Embed Size (px)
Citation preview
IOP PUBLISHING JOURNAL OF PHYSICS D: APPLIED PHYSICS
J. Phys. D: Appl. Phys. 42 (2009) 095404 (7pp) doi:10.1088/0022-3727/42/9/095404
Electrical properties of polyaniline dopedwith metal ionsJ B M Krishna1,4, A Saha1, G S Okram2, A Soni2, S Purakayastha3 andB Ghosh3
1 UGC-DAE Consortium for Scientific Research, Kolkata-700 098, India2 UGC-DAE Consortium for Scientific Research, Indore-452017, India3 School of Energy Studies, Jadavpur University, Kolkata-700032, India
E-mail: [email protected]
Received 19 November 2008, in final form 14 February 2009Published 6 April 2009Online at stacks.iop.org/JPhysD/42/095404
AbstractElectrical transport properties of undoped polyaniline (Pani) and Pani doped with Fe, Niand La ions (named Pani–Fe, Pani–Ni and Pani–La) have been investigated using dc andac conductivity data. It is shown that the Pani–Fe sample follows 3D variable range hopping(VRH) conduction while the Pani, Pani–Ni and Pani–La samples follow 1D VRH conduction.These results are discussed by comparing with conventional HCl-doped Pani. Ac conductivitystudies carried out in the frequency range 42 Hz–5 MHz reveal the influence of dopants oninter-chain interactions. The dielectric response exhibits two well resolved relaxationprocesses, which appear to indicate phase segregation of doped and undoped regions in thesamples.
1. Introduction
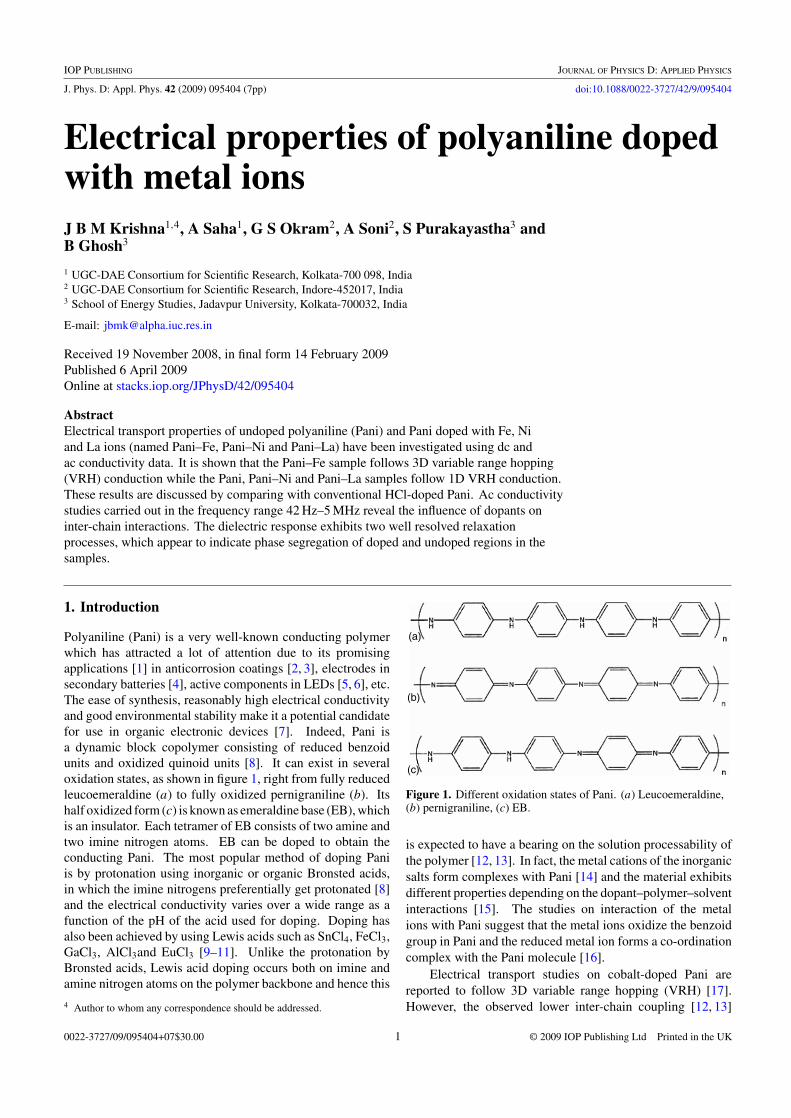
Polyaniline (Pani) is a very well-known conducting polymerwhich has attracted a lot of attention due to its promisingapplications [1] in anticorrosion coatings [2, 3], electrodes insecondary batteries [4], active components in LEDs [5, 6], etc.The ease of synthesis, reasonably high electrical conductivityand good environmental stability make it a potential candidatefor use in organic electronic devices [7]. Indeed, Pani isa dynamic block copolymer consisting of reduced benzoidunits and oxidized quinoid units [8]. It can exist in severaloxidation states, as shown in figure 1, right from fully reducedleucoemeraldine (a) to fully oxidized pernigraniline (b). Itshalf oxidized form (c) is known as emeraldine base (EB), whichis an insulator. Each tetramer of EB consists of two amine andtwo imine nitrogen atoms. EB can be doped to obtain theconducting Pani. The most popular method of doping Paniis by protonation using inorganic or organic Bronsted acids,in which the imine nitrogens preferentially get protonated [8]and the electrical conductivity varies over a wide range as afunction of the pH of the acid used for doping. Doping hasalso been achieved by using Lewis acids such as SnCl4, FeCl3,GaCl3, AlCl3and EuCl3 [9–11]. Unlike the protonation byBronsted acids, Lewis acid doping occurs both on imine andamine nitrogen atoms on the polymer backbone and hence this
4 Author to whom any correspondence should be addressed.
(c)
(b)
(a)
Figure 1. Different oxidation states of Pani. (a) Leucoemeraldine,(b) pernigraniline, (c) EB.
is expected to have a bearing on the solution processability ofthe polymer [12, 13]. In fact, the metal cations of the inorganicsalts form complexes with Pani [14] and the material exhibitsdifferent properties depending on the dopant–polymer–solventinteractions [15]. The studies on interaction of the metalions with Pani suggest that the metal ions oxidize the benzoidgroup in Pani and the reduced metal ion forms a co-ordinationcomplex with the Pani molecule [16].
Electrical transport studies on cobalt-doped Pani arereported to follow 3D variable range hopping (VRH) [17].However, the observed lower inter-chain coupling [12, 13]
0022-3727/09/095404+07$30.00 1 © 2009 IOP Publishing Ltd Printed in the UK
J. Phys. D: Appl. Phys. 42 (2009) 095404 J B M Krishna et al
due to doping at imine and amine sites does not correlatewith the 3D nature of electrical conduction in Lewis aciddoped Pani. Although the observed electrical conductivityis generally explained on the basis of formation of polaronband in the band gap, the details of the interaction betweenthe metal ion and the polymer chain leading to the formationof polaron lattice are still not very well understood. In viewof the wide variety of dopants available in the form of Lewisacids, a clear understanding of their interactions with Pani willhelp in better applications of these materials. In this study wehave investigated electrical transport in metal ion doped Paniusing the temperature dependent dc electrical conductivityand frequency dependent ac conductivity on conventionalHCl-doped Pani (Pani–H), Pani–Fe, Pani–Ni and Pani–Lasamples. Critical analysis of the data indicates that the Pani–Hand Pani–Fe samples follow 3D VRH conduction while thePani–Ni and Pani–La samples follow 1D VRH conduction.
2. Experimental section
2.1. Sample preparation
Pani was synthesized following a method reported earlier [8].Briefly, 20 ml of double distilled aniline was dissolved in300 ml of 1 M HCl and 11.5 g ammonium peroxydisulfate(APS) was dissolved in 200 ml 1 M HCl and both were cooledto ∼1 ◦C in an ice bath. The APS solution was added tothe aniline solution drop-wise with constant stirring over aperiod of 1min. The solution was stirred for ∼1.5 h in an icebath. The solution was filtered by a vacuum filtration and theprecipitate was washed with 750 ml of 1 M HCl to removethe unreacted aniline and its oligomers from the precipitate.Pani synthesized by this method is formed in its protonatedstate and is dark green in colour. The precipitate was dried,weighed and allowed to equilibrate with an appropriate amountof ammonium hydroxide overnight. This process de-doped thePani to its EB form. The dispersion was filtered and freeze-dried. The sample was ground to a fine powder using a mortarand a pestle. 100 ml aqueous solutions of the dopants FeCl3,NiCl2, LaCl3 and HCl of appropriate concentrations wereprepared and 1 g EB powder was added to each of them and keptovernight with constant stirring. The molar ratio of a tetramerunit of EB to dopant was kept 1 : 2 in all the samples. Thesolutions were filtered, and the precipitate was freeze-dried.Samples were compressed into pellets of 10 mm diameter and1 mm thickness by applying a pressure of ∼250 kg cm−2.
2.2. X-ray diffraction (XRD) measurements
For studying the structural changes due to incorporationof metal ions in Pani, XRD measurements were carriedout. XRD patterns were obtained using Bruker D8/Discoverdiffractometer with monochromatic Cu Ka x-rays (λ =1.542 Å) for the samples in the form of pellets.
2.3. Raman spectroscopy measurements
Raman spectroscopy measurements were conducted to identifythe chemical species formed due to incorporation of metal
ions into the Pani samples. Raman spectroscopy was carriedout using a LABRAM-HR (Jobin Yvon Horibra) Ramanspectrometer.
2.4. Dc conductivity measurements
Temperature dependent dc conductivity measurements werecarried out on the samples in the temperature range from 80 to300 K. A Lakeshore temperature controller was used to controlthe sample temperature. The resistivities of the Pani–Feand Pani–H samples were measured by the standard 4-probemethod, while guarded 2-probe measurements were carriedout for the undoped Pani, Pani–Ni and Pani–La samples, astheir resistances were high. Keithley current source 6221 andelectrometer 6517A were used for 4-probe measurements andonly a Keithley electrometer 6517A was used in two probemeasurements. Electrical contacts were made using highlyconducting silver paste.
2.5. Ac conductivity measurements
AC conductivity measurements were carried out using a Tegam3550 LCR meter. Sample pellets were prepared in capacitorgeometry by coating a thin layer of silver paste on both sidesand attaching silver leads. Samples were mounted on a testfixture (TEGAM 3510) and capacitance and dissipation factorwere measured as a function of frequency in the range from42 Hz to 5 MHz.
3. Results and discussion
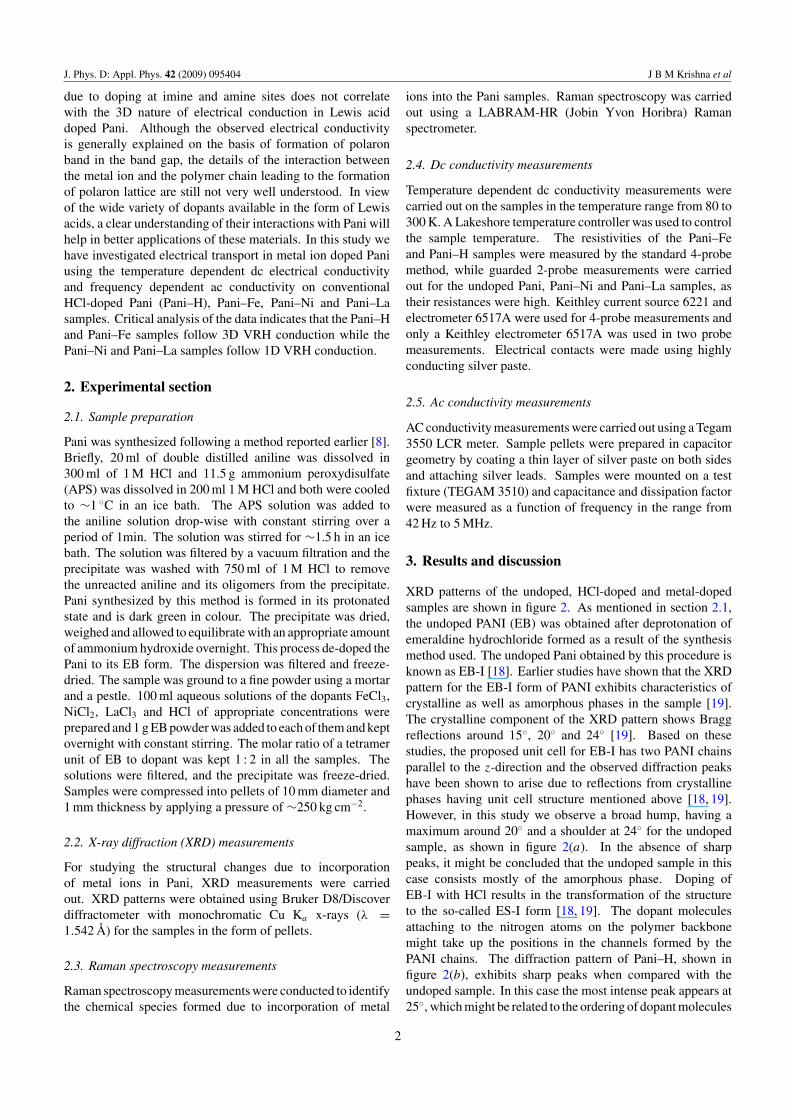
XRD patterns of the undoped, HCl-doped and metal-dopedsamples are shown in figure 2. As mentioned in section 2.1,the undoped PANI (EB) was obtained after deprotonation ofemeraldine hydrochloride formed as a result of the synthesismethod used. The undoped Pani obtained by this procedure isknown as EB-I [18]. Earlier studies have shown that the XRDpattern for the EB-I form of PANI exhibits characteristics ofcrystalline as well as amorphous phases in the sample [19].The crystalline component of the XRD pattern shows Braggreflections around 15◦, 20◦ and 24◦ [19]. Based on thesestudies, the proposed unit cell for EB-I has two PANI chainsparallel to the z-direction and the observed diffraction peakshave been shown to arise due to reflections from crystallinephases having unit cell structure mentioned above [18, 19].However, in this study we observe a broad hump, having amaximum around 20◦ and a shoulder at 24◦ for the undopedsample, as shown in figure 2(a). In the absence of sharppeaks, it might be concluded that the undoped sample in thiscase consists mostly of the amorphous phase. Doping ofEB-I with HCl results in the transformation of the structureto the so-called ES-I form [18, 19]. The dopant moleculesattaching to the nitrogen atoms on the polymer backbonemight take up the positions in the channels formed by thePANI chains. The diffraction pattern of Pani–H, shown infigure 2(b), exhibits sharp peaks when compared with theundoped sample. In this case the most intense peak appears at25◦, which might be related to the ordering of dopant molecules
2
J. Phys. D: Appl. Phys. 42 (2009) 095404 J B M Krishna et al
Figure 2. XRD patterns for undoped and doped Pani samples as indicated.
in the channels between the polymer chains [20]. It appearsthat the incorporation of dopants into the channels betweenthe polymer chains leads to better alignment of the polymerchains. Although the diffraction pattern for Pani–Fe, shownin figure 2(c), is noisy, its general trend is similar to that forPani–H. The XRD pattern for Pani–Ni, shown in figure 2(d),exhibits peaks at 20◦ and 25◦. In the case of Pani–La also, theXRD pattern shows peak at 20◦ and a shoulder at 25◦ as seenin figure 2(e). On comparing the XRD patterns of the dopedsamples with that of the undoped sample, it can be said thatdoping has resulted in a relative increase in crystalline phasesin the sample. The degree of crystalline ordering seems to bedependent on the size of the dopant as can be qualitatively seenfrom the fact that the peaks are relatively sharper in Pani–Hfollowed by Pani–Fe, Pani–Ni and Pani–La.
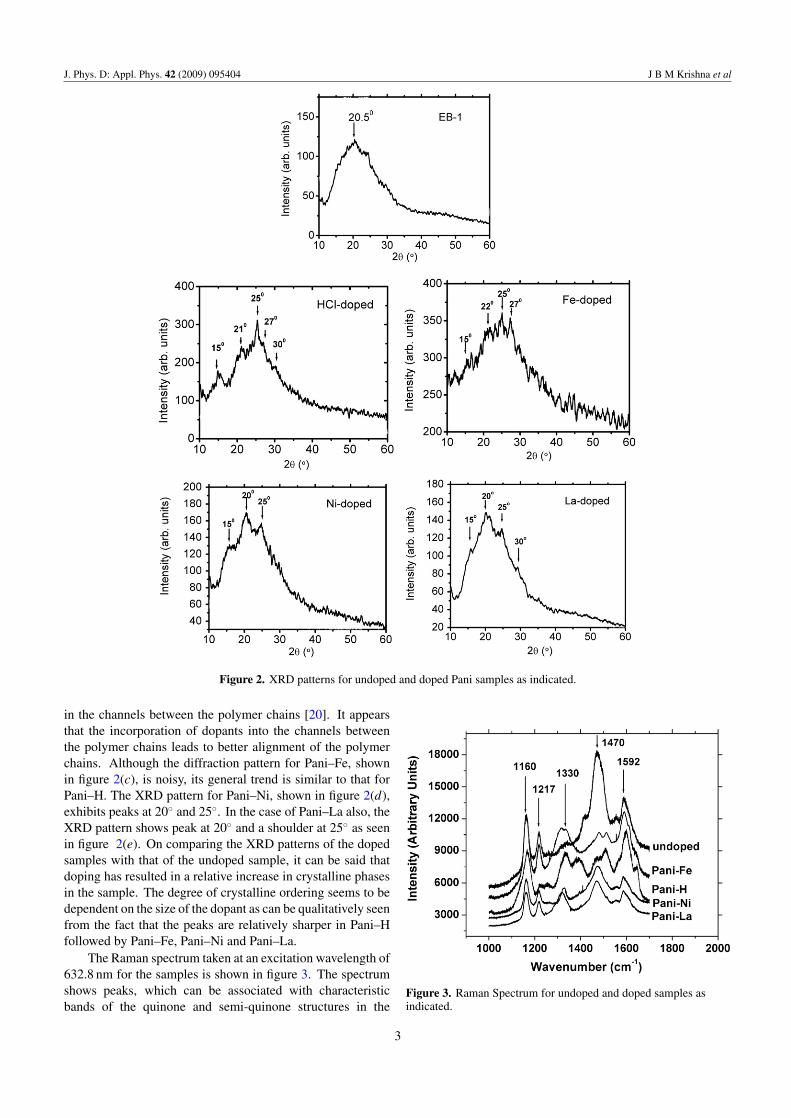
The Raman spectrum taken at an excitation wavelength of632.8 nm for the samples is shown in figure 3. The spectrumshows peaks, which can be associated with characteristicbands of the quinone and semi-quinone structures in the
Figure 3. Raman Spectrum for undoped and doped samples asindicated.
3
J. Phys. D: Appl. Phys. 42 (2009) 095404 J B M Krishna et al
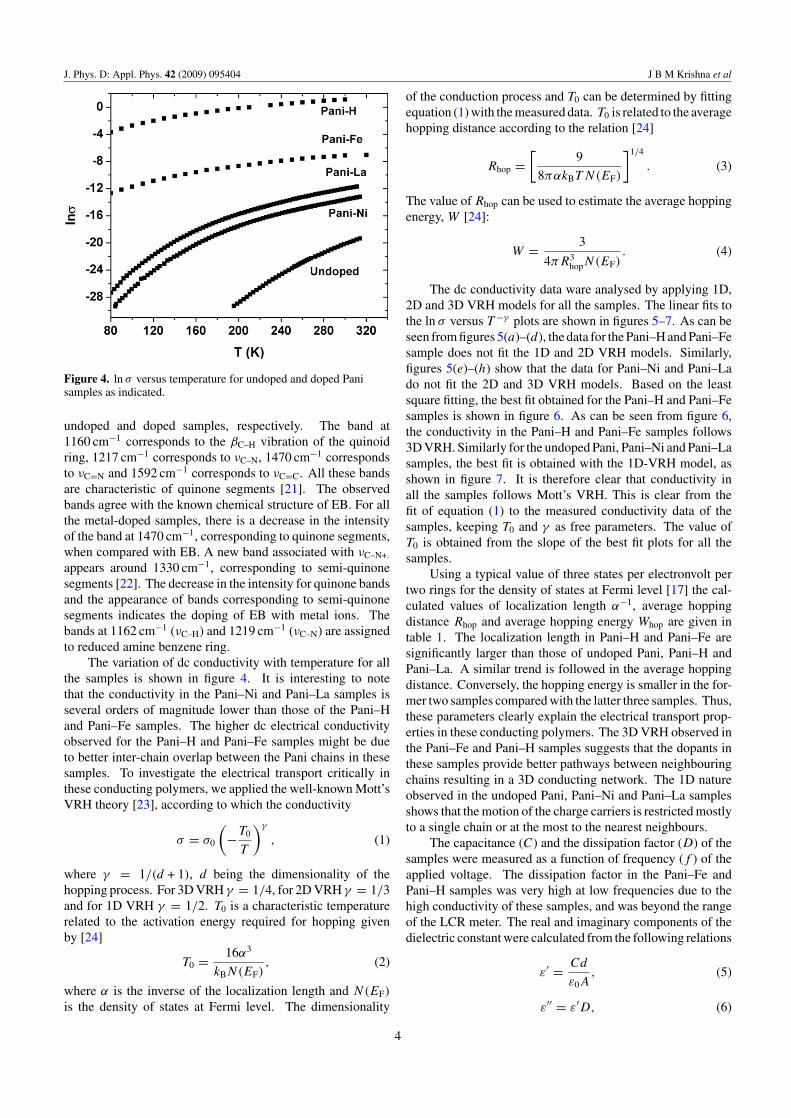
Figure 4. ln σ versus temperature for undoped and doped Panisamples as indicated.
undoped and doped samples, respectively. The band at1160 cm−1 corresponds to the βC–H vibration of the quinoidring, 1217 cm−1 corresponds to νC–N, 1470 cm−1 correspondsto νC=N and 1592 cm−1 corresponds to νC=C. All these bandsare characteristic of quinone segments [21]. The observedbands agree with the known chemical structure of EB. For allthe metal-doped samples, there is a decrease in the intensityof the band at 1470 cm−1, corresponding to quinone segments,when compared with EB. A new band associated with νC–N+.
appears around 1330 cm−1, corresponding to semi-quinonesegments [22]. The decrease in the intensity for quinone bandsand the appearance of bands corresponding to semi-quinonesegments indicates the doping of EB with metal ions. Thebands at 1162 cm−1 (νC–H) and 1219 cm−1 (νC–N) are assignedto reduced amine benzene ring.
The variation of dc conductivity with temperature for allthe samples is shown in figure 4. It is interesting to notethat the conductivity in the Pani–Ni and Pani–La samples isseveral orders of magnitude lower than those of the Pani–Hand Pani–Fe samples. The higher dc electrical conductivityobserved for the Pani–H and Pani–Fe samples might be dueto better inter-chain overlap between the Pani chains in thesesamples. To investigate the electrical transport critically inthese conducting polymers, we applied the well-known Mott’sVRH theory [23], according to which the conductivity
σ = σ0
(−T0
T
)γ
, (1)
where γ = 1/(d + 1), d being the dimensionality of thehopping process. For 3D VRH γ = 1/4, for 2D VRH γ = 1/3and for 1D VRH γ = 1/2. T0 is a characteristic temperaturerelated to the activation energy required for hopping givenby [24]
T0 = 16α3
kBN(EF), (2)
where α is the inverse of the localization length and N(EF)
is the density of states at Fermi level. The dimensionality
of the conduction process and T0 can be determined by fittingequation (1) with the measured data. T0 is related to the averagehopping distance according to the relation [24]
Rhop =[
9
8παkBT N(EF)
]1/4
. (3)
The value of Rhop can be used to estimate the average hoppingenergy, W [24]:
W = 3
4πR3hopN(EF)
. (4)
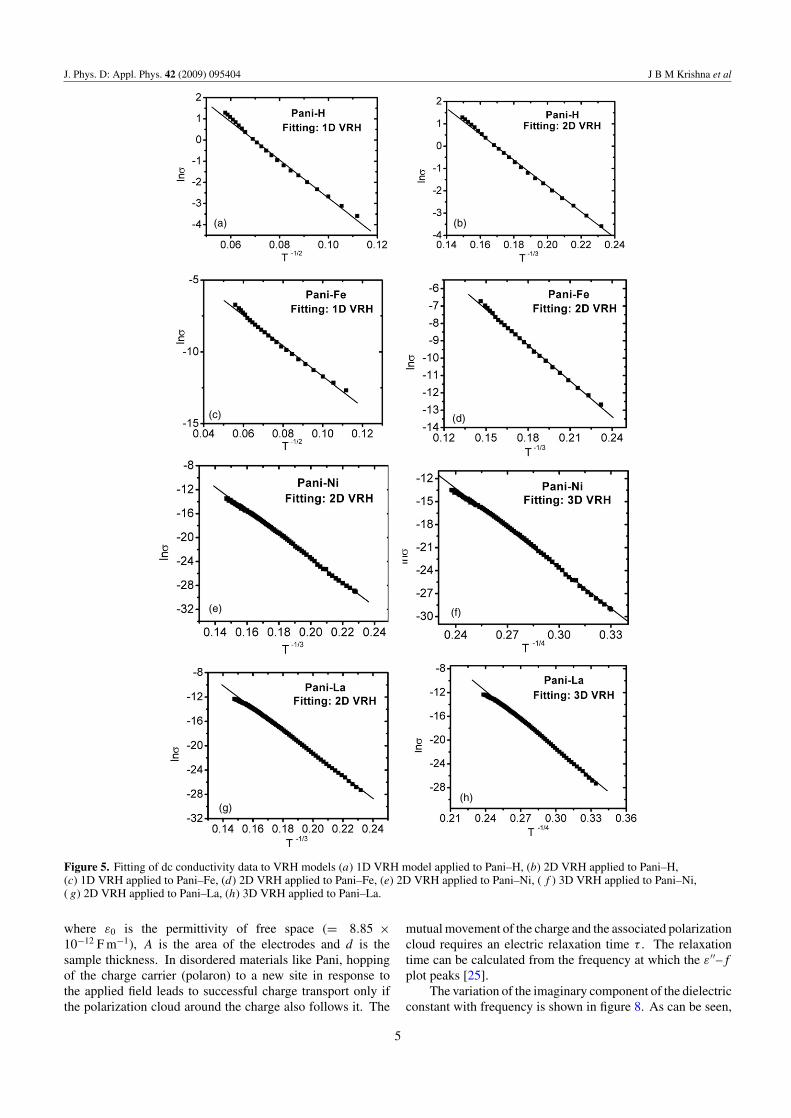
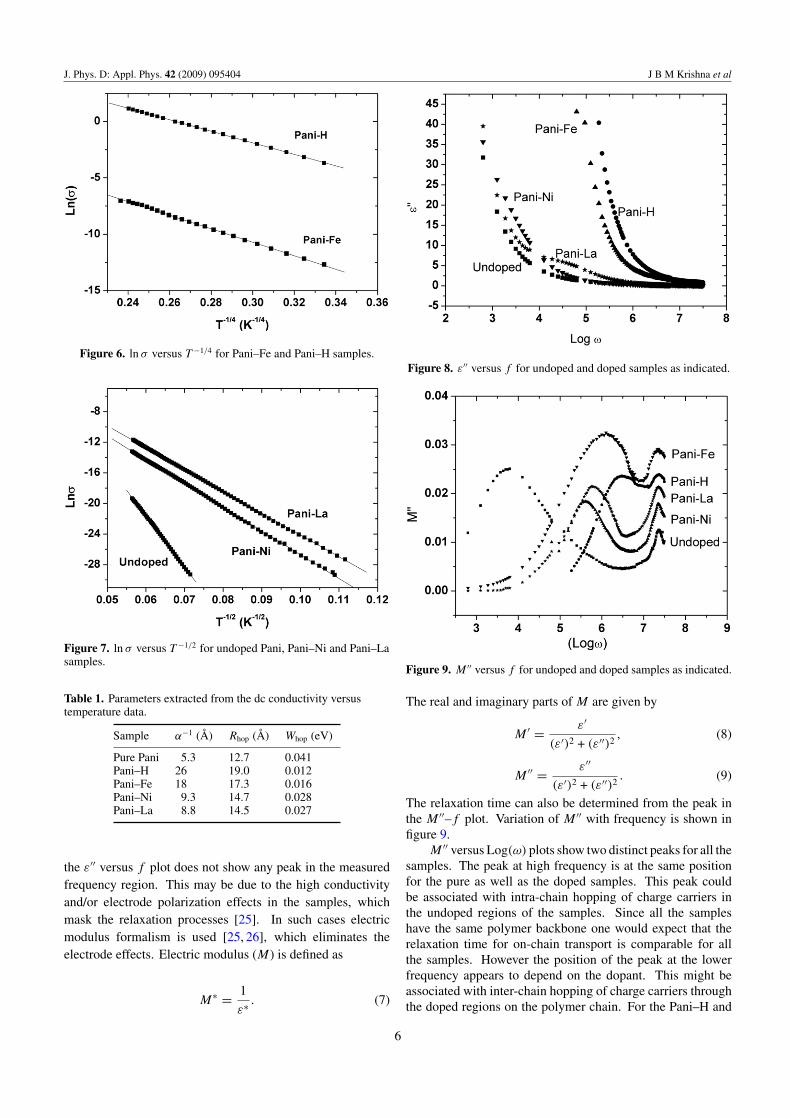
The dc conductivity data ware analysed by applying 1D,2D and 3D VRH models for all the samples. The linear fits tothe ln σ versus T −γ plots are shown in figures 5–7. As can beseen from figures 5(a)–(d), the data for the Pani–H and Pani–Fesample does not fit the 1D and 2D VRH models. Similarly,figures 5(e)–(h) show that the data for Pani–Ni and Pani–Lado not fit the 2D and 3D VRH models. Based on the leastsquare fitting, the best fit obtained for the Pani–H and Pani–Fesamples is shown in figure 6. As can be seen from figure 6,the conductivity in the Pani–H and Pani–Fe samples follows3D VRH. Similarly for the undoped Pani, Pani–Ni and Pani–Lasamples, the best fit is obtained with the 1D-VRH model, asshown in figure 7. It is therefore clear that conductivity inall the samples follows Mott’s VRH. This is clear from thefit of equation (1) to the measured conductivity data of thesamples, keeping T0 and γ as free parameters. The value ofT0 is obtained from the slope of the best fit plots for all thesamples.
Using a typical value of three states per electronvolt pertwo rings for the density of states at Fermi level [17] the cal-culated values of localization length α−1, average hoppingdistance Rhop and average hopping energy Whop are given intable 1. The localization length in Pani–H and Pani–Fe aresignificantly larger than those of undoped Pani, Pani–H andPani–La. A similar trend is followed in the average hoppingdistance. Conversely, the hopping energy is smaller in the for-mer two samples compared with the latter three samples. Thus,these parameters clearly explain the electrical transport prop-erties in these conducting polymers. The 3D VRH observed inthe Pani–Fe and Pani–H samples suggests that the dopants inthese samples provide better pathways between neighbouringchains resulting in a 3D conducting network. The 1D natureobserved in the undoped Pani, Pani–Ni and Pani–La samplesshows that the motion of the charge carriers is restricted mostlyto a single chain or at the most to the nearest neighbours.
The capacitance (C) and the dissipation factor (D) of thesamples were measured as a function of frequency (f ) of theapplied voltage. The dissipation factor in the Pani–Fe andPani–H samples was very high at low frequencies due to thehigh conductivity of these samples, and was beyond the rangeof the LCR meter. The real and imaginary components of thedielectric constant were calculated from the following relations
ε′ = Cd
ε0A, (5)
ε′′ = ε′D, (6)
4
J. Phys. D: Appl. Phys. 42 (2009) 095404 J B M Krishna et al
(a) (b)
(c) (d)
(e) (f)
(g)(h)
Figure 5. Fitting of dc conductivity data to VRH models (a) 1D VRH model applied to Pani–H, (b) 2D VRH applied to Pani–H,(c) 1D VRH applied to Pani–Fe, (d) 2D VRH applied to Pani–Fe, (e) 2D VRH applied to Pani–Ni, ( f ) 3D VRH applied to Pani–Ni,( g) 2D VRH applied to Pani–La, (h) 3D VRH applied to Pani–La.
where ε0 is the permittivity of free space (= 8.85 ×10⁻¹² F m−1), A is the area of the electrodes and d is thesample thickness. In disordered materials like Pani, hoppingof the charge carrier (polaron) to a new site in response tothe applied field leads to successful charge transport only ifthe polarization cloud around the charge also follows it. The
mutual movement of the charge and the associated polarizationcloud requires an electric relaxation time τ . The relaxationtime can be calculated from the frequency at which the ε′′–f
plot peaks [25].The variation of the imaginary component of the dielectric
constant with frequency is shown in figure 8. As can be seen,
5
J. Phys. D: Appl. Phys. 42 (2009) 095404 J B M Krishna et al
Figure 6. ln σ versus T −1/4 for Pani–Fe and Pani–H samples.
Figure 7. ln σ versus T −1/2 for undoped Pani, Pani–Ni and Pani–Lasamples.
Table 1. Parameters extracted from the dc conductivity versustemperature data.
Sample α−1 (Å) Rhop (Å) Whop (eV)
Pure Pani 5.3 12.7 0.041Pani–H 26 19.0 0.012Pani–Fe 18 17.3 0.016Pani–Ni 9.3 14.7 0.028Pani–La 8.8 14.5 0.027
the ε′′ versus f plot does not show any peak in the measuredfrequency region. This may be due to the high conductivityand/or electrode polarization effects in the samples, whichmask the relaxation processes [25]. In such cases electricmodulus formalism is used [25, 26], which eliminates theelectrode effects. Electric modulus (M) is defined as
M∗ = 1
ε∗ . (7)
Figure 8. ε′′ versus f for undoped and doped samples as indicated.
Figure 9. M ′′ versus f for undoped and doped samples as indicated.
The real and imaginary parts of M are given by
M ′ = ε′
(ε′)2 + (ε′′)2, (8)
M ′′ = ε′′
(ε′)2 + (ε′′)2. (9)
The relaxation time can also be determined from the peak inthe M ′′–f plot. Variation of M ′′ with frequency is shown infigure 9.
M ′′ versus Log(ω) plots show two distinct peaks for all thesamples. The peak at high frequency is at the same positionfor the pure as well as the doped samples. This peak couldbe associated with intra-chain hopping of charge carriers inthe undoped regions of the samples. Since all the sampleshave the same polymer backbone one would expect that therelaxation time for on-chain transport is comparable for allthe samples. However the position of the peak at the lowerfrequency appears to depend on the dopant. This might beassociated with inter-chain hopping of charge carriers throughthe doped regions on the polymer chain. For the Pani–H and
6
J. Phys. D: Appl. Phys. 42 (2009) 095404 J B M Krishna et al
Pani–Fe samples this peak is at a higher frequency, whichcorresponds to a lower relaxation time compared with that inthe Pani–Ni and Pani–La samples. From the ac conductivitymeasurements it appears that inter-chain hopping of chargecarriers in the Pani–H and Pani–Fe samples is easier than thatin the Pani–Ni and Pani–La samples. This is also consistentwith the higher conductivities observed and 3D VRH found inthe Pani–H and Pani–Fe samples. It may be noted that the samepeak for the undoped sample is at a much lower frequency,i.e. higher relaxation time, indicating that inter-chain chargehopping is much more difficult in the absence of dopants.
4. Conclusions
Metal ion doped Pani samples were synthesized chemicallyand charge transport in these samples was studied. Dopantsseem to have a strong influence on the charge transport.Dc conductivity studies show that the dopants in the Pani–Hand Pani–Fe samples interact strongly with Pani chains andform 3D conducting networks. The 3D hopping natureand higher values of dc conductivities in these samples areconsistent with higher inter-chain carrier mobility observedin ac conductivity studies. Though the doping concentrationsin the Pani–Ni and Pani–La samples were identical to thatof the Pani–H and Pani–Fe samples, their conductivities aresignificantly low. Ac conductivity studies show that lowerconductivity is mainly due to the lower inter-chain carriermobility.
Acknowledgments
The authors gratefully acknowledge the help extended byDr V R Reddy for XRD measurements and the help ofDr V Sathe in carrying out the Raman measurements at theUGC DAE Consortium for Scientific Research, Indore, India.
References
[1] Kang E T, Neoh K G and Tan K L 1998 Prog. Polym. Sci.23 277
[2] Wessling B 1994 Adv. Mater. 6 226[3] Lu W K, Elsenbaumer R L and Wessling B 1995 Synth. Met.
71 2163[4] MacDiarmid A G, Yang L S, Huang W S and Humphrey B D
1987 Synth. Met. 18 393[5] Wang H L, MacDiarmid A G, Wang Y Z, Gebler D D and
Epstein A J 1996 Synth. Met. 78 33[6] Chen S A, Chung K R, Chao C L and Lee H T 1996 Synth.
Met. 82 207[7] Neoh, K G, Kang E T, Khor S H and Tan K L 1990 Polym.
Degrad. Stab. 27 107[8] Shimano J Y and MacDiarmid A G 2001 Synth. Met. 121 251[9] Dimitrev O P and Kislyuk V V 2002 Synth. Met. 132 87
[10] Bienkowski K, Bajer I K, Genoud F, Oddou J L and Pron A2003 Synth. Met. 135–136 159
[11] Dimitrev O P 2004 Synth. Met. 142 299[12] Yang C and Chen C 2005 Synth. Met. 153 133[13] Kulsewich-Bajer I, Pron A, Abramowicz J, Jeandey C,
Oddou J L and Sobczak J W 1999 Chem. Mater.11 552
[14] Genoud F, Kulsewich-Bajer I, Bedel A, Oddou J L, Jeandey Cand Pron A 2000 Chem. Mater. 12 744
[15] Celly-Izumi M S, Ferreira Anna Maria C, ConstantinoVera R L and Temperini Marcia L A 2007 Macromolecules40 3204
[16] Dimitrev O P, Smertenko P S, Stiller B and Brehmer L 2005Synth. Met. 149 187
[17] Ghosh P, Sarkar A, Meikap A K, Chattopadhyay S K,Chatterjee S K and Ghosh M 2006 J. Phys. D: Appl. Phys.39 3047
[18] Pouget J P, Jozefowicz M E, Epstein A J, Tang X andMacDiarmid A G 1991 Macromolecules 24 779
[19] Luzny W, Sniechowski M and Laska J 2002 Synth. Met.126 27
[20] Uny W and Baka E 2000 Macromolecules 33 425[21] Quillard S, Louam G, Lefrant S and MacDiarmid A G 1994
Phys. Rev. B 50 12496[22] Celly-Izumi M S, Constantino Vera R L,
Ferreira Anna Maria C and Temperini Marcia L A 2000Synth. Met. 156 654
[23] Mott N F and Davis E A 1979 Electronic Processes in NonCrystalline Materials 2nd edn (Oxford: Clarendon)
[24] Campos M and Bello B Jr 2006 J. Phys. D: Appl. Phys. 301531
[25] Singh R, Arora V, Tandon R P, Mansingh A and Chandra S1999 Synth. Met. 104 137
[26] Calleja R D, Matveeva E S and Parkhutik V P 1995J. Non-Cryst. Solids 180 260
7


