Embed Size (px)
Citation preview
econstorMake Your Publications Visible.
A Service of
zbwLeibniz-InformationszentrumWirtschaftLeibniz Information Centrefor Economics
Hafsal K.; Suvvari, Anandarao; Durai, S. Raja Sethu
Article
Efficiency of Indian banks with non-performingassets: Evidence from two-stage network DEA
Future Business Journal
Provided in Cooperation with:Faculty of Commerce and Business Administration, Future University
Suggested Citation: Hafsal K.; Suvvari, Anandarao; Durai, S. Raja Sethu (2020) : Efficiencyof Indian banks with non-performing assets: Evidence from two-stage network DEA, FutureBusiness Journal, ISSN 2314-7210, Springer, Heidelberg, Vol. 6, Iss. 1, pp. 1-9,http://dx.doi.org/10.1186/s43093-020-00030-z
This Version is available at:http://hdl.handle.net/10419/246635
Standard-Nutzungsbedingungen:
Die Dokumente auf EconStor dürfen zu eigenen wissenschaftlichenZwecken und zum Privatgebrauch gespeichert und kopiert werden.
Sie dürfen die Dokumente nicht für öffentliche oder kommerzielleZwecke vervielfältigen, öffentlich ausstellen, öffentlich zugänglichmachen, vertreiben oder anderweitig nutzen.
Sofern die Verfasser die Dokumente unter Open-Content-Lizenzen(insbesondere CC-Lizenzen) zur Verfügung gestellt haben sollten,gelten abweichend von diesen Nutzungsbedingungen die in der dortgenannten Lizenz gewährten Nutzungsrechte.
Terms of use:
Documents in EconStor may be saved and copied for yourpersonal and scholarly purposes.
You are not to copy documents for public or commercialpurposes, to exhibit the documents publicly, to make thempublicly available on the internet, or to distribute or otherwiseuse the documents in public.
If the documents have been made available under an OpenContent Licence (especially Creative Commons Licences), youmay exercise further usage rights as specified in the indicatedlicence.
https://creativecommons.org/licenses/by/4.0/
www.econstor.eu
Hafsal et al. Futur Bus J (2020) 6:26 https://doi.org/10.1186/s43093-020-00030-z
RESEARCH
Efficiency of Indian banks with non-performing assets: evidence from two-stage network DEAK. Hafsal1* , Anandarao Suvvari2 and S. Raja Sethu Durai1
Abstract
This paper addresses the concerns regarding the sustainability of the banking sector in India prompted by the recent unintended high level of non-performing assets (NPAs). It uncovers the linkage between NPAs and banking efficiency by integrating NPAs into the measurement of bank efficiency to provide a holistic efficiency profile of the Indian banking sector. We apply the general two-stage data envelopment analysis of Kao [16] by incorporating NPAs as an exogenous output from the first stage, and the empirical results identify an efficiency gap of 16.2% due to NPAs in the Indian banking sector for the year 2016. Further, it also documents that the efficiency gap/loss is increasing over the years and differs according to the shareholding pattern of the banks.
Keywords: General two-stage network DEA, Bank efficiency, India, Non-performing assets
JEL Classification: G21, P42, C14, C44
© The Author(s) 2020. This article is licensed under a Creative Commons Attribution 4.0 International License, which permits use, sharing, adaptation, distribution and reproduction in any medium or format, as long as you give appropriate credit to the original author(s) and the source, provide a link to the Creative Commons licence, and indicate if changes were made. The images or other third party material in this article are included in the article’s Creative Commons licence, unless indicated otherwise in a credit line to the material. If material is not included in the article’s Creative Commons licence and your intended use is not permitted by statutory regulation or exceeds the permitted use, you will need to obtain permission directly from the copyright holder. To view a copy of this licence, visit http://creat iveco mmons .org/licen ses/by/4.0/.
IntroductionIn emerging economies, banks play a more prominent role in financial intermediation, along with carrying addi-tional responsibility for attaining the government’s social objectives as well. This inevitable relationship between banking and economic development, the growth of the overall economy, is naturally related to the health of the banking sector. The recent global financial crisis high-lighted the importance of a healthy banking system. It emphasized the focus on proper monitoring and per-formance evaluations of banks, as this can impact their overall efficiency, productivity, performance, and profit.
World over, non-performing asset (NPA) in the banking sector is growing, and higher NPA influences the price of loans and interest rates, which in return affects the confidence of investors, lenders, and depositors equally. While higher interest rates will directly impact the inves-tors in need of loans for the creation of infrastructural
and industrial projects, it also causes poor recovery of funds, which will affect the credit creation and revenue stream of the banks. The non-recovery of loans affects credit creation and further affects the financial sound-ness of an economy. So managing the NPAs and main-taining them within the tolerance level will decide the success of a bank. Proper monitoring of NPAs and per-formance evaluations are very important for banking, as this reflects the overall efficiency of banking. Therefore, it is necessary to investigate the role of NPAs in determin-ing the efficiency and profitability of the banking system.
The financial system in India, similar to other emerging countries, is bank dependent, and banks hold a signifi-cant share of total financial assets in the system. It is also having a reasonably large share of public sector banking and a higher level of NPAs compared to the other emerg-ing countries. Recently, the Indian banking system is witnessing a sharp increase in the gross NPA level, and the government-owned public sector banks are mostly responsible for the NPA problem. The Reserve Bank of India (RBI) Financial Stability Report of 2017 states that the public sector banks have 14.6% gross NPA to total
Open Access
Future Business Journal
*Correspondence: [email protected] School of Economics, University of Hyderabad, Prof. C R Rao Road, Hyderabad, Telangana 500046, IndiaFull list of author information is available at the end of the article
Page 2 of 9Hafsal et al. Futur Bus J (2020) 6:26
gross loans, and for all the other banks, it was at 11.2% in 2017. This number is almost fourfold higher than the world gross NPA of 3.45% in 2017, as reported by the IMF Financial Stability Report of 2017. As highlighted by Bawa et al. [3], NPAs in Indian banks are much higher than the other emerging countries like China, Mexico, and Brazil that have a gross NPA of 1.7%, 2.1%, and 3.6%, respectively, in 2017.
The effects of NPAs on the Indian banking system are well documented in the literature. Indira and Garima [14] argued that the public sector banks which have above-average NPAs show a reduced level of efficiency. Fujii et al. [11] highlighted the role of non-performing assets on the Indian banking sector and considered as an essential measure to decide the performance and finan-cial system. The proper understanding of NPAs helps to reveal and understand the problems in the financial system that could contribute to the implementation of a suitable regulatory framework and avoid the consequent loss in the profitability of the banking sector. This study has two main objectives: first, to examine the efficiency of the Indian banks in a two-stage network DEA model to understand the overall efficiency of the banks, as well as efficiency in the intermediation and operating stages and, second, incorporating NPAs in the general two-stage DEA framework of Kao [16] as an exogenous output in the intermediate stage and then quantifying the level of improvement or loss in the overall efficiency.
As the level of NPAs creates serious concern on the sta-bility of the banking system in India, this study focuses on quantifying the effects of NPAs on the efficiency level of the Indian banking system. This quantification will help us to understand the financial health of the Indian bank-ing sector and its influence on the liquidity, solvency, and profitability levels of the banks. This study contributes to the empirical literature in twofold: first, it quantifies the efficiency gap arising out of NPAs in a general two-stage DEA framework; second, it identifies possible rea-sons for this efficiency gap. To our knowledge, this is the first study to apply general two-stage DEA with NPA as an undesirable outcome in the first stage to extract the efficiency gap. The advantage of this method over other multi-criteria decision-making models is that it assesses the system with standard two-stage DEA for bank-wise data to get the efficiency level as a benchmark. Subse-quently, the general two-stage DEA denotes NPA as an undesirable output to derive the efficiency improvement or loss for comparison. The scope of this study rests on getting the bank-wise efficiency gap to identify the finan-cial health of these banks and provides an early warning to evaluate their NPAs. The advantage of this two-stage DEA model is that it recognizes the origin of the inef-ficiency, precisely in which stage it happens so that the
management can concentrate on that particular process to improve the efficiency. The paper is structured as fol-lows: “Literature” section provides a brief literature review on the efficiency measurement of banks. “Meth-odology” section discusses the methodological approach adopted for the analysis and explains the general two-stage network DEA model along with the data used. “Result and discussions” section discusses the empirical results and policy suggestions, while the final section derives conclusions and managerial implications.
LiteratureIn the literature, understanding market efficiency and its effects on financial stability constitutes the macropoint of view [9, 20, 23], while understanding the efficiency of individual business units is the core at the micro-level. The focus of this study is at the micro-level to measure the efficiency of Indian commercial banks by incorporat-ing NPAs to assess its impact on the profits of banks.
Several studies are analyzing the efficiency of the Indian banking system, with most of the studies adopting the data envelopment analysis (DEA) methodology. All these studies examined the efficiency levels, and no study has attempted to quantify the level of efficiency loss aris-ing out of undesirable outcomes like the non-performing assets of the bank. Bhattacharyya et al. [5] analyzed the performance of Indian banks during the initial stages of the liberalization period. They found that the public sector banks1 were more efficient compared to private banks. Similarly, Das and Shanmugam [8] measured the efficiency of Indian banks during the reform period based on the panel stochastic frontier analysis. They demon-strated an improved efficiency of the public sector banks. Ray and Das [22] examined the cost and profit efficiency of Indian banks in the post-reform period. They found that the public sector banks perform better than the pri-vate sector banks in terms of efficiency. They also reveal that small banks operated below the efficiency frontier, thus implying that the ownership pattern of the banks influenced the efficiency level of banks.
In recent years, the efficiency levels of the public sec-tor banks and the private banks are seen to be reversing, with private banks becoming more efficient compared to other public sector banks like the State Bank of India (SBI, including its associate banks). Tzeremes [26], while examining the efficiency of the Indian banking industry from 2004 to 2012 using the directional distance func-tion, found that the financial crisis had hardly affected the efficiency of Indian banks. However, private banks performed better than the public and foreign banks.
1 Government of India holds a major share in these banks.
Page 3 of 9Hafsal et al. Futur Bus J (2020) 6:26
Sandeepa and Gupta [24], in their analysis of the bank-ing efficiency in the post-crisis period from 2009 to 2013, demonstrated that SBI and its associate banks obtained the highest efficiency scores compared to other banks. The Indian banking system, dominated by public sector banks, has undergone a substantial change in terms of restructuring, mergers, and recapitalization due to the persistent growth of non-performing assets (NPA). It often mentioned as being the harbinger of an impending crisis within the Indian financial system. Jayaraman and Srinivasan [15] provided a holistic analysis of the Indian banking efficiency using the Nerlovian methodology and concluded that the profit inefficiency of Indian banks is mainly because of allocative inefficiency. Further, the study stated that the role of profit inefficiency was more compared to the technical inefficiency.
The major drawback of all these studies is the fact that they have considered the efficiency measurement as a ``black box’’ [19] is ignoring the internal structure of the banking process and its efficiency. All these studies con-sidered the total loan outlay as an output in the efficiency measurement of banks without considering that the loans generated consist of both good and bad loans. Färe et al. [10] argued that it is better to treat desirable and unde-sirable outputs asymmetrically in the efficiency measure-ment—where firms with bad outputs are penalized, and firms with desirable outputs are credited.
Chang [6] analyzed the efficiencies of major financial intermediaries in rural Taiwan. Incorporating risk such as non-performing loans (NPL), allowance for loan losses, and risky assets as an undesirable output demonstrated that an undesirable output has a significant impact on the efficiency ranking. Akhter et al. [1] evaluated the per-formance of the commercial banks in Bangladesh using the two-stage network DEA production process. Their findings suggest that non-performing loans (NPL) cre-ated in the previous period correspond with a reduction in the subsequent period’s production possibilities, as NPLs require the banks to either increase equity capital or contract deposit generation. Fukuyama and Weber [12] analyzed the inefficiency level of the Japanese banks by keeping NPLs as an undesirable output while using dynamic network DEA methodology. Their study estab-lished that there is higher inefficiency, which is mainly attributed to NPLs. Partovia and Matousek [21] studied the efficiency of Turkish banks from 2002 to 2017, apply-ing a modified data envelopment analysis (DEA) method that used a directional distance function model to esti-mate the efficiency, where they considered NPLs as an undesirable output. The study indicates that the NPLs are severely affecting the efficiency of banks.
In recent years, there have been a few studies that analyzed the efficiency in the intermediation and
operating stages using a two-stage network DEA frame-work. Fujii et al. [11] evaluated the technical efficiency and productivity growth in the Indian banks using a weighted Russell directional distance model by modi-fying and extending the methodological approaches of Chen et al. [7] and Barros et al. [2]. Their analy-sis observed that NPAs are the main reason for bank inefficiency.
Further, Gulati and Kumar [13] used the two-stage net-work DEA and suggested that the Indian banks have to improve both resource utilization and income-generating abilities to experience an overall improvement ineffi-ciency. However, this study differs from the earlier ones by quantifying the efficiency gain/loss by incorporating NPAs in the analysis. It helps us to understand the banks that are weighed down by these NPAs on the efficiency front and identify some important factors that can move the banking sector forward and away from the clutches of NPAs.
MethodologyIn the empirical literature, the technical efficiency of the banks is measured using either the production or the intermediation approaches. The production approach considers banks as a producer of services like deposits and loans with labor and capital as primary inputs. Inter-mediation approach considers banks as an agent to con-vert the deposits and other funds into loans and other assets. The debate on the ``deposit dilemma’’ in the lit-erature acknowledges whether the deposits (or raised funds) should be considered as an input or an output in measuring the banking efficiency. However, many studies adopting the conventional DEA method used deposits as an input as well as an output without discussing the issue of ``deposit dilemma.’’ Some studies using two-stage net-work model have used the deposits as output in the first stage of the production and as an input in the second stage of the production. This study applies the interme-diation approach of Berger and Mester [4].
First, we use a standard two-stage network DEA of Kao and Hwang [17] to derive the system and divisional effi-ciency scores for the actual data considering all the out-puts in stages 1 and 2 as desirable outputs. Subsequently, the undesirable exogenous output from stage 1 is intro-duced in the general two-stage network DEA framework explained below to derive the system and its divisional efficiency scores. We define the efficiency gap (gain/loss) of that undesirable output as the difference between the system efficiency scores of the standard and the general models.
Page 4 of 9Hafsal et al. Futur Bus J (2020) 6:26
Two‑stage DEAFor N number DMUs (decision making units) DMUj, j = 1 … N, is based on the CRS (constant returns-to-scale) production process with ith input and rth output Xij, i = 1 … m and Yrj, r = 1 … s, Kao and Hwang [17] proposed a two-stage network DEA model derived as the following linear program:
After the optimal multipliers u∗r , v∗i and w∗p are solved,
the system and divisional efficiencies are calculated as Ek =
∑sr=1 urYrk ,E
1k =
∑qp=1 wpZpk/
∑mi=1 viXik
and E2k =
∑sr=1 urYrj/
∑qp=1 wpZpj ; this implies
Ek = E1k ∗ E
2k . Kao and Hwang [17] highlighted the
problem of non-unique optimal multipliers solved from (1); they give a solution based on the set of mul-tipliers which provide the largest E1
k while keeping the total efficiency score at Ek derived from (1) for the objective E1
k = max∑q
p=1 wpZpk s.t.∑m
i=1 viXik = 1∑m
i=1 viXik = 1 , by adding one more constraint ∑s
r=1 urYrk − Ek∑m
i=1 viXik = 0 and keeping all the other constraints in (1). After E1
k is calculated, the effi-ciency of the second stage is obtained as: E2
k = Ek/E1k.
General two‑stage DEAThe general two-stage network DEA model of Kao [16] gives more freedom to alter the internal structure of the production process before achieving the final output. It differs from the basic two-stage network DEA model of Kao and Hwang [17] in terms of additional outputs and input measures. The production process is as follows: (1) inputs of stage 1 produce exogenous outputs (undesirable outputs) and intermediate products (desirable outputs), (2) dropping of undesirable outputs produced in stage 1 while carrying forward the desirable outputs along with additional inputs2 into stage 2, (3) this produces final out-puts in stage 2.
The general two-stage network DEA model is given as the following linear program:
(1)
Ek = max
s∑
r=1
urYrk s.t.
m∑
i=1
viXik = 1,
s∑
r=1
urYrj −
m∑
i=1
viXij ≤ 0,
q∑
p=1
wpZpj −
m∑
i=1
viXij ≤ 0,
s∑
r=1
urYrj −
q∑
p=1
wpZpj ≤ 0, for j = 1, . . . , n;
ur , vi ,wp ≥ ε, r = 1, . . . .., s; i = 1, . . . . . . .,m; p = 1, . . . , q.
For expressing simply, we removed the non-Archimedean number ε. At optimality, the system and division efficien-cies are calculated as:
Even though the intermediate products Zg are not reflected directly in calculating the system efficiency Es
k , they have been considered for in deriving the division effi-ciencies E1
k and E2k which will affect Es
k through the mul-tiplier Ur and Vr. For decomposing the system efficiency into divisional efficiencies done through the following equation Es
k =[
ω1E1k + (1− ω1
]
×[
ω2E2k +
(
1− ω2)]
where ω1 =
∑mi=1 ViXi0
/(∑m
i=1 ViXi0
)
and
DataWe used data from 46 banks of India (26 public sec-tor banks, 20 private sector banks) for the period from 2014 to 2016, mainly collected from the Statistical Tables Relating to Banks in India published by the Reserve Bank of India (www.rbi.org.in). These 46 banks represent more than 85% of banking business across India. Also, there are 43 foreign and 51 cooperative banks that hold less than 15% of the banking business. Therefore, we are not included foreign banks and cooperative banks in our analysis. The shareholding pattern of these banks was collected from the latest Annual Reports of the respec-tive banks to corroborate any effects on the efficiency gap. For the analysis, we applied the same definitions and variables used by Gulati and Kumar [13], Kumar and Gulati [18] and Sharma and Dalip [25]. For the standard
(2)
Es0 = max
s(1)∑
r=1
UrY(undesirable)r0 +
s∑
r=s(1)+1
UrY(final)r0 ; s.t.
m∑
i=1
ViXi0 = 1
s(1)∑
r=1
UrY(undesirable)rj +
h∑
g=1
WgZgj −
m∑
i=1
ViXij ≤ 0, j = 1 . . . ..n
s∑
r=s(1)+1
UrY(final)rj −
h∑
g=1
WgZgj ≤ 0 j = 1 . . . ..n
Ur ,Vi ,Wg ≥ 0, r = 1 . . . ..s, i = 1 . . . . . .m, g = 1 . . . ..h
(3)
Esk =
s(1)�
r=1
UrY(undesirable)r0 +
s�
r=s(1)+1
UrY(final)r0
E1k =
s(1)�
r=1
UrY(undesirable)r0 +
h�
g=1
WgZg0
�
m�
i=1
ViXi0
E2k =
s�
r=s(1)+1
UrY(final)r0
�
h�
g=1
WgZg0
ω2=
h�
g=1
WgZg0 + ViXi0
�
m�
i=1
ViXi0 +
s(1)�
r=1
UrY(undesirable)r0
2 In this study no new additional input is introduced in the stage 2.
Page 5 of 9Hafsal et al. Futur Bus J (2020) 6:26
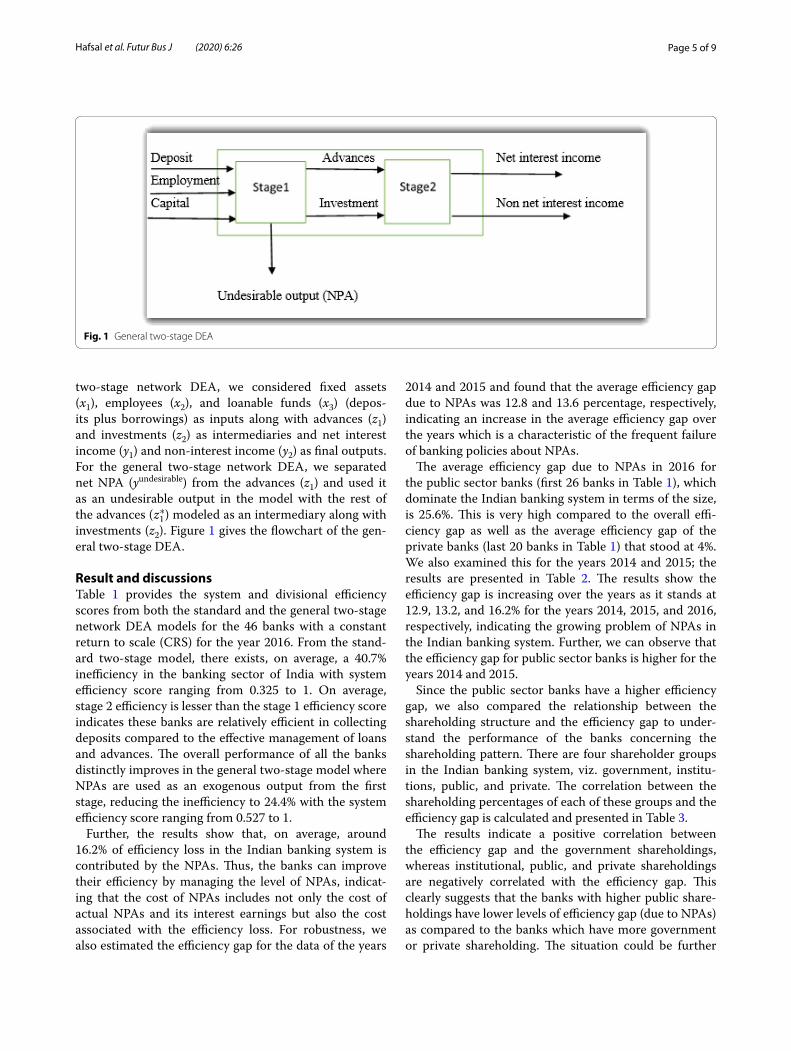
two-stage network DEA, we considered fixed assets (x1), employees (x2), and loanable funds (x3) (depos-its plus borrowings) as inputs along with advances (z1) and investments (z2) as intermediaries and net interest income (y1) and non-interest income (y2) as final outputs. For the general two-stage network DEA, we separated net NPA (yundesirable) from the advances (z1) and used it as an undesirable output in the model with the rest of the advances ( z∗1 ) modeled as an intermediary along with investments (z2). Figure 1 gives the flowchart of the gen-eral two-stage DEA.
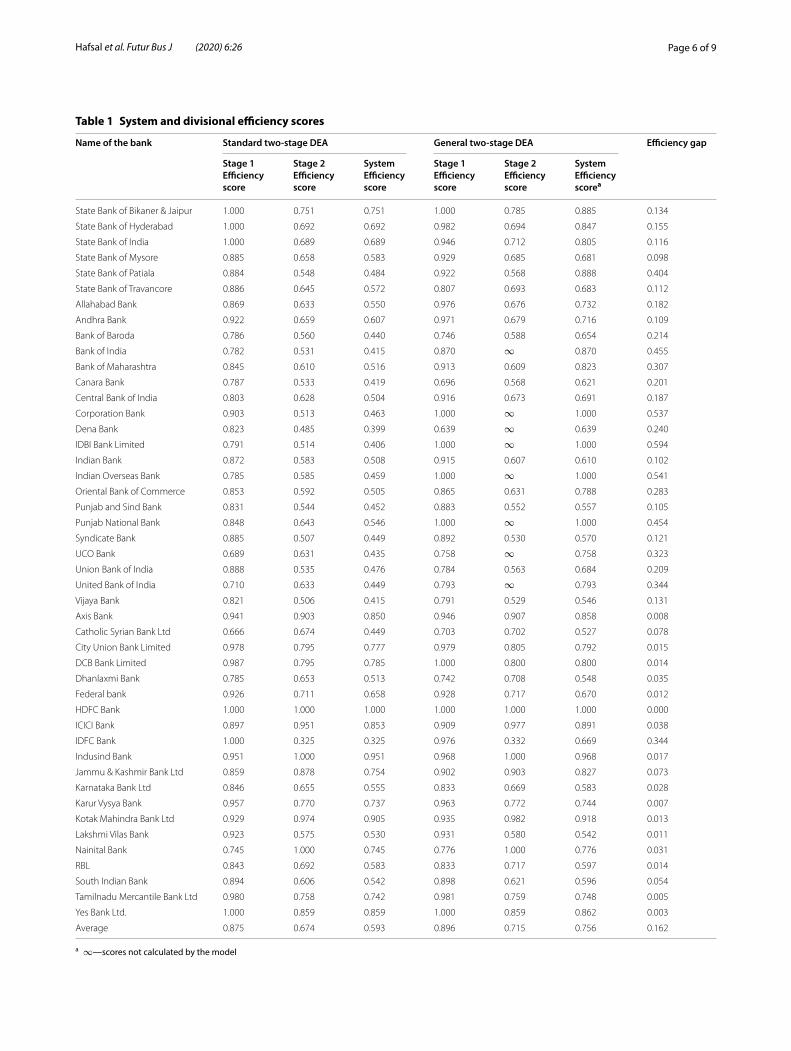
Result and discussionsTable 1 provides the system and divisional efficiency scores from both the standard and the general two-stage network DEA models for the 46 banks with a constant return to scale (CRS) for the year 2016. From the stand-ard two-stage model, there exists, on average, a 40.7% inefficiency in the banking sector of India with system efficiency score ranging from 0.325 to 1. On average, stage 2 efficiency is lesser than the stage 1 efficiency score indicates these banks are relatively efficient in collecting deposits compared to the effective management of loans and advances. The overall performance of all the banks distinctly improves in the general two-stage model where NPAs are used as an exogenous output from the first stage, reducing the inefficiency to 24.4% with the system efficiency score ranging from 0.527 to 1.
Further, the results show that, on average, around 16.2% of efficiency loss in the Indian banking system is contributed by the NPAs. Thus, the banks can improve their efficiency by managing the level of NPAs, indicat-ing that the cost of NPAs includes not only the cost of actual NPAs and its interest earnings but also the cost associated with the efficiency loss. For robustness, we also estimated the efficiency gap for the data of the years
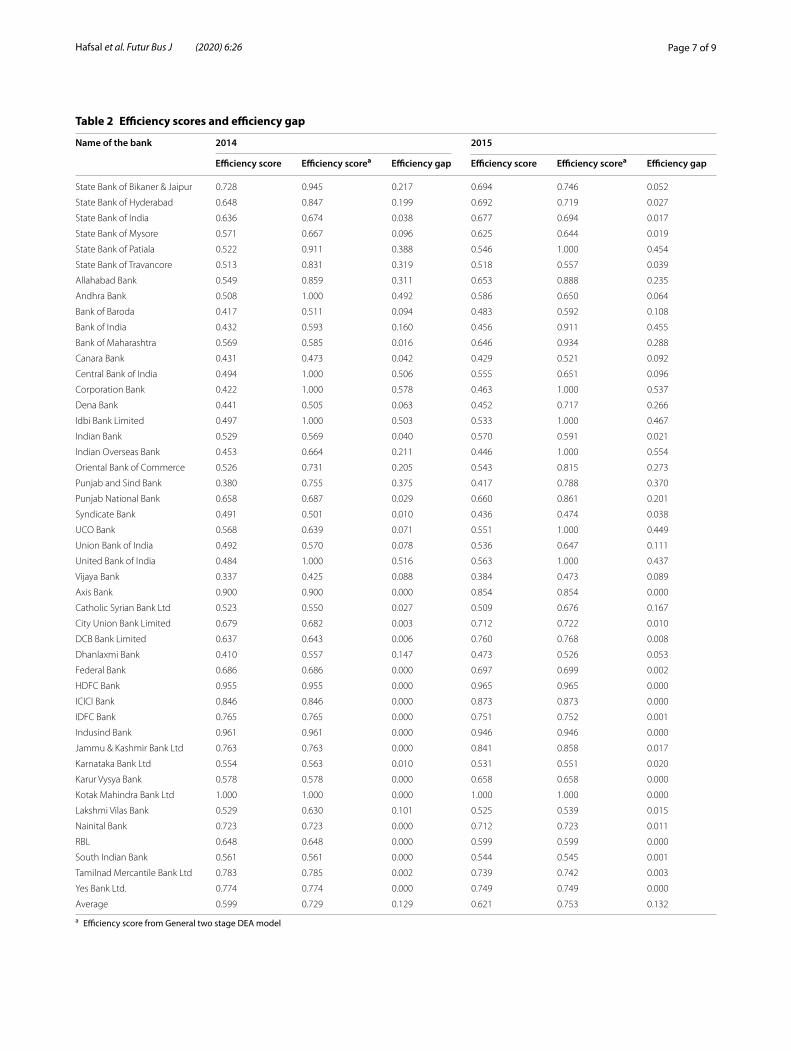
2014 and 2015 and found that the average efficiency gap due to NPAs was 12.8 and 13.6 percentage, respectively, indicating an increase in the average efficiency gap over the years which is a characteristic of the frequent failure of banking policies about NPAs.
The average efficiency gap due to NPAs in 2016 for the public sector banks (first 26 banks in Table 1), which dominate the Indian banking system in terms of the size, is 25.6%. This is very high compared to the overall effi-ciency gap as well as the average efficiency gap of the private banks (last 20 banks in Table 1) that stood at 4%. We also examined this for the years 2014 and 2015; the results are presented in Table 2. The results show the efficiency gap is increasing over the years as it stands at 12.9, 13.2, and 16.2% for the years 2014, 2015, and 2016, respectively, indicating the growing problem of NPAs in the Indian banking system. Further, we can observe that the efficiency gap for public sector banks is higher for the years 2014 and 2015.
Since the public sector banks have a higher efficiency gap, we also compared the relationship between the shareholding structure and the efficiency gap to under-stand the performance of the banks concerning the shareholding pattern. There are four shareholder groups in the Indian banking system, viz. government, institu-tions, public, and private. The correlation between the shareholding percentages of each of these groups and the efficiency gap is calculated and presented in Table 3.
The results indicate a positive correlation between the efficiency gap and the government shareholdings, whereas institutional, public, and private shareholdings are negatively correlated with the efficiency gap. This clearly suggests that the banks with higher public share-holdings have lower levels of efficiency gap (due to NPAs) as compared to the banks which have more government or private shareholding. The situation could be further
Fig. 1 General two-stage DEA
Page 6 of 9Hafsal et al. Futur Bus J (2020) 6:26
Table 1 System and divisional efficiency scores
Name of the bank Standard two‑stage DEA General two‑stage DEA Efficiency gap
Stage 1 Efficiency score
Stage 2 Efficiency score
System Efficiency score
Stage 1 Efficiency score
Stage 2 Efficiency score
System Efficiency scorea
State Bank of Bikaner & Jaipur 1.000 0.751 0.751 1.000 0.785 0.885 0.134
State Bank of Hyderabad 1.000 0.692 0.692 0.982 0.694 0.847 0.155
State Bank of India 1.000 0.689 0.689 0.946 0.712 0.805 0.116
State Bank of Mysore 0.885 0.658 0.583 0.929 0.685 0.681 0.098
State Bank of Patiala 0.884 0.548 0.484 0.922 0.568 0.888 0.404
State Bank of Travancore 0.886 0.645 0.572 0.807 0.693 0.683 0.112
Allahabad Bank 0.869 0.633 0.550 0.976 0.676 0.732 0.182
Andhra Bank 0.922 0.659 0.607 0.971 0.679 0.716 0.109
Bank of Baroda 0.786 0.560 0.440 0.746 0.588 0.654 0.214
Bank of India 0.782 0.531 0.415 0.870 ∞ 0.870 0.455
Bank of Maharashtra 0.845 0.610 0.516 0.913 0.609 0.823 0.307
Canara Bank 0.787 0.533 0.419 0.696 0.568 0.621 0.201
Central Bank of India 0.803 0.628 0.504 0.916 0.673 0.691 0.187
Corporation Bank 0.903 0.513 0.463 1.000 ∞ 1.000 0.537
Dena Bank 0.823 0.485 0.399 0.639 ∞ 0.639 0.240
IDBI Bank Limited 0.791 0.514 0.406 1.000 ∞ 1.000 0.594
Indian Bank 0.872 0.583 0.508 0.915 0.607 0.610 0.102
Indian Overseas Bank 0.785 0.585 0.459 1.000 ∞ 1.000 0.541
Oriental Bank of Commerce 0.853 0.592 0.505 0.865 0.631 0.788 0.283
Punjab and Sind Bank 0.831 0.544 0.452 0.883 0.552 0.557 0.105
Punjab National Bank 0.848 0.643 0.546 1.000 ∞ 1.000 0.454
Syndicate Bank 0.885 0.507 0.449 0.892 0.530 0.570 0.121
UCO Bank 0.689 0.631 0.435 0.758 ∞ 0.758 0.323
Union Bank of India 0.888 0.535 0.476 0.784 0.563 0.684 0.209
United Bank of India 0.710 0.633 0.449 0.793 ∞ 0.793 0.344
Vijaya Bank 0.821 0.506 0.415 0.791 0.529 0.546 0.131
Axis Bank 0.941 0.903 0.850 0.946 0.907 0.858 0.008
Catholic Syrian Bank Ltd 0.666 0.674 0.449 0.703 0.702 0.527 0.078
City Union Bank Limited 0.978 0.795 0.777 0.979 0.805 0.792 0.015
DCB Bank Limited 0.987 0.795 0.785 1.000 0.800 0.800 0.014
Dhanlaxmi Bank 0.785 0.653 0.513 0.742 0.708 0.548 0.035
Federal bank 0.926 0.711 0.658 0.928 0.717 0.670 0.012
HDFC Bank 1.000 1.000 1.000 1.000 1.000 1.000 0.000
ICICI Bank 0.897 0.951 0.853 0.909 0.977 0.891 0.038
IDFC Bank 1.000 0.325 0.325 0.976 0.332 0.669 0.344
Indusind Bank 0.951 1.000 0.951 0.968 1.000 0.968 0.017
Jammu & Kashmir Bank Ltd 0.859 0.878 0.754 0.902 0.903 0.827 0.073
Karnataka Bank Ltd 0.846 0.655 0.555 0.833 0.669 0.583 0.028
Karur Vysya Bank 0.957 0.770 0.737 0.963 0.772 0.744 0.007
Kotak Mahindra Bank Ltd 0.929 0.974 0.905 0.935 0.982 0.918 0.013
Lakshmi Vilas Bank 0.923 0.575 0.530 0.931 0.580 0.542 0.011
Nainital Bank 0.745 1.000 0.745 0.776 1.000 0.776 0.031
RBL 0.843 0.692 0.583 0.833 0.717 0.597 0.014
South Indian Bank 0.894 0.606 0.542 0.898 0.621 0.596 0.054
Tamilnadu Mercantile Bank Ltd 0.980 0.758 0.742 0.981 0.759 0.748 0.005
Yes Bank Ltd. 1.000 0.859 0.859 1.000 0.859 0.862 0.003
Average 0.875 0.674 0.593 0.896 0.715 0.756 0.162
a ∞—scores not calculated by the model
Page 7 of 9Hafsal et al. Futur Bus J (2020) 6:26
Table 2 Efficiency scores and efficiency gap
a Efficiency score from General two stage DEA model
Name of the bank 2014 2015
Efficiency score Efficiency scorea Efficiency gap Efficiency score Efficiency scorea Efficiency gap
State Bank of Bikaner & Jaipur 0.728 0.945 0.217 0.694 0.746 0.052
State Bank of Hyderabad 0.648 0.847 0.199 0.692 0.719 0.027
State Bank of India 0.636 0.674 0.038 0.677 0.694 0.017
State Bank of Mysore 0.571 0.667 0.096 0.625 0.644 0.019
State Bank of Patiala 0.522 0.911 0.388 0.546 1.000 0.454
State Bank of Travancore 0.513 0.831 0.319 0.518 0.557 0.039
Allahabad Bank 0.549 0.859 0.311 0.653 0.888 0.235
Andhra Bank 0.508 1.000 0.492 0.586 0.650 0.064
Bank of Baroda 0.417 0.511 0.094 0.483 0.592 0.108
Bank of India 0.432 0.593 0.160 0.456 0.911 0.455
Bank of Maharashtra 0.569 0.585 0.016 0.646 0.934 0.288
Canara Bank 0.431 0.473 0.042 0.429 0.521 0.092
Central Bank of India 0.494 1.000 0.506 0.555 0.651 0.096
Corporation Bank 0.422 1.000 0.578 0.463 1.000 0.537
Dena Bank 0.441 0.505 0.063 0.452 0.717 0.266
Idbi Bank Limited 0.497 1.000 0.503 0.533 1.000 0.467
Indian Bank 0.529 0.569 0.040 0.570 0.591 0.021
Indian Overseas Bank 0.453 0.664 0.211 0.446 1.000 0.554
Oriental Bank of Commerce 0.526 0.731 0.205 0.543 0.815 0.273
Punjab and Sind Bank 0.380 0.755 0.375 0.417 0.788 0.370
Punjab National Bank 0.658 0.687 0.029 0.660 0.861 0.201
Syndicate Bank 0.491 0.501 0.010 0.436 0.474 0.038
UCO Bank 0.568 0.639 0.071 0.551 1.000 0.449
Union Bank of India 0.492 0.570 0.078 0.536 0.647 0.111
United Bank of India 0.484 1.000 0.516 0.563 1.000 0.437
Vijaya Bank 0.337 0.425 0.088 0.384 0.473 0.089
Axis Bank 0.900 0.900 0.000 0.854 0.854 0.000
Catholic Syrian Bank Ltd 0.523 0.550 0.027 0.509 0.676 0.167
City Union Bank Limited 0.679 0.682 0.003 0.712 0.722 0.010
DCB Bank Limited 0.637 0.643 0.006 0.760 0.768 0.008
Dhanlaxmi Bank 0.410 0.557 0.147 0.473 0.526 0.053
Federal Bank 0.686 0.686 0.000 0.697 0.699 0.002
HDFC Bank 0.955 0.955 0.000 0.965 0.965 0.000
ICICI Bank 0.846 0.846 0.000 0.873 0.873 0.000
IDFC Bank 0.765 0.765 0.000 0.751 0.752 0.001
Indusind Bank 0.961 0.961 0.000 0.946 0.946 0.000
Jammu & Kashmir Bank Ltd 0.763 0.763 0.000 0.841 0.858 0.017
Karnataka Bank Ltd 0.554 0.563 0.010 0.531 0.551 0.020
Karur Vysya Bank 0.578 0.578 0.000 0.658 0.658 0.000
Kotak Mahindra Bank Ltd 1.000 1.000 0.000 1.000 1.000 0.000
Lakshmi Vilas Bank 0.529 0.630 0.101 0.525 0.539 0.015
Nainital Bank 0.723 0.723 0.000 0.712 0.723 0.011
RBL 0.648 0.648 0.000 0.599 0.599 0.000
South Indian Bank 0.561 0.561 0.000 0.544 0.545 0.001
Tamilnad Mercantile Bank Ltd 0.783 0.785 0.002 0.739 0.742 0.003
Yes Bank Ltd. 0.774 0.774 0.000 0.749 0.749 0.000
Average 0.599 0.729 0.129 0.621 0.753 0.132

Page 8 of 9Hafsal et al. Futur Bus J (2020) 6:26
improved by promoting the deregulation of ownership structure to allow these banks to make independent decisions in their business activities. Two lessons can be drawn from this study. First of all, the public sector banks have a more substantial efficiency loss due to NPAs. Sec-ondly, positive results in the future could be ensured by reducing the government’s shareholding in these public sector banks.
This massive, weighed down by NPAs of the public sector banks forced the government to initiate action toward resolving the situation. The Government of India recently decided to inject Rs. 2.1 trillion through various channels as a measure to recapitalize these public sector banks. In order to see whether this recapitalization meas-ure will bridge the efficiency gap, we ran a separate gen-eral two-stage network DEA with capital injection as an exogenous input entering in stage 2 of the model. Since the actual level of the capital injection is not known at present, we calculated 15 and 25% of the gross NPAs as a capital injection for each bank and found a reduction in the efficiency gap.3 The main policy implication from this analysis is that efficiency could be achieved by reducing the government’s shareholding in these banks. Further, recapitalization helps the banks to reduce the adverse effects of NPAs.
ConclusionThis study aims to understand the extent of inefficiency in the Indian banking sector due to non-performing assets (NPAs) using data on 46 banks for the financial year 2016. The analysis was carried out in an intermedia-tion approach to understand the divisional and system efficiency of the banks, first with the standard two-stage network DEA model of Kao and Hwang [17] and then with the general two-stage network DEA model of Kao [16] by keeping NPAs as an undesirable exogenous out-put to understand the efficiency gap due to NPAs. The efficiency estimates of these two models have shown that
around 16.2% of the efficiency loss arises due to NPAs in the Indian banking sector.
This highlights the fact that NPAs are squeezing banks’ capital position and profitability, leading to further dete-rioration of the Indian banking sector and the economy. Also, the analysis has shown that the shareholding pat-tern affected the efficiency gap. The results revealed that the banks with more public shareholding have a lower level of efficiency gap due to NPAs as compared to those which have more government or private shareholding. The managerial implications derived from this study are twofold: First, the banks can improve their efficiency by managing the level of NPAs. Second, it indicates that the cost of NPAs includes not only the cost of actual NPAs and its interest earnings but also the cost associated with the efficiency loss. Further, the findings also suggest that in addition to recapitalizing the public sector banks, dis-investing the government shareholding could improve the efficiency of these banks.
AbbreviationsNPA: non-performing assets; DEA: data envelopment analysis; CRS: constant return to scale; DMU: decision making units; RBI: Reserve Bank of India.
AcknowledgementsThe authors thank the editor and two anonymous referees of this journal for their valuable comments on this paper.
Authors’ contributionsAll the authors HK, AS, and RSD have equal contributions in conceiving the idea and analyzing the empirical results. HK and AS prepared the introduction, literature review, and collected data for the study. RSD contributed in estimat-ing the model. All authors have read and approved the manuscript.
FundingThe authors declare that no funding from any agencies was received for this study.
Availability of data and materialsThe data used in this paper are collected from the Reserve Bank of India database (RBI) (www.rbi.org.in).
Competing interestsThe authors declare that they have no competing interests.
Author details1 School of Economics, University of Hyderabad, Prof. C R Rao Road, Hyderabad, Telangana 500046, India. 2 Central University of Andhra Pradesh, Anantapur, Andhra Pradesh 515002, India.
Received: 22 July 2019 Accepted: 5 May 2020
References 1. Akther S, Fukuyama H, Weber WL (2013) Estimating two-stage network
slacks-based inefficiency: an application to Bangladesh banking. Omega 41:88–96
2. Barros CP, Managi S, Matousek R (2012) The technical efficiency of the Japanese banks: non-radial directional performance measurement with undesirable output. Omega 40:1–83 The results of this analysis are not presented here but can be obtained from
the authors upon request.
Table 3 Correlation between shareholding pattern and efficiency gap
Shareholding group Correlation
Government 0.583
Institutions − 0.291
Public − 0.442
Private − 0.155
Page 9 of 9Hafsal et al. Futur Bus J (2020) 6:26
3. Bawa JK, Goyal V, Mitra SK, Banu S (2018) Analysis of NPAs of Indian banks: using a comprehensive framework of 31 financial ratios. IIMB Manag Rev 30:191–284
4. Berger AN, Mester LJ (1997) Inside the black box: What explains dif-ferences in the efficiencies of financial institutions? J Bank Finance 21:895–947
5. Bhattacharyya A, Lovell CAK, Sahay P (1997) The impact of liberalization on the productive efficiency of Indian commercial banks. Eur J Oper Res 98:332–345
6. Chang CC (1999) The nonparametric risk-adjusted efficiency measure-ment: an application to Taiwan’s major rural financial intermediaries. Am J Agric Econ 81:902–913
7. Chen PC, Yu M, Managi S, Chang C (2011) Non-radial directional per-formance measurement with undesirable outputs. Tohoku University, Working Paper
8. Das A, Shanmugam KR (2004) Efficiency of Indian commercial banks dur-ing the reform period. Appl Financ Econ 14:681–686
9. Davis EP (2003) Institutional investors, financial market efficiency, and financial stability. EIB Pap 8(1):77–107
10. Färe R, Grosskopf S, Lovell CAK, Pasurka C (1989) Multilateral productiv-ity comparisons when some outputs are undesirable: a nonparametric approach. Rev Econ Stat 71:90–98
11. Fujii H, Managi S, Matousek R (2014) Indian bank efficiency and produc-tivity changes with undesirable outputs: a disaggregated approach. J Bank Finance 38:41–50
12. Fukuyama H, Weber WL (2015) Measuring Japanese bank performance: a dynamic network DEA approach. J Prod Anal 44:249–264
13. Gulati R, Kumar SR (2017) Analysing banks’ intermediation and operating efficiencies using the two-stage network DEA model: the case of India. Int J Product Perform Manag 66:500–516
14. Indira R, Garima V (2002) Non-performing loans of PSU banks some panel results. Econ Polit Wkly 37
15. Jayaraman AR, Srinivasan MR (2014) Performance evaluation of banks in India—a Shannon-DEA approach. Eur J Bus Econ 7:51–68
16. Kao C (2017) Efficiency measurement and frontier projection identifica-tion for general two-stage systems in data envelopment analysis. Eur J Oper Res 261:679–689
17. Kao C, Hwang SN (2008) Efficiency decomposition in two-stage data envelopment analysis: an application to non-life insurance companies in Taiwan. Eur J Oper Res 185:418–429
18. Kumar S, Gulati R (2009) Did efficiency of Indian public sector banks converge with banking reforms? Int Rev Econ 56(1):47–84
19. Matthews K (2013) Risk management and managerial efficiency in Chi-nese banks: a network DEA framework. Omega 41:207–215
20. Moradi M, Jabbari Nooghabi M, Rounaghi MM (2019) Investigation of fractal market hypothesis and forecasting time series stock returns for Tehran Stock Exchange and London Stock Exchange. Int J Finance Econ (forthcoming)
21. Partovia E, Matousek R (2019) Bank efficiency and non-performing loans: evidence from Turkey. Res Int Bus Finance 48:287–309
22. Ray SC, Das A (2010) Distribution of cost and profit efficiency: evidence from Indian banking. Eur J Oper Res 201:297–307
23. Rounaghi MM, Zadeh FN (2016) Investigation of market efficiency and financial stability between S&P 500 and London stock exchange: monthly and yearly forecasting of time series stock returns using ARMA model. Phys A 456:10–21
24. Sandeepa K, Gupta PK (2015) Productive efficiency mapping of the Indian banking system using data envelopment analysis. Procedia Econ Finance 25:227–238
25. Sharma SK, Dalip R (2014) Efficiency and productivity analysis of Indian banking industry using Hicks–Moorsteen approach. Int J Product Perform Manag 63:57–84
26. Tzeremes NG (2015) Efficiency dynamics in Indian banking: a conditional directional distance approach. Eur J Oper Res 240:807–818
Publisher’s NoteSpringer Nature remains neutral with regard to jurisdictional claims in pub-lished maps and institutional affiliations.


