Embed Size (px)
Citation preview

The Pennsylvania State University
The Graduate School
College of Information Sciences and Technology
EFFECTS OF MOOD AND STRESS ON GROUP COMMUNICATION AND
PERFORMANCE IN A SIMULATED TASK ENVIRONMENT
A Dissertation in
Information Sciences and Technology
by
Mark S. Pfaff
© 2008 Mark S. Pfaff
Submitted in Partial Fulfillment of the Requirements
for the Degree of
Doctor of Philosophy
May 2008

ii
The dissertation of Mark Stephen Pfaff was reviewed and approved* by the following:
Michael D. McNeese Professor of Information Sciences and Technology and Psychology Thesis Advisor Chair of Committee David L. Hall Professor of Information Sciences and Technology Xiaolong (Luke) Zhang Assistant Professor of Information Sciences and Technology S. Shyam Sundar Professor of Media Studies John Yen Associate Dean for Research and Graduate Programs University Professor of Information Sciences and Technology *Signatures are on file in the Graduate School.

iii
ABSTRACT
In technologically complex work environments, human error is frequently cited as the
primary failure in many large-scale accidents. These errors are often attributed to the high
physical and emotional stress common in time-pressured and hazardous work environments.
Emerging research in human-computer interaction (HCI) suggests that these accidents may also
be attributed to errors in system design, particularly those features which fail to account for user
frustration, anxiety, stress, and boredom.
Overlapping findings in the stress and emotion research literatures suggest possible
interactions between mood states and stressors in terms of their joint impact on cognitive task
performance. This research explored these effects further in the context of group task
performance.
This research extended the NeoCITIES simulation, a simulated task environment (STE)
based around the context of geo-collaborative crisis management, to run team-based human
subject experiments designed to explore possible mediating or moderating effects of positive and
negative moods on the complex relationship between stress and distributed decision making.
These effects were assessed in terms of multiple dimensions of task performance including
timeliness and accuracy of resource allocation tasks and content analysis of communications
data.
These effects were investigated in two similar experiments, each applying a qualitatively
different stressor to teams in happy and sad mood states across a series of within-subjects trials.
Performance data, self-reported mood and stress measures, and team communications were

iv
analyzed for interactions between mood and stress. The first experiment revealed evidence that
negative affect mediated the impact of a task load stressor on team task performance. In the
second experiment, the negative mood manipulation diminished team perspective to the extent
that participants were unmotivated by a team-level performance pressure stressor. Additional
findings provided insight into multiple main effects and interactions between mood and stress on
specific communication behaviors and perceptions of within-team cooperation.
Contributions of this study include extensions to the theories relating moods, stress, and
team cognition. Among these are demonstrations of both mediation and moderation of stressors
by mood states and additional evidence of the orthogonality of positive and negative affect.
Methodological advances were made through the development of a new chat coding scheme to
analyze within-team behaviors. The study also led to the development of a robust experimental
platform for reliably implementing and automating complex psychological manipulations and
measures in a team-based simulated task environment. Together these aid in the development of
additional studies on team cognition as well as suggest new concerns in the design of systems
use in team decision making under stress.

v
TABLE OF CONTENTS
LIST OF FIGURES................................................................................................................................................. viii LIST OF TABLES......................................................................................................................................................ix LIST OF EQUATIONS...............................................................................................................................................x ACKNOWLEDGEMENTS .......................................................................................................................................xi CHAPTER 1 INTRODUCTION................................................................................................................................1
DECISION MAKING UNDER STRESS .............................................................................................................................3 DISTRIBUTED COGNITION..........................................................................................................................................4 TEAM DECISION MAKING UNDER STRESS .................................................................................................................6 RESEARCH OBJECTIVES .............................................................................................................................................7 BROADER IMPACTS....................................................................................................................................................8
CHAPTER 2 STRESS...............................................................................................................................................10 CONCEPTUALIZATIONS OF STRESS...........................................................................................................................10 STRESSORS AND STRESS ..........................................................................................................................................13
Operationalizing and Measuring Stress.............................................................................................................15 Reliability and Validity ......................................................................................................................................17 Summary of Stress Measures and Manipulations ..............................................................................................18
STRESS AND COGNITION..........................................................................................................................................19 STRESS IN DISTRIBUTED COGNITION .......................................................................................................................23
CHAPTER 3 MOOD.................................................................................................................................................28 MODELS OF AFFECT ................................................................................................................................................28 MOODS AND EMOTIONAL EXPERIENCES..................................................................................................................31
Operationalizing and Measuring Moods ...........................................................................................................32 Reliability and Validity ......................................................................................................................................34 Summary of Mood Measures and Manipulations...............................................................................................35
MOOD AND COGNITION............................................................................................................................................36 CHAPTER 4 INTERACTIONS BETWEEN MOOD AND STRESS...................................................................41
DISTINGUISHING MOOD AND STRESS ......................................................................................................................41 CAUSE AND EFFECT.................................................................................................................................................43 THEORIES OF MOOD AND STRESS ............................................................................................................................44 SUMMARY OF FINDINGS ..........................................................................................................................................45 HYPOTHESES ...........................................................................................................................................................48
CHAPTER 5 NEOCITIES........................................................................................................................................50 THE NEOCITIES SIMULATION ................................................................................................................................50 EXTENDING THE NEOCITIES SIMULATION.........................................................................................................52
Flexible Team Configuration .............................................................................................................................52 Controlling Simulated Travel Time....................................................................................................................55 User Interface Enhancements ............................................................................................................................56 Integrating Psychological Manipulations and Measures...................................................................................58 Development of the Chat Coding Measures.......................................................................................................59
CHAPTER 6 RESEARCH METHODOLOGY......................................................................................................62 METHODOLOGIES IN TEAM RESEARCH ....................................................................................................................62 SIMULATED TASK ENVIRONMENTS (STES) .............................................................................................................64 TASK .......................................................................................................................................................................66 PARTICIPANTS .........................................................................................................................................................70

vi
EXPERIMENTAL DESIGN ..........................................................................................................................................70 MANIPULATIONS AND MEASURES ...........................................................................................................................71
Independent Variables .......................................................................................................................................71 Stress............................................................................................................................................................................... 71 Mood............................................................................................................................................................................... 72
Dependent Variables..........................................................................................................................................73 Task Performance ........................................................................................................................................................... 73 Communication variables ............................................................................................................................................... 78
Individual Difference Measures .........................................................................................................................80 Mood and Stress Measures ................................................................................................................................81
EQUIPMENT .............................................................................................................................................................83 PROCEDURES ...........................................................................................................................................................84
CHAPTER 7 RESULTS ...........................................................................................................................................88 MANIPULATION CHECK ITEMS ................................................................................................................................88 EXPERIMENT 1.........................................................................................................................................................91
Descriptive Data ................................................................................................................................................91 Manipulation Checks .........................................................................................................................................91 Main Results.......................................................................................................................................................94
Dyad Task Performance.................................................................................................................................................. 95 Testing of Hypotheses..................................................................................................................................................... 96 Dyad Communications.................................................................................................................................................... 97
EXPERIMENT 2.......................................................................................................................................................100 Changes from experiment 1 .............................................................................................................................100 Descriptive Data ..............................................................................................................................................101 Manipulation Checks .......................................................................................................................................101 Main results .....................................................................................................................................................102
Dyad Task Performance................................................................................................................................................ 102 Testing of Hypotheses................................................................................................................................................... 104 Dyad Communications.................................................................................................................................................. 107
CHAPTER 8 DISCUSSION ...................................................................................................................................110 EXPERIMENT ONE..................................................................................................................................................110
Support for Hypotheses in Experiment 1..........................................................................................................111 Chat behavior...................................................................................................................................................116
EXPERIMENT TWO .................................................................................................................................................117 Support for Hypotheses in Experiment 2..........................................................................................................119 Chat Behavior ..................................................................................................................................................124
SUMMARY OF RESULTS .........................................................................................................................................125 LIMITATIONS .........................................................................................................................................................129 CONTRIBUTIONS ....................................................................................................................................................131 FUTURE WORK ......................................................................................................................................................133 PRACTICAL APPLICATIONS ....................................................................................................................................136
REFERENCES ........................................................................................................................................................139 APPENDIX A: SURVEY ITEMS ..........................................................................................................................149
PRE-TASK SURVEY................................................................................................................................................149 Section 1...........................................................................................................................................................149 Section 2...........................................................................................................................................................150
POST-TASK SURVEY ..............................................................................................................................................151 Section 1...........................................................................................................................................................151 Section 2...........................................................................................................................................................152
WRAP-UP SURVEY .................................................................................................................................................153 Section 1...........................................................................................................................................................153

vii
APPENDIX B: CODING PROCEDURE FOR NEOCITIES CHAT LOGS .....................................................155 CODES .................................................................................................................................................................155 CODING RULES .................................................................................................................................................155
Information ......................................................................................................................................................156 Coordination ....................................................................................................................................................157 Action ...............................................................................................................................................................158 Acknowledgments (ACK) .................................................................................................................................158 Insignificant statements (INSIG)......................................................................................................................158
APPENDIX C: STIMULUS SCREENSHOTS .....................................................................................................159
viii
LIST OF FIGURES
FIGURE 1: SCHEMATIC REPRESENTATION OF THE EFFECTS OF STRESS UPON COGNITION (YATES ET AL., 1995)............20 FIGURE 2: INVERTED U-SHAPE CURVE OF THE YERKES-DODSON LAW (YERKES & DODSON, 1908) ............................21 FIGURE 3: THEORETICAL FRAMEWORK FOR TEAM ADAPTATION (SOURCE: SERFATY ET AL., 1998) .............................24 FIGURE 4: MODEL OF CORE AFFECT SHOWING AXES OF PLEASURE AND ACTIVATION (SOURCE: RUSSELL, 2003).........29 FIGURE 5: WATSON AND TELLEGEN'S TWO-FACTOR MODEL OF AFFECT (SOURCE: WATSON & TELLEGEN, 1985) ......31 FIGURE 6: ABSTRACT MODEL OF INDIVIDUAL'S INTERACTING WITH OBJECT (IIO) (SOURCE: SUN & ZHANG, 2006) ...37 FIGURE 7: MODEL OF MOOD MEDIATING THE EFFECT OF STRESS ON COGNITION ..........................................................47 FIGURE 8: MODEL OF MOOD MODERATING THE EFFECT OF STRESS ON COGNITION .......................................................47 FIGURE 9: MEDIATING MODEL IN TERMS OF THE FIRST THREE HYPOTHESES.................................................................49 FIGURE 10: NEOCITIES IN ITS FIRST MULTISESSION TEST............................................................................................53 FIGURE 11: NEOCITIES ONLINE ADMINISTRATION TOOL.............................................................................................54 FIGURE 12: SCREENSHOT OF THE NEOCITIES CLIENT INTERFACE ...............................................................................56 FIGURE 13: NEOCITIES LABORATORY WORKSTATIONS .............................................................................................67 FIGURE 14: EVENT GROWTH CURVES SHOWING CHANGES IN EVENT MAGNITUDES OVER TIME GIVEN THE ALLOCATION
OF 0, 1, OR 5 RESOURCES TO EVENTS OF VARYING INITIAL MAGNITUDE ..............................................................76 FIGURE 15: EXAMPLE SCORING FOR AN EVENT OF INTIAL MAGNITUDE OF 2 ADDRESSED WITH 2 RESOURCES AT TIME
STEP 30 ...............................................................................................................................................................77 FIGURE 16: OVERLAY OF AFFECT MEASURES ON BOTH MODELS OF AFFECT .................................................................90 FIGURE 17: MOOD X STRESS INTERACTION FOR TASK PERFORMANCE IN EXPERIMENT 1..............................................95 FIGURE 18: MOOD X STRESS INTERACTION FOR %IT...................................................................................................99 FIGURE 19: MOOD X STRESS INTERACTION FOR TOTAL COMMUNICATIONS ...............................................................100 FIGURE 20: MOOD X STRESS INTERACTION FOR TASK PERFORMANCE IN EXPERIMENT 2............................................103 FIGURE 21: MOOD X STRESS INTERACTION FOR INFORMATION ANTICIPATION ..........................................................108 FIGURE 22: MOOD MEDIATING THE EFFECT OF STRESS UPON TASK PERFORMANCE ....................................................114 FIGURE 23: POSSIBLE DOUBLY MEDIATED RELATIONSHIP BETWEEN STRESS AND PERFORMANCE ..............................120
ix
LIST OF TABLES
TABLE 1 FEEDBACK MESSAGES RECEIVED BY RESOURCE MANAGERS..............................................................................69 TABLE 2 EXPERIMENTAL CONDITIONS ..........................................................................................................................71 TABLE 3 SUMMARY OF INDEPENDENT AND DEPENDENT VARIABLES ...............................................................................71 TABLE 4 MOVIES USED FOR MOOD MANIPULATIONS ......................................................................................................73 TABLE 5 TEAM COMMUNICATION ENCODING MEASUREMENTS........................................................................................78 TABLE 6 CONTROL MEASURES OF INDIVIDUAL DIFFERENCES .........................................................................................80 TABLE 7 SUMMARY OF MANIPULATION CHECK FACTORS ................................................................................................89 TABLE 8 MOOD X STRESS INTERACTION FOR TASK PERFORMANCE IN EXPERIMENT 1......................................................96 TABLE 9 MOOD X STRESS INTERACTION FOR %IT.........................................................................................................99 TABLE 10 MOOD X STRESS INTERACTION FOR TOTAL COMMUNICATIONS .....................................................................100 TABLE 11 MOOD X STRESS INTERACTION FOR TASK PERFORMANCE IN EXPERIMENT 2..................................................103 TABLE 12 FACTOR STRUCTURE OF THE POST-TASK ASSESSMENTS .................................................................................105 TABLE 13 SUMMARY OF ANALYSIS OF VARIANCE FOR COMMUNICATION VARIABLES .......................................................107 TABLE 14 MOOD X STRESS INTERACTION FOR INFORMATION ANTICIPATION .................................................................109 TABLE 15 SUMMARY OF HYPOTHESES SUPPORTED IN EXPERIMENT 1 ............................................................................111 TABLE 16 SUPPORT OF HYPOTHESES IN EXPERIMENT 2................................................................................................119

x
LIST OF EQUATIONS
EQUATION 1: NEOCITIES EVENT MAGNITUDE FORMULA (WELLENS & ERGENER, 1988)............................................74 EQUATION 2: EVENT SCORE AND FINAL DYAD SCORE FORMULAS.................................................................................77

xi
ACKNOWLEDGEMENTS
My advisor, Michael McNeese, and my committee, David Hall, Shyam Sundar, and Luke Zhang, for showing me the way and keeping me on track.
Marc Friedenberg for his help on the NeoCITIES team configuration tool.
Ben Hellar for his help in developing the database underlying the psychological manipulations and measures.
Both Ben and Marc for breaking important ground with Flex which has paved the way for NeoCITIES for years to come.
Bimal Balakrishnan for countless hours spent answering my tedious questions about experimental design and data analysis.
Selorm Samuel Kwame Edor for his help with the coding scheme and encoding the chat data.
Rashaad Jones and Erik Connors for paving the way for me with the original version of NeoCITIES. Also Scott Pezanowski for working so incredibly hard on the continuing its continuing development.
My wonderful wife Kristin for her loving support throughout all of this. Just think, it’s almost over! Oh wait, no it’s not….
My parents, Daniel and Eileen for their useful advice and tremendous support while I pursued my degree.
The excellent library resources and personnel at Penn State University.
The helpful folks at the Statistics Consulting Center, and Mary Beth Oliver’s excellent materials on data analysis.
Dr. John A. Johnson for supplying the original CGI scripts for the IPIP NEO-PI instrument and offering useful advice on the use of these measures.
Dr. Karen Gasper for her advice on the mood manipulation procedures.
Qdoba for steadily supporting my burrito-based diet. I also recommend Cozy Thai.
Christopher Quinn, my longtime friend, for being my lifting partner and being there to watch cartoons and play cards with when I desperately needed some time off from my work. I gained 25 lbs and got my bench press up to 210 lbs. during the course of this dissertation with his help.
Eric Schmidt for taking a parallel journey with me, first at the University of Chicago and now at University of Calgary. Yes.
Probably many many more, but I’m running out of room. Still, thanks very much.

1
CHAPTER 1 INTRODUCTION
Scholarly interest in the effects of stress on human performance has risen considerably in
the wake of multiple high-profile accidents. Three widely cited examples are the partial core
meltdown at the Three Mile Island nuclear plant (Wickens, 1992), the accidental targeting and
destruction of an Iranian airbus by the U.S.S. Vincennes (Collyer & Malecki, 1998), and the
Exxon Valdez oil spill in Alaska’s Prince William Sound, the worst oil spill in U.S. history
(Salas, Driskell, & Hughes, 1996). Individual and group cognition have been tested at high levels
of many kinds of stressors during the responses to such crises as the September 11, 2001 attacks
on the World Trade Center and the 2005 Hurricane Katrina.
These diverse domains share a number of common features: interdependent collaborative
work processes, technologically complex environments, ill-structured problems, dynamic and
competing goals, and conflicts between organizational norms and personal expertise. Also
common among these domains are considerable physical, cognitive, and emotional challenges
including time-pressure, high uncertainty, hazardous conditions, and high-risk outcomes
(Orasanu & Connolly, 1993). These characteristics are also familiar to those in commercial
aviation, emergency medicine, fire-fighting, and police work (Salas et al., 1996)
Retrospective analysis of events such as these often cites operator error as the primary
failure (Perrow, 1984), with official reports giving an oversimplified explanation that stress
caused the error. The Fogarty report following the Vincennes tragedy concluded that, overall, the
officers in charge had performed properly and acted within the rules of engagement, yet “stress,
task fixation, and unconscious distortion of data may have played a major role in this incident.”

2
(Fogarty, 1988, p. 63) The simple view is that stress causes mistakes, but it is often unclear
which specific sorts of stress – or consequences of stress – are to blame.
Emerging research in human-computer interaction (HCI) suggests that these accidents
may be attributed not just to human error during the incident, but to errors in system design,
particularly those features which fail to account for psychological states such as frustration,
anxiety, fear, or boredom (e.g.Ahn & Picard, 2006; Hudlicka, 2003; Kapoor, Burleson, & Picard,
2007). In such dynamic and difficult work environments, the effects of stress and emotion are
both factors worth investigating, though the emotional components tend to be subsumed by the
more popular target of stress. As a result, emotions are less frequently discussed in detail due to
the overwhelmingly negative emotional connotation of stress in the research literature.
Stress is not consistently detrimental to all aspects of performance. Indeed, in certain
contexts (such as military training) some stressors are not only expected, but serve to motivate
operators to high levels of performance (Morris, Hancock, & Shirkey, 2004). However, the task
or environmental characteristics that make a stressful situation beneficial or detrimental to
performance are unclear. In order to find more clarity in this matter, this study explored whether
emotional responses to these characteristics were playing a mediating or moderating role in the
relationship between stress and performance.
To explore these issues it is necessary to conceptually differentiate stress and emotion
while unpacking their relationship to each other. This is an ambitious task. Both stress and mood
consist of multiple complex dimensions. “High stress” and “low mood” are phrases that may
work colloquially but are otherwise unquantifiable statements. There are ongoing debates in the
literatures of emotion and stress regarding which models best capture how each construct truly

3
operates in the context of human cognition and behavior. These individual battles have spilled
into each other in some cases to debate whether stress includes emotional dimensions or if stress
itself is subsumed among the emotions.
Research into these problems must explore both individual and distributed cognition in
context in order to understand the specific interrelationships of multiple actors in the
technologically complex group situations described above. Many bodies of research investigate
the effects of specific emotional conditions or stressors upon individual cognitive activities, but
research in these topics at the group level is far less common. In this study, careful manipulations
of mood and stress states were applied during group problem solving tasks to try to draw out
what really happens within and between individuals when working under stress.
DECISION MAKING UNDER STRESS Classical views of decision making maintain that emotions and stress derail otherwise
optimal rationalistic thought. Poor decisions are frequently criticized for having been made with
emotion rather than reason (Hammond, 2000). Contemporary views of naturalistic decision
making, on the other hand, are interested in how severely stressed decision makers can perform
as well as they do in spite of a demonstrable departure from rationalistic decision processes. In
fact, even unstressed individuals depart from normative, rationalistic decision models (Klein,
1998).
The Recognition-Primed Decision (RPD) Model (Klein, 1993) describes how individuals
utilize expertise to make rapid and accurate decisions in complex situations without
systematically evaluating multiple courses of action. When cues or patterns in a given situation
are recognized as a known case, the appropriate course of action is immediately selected without

4
further analysis. In less typical cases, mental simulations generate potential solutions until the
first one that appears to work is selected as the course of action. No further time is spent
weighing options against each other. The RPD model has been applied extensively to domains in
which critical (often life or death) decisions must be made on a moment’s notice, such as fire
fighting, crisis response, and emergency medicine. Recognition-primed decision making actually
harmonizes better with stressors than do strictly rational decision methods, especially for
experienced decision makers. The challenges posed by stressors (such as noise, pain, or time
pressure) to attention, memory, and information gathering are more disruptive to structured
decision systems than to recognitional methods (Klein, 1998).
If most decisions in complex work domains are made by groups, does RPD apply to
group decision making? Hayne, Smith, and Vijayasarathy (2005) extended the RPD model to
determine whether this pattern recognition strategy could function at the group level. Three-
member distributed teams playing a strategy game against a computer were supplied with a tool
to share pattern “chunks” between members. Use of the tool increased collective pattern
recognition by the team, while outcome quality was unaffected by time pressure. This serves as
one demonstration that characteristics of the RPD model may also be observed in group decision
making tasks. The tasks implemented in this study rely on effective distributed cognition for
successful results, which provides the opportunity to further explore the characteristics and
results of team decision making under stress.
DISTRIBUTED COGNITION In the context of group work, cognition does not stay neatly confined to the individual
level. The theory of distributed cognition (Hollan, Hutchins, & Kirsh, 2000) extends the concept
of cognition beyond one individual’s skull to identify cognitive processes distributed among

5
multiple individuals and objects in an environment over time. Three primary questions in
distributed cognition are: (1) how do individual cognitive processes map to group activities, (2)
what are the differences between individual and group cognitive processes, and (3) how do group
activities shape individual cognition? Research on distributed cognition relies extensively on
fieldwork, recordings of actual work practices, as well as simulations and experiments. This
approach is ideally suited for research in computer-supported cooperative work (CSCW). It helps
to identify mismatches between work practices and technological artifacts which aids in the
development of enhanced systems and procedures. It reveals tendencies and behaviors that will
not emerge in the studies of individuals.
Team performance research simultaneously considers the individual and group level of
analysis. Only individuals perform actions and experience stressors in an environment; the team
as an entity does not do or feel anything. Yet the regulating processes and collective outcomes of
these interactions are clearly in the domain of group activity. Researchers are often challenged to
distinguish which aspects of a problem belong to the individual and which belong to the group.
In this study, actions and behaviors have been captured at both levels in order to better
understand which are which. This data in turn painted a picture of distributed cognition in action.
The concept of team requires further definition, particularly in comparison to the term
group, as the two are often used interchangeably in the literature. Of the two, group is the more
general term. Groups tend to consist of a less-differentiated membership, coalesce for a given
goal, and then disband. Teams generally have a shared history, a projected future, and distinct
functions and roles. These are not rigid distinctions, as flexible teams may often interchange
roles or redistribute tasks (Brannick & Prince, 1997). In the context of this study, the term team

6
refers to a collection of individuals organized in such a manner to serve a function (e.g. police
department) for a host organization (e.g. municipal emergency center). To manage a complex
event, multiple teams (for example, the police and hazardous materials services) may have to
share information and coordinate activities to address a compound threat (such as an overturned
chemical truck) as a group.
TEAM DECISION MAKING UNDER STRESS Multiple theories exist to explain the effects of various stressors and emotions on
attention, problem solving, and decision-making in individuals. These have been tested
experimentally across a broad range of psychological perspectives: cognitive, behavioral, social,
and clinical. However, they have rarely been studied within the context of distributed cognition
and group activity. This research gap is partially due to the challenges met in experimentally
controlling and measuring several independent and interdependent actions leading toward a
group outcome. Other very justifiable reasons include the ethical and technical difficulties in
recreating realistic crisis environments to examine group decision making under stress. Many
laboratory experiments on stress and emotion utilize highly-abstracted cognitive tasks, such as
letter or word recognition (e.g. Gasper, 2003; Mathews, May, Mogg, & Eysenck, 1990; Mogg,
Mathews, Bird, & Macgregor-Morris, 1990), or puzzle-solving tasks, such as the Prisoner’s
Dilemma Game (Axelrod, 1980). Ideally, the interaction and overlap between these theories
would be best studied on human subjects in an environment similar to the real setting of the
problem, but with the experimental control afforded by laboratory research. One possible
solution to this problem is the simulated task environment (STE). This experimental approach
facilitates a safe and effective approach to examine specific cognitive and behavioral phenomena
with high ecological validity (Gray, 2002).

7
The STE selected for this research, NeoCITIES, utilizes resource allocation problem
scenarios designed with the help of real-world intelligence analysts and field studies in rural,
metropolitan, and state-wide emergency response centers (Jones, McNeese, Connors, Jefferson,
& Hall, 2004). The domain of emergency crisis management comprises multiple distributed
teams responsible for the safety and welfare of a given geographic area. In the peak of a crisis
response, individuals within these teams can be subjected to severe emotional and physical
challenges, yet must sustain high-cognitive demands in terms of attending to, retaining,
processing, and communicating information within and between teams. In NeoCITIES, this
group activity consists of distributed individuals jointly gathering information about emergency
events, allocating the appropriate type and quantity of resources to address those events, and
detecting emerging threats and patterns of activity from the underlying scenario. The group has a
complex structure – a team of teams – consisting of three dyads in which each member has a
distinct role. This experimental approach provides a holistic assessment of distributed cognition
by returning real-time performance metrics, tool use behaviors, and team communication
measures.
RESEARCH OBJECTIVES There is a clear need to study group decision making in its natural setting in order to
develop effective decision-support technology, training, and operational practice. Previous
studies have tested the effects of specific kinds of stress and mood states upon specific aspects of
individual cognition in controlled laboratory settings (e.g. Braunstein-Bercovitz, 2003; Keinan,
Friedland, Kahneman, & Roth, 1999). This dissertation, however, reviews and merges findings
across the stress and emotion literatures to determine how these effects may manifest in concert
in a realistic distributed decision making context. By conducting experiments with human

8
subjects in a STE employed as a “stress simulator” (Yates, Klatzky, & Young, 1995), this
research aims to clarify the effects and interactions of specific stressors and moods in complex
group decision making tasks.
The primary goal of this research is to improve our understanding of the complex
relationship between stress, mood, and group decision making within a simulated task
environment. This begins with reviews of the concepts of stress and mood in chapters 2 and 3,
respectively. Chapter 4 explores the intersections between the two to justify proposing that mood
may be mediating or moderating the effects of stress upon group task performance. This chapter
also presents the hypotheses designed to test for those relationships.
Chapter 5 describes the NeoCITIES simulation in detail. To meet the requirements of this
study, the NeoCITIES simulation has been extended to support and range of psychological
manipulations and measures which are detailed in chapter 6 along with the full experimental
methodology. The results of the two experiments conducted are presented in chapter 7. Finally,
chapter 8 includes a detailed discussion of these results, followed by the limitations and
contributions of this work, plans for future experiments, and an exploration of the practical
implications of this work.
BROADER IMPACTS Group decision making under stress is an ever-growing concern for the domestic and
international community as the government, military, and civilian sectors are all showing a shift
to larger-scale, distributed, and asynchronous joint efforts for humanitarian response, counter-
terrorism efforts, and military actions (McNeese et al., 2006) The emergency management
domain utilized in this study serves as an example of a command, control, and communications

9
(C3) structure aiming to supply geographically distributed individuals with a common
operational picture. As such, the findings of this and future studies are intended to suggest
procedural and technological interventions that may help to compensate for (or harmonize with)
the inescapably challenging conditions of multiple C3 domains including military operations, air
traffic control, and geo-collaborative crisis management.

10
CHAPTER 2 STRESS
Multiple vectors of research intersect the phenomena related to group decision making
under stress. Complicating matters is the vague and overlapping usage of concepts like stress,
stressor, emotion, and mood. Some studies refer to “emotional stress” or “stressful moods” (e.g.
Christine L. Sheppard-Sawyer, 2000; Matthews, Dorn, & Glendon, 1991) This chapter begins to
discriminate among these concepts by examining multiple conceptualizations of stress and
reviewing the interactions between this concept and individual and distributed cognition. Chapter
3 continues this effort by examining mood states, and chapter 4 explores the intersections and
interactions between mood and stress.
CONCEPTUALIZATIONS OF STRESS It is commonplace for someone to claim to be “stressed-out” or that a particular
encounter was “stressful.” The concept of stress may be found as an independent variable, a
dependent variable, or a process (Cooper, Dewe, & O'Driscoll, 2001). In its colloquial form,
stress may be broadly defined as the opposite of relaxation. However, the specific causes,
characteristics, and effects of stress bridge psychological, behavioral, and physiological
phenomena. This leads to multiple conceptions of stress depending on the orientation of the
research at hand. In this research, the focus is on short-term or situational stress as found during
critical incidents or crises, rather than the long-term stress associated with a hazardous career or
strenuous living conditions.
Human stress research first emerged from work of two 19th century experimental
physiologists, Claude Bernard and Walter Cannon. Bernard (c.f. 1961) argued that organisms
survive by regulating their internal environment according to changes in the external

11
environment, a process called “homeostasis.” Cannon demonstrated how animals experience
significant deviations from homeostasis (e.g. elevated heart-rate and dilated pupils) when
presented with a stressor such as another predator animal, which led to his proposal of the “fight
or flight” response (Cannon, 1929).
Hans Selye (1956) later developed a systematic model of this biologically deterministic
approach. He defined the stress response, or strain, as a deviation from an individual’s
homeostatic stability, and defined a stressor to denote the external event or condition causing the
stress. In this context, stress in excess, or distress, is seen as a disease or syndrome leading to
poor health. Selye also identified eustress, or good stress, which may stimulate faster or more
effective performance. The term “stress” in general usage has become synonymous with Selye’s
concept of distress, while eustress is discussed far less frequently.
A systems model of stress adopts the broad definition that “a situation is considered
stressful if it puts pressure on the individual to perform more accurately or faster or differently
from his normal mode” (Solley, 1969, p. 1). Socio-behavioral studies of stress define stress as
challenging life events or hassles in daily life which lead to unhealthy behaviors, such as
substance abuse (Cerbone & Larison, 2000). Family stress theory defines stress as critical life or
work events which have a negative impact upon the family (Boss, 1987). Organizational stress
theory, the domain most closely aligned with the proposed research, defines it as individuals’
perception of work events combined with their dispositional traits resulting in psychological,
physiological, or behavioral strains (Cooper et al., 2001). Note that the systems model stands out
as a motivational viewpoint on stress, while the rest associate stress solely with negative
outcomes.

12
From the diverse range of definitions above, stress may be described as a generalized
phenomenon with no specific cause and a broad spectrum of effects. Though it is often spoken of
as an emotion-like state – “I’m feeling stressed” – stress itself appears to be a process. The
definitions descending from the classical views of stress as defined by Cannon and Selye are
limited in that they view the stress response as an automatic reaction to something objectively
identified as a threat. This one-size-fits-all viewpoint can not readily account for differences in
stress responses between individuals or situations. More recent stress research has shown that the
psychological process of appraisal, in which a person ascribes meaning to a potentially
threatening situation, is generally much more relevant to the stress response than the objective
characteristics of the situation. Two individuals experiencing the same objective threat may
appraise it differently, and therefore experience two radically different stress responses. Even the
same person may appraise identical threats differently on different occasions.
Most contemporary research on stress in the context of work and performance refers to
Richard Lazarus’ transactional model of stress (Lazarus & Folkman, 1984). According to this
model, stress is characterized as the relationship between the perceived demands of the current
situation and the individual’s ability to respond. When the demands appear to outweigh the
ability to respond, the individual experiences stress. The process of appraisal is central to the
transactional model. Primary appraisal is the evaluation of the personal relevance of the threat, as
well as the potential challenge or harm it may carry. Secondary appraisal is the assessment of the
individual’s capacity to cope with that particular threat. The discrepancies between the primary
and secondary appraisals drive the stress response. This transactional definition states that stress
is neither the environmental stimulus, nor the individual response, but the relationship between
the two. Therefore, what seems stressful for one individual may be unremarkable for another.

13
The quality of the appraisal predicts the type of response to the stressor. If the situation is
deemed a threat, the expectation is of imminent harm, leading to feelings of fear and anxiety. On
the other hand, if the situation is appraised as a challenge (i.e. the demands still exceed the
resources to respond, but in a qualitatively different way), the individual may instead experience
feelings of confidence and motivation. The bulk of organizational stress research dwells on the
type of stress deemed to be a threat, rather than a challenge. This may explain the persistent
association of stress with negative affect, as well as the predominant notion of stress as an
impediment to performance.
Lazarus’ model defines coping as “cognitive and behavioral efforts to manage specific
external and/or internal demands that are appraised as taxing or exceeding the resources of the
person” (Lazarus & Folkman, 1984, p. 141). Following the stress response, which may be one or
more of the physiological and emotional reactions mentioned above (and defined in more detail
below), the process of coping encompasses the changes in performance style and efficacy
observed in individuals performing tasks in a stressful environment. These changes are among
the dependent measures of this study.
STRESSORS AND STRESS It is difficult to use the terms “stress” and “stressor” consistently. In some cases, stressors
cause stress. In others, individuals encounter stress and experience strain (cognitive and
otherwise). External viewpoints of stress focus on defining and measuring environmental factors
causing changes in an individual’s psychological or physiological state. Fisher (1984) offers the
broad operational definition that stress is “any condition which causes a stress response.” In this
sense, stress is defined as any common stimuli (heat, noise, fatigue, etc.) experienced beyond the

14
bounds of what would be considered normal and producing a recognizable physiological,
cognitive, or behavioral response.
Viewpoints of stress as an internal bodily reaction are not concerned with the
characteristics of the stressor (i.e. stress has no specific cause), alarm reactions to the stressor
(being startled), or non-specific qualitative assessments of stress. From this perspective, stress is
identified in specified ranges of physiological and psychological responses. The two primary
components of these responses are modulations of the sympathetic nervous system (SNS) and
hypothalmic-pituitary-adrenal (HPA) activation, though other systems in the central and
peripheral nervous systems may be measurably affected.
Organizational stress research proposes additional non-physical stressors to the above
definitions. Cannon-Bowers and Salas (1998) identified the following list of stressors observed
among Naval crews:
• Multiple information sources • Incomplete, conflicting information • Rapidly changing, evolving scenarios • Requirement for team coordination • Adverse physical conditions (e.g. heat, noise, sleep deprivation) • Performance pressure • Time pressure • High work/information load • Auditory overload/interference • Threat (p. 19)
From the organizational viewpoint, stress may consist of simultaneous reactions to external
conditions (e.g. time pressure), as well as internal states (e.g. feelings of social inadequacy). For
example, Driskell and Salas (1991) operationalized stress as both a threat to the individual’s
well-being as well as an increase in personal responsibility for group task outcome. Performance

15
pressure has been manipulated experimentally as context-specific stress (e.g. pre-exposure to
graphically intense scenes related to the context of the task) which was found to increase the
subjects’ motivation to succeed (Morris et al., 2004). Other organizational factors relevant to
stress include social support in the workplace (Parkes, 1980) and work pace (Broadbent & Gath,
1981).
Operationalizing and Measuring Stress As there are multiple conceptualizations of stress, there is accordingly a diverse range of
approaches for manipulating and measuring the presence, magnitude, and impact of stress. For
this research, the unit of observation for stress was the individual, while impact, in the form of
task performance measures, was observed at both the individual and group level.
External stress stimuli are operationalized by either measuring or manipulating the
external forces acting upon the individual. The stressful tasks administered to subjects may be
inherently challenging (such as highly difficult arithmetic operations) or may be routine tasks
administered in an adverse environment. Physical stressors have been operationalized in the lab
using mild electric shocks or immersing the subject’s arm in ice cold water (Aldwin, 1994).
Driskell, Salas, and Johnston (1999) manipulated stress in a group decision task through the
presence or absence of auditory distractions, high/low time pressure, and high/low task load.
Many studies have used extremes of temperature to induce stress (Hancock, 1986).
Certain psychological states are also considered to be precursors to the stress response.
The Everly Stress and Symptom Inventory (ESSI) and Impact of Event Scale (IES) (Horowitz,
Wilner, & Alvarez, 1979) are surveys used as predictive instruments as well as screening

16
devices. Though internal to the individual, stress measured in this way is seen as a cause, rather
than an effect.
Internal stress responses are operationalized through the measurement of physiological
responses. SNS activation in the form of positive changes in heart rate and blood pressure
indicate the presence of a stressed state. Increases in skin conductance and decreases in skin
temperature also indicate stress (Meehan, Insko, Whitton, & Brooks Jr., 2002). Somatic nervous
system activation may be assessed via electromyography of the frontalis muscles of the forehead.
Increased electrical activity indicates a response to stress. Additionally, increased cerebral
activity in response to stress may be measured using an electroencephalogram (EEG) or cerebral
blood flow velocity (CBFV) measured using Doppler sonography. CBFV also reveals
hemispheric differences in stress response. These techniques provide real-time measurement
over the duration of the experimental task, while survey measures are limited to snapshots in
time, usually before and after the task. The intrusiveness of physiological measurement
equipment needs to be considered carefully with respect to the tasks and setting of the stress
experiment.
The transactional perspective focuses on the individual’s perception of stress. Multiple
self-report measures are used to measure subjective stress states. The Dundee Stress State
Questionnaire (DSSQ) assesses the individual’s present task engagement, distress, and worry
(Matthews et al., 2002) through responses ranging from 1 (not at all) to 5 (extremely). These
three factors closely match the classical “mental trilogy” concept of conation, affect, and
cognition (Hilgard, 1980). Engagement includes energetic arousal, motivation (as interest as well
as to succeed), concentration, task focus, and appraisal of the event as a challenge. High

17
engagement generally enhances an individual’s control over attention and effort. Distress
includes tense arousal, low confidence, emotional focus, and appraisal of the event as a threat.
High distress tends to disrupt executive control and inhibit multitasking as individuals attempt to
alleviate overload. Worry involves self-consciousness, cognitive interference (both personal and
task-related), avoidance behaviors, and appraisal of the event as a failure to attain a goal. High
worry diminishes global cognition as individuals reassess the personal relevance of the event.
Several context specific stress assessments exist, such as the Combat Exposure Scale
(CES) which quantifies combat-related stressors (Keane et al., 1989). In cases where workload is
used to manipulate stress, the NASA-TLX (Hart & Staveland, 1988)is a widely-used workload
assessment tool for high-demand settings which provides a self-reported score from 0 to 100
computed from the weighted average of six subscales.
Reliability and Validity Two primary concerns with using self-report questionnaires in stress research are their
intrusiveness in the experimental situation and their potential to prime or condition subjects to
the stressful stimuli. The DSSQ has proven to be an effective assessment of stress reactions, yet
its length, 90 questions, makes it a fatiguing instrument where multiple measurement points are
required. The Short Stress State Questionnaire (SSSQ), based on the DSSQ, provides a rapid and
reliable assessment of the same three primary dimensions with only 24 questions (Helton &
Garland, 2006). The NASA-TLX is used to assess the task load of a wide range of work
situations with high reliability. However, the relationship between task load and stress is often an
indirect one. Shorter, more contextually targeted surveys such as the CES have shown high
construct validity within their intended domain when care is taken to ensure the experimental
context is aligned with the assumptions of the survey instrument.

18
Physiological measurements such as heart rate, skin conductance, and skin temperature
provide highly sensitive and real-time measures of the stress responses, which are difficult for
the subject to “fake” or consciously control. EMG assessment of stress response is vulnerable to
some consistency issues, including training subjects to relax the muscles prior to testing, as well
as sensitivity to inconsistent electrode placement and skin preparation. A complication with most
psychophysiological techniques is that these sensitive measures are also subject to measurement
noise from the subject’s involuntary movement or other environmental factors. Usage without
proper protocols will negatively impact the reliability and validity of such measures.
Many laboratory measures of stress suffer from sensitization effects. After repeated
exposures, the stimulus stressor may produce a gradually diminishing response. This reduces the
test-retest stability of the measure. In addition, as multiple distinct stress responses may impact
the same physiological measure (e.g. blood pressure), it may be difficult to establish discriminant
validity. An alternative approach which partially addresses both of these problems is to
additionally measure the time required for the autonomic response to return to its pre-stimulus
level, rather than focus solely on the magnitude of the stress response. However, this only
identifies the response factor having the greatest impact. This approach has reduced construct
validity, as it masks lesser stress response factors (Everly & Sobelman, 1987).
Summary of Stress Measures and Manipulations In this study, stress is defined as the conscious or unconscious perception of internal or
external pressures causing deviation from normal interactions with an individual’s environment.
From the transactive viewpoint, stress is a multidimensional concept that must incorporate the
perception of stress, in addition to the characteristics of the stimulus and coping response. For
assessing the perception of stress, the SSSQ was selected as it carries the pedigree of the proven

19
DSSQ, with considerably less intrusiveness even if administered at multiple points during a
simulation. The stress stimuli in these experiments were manipulated through variations of task
load and performance feedback, though sensitization effects had to be carefully considered to
ensure the manipulations remained effective across multiple exposures. These stimuli were
scripted throughout the design of the crisis scenarios subjects were tasked with resolving.
Psychophysiological response measures were not used in the present study, but future work is
likely to explore the value of real-time measures of stress responses in this experimental context.
STRESS AND COGNITION Figure 1 illustrates the relationship between the concepts of threat, stress, and cognition
(Yates et al., 1995). In accordance with Lazarus’ transactional theory of stress, a threat is defined
as a person’s perception that he or she possesses insufficient resources to meet a present demand
(e.g. “That bear is larger and faster than I am and will probably eat me.”). A stressor is any set of
situational conditions causing the perception of a threat, with stress consisting of the physical
and emotional reactions to that threat. That reaction is modulated by individual differences in the
form of personal circumstances, traits, or self-appraisals of the current situation. For example, a
novice driver in heavy freeway traffic would be overwhelmed with the demands of merging and
navigating at high-speed, while an experienced commuter would not. Personal characteristics
will bias the reaction to a stressor, as a person predisposed to anxiety may feel greater stress in a
given situation than a non-anxious person. Finally, someone greatly underestimating the scale of
a threat will obviously feel less stressed than another who has a more accurate appraisal of the
same situation. “Other Factors” include everything else interacting with the current cognitive
activities (e.g. distractions, stimulants or intoxicants, etc.), since stress may play a large or small
role in affecting cognition, depending on the context.

20
Figure 1: Schematic representation of the effects of stress upon cognition (Yates et al., 1995)
Lazarus would likely point out that this model lacks a feedback loop by which changes to
cognition affect changes in the process of appraisal. It is by that process that stressors are
constantly reappraised in light of new perspectives on the situation. For example, if an individual
does not like the feeling accompanying the reaction to a threat, a conscious decision can be made
to reappraise the threat in nonthreatening terms in order to diminish that unpleasant feeling.
The transition between a non-stressful to a stressful situation is not always an increase of
task demands. In the case of the novice driver mentioned above, the demands of the task
exceeded the ability of this driver to respond, but were unremarkable for the experienced
commuter. However, if the commuter driver, in the same objective conditions, was also late for
an appointment, stress would likely ensue, increasing the likelihood of a hasty judgment or risky
maneuver. In this particular instance, it is a change in meaning rather than circumstances that
leads to stress.
Figure 2 shows the inverted U-shaped relationship between stress and cognitive
performance, known as the Yerkes-Dodson Law (Yerkes & Dodson, 1908), a model which is
commonly cited across many areas of stress research. The underlying idea is that individuals
perform best at some optimal level of stress or arousal. Too little arousal leads to disinterest and
boredom, while too much leads to cognitive overload, both of which negatively impact task

21
performance. Overall, this relationship is consistent with the observation that many different
cognitive functions are affected by multiple stressors in similar ways. What this general model
lacks, however, is the ability to account for the relevance of specific stress reactions to individual
cognitive functions.
Stress or Arousal
Perf
orm
ance
Figure 2: Inverted U-shape curve of the Yerkes-Dodson Law (Yerkes & Dodson, 1908)
The most commonly cited cognitive impacts of the stress response include changes to
attention, memory, decision speed, and learning (for a review see Mendl, 1999). The “limited
resources” theory of attention (Kahneman, 1973) suggests that the attentional resources available
are reduced by the effort required to attend to and cope with other stressors, such as excessive
noise, heat, or sleep deprivation. This competition for resources leads to increased errors in
directing or sustaining attention on a particular task (Hancock, 1986). There is also a tendency
for episodes of stress to lead to a narrowing effect of attention in which central features of an
event are more accurately perceived and remembered than peripheral ones. In tasks where
peripheral or contextual information is as significant as central information for successful
performance, this tendency leads to increased errors (Easterbrook, 1959). Stressful conditions
may lead individuals to make decisions using quicker strategies, but with reduced accuracy, for
one or more of the following reasons: premature closure (reaching a decision before completely
considering all options), nonsystematic scanning (considering options in a frantic and
disorganized manner), and temporal narrowing (allocating insufficient time to evaluate each
22
option) (Keinan, 1987). Proponents of recognition-primed decision making would point out that
none of those will necessarily lead to poor decisions. One strength of experienced decision
makers is their ability to recognize and select a suitable course of action without expending the
time and cognitive energy evaluating extraneous options.
Although stress often demonstrates a narrowing effect on attention, the degree to which a
person may be distracted by irrelevant or peripheral stimuli may actually increase under stress.
One experimental strategy used to explore this particular phenomenon is latent inhibition (LI). LI
describes the selective attention process in which pre-exposed irrelevant stimuli continues to be
ignored upon later exposure. If the irrelevant stimulus later becomes a target stimulus, the LI
effect makes reorientation difficult. Thus, the amount of attention drawn by the irrelevant
stimulus is diminished by pre-exposure, making the LI effect useful for measuring distraction by
irrelevant stimuli.
High situational stress has been shown to strongly attenuate LI (Braunstein-Bercovitz,
Dimentman-Ashkenazi, & Lubow, 2001). In the low-stress condition, pre-exposed subjects
performed very poorly compared to non-pre-exposed subjects in a masked letter-identification
task (demonstrating the LI effect). Pre-exposed and non-pre-exposed subjects in the high stress
conditions, however, performed equally – in fact, they performed nearly the same as non-pre-
exposed subjects in the low stress condition. This negative effect of stress upon selective
attention has also been demonstrated in the form of negative priming effects (Braunstein-
Bercovitz, 2003), and Stroop interference (Keinan et al., 1999). This demonstrates that one
cognitive effect of stress is the impairment of selective attention. In an applied context, operators
conditioned to ignore certain stimuli will become more distracted by it when under high stress.

23
Bowers, Weaver, and Morgan (1996) detail additional factors that moderate the effect of
stress upon cognitive performance. Individual factors that improve the response to environmental
stressors include perceived control, self-control, incentive, and, interestingly, alcohol intake. In
dealing with individual stressors in a group context, an internal locus of control (belief that
outcomes are governed by internal abilities rather than by external chance), participation in
decision making, group cohesion, and supervisor support provide beneficial effects, while
anxiety, reactivity, and type A personalities are detrimental to the stress response. Interactions
between the mood and stress manipulations in this study and some of these measures are evident
in examples such as depression diminishing perceived control while positive affect increases it
(Hudlicka, 2003). Hence, following this example, it is very possible that individuals with
measureable differences in the locus of control trait to show differential responses to the mood
manipulations. Some of these factors were utilized as control measures in this study: trait
anxiety, locus of control, and tolerance of ambiguity. Three of the five factors in the five-factor
model (FFM) of personality (Digman, 1990) are also suggested for inclusion in this study:
extraversion, conscientiousness, and neuroticism.
STRESS IN DISTRIBUTED COGNITION Group decision making under stress is a topic of great concern to high-complexity and
high-stakes sectors, such as the military, aerospace, and energy industries. Wherever human error
can lead to catastrophic results, efforts must be made to understand and mitigate the phenomena
that negatively impact a group at work. As stress, variously defined, is among the most
frequently blamed factors, it is consequently a prominent feature of many models of team
performance. Research in this area investigates how some teams successfully adapt to stressful
conditions, while others do not.

24
The Adaptive Team Model (figure 3) illustrates how stress is both an input and an output
of team processes (Serfaty, Entin, & Johnston, 1998). This model demonstrates the interaction of
the effects of stress upon individual cognition with those stressors found in organizational
contexts, such as role uncertainty or miscommunication. Not only does individual stress impact
team processes, but difficulties in the team processes themselves can generate stress.
Performance feedback also modulates stress – poor performance informs the team that there are
failures at one or more layers in the process. Successful teams must be responsive to these
feedback structures, rather than rigidly adhere to some fixed approach to teamwork.
Figure 3: Theoretical framework for team adaptation (Source: Serfaty et al., 1998)
The traditional centralization-of-authority hypothesis, commonly cited in organizational
literature, holds that organizations will centralize authority in response to stress, thereby
concentrating decision making power higher in the command hierarchy (Staw, Sandelands, &
Dutton, 1981). This hypothesis predicts increasingly rigid and narrow information processing
and decision making for organizations under stress, analogous to the effects often described for

25
individuals under stress. Recently many organizations, including the military, have been trying to
determine when it is more appropriate to move power from the center to the edges, as well as
how to successfully study, implement and manage such organizational architectures (Bolia &
Nelson, 2007).
Driskell and Salas (1991) tested the centralization-of-authority hypothesis at the small-
group level of analysis on U.S. Navy students. The goal was to contrast this hypothesis to other
research indicating that group members under stress at all levels of the hierarchy actually become
more receptive to input from each other. Acute stress was defined as an interaction that was not
only a threat to the individual’s well-being, but also increased the individual’s responsibility for
the team’s success. They found that low ranking subjects did defer more to authority when under
stress, though contrary to the centralization-of-authority hypothesis, higher-ranking subjects
under stress were more open to input from their lower-ranking partners. Possible explanations for
this phenomenon may be a desire for individuals to diffuse responsibility for high-stakes
decisions, or that decision makers under stress require more social comparison to validate their
own evaluations. The task in this experiment was an ambiguous visual appraisal task (assessing
the whiter of two checkerboard patterns), so these results need to be re-examined in a real-world
group task setting.
In complex environments, the pressure to perform is a well known situational stressor
that can negatively impact the task performance of even the most highly skilled operators. One
explanation is that performance pressure focuses attention closely onto monitoring one’s own
task performance processes. Previously well-rehearsed and automatic procedures become more
like the tentative steps of a novice which lead to significant decreases in performance. Studies

26
have demonstrated this effect using multiple performance stressors including competition,
monetary incentives, and audience-induced pressure (Baumeister, 1984). Other successful
implementations of performance pressure stressors target specific individuals and settings, such
as pressures designed for on-base Naval students (Driskell & Salas, 1991). In such cases,
experimenters can apply stronger manipulations than would be believed or ethically permitted in
the context of using university students as subjects in a lab.
A contrasting viewpoint is that performance pressure produces a distraction from the task
at hand, rather than focusing attention too closely upon its execution. Distraction theories suggest
that under pressure, working memory and attentional resources are divided between the primary
task and thoughts about the importance and consequences of the current situation (Beilock, Kulp,
Holt, & Carr, 2004).
The ability of stress to manipulate individuals’ attention has also been tested in the group
context to examine the relationship between stress, team perspective, and team performance
(Driskell et al., 1999). Members of highly interdependent teams who had to collaborate to
complete a task showed a broader team perspective than those on teams who worked
independently of each other. Conditions of high stress caused a marked reduction in team
perspective among interdependent team members, which is analogous to the changes in attention
observed among individuals under stress. This narrowing of perspective to a self-focus led to
diminished performance, though after the effect of team perspective was controlled for, it was
found that neither the level of stress nor the interdependence of team members was a significant
predictor of performance. In fact, team perspective mediated the effect of stress on team

27
performance. This finding serves as a demonstration that in stressful situations, it is not
necessarily the stress alone that leads to changes in performance.
As the research reviewed above indicates, stress is far from a simple unidimensional
construct, as the Yerkes-Dodson curve might suggest. Stress is an ongoing process between an
individual and his or her environment which has multiple interacting psychological and
physiological results, including changes in mood, cognitive ability, and physical performance. In
this study, the emphasis is specifically on the interactions between stress and its mood-related
outcomes.

28
CHAPTER 3 MOOD
Until fairly recently, emotions and stress have been considered separate fields of study.
Stress was (and still is) a substantial concern to many fields of study, while emotions have been
an interesting puzzle with uncertain practical applications. Discussions of mood are often
plagued with problems of ambiguity similar to those reviewed previously with the concept of
stress. The terms affect, mood, emotion, and feeling are often used interchangeably, so additional
clarification is necessary before discussing these concepts in terms of their interactions with
cognition and task performance (and in chapter 4, with stress).
MODELS OF AFFECT Russell (2003) has produced a valuable decomposition of the essential concepts
underlying what is casually referred to as emotion. According to Russell’s taxonomy, emotions
may be about a particular object, or may simply be. The term emotion is used broadly to
encompass anything from the thrill of success to prolonged depression to a frightened reaction.
These experiences have such profoundly different time scales, intensities, and functions that it is
impossible to account for them all in one unified construct. Rather, prototypical emotional
episodes may be distinguished from core affect.
Core affect describes the elementary emotional state a person is in. It is not a cognitive or
reflective activity, but rather a backdrop in a person’s consciousness that drifts freely in response
to conscious or unconscious events without any specific orientation toward an object. For
example, simply feeling happy is core affect, but feeling happy as a result of receiving a gift is an
emotional episode. Core affect is similar to the terms feeling or mood in their common usage.

29
Russell specifically defines mood as a prolonged core affect with no object or a quasi-object,
which is the definition used in this research.
The model of core affect (figure 4) provides a two-dimensional representation of
primitive emotions. The horizontal Pleasure-Displeasure axis is generally defined as affective
valence, and the vertical Activation-Deactivation axis is referred to as activation or arousal. It is
not intended to be a descriptive model of how emotions work, but a framework for showing
relationships between affective states. Russell explains, “As with [body] temperature, core affect
is simple at a subjective level but complex at the biological level.” (Russell, 2003, p. 148)
Figure 4: Model of core affect showing axes of pleasure and activation (Source: Russell, 2003)
While this model cannot fully account for the collection of emotional events leading to a
particular affective state, it provides a framework to relate affective variables in context. The
pleasure axis corresponds to positive or negative affective valence. Anxiety, for example, may be
defined as an affective state somewhere in the upper left quadrant – a state of elevated activation
and displeasure. Introducing pleasure (e.g. in the form of positive feedback on task performance)

30
to a subject in an anxious state may maintain the activation of the former state, but shift toward a
more pleasurable emotional state. This new state may have a noticeably different effect upon the
individual’s cognitive processes.
Prototypical emotional episodes (also called full-blown emotions or blue-ribbon
emotions) are categorically distinct instances of a commonly identifiable emotion: fright, joy,
shame, disgust, and so on. These episodes are each characterized by a particular core affect,
specific behaviors (e.g. smile with happy, run away with fear), attention toward and appraisal of
the object relating to this emotion, the awareness of having a specific emotional experience, as
well as the physiological reactions to the emotional stimulus. Episodes have a beginning and an
end, with the duration measuring the persistence of the emotion. In contrast to the definition in
the previous paragraph, anxiety as a prototypical emotional episode could be defined as “an
emotional state that results when a stressor is interpreted as requiring avoidance, and some sort
of harm is anticipated.” (Bowers et al., 1996, p. 173)
Russell’s model is similar to a number of two-dimensional representations of affective
states (for a review see Yik, Russell, & Feldman Barrett, 1999). One point of contention between
these models is whether positive and negative affect are two endpoints of a single bipolar
measure, or if they are actually two independent constructs. A model in which the two are
independent rotates the valence axes such that positive and negative affectivity are orthogonal,
with activation (relabeled engagement) shared between the two (see figure 5).

31
Figure 5: Watson and Tellegen's two-factor model of affect (Source: Watson & Tellegen, 1985)
While it seems logical that oppositely valenced emotions would be inversely correlated,
many studies have found occasions of little correlation between negative and positive affectivity
(e.g. Cropanzano, Weiss, Hale, & Reb, 2003; Watson & Clark, 1997), which has led to the
development of separate scales for positive and negative affectivity. Russell and Carroll (1999)
respond that bipolarity provides the most parsimonious explanation and these inconsistencies
between positive and negative affect can be explained by imprecise measurement methods and
variations in time frame. However, Yik et al (1999) admit that which model is best applied to a
given research program is a choice best left to the researcher.
MOODS AND EMOTIONAL EXPERIENCES There are four general approaches for observing an individual’s mood: behaviors and
actions, physiological measurements, self-reports, and environmental contexts (Lazarus, 1991).
The first approach refers to observing intentional or unintentional actions, such as facial
expressions, crying, or physical postures. Physiological reactions such as changes in heart rate,

32
blood pressure, or skin conductance all can indicate changes in an individual’s mood. Simply
asking people how they feel is one of the most common methods used in emotion research.
Finally, observing the events or context around an individual allows for some inference about
current emotional states. For example, an individual who has just been insulted is likely to feel
hostile and angry, while another watching a sad movie is likely to feel unhappy and distressed.
This last approach is also the source of most mood manipulations. By stimulating an individual
with a story, song, or a memory associated with a particular emotional state, it is possible to put
that individual into the suggested mood temporarily. The intensity and persistence of these
mood-induction procedures varies depending on the target mood desired, yet they have proven to
be very successful when properly implemented (see a review in Westermann, Spies, Stahl, &
Hesse, 1996).
Operationalizing and Measuring Moods In experimental settings, mood assessments are frequently self-reported using a range of
survey instruments calibrated for specific emotional conditions. Typically these involve
responses to lists of carefully selected emotional adjectives or short phrases with the subject
indicating agreement or disagreement with each item. These may be used to assess feelings at the
present moment (state measurements), or over longer periods of time (trait measurements). One
such instrument is the Spielberger State-Trait Anxiety Inventory (STAI) (Spielberger, 1983), a
popular and reliable measure of both state and trait anxiety. Respondents indicate their
agreement with short phrases like “I feel pleasant,” “I tire quickly,” and “I feel like crying.” The
Positive and Negative Affect Schedule (PANAS) (Watson, Clark, & Tellegen, 1988) comprises
two brief 10-item surveys which provide two independent measures of positive (PA) and

33
negative affectivity (NA). This instrument collects agreement with terms such as “interested,”
“irritable,” “excited,” “ashamed,” “strong,” and “nervous.”
The Profile of Mood States (POMS), which has a long (65 adjectives) and short (37
adjectives) form, is used to measure mood along six dimensions: tension-anxiety, depression-
dejection, anger-hostility, vigor-activity, fatigue-inertia, and confusion-bewilderment. Though it
has some correlation with social desirability, it is often used to measure an individual’s mood
from a time range extending into the past anywhere from a week to the last three minutes
(Curran, Andrykowski, & Studts, 1995). Examples of more focused emotional measurement
instruments include the Beck Depression Inventory (BDI) (Beck, Steer, & Carbin, 1988), State
Trait Anger Expression Inventory (STAXI) (Spielberger, 1988), and the Dispositional Envy
Scale (DES) (Smith, Parrott, Diener, Hoyle, & Kim, 1999).
Ecological Momentary Assessment (EMA) (Stone & Shiffman, 1994) is a self-report
technique often used to assess cognitive, behavioral, or affective experiences over time by
periodically signaling subjects remotely (e.g. via pager or cell phone) to report or record data at
that moment. Repeated measurements taken in the subject’s natural environment help avoid the
unintended influence of laboratory conditions, and also helps with some limitations of
retrospective self-reports which rely upon accurate and honest recall of details over longer
periods of time. This technique may be used in conjunction with some of the instruments
described above, such as the PANAS scales or short form of the STAI, for longitudinal studies of
mood or anxiety.
Many of the psychophysiological methods used to measure stress are also used to
measure emotions. Skin conductance measures arousal, or the affective dimension of activation,
34
independent of the affective valence. This measure helps establish the intensity of an emotional
response, but cannot identify any other qualities. Laboratory methods that can capture emotional
expressions include automatic visual assessments (Kapoor, Qi, & Picard, 2003) or
electromyographical (EMG) measurements of the muscles employed in facial expressions (e.g.
Partala & Surakka, 2004).
Reliability and Validity The generally negative connotation of stress makes it difficult to experimentally
discriminate stress from negative affect, as similar effects are seen in the presence of either one.
As an example, manipulations of mood (Gasper & Clore, 2002), stress (Braunstein-Bercovitz et
al., 2001), and anxiety (Derryberry & Reed, 1997) all demonstrated similar cognitive
consequences. Therefore, a concern in this research is that measures of stress and measures of
mood must not confound each other. In addition, one common point resulting from debate
described above regarding the independence or bipolarity of positive and negative affect is that
no matter which model a researcher chooses to subscribe to, mood measurements must be taken
such that valence and activation do not confound each other.
There is some occasional overlap in the self-report instruments used for stress and mood
measurement. In experimental trials, the SSSQ Distress factor has appeared to be exclusively
measuring negative affect, while the Engagement factor measures motivation and the Worry
factor measures cognitive effects (Helton & Garland, 2006). One could argue that there is little
difference between “I feel sad” on the SSSQ Distress factor and “I feel upset” which appears on
both the positive affect scale of the PANAS and short form STAI. However, the SSSQ
Engagement factor shares two items with the PANAS: “I feel alert” and “I feel active.” This
suggests that there is the potential for these instruments to confound stress and mood

35
measurements, which recommends further factor analysis when these instruments are used in
conjunction with each other.
EMA can suffer from problems related to compliance by the participant, who may be
unavailable or otherwise occupied when prompted to respond. In some cases he or she may
simply ignore the prompt in the absence of any experimental supervision.
Stress also appears to play a role in the correlation of positive and negative affectivity.
Across a series of three experiments utilizing different stressors, subjects in the stressed
conditions showed a significantly stronger inverse correlation between negative and positive
affect than those in unstressed conditions (Zautra, Reich, Davis, Potter, & Nicolson, 2000). This
finding provides additional evidence that stress and affect interact in significant and complex
ways.
Summary of Mood Measures and Manipulations The Watson and Tellegen model of emotions was determined to be the most effective one
for this research, as the implementation of positive and negative affectivity as independent scales
does not preclude later reorientation as a single bipolar construct. Rather than taking on the
whole range of emotions at once, the two moods happy and sad were selected for this study. In
both models described above, happy and sad are polar opposites. In Russell’s model, the happy-
sad axis is roughly parallel to the pleasure-displeasure axis. On the other hand, in Watson and
Tellegen’s model, the happy-sad axis is perpendicular to the engagement axis. This suggested
that Watson and Tellegen’s PANAS Scales would be a valuable complement to the SSSQ
Engagement scale. A short six-question form of the STAI was also selected as a reliable but less
intrusive version of the original 20 question form (Marteau & Bekker, 1992).

36
According to Westermann et al (1996), presenting a short film or story is generally the
most effective method to manipulate a subject’s mood, both positively and negatively. It has
proven to be a particularly reliable method across many studies (e.g. Cavallo & Pinto, 2001;
Forgas & Moylan, 1987; Göritz & Moser, 2006; Van Tilburg & Vingerhoets, 2002; Wang,
LaBar, & McCarthy, 2006; Yuen & Lee, 2003) and is relatively straightforward to implement
with a TV and VCR or DVD player, or a computer workstation with sound capabilities.
For the purposes of this research, mood assessment was conducted using survey measures
pre- and post-task. However, there is good justification to employ psychophysiological
techniques in later experiments to examine these phenomena in real-time. Though not employed
in this research (because the simulation software does not yet support it), EMA could potentially
be embedded within an experimental task such as NeoCITIES at regular intervals throughout the
simulation.
MOOD AND COGNITION The complexity underlying models such as those above is exemplified by contrasting
findings on affect and cognition. For example, many studies show anxiety to have a constricting
effect on attention to focus subjects on primary tasks or threats at the exclusion of secondary
ones (Solley, 1969), while others have shown the effects of anxiety to broaden attention to
peripheral, non-threatening information (Mathews, May, Mogg, & Eysenck, 1990). Hence, the
effects of affect upon cognition appear to be sensitive to additional variables inherent in the
particular context of the study.
Sun and Zhang’s (2006) abstract model of individual interactions with objects (figure 6)
shows a generalized way of representing the relationship of affective and cognitive processes

37
that lead to individual behaviors. Note that while traits are positioned as the launching point for
determining interaction, neither affective nor cognitive reactions are given precedence in
determining how the individual intends to act. In fact, these reactions influence each other
(propositions P3-1 and P3-2), a position that aligns with the “parallel-processing” view that
cognition and affect are both interactive information processing systems (Norman, Ortony, &
Russell, 2003). Minsky integrates affect and cognition even further with the position that each
emotional state corresponds to a different way of thinking (Minsky, 2006).
Figure 6: Abstract model of Individual's Interacting with Object (IIO) (Source: Sun & Zhang, 2006)
The affect-as-information perspective (Schwarz & Clore, 1996) has been tested in
numerous studies on mood and visual processing of information. According to this approach,
affect will influence task performance when it seems to provide task-relevant information. A
happy mood, for example, provides the information that the task is proceeding well, while a sad
mood indicates there are problems and caution is recommended. That message of caution can
result in more rigid thinking, fixation on local details, and a more careful approach in decision-
making. Individuals with a positive mood, however, are more likely to detect global features and
employ more novel and generative approaches to problem solving.

38
Gasper and Clore (2002) tested the levels-of-focus hypothesis, which proposes that the
task-relevance of affective feelings influences the extent of global or local processing. After
inducing subjects into a happy or sad mood by asking them to write for nine minutes about a
happy or sad life event, subjects performed a feature-matching memory task (experiment 1) or
compared shape sets based on global or local properties (experiment 2). Both experiments
confirmed that attention to global features was higher in subjects in happy moods.
When this approach was applied to problem solving strategies, subjects in sad moods
stuck with their initial strategy until the data proved it unworkable, while those in happy moods
freely altered their strategy according to their own internal rules (Gasper, 2003). This clarifies
that subjects experiencing a negative mood are not necessarily trapped into narrow thinking or
rigid processes, but that they will respond to the evidence when change is clearly necessary, and
arguably, when it is needed most.
Gasper (2004) explored this further to demonstrate that a sad mood only decreased global
processing when the feelings were relevant to the task, but not when they seemed irrelevant or
ambiguous. After the same mood manipulation described above, half of the subjects were
reminded that their current feelings were irrelevant to the following visual matching task. Those
subjects did not show the effect of mood on attention described above, demonstrating that mood
could have a reduced effect on cognitive processing when it is determined to be irrelevant to the
task at hand. This may support the notion that a person experiencing emotion-laden problems at
home or elsewhere is capable of putting those distracting feelings aside while engaged in work.
Gasper also found that the intensity of the mood, whether happy or sad, led to faster processing

39
times. Hence affective valence appears to direct attention, while affective intensity increases
processing speed.
Derryberry and Reed (1997) studied several aspects of how anxiety impacts attention.
One study examined individual differences and mechanisms related to global vs. local
perception. Subjects were divided into low and high trait anxious groups using the State Trait
Anxiety Inventory (STAI) (Spielberger, 1983) and manipulated in affect by a positive (gaining
points by positive outcomes toward a high score) or negative (losing points through negative
outcomes toward zero) score orientation of a computer-based targeting game. Both state and trait
anxiety were shown to focus subjects’ attention to local details, but only during the negatively-
oriented games. Interestingly, a hemispheric effect was discovered for targets in the right visual
field, which is consistent with the association of negative affective states increasing left
hemispheric activation.
A later study looked specifically at the attention given to threatening stimuli by anxious
individuals (Derryberry & Reed, 2002). This also used the positively or negatively oriented
targeting game approach to manipulate affect. In this case, the affect manipulation had no effect,
but high anxious subjects showed a stronger orientation to threatening cues when compared to
low anxious subjects. Attentional control was also assessed, and it was found that anxious
subjects with better control of their attention were able to regulate the impact of threatening cues.
These experimental results beg to be extended to the group level of analysis to see how
these individual cognitive processes and task parameters manifest collectively in the context of
real work tasks conducted with real human collaborators. This research aims to build upon the
value of these previous findings by bringing them together and observing them in ecologically
40
relevant situations. A thorough understanding of team cognition has to embrace not only what is
inside the head, but what the head is inside of (Mace, 1977).
The findings just described have analogs in the geo-collaborative tasks involved in this
research. Attention and problem-solving strategies are critical to the processes of assessing crisis
situations and determining how to resolve them. In managing an emerging crisis situation, a local
focus (i.e. putting out fires as fast as they happen) is only part of the responsibility. Operators
also need to have a global “big picture” view of the situation in order to identify connections
between events or emerging patterns of activity, as well as communicate and coordinate with
other team members. Should negative moods or anxious states impact the capacity to maintain
that attention to global features, the design of visualization tools and procedures intended for
situation awareness must take that into account. In summary, the complex relationship between
mood, feedback, and problem-solving strategies must factor in to the design of tools for
collaborative, distributed cognition.

41
CHAPTER 4 INTERACTIONS BETWEEN MOOD AND STRESS
The previous two chapters have reviewed stress and mood individually, but it is already
evident from the discussion so far that the two have complex relationships with each other. This
chapter explores research regarding both mood and stress in order to identify where these
concepts overlap (that is, where researchers may be talking about the same thing) and where the
two influence one another as distinct phenomena. After reviewing multiple theories addressing
both mood and stress, common findings from the previous two chapters are summarized. Based
upon these findings, the primary research question of this study is presented along with two
proposed models and the four hypotheses to be tested.
DISTINGUISHING MOOD AND STRESS Lazarus (1999, p. 36) argues that “we cannot sensibly treat stress and emotion as if they
were separate fields without doing a great disservice to both.” It is true that the literature on the
relationship between stress and cognition shows many similarities with the literature on mood
and cognition. In some cases, when looking at the manipulations and measures used in both areas
of research, one may suspect that emotion researchers and stress researchers are examining
similar phenomena but choosing different terminology to describe it. Bootzin and Max (1981)
explain that while theorists disagree over the causes of anxiety, there is general agreement over
the constitution of the anxiety response, which happens to be a list of verbal reports, behavioral
responses, and physiological responses almost identical to the responses attributed to stress.
In organizational stress research, emotions are included among the individual differences
in reacting to stress, and generally with very negative connotations: “When emotions are directly
involved in action, they tend to overwhelm or subvert rational mental processes, not to

42
supplement them” (Elster, 1985, p. 379). Dysfunctional reasoning is blamed on “emotional
stress” (Sjöberg & Olsson, 1981). This perspective holds that stress may be inescapable in high
stakes circumstances, but emotions (apparently positive and negative ones) are something to be
avoided at all costs. However, many researchers have shown this broad generalization to be
untrue.
For example, Mogg et al (1990) admit that they could not be certain whether their
manipulation (difficult task with false negative feedback or easy task with false positive
feedback) was actually a manipulation of stress, mood, anxiety, or performance feedback. They
chose stress as the most non-specific term, though the intended outcome of the manipulation was
in fact anxiety – a mood state. Many conceptual frameworks of stress show stress leading to
negative affect, which in turn leads to various physiological and psychological outcomes, though
some also suggest a direct effect of stress in addition to one mediated by negative affect (Aldwin,
1994).
However, stress and mood are also conceptually distinct and independent of each other,
at least to some degree. One can feel happy or sad, but not stressed; one could be stressed and
feel exhilarated, depressed, or neither. Many studies have shown how people may experience
both positive and negative moods in the presence of stress (Lazarus, 2003). For example,
observations of caregivers of terminal patients demonstrated that a small positive event amidst a
majority of negative events can prompt a positive affective response despite ongoing stress
(Folkman & Moskowitz, 2000). This shows that positive moods may coexist with stressful
conditions and such positive responses have a meaningful coping function. The matter that

43
follows is to investigate the role of affect in coping with stress, and under what conditions and
for how long these effects occur.
CAUSE AND EFFECT Theorists have long debated the causal directionality between stress and emotions
(Cassidy, 1999). The James-Lange theory of emotion maintained that physiological arousal (i.e.
the stress response) causes cognitive and emotional changes. In response to a threat, the increase
in heart rate and activity of fleeing cause the emotional state of fear. The Cannon-Bard theory
argued the opposite position that the perception of a threat causes the emotional reaction which
then leads to the stress response (Cannon, 1929).
Schachter and Singer’s (1962) two-factor model of emotion proposed (and demonstrated
experimentally) that the same physiological state could be labeled by the subject as any number
of emotional states, including a state of no emotion. Their conclusion was that physiological
measures could only predict emotional states to the extent that interactions with cognitive and
situational factors were also taken into account. This aligns with the transactive theory of stress
by demonstrating that an individual’s cognitive appraisal moderates the emotional reaction to a
threat.
Lazarus and Folkman (1984) emphasized the primacy of the cognitive process of
appraisal preceding any reaction to stress, emotional or otherwise. Zajonc (1984), on the other
hand, responded that the emotional reaction precedes cognitive processing of the threat, and
these two reactions may sometimes be in conflict with each other. Sun and Zhang’s previously
described model of individuals interacting with objects (figure 6) suggests that both are right.
Consciousness comprises processing systems which are independent of each other to varying

44
degrees, which suggests that emotional and cognitive reactions can occur in either order and may
act to inform each other of the meaning of the present circumstances. Lazarus (1991) later
incorporated this reciprocal causality with his description of appraisal to allow for simultaneous
and potentially contradictory appraisals of a situation. He gives the example of a plane during
takeoff when a person may emotionally feel a sense of fear and dread from one appraisal, while
another appraisal assesses the chance of a disaster occurring to be next to none. In these ways,
appraisal is shown to be a complex and multi-threaded process. However, persistently faulty
appraisal and coping patterns can lead to neuroses, compulsions, phobias, and panics (Lazarus,
1991).
THEORIES OF MOOD AND STRESS Lazarus (1991) proposed a cognitive-motivational-relational (CMR) theory of emotion
which incorporated stress and emotion through the mechanisms of appraisal, coping, and
relational meanings. The emotions in this model are distinct emotional categories, not unlike
Russell’s prototypical emotional episodes (e.g. love, guilt, sadness, pride), rather than
dimensional ones (i.e. valence and activation). Lazarus defined 15 emotions: four positive, nine
negative, and two mixed. These emotions occur in response to relational meanings, and therefore
each emotion has its “core relational theme.” For example, the theme for happiness is “making
reasonable progress toward the realization of a goal.” Sadness’ theme is “having experienced an
irrevocable loss.” An emotion is aroused when its theme matches the current appraisal of the
relationship between one’s self and the object of the appraisal. This theory also maintains that
these emotional relationships are goal-oriented, for these relationships are meaningless without
some motivation to either approach or avoid the object.

45
From this model, Lazarus (1993) argued that stress should be considered a subset of the
emotions. Noting the overlapping similarities between the multi-dimensional models employed
in both domains, he claimed that consideration of the full range of emotions provides a far more
comprehensive description of how individuals adapt to stressful conditions when compared to
assessing stress alone. However, his so-called “stress emotions” (anger, envy, jealousy, anxiety,
fright, guilt, shame, and sadness (Lazarus, 1999, p. 36)) are rooted in the causes and effects of
objects and environments, as well as self-awareness of the emotional state, these are not the
objectless moods defined earlier as the affective phenomena of interest in this study. Lazarus is
correct that emotions and stress are interdependent, but they are not so fully intertwined as to be
the same thing. The fact that there appears to be independence between perceptions of stress and
mood states was the inspiration to manipulate both factors individually in this study.
The complex effects of stress upon individuals – particularly the individual differences in
the appraisal of stressors – amplify the need to better understand the similarities, differences, and
interactions between stress and emotion in collaborative settings. The findings regarding stress,
mood, and cognitive performance detailed above demonstrate several effects relevant to the
conditions individuals encounter in group problem solving contexts. However, they do not
specifically explain how individual moods or reactions to stress will impact group cognition and
the outcome of group-based activities.
SUMMARY OF FINDINGS Taken collectively, the following trends emerge from the research detailed in the
preceding chapters:
1. Cognitive processing is restricted by negative affect. a. Negative affect diminishes attention to global details (Gasper & Clore, 2002). b. Negative affect inhibits flexible problem solving (Gasper, 2003).

46
c. Increased task relevance of affect increases the effect of affect upon task performance (Gasper, 2004).
2. Cognitive processing is disrupted by stress a. Decision making under stress increases speed at the expense of accuracy (Keinan,
1987) b. Stressful events impair the formation of memories after the event (Mendl, 1999)
3. Attention is difficult to control under high anxiety and stress. a. Negative affect focuses attention on local details, regardless of anxiety
(Derryberry & Reed, 1997; Solley, 1969). b. High anxiety focuses attention on threatening cues, regardless of affect
(Derryberry & Reed, 2002). c. High stress inhibits selective attention (Braunstein-Bercovitz et al., 2001). d. Pressure to perform disrupts the ability to regulate attention (Beilock et al., 2004)
4. Stress disrupts team coherence. a. High stress diminishes adherence to status and authority structures (Driskell &
Salas, 1991). b. Stress diminishes team perspective, a strong predictor of team performance
(Driskell et al., 1999).
The overall goal of this study is to re-explore these laboratory findings within an
ecologically valid team setting to address this research question:
For emergency crisis response teams, what is the relationship between levels of
cognitive stressors, mood states, and the efficacy of group decision making in a
simulated task environment?
Given the considerable similarities between the cognitive outcomes of multiple mood and
stress states, two possible outcomes were envisioned in this study. The first was that mood
mediated the relationship between stress and cognition (Figure 7). This would mean that stress
leads to a change in mood (e.g. negative affect), but it is the change in mood that results in the
changes in cognition (e.g. narrowed attention). A series of statistical tests can demonstrate
whether or not this effect is occurring.

47
Figure 7: Model of mood mediating the effect of stress on cognition
A second possibility is that mood moderates the impact of stress upon cognition (Figure
8). This would mean that the effect of stress upon cognition changes under different mood states.
For example, stress and a sad mood may impair certain aspects of cognition, while stress and a
happy mood would not. Moderation can be demonstrated by identifying a significant interaction
effect between mood and stress.
Figure 8: Model of mood moderating the effect of stress on cognition
In an exploratory study such as this, one experiment is often not sufficient to reliably test
phenomena so enigmatic as stress and mood. A repeated experiment is generally used to verify
the results of the first to be confident that the phenomena of interest are not just a fortuitous
discovery of what the experimenters expected to find. The second experiment is also an
opportunity to alter the conditions of the experiment in some fashion to try to test the boundaries
of the effects uncovered – are the hypotheses supported under some conditions but not others?
Does mood mediate the effects of some stressors while moderating the effects of others? This
study includes a series of two experiments designed to address those questions.

48
HYPOTHESES Many cognitive stressors have been shown to manipulate cognitive functions –
heightening some and diminishing others – which would also lead to changes in team
performance. Hypothesis 1 predicts that each stressor used in the two experiments will have
unique effects upon team performance, positively or negatively. This study includes two
experiments with two different stressors specifically because of the clear evidence that all
stressors do not act the same.
H1: Cognitive stressors will trigger changes in team performance.
In order to test the second step of the mediational model (Figure 7), the experiment needs
to demonstrate that stresses targeting cognitive functions (e.g. increased task load) have
emotional consequences. The models of stress proposed by Lazarus (1999) and Matthews et al
(2002) both describe emotional components to the stress response, although in considerably
different ways. Therefore:
H2: Cognitive stressors will trigger changes in individual mood. As demonstrated in several of the experiments detailed above, negative moods appear to
disrupt multiple cognitive functions that in turn could negatively impact team task performance.
Hypothesis 3 predicts that these experimental findings from the individual level will extend to
the team level.
H3: Negative mood among team members will result in diminished team task performance.
Prior experimental findings have shown how stressful conditions diminish the
individual’s perspective on team activity and disrupt an individual’s ability to direct and regulate
attention. The team emergency management tasks in these experiments rely on accurate situation

49
assessment. This requires the ability for individuals to attend to and communicate about potential
connections between events and emerging patterns of activity that may be suggestive of an
organized attack or terrorist plot. Hypothesis four predicts that such skills will be diminished
under stress.
H4: Teams under high stress conditions will be less able to detect emerging patterns of activity in the simulated task environment.
The mediating model portion of this research problem is addressed using the causal steps
approach described by Baron and Kenny (1986). To demonstrate a mediating effect, these
conditions must be satisfied: (1) there is a direct effect of the independent variable on the
dependent variable [H1], (2) the independent variable accounts for variation in the mediating
variable [H2], and (3) the mediating variable accounts for variation in the dependent variable
[H3]. A strong mediating effect is demonstrated when control of the mediating variable causes a
significant reduction of the effect of the independent variable upon the dependent variable.
Figure 9 restates the mediating model in terms of the first three hypotheses of this study.
Figure 9: Mediating model in terms of the first three hypotheses
If mood is serving as a moderator of the effect of stress upon performance, however, then
the interaction of stress and mood will show a significant effect upon team performance in some
way. Mood and stress may also have main effects, though this is not required to prove the
moderator hypothesis.

50
CHAPTER 5 NEOCITIES
The preceding chapters have reviewed the theoretical concepts and issues leading to the
main research question and hypotheses of this study. This chapter describes NeoCITIES, the
multi-user simulation used as the central testbed in this study. A brief overview of the
NeoCITIES simulation is followed by a discussion of the extensions and upgrades made to the
simulation to conduct the manipulations and measures required to test these hypotheses.
NeoCITIES is a robust and complex simulation platform that merits a detailed review before
proceeding in the next chapter to a full discussion of the research methodology for this study.
THE NEOCITIES SIMULATION NeoCITIES is a scaled world simulation advancing from the original CITIES task: C3
(command, control, and communication) Interactive Task for Identifying Emerging Situations
(Wellens & Ergener, 1988). The NeoCITIES task is designed to mimic the situation assessment
and resource allocation tasks of emergency crisis management teams. Teams of six are divided
into three pairs (Police, Fire/EMS, and Hazardous Materials) to collectively address a custom-
written series of emergency events requiring a range of responses and interactions within the
team. The members of each pair have unique roles. One is the Information Manager (IM) who
receives incoming information about the emergency events. The other is the Resource Manager
(RM) who has control over the resources to respond to the event, as well as access to reports on
the success or failure of those resources. As time passes, an event which is neglected or
incorrectly addressed escalates in severity, which increases the number of resources required to
bring that event under control. Furthermore, task scenarios can include complex underlying plots

51
(e.g. an emerging terrorist attack) hidden among other disconnected events (e.g. trash can fire,
domestic dispute, car accident, etc.).
To complete these tasks successfully, all six participants engage in data gathering,
analysis, coordination, and communication activities which demand vigilance despite divided
attention and frequent task switching. Performance is measured in the timeliness and accuracy of
responses to individual events, as well as in the detection and interception of emerging
underlying plots (McNeese et al., 2005).
A central server manages the roles and responsibilities of team members while
monitoring and recording the actions and interactions of all participants. The server also
computes multiple ongoing performance scores in real time, which provides feedback on the
participants’ performance. The recorded data include the time-stamped resource allocation
activities, chat logs, and mouse and keyboard activity within the interface. This provides the
researcher with a rich set of data to measure individual and group performance, knowledge
transfer, and team cognition. The structure of the simulation allows for assessment of
psychological measures or other self-reported data prior to, during, and following a NeoCITIES
session.
The NeoCITIES simulation facilitates multiple methods of manipulating the participant’s
cognitive and emotional states. The scenarios driving NeoCITIES can be flexibly constructed to
induce varying levels of workload, complexity, ambiguity, or time pressure. Built-in messaging
mechanisms can present messages as manipulations at any time during the simulation. The
components of the client software are modular in construction, allowing for ease in manipulating
the effect of specific features, such as score polarity (see Derryberry & Reed, 1997, 2002).

52
NeoCITIES was developed as a Java-based client-server application. The first
experimentally viable implementation of this simulation was NeoCITIES 1.3. This version was
used in two dissertation studies conducted in 2006. Connors (2006) developed three intelligent
group interface designs for NeoCITIES and tested them with multiple teams in a longitudinal
study. Jones (2006), the principal architect of the NeoCITIES simulation, developed a decision
aid based on fuzzy cognitive modeling and tested it in a scenario based on a terrorist attack. Both
studies were conducted successfully, validating NeoCITIES as a stable platform for team-based
experimentation.
EXTENDING THE NEOCITIES SIMULATION
Flexible Team Configuration Upon review of the earlier studies, a number of issues were identified that required
upgrades for NeoCITIES 1.4, the version used in this study. The first and foremost was that the
server and client were hard-coded to run exclusively on a set of seven computers operating in the
User Science and Engineering (USE) Lab in the College of IST at Penn State University. In
order to run the simulation at any other location – even for a demonstration – revisions were
required to configure teams and workstations independently.
The first part of the solution was to remove references to specific computers from the
code and place them instead in an external file. Throughout the client and server code, all
references to specific machines were pointed instead to a hash map which linked team roles to
computer identities that were loaded from that configuration file at runtime. This simple text file
listed an abbreviation for each role (e.g. PI for police information manager, HR for hazmat
resource manager, and so on) and the machine name that was to play that role in the simulation.

53
Though this upgrade made the task of configuring teams relatively simple, even for a
non-programmer, it was quickly determined that the task of configuring teams – especially a
large number of teams – could and should be centralized. A new method was added to the client
and server code which made a call over the internet to a web-based tool that acted as the front
end of a database containing all of the information about which computers served which roles,
and on which teams. The server identifies the computer making the call, determines its
teammates from the database, and returns the appropriate configuration file for that computer.
This new configuration arrangement allows for concurrent instantiations of NeoCITIES on an
unlimited number of workstations on a network. The first successful implementation of this
upgrade was for a half-day workshop for 36 middle-school girls simultaneously playing on six
NeoCITIES simulations. The benefit to the experimenter is the ability to gather data from
simultaneous NeoCITIES sessions, whereas before the simulation could only run one session at a
time.
Figure 10: NeoCITIES in its first multisession test

54
Administration of the team configuration application was designed for operation by non-
technical personnel. The operator logs on and simply assigns computers to teams via pull-down
menus. The operator may also add or remove computers from the available pool. Thinking
forward to future incarnations of NeoCITIES, this tool was not locked to the current NeoCITIES
team structure (i.e. three dyads plus one server). Rather, the user is able to specify teams of any
name and number of roles. The database and server code were designed in MySQL and PHP,
respectively, both open standards which allowed for portability of this application to nearly any
standard web server.
Figure 11: NeoCITIES online administration tool

55
Controlling Simulated Travel Time Upon dispatching resources to an event, the resource manager experiences a pause before
receiving on-site feedback about whether or not those resources were making progress. One
potential stress manipulation was to extend that pause to increase the apparent travel time for the
resources to arrive at the event. Originally, this travel time was six seconds (in real time,
corresponding to several minutes of game time), which was short enough that participants always
received feedback that was clearly associated with the action just taken. Lengthening the pause
before revealing the status of events would prolong the uncertainty experienced by the
participants. If lengthened long enough, waiting participants may also get involved in other tasks,
such as a chat discussion or another incoming event. This would provide an additional cognitive
challenge of paying attention to multiple overlapping events.
This pause before feedback was a fixed constant that could only be changed by
recompiling the software. To fix this problem, a new runtime parameter was added to the client
software which introduced a traffic variable. This variable acts as a multiplier to the original
pause to simulate increased traffic in the city. Busy rush hour traffic might use a value of six to
ten, while sedate traffic conditions at four in the morning might be between two and four. To
ensure multitasking occurs, a value can be chosen which extends the pause to a time period
longer than the pause between events. For example, a traffic value of five would produce a thirty
second delay before receiving on-site feedback. If events are coming in every twenty seconds, a
resource manager receiving two in a row would be busy attending to the second event while
waiting for feedback from the first. Informal pretesting of this new function demonstrated that as
the traffic delay got longer, participants took more time and made more errors associating
feedback messages with the proper event.

56
User Interface Enhancements The NeoCITIES user interface provides a set of tools for information visualization,
critical analysis, and communication. Its composition was derived from a combination of
elements in common to collaborative command-and-control systems and designed to be similar
to common multi-player simulation games (as the most available subject pool consisted of
undergraduate college students.)
Figure 12: Screenshot of the NeoCITIES client interface
Several features of the user interface (UI) were identified that would benefit from
additional design modifications. One issue regarded the event tracker, a table listing the time

57
stamp, description, and status of each event. There was not enough room in the description
column to contain more than the first few words of the event description which seemed to require
frequent re-opening of events to re-read its details. This also made it difficult to quickly
distinguish between similarly-worded events in the tracker. The root of this problem was that the
status column had been made wide enough for the longest status message: “Resources
Dispatched.” This was fixed simply by shortening the feedback message to “Dispatched” and
decreasing the width of the status column accordingly. This provided a sizeable gain in width for
that column.
A second UI issue appeared once the software was capable of running on computers of
varying monitor sizes and resolutions. The NeoCITIES UI was configured to run exclusively at a
resolution of 1280x1024. However, many laptop computers with non-standard screen
proportions would typically have more screen available that the simulation required. Running
NeoCITIES on these machines revealed that several of the UI elements were rendering in
unattractive ways, though formerly this had not been an issue since the problem areas were
outside of the available screen space. New adjustments to the UI containers ensured that the
interface would look tidy and organized on any screen resolution. Additional minor cosmetic
adjustments helped improve the overall look of the interface.
Preliminary testing of the traffic variable described above revealed problems when
multiple dialog boxes would pop up and remain on the user’s screen. Formerly, it was rare for a
user to leave one dialog box up long enough for another one to pop up in front of it as the time
between events was quite long compared to the time between taking action and receiving

58
feedback. However, once scenarios were designed to intentionally create a pile-up of messages
and events for the user, this bug became very problematic.
Part of the system logic was to require users to take action on a dialog box (e.g. receiving
a feedback message or an incoming event) before returning to use other parts of the UI, such as
the map or chat features. When the pace of the simulation was fast enough for the user to be
managing several events simultaneously, this would lead to apparent system lock-ups when one
dialog box waiting for input would become occluded by one or more additional dialog boxes.
The system would then be waiting indefinitely for the user to enter information on a dialog box
that could no longer be seen or operated. To solve this matter, new logic was written so that new
dialog boxes would wait in a queue to appear only after the currently visible one was closed.
Other solutions were tested that employed more flexible UI elements, such as pop-up windows
that could be repositioned and closed at will. However, tests showed that the server and clients
could drift out of sync when the user addressed messages in the order of his or her choice, rather
than the order in which the server had sent them.
Integrating Psychological Manipulations and Measures Until this study, NeoCITIES had not been used to run experiments employing integrated
psychological manipulations or measures. To date, only Connors (2006) employed a post-task
online survey measure. Jones (2006) relied on a separate paper-and-pencil survey administered
after the task. The current study required the administration of a different mood manipulation
before every task as well as multiple self-reported measures before and after every NeoCITIES
exposure. To reliably handle this complex experimental scenario, a new web-based system was
developed to maintain and deliver all survey measures as well as manage the manipulations for
each condition of the experiment.

59
The first layer of development was the creation of a MySQL database containing tables
for every survey measure (e.g. STAI, SSSQ, PANAS, etc.). These tables contained the text of
each question along with a unique identification number, scoring polarity (whether or not the
question is reverse-coded), and any other necessary qualifiers, such as the categories or subscales
the questions belonged to, as appropriate. By storing all questions in this way, all survey
measures could be implemented simply with web page templates that only required specification
of which table or tables to draw questions from, whether to filter the questions by category or
subscale, whether to randomize the order of the questions, and how many points to use on the
response scale (five point scales were the default). An additional table was designed to collect
the responses from each participant during each session. This facilitated easy querying of
response data from any individual or range of participants via custom query web pages.
One more table stored information on what experimental conditions were to run during
the current session. At the beginning of an experimental session, each participant’s workstation
queried this table to determine which movie clips to use for the mood induction procedures and
which NeoCITIES scenario files were going to be used in the simulation tasks. This allowed for
central control, from the server side, of the experimental tasks and procedures in each session.
Like the NeoCITIES team configuration tool described above, all of these server-side tools were
built using PHP and MySQL for reusability and ready deployment on most any standard web
server.
Development of the Chat Coding Measures Holistic measurements of team cognition require more than aggregated task outcome
measures (Cooke, Salas, Kiekel, & Bell, 2004). Similar task outcome measures can result from
distinctly different group problem-solving activities due to within-group advantages and

60
disadvantages in various team capacities, such as coordination, leadership, or shared memory.
One team may fail a task due to a strongly persuasive leader who happens to be advocating an
incorrect course of action. Another may similarly fail due to incoherent communication
strategies. The challenge is figuring out why and how these failures happened.
Content analysis of communication data provides the experimenter with an effective
means to explore the subtle “why” of team successes and failures. This is achieved by breaking
down large bodies of complex qualitative information into more manageable forms which may
be coded and quantified for comparison within or between groups (Smith, 2000). Simple
measures of message quantity as well as complex analysis of message content provide useful
details that can reveal individual and team behaviors that predict group task outcome.
Communication data also serve as a dependent variable to explore how manipulations of task
conditions (such as mood and stress) impact the style and frequency of team communication.
NeoCITIES provides several chat logs: one for the communication between the
Information Manager and Resource Manager on each two-person team (Police, Fire/EMS, and
Hazmat), and one for communications between all three Information Managers. The latter
communication channel is primarily for discussion of which teams are responsible for
responding to a given event. The IM/RM communication is largely comprised of messages
pertaining to emergency responses still in progress. Note that since RMs cannot communicate
with anyone except his or her IM, messages to other teams must be relayed through the IM. This
communication structure permits the experimenter to observe the messages which transmit
information from one point to another within the group – for example, from the Fire team’s

61
Resource Manager to the Police team’s Information Manager, via the Fire team’s Information
manager.
In this study, the coding scheme for the communications logs was adapted from one
developed by Entin and Entin (2001) for the Adaptive Architectures for Command and Control
(A2C2). This scheme individually records requests and transfers of information, action, and
coordination, as well as acknowledgements such as “OK” or “got it.” Ratios of anticipation are
constructed by dividing the number of transfers by the number of requests in each category. This
measure refers to how often one partner anticipates the other’s need for information or action and
sends a message to that effect without being prompted to do so. In other words, anticipation
ratios describe the tendency for one partner to provide an answer without being asked a question.
The scheme used in this study was adapted from the original by changing the scale from a
rate measurement (number of communications per minute) to a quantity of communications, as
the duration of the sessions was constant in both experiments. An additional category was added
for off-task communications such that all messages sent could be tallied and accounted for. For
these measures to be reliable, the data must be analyzed and coded by two or more coders, whose
agreement is measured in terms of inter-coder reliability. Coding instructions are contained in
appendix B.

62
CHAPTER 6 RESEARCH METHODOLOGY
The previous chapter detailed the NeoCITIES simulation which figures prominently in
the methodology applied in this study. Research situated team contexts takes many forms and
often requires the use of methods practiced in multiple disciplines, including both quantitative
and qualitative. This chapter begins with a brief review of common methodologies used in team
research and the challenges faced by each. Simulated task environments, of which NeoCITIES is
an example, are presented as an effective methodological approach that builds upon the strengths
of multiple methods.
The remainder of this chapter describes the task, participants, and experimental design of
this study in detail, including all of the manipulations and measures and how each one was
conceived and implemented. The chapter concludes with the full procedure administered to the
experimental participants during each experimental session.
METHODOLOGIES IN TEAM RESEARCH Small group research methods cover a range of within- and between-group processes.
These include the formation, structure, and development of groups, as well as the social
processes occurring within groups (such as leadership emergence or conflict behaviors), decision
making, task performance, and external environmental events affecting all of these processes
(see Kerr, Aronoff, & Messé, 2000; Weaver, Bowers, & Salas, 2001). The current study
examines the impact of stressors and mood states as environmental factors on within-group
communication, decision-making, and task performance.
Psychological research methods are often challenged to balance and manage
experimental control and ecological validity. One shortcoming of psychological research

63
conducted at the individual level is that it is often difficult to predict how the processes or
behaviors of interest will actually manifest in the context of naturalistic interactions with one or
more other individuals (researchers frequently point this out in the “future work” sections of
journal articles). This is not to say that important findings continue to emerge by placing
individual cognitive functions under the microscope (phenomena which may be termed
microcognition), but that the step from individual to group-level research is a necessary step
toward research on cognition as it naturally occurs. Pietro Cacciabue and Erik Hollnagel coined
the term macrocognition to refer to cognitive functions as they work together within and between
individuals in naturalistic decision-making contexts (Cacciabue & Hollnagel, 1995).
In discussing their approach to research on macrocognitive processes using simulated
environments, Brehmer and Dörner describe this methodological dilemma:
“The root of these problems lies in the inability to handle complexity. In field research, there is often too much of it to allow for any more definite conclusions, and in laboratory research, there is usually too little complexity to allow for any interesting conclusions.” (Brehmer & Dörner, 1993, p. 172)
To provide contrast to the controlled laboratory experiments detailed in the previous
chapters, it is worth mentioning an example of field research on group decision making under
stress. The TADMUS (Tactical Decision Making Under Stress) research program was a seven-
year project launched by the U.S. Navy in response to the U.S.S. Vincennes accidental
destruction of an Iranian airbus in 1989 – an accident ultimately attributed to human error
resulting from insufficient technological, procedural, and administrative understanding of
operators under stress in conflict scenarios. In addition to post-hoc analysis of the Vincennes
incident itself, this research program utilized interviews and observation of Navy crews at work
to better understand and define the decision environment and the stressors within that

64
environment. The goals of this program were to develop principles of design for decision support
systems and generate strategies for conducting simulations and training for decision making
under stress.
The TADMUS report concludes with some lessons learned from the challenges of this
research program (Salas, Cannon-Bowers, & Johnston, 1998). These suggest possible strategies
for addressing the gulf between laboratory and field reseaerch:
• Do not underestimate the complexities of conducting meaningful field research. • Do not be afraid of getting the users involved, but manage the process. • Do not underestimate the value of data • Be happy with small increments of progress; they eventually lead to the goal
SIMULATED TASK ENVIRONMENTS (STES) The four points above provide a strong argument for the use of simulated task
environments for detailed experimental research on group decision making under stress. STEs
offer a potent blend of the strengths of field study and controlled laboratory experiments (Gray,
2002). The tasks and the environment provide ecological validity while the experimental
conditions and manipulations can be carefully controlled and repeated. Finally, given a sufficient
subject pool, STEs allow for an iterative and modular research process to explore detailed
variations on a given theme.
A STE can be employed to create the illusion of stress without putting the subject in
actual danger. This is a significant benefit given the ethical and legal constraints of
experimentation on human subjects. In competitive sports or role-playing exercises, for example,
participants caught up in the activity may perceive dangerous threats and experience great
psychological stress. Yet to an outside observer (or even to the participants themselves, at
another level of consciousness that is temporarily set aside), it is clear that these threats are not

65
real, but simulated by the activity. An effective stress simulator, therefore, needs to be realistic
and engaging enough to induce transportation into this insulated microcosm (Yates et al., 1995).
Gray (2002) defines a taxonomy of STEs which vary in complexity and fidelity. Scaled
worlds are one variety of STE that balances these two parameters to simulate a subset of
functions within a particular task environment. Which functions are included or removed
depends on the specific research question. When implemented thoughtfully, scaled worlds are
well suited for generalizing findings back to the original task environment. Rather than focus on
the material properties of complexity and fidelity of a given STE, Gray proposes three evaluative
dimensions drawn from the perspectives of the researcher (tractability), the task
(correspondence), and the participant (engagement). Tractability describes how well the STE
permits the researcher to manage the pursuit of a given research problem. Simple lab tasks are
highly tractable, while complex hi-fidelity simulations can be difficult to assess and control.
Correspondence refers to how the STE resembles the modeled domain. At one end of the
spectrum, an F-16 flight simulator represents many aspects of one system. At the other end are
lab experiments on one aspect found in many systems, such as memory retrieval or pattern
recognition. Finally, engagement describes how seriously the participants take their experience
in the STE. Engagement may come from many sources ranging from the sensory excitement of
the simulated scenario to the compensation offered subjects for participating. Often engagement
is enhanced by adding game-like features to the simulation, though a dull domain should not be
simulated to be more engaging than it really is when vigilance or under-stimulation are the
phenomena of interest in a study.

66
In two previous studies, NeoCITIES has been successfully implemented as a scaled
world simulation (Connors, 2006; Jones, 2006). The simulation designers pursued high
tractability by providing the experimenter with tight control over all aspects of the simulation
including the initial training protocols, the characteristics and pace of the emergencies
participants are tasked with managing, and the types of affordances and communication
pathways offered to users in the interface. Each role in the simulation is defined to be distinct
which allows the experimenter to carefully control the distribution of work across the team. In
the interest of offering high correspondence to the emergency management domain, the
simulation structure and underlying scenarios have been informed by in situ field observation
and knowledge elicitation of 911 dispatch workers (Terrell, McNeese, & Jefferson, 2004).
However, in order to maintain engagement, especially from participants who are typically
university undergraduate students, the pace of the simulation is accelerated from ten to twenty-
five times faster than real time (for example, events transpiring over 120 minutes in the city
could be simulated during a ten minute experimental session). This accelerated temporal
dimension resembles that used in similar types of popular simulation-based online multiplayer
video games (Dickey, 2005).
TASK In each condition, each six-person team ran the previously described NeoCITIES
simulation (for detailed descriptions of the underlying functions and protocols of the NeoCITIES
task see Connors, 2006). The members of each team are assigned to one of three pairs
responsible for different types of emergency management: police, fire and hazmat. Each pair
consists of two roles: an information manager (IM) and a resource manager (RM). Prior to the

67
beginning of experimental trials, all participants receive role-specific training on how to operate
the simulation and effectively perform their roles.
Participants perform the task isolated by dividers and therefore have to coordinate all
action and communication exclusively through the NeoCITIES client software using a structured
communication protocol and a text-based chat tool.
Figure 13: NeoCITIES Laboratory Workstations
During the simulation, the IMs all receive the same incoming information about
emergency events and discuss via a chat panel which among their pairs should take action (often
this requires discussion between all of the IMs). For example, a new event appears
simultaneously on all three IMs displays describing a report that a burglar alarm had gone off in
a chemistry lab on campus. The IM for the police team might quickly determine that her dyad
should respond to this event, but the three IMs would also discuss whether or not the report
suggested that the hazmat team should also send some resources. Those IMs that determine no
action is necessary set the event aside by clicking the “Ignore” button.

68
If action is deemed necessary by a given IM, that IM uses a structured communication
tool to pass the emergency report along to the RM along with a user-selected icon (from 24
available standard icons denoting common emergency events) and an optional text message used
to convey additional information, when necessary, to the RM about the event.
The RM is the only member of the dyad with control to dispatch the appropriate
resources to the event. Upon receipt of the structured communication from the IM described
above, the RM has the option to dispatch one or more resources to the event or may opt to ignore
the event if he or she believes the IM incorrectly accepted responsibility to manage the event. A
chat panel permits discussion between the IM and RM to negotiate whether and how to respond
to events. The RM does not know anything about any events other than the ones selected and
passed along by the IM. The RMs can only communicate with their respective IMs.
Each RM has five units each of three different resources to utilize during the simulation.
For example, the Hazmat RM has chemical clean-up trucks, bomb squads, and investigators
available. There is a delay between the time resources are dispatched and the time they arrive on-
scene, which is computed from a “traffic” constant set at run-time. Resources that are en-route,
on scene, or returning from events are unavailable to be allocated to other events. This
discourages over-allocation of resources. While five fire trucks can put out a fire faster than one,
the RM is ill-advised to send all five to one event and have none available when another fire
occurs. Once resources arrive on-scene, RMs receive an automatic report from the field
pertaining to the success or failure of their actions. These messages indicate whether the
resources sent were appropriate or in sufficient quantity to adequately resolve the emergency.

69
Depending upon the feedback received, additional communication and coordination with other
teams may be necessary.
Table 1 Feedback messages received by resource managers
On-Scene Feedback Messages Interpretation “Unit(s) have arrived on-scene and report on-going progress. The situation will be resolved shortly.”
RM dispatched the correct number of appropriate resources. Resources will return when the emergency is resolved.
“Units have arrived on-scene, but field commander reports that unnecessary personnel are present and currently inactive. However, progress is being made to resolve the situation.”
RM dispatched more than the correct number of appropriate resources. Resources will return when the emergency is resolved.
“Unit(s) have arrived on-scene and report that progress is slow. Unit(s) have requested additional support from headquarters.”
RM dispatched an insufficient quantity of the appropriate resource. Emergency is resolving too slowly. Resources will return when the emergency is fully resolved.
“Unit(s) have arrived on-scene, but do not have the capabilities to address the situation. Unit(s) have requested additional support from headquarters.”
RM dispatched inappropriate resources to the event. Resources will return when the emergency is resolved.
“Unit(s) have arrived on-scene, but do not have the proper credentials to address this situation. Unit(s) are returning to headquarters.”
This dyad is not required to respond to this event. Resources are returning immediately.
A scenario file containing a prewritten script controls the simulation during each
exposure to the task. These scenario files contained ten minutes (experiment 1) or eight minutes
(experiment 2) of emergency events to be released to the IMs at timed intervals. Each event was
designed to be handled by only one dyad, however most were worded such that there was some
ambiguity about whether an event was supposed to be dealt with by fire, police, or hazmat, or
perhaps through collaboration between two or more. All of the events were selected from the
scenario files previously tested and utilized in the prior two studies using NeoCITIES (Connors,
2006; Jones, 2006). Each scenario file was balanced such that each pair was required to deal with

70
the same number of events and utilize the same total number of resources with approximately the
same amount of time allowed to respond between events.
The score bar in each client’s interface is set at 100% at the beginning of the simulation.
The score bar reflects the accuracy and timeliness of each pair’s responses to their respective
events. All participants are asked to cooperate with each other and use the knowledge from their
training to keep the score bars as high as possible (errors and delays gradually diminish the
score). The simulation automatically closes at the end of the scenario.
PARTICIPANTS Participants were drawn from a pool of undergraduate students enrolled in a junior-level
human-computer interaction course as part of the curriculum in the College of Information
Sciences and Technology at the Pennsylvania State University. Participation in the experiment
was given in exchange for course credit.
EXPERIMENTAL DESIGN Both experiments used a 2x2 within-subjects full-factorial design. The two independent
variables were the level of stress (normal, high) and affective valence (sad, happy). The second
experiment was conducted identically to the first with the stress manipulation changing from task
load to performance pressure.
The condition sequence was changed each day as the time to configure conditions took
longer than the time available between consecutive sessions. Teams visited the lab one at a time.
No more than two groups visited the lab each day.

71
Table 2 Experimental Conditions
Condition Stress Mood
1 Normal Sad
2 Normal Happy
3 High Sad
4 High Happy
MANIPULATIONS AND MEASURES The manipulations and measures implemented in this study are detailed in Table 3.
Table 3 Summary of independent and dependent variables
Independent Variables Dependent Variables
Stress (manipulated): High task load or normal task load; high performance pressure or no performance pressure Mood (manipulated): Positive affective valence or negative affective valence
Task Performance: Dyad-level score based upon timeliness and accuracy of resource allocation responses Communication type and frequencies: Within-dyad messages coded according to communication types (acknowledgements, requests, or transfers of information, action, or coordination)
Independent Variables
Stress Stress was manipulated in the first experiment using task load (normal or high) and in the
second experiment using performance pressure (none or high). The same stress manipulation was
applied to all six team members simultaneously. Low task load was provided with scenarios
containing 18 events to be addressed in ten minutes. This task load was approximately equivalent
to the load used in prior experiments which were testing tools under routine task conditions.

72
High task load was defined as scenarios containing 30 events to be addressed in ten minutes.
This pace was determined to slightly exceed what an experienced user would be able to manage
by ensuring that at least one new event would emerge for each dyad before the prior event could
be fully addressed. Care was taken to avoid a task load so high that participants would “choke”
under pressure and stop performing altogether.
The performance pressure stress manipulation used in the second experiment was
partially adapted from the Trier Social Stress Test (Kirschbaum, Pirke, & Hellhammer, 1993).
Subjects in the stressed condition were told at the beginning of the simulation that this particular
trial had been randomly selected to be digitally monitored and recorded for evaluation by a panel
of crisis management experts. Upon the launch of the simulation, two experimental monitors
closely observed the participants by walking up and down the aisle behind the participants,
pretending to make notes on clipboards. In addition, a monetary incentive of $150US was going
to be awarded to the six-person team with the best overall score during the second experiment.
The significance of this award was heavily emphasized at the beginning of the trials during the
stress condition. To maintain this performance pressure further during the trial, participants were
emphatically told that they needed to perform better at three minutes and seven minutes into the
scenario. All scenarios in the second experiment had 18 events to be addressed in eight minutes,
a pace slightly higher than the low-load condition in the first experiment.
Mood Mood was manipulated by showing participants eight to ten minute happy or sad scenes
from popular movies immediately prior to performing the NeoCITIES task. The happy and sad
movie clips used in these experiments were selected from a larger pool through informal
pretesting on lab personnel. Participants viewed a total of four clips in each experiment. This

73
method has elicited the desired moods in several studies (e.g. Cavallo & Pinto, 2001; Van
Tilburg & Vingerhoets, 2002; Wang et al., 2006). The same mood manipulation was applied
simultaneously to all six team members. The happy manipulation actually has far less effect
upon individuals than the sad manipulation. Most people enter a situation such as an
experimental trial in a fairly happy mood (Diener & Diener, 1996), so there is not much room to
make them happier. In that sense, the happy state is a control condition, while the sad state is the
actual mood manipulation.
Table 4 Movies used for mood manipulations
Happy Sad
Austin Powers: The Spy Who Shagged Me (Mike Myers, 1999) [two clips] Hitch (Kevin Bisch, 2005) Play It Again, Sam (Woody Allen, 1972)
Forrest Gump (Robert Zemeckis, 1994) Terms of Endearment (James L. Brooks, 1983) Titanic (James Cameron, 1997) [two clips]
Dependent Variables
Task Performance An overall task performance score for each dyad per session was calculated by
aggregating per-event scores over the course of the scenario. This is the same formula used in the
original CITIES experiments (Wellens & Ergener, 1988). The current magnitude for each event
is recorded at each time step as a penalty. If the event magnitude continues to escalate beyond a
preset threshold or if the event persists longer than a preset time limit, the event is declared a
failure. On the other hand, once the appropriate resources arrive on scene ( correctR ), the

74
magnitude of the event will diminish at a rate proportionate to the quantity of resources correctly
dispatched. Once the magnitude reaches zero, the event is considered to be successfully resolved.
)()()( 211 correctttt RcMbMaM −+= −−
Equation 1: NeoCITIES event magnitude formula (Wellens & Ergener, 1988)
The event scores are recorded at each time step as tM . The time when an event is
dispatched to the clients is defined as 0=t . The first magnitude computed is 1M . The
term correctR denotes the number of appropriate resources currently dispatched to the event
(inappropriate resources have no effect in resolving the event). Each event is fired with an initial
magnitude ( 0M ) that is proportional to the severity of the event. For example, for a wastebasket
fire, the initial severity 25.10 =M , while for a multiple-car accident 00.30 =M . Over time, the
magnitude of the event escalates until the proper resources arrive to address and begin to resolve
the event. The general idea behind this model is that a wastebasket fire left unattended becomes
an apartment fire, and if still unattended it can spread to many buildings, and so on. As the fire
escalates, more resources are required to put that fire out. Ultimately, however, all the buildings
burn down, so there is a maximum limit to the possible penalty. The graphs in Figure 14 show
how event magnitudes change over time depending on how many resources are allocated to
resolve them. Total penalty for an event is the area under the curve.

75
Resources Dispatched = 0
0
1
2
3
4
5
6
7
8
9
10
0 40 80 120 160 200 240
Time Step (t)
Even
t Mag
nitu
de
Resources Dispatched = 1
0
1
2
3
4
5
6
7
8
9
10
0 40 80 120 160 200 240
Time Step (t)
Even
t Mag
nitu
de

76
Resources Dispatched = 5
0
1
2
3
4
5
6
7
8
9
10
0 40 80 120 160 200 240
Time Step (t)
Even
t Mag
nitu
de
Figure 14: Event growth curves showing changes in event magnitudes over time given the allocation of 0, 1, or
5 resources to events of varying initial magnitude
The total penalty assigned to the dyad for that event ( iE ) equals the sum of the event
magnitude values ( tM ) recorded during the lifetime of that event. This total penalty amount is
then deducted from the dyad’s score bar. Therefore, if an event is resolved with the proper
resources very quickly, the penalty to that dyad’s score is fairly small. If an emergency event is
left to run out of control, however, the accumulated penalty can be very large. In this version of
NeoCITIES, events fail when they increase in magnitude to the next higher integer (e.g. when an
event of initial magnitude of 2 increases to a magnitude of 3).
Comparing the event scores for the magnitude 2 event in each of the three graphs above
demonstrates the significant shifts in score depending on the operator’s response. If the operator
ignores the event (R = 0), the event reaches a magnitude of 3 by time step 36 and fails with a
score of 80.40. If one resource is immediately dispatched, the event slowly resolves by time step
45 for a score of 50.66. If the operator dispatches 5 resources immediately, this excessive

77
response resolves the event at time step 10 with a score of 9.38. Of course, this over-allocation of
resources presents the risk of not having enough available for another imminent emergency.
Figure 15 shows a typical example of an event response. In this graph, an event of initial
magnitude of 2 occurs at time step 0 ( 0M = 2). The operator does not address this event until
time step 30, at which time two resources are dispatched. The magnitude begins to decrease at
this point and reaches 0 at time step 66. At this point the event is successfully resolved, and the
total score for the event is calculated as the area under the curve ( iE = 131.68).
0
0.5
1
1.5
2
2.5
3
3.5
4
4.5
5
1 21 41 61 81
Figure 15: Example scoring for an event of intial magnitude of 2 addressed with 2 resources at time step 30
Each scenario has an initial maximum score maxS derived from the quantity and severity of
events it contains. The final score for each dyad equals maxS minus the sum of the accumulated
event penalties.
∑=
=max
0
t
tti ME ∑
=
−=I
iiT ESS
1max
Equation 2: Event score and final dyad score formulas

78
The calculations above refer to time in terms of time-steps in the simulation, not actual
time in seconds or minutes. For example, time steps may be six seconds apart, each step
representing one minute of simulation time. The scaling constants a, b, and c may be adjusted for
different kinds of experimental scenarios. In this study, a = 0.995, b = 0.0075, and c = 0.04995.
These constants and equations are the same as those used as measures in the C.I.T.I.E.S. game
(Wellens & Ergener, 1988) which is NeoCITIES’ progenitor. Two prior NeoCITIES experiments
also used these scoring formulas as dependent measures (Connors, 2006; Jones, 2006).
Communication variables The purpose of including measures of communication data is to try to find possible
explanations for why stress or mood states cause changes in team performance. By detecting
changes in communications types, patterns, or content, it may be possible to identify changes in
attention or problem-solving styles at both the individual and team levels.
The communication variables computed for this study focused exclusively on within-
dyad communications rather than between-dyad communications in order to directly compare the
dyad-level performance score with the communication behaviors occurring at that level. The
development of the chat coding scheme for NeoCITIES was described in chapter five (coding
instructions are found in appendix B). The primary communication measures are described in
Table 5.
Table 5 Team communication encoding measurements Abbreviation Measure Description
Overall Rate
TC Total Communications Total number of communications in the session

79
Communication Type
IR Information Request Request for information IT Information Transfer Transmission of information AR Action Request Request for action AT Action Transfer Statement of action taken or to be taken CR Coordination Request Request to coordinate an action CT Coordination Transfer Agreement to coordinate an action
ACK Acknowledgements Acknowledgements of the receipt of a communication, but without any specific message content (i.e. “OK”)
INSIG Insignificant Utterances Task-irrelevant statements or chatter
Communication Ratios
OA Overall Anticipation Total communications transfers divided by total communications requests
IA Information Anticipation Information transfers divided by information requests
AA Action Anticipation Action transfers divided by action requests CA Coordination Anticipation Coordination transfers divided by coordination
requests
An additional category of communication measurement assessed the proportion of the
chat log consisting of each type of communication. These were computed by dividing the
number of each type of message by the total number of messages in the log. This provided
variables indicating the percentage of the log consisting of information transfers (%IT), action
requests (%AR), and so on. Lastly, a measure of on-task messages was computed by subtracting
the insignificant utterances from the total communications (TC-INSIG)
Certain measures from this table are not relevant to within-dyad communication. When
RMs receive a status report suggesting their dyad is not suited to handle an event, coordination
requests (CR) may be made to their IMs to suggest to the other IMs that action by another dyad
is necessary to resolve a certain event. Coordination transfers (CT), however, are exclusive to the
80
domain of between-dyad communication. Therefore, CTs were not considered in this study, nor
were the CA ratios.
Individual Difference Measures The significant role of individual personality factors in reactions to stressors is
acknowledged in nearly all models of stress. Though the effects of individual differences may
not be reliable in subject pools as small as the one in thus study, failure to measure and account
for those suggested by previous research posed a possible threat to the internal validity of the
study. The literature reviewed in the preceding chapters identifies several individual differences
that are particularly relevant in the context of the group decision making processes and
conditions in this study: locus of control, tolerance of ambiguity, trait anxiety, neuroticism, and
extraversion. Prior to the beginning of the experimental trials, all participants were administered
the following survey measures:
Table 6 Control measures of individual differences
Measurement Instrument Measures Provided Myers-Briggs Type Indicator (Myers, McCaulley, Quenk, & Hammer, 1998)
Four-factor dichotomous personality type (administered by instructor in class)
International Personality Item Pool Representation of the NEO PI-R™ Five-factor personality inventory (Goldberg et al., 2006)
Continuous measures of extraversion, neuroticism, conscientiousness, agreeableness, and openness to experience
State-Trait Anxiety Inventory (STAI) Form X-2 (Spielberger, Gorsuch, & Lushene, 1970)
Trait anxiety index
Multiple Stimulus Types Ambiguity Tolerance (MSTAT-I) (McLain, 1993)
Tolerance of ambiguity index
Multidimensional Multiattributional Causality Scales (MMCS) (Lefcourt, 1981)
Internal and external locus of control indices
Basic demographics Age and gender

81
Dyad-level measures of these individual differences were computed by averaging the
values of the two dyad members. A gender mix variable was created to code whether dyads were
male-male, male-female, or female-female.
Mood and Stress Measures Immediately following the mood induction stimulus, participants completed a brief
questionnaire (unrelated to the NeoCITIES task) that included items from the Positive and
Negative Affectivity Scales (PANAS) (Watson et al., 1988), Short Stress State Questionnaire
(SSSQ) (Helton, 2004), and Short-Form State Trait Anxiety Inventory (STAI) (Marteau &
Bekker, 1992) in addition to questions about the content of the movie clip. These items were
used to check for the effect of the mood manipulation. Immediately following the NeoCITIES
task, participants completed another longer questionnaire that included a larger set of items from
the three instruments listed above in addition to task-related questions about the participant’s
experience during the NeoCITIES simulation. These items checked for the effect of the stress
manipulation and the persistence of the mood manipulation.
All questions on the two surveys mentioned above were answered on 5-point likert scales
indicating agreement with statements (e.g. “I feel determined,” “I am worried,” “I feel this movie
clip was sad”) with responses ranging from “Not at all” to “Extremely.” To prevent the survey
instruments from becoming too long and fatiguing, a subset of questions from the each
dimension of the SSSQ (engagement: six items; distress: five items; worry: five items) was
selected as the most salient set of stress measures for these experiments. All of the survey items
are reproduced in appendix A.

82
Additional task-related questions were utilized in experiment 2 to test the fourth
hypothesis regarding the effects of stress on team processes, specifically the ability of the team to
collectively detect patterns of activity from pieces of information distributed among each of its
members. Prior to the second experiment, teams were told that sometimes there are connections
between events in NeoCITIES, meaning that an event one pair is dealing with may cause another
event for another pair, which again could cause yet another event. They were to be on alert to
look closely at events and communicate with each other in order to find them when they
occurred and describe them on a paper-and-pencil survey administered at the end of the task (this
survey was not analyzed).
Each 18-event scenario had six connected events – two for each dyad to resolve (one
third of the events per scenario were written to be interconnected). By holding the number of
connected events constant in each scenario, variations in the attention to and reporting of such
events could be attributed to the manipulations of stress or mood. Connected events were defined
to be in close proximity on the map, have at least two keywords in common in the event
description, and occur within a total span of six events. An example of connected events might
be a break-in at a chemistry lab that would be addressed by the police. Some time later, however,
the materials stolen in that incident would surface in another nearby event that requires the
attention of the hazmat team. Resolving this second event successfully would require
information gathered by police during the first event, so it benefits the hazmat team to a) recall
that a potentially related event occurred earlier, and b) inquire of the police: “Didn’t you deal
with a break-in at a chemistry lab a while ago? What happened with that?”

83
This hypothesis has communication and coordination dimensions which were tested with
additional post-task questions. The experimenters constructed these questions by drawing from
communication and cooperation-related parameters of teamwork frequently referred to in the
stress literature. Examples of these include perceived levels of trust in communication, and
confidence in information. The last two questions were designed to assess the perception of
interconnected events as specifically defined for participants at the beginning of the experimental
sessions. Participants indicated their agreement with the following statements added to the post-
task surveys. These were answered on the same 5-point likert scale as the other self-report
questions above.
EQUIPMENT NeoCITIES is built on a Java-based server-client architecture. It currently runs
exclusively on the Microsoft Windows platform. The server code runs on a separate computer
from the client workstations. The NeoCITIES software does not require any specific hardware or
software beyond what is commonly found on most desktop computers running Microsoft
Windows: a keyboard and mouse, a monitor capable of displaying 1280x1024 pixels or higher, a
web browser, the Java Runtime Engine (JRE) 1.5.02 or later, and a network connection. Training
materials are presented to users in Microsoft PowerPoint format. The mood induction procedures
as well as the assessments of stress and mood were administered online in a web browser prior to
and following exposures to the NeoCITIES task. The launch and sequence of the mood
inductions, NeoCITIES task, and survey instruments were automatically controlled by batch
files.
The experiments were conducted in the User Science and Engineering Lab (314A IST
Building) which houses a modular experimental space supporting six physically divided

84
computer workstations (see Figure 13). Each client workstation contained a Dell Optiplex
computer running Microsoft Windows XP Professional SP2 with a 17” flat-panel display,
ethernet network connection, standard keyboard, optical 2-button mouse with scroll wheel, and
stereo headset. The software installed on the computers included the Java Runtime Engine
1.5.02, Internet Explorer 7.0, Microsoft PowerPoint, and Adobe Flash Player 9.0. An additional
Dell laptop computer running the same software ran the NeoCITIES server software from the
experimental monitor’s position in the lab. Batch files ran from the experimenter’s workstation at
the conclusion of each NeoCITIES task to gather all of the performance logs from the server and
six clients and organize them on an external storage server.
PROCEDURES An initial information session detailing participation requirements was performed during
the first week of the semester. Participants were told that the experiments they were going to
participate in were part of a joint effort by the College of Information Sciences and Technology,
the College of Communications, the Department of Psychology, and the Department of
Geography (all of which were, in fact, participating in various aspects of the current study) to
conduct multiple unrelated experiments that all pertained to various aspects of “Individual
Differences in Group Performance.” However, this statement was actually to provide a cover
story for the mood induction procedure. Participants were told that they were participating in an
experiment on visual communication and memory in which they would view a video clip and
answer questions about it after waiting for ten to fifteen minutes. The experimenter would be
using that waiting period to conduct the NeoCITIES experiment.
At that time participants were asked to read, sign, and return the IRB-mandated informed
consent form. Each team was then asked to determine their availability for lab sessions;

85
assembly of the final schedule took approximately two weeks. Each group visited the lab at the
same day and time for training and both experiments. Participants were randomly assigned to a
dyad and role. Once assigned, each participant held the same position and computer workstation
at each session during the experiment. In order to prevent repeated exposure from inducing
boredom, subjects were reassigned to new roles within the team for the second experiment.
While the task work of the Police, Fire, or Hazmat dyads are functionally equivalent, the changes
in perspective (i.e role and resources in use) were intended to keep the simulation interesting and
defer a loss of interest in the task.
Once the schedule was completed, teams visited the lab for a preliminary session that
included the online administration of the personality survey measures and approximately 30-45
minutes of training on the NeoCITIES simulation. Training began with a self-paced PowerPoint-
based tutorial customized for each role. It explained how the interface worked, what each
participant’s responsibilities were, and what to expect from their partner in the simulation. Once
all participants completed the tutorial, the experimenter offered to answer any questions. Next,
participants completed a brief scenario consisting of nine events at a slow place. Following this,
participants could again ask any questions about operations or strategies within the simulation.
Finally, participants went through a longer scenario consisting of twenty events, similar to what
they would encounter in the actual experimental trials. Participants could then continue to ask
questions if needed and then were dismissed. Participants were given the opportunity to review
the training materials again prior to experiment 2.
For the active experimental sessions, participants were seated at the same workstation
they had been trained at. Each logged into their workstation with a unique ID that ensured the

86
self-reported data was automatically tracked with that individual’s session. They were reminded
that they would begin with the experiment on visual communication and memory and then
proceed to the NeoCITIES experiment, returning again to the visual communication experiment
at the end. Requiring participants to recall the movie clip after the NeoCITIES task is a technique
that helps preserve the clip in working memory (and therefore maintains its emotional impact)
during the task.
At the beginning of the session, participants put on their headphones and double-clicked
an icon which launched the batch file that would automatically control each step of the
experiment from that point on (screenshots of each page of the experimental session in sequence
are in appendix C). At this point the experimenter sat at a desk at one end of the lab to discreetly
monitor the experiment and control the NeoCITIES server. Participants first saw an introductory
screen explaining the general instructions for the activities to follow. The next screen introduced
the visual communications part of the study. After clicking “Begin” the mood manipulation
movie clip began. At the conclusion of the movie clip, participants were presented with a short
online survey that included questions about features from the movie clip and their current
feelings at that moment (see appendix A). Questions about the movie provided cover for other
items required for the mood manipulation check. Following the pre-task survey, participants
received a score on their recall of features from the movie. This maintained the on-going thread
of the visual communications study as separate from the NeoCITIES study. Responses to these
questions were not analyzed. The NeoCITIES task immediately followed, lasting ten minutes
(experiment 1) or eight minutes (experiment 2). Following the NeoCITIES task, participants
completed a longer survey including questions about the NeoCITIES task and their feelings at

87
that current moment (see appendix A). Participants were asked to wait after completing the
survey until everyone had finished.
After a brief pause, the participants completed the second condition of the session. The
cycle repeated with a second movie clip (opposite mood of the first), pre-task survey,
NeoCITIES task (same stress condition as the first), post-task survey, and a final clip of a stand-
up comedian that served two additional purposes. One was to provide an emotional “reset” to put
participants back into a positive mood before leaving the session. The second was to present
follow-up survey questions comparing the comedian clip to the happier of the two clips seen
during the session. This reemphasized the requirement to preserve the movie clips in memory
during the other tasks. Answers to these questions were not analyzed. After everyone had
completed the final survey, participants were reminded of the date and time of their next lab
session and were dismissed.

88
CHAPTER 7 RESULTS
This chapter details the results of the two experiments explained in the prior two
chapters. The two experiments are reviewed in sequence, beginning with descriptive data about
the participants and conduct of the experimental sessions, followed by the manipulation checks
and main results. The main results sections first report on the analysis of task performance and
results of the hypothesis tests, and then concludes with analysis of the communications data.
MANIPULATION CHECK ITEMS Principal components factor analyses (varimax rotation) were conducted on the pre- and
post-NeoCITIES responses for each experiment (four analyses total). The scree plot for all four
analyses suggested a three factor solution. Items were selected that loaded more than .60 on one
factor without loading more than .40 on any other factor.
One factor containing three items from the positive affectivity scale of the PANAS (one
item was also shared with the engagement scale of the SSSQ) was common to pre- and post-task
surveys in both experiments: “I feel active” (PA, SSSQ-E), “I feel enthusiastic” (PA), and “I feel
determined” (PA). This factor was named “PA/Engaged.” A second factor appeared in the post-
task survey in the second experiment with items from the negative affect scale of the PANAS,
the State Trait Anxiety Inventory, and the distress scale of the SSSQ: “I feel upset” (STAI), “I
am worried” (STAI), “I feel dissatisfied” (SSSQ-D), and “I feel distressed” (NA). The pre-task
survey in experiment 2 had a six-item factor including the same four items. The post-task survey
of experiment 1 had a five-item factor including three of those four items, and the pre-task
survey had a nearly identical factor that did not quite meet the selection criteria. As no other
items in the first experiment clearly formed meaningful pre- and post-task factors, this four-item

89
factor was adopted for both experiments and named “NA/Anxious.” All factors indicated
adequate internal consistency. According to both Russell’s model of core affect (Figure 4) and
Watson and Tellegen’s two-factor model of affect (Figure 5), these two measures are roughly
orthogonal.
Table 7 Summary of manipulation check factors
Experiment 1 Experiment 2
Pre-task Post-task Pre-task Post-task
PA/Engaged
Cronbach’s α .79 .85 .86 .75
Mean 1.45 1.95 1.32 1.54
Standard Deviation .91 .92 .77 .76
NA/Anxious
Cronbach’s α .72 .71 .77 .78
Mean .49 .28 .37 .56
Standard Deviation .62 .44 .48 .64

90
Figure 16: Overlay of affect measures on both models of affect

91
EXPERIMENT 1
Descriptive Data Seven teams of six participants each divided into three dyads participated in the study.
The unit of analysis for the dependent measures was the dyad (N = 21). Forty-three students
ranging from 19 to 30 years old participated in the study. The average age of participants was
21.1 years (SD = 1.98). Thirty-nine were male and four were female. Forty-two of the
participants were from the United States; one was from India.
The course instructor assigned the participants to groups of three to work on group
projects for the duration of the semester. The experimenter created seven teams of six for the
simulation by quasi-randomly combining two of these three-person groups based on which teams
were able to schedule simultaneous time in the lab outside of class. The remaining student was a
member of one of the groups for class projects and served as an alternate participant for the
experiments. These groups stayed together for the duration of both experiments. The group
cohesion found in real-world teams was mimicked as these teams maintained additional working
contact outside of the experiments – in the classroom and on team projects.
In the first experiment, one dyad was excluded from all four conditions for not following
the experimenter’s instructions. One additional dyad failed to report to the lab for one session
(two conditions missed), though the simulation still ran with the two remaining dyads. This
eliminated two additional data points from the no-stress condition of the first experiment.
Manipulation Checks The measures of self-reported stress and mood states were averaged across both members
of each dyad to maintain all analysis at the dyad level. The effects of the mood manipulation
were tested on all participants with a within-subjects analysis of variance (ANOVA) using the

92
restricted maximum likelihood (REML) method. REML is a versatile approach for variance
component estimation within models containing random effects, which in this case is to control
for dyad ID in the within-subject measures across the four conditions. REML results feature
attributes that differ in appearance from standard ANOVA analysis, including fractional degrees
of freedom. Complete details on the REML method and the rationale for its use in this type of
design are in Littell, Milliken, Stroup, Wolfinger, & Schabenberger (2006).
The two dependent variables tested were the self-reported PA/Engaged and NA/Anxious
scales (defined in chapter 6) recorded immediately following the movie clip. There was a
significant effect of mood on PA/Engaged, F(1,56.98) = 45.53, p < .01, R2 = .64. Participants
reported higher positive affect in the happy condition (M = 1.80, SE = .12) than in the sad
condition (M = 1.14, SE = .12). There was also a significant effect of mood on the NA/Anxious
variable, F(1,57.14) = 91.30, p < .01, R2 = .69. Participants reported higher negative affect in the
sad condition (M = .81, SE = .07) than in the happy condition (M = .19, SE = .07). Note,
however, that the NA/Anxious measure was very low overall on a scale of zero to 4.
The differences between the post- and pre-task mood measurements were tested using the
same technique to check for the persistence of the mood manipulation. In both cases, there was a
significant result indicating that participants felt more negative affect and less positive affect
after completing the task in the happy condition than the sad condition – just the opposite of
what one might predict (PA/Engaged: F(1,57.33) = 21.95, p < .01, R2 = .48; NA/Anxious:
F(1,56.69) = 74.45, p < .01, R2 = .53).

93
0
0.1
0.2
0.3
0.40.5
0.6
0.7
0.8
0.9
Pre-Task Post-Task
Time
NA
/Anx
ious
Happy condition
Sad condition
This reflected the fact that the mood manipulation appears to have worn off prematurely.
Participants generally entered the experimental session in a good mood and did not become
substantially happier after watching a happy movie clip. At the end of the task, their mood would
remain roughly at the same level of happiness. This is a frequent problem with positive mood
inductions (Westermann et al., 1996). The manipulation check above demonstrated that
participants in the sad condition did indeed begin the task in a sad mood, but the pre-post change
indicates participants returned to a good mood by the end of the task. Therefore, simply due to
the effect of time passing, participants in the sad condition show a large improvement in mood
following the task whereas participants in the happy condition show little or no change. As a
result, to avoid this erroneous bias, only the post-task mood measures were used to assess
changes in mood resulting from the task.
The differences between the post- and pre-task measurements of the three dimensions of
the Short Stress State Questionnaire (SSSQ) were tested for the effect of the stress manipulation
using the same analysis as above. The effect of stress on sssq-engagement approached
significance, F(1,58.77) = 3.31, p = .07, R2 = .34. Stressed participants reported lower
0
0.5
1
1.5
2
2.5
Pre-Task Post-Task
Time
PA/E
ngag
ed
Happy condition
Sad condition

94
engagement (M = .83, SE = .13) than non-stressed (M = 1.10, SE = .13). A significant effect was
found on sssq-worry, F(1,58.92) = 4.20, p < .05, R2 = .03. Participants under stress reported more
worry (M = .19, SE = .08) than non-stressed participants (M = -.03, SE = .08), though this overall
difference is quite small. No significant effect was found on sssq-distress.
Main Results As a portion of this study was exploratory in nature, backward stepwise multiple
regression was used to determine which individual difference measures had a significant impact
upon dyad task performance1 in addition to the Stress X Mood factorial model defined by the
experimental design. Only when these factors are identified and controlled for can the
hypotheses be reliably tested.
The individual differences identified in the literature (dyad age, gender mix, locus of
control, tolerance of ambiguity, trait anxiety, neuroticism, conscientiousness, and extraversion;
see Table 6) were analyzed for pairwise correlations to test for multicollinearity. Only
neuroticism and trait anxiety showed a high enough degree of correlation (r(82) = .66, p < .01) to
warrant exclusion of one of the terms; neuroticism was eliminated from the set prior to further
analysis. These remaining factors were added to the model and removed one by one in order of
the largest p values until the remaining terms showed p < .10. Gender mix, conscientiousness,
and tolerance of ambiguity were the only individual difference measures remaining in the model.
Gender mix was defined with three levels (male-male, male-female, and female-female), but as
there were no female-female pairs in this study, this variable had only two levels.
Conscientiousness and tolerance of ambiguity were continuous measures.
1 The task performance measure was squared for a normal distribution in experiment 1. Back-transformed means appear in parentheses after the analyzed means in the results tables.

95
During experimental trials, teams were observed to perform better during the second task
of each session. Indeed, a one-way ANOVA revealed a significant effect for task order indicating
that participants performed significantly better on the second task of each experimental session,
F(1,57.15) = 15.12, p < .01, R2 = .38. Therefore, task order was also entered into the model as a
covariate.
Dyad Task Performance Following the regression analysis, the dyad task performance variable was tested using a
2 (Stress: none, high) X 2 (Mood: happy, sad) factorial within-subjects ANCOVA (REML
method) using task order (first, second), gender mix (male-male, male-female),
conscientiousness, and tolerance of ambiguity as covariates. There was a significant main effect
for the stress manipulation, F(1,18.45) = 7.31, p < .05. Participants performed worse in the high
stress condition (M = 1371.66 (37.04), SE = 78.40) than in the no stress condition (M = 1567.07
(39.59), SE = 79.07). There was no main effect for mood, nor was there any significant
interaction between mood and stress.
0
5
10
15
20
25
30
35
40
45
No Stress High Stress
Stress Condition
Dya
d Ta
sk P
erfo
rman
ce
Happy Sad
Figure 17: Mood X Stress interaction for task performance in experiment 1

96
Table 8 Mood X Stress interaction for task performance in experiment 1
No Stress High Stress
Mood N M SE N M SE
Happy Mood 19 1566.21 (39.58) 94.34 20 1328.80 (36.45) 92.98
Sad Mood 19 1567.93 (39.60) 94.34 20 1414.52 (37.61) 92.98 Back-transformed means appear in parentheses
The model confirmed that task order had a very significant effect, F(1,18.42) = 12.70, p <
.01. Participants performed considerably better on the second task (M = 1614.58 (40.18), SE =
80.95) than on the first (M = 1324.15 (36.39), SE = 80.95). Gender mix also showed a significant
result, F(1,15.63) = 4.78, p < .05, with male-female dyads performing worse (M = 1310.98
(36.21), SE = 131.93) than male-male dyads (M = 1627.75 (40.35), SE = 53.72). Lastly,
conscientiousness revealed a positive correlation with performance which approached
significance, B = 5.96, t(18.01) = 2.07, p = .054.
Testing of Hypotheses The first three hypotheses were designed to determine whether mood mediated the effect
of stress upon performance. Hypothesis 1 predicted the main effect of stress upon performance
which was confirmed above. This shows there is an effect of stress to be mediated.
Hypothesis 2 predicted that cognitive stressors would trigger changes in individual mood,
as assessed by the two mood measures, PA/Engaged and NA/Anxious. A one-way within-subjects
ANOVA (REML method) showed that stress had a significant effect on negative affectivity,
F(1,58.16) = 4.99, p < .05, R2 = .37, with stressed participants rating higher NA/Anxious (M =

97
.35, SE = .05) than non-stressed participants (M = .22, SE = .05). This was also true for the effect
of stress upon the PA/Engaged measure, F(1,57.43) = 4.68, p < .05, R2 = .75. Participants rated
lower on this measure when in the stressed condition (M = 1.83, SE = .15) than in the non-
stressed condition (M = 2.03, SE = .15). This supports the second hypothesis that stress also has
an effect upon the participant’s mood as assessed by both mood measurements.
Next, hypothesis 3 predicted that a negative mood among participants would result in
diminished team task performance. This was tested using a within-subjects (REML method)
regression analysis between each of the mood measures (one at a time) and performance,
controlling for stress. The analysis of NA/Anxious showed an effect to diminish task
performance which approached significance, B = -339.93, t(54.24) = 1.93, p = .06. This
regression also showed that the formerly significant effect of stress was no longer significant, B
= -72.00, t(17.33) = 1.62, p > .10, which demonstrates that negative affect mediated the effect of
stress upon performance. The analysis of the PA/Engaged variable, however, showed no
correlation between positive affect and performance. The main effect of stress remained
significant (F(1,17.89) = 5.71, p < .05). This affect variable does not show the hypothesized
mediating effect.
Hypothesis 4 was not tested until the second experiment.
Dyad Communications Communication logs for each IM-RM pair were analyzed by two coders according to the
coding scheme described in appendix B. The two coders’ ratings were highly correlated, r(894) =

98
.97, p < .01. The logs recording messages between the three IMs were not analyzed for this
study.2 The two coders’ total counts for each message type were averaged for each log.
The communication variables were examined using a 2 (Stress: none, high) X 2 (Mood:
happy, sad) within-subjects ANOVA (REML method). The individual differences included in
the performance model have only been cited with regard to task performance and were not
included in the communication models.
Only one main effect was identified among the communications variables. Stress showed
an effect approaching significance on the percentage of messages that were information requests
(%IR), F(1,10.51) = 4.17, p = .07. A greater proportion of information requests were made under
stress (M = -1.69 (.18), SE = .15) than in the non-stressed condition (M= -1.98 (.14), SE = .13).
An interaction between stress and mood was observed on the percentage of information transfers
(%IT), F(1,15.9) = 5.31, p < .05. Participants in the happy condition dedicated significantly more
of their communication efforts toward information transfers when under stress than in the non-
stressed condition, while participants in the sad condition did the opposite, showing a marginal
decrease in %IT in the stressed condition. Post-hoc analysis using Tukey’s HSD “Honestly
Significantly Different” (HSD) test with an alpha of 0.05, however, revealed no significant
differences between the test means.
2 Dyad performance scores were squared to achieve a normal distribution. Most of the aggregate communication measures (TC, TC-INSIG, OA, IA, AA, %IR, %AR, %CR, %ACK, and %INSIG) were log-transformed for a normal distribution. %AT was log-transformed and then cubed; %IT required no transformation. Back-transformed means appear in parentheses after the analyzed means.

99
0%
20%
40%
60%
80%
100%
No Stress High Stress
Stress Condition
% In
form
atio
n Tr
ansf
ers
Happy Sad
Figure 18: Mood X Stress interaction for %IT
Table 9 Mood X Stress interaction for %IT
No Stress High Stress
Mood M SE M SE
Happy Mood .35 .05 .48 .04
Sad Mood .49 .05 .42 .04 Means did not significantly differ per Tukey’s HSD, α = .050
An interaction between mood and stress, also approaching significance, was observed on
the total communications variable (TC), F(1, 8.54) = 4.20, p = .07. Participants in the happy
condition sent fewer messages under stress, while participants in the sad condition sent more
under stress. Tukey’s HSD again revealed no significant differences between means.

100
0
2
4
6
8
10
12
14
No Stress High Stress
Stress Condition
Tota
l Com
mun
icat
ions
Happy Sad
Figure 19: Mood X Stress interaction for total communications
Table 10 Mood X Stress interaction for total communications
No Stress High Stress
Mood M SE M SE
Happy Mood 2.57 (13.10) .22 2.21 (9.12) .19
Sad Mood 2.28 (9.82) .22 2.46 (11.73) .19 Back-transformed means appear in parentheses. Means did not significantly differ per Tukey’s HSD, α = .050
EXPERIMENT 2
Changes from experiment 1 The same teams from experiment 1 participated in experiment 2. Each member was
assigned a new role within the team. Resource managers became information managers and vice
versa. Each member was assigned to a new dyad (fire, police, hazmat) such that each was

101
working with a new partner. Each team retrained on NeoCITIES in their new roles for 30
minutes.
The task load stressor was replaced with the performance pressure stressor specified in
chapter 6. The mood manipulation and the format of the experimental sessions remained the
same as the first experiment. The seven additional questions regarding perceived connections
between events and coordination between teammates (see chapter 6) were added to the post-task
surveys.
Descriptive Data All 42 participants arrived on time and followed instructions for each session in the
second experiment, so no data points had to be eliminated. Communication and self-reported
measures were aggregated and transformed using the same methods as experiment 1 (unlike
experiment 1, the task performance measure did not require any transformation). The learning
effect between the first and second tasks per session found in experiment 1 had leveled off in
experiment 2.
Manipulation Checks As in experiment 1, the measures of self-reported stress and mood states were averaged
across both members of each dyad to maintain all analysis at the dyad level. The mood and stress
manipulations were tested using the same analyses from experiment 1. For the mood measures
immediately following the movie, PA/Engaged and NA/Anxiety both showed a significant effect.
Participants rated higher on the PA/Engaged measure in the happy condition (M = 1.42, SE =
.09) than in the sad condition (M = 1.22, SE = .09), F(1,62) = 5.52, p < .05, R2 = .52. Participants
likewise reported lower on the NA/Anxious measure in the happy condition (M = .29, SE = .06)
than in the sad condition (M = .45, SE = .06), F(1,62) = 6.44, p < .05, R2 = .41. As in experiment

102
1, post- and pre-task comparisons of these mood measures indicated that the mood manipulations
did not persist through the conclusion of the task.
None of the three measures of the SSSQ stress instrument showed a significant result for
the stress manipulation. This suggests that the performance pressure stressor used in this
experiment was not perceived as stressful, unlike the task load stressor which was perceived as
stressful by participants on two of the three dimensions of the SSSQ.
Main results As in experiment 1, backward stepwise multiple regression was performed upon the main
factorial model and the individual difference measures to see which factors had a significant
impact on performance in the context of the performance pressure stressor. Factors were again
removed one at a time in order of the largest p values until the remaining terms showed p < .10.
In this experiment, gender mix (F(1,76) = 4.35, p < .05), locus of control (F(1,76) = 3.39, p =
.07), trait anxiety (F(1,76) = 3.86, p = .05), and conscientiousness (F(1,76) = 9.83, p < .01)
remained as factors in the model. Gender mix again had two levels (male-male and male-female)
and the other three covariates were continuous measures.
Dyad Task Performance Dyad task performance was once again tested using a 2 (Stress: none, high) X 2 (Mood:
happy, sad) factorial within-subjects ANCOVA (REML method) using gender mix (male-male,
male-female), locus of control, trait anxiety, and conscientiousness as covariates. There was a
significant main effect for the stressor, F(1,19.91) = 6.40, p < .05. In this case, participants
performed better under the performance pressure stressor (M = 31.33, SE = 1.46) than under no
stress (M = 28.18, SE = 1.46). There was also a significant interaction between mood and stress,
(F(1,20) = 6.54, p < .05). Participants in the happy conditions performed much better in the

103
stress condition (performance pressure applied) than in the non-stressed condition (no pressure
applied), while participants in the sad conditions performed slightly worse in the stress condition
than in the non-stressed condition. Post-hoc analysis using Tukey’s HSD showed that the mean
from the happy/stress condition significantly differed from the mean for the happy/no-stress
condition.
0
5
10
15
20
25
30
35
40
No Stress High Stress
Stress Condition
Dya
d Ta
sk P
erfo
rman
ce
Happy Sad
Figure 20: Mood X Stress interaction for task performance in experiment 2
Table 11 Mood X Stress interaction for task performance in experiment 2
No Stress High Stress
Mood N M SE N M SE
Happy Mood 21 26.82a 1.83 21 33.26b 1.83
Sad Mood 21 29.54ab 1.83 21 29.40ab 1.83 Means not sharing a letter differ significantly at α = .050

104
The only additional factor showing a significant effect in the model was
conscientiousness which showed a negative correlation with performance, B = -.12, t(16.6) =
2.35, p < .05.
Testing of Hypotheses Hypothesis 1 predicting the main effect of stress on performance was confirmed above,
though with the opposite effect as experiment 1. In this case, performance pressure led to an
increase in task performance.
Hypothesis 2 was not supported in this experiment. One-way within-subjects ANOVAs
(REML method) showed that there was no significant effect of the stress manipulation on either
the PA/Engaged or NA/Anxious mood measurement. Hypothesis 3 was also not supported.
Within-subjects regression analysis (REML method) revealed that neither mood measurement
showed any significant correlation with task performance. The main effect of stress remained in
both analyses. Therefore, there appears to be no mediating effect of mood in this experiment.
Hypothesis 4 predicted that teams in the stressed conditions would be less able to detect
emerging patterns of activity that require communication and coordination between team
members. This was tested using the Cooperation and Connections measures defined in chapter 6.
Principal components factor analyses (varimax rotation) were conducted on these
measures to determine a factor structure. The scree plot suggested a three factor solution. Items
were selected that loaded more than .60 on one factor without loading more than .40 on any other
factor.

105
Table 12 Factor structure of the post-task assessments
Question Cooperation Connections Uncertainty
I felt like I knew what other teams were doing during
the simulation.
.57 .48 -.10
I was unsure about how to communicate with other
teams.
-.19 -.06 .67
I frequently felt like I was being ignored. -.81 .05 .15
My teammates were highly cooperative in resolving
events.
.91 -.03 .04
I felt like I needed more information to make correct
decisions.
.07 -.04 .81
I think there were connections between some of the
events. I think each team had a part in resolving some
related events.
-.03 .88 .01
I did not see any connections between events. All of
these events happened independently of each other.
-.02 -.88 .13
Loadings exceeding .60 with no other factor loading more than .40 are in bold.
Three two-item factors resulted from the analysis. The first, dubbed cooperation,
contained two questions measuring the perceived level of cooperation within the team: “I
frequently felt like I was being ignored” and “My teammates were highly cooperative in
resolving events.” These were inversely correlated, r(166) = -.60, p < .01. The second factor,
named connections, contained items measuring the perceived interconnectedness of events

106
within the team: “I think there were connections between some of the events. I think each team
had a part in resolving some related events.” and “I did not see any connections between events.
All of these events happened independently of each other.” These were inversely correlated as
well, r(166) = -.64, p < .01. The third factor, uncertainty, contained the items “I was unsure
about how to communicate with other teams” and “I felt like I needed more information to make
correct decisions.” These two were only weakly correlated, r(166) = .11, p > .10, so this factor
was not used for analysis.
One-way within-subjects ANOVAs (REML method) did not support this fourth
hypothesis, however, as the stress manipulation had no significant effect on either measure.
However, once stress was eliminated as a predictor of perceived event connections and
cooperation processes, additional analyses were performed to test whether mood was possibly a
significant predictor of either. Two within-subjects regression analyses (REML method) were
performed using PA/Engaged and NA/Anxious as the independent variables, using cooperation
as the dependent variable in the first, and connections in the second. The analysis of cooperation
showed a significant inverse correlation between NA/Anxious and cooperation B = -.42, t(68.96)
= 2.74, p < .01. There was no significant effect of PA/Engaged on perceived cooperation. The
analysis of connections showed a significant positive correlation between PA/Engaged and
connections B = .67, t(75.46) = 3.20, p < .01. There was no significant effect of NA/Anxious on
perceived connections between events. Though hypothesis four was not supported as originally
conceived, these two findings reveal unique affective influences upon specific perceptions of
team processes.

107
Dyad Communications Communications logs for each IM-RM pair were analyzed by the same two coders as
experiment 1. The ratings were again highly correlated, r(894) = .96, p < .01. These variables
were examined using the same 2 (Stress: none, high) X 2 (Mood: happy, sad) within subjects
ANOVA (REML method) as experiment 1.
Stress showed a main effect on the total number of communications (TC) sent within
each dyad, F(1,19.85) = 4.66, p < .05. Participants sent more messages per session in the stressed
condition than in the non-stressed condition. This effect was more pronounced after removing
off-task messages from the total, (TC-INSIG) F(1,19.7) = 5.98, p < .05. There was also a
significant effect of stress on the percentage of acknowledgement messages sent (%ACK),
F(1,14.68) = 7.11, p < .05. Participants dedicated more of their messages toward acknowledging
other messages in the stressed condition than in the non-stressed condition. Stress also
significantly curtailed the proportion of off-task remarks made in the chat (%INSIG), F(1,12.23)
= 14.05, p < .01. Participants sent a far smaller proportion of off-task statements under stress
than in the non-stressed condition. These results are summarized in Table 13.
Table 13 Summary of analysis of variance for communication variables
No Stress High Stress
Communication Variable M SE M SE
Total Communications (TC) 6.19 (12.03) .61 7.13 (14.45) .60
Total on-task communications (TC-INSIG) 5.21 (9.80) .62 6.59 (13.02) .60
Proportion of acknowledgments (%ACK) -2.27 (.10) .13 -1.91 (.15) .12
Proportion of insignificant messages (%INSIG) -1.53 (.22) .24 -2.34 (.10) .22Back-transformed means appear in parentheses.

108
Only one main effect for mood was identified. The percentage of action requests (%AR)
dropped significantly in the sad mood conditions (M = -2.95 (.05), SE = .14) as compared to the
happy condition (M = -2.40 (.09), SE = .14), F(1,9.14) = 10.36, p < .05.
An interaction approaching significance between mood and stress was found for
information anticipation, F(1,16.78) = 3.50, p = .08. In the stressed condition, participants in
happy and sad mood appeared to anticipate their partner’s information needs roughly equally.
However, in the non-stressed condition, happy participants rated noticeably higher on
information anticipation than sad participants.
0
1
2
3
4
5
6
No Stress High Stress
Stress Condition
Info
rmat
ion
Ant
icip
atio
n
Happy Sad
Figure 21: Mood X Stress interaction for information anticipation

109
Table 14 Mood X Stress interaction for information anticipation
No Stress High Stress
Mood M SE M SE
Happy Mood 1.62 (5.07) .17 1.28 (3.59) .14
Sad Mood 1.15 (3.15) .15 1.38 (3.97) .16 Back-transformed means appear in parentheses. Means did not significantly differ per Tukey’s HSD, α = .050

110
CHAPTER 8 DISCUSSION
This chapter discusses the theoretical and practical implications of the results detailed in
the previous chapter. Both experiments in this study were identical in most respects except for
the stress manipulation employed. The change in stressors provided two distinct cases for testing
the hypotheses of this study and comparing the changes in performance and communication
behaviors among the teams. Each experiment is reviewed in terms of the key variables of interest
and the proposed hypotheses. A summary of these experiments reviews the efficacy and
limitations of the manipulations, measures, and methods used during this study. This is followed
by a discussion of the contributions of this work and plans for future research. This chapter
concludes with an exploration of the practical implications of these results.
EXPERIMENT ONE The first experiment used the stressor of task overload. This might be considered a
standard exemplar from Lazarus’ transactional model of stress: in the high-stress condition, the
amount of work exceeded the individual’s ability to respond (and was perceived as such by
participants). According to the manipulation check, participants perceived this manipulation as
stressful according to the motivational (less engaged) and cognitive (more worried) dimensions
of the SSSQ instrument, but not the affective dimension (distress). For the type of tasks involved
in the NeoCITIES simulation, the increased worry is sensible. Participants would be increasingly
concerned about their ability to keep up as events piled on faster than they could be resolved.
The decrease in engagement, however, suggests that the task load may have seemed
insurmountable and therefore decreased the participants’ willingness to act. It is likely they cared
less about engaging with the specific details of the events than simply going through the motions

111
as quickly as possible. This could imply that the task load was higher than necessary in the stress
condition. A somewhat less aggressive task load may have maintained or even enhanced
engagement.
The loss of engagement under the task overload condition may also result from the fact
that the course credit received by the participants was not tied to success or failure on the task.
Once the task got harder than a certain level, many participants may have lost interest in
investing energy into the task when no reward was at stake. Instances of clear disinterest were
observed during the first experiment which provided additional rationale for a monetary
incentive as part of the performance pressure stressor in the second experiment.
Support for Hypotheses in Experiment 1
Table 15 Summary of hypotheses supported in experiment 1
Hypothesis Supported 1) Stress impacts performance Supported
2) Stress changes mood Supported for both PA/Engaged and NA/Anxious
3) Mood impacts performance Marginally supported for NA/Anxious measure
4) Stress diminishes detection of emergent activity
Not tested
The task overload manipulation had a significantly negative impact on task performance,
which confirmed hypothesis 1 that stressful experiences can impact task performance.
Hypothesis 1 was deliberately non-directional in anticipation of unique results for each stressor.
The profile afforded by the SSSQ aids in characterizing each stressor for that purpose. Thus, the

112
particular effects observed with this stressor may extend to other stressors that increase worry,
decrease engagement, and have little impact on distress.
Task overload had significant effects on both affective measures, PA/Engaged and
NA/Anxious, confirming hypothesis 2 that the experience of stress has emotional outcomes.
Again, this non-directional hypothesis anticipated that different stressors would have diverse
emotional outcomes. In fact, this very point is the crux of the proposed mediational model: that
instances of eustress and distress (that is, enhanced or diminished performance) can be explained
by the positive or negative emotional outcomes of a given stressful situation. It is important to
point out that the distress dimension of the SSSQ (specifically, the subset of its questions used in
this study) did not reveal an affective impact of the stress manipulation. It can be concluded that
the PA and NA scales developed specifically for this study were more sensitive than that
particular dimension of the generalized SSSQ instrument as used here.
The mood manipulation was clearly successful in placing participants in significantly
different moods prior to the beginning of the task. While no main effect of the mood
manipulation was observed on performance, the NA/Anxiety measure at the conclusion of the
task was indeed inversely correlated with performance and very nearly approached significance
(p = .0586). This failure to achieve significance unfortunately did not support hypothesis 3 that
negative mood would diminish performance. The detrimental effects of negative affect on
performance in individual-level cognitive tasks are well documented, so it is highly probable that
similar effects are at work in group-level tasks such as the NeoCITIES simulation. On the other
hand, even though participants were physically isolated and exposed to the mood and stress
manipulations individually, group-level effects such as social facilitation (Zajonc, 1965) or

113
others could be moderating or normalizing the within-group stress and emotional reactions.
Therefore, a repeated study with an increase in participants would be necessary to see if
significance increases, or if this effect is indeed a marginal one.
The most likely explanation for the absence of a main effect for the mood manipulation is
that the effect wore off before the post-task survey. Effect persistence has been an issue in other
studies employing similar mood induction procedures (Westermann et al., 1996). Many of those
studies, however, generally involve simple individual tasks, whereas these experiments
employed complexity, interactivity, and multiple performers, any of which could have
profoundly diminished the effect of the mood manipulation. The point at which the effect wore
off, and at what rate, however, remains a mystery given only pre- and post-task measurements to
work from. Had additional measurements been taken during the simulation, using EMA or
psychophysiological methods, more could be known about the persistence of the mood
manipulation in this task context. Psychophysiological measures have provided valuable insights
into the subjective experience of interactive environments (e.g. Sundar & Kalyanaraman, 2004;
Sundar & Wagner, 2002). Perhaps a creative solution can be found for a continuous mood
induction of some sort that participants are exposed to during the task, rather than only
beforehand.
The observed effect of post-task mood on performance, however, implies that other
factors in addition to (or indeed contrary to) the mood manipulation induced negative affect and
anxiety, even in the positive mood condition. These other phenomena may have included
dysfunctional team interactions, task underperformance, frustration with the software, or other
factors external to the experiment (having a bad day, arriving at the experiment after a difficult

114
exam, etc.). In fact, given that no main effect for the mood manipulation was found in either
study, if the within-task activities were stimulating a measurably diverse range of moods, then
the mood manipulation may have been unnecessary to test the hypotheses of this study.
Despite the lack of support for hypothesis 3, the main effect of the task load stressor was
eliminated by controlling for mood, meeting three of the four conditions necessary for
demonstrating the mediating model suggested in Figure 7. Task overload caused an increase in
negative affect, which possibly led to diminished task performance. The impact of negative
affect on cognitive task performance itself is nothing new, which again suggests that the
mediation effect may have occurred despite the lack of strong support for hypothesis. This result
suggests that it was not actually the stress itself that diminished the timeliness and accuracy of
the resource allocation responses, but rather the affective consequences of the stressful
experience. Specifically, it was negative affect which was significant in this case, which is
consistent with the notion of hedonic asymmetry – that negative affect generally has much
stronger and more persistent effects than positive affect. As seen in Figure 22 below, stress is
correlated with mood such that when stress increases, so does negative affect and anxiety. As
that increases, task performance decreases.
Figure 22: Mood mediating the effect of stress upon task performance
The covariates included in the model shed additional light onto the factors at work in this
experiment. The learning effect observed on the first experiment was to be expected and was an
unfortunate logistic consequence of having the teams complete two conditions in each

115
experimental session. Noting that it leveled off by the second experiment, future studies now
have a benchmark for how much exposure to the NeoCITIES task before participants develop
and retain measurable task expertise.
The positive effect of the conscientiousness trait is not surprising in a task requiring
effective team interactions. Within the five-factor model from which this measure is derived,
conscientiousness is defined as the opposite of undirectedness or impulsivity. Conscientious
dyads would be described as careful, deliberate, fair, and cautious, as opposed to careless,
unstable, playful, and disorganized. To successfully allocate limited resources to resolve
somewhat ambiguous emergencies, especially for these participants who were quite new to the
job of emergency management, it is sensible to expect that more cautious and organized
individuals would engage in more discussion and be more open to input and joint problem-
solving than impulsive individuals, who would make judgments and take action without too
much concern for due process. Given that each member of the dyad possesses unique powers and
information that must be combined to perform the task, in addition to each member being
accountable to the other, the conscientiousness is likely to lead to more success than impulsivity.
Lastly, it is difficult to make too much of the gender-mix effect with only four mixed-
gender dyads compared to 17 all-male dyads. Additional studies with more balanced groupings
of all three possible gender pairs would be necessary to better explain a) why male-female dyads
performed so much worse than all-male dyads, and b) where all-female dyads would rank overall
in a task environment such as NeoCITIES. However, possible explanations may be drawn from
other studies that have shown that college-age males value and trust other males more than
females in technological contexts (e.g. Joshi & Schmidt, 2006; Williams, Ogletree, Woodburn, &
116
Raffeld, 1993) and act more competitively than cooperatively in mixed-gender pairs (Valenzuela
& Raghubir, 2007).
Chat behavior The results of the chat analysis provided some additional information about the changes
in teamwork behaviors under the different conditions. These results also provide some hints
about the technological or procedural interventions that would be of aid in these stressful
circumstances.
The increase in the proportion of information requests under stress is interesting and
helps identify specific cognitive processes affected by the stress manipulation. Information
requests are typically retrospective and analytical. A high proportion of such statements suggests
that the dyad was engaging in high amounts of sensemaking behavior: “What did you send to
event number 5?” or “Do you know why we failed on that car crash event?” Such behavior
points to difficulty in attending to the details of multiple events and effectively holding them in
memory. In the stress condition, participants had to repeatedly shift their attention from the
current task to either a new incoming task or a chat message from their partner. This challenge to
attention may be interfering with the process of forming memories by limiting the amount of
attention allotted to each event. It may also be directly impacting memory formation by
interrupting the processes of consolidating and storing information after an event (Mendl, 1999).
These all suggest that tools enhancing transactive memory (Wegner, 1986) would be of great use
in distributed problem solving environments like that simulated in NeoCITIES.
The significant interaction between mood and stress on the proportion of information
transfers reveals a trend extending the sensemaking behavior just described. In this case, only

117
happy participants showed an increased proportion of information transfers under stress
(presumably in partial response to the increase in information requests), while sad participants
did not. However, the interaction between mood and stress on the total amount of
communication suggests that sad participants were sending more messages overall under stress
while happy participants sent fewer. This indicates that sad participants under stress, rather than
dwelling on the retrospective sensemaking messages, may have been sending more of the other
more immediate categories of messages: action (“you do this” or “I’m doing this”) and
coordination (“find someone to do this”). These findings point to a local “right now” focus
induced by the sad mood. This corresponds to similar findings in which individuals in sad moods
pay more attention to the trees than the forest (Derryberry & Reed, 1998; Gasper & Clore, 2002),
but in this case that phenomenon is only occurring under stress. Since happy participants were
sending fewer messages under stress than sad participants, this implies that happy participants
sustained a sense that the task was proceeding acceptably (i.e. no extra effort necessary), as
predicted by the affect-as-information perspective and demonstrated in experiments on mood and
problem solving strategies (Gasper, 2003).
EXPERIMENT TWO Experiment 2 was designed to replicate and extend experiment 1 by replacing the task
load stressor with performance pressure and introducing additional dependent measures
regarding perceived coordination and communication. This stressor did not register any
significant changes in any of the three dimensions of the SSSQ. This was somewhat surprising as
performance pressure has been successfully employed in other experiments in a similar fashion,
by convincing participants in one way or another that they had to perform well and were being
carefully monitored and evaluated (e.g. Baumeister, 1984; Beilock et al., 2004; Butler &

118
Baumeister, 1998). The chat logs repeatedly showed statements that the teams were effortfully
pursuing the goals laid out by the performance pressure stressor: “Let’s not fail this time!” and
“Let’s see if we can do a little better this time.”
However, instantiation of the performance pressure stressor in this experiment was
intended to bend, but not break (i.e. “choke”) the participants’ ability to succeed. It is
conceivable that only when the pressure is great enough to induce “choking” that participants
would begin to rate the task as stressful on one or more of the SSSQ dimensions.
Returning for a moment to the multiple stress definitions described in chapter 2, it is clear
that this stressor did not fulfill the definition prescribed by the commonly adopted transactional
model. Participants do not appear to have appraised the demands of the situation as outstripping
their ability to respond. Further pretesting of this complex stressor may have produced more
powerful results.
On the other hand, regardless of how it was perceived, the performance pressure
manipulation in this experiment did have a clearly measurable effect on task performance.
Participants were motivated to a significantly higher level of timeliness and accuracy in the
resource allocation tasks. This result accords with a definition of stress that extends Selye’s
concept of homeostasis mentioned previously which considers an event stressful “if it puts
pressure on the individual to perform more accurately or faster or differently from his normal
mode” (Solley, 1969, p. 1). Of course, it would be dangerous to begin suggesting that anything
that changes an individual’s performance is a stressor, yet in this case it seems clear that the
improvement in task performance is directly in response to the increased sense that it was very

119
important to achieve highly. Recall that all of the other task characteristics (load, complexity,
etc.) remained constant in all conditions.
Support for Hypotheses in Experiment 2
Table 16 Support of hypotheses in experiment 2
Hypothesis Supported 1) Stress impacts performance Supported
2) Stress changes mood Not supported
3) Mood impacts performance Not supported
4) Stress diminishes detection of emergent activity
Not supported; mood measures are correlated with measures of cooperation and connectedness of events
Even though the performance pressure stressor was not perceived as stressful, it did
induce a change in task performance, showing that hypothesis 1 was supported in this second
experiment. This stressor did not induce any significant change in either affect measure, nor did
either affect measure show any significant correlation with performance, eliminating any support
for hypotheses 2 and 3, respectively, as well as any mediating effect as seen in experiment 1. The
mood manipulation was just as strong as the first experiment, though, and the interaction
between the mood and stress manipulations pointed out an interesting complication with the
application of the performance pressure stressor.
In this experiment, the pressure was applied on the entire group which had to work
together and perform well in order to receive the monetary incentive. Therefore, the effects of
this stressor would be much less significant upon an individual team member who did not care
much for the team’s success or who did not believe he or she had much ability or access to make

120
a substantial difference. In contrast, an individual-level performance pressure stressor could
place personal responsibility for the team’s performance upon each participant (e.g. “Only your
score will determine the maximum score your team can receive.”). Of course, in a task involving
group communication such a premise would be impossible to maintain.
A broad team perspective is not only a good predictor of team performance, but also a
factor that significantly mediates the effect of stress upon team performance (Driskell et al.,
1999). The interaction between mood and stress seen in this experiment adds a new twist to their
finding by suggesting that the participants in sad moods lose team perspective (that is, return to a
local focus and deal with their own problems without attending to those of their teammates) and
therefore were not motivated to support their team. Only the happy participants showed a
significant jump in performance as a result of the motivation provided by performance pressure,
while the sad participants performed about the same in both high and low stress conditions.
Driskell et al. concluded that stress diminished team perspective which in turn diminished
performance; this study adds that negative affect also diminishes team perspective, of course
with the same consequences on performance. By drawing from the mediating effects observed in
experiment 1, it is proposed that the diminished team perspective Driskell et al. observed was
actually caused by the emotional consequences of their stress stimuli (auditory distraction, task
load, and time pressure). That is, those stressors (similar to those used in experiment 1 of this
study) increased negative affect, which diminished team perspective (as witnessed in experiment
2 of this study), which decreased team task performance.
Figure 23: Possible doubly mediated relationship between stress and performance

121
An alternative argument for this interaction would be the common finding that positive
moods show a coping role in managing stress. Indeed, emotion-focused forms of coping allow
for cognitive reappraisals of threats and can help change the meaning of a stressful transaction
for the better (Lazarus & Folkman, 1984). However, given that the performance pressure stressor
was not measurably perceived as a threat according to any dimensions of the SSSQ, it appears
that there would be no threat for participants to reappraise. The argument above regarding the
diminished team perspective seems much more fitting in this experiment.
Returning to the two proposed models regarding stress, mood, and performance, mood
was not observed to mediate the effect of stress upon performance in this experiment. Rather,
manipulated mood has moderated the effect of a stressor upon task performance by producing
different stress responses for happy and sad individuals. The moderator relationship between
these concepts is shown in the model in figure 8.
The only covariate with a significant effect in this experiment was conscientiousness, but
this time it was negatively correlated with performance – the opposite finding of experiment 1.
Fast-acting and impulsive teams performed better than mindful, orderly ones. The most likely
cause of this change is the accumulated task experience participants had by the time they began
the second experiment. While novice decision makers tend to use orderly and consensus-based
techniques (and successfully, as seen in experiment 1), experienced decision makers are able to
recognize cues in a scenario and immediately jump to the correct course of action, a process
known as recognition-primed decision making (RPD) (Klein, 1993). These less conscientious
individuals are more likely to have adopted RPD strategies for making decisions by the second

122
experiment, while more conscientious ones continued to tend toward more orderly and
deliberate, but slower, decision making methods.
In a task like NeoCITIES where performance is directly related to the speed at which
teams make correct resource allocation decisions, the advantages of RPD strategies are clear.
Much of RPD research investigates the actions of individual decision makers. This experiment
reveals RPD occurring at a group level, as this task requires the actions of two individuals in
distinct roles to jointly make these decisions quickly and accurately. Further studies along this
thread may expand RPD theory at the group level which is still a developing field (e.g. Hayne et
al., 2005). Additionally, as decisions are frequently made by teams rather than individuals in the
complex domains addressed by this research, more knowledge about team RPD will help
develop useful decision aids that can accommodate these disorderly-yet-effective strategies in
team decision making.
Hypothesis 4 attempted to explore one of the core goals of distributed command and
control systems, which is to facilitate synchronous (and asynchronous) situation assessment and
decision making tasks by multiple individuals with different locations, knowledge, access, and
abilities. The system must visually and conceptually help bring about a common operational
picture (McNeese et al., 2006), otherwise evidence of a complex emerging plot would simply be
anomalous pieces of knowledge distributed across multiple individuals who have little reason to
think that those pieces could belong to a single puzzle. It was disappointing to find that stress did
not affect either of the measures developed to capture the participants’ awareness of these events
as well as their perception of cooperation within their team. However, the correlations between

123
these two measures and the two mood measures that were found after additional analysis proved
to be very intriguing findings.
The inverse correlation between perceived cooperation and the NA/Anxious measure
shows that participants who exited the task with high levels of negative affect and anxiety also
felt that there were low levels of cooperation within their team. It is impossible to determine
whether one caused the other as both measures were attained from post-task surveys. Those who
finished the task with feelings of high positive affect and engagement also reported sensing more
connections between events (recall that the quantity of connected events per scenario was
constant). The analysis is unable to show whether those in happy moods had an exaggerated
sense of connections between events. That is, the elevated mood states may have led them to see
connections that were not actually present. Again, whether one caused the other would be very
interesting to know, but cannot be determined from this experiment.
It is particularly interesting that each of these two teamwork measures correlated to one
affective measure and not the other. This attests to the discriminant validity of the two mood
measures developed for this study; recall that they appear as orthogonal factors in both models of
affect. It also points out that perceived connections and coordination are associated with distinct
affective dimensions.
Without any ability to assess causes and effects, the most one could argue from these two
results is that the feeling of cooperation within a team is associated with feelings of
contentedness, calm, and being relaxed, whereas uncooperative experiences are associated with
feeling upset, distressed, hostile, and nervous. Additionally, the feelings of being excited,
enthusiastic, active, and strong, are associated with the discovery of many connections between

124
events, while teams reporting feeling tired, dull, sluggish, and lethargic do not share this
perception.
Chat Behavior Several of the effects seen on the chat variables are most likely explained by a heightened
task-focus resulting from the performance pressure stressor. Under stress, participants
communicated significantly more with each other overall, the proportion of acknowledgements
sent in response to each others messages raised to 15% from 10%, and the proportion of off-task
remarks dropped sharply from 22% to 10%. Several of the chat logs in the stress condition began
with calls for increased task-focused communication, such as “I say we announce what we are
doing so we know each thing is being taken care of” and “To get the best score let’s each say
who gets what event.”
The interaction between mood and stress on information anticipation shows a tendency
toward a convergence of behavior under the task focusing effect of performance pressure.
Without stress, happy participants were noticeably more likely to send information transfers
without waiting for information requests than sad participants. This could again be evidence of
sad mood diminishing team perspective. Sad individuals simply were not motivated to address
their teammates’ concerns until prompted to and would not speak until spoken to. The interaction
between mood and stress showed that these differences in behavior converged under the stress
condition. The performance pressure stressor overwhelmed the mood effect such that
information anticipation became approximately the same for both happy and sad participants.
This begins to indicate the scale of some of these effects and helps identify which among them
may be too minor to worry about under the stressful conditions that are of primary concern. In

125
this case, it is clear that a minor difference in behavior based on a mood state becomes negligible
when the rubber hits the road.
The drop in the proportion of action requests from 9% to 5% in the sad mood condition
returns to the diminished team perspective discussed previously. Sad participants were more
likely to concern themselves with their own tasks – a manifestation of “I’ll do my job and you do
yours.” A sad participant noticing an event that requires attention by another team member
would be more likely to leave it up to that member to find out about it, rather than make the
effort to bring it to that member’s attention. Not only does this provide additional confirmation
of the affective influences on team perspective, but it strongly recommends that distributed
command and control systems actively maintain positive linkages between team members.
Without reaffirming team cohesion, especially during frustrating or anxious conditions,
diminishing team perspective will gradually render useless the collaborative functions the system
is designed to provide.
SUMMARY OF RESULTS The proposed mediation of stress by mood was nearly demonstrated in experiment 1, but
additional studies are necessary to determine a) if this effect really does occur, and b) if so, why
is stress mediated by negative affect and anxiety but not positive affect and engagement? The
task load stressor itself significantly impacted both mood measures, but only the former
suggested the mediational relationship. If nothing else, this result attests to the discriminant
validity of the two mood measures and provides additional evidence that positive and negative
affectivity are not bipolar constructs (though in many cases they are found to behave that way).

126
Since the two experiments were identical in nearly all respects, excepting the stress
manipulation, the substantial differences in the results of the two experiments are most likely
attributed to characteristics unique to each stressor. If the performance pressure stressor may be
considered a stressor, despite the fact that it was not perceived as such by the participants, then
affect appears to mediate the effect of stress on performance for some stressors while moderating
the effects of others. On the other hand, if the performance pressure manipulation was not
extreme enough to truly induce significant stress, then an additional study with performance
pressure applied high enough to cause “choking” among participants is necessary to begin to
explore how broadly the mediational model may be applied. In fact, it would be wise to repeat
the experiment with a range of stressors, from physical ones like extremes of heat or noise, to
physiological ones such as sleep deprivation, to task-related ones like task ambiguity, and team-
based ones such as personality conflicts.
The SSSQ instrument, which captures the impacts of stress across multiple distinct
dimensions, performed usefully as a discriminatory measure of how individuals appraise
potentially stressful situations. It not only reveals whether or not a situation was stressful, as do
many task-specific or ad-hoc measures used in other studies (e.g. Braunstein-Bercovitz et al.,
2001), but it indicates how a particular situation was appraised as stressful. The appraisals
revealed by this instrument have provided descriptive profiles of various stressful situations in
this experiment and others (Helton, Fields, & Thoreson, 2005; Helton & Garland, 2006). Profiles
mapped to particular cognitive and emotional outcomes of stressful experiences could help
develop a model describing how these parameters of multiple stressful experience impact real-
world macrocognitive tasks. This would be a significant contribution on top of the array of
known microcognitive impacts of stress.

127
There were no main effects on performance from the mood manipulation in either
experiment, yet the mood states measured post-task were significantly correlated with
performance. This indicates that within-task activities had persistent and task-relevant emotional
impacts, and these impacts were, in some cases, significantly correlated with performance. So
was the mood manipulation really necessary? According to the theory of affect-as-information,
the levels-of-focus hypothesis states that the emotional impact of the manipulation should not
affect task performance to the extent that individuals realize that the induced mood is not task
relevant. As administered, the movie stimulus was purportedly not relevant to the task at hand
(participants were told it was part of another study not related to NeoCITIES), yet it did show
some significant impacts, especially the interaction seen in the second experiment in which the
induced mood diminished team perspective.
This begs the question of whether there would have been a main effect for the mood
manipulation if it had been designed and described to participants as task- or context-relevant. A
study using an off-the-shelf PC-based combat game used two war films as task-relevant stress
stimuli: one highly graphic, the other a documentary. Participants watching the graphic
(stressful) stimuli showed a significantly higher motivation to succeed and greater mission
success than participants who watched the documentary (Morris et al., 2004). Should task
relevance be deemed necessary for future NeoCITIES trials, mood manipulations could use both
documentary (neutral) and dramatized (happy or sad) accounts of emergency responses to events
such as the 9/11 attacks or hurricane Katrina.
Few conclusions can be drawn overall from the inclusion of the individual differences
variables in this study. In general, finding significant results in studies on individual differences

128
requires far greater numbers of participants than this study provided. Several of the measures
suggested by the literature do appear to be relevant to the domain and tasks of the NeoCITIES
simulation, as evidenced by the factor analysis used to determine which measures to include in
the models for each experiment. Gender mix, tolerance of ambiguity, locus of control, trait
anxiety, and conscientiousness all made it into the model in either experiment 1 or 2.
Conscientiousness was the only one to figure in both experiments, though its impact seems to
interact with task experience. Participants in experiment one, though fully trained on the task,
were essentially novices and made decisions as novices often do – carefully and considerately.
Conscientious dyads appeared to succeed by making accurate decisions, though their more
impulsive colleagues may have made faster (but inaccurate) decisions. By the second
experiment, all participants had greater experience with the NeoCITIES task which was
evidenced by their ability to make accurate decisions with less deliberation (if that was the
dyad’s tendency), and therefore resolve the emergencies more quickly.
Even though few of the individual difference measures demonstrated significant effects
in this study, it is still recommended to observe and control for their influence, especially in
exploratory studies such as this one. While traits such as neuroticism, extraversion, or tolerance
of ambiguity held clear connections to the NeoCITIES task and conditions of the experiment, the
conscientiousness finding was unexpected. In fact, its inclusion in the study was simply due to
the fact that it came along with the others in the five-factor personality model assessment
instrument (IPIP-NEO). The conflict observed between conscientiousness and group-level RPD
is a compelling finding that would have gone unnoticed without having made the effort to gather
these trait measures.

129
LIMITATIONS Several issues in the design and conduct of these experiments pose certain limitations to
the results. The last within-subjects experiment using NeoCITIES had such difficulty scheduling
teams of six undergraduate students to come to the lab – and actually having them all show up –
that the decision to have teams complete two conditions per visit was reluctantly made. The
resulting task learning effect was expected, though, and addressed to an extent by
counterbalancing conditions to the extent made possible by the experimental setup. It was
relieving to see the effect had leveled off by the second experiment. With professional or
otherwise more invested participants (such as emergency management personnel), such shortcuts
would be less necessary. An alternative would be to redesign these experiments with longer one-
shot sessions, three to four hours long, first training participants to a sufficient experience level
and then administering all four conditions in counterbalanced order. However, fatigue may
become an issue just as troublesome as the learning effect. It may also become difficult to
effectively manipulate so many mood and stress states during one contiguous session.
Effect persistence is a concern with all mood induction procedures, and this experiment
was no exception. As previously discussed, the mood manipulations were successful throughout
both experiments to the extent that participants reliably entered the NeoCITIES task in the
desired mood state. However, the effect wore off by the time the post-task surveys were
administered in both experiments. The post-task mood measurements revealed that there were
significant correlations between stress, moods, and task performance, but the antecedents of
those moods are unclear. More study is required to elicit the emotional reactions occurring
within an individual’s experience in the NeoCITIES simulation.

130
Undergraduate college students are often the most available subject pool for research
such as this, but rarely does their manner or motivation resemble members of the domain of
interest – in this case, emergency dispatch workers. The participant pool in this study was
predominantly 21 year old Caucasian males who were participating for course credit. Very few
women or persons of other races were represented. The chat transcripts occasionally revealed
that some participants were not taking the experiment seriously (e.g. “ive been drinking tequilla
all afternoon” and “let’s not submit anything n just loose…” [copied verbatim]).
On the other hand, these teams were engaged in group work in the lab and the classroom
for the duration of the semester, which stimulated team cohesion. Leveraging this advantage
further, these were all junior-level students in the same major, so most of the students were likely
to have at least some familiarity with their teammates prior to the study. Overall, these are highly
desirable characteristics of cohesive teams that are not usually found in the most common subject
pool in university research, which is the one-shot extra credit crowd who want to get it over with
and go home.
There has yet to be any formal analysis of the task difficulty in NeoCITIES according to
a standardized measure, such as NASA TLX or similar instruments. Therefore it is difficult to
say with certainty that the characteristics of these NeoCITIES scenarios resemble those in other
studies or domains simply because they have only been compared relative to other NeoCITIES
scenarios. Studies of this sort, whether testing tool efficacy or individual behaviors, benefit from
better measurement and control of the task difficulty (Greitzer & Allwein, 2005). The task pace
and load for the scenarios used in these experiments were calibrated in comparison to scenarios
utilized in prior experiments, which were calibrated via informal pretesting. Therefore it is not

131
yet clear how different scenario parameters such as pace, complexity, or ambiguity come
together to form tasks of greater or lesser difficulty. More research is required on the craft of
scenario development to better understand and quantify these parameters. This is not only to
provide better control over the stimuli provided by the scenarios but also to be able to compare
studies using the NeoCITIES task with others implementing analogous tasks.
CONTRIBUTIONS The foremost theoretical contribution of this study is the evidence found for a mediating
effect of mood on the relationship between stress and team task performance. Though continued
research is necessary to test this discovery in more detail, it was the suspicion of this very
phenomenon that served as the launching point for this program of study. To have found even
partial evidence for it is very gratifying.
Another theoretical contribution is empirical measurement of the differences in the
individual perception and impact upon task performance of two stressors common to the
domains of team decision making under stress: task load and performance pressure. This is only
scratching the surface of what remains to be tested, however. Not only are there many more
relevant stressors to explore, but the two employed in this study require recalibration and further
testing. This study only tested the presence and absence of two stressors at a one preset level
each; the impacts of the same stressors at higher or lower levels are still unknown.
This study began by holding no opinion about whether positive and negative affectivity
were bipolar or not. As it turned out, two scales emerged from the study which appeared to be
orthogonal on Watson and Tellegen’s two-factor model (which would be expected) as well as
Russell’s bipolar model (which was a surprise). It is beyond the scope of this dissertation to enter

132
into the ongoing fray of the bipolarity-of-affect debate, but multiple results found in both
experiments demonstrate that these two scales were independently measuring qualitatively
different ranges of emotions. Additional studies could be conducted solely with the purpose of
refining these scales for assessing emotional reactions in other complex tasks.
A practical contribution of this study is the development of an experimental platform
supporting rapid development of materials for testing new hypotheses regarding team-based
problem solving. All of the systems designed and integrated for this study, including delivery of
stimuli and tasks, administration of measures, and collection of data, can all be readily
reconfigured to explore new research questions in the domain of team cognition. Open-source
and platform-independent software options were chosen whenever possible with the explicit
desire to enable this platform to be deployed with the fewest restrictions on computing resources.
The goal was to develop a framework to lift NeoCITIES from its captivity in the lab of its origin
and permit its free deployment in multiple sites, simultaneously, by non-technical operators. This
goal was achieved.
In this study, the system gracefully supported interchangeable mood and stress
manipulations while collecting and backing up data with bullet-proof reliability (not a single data
point was lost due to experimenter error). The timing and structure of the experimental sessions
were consistent and continuous from start to finish with little intervention required by the
experimenter. Where possible, transitions from one phase to the next were automated and
synchronized. These features all aimed to eliminate as much inconsistency, complexity, and
uncertainty as possible from the challenging task of running multiple-subject experiments.

133
Lastly, the chat logs collected in this study provided a wealth of information previously
unrecorded in NeoCITIES experiments. On the surface, these logs seemed to contain mostly
trivial and off-task messages as one might expect from undergraduate college students. However,
after analysis, they revealed clear demonstrations of focused problem solving and sensemaking
behaviors. The analysis also showed how the mood and stress manipulations altered how
individuals interacted within their teams. The data collection and coding techniques developed
for this study are an additional contribution to future studies on teams using NeoCITIES and
similar simulations.
FUTURE WORK The successor to NeoCITIES 1.4 has been in development for approximately 18 months
and is about to enter usability testing. NeoCITIES 2.0 maintains the Java-based server engine of
its predecessor, but is redeployed as a Web application. The Java client has been completely
replaced with a new user interface designed in Adobe Flex, a cross-platform and open-source
rich internet application platform based on the ubiquitous Flash player. The client is accessed via
any Web browser on any device with the free Flash plugin installed (this means virtually all
desktop and portable computers). Therefore, no software is installed on the client end; the client
simply visits a URL to connect to the simulation. The end-user experience is guaranteed to be
uniform regardless of which browser or operating system is in use. This eliminates the need for
programmers to develop multiple solutions for multiple platforms, which allows for that energy
to be expended instead in more innovative directions.
Development in Flex permits the rapid prototyping of rich visualization methods and
novel tools for communication and collaboration. In development now are tools for graphically
annotated chat (which allows users to share shapes drawn on their personal map with other users

134
by attaching the shape to a chat message) and selective map layering options drawing from
powerful geographic information systems (GIS). Upcoming experiments will test the efficacy of
these tools individually and in combination with each other. This Web-based task can be easily
integrated into the experimental platform designed for the current study to explore the
interactions of mood and stress with such tools. Does annotated chat mitigate the effects of a
time pressure stressor on team performance? Does the utilization of layer filtering options
change under different mood states? These questions and more can be pursued by integrating the
new NeoCITIES task with the current experimental platform.
The communications variables derived from the chat data provided valuable insight into
the team processes involved in the NeoCITIES task. However, these variables were only used as
dependent measures in these experiments. It is quite possible that certain communication
behaviors could predict task successes or failures. Therefore, additional data analysis will be
performed soon to determine which, if any, communication variables are correlated with
performance. If any such relationships are found, continued analysis may reveal whether any of
these communication measures mediate the effects of stress upon performance. An
oversimplified example for demonstration’s sake might be that a time pressure stressor would
appear to be decreasing performance. A possible mediating relationship could be that the stressor
was causing a drop in the number of messages sent and the decreased communication was
causing the drop in performance. This is an exciting prospect for secondary analysis of this
study’s data.
This study evaluated all variables at the dyad level. The scores were achieved by the
work of both individuals in the dyad; there is no individual score in this version of NeoCITIES.

135
The individual differences measures and individually reported mood and stress measurements
were averaged to create dyad-level measures in the analysis. However, there are multiple levels
of analysis of interest in this research including individual, small group (dyad), and large group
(team). There are individual-level performance variables that were not analyzed in this
experiment. These include logs of the different types of errors committed which are unique to
each role within the dyad. Analysis of these errors may help distinguish each individual’s
contribution to the dyad’s performance.
Coming from the other direction, hierarchical linear modeling is a method for
understanding the effect of group membership upon individual group members. For example,
such analysis is used to measure the efficacy of school testing methods when individual
measurements (students) are nested in groups (classrooms), which could also be nested at
another level (schools). Students in different classrooms with different teachers cannot all be
directly compared without accounting for the effect the teacher has on the population of his or
her classroom. Likewise, in this study, since the teams worked together all semester long both in
the classroom and the lab, it is highly reasonable to believe that there could be a significant
group-level effect that explains some of the variation between measurements of dyads taken in
the lab. This type of analysis is complex and requires high numbers of individuals and groups to
arrive at significant results. However, the relevance of such multilevel analyses cannot be
ignored in the context of team-based tasks where group membership is a significant factor and
individual members have unique contributions toward common goals. Future studies will aim for
opportunities to incorporate these analytic techniques.

136
Lastly, another method in which to study the effects of individual traits and
characteristics is to use them for assignment to conditions in experiments like the ones just
completed. For example, teams of high trait anxious individuals could be compared to teams of
low trait anxiety. Alternatively, teams could be deliberately composed of high and low pairs (i.e.
extraverted information managers and introverted resources managers) to see whether some traits
balance out between the two, or whether complete dysfunction ensues. This method provides a
more direct route to assessing the roles of individual differences, but the fact remains that, in
general, the odds are that most real teams will have a random helping of these traits. However,
certain job descriptions attract certain personality types. What would a battery of personality
profiles reveal about the typical employees of an emergency dispatch center? Are there particular
traits that are either helping or hindering teamwork in these contexts? It is these questions that
could be addressed by using individual differences as a selection technique.
PRACTICAL APPLICATIONS The findings of this study provide a more detailed explanation of the collective
relationships between specific components of stress, mood, and performance than is evident from
previous research on these components in isolation. Further exploration of these results,
particularly in experiments applying these same manipulations against specific tools or problem
solving methods, may also point toward procedural or technological interventions for addressing
these phenomena in real-world contexts.
In organizational contexts, when the specific mechanisms by which stress affects
performance are identified, there are five approaches for applying these findings (Yates et al.,
1995):
1. Eliminate or weaken the stressor.

137
2. Reduce stress reactions by system operators. 3. Select operators who are resistant or immune to the stressor 4. Train operators to function effectively under stress. 5. Stress-proof the system by designing features and procedures that achieve system goals
despite the stress upon system operators.
Each of these approaches has its advantages and disadvantages. Approaches 1 and 2 are
among the most commonly used: identify and remove the stressor from the environment, and/or
diminish the impact of the stressor upon operators. Approach 3 is challenging from a human-
resources perspective, given the limitations of an available pool of candidates, as well as the
difficulty and expense in accurately assessing a potential hire’s reactions to the anticipated
stressors. Approach 4 has found support in the use of preparatory information (Inzana, Driskell,
Salas, & Johnston, 1996) and stress inoculation training (Saunders, Driskell, Johnston, & Salas,
1996). The latter is a method analogous to inoculations against a disease, pre-exposing operators
to anticipated stressors in order to build up a resistance to them. Approach 5 takes a human
factors perspective to develop and test specific design interventions that increase the stress-
immunity of the system. To be effective, this approach requires fine-grained analysis, as
provided by this study, of the unique interactions between stressors, affective states, and
cognitive processes.
In this study, certain findings point directly to design guidelines for addressing some of
the changes in user behavior observed under these different mood and stress conditions. The
effect of negative affect diminishing team perspective indicates that system designers need to
make sure collaborative systems reemphasize the existence and activities of other team members
especially when task conditions are at their worst. The challenges observed in attending to and
recalling information under stress as a group point to the need for tools supporting shared

138
memory and the exchange of knowledge from the working memory of one team member to
another.
Further developments in these areas have multiple practical applications for collaborative
systems. In the context of CSCW for real-time problem solving, individuals are generally
required to devote their attention to a locally focused task (such as analyzing an image or sending
a message) while also attending to global details of situational awareness (such as position or
status of other team members, or incoming information). Armed with knowledge of how certain
characteristics of working environments (such as stressors) can disrupt these macrocognitive
tasks, developers can design tools that address those problems. As an example, one study
assessing how transparency levels permitted simultaneous foreground and background attention
demonstrated limited success (Harrison, Kurtenbach, & Vicente, 1995). Future practical
developments are likely to come from a combination of novel technological approaches with
improved understandings of the interactions between stressful environments, individual
emotions, and distributed cognition.
Applications of these findings will prove valuable to many command and control
contexts, including emergency management centers, air traffic control, entities such as the
Department of Homeland Security (DHS) who are responsible for managing complex terrorist or
humanitarian crises, and the Department of Defense (DOD) C4ISR infrastructure (Command,
Control, Communications, Computers, Intelligence, Surveillance, and Reconaissance).

139
REFERENCES
Ahn, H., & Picard, R. W. (2006). Affective cognitive learning and decision making: The role of emotions. Proceedings of the 18th European Meeting on Cybernetics and Systems Research (EMCSR 2006).
Aldwin, C. M. (1994). Stress, coping, and development: An integrative perspective. New York: The Guilford Press.
Axelrod, R. (1980). Effective choice in the prisoner's dilemma. The Journal of Conflict Resolution, 24(1), 3-25.
Baron, R. M., & Kenny, D. A. (1986). The moderator-mediator variable distinction in social psychological research: Conceptual, strategic, and statistical considerations. Journal of Personality and Social Psychology, 51(6), 1173-1182.
Baumeister, R. R. F. (1984). Choking under pressure: self-consciousness and paradoxical effects of incentives on skillful performance. Journal of Personality and Social Psychology, 46(3), 610-620.
Beck, A. T., Steer, R. A., & Carbin, M. G. (1988). Psychometric properties of the Beck Depression Inventory: Twenty-five years of evaluation. Clinical Psychology Review, 8(1), 77-100.
Beilock, S. L., Kulp, C. A., Holt, L. E., & Carr, T. H. (2004). More on the fragility of performance: Choking under pressure in mathematical problem solving. Journal of Experimental Psychology: General, 133(4), 584-600.
Bernard, C. (1961). An introduction to the study of experimental medicine. New York: Collier.
Bolia, R. S., & Nelson, W. T. (2007). Characterizing team performance in network-centric operations: Philosophical and methodological issues. Aviation, Space, and Environmental Medicine, 78, B71-B76.
Bootzin, R. B., & Max, D. (1981). Learning and behavioral theories. In I. L. Kutasch & L. B. Schlesinger (Eds.), Handbook of stress and anxiety. San Francisco: Jossey-Bass Publishers.
Boss, P. (1987). Family stress. In M. B. Sussman & S. K. Steinmetz (Eds.), Handbook of marriage and the family (pp. 835-859). New York: Plenum Press.
Bowers, C. A., Weaver, J. L., & Morgan, B. B. (1996). Moderating the performance effects of stressors. In Stress and human performance (pp. 163-192). Mahwah, NJ: Lawrence Erlbaum Associates.
Brannick, M. T., & Prince, C. (1997). An overview of team performance and measurement. In M. T. Brannick, E. Salas & C. Prince (Eds.), Team performance assessment and measurement : Theory, methods, and applications (pp. 3-16). Mahwah, N.J.: Lawrence Erlbaum Associates.
Braunstein-Bercovitz, H. (2003). Does stress enhance or impair selective attention? The effects of stress and perceptual load on negative priming. Anxiety, Stress & Coping, 16(4), 345-357.

140
Braunstein-Bercovitz, H., Dimentman-Ashkenazi, I., & Lubow, R. E. (2001). Stress affects the selection of relevant from irrelevant stimuli. Emotion, 1(2), 182-192.
Brehmer, B., & Dörner, D. (1993). Experiments with computer-simulated microworlds: Escaping both the narrow straits of the laboratory and the deep blue sea of the field study. Computers in Human Behavior, 9, 171-184.
Broadbent, D. E., & Gath, D. (1981). Ill-health on the line: Sorting out myth from fact. Employment Gazette(March), 157-160.
Butler, J. L., & Baumeister, R. F. (1998). The trouble with friendly faces: Skilled performance with a supportive audience. Journal of Personality and Social Psychology, 75(5), 1213-1230.
Cacciabue, P. C., & Hollnagel, E. (1995). Simulation of cognition: Applications. In J. M. Hoc, P. C. Cacciabue & E. Hollnagel (Eds.), Expertise and technology: Cognition and human-computer cooperation (pp. 55-73): Lawrence Erlbaum Associates.
Cannon-Bowers, J. A., & Salas, E. (1998). Individual and team decision making under stress: Theoretical underpinnings. In J. A. Cannon-Bowers & E. Salas (Eds.), Making decisions under stress (pp. 17-38). Washington, D.C.: American Psychological Association.
Cannon, W. B. (1929). Bodily changes in pain, hunger, fear, and rage (2nd ed.). New York: Appleton.
Cassidy, T. (1999). Stress, cognition, and health. New York: Routledge.
Cavallo, D. A., & Pinto, A. (2001). Effects of mood induction on eating behavior and cigarette craving in dietary restrainers. Eating Behaviors, 2(2), 113-127.
Cerbone, F. G., & Larison, C. L. (2000). A bibliographic essay: The relationship between stress and substance use. Substance Use & Misuse. Special Issue: Stress and Substance Use, 35(5), 757-786.
Christine L. Sheppard-Sawyer, R. J. M. J. H. F. (2000). Film-induced sadness as a trigger for disinhibited eating. International Journal of Eating Disorders, 28(2), 215-220.
Collyer, S. C., & Malecki, G. S. (1998). Tactical decision making under stress: History and overview. In J. A. Cannon-Bowers & E. Salas (Eds.), Making decisions under stress (pp. 3-15). Washington, D.C.: American Psychological Association.
Connors, E. S. (2006). Intelligent group interfaces: Envisioned designs for exploring team cognition in emergency crisis management. Ph.D. dissertation, The Pennsylvania State University, University Park, PA. Retrieved August 24, 2007, from ProQuest Digital Dissertations database. (Publication No. AAT 3231819).
Cooke, N. J., Salas, E., Kiekel, P. A., & Bell, B. (2004). Advances in measuring team cognition. In E. Salas & S. M. Fiore (Eds.), Team cognition: Understanding the factors that drive process and performance. Washington, DC: American Psychological Association.
Cooper, C. L., Dewe, P. J., & O'Driscoll, M. P. (2001). Organizational stress: A review and critique of theory, research, and applications. Thousand Oaks, CA: Sage Publications.
141
Cropanzano, R., Weiss, H. M., Hale, J. M. S., & Reb, J. (2003). The structure of affect: Reconsidering the relationship between negative and positive affectivity. Journal of Management, 29(6), 831-857.
Curran, S. L., Andrykowski, M. A., & Studts, J. L. (1995). Short form of the Profile of Mood States(POMS-SF): Psychometric information. Psychological assessment, 7(1), 80-83.
Derryberry, D., & Reed, M. A. (1997). Anxiety and attentional focusing: trait, state, and hemispheric influences. Personality and Individual Differences(25), 745-761.
Derryberry, D., & Reed, M. A. (1998). Anxiety and attentional focusing: Trait, state, and hemispheric influences. Personality and Individual Differences, 25(4), 745-761.
Derryberry, D., & Reed, M. A. (2002). Anxiety-related attentional biases and their regulation by attentional control. Journal of Abnormal Psychology, 111(2), 225-236.
Dickey, M. D. (2005). Engaging by design: How engagement strategies in popular computer and video games can inform instructional design. Educational Technology Research and Development, 53(2), 67-83.
Diener, E., & Diener, C. (1996). Most people are happy. Psychological Science, 7(3), 181-185.
Digman, J. M. (1990). Personality structure: Emergence of the five-factor model. Annual Review of Psychology, 41(1), 417-440.
Driskell, J. E., & Salas, E. (1991). Group decision making under stress. Journal of Applied Psychology, 76(3), 473-478.
Driskell, J. E., Salas, E., & Johnston, J. H. (1999). Does stress lead to a loss of team perspective? Group Dynamics: Theory, Research, and Practice, 3(4), 291-302.
Easterbrook, J. J. A. (1959). The effect of emotion on cue utilization and the organization of behavior. Psychological Review, 66(3), 183-201.
Elster, J. (1985). Sadder but wiser? Rationality and the emotions. Social Science Information, 24(2), 375.
Entin, E. E., & Entin, E. B. (2001). Measures for evaluation of team processes and performance in experiments and exercises. Procedings of the 6th International Command and Control Research and Technology Symposium, Annapolis, Maryland, 19-21.
Everly, G. S., Jr., & Sobelman, S. A. (1987). Assessment of the human stress response. New York: AMS Press.
Fisher, S. (1984). Stress and the perception of control. London: Lawrence Erlbaum Associates, Ltd.
Fogarty, W. M. (1988). Investigation report: Formal investigation into circumstances surrounding the downing of Iran air flight 655 on 3 July 1998: Washington, DC: US Department of Defense.
Folkman, S., & Moskowitz, J. T. (2000). Positive affect and the other side of coping. American Psychologist, 55(6), 647-654.

142
Forgas, J. P., & Moylan, S. (1987). After the movies: transient mood and social judgments. Personality and Social Psychology Bulletin, 13(4), 467-477.
Gasper, K. (2003). When necessity is the mother of invention: Mood and problem solving. Journal of Experimental Social Psychology, 39(3), 248-262.
Gasper, K. (2004). Do you see what I see? Affect and visual information processing. Cognition and Emotion, 18(3), 405-421.
Gasper, K., & Clore, G. L. (2002). Attending to the big picture: Mood and global versus local processing of visual information. Psychological Science, 13(1), 34-40.
Goldberg, L. R., Johnson, J. A., Eber, H. W., Hogan, R., Ashton, M. C., Cloniger, C. R., et al. (2006). The international personality item pool and the future of public-domain personality measures. Journal of Research in Personality, 40, 84-96.
Göritz, A. S., & Moser, K. (2006). Web-based mood induction. Cognition & Emotion, 20(6), 887-896.
Gray, W. D. (2002). Simulated task environments: The role of high-fidelity simulations, scaled worlds, synthetic environments, and microworlds in basic and applied cognitive research. Cognitive Science Quarterly 2(2), 205-227.
Greitzer, F. L., & Allwein, K. (2005). Metrics and measures for intelligence analysis task difficulty. Panel Session, 2005 International Conference on Intelligence Analysis Methods and Tools. Vienna, VA, May, 2-5.
Hammond, K. R. (2000). Judgments under stress. New York: Oxford University Press.
Hancock, P. A. (1986). Sustained attention under thermal stress. Psychological Bulletin, 99(2), 263-281.
Harrison, B. L., Kurtenbach, G., & Vicente, K. J. (1995). An experimental evaluation of transparent user interface tools and information content. Proceedings of the 8th annual ACM symposium on user interface and software technology, 81-90.
Hart, S. G., & Staveland, L. E. (1988). Development of NASA-TLX (Task Load Index): Results of empirical and theoretical research. In P. A. Hancock & N. Meshkati (Eds.), Human mental workload (Vol. 1, pp. 239-350). Amsterdam: North Holland Press.
Hayne, S. C., Smith, C. A. P., & Vijayasarathy, L. (2005). Team pattern recognition: Sharing cognitive chunks under time pressure. Procedings of the 38th Annual Hawaii International Conference on System Sciences, 1-10.
Helton, W. S. (2004). Validation of a short stress state questionnaire. Proceedings of the Human Factors and Ergonomics Society, 48, 1238-1242.
Helton, W. S., Fields, D., & Thoreson, J. A. (2005). Assessing daily stress with the Short Stress State Questionnaire (SSSQ): Relationships with cognitive slips-failures. Proceedings of the Human Factors and Ergonomics Society 49, 886-890.

143
Helton, W. S., & Garland, G. (2006). Short stress state questionnaire: Relationships with reading comprehension and land navigation. Proceedings of the Human Factors and Ergonomics Society 50, 1731-1735.
Hilgard, E. R. (1980). The trilogy of mind: cognition, affection, and conflation. Journal of the History of the Behavioral Sciences, 16(2), 107-117.
Hollan, J., Hutchins, E., & Kirsh, D. (2000). Distributed cognition: Toward a new foundation for human-computer interaction research. ACM Transactions on computer-human interaction, 7(2), 174-196.
Horowitz, M., Wilner, N., & Alvarez, W. (1979). Impact of Event Scale: a measure of subjective stress. Psychosomatic Medicine, 41(3), 209-218.
Hudlicka, E. (2003). To feel or not to feel: The role of affect in human–computer interaction. International Journal of Human-Computer Studies, 59(1-2), 1-32.
Inzana, C. M., Driskell, J. E., Salas, E., & Johnston, J. H. (1996). Effects of preparatory information on enhancing performance under stress. Journal of Applied Psychology, 81(4), 429-435.
Jones, R. E. T. (2006). The development of an emergency crisis management simulation to assess the impact a fuzzy cognitive map decision-aid has on team cognition and team decision-making. Ph.D. dissertation, The Pennsylvania State University, University Park, PA. Retrieved August 24, 2007, from ProQuest Digital Dissertations database. (Publication No. AAT 3231841).
Jones, R. E. T., McNeese, M. D., Connors, E. S., Jefferson, T., & Hall, D. L. (2004). A distributed cognition simulation involving homeland security and defense: The development of NeoCITIES. Procedings of the 48th Annual Meeting of the Human Factors and Ergonomics Society, Santa Monica, CA, 631-634.
Joshi, K. D., & Schmidt, N. L. (2006). Is the information systems profession gendered? Characterization of IS professionals and IS career. ACM SIGMIS Database, 37(4), 26-41.
Kahneman, D. (1973). Attention and effort. Englewood Cliffs, NJ: Prentice-Hall
Kapoor, A., Burleson, W., & Picard, R. W. (2007). Automatic prediction of frustration. International Journal of Human-Computer Studies, 65(8), 724-736.
Kapoor, A., Qi, Y., & Picard, R. W. (2003). Fully automatic upper facial action recognition. Procedings of the IEEE International Workshop on Analysis and Modeling of Faces and Gestures (AMFG’03), 195-202.
Keane, T. M., Fairbank, J. A., Caddell, J. M., Zimmering, R. T., Taylor, K. L., & Mora, C. A. (1989). Clinical evaluation of a measure to assess combat exposure. Psychological Journal of Consulting and Clinical Psychology, 1(1), 53-55.
Keinan, G. (1987). Decision making under stress: Scanning of alternatives under controllable and uncontrollable threats. Journal of Personality and Social Psychology, 52(3), 639-644.
Keinan, G., Friedland, N., Kahneman, D., & Roth, D. (1999). The effect of stress on the suppression of erroneous competing responses. Anxiety, Stress & Coping, 12(3), 455-476.

144
Kerr, N. L., Aronoff, J., & Messé, L. A. (2000). Methods of small group research. In H. T. Reis & C. M. Judd (Eds.), Handbook of research methods in social and personality psychology (pp. 160-189). Cambridge, UK: Cambridge University Press.
Kirschbaum, C., Pirke, K. M., & Hellhammer, D. H. (1993). The "Trier Social Stress Test"--A tool for investigating psychobiological stress responses in a laboratory setting. Neuropsychobiology, 28(1-2), 76-81.
Klein, G. A. (1993). A recognition-primed decision (RPD) model of rapid decision making. In G. A. Klein, J. Orasanu, R. Calderwood & C. E. Zsambok (Eds.), Decision making in action: Models and methods (pp. 138-147). Norwood, NJ: Ablex.
Klein, G. A. (1998). Sources of power: How people make decisions. Cambridge, MA: MIT Press.
Lazarus, R. S. (1991). Emotion and adaptation. New York: Oxford University Press.
Lazarus, R. S. (1993). From psychological stress to the emotions: A history of changing outlooks. Annual Review of Psychology, 44, 1-21.
Lazarus, R. S. (1999). Stress and emotion: A new synthesis. New York: Springer.
Lazarus, R. S. (2003). Does the positive psychology movement have legs? Psychological Inquiry, 14(2), 93.
Lazarus, R. S., & Folkman, S. (1984). Stress, appraisal, and coping. New York: Springer
Lefcourt, H. M. (1981). The construction and development of the multidimensional–multiattributional causality scales. In H. M. Lefcourt (Ed.), Research with the locus of control construct (Vol. 1: Assessment methods, pp. 245-261). New York: Academic Press.
Littell, R. C., Milliken, G. A., Stroup, W. W., Wolfinger, R. D., & Schabenberger, O. (2006). SAS for mixed models (2nd ed.). Cary, NC: SAS Institute, Inc.
Mace, W. M. (1977). James J. Gibson’s strategy for perceiving: Ask not what’s inside your head, but what your head’s inside of. In R. Shaw & J. Bransford (Eds.), Perceiving, acting, and knowing: Toward an ecological psychology (pp. 43-65). Hillsdale, NJ: Erlbaum.
Marteau, T. M., & Bekker, H. (1992). The development of a six-item short-form of the state scale of the Spielberger State-Trait Anxiety Inventory (STAI). The British Journal of Clinical Psychology, 31(3), 301-306.
Mathews, A., May, J., Mogg, K., & Eysenck, M. (1990). Attentional bias in anxiety: Selective search or defective filtering? Journal of Abnormal Psychology, 99(2), 166-173.
Matthews, G., Campbell, S. E., Falconer, S., Joyner, L. A., Huggins, J., Gilliland, K., et al. (2002). Fundamental dimensions of subjective state in performance settings: task engagement, distress, and worry. Emotion, 2(4), 315-340.
Matthews, G., Dorn, L., & Glendon, A. I. (1991). Personality correlates of driver stress. Personality and Individual Differences, 12(6), 535-549.

145
McLain, D. L. (1993). The MSTAT-I: A new measure of an Individual's tolerance for ambiguity. Educational and Psychological Measurement, 53(1), 183.
McNeese, M. D., Bains, P., Brewer, I., Brown, C., Connors, E. S., Jefferson, T., et al. (2005). The NeoCITIES simulation: Understanding the design and experimental methodology used to develop a team emergency management simulation. Proceedings of the 49th Annual Meeting of the Human Factors and Ergonomics Society 591-594.
McNeese, M. D., Pfaff, M. S., Connors, E. S., Obieta, J., Terrell, I. S., & Friedenberg, M. A. (2006). Multiple vantage points of the common operational picture: Supporting complex teamwork. Procedings of the 50th Annual Meeting of the Human Factors and Ergonomics Society, San Francisco, CA.
Meehan, M., Insko, B., Whitton, M., & Brooks Jr., F. P. (2002). Physiological measures of presence in stressful virtual environments. ACM Transactions on Graphics, 21(3), 645-652.
Mendl, M. (1999). Performing under pressure: Stress and cognitive function. Applied Animal Behaviour Science, 65(3), 221-244.
Minsky, M. (2006). The emotion machine: Commonsense thinking, artificial intelligence, and the future of the human mind. New York: Simon and Schuster.
Mogg, K. K., Mathews, A. A., Bird, C. C., & Macgregor-Morris, R. R. (1990). Effects of stress and anxiety on the processing of threat stimuli. Journal of Personality and Social Psychology, 59(6), 1230-1237.
Morris, C. S., Hancock, P. A., & Shirkey, E. C. (2004). Motivational effects of adding context relevant stress in PC-based game training. Military Psychology, 16(2), 135-147.
Myers, I. B., McCaulley, M. H., Quenk, N. L., & Hammer, A. L. (1998). The MBTI® manual: A guide to the development and use of the Myers-Briggs Type Indicator. Palo Alto, CA: Consulting Psychologists Press.
Norman, D. A., Ortony, A., & Russell, D. M. (2003). Affect and machine design: Lessons for the development of autonomous machines. IBM Systems Journal, 42(1), 38-44.
Orasanu, J., & Connolly, T. (1993). The reinvention of decision making. In G. A. Klein, J. Orasanu, R. Calderwood & C. E. Zsambok (Eds.), Decision making in action: Models and methods (pp. 3-20). Norwood, NJ: Lawrence-Erlbaum Associates.
Parkes, K. R. (1980). Occupational stress among student nurses: 1. A comparison of medical and surgical wards. Nursing Times, 76(25), 113-116.
Partala, T., & Surakka, V. (2004). The effects of affective interventions in human–computer interaction. Interacting with Computers, 16(2), 295-309.
Perrow, C. (1984). Normal accidents: Living with high-risk technologies. New York: Basic Books.
Russell, J. A. (2003). Core affect and the psychological construction of emotion. Psychological Review, 110(1), 145-172.

146
Russell, J. A., & Carroll, J. M. (1999). On the bipolarity of positive and negative affect. Psychological Bulletin, 125(1), 3-30.
Salas, E., Cannon-Bowers, J. A., & Johnston, J. H. (1998). Lessons learned from conducting the TADMUS program: Balancing science, practice, and more. In J. A. Cannon-Bowers & E. Salas (Eds.), Making decisions under stress (pp. 409-413). Washington, D.C.: American Psychological Association.
Salas, E., Driskell, J. E., & Hughes, S. (1996). The study of stress and human performance. In J. E. Driskell & E. Salas (Eds.), Stress and human performance (pp. 1-45). Mahwah, N.J.: Lawrence Erlbaum Associates.
Saunders, T., Driskell, J. E., Johnston, J. H., & Salas, E. (1996). The effect of stress innoculation training on anxiety and performance. Journal of Occupational Health Psychology, 1(2), 170-186.
Schachter, S., & Singer, J. (1962). Cognitive social and physiological determinants of emotional state. Psychological Review, 69, 379-399.
Schwarz, N., & Clore, G. L. (1996). Feelings and phenomenal experiences. In E. T. Higgins (Ed.), Social psychology: A handbook of basic principles (pp. 433-465). New York: Guilford Press.
Selye, H. (1956). The stress of life. New York: McGraw-Hill.
Serfaty, D., Entin, E. E., & Johnston, J. H. (1998). Team coordination training. In J. A. Cannon-Bowers & E. Salas (Eds.), Making decisions under stress (pp. 409-413). Washington, D.C.: American Psychological Association.
Sjöberg, L., & Olsson, G. (1981). Volitional problems in carrying through a difficult decision: the case of drug addiction. Drug and Alcohol Dependence, 7(2), 177-191.
Smith, C. P. (2000). Content analysis and narrative analysis. In H. T. Reis & C. M. Judd (Eds.), Handbook of research methods in social and personality psychology (pp. 313-335). Cambridge, UK: Cambridge University Press.
Smith, R. H., Parrott, W. G., Diener, E. F., Hoyle, R. H., & Kim, S. H. (1999). Dispositional envy. Personality & Social Psychology Bulletin, 25(8), 1007-1020.
Solley, C. M. (1969). Effects of stress on perceptual attention. In B. P. Rourke (Ed.), Explorations in the psychology of stress and anxiety (pp. 1-14). Don Mills, Canada: Longmans Canada Ltd.
Spielberger, C. D. (1983). Manual of the State-Trait Anxiety Inventory, form Y. Palo Alto, CA: Consulting Psychologists Press.
Spielberger, C. D. (1988). Manual for the State-Trait Anger Expression Inventory (STAXI). Odessa, FL: Psychological Assessment Resources.
Spielberger, C. D., Gorsuch, R. L., & Lushene, R. E. (1970). Manual for the State-Trait Anxiety Inventory. Palo Alto, CA: Consulting Psychologists Press.
Staw, B. M., Sandelands, L. E., & Dutton, J. E. (1981). Threat-rigidity effects in organizational behavior: A multi-level analysis. Administrative Science Quarterly, 26(4), 501-524.

147
Stone, A. A., & Shiffman, S. (1994). Ecological momentary assessment (EMA) in behavioral medicine. Annals of Behavioral Medicine, 16(3), 199–202.
Sun, H., & Zhang, P. (2006). The Role of Affect in IS Research: A Critical Survey and a Research Model. In P. Zhang & D. Galletta (Eds.), HCI and MIS (I): Foundations (Vol. 5). Armonk, NY: M. E. Sharpe.
Sundar, S. S., & Kalyanaraman, S. (2004). Arousal, memory, and impression-formation effects of animation speed in web advertising. Journal of Advertising, 33(1), 7-17.
Sundar, S. S., & Wagner, C. B. (2002). The world wide wait: Exploring physiological and behavioral effects of download speed. Media Psychology, 4(2), 173-206.
Terrell, I. S., McNeese, M. D., & Jefferson, T. (2004). Exploring cognitive work within a 911 dispatch center: Using complementary knowledge elicitation techniques. Proceedings of the 48th Annual Meeting of the Human Factors and Ergonomics Society, 605-609.
Valenzuela, A., & Raghubir, P. (2007). The role of strategy in mixed-gender group interactions: A study of the television show “The Weakest Link”. Sex Roles, 57(3), 293-303.
Van Tilburg, M. A. L., & Vingerhoets, A. J. J. M. (2002). The effects of alcohol on mood induced by an emotional film: A study among women. Journal of Psychosomatic Research, 53(3), 805-809.
Wang, L., LaBar, K. S., & McCarthy, G. (2006). Mood alters amygdala activation to sad distractors during an attentional task. Biological Psychiatry, 60(10), 1139-1146.
Watson, D., & Clark, L. A. (1997). Measurement and mismeasurement of mood: Recurrent and emergent issues. Journal of Personality Assessment, 68(2), 267-296.
Watson, D., Clark, L. A., & Tellegen, A. (1988). Development and validation of brief measures of positive and negative affect: The PANAS scales. Journal of Personality and Social Psychology, 54(6), 1063-1070.
Watson, D., & Tellegen, A. (1985). Toward a consensual structure of mood. Psychological bulletin, 98(2), 219-235.
Weaver, J. L., Bowers, C. A., & Salas, E. (2001). Stress and teams: Performance effects and interventions. In P. A. Hancock & P. A. Desmond (Eds.), Stress, workload, and fatigue (pp. 83-106). Mahwah, NJ: L. Erlbaum.
Wegner, D. M. (1986). Transactive memory: A contemporary analysis of the group mind. In B. Mullen & G. R. Geothals (Eds.), Theories of group behavior (pp. 185-208). New York: Springer-Verlag.
Wellens, A. R., & Ergener, D. (1988). The C.I.T.I.E.S. game: A computer-based situation assessment task for studying distributed decision making. Simulation & Games, 19(3), 304-327.
Westermann, R., Spies, K., Stahl, G., & Hesse, F. W. (1996). Relative effectiveness and validity of mood induction procedures: a meta-analysis. European Journal of Social Psychology, 26(4), 557-580.
Wickens, C. D. (1992). Engineering psychology and human performance (2nd ed.). New York: Harper Collins.
148
Williams, S. W., Ogletree, S. M., Woodburn, W., & Raffeld, P. (1993). Gender roles, computer attitudes, and dyadic computer interaction performance in college students. Sex Roles, 29(7), 515-525.
Yates, J. F., Klatzky, R. L., & Young, C. A. (1995). Cognitive performance under stress. In R. S. Nickerson (Ed.), Emerging needs and opportunities for human factors research (pp. 262-290). Washington, D.C.: National Academies Press.
Yerkes, R. M., & Dodson, J. D. (1908). The relation of strength of stimulus to rapidity of habit-formation. Journal of Comparative Neurology and Psychology, 18(5), 459-482.
Yik, M. S. M., Russell, J. A., & Feldman Barrett, L. (1999). Structure of self-reported current affect: Integration and beyond. Journal of Personality and Social Psychology, 77(3), 600-619.
Yuen, K. S. L., & Lee, T. M. C. (2003). Could mood state affect risk-taking decisions? Journal of Affective Disorders, 75(1), 11-18.
Zajonc, R. B. (1965). Social facilitation. Science, 149(3681), 269-274.
Zajonc, R. B. (1984). On the primacy of affect. The American Psychologist, 39(2), 117.
Zautra, A. J., Reich, J. W., Davis, M. C., Potter, P. T., & Nicolson, N. A. (2000). The role of stressful events in the relationship between positive and negative affects: Evidence from field and experimental studies. Journal of Personality, 68(5), 927-951.

149
APPENDIX A: SURVEY ITEMS
PRE-TASK SURVEY The pre-task survey contained questions regarding the visual communications portion of the study (i.e. watching the movie clips). Section 1 of this survey contained four movie-specific questions. Section 2 contained self-report mood and stress items. All questions were presented in a randomized order. The forms below are not formatted exactly as they appeared on screen to participants (see screenshots in Appendix C).
Section 1
This section consists of a number of specific questions about the movie. Read each statement and then select the correct answer.
Why was winning the ticket the best thing that happened to Jack?
He had never travelled before
He got to meet Rose
He escaped from his family
He was getting a fresh start
Jack tells Rose she will die an old woman in her:
Rocking chair
Sleep
Home
Bed
Why are the rowers instructed to be careful with their oars?
To not make too much noise
To go very slowly
To not splash too much
To not hit the bodies
Jack tells Rose that the delay in their rescue is because:
They are getting the boats organized
There weren't enough boats
The boats aren't big enough
The boats move too slowly

150
Section 2
Read each statement and then select the most appropriate answer to indicate how you feel right now, at the present moment. Do not spend too much time on any one statement. Use the following scale to indicate your answers:
1. Very slightly or not at all 2. A little 3. Moderately 4. Quite a bit 5. Extremely
1 Not at all
2 A little
3 Moderately
4 Quite a bit
5 Extremely
I feel upset I feel concerned about the impression I am making
I feel this movie clip was funny I am relaxed I feel sad I feel distressed I feel jittery I feel dissatisfied
1 Not at all
2 A little
3 Moderately
4 Quite a bit
5 Extremely
I am worried I feel this movie clip was boring I feel this movie clip was stimulating I feel determined I feel enthusiastic I feel this movie clip was sad I feel active
Click Here to Continue Please be patient. It may take up to 60 seconds before the next page appears.

151
POST-TASK SURVEY The post-task survey contained questions regarding the experience of the NeoCITIES simulation. Section 1 of this survey contained self-report mood and stress items. Section 2 contained task-specific questions (i.e. perceived communication, coordination). All questions were presented in a randomized order.
Section 1
Read each statement and then select the most appropriate answer to indicate how you feel right now, at the present moment. Do not spend too much time on any one statement. Use the following scale to indicate your answers:
1. Very slightly or not at all 2. A little 3. Moderately 4. Quite a bit 5. Extremely
1 Not at all
2 A little
3 Moderately
4 Quite a bit
5 Extremely
I feel distressed I feel determined I feel I am performing well on these tasks I feel confident about my abilities I am tense I feel alert I am motivated to do these tasks I feel dissatisfied I feel sad I feel calm
1 Not at all
2 A little
3 Moderately
4 Quite a bit
5 Extremely
I feel upset I feel concerned about the impression I am making

152
I feel content I feel irritable I am trying to figure myself out I feel annoyed I feel jittery I thought about how I would feel if I were told how I performed
I feel active I feel angry
1 Not at all
2 A little
3 Moderately
4 Quite a bit
5 Extremely
I am relaxed I feel self-conscious I feel enthusiastic I am worried Generally, I feel in control of things I am worried about what other people think of me
1 Not at all
2 A little
3 Moderately
4 Quite a bit
5 Extremely
Section 2
This section consists of a number of specific questions about your experience today with the NeoCITIES simulation you just completed. Read each statement and then select your response.
Strongly Disagree Disagree
Neither Agree nor Disagree
Agree Strongly Agree
I felt like I knew what other teams were doing during the simulation I was unsure about how to communicate with other teams I felt like I needed more information to make correct

153
decisions I did not see any connections between events. All of these events happened independently of each other.
My teammates were highly cooperative in resolving events I frequently felt like I was being ignored I think there were connections between some of the events. I think each team had a part in resolving some related events.
Strongly Disagree Disagree
Neither Agree nor Disagree
Agree Strongly Agree
STOP - Complete the paper questionnaire now. Wait for everyone to finish before you continue.
Click Here to Continue
Please be patient. It may take up to 60 seconds before the next page appears.
WRAP-UP SURVEY The wrap-up survey concluded the experiment following the stand-up comic clip. This simply provided cover for showing this last clip which was actually intended to “reset” the participant’s mood back to a happy state before leaving the lab. The questions were to be answered in comparison to the “happy” movie clip of the session (in the example below, this was the second movie).
Section 1
Using the different adjectives listed below, indicate how much you think this last clip differed from the second clip you watched.
Compared to the second movie you watched, was the last clip you watched more or less:
Much less A little less About the same A little more Much more
Unpredictable Exciting

154
Silly Interesting Dull Happy Depressing Serious
Much less A little less About the same A little more Much more
Click Here to Continue
Please be patient. It may take up to 60 seconds before the next page appears.

155
APPENDIX B: CODING PROCEDURE FOR NEOCITIES CHAT LOGS
For each team/condition there will be a tally for:
• All three IMs combined (one file) • Each IM/RM pair (three files)
1. Browse all of the chat files first to get a feel for the team’s communication style 2. Code all MergedIMChat.txt first for all sessions 3. Code each RM chat log (rm_chatlog.txt) next. The rm_chatlog file is the same in both the
IM and RM folder, so use the one in the IM folder for convenience and consistency. a. These are often short, or empty (i.e. IM and RM did not chat) b. Final result is a tally for each IM/RM pair
Complete all 8 conditions for a team before moving on to the next team Put everything in one Excel file. use chat coding template.xls and SAVE AS… using “chat coding - [coder’s last name].xls” as the file name. E.g. “chat coding – pfaff.xls” CODES Measure Description Overall Rate TC Total Communications Total number of communications in the session Communication Type IR Information Request Request for information IT Information Transfer Transmission of information AR Action Request Request for action AT Action Transfer Statement of action taken or to be taken CR Coordination Request Request to coordinate an action CT Coordination Transfer Agreement to coordinate an action ACK Acknowledgements Acknowledgements of the receipt of a communication, but
without any specific message content (i.e. “OK”) INSIG Insignificant Utterances Task-irrelevant statements or chatter These codes have been adapted and extended from those described in: Entin, E. E., & Entin, E. B. (2001). Measures for Evaluation of Team Processes and Performance in Experiments and Exercises. Proceedings of the 6th International Command and Control Research and Technology Symposium, Annapolis, Maryland June, 19-21, p.8. CODING RULES There are three primary classes of communications in NeoCITIES: Information, Action, and Coordination. Each class has two types: Request or Transfer. Other communications fall into the categories of Acknowledgements or Insignificant Utterances.

156
Chat discussions between IMs tend to revolve around the coordination of which dyad(s) are responsible for which events. IM-RM chat usually involves the actions in response to specific events and the status of dyad resources. Events are usually referred to in chat by their ID number or time-stamp, but sometimes by their subject or location (e.g. “the big car crash”).
Information “Information” refers to statements expressing or inquiring about of the status of events in the city or the activities of the participants in the simulation. Information requests and transfers are analytical in nature, and sometimes retrospective – discussing what has taken place for a given event. Statements classified as “information” do not include discuss coordination or statements of actions (to be) taken. It is often difficult to distinguish whether a statement is requesting information or requesting coordination, so the surrounding context should be used as a guide. In simple scenarios with straightforward events, there are usually few information requests or transfers. Rather, the subjects discuss coordinating responsibility and taking action on events. However, in complex scenarios with ill-defined events or puzzles to solve, there will generally be many more exchanges of information. IR – requesting information from other team member(s), but NOT about which team is taking responsibility for an event (that would be a CR in question form).
(08:39 AM) Police I-MGR: Is hazmat sending a bomb unit to 4? IR (08:40 AM) Hazmat I-MGR: No, we haven’t done anything on 4. IT -- which could be followed by -- (08:41 AM) Police I-MGR: Hazmat needs to take care of 4 CR -- or -- (08:41 AM) Police I-MGR: Hazmat – send a bomb unit to 4! AR Examples: “Is anything happening yet?” “How did we fail 25, police?” “What do you think about the firearms one?” [If this last statement is in reference to a current event and is asking for discussion about who should take the firearms event, then it is a CR. On the other hand, if it is in reference to an event that happened some time ago, and the requester is asking about its status or outcome, then it is an IR.]
IT – statements containing general information not directly related to taking responsibility for an event (which would be a CT) or taking a particular action (which would be an AT). These might include justifications or rationale for actions, but not a statement of action taken. Often these are in response to an IR.
Examples: “EMT wasn’t needed for 12” “Because 5 is a bomb event.” “Fumes are not fire related” “Lots of poisonings going on.”

157
Coordination “Coordination” refers to the delegation or acceptance of responsibility to manage an event in the simulation. These exchanges are usually between IMs. A CR may ask an IM’s dyad to take responsibility for handling an event, or may begin a discussion among all three IMs about who should handle the event. CR – specifically assigning responsibility for an event to another dyad (police, fire, hazmat) or asking that members determine which team should handle an event. Between IMs, this is usually in the form of “police to 14” or “hazmat on 3?” or “who is taking 12?” “Hazmat 3?” is often how IMs will state a CR, which would then be followed by a CT from Hazmat: “We’re on 3.”
Stated by an RM to an IM, this is more like “this isn’t our event, fire should take it instead” (CR from RM to IM)
Examples: “Police to 14” “Fire on 10?” “Who is taking 12?” “Who transports ammunition?” [If this last statement is made among IMs in the context of an event just fired requiring the
transportation of ammunition, then it is a CR referring to the event by activity, rather than by ID number or time stamp. If it is a discussion between an IM and RM about what kind of resource transports ammunition, then it is an IR.] CT – a statement of agreement to manage a given event. Coordination is a high-level administrative activity and does not include statements about specific actions to be taken. This type of statement is exclusive to IMs. Sometimes CTs are hard to distinguish from ACKs, but the communication style of the group usually makes it clear how an agreement to coordinate is made. A key distinction is that a CT must include a specific reference back to the event being coordinated. “On it” only states receipt of the CR. Even though the agreement to coordinate is implied, because there is no reference back to the initial request, such a statement is an ACK. Note in the example below that each CT makes reference to the specific event being accepted. Some teams might simply use “got it” or “on it” in response to a CR. The context makes it clear that the statement is an agreement to coordinate the event just mentioned, but because the message does not include any substantive information (event ID, time stamp, or action), then it is classified as an ACK.
Examples: (08:56 AM) Hazmat I-MGR: police needed at 8:53 CR (08:59 AM) Police I-MGR: on it...8:53 CT (09:01 AM) Police I-MGR: hazmat at 8:58 CR (09:03 AM) Hazmat I-MGR: dispatched at 8:58 CT (09:03 AM) Fire I-MGR: Police for 9:03 CR (09:04 AM) Police I-MGR: On it. ACK (09:06 AM) Hazmat I-MGR: police for 9:06 ? CR (09:07 AM) Fire I-MGR: No, 9:06 is Fire. CT
158
(09:07 AM) Hazmat I-MGR: Ok. ACK Note that in the next to last line that even though the Fire I-MGR did not explicitly say “I’m taking it,” it is implied when he indicates that his team is responsible for the event. The same words – “No, 9:06 is Fire” coming from the Hazmat or Police I-MGR would be a CT.
Action “Action” refers to ground-level activities, usually discussed between IMs and RMs. Exchanges involve dispatching specific resource(s) to events. Asking for a fire investigator to be sent is an AR, while asking the Fire/EMS team to handle an event is a CR. Often a team and a resource may be referred to similarly. For example, “EMS to 13” may mean “The fire/ems team should deal with 13” (CR) or “The fire team should send an EMS unit to 13” (AR). When in doubt, if it is an exchange between IMs, code it as a CR. If it is an exchange between IM-RM, code it as an AR. AR – specifically asking another member to take a particular action (“send a chem truck”), rather than “Hazmat team, you take this event” (which is a CR). Sometimes IMs may instruct other IMs to tell their RM to send a specific resource – this is an AR. Often IMs will prompt their RM to send a specific resource via the “Send to IM” dialogue box, so there are often few ARs from IM to RM. AT – Agreement to send a resource to a given event. Usually this is a statement to an IM from an RM, as the RMs are the only ones with the authority to take action on events (i.e. dispatch resources). Typical statements: “Sent three trucks to the coal fire.” “Sent two investigators.”
Acknowledgments (ACK) ACK lines include agreements or receipt of info “OK” “yep” and “yeah,” as well as more substantial agreements like “seems like it” or “yeah, probably was” that do not, on their own, constitute an AR or CR. Even if the context seems to indicate an “OK” is serving as another message (such as an CT), if the message does not include any reference to other tangible message information (event ID, event description) then it is only an ACK.
Insignificant statements (INSIG) Insignificant statements are those that don’t really contribute to the tasks at hand. An exchange like “I wish there were a sudoku option” “yes, me too” would be insignificant. Asides like “sorry” (referring to a typo) or “Woohoo!” exclamations are also insignificant. The reason for coding such lines is that they all should be included in the total amount of communication occurring. On-task message counts can be isolated by subtracting INSIG from TC. Participants may discuss the simulation itself, which is considered an on-task message. An exchange like “How are we failing on 4 things?” (IR); “Good question” (ACK); “I’m so confused on this” (IT) should not be coded as INSIG.

159
APPENDIX C: STIMULUS SCREENSHOTS
Participants logged in with a personal user ID and password to begin the experiment. This ensured the data collected was properly ascribed to each participant:

160
Upon login, participants were greeted with the following screen explaining the instructions for the experiment:

161
The pre-task mood manipulation was encapsulated as an unrelated study on visual communication. This was introduced with this page:

162
The movie was presented in a screen with no controls to pause, scan, or restart the movie. Participants could adjust the volume if needed.

163
The movie was followed by a survey testing recall of features from the movie (section 1) and self-reported mood and stress measures (section 2):

164
Following the pre-task survey, participants received a score on their recall of features from the movie. This maintained the on-going thread of the visual communications study as separate from the NeoCITIES study:

165
All participants were instructed to stop and wait until the experimental monitor instructed them to proceed. The monitor waited until all participants had completed the survey questions and arrived at this screen before instructing participants to begin the NeoCITIES task:

166
At this point, participants began the NeoCITIES simulation:

167
At the conclusion of the NeoCITIES task, participants arrived at this screen to answer self-report mood and stress items:

168
The cycle repeated with exposure to the second condition of the session. This was identical to the first except for the mood manipulation which was the opposite mood of the first condition:

169
The second mood manipulation movie clip:

170
Pre-task survey for the second condition:

171
Score report for the second condition:

172
Pause before beginning the second NeoCITIES task:

173
Post-task survey following the second NeoCITIES task:

174
Final mood manipulation stage to “reset” participants’ moods in the event that the last mood was a sad clip:

175
This final clip was always a stand-up comic:
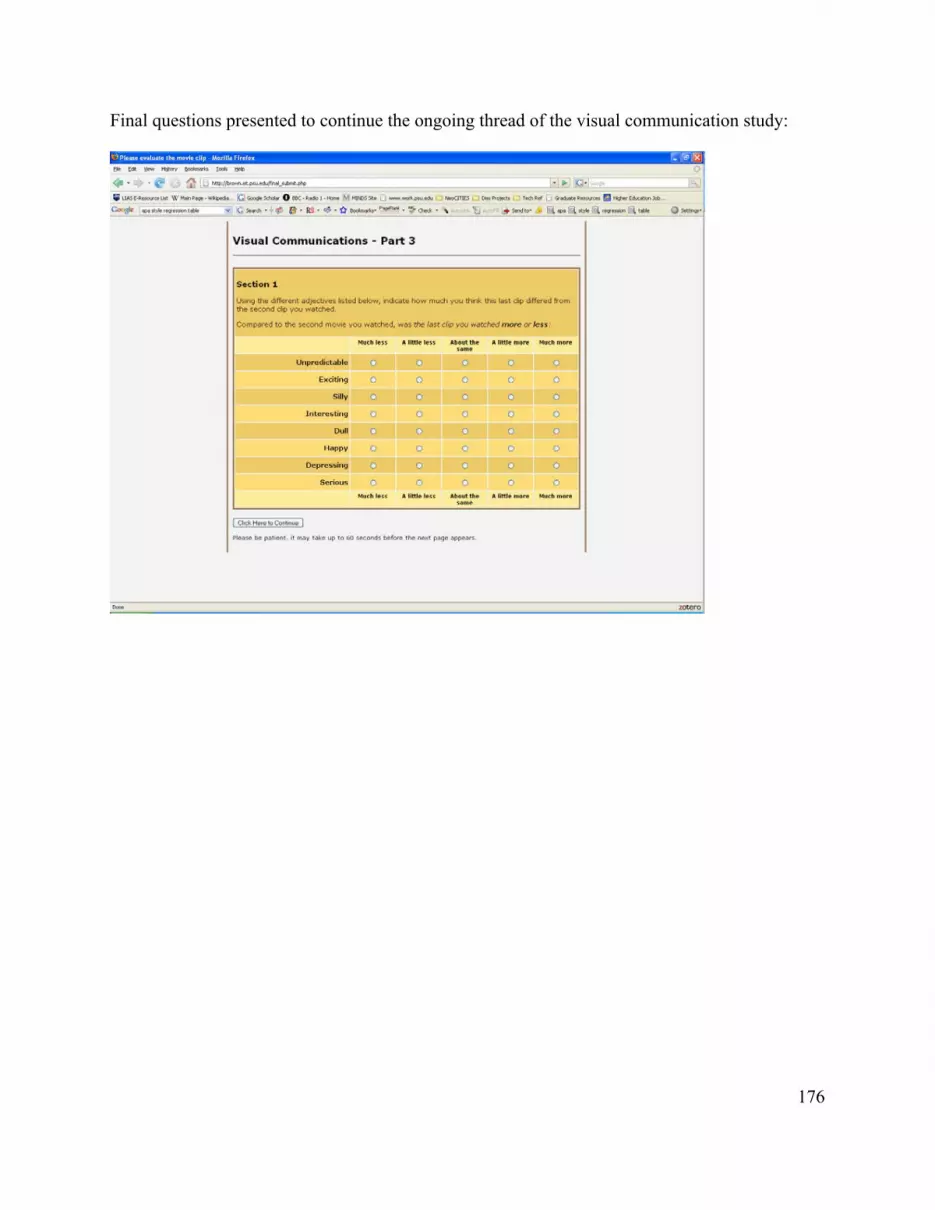
176
Final questions presented to continue the ongoing thread of the visual communication study:

177
Closing screen before participants were dismissed:

Mark S. Pfaff
Education: Ph.D. Information Sciences and Technology The Pennsylvania State University, University Park, PA. August 2004 – Present Expected Graduation: May 2008
Dissertation Title: Effects of mood and stress on group communication and performance in a simulated task environment. Successfully defended on December 14, 2007. Advisor: Michael D. McNeese
M.S. Multimedia Technology Duquesne University, Pittsburgh, PA. May 2001
B.A. Visual Arts with Honors in Photography
The Pennsylvania State University, University Park, PA. December 1995 Honors: Exploratory and Foundational (E&F) Graduate Research Assistantship, Applied Research
Laboratory, The Pennsylvania State University, University Park, PA. 2005-present University Scholar’s Program, The Pennsylvania State University, University Park, PA. 1991-
1995 Prior Appointments: Instructor, Interactive Media Department, McAnulty College and Graduate School of Liberal
Arts, Duquesne University, Pittsburgh, PA. Taught three to five courses per semester to undergrad and graduate students. January 2001 – August 2004
Refereed Papers: Krakowiak, K. M., Lacayo, A., Pfaff, M. (2007). The puzzling effects of multitasking in online
environments. 93rdAnnual Convention of the National Communication Association (NCA 2007), Chicago, IL, November 2007. [Winner of Scholar-to-Scholar Best Overall Display Award]
Ahern, L., Pfaff, M., Rutter, P., & Johnson, C. (2007). Media bias in the eye of the beholder:
Issue importance, issue support and political identity. 90thAnnual Convention of the Association for Education in Journalism and Mass Communication, (AEJMC 2007), Washington, D.C., August 2007.
Zhu, S., Abraham, J., Paul, S., Reddy, M., Yen, J., Pfaff, M., DeFlitch, D. (2007). R-CAST-MED:
Applying intelligent agents to support emergency medical decision making teams. 11th Conference on Artificial Intelligence in Medicine, (AIME 2007), Amsterdam, The Netherlands, July 2007.
McNeese, M., Pfaff, M., Connors, E., Obieta, J., Terrell, I., & Friedenberg, M. (2006). Multiple
vantage points of the common operational picture: Supporting complex teamwork. 50th Annual Meeting of the Human Factors and Ergonomics Society, (HFES 2006), San Francisco, CA, October 2006.
Home Address: 2641 Penbrook Lane
State College, PA 16801 Cell phone: (814) 404-3705
http://psylocke.ist.psu.edu/mpfaff
314B IST Building University Park, PA 16802 (814) 865-6847 [email protected]


