Embed Size (px)
Citation preview
Ž .Energy and Buildings 32 2000 345–354www.elsevier.comrlocaterenbuild
Effects of airflow infiltration on the thermal performance of internallyinsulated ducts
Ronnen Levinson), Wm. Woody Delp, Darryl Dickerhoff, Mark ModeraLawrence Berkeley National Laboratory, Mailstop 90-3074, UniÕersity of California, Berkeley, CA 94720, USA
Received 17 April 1999; accepted 7 April 2000
Abstract
Air flowing through a supply duct infiltrates perviously faced, porous, internal duct insulation, degrading its thermal performance.Encapsulating the insulation’s air-facing surface with an impervious barrier prevents infiltration, increasing the capacity of theconditioned supply air to heat or cool the space to which it is delivered.
This study determined the air-speed dependence of the thermal conductivity of fiberglass insulation by measuring the inlet-to-outlettemperature drop of heated air flowing through a long, insulated flexible duct. The conductivity of a flexible duct’s low-density, internal,fiberglass-blanket insulation increased with the square of the duct air speed, rising by 140% as the duct air speed increased from 0 to 15m sy1. At air speeds recommended for branch ducts, the conductivity of such insulation would increase by 6% above its still-air value ina residential system and by 16% in a commercial system. Results partially agreed with those reported by an earlier study.
Simulations indicate that encapsulating the air-stream surface of internal fiberglass duct insulation with an impervious barrier increasesthe effectiveness with which a duct delivers the thermal capacity of supply air by 0.15%–0.9% in typical duct systems. q 2000 ElsevierScience S.A. All rights reserved.
Keywords: Airflow infiltration; Thermal performance; Internal-duct insulation
1. Introduction
1.1. Duct system heat gains and losses
Heat gains and losses to duct systems in residential andcommercial buildings have been shown to strongly influ-ence the energy efficiency with which conditioned air isdelivered to the occupied space. Based both on measure-
w xment and simulation, Palmiter and Francisco 5 estimatedthat heat pump systems in the Pacific Northwest mightsuffer a 10% increase in seasonal energy requirementsfrom conduction losses from ducts located in crawlspaces.
w xIn a very different climate, Parker et al. 6 predictedthrough a detailed simulation that peak residential ductsystem heat gains could approach 33% of available coolingsystem capacity under peak conditions when ducts were
w xlocated in an attic. Jump et al. 2 performed detailed
) Corresponding author. 2252 Parker Street 302, Berkeley, CA 94704,USA. Tel.: q1-510-649-9084; fax: q1-425-955-1992.
Ž .E-mail address: [email protected] R. Levinson .
measurements that determined that supply-duct conductionreduced residential space conditioning efficiency by 16%in California homes tested.
1.2. DeliÕery effectiÕeness of a supply air duct
A supply air duct may contain a fiberglass lining foracoustic control and thermal insulation. As conditioned airtravels through a supply duct, heat exchange between theair and the duct’s surroundings reduces the air’s ‘‘thermalcapacity,’’ or rate at which it can heat or cool the space towhich it is delivered. The magnitude of this thermal gainor loss is inversely proportional to the duct’s total thermalresistance, which is the sum of the resistance of the duct’sinsulated wall and the resistances of the boundary-layer airfilms inside and outside the duct’s wall. Increasing theresistance of the duct’s insulation will reduce the thermalgain or loss from the duct, and thereby raise the fraction ofthe supply air’s inlet thermal capacity delivered to theduct’s outlet. This ratio of outlet capacity to inlet capacityis the duct’s ‘‘delivery effectiveness.’’
0378-7788r00r$ - see front matter q 2000 Elsevier Science S.A. All rights reserved.Ž .PII: S0378-7788 00 00055-4
( )R. LeÕinson et al.rEnergy and Buildings 32 2000 345–354346
1.3. Increasing effectiÕeness by preÕenting infiltration
Air flowing through a duct will infiltrate internal fiber-glass insulation if the insulation’s air-facing surface ispervious. Infiltration induces forced convection within thefiberglass, raising its effective thermal conductivity andlowering its thermal resistance. Encapsulating the insula-tion’s air-facing surface with an impervious barrier pre-vents infiltration of the insulation and degradation of itsthermal performance.
The increase in delivery effectiveness induced by en-capsulating the insulation’s surface is the duct’s ‘‘effecti-veness gain.’’ Given the variation with air speed of itsinsulation’s conductivity, a duct’s effectiveness gain canbe calculated for arbitrary duct geometries, duct air speeds,and exterior ambient conditions.
1.4. Reported measurement of the change in total thermalresistance due to infiltration
Only one report of the variation with duct air speed ofthe total resistance of fiberglass-insulated ductwork was
w xfound in the literature. Lauvray 3 reported that the totalconductance of a flexible duct with internal fiberglassinsulation was invariant at air speeds below 5 m sy1, androse linearly with air speed at speeds above 5 m sy1. Thestudy did not report the diameter of the duct, the thicknessof its insulation, the emissivity of its outer surface, or thespeed and temperature of the ambient air. Thus, it isdifficult to generalize the reported variation of total ther-mal resistance, or to calculate the variation with air speedof the insulation’s thermal conductivity. No reports of thevariation with duct air speed of the conductivity of internalfiberglass insulation were found.
1.5. Elements of current study
This study determined the air-speed dependence of theconductivity of fiberglass insulation by measuring the in-let-to-outlet temperature drop of heated air as it traveled atvarious speeds through a long, insulated flexible duct. Theresults were used to simulate the effectiveness gains ob-tainable by encapsulating the air-facing surface of theinsulation inside ducts in residential and commercial sys-tems. The simulations modeled flexible and rigid ducts,hot and cold air supplies, and duct locations inside andoutside the building’s thermal envelope.
The temperature-drop conductivity measurement tech-nique requires a long, narrow duct to obtain a good ratio ofsignal to noise in the observed temperature difference.Flexible branch ducts are manufactured in lengths of up to15 m, and are typically insulated with low-density fiber-glass blankets. Rigid main ducts — e.g., rectangularsheet-metal trunk ducts — are typically insulated withhigh-density fiberglass blankets, and are not usually manu-factured in long lengths. The high-density blankets are lesspermeable to air than are low-density blankets, and their
conductivities are expected to vary less with duct airspeed.
Since it was more convenient to obtain a long run ofinsulated flexible duct than a long run of insulated rigidduct, the conductivity measurements were performed onlow-density, flexible-duct insulation. The permeabilities ofthe low- and high-density blankets were measured, andtheir ratio used to theoretically extrapolate the air-speedvariation of the conductivity of the high-density, rigid-ductinsulation from that measured for the low-density blanket.
2. Theory
2.1. Effect of thermal losses from duct on thermal capacityof supply air
2.1.1. Thermal capacityTo maintain the air in a conditioned room at constant
temperature and humidity, the net influx of enthalpy fromthe inflow of supply air and outflow of room air mustequal the room’s net thermal load. If the room’s airflow isbalanced, this net enthalpy influx is the supply air’s ther-mal capacity,
C'm HyH . 1Ž . Ž .˙ a R
Here m is the mass flow rate of the dry-air component of˙ a
the supply air, and H and H are the enthalpiesrunitR
mass dry air of the supply air and room air, respectively.
2.1.2. DeliÕery effectiÕenessThe effectiveness with which a duct delivers capacity is
defined as the ratio of the capacity at its outlet, C , to theB
capacity at its inlet, C . If the duct is airtight and free ofA
internal condensation, its delivery effectiveness is
C c T yTŽ .B p A B´ ' s1y , 2Ž .C C H yHA A R
where T and T are the temperatures at inlet and outlet,A B
and c is the air’s specific heatrunit mass.p
2.1.3. Influence of thermal resistance on deliÕery effectiÕe-ness
The duct’s delivery effectiveness is related by an energybalance to its ‘‘total resistance,’’ R, or resistance to heattransfer from the air in the duct to the duct’s surroundings:
c 1yexp yRrR T yTŽ . Ž .p A `´ s1y , 3Ž .C H yHA R
where T is the temperature of the duct’s surroundings,`
Ž .Rs4 lr r c Õd is a characteristic thermal resistance, la p h,i
is the length of the duct, r is the density of dry air, Õ isa
the bulk velocity of airflow through the duct, d '4h,i
A rP is the duct’s inner hydraulic diameter, A is thei i i
duct’s inner cross-sectional area, and P is the duct’s inneriw xperimeter 5 . Increasing the duct’s total resistance from R
to RX will increase its delivery effectiveness by
D´ '´ RX y´ R . 4Ž . Ž . Ž .C C C

( )R. LeÕinson et al.rEnergy and Buildings 32 2000 345–354 347
This rise in effectiveness is denoted the duct’s effective-ness gain.
2.2. Variation of the effectiÕe thermal conductiÕity offiberglass insulation with temperature and duct air speed
2.2.1. Variation of total resistance with insulation’s effec-tiÕe thermal conductiÕity
The total resistance R of a fiberglass-insulated duct isthe sum of the inner air film resistance R , the insulationi
resistance R , and the outer air film resistance R . Thef o
thickness and resistance of the duct wall are each at leastan order of magnitude smaller than those of the fiberglassinsulation, and may be neglected in the thermal analysis.
The insulation’s resistance is inversely proportional toits effective thermal conductivity, k . Thus, lowering thef
Žinsulation’s effective thermal conductivity or ‘‘conductiv-.ity,’’ for short will increase the insulation’s resistance, the
duct’s total resistance, and the duct’s delivery effective-ness.
2.2.2. Variation with temperature and duct air speed ofinsulation conductiÕity
The conductivity of infiltrated internal fiberglass ductinsulation varies with both fiberglass temperature and ductair speed. Over the temperature range of interest to HVACapplications — say, 08C to 508C — the conductivity offiberglass increases approximately linearly with its mean
w xtemperature T . Theory 5 and measurements developed inf
this study indicate that the conductivity of infiltrated insu-lation increases linearly with the square of the duct airspeed. Thus, if the conductivity varies independently withtemperature and duct air speed,
) ) 2k T ,Õ sk 1qg T yT 1qg Õ , 5Ž .Ž . Ž .f f f 0 T f v
where g and g are the sensitivities of the insulation’sT v
effective thermal conductivity to temperature and velocity,and k ) is the still-air conductivity of fiberglass insulationf 0
at reference mean temperature T ) s248C.
2.2.3. Variation with permeability of Õelocity sensitiÕityThe permeability to a fluid of a porous medium is the
ratio of the fluid’s bulk-flow velocity through the mediumto the magnitude of the pressure gradient across themedium. Flow analysis suggests that the velocity sensitiv-ity g of a porous insulator is proportional to its permeabil-v
w xity to air 5 .
2.3. Increasing effectiÕeness by preÕenting infiltration ofinternal fiberglass duct insulation
2.3.1. Encapsulating insulation to preÕent degradation ofthermal resistance
Consider a perviously faced fiberglass blanket of still-airconductivity k . When it is installed inside a duct, airf0
flowing through the duct can infiltrate the fiberglass, in-ducing forced convection within the insulation that in-
Ž .creases its conductivity to some value k Õ )k Encap-f f0
sulating the air-facing surface of the insulation with animpervious barrier will prevent infiltration, lowering theinsulation’s conductivity at a given duct air speed from
Ž . Xk sk Õ to k sk . Encapsulation thereby increases bothf f f f0
the insulation resistance and the total resistance by
D RsD R sr ln r rr 1rkX y1rkŽ . Ž .f i o i f f
2r ln r rr g ÕŽ .i o i vs , 6Ž .2k 1qg Õf 0 v
where r and r are the duct’s inner and outer radii,i oŽ .respectively. The effectiveness gain is given by Eq. 4 ,
where RX sRqD R.
2.3.2. Parameters influencing magnitude of effectiÕenessgain
When the magnitude of the inlet-to-outlet temperaturedifference is much smaller than the magnitude of thetemperature difference between the duct air and the duct’ssurroundings, the effectiveness gain is approximately
4 l T yT DUŽ .A `D´ fy , 7Ž .C
r d Õ H yHŽ .a h ,i A R
where Us1rR is the duct’s total thermal conductance,and DUsU X yU is the change in total conductanceinduced by encapsulation. The approximate effectivenessgain is proportional to both the duct length l and the
Ž .inlet-to-ambient temperature difference T yT , and in-A `
versely proportional to both the duct’s inner hydraulicdiameter d and the inlet-to-room enthalpy differenceh,iŽ . w xH yH 5 .A R
2.4. Determining sensitiÕity of effectiÕe thermal conductiÕ-ity to duct air speed
An energy balance relates the duct’s total thermal resis-tance R to measured values of its inlet, outlet, and ambientair temperatures. The insulation’s thermal resistance can befound by subtracting the air film resistances from the totalresistance. Then, the insulation’s conductivity can be cal-
w xculated from the insulation’s resistance 4 . Since the varia-tion with temperature of the conductivity of fiberglass is
w xknown 1, p. 24.18 , the velocity sensitivity g and thev
still-air reference-temperature conductivity k ) , of thef 0) Ž .insulation can be determined by measuring k Õ over af
range of air speeds, then regressing a function of the formŽ .of Eq. 5 to the data.

( )R. LeÕinson et al.rEnergy and Buildings 32 2000 345–354348
3. Experimental measurement of the conductivity offiberglass insulation vs. duct air speed
3.1. OÕerÕiew
The total resistance of a long, flexible duct with internalfiberglass insulation was measured by blowing hot airthrough the duct at various speeds, then measuring theair’s bulk velocity and the steady-state values of the ductinlet, duct outlet, and ambient air temperatures. These data
Ž .were used to compute a the duct’s total resistance R andŽ .b the insulation’s resistance R , conductivity k , refer-f f
ence-temperature conductivity k ) , still-air reference-tem-f
perature conductivity k ) , and velocity sensitivity g . Thef 0 v
conductivities of both perviously and imperviously facedfiberglass blankets were measured with the expectationthat the former would vary with air speed, while the latterwould remain constant.
3.2. Experiment
Air was heated to temperatures ranging from 328C–478C, then blown at bulk speeds of 1–16 m sy1 into a15-m length of fiberglass-insulated flexible duct. The duct’sinner and outer diameters were 15 and 21 cm, respectively.The duct rested on a carpeted floor, and was pulled taut in
Ž .a U-configuration Fig. 1 .Steady-state values of the duct’s inlet air temperature
and inlet-to-outlet air temperature differential were mea-Ž .sured with a pair of resistance temperature detection RTD
Ž .probes differential mode accuracy "0.038C . Tempera-tures were considered steady when, after a period of 20–60min, the fluctuation in temperature difference fell to 0.18C.
The inlet and outlet temperatures were measured alongthe duct’s centerline, approximately 10 inner diametersŽ .1.5 m inwards of the duct’s ends. The inlet-to-outlet drop
in air temperature ranged from 0.38C–5.48C, varying withthe inlet air temperature and duct air speed. The ambientair temperature and velocity were measured with a hot
Ž y1 .wire anemometer accuracy "0.38C, "0.1 m s , andranged from 218C–268C and 0.0–0.1 m sy1, respectively.The volumetric flow rate through the system was measured
Ž .with an orifice-type flow meter accuracy "5% built intothe heaterrfan unit.
Separate trials were conducted with fabric-core andplastic-core fiberglass-insulated flexible ducts. Each ductconsisted of a 15-cm diameter spring-wire helix frameencapsulated in a thin inner core of either non-woven
Ž y1fabric thickness 10 mm, flat-form thermal resistancey2 2 y1. Ž y110 m K W or plastic thickness 10 mm, flat-form
y3 2 y1.thermal resistance 10 m K W . The inner core wasŽsurrounded by a low-density fiberglass blanket thickness
2.9 cm, density 13 kg my3, flat-form nominal thermal2 y1 w 2 y1 x.resistance 0.74 m K W 4.2 h ft F Btu , which was
Žin turn encapsulated in a metalized plastic jacket thickness10y1 mm, flat-form thermal resistance 10y3 m2 K Wy1,
.outer-surface long-wave emissivity 0.47 . The duct’s innercore acted as the blanket’s air-facing surface.
The permeability to air of a high-density fiberglassŽblanket used to line rigid ducts thickness 2.5 cm, density
24 kg my3, flat-form nominal thermal resistance 0.63 m2
y1 w 2 y1 x.K W 3.6 h ft F Btu was measured to be approxi-mately half that of the low-density blanket in the flexible
w xduct 4 .
3.3. Results
3.3.1. Variation of conductiÕity with duct air speedThe reference-temperature conductivity of the impervi-
ously faced blanket was approximately constant, with a95% confidence-level value of k ) s0.037"0.002 W my1
f
Ky1. The reference-temperature conductivity of the pervi-
Fig. 1. Heater, fan, and insulated flexible duct used to measure the effect of infiltration on the effective thermal conductivity of fiberglass duct insulation.
( )R. LeÕinson et al.rEnergy and Buildings 32 2000 345–354 349
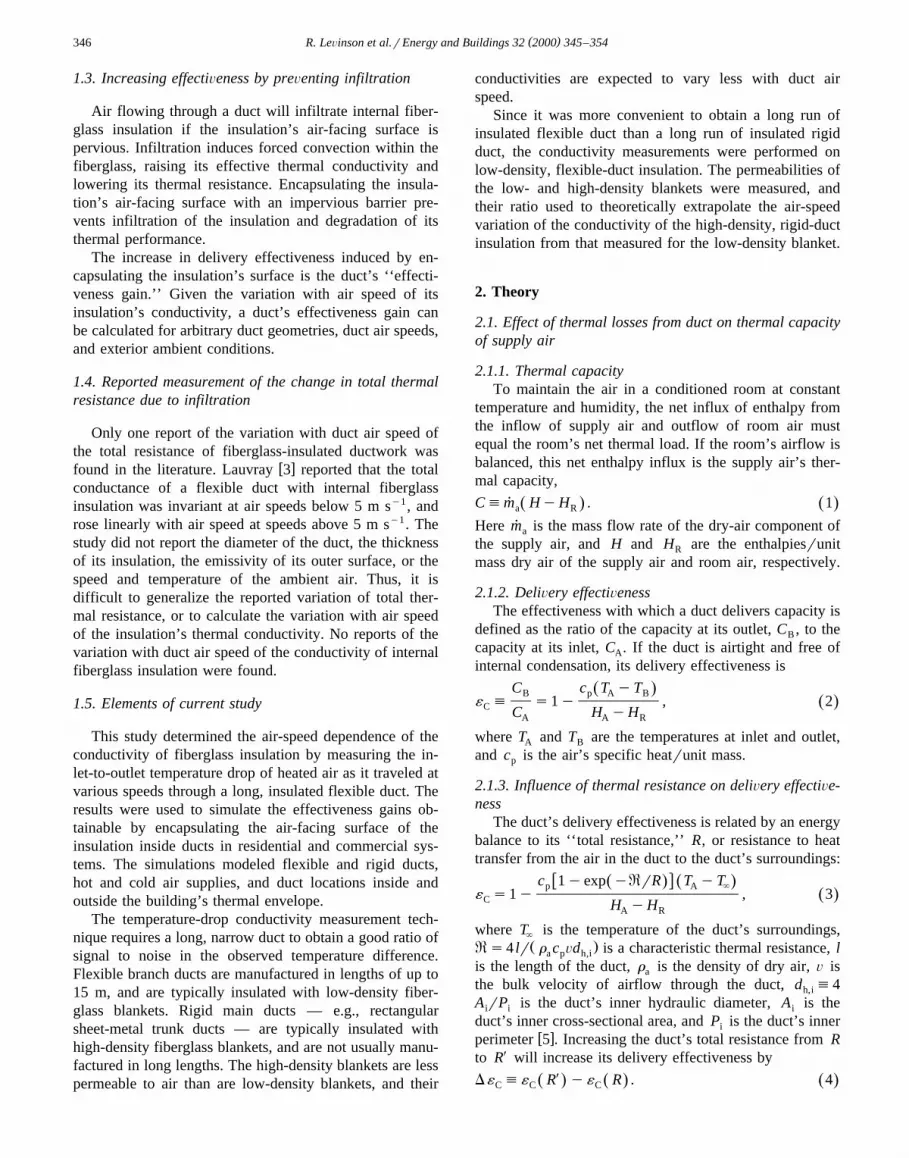
ŽFig. 2. Variation with duct air speed of the effective thermal conductivity at 248C of perviously and imperviously faced fiberglass blankets density 13 kgy3 .m in flexible ducts. Also shown is the nominal, still-air effective thermal conductivity for both blankets.
ously faced fiberglass blanket rose with the square of theŽ .duct air speed in the fashion of Eq. 5 . The 95% confi-
dence-level regressed values of its still-air, reference-tem-perature conductivity and its velocity sensitivity werek ) s0.041"0.002 W my1 Ky1 and g s0.0062"f 0 v
2 y2 Ž .0.0005 s m Fig. 2 .
The regressed reference-temperature, still-air conductiv-ities of the imperviously and perviously faced blanketswere within 5% of the blankets’ nominal conductivityvalue of 0.039 W my1 Ky1.
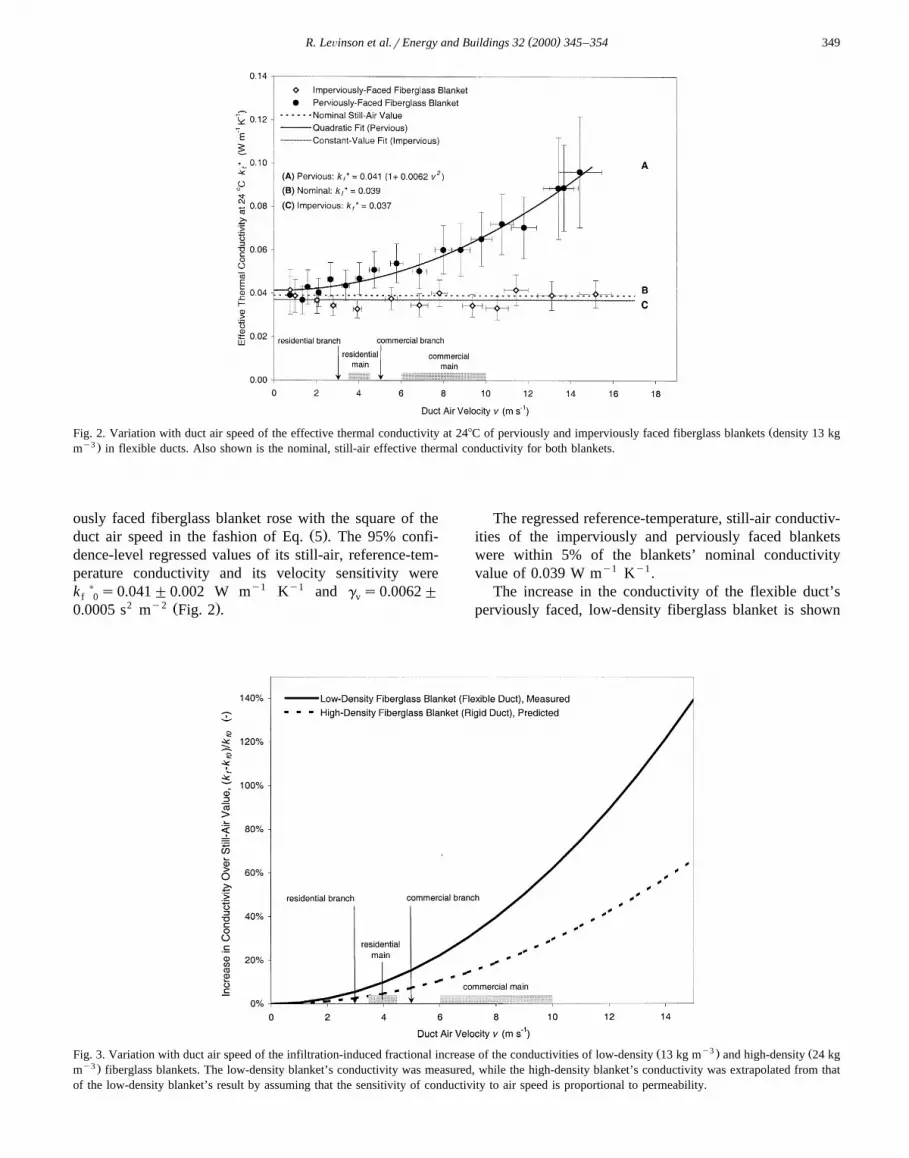
The increase in the conductivity of the flexible duct’sperviously faced, low-density fiberglass blanket is shown
Ž y3 . ŽFig. 3. Variation with duct air speed of the infiltration-induced fractional increase of the conductivities of low-density 13 kg m and high-density 24 kgy3 .m fiberglass blankets. The low-density blanket’s conductivity was measured, while the high-density blanket’s conductivity was extrapolated from that
of the low-density blanket’s result by assuming that the sensitivity of conductivity to air speed is proportional to permeability.
( )R. LeÕinson et al.rEnergy and Buildings 32 2000 345–354350
Table 1w xDuct air speeds recommended to minimize flow noise 7, p. 6.4
y1Ž .Duct air speed m s Residential Commercial
Branch duct 3 5Main duct 3.5–4.5 6–10
Table 2Fractional increases due to infiltration of the conductivities of fiberglassinsulation in flexible branch ducts and rigid main ducts in residential andcommercial systems, computed for the duct air speeds recommended tominimize noise
Ž .Conductivity increase due to infiltration % Residential Commercial
Flexible branch duct 6 16Rigid main duct 4–6 11–29
as a percentage of its still-air conductivity in Fig. 3. Alsoshown is the conductivity increase with air speed for ahigh-density, rigid-duct fiberglass blanket, which has beenextrapolated from that of the low-density-blanket by as-suming that velocity sensitivity is proportional to perme-ability.
Table 1 shows air speeds recommended to minimizeflow noise in main ducts and branch ducts in residential
w xand commercial systems 7, p. 6.4 . Flexible ductwork isused for branch ducts, while rigid ductwork is used formain ducts. Typical increases in the conductivities offlexible branch-duct insulation and rigid main-duct insula-tion in residential and commercial systems are presented inTable 2.
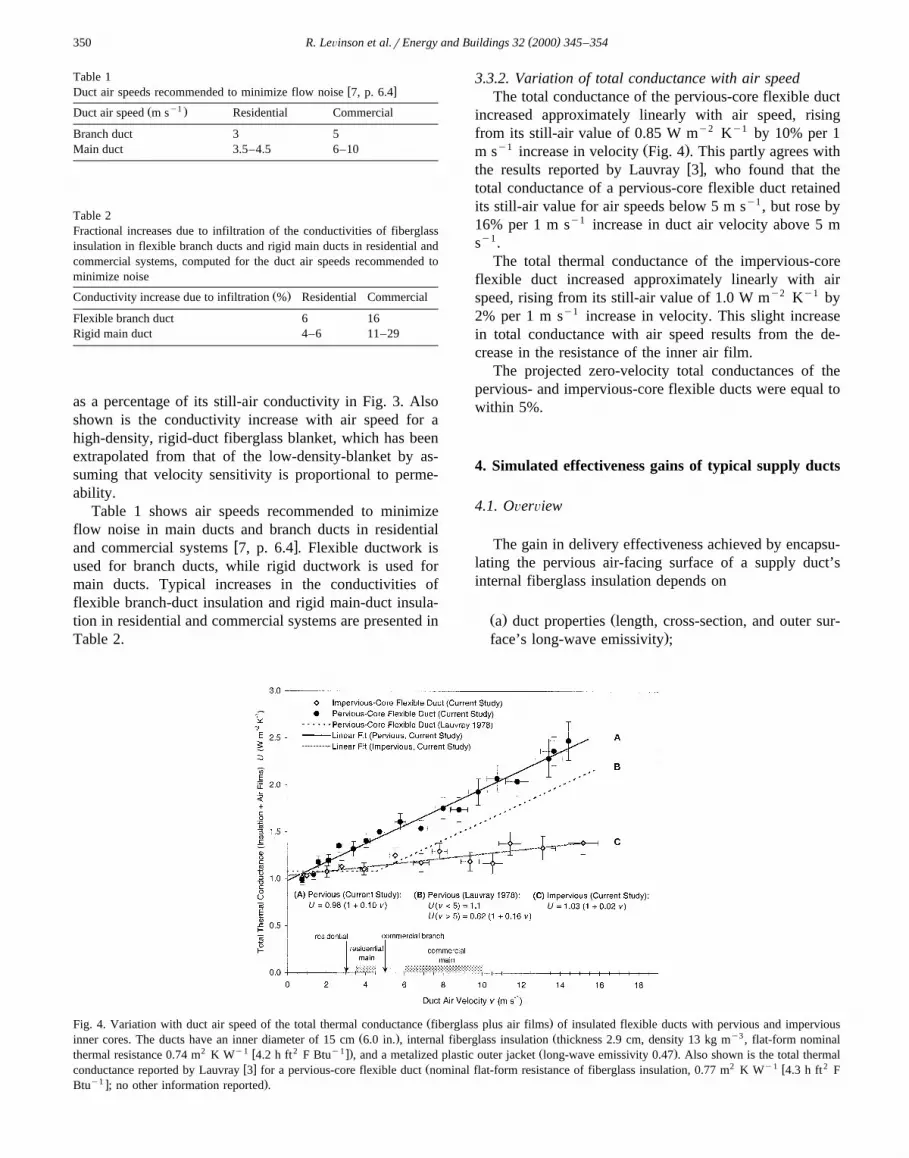
3.3.2. Variation of total conductance with air speedThe total conductance of the pervious-core flexible duct
increased approximately linearly with air speed, risingfrom its still-air value of 0.85 W my2 Ky1 by 10% per 1
y1 Ž .m s increase in velocity Fig. 4 . This partly agrees withw xthe results reported by Lauvray 3 , who found that the
total conductance of a pervious-core flexible duct retainedits still-air value for air speeds below 5 m sy1, but rose by16% per 1 m sy1 increase in duct air velocity above 5 msy1.
The total thermal conductance of the impervious-coreflexible duct increased approximately linearly with airspeed, rising from its still-air value of 1.0 W my2 Ky1 by2% per 1 m sy1 increase in velocity. This slight increasein total conductance with air speed results from the de-crease in the resistance of the inner air film.
The projected zero-velocity total conductances of thepervious- and impervious-core flexible ducts were equal towithin 5%.
4. Simulated effectiveness gains of typical supply ducts
4.1. OÕerÕiew
The gain in delivery effectiveness achieved by encapsu-lating the pervious air-facing surface of a supply duct’sinternal fiberglass insulation depends on
Ž . Ža duct properties length, cross-section, and outer sur-.face’s long-wave emissivity ;
Ž .Fig. 4. Variation with duct air speed of the total thermal conductance fiberglass plus air films of insulated flexible ducts with pervious and imperviousŽ . Ž y3inner cores. The ducts have an inner diameter of 15 cm 6.0 in. , internal fiberglass insulation thickness 2.9 cm, density 13 kg m , flat-form nominal
2 y1 w 2 y1 x. Ž .thermal resistance 0.74 m K W 4.2 h ft F Btu , and a metalized plastic outer jacket long-wave emissivity 0.47 . Also shown is the total thermalw x Ž 2 y1 w 2conductance reported by Lauvray 3 for a pervious-core flexible duct nominal flat-form resistance of fiberglass insulation, 0.77 m K W 4.3 h ft F
y1 x .Btu ; no other information reported .
( )R. LeÕinson et al.rEnergy and Buildings 32 2000 345–354 351
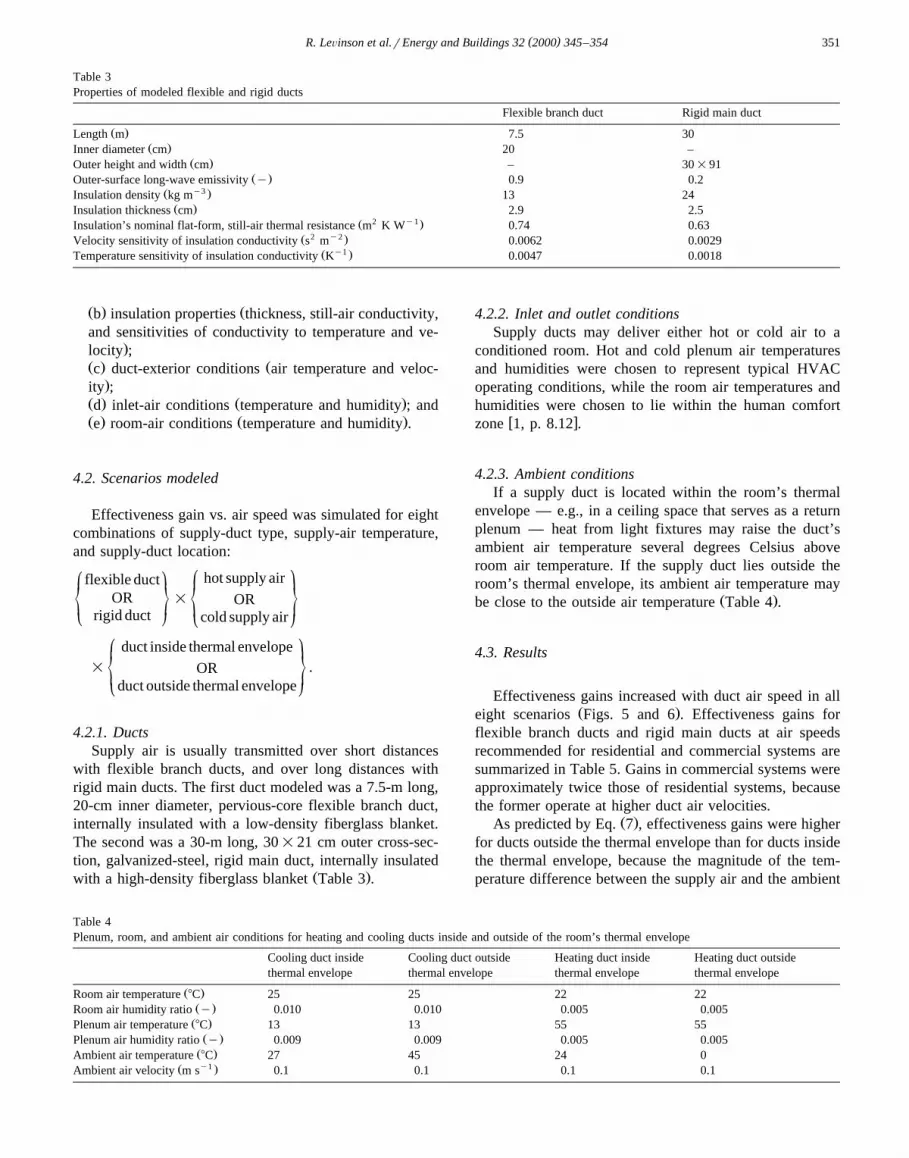
Table 3Properties of modeled flexible and rigid ducts
Flexible branch duct Rigid main duct
Ž .Length m 7.5 30Ž .Inner diameter cm 20 –
Ž .Outer height and width cm – 30=91Ž .Outer-surface long-wave emissivity y 0.9 0.2
y3Ž .Insulation density kg m 13 24Ž .Insulation thickness cm 2.9 2.5
2 y1Ž .Insulation’s nominal flat-form, still-air thermal resistance m K W 0.74 0.632 y2Ž .Velocity sensitivity of insulation conductivity s m 0.0062 0.0029
y1Ž .Temperature sensitivity of insulation conductivity K 0.0047 0.0018
Ž . Žb insulation properties thickness, still-air conductivity,and sensitivities of conductivity to temperature and ve-
.locity ;Ž . Žc duct-exterior conditions air temperature and veloc-
.ity ;Ž . Ž .d inlet-air conditions temperature and humidity ; andŽ . Ž .e room-air conditions temperature and humidity .
4.2. Scenarios modeled
Effectiveness gain vs. air speed was simulated for eightcombinations of supply-duct type, supply-air temperature,and supply-duct location:
hot supply air° ¶flexible duct° ¶ ~ •~ •OR = OR¢ ß ¢ ßrigid duct cold supply air
duct inside thermal envelope° ¶~ •= .OR¢ ßduct outside thermal envelope
4.2.1. DuctsSupply air is usually transmitted over short distances
with flexible branch ducts, and over long distances withrigid main ducts. The first duct modeled was a 7.5-m long,20-cm inner diameter, pervious-core flexible branch duct,internally insulated with a low-density fiberglass blanket.The second was a 30-m long, 30=21 cm outer cross-sec-tion, galvanized-steel, rigid main duct, internally insulated
Ž .with a high-density fiberglass blanket Table 3 .
4.2.2. Inlet and outlet conditionsSupply ducts may deliver either hot or cold air to a
conditioned room. Hot and cold plenum air temperaturesand humidities were chosen to represent typical HVACoperating conditions, while the room air temperatures andhumidities were chosen to lie within the human comfort
w xzone 1, p. 8.12 .
4.2.3. Ambient conditionsIf a supply duct is located within the room’s thermal
envelope — e.g., in a ceiling space that serves as a returnplenum — heat from light fixtures may raise the duct’sambient air temperature several degrees Celsius aboveroom air temperature. If the supply duct lies outside theroom’s thermal envelope, its ambient air temperature may
Ž .be close to the outside air temperature Table 4 .
4.3. Results
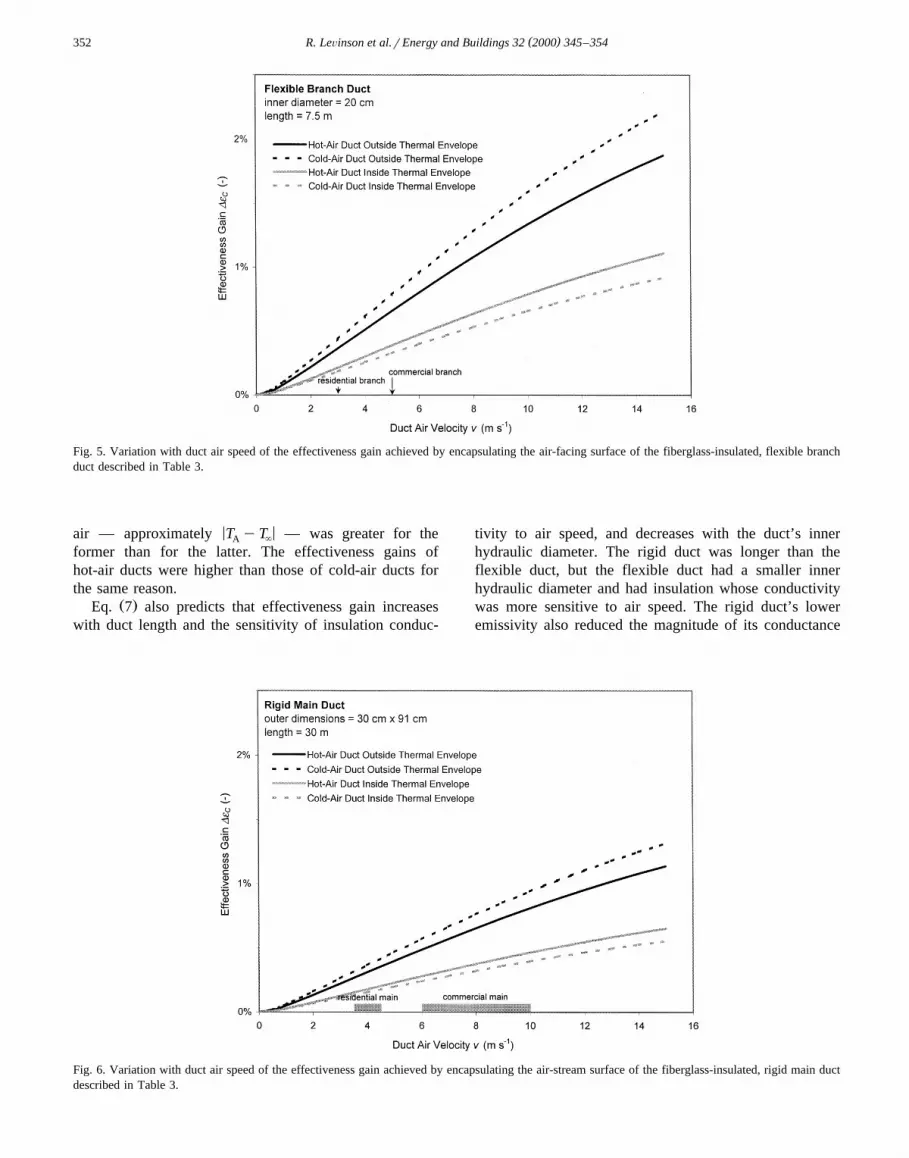
Effectiveness gains increased with duct air speed in allŽ .eight scenarios Figs. 5 and 6 . Effectiveness gains for
flexible branch ducts and rigid main ducts at air speedsrecommended for residential and commercial systems aresummarized in Table 5. Gains in commercial systems wereapproximately twice those of residential systems, becausethe former operate at higher duct air velocities.
Ž .As predicted by Eq. 7 , effectiveness gains were higherfor ducts outside the thermal envelope than for ducts insidethe thermal envelope, because the magnitude of the tem-perature difference between the supply air and the ambient
Table 4Plenum, room, and ambient air conditions for heating and cooling ducts inside and outside of the room’s thermal envelope
Cooling duct inside Cooling duct outside Heating duct inside Heating duct outsidethermal envelope thermal envelope thermal envelope thermal envelope
Ž .Room air temperature 8C 25 25 22 22Ž .Room air humidity ratio y 0.010 0.010 0.005 0.005Ž .Plenum air temperature 8C 13 13 55 55Ž .Plenum air humidity ratio y 0.009 0.009 0.005 0.005Ž .Ambient air temperature 8C 27 45 24 0y1Ž .Ambient air velocity m s 0.1 0.1 0.1 0.1
( )R. LeÕinson et al.rEnergy and Buildings 32 2000 345–354352
Fig. 5. Variation with duct air speed of the effectiveness gain achieved by encapsulating the air-facing surface of the fiberglass-insulated, flexible branchduct described in Table 3.
< <air — approximately T yT — was greater for theA `
former than for the latter. The effectiveness gains ofhot-air ducts were higher than those of cold-air ducts forthe same reason.
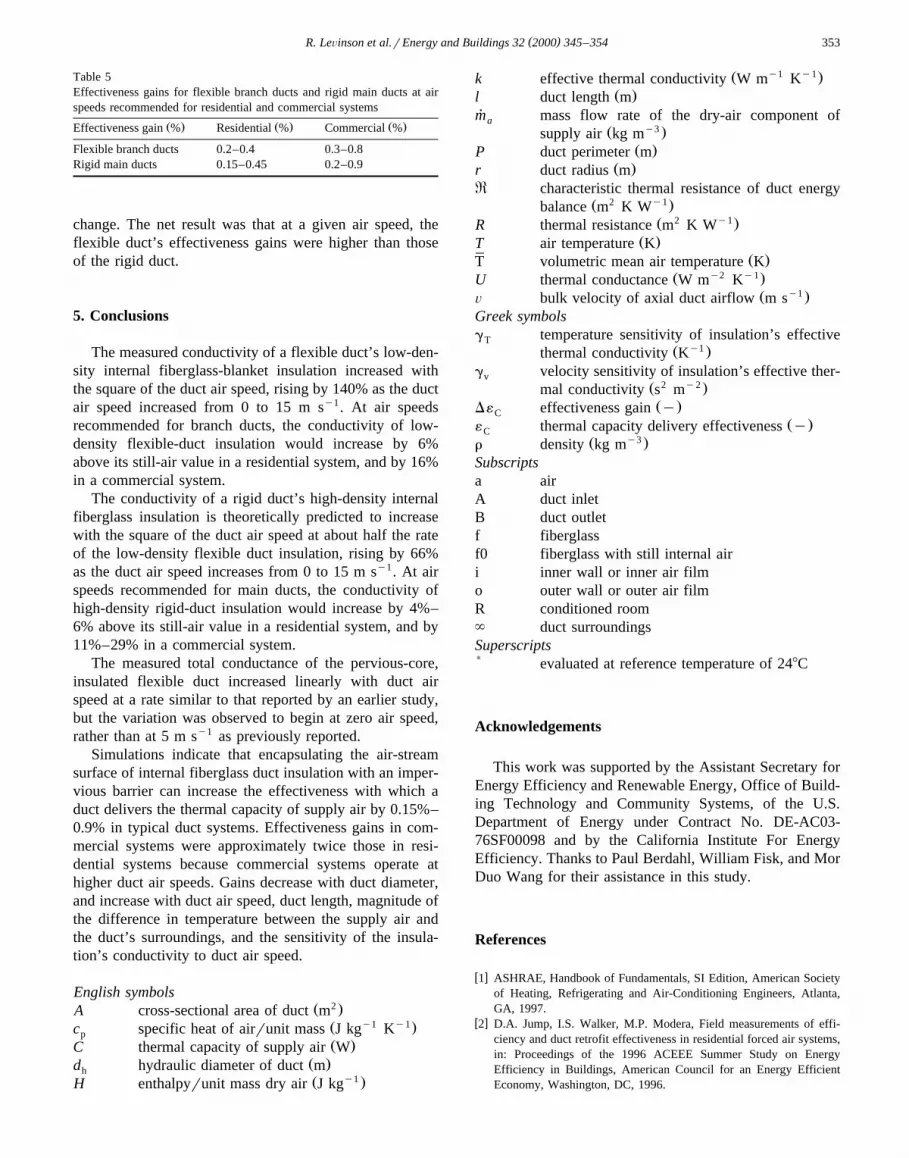
Ž .Eq. 7 also predicts that effectiveness gain increaseswith duct length and the sensitivity of insulation conduc-
tivity to air speed, and decreases with the duct’s innerhydraulic diameter. The rigid duct was longer than theflexible duct, but the flexible duct had a smaller innerhydraulic diameter and had insulation whose conductivitywas more sensitive to air speed. The rigid duct’s loweremissivity also reduced the magnitude of its conductance
Fig. 6. Variation with duct air speed of the effectiveness gain achieved by encapsulating the air-stream surface of the fiberglass-insulated, rigid main ductdescribed in Table 3.
( )R. LeÕinson et al.rEnergy and Buildings 32 2000 345–354 353
Table 5Effectiveness gains for flexible branch ducts and rigid main ducts at airspeeds recommended for residential and commercial systems
Ž . Ž . Ž .Effectiveness gain % Residential % Commercial %
Flexible branch ducts 0.2–0.4 0.3–0.8Rigid main ducts 0.15–0.45 0.2–0.9
change. The net result was that at a given air speed, theflexible duct’s effectiveness gains were higher than thoseof the rigid duct.
5. Conclusions
The measured conductivity of a flexible duct’s low-den-sity internal fiberglass-blanket insulation increased withthe square of the duct air speed, rising by 140% as the ductair speed increased from 0 to 15 m sy1. At air speedsrecommended for branch ducts, the conductivity of low-density flexible-duct insulation would increase by 6%above its still-air value in a residential system, and by 16%in a commercial system.
The conductivity of a rigid duct’s high-density internalfiberglass insulation is theoretically predicted to increasewith the square of the duct air speed at about half the rateof the low-density flexible duct insulation, rising by 66%as the duct air speed increases from 0 to 15 m sy1. At airspeeds recommended for main ducts, the conductivity ofhigh-density rigid-duct insulation would increase by 4%–6% above its still-air value in a residential system, and by11%–29% in a commercial system.
The measured total conductance of the pervious-core,insulated flexible duct increased linearly with duct airspeed at a rate similar to that reported by an earlier study,but the variation was observed to begin at zero air speed,rather than at 5 m sy1 as previously reported.
Simulations indicate that encapsulating the air-streamsurface of internal fiberglass duct insulation with an imper-vious barrier can increase the effectiveness with which aduct delivers the thermal capacity of supply air by 0.15%–0.9% in typical duct systems. Effectiveness gains in com-mercial systems were approximately twice those in resi-dential systems because commercial systems operate athigher duct air speeds. Gains decrease with duct diameter,and increase with duct air speed, duct length, magnitude ofthe difference in temperature between the supply air andthe duct’s surroundings, and the sensitivity of the insula-tion’s conductivity to duct air speed.
English symbolsŽ 2 .A cross-sectional area of duct m
Ž y1 y1.c specific heat of airrunit mass J kg KpŽ .C thermal capacity of supply air W
Ž .d hydraulic diameter of duct mhŽ y1 .H enthalpyrunit mass dry air J kg
Ž y1 y1.k effective thermal conductivity W m KŽ .l duct length m
m mass flow rate of the dry-air component of˙ aŽ y3 .supply air kg m
Ž .P duct perimeter mŽ .r duct radius m
R characteristic thermal resistance of duct energyŽ 2 y1.balance m K W
Ž 2 y1.R thermal resistance m K WŽ .T air temperature K
Ž .T volumetric mean air temperature KŽ y2 y1.U thermal conductance W m K
Ž y1 .Õ bulk velocity of axial duct airflow m sGreek symbolsg temperature sensitivity of insulation’s effectiveT
Ž y1 .thermal conductivity Kg velocity sensitivity of insulation’s effective ther-v
Ž 2 y2 .mal conductivity s mŽ .D´ effectiveness gain yC
Ž .´ thermal capacity delivery effectiveness yCŽ y3 .r density kg m
Subscriptsa airA duct inletB duct outletf fiberglassf0 fiberglass with still internal airi inner wall or inner air filmo outer wall or outer air filmR conditioned room` duct surroundingsSuperscripts) evaluated at reference temperature of 248C
Acknowledgements
This work was supported by the Assistant Secretary forEnergy Efficiency and Renewable Energy, Office of Build-ing Technology and Community Systems, of the U.S.Department of Energy under Contract No. DE-AC03-76SF00098 and by the California Institute For EnergyEfficiency. Thanks to Paul Berdahl, William Fisk, and MorDuo Wang for their assistance in this study.
References
w x1 ASHRAE, Handbook of Fundamentals, SI Edition, American Societyof Heating, Refrigerating and Air-Conditioning Engineers, Atlanta,GA, 1997.
w x2 D.A. Jump, I.S. Walker, M.P. Modera, Field measurements of effi-ciency and duct retrofit effectiveness in residential forced air systems,in: Proceedings of the 1996 ACEEE Summer Study on EnergyEfficiency in Buildings, American Council for an Energy EfficientEconomy, Washington, DC, 1996.

( )R. LeÕinson et al.rEnergy and Buildings 32 2000 345–354354
w x3 T.L. Lauvray, Experimental heat transmission coefficients for operat-Ž . Ž .ing air duct systems, ASHRAE J. 20 1978 69–73, June .
w x4 R. Levinson, W.W. Delp, D. Dickerhoff, M. Modera, Effects of airinfiltration on the effective thermal conductivity of internal fiberglassinsulation and on the delivery of thermal capacity via ducts, LawrenceBerkeley National Laboratory report LBNL-42499, Berkeley, CA,2000.
w x5 L. Palmiter, P. Francisco, Development of a practical method forestimating the thermal efficiency of residential forced air distribution
systems, Electric Power Research Institute report EPRI-TR-107744,Palo Alto, CA, 1997.
w x6 D.S. Parker, P.F. Fairey, L. Gu, Simulation of the effects of ductleakage and heat transfer on residential space cooling energy use,
Ž . Ž .Energy Build. 20 2 1993 97–114.w x7 SMACNA, Installation Standards For Residential Heating and Air
Conditioning Systems, 6th edn., Sheet Metal and Air ConditioningContractors National Association, Vienna, VA, 1988.


