Embed Size (px)
Citation preview
ARTICLE IN PRESS
Available at www.sciencedirect.com
WAT E R R E S E A R C H 4 0 ( 2 0 0 6 ) 2 4 2 7 – 2 4 3 5
0043-1354/$ - see frodoi:10.1016/j.watres
�Corresponding aE-mail address: a
journal homepage: www.elsevier.com/locate/watres
Effect of River Landscape on the sediment concentrationsof antibiotics and corresponding antibiotic resistancegenes (ARG)
Ruoting Pei, Sung-Chul Kim, Kenneth H. Carlson, Amy Pruden�
Department of Civil & Environmental Engineering, 1372 Campus Mail, Colorado State University, Fort Collins, CO 80523, USA
a r t i c l e i n f o
Article history:
Received 18 September 2005
Received in revised form
28 February 2006
Accepted 16 April 2006
Available online 6 June 2006
Keywords:
Antibiotic resistance
Quantification
Sediments
Tetracyclines
Sulfonamides
nt matter & 2006 Elsevie.2006.04.017
uthor. Tel.: +1 970 491 [email protected]
A B S T R A C T
The purpose of this study was to quantify antibiotic resistance genes (ARG) in the
sediments of the mixed-landscape Cache La Poudre River, which has previously been
studied and shown to have high concentrations of antibiotics related to urban and
agricultural activities. River sediments were sampled during two events (high-flow and
low-flow) from five sites with varying urban and agricultural impact levels. Polymerase-
chain-reaction (PCR) detection assays were conducted for four sulfonamide resistance gene
families, using newly designed primers, and five tetracycline resistance gene families,
using previously published primers. Sul(I), sul(II), tet(W), and tet(O) gene families were
further quantified by real-time quantitative polymerase chain reaction (Q-PCR). Resistance
to four classes of antibiotics (tetracyclines, sulfonamides, ionophores, and macrolides) was
also investigated using a culture-based approach. The quantities of resistance genes
normalized to the 16S gene copy number were significantly different between the sites,
with higher resistance gene concentrations at the impacted sites than at the pristine site.
Total resistant CFUs were over an order of magnitude lower at the pristine site, but
differences were less apparent when normalized to the total CFUs. Six tetracyclines and six
sulfonamides were also quantified in the sediments and were found to be highest at sites
impacted by urban and agricultural activity, with no antibiotics detected at the pristine sit.
To the knowledge of the authors, this study is the first to demonstrate a relationship
between urban and agricultural activity and microbial resistance in river sediments using
quantitative molecular tools.
& 2006 Elsevier Ltd. All rights reserved.
1. Introduction
Pharmaceutical compounds including antibiotics, hormones,
and steroids are widely used to prevent and/or treat diseases
and to promote animal growth in livestock production
facilities, such as concentrated animal feeding operations
(CAFOs). In particular, one half of the 50 million pounds of
antibiotics produced each year in the US is used for
agriculture and 90% of these are used for growth promotion
r Ltd. All rights reserved.
4; fax: +1 970 491 8671.u (A. Pruden).
(Levy, 1998). A significant amount of these antibiotics (up to
75%; Elmund et al., 1971; Feinman and Matheson, 1978) are
excreted as active metabolites. Thus, animal waste presents a
major potential source of antibiotic input to the environment
(Haapapuro et al., 1997; Sweeten, 1992). Discharge of treated
municipal, hospital, and veterinary wastewaters present
additional sources. A recent study conducted by the United
States Geological Survey in 1999 and 2000 indicated that, out
of a network of 139 streams across 30 states, 95 contained
ARTICLE IN PRESS
WAT E R R E S E A R C H 4 0 ( 2 0 0 6 ) 2 4 2 7 – 2 4 3 52428
antibiotics (Kolpin et al., 2002). Now that antibiotic contam-
ination in the environment has been confirmed, a growing
concern is that the release of antibiotics into the environment
may contribute to the emergence of strains of disease-
causing bacteria that are resistant to even high doses of
these drugs (ASM, 2002; Chee-Sanford et al., 2001; Goni-Urriza
et al., 2000; Guardabassi et al., 1998). Therefore, there is a need
to better understand the relationship between antibiotics in
the environment and their ultimate impact on the emergence
of microbial resistance.
Recently, the occurrence of four classes of antibiotics
(tetracyclines, sulfonamides, macrolides and ionophores)
has been investigated in environmental samples such as
natural water, animal and human wastewaters, irrigation
ditches, and river sediments (Kim and Carlson, 2005; Yang
and Carlson, 2003, 2004a,b; Yang et al., 2004). In particular,
within the mixed-landscape of the Cache La Poudre (Poudre)
River watershed, the presence of these four classes of
antibiotics in water and sediments were found to relate to
urban and agricultural activity. Generally, the number of
antibiotics present and their concentrations increased as
agricultural and urban activates increased along the Poudre
River from its pristine origins in the Rocky Mountains, where
no antibiotic contamination has yet been found. Relation-
ships could also be identified between antibiotics known to be
specific to human or agricultural use, and their most likely
inputs (Yang and Carlson, 2003, 2004a,b; Yang et al., 2004).
Based on these results it is clear that studies are needed to
assess the impact of antibiotics released into the environ-
ment and their potential ultimate effect on human health and
the environment. In particular, there is a need for the
development and application of methods to quantify actual
resistance genes in the environment. The quantity of anti-
biotic resistance genes (ARG) may serve as a good indicator of
the bioavailability of antibiotics in the environment. Also, as
suggested recently by Rysz and Alvarez (Rysz and Alvarez,
2004), the genes themselves could be considered to be
‘‘pollutants,’’ as their wide-spread dissemination is clearly
undesirable.
The purpose of this study was two-fold: (1) to develop
methods for quantifying ARG in environmental samples; and
(2) to apply these methods in assessing and quantifying ARG
present in the sediments of the Poudre River, a model river
system that is zonated with respect to pristine, urban, and
agricultural impacts. In particular, quantitative real-time
polymerase chain reaction (Q-PCR) methods targeting tetra-
cycline and sulfonamide resistance genes were developed
and applied. Both of these classes of antibiotics are widely
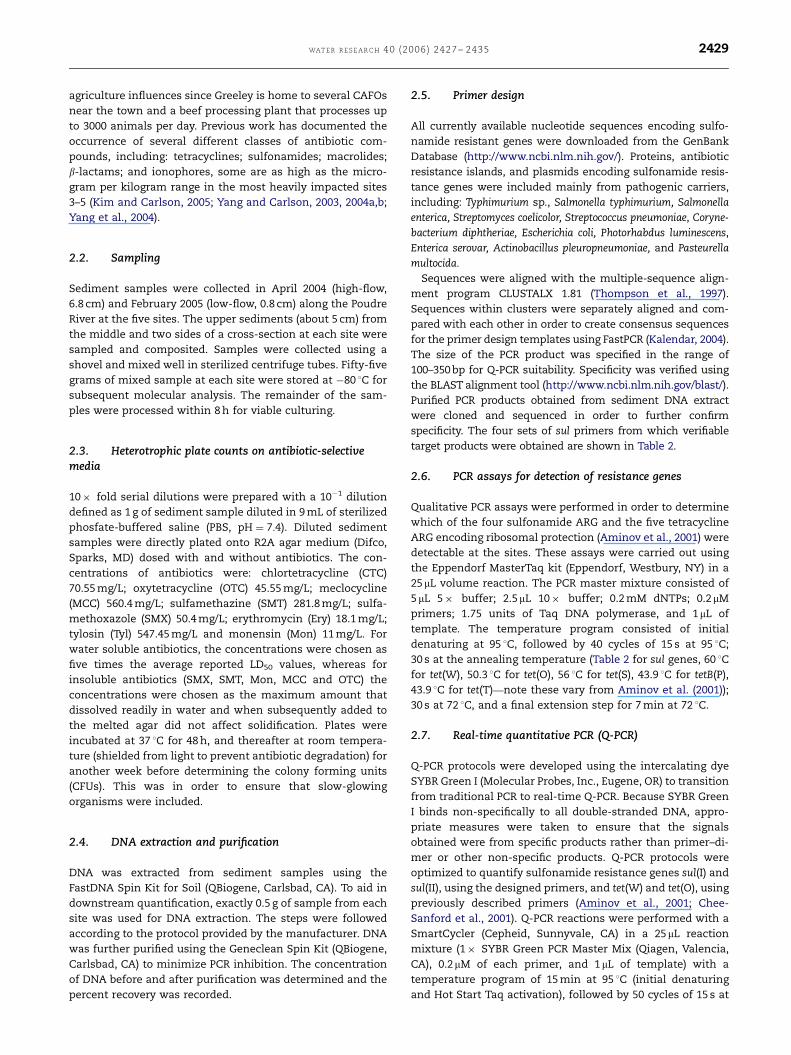
Table 1 – Poudre River sampling site locations and characteris
Site ID Actual location
Site 1 Greyrock National Recreation Trail, Ft Collins, CO
Site 2 Shields street bridge, Ft Collins, CO
Site 3 Drake waste water treatment plant, Ft Collins, CO
Site 4 Hwy 329 bridge, Windsor, CO
Site 5 Weld country municipal airport, Greeley, CO
used in both animals and in humans (Aminov et al., 2001;
Huber, 1971; Pereten and Boerlin, 2000). A culture-based
approach was also implemented as a broad method of
quantifying microbial resistance, including resistance in-
curred by genes that may not have been previously described.
Finally, various tetracyclines and sulfonamides were also
quantified in the sediment samples in order to compare the
concentrations of antibiotics observed with those of ARG.
2. Materials and methods
2.1. Study area and sampling sites
The Poudre River in northern Colorado has many unique
attributes that make it an excellent model watershed to
compare pristine, urban, and agricultural impacts. These
attributes include: (1) the semi-arid nature of the front range
of Colorado which results in only a small number of
tributaries to the Poudre River; (2) the predominance of point
sources in the urban landscape of Fort Collins versus non-
point sources in the agricultural areas outside of the city; and
(3) the source of the river being primarily snowmelt with
minimal anthropogenic influences (Yang and Carlson, 2003,
2004b).
Five sites along the Poudre River were monitored and are
summarized in Table 1. A map of this study site has been
previously published (Yang and Carlson, 2003). Sample site 1
was chosen to represent the pristine area without anthro-
pogenic influence and is located at the river origin. The river
originates near the continental divide in the Rocky Mountain
National Park and flows through steep mountainous terrain
for approximately 43 miles before entering the front range
city of Fort Collins. To date, no antibiotic compounds have
been detected at site 1 (Kim and Carlson, 2005; Yang and
Carlson, 2003, 2004a,b; Yang et al., 2004). Site 2 is located just
prior to where the river enters Fort Collins and represents an
area influenced by light agricultural activities (a few small-
scale dairies and cattle feed operations). Sample site 3 is
located at the point of discharge for the Drake Wastewater
Reclamation Facility after the river travels through the city
and represents an urban area influenced by wastewater
discharge. Sample site 4 is downstream of Fort Collins but
upstream of the next urban area, Greeley, CO. Between Fort
Collins and Greeley there are at least six CAFOs and multiple
smaller animal feed facilities, therefore, site 4 represents an
area heavily influenced by agriculture activities. Site 5 is
downstream of Greeley and represents both urban and
tics
Site characteristics
Pristine area without anthropogenic influence
Area influenced by light agriculture activities
Urban area influenced by wastewater discharges
Area influenced significantly by agriculture activities
Area influenced by both urban and agriculture activities
ARTICLE IN PRESS
WAT E R R E S E A R C H 40 (2006) 2427– 2435 2429
agriculture influences since Greeley is home to several CAFOs
near the town and a beef processing plant that processes up
to 3000 animals per day. Previous work has documented the
occurrence of several different classes of antibiotic com-
pounds, including: tetracyclines; sulfonamides; macrolides;
b-lactams; and ionophores, some are as high as the micro-
gram per kilogram range in the most heavily impacted sites
3–5 (Kim and Carlson, 2005; Yang and Carlson, 2003, 2004a,b;
Yang et al., 2004).
2.2. Sampling
Sediment samples were collected in April 2004 (high-flow,
6.8 cm) and February 2005 (low-flow, 0.8 cm) along the Poudre
River at the five sites. The upper sediments (about 5 cm) from
the middle and two sides of a cross-section at each site were
sampled and composited. Samples were collected using a
shovel and mixed well in sterilized centrifuge tubes. Fifty-five
grams of mixed sample at each site were stored at �80 1C for
subsequent molecular analysis. The remainder of the sam-
ples were processed within 8 h for viable culturing.
2.3. Heterotrophic plate counts on antibiotic-selectivemedia
10� fold serial dilutions were prepared with a 10�1 dilution
defined as 1 g of sediment sample diluted in 9 mL of sterilized
phosfate-buffered saline (PBS, pH ¼ 7:4). Diluted sediment
samples were directly plated onto R2A agar medium (Difco,
Sparks, MD) dosed with and without antibiotics. The con-
centrations of antibiotics were: chlortetracycline (CTC)
70.55 mg/L; oxytetracycline (OTC) 45.55 mg/L; meclocycline
(MCC) 560.4 mg/L; sulfamethazine (SMT) 281.8 mg/L; sulfa-
methoxazole (SMX) 50.4 mg/L; erythromycin (Ery) 18.1 mg/L;
tylosin (Tyl) 547.45 mg/L and monensin (Mon) 11 mg/L. For
water soluble antibiotics, the concentrations were chosen as
five times the average reported LD50 values, whereas for
insoluble antibiotics (SMX, SMT, Mon, MCC and OTC) the
concentrations were chosen as the maximum amount that
dissolved readily in water and when subsequently added to
the melted agar did not affect solidification. Plates were
incubated at 37 1C for 48 h, and thereafter at room tempera-
ture (shielded from light to prevent antibiotic degradation) for
another week before determining the colony forming units
(CFUs). This was in order to ensure that slow-glowing
organisms were included.
2.4. DNA extraction and purification
DNA was extracted from sediment samples using the
FastDNA Spin Kit for Soil (QBiogene, Carlsbad, CA). To aid in
downstream quantification, exactly 0.5 g of sample from each
site was used for DNA extraction. The steps were followed
according to the protocol provided by the manufacturer. DNA
was further purified using the Geneclean Spin Kit (QBiogene,
Carlsbad, CA) to minimize PCR inhibition. The concentration
of DNA before and after purification was determined and the
percent recovery was recorded.
2.5. Primer design
All currently available nucleotide sequences encoding sulfo-
namide resistant genes were downloaded from the GenBank
Database (http://www.ncbi.nlm.nih.gov/). Proteins, antibiotic
resistance islands, and plasmids encoding sulfonamide resis-
tance genes were included mainly from pathogenic carriers,
including: Typhimurium sp., Salmonella typhimurium, Salmonella
enterica, Streptomyces coelicolor, Streptococcus pneumoniae, Coryne-
bacterium diphtheriae, Escherichia coli, Photorhabdus luminescens,
Enterica serovar, Actinobacillus pleuropneumoniae, and Pasteurella
multocida.
Sequences were aligned with the multiple-sequence align-
ment program CLUSTALX 1.81 (Thompson et al., 1997).
Sequences within clusters were separately aligned and com-
pared with each other in order to create consensus sequences
for the primer design templates using FastPCR (Kalendar, 2004).
The size of the PCR product was specified in the range of
100–350 bp for Q-PCR suitability. Specificity was verified using
the BLAST alignment tool (http://www.ncbi.nlm.nih.gov/blast/).
Purified PCR products obtained from sediment DNA extract
were cloned and sequenced in order to further confirm
specificity. The four sets of sul primers from which verifiable
target products were obtained are shown in Table 2.
2.6. PCR assays for detection of resistance genes
Qualitative PCR assays were performed in order to determine
which of the four sulfonamide ARG and the five tetracycline
ARG encoding ribosomal protection (Aminov et al., 2001) were
detectable at the sites. These assays were carried out using
the Eppendorf MasterTaq kit (Eppendorf, Westbury, NY) in a
25mL volume reaction. The PCR master mixture consisted of
5 mL 5� buffer; 2.5mL 10� buffer; 0.2 mM dNTPs; 0.2 mM
primers; 1.75 units of Taq DNA polymerase, and 1mL of
template. The temperature program consisted of initial
denaturing at 95 1C, followed by 40 cycles of 15 s at 95 1C;
30 s at the annealing temperature (Table 2 for sul genes, 60 1C
for tet(W), 50.3 1C for tet(O), 56 1C for tet(S), 43.9 1C for tetB(P),
43.9 1C for tet(T)—note these vary from Aminov et al. (2001));
30 s at 72 1C, and a final extension step for 7 min at 72 1C.
2.7. Real-time quantitative PCR (Q-PCR)
Q-PCR protocols were developed using the intercalating dye
SYBR Green I (Molecular Probes, Inc., Eugene, OR) to transition
from traditional PCR to real-time Q-PCR. Because SYBR Green
I binds non-specifically to all double-stranded DNA, appro-
priate measures were taken to ensure that the signals
obtained were from specific products rather than primer–di-
mer or other non-specific products. Q-PCR protocols were
optimized to quantify sulfonamide resistance genes sul(I) and
sul(II), using the designed primers, and tet(W) and tet(O), using
previously described primers (Aminov et al., 2001; Chee-
Sanford et al., 2001). Q-PCR reactions were performed with a
SmartCycler (Cepheid, Sunnyvale, CA) in a 25mL reaction
mixture (1� SYBR Green PCR Master Mix (Qiagen, Valencia,
CA), 0.2mM of each primer, and 1 mL of template) with a
temperature program of 15 min at 95 1C (initial denaturing
and Hot Start Taq activation), followed by 50 cycles of 15 s at
ARTICLE IN PRESS
Table 2 – PCR primers targeting sulfonamide resistance gene families
Primer Class targeted Sequences Traditional PCR Q-PCR annealing Amplicon sizeannealing temp (1C) temp (1C) (bp)
sulI-FWa sul(I) cgcaccggaaacatcgctgcac 55.9 65.0 163
sulI-RV tgaagttccgccgcaaggctcg
sulII-FW sul(II) tccggtggaggccggtatctgg 60.8 57.5 191
sulII-RV cgggaatgccatctgccttgag
sulIII-FW sul(III) tccgttcagcgaattggtgcag 60.0 61.0 128
sulIII-RV ttcgttcacgccttacaccagc
sulA-FW sul(A) tcttgagcaagcactccagcag 60.0 60.0 299
sulA-Rv tccagccttagcaaccacatgg
a FW, forward; RV, reverse.
WAT E R R E S E A R C H 4 0 ( 2 0 0 6 ) 2 4 2 7 – 2 4 3 52430
95 1C; 30 s at the annealing temperature (65 1C for sul(I), 57.7 1C
for sul(II), 60 1C for tet(W), and 50.3 1C for tet(O)); and 30 s at
72 1C (optical window on) followed by a final melt curve stage
with temperature ramping from 60 to 95 1C.
2.8. Q-PCR standard curves and quantification
To generate positive controls for calibration, genes from the
site sediment DNA extractions were PCR-amplified using
traditional PCR and cloned using the TOPA TA Cloning Kit
(Invitrogen, Carlsbad, CA). The log copy number of genes
permL DNA template solution for y-axis of the calibration
curve was calculated by
Log copy of genes=mL DNA ¼ logb� c
L� a� 1012, (1)
In which, a is the weight of kb DNA per pmol (1 kb DNA ¼
0:66mg=pmol), b the Avogadro’s constant (6.022�1023/mol),
L the length of template containing the target gene, c the
concentration of template in mg/mL.
Two approaches were taken to investigate the effect of the
DNA extraction matrix and the potential for threshold cycle
(CT) value suppression. (1) To determine if the concentration
of a background DNA affects the amplification of the desired
genes, two concentrations (140 ng/uL and 50 ng/mL) of addi-
tional non-target calf thymus DNA (BioRad, Hercules, CA) was
spiked into the calibration control templates. Ten-fold serial
dilutions of both solutions (140 ng/mL Calf thymus+3 ng/mL
desired gene and 50 ng/mL Calf thymus+3 ng/mL desired gene)
were made up to 10�10 to determine the detection limit. For
each type of gene, at least six replicates of 10 different
concentrations at two carrier DNA levels were used to create
the standard curves. The detection limit for each gene was
determined by the maximum dilution that produced a
consistent CT value (within 5%). (2) The impact of PCR
inhibitors potentially present in the DNA extract from the
sediments was also investigated. DNA extract from each of
the five sites was spiked with known amounts of template
and the difference in CT value between the matrix and the
control was determined. The matrix test was performed for
each of the four resistance genes at two different concentra-
tions of spiked template (10� and 100� of the concentration
of the sediment DNA) and a consistent value was obtained for
each DNA with respect to the percent suppression observed.
Correlation coefficients were more than 99% ðR240:99Þ for
all calibration curves, indicating that the relationship be-
tween the CT value and the log copy number of genes per Q-
PCR reaction was linear over 8 orders of magnitude. The levels
of detection (LOD) for sul(I), sul(II), tet(W), and tet(O) were
observed to be 8, 7, 1, and 1 copies of genes per 25mL assay,
respectively, which were then implemented as the level of
quantification (LOQ) in the calibration curves. It was deter-
mined that the background DNA concentration had no
significant effect on the amplification of target genes, as all
CT values fell within 5% of each other, regardless of the
concentration of calf thymus DNA. However, the matrix study
revealed that suppression of the CT value by the DNA extract
matrix was apparent and varied between sites. Little to no
suppression was observed in DNA extract from the pristine
site, while the matrix from the impacted sites lowered the
gene copy number estimate by as much as 20� and an
average of 4� . A suppression factor was determined for each
DNA matrix and primer combination as noted in Eq. (2),
where c is the number of templates enumerated in the
control, t is the number of templates enumerated in DNA
extraction matrix, and m is the number of templates
enumerated when the same control is spiked into the DNA
extraction matrix:
S ¼ ðcþ tÞCm. (2)
Quantification of ARG at the sites thus took into account the
mass of sediment extracted (0.5 g), any losses observed during
DNA cleaning steps (as a fraction), and the PCR suppression
factor. Therefore, the copy of genes/gram of sediment was
determined according to
gene copiesg sediment
¼ d�50mL DNA extract
0:5 g sediment
� �� e� S, (3)
where d is the copy of genes/mL DNA extract determined from
calibration curve, e is the correction factor for losses during
cleaning the DNA extract (1/loss fraction), and S is the matrix
suppression factor (Eq. (2)). Although several kits and condi-
tions were tested for Q-PCR, in general, it was found that
Q-PCR was more susceptible to DNA extraction matrix
ARTICLE IN PRESS
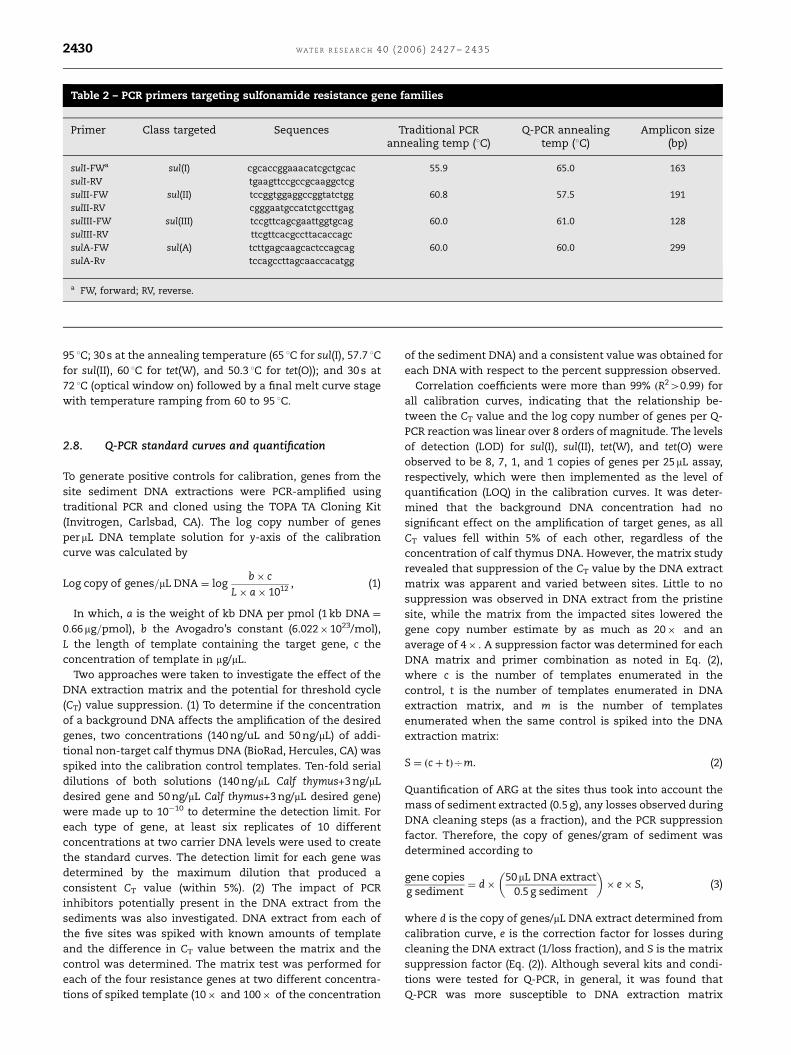
Fig. 1 – CFUs on antibiotic media normalized to CFUs on
media with no antibiotic added for the high-flow sampling
event.
WAT E R R E S E A R C H 40 (2006) 2427– 2435 2431
inhibition and thus the remaining genes were detected by
traditional PCR, but could not be quantified by Q-PCR.
In order to account for potential changes in the overall size of
the microbial population at the sites, a standard curve was
generated using ‘‘universal’’ primers and a TaqMan probe
targeting Bacterial 16S rDNA as described in Suzuki et al. (2000).
2.9. Quantification of antibiotics
For quantification of antibiotics in sediments, Mcllvaine Buffer
solution (pH 4.0) was used to pre-extract tetracyclines and
sulfonamides from the solid phase to the liquid phase, followed
by solid phase extraction (SPE) to clean-up and concentrate the
sample. High-performance liquid chromatography tandem
mass spectrometry (HPLC/MS/MS) operated in positive mode
with electrospray ionization (ESI) was used to separate and
detect the tetracyclines and sulfonamides. Detailed information
on the quantification of tetracyclines and sulfonamides in
sediments is described elsewhere (Kim and Carlson, 2005).
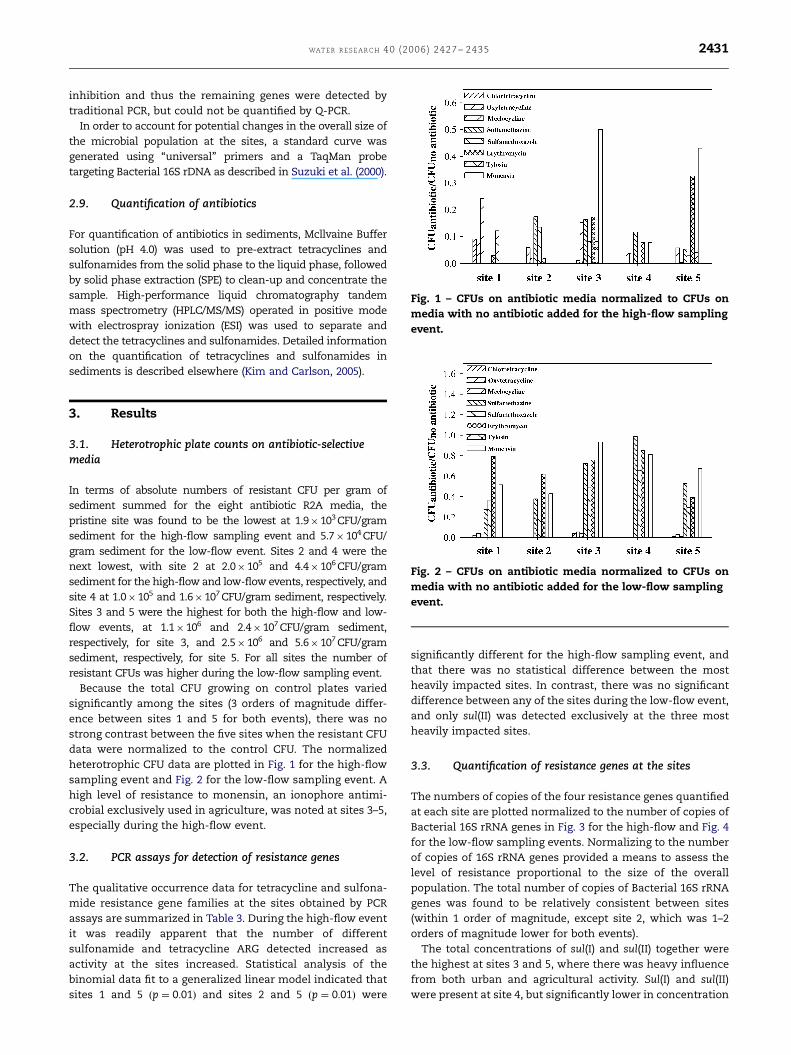
Fig. 2 – CFUs on antibiotic media normalized to CFUs on
media with no antibiotic added for the low-flow sampling
event.
3. Results
3.1. Heterotrophic plate counts on antibiotic-selectivemedia
In terms of absolute numbers of resistant CFU per gram of
sediment summed for the eight antibiotic R2A media, the
pristine site was found to be the lowest at 1.9�103 CFU/gram
sediment for the high-flow sampling event and 5.7�104 CFU/
gram sediment for the low-flow event. Sites 2 and 4 were the
next lowest, with site 2 at 2.0�105 and 4.4�106 CFU/gram
sediment for the high-flow and low-flow events, respectively, and
site 4 at 1.0�105 and 1.6�107 CFU/gram sediment, respectively.
Sites 3 and 5 were the highest for both the high-flow and low-
flow events, at 1.1�106 and 2.4�107 CFU/gram sediment,
respectively, for site 3, and 2.5�106 and 5.6�107 CFU/gram
sediment, respectively, for site 5. For all sites the number of
resistant CFUs was higher during the low-flow sampling event.
Because the total CFU growing on control plates varied
significantly among the sites (3 orders of magnitude differ-
ence between sites 1 and 5 for both events), there was no
strong contrast between the five sites when the resistant CFU
data were normalized to the control CFU. The normalized
heterotrophic CFU data are plotted in Fig. 1 for the high-flow
sampling event and Fig. 2 for the low-flow sampling event. A
high level of resistance to monensin, an ionophore antimi-
crobial exclusively used in agriculture, was noted at sites 3–5,
especially during the high-flow event.
3.2. PCR assays for detection of resistance genes
The qualitative occurrence data for tetracycline and sulfona-
mide resistance gene families at the sites obtained by PCR
assays are summarized in Table 3. During the high-flow event
it was readily apparent that the number of different
sulfonamide and tetracycline ARG detected increased as
activity at the sites increased. Statistical analysis of the
binomial data fit to a generalized linear model indicated that
sites 1 and 5 ðp ¼ 0:01Þ and sites 2 and 5 ðp ¼ 0:01Þ were
significantly different for the high-flow sampling event, and
that there was no statistical difference between the most
heavily impacted sites. In contrast, there was no significant
difference between any of the sites during the low-flow event,
and only sul(II) was detected exclusively at the three most
heavily impacted sites.
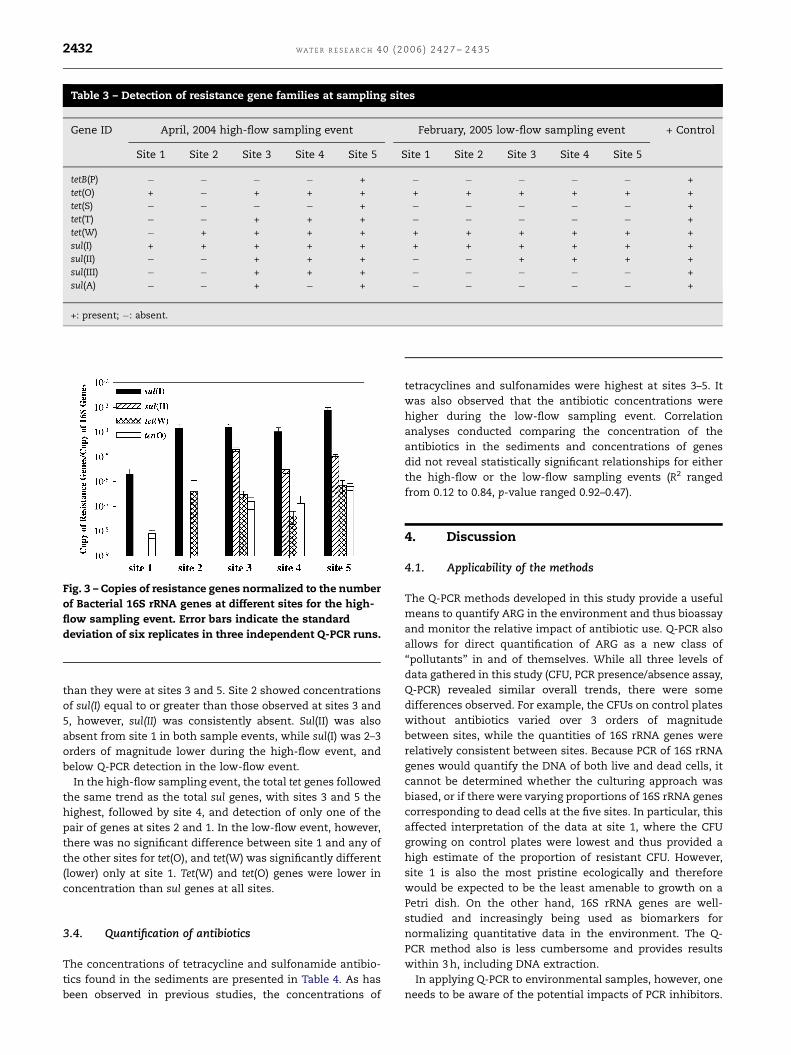
3.3. Quantification of resistance genes at the sites
The numbers of copies of the four resistance genes quantified
at each site are plotted normalized to the number of copies of
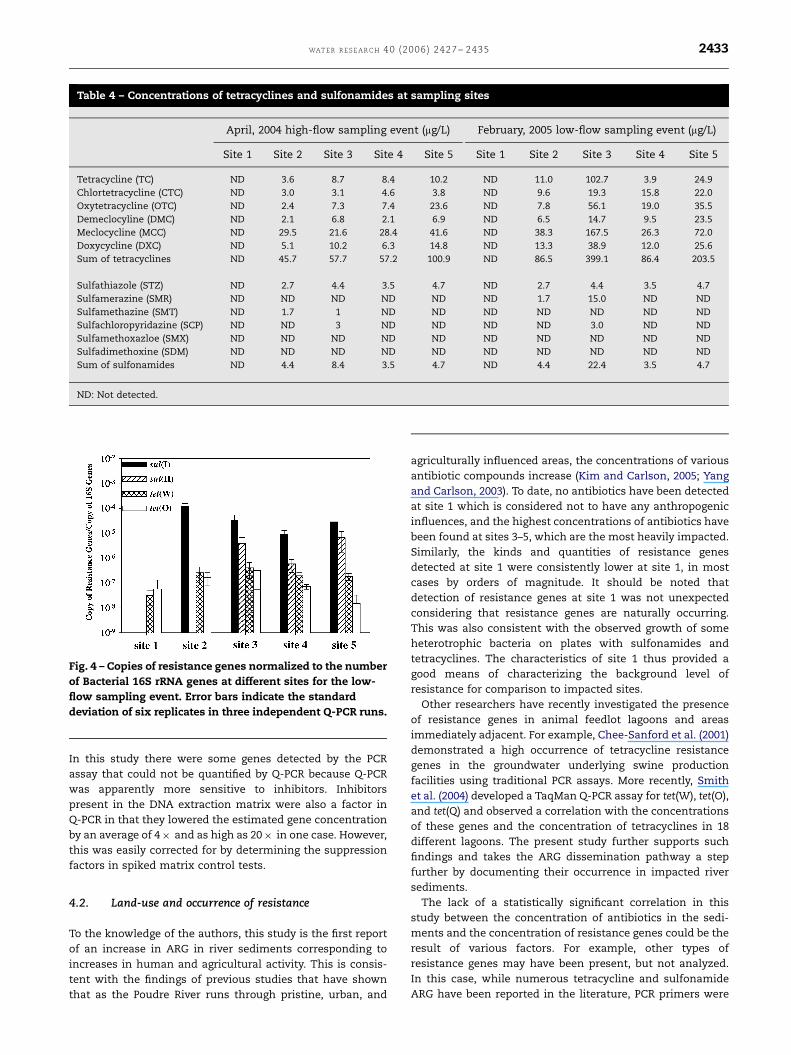
Bacterial 16S rRNA genes in Fig. 3 for the high-flow and Fig. 4
for the low-flow sampling events. Normalizing to the number
of copies of 16S rRNA genes provided a means to assess the
level of resistance proportional to the size of the overall
population. The total number of copies of Bacterial 16S rRNA
genes was found to be relatively consistent between sites
(within 1 order of magnitude, except site 2, which was 1–2
orders of magnitude lower for both events).
The total concentrations of sul(I) and sul(II) together were
the highest at sites 3 and 5, where there was heavy influence
from both urban and agricultural activity. Sul(I) and sul(II)
were present at site 4, but significantly lower in concentration
ARTICLE IN PRESS
Table 3 – Detection of resistance gene families at sampling sites
Gene ID April, 2004 high-flow sampling event February, 2005 low-flow sampling event + Control
Site 1 Site 2 Site 3 Site 4 Site 5 Site 1 Site 2 Site 3 Site 4 Site 5
tetB(P) � � � � + � � � � � +
tet(O) + � + + + + + + + + +
tet(S) � � � � + � � � � � +
tet(T) � � + + + � � � � � +
tet(W) � + + + + + + + + + +
sul(I) + + + + + + + + + + +
sul(II) � � + + + � � + + + +
sul(III) � � + + + � � � � � +
sul(A) � � + � + � � � � � +
+: present; �: absent.
Fig. 3 – Copies of resistance genes normalized to the number
of Bacterial 16S rRNA genes at different sites for the high-
flow sampling event. Error bars indicate the standard
deviation of six replicates in three independent Q-PCR runs.
WAT E R R E S E A R C H 4 0 ( 2 0 0 6 ) 2 4 2 7 – 2 4 3 52432
than they were at sites 3 and 5. Site 2 showed concentrations
of sul(I) equal to or greater than those observed at sites 3 and
5, however, sul(II) was consistently absent. Sul(II) was also
absent from site 1 in both sample events, while sul(I) was 2–3
orders of magnitude lower during the high-flow event, and
below Q-PCR detection in the low-flow event.
In the high-flow sampling event, the total tet genes followed
the same trend as the total sul genes, with sites 3 and 5 the
highest, followed by site 4, and detection of only one of the
pair of genes at sites 2 and 1. In the low-flow event, however,
there was no significant difference between site 1 and any of
the other sites for tet(O), and tet(W) was significantly different
(lower) only at site 1. Tet(W) and tet(O) genes were lower in
concentration than sul genes at all sites.
3.4. Quantification of antibiotics
The concentrations of tetracycline and sulfonamide antibio-
tics found in the sediments are presented in Table 4. As has
been observed in previous studies, the concentrations of
tetracyclines and sulfonamides were highest at sites 3–5. It
was also observed that the antibiotic concentrations were
higher during the low-flow sampling event. Correlation
analyses conducted comparing the concentration of the
antibiotics in the sediments and concentrations of genes
did not reveal statistically significant relationships for either
the high-flow or the low-flow sampling events (R2 ranged
from 0.12 to 0.84, p-value ranged 0.92–0.47).
4. Discussion
4.1. Applicability of the methods
The Q-PCR methods developed in this study provide a useful
means to quantify ARG in the environment and thus bioassay
and monitor the relative impact of antibiotic use. Q-PCR also
allows for direct quantification of ARG as a new class of
‘‘pollutants’’ in and of themselves. While all three levels of
data gathered in this study (CFU, PCR presence/absence assay,
Q-PCR) revealed similar overall trends, there were some
differences observed. For example, the CFUs on control plates
without antibiotics varied over 3 orders of magnitude
between sites, while the quantities of 16S rRNA genes were
relatively consistent between sites. Because PCR of 16S rRNA
genes would quantify the DNA of both live and dead cells, it
cannot be determined whether the culturing approach was
biased, or if there were varying proportions of 16S rRNA genes
corresponding to dead cells at the five sites. In particular, this
affected interpretation of the data at site 1, where the CFU
growing on control plates were lowest and thus provided a
high estimate of the proportion of resistant CFU. However,
site 1 is also the most pristine ecologically and therefore
would be expected to be the least amenable to growth on a
Petri dish. On the other hand, 16S rRNA genes are well-
studied and increasingly being used as biomarkers for
normalizing quantitative data in the environment. The Q-
PCR method also is less cumbersome and provides results
within 3 h, including DNA extraction.
In applying Q-PCR to environmental samples, however, one
needs to be aware of the potential impacts of PCR inhibitors.
ARTICLE IN PRESS
Table 4 – Concentrations of tetracyclines and sulfonamides at sampling sites
April, 2004 high-flow sampling event (mg/L) February, 2005 low-flow sampling event (mg/L)
Site 1 Site 2 Site 3 Site 4 Site 5 Site 1 Site 2 Site 3 Site 4 Site 5
Tetracycline (TC) ND 3.6 8.7 8.4 10.2 ND 11.0 102.7 3.9 24.9
Chlortetracycline (CTC) ND 3.0 3.1 4.6 3.8 ND 9.6 19.3 15.8 22.0
Oxytetracycline (OTC) ND 2.4 7.3 7.4 23.6 ND 7.8 56.1 19.0 35.5
Demeclocyline (DMC) ND 2.1 6.8 2.1 6.9 ND 6.5 14.7 9.5 23.5
Meclocycline (MCC) ND 29.5 21.6 28.4 41.6 ND 38.3 167.5 26.3 72.0
Doxycycline (DXC) ND 5.1 10.2 6.3 14.8 ND 13.3 38.9 12.0 25.6
Sum of tetracyclines ND 45.7 57.7 57.2 100.9 ND 86.5 399.1 86.4 203.5
Sulfathiazole (STZ) ND 2.7 4.4 3.5 4.7 ND 2.7 4.4 3.5 4.7
Sulfamerazine (SMR) ND ND ND ND ND ND 1.7 15.0 ND ND
Sulfamethazine (SMT) ND 1.7 1 ND ND ND ND ND ND ND
Sulfachloropyridazine (SCP) ND ND 3 ND ND ND ND 3.0 ND ND
Sulfamethoxazloe (SMX) ND ND ND ND ND ND ND ND ND ND
Sulfadimethoxine (SDM) ND ND ND ND ND ND ND ND ND ND
Sum of sulfonamides ND 4.4 8.4 3.5 4.7 ND 4.4 22.4 3.5 4.7
ND: Not detected.
Fig. 4 – Copies of resistance genes normalized to the number
of Bacterial 16S rRNA genes at different sites for the low-
flow sampling event. Error bars indicate the standard
deviation of six replicates in three independent Q-PCR runs.
WAT E R R E S E A R C H 40 (2006) 2427– 2435 2433
In this study there were some genes detected by the PCR
assay that could not be quantified by Q-PCR because Q-PCR
was apparently more sensitive to inhibitors. Inhibitors
present in the DNA extraction matrix were also a factor in
Q-PCR in that they lowered the estimated gene concentration
by an average of 4� and as high as 20� in one case. However,
this was easily corrected for by determining the suppression
factors in spiked matrix control tests.
4.2. Land-use and occurrence of resistance
To the knowledge of the authors, this study is the first report
of an increase in ARG in river sediments corresponding to
increases in human and agricultural activity. This is consis-
tent with the findings of previous studies that have shown
that as the Poudre River runs through pristine, urban, and
agriculturally influenced areas, the concentrations of various
antibiotic compounds increase (Kim and Carlson, 2005; Yang
and Carlson, 2003). To date, no antibiotics have been detected
at site 1 which is considered not to have any anthropogenic
influences, and the highest concentrations of antibiotics have
been found at sites 3–5, which are the most heavily impacted.
Similarly, the kinds and quantities of resistance genes
detected at site 1 were consistently lower at site 1, in most
cases by orders of magnitude. It should be noted that
detection of resistance genes at site 1 was not unexpected
considering that resistance genes are naturally occurring.
This was also consistent with the observed growth of some
heterotrophic bacteria on plates with sulfonamides and
tetracyclines. The characteristics of site 1 thus provided a
good means of characterizing the background level of
resistance for comparison to impacted sites.
Other researchers have recently investigated the presence
of resistance genes in animal feedlot lagoons and areas
immediately adjacent. For example, Chee-Sanford et al. (2001)
demonstrated a high occurrence of tetracycline resistance
genes in the groundwater underlying swine production
facilities using traditional PCR assays. More recently, Smith
et al. (2004) developed a TaqMan Q-PCR assay for tet(W), tet(O),
and tet(Q) and observed a correlation with the concentrations
of these genes and the concentration of tetracyclines in 18
different lagoons. The present study further supports such
findings and takes the ARG dissemination pathway a step
further by documenting their occurrence in impacted river
sediments.
The lack of a statistically significant correlation in this
study between the concentration of antibiotics in the sedi-
ments and the concentration of resistance genes could be the
result of various factors. For example, other types of
resistance genes may have been present, but not analyzed.
In this case, while numerous tetracycline and sulfonamide
ARG have been reported in the literature, PCR primers were
ARTICLE IN PRESS
WAT E R R E S E A R C H 4 0 ( 2 0 0 6 ) 2 4 2 7 – 2 4 3 52434
developed or applied for only 15 sul and tet genes total, nine of
which tested positive in the PCR assay, and only four were
quantified. To fully characterize the correlation, full discovery
and quantification of all resistance genes would be required.
It should also be pointed out that microbial populations may
retain resistance genes long after their initial exposure, which
could additionally contribute to a lack of direct correlation.
Also, lower concentrations of antibiotics may actually en-
hance the development of resistance, considering that very
high concentrations are often lethal even to resistant cells.
Such phenomena would be of significant interest in develop-
ing a model of understanding of the spread of ARG and
strategies for minimizing their impact. Recent work investi-
gating the fate of antibiotic resistant organisms in column
studies suggests that about one month was required for
resistance levels to return to baseline after tetracycline was
removed from the feed (Rysz and Alvarez, 2004).
4.3. Sulfonamide resistance genes
Sulfonamides are used both in animals and in humans,
though generally more-so in humans. This is because
sulfonamides are used primarily as therapeutic agents, rather
than as routine growth-promoters. The target of sulfonamide
antibiotics is the enzyme dihydropteroate synthase (DHPS) in
the folic acid pathway. Sul(I) and sul(II) are two alternative
sulfonamide resistant DHPS genes found in Gram-negative
bacteria (Skold, 2000). In a case study of pathogenic E. coli
from various livestock in Switzerland by Lanz et al. (2003),
about 70% of the sulfonamide-resistant isolates from pigs
could be explained by the presence of sul(I) and sul(II). Both of
these genes have also been detected in human pathogens
such as Salmonella typhimurium, E. coli, and Streptococcus
pneumoniae. The most commonly detected sulfonamide
resistance genes in this study were also mainly sul(I) and
sul(II), and based on the research of Lanz et al., their likely
inputs may be from the CAFOs that are prolific in northern
Colorado.
4.4. Tetracycline resistance genes
Tet(W) and tet(O) are both common in anaerobic intestinal and
rumen environments and both incur resistance by ribosomal
protection mechanisms (Barbosa et al., 1999; Taylor et al.,
1987). Tet(O) is found in both Gram-positive and Gram-
negative bacteria (Roberts, 1997), and approximate estimates
suggest that up to 5% of the bacteria in bovine rumen and
swine intestines may carry the tet(O) gene (Aminov et al.,
2001). Tet(W) is also found in bovine and sheep rumen as well
as human intestinal isolates (Melville et al., 2004; Scott et al.,
2000). In a study by Smith et al. (25) tet(O) and tet(W) along
with tet(Q) were the most commonly found tetracycline
resistance genes in 18 different feedlot lagoons. Thus, the
presence of the tet(W) and tet(O) resistance genes may be a
good indicator of fecal contamination from humans and/or
animals. If tet(O) and tet(W) are truly indicators of fecal
contamination, then the present study suggests that such
contamination is wide-spread at the impacted sites, espe-
cially during high-flow events, which may be the result of
transport of fecal bacteria in runoff. Tet genes may have been
lower at site 5 during the low-flow event, even though the
concentration of tetracyclines was double, because there was
less runoff. On the other hand, both tet(O) and tet(W) have
been cited as being promiscuous in their ability to spread
among and across populations (Billington et al., 2002; Smith
et al., 2004) and tet(W) in particular has recently been
identified as being associated with a conjugative transposon
(Melville et al., 2004). Examples of tet(W) carrying strains
include Mitsuokella multiacidus, Selenomonas ruminantium, and
Butyrivibrio fibrisolvens (Barbosa et al., 1999). Further investiga-
tion is needed in order to determine whether horizontal gene
transfer interferes with the use of these genes as indicators of
fecal sources of ARG.
5. Conclusions
This study demonstrates a relationship between human and
agricultural activity and elevated levels of ARG in river
sediments using quantitative molecular tools. This is an
important step in developing a paradigm for ARG as environ-
mental contaminants. Further study is needed in order to
better understand the relationship between the use of
antibiotics in humans and animals and the spread of ARG.
In particular, the relationship between the transport of
antibiotics and the transport of ARG in the environment has
not been defined. For example, in this study it is not clear
whether the elevated levels of resistance quantified in the
river sediments were a result of antibiotic selection taking
place in the sediments, or if selection occurred upstream and
the resistant microbes were later transported there.
Another important area of future work will be to build a
better understanding and separation of human and animal
sources. Source tracking methods for resistance genes need
to be further developed and applied to accomplish this. Even
if it becomes possible to clearly distinguish human and
agricultural sources of ARG, it will still be important to
consider that even antibiotics used exclusively for agriculture
have been demonstrated to co-select for microbial resistance
to a variety of antibiotics. A better understanding of the
sources and fates of antibiotics and ARG will facilitate
improved modeling of the ultimate impact of antibiotic use
on human, animal, and environmental health and may
ultimately be applied in developing strategies to mitigate
potentially adverse impacts.
Acknowledgments
This research was financially supported by the US Depart-
ment of Agriculture National Research Initiative (NRI) Water-
sheds Program.
R E F E R E N C E S
Aminov, R.I., Garrigues-Jeanjean, N., Mackie, R.I., 2001. Molecularecology of tetracycline resistance: development and validationof primers for detection of tetracycline resistance genesencoding ribosomal protection proteins. Appl. Environ.Microbiol. 67, 22–32.
ARTICLE IN PRESS
WAT E R R E S E A R C H 40 (2006) 2427– 2435 2435
ASM-American Society of Microbiology, 2002. The role of anti-biotics in agriculture. In: Issacson, R.E., Torrencem, M.E. (Eds.),Report from a Colloquium Sponsored by the AmericanAcademy of Microbiology, November 2–4, 2001, Santa Fe, NM.
Barbosa, T.M., Scott, K.P., Flint, H.J., 1999. Evidence for recentintergeneric transfer of a new tetracycline resistance gene,tet(W), isolated from Butyrivibrio fibrisolvens, and the occur-rence of tet(O) in ruminal bacteria. Environ. Microbiol. 1,53–64.
Billington, S.J., Songer, J.G., Jost, B.H., 2002. Widespread distribu-tion of a Tet W determinant among tetracycline-resistantisolates of the animal pathogen Arcanobacterium pyogenes.Antibicrob. Agents Chemother. 46, 1281–1287.
Chee-Sanford, J.C., Aminov, R.I., Krapac, I.J., Garrigues-Jeanjean,N., Mackie, R.I., 2001. Occurrence and diversity of tetracyclineresistance genes in lagoons and groundwater underlying twoswine production facilities. Appl. Environ. Microbiol. 67,1494–1502.
Elmund, G.K., Morrison, S.M., Grant, D.W., Nevins, M.P., 1971. Roleof excreted chlortetracycline in modifying the decompositionprocess in feedlot waste. Bull. Environ. Contam. Toxicol. 6,129–135.
Feinman, S.E., Matheson, J.C., 1978. Draft environmental impactstatement: subtherapeutic antibacterial agents in animalfeeds. Food and Drug Administration Department of Health,Education and Welfare Report, p. 372. Food and Drug Admin-istration, Washington, DC.
Goni-Urriza, M., Capdepuy, M., Arpin, C., Raymond, N., Caumette,P., Quentin, C., 2000. Impact of an urban effluent on antibioticresistance of riverine Enterobacteriaceae and Aeromonas spp.Appl. Environ. Microbiol. 66, 125–132.
Guardabassi, L., Petersen, A., Olsen, J.E., Dalsgaard, A., 1998.Antibiotic resistance in Acinetobacter spp. isolated from sewersreceiving waste effluent from a hospital and a pharmaceuticalplant. Appl. Environ. Microbiol. 64, 3499–3502.
Haapapuro, E.R., Barnard, N.D., Simon, M., 1997. Review-animalwaste used as livestock feed: dangers to human health. Prev.Med. 26, 599–602.
Huber, W.G., 1971. Antibacterial drugs as environmental con-taminants. Adv. Environ. Sci. Technol. 2, 289–320.
Kalendar, R., 2004. FastPCR, PCR primer design, DNA and proteintools, repeats and own database searches program. (Online)/http://www.biocenter.helsinki.fi/bi/bare-1_html/manual.htmS.
Kim, S.C., Carlson, K.H., 2005. Quantification of human andveterinary antibiotics in water and sediments using SPE/LC/MS/MS method. Anal. Bioanal. Chem., in press
Kolpin, D.W., Furlong, E.T., Meyer, M.T., Thurman, E.M., Zaugg,S.D., Barber, L.B., Buxton, H.T., 2002. Pharmaceuticals, hor-mones, and other organic wastewater contaminants in USstreams, 1999–2000: a national reconnaissance. Environ. Sci.Technol. 36, 1202–1211.
Lanz, R., Kuhnert, P., Boerlin, P., 2003. Antimicrobial resistanceand resistance gene determinants in clinical Escherichia colifrom different animal species in Switzerland. Vet. Microbiol.91, 73–84.
Levy, S.B., 1998. The challenge of antibiotic resistance. Sci. Am.278, 46–53.
Melville, C.M., Brunel, R., Flint, H.J., Scott, K.P., 2004. TheButyrivibrio fibrisolvens tet(W) gene is carried on the novelconjugative transposon TnB1230, which contains duplicatednitroreductase coding sequences. Appl. Environ. Microbiol.186, 3656–3659.
Pereten, V., Boerlin, P., 2000. A new sulfonamide resistancegene (sul3) in Escherichia coli is widespread in the pigpopulation of Switzerland. Antimicrob. Agents Chemother.47, 1169–1172.
Roberts, M.C., 1997. Genetic mobility and distribution of tetra-cycline determinants. Antibiotic Resistance. Origins, Evolu-tion, Selection and Spread. Ciba Foundation Symposium, vol.207, Wiley, Chichester, pp. 206–222.
Rysz, M., Alvarez, P.J.J., 2004. Amplification and attenuation oftetracycline resistance in soil bacteria: aquifer column ex-periments. Water Res. 38, 3705–3712.
Scott, L.P., Melville, C.M., Barbosa, T.M., Flint, H.J., 2000. Occur-rence of new tetracycline resistance gene tet(W) in bacteriafrom the human gut. Antimicrob. Agents Chemother. 44,775–777.
Skold, O., 2000. Sulfonamide resistance: mechanisms and trends.Drug Resist. Updates 3, 155–160.
Smith, M.S., Yang, R.K., Knapp, C.W., Niu, Y., Peak, N., Hanfelt,M.M., Galland, J.C., Graham, D.W., 2004. Quantification oftetracycline resistance genes in feedlot lagoons by real-timePCR. Appl. Environ. Microbiol. 70, 7372–7377.
Suzuki, M.T., Taylor, L.T., DeLong, E.F., 2000. Quantitative analysisof Small-subunit rRNA genes in mixed microbial populationsvia 5’-nuclease assays. Appl. Environ. Microbiol. 66, 4605–4614.
Sweeten, J.M., 1992. Livestock and poultry waste management: anational overview. In: Blake, J., Donald, J., Magette, W. (Eds.),National Livestock, Poultry, and Aquaculture Waste Manage-ment. American Society of Agricultural Engineering, St.Joseph, MI, pp. 4–15.
Taylor, D.E., Hiratsuka, K., Ray, H., Manavathu, E.K., 1987.Tetracycline resistance mediated by ribosomal protection.Antimicrob. Agents Chemother. 40, 1–5.
Thompson, J.D., Gibson, T.J., Plewniak, F., Jeanmougin, F., Higgins,D.G., 1997. The CLUSTAL_X windows interface: flexible stra-tegies for multiple sequence alignment aided by qualityanalysis tools. Nucl.Acid Res. 24, 4876–4882.
Yang, S., Carlson, K.H., 2003. Evolution of antibiotic occurrence ina river through pristine, urban and agricultural landscapes.Water Res. 37, 4645–4656.
Yang, S., Carlson, K.H., 2004a. Solid-phase extraction-high-performance liquid chromatography-ion trap mass spectro-metry for analysis of trace concentration of macrolideantibiotics in nature and wastewater matrices. J. Chromatogr.A 1038, 141–155.
Yang, S., Carlson, K.H., 2004b. Routine monitoring of antibiotics inwater and wastewater with a radioimmunoassy technique.Water Res. 38, 3155–3166.
Yang, S., Cha, J., Carlson, K.H., 2004. Quantitative determinationof trace concentration of tetracycline and sulfonamide anti-biotics in surface water using solid-phase extraction andliquid chromatography/ion trap tandem mass spectrometry.Rapid Commun. Mass Spectrom. 18, 2131–2145.