Embed Size (px)
Citation preview
Ekonomický časopis, 62, 2014, č. 2, s. 167 – 184 167
Economic Impact of Natural Gas Supply Disruptions – Case of Slovakia 1
Lucia FAŠUNGOVÁ* – Marek RADVANSKÝ** 1
Abstract
European energetic safety is belongs to the most discussed economic issues. This paper analyses impact of sudden, large-scale and persistent gas supply disruptions on the economy. This situation has been observed in real economy, more particularly in Central Europe and Balkan countries during Russia-Ukraine gas crisis at January 2009, where the gas supply was cut-off for 13 days. We will analyse the effects of this cut on Slovak economy, which belongs to one of the most affected. Economic analysis will be based on Computed General Equilibrium methodology – CGE model. Our aim is to estimate gas failure as an exogenous non-marginal supply shock with serious impact on aggregated and structural economic indicators. First quick estimation about possible daily losses at level about one third of daily GDP was confirmed. As a result of this disruption, there was implemented project in Slovakia to allow full reverse flow at main pipeline from Czech Republic. Slovakia can be now supplied from the west in case of unpredictable situation. Keywords: general equilibrium modelling, gas supply, cut-off, international trade JEL Classification: C68, L95, Q34, Q43
1. Introduction
Currently, the most discussed problem is the influence of the financial crisis on economy. In some European countries the onset of the crisis has been aggra-vated by the interruption of gas supplies from Russia. Due to its full dependence on Russian gas Slovakia was one of the countries most affected. As a result of
* Lucia FAŠUNGOVÁ Comenius University, Faculty of Mathematics, Physics and Informa-tics, Mlynská dolina, 842 48 Bratislava, Slovakia; e-mail: [email protected]
** Marek RADVANSKÝ Institute of Economic Research, Slovak Academy of Sciences, Šancová 56, 811 05 Bratislava, Slovakia; e-mail: [email protected] 1 This work was supported by the Slovak Research and Development Agency under the con-tract APVV-0135-10.
168
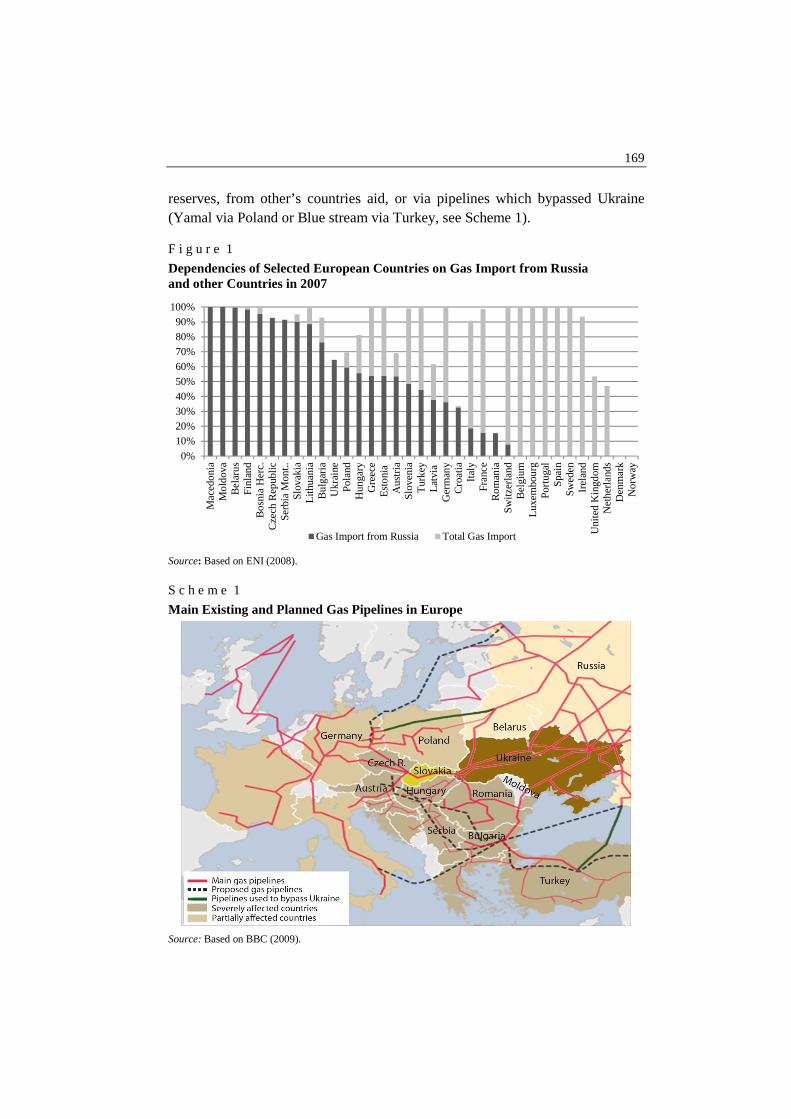
unsuccessful negotiations between Russia and Ukraine, on 6th January 2009 gas supply from Russia to Slovakia has been stopped. Slovakia started to supply households and firms from strategic reserves, but gas consumption of the largest consumers was restricted by the authorities. Large producers reduced or com-pletely interrupted their production. The economy of gas-thirsty Slovakia had started to return to its normal pulse on January 19th when reverse flows through the pipeline from the Czech Republic was established. This supply route by-passed Ukraine and allowed the restrictions in Slovakia to be lifted. The cut-off gas supply and production lasted for 13 days. On January 21st gas supply through the standard Ukrainian route was resumed. An estimation of the macroeconomic influence of the interruption or re-striction of the gas supply to the national economy is the main objective of this paper. Both long-term and short-term effects will be discussed. This study re-flects generally the situation in countries of East and Central Europe which were most hit by worsened relations between Russia and Ukraine. The paper is fo-cused on the Slovak economy, which was completely dependent on Russian gas supply during this „gas crisis“. The study serves as a forecast for other countries for the case of a cut-off of gas supply. The structure of this paper is as follows. The next section looks at the dependency of EU countries on gas imports. After-wards, we will explain situation in Slovakia during “gas crisis” and continue to theoretical model. Empirical estimation will illustrate the possible impact on economy, which will be concluded at discussion part. 1.1. Dependence on Gas Imports in European Union The analysis of OECD (2006) shows that more than 80% of Russian gas export to Europe goes via pipelines in Ukraine. According to Eurostat (2008), the total dependence of the European Union countries (EU-27) on external supply of natu-ral gas amounts to 60% (60.8% in 2007), about 25% of the deliveries are coming from Russia (see Figure 1). The crisis naturally affected in the first place countries, which were nearly 100% dependent on gas from Russia via pipelines in Ukraine. Those were the Central European and Baltic countries: Slovakia, Hungary, Bulgar-ia, Romania, Macedonia, Bosnia and Herzegovina, Serbia and Montenegro. Only few countries were not able to supply households in January. Bulgaria had to reduce the gas consumption in industries sharply after few days after the interruption of gas supplies. One week later Bulgaria had to reduce also the sup-ply to households. Things were even worse in Moldavia. Their enterprises and households were totally cut from gas supplies after just few hours from the be-ginning of the crisis, because of no gas reserves in that country. Other countries were able to supply households and a part of industries either from their own
169
reserves, from other’s countries aid, or via pipelines which bypassed Ukraine (Yamal via Poland or Blue stream via Turkey, see Scheme 1). F i g u r e 1
Dependencies of Selected European Countries on Gas Import from Russia and other Countries in 2007
Source: Based on ENI (2008). S c h e m e 1
Main Existing and Planned Gas Pipelines in Europe
Source: Based on BBC (2009).
0%
10%20%30%
40%50%
60%70%80%
90%100%
Ma
cedo
nia
Mo
ldov
aB
ela
rus
Fin
land
Bo
snia
He
rc.
Cze
ch R
epub
licS
erb
ia M
ont
..S
lova
kia
Lith
uani
aB
ulg
aria
Ukr
aine
Pol
and
Hun
gary
Gre
ece
Est
oni
aA
ustr
iaS
love
nia
Tur
key
Latv
iaG
erm
any
Cro
atia
Italy
Fra
nce
Ro
man
iaS
witz
erla
ndB
elg
ium
Luxe
mbo
urg
Por
tuga
lS
pain
Sw
ede
nIr
ela
ndU
nite
d K
ingd
omN
eth
erla
nds
De
nma
rkN
orw
ay
Gas Import from Russia Total Gas Import
170
The European Union, despite of its oil reserves (90-days2), doesn’t regulate strategic reserves of natural gas. The last European document about security of gas supplies was a Council Directive3 of 2004, which merely suggests building up reserves to avoid short gas supply and price shocks in Europe. The supply crisis from January 2009 renewed the dialogue about mandatory gas strategic reserves in EU. 1.2. Case of Slovakia The effect of the interruption of gas supply from Ukraine to Slovakia was almost immediate. In January 2009, Slovakia had gas reserves, but its larger part was not controlled by state, because the reserve storage places were sold to pri-vate companies during the privatization. The rest of them were able to compen-sate missing gas for about 30% of consumption only. Restrictions in Slovakia were put in place on January 6th. Large commercial customers and businesses whose contracted gas consumption exceeded 60,000 cubic metres per year had to reduce their gas usage to a minimum safety level. Estimations about available gas reserves varied from too pessimistic 10 to rather too optimistic 30 days and were uncertain. Because of the threat of the failure of electricity generators po-wered by gas the government considered the activation of the nuclear plant in Mochovce as a controversial policy option, although this nuclear power plant has been closed following the EU accession agreement. A partial solution came on January 19th. Slovakia began receiving deliveries via the Czech Republic by the reverse flow in the pipeline by a route which by-passed Ukraine. This allowed restrictions on natural gas use to be lifted. This reverse flow was activated for the first time during over 40 years of the pipeline. The cut-off gas supply and production lasted for 13 days. On January 21st gas supply via the normal route through Ukraine was resumed. The estimation of the economic costs began. 1.3. Modelling Approach While the main idea for the article comes out of a real situation, there are no similar articles or research topic discussed in the literature. Therefore we decided to combine two approaches: the qualitative one based on the potential product estimation and quantitative general equilibrium modelling approach.
2 In the European Union, according to Council Directive 98/93/ES from 14 December 1998, all 27 members must have a strategic oil reserves equal to at least 90 days of average daily consump-tion (EUR-Lex, 1998). 3 Council Directive 2004/67/EC of 26 April 2004 concerning measures to safeguard security of natural gas supply. Available at: <http://eur-lex.europa.eu/LexUriServ/LexUriServ.do?uri=CELEX:32004L0067:EN:HTML>.
171
Our initial rough estimation was based on a simple calculation under the as-sumption of a lower economic output. Information from main Slovak producers indicated, that the economy was working only at about 60% of its potential. Na-tional regulation degree eight4 meant that producers had to cut their gas energy consuming activities to the minimum safety level. Based on information from the producers we have estimated the drop of production to about 40%. This amounts the total daily losses of about EUR 33 – 38 million. The 13 day interruption of gas-supply, excluding any other external influences (e.g. impact of world eco-nomic crisis), thus might represent 0.6 – 0.7 percentage point (p. p.) slowdown in GDP growth compared to earlier prognoses. We estimate that total losses from restricted production represent EUR 430 – 500 million. For the case of a longer interruption of gas supplies, we estimate and increase of daily GDP losses to about EUR 103 million (Pravda, 2009). This is equivalent to a daily drop of 0.1 p. p. of GDP. We will discuss these results in concluding part of this paper. 2. Introduction to the CGE Model In order to quantify the macroeconomic impact of interrupted gas supply to the economy, a Computational General Equilibrium (CGE) model is used. CGE model is a macroeconomic tool widely used in economic modelling for quantify-ing short-term (possibly also mid-term) impacts of shocks to the economy. These shocks are considered to have fiscal character (tax changes, changes in govern-ment consumption, etc.), or character of supply shock (the case of gas crises) or price shocks. The main advantage of these models is their deeper structural character which is allowed by the inclusion of the SAM (Social Accounting Matrix) table. The latter enables us to analyse non-marginal changes not only in main macroeco-nomic indicators (GDP, employment, value-added, consumer’s income), but in the indicators of disaggregated production (NACE classification) as well. 2.1. Model Structure in Context of Scenario Our aim is to estimate gas failure as an exogenous non-marginal supply shock with serious impact on aggregated and structural economic indicators. A procedure to assess the effect of gas reduction by a CGE model was developed earlier in 2007 (see Renčko et al., 2008), where cut import in mining sector was simulated.
4 National Regulation degree of gas consumption indicates the amount of current supply for consumers in 10 levels. The normal degree of unlimited supply to all consumers is 3, emergency level is 10, when gas supplies are fully terminated for all consumers.
172
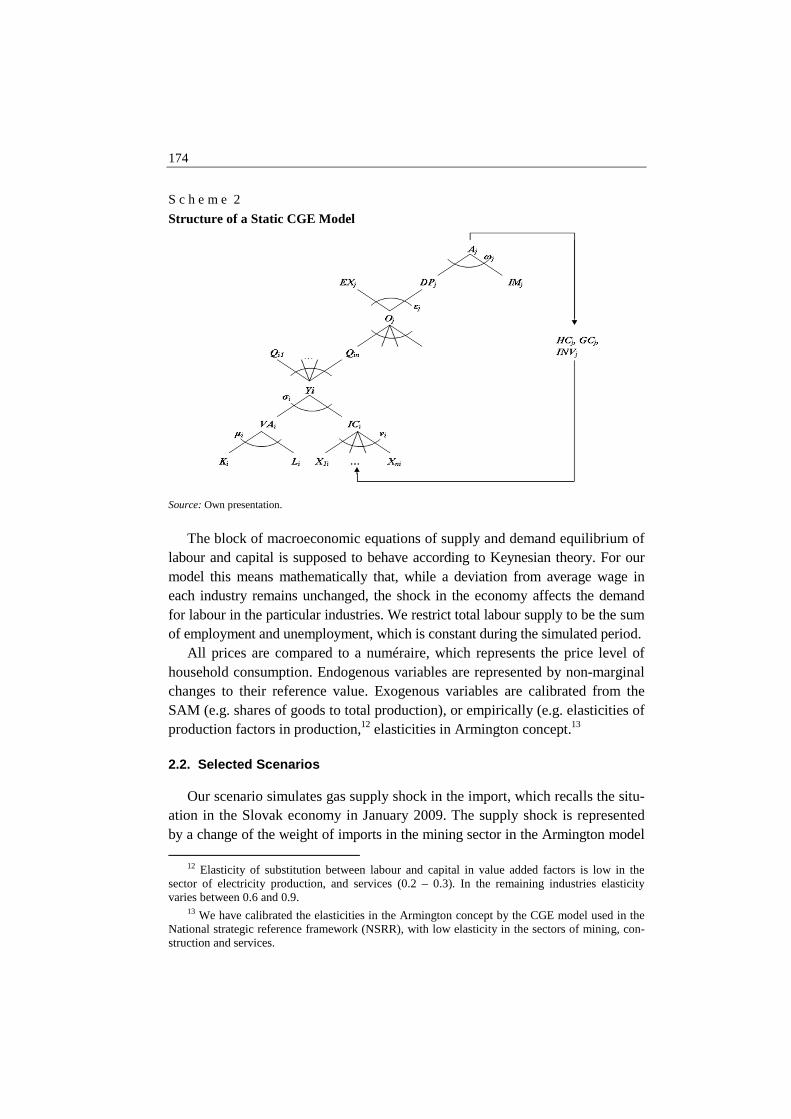
After certain time, this scenario appears to be realistic, because in the beginning of year 2009, gas supplies to Slovak Republic have been interrupted. After the gas crisis we rebuilt our model with more actual data and enhanced it structurally to describe relations among consumers more deeply. The model is based on a SAM, which has its origin in the Supply and Use tables and National Accounts for Slovakia in 2005.5 Production is aggregated into seven main production sectors (agriculture, mining, heavy industry, light industry, power industry, construction and services).6 The sector of mining has been considered separately because it includes gas extraction.7 Production is based on a nested production function divided into two levels. The upper level represents aggregate output (Yi) based on a Leontief production function. This output uses aggregated net production (VAi) and intermediate consumption (ICi) which enters as production factors (obtained in the lower level of the nested pro-duction function). Factor inputs include labour (Li) and capital (Ki), which are substitutable to some degree8 (represented by Constant Elasticity of Substitution function CES). Intermediate consumption of factors (X1i – Xni) in the particular sector i are not substitutable at all; therefore it is represented by the Leontief function.9 International trade is modelled by the Armington concept. That means that the total output (Oj) of the economy is divided into commodities for export (EXj) and for domestic market (DPj). This is reflected by the Constant Elasticity of Transformation function (CET). Imports (IM j), with commodities for the domes-tic market (DPj) are aggregated into the supply (Aj) of j th commodity on domestic market using the CES function. Greek symbols ωj, εj, σj, μj (Scheme 1) represent weights of inputs for particular output (called also “shares”). The equations of the Armington concept are crucial for the model because it enable us to simulate gas interruptions through the change of share value of im-
port in the mining sector. 1
(1 )j j jj j j j jA IM DP
ρ ρ ρα α = + −
(1) ρj ≤ 1 ^ ρj ≠ 0, j = {set of commodities}.
5 SAM is published in SKK currency, but for the needs of our analyses is expressed in Euro by using actual conversion rate 30. 1260 SKK/EUR. 6 According to Classification of Economic Activities sectors are aggregated as follow: agricul-ture x1 – x5, mining x10 – x14, heavy industry x24 and x29 – x35, light industry x15 – x23 and x25 – x28 and x36 – x37, power industry x40 – x41, construction x45, and services x50 – 95. 7 Classified as x11. 8 This choice depends on capital difficulty of production sector. 9 Mathematical notation of basic function used in CGE model – see Sekereš (2006).
173
The parameters ρj,,αj represent the elasticity of substitution and the share of the imported value of the j th commodity to supply j th commodity on domestic market, respectively. Considering the structure of a Leontief function and a Cobb-Douglas function as limited instance of CES function depending on elas-ticity of substitution, we set up elasticity of substitution for imported commodity in mining sector and domestic commodity in mining sector close to the Leontief limited case. We can simulate then real situation of limited Slovak gas sources, which cannot be substituted well when the imported supply decreases. Since the supply on the domestic market is created mainly by the imported commodity, there is an alternative to simulate such a situation. Another modelling approach for international trade may be consideration of supply on the domestic market to be exogenous (see Sekereš, 2006). However, aggregated mining sector includes not only gas commodity but also other minerals,10 we set up low level of substi-tution for CES function close to Leontief function. The second block of the equations consists of consumption and income redis-tribution11 balances. The final consumption of households (HCj) is modelled by maximizing the Cobb-Douglas utility function under budget constraints. The constraints consist of the total (mainly wage, domestic and foreign) income of households, social benefits and income from capital ownership. Demand for commodities is determined by the Marshallian demand functions maximizing utility under the income constraint. Government’s final consumption (GCj) is modelled by maximizing the Leontief utility function under the budgetary con-straints. Government income consists mainly of taxes, social contributions and income from property. Investments (INVj) are represented by demand for capital. Demand is derived by maximizing the Leontief utility function under the budg-etary constraints. Households are equipped by investments which yield them annual revenues from enterprises. For quantitative impact assessment we opted for static CGE model, which calculates the impact of non-marginal change of the shock. New equilibrium is then compared with benchmark level of economy (defined in SAM) without any time sequence. The model structure is schematically described by the following diagram (Scheme 2):
10 According to the SAM, anual import of gas commodity standed for 26% of mining sector import in Slovakia in 2005. 11 According to our SAM, this redistribution includes first and second use and redistribution of income among households, government and enterprises. The first redistribution represents income from property (especially interest, dividend, and reinvested profit from foreign direct investments), while the second one represents fiscal flows (mainly taxes, social contributions, and insurance payments).
174
S c h e m e 2
Structure of a Static CGE Model
Source: Own presentation.
The block of macroeconomic equations of supply and demand equilibrium of labour and capital is supposed to behave according to Keynesian theory. For our model this means mathematically that, while a deviation from average wage in each industry remains unchanged, the shock in the economy affects the demand for labour in the particular industries. We restrict total labour supply to be the sum of employment and unemployment, which is constant during the simulated period. All prices are compared to a numéraire, which represents the price level of household consumption. Endogenous variables are represented by non-marginal changes to their reference value. Exogenous variables are calibrated from the SAM (e.g. shares of goods to total production), or empirically (e.g. elasticities of production factors in production,12 elasticities in Armington concept.13 2.2. Selected Scenarios Our scenario simulates gas supply shock in the import, which recalls the situ-ation in the Slovak economy in January 2009. The supply shock is represented by a change of the weight of imports in the mining sector in the Armington model
12 Elasticity of substitution between labour and capital in value added factors is low in the sector of electricity production, and services (0.2 – 0.3). In the remaining industries elasticity varies between 0.6 and 0.9. 13 We have calibrated the elasticities in the Armington concept by the CGE model used in the National strategic reference framework (NSRR), with low elasticity in the sectors of mining, con-struction and services.
175
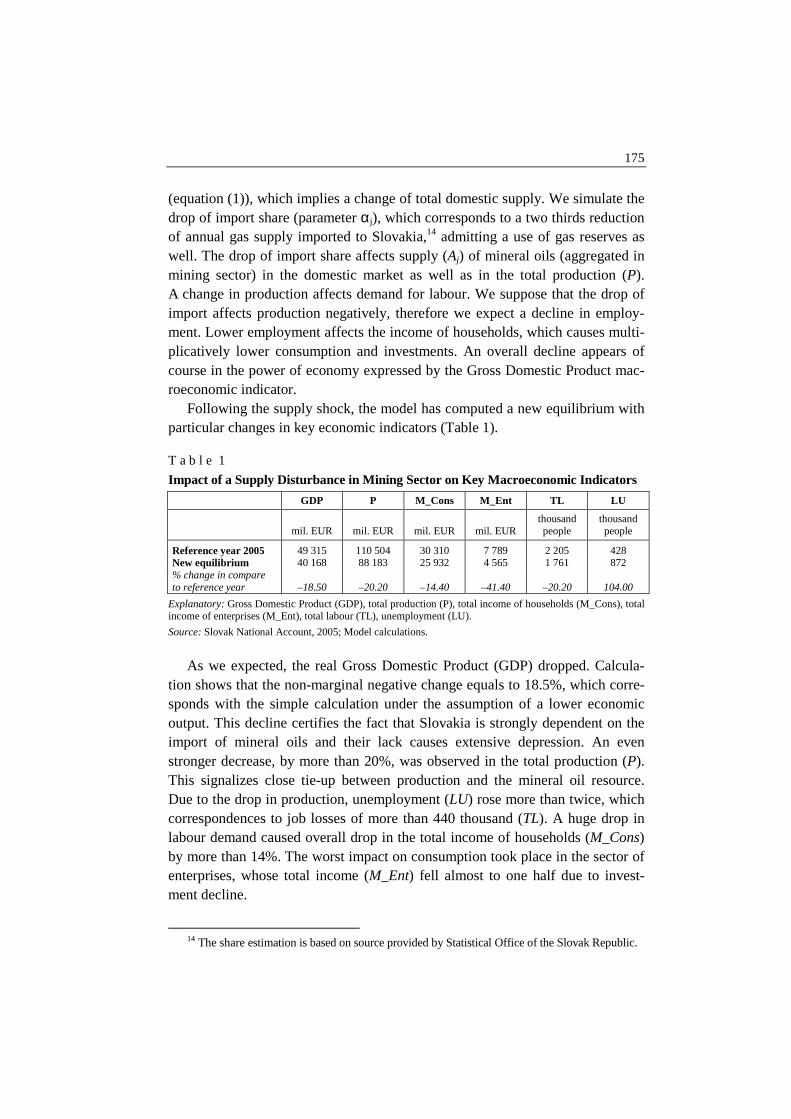
(equation (1)), which implies a change of total domestic supply. We simulate the drop of import share (parameter αj), which corresponds to a two thirds reduction of annual gas supply imported to Slovakia,14 admitting a use of gas reserves as well. The drop of import share affects supply (Aj) of mineral oils (aggregated in mining sector) in the domestic market as well as in the total production (P). A change in production affects demand for labour. We suppose that the drop of import affects production negatively, therefore we expect a decline in employ-ment. Lower employment affects the income of households, which causes multi-plicatively lower consumption and investments. An overall decline appears of course in the power of economy expressed by the Gross Domestic Product mac-roeconomic indicator. Following the supply shock, the model has computed a new equilibrium with particular changes in key economic indicators (Table 1). T a b l e 1
Impact of a Supply Disturbance in Mining Sector on Key Macroeconomic Indicators
GDP P M_Cons M_Ent TL LU
mil. EUR mil. EUR mil. EUR mil. EUR thousand people
thousand people
Reference year 2005 49 315 110 504 30 310 7 789 2 205 428 New equilibrium 40 168 88 183 25 932 4 565 1 761 872 % change in compare to reference year –18.50 –20.20 –14.40 –41.40 –20.20 104.00
Explanatory: Gross Domestic Product (GDP), total production (P), total income of households (M_Cons), total income of enterprises (M_Ent), total labour (TL), unemployment (LU). Source: Slovak National Account, 2005; Model calculations.
As we expected, the real Gross Domestic Product (GDP) dropped. Calcula-tion shows that the non-marginal negative change equals to 18.5%, which corre-sponds with the simple calculation under the assumption of a lower economic output. This decline certifies the fact that Slovakia is strongly dependent on the import of mineral oils and their lack causes extensive depression. An even stronger decrease, by more than 20%, was observed in the total production (P). This signalizes close tie-up between production and the mineral oil resource. Due to the drop in production, unemployment (LU) rose more than twice, which correspondences to job losses of more than 440 thousand (TL). A huge drop in labour demand caused overall drop in the total income of households (M_Cons) by more than 14%. The worst impact on consumption took place in the sector of enterprises, whose total income (M_Ent) fell almost to one half due to invest-ment decline.
14 The share estimation is based on source provided by Statistical Office of the Slovak Republic.
176
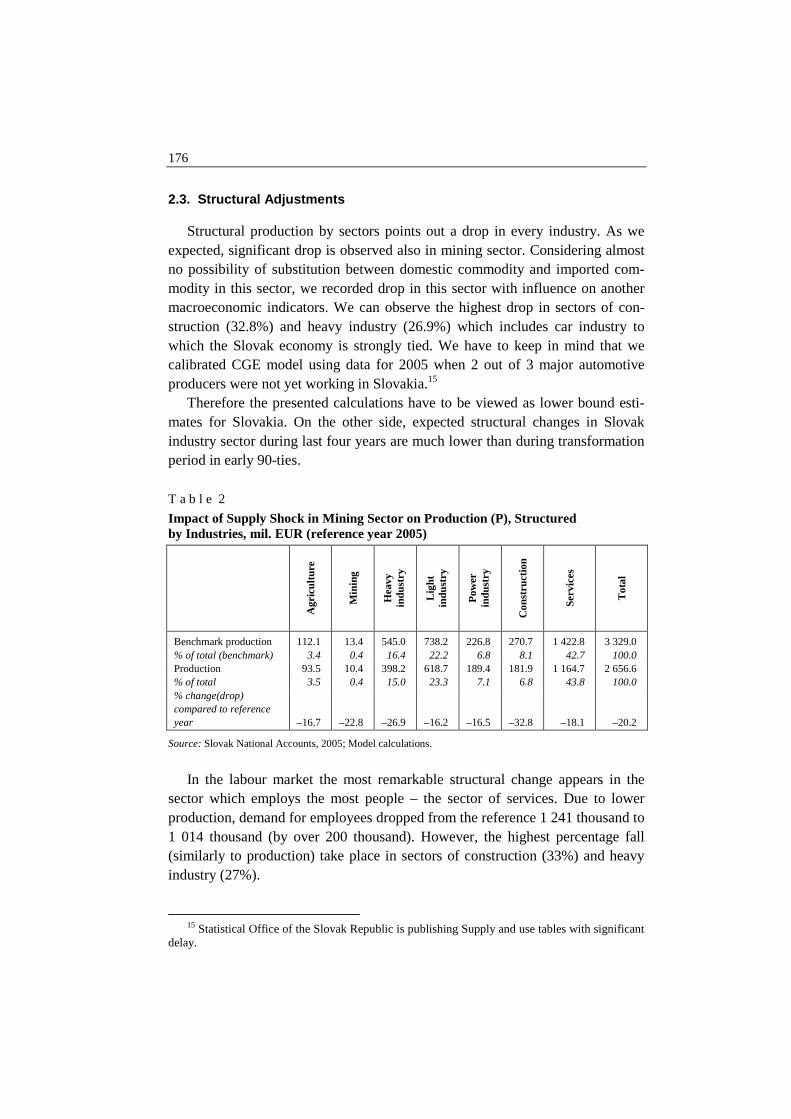
2.3. Structural Adjustments Structural production by sectors points out a drop in every industry. As we expected, significant drop is observed also in mining sector. Considering almost no possibility of substitution between domestic commodity and imported com-modity in this sector, we recorded drop in this sector with influence on another macroeconomic indicators. We can observe the highest drop in sectors of con-struction (32.8%) and heavy industry (26.9%) which includes car industry to which the Slovak economy is strongly tied. We have to keep in mind that we calibrated CGE model using data for 2005 when 2 out of 3 major automotive producers were not yet working in Slovakia.15 Therefore the presented calculations have to be viewed as lower bound esti-mates for Slovakia. On the other side, expected structural changes in Slovak industry sector during last four years are much lower than during transformation period in early 90-ties. T a b l e 2
Impact of Supply Shock in Mining Sector on Production (P), Structured by Industries, mil. EUR (reference year 2005)
Agr
icul
ture
Min
ing
Hea
vy
indu
stry
Ligh
t in
dust
ry
Pow
er
indu
stry
Con
stru
ctio
n
S
ervi
ces
T
otal
Benchmark production 112.1 13.4 545.0 738.2 226.8 270.7 1 422.8 3 329.0 % of total (benchmark) 3.4 0.4 16.4 22.2 6.8 8.1 42.7 100.0 Production 93.5 10.4 398.2 618.7 189.4 181.9 1 164.7 2 656.6 % of total 3.5 0.4 15.0 23.3 7.1 6.8 43.8 100.0 % change(drop) compared to reference year
–16.7
–22.8
–26.9
–16.2
–16.5
–32.8
–18.1
–20.2
Source: Slovak National Accounts, 2005; Model calculations.
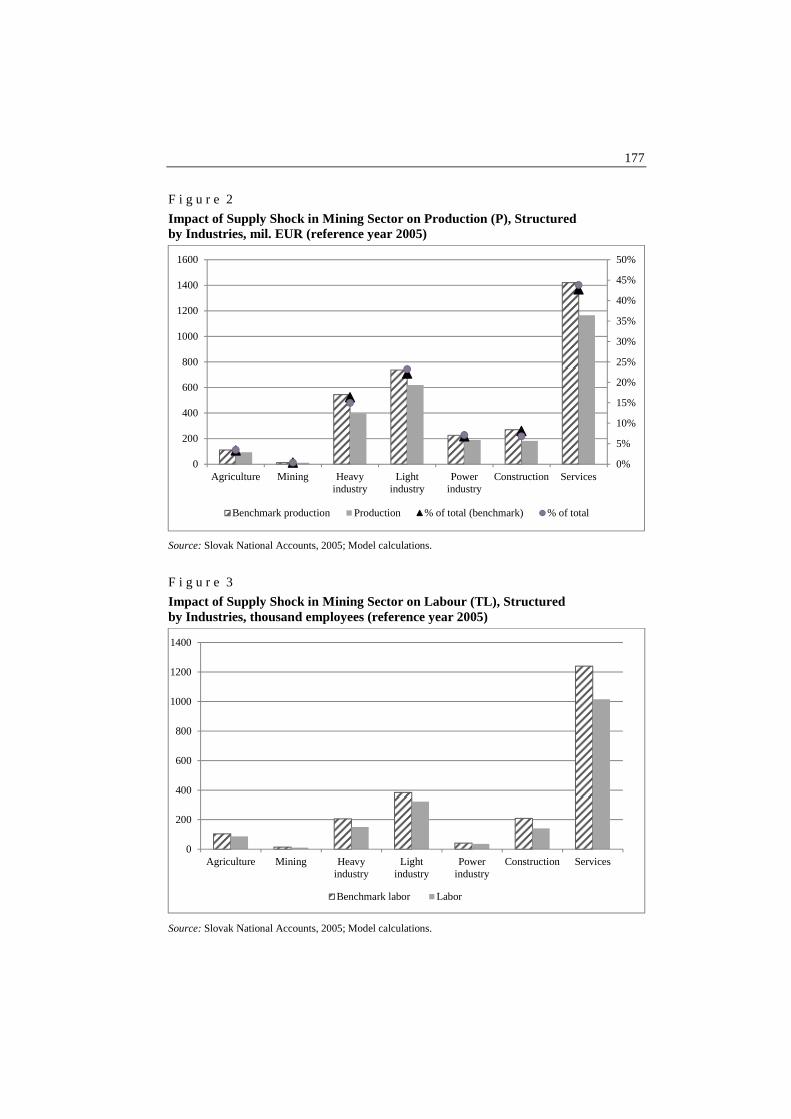
In the labour market the most remarkable structural change appears in the sector which employs the most people – the sector of services. Due to lower production, demand for employees dropped from the reference 1 241 thousand to 1 014 thousand (by over 200 thousand). However, the highest percentage fall (similarly to production) take place in sectors of construction (33%) and heavy industry (27%).
15 Statistical Office of the Slovak Republic is publishing Supply and use tables with significant delay.
177
F i g u r e 2
Impact of Supply Shock in Mining Sector on Production (P), Structured by Industries, mil. EUR (reference year 2005)
Source: Slovak National Accounts, 2005; Model calculations.
F i g u r e 3
Impact of Supply Shock in Mining Sector on Labour (TL), Structured by Industries, thousand employees (reference year 2005)
Source: Slovak National Accounts, 2005; Model calculations.
0%
5%
10%
15%
20%
25%
30%
35%
40%
45%
50%
0
200
400
600
800
1000
1200
1400
1600
Agriculture Mining Heavyindustry
Lightindustry
Powerindustry
Construction Services
Benchmark production Production % of total (benchmark) % of total
0
200
400
600
800
1000
1200
1400
Agriculture Mining Heavyindustry
Lightindustry
Powerindustry
Construction Services
Benchmark labor Labor
178
T a b l e 3
Impact of Supply Shock in Mining Sector on Labour (TL), Structured by Industries, thousand employees (reference year 2005)
Agr
icul
ture
Min
ing
Hea
vy
indu
stry
Ligh
t in
dust
ry
Pow
er
indu
stry
Con
stru
ctio
n
S
ervi
ces
T
otal
Benchmark labour 105.1 14.7 206.3 385.5 42.6 209.8 1 241.3 2 205.3 % of total (benchmark) 4.8 0.7 9.4 17.5 1.9 9.5 56.3 100.0 labour 86.9 11.0 150.3 321.8 35.5 140.5 1 014.7 1 760.8 % of total 4.9 0.6 8.5 18.3 2.0 8.0 57.6 100.0 Drop (% change) –17.4 –25.1 –27.1 –16.5 –16.6 –33.0 –18.3 –20.2
Source: Slovak National Accounts, 2005; Model calculations.
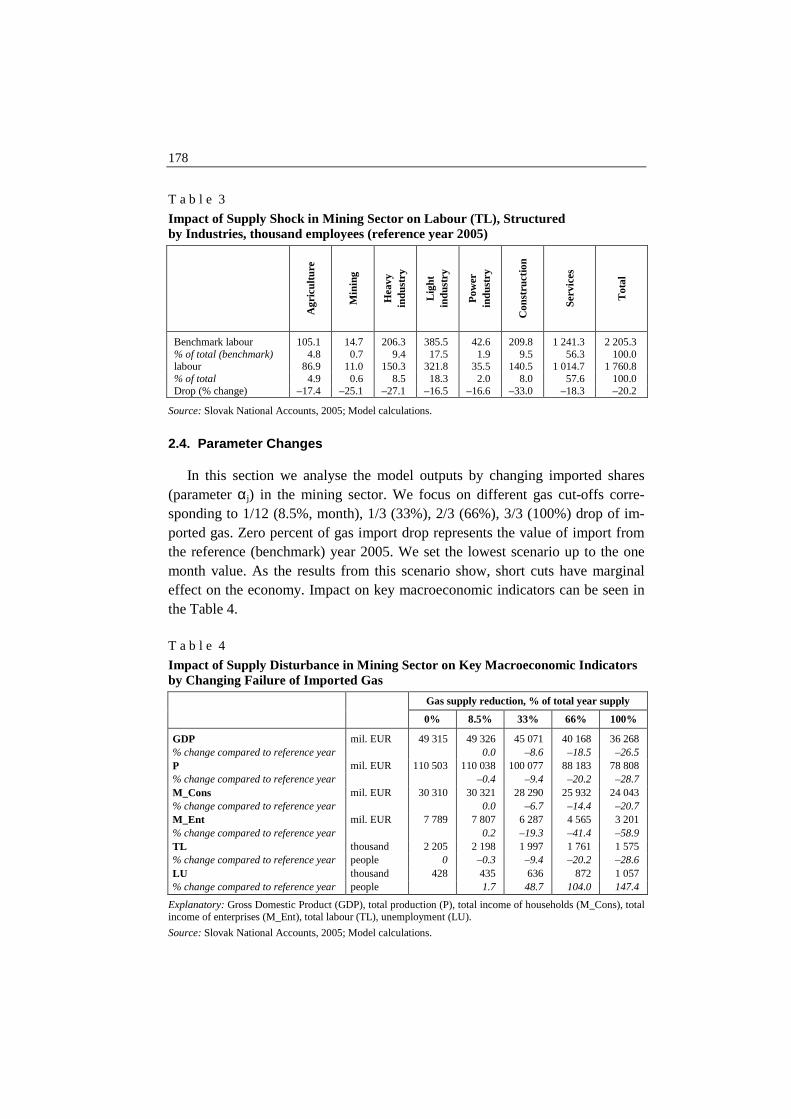
2.4. Parameter Changes In this section we analyse the model outputs by changing imported shares (parameter αj) in the mining sector. We focus on different gas cut-offs corre-sponding to 1/12 (8.5%, month), 1/3 (33%), 2/3 (66%), 3/3 (100%) drop of im-ported gas. Zero percent of gas import drop represents the value of import from the reference (benchmark) year 2005. We set the lowest scenario up to the one month value. As the results from this scenario show, short cuts have marginal effect on the economy. Impact on key macroeconomic indicators can be seen in the Table 4. T a b l e 4
Impact of Supply Disturbance in Mining Sector on Key Macroeconomic Indicators by Changing Failure of Imported Gas
Gas supply reduction, % of total year supply
0% 8.5% 33% 66% 100%
GDP mil. EUR 49 315 49 326 45 071 40 168 36 268 % change compared to reference year 0.0 –8.6 –18.5 –26.5 P mil. EUR 110 503 110 038 100 077 88 183 78 808 % change compared to reference year –0.4 –9.4 –20.2 –28.7 M_Cons mil. EUR 30 310 30 321 28 290 25 932 24 043 % change compared to reference year 0.0 –6.7 –14.4 –20.7 M_Ent mil. EUR 7 789 7 807 6 287 4 565 3 201 % change compared to reference year 0.2 –19.3 –41.4 –58.9 TL thousand 2 205 2 198 1 997 1 761 1 575 % change compared to reference year people 0 –0.3 –9.4 –20.2 –28.6 LU thousand 428 435 636 872 1 057 % change compared to reference year people 1.7 48.7 104.0 147.4
Explanatory: Gross Domestic Product (GDP), total production (P), total income of households (M_Cons), total income of enterprises (M_Ent), total labour (TL), unemployment (LU). Source: Slovak National Accounts, 2005; Model calculations.
179
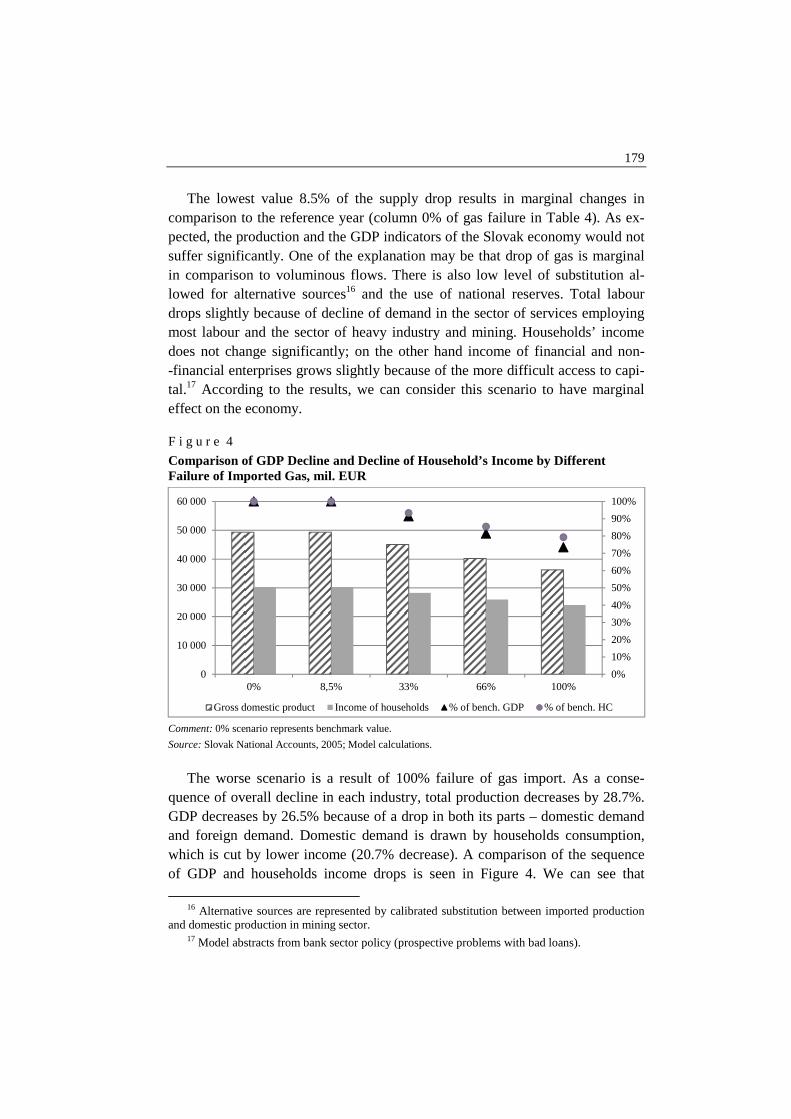
The lowest value 8.5% of the supply drop results in marginal changes in comparison to the reference year (column 0% of gas failure in Table 4). As ex-pected, the production and the GDP indicators of the Slovak economy would not suffer significantly. One of the explanation may be that drop of gas is marginal in comparison to voluminous flows. There is also low level of substitution al-lowed for alternative sources16 and the use of national reserves. Total labour drops slightly because of decline of demand in the sector of services employing most labour and the sector of heavy industry and mining. Households’ income does not change significantly; on the other hand income of financial and non- -financial enterprises grows slightly because of the more difficult access to capi-tal.17 According to the results, we can consider this scenario to have marginal effect on the economy. F i g u r e 4
Comparison of GDP Decline and Decline of Household’s Income by Different Failure of Imported Gas, mil. EUR
Comment: 0% scenario represents benchmark value. Source: Slovak National Accounts, 2005; Model calculations.
The worse scenario is a result of 100% failure of gas import. As a conse-quence of overall decline in each industry, total production decreases by 28.7%. GDP decreases by 26.5% because of a drop in both its parts – domestic demand and foreign demand. Domestic demand is drawn by households consumption, which is cut by lower income (20.7% decrease). A comparison of the sequence of GDP and households income drops is seen in Figure 4. We can see that
16 Alternative sources are represented by calibrated substitution between imported production and domestic production in mining sector. 17 Model abstracts from bank sector policy (prospective problems with bad loans).
0%
10%
20%
30%
40%
50%
60%
70%
80%
90%
100%
0
10 000
20 000
30 000
40 000
50 000
60 000
0% 8,5% 33% 66% 100%
Gross domestic product Income of households % of bench. GDP % of bench. HC
180
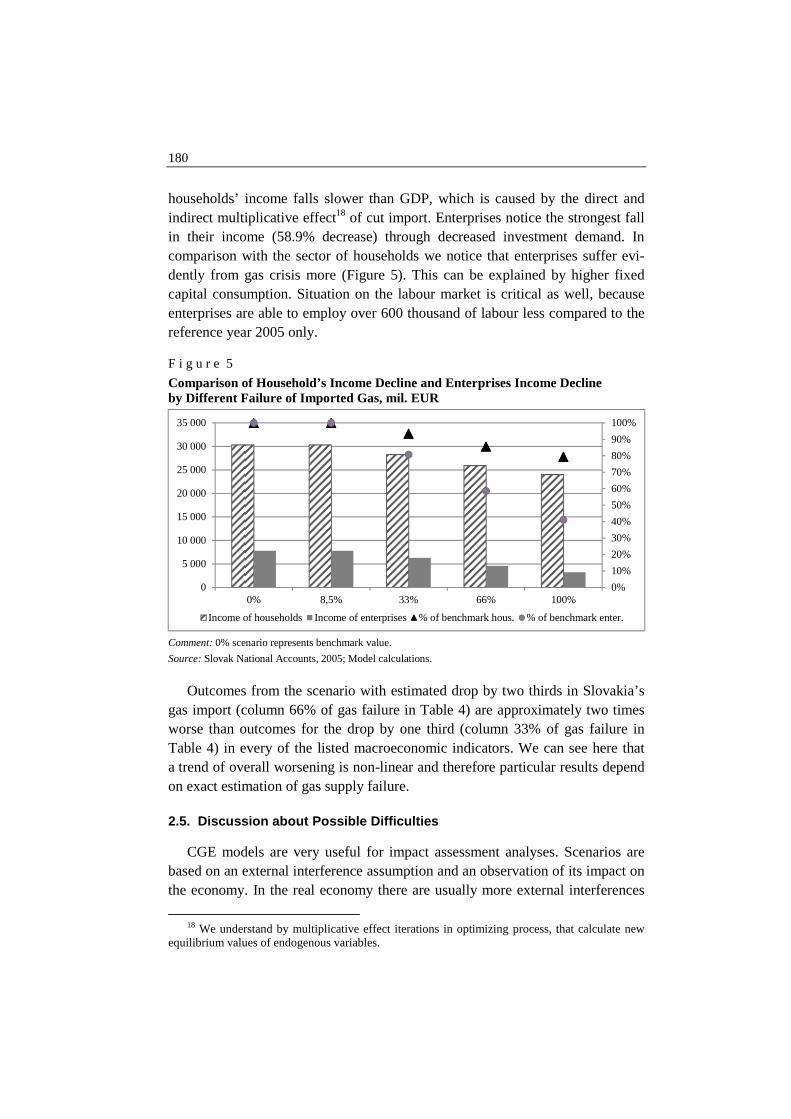
households’ income falls slower than GDP, which is caused by the direct and indirect multiplicative effect18 of cut import. Enterprises notice the strongest fall in their income (58.9% decrease) through decreased investment demand. In comparison with the sector of households we notice that enterprises suffer evi-dently from gas crisis more (Figure 5). This can be explained by higher fixed capital consumption. Situation on the labour market is critical as well, because enterprises are able to employ over 600 thousand of labour less compared to the reference year 2005 only. F i g u r e 5
Comparison of Household’s Income Decline and Enterprises Income Decline by Different Failure of Imported Gas, mil. EUR
Comment: 0% scenario represents benchmark value. Source: Slovak National Accounts, 2005; Model calculations.
Outcomes from the scenario with estimated drop by two thirds in Slovakia’s gas import (column 66% of gas failure in Table 4) are approximately two times worse than outcomes for the drop by one third (column 33% of gas failure in Table 4) in every of the listed macroeconomic indicators. We can see here that a trend of overall worsening is non-linear and therefore particular results depend on exact estimation of gas supply failure. 2.5. Discussion about Possible Difficulties CGE models are very useful for impact assessment analyses. Scenarios are based on an external interference assumption and an observation of its impact on the economy. In the real economy there are usually more external interferences
18 We understand by multiplicative effect iterations in optimizing process, that calculate new equilibrium values of endogenous variables.
0%
10%
20%
30%
40%
50%
60%
70%
80%
90%
100%
0
5 000
10 000
15 000
20 000
25 000
30 000
35 000
0% 8,5% 33% 66% 100%
Income of households Income of enterprises % of benchmark hous. % of benchmark enter.
181
than one. There will be another response in form of a shock trying to diminish (negative) effect on the economy. Such a scenario is most probable by a large scale shock. With a drop of a commodity supply which can be substituted hardly, there is a different effect in short-term and long-term period. In a long-term period we can expect alternative sources to be substituted which require technological adaption. In order to simulate more external shocks in a long-term horizon, dy-namic CGE approach would be more suitable. On the other hand, in the short- -term period (shorter than one month) we can expect that legal environment ena-bles enterprises to adapt to the situation without significant loses. In case of a cut-off production in manufacturing area, Labour Code offers possibility to adapt shifts and working time properly to recession. Missing working days are substituted later with overtimes in the peak season. However, CGE models don’t take into consideration legal aspect. This type of simulation is considered to have marginal effect and need to be analysed by respecting assumption and limits of the model. To construct our CGE model we faced exogenous interventions. For example the parameters of elasticities in the production function for each of the sectors I had to be calibrated. This calibration and the choice of the proper estimation method is a matter of discussion. We can also dispute the data from the input- -output table and their appropriate reflection of energetic difficulty in intermedi-ate consumption among industries. In spite of the possible discussion and open questions about exogenous pa-rameters, the results from the simulations signalize, that our economy might fall into long depression.
3. Results and Overall Discussion
Our overall estimation of short-term drop based on first calculations might represent a 0.6 – 0.7 p. p. slowdown in GDP growth compared to previous fore-casts. Actual total losses were even smaller because of the influence of the eco-nomic crisis.19 Early expectations were losses in production of GDP of about SKK 3 bil. (EUR 100 mil.) per day, which means about 0.14% of the GDP growth in the long-term. The short-term losses could be compensated by later production in-creases and the expected losses were about 1/3 of the original production reduc-tions (EUR 33 – 37 mil. per day).
19 Absolute effect of global crisis on GDP of Slovakia is nearly 11%. Pre-crisis estimation of 2009 GDP growth was around 6.4%, current estimations are about –4.5%.
182
The long-term effects of a permanent reduction of gas deliveries are modelled in four scenarios and are quantified up to a drop of GDP by 25%, a drop of pro-duction by 30% and very high unemployment increased to the 40% level (in the extreme way). Such a depression in Slovakia would be comparable to situation in the beginning of the 90-ties (during 1991 unemployment rate rose from almost zero to12% (almost 300 thousand) in Slovakia or to the effects of the oil price crisis in the 70-ties. Fortunately, after 13 days gas supply was started. The shortfalls in production of particular businesses could be difficult to quantify because they have different levels of gas dependences and the individual structures of their production. At the same time, it is widely known that some companies were violating the degree 8 supply restrictions and used gas in larger amounts despite the regulations. Some of the companies will have to pay penalties for violating their consumer contracts. Because of the simultaneous effect of the financial crisis and falling foreign demand for Slovak goods, the country has not felt the full impact of lim-ited gas supplies, since most of the affected companies were not working at full capacity even before supplies were cut. The short-term losses were only partially (by approximately two thirds) compensated by production increasing in further period. This case illustrate, that if economy is working bellow potential level, real negative effects of short-term outage are really low and losses can be compen-sated in next period. More important is negative effects in trust and suppliers confidence. These shortages on gas supplies from Russia were reality despite valid long-term contracts about gas supply. Gas and other resources dependency can be used as advantage and instrument of negotiation by third country (in this case Ukraine). The only solution for the future is diversification of sources, esta-blishment of strategic reserves for the case of shortage and the use of alternative routes. Conclusions The present paper discusses effects of gas supply failure on a small open economy. The impacts of interruption of gas transport from Russia through Ukraine into Central and Western Europe, which occurred in January of 2009, showed the necessity to quantify effects of such gas crisis on affected countries. We demonstrate the use of CGE model on the example of Slovakia and we discuss the results based on production loss per one day of the gas crises. A disaggregated view is an advantage of the CGE models. Shortage of gas is
183
a good example of supply shock which can serve as an example for this type of general equilibrium models. The disadvantage of CGE models is lack of dynamics in the process of transfer to the new equilibrium. Application of CGE model on simulation of potential macroeconomic effects of permanent interruption of gas import from Russia is consistent with later de-velopments. The results are similar to the estimates of daily GDP loses. Appro-priate CGE scenarios allow estimating effective volumes of investments into gas sources diversification and potential impacts on individual sectors of economy in a specific country. The model also shows that the effects are not equal in all sec-tors of the economy. One of the key factors will be the attitude of the European Union to negotia-tions with Russia and Ukraine in the future. The European Union must be more involved in energetic safety of member states. The key question for energy poli-cy will by also secure the energetic safety of small open countries without own natural resources by setting of mandatory reserves of key resources. The key factor is diversification of foreign sources and an increase of strategic reserves of natural gas and oil. Secondary, a threat for Slovakia is represented by the supply of electric energy as well, because after the decrease of the share of nuclear en-ergy in Slovakia, more energy has to be provided via gas and oil plants. The problem of energy and natural resources strategy is not trivial, and any interrup-tion of steady supply could result to significant losses on national economies. Additionally as real situation shows, gas strategic reserves differs from oil. If they are needed, they have to be transported to all regions, which could be prob-lematic without adjusted infrastructure. Paper is based on real economic situation and similar situation resulting in threat to gas supply from Russia still prevails, despite some precautions has been already made. Literature BRITISH BROADCASTING CORPORATION (2009): European Gas Supplies Disrupted. Avai-
lable at: <www.bbc.co.uk>. ENI (2008): World Oil and Gas. Review ENI SpA. Available at: <www.eni.com>. EUR-Lex (1998): Council Directive 98/93/ES from 14 December 1998 imposing an obligation on
Member States of the EEC to maintain minimum stocks of crude oil and/or petroleum products. Available at: <http://eur-lex.europa.eu/LexUriServ/LexUriServ.do?uri=CELEX:31998L0093: EN:HTML:NOT>.
EUR-Lex (2004): Council Directive 2004/67/EC of 26 April 2004 concerning measures to safe-guard security of natural gas supply. Official Journal of the European Union. Available at: <http://eur-lex.europa.eu/LexUriServ/LexUriServ.do?uri=CELEX:32004L0067:EN:HTML>.
EUROSTAT (2008): Energy, Transport and Environment Indicators. Luxembourg: Office for Offi-cial Publications of the European Communities. ISBN 978-92-79-09835-2. ISSN 1725-4566.
184
LICHNER, I. (2012): Strednodobá prognóza vývoja sektorovej zamestnanosti v SR aplikáciou CGE modelu. Forum Statisticum Slovacum, VIII , No. 4, pp. 126 – 134.
OECD (2006): Ukraine Energy Policy Review/International Energy Agency. Paris: OECD, 379 p. ISBN: 92-64-10991-9.
PRAVDA (2009): Bez plynu Slovensko stráca sto miliónov eur denne. Pravda Newspapers, 9th of January 2009.
RENČKO, J. – PÁLENÍK, V. –DOMONKOS, T. – KVETAN, V. – MLÝNEK, M. – PÁNIKOVÁ, L. – RADVANSKÝ; M. (2008): Modernization of Macroeconomic Forecasting as a Basis for Ef-ficient Budgeting in Ukraine. Kiev: USAID. ISBN 978-966-8274-15-2.
SEKEREŠ, S. (2006): Theory of Static and Dynamic CGE Models. [Diploma work.] Bratislava: Comenius University in Bratislava, Faculty of Mathematics Physics and Informatics. Available at: <http://www.iam.fmph.uniba.sk/studium/efm/diplomovky/2006/sekeres/diplomovka.pdf>.


