Embed Size (px)
Citation preview

0 | P a g e
JANUARY 2013
ECONOMIC
CONTRIBUTIONS
OF THE RAILROAD
INDUSTRY TO
WISCONSIN:
A FOCUS ON THE PUBLICLY-OWNED RAILROAD SYSTEM
IN SOUTHERN WISCONSIN
Steven Deller
Department of Agricultural and Applied Economics University of Wisconsin – Madison
University of Wisconsin – Extension, Cooperative Extension

1 | P a g e
ECONOMIC CONTRIBUTIONS OF THE RAILROAD INDUSTRY TO WISCONSIN: A FOCUS ON THE PUBLICLY-OWNED RAILROAD SYSTEM IN SOUTHERN WISCONSIN
1
Steven Deller Department of Agricultural and Applied Economics
University of Wisconsin – Madison University of Wisconsin – Extension, Cooperative Extension
Acknowledgements: The following people should be recognized for their work and support of this important study. First and foremost, we thank all the respondents (Rail Businesses) who took the time and effort to supply much needed data for our user survey. Lindsay Amiel from the Department of Agriculture and Applied Economics, University of Wisconsin - Madison; Liat Bonneville and Frank Huntington from the Wisconsin Department of Transportation; Secretary Mark Gottlieb of the Wisconsin Department of Transportation; Each member of the Full Commission of the Wisconsin River Rail Transit Commission; Forrest Van Schwartz of the Wisconsin River Rail Transit Commission; Al Anderson of the Pink Lady Rail Transit Commission; Rick Webb, Chief Executive Officer of Watco Companies and Ken Lucht also of Watco Companies.. All errors are the responsibility of the author.
1 This study was commissioned and funded by the Wisconsin River Rail Transit Commission.

2 | P a g e
Background History This study focuses on the economics of rail shipping associated with the Publicly-owned freight rail system in Southern Wisconsin. The State of Wisconsin, in cooperation with several local Rail Transit Commissions (RTCs), owns approximately 530 miles of railroad in 21 Wisconsin counties. In addition, applications for funding to acquire an additional 70 miles of track contiguous to the existing publicly owned system in the southern part of the state are currently being considered. Wisconsin’s 1848 Constitution prohibited the state from investing in canals or railroads. To provide for needed public investment in the state’s railroad system, local Rail Transit Commissions were formed to accommodate public acquisition and rehabilitation of rail lines needed to provide essential freight rail service that would otherwise be abandoned by major Class I railroads. The Constitution was modified in 1992 to allow direct state investment in railroads, but the partnership between the State, the local RTCs and the private railroads has worked well and is still being used. RTCs are legally permitted to own or control railroad infrastructure, with the state owning the real property underlying such railroad infrastructure (track, bridges, buildings, etc.).
This study focuses on those Publicly-owned freight corridors that are managed by the following RTC’s: Wisconsin River Rail Transit Commission, East Wisconsin Counties Railroad Consortium and Pecatonica Rail Transit Commission. The study also includes shippers on the privately owned line leased by the WSOR from the Union Pacific that is currently the subject of an acquisition application and is the focus of the Pink Lady Rail Transit Commission. The RTCs manage and provide oversight over operations of the 530-mile public railroad system. All three owning RTCs have operating agreements with private operators to provide service to Wisconsin communities and businesses. For sake of this study, an analysis was conducted on the public railroad system that is managed by the RTCs referenced above and operated by the Wisconsin & Southern Railroad. The Union Pacific trackage that is currently leased by the WSOR is also included in the study.
Executive Summary The intent of this study is to explore how freight rail service impacts Wisconsin industries and contributes to the economy. Two levels of analysis are undertaken. The overall scale of the railroad industry itself is discussed. Railroads are like any other business in Wisconsin in that they employ workers, pay wages and salaries, purchase materials that are required for their operations and pay taxes. This activity has an economic impact on the state economy. Second, and perhaps more importantly, freight railroads provide important transportation services to a wide range of Wisconsin businesses. The question this study seeks to better understand is the economic impact of a lack of rail freight services may have on these businesses. A survey was sent to all customers of the Publicly Owned Rail System (hereafter PORS) to assess their reliance on rail for their operations.2 In addition, 30 PORS customer businesses were identified for telephone interviews. Overall findings include:
In 2010 there were eight freight railroads in Wisconsin with 3,387 miles of track and 2,927 employees who are paid an average of $107,900 in wages and benefits.
2 Rail customers on Wisconsin & Southern leased lines radiating from Madison were included in the PORS customer survey base.

3 | P a g e
The freight railroad companies themselves generate a total economic impact of 10,160 jobs, $614 million wages, $1.03 billion in total income, $1.8 billion in industrial sales, and $91.9 million in state and local tax revenues.
For the firms responding to the survey 60.5 percent have 50 or fewer employees and 40.7 percent are 25 years old or newer.
Eighty-three (83.3%) percent of the surveyed firms reported that rail services is either “somewhat” (22.6%) or “very” (60.7%) important to their business.
Fifty-eight (58.0%) percent of the surveyed firms reported that it would be “somewhat” (29.6%) or “very” (28.4%) difficult to shift from rail to trucks.
Thirty-two (32.5%) percent of the surveyed firms reported that it would be “somewhat” (18.1%) or “very” (14.5%) likely that they would be forced to close/relocate their business if rail service was no longer available.
Three impact scenarios using PORS customers (a) all customers, (b) those that are “somewhat” and “very” likely to close/relocate without rail service and (c) those that are “very” likely to close/relocate:
o “All” customers generate 34,300 jobs, $1.76 billion in labor income, $2.88 billion in total
income, $5.92 billion in industry sales, and $291.7 million in state and local government revenues.
o Customers that are “somewhat” and “very” likely to close/relocate without rail service generate about 9,700 jobs, $502 million in labor income, $829 million in total income, $1.7 billion in industrial sales, and $86 million in state and local government revenue.
o Customers that are “very” likely to close/relocate generate 5,900 jobs, about $310 million in labor income, $507 million in total income, $964 million in industry sales, and $56.6 million in state and local government revenues.
Introduction
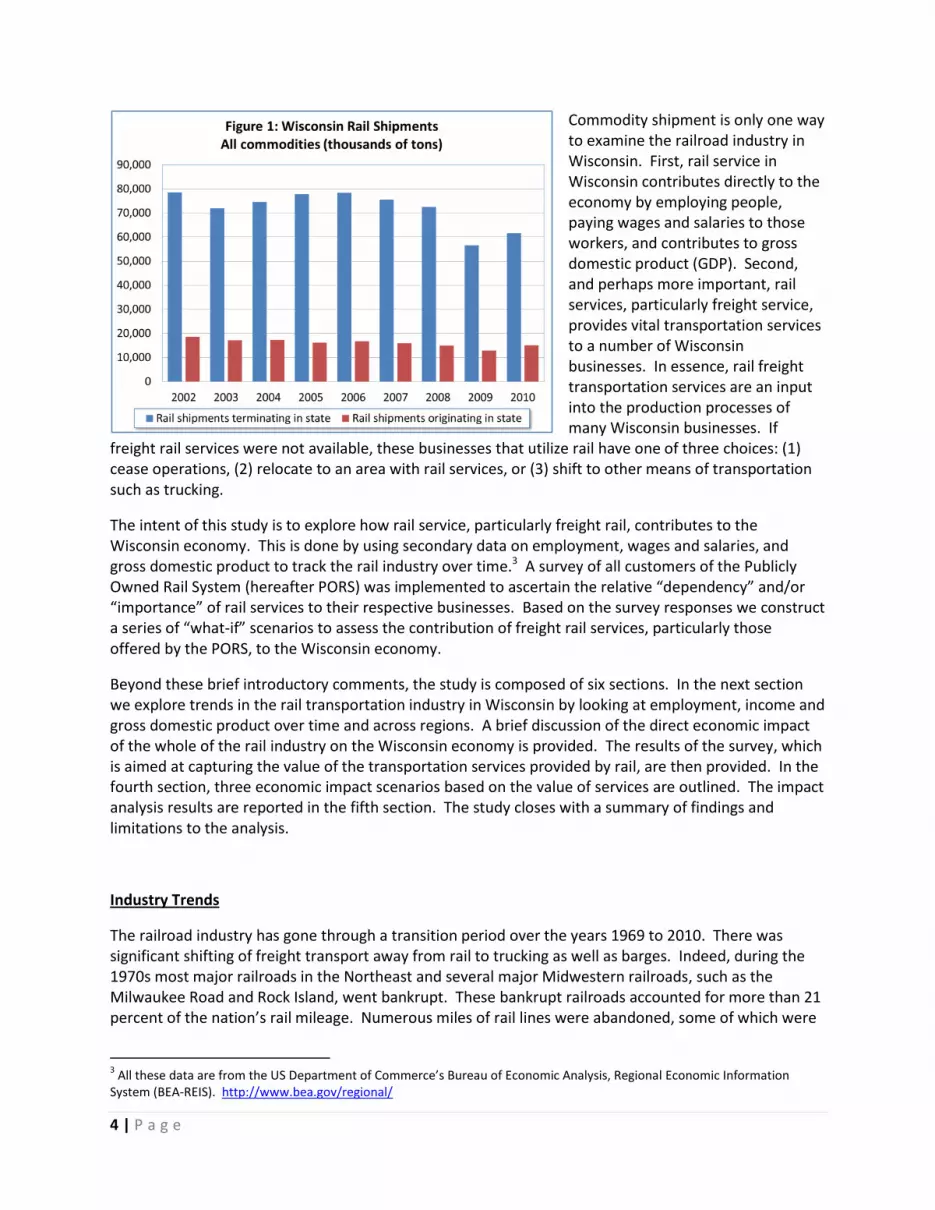
Freight rail service is an important component of the transportation infrastructure of Wisconsin. In 2010 there were 76,640,000 tons of products transported by rail in Wisconsin of which 61,590,000 tons was shipped into Wisconsin and 15,044,000 tons shipped that originated in Wisconsin (See Appendix B). Coal dominates inbound shipments with 36.9 million tons, followed by metallic ores (7.3 million tons) and farm products (4.5 million tons). Freight rail traffic originating in Wisconsin is dominated by stone, sand and gravel (4.7 million tons) and farm products (3.1 million tons) (See Appendix B). This volume of rail freight traffic is below the average over the past ten years which was about 88 million tons (Figure 1). This recent decline is likely due to the “Great Recession” and slow rate of recovery.
4 | P a g e
Commodity shipment is only one way to examine the railroad industry in Wisconsin. First, rail service in Wisconsin contributes directly to the economy by employing people, paying wages and salaries to those workers, and contributes to gross domestic product (GDP). Second, and perhaps more important, rail services, particularly freight service, provides vital transportation services to a number of Wisconsin businesses. In essence, rail freight transportation services are an input into the production processes of many Wisconsin businesses. If
freight rail services were not available, these businesses that utilize rail have one of three choices: (1) cease operations, (2) relocate to an area with rail services, or (3) shift to other means of transportation such as trucking.
The intent of this study is to explore how rail service, particularly freight rail, contributes to the Wisconsin economy. This is done by using secondary data on employment, wages and salaries, and gross domestic product to track the rail industry over time.3 A survey of all customers of the Publicly Owned Rail System (hereafter PORS) was implemented to ascertain the relative “dependency” and/or “importance” of rail services to their respective businesses. Based on the survey responses we construct a series of “what-if” scenarios to assess the contribution of freight rail services, particularly those offered by the PORS, to the Wisconsin economy.
Beyond these brief introductory comments, the study is composed of six sections. In the next section we explore trends in the rail transportation industry in Wisconsin by looking at employment, income and gross domestic product over time and across regions. A brief discussion of the direct economic impact of the whole of the rail industry on the Wisconsin economy is provided. The results of the survey, which is aimed at capturing the value of the transportation services provided by rail, are then provided. In the fourth section, three economic impact scenarios based on the value of services are outlined. The impact analysis results are reported in the fifth section. The study closes with a summary of findings and limitations to the analysis.
Industry Trends
The railroad industry has gone through a transition period over the years 1969 to 2010. There was significant shifting of freight transport away from rail to trucking as well as barges. Indeed, during the 1970s most major railroads in the Northeast and several major Midwestern railroads, such as the Milwaukee Road and Rock Island, went bankrupt. These bankrupt railroads accounted for more than 21 percent of the nation’s rail mileage. Numerous miles of rail lines were abandoned, some of which were
3 All these data are from the US Department of Commerce’s Bureau of Economic Analysis, Regional Economic Information
System (BEA-REIS). http://www.bea.gov/regional/

5 | P a g e
converted into recreational trails. Starting in the late 1960’s and early 1970’s there was significant consolidation in the rail industry leading to significant gains in productivity via economies of scale.
Perhaps more important was the passage of the Staggers Rail Act of 1980 which followed the Railroad Revitalization and Regulatory Reform Act of 1976 (4R Act). The Staggers Act was a deregulatory act that reduced much of the federal regulations that hindered the ability of freight rail to adjust to a changing market place. The Staggers Act caused the rapid proliferation of short line and regional railroads across the country. The large railroads now had the ability to sell off or abandon marginal lines and some duplicate main lines. An important question to ask is, from a purely descriptive perspective, what has happened to the rail industry from 1969 through deregulation and significant restructuring to today?
The volume of freight transported is only one of many ways to measure the size of the rail industry in Wisconsin. Rail companies directly employ workers, pay wages and salaries, and contribute to gross domestic product. Tracking each of these three measures of economic activity over time and across regions provides insights into industry trends. One limitation to these particular data is that freight and passenger rail is combined into one industrial classification. Passenger rail here does not include public mass transit, an example of which would be the Chicago Metra system, because those systems are included in the state and local government industrial classification. For Wisconsin, passenger rail is Amtrak which has a modest presence in the state. Thus, outside of heavy Amtrak corridors, such as the Chicago to Milwaukee corridor which has approximately 819,500 passengers each year, the data discussed in this section of the study is dominated by freight rail.4
Adjusting to 2005 prices (i.e., inflation adjusted to 2005 dollars), rail transportation in Wisconsin contributed $761.9 million to gross domestic product in 1969 (the beginning of the study period), peaking at $850.1 million in 1979, and declining to $468.5 million in 2010. By computing a growth index, where all values are compared to the initial levels in 1969 (again, the beginning of the study period), one
can more easily compare trends in Wisconsin to the nation, the Great Lake States as well as the Great Plains States (Figure 2). It is clear that the recession of the early 1980s was particularly difficult for the rail industry, which experienced a noticeable decline that did not stabilize until about 1990 for Wisconsin and 2002 for the nation and the Great Plains. The industry in Wisconsin did not experience growth, as measured by inflation adjusted gross domestic product, till about 2004,
4 Data about Amtrak ridership found on the Amtrak website:
http://www.amtrak.com/servlet/ContentServer?c=Page&pagename=am%2FLayout&cid=1246041980246

6 | P a g e
and has since, other than at the height (or depth) of the Great Recession, been experiencing growth. Over the last ten years (other than the Great Recession) the industry has seen reasonable growth both nationally and in the Great Lake states. The rail industry in the Great Plains, however, has experienced a more modest decline and has experienced strong growth since 1998.
Examining railroad employment trends reveals a similar pattern as those using Gross National Product: the industry experienced noticeable declines in employment beginning in about 1979 and began to stabilize in the mid-1990s (Figure 3). But unlike gross domestic product, employment in rail did not show any evidence of returning to higher levels. For the U.S. there was a modest increase in about 2007 but Wisconsin did not experience this modest bump. From 1986, when the industry started to stabilize in Wisconsin, employment has declined by 35.2 percent (1986 to 2010). The modest growth in real gross domestic product in rail activity in Wisconsin coupled with the slow decline in employment can be explained by increases in labor productivity. Because of new technologies, it requires fewer rail workers to produce higher levels of rail services. This increase in rail labor productivity is most evident in the Great Plain States. If there is a noteworthy increase in rail labor productivity, simple economic theory suggests that there should be a corresponding increase in labor compensation, or wages and salaries. A graphing of real per employee compensation (i.e., compensation adjusted for inflation to 2005 prices) over the study period reveals that there has indeed been strong growth: in 1969 the typical Wisconsin railroad worker earned $46,262 (compared to $45,904 for the U.S., $46,216 for the Great Lakes States, and $46,047 for the Great Plains States) which increased by 111.2 percent to $97,698 ($95,610 for the U.S., $93,810 for the Great Lakes States, and $97,765 for the Great Plains States) (Figure 4).5 There are two additional points concerning trends in rail worker compensation. First, there is an unusual “spike” in 1987 that is not readily explained. Second, although Wisconsin had higher per worker compensation at the beginning (1969) and end (2010) of the study period when compared to the U.S., other Great Lakes States or the Great Plains States, there was a period from 1991 to 2001 where Wisconsin was below the national average and the two comparison regions.
5 In the summary of findings as well as the impact analysis below, we note that employees in Wisconsin are paid an average of
$107,900 in wages and benefits for 2010, but in Figure 4 the figure is $97,698. The difference is the adjustment for inflation. The $97,698 figure is adjusted to reflect prices in 2005, whereas $107,900 is in nominal dollars or reflect prices in 2010.

7 | P a g e
There have been a handful of rigorous studies of freight rail productivity in the post-deregulation environment including the work of Bitzan and Keeler (2003) as well as Bereskin (1996, 2001) and Oum, Waters and Yu (1999).6 Uniformly these studies have documented significant increases in productivity ranging from economies of scale via consolidation and new computer technologies to the elimination of cabooses and associated crew members. These gains in railroad productivity
explain the declines in employment while at the same time total value (as measured by gross domestic product) have increased. Again, as predicted by simple economic theory, those productivity gains are reflected in higher employee compensations.
In summary, the freight rail industry went through a significant transition in the 1970s and 1980s. Beginning in the 1990s, productivity gains through consolidation and new technologies have revitalized the railroad industry. Other than a short period during the most recent Great Recession the industry in Wisconsin and the nation (particularly in the Great Plain States) has seen modest, but continued growth.
Direct Impact of Wisconsin Rail
The rail industry in Wisconsin contributes to the state’s economy in two ways: (1) directly through hiring workers and the direct costs associated with running a railroad; and (2) indirectly through the transportation services that are offered and consumed by rail customers. In this first section the impact of the operations of the Wisconsin railroad industry is examined. The impact of the consumer of rail services is considered in the next section.
To assess the impact of railroad operations on the Wisconsin economy this study uses a regional input-output model of Wisconsin using data from 2010 (most current year available). For an overview of the methods and discussion of terms see Appendix D. The scenario under consideration is the contribution of 2,927 railroad workers, the corresponding $315.8 million in employee compensation and the other non-labor costs associated with operating freight rail in Wisconsin. The results of this analysis are provided in Table 1.
6 Bitzan, J.D. and T.E. Keeler (2003). “Productivity Growth and Some of Its Determinants in the Deregulated U.S. Railroad
Industry.” Southern Economic Journal. 70(2):232-253. Bereskin, C.G. (1996). “Econometric Estimation of the Effects of Deregulation on Railway Productivity Growth.” Transportation Journal. 35:34-43. Bereskin, C.G. (2001). “Sequential Estimation of Railroad Costs for Specific Traffic.” Transportation Journal. 40:33-45. Oum, T.H., W.G. Waters and C. Yu. (1999). “A Survey of Productivity and Efficiency Measurement in Rail Transport.” Journal of Transportation Economics and Policy. 33:9-42.

8 | P a g e
The operation of freight rail in Wisconsin supports 10,160 jobs, $614.4 million in labor income (wages, salary and proprietor income), $1.03 billion in total income (labor income plus transfer payments, dividends, interest, rental income, etc.) and $1.8 billion in industrial sales. For every job in freight rail there are an additional 2.47 jobs generated elsewhere in the Wisconsin economy (employment multiplier of 3.471), while for every dollar of labor income paid there is an additional 94¢ of labor income generated elsewhere in the Wisconsin economy (labor income multiplier of 1.945).7 The industry impacted the most is “services” (which include rail services itself, specifically, the “direct multiplier effect”) and is largely consumer oriented services. This latter result is due to the high employee pay scales driving a large “induced multiplier effect”: much of the impact comes from relatively highly paid workers spending their wages in the economy.
In addition to generating economic activity as measured by employment, income and industry sales, there are state and local government tax revenues generated. Employees pay income taxes on wages and salaries earned as a result of the multiplier effect, households and firms pay property taxes, and as workers spend their income they pay sales taxes. The amount of economic activity supported by the direct operation of the rail industry in Wisconsin generates about $71.9 million in state and local government revenues. Sales taxes (the bulk of which flows to state government with some flowing to certain county governments) represents $17.3 million, income taxes (all flows to state government)
7 A general rule of practice is to question economic multipliers larger than 2.0. Here the income and industry sales multipliers
are smaller than 2.0, but the employment multiplier is unusually large at 3.471. Upon further examination of the industries that are affected, two issues may explain the unusually large employment multiplier: (1) railroad jobs are very high paying resulting in large induced effects; (2) many of the induced impacts are in personal services and retail where there are a high number of part-time jobs. Because the modeling system does not compute full-time-equivalent, but rather simply jobs. Hence, a person who is working, say, three part-time jobs to be the equivalent of full-time employment counts as three jobs.
Table 1: Economic Impact of Rail Alone ($000)
Employment Labor Income Total Income Industry Sales
Direct Effect 2,927 $ 315,823 $ 558,863 $ 961,694 Indirect Effect 3,183 $ 146,591 $ 199,690 $ 390,250 Induced Effect 4,049 $ 151,984 $ 269,656 $ 447,851 Total Effect 10,160 $ 614,398 $ 1,028,208 $ 1,799,794
Multiplier 3.471 1.945 1.840 1.871
Agriculture 39 $ 755 $ 1,707 $ 4,073 Mining 3 $ 206 $ 494 $ 778 Utilities 19 $ 2,440 $ 9,337 $ 11,054 Construction 453 $ 23,101 $ 28,443 $ 64,719 Food Processing 33 $ 1,716 $ 3,063 $ 15,866 Manufacturing 167 $ 10,288 $ 15,217 $ 47,396 Wholesale 201 $ 13,711 $ 24,150 $ 28,855 Retail 809 $ 21,594 $ 31,027 $ 46,442 Services 8,338 $ 548,561 $ 909,644 $ 1,563,691 Government 97 $ 6,541 $ 5,127 $ 16,919
Sales Taxes 17,316$ Income Taxes 16,630$ Property Taxes 17,737$ Other (fees, charges, mis taxes) 20,239$ Total State & Local Govt Rev 71,922$

9 | P a g e
represents $16.6 million, and property taxes (which flows to local governments, predominately K12 public education) represents $17.7 million.
A Survey of Wisconsin & Southern Customers
As outlined above, the freight rail industry impacts the Wisconsin economy in two ways: (1) directly through hiring workers and the direct costs associated with running a railroad (results of this analysis represented immediately above); and (2) indirectly through the transportation services that are offered and consumed by rail customers. As noted in the introductory comments, coal is the single largest commodity that flows into and terminates in Wisconsin. This coal is used almost exclusively by electric utility companies in numerous power plants located across Wisconsin.
There are few alternatives available to electric companies besides using rail to transport coal. Current rail technology provides for operation of unit coal trains consisting of 130 cars, each weighing 143 tons for total weight of about 18,600 tons. Most of the coal originates in the Powder River Basin (PRB) of Wyoming and Montana, some in Kentucky and West Virginia. To move one train of coal from the PRB region to Wisconsin on a continuing basis by truck would require about 460 trucks. Likewise, the lengthy EPA requirements for new power plants make it difficult for power plants to construct new facilities closer to rail service.
Other industries and companies in Wisconsin also use PORS to both import and export raw materials and final goods. Without freight rail service, these companies would face three choices: 1) shift to trucking for shipments; 2) suspend operations and close; 3) relocate closer to existing rail service. To fully understand how freight railroad customers may respond to the lack of rail services it is necessary to talk directly to rail customers. To this end we surveyed all 177 customers on the PORS served by the Wisconsin & Southern Railroad, LCC. Wisconsin & Southern Railroad is a privately held and managed Class II regional railroad company operating in the southern half of the State of Wisconsin and a small portion of northeastern Illinois. WSOR operates over 700 miles of branch and mainline track traversing a total of 21 counties in Wisconsin and Illinois. WSOR is Wisconsin’s second largest railroad.
It is important to note that because this study focuses on PORS customers, the impact analysis for the whole of the Wisconsin rail freight is conservative.
The survey took two forms: (1) an on-line survey and (2) telephone interviews. To gain insights into customers’ perspectives, 30 of the 177 customers were selected for telephone interviews. A few were included for phone interviews because a contact e-mail was not available and the remainder was selected at random to obtain a sample of 30 customers. A total of 86 firms responded and provided usable information. This represents a response rate of 48.6 percent which is reasonable for a business survey.8
8 The on-line survey involved several steps. A letter of introduction to the study was sent to all 177 PORS
customers by Wisconsin Secretary of Transportation Mark Gottlieb in June 2012. An e-mail was then sent to all 177 PORS customers reintroducing them to the intent of the study. Then in one week intervals, the 147 customers (the remaining 30 were contacted by telephone) to receive the web-based survey were sent e-mails providing a link to the survey and reminder notes. A total of five e-mails beyond the introductory e-mails were sent. Telephone interviews were conducted through September 2012.

10 | P a g e
In addition to basic background information (industry type, number of employees, age of facility using rail services, basic rail-truck shipment levels) the survey asked three basic questions:
How important is rail service to your business?
How difficult would it be for your business to shift from rail to truck?
If rail service was no longer available how likely would you be forced to close/relocate your business?
Rail customers were asked to respond to each of these three key questions using a Likert-type response (strongly agree to strongly disagree and/or very likely to very unlikely). We also offered the opportunity for open comments on the web-based survey and were a focal point of the telephone interviews.
The key to documenting the economic impact of freight rail services is to identify those firms that are unable to operate without rail services. This points to the third of the three key questions listed above: If rail service was no longer available how likely would you be forced to close/relocate your business? As outlined in Figure 5, we need to examine three possible scenarios: (1) all rail customers; (2) those that are either “somewhat likely” or “very likely” to close/relocate their business; and (3) those that are “very likely” to close/relocate their business.
Before turning to the importance of rail services, first consider the characteristics of the firms responding to the survey. Plastics firms and lumber and wood products firms, followed by grain and

11 | P a g e
grain by-product firms and fertilizer companies are the most common types of firms in the survey. From a pure volume, rock, limestone and sand is the largest commodity along with coal, but the survey responses outline in Table 2 is based on number of firms. For example, the volume of plastics is not in the top five commodities shipped, but the number of plastics firms that use rail services is fairly large. This is further evidenced by the size, measured by employment. Most of the businesses responding to the survey could be deemed as “small and medium sized” (SME) where 60.5 percent of respondents have 50 or fewer employees. About one in five responding firms were large firms and had more than 150 employees.
These two sets of results have several implications for the analysis. First, most firms tend to be small and are more likely shipping smaller volumes over rail. As such, they are more likely to be able to shift to trucks for
shipments. Second, while the large volume (coal, sand, etc.) commodities may receive a lion’s share of the attention, there are numerous other commodities that are being shipped by rail that may be equally if not more important. Thus care must be taken not to limit our attention to large firms that have high volumes of shipments.
As outlined in Table 4, the age of firms, or more specifically, specific facilities at current location, is evenly distributed: 40.7 percent are less than 25 years old, 33.7 percent are between 26 and 50 years old and about one in four are older than 50 years. A small number (5.5 percent) are less than five years of age. The small number of younger firms is likely a reflection of the effects of the Great Recession.
Table 2: Industry Type (Survey Respondents)
Frequency(%)
Canned and Frozen Foods 7.0
Chemicals 5.8
Coal, Coke and Petrolum 3.5
Fertilizers 10.5
Grain and Grain Byproducts 12.8
Lumber and Wood Products 14.0
Metal Products 5.8
Newsprint, Paper and Pulp 2.3
Plastics 14.0
Rock, Limestone and Sand 8.1
Other 16.3
sample size = 86

12 | P a g e
The more important descriptive component of the firms responding to the survey centers on the mix of inbound and outbound shipment of materials across rail and truck (Table 5). About one in four firms ship more than 50 percent of their inbound materials by rail. But 57.9 percent of firms report that more than 50 percent of inbound shipments are by truck. Inbound materials are likely to be shipped by rail while outbound material shipment is dominated by truck. It is evident that rail is a secondary mode of transportation to trucking. But as one respondent noted: “…even though less than 10% of our inbound shipments come into
the facility by rail, it is still very important to our business.” Another respondent expressed a similar viewpoint: “…even though our percent of inbound shipments that use rail is extremely low, it is still somewhat important to our business.” One important element that came from the telephone interviews and open comments is that for some material shipments, while a small or even modest amount of total material shipment, is not conducive to truck shipment: “One product that comes in via rail. It is plastic resin. It is more expensive to bring it in via truck due to the weight restrictions on trucking.” The important distinction here is that no firm responding to the survey was 100 percent dependent on rail or trucking, rather, the transportation system is bimodal where trucking and rail overlap and complement each other.
When asked directly how important rail service is to their businesses 83.3 percent responded that it was either “somewhat” or “very” important (Table 6). Indeed, 60.7 percent responded that rail service was “very important” to the operation of their businesses. Only 14.2 percent responded that rail was unimportant or not important to their operations. But when asked how difficult it would be to shift from rail to trucking slightly more than one in four thought that it would be either “somewhat easy” or
Table 5: Percent of material by mode of shipment
Percent of materials shipped by rail Inbound Outbound
0-25% 60.2 82.9
26-50 14.5 7.3
51-75 14.5 4.9
75+ 10.8 4.9
Percent of materials shipped by truck Inbound Outbound
0-25% 26.5 18.1
26-50 15.7 7.2
51-75 14.5 74.7
75+ 43.4 0.0
Table 3: How many employees do you have at this facility?
0-10 25.6
11-25 22.1
26-50 12.8
51-75 8.1
76-100 5.8
101-150 4.7
151+ 20.9
Table 4: How long has this facility been at this location?
0-2 years 2.3
3-5 3.5
6-15 18.6
16-25 16.3
26-50 33.7
51+ 25.6

13 | P a g e
“not difficult” (Table 7). A clear majority, 58 percent thought that the transition completely to trucking would be difficult, and 28.4 percent expressed the opinion that it would be “very difficult”.
Based on these responses it would appear that access to freight rail service is “important” to the majority of PORS customers and that shifting to trucking would be difficult. But when asked if the lack of rail service would be destructive to their operations, a slightly different picture emerges (Table 8).
Fourteen and one-half percent of firms responding to the survey suggested that without rail service it would be “very likely” that they would be forced to close or relocated their business. A slightly larger share, 18.1 percent, suggested that it would be “somewhat likely” to close or relocate their business if rail service was not available. The majority, 59.1 percent, responded that it was “somewhat unlikely” (12.1%) or “not at all likely (47.0%) that they would close or relocate their business without access to rail.
It is clear from the written comments as well as the insights gained from the telephone interviews, most businesses found access to rail important and it would be difficult to transition completely to trucking, but if necessary they would make the transition. Of those firms that could and would make the transition most expressed concerns over increases in costs that would negatively impact their profitability. For example (for a listing of all open ended comments, see Appendix C):
Table 8: If rail service was no longer available how likely would
you be forced to close/relocate your business?
Not at all Likely 47.0
Somewhat Unlikely 12.1
Neutral 8.4
Somewhat Likely 18.1
Very Likely 14.5
Table 6: How important is rail service to your business?
Not Important 7.1
Somewhat Unimportant 7.1
Neutral 2.4
Somewhat Important 22.6
Very Important 60.7
Table 7: How difficult would it be for your business to shift from rail to truck?
Not Difficult 19.8
Somewhat Easy 8.6
Neutral 13.6
Somewhat Difficult 29.6
Very Difficult 28.4

14 | P a g e
“Loss of rail service would impact our purchasing position in that our raw material prices would increase due to the added freight (via truck) and volume pricing incentives lost.”
“One of our main raw material inbound costs would go up significantly potentially making us uncompetitive in the market.”
“We would have to receive all of our raw materials by truck which makes us less efficient.”
“[The] location would be put at an extreme disadvantage to other transport modes and would likely lose jobs and cost customers more to move their grain products to market…”
“Forced to increase cost by bringing in main raw material by truck.”
Some firms would not be strongly affected, others would make the transition to trucks but profitability would be harmed, and some firms would simply close or relocate.
The results outlined in Table 8 provides the information necessary to construct the three economic impact scenarios outlined in Figure 5: (1) all firms that use rail (specific to PORS); (2) all firms that are either “somewhat” or “very” likely to close/relocate; and (3) all firms that are “very” likely to close/relocate.
Because each type of industry that uses rail has different linkages to the rest of the Wisconsin economy, it is necessary to cross link the information in Tables 2 and 8. Specifically, plastics manufacturers have a different relation to the state economy than does a grain processing company or a lumber and wood products firm. This decomposition is provided in Table 9. Because we can identify individual PORS customers we can apply the patterns outlined in Table 9 to all firms. For example, no food processors or newsprint, paper and pulp company stated that they are “very likely” to close/relocate. We then assume that this response applies to all firms in these groups. Likewise, we assume that 16.7 percent of all plastics firms are “very likely” to close/relocate and 58.3 percent are “somewhat or very likely” to close/relocate.
Table 9: If rail service was no longer available how likely would you be forced to close/relocate your business?
Very Likely Unlikely
Somewhat
or Very
Likely
Unlikely
Canned and Frozen Foods 0.0 100.0 33.3 66.7
Chemicals 20.0 80.0 60.0 40.0
Coal, Coke and Petrolum 0.0 100.0 0.0 100.0
Fertilizers 11.1 88.9 22.2 77.8
Grain and Grain Byproducts 9.1 90.9 36.4 63.6
Lumber and Wood Products 16.7 83.3 25.0 75.0
Metal Products 25.0 75.0 25.0 75.0
Newsprint, Paper and Pulp 0.0 100.0 0.0 100.0
Plastics 16.7 83.3 58.3 41.7
Rock, Limestone and Sand 14.3 85.7 14.3 85.7
Other 25.0 75.0 33.3 66.7

15 | P a g e
One of the problems or limitations to the analysis is that we use the firm employment data on record with Wisconsin & Southern Railroad. While PORS takes great care to ensure that their employment estimates are reasonable, there are a handful of firms where there are no employment data. These firms are removed from the impact analysis and as such, the impact assessments reported in the next section are to be considered conservative.
Railroad Impacts with a Focus on PORS As outlined in Figure 5 and detailed above, three impact scenarios are considered: (1) all PORS customers regardless of response to the close/relocate question; (2) all firms that are “somewhat or very likely” to close/relocate; and (3) all firms that are “very likely” to close/relocate. Again, we apply the response rate of those firms that responded to the survey (Table 9) to all PORS customers for which we have employment data. Each scenario is discussed in turn. The results of the first scenario (all PORS customers) are provided in Table 10. The total employment impact is 34,360 jobs with an employment multiplier of 2.294. This means that if a “typical” PORS customer added, for example, 100 jobs, the corresponding economic impact would be a total of 229 jobs, the original 100 jobs plus an additional 129 through the multiplier effect.
Table 10: All WSOR Customers ($000)
Employment Labor Income Total Income Industry Sales
Direct Effect 14,961 $ 929,120 $ 1,458,900 $ 3,415,640 Indirect Effect 7,995 $ 407,284 $ 662,036 $ 1,244,933 Induced Effect 11,362 $ 426,413 $ 756,631 $ 1,256,560 Total Effect 34,318 $ 1,762,817 $ 2,877,567 $ 5,917,134
Multiplier 2.294 1.897 1.972 1.732
Agriculture 397 $ 9,589 $ 19,762 $ 41,966 Mining 14 $ 986 $ 1,703 $ 2,726 Utilities 128 $ 16,286 $ 62,640 $ 75,275 Construction 747 $ 38,091 $ 46,900 $ 106,716 Food Processing 1,180 $ 62,627 $ 117,356 $ 517,959 Manufacturing 8,678 $ 567,978 $ 844,926 $ 2,514,483 Wholesale 5,325 $ 363,800 $ 640,772 $ 765,614 Retail 2,802 $ 77,947 $ 112,751 $ 167,829 Services 14,761 $ 604,093 $ 1,011,734 $ 1,673,639 Government 285 $ 21,420 $ 19,024 $ 50,926
Sales Taxes 83,191$ Income Taxes 46,649$ Property Taxes 84,372$ Other (fees, charges, mis taxes) 77,466$ Total State & Local Govt Rev 291,678$

16 | P a g e
Total labor income generated by the users of PORS is $1.76 billion (multiplier of 1.897), and total income (labor income plus all other sources of income) of $2.88 billion (multiplier of 1.972), and industry sales or revenue of about $5.92 billion (multiplier of 1.732). This represents about 1.0 percent of Wisconsin total employment, 0.4 percent of total labor income, 1.9 percent of Wisconsin total income and 2.5 percent of total industrial sales or revenue. The bulk of the impacts are in manufacturing, wholesale trade and the broad category of services. The first two results on manufacturing and wholesale trade is not surprising as the PORS customers are within those two broad categories. The impact on services is tied mostly to the induced effects associated with labor income being spent in the regional economy. Indeed, looking at the relative sizes of the “indirect” and “induced” impacts reveals that a majority of the multiplier effect is coming from labor spending their wages and salary. This is partially explained by the fact that wages tend to be relatively high in those industries that are PORS customers. The economic activity associated with all PORS customers also generates revenues for state and local governments across Wisconsin (predominately within the 21 counties where the PORS exists). In total, this economic activity generates $291.2 million in revenues, $83.2 million in the form of sales taxes, the bulk of which flows to state government and a small amount to county governments that have elected to impose the county option sales tax, $46.6 million in income taxes, all of which flows to state government, $84.4 million in property taxes that flow to local governments, mostly K12 public schools, and $77.5 million in miscellaneous other sources of revenue.9
As outlined in detail above, if freight rail services were not available many of the commodities shipped over the PORS would shift to truck services. The survey responses, particularly from the open comments and conversations during the phone interviews, made it clear that the majority of firms would shift to trucking and continue operations, albeit with lower profits. But some firms are more dependent on rail services. If rail services were not available this latter group of firms is likely to close or relocate where rail services are available. Consider the economic activity associated with those firms that are “somewhat or very likely” to close/relocate if rail service was not available. The results of this more focused analysis are provided in Table 11.
If the firms that responded “very and/or somewhat likely” to close or relocated ceased operations, Wisconsin would lose about 9,681 jobs, $502.1 million in labor income, $829.5 million in total income, and $1.69 billion in industrial sales or revenue annually. Again, manufacturing and wholesale trade are impacted the most and this is because of the “direct” effect, or these are the sectors where the affected customers of PORS are classified. The induced effect is slightly larger than the indirect effect again hinting at the relatively higher wages and salaries being paid in those customer industries. Given the larger induced impact, the large impact on the broad service sector is not unexpected (i.e., labor is spending an increasing share of its income in the service sectors).
The state and local government revenues that are generated by the activity outlined in Table 11 include $24.9 million in sales taxes, $13.3 million in income taxes, $25.2 million in property taxes, $22.9 million in miscellaneous revenues, for a total of $86.2 million. Again, other than the property tax, the bulk of these revenues flow to state government.
9 Care must be taken not to compare the impact on government employment, income and industry sales with
government revenue impacts. Because government is considered an “institution” and treated the same as household and not as an “industry” output or sales is not government expenditures and as such is not directly comparable to revenues.

17 | P a g e
The third and final scenario examined using data from the PORS customer base is perhaps the most likely and use only those firms that are “very likely” to close or relocate if freight rail services were not available. Returning to Table 9, this would include 20 percent of all chemical companies, 11 percent of fertilizer companies, nine percent of grain and grain by-product firms, among others. Again, these sample averages based on survey respondents are applied to all of PORS customers. The results of this more focused analysis are presented in Table 12.
This most conservative analysis suggests that freight rail services provided by PORS supports 5,900 jobs in Wisconsin, $309.6 million in labor income (wages, salaries and proprietors income), $506.8 million in total income (labor income plus transfer payments such as social security, dividends, interest and rental income along with a few other smaller categories of income sources) and $964.2 million in industrial revenues or sales. Consistent with the prior scenarios, the induced impact is larger than the indirect suggesting that the impact of PORS freight services, beyond the customer firms, is from labor spending wages/salaries in the regional economy. The multipliers are all reasonable with the employment multiplier of 2.193, labor income multiplier of 1.785, total income multiplier of 1.843 and industrial sales/revenue multiplier of 1.700. Finally, the impact on state and local governments is $56.6 million with the distribution across the different revenue categories consistent with the prior scenarios.
Table 11: "Very and/or Somewhat Likely" Close/Relocate ($000)
Employment Labor Income Total Income Industry Sales
Direct Effect 4,289 $ 270,926 $ 435,218 $ 996,538 Indirect Effect 2,156 $ 109,757 $ 178,768 $ 335,282 Induced Effect 3,236 $ 121,442 $ 215,489 $ 357,869 Total Effect 9,681 $ 502,126 $ 829,475 $ 1,689,689
Multiplier 2.257 1.853 1.906 1.696
Agriculture 109 $ 2,554 $ 5,852 $ 11,951 Mining 3 $ 203 $ 362 $ 578 Utilities 36 $ 4,584 $ 17,652 $ 21,045 Construction 233 $ 11,905 $ 14,658 $ 33,352 Food Processing 388 $ 20,597 $ 38,584 $ 170,041 Manufacturing 2,380 $ 154,453 $ 233,978 $ 693,618 Wholesale 1,710 $ 116,844 $ 205,800 $ 245,897 Retail 779 $ 21,576 $ 31,190 $ 46,450 Services 3,964 $ 163,511 $ 276,160 $ 452,642 Government 79 $ 5,900 $ 5,239 $ 14,114
Sales Taxes 24,866$ Income Taxes 13,288$ Property Taxes 25,202$ Other (fees, charges, mis taxes) 22,887$ Total State & Local Govt Rev 86,243$

18 | P a g e
Insights from Personal Interviews
The Wisconsin and Southern Railroad serves 177 companies in Wisconsin. A survey was sent out to each company
and thirty companies were selected to receive phone interviews. A total of 86 firms responded and provided
usable information. This represents a response rate of 48.6 percent. The phone interviews contained the same
questions as the web-based survey; however, it also allowed the researchers to elicit detailed responses to the
open ended question on the survey as well as pose additional questions about why their business would be
affected by rail line closures and what costs would they incur when restructuring the transportation of imports and
exports to and from their business. A total of 19 businesses (out of 30) answered the questions posed during the
phone interviews, for a response rate of approximately 63%.
There are several trends apparent in the phone based interviews. First, rail service is important for shipping goods
over longer distances (e.g., cross country). Trucking is a cost effective option for shipping goods within a region
but for interregional and cross continent freight rail shipping is much more cost effective. “Where the rail
becomes advantageous, and where our country does not use the rail as well as it should, is with long distance
hauls. We are a trucking country and diesel fuels have allowed us to move things by trucking. As diesel fuel
[price] increases, the country is learning that trucking can help reduce costs by reducing the length of the haul.”
Consequently, the businesses from the phone survey that relied on importing or exporting raw materials and
finished goods over long distances all said that they would be adversely affected by a decline in freight rail service.
Table 12: Very Likely" to Close/Relocate ($000)
Employment Labor Income Total Income Industry Sales
Direct Effect 2,692 $ 173,406 $ 275,010 $ 567,278 Indirect Effect 1,217 $ 61,297 $ 98,920 $ 176,175 Induced Effect 1,996 $ 74,909 $ 132,921 $ 220,744 Total Effect 5,905 $ 309,612 $ 506,851 $ 964,196
Multiplier 2.193 1.785 1.843 1.700
Agriculture 137 $ 3,783 $ 4,212 $ 6,137 Mining 2 $ 144 $ 233 $ 376 Utilities 20 $ 2,522 $ 9,718 $ 11,505 Construction 42 $ 2,153 $ 2,651 $ 6,033 Food Processing 16 $ 857 $ 1,532 $ 7,955 Manufacturing 1,490 $ 99,822 $ 149,040 $ 441,745 Wholesale 1,225 $ 83,695 $ 147,414 $ 176,135 Retail 481 $ 13,357 $ 19,327 $ 28,768 Services 2,440 $ 99,549 $ 169,394 $ 276,945 Government 49 $ 3,730 $ 3,330 $ 8,597
Sales Taxes 16,685$ Income Taxes 8,194$ Property Taxes 16,892$ Other (fees, charges, mis taxes) 14,868$ Total State & Local Govt Rev 56,639$

19 | P a g e
Freight rail is also advantageous for shipping large quantities of the same good. One interviewee phrased it this
way: “Rail cars are essentially three trucks. Cost wise, you basically get a third for free, but you also must ship at
least three truck loads at a time to realize that savings.” This returns us to the example of coal shipments to
power plants discussed in the text of the report. Consequently, small businesses, which do not ship large
quantities, cannot benefit from freight rail unless they are able to coordinate with other businesses that are
shipping similar products. Most small businesses from the phone survey stated that using rail service was not cost
effective. Similarly, businesses that rely on fast “inventory turns,” selling smaller quantities of goods more
frequently, also cannot use freight rail service to ship goods and materials.
“Middlemen,” businesses that ship in raw materials via freight rail, and then redistribute it to businesses within the
region via truck, can help to solve these coordination problems. Shipping companies can link together businesses
with the same factors of production and ship large quantities of inputs across country via rail; they can then deliver
smaller quantities to individual businesses via truck. This cuts costs for smaller businesses by lowering the cost of
their factors of production. Businesses that acted as “middlemen” were the very concerned about the loss of
freight rail service in Wisconsin. “I am a middle man, moving raw materials from one place to us and then to
another (from the source to the plant). Trucking is so much more expensive over long distances that my
customers would have to look for more cost effective means to get their materials. They would either look for
vendors that are closer … (or) they might also look to relocate their business closer to the raw materials, and
again, this could/would eliminate my business.”
During the phone interviews, businesses that no longer rely on freight rail discounted the potential impact of
losing freight rail in Wisconsin, in part because the role of “middlemen” who employ freight rail services to ship
goods to the Midwest was overlooked by companies who do not rely on rail service (See Figure 6 and
corresponding discussion). These businesses forgot that a portion of their raw materials or secondary inputs
purchased from other local/regional companies might rely on freight rail. When discussing the impact of higher
costs for secondary inputs, most businesses stated that losing freight rail service in Wisconsin would adversely
impact their businesses. Losing freight rail service would indirectly raise their cost of doing business by increasing
the costs of their inputs; however, because it was a hidden cost, most companies that do not directly use freight
rail initially disregarded its impact.
One company representative from a firm that ships goods to Chicago or Milwaukee via rail and then distributes
those goods to other companies via truck summed up the problem by stating, “If rail was not available in
Wisconsin, the cost of business would be much greater because it is much cheaper to ship things over long
distances via rail. If the cost of rail transportation increases, the cost of doing business overall in Wisconsin
would increase dramatically. So, losing rail services won’t just cause my business to close, but it would also
impact other business that rely on their raw materials being shipped from long distances to Wisconsin via rail. “
The latter quote is important in that it points to the complexity of the freight industry: many businesses that rely on rail or air freight are dependent only indirectly. In a survey of small (less than 100 employees) rural Wisconsin (and Northern New England) manufacturers some years ago very few manufacturers reported proximity to an airport as important. These same firms, however, stated that access to overnight or three day delivery services offered through companies like UPS and Federal Express is extremely important. Here access to airports is extremely important to companies like UPS and FedEx and the services they provide to small rural manufacturers. Thus, while manufacturers themselves stated that access to airports is not relevant, access to services they depend upon (UPS and FedEx), however, is very dependent on access to airport.
The same could be applied to access to freight rail services. In the analysis presented here, wholesale trade firms were identified as being particularly vulnerable to rail services. What is missing from this analysis is the “ancillary” dependency on rail firms may have through wholesale suppliers. Consider the network of firm dependency

20 | P a g e
outlined in Figure 6. Here we have freight rail, such as PORS, providing services to three types of firms (type “A”, “B” and “C”). Here all three types use freight rail services. Some firms, those in group “A”, could shift to trucking
at some costs to the firm. Other firms, those in group “B” would find shifting to trucking prohibited and may elect to close or relocate. The two scenarios outline in Table 9 capture those firms in group “B”.
But there is a third group of firms, group “C”, that provide vital services to firms “X”, “Y” through “Z”. Group “C” could loosely be described as wholesalers and provide a connecting or linking service. If one were to ask those firms “X”, “Y” and “Z” if they are
dependent on freight rail they would likely say no, they are not dependent on rail services. But if asked their dependency on the services offered by firms in group “C” they would likely respond that they are highly dependent. The analysis presented here focuses on groups “B” and “C” but not the services firms in group “C” provide to their customers. As such one could reasonably conclude that the analysis presented here is conservative.
There were also misconceptions by business owners as to how to account for the additional costs associated with losing freight rail service. A common response from companies was that they would pass on the additional costs to the customers. If all businesses in Wisconsin were facing the same additional costs from losing the option of freight rail service, then all of the additional costs could be passed on to customers. They did not consider that they could be facing competition from businesses in other nearby states that continued to improve freight rail service. Additionally, one business believed that because the company they contracted for paid to ship the inputs to their company, their cost of doing business would not increase with the loss of freight rail, since their “parent company” would have to pick up the additional charges. After discussing the issue for a couple of minutes, they changed their mind, stating that they might lose business because their “parent company” would either find a closer business or a business located on the rail line to work with instead of them.
Finally, a large number of firms already switched to trucking during the recession. During the recession, companies did not need to ship large quantities of inputs since their business slowed down; consequently, shipping via truck became more cost effective than shipping by rail, which is most effective with large shipments. Two companies had the following to say about the recession:
“In the last two years, we have not had much by way of incoming shipments from rail. However, before that, almost 20% of our shipments came in by rail. The slowdown in the economy and the volatility in the market is the main cause for the shift.”
“During the recession, we switched to completely to trucking because we are not purchasing large enough quantities to make rail service cost effective. However,

21 | P a g e
even though we do not use rail service right now, it is still very important to our business, and as the economy picks up, we hope to use the rail again in the future.”
Not all companies were ready to shift back to freight rail, however, as the economy recovered from the recession. Since they had already changed the infrastructure of their plants and shipping facilities towards trucking, the cost of shipping goods by rail would need to decrease substantially before they would be willing to restructure their facilities and switch back to using rail for their shipping needs.
Conclusions
By the turn of the twentieth century, the freight rail industry had recovered from an economic downturn. The Staggers Rail Act of 1980 provided the foundation for the industry to rebuild itself and become more competitive in the transportation industry. Through deregulation (the central thrust of the Staggers Act) railroad companies were able to continue consolidation and gain economies of scale and enact efficiency enhancing technologies.10 While many of these new efficiencies were labor saving, hence a downward trend in rail service employment, the remaining workers saw significant increases in wages and salaries.
Through a web-based survey, coupled with phone interviews, of Publicly-Owned Railroad System (PORS) customers, as served by the Wisconsin & Southern Railroad, a number of “what-if” scenarios were generated and examined. While the analysis uncovered that most PORS customers are perhaps more dependent on truck transportation than rail, rail remains a vital piece of the customers’ transportation network. The vast majority of respondents claimed that freight rail services are important to their operations and shifting away from rail to 100 percent trucking would be very difficult. Most also responded that if no rail services were available, they would indeed shift to trucking but it would hinder their transportation efficiency and hence profitability.
Some firms, however, are dependent upon freight rail service and could not operate without rail. These latter firms were grouped and analyzed in two ways: (1) those that are “somewhat” or “very likely” to close or relocate operations; and (2) those that are “very likely” to close or relocate operations. The analysis suggests that these two groupings of PORS customers generate between 5,900 and 9,700 jobs in Wisconsin. This activity supports between $310 and $502 million in labor income (wages, salaries and proprietor income) and between $507 and $829 million in total income (labor income plus all other sources of income) and $946 to $1,690 million in industrial sales/revenue. The activity associated with these two groupings of PORS customers also generates between $57 and $86 million in state and local government revenues. The analysis also considered two additional scenarios as background material: (1) the impact of the Wisconsin rail industry itself; and (2) the impact of all PORS customers.
Perhaps two survey respondents summarize the contribution of freight rail best:
“If rail service was no longer available, we would lose the competitive advantage that you get from the rail service that we have seen in the past. As I said before, we already mostly use
10
Significant consolidation occurred before Staggers: 1968 – Penn Central, combining New York Central, Pennsylvania, later adding New Haven & others; 1970 – Burlington Northern, combining Chicago Burlington & Quincy, Great Northern, Northern Pacific, Spokane Portland & Seattle, Frisco (SL-SF); 1979-1980: Union Pacific merged with Missouri Pacific and Western Pacific.

22 | P a g e
trucking, so we would not necessarily have to close or relocate, but I think that it would definitely hurt our business.”
“As rail is a part of what my business does, it would shut us down. We bring in bulk products (dry and liquid) and bring them in by rail, and then ship them out to companies within a zero to 300 miles radius. We deliver them to customers who do not have access to rail. It helps to cut down on their costs to ship the raw materials over long distances by rail. Our company gives them access to the rail lines.”
Future study of the impact of freight rail services on the Wisconsin economy should focus on the role of what has been referred to as both “wholesalers” and “middlemen” in this study (Firm “C” in Figure 6). The study reported here looked at the direct consumers of freight rail services (Firms “A”, “B” and “C” in Figure 6) and did not consider the indirect users (Firms “X” through “Z” in Figure 6). Through the personal phone interviews it became apparent that many indirect users of freight rail are unaware of their dependency on quality freight rail services.

23 | P a g e
Appendix A

24 | P a g e
Appendix B

25 | P a g e
Appendix C
Phone Interviews Comments and Written Comments
Please describe what would happen to your business/facility if rail transportation was no longer available.
Open-Ended Response (unedited)
We print books for publishing companies. The largest item that comes into our facility is paper. We can fit 2.5 truck loads into each rail car, so it is cheaper to bring paper in by rail. Thus, even though less than 10% of our inbound shipments come into the facility by rail, it is still very important to our business. However, losing rail would have a fairly minimal impact on our costs. This is because the publishers send us the paper by rail. If rail was no longer available, they would have to absorb the costs to send the paper by truck.
Rock Springs grain location would be put at an extreme disadvantage to other transport modes and would likely lose jobs and cost customers more to move their grain products to market
We would shift to shipping by truck and our volumes would decrease.
Added cost to transfer via truck.
Loose cost advantages that would impact our competitiveness and reduce our ability to serve our company.
We would have to rely on Semi truck exclusively and the amount of extra capital and taxes that would impede the local townships and counties would really hurt the local economy greatly.
We would use tanker trucks
We have just a couple of products (out of the hundred or so that we sell) that require rail service. Therefore, even though our percent of inbound shipments that use rail is extremely low, is it is still somewhat important to our business. If rail service was no longer available to us, we would shift entirely to trucking. The additional cost for those couple of products would be passed on to the customers if all of our competitors were without rail. Otherwise, we would need to internalize the additional costs.
In the last two years, we have not used rail service at all due to the collapse in the housing market. In order to use rail service effectively in our business, you must purchase large quantities of product. During the recession, we switched to completely to trucking because we are not purchasing large enough quantities to make rail service cost effective. However, even though we do not use rail service right now, it is still very important to our business, and as the economy picks up, we hope to use the rail again in the future. The rail is a cost effective means of moving large quantities of lumber long distances. Rail is important to people who are along it, especially if you can purchase large quantities at a lower price.
We would need to bring our Wheat in by truck instead of rail.
The plant would reduce production by 30 - 40%
Less competition would cause our material cost to rise.
It would cost us a little more money since trucking is more expensive. However, we would pass the additional costs would be passed on to customers. Our business has been around for awhile. You learn to adapt to the resources that are available. We do business with the rail, but we don't function on the rail, so if we were forced to move entirely to trucking, we would. It would be difficult to change, and it would change the nature of our business, but we wouldn't be forced to close or relocate. For example, a large part of our inbound shipments from the rail actually come into the Chicago or Milwaukee rail lines. We go to the rail and truck them back in. If the rail line went away, instead of picking up a lot of our product from the Chicago rail yards, we would be forced to ship it from Louisiana, Texas...using trucks. On one hand we would have more business due to more things being shipped via trucking. However, shifting to trucking completely would cause capacity issues for our company. The length of hall would be longer, which means prices for customers would necessarily increase. However, since all businesses would face the same constraint, this would impact everyone and hopefully wouldn't hurt business.

26 | P a g e
If rail service was no longer available, we would lose the competitive advantage that you get from the rail service that we have seen in the past. As I said before, we already mostly use trucking, so we would not necessarily have to close or relocate, but I think that it would definitely hurt our business.
We load rail cars at this facilities, it is approximately 2% of outbound ships. However, we also load containers that leave the facility by truck and end up on the rail, and that is approximately 20% of outbound shipments. Due to a business’s location to the rail line, this is common. If rail service was no longer available, we would have to go completely to trucking. For the most part, this would be okay, since we already truck a large portion of our outbound shipments. However, one of our products ships out exclusively by rail. Since it is only product, we wouldn't close or relocate, but rather switch to trucking, even though this would increase the cost of business substantially. We would most likely have to absorb about 50% of the additional costs, while passing the other 50% on to our customers.
One product that comes in via rail. It is plastic resin. It is more expensive to bring it in via truck due to the weight restrictions on trucking. Unfortunately, we would have to absorb the costs in order to remain competitive.
We do not use rail
Forced to increase cost by bringing in main raw material by truck
We have rail on site, but don't use it because it is not competitive. The Wisconsin Southern Rail line has such a large premium on using the rail line that it is cheaper to bring everything in/ and ship everything out by truck. We would like to use the rail line, but haven't for the last five years because it is far too expensive.
As rail is a part of what my business does, it would shut us down. We bring in bulk products (dry and liquid) and bring them in by rail, and then ship them out to companies within a zero to 300 miles radius. We deliver them to customers who do not have access to rail. It helps to cut down on their costs to ship the raw materials over long distances by rail. Our company gives them access to the rail lines.
It wouldn't be as convenient, but your cost per ton would not be different. The cost of rail has gotten pretty high, so the cost of using trucks would not increase our overall costs very much.
I am a middle man, moving raw materials from one place to another (from the source to the plant). Trucking is so much more expensive over long distances that my customers would have to look for more cost effective means to get their materials. They would either look for venders that are closer and this could eliminate the need for my services. They might also look to relocate their business closer to the raw materials, and again, this could/would eliminate my business. Alot of my business comes from Canada, so at that great distance it is difficult to use trucking cost effectively. Losing rail services would most likely cause my business to close and relocating is not possible.
We would have to receive all of our raw materials by truck which make us less efficient.
Raw material costs would jump up significantly.
We receive 6-8 products by rail. Loss of rail service would impact our purchasing position in that our raw material prices would increase due to the added freight (via truck) and volume pricing incentives lost.
One of our main raw material inbound costs would go up significantly potentially making us uncompetitive in the market. Nothing would change with your business. We just use it in the one plant. We have nine plants in Wisconsin.
It would cost more for lumber
We don't receive a lot in by rail, but it would be nice to always have that option.
The roads would be ruined and huge amounts of money to rebuild them
We would not be as competitive and a result would more than likely relocate to a site that provided rail.
We would close, dismantle and move to a more appropriate location.
We are a trucker. We use the rail to transload products to customers in a 150 mile radius

27 | P a g e
With the significant savings we see using rail it may be in the best interest of the company to locate to another facility that utilizes rail and will benefit from the savings.
We would be forced to raise transportation costs to a point that would jeopardize @ 23% of a product group that is essential to the economic health of the company.
Corporate Logistics would review alternatives.
I would continue my transloading activities with my current customers.
The influx of trucks would impede our ability to ship truckloads a product on time. This is for our location on 35th Street Milwaukee only.
We would lose our Full Service 3PL Status.
We would rethink our product line & what we make available to our customer base.
our business would be deprived of a valuable resource
We would be less efficient and not as competitive with our grain prices to local farmers as we would lose market access. We would add between 230 and 300 truckloads per week
We would truck to facilities that prefer rail deliveries, i.e. integrated steel mills. Higher cost.
Would need to make some labor adjustments. Would need to add additional labor which is not desirable at this time #1 would lose profit due to higher trucking transportation cost. We would become less efficient. More labor needed to handle trucks. The cars are also temporary short term storage.
We purchase a large volume of plastic resins in rail. These materials come from the gulf coast. Moving to truck is not feasible. The cost of transport would make us uncompetitive and the logistics of handling that much volume in bulk trucks is not feasible. As 100% of the products we handle are exported out of state, we would either a) have to truck-to-rail alternate and further distant/costlier locations or b) face terminal closure impacting local industrial minerals processing plant, terminal operators and local trucking that rely on this facility. Both a and b options would also impact customer in, at least, higher priced goods, if not closure of some of their facilities. Customer would have to source same products from other states other than Wisconsin. Affordable and reliable rail is absolutely critical to the industrial minerals industry within Wisconsin, and the local communities in which these raw materials are located.
There would be no change. We have a siding, but never use it.
We would be forced to pay an additional 3 to 5 percent for our raw materials (due to the upcharge for ordering smaller truck quantities). This would wipe out a significant chunk of our profit margin.
Currently we do not utilize rail service however we are working on a project that will demand delivery of material via rail. This would be a major factor in our ability to achieve this business in a financially competitive manner. This will become extremely important in our business model.
Slightly increased price in lumber price
This facility would not be able to sustain it's current production capacity without rail service.
With current rail rates truck to ethanol is WAY cheaper.
If rail was no longer available the added cost to ship product from this facility could create a competitive disadvantage forcing us to consolidate operations or look to purchase product from another source.
Rail gives us a definite freight advantage in our bidding structure for grain. Our volume would decrease significantly without rail because we are now a competitor of the river system. Before we had the rail option we were a customer of the river and the producers would bypass us and go to the river. Now days the producers are larger and have their own trucks and we would definitely be out of the picture.

28 | P a g e
We may have to scale back or relocate this location or divisions. Cause supply chain to become non-competitive. Would not be able to source raw materials.
We would get everything in by truck like we do now.. We used to receive most of our potash by rail because it was always ten to fifteen dollars cheaper per ton than trucking it in. Today it is the other way around. Would rather have rail cars but they are too expensive. You are not even competitive.
We would pay a higher delivered cost on the small portion of our raw material we do receive by rail
A key raw material would not be available, as it only ships by rail.
My freight cost would be considerable higher
Production lines would go down, lays-offs would follow...nearly 100 production workers.
We currently DO NOT have service and have been surviving by using a depot that is close and using a bulk truck service to deliver to plant. This has increased our costs resulting in increase to customers who could not or would not accept the increase and they chose to purchase a similar product off shore. Getting rail service back to our manufacturing facility will help in managing our competitiveness against imports.
The obvious is increased cost of product. Plus the increase of in house material handing costs will change. With multi -state production facilities, all with rail access , work could transfer to other facilities because of cost concerns which in turn creates loss of jobs at this facility
Efficiencies would be lost and costs of transportation would increase. we would also be faced with fewer markets to ship to. We are told when and when not to use rail for the military vehicles we ship. We would just truck them away at a greater cost to the tax payer.

29 | P a g e
Appendix D
Basics of Input-Output Modeling and Economic Multipliers
A simple non-technical discussion of the formulation of input-output (IO) modeling is presented in this section. Similar descriptive treatments are readily available, including Shaffer, Deller and Marcouiller (2004) while more advanced discussions of input-output include Miernyk (1965), and Miller and Blair (1985). As a descriptive tool, IO analysis represents a method for expressing the economy as a series of accounting transactions within and between the producing and consuming sectors. As an analytical tool, IO analysis expresses the economy as an interaction between the supply and demand for commodities. Given these interpretations, the IO model may be used to assess the impacts of alternative scenarios on the region's economy. Transactions Table A central concept of IO modeling is the interrelationship between the producing sectors of the region (e.g., manufacturing firms), the consuming sectors (e.g., households) and the rest of the world (i.e., regional imports and exports).
The simplest way to express this interaction is a regional transactions table (Table 1). The transactions table shows the flows of all goods and services produced (or purchased) by sectors in the region. The key to understanding this table is realizing that one firm's purchases are another firm's sales and that producing more of one output requires the production or purchase of more of the inputs needed to produce that product.
The transactions table may be read from two perspectives. Reading down a column gives the purchases by the sector named at the top of the column from each of the sectors named at the left. Reading across a row gives the sales of the sector named at the left of the row to those named at the top. In the illustrative transaction table for a fictitious regional economy (Table 1), reading down the first column shows that the agricultural firms buy $10 worth of their inputs from other agricultural firms. The sector also buys $4 worth of inputs from manufacturing firms and $6 worth from the service industry. Note that agricultural firms also made purchases from non-processing sectors of the economy, such as the household sector ($16) and imports from other regions ($14).
Purchases from the household sector represent value added, or income to people in the form of wages and investment returns. In this example, agricultural firms purchased a total of $50 worth of inputs. Reading across the first row shows that agriculture sold $10 worth of its output to agriculture, $6 worth to manufacturing, $2 worth to the service sector. The remaining $32 worth of agricultural output was sold to households or exported out of the region. In this case $20 worth of agricultural output was sold to households within the region and the remaining $12 was sold to firms or households outside the region. In the terminology of IO modeling, $18 (=$10+$6+$2) worth of agricultural output was sold for intermediate consumption, and the remaining $32 (=$20+$12) worth was sold to final demand. Note that the transactions table is balanced: total agricultural output (the sum of the row) is exactly equal to agricultural purchases (the sum of the column). In an

30 | P a g e
economic sense, total outlays (column sum, $50) equal total income (row sum, $50), or supply exactly equals supply. This is true for each sector. The transactions table is important because it provides a comprehensive picture of the region's economy. Not only does it show the total output of each sector, but it also shows the interdependencies between sectors. It also indicates the sectors from which the region's residents earn income as well as the degree of openness of the region through imports and exports. In this example households' total income, or value added for the region is $132 (note total household income equals total household expenditure), and total regional imports is $88 (note regional imports equals regional exports). More open economies will have a larger percentage of total expenditures devoted to imports. As discussed below, the “openness” of the economy has a direct and important impact on the size of economic multipliers. Specifically, more open economies have a greater share of purchases, both intermediate and final consumption purchases, taking the form of imports. As new dollars are introduced (injected from exports) into the economy they leave the economy more rapidly through leakages (imports). Direct Requirements Table Important production relationships in the regional economy can be further examined if the patterns of expenditures made by a sector are stated in terms of proportions. Specifically, the proportions of all inputs needed to produce one dollar of output in a given sector can be used to identify linear production relationships. This is accomplished by dividing the dollar value of inputs purchased from each sector by total expenditures. Or, each transaction in a column is divided by the column sum. The resulting table is called the direct requirements table (Table 2). The direct requirements table, as opposed to the transactions table, can only be read down each column. Each cell represents the dollar amount of inputs required from the industry named at the left to produce one dollar's worth of output from the sector named at the top. Each column essentially represents a `production recipe' for a dollar's worth of output. Given this latter interpretation, the upper part of the table (above households) is often referred to as the matrix of technical coefficients. In this example, for every dollar of sales by the agricultural sector, 20 cents worth of additional output from itself, 8 cents of output from manufacturing, 12 cents of output from services, and 32 cents from households will be required. In the example region, an additional dollar of output by the agricultural sector requires firms in agriculture to purchase a total of 40 cents from other firms located in the region. If a product or service required in the production process is not available from within the region, the product must be imported. In the agricultural sector, 28 cents worth of inputs are imported for each dollar of output. It is important to note that in IO analysis, this production formula, or technology (the column of direct requirement coefficients), is assumed to be constant and the same for all establishments within a sector regardless of input prices or production levels.

31 | P a g e
Assuming the direct requirements table also represents spending patterns necessary for additional production, the effects of a change in final demand of the output on the other of sectors can be predicted. For example, assume that export demand for the region's agricultural products increases by $100,000. From Table 2, it can be seen that any new final demand for agriculture will require purchases from the other sectors in the economy. The amounts shown in the first column are multiplied by the change in final demand to give the following figures: $20,000 from agriculture, $8,000 from manufacturing, and $12,000 from services. These are called the direct effects and, in this example, they amount to a total impact on the economy of $140,000 (the initial change [$100,000] plus the total direct effects [$40,000]). For many studies of economic impact the direct and initial effects are treated as the same although there are subtle differences. The strength of input-output modeling is that it does not stop at this point, but also measures the indirect effects of an increase in agricultural exports. In this example, the agricultural sector increased purchases of manufactured goods by $8,000. To supply agriculture's new need for manufacturing products, the manufacturing sector must increase production. To accomplish this, manufacturing firms must purchase additional inputs from the other regional sectors. Continuing our $100,000 increase in export demand for a region’s agricultural products, for every dollar increase in output, manufacturing must purchase an additional 12 cents of agricultural goods ($8,000 x .12 = $960), 8 cents from itself ($8,000 x .08 = $640), and 4 cents from the service sector ($8,000 x .04 = $320). Thus, the impact on the economy from an increase in agricultural exports will be more than the $140,000 identified previously. The total impact will be $140,000 plus the indirect effect on manufacturing totaling $1,920 ($960 + $640 + $320), or $141,920. A similar process examining the service sector increases the total impact yet again by $1,440 ([$12,000 x .04] + [$12,000 x .06] + [$12,000 x .02] = $1,440). The cycle does not stop, however, after only two rounds of impacts. To supply the manufacturing sectors with the newly required inputs, agriculture must increase output again, leading to an increase in manufacturing and service sector outputs. This process continues until the additional increases drop to an insignificant amount. The total impact on the regional economy, then, is the sum of a series of direct and indirect impacts. Fortunately, the sum of these direct and indirect effects can be more efficiently calculated by mathematical methods. The methodology was developed by the Nobel winning economist Wassily Leontief and is easily accomplished in computerized models. Total Requirements Table Typically, the result of the direct and indirect effects is presented as a total requirements table, or the Leontief inverse table (Table 3). Each cell in Table 3 indicates the dollar value of output from the sector named at the left that will be required in total (i.e., direct plus indirect) for a one dollar increase in final demand for the output from the sector named at the top of the column. For example, the element in the first row of the first column indicates the total dollar increase in output of agricultural production that results from a $1 increase in final demand for agricultural products is $1.28. Here the agricultural multiplier is 1.28: for every dollar of direct agricultural sales there will be an additional 28 cents of economic activity as measured by industry sales.

32 | P a g e
An additional, useful interpretation of the transactions table, as well as the direct requirements and total requirements tables, is the measure of economic linkages within the economy. For example, the element in the second row of the first column indicates the total increase in manufacturing output due to a dollar increase in the demand for agricultural products is 12 cents. This allows the analyst to not only estimate the total economic impact but also provide insights into which sectors will be impacted and to what level. Highly linked regional economies tend to be more self-sufficient in production and rely less on outside sources for inputs. More open economies, however, are often faced with the requirement of importing production inputs into the region. The degree of openness can be obtained from the direct requirements table (Table 2) by reading across the imports row.
The higher these proportions are the more open the economy. By definition, as imports increase the values of the direct requirement coefficients will decline. It follows then that the values making up the total requirements table, or the multipliers, will be smaller. In other words, more open economies have smaller multipliers due to larger imports. The degree of linkage can be obtained by analyzing the values of the off- diagonal elements (those elements in the table with a value of less than one) in the total requirements table. Generally, larger values indicate a tightly linked economy, whereas smaller values indicate a looser or more open economy. Input-Output Multipliers Through the discussion of the total requirements table, the notion of external changes in final demand rippling throughout the economy was introduced.
The total requirements table can be used to compute the total impact a change in final demand for one sector will have on the entire economy. Specifically, the sum of each column shows the total increase in regional output resulting from a $1 increase in final demand for the column heading sector. Retaining the agricultural example, an increase of $1 in the demand for agricultural output will yield a total increase in regional output equal to $1.56 (Table 3). This figure represents the initial dollar increase plus 56 cents in direct and indirect effects. The column totals are often referred to as output multipliers. The use of these multipliers for policy analysis can prove insightful. These multipliers can be used in preliminary policy analysis to estimate the economic impact of alternative policies or changes in the local economy. In addition, the multipliers can be used to identify the degree of structural interdependence between each sector and the rest of the economy. For example, in the illustrative region, a change in the agriculture sector would influence the local economy to the greatest extent, while changes in the service sector would produce the smallest change. The output multiplier described here is perhaps the simplest input-output multiplier available. The construction of the transactions table and its associated direct and total requirements tables creates a set of multipliers ranging from output to employment multipliers. Input-output analysis specifies this economic change, most commonly, as a change in final demand for some product. Economists sometimes might refer to this as the "exogenous shock" applied to the system. Simply stated, this is the manner in which we attempt to introduce an economic change. The complete set includes:

33 | P a g e
Type Definition 1. Output Multiplier The output multiplier for industry i measures the sum of direct and indirect requirements from all sectors needed to deliver one additional dollar unit of output of i to final demand. 2. Income Multiplier The income multiplier measures the total change in
income throughout the economy from a dollar unit change in final demand for any given sector.
3. Employment Multiplier The employment multiplier measures the total change in employment due to a one unit change in the employed labor force of a particular sector.
The income multiplier represents a change in total income (employee compensation plus proprietary income plus other property income plus indirect business taxes) for every dollar change in income for any given sector. The employment multiplier represents the total change in employment resulting from the change in employment in any given sector. Thus, we have three ways that we can describe the change in final demand. Consider for example a dairy farm that has $1 million in sales (industry output), pays labor $100,000 inclusive of wages, salaries and retained profits, and employs three workers including the farm proprietor. Suppose that demand for milk produced at these farm increases 10 percent, or $100,000 dollars. We could use the traditional output multiplier to determine what the total impact on output would be. Alternatively, to produce this additional output the farmer may find that they need to hire a part-time worker. We could use the employment multiplier to examine the impact of this new hire on total employment in the economy. In addition, the income paid to labor will increase by some amount and we can use the income multiplier to see what the total impact of this additional income will have on the larger economy. But how are these income and employment multipliers derived if the IO model only looks at the flow of industry expenditures (output)? In the strictest sense, the IO does not understand changes in employment or income, only changes in final demand (sales or output). To do this we use the fact that the IO model is a “fixed proportion” representation of the underlying production technologies. This is perhaps most clear by reexamining the direct requirements table (Table 2). For every dollar of output (sales) inputs are purchased in a fixed proportion according to the production technology described by the direct requirements table. For every dollar of output there is a fixed proportion of employment required as well as income paid. In our simple dairy farm example, for every dollar of output there are .000003 (= 1,000,000 ÷ 3) jobs and $.10 (= 1,000,000 ÷ 100,000) in income. We can use these fixed proportions to convert changes in output (sales) into changes in employment and income. Graphically, we can illustrate the round-by-round relationships modeled using input-output analysis. This is found in Figure 1. The direct effect of change is shown in the far left-hand side of the figure (the first bar (a)). For simplification, the direct effect of a $1.00 change in the level of exports, the indirect effects will spillover into other sectors and create an additional 66 cents of activity. In this example, the simple output multiplier is 1.66. A variety of multipliers can be calculated using input-output analysis. While multipliers may be used to assess the impact of changes on the economy, it is important to note that such a practice leads to limited impact information. A more complete analysis is not based on a single multiplier, but rather, on the complete total requirements table. A general discussion of the proper, and inappropriate, uses of multipliers is presented in the next appendix to this text.

34 | P a g e
Initial, Indirect and Induced Effects The input-output model and resulting multipliers described up to this point presents only part of the story. In this construction of the total requirements table (Table 3) and resulting multipliers the production technology does not include labor. In the terminology of IO modeling, this is an “open” model. In this case, the multiplier captures only the initial effect (initial change in final demand or the initial shock) and the impact of industry to industry sales. This latter effect is called the indirect effect and results in a Type I multiplier. A more complete picture would include labor in the total requirements table. In the terminology of IO modeling, the model should be “closed” with respect to labor. If this is done, we have a different type of multiplier, specifically a Type II multiplier, which is composed of the initial and indirect effects and also what is called the induced effects. The Type II multiplier is a more comprehensive measure of economic impact because it captures industry to industry transactions (indirect) and also the impact of labor spending income in the economy (induced effect). In the terminology of IO analysis an “open” model where the induced effect is not captured, any labor or proprietor income that may be gained (positive shock) or lost (negative shock) is assumed to be lost to the economy. In our simple dairy farm example, any additional income (wages, salaries and profits) derived from the change in output (sales) is pocketed by labor and is not re-spent in the economy. This clearly is not the case: any additional income resulting from more labor being hired (or fired) will be spent in the economy generating an additional round of impacts. This second round is referred to as the induced impact. Insights can be gained by comparing and contrasting the indirect and induced effects. For example, industries that are more labor intensive will tend to have larger induced impacts relative to indirect. In addition, industries that

35 | P a g e
tend to pay higher wages and salaries will also tend to have larger induced effects. By decomposing the Type II multiplier into its induced and indirect effects one can gain a better understanding of the industry under examination and its relationship to the larger economy. Misuses of Economic Multipliers
Multipliers are often misused or misunderstood. Problems frequently encountered in applying multipliers to community change include: (1) using different multipliers interchangeably; (2) double counting; (3) pyramiding; and (4) confusing multipliers with other economic measurements, such as turnover and value added. Please note that if IMPLAN
11 is used to generate the multipliers used in the analysis, many of the concerns outlined in this
appendix are moot. (1) Interchanging Multipliers. As mentioned earlier, multipliers can be estimated for changes in business output, household income, and employment. These different multipliers are sometimes mistakenly used interchangeably. This should not be done, as the sizes of the multipliers are different—and they measure totally different types of activity. (2) Double Counting. Unless otherwise specified, the direct effect or initial change is included in all multiplier calculations. Consider, for example, a mining business multiplier of 2.20. The 2.20 represents 1.00 for the direct effect, and 1.20 for the indirect effects. The direct effect is thus accounted for by the multiplier and should not be added into the computation (double counted). A $440,000 total impact resulting from an increase of $200,000 in outside income (using the above 2.20 multiplier) includes $200,000 direct spending, plus $240,000 for the indirect effects. The multiplier effect is sometimes thought to refer only to the indirect effect. In this case, the initial impact is added to the multiplier effect, and is thereby counted twice—yielding an inflated estimate of change. (3) Pyramiding. A more complicated error in using multipliers is pyramiding. This occurs when a multiplier for a nonbasic sector is used, in addition to the appropriate basic sector multiplier. For example, sugar beet processing has been a major contributor to exports in many western rural counties. Assume the local sugar beet processing plant were closed, and local officials wanted to determine the economic effect of the closing, as well as the subsequent effect upon local farmers. The multiplier for the sugar beet processing sector includes the effect upon farms raising sugar beets, because the sugar beet crop is sold to local processors and not exported. Therefore, the processing multiplier should be used to measure the impact of changes in the sugar industry on the total economy. The impact estimate would be pyramided if the multiplier for farms, whose effects had already been counted, were added to processing. Double counting and pyramiding are particularly serious errors because they result in greatly inflated impact estimates. If inflated estimates are used in making decisions about such things as school rooms or other new facilities, the results can be very expensive, indeed. (4) Turnover and Value Added. Economic measurements incorrectly used for multipliers also result in misleading analysis. Two such examples are turnover and value added. Turnover refers to the number of times money changes hands within the community. In Figure 1, for example, the initial dollar "turns over" five times; however, only part of the initial dollar is respent each time it changes hands. Someone confusing turnover with multiplier might say the multiplier is 5, when the multiplier is actually only 1.66. Value added reflects the portion of a product's total value or price that was provided within the local community. The value added would consider the value of a local raw product—like wheat delivered to the mill—and subtract that from the total wholesale value of the flour, then figure the ratio between the two. With cleaning losses, labor, bagging, milling, etc., the wholesale value may represent several times the value of the raw product and may be a fairly large number.
11
IMPLAN is a regional economic input-output modeling system originally developed by the US Forest Service and is now maintained by the Minnesota IMPLAN Group (MIG). Details about IMPLAN can be found at http://www.implan.com Also see Appendix E for a sampling of Wisconsin specific studies that has used IMPLAN.

36 | P a g e
Appendix E
Recent Applications of IO-IMPLAN in Wisconsin Reports/Studies Deller, Steven C. and Williams, David. 2009. “The Contribution of Agriculture to the Wisconsin Economy.” Department of Agricultural and Applied Economics Staff Paper No. 541. University of Wisconsin-Madison/Extension. (August). http://www.aae.wisc.edu/pubs/sps/pdf/stpap541.pdf Deller, Steven C. and Williams, David. 2011. “The Economic Impacts of Agriculture in Wisconsin Counties.” Department of Agricultural and Applied Economics Miscellaneous Publications (March). http://www.aae.wisc.edu/pubs/misc/docs/deller.economic%20impacts.03.24.pdf http://www.uwex.edu/ces/ag/wisag/ Deller, Steven C. 2011. “The Economic Contribution of Hospitals to Wisconsin.” Department of Agricultural and Applied Economics Miscellaneous Publications (November). http://www.aae.wisc.edu/pubs/misc/docs/deller.hospital.impacts.10.26.11.pdf http://www.wha.org/financeAndData/economicImpact/HealthyHospitals_web.pdf Erickson, Jenny, Dalhoff, Gene and Deller, Steven C. 2011. “Sauk County Rail Economic Impact Analysis.” Sauk County University of Wisconsin Cooperative Extension Office. (March). http://sauk.uwex.edu/files/2011/03/Sauk-County-Rail-Economic-Impact-Analysis1.pdf Meehan-Strub, Mary, Deller, Steven C. and Green, Karl. 2012. “The Health Care Industry and La Crosse County: Will Medicaid and BadgerCare Budget Reductions Impact the Local Economy?” Department of Agricultural and Applied Economics, University of Wisconsin-Madison. Miscellaneous Publication, March 18pp. http://www.aae.wisc.edu/pubs/misc/docs/deller.health%20care%20LAX.03.27.12.pdf Duley, Carl, and Deller, Steven C. 2012. “The Economics of Sand Mining and Buffalo County.” Department of Agricultural and Applied Economics, University of Wisconsin-Madison. Miscellaneous Publication, September 41pp. http://www.aae.wisc.edu/pubs/misc/docs/deller.frac%20sand%20report.09.10.12.pdf Wisconsin Media Coverage (sample) Janesville Gazette: Drought threatens to drain Rock County's economy, July 15, 2012 http://gazettextra.com/news/2012/jul/15/drought-threatens-drain-rock-countys-economy/ Baraboo News Republic: Rail plays big role in economy, March 26, 2011 http://www.wiscnews.com/baraboonewsrepublic/news/local/article_f6f5ae40-8800-11e0-aa73-001cc4c002e0.html Wisconsin State Journal: On the Capital: Sometimes those economists know what they’re talking about, April 28, 2012 http://host.madison.com/wsj/news/local/govt-and-politics/on-the-capitol-sometimes-those-economists-know-what-they-re/article_9869b514-90ac-11e1-993c-001a4bcf887a.html Milwaukee Journal Sentinel: Ripple effect felt in closing GM’s Janesville plant, December 11, 2008 http://www.jsonline.com/news/wisconsin/36026504.html