Embed Size (px)
Citation preview

International Journal of Technology Assessment in Health Care, 24:3 (2008), 282–293.Copyright c© 2008 Cambridge University Press. Printed in the U.S.A.doi:10.1017/S0266462308080380
Economic analysis of medicalpractice variation between 1991and 2000: The impact of patientoutcomes research teams (PORTs)
Stephen T. ParenteUniversity of Minnesota
Charles E. PhelpsUniversity of Rochester
Patrick J. O’ConnorHealthPartners Research Foundation
Objectives: The aim of this study was to examine the impact of the multi-hundred milliondollar investment by the federal government in the developing Patient OutcomesResearch Teams (PORTs) in over a dozen major academic medical centers in the UnitedStates throughout the 1990s. The objective of the PORTs was to reduce unnecessaryclinical variation in medical treatment.Methods: Using an economic derivation of welfare loss attributable to medical practicevariation and hospital admission claims data for 2 million elderly patients generalizable tothe nation, we estimate the change in welfare between 1991 and 2000, the period withinwhich the PORTs were designed and executed and their results disseminated.Results: Our results show inpatient admission types targeted by the PORTs did have lesswelfare loss relative to their total expenditure by 2000, but that there was not a netdecrease in the welfare loss for all hospital admissions affected by the PORT.Conclusions: We conclude that PORTs may have had favorable effects on welfare, mostlikely by reducing variation in clinical care, but that causality cannot be proved, and theeffects were not equal across all conditions targeted by PORTs. This research provides amethodological template that may be used to evaluate the impact of patient safetyresearch on welfare loss and on variation in medical treatment in both hospital andambulatory settings.
Keywords: Health technology assessment, Health economics, Health outcomes, Welfareeconomics
STATEMENT OF RESEARCH QUESTIONS
Variation in medical care utilization has been well docu-mented for over 6 decades (8;16;17). Since Wennberg et al.(18) documented a two-fold differences in the use of com-mon medical procedures between New Haven and Boston,evidence suggests that demand and supply in metropolitanmarkets vary in idiosyncratic ways that defy market-drivenexplanations. In 1989, U.S. federal government’s Agency
for Health Care Policy and Research was created in part toredirect health services research resources to examine thesources of these variations and identify best clinical prac-tices for dissemination. From 1991 to 1995, several hundredmillion dollars were invested in Patient Outcomes ResearchTeam (PORT) projects by AHCPR to focus on a set of medi-cal conditions and procedures to produce clinical guidelinesand other information and tools to reduce unwarranted vari-ation in clinical practice (7).
282

Economic analysis of medical practice variation
Recent patient safety research, stimulated largely by the1999 Institute of Medicine report, “To Err is Human” and its2001 companion “Crossing the Quality Chasm,” highlightthe contribution of clinical variation to medical errors thatmay lead to deaths or adverse clinical events (10;11). Thefederal government and private research foundations haveprovided substantial funding of projects designed to iden-tify and reduce unwarranted variation in clinical practice toimprove patient safety. Patient safety research initiatives of-ten apply rigorous systems approaches to minimize medicalpractice variation and thereby reduce error rates. Both the ear-lier PORTs and more recent patient safety research assumethat a substantial fraction of observed variation in clinicalpractice is unacceptable.
A critical difference between medical practice variationresearch and patient safety as well as medical appropriate-ness research is the determination of the reference point ofa “correct” utilization rate. Variation research implicitly as-sumes that the average rate of utilization of a procedure isthe correct rate. Alternatively, patient safety and appropri-ateness studies develop a target utilization rate based on ex-pert opinion of best practices of medical care. For example,a practice variations analysis focused on depression woulduse hospital records to observe an average utilization rate(e.g., 1/1,000 admissions per person) to function as “norm”for comparison. An appropriateness study would use expertopinion to develop a target hospitalization rate (e.g., 1.5/1000admissions per person) based on assessments of underlyingdisease prevalence, alternative therapies and clinical effec-tiveness. Similar to appropriateness studies, patient safetyanalyses choose a threshold value based on expert opinionthat serves as a goal rate. For example, Springfield Hospitalseeks to achieve no more than a 1/10,000 fatal medical errorrate per admission). The common thread of variations, appro-priateness, and safety literature is that once a central pointof comparison is identified, estimates of variance aroundthat point are created to determine the extent “error” presentfrom an identified norm in clinical practice. In operation,data-driven practice variation research reveals the extent ofvariation in the absence of expert opinion and serves as a diag-nostic tool for policy makers and managers. Appropriatenessand patient safety research provides a next level of analysisonce expert opinion has established a norm of practice and,as such, serves as an on-going performance measurementtool.
The objective of this study is to identify whether thefederal government’s investment in the PORT initiative re-duced the variation in targeted clinical procedures, and theirassociated welfare loss to society. A before and after quasi-experimental design is used in this evaluation. Using Medi-care inpatient claims data from the 5 percent National ClaimsHistory from 1991 to 2000, we compare use rate varia-tion and related welfare losses for medical and surgical ad-missions that were, and were not, directly targeted by thePORTs. This analysis permits us to address two research
questions: (i) By 2000, did the hospital admissions for pro-cedures targeted by the PORT initiative have less welfarelosses than those not targeted? (ii) Did the PORT initiativereduce the welfare loss for specific targeted procedures af-fected in terms of inflation adjusted dollars between 1991 and2000.
The results provide a crude market level assessment ofwhether a substantial government investment designed todiffuse throughout an entire industry had its desired impacton clinical care. While the PORT initiative is not identi-cal in implementation to the current patient safety initiative,the fundamental premise is the same: unacceptable variationmust be attenuated through outside intervention.
Although the PORT program centered on the UnitedStates, this research provides knowledge relevant to the in-ternational medical technology assessment efforts as well.Currently, there are over two dozen countries with formalprograms in technology assessment (19). Each of these pro-grams has objectives similar to the intent of the PORT ini-tiative. This research highlights how it is possible to eval-uate the impact of a national health policy as well as pro-vide some insights on the data required to provide such asassessment.
SIGNIFICANCE AND IMPACT
Many investigations have focused on variations in the useof different medical procedures. For example, one study re-ported that hysterectomy rates vary 3.5-fold across differentregions of Maine (16). Other studies found similar variationsin hundreds of medical procedures (12). Wennberg and Git-tlesohn (17) described differences in use rates of commonsurgical procedures across different regions in New Englandand proposed using the coefficient of variation (COV) to ex-press the degree of variation in a medical procedure. TheCOV is equal to the standard deviation of the utilization rateof a procedure divided by the mean of the rate of use of theprocedure. A high COV indicates a large degree of variationbecause the variance (as measured by the standard deviation)is relatively large in comparison to the mean rate of use. Inearlier literature, calculated COVs ranged from 0.32 to 0.70.While there is no common benchmark to determine whethera procedure’s COV is too high, the statistic does provide ametric to gauge the relative degrees of variation and to or-der procedures associated by their degree of variation. Diehrand Grembowski (4) showed through simulation that utiliza-tion differences that are completely random will generatea non-zero COV and established a natural lower bound beapproximately 0.10.
To understand the financial impact of variations in useof medical procedures, Phelps and Parente (14) developedan expression for welfare loss associated with highly vari-able procedure use rates. Welfare loss was calculated as afunction of the volume (number of procedures times the fee
INTL. J. OF TECHNOLOGY ASSESSMENT IN HEALTH CARE 24:3, 2008 283

Parente et al.
Figure 1. Effect of medical practice variation.
of procedure), price elasticity of insurance and unexplainedvariation in procedure use. Few procedures were foundto have a strong positive correlation between volume andCOV. The original analysis was developed for a technologyevaluation work group of the Institute of Medicine in 1988(9). As a result, the welfare loss study’s initial findings wereconsidered in the development of the list of medical proce-dures most deserving of clinical guideline development byAHCPR in 1990.
From a public policy perspective, the Phelps and Parenteanalysis underscores the net financial impact of variations.Nearly $1 billion was estimated to be the welfare loss fromvariations in New York State hospitals for 1987 alone. Phelpsand Mooney (15) found that the welfare loss associated withvariations was roughly similar to the amount due to so calledmoral hazard in health insurance contracts. It is importantto underscore that outpatient, physician office, and labora-tory procedures were left out of that welfare loss calculation.Given that nonhospital expenditures account for roughly halfthe cost of the nation’s health care, the additional welfareloss from ambulatory medical procedures may be quite sig-nificant. On the other hand, including ambulatory proceduresthat could substitute for inpatient procedures may yield lessnet variation and, consequently, less welfare loss. Either sce-nario only underscores the value of further research in thisarea.
The Phelps and Parente (14) welfare loss analysis wasdesigned as a priority assessment tool capable of beingapplied in different health care settings. Since its publica-tion, over 70 citations have referenced the article, many ofwhich are from publication in international journals.1 Policy
1Based on Google Scholar search, accesses on April 13, 2008.
makers can use welfare loss analysis to gauge the ef-fectiveness of the PORT initiatives as well as to iden-tify medical conditions and procedures that may requiremore detailed analysis. If the clinical uncertainty suggestedby the large variations in medical practice identified is aproxy for poor outcomes or medical errors, this analy-sis could identify and prioritize conditions and proceduresfor new initiatives in delivery system re-engineering be-ing contemplated by both the public and private healthcaresectors.
CONCEPTUAL MODEL
The conceptual model for this work was developed in Phelpsand Parente (14) and is illustrated in Figure 1. We first as-sume there is a point in the consumption of medical carewhere the consumer’s utility is maximized at U∗. At thispoint, any more or any less treatment would lead to a wel-fare loss. For example, if a consumer received Xu of care,they would be receiving less than an optimal level of care,possibly due to rationing. At Xu, the marginal value of careto an individual in terms of its incremental health benefitexceeds the actual cost of the care, thus creating a wel-fare loss. If too much care is provided, as illustrated byXo, than the cost of the care exceeds its incremental valueto the patient, and they would be worse off. For exam-ple, adverse events of unnecessary medical care are welfarereducing in terms of efficient use of resources and couldalso lead to a health outcome that is debilitating to thepatient.
Phelps and Parente (14) and Phelps and Mooney (15)applied this economic model to develop an estimate of wel-fare loss for each hospital procedure using market specific
284 INTL. J. OF TECHNOLOGY ASSESSMENT IN HEALTH CARE 24:3, 2008

Economic analysis of medical practice variation
admission rates. Solving for the area in the triangles, thewelfare loss can be calculated as:
WL = 1/2 × (total spending on X) × (Coefficient of Variation)2
× demand elasticity.
A key feature of this estimate is the use of the coefficientof variation as a critical parameter. This expression, describedin detail in Phelps and Parente (14), shows that expenditurecombined with variation will drive the extent of welfare loss.In effect, the model provides a way to statistically weightprocedure variation by expenditure using a construction thatis consistent with economic theory. The model also allowsfor changes over time. Because it largely reflects a demandcurve for medical care, temporal shocks such as the intro-duction of a new medical procedure can be interpreted aspotential demand shifters. For example, a new surgical pro-cedure that substitutes for an old procedure may prompt areduction in price in the old procedure, leading to an inwardshift in the demand curve of the old technology. Likewise, anew procedure with a lower price that complements an oldprocedure would lead to a demand shift out. Also, reductionsin perceived incremental value of a procedure would lead toa demand shift in.
APPROACH AND METHODOLOGY
Replicating the methods used in Phelps and Parente (14) andPhelps and Mooney (15), hospital procedure use rates arecalculated for a given population area. In this analysis, wechose to use states as the level of analysis to avoid small cellsize problems. Because there were sixty-two New York Statecounties in the original analysis, fifty states is a closer com-parison of results to the original study than either thousandsof counties or hundreds of metropolitan statistical areas.
With approximately 527 hospital admission procedures,in the form of diagnosis-related groups (DRGs), we chose tocollapse certain DRGs to make more general categories ofmedical admissions. This representation of hospital admis-sion procedures is common in the variations literature andwas first used by Wennberg in 1984. This procedure leaves146 possible modified DRGs (MDRGs) to represent hospitalstotal inpatient product.
A review of the PORT literature was conducted to iden-tify which of the 146 MDRGs were considered “PORT-affected”, meaning that they (or a group of them) were the fo-cus of a PORT project. The typical PORT was multi-milliondollar, multi-year investigation conducted by one or moreacademic health centers with expertise in outcomes research,health economics, and cost-effectiveness analysis. We identi-fied a total of 32 of the 146 MDRGs that were the direct focusof PORTs. Of those thirty-two PORT MDRGs, we considereda subset of fifteen cardiac MDRGs to be conditional mem-bers of the PORT group because their results may be different
due to technological change. Heart attacks and cardiac carewere the focus of the Harvard-based PORT. However, severalfactors may mitigate the impact of the heart disease PORTon variation in care and on social welfare. First, cardiologyand cardiothoracic surgery have historically been in the van-guard in use of strategies to reduce practice variation.2 Sec-ond, the 1990s saw widespread introduction of cardiac stentsand technological advances related to coronary artery bypassgraft (CABG) surgery. While the heart disease PORT’s focuson reduction in practice variation is perhaps more likely tostrike a familiar chord with clinicians, the complexity and ra-pidity of technological advances could mitigate the potentialPORT contribution.
Adjusted COVs were constructed by running MDRG-specific regressions by year with state-level demographicvariables representing the age, gender, socioeconomic, andmarket conditions. The R-squares ranged from .10 to .75 asthey did in earlier analysis (14). Finally, the total expenditurefor each MDRG is calculated by year. With this and the pre-ceding estimates as components, welfare loss estimates arecalculated using methods in Phelps and Mooney (15), whereelasticity is assumed to be fixed. This estimate is based onthe Rand Health Insurance Experiment medical care demandelasticity estimate of −0.15. Once the welfare loss estimatesare generated, the 1991 estimates are adjusted to 2000 dol-lars for relevant comparison. For each MDRG, the differencebetween the two period welfare loss estimates is calculatedto generate a net difference in welfare loss.
DATA
A five percent sample of recipients of the Medicare healthinsurance program was used for this analysis. The Medi-care program provides health insurance to approximately 40million elderly or disabled individuals. For this analysis, wechose to focus on the elderly population because the disabledpopulation is quite small and because state Medicaid and so-cial assistance policies may affect the benefits received bydisabled individuals.
Using annual inpatient claims totaling over one hun-dred million records; we calculated MDRG utilization ratesby state. The Medicare program’s denominator file of alleligible Medicare participants was used to construct state-and year-specific denominators for use in the constructionof MDRG-specific utilization rates. The mean and coeffi-cient of variation for each MDRG were constructed usingsummarized state level demographic data based on the ac-companying Medicare program subscriber denominator filesfrom the national claims history file. Total expenditures foreach MDRG were also calculated by year for each MDRG.
2The Framingham study begun in the 1950s, and numerous large randomizedtrials have provided ample evidence of the importance of cardiovascular riskfactor identification and control, and national guidelines for blood pressureand lipid control were available before 1990.
INTL. J. OF TECHNOLOGY ASSESSMENT IN HEALTH CARE 24:3, 2008 285

Parente et al.
Regression adjusted coefficient of variation statistics foreach MDRG were constructed. The regressions used covari-ates from state level demographic data from the denominatorfile, including age, gender, Medicare HMO market penetra-tion rate, Medicaid participation rate, race, mortality, andMedicare supplemental coverage purchases. Data from 1991and 2000 were used to generate pre and post PORT effects. Inaddition, similar data was prepared for the intervening yearsto provide insights on trends in procedure use rates withinthe 10 years under investigation.
The MDRGs were partitioned into three groups: notdirectly PORT affected, PORT affected, and cardiac. In theoriginal analysis by Phelps and Parente (14), medical andsurgical procedures were identified as distinctively differentin their care patterns. For this analysis, the rationale for theidentification of a separate cardiac category is the dramatictechnological innovations that have occurred within the pastdecade, particularly, the wide spread use of angioplasty andstents, new pharmaceutical interventions, and advances insurgical technique.
RESULTS
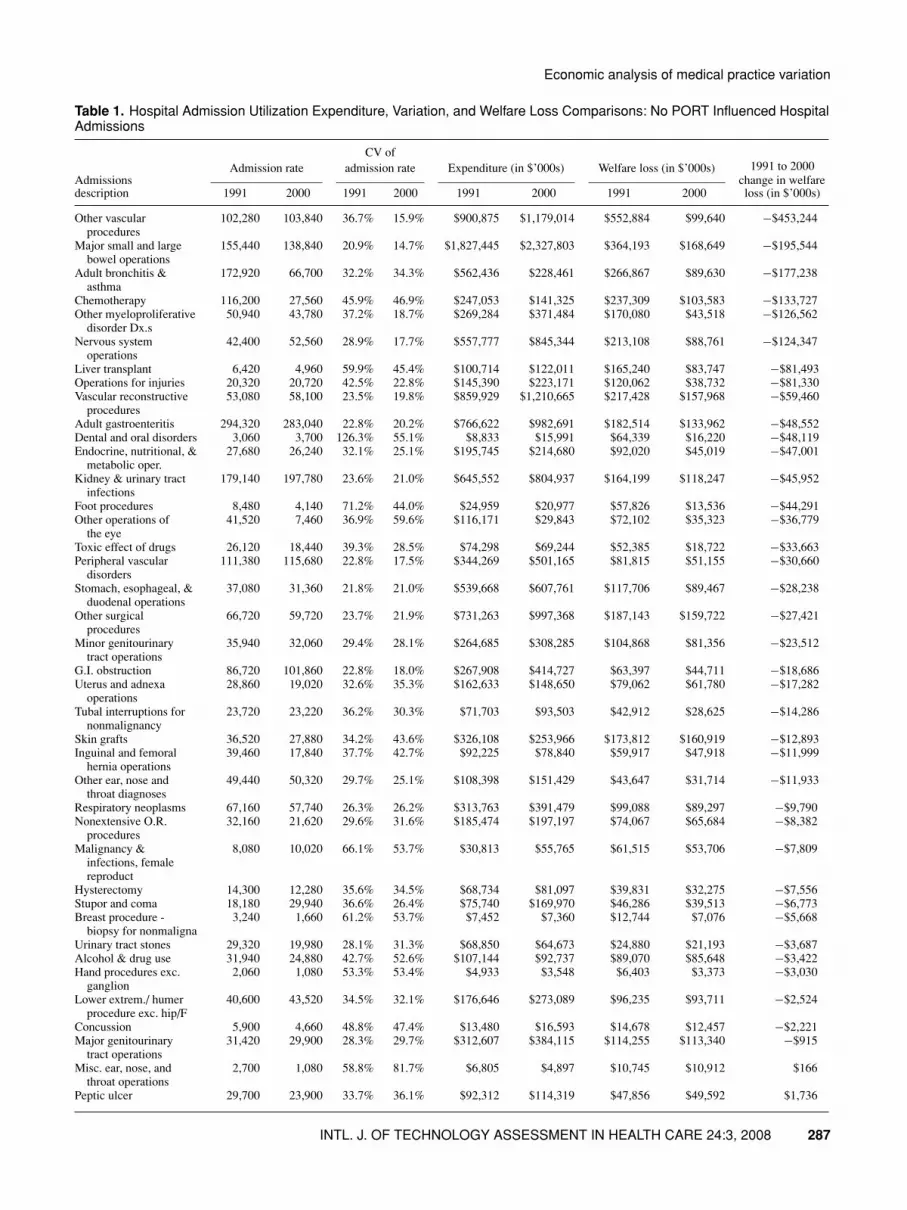
Welfare loss comparisons between 1991 and 2000 are pre-sented in Tables 1 through 3. Each of these tables list theMDRGs and their computed welfare losses, along withnational Medicare admission rates, provider payment, andadjusted coefficient of variation. The Non-PORT Affectedgroup is shown in Table 1. This group is the largest of thethree in terms of number of procedures (n = 84), expen-diture and welfare loss. The adjusted COV in 1991 rangedfrom 13 percent to 126 percent, contrasting with 15 percentto 396 percent in 2000. The computed welfare loss in 2000for each MDRG ranged from $3 million to $29 billion. Interms of 2000 dollars, the difference between 1991 and 2000welfare loss ranged from a net savings of $453 million forOther Vascular Procedures w/Complicating Conditions to anet loss of $29.4 billion for Pulmonary Edema and Respi-ratory Failure. The net impact of the difference in welfareloss was $36.5 billion in 2000. This includes one MDRGwith exceptionally high COV estimates in 2000 leading toextraordinarily high 2000 welfare loss estimates. If this wasremoved from the distribution, the net welfare loss differ-ence between 1991 and 2000 would be $7.3 billion. Thus,the net welfare loss increased dramatically for this set of nonPORT-affected MDRGs from 1991 to 2000.
In Table 2, the results of the PORT-affected MDRGsshow significantly fewer procedures, yet the use of theseprocedures is fairly substantial, and a comparison betweenthe 1991 and 2000 adjusted COV ranges finds less variation in2000. The range in 2000 welfare loss estimates is from $3.2million to $1.5 billion. Comparing the net change in 2000welfare loss, an increase in welfare loss occurred during theperiod. It would appear that the reduction in variation that
occurred in some instances was insufficient to counter theincrease in utilization of these procedures.
We also observe evidence of bias in welfare loss cal-culation due to an underlying temporal change in the rateof use of a procedure. For example, lens operations had a93 percent reduction in admissions between 1991 and 2000.This reduction was most likely due a shift in practice of per-forming cataract surgery in outpatient hospital settings andfree-standing surgical centers. A similar reduction in prosta-tectomy procedures (−61 percent) is also observed. In thiscase, new drug therapies may have acted as substitutes forsurgical procedures.
The cardiac MDRG welfare loss estimates are presentedin Table 3. Compared with the other two categories, there isconsiderably less variation in 1991 and 2000, as measuredby the adjusted COV. Consequently, there is also less welfareloss in 1991 and 2000, despite the scale of the expendituresfor these MDRGs. The net welfare loss between 1991 and2000 is $336 million, by far the lowest relative to the totalexpenditures of each of the three PORT categories.
A summary of the three PORT category welfare lossanalyses is shown in Table 4. The procedures not associ-ated with a PORT initiative had the greatest increase in wel-fare loss in both 2000 dollars, and as a percent change of318.8 percent, compared with the other two PORT-affectedgroups of admissions. This result would remain even if thetwo outlier admissions discussed earlier were removed fromthe analysis. The best category of results for the net impactin welfare loss was for the Cardiac PORTs, with a percentchange of 9.9 percent. The directly PORT-affected group ofadmissions had the middle performance level in terms ofwelfare loss, with a percent increase in 2000 dollar welfareloss of 42.9 percent. A final comparative statistic is the ratioof total expenditure to welfare loss. Ideally, welfare loss willbe 0, so policy makers would want to maximize this ratio.Welfare loss as a share of total expenditure is far greaterfor the admissions that were not PORT-affected, making thisratio lower than the ratio for the two other PORT-affectedgroups of admissions.
Figure 2 illustrates trends in overall welfare loss overtime by each of the PORT-affected categories. By 2000, 84percent of all welfare loss estimates were for non–PORT-affected procedures. This compares to only 62 percent in1991.
DISCUSSION
There are two key findings from this study that directly ad-dress the main research questions. First, hospital admissionprocedures targeted by the PORT initiative did have smallerwelfare losses as a share of total expenditure. This resultis also supported in terms of a generally smaller percent-age increases in welfare loss between 1991 and 2000 for thePORT-affected admissions, in comparison to the non PORT-affected hospitalizations. Our second finding is that the net
286 INTL. J. OF TECHNOLOGY ASSESSMENT IN HEALTH CARE 24:3, 2008
Economic analysis of medical practice variation
Table 1. Hospital Admission Utilization Expenditure, Variation, and Welfare Loss Comparisons: No PORT Influenced HospitalAdmissions
CV ofAdmission rate admission rate Expenditure (in $’000s) Welfare loss (in $’000s) 1991 to 2000
Admissions change in welfaredescription 1991 2000 1991 2000 1991 2000 1991 2000 loss (in $’000s)
Other vascularprocedures
102,280 103,840 36.7% 15.9% $900,875 $1,179,014 $552,884 $99,640 −$453,244
Major small and largebowel operations
155,440 138,840 20.9% 14.7% $1,827,445 $2,327,803 $364,193 $168,649 −$195,544
Adult bronchitis &asthma
172,920 66,700 32.2% 34.3% $562,436 $228,461 $266,867 $89,630 −$177,238
Chemotherapy 116,200 27,560 45.9% 46.9% $247,053 $141,325 $237,309 $103,583 −$133,727Other myeloproliferative
disorder Dx.s50,940 43,780 37.2% 18.7% $269,284 $371,484 $170,080 $43,518 −$126,562
Nervous systemoperations
42,400 52,560 28.9% 17.7% $557,777 $845,344 $213,108 $88,761 −$124,347
Liver transplant 6,420 4,960 59.9% 45.4% $100,714 $122,011 $165,240 $83,747 −$81,493Operations for injuries 20,320 20,720 42.5% 22.8% $145,390 $223,171 $120,062 $38,732 −$81,330Vascular reconstructive
procedures53,080 58,100 23.5% 19.8% $859,929 $1,210,665 $217,428 $157,968 −$59,460
Adult gastroenteritis 294,320 283,040 22.8% 20.2% $766,622 $982,691 $182,514 $133,962 −$48,552Dental and oral disorders 3,060 3,700 126.3% 55.1% $8,833 $15,991 $64,339 $16,220 −$48,119Endocrine, nutritional, &
metabolic oper.27,680 26,240 32.1% 25.1% $195,745 $214,680 $92,020 $45,019 −$47,001
Kidney & urinary tractinfections
179,140 197,780 23.6% 21.0% $645,552 $804,937 $164,199 $118,247 −$45,952
Foot procedures 8,480 4,140 71.2% 44.0% $24,959 $20,977 $57,826 $13,536 −$44,291Other operations of
the eye41,520 7,460 36.9% 59.6% $116,171 $29,843 $72,102 $35,323 −$36,779
Toxic effect of drugs 26,120 18,440 39.3% 28.5% $74,298 $69,244 $52,385 $18,722 −$33,663Peripheral vascular
disorders111,380 115,680 22.8% 17.5% $344,269 $501,165 $81,815 $51,155 −$30,660
Stomach, esophageal, &duodenal operations
37,080 31,360 21.8% 21.0% $539,668 $607,761 $117,706 $89,467 −$28,238
Other surgicalprocedures
66,720 59,720 23.7% 21.9% $731,263 $997,368 $187,143 $159,722 −$27,421
Minor genitourinarytract operations
35,940 32,060 29.4% 28.1% $264,685 $308,285 $104,868 $81,356 −$23,512
G.I. obstruction 86,720 101,860 22.8% 18.0% $267,908 $414,727 $63,397 $44,711 −$18,686Uterus and adnexa
operations28,860 19,020 32.6% 35.3% $162,633 $148,650 $79,062 $61,780 −$17,282
Tubal interruptions fornonmalignancy
23,720 23,220 36.2% 30.3% $71,703 $93,503 $42,912 $28,625 −$14,286
Skin grafts 36,520 27,880 34.2% 43.6% $326,108 $253,966 $173,812 $160,919 −$12,893Inguinal and femoral
hernia operations39,460 17,840 37.7% 42.7% $92,225 $78,840 $59,917 $47,918 −$11,999
Other ear, nose andthroat diagnoses
49,440 50,320 29.7% 25.1% $108,398 $151,429 $43,647 $31,714 −$11,933
Respiratory neoplasms 67,160 57,740 26.3% 26.2% $313,763 $391,479 $99,088 $89,297 −$9,790Nonextensive O.R.
procedures32,160 21,620 29.6% 31.6% $185,474 $197,197 $74,067 $65,684 −$8,382
Malignancy &infections, femalereproduct
8,080 10,020 66.1% 53.7% $30,813 $55,765 $61,515 $53,706 −$7,809
Hysterectomy 14,300 12,280 35.6% 34.5% $68,734 $81,097 $39,831 $32,275 −$7,556Stupor and coma 18,180 29,940 36.6% 26.4% $75,740 $169,970 $46,286 $39,513 −$6,773Breast procedure -
biopsy for nonmaligna3,240 1,660 61.2% 53.7% $7,452 $7,360 $12,744 $7,076 −$5,668
Urinary tract stones 29,320 19,980 28.1% 31.3% $68,850 $64,673 $24,880 $21,193 −$3,687Alcohol & drug use 31,940 24,880 42.7% 52.6% $107,144 $92,737 $89,070 $85,648 −$3,422Hand procedures exc.
ganglion2,060 1,080 53.3% 53.4% $4,933 $3,548 $6,403 $3,373 −$3,030
Lower extrem./ humerprocedure exc. hip/F
40,600 43,520 34.5% 32.1% $176,646 $273,089 $96,235 $93,711 −$2,524
Concussion 5,900 4,660 48.8% 47.4% $13,480 $16,593 $14,678 $12,457 −$2,221Major genitourinary
tract operations31,420 29,900 28.3% 29.7% $312,607 $384,115 $114,255 $113,340 −$915
Misc. ear, nose, andthroat operations
2,700 1,080 58.8% 81.7% $6,805 $4,897 $10,745 $10,912 $166
Peptic ulcer 29,700 23,900 33.7% 36.1% $92,312 $114,319 $47,856 $49,592 $1,736
INTL. J. OF TECHNOLOGY ASSESSMENT IN HEALTH CARE 24:3, 2008 287

Parente et al.
Table 1. Continued.
CV ofAdmission rate admission rate Expenditure (in $’000s) Welfare loss (in $’000s) 1991 to 2000
Admissions change in welfaredescription 1991 2000 1991 2000 1991 2000 1991 2000 loss (in $’000s)
Adult otitis media & uri 15,600 15,000 39.4% 44.5% $38,810 $44,716 $27,515 $29,487 $1,972Appendectomy with
appendicitis11,200 11,820 38.4% 39.8% $66,385 $91,481 $44,737 $48,392 $3,655
Other ear, nose, andthroat operations
18,520 9,500 36.3% 49.4% $74,510 $62,143 $44,750 $50,533 $5,783
Pancreas disorders 32,080 40,080 27.5% 25.1% $128,954 $246,465 $44,631 $51,641 $7,010Conization exc. for
malignancy2,140 1,700 44.6% 73.2% $4,383 $6,482 $3,991 $11,589 $7,598
Red blood cell disorders 58,000 71,640 25.1% 24.1% $166,585 $289,939 $47,884 $55,986 $8,102Soft tissue operations 10,200 8,880 43.1% 52.0% $40,280 $50,127 $34,226 $45,235 $11,009Mastectomy for
malignancy62,620 37,000 17.6% 28.8% $198,847 $142,236 $28,075 $39,464 $11,389
Other endocrine,nutritional &metab. Dx
249,900 274,980 21.4% 22.7% $852,664 $1,103,268 $177,756 $189,789 $12,033
Female reproductive sys.operations
48,320 44,140 23.4% 28.8% $164,642 $205,409 $41,259 $56,673 $15,414
Not classified 57,240 50,740 23.3% 25.4% $797,574 $991,428 $197,765 $213,421 $15,656Other adult hernia
operations26,020 22,200 29.7% 35.7% $86,912 $119,247 $34,948 $50,765 $15,816
Seizures and headaches 55,820 51,180 21.6% 27.3% $183,105 $224,211 $39,040 $55,729 $16,689Other digestive disease
operations53,880 52,180 21.2% 22.9% $456,807 $650,102 $93,528 $113,257 $19,729
Other vascularprocedures
190,100 113,080 21.0% 28.7% $1,599,918 $1,256,805 $322,109 $345,155 $23,045
Other musculoskeletalsystem procedures
60,720 55,760 21.9% 26.2% $386,401 $484,500 $84,757 $111,185 $26,429
Eye disorders 7,240 7,180 40.6% 70.9% $17,714 $25,783 $13,345 $43,247 $29,902Other respiratory system
diagnoses90,180 109,240 19.8% 23.4% $374,917 $586,028 $66,881 $107,033 $40,152
Other fractures/ sprains/strains/ dislo
35,720 37,560 39.6% 50.2% $96,656 $134,706 $69,099 $113,029 $43,930
Anal operations 20,380 10,120 30.5% 62.6% $59,242 $53,380 $25,121 $69,779 $44,658Gastrointestinal
hemorrhage191,980 256,880 12.7% 16.0% $675,793 $1,175,589 $49,544 $100,058 $50,513
Immunity disorders 32,940 31,920 27.6% 40.5% $185,796 $215,540 $64,726 $117,986 $53,260Syncope & collapse 108,840 135,960 23.7% 29.2% $271,216 $445,347 $69,571 $126,394 $56,823Digestive malignancy 37,160 33,140 31.5% 43.4% $182,080 $225,095 $82,605 $141,299 $58,694Respiratory system
operations70,300 73,780 22.3% 24.2% $707,092 $1,157,510 $160,240 $226,040 $65,799
Other skin, subcut.tissue & breast proc.
15,460 9,440 33.9% 66.5% $80,022 $73,798 $42,043 $108,704 $66,661
Respiratory sign &symptoms
35,220 25,120 25.9% 58.6% $94,780 $90,680 $29,086 $103,923 $74,837
Other hematology &oncology
8,480 9,940 38.9% 45.4% $116,641 $227,627 $80,808 $156,620 $75,812
Other digestive diseasediagnoses
58,700 85,900 24.4% 29.3% $209,091 $468,823 $57,064 $134,313 $77,249
Male reproductivesystem operations
28,260 9,820 31.8% 83.3% $99,291 $55,167 $45,823 $127,593 $81,770
Extracranial vascularprocedures
55,200 86,220 23.4% 28.4% $325,344 $614,625 $81,048 $165,298 $84,250
Other injuries,poisoning, tox.effect di
35,820 39,840 44.6% 59.3% $108,896 $171,357 $98,928 $201,242 $102,313
Other trauma 41,700 58,320 26.3% 26.1% $2,133,620 $3,415,314 $672,509 $776,687 $104,178Other hepatobiliary
system diagnoses62,160 61,180 24.8% 38.3% $281,405 $399,654 $79,320 $195,276 $115,956
Chronic obstructivepulmonary disease
175,760 343,720 25.5% 24.5% $652,919 $1,553,881 $194,146 $310,920 $116,774
Other nervous systemdiagnoses
140,780 176,900 36.9% 39.3% $658,343 $1,058,842 $409,625 $544,302 $134,677
Respiratory infections/inflammations
147,720 164,360 29.2% 36.3% $956,025 $1,289,908 $372,492 $567,503 $195,011
Kidney & urinary tractdiagnoses
88,000 147,060 18.0% 35.4% $345,460 $889,786 $50,942 $370,933 $319,991
288 INTL. J. OF TECHNOLOGY ASSESSMENT IN HEALTH CARE 24:3, 2008

Economic analysis of medical practice variation
Table 1. Continued.
CV ofAdmission rate admission rate Expenditure (in $’000s) Welfare loss (in $’000s) 1991 to 2000
Admissions change in welfaredescription 1991 2000 1991 2000 1991 2000 1991 2000 loss (in $’000s)
Cellulitis 83,080 98,020 21.8% 57.7% $269,161 $382,381 $58,385 $424,504 $366,119Other musculoskeletal
system diagnoses157,100 164,060 28.7% 54.5% $602,431 $817,827 $227,222 $811,603 $584,381
Infectious diseasediagnoses
179,460 215,200 20.5% 45.8% $926,252 $1,520,523 $178,220 $1,065,570 $887,350
Other factors influencinghealth status
180,560 344,920 50.2% 63.3% $1,273,685 $2,959,098 $1,468,011 $3,951,219 $2,483,208
Other skin, subcutaneoustissue & breast
57,360 66,460 30.7% 159.0% $198,255 $333,111 $85,558 $2,807,750 $2,722,192
Pulmonary edema &respiratory failure
56,220 75,400 33.3% 395.7% $274,629 $562,434 $138,773 $29,374,862 $29,236,089
TOTAL 5,285,069 5,560,620 $29,098,238 $41,070,551 $10,922,593 $47,402,385 $36,479,792
effect of the PORT was not a reduction in the welfare lossfor those procedures, in terms of inflation adjusted dollarsbetween 1991 and 2000. For many MDRGs, there was reduc-tion in welfare loss. However, when these negative changesin welfare loss were added with the MDRGs where there wasan increase in welfare loss, the net effect in all three PORT-affected categories was still an increase in welfare loss.
The results of this study suggest the PORT initiativemay have had a welfare-improving effect on society. At thevery least, the evidence suggests that, taken as a group,the directly PORT-affected and cardiac PORT proceduresshow that the variation situation documented by Wennbergand others might have deteriorated further had there beenno PORT investigations. The cardiac PORT results were
Table 2. Hospital Admission Utilization Expenditure, Variation, and Welfare Loss Comparisons: PORT InfluencedHospital Admissions
CV ofAdmission rate admission rate Expenditure (in $’000s) Welfare loss (in $’000s) 1991 to 2000
change in welfareAdmissions description 1991 2000 1991 2000 1991 2000 1991 2000 loss (in $’000s)
Prostatectomy 252,680 98,300 17.2% 22.8% $975,508 $465,382 $132,189 $80,879 −$51,310Psychosis 170,600 137,820 42.9% 42.5% $733,576 $948,747 $616,637 $571,548 −$45,089Lens operation 8,680 620 67.5% 64.7% $18,932 $2,327 $39,394 $3,251 −$36,143Knee procedures 275,280 343,180 24.6% 24.0% $2,467,498 $3,418,018 $684,311 $658,253 −$26,058Acute adjustment
reaction19,880 17,860 47.0% 42.3% $59,427 $71,140 $59,964 $42,507 −$17,457
Disorders of thebiliary tract
48,860 38,020 27.0% 23.9% $155,233 $183,550 $51,567 $34,826 −$16,741
Hip procedure exceptjoint replacement
147,000 149,960 18.1% 18.7% $1,023,287 $1,197,998 $153,985 $139,603 −$14,382
Male reproductivesystem diagnoses
21,500 14,300 34.3% 36.7% $60,708 $58,146 $32,601 $26,072 −$6,529
Transurethraloperations
51,240 30,060 27.0% 30.0% $151,656 $147,937 $50,623 $44,401 −$6,222
Diabetes 74,620 67,620 29.8% 30.4% $214,522 $262,312 $86,868 $80,718 −$6,150Hepatobiliary system
procedures29,540 17,960 27.4% 33.9% $391,779 $362,375 $133,968 $139,159 $5,191
Cholecystectomy withgall bladder disease
136,340 101,380 19.4% 25.0% $765,229 $843,027 $131,215 $175,543 $44,328
Depressive neurosis 12,640 10,420 48.6% 75.1% $48,318 $52,342 $52,105 $98,424 $46,319Other mental disorders 81,640 76,200 34.0% 39.0% $322,142 $454,284 $170,604 $229,858 $59,254Medical back problems 95,240 192,780 31.2% 23.3% $254,443 $1,181,248 $113,376 $214,675 $101,300Adult pneumonias 481,540 617,560 21.0% 25.1% $2,683,982 $4,448,802 $543,222 $936,157 $392,935Fracture femur/ hip/
or pelvis70,380 67,360 52.6% 116.9% $285,844 $330,579 $361,736 $1,506,960 $1,145,224
TOTAL 1,977,660 1,981,400 $10,612,084 $14,428,214 $3,414,364 $4,982,833 $1,568,470
INTL. J. OF TECHNOLOGY ASSESSMENT IN HEALTH CARE 24:3, 2008 289

Parente et al.
Table 3. Hospital Admission Utilization Expenditure, Variation, and Welfare Loss Comparisons: Cardiac PORTHospital Admissions
CV ofAdmission rate admission rate Expenditure (in $’000s) Welfare loss (in $’000s) 1991 to 2000
change in welfareAdmissions description 1991 2000 1991 2000 1991 2000 1991 2000 loss (in $’000s)
Specificcerebrovasculardisorders
359,760 331,900 25.0% 16.7% $1,729,652 $1,949,468 $495,236 $180,296 −$314,939
Angina pectoris 309,280 61,720 31.4% 37.1% $711,644 $159,257 $321,334 $73,077 −$248,257Cardiothoracic
procedures7,900 60,920 65.8% 22.3% $199,201 $1,309,166 $393,916 $216,920 −$176,996
Circulatory disordersexc AMI,W/CARDCTH
195,700 181,480 29.9% 23.3% $775,380 $1,142,009 $317,367 $206,680 −$110,686
Chest pain 102,120 174,880 31.9% 19.5% $205,683 $453,190 $95,713 $57,289 −$38,425Transient ischemic
attack and precerebra128,960 144,780 26.5% 22.6% $322,209 $517,619 $103,181 $88,226 −$14,955
Cardiac arrhythimias 252,540 272,380 17.8% 16.9% $710,547 $950,892 $103,164 $90,056 −$13,109Hypertension 25,500 33,660 36.6% 37.5% $58,932 $97,371 $36,055 $45,545 $9,490Acute myocardial
infarction285,420 267,020 19.1% 20.4% $1,418,387 $1,800,694 $236,458 $250,331 $13,873
Heart failure & shock 579,740 633,080 16.0% 17.1% $2,181,259 $3,143,479 $255,781 $306,875 $51,094Other circulatory
system diagnoses58,360 76,740 25.8% 29.0% $216,765 $430,535 $65,974 $120,511 $54,537
Atherosclerosis 18,360 141,580 57.6% 31.6% $50,003 $460,458 $75,793 $153,289 $77,496Coronary bypass
procedures122,280 85,460 18.2% 25.4% $2,553,313 $2,363,918 $387,433 $508,700 $121,267
Pacemaker procedures 84,820 334,920 21.7% 21.4% $814,317 $4,046,886 $174,473 $618,588 $444,114Cardiac valve
procedures32,600 60,200 27.8% 33.9% $968,575 $2,145,517 $342,756 $824,420 $481,664
TOTAL 2,563,340 2,860,720 $12,915,864 $20,970,460 $3,404,634 $3,740,802 $336,168
particularly interesting because of the overall lack of highlevels of COV in 2000. Generally, when new medical in-novations are introduced, one would expect a high level ofvariation in clinical practice as the new technology is dif-fused (5). However, cardiac care was already governed by
national clinical guidelines for the treatment of hyperten-sion and lipid disorders by 1991, and many of the newertechnologies introduced in the 1990s were introduced witha strong evidence base and with clear indications for appro-priate use—factors which may be associated with inherently
Table 4. Changes in Welfare Loss 1991–2000: Comparison of No PORT, PORT and Cardiac PORT Admissions
Ratio of 20001991 to 2000 1991 to 2000 expenditure to
1991 2000 Change % Change welfare loss
No PORTAdmissions 5,287,060 5,556,620 5.1%
Sum of expenditures $29,100,229,199 $41,072,551,331 41.1%Welfare loss in 2000 $$$ $10,922,592,733 $47,402,385,167 $40,652,671,540 334.0% 0.87
PORT affectedAdmissions 1,977,660 1,981,400 0.2%
Sum of expenditures $10,612,084,330 $14,428,214,472 36.0%Welfare loss in 2000 $$$ $3,414,363,591 $4,982,833,299 $1,568,469,709 45.9% 2.90
Cardiac PORTAdmissions 2,563,340 2,860,720 11.6%
Sum of expenditures 12,915,863,740 $20,970,459,760 62.4%Welfare loss in 2000 $$$ $3,404,633,960 $3,740,802,340 $336,168,375 9.9% 5.61
290 INTL. J. OF TECHNOLOGY ASSESSMENT IN HEALTH CARE 24:3, 2008

Economic analysis of medical practice variation
Figure 2. Percentage of welfare loss between 1991 and 2000 by PORT-affected categories.
low levels of variation, as both the 1991and 2000 resultssuggest.
This research has five limitations. First, we chose onlyto focus on the Medicare population, limiting the generaliz-ability of these findings to the privately insured population.However, the selection of the Medicare population removesmany confounding influences such as the effect of managedcare and other financial incentives that were either introduced(e.g., performance based financial rewards for physicians) orremoved (e.g., scaling back utilization review activities infavor of disease management). The Medicare reimbursementsystem largely remained unchanged for hospitals during thestudy period. The rise of Medicare managed care may have aninfluence, but to the extent possible, its effect was formallyconsidered in our approach by including it as a covariatein the MDRG-specific regression models used to adjust thecoefficient of variation.
The second limitation is a failure to control for the in-troduction of new medical technologies, which could affectthe production of inpatient hospital admissions. While thiscould certainly influence our results, we see it as equallylikely that these exogenous shocks to the market would in-fluence both the PORT affected and non-PORT admissionsrandomly. In addition, these shocks could simultaneously af-fect many clinical domains. For example, development andapplication of sophisticated laparoscopic surgical techniquesaffected not only the University of Pennsylvania PORT ongall bladder disease, but many other clinical domains nottargeted by PORTS, such as orthopedic procedures, manage-ment of appendicitis, and neonatology. Similarly, advances inimaging technology improved diagnosis and in many casesmanagement of conditions in numerous clinical domains.(1;6).
A third limitation is that the analysis does not explicitlyaccount for substitution of outpatient services for inpatientcare. However, like the case of the development of a newtechnology shock, the presence of substitutable proceduresmay fairly be assumed to be random in its influence on eitherPORT or non-PORT admissions.
The fourth limitation is that our estimates of the “cor-rect” level of hospital utilization may incorrect. For exam-ple, the average rate of knee procedures in our study was8.6/1,000, but ideally, it should (hypothetically) be 7/1,000based on the state of medical technology knowledge, dis-ease prevalence and hospital supply. This deviation from acorrect rate would introduce a bias formally expressed inthe welfare loss expression as an additional component tobe added to the welfare loss expression stated as: Addi-tional WL = 1/2(%Bias)2/h where h is demand elasticity(15). Thus, the welfare loss increases with the square of thepercent change in the bias of average use relative to the “cor-rect” rate of use. This calculation is based on the propertyin statistics where mean squared error of a biased estimatorcontains two sources of error—variability about the meanand the squared bias. This additional welfare loss due tobias would occur for both under-use and over-use of a pro-cedure in a manner similar to that displayed by the deadweight loss triangles in Figure #1. A more complete analysiswould account for the additional welfare loss introduced bythis bias with meta-analysis to compare average and expert-determined “correct” rates of utilization. While this addi-tional step is outside the scope of the analysis, our inabilityto account for bias leads us to assume the average rate ofuse is correct and thus our estimates could be interpreted asa lower bound of the welfare loss possible for each type ofadmission.
INTL. J. OF TECHNOLOGY ASSESSMENT IN HEALTH CARE 24:3, 2008 291

Parente et al.
Finally, the analysis is done at the level of the nation,and does not drill down to identify specific mechanisms thatmitigate or aggravate variation in practice that influence so-cial welfare. In theory, the method applied in this analysiscould be applied to pinpoint patterns of variation and wel-fare loss at the physician level by using the attending physi-cian’s unique identification number (UPIN). The attendingphysician serves the role as admitting and discharge coordi-nator for a patient, so their individual practice style shouldbe carefully quantified if possible. Unfortunately, physicianidentification data are only of good quality in 2000 becauseand the UPIN was not a required data field in 1991. Hospitalidentification might serve as a proxy, but it is not as clean arepresentation of practice style. Because hospitals are essen-tially the doctor’s workshop (13), physicians, not institutions,may primarily determine admission rates. Ideally, an econo-metric analysis focused on some combination of both, withadmitted physician effects accounted for by random effectsand hospital by fixed effects, using a national database wouldprovide the most comprehensive approach to addressing thisissue.
From a policy perspective, PORTs may have been agood investment, although the Agency for Health Care Policyand Research did not provide a direct successor program ofresearch. Practice guidelines developed through the PORTinitiative were followed up by a host of clinical practiceguidelines created by constituencies ranging from disease-specific societies to specialty groups whose recommendationwere not always strongly evidence-based.
The success of recent research initiatives that aim to re-duce errors and improve patient safety could be enhanced insome cases by adopting and further developing the measuresof variation in care and social welfare loss using methodssimilar to those we have presented. An example of such anapplication may be investigations of drug prescribing prac-tices. Patterns of drug prescribing exhibit wide variation,which may often translate directly into variation in clinicaloutcomes, costs of care, and risk of adverse events (3). More-over, variation exists at several levels of the care system—patients, providers, facilities, and regions. This area of inves-tigation promises to deepen and broaden our understandingof variation in care, and perhaps lead to novel interventionstrategies built, to some degree, on the foundations laid bythe pioneering PORT studies
In summary, this is the first study to systematically eval-uate the long term effect of PORTs on practice variation andsocial welfare. Using an economic derivation of welfare lossattributable to medical practice variation, and using hospitaladmission claims data for 2 million elderly patients general-izable to nation, we estimated the change in welfare in the1990s for conditions that were or were not targeted by PORTinvestigations. Our results show that inpatient clinical do-mains targeted by the PORTs had less welfare loss relativeto their total expenditure by 2000, but that there was not anet decrease in the welfare loss for all hospital admissions
affected by the PORT. This research provides a novel ap-proach to evaluating the impact of significant social scienceand medical interventions, and variation in the delivery ofthese interventions, on social welfare.
CONTACT INFORMATION
Stephen T. Parente, PhD ([email protected]), AssociateProfessor, Department of Finance, University of Minnesota,321 19th Avenue South, Room 3-279; Director, Medical In-dustry Leadership Institute, Carlson School of Management,321 19th Avenue South, Room 3-122, Minneapolis, Min-nesota 55455Charles E. Phelps, PhD ([email protected]),University Professor/Provost Emeritus, Economics/Comm. & Preventive Medicine, University of Rochester,200 Wallis Hall, Rochester, New York 14627Patrick J. O’Connor, MD, MPH ([email protected]), Senior Clinical Investigator, Health-Partners Research Foundation, 8170 33rd Avenue South,Mail Stop: 21111R, Minneapolis, Minnesota 55440-1524
REFERENCES
1. Bass EB, Pitt HA, Lillemoe KD. Cost-effectiveness of la-paroscopic cholecystectomy versus open cholecystectomy. AmJ Surg. 1993;165:466-471.
2. Cain KC, Diehr P. Testing the null hypothesis in small areaanalysis. Health Serv Res. 1992;27:267-294.
3. Centers for Disease Control. Communication. JAMA. May 15,2002.
4. Diehr P, Grembowski D. A small area simulation approachto determining excess variation in dental procedure rates. AmJ Public Health. 1990;80:1343-1348.
5. Eisenberg JM. Doctor’s decisions and the cost of medical care.Ann Arbor, MI: Health Administration Press; 1986.
6. Escarce JJ, Bloom BS, Hillman AL, Shea JA, SchwartzJS. Diffusion of laparoscopic cholecystectomy among gen-eral surgeons in the United States. Med Care. 1995;33:256-271.
7. Freund D, Lave J, Clancy C, et al. Patient outcomes researchteams: Contribution to outcomes and effectiveness research.Annu Rev Public Health. 1999;20:337-359.
8. Glover JA. The incidence of tonsillectomy in school children.Proc R Soc Med. 1938;31:1219-1236.
9. Institute of Medicine. Assessing medical technologies. Wash-ington, DC: National Academy Press; 1985.
10. Institute of Medicine. To err is human. Washington, DC: Na-tional Academy Press; 1999.
11. Institute of Medicine. Crossing the quality chasm. Washington,DC: National Academy Press; 2001.
12. Paul-Shaheen P, Clark JD, Williams D. Small area analysis: Areview and analysis of the North American literature. J HealthPolit Policy Law. 1987;12:741-809.
13. Pauly MV, Redisch M. The not-for-profit hospital as a physi-cian’s cooperative. Am Econ Rev. 1973;63:87-99.
292 INTL. J. OF TECHNOLOGY ASSESSMENT IN HEALTH CARE 24:3, 2008

Economic analysis of medical practice variation
14. Phelps CE, Parente ST. Priority setting in medical technol-ogy and medical practice assessment. Med Care. 1990;28:703-723.
15. Phelps CE, Mooney C. Priority setting in medical technologyand medical practice assessment: Correction and update. MedCare. 1992;30:744-751.
16. Wennberg JE. Dealing with medical practice variations: A pro-posal for action. Health Aff (Millwood). 1984;3:6-32.
17. Wennberg JE, Gittelsohn A. Small area variations in health caredelivery. Science. 1973:1102-1108.
18. Wennberg JE, Freeman JL, Culp WJ. Are hospital servicesrationed in New Haven or over-utilised in Boston?” Lancet.1987;1:1185-1189.
19. University of York, Centre for Reviews and Dissemination.http://www.york.ac.uk/inst.crd/hfaq16.htm, Accessed April 13,2008.
INTL. J. OF TECHNOLOGY ASSESSMENT IN HEALTH CARE 24:3, 2008 293