Embed Size (px)
Citation preview

Ecological dynamics on old extensive green roofs:
vegetation and substrates > twenty years since installation
By:
Christine E. Thuring
A thesis submitted in partial fulfilment of the requirements for the degree of
Doctor of Philosophy
The University of Sheffield
Faculty of Social Sciences
Department of Landscape
July 2015

i
Contents
Table of Contents …………………………………………………………………………….…………………….……… i
Summary ………….………………………………….……………………………….………………………………......…… v
List of Figures …………………..……………………………….……………………………….…………………….…... vi
List of Tables …………….………………………………….……………………………….…………………………..…… x
List of Abbreviations ………………………………….……………………………….…………………………..… xiii
Acknowledgements ………………………..….……………………………….……………………………….…… xiv
1 Introduction ………………………………………………………………………………………………….……….. 1
1.1 What are green roofs? ……………………………………………………………………………………....… 2 1.1.1 Extensive green roof systems …………………………………………………………………………... 4 1.1.2 Policies and standards supporting EGR development and implementation ..….. 11 1.1.3 The function and benefits of extensive green roofs ……..……..……..……..……..……. 13
1.2 Green roofs and urbanization …………………………………………………………………………… 14 1.2.1 Ecosystem services and biodiversity: current knowledge ……………………………….. 15 1.2.2 Green roofs as green infrastructure ……………………………………………………………..… 17
1.3 Ecology and green roofs ……………………………………………………………………………….…… 19 1.3.1 A brief history of ecology ………………………………………………………………………….……. 19 1.3.2 Natural succession and vegetation dynamics ……………………………………….…….…… 21 1.3.3 Urban ecology ……………………………………….…….…………………………………………….…... 30 1.3.4 Green roofs designed for biodiversity ….…….…………………………………………….…….. 35
1.4 Ecological research on green roofs ….…….……………………………………………….……….. 36 1.4.1 EGR plant screening trials ….…….…………………………………………….………………………. 37 1.4.2 Green roof phytosociology …………………………………………….……………….……….…..… 39 1.4.3 Natural succession on spontaneously vegetated gravel roofs ………….…….…….... 40 1.4.4 EGR biodiversity research ……………….………...……………….………...………….…….….…. 42
1.5 Research questions and aims …………….………...……………….………...……………….……… 46 1.5.1 Research aims …………….………...……………….………...……………….………………………..… 46 1.5.2 Research questions …….………...……………….………...……………….………………………..… 46

ii
2 Vegetation development on EGRs over time ...……………….…………….……………. 47
2.1 Literature review: plant ecological surveys of mature green roof vegetation 2.1.1 Research aims and questions …….………...……………….………...……………………………. 51
2.2 Methods …………………………………….….………...……………….………...……………….……….……. 52 2.2.1 Description of the roofs surveyed …...……………….………...……………….…..……...…... 53 2.2.2 Background and original information …………….………...……………….…..………………. 61 2.2.3 Sampling methods …………………………………….….………...……………….………..........….. 62 2.2.4 Data collected …………………………………….….………...……………….………........………..…. 66 2.2.5 Data analysis …………………………………….….………...……………….………........…………….. 73
2.3 Results …………………………………….….………...……………….………........…………….………..….… 74 2.3.1 Relating cover and species diversity of growth forms ……….…………………..……..… 80 2.3.2 Relating green roof vegetation with time (roof age) …………………….…………...…… 82 2.3.3 Relating EGR vegetation development with environmental conditions ….…….… 83 2.3.4 Relating vegetation development to substrate characteristics ………………..……… 86
2.4 Discussion …………………………………….….………...……………….………....……………….…..……. 87 2.4.1 Distinguishing plant growth forms: different approaches ….….………………………… 87 2.4.2 Treatment of aspect, slope and shade …………………….………….........................…… 88
2.5 Conclusions …………………………………….….………...……………….………........…………….……… 89 2.5.1 Vegetation dynamics ……………….….………...……………….………...……………….…..…..... 89 2.5.2 Roof vegetation, time (roof age) and environmental conditions …….…..…..…..... 90
3 Classifying mature EGR vegetation into types ..……………….………...………………. 92
3.1 Literature Review: plant community ecology of green roof vegetation ……… 92 3.1.1 Factors in green roof plant community formation ……………….……….……….……….. 93 3.1.2 Classifying EGR vegetation into recurring types: emergence? ….……….……..……. 96 3.1.3 Research aims and questions .……………….………. .……………….………...…………………. 98
3.2 Methods ………………………………….….………...……………….………........………………………..…. 99 3.2.1 Data analysis …………………….….………...……………….………........………………………..…... 99
3.3 Results …………………….….………...……………….………........………………………..………………... 103 3.3.1 EGR species composition after 20-30 years: persistence, loss and gain …………. 103 3.3.2 Characterising EGR grasses and succulents ………..….………..….………..….……….…. 114 3.3.3 Succulents: in proportion to other life forms ……..….………..….………..….…….….... 120 3.3.4 EGR vegetation types ……..….………..….………..….…………..….…………..….………….…. 123
3.4 Conclusions …………………………….….………...……………….………........………………………….. 128 3.4.1 EGR vegetation over time: persistence, gain and loss ……...……..…..…….………... 128 3.4.2 EGR vegetation composition after > 20 years ……………………………………..………... 131 3.4.3 Characterising EGR vegetation: succulents and grasses ………………………..………. 132 3.4.4 EGR vegetation communities or types ……………..…………………..……….….…….…… 132

iii
4 Substrate depth over time ….………..….…………..….…………..….…………..…………….… 133
4.1 Literature review ……………..……….………..……….………..………………..……….………………. 133 4.1.1 Depth and the FLL guideline .………..……….………..………………..……….…………………. 133 4.1.2 Depth and green roof ecology ……..……….………..………………..……….…………………. 136 4.1.3 Research aims and questions ……..……….………..………………..……….………………..…. 137
4.2 Methods ……………..……….………..……………………..………..………………..……….………………. 138 4.2.1 Data analysis ……..……….………..……………………..………..………………….….……………… 138
4.3 Results ……..……….………..……………………..…………………..………………..……….………………. 139 4.3.1 Quadrat-level query ……………………..…………………..………………..…………...……..…… 139 4.3.2 Roof-level query: mean depth ……..…………………..………………..…………...…………… 152
4.4 Conclusions ……..…………………..………………..…………...……………...……………...……….…… 156 4.4.1 How is depth over time addressed by the FLL? ……..……………...………………...…… 157
5 Ecological conditions and processes on EGRs …………………..………………….…… 159
5.1 Literature Review: the ecology of urban environments ……..………………….…… 159 5.1.1 The nature of urban ecosystems and urban vegetation ……..…………………….…… 160 5.1.2 Ecological principles for green roofs ……..………………..…………...……………….……… 169 5.1.3 Research aims and questions .………………..…………...……………………………….….…… 180
5.2 Methods .………………..…………...……………………….……….….…………….….…………….….…… 180 5.2.1 Data and Analysis ...……………………….……….….…………….….……………….….…… 181
5.3 Results and Discussion ...……………………….……….….…………….….…………….……..…… 182 5.3.1 Characterising EGR environmental conditions: Ellenberg Indicator Values ….… 182 5.3.2 Characterising EGR vegetation types using cluster analysis with EIVs …………… 192
5.4 Conclusions .………………..…………...……………………….……….….…………….….…………….…. 197 5.4.1 Characterising EGR environmental conditions …….….…………….….………………….. 197 5.4.2 EGR species composition over time: emergent properties? .….……………….…….. 198 5.4.3 Relevant ecological theories and models for EGRs .….…………………………….…….. 200
6 EGR substrate development after > twenty years …………………………………… 203
6.1 Literature review ………………………………………………………………………………………………. 203 6.1.1 Soil basics ……………………………………………………………………………………………………… 203 6.1.2 EGR substrates ……………………………………………………………………………………………… 212 6.1.3 Hydrologic-horticultural concepts for green roof substrates …………………….…… 215 6.1.4 Research aims and questions ………………………………………………………………………… 220
6.2 Methods ………………………………………………………………………….…………………………………. 220 6.2.1 Data and analysis ……………………………………….…………………………………………………. 221
6.3 Results and Discussion ……………………………………….……………………………………...……. 221 6.3.1 Physical characteristics: water holding capacity, soil organic content ………...… 222 6.3.2 Chemical characteristics: soil pH and nutrients …………………………………………..… 230 6.3.3 Biological component: ants and earthworms ……………………………………..………… 236
6.4 Conclusions …………………………………………………………….………………………………… 238 6.4.1 EGR substrate properties over time: FLL recommendations? ………….……….…… 238 6.4.2 Soil ecological processes on EGRs ………….……………………….………………………….… 240 6.4.3 Recommendations ………….…………………….……………………….………………………….… 243

iv
7 Proposing models for EGR vegetation development over time ………..…. 244
7.1 Literature review: the role of models to ecological research …..………………... 244 7.1.1 Application of CSR triangle model for natural succession to EGRs …..………..….. 246 7.1.2 Research aims and questions ………….……………………….………………………………...… 249
7.2 Methods ………….……………………….……………………………….........................................… 249 7.2.1 Methods for the quantitative model (EGR vegetation by CSR signatures) …….. 249
7.3 Results and Discussion ………….……………………….………………………………................... 252 7.3.1 Quantifying EGR vegetation types by adaptive life strategies (CSR) ..............… 252 7.3.2 Comparing EGR vegetation types by adaptive strategies ..............................…. 266 7.3.3 Quantifying EGR vegetation change over time ..............................................…. 267 7.3.4 Modeling successional change on EGRs over time: conceptual framework …… 275 7.3.5 Ecological filters influencing EGR vegetation dynamics …………………………………. 281 7.3.6 Modeling EGR vegetation assembly over time ……………………………..………………. 283
7.4 Conclusions ………….……………………….………………………………...................................... 286 7.4.1 To propose models illustrating and predicting vegetation development on EGRs
over time ………….……………………….………………………………..................................... 286 7.4.2 If successional change can be observed on EGRs, what are the main drivers and
mechanisms? ….……………………….………………………………....................................... 286
8 Concluding summary ……….……………………………….................................................. 288
8.1 Aim: To characterise mature EGR vegetation in terms of growth form cover and species diversity …………….……………………….………............................................. 289
8.2 Aim: To characterise EGR substrate development > 20 years after installation ……….……………………………….................................................................... 289
8.3 Aim: To identify plausible ecological theories or models which describe the processes that occur on EGRs over time …….……….............................................. 290
8.4 Aim: To propose models illustrating and predicting vegetation development on EGRs over time …………….................................................................................... 291
8.5 Future research …………………….……………………………................................................. 292 8.5.1 EGRs and urban ecological research ………………................................................. 292 8.5.2 EGRs and urban soil ecology ………………............................................................. 293 8.5.3 EGRs and plant ecological research ……………….................................................. 294 8.5.4 EGRs for testing theories and generating hypotheses ...................................... 294
8.6 Possible implications for the research .............................................................. 295
8.7 In closing …………….................................................................................................... 296
Bibliography ….………….….………………………………………..……………................................ 297
Appendix 1 ….……………..……………………………………………………….................................. 334
Appendix 2 ….……………………….…..…………………………………......................................... 366

v
Summary Extensive green roof (EGR) technology has become a popular ecological intervention for towns and cities around the world in recent years. Much is known about EGR engineered performance, but little work has studied green roofs as “novel ecosystems” subject to the laws of nature. This research would not have been possible without the collaborative industry-academic partnership in which it was nested, in particular the arrangement of access to a number of old EGRs by the industry partner. Since roof access is typically difficult to attain, this was a unique opportunity to develop methods and gain preliminary insights into what will undoubtedly become an important field of work in the rapidly urbanizing future. With an interest in how the vegetation and substrates of commercial EGR systems develop over time, nine of the oldest EGRs in the world (at least twenty years since installation) were surveyed using methods of applied plant ecology in southwest Germany. The vegetation cover of old EGRs is dominated by succulents, which are tolerant of the environmental stress and disturbance to which these systems are subject. With reference to original lists, species- and functional diversity appear to decline over time in spite of colonization by other species, eventually to comprise assemblages defined by the adaptive strategies of stress tolerance and ruderal life cycles. The growing substrates increased in soil organic content and declined in soil pH, and it is conceivable that associated plant-soil feedbacks support the Sedum dominance observed. Having characterised the environmental conditions of the EGRs using Ellenberg Indicator Values, the vegetation was characterised into different types, which included variations of the “Sedum meadow” as well as “Species-poor Sedum roof”. To predict the processes directing EGR species assembly over time, these vegetation types together with the species’ functional traits were integrated with a hierarchical causal framework of natural succession. To illustrate the quantitative and qualitative aspects of these time-based processes, the twin-filter model was adapted from universal adaptive strategies theory. Given the obvious decline in floristic diversity, this research challenges the assumption that commercial EGRs can support biodiversity over the long term, and proposes some ways by which these technologies can be improved to respond to the pressing issues of urbanisation and global biodiversity decline.

vi
List of Figures FIGURE 1.1. BUILD-UP OF TRADITIONAL SCANDINAVIAN GRASS ROOF WHERE 1=BIRCH BARK WATERPROOFING; 2=BRACKET HOOK; 3= CULLIS HOOK; 4=GRAVEL FILTER LAYER; 5=ROOF DECK. SOURCE: GRÜTZMACHER (1993).
FIGURE 1.2. ONE GERMAN STANDARD FOR TPG SPECIFIED GLUE-BRUSHING OVERLAPPING TARPAPER (USING “WOOD CEMENT”) ONTO A WOODEN ROOF DECK, AND LAYERS OF SAND AND GRAVEL. SOURCE: KOCH (1894).
FIGURE 1.3. EGRS COMPRISE A SERIES OF LAYERS ON TOP OF THE WATERPROOFED ROOF DECK.
FIGURE 1.4. PLANT HABIT AND ROOT ARCHITECTURE FOR EIGHT SPECIES IN (A) NATURAL HABITAT AND (B) EXTENSIVE GREEN ROOF SYSTEM. MODIFIED FROM RIEDMÜLLER, 1994 (P. 37-38).
FIGURE 1.5. VARIOUS INTERPRETATIONS OF SUCCESSION: 1. CLEMENTSIAN VIEW. 2. RELAY FLORISTICS. 3. INITIAL FLORISTICS. 4. CHANGING RESOURCE AVAILABILITY. 5. FACILITATION. 6. TOLERANCE. 7. INHIBITION. MODIFIED FROM LUKEN (1990).
FIGURE 1.6. WHEN NATURAL SUCCESSION IS DEFLECTED BY CONTINUOUS DISTURBANCE, SUCH AS GRAZING, THE VEGETATION DEVELOPS INTO AND IS MAINTAINED AS A PLAGIOCLIMAX COMMUNITY. MODIFIED FROM TANSLEY (1965).
FIGURE 1.7. CSR SPACE: A) THE RELATIONS BETWEEN THE TWO ENVIRONMENTAL DIMENSIONS (STRESS AND DISTURBANCE) AND THE THREE PLANT DIMENSIONS (C, S AND R); B) THE LOCATIONS OF THREE PRIMARY (C,S,R) AND FOUR SECONDARY (CR, SC, CSR, SR) PLANT FUNCTIONAL TYPES WITHIN THE ENTIRETY OF CSR SPACE. A FURTHER TWELVE TERTIARY INTERMEDIATES EXIST BETWEEN THESE SEVEN. MODIFIED FROM HUNT ET AL. (2004).
FIGURE 1.8. THE CSR MODEL OF PLANT STRATEGIES CAN BE USED TO ILLUSTRATE PATHWAYS OF NATURAL SUCCESSION UNDER VARIOUS DEGREES OF DISTURBANCE AND PRODUCTIVITY: (A) SUCCESSION UNDER CONDITIONS OF HIGH (S1); MODERATE (S2), AND
LOW (S3) POTENTIAL PRODUCTIVITY; (B) UNDER CONDITIONS OF INCREASING (S4) AND
DECREASING (S5) POTENTIAL PRODUCTIVITY. MODIFIED FROM GRIME (2001).
FIGURE 1.9. NATURAL SUCCESSION OF PLANT COMMUNITIES ON SUN-EXPOSED GRAVEL ROOFS IN BASEL OVER TIME (YEARS) AND IN VARIOUS DEPTHS (CM). MODIFIED FROM THOMMEN (1988) (P. 41).
FIGURE 2.1. SPECIES ASSEMBLAGES FOR DIFFERENT GRAVEL DEPTHS IN SWITZERLAND AFTER 20-30 YEARS. MODIFIED FROM THOMMEN (1988).
FIGURE 2.2. THE EGRS SURVEYED ARE IN SOUTH-WEST GERMANY, WITHIN 50 KM FROM STUTTGART CITY CENTRE.
FIGURE 2.3. THE NINE EGRS SAMPLED IN SOUTHWEST GERMANY WERE CONSTRUCTED BETWEEN 1977-1991 AND ARE ARRANGED IN ORDER OF INCREASING AGE FROM THE TOP-LEFT.
FIGURE 2.4. LAYOUT OF QUADRATS IN SYSTEMATIC INTERVAL SAMPLING AT FH NÜRTINGEN. FIGURE 2.5. QUADRAT PLACEMENT AT KÖNGEN FOLLOWED RANDOM SAMPLING METHODS FOR THE TWO ROOFS.

vii
FIGURE 2.6. QUADRAT PLACEMENT AT RATHAUS-PV FOLLOWED STRATIFIED SAMPLING METHODS, TAKING CARE TO AVOID MOUNDS AND EDGES.
FIGURE 2.7. TRANSECTS AND SYSTEMATIC RANDOM SYMMETRIC QUADRATS WERE USED AT TÜBINGEN AND KILLESBERG.
FIGURE 2.8. VISUAL INTERPRETATION OF DOMIN COVER/ COVER THRESHOLDS. IN THE DIAGRAMS, EACH SUB-SQUARE HAS THE SAME TOTAL AREA OF BLACK. THE TOP LEFT DIAGRAM, FOR EXAMPLE, HAS 10% BLACK IN EACH SUB-SQUARE. MODIFIED FROM RODWELL (2006).
FIGURE 2.9. ORDINAL RANKINGS FOR ENVIRONMENTAL VARIABLES.
FIGURE 2.10. THE VEGETATION AT KILLESBERG IS CLEARLY DEFINED BY THE NORTH-SOUTH GRADIENT.
FIGURE 3.1. FEEDBACKS AND DYNAMICS OF SOIL SEED BANKS. MODIFIED FROM LUKEN (1990: 41).
FIGURE 3.2. RE-CONFIGURING SUCCULENT COVER PROPORTIONATE TO 100% WITH THE OTHER GROWTH FORMS EXPLAINS MORE ABOUT THIS GROWTH FORM THAN THE ORIGINAL, NOT PROPORTIONATELY CORRECTED DATA (R2=0.79).
FIGURE 3.3. MEAN COVER (%) BY INTENTIONAL SPECIES FOR NINE EGRS, AS WELL AS RANGE.
FIGURE 3.4. NUMBER OF SPECIES AND THE PROPORTION (%) THAT WAS INTENTIONAL AND PERSISTED ON NINE EGRS > 20 YEARS.
FIGURE 3.5. TOTAL COVER (%) COMPRISING INTENTIONAL GRASS SPECIES FOR NINE EGRS.
FIGURE 3.6. RELATIVE COVER OF GROWTH FORMS ON NINE OLD EGRS [NB: KÖNGEN SOUTH IS USED (N=13), EXEMPTING THE 5 NORTH-FACING QUADRATS FROM THAT ROOF].
FIGURE 3.7. A CLUSTER ANALYSIS FOR NINE OLD EGRS REVEALS TWO MAJOR GROUPINGS, OR VEGETATION TYPES, WITH REFERENCE TO PROPORTIONATE COVER.
FIGURE 3.1. DEPTH MEASUREMENTS FOR THE ROOFS SURVEYED SHOW A FEW OUTLIERS, OF WHICH ONE WAS SIGNIFICANT.
FIGURE 3.2. MEASURED SUBSTRATE DEPTH (MM) PER ROOF, IN ORDER OF AGE AT TIME SURVEYED, AND SHOWING MEAN, MINIMUM AND MAXIMUM VALUES.
FIGURE 3.3. BLOCKED DRAINS ON VB A2 LED TO THE RE-POSITIONING OF THE LIGHTWEIGHT (LECA) SUBSTRATE COMPONENT; SEVERAL AREAS HAVE BEEN SCOURED TO EXPOSE THE WATERPROOFING.
FIGURE 3.4. SUBSTRATE LOSS (ASSUMING INITIAL DEPTH OF 100 MM) FOR SEVEN EGRS OF VARIOUS AGES.
FIGURE 3.5. QUADRATS LOCATED ON NORTH-FACING ASPECTS HAD A GREATER RANGE OF DEPTHS MEASURED BUT DID NOT DIFFER SIGNIFICANTLY FROM SOUTH-FACING QUADRATS.
FIGURE 3.6. MEAN SUBSTRATE DEPTH OF EGRS OVER A TIMEFRAME FROM 3 TO 33 YEARS AFTER INSTALLATION (USING DATA FROM BUTTSCHARDT, 2001).
FIGURE 5.1. ON A SUNNY AFTERNOON, URBAN AIR CAN BE 1-3°C WARMER THAN NEARBY RURAL AIR. SOURCE: BERKELEY LAB, HEAT ISLAND GROUP.

viii
FIGURE 5.2. A SCHEMATIC MODEL OF MAJOR URBAN FILTERS THAT ADD AND REMOVE PLANT SPECIES RESULTING IN ALTERED SPECIES PERSISTENCE AND LEAD TO A SUITE OF TAXA THAT CAN PERSIST IN URBAN ENVIRONMENTS. MODIFIED FROM WILLIAMS ET AL (2009).
FIGURE 5.3. FACILITATION MODEL AND RELAY FLORISTICS: AFTER CROPLAND IS ABANDONED, ANNUALS AND PERENNIAL HERBS ARE THE FIRST TO COLONIZE, FOLLOWED BY SHADE INTOLERANT WOODY SPECIES AND FINALLY THE SHADE-TOLERANT TREES AND SHRUBS, WHICH REPRESENT THE CLIMAX STATE. MODIFIED FROM EGLER (1954).
FIGURE 5.4. INITIAL FLORISTIC COMPOSITION MODEL: SECONDARY SUCCESSION IS STRONGLY DIRECTED BY THE PROPAGULES OF A SITE’S INITIAL FLORA, WHICH RISE AND FALL FROM PREDOMINANCE IN ACCORDANCE WITH RESOURCES AND STRESS. MODIFIED FROM EGLER (1954).
FIGURE 5.5. THE “HUMPED BACK MODEL FOR SPECIES RICHNESS” DESCRIBES THE IMPACT OF A GRADIENT OF INCREASING STRESS AND/ OR DISTURBANCE UPON THE POTENTIAL SPECIES DENSITY IN HERBACEOUS VEGETATION. MODIFIED FROM GRIME (1973A).
FIGURE 5.6 A) RANGE AND MEAN FOR LIGHT EIV ON NINE ROOFS; B) DISTRIBUTION OF SPECIES FOR 9 CATEGORIES OF LIGHT EIV.
FIGURE 5.7 A) RANGE AND MEAN FOR TEMPERATURE EIV ON NINE ROOFS; B) DISTRIBUTION OF SPECIES FOR 9 CATEGORIES OF TEMPERATURE EIV.
FIGURE 5.8 A) RANGE AND MEAN FOR CONTINENTALITY EIV ON NINE ROOFS; B) DISTRIBUTION OF SPECIES FOR 9 CATEGORIES OF CONTINENTALITY EIV.
FIGURE 5.9 A) RANGE AND MEAN FOR MOISTURE EIV ON NINE ROOFS; B) DISTRIBUTION OF SPECIES FOR 9 CATEGORIES OF MOISTURE EIV.
FIGURE 5.10 A) RANGE AND MEAN FOR REACTION EIV ON NINE ROOFS; B) DISTRIBUTION OF SPECIES FOR 9 CATEGORIES OF REACTION EIV.
FIGURE 5.11 A) RANGE AND MEAN FOR NITROGEN EIV ON NINE ROOFS; B) DISTRIBUTION OF SPECIES FOR 9 CATEGORIES OF NITROGEN EIV.
FIGURE 5.12. A CLUSTER ANALYSIS FOR NINE OLD EGRS REVEALS THREE MAJOR GROUPINGS WITH REFERENCE TO ENVIRONMENTAL GROWING CONDITIONS (EIV RANGE), SPECIES NUMBER, AND DOMINANCE BY NON-DOMINANT SPECIES.
FIGURE 6.1. THE PROPORTIONS OF SOLIDS, AIR AND WATER IN SOILS OF VARIOUS GROWING CONDITIONS: A) GOOD TOPSOIL (APPROXIMATE PROPORTIONS OF SOLIDS AND PORE SPACE); B) WATERLOGGED; C) COMPLETELY DRIED; D) MINIMUM AIR-FILLED POROSITY FOR GOOD GROWTH OF MANY PLANTS; E) “IDEAL” PROPORTIONS OF AIR AND WATER FOR EXCELLENT GROWTH; F) SEVERE COMPACTION. MODIFIED FROM HANDRECK AND BLACK (2010) (P. 59).
FIGURE 6.2. WATER IN UNSATURATED SOIL IS SUBJECT TO CAPILLARITY AND ADSORPTION, WHICH COMBINE TO PRODUCE A “NEGATIVE” MATRIC POTENTIAL, OR A MATRIC SUCTION. SOURCE: HILLEL (1998) (P. 149).
FIGURE 6.3. WATER IN AN UNSATURATED COURSE-TEXTURED SOIL. SOURCE: HILLEL (1998) (P. 205).
FIGURE 6.4. MEAN SOIL ORGANIC CONTENT (CORG) FOR EIGHT EGRS OF VARIOUS AGES.

ix
FIGURE 6.5. THE AVAILABILITY OF NUTRIENT ELEMENTS TO PLANTS IN MINERAL SOILS VARIES WITH SOIL PH; THE MEASURED RANGE FOR THE EGRS SURVEYED IS SHOWN BY THE DASHED LINES (PH 5.2 TO 7.2). MODIFIED FROM HANDRECK AND BLACK (2010).
FIGURE 7.1. PRIMARY SUCCESSION IN A SKELETAL HABITAT SUCH AS A ROCK OUTCROP. MODIFIED FROM GRIME (2001).
FIGURE 7.2. SECONDARY SUCCESSION FOR A SITE OF LOW FERTILITY, SUCH AS UNIMPROVED CALCAREOUS GRASSLAND. MODIFIED FROM GRIME (2001).
FIGURE 7.3. THE MASTER SPECIES LIST (FROM ALL ROOFS) IN RELATIVE PROPORTIONATE COVER, CLASSIFIES AS A S/ SR COMMUNITY.
FIGURE 7.4. THE CLUSTERED EGR VEGETATION TYPES WITHIN CSR SPACE.
FIGURE 7.5. COMPARATIVE RESULTS OF CSR CLASSIFICATION FOR THREE ROOF TYPES: SPECIES-POOR SEDUM ROOF (S); SEDUM MEADOWS (S/SR); AND PITCHED SEDUM ROOF (S/SR).
FIGURE 7.6. THE ORIGINAL SPECIES LIST FOR STUTTGART RATHAUSGARAGE ROOFS CLASSIFIED AS S/ CSR VEGETATION.
FIGURE 7.7. THE VEGETATION SURVEYED IN 2011 ON RATHAUSGARAGE ROOFS CAN BE DESCRIBED AS S/SR VEGETATION, SHIFTING FROM THE S/CSR LOCATION OF THE ORIGINAL (THOUGH NOT PROPORTIONAL) LIST.
FIGURE 7.8. PROPOSED SUCCESSIONAL TRAJECTORIES FOR SEDUM-BASED EGR SYSTEMS.
FIGURE 7.9. COMPARED WITH OTHER URBAN HABITATS, EXTENSIVE GREEN ROOFS (EGRS) ARE AMONG THE MOST STRESSFUL WITH VEGETATION LIMITED PREDOMINANTLY TO S-STRATEGISTS, OR STRESS TOLERATORS. MODIFIED FROM GILBERT (1989) (P. 16).
FIGURE 7.10. A HIERARCHICAL CAUSAL FRAMEWORK FOR EGR VEGETATION DYNAMICS. ADAPTED FROM PICKETT ET AL. (1987, 2009).
FIGURE 7.11. THE ROLE OF REGENERATIVE STRATEGIES IN THE SUCCESSIONAL PATHWAYS OF LOW FERTILITY SITES (LEFT) AND OF SKELETAL HABITATS (RIGHT). W = NUMEROUS, SMALL, WIDELY DISPERSED PROPAGULES; V = VEGETATIVE SPREAD; BS = PERSISTENT SEED
BANK; BSD = PERSISTENT SEEDLINGS. ADAPTED FROM GRIME (2001).
FIGURE 7.12. THE CSD FILTER EXCLUDES ADAPTIVE STRATEGIES (REPRESENTED BY DIFFERENT GEOMETRIC SHAPES) FROM NICHES CHARACTERIZED BY CONTRASTING LEVELS OF PRODUCTIVITY AND DISTURBANCE, SORTING THE LOCAL SPECIES POOL INTO ADMISSIBLE AND INADMISSIBLE STRATEGIES. ADAPTED AND USED WITH PERMISSION FROM WILEY & SONS, LTD.
FIGURE 7.13. THE PROXIMAL FILTER OF COMMUNITY ASSEMBLY, SHOWING HOW SPECIES (BLACK ARROW) AND INDIVIDUALS (WHITE ARROWS) MUST PASS THROUGH SELECTION FILTERS IN ORDER TO ENTER A COMMUNITY. ADAPTED AND USED WITH PERMISSION FROM WILEY & SONS, LTD.
FIGURE 7.14. THE CSD FILTER ON EGRS LEADS TO SPECIES COMPOSITION PREDOMINATED BY S- STRATEGISTS.
FIGURE 7.15. THE PROXIMAL FILTER LEADS TO DIVERGENCE IN EGR VEGETATION TYPES.
FIGURE 7.16. A SERIES OF ECOLOGICAL FILTERS AS WELL AS FEEDBACK MECHANISMS DETERMINE SPECIES COMPOSITION ON EGRS OVER TIME.

x
List of Tables
TABLE 1.1. SUITABLE VEGETATION FOR VARIOUS EGR SUBSTRATE DEPTHS. MODIFIED FROM FLL (2008) (P. 43).
TABLE 1.2. SUGGESTED BASIS FOR THE EVOLUTION OF THREE STRATEGIES IN VASCULAR PLANTS. SOURCE: GRIME (1977).
TABLE 2.1. DETAILS OF NINE OLD EGRS SAMPLED OVER TWO GROWING SEASONS (2010, 2011) IN STUTTGART REGION. DATA FOR SUBSTRATE DEPTH IS DISPLAYED AS THE MEAN ± THE STANDARD ERROR.
TABLE 2.2. SAMPLING DETAILS AND DATES FOR NINE OLD EGRS IN SOUTH-WEST GERMANY. TABLE 2.3. SPECIES WERE GROUPED INTO PHYSIOGNOMIC GROWTH FORM GROUPS.
TABLE 2.4. FULL SPECIES LIST, WITH FREQUENCY, FOR VEGETATION ON NINE EGRS.
TABLE 2.5. RESULTS FROM SPEARMAN’S CORRELATION (RHO) RELATING GROWTH FORM COVER WITH SPECIES DIVERSITY.
TABLE 2.6. RESULTS FROM SPEARMAN’S RANK CORRELATION (RHO) RELATING ROOF AGE WITH COVER AND SPECIES DIVERSITY OF FIVE GROWTH FORM GROUPS.
TABLE 2.7. RESULTS FROM SPEARMAN’S RANK CORRELATION (RHO) RELATING SUBSTRATE DEPTH WITH VEGETATION (COVER AND SPECIES DIVERSITY OF FIVE GROWTH FORM GROUPS, BOTH VARIABLES N=134).
TABLE 2.8. RESULTS FROM SPEARMAN’S RANK CORRELATION (RHO) RELATING SUBSTRATE DEPTH WITH ABIOTIC VARIABLES (N=134).
TABLE 2.9. RESULTS FROM SPEARMAN’S RANK CORRELATION (RHO) RELATING SLOPE, ASPECT AND SHADE WITH COVER (N=134) AND SPECIES DIVERSITY OF FIVE GROWTH FORM GROUPS (N=134).
TABLE 2.10. RESULTS FROM SPEARMAN’S RANK CORRELATION (RHO) RELATING SUBSTRATE VARIABLES (N=8) WITH COVER AND SPECIES DIVERSITY OF FIVE GROWTH FORM GROUPS.
TABLE 2.11. RESULTS FROM SPEARMAN’S RANK CORRELATION (RHO) RELATING SUBSTRATE VARIABLES WITH SLOPE (N=8), ASPECT (N=8) AND SHADE (N=118).
TABLE 3.1. COMPARING COVER BY SUCCULENTS/ QUADRAT IN (VERSUS NOT) IN PROPORTION WITH OTHER GROWTH FORMS.
TABLE 3.2. PROPORTION AND COVER (%) BY INTENTIONAL SPECIES FOR NINE EGRS AFTER 20-30 YEARS.
TABLE 3.3. OF THE TWENTY-FOUR SPECIES ORIGINALLY PLANTED/ SOWN ON TÜBINGEN, ONLY FOURTEEN REMAINED AND SEVEN NEW SPECIES WERE RECORDED IN 2010.
TABLE 3.4. OF THE 39 SPECIES ORIGINALLY PLANTED/ SOWN ON RATHAUS-PV, ONLY 16 REMAINED AND 11 NEW SPECIES WERE RECORDED IN 2011.
TABLE 3.5. OF THE 39 SPECIES ORIGINALLY PLANTED/ SOWN ON RATHAUS-LOWER ROOF, 13 PERSISTED AND 17 NEW SPECIES WERE RECORDED IN 2011.
TABLE 3.6. PROPORTIONAL COVER ON 9 EGRS WITH INTEREST IN GRASS COVER AND DIVERSITY.
TABLE 3.7. TOTAL GRASS COVER AND THE PROPORTION (%) THAT COMPRISED INTENTIONAL SPECIES ON NINE EGRS.

xi
TABLE 3.8. LIFE STRATEGIES OF THE GRASSES IDENTIFIED ON THE EGRS SURVEYED, USING CSR SIGNATURES
TABLE 3.9. RELATIVE PROPORTIONATE COVER OF GROWTH FORMS ON NINE OLD EGRS, IN ORDER OF ROOF AGE, SHOWING MEAN WITH STANDARD DEVIATION.
TABLE 3.1. SUMMARY OF SUBSTRATE DEPTH PER ROOF (MM), IN ORDER OF ROOF AGE.
TABLE 3.2. SUBSTRATE LOSS PER QUADRAT FOR SEVEN EGRS (ASSUMING 100 MM INITIAL DEPTH).
TABLE 3.3. DEPTH MEASUREMENTS PER QUADRAT FOR THREE PITCHED EGRS (SLOPE LOCATION, ASPECT).
TABLE 3.4. SUBSTRATE DEPTH HAD SIGNIFICANT CORRELATIONS WITH THE COVER OF ELEVEN SPECIES.
TABLE 3.5. MEAN SUBSTRATE DEPTH ON NINE EGRS OF DIFFERENT AGE GROUPS.
TABLE 3.6. AMALGAMATED DATASET OF 17 EGRS IN SOUTH-WEST GERMANY INSTALLED BETWEEN 1977-1997 IN ORDER OF AGE.
TABLE 5.1. MEAN RESULTS FOR THE SIX EIVS ASSESSED.
TABLE 5.2. VARIOUS PROPORTIONS OF COVER BY DOMINANT SPECIES FOR NINE EGRS.
TABLE 6.1. PHYSICAL SOIL PARAMETERS FROM EGRS SAMPLED IN STUTTGART REGION (2010, 2011).
TABLE 6.2. SOIL ORGANIC CONTENT (CORG) FOR EIGHT EGRS OF VARIOUS AGES.
TABLE 6.3. CHEMICAL SOIL PARAMETERS FOR EIGHT EGRS (IN ORDER OF AGE) WITH FLL REFERENCE.
TABLE 6.4. NUTRIENT ANALYSES FOR GÄRTNEREIHOF TÜBINGEN SIX YEARS AFTER INSTALLATION SHOW EXCESSIVE LEVELS OF P, K AND MG.
TABLE 6.5. SIX OF SEVEN EGRS SURVEYED IN KARLSRUHE BY BUTTSCHARDT (2001) HAD EXCESSIVE PHOSPHORUS.
TABLE 7.1. STANDARD COORDINATE VALUES WITHIN CSR SPACE (REFERENCE FROM SPREADSHEET TOOL).
TABLE 7.2. MASTER SPECIES LIST WITH CSR SIGNATURES AND RELATIVE TOTAL COVER PER SPECIES.
TABLE 7.3. RESULTS FOR CSR PROPORTIONS FOR THE FIVE EGR VEGETATION TYPES, INCLUDING MASTER SPECIES LIST.
TABLE 7.4. "SPARSE SEDUM MEADOW" (TÜBINGEN, RATHAUS-PV): SPECIES LIST WITH CSR SIGNATURES, PROPORTIONATE COVER AND OUTPUT FROM CSR CALCULATOR.
TABLE 7.5. “SPARSE SEDUM MEADOW WITH CHIVES” (VB A1, A2): SPECIES LIST WITH CSR SIGNATURES, PROPORTIONATE COVER AND OUTPUT FROM CSR CALCULATOR.
TABLE 7.6. “PITCHED SEDUM MEADOW” (KILLESBERG): SPECIES LIST WITH CSR SIGNATURES, PROPORTIONATE COVER AND OUTPUT FROM CSR CALCULATOR.
TABLE 7.7. “FLORISTICALLY-DIVERSE SEDUM MEADOW” (FH NÜRTINGEN, RATHAUS-LOW): SPECIES LIST WITH CSR SIGNATURES, PROPORTIONATE COVER AND OUTPUT FROM CSR CALCULATOR.

xii
TABLE 7.8. OUTPUT FROM THE COMPARATOR TOOL FOR THREE EGR VEGETATION TYPES BY CSR PROPORTIONATE COVER.
TABLE 7.9. ORIGINAL SPECIES LIST FOR STUTTGART RATHAUSGARAGE ROOF COMPLEX (35 SPECIES, 12 CSR TYPES).
TABLE 7.10. ADAPTIVE STRATEGY PROPORTIONS ON THE TWO RATHAUS ROOFS AFTER 21 YEARS.
TABLE 7.11. THE SPECIES COMPOSITION FOR RATHAUS PV IN 2011 COMPRISED SEVEN CSR STRATEGIES.
TABLE 7.12. THE THIRTY SPECIES RECORDED AT RATHAUS LOWER ROOF (2011) COMPRISES ELEVEN LIFE STRATEGIES.

xiii
List of Abbreviations
The following table lists the various abbreviations and acronyms used throughout the thesis, and gives the page number on which each is defined and/ or first used.
Abbreviation Meaning Page
TPG tar-paper gravel roof 2
EGR extensive green roof 4
FLL Forschungsgesellschaft Landschaftsentwicklung Landschaftsbau 10
FBB Fachvereinigung Bauwerksbegrünung e.V. 12
IGRA International Green Roof Association 12
UHI Urban Heat Island 14
ibid Latin: ibidem means “in the same place” 14
MEA Millennium Ecosystem Assessment 15
ICLEI Local Governments for Sustainability 17
CSR adaptive strategies: Competition (C), Stress (S), Ruderality (R) 26
CSD Competition (C), Stress (S), Disturbance (D) 26
UAST Universal Adaptive Strategy Theory 26
PGE Park Grass Experiment 29
LTER Long-Term Ecological Research 30
AM arbuscular mycorrhizae 43
VB (A1, A2) Verkehrsbetrieb (Areas 1 and 2) 57
DIN Deutsches Institut für Normung 75
ASTM American Society for Testing and Materials 75
MWC maximum water capacity 75
Corg soil organic content 87
CAM Crassulacean Acid Metabolism 90
LECA Lightweight Expanded Clay 140
EIV Ellenberg Indicator Value 180
CEC cation exchange capacity 202

xiv
Acknowledgements
This work would not have been possible without the generous support, help and conditions
imparted by a network of lovely people.
Many thanks to my supervisor, Dr. Nigel Dunnett, for inviting me onto this project. In
addition to learning to write with “boring, dry style”, I’m grateful for the opportunities to
teach and to work as a studio tutor on ecological design.
Many thanks to my examiners, James Hitchmough and Martin Hermy, for their committed
efforts towards the improvement of this work. Huge thanks to everyone who helped with
field work and other nitty gritty bits (e.g., discussions on data), especially Gianni Vesuviano,
Claire Cannon, Tobias Emilsson, Elisa Olivares, Dan Richards, and Oliver Pescott.
I’m indebted to Dr. Reinhard Böcker, now Professor Emeritus with the Department of
Landscape Ecology and Vegetation Science at the University of Hohenheim. When I
appeared “out of the blue” in 2010, independent of any institutional arrangements, he
happily helped me identify grass and bryophyte species and even arranged for me to use
the facility’s drying ovens to process my biomass data, which involved several weeks’ worth
of after-hours access. This recalls the biological term “commensalism”, whereby two
organisms interact but only one benefits while the other is unaffected; I benefited massively
and am grateful to have experienced such a supportive and friendly academic relationship.
Jean Russell holds a special place to the heart of this work, as her beautiful mind was able to
make statistical sense of the multivariate and inadequate data. Jean’s ability to remember
important trends or relationships months (years!) later, in relation to a new analysis, was
astounding, particularly since ecology did not fall within her domain of expertise.
To all the colleagues who have accompanied me on this journey, whether at ZinCo GmbH
(especially Ralf Walker, Wolfgang Ansel, Roland Appl, Heike Schäfer, Inge Wüppen), or from
the Sheffield Green Roof Team (Nigel Dunnett, Virginia Stovin, Jeff Sorrill, Jörg Werdin, Rosie
Mohoroko, Christian Berretta, Zoe Dunsiger, Gianni Vesuviano, Elisa Olivares, Maria Elena
Provenzano). Thanks also must go to other colleagues in Landscape for the professional and
intellectual stimulation shared, in particular studio tutors (especially Marian Tylecote, Fiona

xv
McQuaid, Tim Blundell-Jones), faculty members (Ross Cameron, Mel Burton, Olaf Schroth,
James Hitchmough) and the many students I’ve been fortunate to interface with.
To the global family of PhD researchers on 9th floor, for their friendly, supportive and
enriching accompaniment of this unique journey, especially Jemima Unwin, Vera Hale, Elisa
Olivares, Gloria Vargas, Chomchon Fusinpaiboon, Hae-Joon Jung, HyunJu Yang, Ziyad Jameel
Frances, Bev Nadin, Maša Šorn, Mike Livingstone, Behdad Alizadeh, Xiang Ren Robert,
Adrien L’homme-Duchadeuil, Daiwei Li, Jia Yuan, and so many more.
Beyond the Univeristy, I’m grateful for the professional colleagues who have supported me
and this work. Ever encouraging and positive, Gary Grant has been a great colleague and
friend; I’m particularly indebted to him for reading drafts of my thesis. Further thanks are
owed to other colleagues for fruitful conversations and stimulating discussions, especially
Dusty Gedge, Stephan Brenneisen, Nathalie Baumann, Maureen Connelly, Kerly Acosta,
Genevieve Noell, Ken Thompson, and the late Mark Simmons (RIP, metta mate).
To family members who have been supportive in so many ways, including my wonderful
parents, gorgeous sisters, lovely in-laws and beautiful nieces/ nephews in Canada; my sweet
Swiss relatives; and my gentle and loving British kin, especially Giles and Jean Watts.
An mein Bruder, Walter Wild, for his boundless generosity and friendship. In addition to his
gifts of a cosy home, inspired excursions in art and botany, cuddly cats and village goodness,
this work would literally not have been possible without Walter. The blue Volkswagen Golf
(‘s Rägätröpfli) is an obvious case in point, as was his brotherly care after the surprise
incident that put me in hospital for 4 days, 1 L short of blood, and bedridden for 4 weeks.
For the music, for keeping me buoyant and joyful: Sheffield Samba Band, Barba Gianni, Tom
Carpenter, Heather Lonie, George Moran, Simon V, Storm, and the Tübingen Pressure crew.
For the Dharma and all my Buddhist friends, for keeping me grounded, healthy, and happy.
And to all the friends who have shared food, laughs and tears, during both good and difficult
times, including FF foodie enthusiasts: Sara Fischer, Itcha, Simi Stählin, Rachel Littelford,
Claire McDade, Michael Haylett, Giles Watts, and many more.

1
1 Introduction
However urbanised Earth is due to become by 2050, with an ecologically primed roofscape
its 6.3 billion urban residents may still have direct access to the natural world and its
experiences. Appreciation for biodiversity and green infrastructure instilled in the first
decades of the new millennium helped to foster support for regenerative urban design
strategies, such as green roofs. An archipelago of verdant rooftops in a hard urban matrix
can soften the impacts of the built environment, while also reducing greenhouse gas
emissions, supporting pollinators and providing other ecosystem services, like cooler,
fresher and cleaner air. In temperate climates, lightweight green roofs provide seasonal
displays of colours and texture throughout the seasons, offering intrinsic benefits to human
well-being. Having brought together the effectiveness of trans-disciplinary collaborations
and industry-policy partnerships for the advancement of intelligent and applicable urban
ecological design, green roofs became endowed with greater purpose and with more
benefits than ever before.
With its goal of understanding how green roof vegetation and substrates develop over time,
this dissertation takes reference from the science of ecology, using the methods and
theories of applied vegetation science as well as recent developments in urban ecology. The
ecological potential of vegetated roofs to serve as green infrastructure for enhancing
ecosystem services is especially timely considering that we have entered a period of
unprecedented urbanisation and population growth (UNFPA, 2011) concurrent with the
greatest extinction cascade since the dinosaurs (CBD, 2006). Recognising also that we are
currently in the UN Decade on Biodiversity (2010-2020) (CBD, 2010a), and that plants and
soil form the basis of terrestrial biodiversity (trophic levels and food webs) (Wardle, 2002,
De Ruiter et al., 2005), this dissertation examines how vegetation and soil on some of the
oldest extensive green roofs have developed after 20-30 years. With all the knowledge
acquired from centuries of experience, research and development, what role can
lightweight green roofs play for an urbanising and biologically depleting planet? This work
therefore identifies and bridges the gaps between past and future, and between ecology
and culture.

2
1.1 What are green roofs?
Growing plants on roofs is a concept common to many cultures and climates, ranging from
prehistory to modern times. Just as their range of appearances and constructions varied
across time and space, vegetated roofs embody an equally broad scope of intent and
purpose. Grass (or sod) roofs have a long lineage from around the world, and were generally
used as a response to lacking building materials. Ancient examples of such roofs, often a
simple construction of cut turf laid over a bark waterproofing (Grützmacher, 1993) (Figure
1.1), can be found in Central Asia, East Africa, and North and Central America (Dunnett and
Kingsbury, 2004, Adler, 2005, Grant, 2006). The rich cultures of ancient Egypt and Greece
are known to have used “hanging gardens” as personal sanctuaries to honour the gods,
while in ancient Rome such roof gardens demonstrated wealth and luxury (Adler, 2005,
Arhendt, 2007). By medieval times, the roof gardens of Islam were designed to recall
paradise, while those in Aztec America were for urban agriculture and amenity (Adler, 2005,
Arhendt, 2007, Grant, 2006).
Figure 1.1. Build-up of traditional Scandinavian grass roof where 1=birch bark waterproofing; 2=bracket hook; 3= cullis hook; 4=gravel filter layer; 5=roof deck. Source: Grützmacher (1993).
Another early type of vegetated roof was the “Holzzementdach”, or tar-paper gravel (TPG)
roof in early 19th century Europe, which was favoured for its ability to inhibit the spread of
fire (Arhendt, 2007, Köhler and Poll, 2010). By 1880, TPGs were prevalent on public and
private homes, and on public, industrial and commercial buildings in many large continental
European cities, though they were particularly popular in Germany (Arhendt, 2007). In
addition to preventing fire, the upper sandy-gravel layers on TPG roofs helped to maintain
the integrity of the roof membrane by shielding it from ultra violet light (Arhendt, 2007,
Köhler and Poll, 2010). Various publications detailed the correct installation and
construction of TPG roofs (e.g., Koch, 1894) (Figure 1.2). The exact substrate composition

3
and depth of the gravel roofs varied somewhat per city, but the German standard
apparently called for 50 mm each sand and gravel (Bornkamm, 1961). Standards were
sometimes compromised, however; during Berlin’s housing boom at the turn of the century,
the sand layer was topped by 100-150 mm gravel amended with demolition waste (Darius
and Drepper, 1983).
Figure 1.2. One German standard for TPG specified glue-brushing overlapping tarpaper (using “wood cement”) onto a wooden roof deck, and layers of sand and gravel. Source: Koch (1894).
The early decades of the 20th century saw much experimentation with roof gardens by
architects such as Henri Sauvage (Paris), Frank Lloyd Wright (Chicago) and Walter Gropis
(Cologne) (Grant, 2006, Arhendt, 2007). One architect in particular, Le Corbusier (Swiss,
1887-1965) made perhaps the biggest contribution to the development of roof garden
construction through his built examples, writings and teachings. Although most architects
remained sceptical and conservative, Le Corbusier was generous with soil cover on his roof
gardens. Convinced that soil and vegetation were the best protection for the waterproofing
from weathering, and valuable insulation from solar gain, Le Corbusier installed almost one
meter of earth on his parents’ house near Lake Geneva in 1923. He didn’t plant a formal
garden but allowed colonisation and wild growth, preaching the benefits of a root network
that very economically regulates building temperature and of a maintenance-free
vegetation (Arhendt, 2007).
As the 20th century progressed, steel and reinforced concrete became more conventional
building materials and the potential for integrating vegetation onto roofs moved from
experimentation to widespread application. Countries that were less affected by World War
II continued building and experimenting with roof gardens atop concrete buildings, with
famous examples in England (e.g., Derry & Toms in London, opened 1938) and America
(e.g., Rockefeller Centre in New York City, opened 1934) (Osmundson, 1999); Germany
joined the movement in the 1960s. All of those early roof gardens created valuable green
spaces in densely built-up districts, and also led to research and development to address

4
problems of leaks and damage caused by roots. By 1971, the first purpose-made green roof
products appeared on the market, alongside improved waterproofing and drainage systems;
by the late 1970s ‘extensive green roofs’ had emerged (Krupka, 1992, Adler, 2005).
Institutes in Germany, starting with polytechnic colleges like Fachhochschule (FH)
Osnabrück, and followed by others in Berlin, Weihenstephan, Hannover, Veitshöchheim and
Geisenheim, began to establish test facilities for the assessment and development of these
new green roof systems (Krupka, 1992). A few decades experimenting with materials and
vegetation has resulted in a global, burgeoning green roof industry (Thuring, 2009, GRHC,
2012, GRHC, 2014). This has led to knowledge of basic principles as well as progress in
materials, particularly for vegetation technologies (Grant, 2006).
1.1.1 Extensive green roof systems
Extensive green roofs (EGRs) emerged in the 1970s as part of that era’s greater Green
Movement, which also included materialization of the Green Party, Greenpeace, etc.
(Galtung, 1986). In the spirit of the times, vegetated roofs were seen as opportunities to
reconnect urban dwellers with nature (Minke and Witter, 1983). Extensive roofs weigh
between 60 and 240 kg/m2, which means they can often be retrofitted in place of gravel
ballast (used to prevent wind uplift) without the need for structural adjustments (Weiler
and Scholz-Barth, 2009). The minimal loading capacity of EGRs means that these systems
are designed for functional, rather than recreational, purposes. Similar to their precursors,
modern green roof systems are basically layers on top of a building’s waterproof
membrane. Extensive green roofs comprise at least two layers – vegetation and growing
substrate – but usually multiple layers are used (e.g., protection mat, drainage layer) (Figure
1.3). The drainage layer is designed to move excess water towards roof drains in order to
minimise water logging and hydrostatic load (Kolb and Schwarz, 1999). Theoretically,
drainage layers with storage cups can provide moisture to plants during periods of drought
but, unless the cups are filled with granular infill, the substrate is effectively separated from
the stored water by an air gap, which prevents capillary action. It appears the only way by
which plants can access such moisture is if this stored water transfers to the substrate by
evaporation (Vesuviano, 2013). Due to issues associated with poor drainage, single-layer
systems should be limited to roofs with a minimum 2% slope (Krupka, 2006). Being intended
as low-maintenance, self-sustaining systems, EGRs are typically not irrigated, except during
establishment or during periods of extended drought (Dunnett and Kingsbury, 2004).

5
Figure 1.3. EGRs comprise a series of layers on top of the waterproofed roof deck.
Substrate depth is the primary constraint on EGR vegetation because the shallow profile
offers limited provisions of rooting volume, moisture and mineral nutrition; water-logging,
drought and heat have direct and immediate impacts on the vegetation; and conditions for
humus formation, mineralisation and nutrient recycling are altered (Krupka, 1992). As part
of the early research and development into these modern, lightweight systems, engineers
determined the optimal depth and composition of growing substrates in order to minimize
weight whilst maximizing stormwater retention (Li and Babcock, 2014), and horticulturalists
have matched these substrates with the most reliable cultivars and varieties for shallow,
drought-prone, and exposed environments (Dvorak and Volder, 2010). Given the limitations
of substrate depth on plants, different types of vegetation can be confidently specified for
certain depths; by definition EGRs have less than 200 mm substrate (FLL, 2008) (Table 1.1).
Table 1.1. Suitable vegetation for various EGR substrate depths. Modified from FLL (2008) (p. 43).
Depth of vegetation support course (cm)
Vegetation forms 4 6 8 10 12 15 18 20
Moss-Sedum
Sedum-Moss-Herbaceous
Sedum-Herbaceous-Grass
Grass-Herbaceous
1.1.1.1 EGR vegetation
Since EGRs are meant to be low-maintenance, EGR vegetation must guarantee a persistent,
closed and stable cover with few inputs (e.g., moisture, fertilisation) (Kolb et al., 1983). Most
EGR plants bear special attributes or adaptive strategies to store water and/ or to prevent
water loss, and are able to regenerate after stressful periods (VanWoert et al., 2005b,
Nagase and Dunnett, 2010, Schroll et al., 2011, Van Mechelen et al., 2014b). Prevailing
climatic conditions will also direct the appropriate selection of plants; in northern latitudes
(43 to 60° N), for example, at least 100 mm substrate is required to protect roots from

6
freezing injury (Boivin et al., 2001). In accordance with the shallow depths, appropriate
plants have shallow rooting systems able to acquire their requirements of moisture, air, and
mineral nutrition within this limited root space. Since roofs are typically exposed without
any protection, EGR vegetation must tolerate direct solar radiation, extreme temperature
fluctuations, and emissions (Getter and Rowe, 2007, Getter et al., 2009a). Plants from xeric
habitats with nutrient-poor soils perform well on extensive green roofs because of their
adaptations to tolerate shallow, free-draining mineral soils, intense solar radiation, and
regular occurrences of drought. In spite of a slow growth rate, xeric, stress-tolerant plants
have a competitive edge on EGRs (Dunnett et al., 2008a).
Almost every plant family has at least a few species that are adapted to colonize extreme
and dry habitats, where conditions reflect those found on extensive green roofs. The
influence of EGR substrate and depth on vegetation was demonstrated through a large plant
screening trial in Heidelberg (Riedmüller, 1994). Compared to the deep profile of a natural
soil, shallow EGRs constrain plant root architecture (Figure 1.4). That study concluded that
EGR depth should never be less than 100 mm if species of dry meadows were to persist.
Even then, the author added that provision for shade and water storage was still necessary.
In addition to these, that study found that other key factors which determined EGR species
composition included substrate properties and seed introduction (both seed bank and seed
rain). Substrate depth and EGR vegetation will be reviewed more closely in later chapters.
Figure 1.4. Plant habit and root architecture for eight species in (a) natural habitat and (b) extensive green roof system. Modified from Riedmüller, 1994 (p. 37-38).

7
1.1.1.1.1 Moss-Sedum vegetation
The Moss-Sedum vegetation type occurs as various forms in depths between 20 and 60 mm,
and usually limited to boundaries and extreme habitat conditions (Krupka, 1992). Within
this type, mosses comprise 60-95% cover. When the substrate becomes extremely shallow,
mesophile mosses are replaced by xerophile species and the proportion of lichens (e.g.,
Cladonia spp.) increases. Sedum proportion varies considerably and depends on roof
construction and roof location, occurring more frequently in zones with longer periods of
moisture (e.g., near roof gutters), but falling away in zones prone to water-logging and
becoming patchy in shaded and wind-sheltered areas. Moss-Sedum can form extensive,
closed cover but it also occurs as smaller patches within other vegetation types. Key
bryophyte species defining this vegetation form in Germany include Barbula convoluta, B.
hornschuchiana, Brachythecium rutabulum, Bryum spp., Ceratodon purpureus,
Homalothecium sericeum, Polytrichum piliferum, Schistidium apocarpum, Cladonia spp.
(Krupka, 1992). As with the other vegetation forms, Moss-Sedum is changeable and will turn
into or intersperse with other vegetation forms depending on conditions. Due to the
shallow depths, Moss-Sedum vegetation is established by pre-cultivated mats, perhaps
supplemented by the sowing of Sedum cuttings, while the moss component will colonise
and develop in any bare patches (Krupka, 1992).
1.1.1.1.2 Sedum-Moss-Herbaceous vegetation
As a transition form, Sedum-Moss-Herbaceous vegetation is a common neighbour of the
Sedum-Moss type and also occurs within the Sedum-Grass-Herbaceous form. Though it is
difficult to define the boundaries between these three types, the Sedum-Moss-Herbaceous
form occurs on depths between 60-100 mm (approximately 100 kg/ m3), and is especially
prominent in the early years after successful Sedum establishment, with between 70-95%
Sedum cover (Krupka, 1992). In depths closer to 100 mm, grass and herbaceous taxa can
dominate over Sedums, especially on flat roofs with damp patches. In addition, since most
Sedums require high light and warm conditions, areas with variable light will tend to favour
grasses and herbaceous taxa, while exceptionally wet years will benefit mosses. Sedum-
Moss-Herbaceous vegetation can be established through the sowing of seed and Sedum
cuttings, but also by pre-cultivated mats (Krupka, 1992).

8
1.1.1.1.3 Sedum-Grass-Herbaceous vegetation
This vegetation form is predominated by patches of Sedum with grasses evident as
individual tufts, small groups or spreading swards (e.g., Poa compressa). As a rule, the
herbaceous component is limited to small-statured, drought-tolerant, short-lived, and often
spontaneous colonisers. Although inconspicuous, a distinctive moss layer is generally also
present. The Sedum-Grass-Herbaceous form depends on the climatic conditions created by
roof slope and aspect, and on substrate depths of 60-100 mm and 100-150 mm. On flat
roofs, greater depths promote grasses and herbaceous taxa with Sedums limited to edges
and other extreme areas. On exposed pitched roofs, this vegetation form is only possible in
depths of 100-150 mm, with Sedums dominating the sun-exposed areas while grasses and
herbaceous taxa occur in shade (Krupka, 1992). The small-scale dominance of herbaceous
species like Hieracium pillosella, Thymus spp. or Dianthus deltoides is striking on flat roofs of
100-150 mm, and wet years can lead to a ruderal component of spontaneous colonisers,
including legumes (e.g., Trifolium repens). Sedum-Grass-Herbaceous vegetation is
established primarily through sowing of seed, but also by pre-cultivated mats (Krupka,
1992).
1.1.1.1.4 Grass-Herbaceous vegetation
Grasses form an extensive component of this vegetation form, but generally in patches of
varied density since exposed and drought-prone areas create favourable conditions for
mosses, herbs and succulents to colonise (Krupka, 1992). With its preponderance of
xeromorphic species and relatively drought-tolerant mesomorphs, the Grass-Herbaceous
form is comparable with semi-natural dry grassland (Krupka, 1992). On flat roofs with
sheltered areas, this vegetation occurs upwards of 100 mm substrate; however, resilient
grass-herbaceous assemblages can only persist in depths greater than 150 mm. As water
supply improves, the grass component becomes denser, and strongly xeromorphic species
like Poa compressa are replaced by pronounced swards of Festuca species and typical
meadow grasses, like Dactylis glomerata. The herbaceous component can be distinguished
between small, creeping, or rosette-forming taxa and tall-growing species whose flowering
heads are visible within or above the grasses. Smaller-statured forbs require open spaces
and will occupy extreme areas, like gravel edges, but also serve as regeneration for patches
in which taller taxa have died out. Pitched and exposed roofs support a lean Grass-

9
Herbaceous variant, with grass covering about 50% and the conspicuous patches filled in
with succulents and herbs (Krupka, 1992).
1.1.1.2 EGR substrates
Green roof substrates need to be water-absorbent, in order to ensure that soil moisture
levels are maintained at adequate levels and to delay and reduce runoff, but they also need
to be free-draining in order to minimize water logging and associated structural loading.
These characteristics are achieved in shallow substrates and through the use of granular and
porous minerals (70-90%) (FLL, 2008). Low organic content is a requirement for fire
protection purposes (FLL, 2008) but can also be advantageous for vegetation growing in
drought-prone habitats because moderately stressed plants are hardier and stand a better
chance of survival when resources become suddenly limited (Rowe et al., 2006, Handreck
and Black, 2010, Nagase and Dunnett, 2011). This also reduces maintenance because the
vegetation is limited to low growing, hardy, drought-tolerant taxa. Taken together, these
conditions pose challenges for plants and other organisms, and are responsible for the
attributes that characterize successful green roof taxa, such as small leaf area, specific leaf
area and whole leaf dry mass, needle-like or scale-like leaves, (facultative) CAM metabolism,
stress-tolerance, dispersal through fragmentation or runners and storage of reserves
through succulence (Durhman et al., 2006, Getter et al., 2009a, Lundholm et al., 2010,
MacIvor and Lundholm, 2011b, Van Mechelen et al., 2014b).
Typical EGRs don’t use natural soils so terms like ‘substrate’ or ‘growing medium’ are more
appropriately used. Due to the unique soil-air-water dynamics on green roofs and their
disconnect from a greater soil profile, EGRs can be considered analogous to very large,
shallow containers filled with horticultural growing media (Beattie and Berghage, 2004).
This being the case, a major distinction lies in the longevity of horticultural media versus
EGR substrates; while potting soils need only be stable for a short duration (a few months to
1 or 2 years), EGR substrates will remain on the roof for many years. In this light, good EGR
substrates must continuously supply plant roots with balanced proportions of water, air,
and nutrients, with little to any maintenance or inputs. Idealistic green roof installations
specifying the use of natural soils to enhance or re-create locally distinctive biodiversity
must recognise that a soil’s chemical, physical and biological characteristics will change as
soon as it is disturbed or removed from a site; unless it is cut as part of a very deep turf, a

10
“local soil” will not have the same properties and characteristics once placed on a roof
(Dunnett, 2006).
The disconnect of EGR systems from a greater soil profile has major impacts on the
vegetation (Krupka, 1992), including (but not limited to) limited rooting space; constrained
nutrient, water and air provisions; large variations in soil moisture; and weaker buffering
capacity for pH and temperature (Rumble and Gange, 2013). Soil ecological processes are
presumably also influenced by these conditions. Most of the research and development for
EGR substrates have been explicitly more interested in long-term stability (Kolb and
Schwarz, 1999, Roth-Kleyer, 2002) and engineered drainage performance (Liesecke, 1979,
Liesecke, 1995, Kolb et al., 1982). Rightfully so, as the harsh conditions of EGR habitats lead
to double-edged requirements: while water retention is one of their most important
functions, excess water must concurrently be drained quickly to prevent any ponding or
surface water (Henneberg and Mann, 2010). EGR substrates play meaningful roles to
stormwater retention, evaporation and biodiversity, but less so to fertility and carbon
sequestration (Getter et al., 2009b). The chapter focused on substrates will introduce the
physical and chemical aspects of EGR substrates in closer detail.
1.1.1.3 FLL guidelines
In order to ensure reliable and high quality green roofs in Germany, the not-for-profit
association FLL (Forschungsgesellschaft Landschaftsentwicklung Landschaftsbau, or The
Landscape Development and Landscaping Research Society), has developed guidelines since
the inception of the green roof market there. A body within the Federation of German
Industries, the FLL has defined technical guidelines for the planning, construction and
maintenance of green roofs since 1982. The first edition, “Principles for roof greening”, has
progressed through seven editions named “Guidelines for roof greening” since 1990. The
FLL guidelines have served for respected quality specifications and, having published
numerous versions, reflect the most current state-of-the-technology and best practices with
reference to standards that apply to the green roof disciplines (e.g., DIN, ISO) (Lösken,
2004). Since it is itself not a standard, the FLL guideline contains content and information
with few degrees of liability or obligation. For instance, while it refers to research, the
guidance does not claim to be scientifically accurate (Lösken, 2004).

11
Based upon years of research and supported by existing laboratory standards, the FLL has
developed precise guidelines and requirements for green roof substrate properties and
composition in order to optimise conditions for plant performance and runoff retention
(Lösken, 2004). According to the guidelines, “the materials and dimensions chosen for [the
substrate layer] are determined by local construction requirements and by objectives for
the vegetation” (FLL, 2008, p. 56). Construction requirements relate to the drainage
function of the substrate, as well as its design load and protection to the building envelope,
while the vegetation-based objectives relate to the demands imposed by the desired
greening type, to the longevity of plant-oriented functions, and to limiting maintenance and
costs relating to plant development (FLL, 2008). For the substrate, or “vegetation support
course,” the FLL provides detailed guidance on granulometric distribution and water storage
capacity, but also includes information on frost-resistance, pore volume, structural stability,
pH, nutrient and salt content.
As stated by the FLL (2008), “the essential effects of roof-greening are: a reduction of
drainage water from precipitation, the retention of rain water to meet the water needs of
the roof vegetation and the delay in the runoff water into the drains. These features are of
economic, ecological and technical significance” (p. 44). The technical requirements for EGR
performance consequently overshadow most aspects of soil science. It is important to recall
that these standards were developed in the continental climate of central Europe, and that
EGRs in other climates may have different criteria (Williams et al., 2010, Razzaghmanesh et
al., 2014, Van Mechelen et al., 2014a, Farrell et al., 2012).
1.1.2 Policies and standards supporting EGR development and implementation
The financial incentives that different municipal and state governments around the world
provide for green roofs have helped their widespread implementation. By the 1990s, EGRs
had become quite popular in many places in Europe, especially in Germany. By 2006, some
130 km2 had been installed, at a rate of approximately 13 km2/ year (Grant, 2006).
Germany’s unmatched progress in both continual development and widespread
implementation can also be attributed the creation of industry associations, and to
supportive policies (often with financial incentives). In 2005, nearly 120 cities offered
incentives, with support ranging from 25% to 100% of installation cost (Grant, 2006). Taken
together, these various levels of organisation have been key to the development and
sustained growth of the German green roof industry and market (Ansel et al., 2011).

12
Extensive green roofs consistently cover more area per year than intensive green roofs in
Germany. According to a member survey from 2011, the FBB (Fachvereinigung
Bauwerksbegrünung e.V.) (professional association for the greening of buildings under the
Federation of German industries) estimates that between eight and ten million square
meters of roof surface are covered by vegetation every year in Germany. In proportion with
intensive green roofs, 89% of green roof installations in 2008 were extensive; 83% in 2010
and 87% in 2011 (FBB, 2012). In 1997, the European Federation of Green Roof Associations
(EFB) formed in order to unite Europe’s green roof associations; the EFB currently has 10
member countries (EFB, 2013).
Green roof coverage in other parts of the world has also been growing dramatically since
the late 1990s, particularly the USA and UK (Oberndorfer et al., 2007) but also in tropical
and Mediterranean climates (Williams et al., 2010). From its corporate members’ survey,
the North American industry association, Green Roofs for Healthy Cities, reported an
increase by 115% (in m2 coverage) in the year from 2010 to 2011 (Peck, 2012). The leading
North American cities for green roof coverage also have incentives in place, whether in the
form of direct incentives (e.g., Portland, 2005; Toronto, 2009) and green improvement
programs (e.g., Chicago, 2006; Philadelphia, 2007; Washington DC, 2007; Syracuse, 2010),
utility and/ or stormwater fee credits (e.g., Minneapolis, 2005; Milwaukee, 2010), or density
bonuses (e.g., Austin, 2011) (GRHC, 2012). In 2007, Green Roofs Australasia was
incorporated as a not-for-profit association (Green Roofs Australasia, 2012).
The widespread use of extensive green roofs, starting globally in the 1990s, is owing to their
simplicity and versatility. Being shallow and drought-prone not only minimises roof loading
but also reduces green roof maintenance since only the hardiest of taxa will survive. Deeper
substrates, by contrast, offer more rooting depth and greater stores of moisture to permit
more complex vegetation, including grasses, which require maintenance like mowing and
biomass removal. Since building owners want as little maintenance as possible (especially
when they are required by law to include a green roof), Sedum roofs are the most popular
export on the global green roof market [personal communications: January 2013, Ansel
(IGRA), Breuning (Green Roof Service LLC), Küsters (Optigrün), Roth-Kleyer (FH Geisenheim),
Walker (ZinCo)]. Perhaps related to the minimal input from ecologists or biologists, and
most certainly to the commercial success of the industry, the EGR systems most widely
implemented today are uniform and homogeneous by design.

13
1.1.3 The function and benefits of extensive green roofs
Of all the reasons people over the ages have installed vegetation on roofs, green roofs have
always evolved to reflect the interests and capacities of every culture, from material
availability to contemporary trends, through to policies and social issues. In this light, EGRs
are a modern expression of a biophilic tradition whose progress is deeply rooted in human
innovation and ingenuity to improve the urban environment, reduce the impacts of the built
environment and improve human quality of life. A study of the perception of people
overlooking naturalistic versus simple Sedum vegetation on green roofs in Toronto and
Chicago reported a great variety of responses, and concluded that vegetated roofs agree
with the biophilia hypothesis, namely that humans possess biological inclinations to affiliate
with natural systems and that this is instrumental to our health and productivity (Kellert et
al., 2008). That study commented that the installation of naturalistic and diverse EGRs,
rather than Sedum-dominated systems, present an opportunity to shift human preferences
from scenic or tourist aesthetics to ecological inclinations (Loder, 2014). Modern green roofs
can clearly offer more than just technological solutions to urban residents.
In addition to the availability of commercially manufactured systems, extensive green roofs
have become increasingly popular since the 1990s because of the many benefits they
provide. The original driver for modern green roofs in the 1970s was to improve conditions
for urban dwellers; psychological and health benefits were promised through more
exposure to nature, improvements to air quality and better thermal insulation (Minke and
Witter, 1983, Weiler and Scholz-Barth, 2009). Since then, green roofs have been promoted
and recognized for their capacity to reduce the volume and delay peak flows of storm water
runoff, to mitigate the urban heat island effect, for cooling and insulation, to extend the
lifespan of waterproofing, to provide habitat for wildlife, and combinations of all of these
benefits (Oberndorfer et al., 2007).
The amount of rainfall retained by green roofs is of particular interest to cities with aging
stormwater infrastructure because green roofs can retain and detain runoff. Depth strongly
influences stormwater performance, as deeper substrates have greater storage capacity
(Mentens et al., 2006, VanWoert et al., 2005a). In spite of their shallow substrates (< 200
mm), EGRs have measured cumulative annual retentions of 70% in northern Germany
(Liesecke, 1995, Liesecke, 1998), 60% in North Carolina (Moran et al., 2004) and 50% in
northern England (Stovin et al., 2012b). In addition to depth, retention values depend on

14
the intensity and duration of a rain event, local climate, vegetation, and roof slope
(Villarreal and Bengtsson, 2005, VanWoert et al., 2005a, DeNardo et al., 2005, Dunnett et
al., 2008b, Yio et al., 2013, Getter et al., 2007, Stovin et al., 2012a). Most hydrologic models
are based on relatively young green roofs or test facilities; other than one company’s
proprietary research station (Uhl et al., 2003), the evaluation of green roof hydrological
performance over time is largely unknown (Li and Babcock, 2014).
Extensive green roofs are also promoted for improving air quality (Speak et al., 2012). Like
any leafy vegetation, green roof plants can trap dust and airborne particles (Dimoudi and
Nikolopoulou, 2003), while moderating ambient temperatures to mitigate the urban heat
island (UHI) effect (Köhler et al., 2002, Dimoudi and Nikolopoulou, 2003, Wong et al., 2003a,
Takebayashi and Moriyama, 2007, Hunter-Block et al., 2012). Vegetated rooftops can
reduce the demand for air conditioning by reducing heat entering the building (Wong et al.,
2003a, Wong et al., 2003b, Niachou et al., 2001, Connelly et al., 2006, Simmons et al., 2008)
and therefore also help to reduce greenhouse gas emissions (Getter and Rowe, 2006,
Takebayashi and Moriyama, 2007). Further to thermal insulation, green roofs can mitigate
low frequency noise and attenuate sound (Connelly and Hodgson, 2013).
The functions provided by green roofs are bolstered by cost-savings. Building owners may
reduce their roofing or replacement costs, since the shade and protection from temperature
fluctuations by green roofs can double or triple the roof membrane’s life expectancy (Weiler
and Scholz-Barth, 2009, Kosareo and Ries, 2007). Municipalities can save costs by installing
(relatively inexpensive) green roofs on new developments instead of expanding stormwater
infrastructure. Home owners can increase their property values by investing in green roofs
(Peck et al., 1999). Green roofs enhance photovoltaic function, and buffer heat flux entering
buildings in summer, for which the decreased demand on air conditioning means fewer
greenhouse gas emissions (Cantor, 2008). Visual aesthetics of vegetated versus concrete
roofs can improve cognitive functioning, such as boosting attention spans (Lee et al., 2015),
which aligns with psychophysiological accounts of the beneficial effects of natural views on
hospital patients (Ulrich, 1984)).
1.2 Green roofs and urbanisation
At the global level, urban populations grew very rapidly over the 20th century, from 220
million in 1900 to 2.8 billion in 2000, but “the next few decades will see an unprecedented

15
scale of urban growth” especially in the developing world, with almost 5 billion projected for
2030 (UNFPA, 2007). For the first time in history, 2008 marked the year at which more than
half the world’s human population (3.3 billion) was living in urban areas (UNFPA, 2011). At
the same time, losses in biodiversity due to human activities have occurred more rapidly in
the past 50 years than at any time in human history (Millennium Ecosystem Assessment,
2005a). Considering that green roof markets continue to grow in Germany (FBB, 2012) and
in other parts of the world [e.g., (Peck, 2012)], and that the original EGR systems developed
in the 1970s are currently being re-evaluated (Green Roof Systems Project, 2013), vegetated
roofs could serve as important biophilic technologies for this extraordinary point in history
in which human population growth and urbanisation are negatively correlated with
plummeting biodiversity. By elucidating the capacity of EGRs for ecosystem function over
the long-term, this dissertation hopes to clarify the role they may play for the future ahead.
1.2.1 Ecosystem services and biodiversity: current knowledge
Life on this planet would not be possible without functioning natural ecosystems. Potable
water and breathable air, fertile soils, the pollination of food crops, the decomposition and
processing of wastes and countless other processes are all manifestations of the workings of
life on Earth. The concept of ecosystem services was formalised and made popular by the
Millennium Ecosystem Assessment (MEA) and helps to explain how humans are supported
by, and reliant upon, the natural environment (Grant, 2012). On the first page of this
massive report, which took 1360 scientists from 95 countries four years to create, the MEA
states simply: “Everyone in the world depends completely on Earth’s ecosystems and the
services they provide” (Millennium Ecosystem Assessment, 2005b). Ecosystem services are
grouped into four broad categories including 1) provisioning (e.g., production of food and
water); 2) regulating, (e.g., control of climate and disease); 3) supporting (e.g., nutrient
cycles, crop pollination); and 4) cultural (e.g., spiritual and recreational benefits). The MEA
emphasises that biodiversity underpins ecosystem services, so the two terms can be
considered synonymous (ibid).
Plants and soil are the foundation for terrestrial ecosystems (Cilliers and Siebert, 2011), and
are important for biodiversity due to their position underscoring trophic foodwebs. Species
diversity has functional consequences because the number and kinds of species present
determine the organismal traits that influence ecosystem processes (Chapin et al., 2000).
Experiments have revealed correlations between species richness and rates of ecosystem

16
processes for low species numbers (Tilman et al., 1996, Hector et al., 1999), but less is
known about the impact of species richness in species-rich, natural ecosystems (Chapin et
al., 2000) and even less so for urban ecosystems (Pickett et al., 2008). Still, although the
mechanisms and circumstances under which species diversity influences ecosystem
properties are uncertain, incorporating diversity effects into policy and management is
essential in order to reduced restrictions on future management options (Hooper et al.,
2005).
The most dramatic changes in ecosystem services will likely come from altered functional
compositions of communities and the resulting effects on genetic and taxonomic species
diversity (Millennium Ecosystem Assessment, 2005a). The loss of species within the same
trophic level of locally abundant species may have greater impacts rather than the loss of
already rare species (Diaz et al., 2006). This concern partly explains why attention has
shifted to consider the ecosystem services delivered by towns, cities and urban areas
(Gomez-Baggethun and Barton, 2013, McDonald et al., 2013). Land conversion for purposes
of human settlement is the most direct driver of biodiversity decline (McDonald et al.,
2013), since growing populations require more built infrastructure while consuming ever
more ecosystem services. With over 60% of this projected urbanisation yet to be built (CBD,
2012), proponents of urban ecology must coordinate ranks if they hope to meet the
opportunities embedded in this challenge (Elmqvist et al., 2013, Pickett et al., 2014, Steiner
et al., 2013). It’s evocative to consider that, by 2050, global population is projected to reach
8.1 - 9.6 billion (Millennium Ecosystem Assessment, 2005a), of which 6.3 billion will be
urban, nearly twice the urban dwellers worldwide in 2010 (CBD, 2012).
While green roofs and other forms of green infrastructure may contribute to urban
ecosystem services, they may also contribute to “ecosystem disservices” (Honey-Roses et
al., 2014), too. Whether they facilitate the spread and increase of allergens, invasive
species, pathogens and pests, or obstruct mobility or compromise human security and
safety, informing social perceptions and knowledge must complement the collaborative
urban planning of green infrastructure (Lyytimaki, 2014). As it is, the concept of ecosystem
services is not without criticism [e.g., Bull et al. (2013)] for being too abstract, for
compromising knowledge of ecological complexity for the sake of static economic models
and, especially, for claiming the ability of quantifying the benefits of functioning ecosystems

17
towards the values implicit to financial currency, as was recently completed for the United
Kingdom (UK National Ecosystem Assessment, 2014).
The direct drivers of declining biodiversity are either remaining steady, showing no evidence
of decline over time, or are increasing in intensity over time (CBD, 2012). In effect, we are
currently witnessing the sixth major extinction event in the history of the Earth; the greatest
since the dinosaurs disappeared 65 million years ago (CBD, 2006). It is not surprising that
geologists refer to this industrialised era as the Anthropocene (Steffen et al., 2007,
Zalasiewicz et al., 2010). We are approaching the threshold limits of freshwater, land use,
ocean acidification and interference with global nutrient cycles (Millennium Ecosystem
Assessment, 2005b) and may already have transgressed the threshold boundaries of three
Earth-system processes: climate change, rate of biodiversity loss, and interference with the
nitrogen cycle (Rockstrom et al., 2009). Ultimately, “the choice of biodiversity levels must be
determined by society” (p. 16), as the interaction of human health, security, social relations,
freedom, and human well-being have direct impacts on biodiversity (Millennium Ecosystem
Assessment, 2005a). For context:
In 2008-09, the world’s governments rapidly mobilised hundreds of millions of dollars to
prevent collapse of a financial system whose flimsy foundations took the markets by
surprise. Now we have clear warnings of the potential breaking points towards which we
are pushing the ecosystems that have shaped our civilisations. For a fraction of the money
summoned up instantly to avoid economic meltdown, we can avoid a much more serious
and fundamental breakdown in the Earth’s life support systems. (CBD, 2010b) (p. 87)
1.2.2 Green roofs as green infrastructure
Ecological design using green infrastructure and living architecture integrates science and
design with culture and nature, following the principles of biomimicry and ecological
restoration (Grant, 2012, Orr, 1999, Lundholm and Richardson, 2010). Cities are considered
essential to meeting the global environmental challenges described above, and there are
many local government and municipal leaders who are engaged in action. Since the 1990s,
“Local Governments for Sustainability” (ICLEI) have united cities from around the world to
build more sustainable communities through numerous initiatives (ICLEI, 2011). However
grim, the increase in natural disasters, extreme weather events, and socio-economic crises
have unequivocally softened humanity’s sensibility to its vulnerability, and to the profound

18
truth of interconnectedness. A sign of the times, policies have begun emerging which
support trans-disciplinary collaborations that demonstrate ecologically informed
approaches to designing and managing the environment. Of the four potential development
paths for reducing poverty and hunger in fifty years (Millennium Ecosystem Assessment,
2005a), the two scenarios with the most balanced impacts on human well-being and the
least biodiversity loss, Adapting Mosaic and TechnoGarden, refer to green roofs.
Green infrastructure takes green space planning beyond the preservation of a few selected
sites and places emphasis on large-scale, forward planning of restored, interconnected
landscapes. Multi-functionality is emphasised such that a wide range of ecosystem services
is afforded by all sites (Grant, 2012). In the United States, the unparalleled extreme weather
events of 2012, coupled with Superstorm Sandy (the largest Atlantic hurricane on record)
have led to an unprecedented promotion for the widespread financing and implementation
of green infrastructure (Natural Resources Defense Council, 2013). Whether roadside
plantings, green roofs, vegetated parks, or porous pavement, the combination of vegetation
and soil allows green infrastructure to manage and clean stormwater by capturing rain on or
near where it falls and either storing the water or allowing it to naturally filter back into the
ground (U.S. Environmental Protection Agency, 2011).
Ecological urbanism is a comprehensive design approach which reflects the complexity of
the urban situation through a language which integrates ecological principles into the urban
matrix (Mostavi and Doherty, 2010). In terms of landscape, this ecologically informed
approach replaces horticulture-based design practices for the benefit of urban remediation.
It involves the development of trans-disciplinary collaboration and enhanced professional
awareness about the relationship of vegetation, soil and ecology by both design and
management. This approach can also help to change public attitudes to more naturalistic
planting styles in the public realm, which is culturally beneficial as funding for green and
open spaces becomes increasingly constricted, as in the UK (Heritage Lottery Fund, 2014).
Cities have traditionally been built to operate in exclusion of ecology, and in ways that
promote the widespread ignorance of it (Grant, 2012), so using the ecological approach is a
social tool to turn this around.

19
1.3 Ecology and green roofs
If cities create environmental problems, they also contain the solutions. The potential
benefits of urbanisation far outweigh the disadvantages. The challenge is learning how to
exploit its possibilities. (UNFPA, 2007)
This research directs ecological interest to the roofscape, so the relevant ecological theories,
sub-disciplines and approaches shall be introduced here and may be expanded upon in the
chapters that follow. To start with, a brief history of ecology as a science and discipline will
be reviewed since it has evolved tremendously over the years. The parts of ecological theory
and methods that are relevant to this work were formed during different points in history,
sometimes under varying cultural beliefs, so their foundations will be introduced here.
1.3.1 A brief history of ecology
Ecology is the science of relationships of living organisms with each other and with the
environment (Greek: oikos means "house"; -ology means "study of"). In the period from
Aristotle until Darwin, humanity’s world view beheld the natural world as static and
unchanging, made of closed and self-regulating systems that excluded humans (Pickett et
al., 1992). Studies of the natural world up until the early 20th century therefore used coarse
scales to examine bits and pieces of its material and phenomena (McDonnell, 2011). While
the positivist scientific tradition that prevailed at that time allowed classic disciplines like
physics, astronomy and chemistry to make great strides, its methods precluded the study of
the dynamic and reciprocal relations between organisms, their adaptations, and the
environment (Pickett et al., 1994). This explains why the diligent naturalists of the 18th
century so avidly collected (and pickled) specimens: their goal was to study individual
organisms; little regard was given for the conditions in which those organisms existed.
The assertion that nature maintains an innate balance which includes all influences from the
organic and inorganic world (i.e., geologic causes, biota) – with clear exception of “cultured
man” (Marsh, 1864) – has been interpreted as a metaphor which ecologists have referred to
as the “equilibrium paradigm” (McDonnell, 2011). This classical paradigm emphasises that
all ecosystems have stable points of equilibrium, and that ecological systems are closed
(Pickett et al., 1992). Consonant with the metaphor of the “balance of nature”, the
equilibrium paradigm has had widespread repercussions to the development of Western
culture and science (Pickett et al., 1994). Beyond tangible outcomes, like the over-

20
exploitation of natural resources and the unequal distribution of wealth, the psychological
effects of alienation of humans from nature has had subtle but profound consequences,
which persist through negative feedbacks (Chiesura, 2004, Turner et al., 2004, Dallimer et
al., 2012).
Since the 1970s, a mounting body of scientific evidence has grown to indicate flaws in the
classical paradigm (Botkin, 1990, Pickett et al., 1992). The “flux of nature” paradigm
expresses a human-inclusive world view and, with reference to empirical evidence, observes
that ecological systems are driven by process rather than endpoint (Vitousek and White,
1981), as open systems potentially regulated by external forces (Whittaker and Levin, 1977).
In effect, this means that humans are explicitly included as components of ecosystem
processes and functions that regulate the structure and function of ecosystems as much as
any external force (e.g., fires, floods) (McDonnell, 2011). While the coarse-scale studies
from classical ecology have helped to develop methods and establish preliminary ecological
theories, the fine-scale emphasis of the contemporary “flux of nature” paradigm has
delivered important ideas about natural systems. In the new paradigm, a landscape may be
in compositional equilibrium even while individual patches are in a variety of states,
distributed through space and time (Pickett et al., 1992). As shall be shown, most of the
ecological approaches that are relevant to this work reflect this latter paradigm, though
some have only reached this point after considerable transformation from the original
conceptual form.
1.3.1.1 Phytosociology: plant community ecology
Early ecologists agreed that plant species tend to occur together in consistent combinations
(e.g., forests, grasslands, and heathlands), but the methods for describing them developed
somewhat in Europe. While American and British schools of ecology pursued methods of
ordination to describe and predict vegetation change over time, European plant ecologists
focused on classifying vegetation into communities. Since both approaches are based on
their own systems of values, interests, assumptions and concepts, which consequently
interlink to inform practices and serve underlying interests, divergent scientific cultures
emerged (Whittaker, 1972). As such, the European approach of classification is not widely
known or used by the English-speaking schools of ecology (Goodall, 2014). As shall be
reviewed later, this approach was used to classify spontaneous rooftop vegetation so it will
be introduced here.

21
In the 1920s, Josias Braun-Blanquet (1884-1980) coined the term “plant sociology” and
established methods that are still used today for recognizing and defining plant
communities. Owing to his affiliations, this approach became known as the Zürich-
Montpellier school of plant sociology. The main construct of phytosociology [the study (-
ology) of plant (phyto-) communities (socio-)] is that distinct species assemblages repeat
over space and time, and can therefore be identified as communities or associations. This
concept, also described by Clements (1916), was developed by numerous plant ecologists
over time, in some cases with strongly differing opinions [e.g., Gleason (1939), Tansley
(1920, 1935)]. From the basis that vegetation falls into discrete categories (‘associations’), of
which a certain assemblage of ‘characteristic’ species are normally present, European
botanists set out sampling plots from as many ecosystems as possible, with the goal of
classifying all the major plant communities and their constituent species. According to this
conceptual framework, the species assemblage of a plant community is determined by
specific endogenous and exogenous factors, i.e., dynamics caused by the organisms
themselves or by forces directing dynamics from outside the system. From a practical
standpoint, this implies that some species will have strong relationships to particular
habitats, and also to certain accompanying species. The tighter a species’ relationships
(‘fidelity’), the more characteristic it is to a designated community. Still, though “fidelity is of
supreme diagnostic importance”, a decisive classification is ultimately the summation of all
the floristic, ecologic, syngenetic, and synchorologic characteristics, as well as spatial factors
and precise geographic location (Braun-Blanquet, 1932) (p. 365).
1.3.2 Natural succession and vegetation dynamics
To the discipline of ecology, the theoretical model of natural succession occupies the same
role as evolution does for biology (Anderson, 1986, Margalef, 1968, Dawkins, 2004). Natural
succession has commanded much of the attention of plant ecologists since the inception of
the discipline in the late 19th century, with the aim of describing or predicting patterns of
vegetation change through time (Pickett et al., 1987, Luken, 1990) All plant assemblages
change their species composition and structure over time, and natural succession is a very
complex conceptual model due to the temporal and spatial scales over which it occurs (not
to mention the logistical difficulties of studying natural communities across these scales)
(Barbour et al., 1999). Unsurprisingly, the mechanisms and processes driving successional
change have been disputed since the theory first emerged. Figure 1.5 presents a summary

22
of seven major interpretations, of which all bear merit to our understanding of natural
succession.
Figure 1.5. Various interpretations of succession. 1. Clementsian view. 2. Relay floristics. 3. Initial floristics. 4. Changing resource availability. 5. Facilitation. 6. Tolerance. 7. Inhibition. Modified from Luken (1990).
Though the need for simplicity is at least partly to blame, the straight arrows in the figure
above imply that change over time is directional, with an end point where change ceases.
This was the first and biggest point of contention when ecologists first began the quest for
understanding the vegetation dynamics of abandoned arable fields. The first and strongest
explanation (Box 1 in Figure 1.5) suggested that natural succession occurs in five basic steps
after a site has been denuded, eventually reaching a stable “climax community” endpoint
(Clements, 1916). Doubts to the predictability and certainty of this model were raised from
the onset, with contrary suggestions that plant succession is directed by chaos,
individualism, competition and a blur of continuous change and complexity (Gleason, 1939).
The theory was continually developed further as alternative perspectives arose, like
consideration for and emphasis on pattern and process (Watt, 1947) or the pattern climax
concept that emerged from new methods of gradient analysis (Whittaker, 1967).

23
The concept of “plagioclimax” was another early refinement to succession theory that may
be useful for describing EGR vegetation development. Although still assuming directional
change, this model implies deflected succession, as derived from the Greek plagios which
means slanting or sideways (Figure 1.6). Observations of chalk grassland led British
ecologists to suggest that this species-rich vegetation was maintained, even produced, by
grazing and would not persist without this continuous disturbance (Hope-Simpson, 1940,
Tansley, 1965). Plagioclimax communities, like chalk grassland, are floristically stable, but
only when provided with appropriate grazing regimes that “deflect” the vegetation from
changing into species-poor, coarse grassland dominated by competitive grasses (Bakker et
al., 1984, Gibson and Brown, 1992, van der Maarel, 1971, Bardgett et al., 1996). The
deflecting disturbances associated with plagioclimax communities can also be the product
of local environment and soil conditions (e.g., extremely shallow soil which prevents higher
plants from establishing) (Tansley, 1958). Certainly, shallow soils inhibit competitive species
with deep root architecture (Graham and Hutchings, 1988). If the vegetation of such
conditions attains a stable or steady state, then it may qualify as an edaphic (soil-caused)
plagioclimax.
Figure 1.6. When natural succession is deflected by continuous disturbance, such as grazing, the vegetation develops into and is maintained as a plagioclimax community. Modified from Tansley (1965).
As a conceptual construct, the continual improvements to this model over the course of the
20th century reflect as much the methods used as well as the worldview and the vernacular
culture of its proponents. As methods improved for monitoring and analysis, and more
empirical evidence accumulated, ecologists began to accept a more dynamic “flux of
nature” model (to the demise of the Aristotelian “balance of nature” myth). Important
developments to community ecology and population dynamics have described succession
through contributions from Pickett (1976), Connell and Slatyer (1977), Grime (1977), Tilman
(1985), Huston and Smith (1987) and others.

24
1.3.2.1 Emergence in biotic communities
Concurrent with the earliest studies of succession, the concept of emergence arose from the
same philosophical foundations upon which science and ecology are based. The term was
coined during the age of positivist philosophy by G.H. Lewes (1891), who defined an
emergent as “unlike its components insofar as these are incommensurable, and it cannot be
reduced to their sum or their difference” (p. 412). A phenomenon is therefore emergent if it
cannot be predicted by means of the accepted theories of the time and on the basis of the
data available before its occurrence (Henle, 1942). From the perspective of ecology, biotic
communities may exhibit emergent properties when the sum of their components
(including interactions and patterns) are greater than their individual parts to that system,
or when the collective exhibits more complex behavior than the individuals together can
exert (Edson et al., 1981). The emergent property itself may be very predictable, such as
secondary succession on old fields, or they may be entirely unpredictable and
unprecedented, such as the assemblage of novel ecosystems in urban environments.
Though the debate over an organismal versus individualistic sort of natural succession
eventually receded from centre stage, the notion of emergent community characteristics
remained tacitly accepted (if not always philosophically endorsed) by community ecologists
(Anderson and Kikkawa, 1986). In that context, any reference to perturbation or disturbance
is seen to imply the operation of a selective force on that system, and it is the system, rather
than its component individuals, which is expected to respond (Anderson and Kikkawa,
1986). The notion of emergence to ecology has not been without scorn (Salt, 1979, Edson et
al., 1981); not only is it difficult (impossible?) to define, but any observation of phenomena
is inescapably confined to the scope of knowledge at a given time, so suggestions of
emergent characteristics are relative, not absolute, and their status may change when more
knowledge is available (Hempel and Oppenheim, 1948). In addition, any ecologist aware of
inter-connectivity will attest that interactions between components of a system will
increase exponentially with the number of components, meaning that new and subtle types
of behaviour may emerge (Edson et al., 1981). Lastly, large numbers of interactions can
work against the emergence of interesting behaviour as they may generate too much noise
to perceive an emerging signal (Beckner, 1968). Thus organization of components also plays
a role in emergence, or of our ability to perceive it. Edson et al. (1981) argue that seeking
emergent status of different ecological phenomena simply diverts time, attention and

25
resources away from the real focus of ecological inquiry, namely the empirical study of
ecological relationships. The main opposition to the concept of emergence was due to how
it was being used rather than its merit, as some ecologists used it as an excuse to describe
certain phenomena as mysterious and absolutely unexplainable rather than using
conventional ecological measurements for explanation and prediction (Hempel and
Oppenheim, 1948, Edson et al., 1981).
1.3.2.2 Succession according to plant functional traits and adaptive strategies
A major development in succession theory argued that most of the perceived phenomena of
successional sequences could be ascribed to differences in species’ ability to colonize, grow
and survive in environments with different suites of resource combinations (Drury and
Nisbet, 1973). This opinion that a comprehensive theory of succession should be sought at
the level of the organism, and not in emergent properties of communities, led to studies of
the ecophysiological attributes of species characterising different successional stages [e.g.,
Bazzaz (1979), Bazzaz and Pickett (1980)]. Some ecologists referred to the influence of
species’ life history strategies on the structure and composition of vegetation and
successional processes. The popular concept of r/K continuum (MacArthur and Wilson,
1967) encapsulated many of the conditions necessary for evolution and diversity, whereby
conditions of high mortality risk favoured short-lived organisms capable of early
reproduction (r-selection) while conditions of low mortality selected for organisms with
delayed reproduction, larger stature, longer lifespans, and the capacity to monopolize
resource capture (K-selection) (Pianka, 1970). Still, some ecologists felt an important
dimension was missing, namely the location within the model for tolerance (Grime, 1977,
Southwood, 1977, Pugh, 1980, Greenslade, 1983) or for particular forms of competition for
resources (Tilman, 1982, Tilman, 1988) and space (Bolker and Pacala, 1999).
These lacking aspects of r- and K- selection theory were resolved by empirical studies which
revealed that there were three, rather than two, selective strategies and that these exist in
nature as distinct, coherent phenomena (Taylor et al., 1990). Specifically, high and low levels
of stress and disturbance were seen to have led to the evolution of three distinct types of
strategies, which can be described by four permutations (Table 2). Competitive plants thrive
in conditions of low stress and low disturbance; stress-tolerant plants thrive in conditions of
high stress and low disturbance; and ruderal plants thrive in conditions of low stress and
high disturbance. Few species are found in habitats subject to high intensities of disturbance

26
and stress. Secondary and tertiary strategies result as adaptations to intermediate
intensities of competition, stress and disturbance (Grime et al., 2007, Pierce et al., 2013,
Hodgson et al., 1999).
Table 1.2. Suggested basis for the evolution of three strategies in vascular plants. Grime (1977)
Intensity of stress
Intensity of disturbance Low High
Low Competitive strategy Stress-tolerant strategy
High Ruderal strategy No viable strategy
The triangular CSR model is defined by a continuum where three life strategies –
competition or growth (C), stress-tolerance or maintenance (S), and ruderality or
regeneration (R) – emerge as a result of two environmental selection pressures, stress and
disturbance (Figure 1.7). Since neighbouring organisms also exert pressure, three selection
forces of a habitat – competition (C), stress (S) and disturbance (D) – may be considered a
three-way equilibrium (Grime and Pierce, 2012). Just as CSR theory remains unfalsified,
empirical studies continue to validate CSD equilibrium theory through collaborative
research groups working from different countries (Diaz et al., 2004, Wright et al., 2004,
Cerabolini et al., 2010, Freschet et al., 2012). In fact, the increasing validation that this
three-way trade-off occurs throughout the tree of life (i.e., in addition to plants), CSR theory
has recently been extended into universal adaptive strategy theory (UAST) (Grime and
Pierce, 2012). With respect to natural succession, the CSD equilibrium is a mechanism that
explains how and why adaptive different strategies may persist or get filtered out of
habitats. Based on observations that all organisms have a limited potentiality with regard to
their evolutionary response to CSD, the equilibrium is defined by trade-offs that dictate the
assumption of predictable sets of core adaptive traits (Grime and Pierce, 2012). UAST will be
reviewed more closely in Chapter 7.
Figure 1.7. CSR space: a) the relations between the two environmental dimensions (stress and disturbance) and the three plant dimensions (C, S and R); b) the locations of three primary (C,S,R) and four secondary (CR, SC, CSR, SR) plant functional types within the entirety of CSR space. A further twelve tertiary intermediates exist between these seven. Modified from Hunt et al. (2004).

27
The predictive power offered by the CSR model to the study of succession (and to the
practice of succession management) is illustrated in Figure 1.8, where trajectories and their
locations within CSR space identify the sequence of dominant plant strategies likely to
characterise secondary succession in varying conditions of potential productivity (Grime,
2001). Since secondary succession begins on disturbed ground, successional trajectories
begin in the R-corner and proceed towards the S-corner with differing proximity to the apex
of the triangle where C-strategists dominate. The circles superimposed on the curves
represent the relative size of plant biomass at three stages of succession. Since conditions of
fixed potential productivity as shown by S1-S3 (Figure 1.8a) are unlikely to occur in nature,
the curves in Figure 1.8b show hypothetical pathways of succession under conditions of
increasing (S4) and decreasing (S5) potential productivity.
Figure 1.8. The CSR model of plant strategies can be used to illustrate pathways of natural succession under various degrees of disturbance and productivity: (a) succession under conditions of high (S1); moderate (S2), and low (S3) potential productivity; (b) under conditions of increasing (S4) and decreasing (S5) potential productivity. Modified from Grime (2001).
In Figure 1.8a, the upper arc (S1), representing exceptionally productive habitats, extends
into the central CSR zone and then descends steeply into the S-corner. This succession can
be characterised by a mid-point of intensive competition by competitive herbs followed by
woody vegetation, and leading to a terminal phase where stress-tolerance becomes
increasingly important because mineral nutrients become locked up in the biomass
dominated by large, long-lived trees. When succession occurs in less productive habitats
(S2), the appearance of highly competitive species is prevented by the earlier onset of
resource depletion and the stress-tolerant phase is associated with dominance by smaller
slow-growing trees and shrubs in various vegetation types. Finally, the lower arc (S3)
represents unproductive habitats, where plant biomass remains low over the course of
succession, and the vegetation shifts from ruderal directly to stress-tolerance. The CSR

28
model “is perhaps the nearest approach to a coherent predictive theory of succession”
(Burrows, 1990) (p. 273) with potential to reveal great insights into its driving mechanisms
(Bazzaz, 1996).
1.3.2.3 LTER for understanding succession
Temporal study is clearly essential to understanding succession and ecological change, but
this is not easily accomplished. Short-term research can be misleading as it can offer neither
“definitive bases for addressing societal concerns related to environmental biology nor …
the substantial advancement of a science that deals with processes occurring over long
periods of time” (Callahan, 1984)(p. 363). With respect to natural succession, Luken (1990)
states three methods for accumulating a database for a particular area or plant community:
(1) published research, (2) cooperative research agreements, and (3) on-site research.
Historical records are usually inadequate (Callahan, 1984), if only because the time scales of
many ecological phenomena occur over the course of generations, which results in
discontinuous records as methods and practitioners change over time (Bakker et al., 1996,
Dunnett et al., 1998). This affects the quality of baseline data, limiting its extent to recent
work and current observations, which plainly inhibits long-term perspective. The
development of a unified theoretical base for ecology has been severely impeded by the
lack of comprehensive and comparable information across a diversity of ecosystems
(Callahan, 1984). Many ecologists would also agree that “the traditional patterns and rules
for the planning of research and competing for funding have often been counterproductive
to a science that deals with many phenomena occurring over decades or centuries”
(Callahan, 1984) (p. 367).
Long-term observations of ecological phenomena and biodiversity, and the consistent and
reliable accumulation of long-term synoptic datasets, are crucial to understanding how
natural systems work (Callahan, 1984, Likens, 1989, Franklin et al., 1990), including
questions like ‘why’ (causes) and ‘how’ (mechanisms) (Bakker et al., 1996).
Chronosequences (or 'space-for-time substitutes') which may result from such studies are
useful for qualitative purposes and for hypothesis generation. Site history is of plain
importance, but the implicit assumption that sites of different ages will have similar
environments (i.e. same soil conditions, microclimate, and availability of propagules) is
rarely met (Glenn-Lewin and van der Maarel, 1992). So, while they can provide invaluable
perspective into plant community dynamics, unless the assumptions are met

29
chronosequences are unreliable for gaining deeper insights into successional change (Pickett
et al., 1987). Another reason that long-term ecological research is rare is due to the nature
of scientific funding, which is never intended for decades, let alone centuries (Franklin et al.,
1990). Although concern about the ecological effects of projected climate change
underscores the importance of understanding of how plant communities change (Silvertown
et al., 1994) – and how stable they are over 50 to 100 years (Pimm, 1991) – few research
projects last longer than 10 years (Delcourt and Delcourt, 1988).
Despite the limitations, there are a number of examples of long-term research in grassland
or heathland ecology. The Russian plant ecologist L.G. Ramenskii (1938) pioneered the use
of permanent quadrats for describing meadow, fen and steppe vegetation over time, and
implemented an early understanding of the necessity of objective methods for studying the
complex relationship between vegetation and habitat. Ramenskii instigated the process of
recognising the fundamental and inescapable constraints that are integral to the core
functioning of plant communities (Grime et al., 2007). The use of permanent plots and long-
term surveys can enhance our knowledge of the mechanisms of succession (Bakker et al.,
1996). As one example, annual surveys (starting in 1958) of mesotrophic grassland along
wide roadside verges in southern England granted perspectives into how species abundance
can fluctuate within a single year, even within what may be thought of as relatively stable,
non-successional vegetation (Hunt et al., 2004, Morecroft et al., 2004). The comparison of
annual vegetation records with a time series of basic meteorological data (individual
weather variables) and higher-level weather data (synoptic patterns) permitted that study
to illustrate correlations between stress tolerant species with warm dry springs and
summers, and between more productive species with wet growing seasons (Dunnett et al.,
1998, Dunnett and Willis, 2000).
Perhaps the longest grassland monitoring program is the Park Grass Experiment (PGE) at
Rothamsted (England), begun in 1856 with only a few time gaps (Bakker et al., 1996). The
PGE features a series of contiguous meadow grassland communities within the same
microclimate and soil type, divided into soil treatments (fertilizer, liming) in order to
quantify the effects on species richness, floristic composition, annual net primary
production, community stability, and more (Johnston, 1991, Silvertown et al., 1994, Dodd et
al., 1995). A similar experiment was set up in northern England in 1993 (The Buxton Climate
Change Impacts Lab) in order to determine how projected climate conditions in 2100 would

30
affect species-rich calcareous grasslands (Grime et al., 2013). Six treatments (warming,
summer drought, supplementary rain) are delivered through microcosm techniques and
field manipulations in order to study the effects on dominant plant species on the trophic
structure of herbaceous vegetation. 2013 marked twenty years of continuous climate
manipulation in the main experiment at Buxton, and collaborative experiments have since
extended to other Universities in Britain, Italy, Switzerland and the United States. These
manipulations have revealed insights into how plant communities and agrarian systems may
respond to climate change, e.g., dispersal (rather than biotic resistance) as main obstruction
to species’ northward migrations (Moser et al., 2011), and the importance of fine-scale soil
heterogeneity as a buffer for community response (Fridley et al., 2011).
On a grand scale, the American National Science Foundation (NSF) initiated a Long-Term
Ecological Research (LTER) program in 1980 which established 26 sites as “sample
ecosystems” across the U.S. with several thousand associated scientists (Robertson et al.,
2012). Comparability of data across LTER sites was of key importance (Callahan, 1984) and,
after 40 years, they have indeed addressed some fundamental questions, many of which
cannot be addressed by short-term funding cycles (e.g., How do populations change in
response to long-term environmental changes, such as landscape and climate change? How
do these changes affect biodiversity and trophic interactions and, in turn, primary
productivity, element cycles, and other ecosystem processes? What are the lags in
ecosystem responses to and the legacies of past human and natural disturbances? What
precipitates ecological tipping points, and are such changes predictable?) (Robertson et al.,
2012). In the 1990s, two urban metropolises were added to the LTER network: Phoenix (AZ)
and Baltimore (MD) (Grimm et al., 2000). In Europe, a similar program has been assembled
under the heading “Long-Term Socio-Ecological Research” (LTSER) (Mauz et al., 2012).
1.3.3 Urban ecology
Today’s built environment is a perfect manifestation of the “equilibrium paradigm” that has
dominated human thought for so long, of the worldview that humanity is separate from
nature. For much of human history, buildings were integrated with the natural environment,
whereby builders, artisans, and designers used local materials and adopted themes and
patterns from nature in order to create beautiful, enduring and functional structures which
connected culture and heritage with the natural world (Kellert et al., 2008). Modern
accomplishments in architecture and engineering, however, have helped to foster the belief

31
that humanity can transcend the dictates of natural systems. David Orr (1999) lamented
that this dangerous illusion has led to an architectural practice which encourages
overexploitation, environmental degradation, and separation of people from natural
systems and processes. Humanity’s increasing alienation from the natural world is described
by the biophilia hypothesis, which refers to an instinctive bond between human beings and
other organisms and systems. Defined as “the urge to affiliate with other forms of life”
(Wilson, 1984), the term biophilia literally means “love of life or living systems” (Greek: bio
means "life"; -philia means "affiliation, love, or attraction to"). Biophilic design can be
implemented at any scale, from buildings to cities, and reflects on the interactions between
the natural environment and human experience (Kellert et al., 2008).
Very little traditional ecology research has contributed to our understanding of the ecology
of human settlements (Grimm et al., 2008) because, under the spell of the ‘equilibrium
paradigm’, any sites worthy of ecological study would explicitly exclude humans. Traditional
ecologists therefore viewed any non-human organisms living in cities as being there by
coincidence and, therefore, as uninteresting (McDonnell, 2011). It is also noteworthy that
many of the early ecological theories and concepts were developed concurrent with the
settlement of the New World and Oceania, meaning that traditional ecological studies
focused on areas with low cultural impact or human population density (McDonnell, 2011).
As such urban ecology is a relatively young applied science which intrinsically reflects a
human-inclusive world view (McDonnell, 2011). Given its tremendous range of trans-
disciplinary observations, it may be best to describe urban ecology as ecological research in
the urban setting (Rebele, 1994, McDonnell et al., 2009, Niemela, 2011).
In fact, the human desire to understand vegetation that occurs naturally in cities has a long-
standing tradition, certainly in Central Europe and the UK. The flora of the Coliseum of
Rome was described by Panarolis in 1643, and vegetated walls in Palestine were
documented in 1762 by Hasselquist (Sukopp, 2002). Since the 17th century, the flora of
castle ruins and walls was studied and given the name “ruderata” (Buxbaum 1721, Linnaeus
1751) from the Latin rudus for rubble or ruins (Sukopp, 2002). Disturbance has always held a
central role to urban ecological theories because cities have generally always been
considered disturbed environments (McKinney, 2006). As a discipline, urban ecology traces
its origins to post-war Europe, as the spontaneous colonization of exotic vegetation in
bombed demolition sites issued dramatic social responses (Salisbury, 1943). In northern

32
regions, these rubble sites were warmer and drier than the natural habitats, allowing
species from warmer climates to expand their ranges through dispersal and colonisation
(Sukopp, 2002, Millard, 2004, Thompson and McCarthy, 2008).
Modern cities may actually be less disturbed than is sometimes thought, however,
particularly if they were not recently bombed (Thompson and McCarthy, 2008). Urban
habitats classified as ‘‘disturbed’’ can equally be termed ‘‘novel’’ or ‘‘anthropogenic’’
(McKinney, 2006), as it is those features, rather than disturbance, which create the
observed effects. In any case, descriptions of nature of the city as a whole, rather than as
individual biotopes, began in the 1970s (Sukopp, 2002); Berlin (Germany) was one of the
first cities to be studied comprehensively (Breuste et al., 2008). Some of the long-term
processes explored include natural succession of different urban soils (Rebele, 1992), urban
woodlands (Bornkamm, 2007) and grasslands (Fischer et al., 2013, Kowarik, 1990), as well as
green roof vegetation (Köhler, 1990). Interestingly, the German research has also led to
design concepts for low-input urban landscapes using spontaneous urban vegetation (Kühn,
2000). As ever more cities are surveyed and studied, a new understanding has begun to
accrue, predominantly for cities in the northern hemisphere (Cilliers and Siebert, 2011).
On the basis that cities present both the problems and solutions to the challenges of an
increasingly urbanized world (UNFPA, 2007), urban ecology is a useful approach because it
integrates the natural and social sciences to study these altered environments and their
regional and global effects (Grimm et al., 2008). In the 1970s, particularly, the realisation
that cities lie at the core of many environmental and social problems led to a call to improve
our understanding of the physical, biological and social components of cities and towns
(McDonnell et al., 2009). Now, after twenty-five years of query, this discipline has
elucidated many of the physical and chemical functions and processes of the urban domain
(atmosphere, soils, hydrology, living and non-living elements) (McDonnell and Hahs, 2013),
and where the flow systems of materials and energy link the biological and non-biological
(Grimm et al., 2008). As these urban systems can be shown to be integrated, so too can
human socio-economic structures, which play pivotal roles (Alberti et al., 2003, Marzluff et
al., 2008). Coupled with the unknown effects of global change and the unprecedented
expansion of human population and settlement, it’s clear that an improved ecological
understanding of cities and towns is crucial for mitigating human impacts at local, regional
and global scales (McDonnell and Hahs, 2013, Felson et al., 2013, Elmqvist et al., 2013).

33
1.3.3.1 Cultural or semi-natural ecosystems
The concept of cultural (or semi-natural) ecosystems can be useful for understanding the
place of vegetated roofs to both the urban environment and to the delivery of ecosystem
services on regional and larger scales. A physical example of the human-inclusive world view
in ecology, the concept of semi-natural ecosystems is based on the notion that all
landscapes have some degree of human influence. To this end, the notion of “virgin” or
“untouched” ecosystems is rejected. Just as most grasslands and savannahs are accepted to
be products of millennia of traditional human use, the remote Arctic tundra is affected by
atmospheric nutrient deposition and human-induced climate change. Acceptance of this
concept varies across industrialised cultures, with greater appreciation in Europe. Given
Europe’s millennia of archaeologically documented human settlement, it is relatively easy to
see how the landscape and its ecosystems evolved in tandem with humans. With a record of
tool development from the Palaeolithic through to modern machinery, it is no stretch of the
imagination to see how the effects of traditional versus modern management and tools will
affect ecosystems and biodiversity (Davies and Davies, 1980). Similarly, knowing that human
ecosystem management was much more diverse and localised prior to industrialisation it is
relatively easy to understand why some native species depend upon traditional methods if
they are to persist (Bakker, 2005).
1.3.3.2 Novel ecosystems
Altered ecosystems that have been significantly changed by human activity, often in relation
to invasive species or climate change, have been variously described as “novel”, “emerging”,
or “no-analog” ecosystems (Milton, 2003, Hobbs et al., 2006, Williams and Jackson, 2007).
Combined with the breakdown of biogeographical barriers (through global transportation of
species), our current era is set apart from previous ones because the rapid pace of change
leads to the rapid appearance of novel environments, species combinations and altered
ecosystem functions (Hobbs et al., 2006, Meyerson and Mooney, 2007). Indeed, the
prevalence of novel ecosystems may be an inevitable consequence of the Anthropocene
(Steffen et al., 2007, Hobbs et al., 2009), as many ecosystems have departed substantially
from their historical trajectory (Hobbs et al., 2014).
A novel ecosystem is one in which the species composition and/ or function have been
completely transformed from the historic reference. The decision on which version of

34
history is most important will always be a debatable point; nevertheless many restoration
projects are driven by commitment to historical qualities and re-establishing past
relationships between people and ecosystems (Higgs, 2003). Hybrid systems might retain
characteristics of the historic state but their composition and function now lie beyond the
historic range of variability (Hobbs et al., 2009). The process by which ecosystem change
occurs depends on abiotic forces and biotic responses, and the speed by which novel states
emerge is determined by the timing of the alterations in question. If abiotic change occurs
very intensively (e.g., changes in climate, land use, pollution, nutrient loading), and all or
some of the biota are unable to survive or regenerate, then the transformed system will
shift into a new system. Where only biotic changes are salient (e.g., significant declines in
native species and/ or invasion by non-natives), then a hybrid system may emerge. Novel
ecosystems are more likely to arise as the proportion of new species increases (Hobbs et al.,
2009). New biotic assemblages affect key interactions and processes, and changes in animal-
plant interactions, biogeochemistry or disturbance frequencies can lead to positive feedback
loops where members of the novel system facilitate the maintenance (and sometimes
spread) of that ecosystem and inhibit restoration of the previous (Hobbs et al., 2006).
Green roofs (and other urban ecosystems) can be defined as such due to their novel
elements, but they differ from novel ecosystems of cultivated or degraded landscapes due
to the management associated with the built environment (Hobbs et al., 2006, Lundholm
and Richardson, 2010, Kowarik, 2011, Perring et al., 2013). Otherwise, green roofs line up
nicely with the key characteristics outlined in the seminal paper on novel ecosystems
(Hobbs et al., 2006). The first characteristic, novelty, refers to new species combinations
with the potential for changes in ecosystem functioning. Indeed, the original intention for
EGRs was to improve the urban environment through the ecological processes granted by
the introduction of soils and living plants. The second characteristic, human agency, refers
to ecosystems that are the result of deliberate or inadvertent human action but not
dependent on continued human intervention for maintenance. Although EGRs do require
maintenance at least once annually, undocumented observations suggest that the shallow
substrate serves as an edaphic plagioclimax, which maintains stable vegetation and limits
natural succession into woodland. This characteristic of human agency further imparts the
perspective that green roofs can be considered a human response to urbanisation.
Ecological research of extensive green roofs has recently begun treating them as novel

35
ecosystems (Van Mechelen et al., 2015, Williams et al., 2014, Lundholm, 2015, Molineux et
al., 2014). Given how nascent both fields of research are, there is every possibility that
ecology-oriented green roof research could support our understanding of novel ecosystems
overall.
1.3.4 Green roofs designed for biodiversity
Further to the commercial EGR systems that define the global market, ecologically designed
alternatives can be found around the world, though these are limited to regional scales. The
trend of “green roofs designed for biodiversity” emerged from research in Switzerland and
the science-policy support mechanisms there (Gedge, 2003, Gedge and Kadas, 2004,
Brenneisen, 2010a), though the principles and experiences served as important reference
for practitioners in other parts of the world (Lundholm and Richardson, 2010, Macdonough
et al., 2006). That research will be described later; this section intends simply to introduce
these systems and how they relate to commercial EGRs. Specific details are not the
emphasis here, but rather a brief history of these developments in biophilic expression in
order to offer a sense of the possibilities for flat roofs with limited loading capacity.
The concept for green roofs designed for biodiversity arose from the sense that shallow
vegetated roofs could support greater diversity than Sedum-dominated systems (Thommen,
1988, Mann, 1996). A key study in Basel experimented with variations in substrate
(composition, depths and heterogeneity), vegetation (diversity, cover), and provisions for
wildlife (e.g., structures providing opportunities to bask, perch, hide, nest); many birds were
found to use these green roofs designed as habitat, including Crested Lark (Galerida
cristata), Little ringed plover (Charadrius dubius), Lapwing (Vanellus vanellus), Skylark
(Alauda arvensis), Common tern (Sterna hirundo), Meadow pipit (Anthus pratensis),
Wheatear (Oenanthe oenanthe) and Greenfinch (Carduelis chloris) (Brenneisen, 2003). This
concept was taken further by proponents in London, who developed green roof designs that
could support the habitat needs of Black Redstart (Phoenicurus ochruros), a rare breeding
bird in the brownfields of London’s Thames corridor slated for redevelopment (Gedge and
Kadas, 2004). These efforts concurrently led to the introduction of green roofs to the UK
(Gedge and Frith, 2005), and to a policy plan for “living roofs” in London with explicit
reference to supporting biodiversity (Greater London Authority, 2008). The London
Biodiversity Partnership’s Black Redstart Action Plan was instrumental in broadcasting the

36
benefits of green roofs to the mainstream, while also proving that these birds would indeed
breed on green roofs provided they were designed appropriately (Gedge, 2003).
By contrast with Sedum-based EGRs, biodiverse roofs feature greater emphasis on the
substrate; in many cases recycled aggregate is left to colonise naturally or is seeded with
annual wildflower mix or local seed source (Kadas, 2006). However, the absolute icon of the
nature conservation potential of green roofs is the Lake Water Treatment facility for Zurich.
This facility was one of the first to be constructed with reinforced concrete in this region in
1914; each of the five buildings was covered with earth in order to moderate the
temperatures inside. Specifically, 50 mm sand and gravel were lain down for drainage, upon
which 150 to 200 mm topsoil was placed, for a total of 30,000 m2 (Brenneisen, 2010b).
Apparently the roof was not planted. The soil obviously included the local seed bank, as an
extraordinarily diverse meadow developed, featuring 175 plant species typical of wet
meadow, including nine orchids and numerous other species that had become rare in the
eastern Swiss plateau since the roofs construction (Brenneisen, 2004). Although it is not an
EGR, this roof serves the example of what can happen when the conditions are created for
ecological processes to happen, in the absence of human interference.
1.4 Ecological research on green roofs
Most of the published research on extensive green roofs has focused on horticulture,
engineering, and design, with comparatively little work from ecology (Blank et al., 2013). Of
the ecological research, most has examined opportunities of habitat for invertebrates and
birds by green roofs; plant ecology research is hardly represented in the English language
literature (Piana and Carlisle, 2014). To be clear, green roof horticultural research is
abundant (Dvorak and Volder, 2010), but any plant ecological work has been limited to
experimental microcosms in which horticultural metrics such as establishment and growth
rate are recorded rather than ecological measurements like diversity or cover abundance.
Of the few plant ecological studies conducted on actual EGRs, these have been limited to
young roofs less than 10 years since installation (Rowe et al., 2012, Bates et al., 2013,
Dunnett et al., 2008b). A small body of work has surveyed well-established green roofs in
Germany, but most have been confined to unpublished dissertations or manuscripts
(Thommen, 1988, Riedmüller, 1994, Buttschardt, 2001, Poll, 2008, Darius and Drepper,
1983) and those published in journals are in German (Bornkamm, 1961, Bossler and Suszka,
1988), with a few exceptions (Köhler, 2006, Köhler and Poll, 2010). Similarly, beyond surveys

37
of soil-dwelling arthropods (Schrader and Boening, 2006, Madre et al., 2013) and
microorganisms (McGuire et al., 2013, Rumble and Gange, 2013, Molineux et al., 2014) little
is known about the soil ecological processes that occur on green roofs, yet much research
has gone into developing and testing blends (Kolb et al., 1982, Rowe et al., 2006, Emilsson,
2008).
For these and other reasons, the study of engineered EGRs as dynamic ecosystems subject
to the laws and processes of nature has hardly been touched upon (Francis and Lorimer,
2011, Cook-Patton and Bauerle, 2012). Further to the typical barriers to fully understanding
natural ecosystems and processes (e.g., the requirements for LTER), the ecological
investigation of EGRs is challenged by complications related to access. For one, the relative
newness of this technology to most parts of the world means that old examples of these
engineered systems are geographically limited to Germany where they were first developed
in the 1970s. For another, roof access rests upon the cooperation of building authorities
(e.g., building owner, landlord, estate management) who can easily evade contact if the
research does not interest them. Reliable documentation on an old green roofs
construction, component details and maintenance history can be impossible to access,
especially if institutional practices discard unused records and files after ten years, as is the
case in Germany. Lastly, the lack of studies may also be due to the limited interest by
traditional ecologists for urban sites (McDonnell, 2011).
1.4.1 EGR plant screening trials
The first native plant screenings for green roof systems date from the early 1980s in
Germany. Conducted mostly in Hannover and Weihenstephan, these trials screened species
and cultivars of regional provenance, but also species with promising traits originating from
dry grasslands, mountains cliffs and talus slopes (Kolb et al., 1982, Krupka, 1985), as well as
steppe, heath and sandy habitats (Liesecke, 1979, Kolb et al., 1983). Equal emphasis was
given to the screening of potential substrates (Penningsfeld, 1979, Kolb et al., 1982) and to
approaches for successfully establishing vegetation on gravel roofs (Kolb et al., 1983).
Techniques like sowing Sedum cuttings (Liesecke, 1985) eventually became standard
industry practice. The titles of most of these works make clear their intent to determine the
optimal green roof build-up (Liesecke, 1979), from the technical perspective of the
vegetation (Liesecke, 1981), as well as cost (Kolb et al., 1982). By 1985, the first book of
research proceedings was published which disseminated all the factors thought to be

38
essential for the creation of extensive green roofs, including site specific factors, plants and
vegetation forms (Krupka, 1985)(Krupka, 1985). The first English-language article was
published the following year (Kolb and Schwarz, 1986).
North America serves as an example of demonstration for more recent plant screening trials
for EGRs. Compared to Europe, there are exponentially more eco-regions on this continent
and, accordingly, a tremendous selection of species originating in habitats with analogous
conditions to extensive green roofs. Since 1998, screening trials of native vegetation for
EGRs there have come to include sub-tropical, semi-desert, humid continental, and
temperate coastal climate zones (Dvorak and Volder, 2010, Butler et al., 2012). Particularly
well-represented are the Atlantic Maritime Coast and the South Central Great Lakes
because of the green roof research centres in those regions. As in the German experience,
plant screening trials have been integrated with the testing of different substrate types
and/or depths (Rowe et al., 2006, Getter and Rowe, 2008, Thuring et al., 2010), soil
amendments (Licht and Lundholm, 2006), irrigation treatments (Wolf and Lundholm, 2008,
Monterusso et al., 2005, Schroll et al., 2011), stormwater performance (Simmons et al.,
2008, Lundholm et al., 2010) and surface temperatures (MacIvor and Lundholm, 2011b).
Experiments have begun accruing which illustrate that green roofs in hot and dry climates
are feasible but that their system design and appearance will differ from cooler and wetter
climates (Simmons et al., 2008, Benvenuti and Bacci, 2010, Van Mechelen et al., 2014a,
Williams et al., 2010). Drainage layers may not be appropriate in hot and dry climates, for
example (Simmons et al., 2008), and a great variety of Mediterranean xerophytes from
various life forms await application (Benvenuti and Bacci, 2010, Van Mechelen et al.,
2014b). Since extensive green roofs in hot and dry climates will not always be green,
certainly not without irrigation, an approach embracing seasonality, change and process
may be required if they are to be distinguished from intensively managed roof gardens. The
opportunity to apply ecological knowledge while discouraging uniformity can lead to local
distinctiveness with the benefit of maximizing biodiversity and the provision of ecosystem
services. There is much potential yet to be realised in hot and dry climates; the uncertainty
of climate change makes this area of research pertinent for many climate zones.

39
1.4.2 Green roof phytosociology
By the middle of the 20th century great volumes of literature had accumulated to describe
plant associations, their distribution and interrelations in Europe. It wasn’t long until
discerning eyes noticed the spontaneous vegetation growing on gravel rooftops,
presumably seeing them as one more association to be catalogued into this growing atlas.
Dr. Reinhard Bornkamm applied phytosociological methods to the vegetation TPGs in
Göttingen. At the time of Bornkamm’s initial investigations, post-war re-construction was
slowing and the inclusion of green spaces on urban structures had progressed in many cities
around the coming to a close (Osmundson, 1999). Bornkamm’s paper is purely scientific in
its descriptions of roof vegetation, however, without advocacy or speculation on this
ecologically interesting construction type. To the ecologist, spontaneously vegetated roofs
hint at ecological processes, both novel and classic. This pioneering work inspired a number
of ensuing studies in Berlin (Darius and Drepper, 1983, Poll, 2008, Köhler and Poll, 2010),
Osnabrück (Bossler and Suszka, 1988), on gravel roofs in Switzerland (Thommen, 1988), and
a few others that could not be accessed. The two most consistent communities will be
reviewed here.
1.4.2.1 Sedo-Scleranthetea (Dry meadow of sandy soils)
The Class Sedo-Scleranthetea (Br.-B. 55 em. Th. Müller 1961) was identified on all TPG and
gravel roofs, if only at shallow roof edges where the gravel layer is very thin (mean 68 mm)
(Bornkamm, 1961). EGRs never had enough associate species for a full community
classification (Thommen, 1988, Buttschardt, 2001). By definition, the Sedo-Scleranthetea
constitutes poor grassland of acid or siliceous and sandy soils upon which the vegetation
forms open or loosely covered stands that are usually two-layered and consisting primarily
of low-growing herbs, short-culmed and thin-leaved grasses, mosses and lichens (Ellenberg,
1986). The herbs are represented predominantly by succulents, in particular Sedum species,
and winter annuals. The TPG roofs surveyed featured a mix of species native to sandy
grassland and entisol with annual or short-lived species of field and ruderal communities.
This Class divides further into several sub-orders and associations, all of which are heavily
dependent on annual precipitation and fluctuate, accordingly, between prevalence of
annuals versus succulents and drought-tolerant mosses. Indicator species of the Sedo-
Scleranthetea include Arabidopsis thaliana, Arenaria serphyllifolia, Brachythecium albicans,

40
Ceratodon purpureus, Poa bulbosa, Rumex acetosella, Sedum acre, S. rupestre, S.
sexangulare, Veronica arvensis. Sub-orders and associations which were defined on
vegetated roofs – both spontaneous and EGRs – include the Order Sedo-Scleranthetalia (Br.-
B 55) (with indicator species Cerastium pumilum, Sedum album, Sempervivum tectorum) and
the Associations Alysso alyssoiidis-Sedion albi (Oberd. and Th. Müller 61) and Saxifrago
tridactylitis-Poetum compressae (Kreh 45) (Gehu and Leriq 57).
1.4.2.2 Poetum anceptis-compressae (Typical Poa meadow)
The typical Poa meadow is the definitive community of spontaneously vegetated TPG roofs,
covering the largest surface area of all roofs studied. In Göttingen and Berlin, it occurs on
loamy gravel ballasts over 100 mm deep (Bornkamm, 1961, Köhler and Poll, 2010). Further
south, Thommen (1988) and Buttschardt (2001) defined the Saxifrago tridactylis-Poetum
compressae sub-community. This community is defined by relatively dense meadow
dominated by the rhizomatous grass Poa compressa and scattered with ruderal species.
Closed swards of Poa compressa will exclude all other plants in depths above 150 mm while
depths less than 100 mm loosens up the grass to permit annual and ruderal species to
establish (Bornkamm, 1961, Buttschardt, 2001, Bossler and Suszka, 1988). In Berlin, Darius
and Drepper (1983) observed how Poa meadows converted to Saxifrago-Poetum
compressae at roof locations susceptible to erosion.
1.4.3 Natural succession on spontaneously vegetated gravel roofs
A study of natural succession on spontaneously vegetated gravel roofs concluded that the
various plant communities identified developed as a result of two factors, namely time since
installation and substrate depth (Thommen, 1988, p. 39). Similar to the tables developed to
predict species/ plant communities that would develop in different substrate depths, a two-
dimensional illustration of plant community development on gravel roofs in Switzerland are
shown as a combined effect of substrate depth and time (Figure 1.9). This illustration shows
that the earliest plant community type to emerge on sun-exposed gravel roofs can establish
gravel as shallow as 20 mm (the ruderal Conyzo-canadensis-Lactucetum serriolae), but that
this is soon overtaken by the Sisymbrietalia (or Dauco-Melilotion). From five years on, plant
community development on gravel roofs depends largely on the substrate depth, such that
depths up to 50 mm will support the Sedo-Sempervivetum ceratodontetosum while depths
from 30 to 90 mm will develop into the Saxifraga tridactylitis-Poetum compressae and (from

41
15 to 25 years) the Centrantho-Parietarion. After 40 years, gravel roofs with 40 to 150 mm
depth will support the Alysso-Sedetum (or Sileno-Cerastietum) while depths greater than 90
mm will support the Poetum anceptis-compressae (or meadow with annual grasses)
(Thommen, 1988).
Figure 1.9. Natural succession of plant communities on sun-exposed gravel roofs in Basel over time (years) and in various depths (cm). Modified from Thommen (1988) (p. 41).
By contrast, the old spontaneous TPG roofs surveyed in Berlin (Darius and Drepper, 1983)
and Osnabrück (Bossler and Suszka, 1988) did not exemplify any successional stages, and
those authors reported that the vegetation appeared to have been stable for decades. The
substrate of those TPG roofs been not been altered in any way since the 1950s (with
certainty in Berlin), and both studies concluded that these systems had established a steady
state of litter production, humus formation and mineralisation. The younger gravel roofs
surveyed as a TPG contrast in Osnabrück, however, were still in the early stages of very slow
humus formation, and the examined samples were very humus poor, likely because the
vegetation was limited to pioneering mosses and lichens (Bossler and Suszka, 1988). These
studies demonstrate the importance of substrate depth not only in determining species
composition on green roofs, but concurrently in driving natural succession and long-term
soil-based processes like humus formation.

42
1.4.4 EGR biodiversity research
Considerable ecological research on green roofs has studied invertebrates and habitat
potential of these systems for biodiversity. Since this dissertation is focused on the ecology
of EGR vegetation and substrates, this body of research will be reviewed because any fauna
will inevitably have some sort of impact. This field of research has recently arrived at a point
of scientific scrutiny, as well, through the examination of several of the hypotheses to the
biodiversity conservation value of EGRs (Williams et al., 2014).
1.4.4.1 Soil-dwelling invertebrates and microbes
The soil-dwelling invertebrates that become established in green roof substrates are
predominantly generalist cosmopolitan species of dry, exposed, disturbance-prone habitats
(Buttschardt, 2001, Schrader and Boening, 2006, Rumble and Gange, 2013, McGuire et al.,
2013, Madre et al., 2013, Jones, 2002), but these are apparently unstable and vulnerable to
population crashes (Rumble and Gange, 2013). Similar to plants, then, the living conditions
on green roofs also select invertebrate taxa that can tolerate high temperatures, low soil
moisture, and impoverished food webs. The abundance of springtails (Collembola) on two
EGR in London (UK) (between 6-7 years old) was also high, but were also shown to be
unstable and vulnerable to population crashes believed to be caused by high temperatures,
low soil moisture, and impoverished soil food webs (Rumble and Gange, 2013). These
studies indicate that while green roof substrates may support organisms involved in soil
food webs, the living conditions therein tend to select taxonomic compositions featuring
hardy, stress-tolerant species.
In their snapshot study (which used pitfall traps on a roof over 4 weeks in August 1982) of
two old TPGs in Berlin, Darius and Drepper (1983) found that the roofs had far higher counts
of Oribatid mites than ground-level green spaces, ranging from 10,000 to more than 25, 000
individuals/ m2 on the TPGs compared to only 3,000 individuals/ m2 at ground-level.
Snapshot samples of old extensive green roofs in Karlsruhe (six roofs between two and
seven years old) (Buttschardt, 2001) and Hannover (ten roofs between 7-15 years)(Schrader
and Boening, 2006) found an abundance of springtails, with higher densities on roofs than
ground-level reference habitats.

43
1.4.4.2 Mycorrhizal fungi
Experiments have shown that mycorrhizal fungi will readily colonize green roofs (John et al.,
2014, Heim and Lundholm, 2014, Molineux et al., 2014), and can be successfully inoculated
(McGuire et al., 2013). In New York City, a survey of ten experimental green roofs (150 mm
substrate and planted with a range of native species) found a diverse fungal community
spanning all the major phyla, though most were associated with disturbed environments
(McGuire et al., 2013). This study found high richness and abundance of arbuscular
mycorrhizae (AM), which have symbiotic associations with a variety of herbaceous plants
(e.g., facilitating greater access to nutrients and moisture) (Bardgett, 2005). Although AM
colonization levels were not quantified in that study, two Sedum roofs in London reported
increased root length (49% ±4) when colonized by mycorrhizal fungi with some individual
plants with root growth increased by 76% (Rumble and Gange, 2013). In Halifax (Nova
Scotia), a survey of an experimental green roof after four years observed mycorrhizal
colonization of the roots of some plant species (e.g., Danthonia spicata, Solidago bicolor)
although it was notably absent for others (Sedum acre) (John et al., 2014). A study which
involved the inoculation of different microbial groups into an experimental green roof in
London revealed that bacteria had greater biomass in shallower substrates while fungal
biomass varied with depth and substrate type (Molineux et al., 2014). The balance between
fungal-based and bacterial-based energy channels (Moore and Hunt, 1988) has major
implications on nutrient cycling, mineralization and succession due to the corresponding
regulation of trophic levels (Wardle, 2002). Soil organisms play fundamental roles to
decomposition, nutrient cycling, and the physical alteration of the soil environment (Lavelle
et al., 1995); more work on the microbial ecology of green roof substrates can offer a
clearer understanding of green roof ecology.
1.4.4.3 Surface-dwelling and highly mobile invertebrates
Surveys of various green roofs in Böblingen (Germany) and Linz (Austria) showed that
extensive green roofs were visited by flying insects (including bees and butterflies) and
spiders, while roofs combining elements of both extensive and intensive systems and
featuring depths from 100 to 400 mm supported much greater invertebrate diversity,
including snails, beetles, spiders and cicadas (Mann, 1996). This positive correlation
between heterogeneous substrate depths with invertebrate diversity has been
corroborated by studies in Basel (Switzerland) (Brenneisen, 2009) and London (England)

44
(Jones, 2002, Kadas, 2006, Kadas, 2011). The latter studies identified a remarkable number
of species found on green roofs with nature conservation designations. In the first three-
years of the Basel study, for example, 78 of the spider species identified were listed in the
Swiss red data book as being of conservation concern, with eight listed as potentially
endangered (Brenneisen, 2009). In London, a preliminary survey of eight extensive green
roofs (between 1 to 10 years old) recorded 136 species of invertebrates, of which some of
the noteworthy species were uncommon nationally and others were ‘nationally rare’ or
‘nationally scarce’ as defined by the UK red data book (Jones, 2002). A further study in
London found nationally rare and scarce spider species, as well as beetles of national
importance on Sedum-dominated extensive green roofs and on ‘brown’ or ‘biodiverse’ roofs
(Kadas, 2006). That study noted that species-richness continued to increase on the roofs
designed for biodiversity, but declined on the Sedum roofs (Kadas, 2011). Such findings have
not since been replicated by other published work, however.
With an interest in the processes that shape invertebrate assemblages on green roofs, a
study of forty green roofs and forty parks in Zurich revealed that community composition of
carabid beetles and spiders is influenced by local environmental conditions, whilst those
groups with comparatively greater mobility (including bees and weevils) are determined by
habitat connectivity (Braaker et al., 2014). The conclusion was that green roofs do offer
valuable habitat for many invertebrates and have the potential to function as ‘stepping
stones’, both for highly mobile and less mobile taxa. This study also suggests that enhancing
green roofs by diversifying local environmental variables can increase their ecological value
by enabling higher connectivity between green spaces (Braaker et al., 2014). By contrast, a
French study of more than 100 extensive green roofs found that the surrounding
environment exerted only a minor influence on composition, abundance and species
richness of four invertebrate groups (spiders, beetles, true bugs and hymenopterans)
(Madre et al., 2013). The latter group includes ants, which, although they don’t receive
much mention, have been observed in many studies. Ant species noted on green roofs
include Lasius niger and Formica cuniculari (Madre et al., 2013, MacIvor and Lundholm,
2011a), as well as Camponotus sp. (MacIvor and Lundholm, 2011a).
Structurally heterogeneous vegetation has been shown to support greater species richness
of invertebrates, especially bees (Madre et al., 2013, Tonietto et al., 2011). In Halifax
(Canada), plant species richness did not have a significant influence on insect diversity

45
(MacIvor and Lundholm, 2011b), but this was attributed to the small sample size (five roofs).
In Chicago, a survey comparing bee communities on six green roofs, six parks and six prairie
sites found that the green roof with the highest recorded bee species and individuals was
planted with prairie species and also had the highest plant diversity of all green roofs
(Tonietto et al., 2011). Recent work on an experimental green roof in downtown Toronto
suggests that native bees may be disadvantaged in cities with a prevalence of Sedum-
dominated green roofs because exotic bee species were observed to collect significantly
greater loads of Sedum pollen (MacIvor et al., 2014). Since bees are highly mobile and can
forage for flowers vertically between green roofs and at ground level, they are presumed to
benefit more from green roofs than other insect species (Braaker et al., 2014).
Varying the composition and depth of substrates seems to be key to improving the
ecological value of extensive green roofs for most organisms. Deeper areas can serve as
refuge from high temperature and low soil moisture (Buttschardt, 2001, Rumble and Gange,
2013), while the inclusion of features like stones, dead wood, ephemeral pools and nesting
materials can provide habitat opportunities (Mann, 1996, Brenneisen, 2009). Greater depths
also provide the resources for more structurally diverse vegetation, which benefits other
organisms. Ideally, the construction and design of a green roof should take into account the
wildlife and habitats of the surroundings as well as the specific conditions of the exposed
space on top of buildings (Braaker et al., 2014).
1.4.4.4 Do EGRs support biodiversity conservation?
A recent review of EGR biodiversity research (Williams et al., 2014), which examined six
unstated hypotheses in this literature, agreed with one hypothesis, namely that “EGRs have
greater organism abundance and species diversity than conventional roofs”. However,
insufficient empirical basis was found to support the hypotheses that “EGRs can support
species diversity, composition and abundances of organisms comparable to ground-level
habitats”, that “EGRs designed specifically to support native organisms support greater
species diversity and abundances than standard EGRs” or that “EGRs can replicate ground-
level ecological communities”. This study warned about the generalisation of the hypothesis
that “EGRs can aid rare species conservation”; available evidence confirms that some, but
not for all, rare taxa can benefit from EGRs. Lastly, while evidence has shown that flying
organisms will use EGRs as habitat, this review warns that the hypothesis “EGRs can
facilitate movement of organisms through urban landscapes” must take into account the

46
broader landscape. The authors of this critique concluded that EGRs may help achieve the
conservation goals for urban biodiversity, but that the goals need to be realistic, well-
defined and measured to evaluate success, just like ecological projects at ground-level.
1.5 Research questions and aims
This research strives to describe and understand how EGR systems develop over time, using
vegetation and substrate as ecological indicators. Understanding their ecology may reveal
their true contributions to the built, social and natural environments over the long term.
Although related, the disciplines of plant-, community-, soil-, and urban ecology have not
given green roofs much consideration; this work may therefore also illustrate opportunities
for integrating ecological green roof research with these and other disciplines. This work
therefore addresses the gap in plant ecology research on EGRs through its methods and
preliminary findings. With the ambition of contributing to the nascent foundations of
ecological query on green roofs, this work strives to advance and align green roof research
and practice with the various disciplines and proponents of urban ecology. The initiation of
progressive approaches to green roof research, practice and policy can help to improve the
quality of life in urban environments and beyond, for all organisms.
1.5.1 Research aims
To characterise mature EGR vegetation in terms of life form cover abundance and species diversity.
To characterise EGR substrate development > 20 years after installation.
To identify plausible ecological theories or models which describe the processes that occur on EGRs over time
To propose models illustrating and predicting vegetation development on EGRs over time.
1.5.2 Research questions
If successional changes can be observed on EGRs, what are the main drivers and mechanisms?
Do emergent community characteristics result with time, such that roofs with similar properties have similar species composition/ abundance/ diversity?
Do EGR substrates retain their recommended properties over time, as specified by the FLL?

47
2 Vegetation development on extensive green roofs over time
This chapter opens the query of how EGR vegetation and substrates develop with time. The
commercial ideal would have all the originally chosen species persist and multiply, with any
gaps filled by these and other desirable species to create a species-rich tapestry that lasts
for decades with minimal maintenance. Indeed, the species selected by the early green roof
pioneers took ecological reference from plant communities of analogous environmental
conditions whose species-richness is maintained by disturbance in plagioclimax (e.g., dry
grasslands) with the aim of achieving this type of vegetation. Many species from these
original lists remain popular for EGRs around the world, yet little is known of their long-term
performance nor how species diversity and composition develop on EGRs over time or
under varying conditions. If EGRs are intended as green infrastructure solutions for an
increasingly urbanising planet, then understanding the long-term performance of their
vegetation and substrates is imperative.
The industry partner on this project, one of the first EGR system manufacturers in Germany,
ZinCo GmbH always wanted to know how the vegetation on its earliest systems had
evolved. This PhD research was uniquely positioned to examine this question. The author’s
spoken and written fluency in German greatly facilitated the work, not to mention
familiarity with the region through connections with the University of Hohenheim and with
the green roof community. ZinCo was able to locate a number of old green roofs and to lift
the usual barriers of physical access (through building contacts) and access to background
information for some of them. In addition, an interview was arranged in June 2010 to meet
the company’s first green roof installer, Thomas Hövekamp, in order to gain more
information on the roofs surveyed and details on any of the surviving documentation. Since
1990, Hövekamp has been running a small business that is specialised in green roof
installation (GrünDach Technik Systems GmbH).
2.1 Literature review: plant ecological surveys of mature green roof vegetation
Surveying well-established green roof vegetation using ecological methods is scarcely
represented in green roof research, though some examples do exist. A small body of work

48
has examined vegetation development on spontaneously vegetated TPG roofs in different
German cities, including Göttingen (Bornkamm, 1961), Berlin (Darius and Drepper, 1983,
Poll, 2008, Köhler and Poll, 2010), Osnabrück (Bossler and Suszka, 1988), and on gravel roofs
in Switzerland (Thommen, 1988). In the case of TPG roofs, they were apparently not
intentionally seeded or planted (Buttschardt, 2001, Göbelsmann and Hippert, 2004, Grant,
2006, Adler, 2005) though some may have been laid with sod (Köhler, 2006, Poll, 2008).
On TPG roofs in Göttingen, Bornkamm (1961) found that recently installed roofs were first
colonized by annuals (also known as ruderals or therophytes), but that this cover decreased
after about ten years as the dominant grass, Poa compressa, expanded in cover. In Basel,
Thommen (1988) was interested in the succession of a similar roof type, based by sand and
varying depths of gravel ballast. Substrate depth was deemed a crucial factor, but climate
was ultimately treated as the primary cause for differing directions of succession. Figure 2.1
illustrates the various plant communities on those roofs in the dry-warm climate of Basel.
Figure 2.1. Species assemblages for different gravel depths in Basel after 20-30 years. Modified from Thommen (1988).

49
In the early 1900s, Berlin had around 2,000 TPG roofs of which 50 survived the wars and ten
survived the renovation trend of the 1980s (Adler, 2005, Arhendt, 2007, Poll, 2008). By the
start of the new millennium, the undisturbed surfaces of these remaining TPG roofs had
become wild meadows, having been colonized by seed dispersal (Köhler, 2006). Since the
sealing compound of these roofs consisted primarily of tar, which also functions as a long-
term root repellent, these roofs remained leak-proof, and the aerated construction of the
roof guaranteed long-term impermeability, too.
The longest-running study of EGR vegetation describes nineteen years of data from two
roofs (sampled twice per annum) evaluating how plant species richness is affected by roof
area, slope, age, water availability and other factors (Köhler, 2006). Installed in 1985, the
Paul-Linke-Ufer (PLU) green roof was the first inner-city residential project in Berlin
integrated with a monitoring program of the numerous environmental technologies, which
included an EGR subdivided into ten sections (total 650 m2). Prototypic pre-cultivated
vegetation mats on the PLU were placed onto 100 mm substrate (expanded clay, sand and
humus). The second site, Ufa-Fabrik, was installed with three EGRs (total 2,000 m2) between
1986 and 1990, with 100 mm substrate (sandy garden soil, 10% expanded clay) and seeded
with alpine wildflower meadows. This study found that species numbers fluctuated
significantly depending on moisture availability, whether irrigated (provided during
establishment and then stopped) or precipitation patterns. For example during a dry month
(June 1998) eight species were found compared to twenty-five species during wet periods
(June 1987 and May 2005). Species richness was also attributed to the proximity to green
spaces that were sources of the propagules of colonizing species, as well as the provision of
shade for a variety of exposures. That study found that five species persisted over time and
were present every year (Poa compressa, Festuca ovina, Sedum acre, Allium
schoenoprasum, Bromus tectorum), and that some of the initial annual pioneers and weeds
(from 1986) had disappeared by 2005.
A study aiming to understand the development of roof vegetation and substrates over time
united the findings from three studies of TPGs and four of EGRs (Köhler and Poll, 2010). The
EGRs were all built in the 1980s in Berlin (Baier, 1988; Blödorn and Krause, 1992; Jänel,
1996) (these papers could not be accessed), and the TPGs were up to 100 years old. One of

50
the three TPG datasets was from Berlin (Darius and Drepper, 1983), the others were from
Göttingen (Bornkamm, 1961) and Osnabrück (Bossler and Suszka, 1988). With respect to
species diversity, the meta-analysis found that old extensive green roofs (from the 1980s)
supported around seventy species, whereas the older TGP roofs supported around forty-five
species. The authors attributed this disparity in diversity to the initial plantings as well as the
different growing substrates and systems. The north-facing aspects had the most plant
cover and diversity compared to roofs with other exposures, such that roofs facing east and
south were dominated by Sedum species, whereas the other most dominant species, Allium
schoenoprasum, had its highest abundance on west-facing roofs where grasses were most
poorly represented. With respect to these findings, this study recommended that south- or
south-east facing roofs are better used for purposes other than roof vegetation, such as
solar panels.
Long-term observations of EGR vegetation have been conducted in other parts of the world,
too, though not for as long as the studies described above. In Sheffield (UK), the species
composition of fifteen herbaceous perennial and grass species were observed over five
growing seasons on eighteen (roof-level) test beds featuring varying treatments (depth,
irrigation) and replications (Dunnett et al., 2008). This study found a major divergence in
plant responses owing to the two depths (100mm and 200 mm), in that the majority of the
taxa (11 of 15) maintained their numbers in the deeper substrate, while the shallower depth
only supported four taxa over time. In addition to the greater density of plants per unit area
at 200 mm, those plants also tended to be significantly taller, were wider spreading and
flowered twice as long as individuals from the same taxa growing in the shallow substrate
(100 mm). Total biomass was also greater in deeper substrate (200mm), but species
richness and diversity were greater in the shallower depth, which the authors attribute to
the reduced vigour of planted species in 100 mm of substrate and the greater proportion of
bare surface for colonizing species to establish in. Indeed, the main differences between the
two depths arose from the greater proportion of wind-blown herbs in the shallow substrate
(100 mm).
In the USA, a study of twenty-four raised roof platforms in East Lansing (Michigan) found
that only six of the original twenty-five species were still alive in all substrate depths (25, 50,

51
and 75 mm) after seven years (Rowe et al., 2012), and that absolute cover amongst the
surviving species only varied in the deeper substrate. At 50 mm and 75 mm, Phedimus
spurius and Sedum middendorffianum were the dominant species, while the succulents
Sedum acre and S. album covered the most area in 25 mm. A study of two ‘brownfield’ roofs
in Birmingham (UK) showed that substrate moisture seemed to be the most limiting factor
controlling plant growth (Bates et al., 2013). In spite of the lower water availability in 2010-
2011, mosses and Sedum acre had the most sustained expansion of cover throughout the
four-year study period. Indeed, mosses and Sedums are exceptionally resilient to limited
moisture in green roof habitats (Emilsson and Rolf, 2005, Nagase and Dunnett, 2010). As in
the other studies, these researchers also associated decline in cover with exposure, as this
trend was less pronounced in areas that offered some shade and shelter from wind.
2.1.1 Research aims and questions
Vegetation and soils are the foundation of terrestrial ecosystems, as they determine the
biotic composition and higher levels of organisation within that system (Cilliers and Siebert,
2011), like food webs and trophic structures (Barbour et al., 1999). Plant species diversity
can therefore be treated as a key determinant of biodiversity in general and as an important
influence on ecosystem function, even though the relationship between the latter is not
linear (Cardinale et al., 2012). Indeed, since any species represents a “package” for all the
genetic and trait variation that influences the metabolism and function of an organism
(Cardinale et al., 2012), species richness is a layered and complex measure of biodiversity.
This research uses measurements of vegetation and soil in order to determine the ecological
function that extensive green roofs maintain twenty to thirty years after installation. This
chapter therefore addresses one aim and one question of the research.
Aim: To characterize mature EGR vegetation in terms of growth form cover and species diversity.
Question: If successional change can be observed on EGRs, what are the main drivers & mechanisms?
Satisfactory explanations to these will be gained over this and ensuing chapters. In order to
help direct their continuous resolution, this preliminary chapter will focus on some clearly
defined objectives.

52
2.1.1.1 Objectives of the chapter
The objectives for this chapter involve the examination of several relationships:
Relating the cover of growth forms and species diversity on old EGRs
Relating EGR vegetation development with time (roof age)
Relating EGR vegetation development with abiotic/ environmental conditions
Relating EGR vegetation development with substrate characteristics
2.2 Methods
Since the green roof industry began in south-west Germany, the oldest roofs are located in
this region, within 50 km from the city of Stuttgart (Figure 2.2). South-west Germany, the
warmest part of the country, is typified by a continental climate in which summers often
feature hot periods of > 30°C temperatures and winters may feature extended periods of
cold and snow (Wikipedia contributors, 2014). The sample was restricted to old roofs in this
region that could be easily accessed. In addition to six of ZinCo’s oldest EGRs, three non-
ZinCo green roofs were sampled, for a total of nine EGRs ranging from 20 to 33 years since
installation. Knowledge of and contacts for the non-ZinCo roofs were gained through the
network of green roof professionals. Most notably, the author had known John Döveling
(Stuttgart Dept of Cemetaries, Gardens and Parks and based at Killesberg) for several years
and had visited the roof at Killesberg with a green roof study tour in 2008 and 2012 (Green
Roof Safari). In addition to that roof, Döveling connected the author with the manager of
the roofs of Stuttgart Rathausgarage complex.

53
Figure 2.2. The EGRs surveyed are in south-west Germany, within 50 km from Stuttgart city centre.
2.2.1 Description of the roofs surveyed
Roof selection was determined by availability of accessible old roofs located within the same
climatic region. The roofs surveyed included a range of construction types, including both
pitched and flat, some with partial shade and others with none. This diverse selection
presents opportunities for description although it also poses challenges to analysis. Table
2.1 presents the roofs, in the order of age, with reference to their physical constructions
(area, slope, depth) and environmental conditions (aspect). Figure 2.3 provides visual
impressions in the same order. In spite of their differences, the roofs are all based by typical
EGR substrates (i.e., mineral: organic ratio; under 100 mm deep), use multiple-layered
systems, and feature dominant Sedum coverage with varying cover by flowering herbs and
grasses. While the species-poor roofs consisted mainly of Sedum, the more diverse roofs
featured taller forbs and grasses over a base layer of Sedum, termed Sedum meadow. Some
of the roofs featured prototypic systems and/ or materials, some of which became
commonplace to the green roof industry while others were not taken up. In addition to the
brief descriptions here, Appendix 1 provides more detailed information on the roofs.

54
Table 2.1. Details of nine old EGRs sampled over two growing seasons (2010, 2011) in Stuttgart region. Data for substrate depth is displayed as the mean ± the standard error.
Roof name (in order of age)
Year Installed
Area (m2)
Slope (°) Aspect Depth (mm)
Killesberg 1991 450 30 N- and S-face 84.67±0.68
S-Rathausgarage, lower 1990 1000 0 none (flat) 69.71±0.71
S-Rathausgarage, PV 1990 1300 0 none (flat) 75.24±2.94
FH Nürtingen 1987 258 0 none (flat) 72.29±4.19
Römermuseum, Köngen 1987 350 17, 15 NW-SE-facing
78.13±5.61
Gärtnereihof Tübingen 1986 2160 15 N- and S-face 61.48±0.60
Esslingen VB Area 1 1986 1860 0 none (flat) 53.33±0.46
Esslingen VB Area 2 1986 2064 0 none (flat) 58.11±0.64
Pliensaufriedhof 1977 500 0 none (flat) 61.56±0.59
Figure 2.3. The nine EGRs sampled in southwest Germany were constructed between 1977-1991 and are arranged in order of increasing age from the top-left.

55
2.2.1.1 Pliensaufriedhof (1977)
The oldest roof surveyed, at Pliensau cemetery, is based by a 70 mm water retention
drainage board, and is planted with Sedums, small shrubs and grasses. Although it is
technically a simple intensive green roof (FLL, 2008), and a section of the roof was planted
with Teucrium chamaedrys and Festuca ovina, its substrate depth and Sedum-dominated
vegetation are equivalent to EGRs. Original documentation from ZinCo reports the use of a
“Systemerde Dachgarten” (Technical roof garden soil) but the details of its composition are
not specified. A contact from ZinCo suggested it was probably a blend involving topsoil,
since technical aggregates were not available at the time of its construction, but that it likely
adhered with the FLL recommendations to a degree (Appl, 2014). This roof is located on a
ridge overlooking the Neckar valley, and receives partial shade from neighbouring pines in a
sheltered, park-like environment. Skylights and a path intersperse the dense Sedum cover,
and a few mounded anthills were perceptible beneath the smooth carpet of Sedum (Figure
2.4).
Figure 2.4. Facing north on the roof at Pliensaufriedhof.
2.2.1.2 Esslingen Verkehrsbetrieb (two roofs: Areas 1 and 2) (1986)
Next in age, two EGRs at Esslingen bus depot (Verkehrsbetrieb) are interspersed by roof
shafts that are long and cover the length of the roof (VB Area 1) or smaller and more spaced

56
(VB Area 2). These roofs were Thomas Hövekamp’s first green roof installation (May-June
1986) and were based by 100 mm expanded clay (which was pumped up) and 10-20 mm
organic substrate. Interspersed in geometric design and buried to be flush with the
substrate surface, 3,000 styrofoam “Floraterra” modules, pre-grown with Sedums and
Thyme, were used to create instant green and visual interest by geometric placement; these
did not succeed as a commercial product. Other than a conversation with the original
installer (Hövekamp, 2010), no information was available for this roof complex. Beyond
permitting access, site staff had no interest in it. These roofs have the largest surface area of
all the roofs surveyed (1, 860 m2, 2, 064 m2, respectively). Being located in a dense industrial
zone, they do not receive any shade from neighbouring features (Figure 2.5).
Figure 2.5. Aerial view of the two roofs at Esslingen Verkehrsbetrieb. Image courtesy Google Maps.
2.2.1.3 Gärtnereihof Tübingen (1986)
The EGR installed on the facilities for Tübingen’s Department of Gardens and Landscape
(Gärtnereihof) (1986) was the first pitched roof of its kind. As a result of negotiations with
ZinCo, the original plan to have grass turf unrolled on both aspects was changed to limiting
grass turf to the north-face and planting drought-tolerant taxa on the south-face.

57
Apparently, the grassy side steadily declined in cover. After the Department took over the
roof maintenance (1988), the Head Gardener oversaw staff efforts to gradually fill in the
gaps of failing grass with Sedum from the south-face (Braun, 1992). Additional background
information for this roof includes correspondences (e.g., with FH Nürtingen), ZinCo
brochures, and the results of a substrate analysis six years after installation (Sailer-Schmid,
1993). The original specifications of substrate composition and species lists are uncertain,
however, because the only documentation found is a sample invoice that was never
completed. The base of the north-facing roof is in contact with the canopy of an adjoining
row of trees, while the south-face is totally exposed (Figure 2.6).
Figure 2.6. Facing north-east on the roof at Gärtnereihof Tübingen.
2.2.1.4 Römermuseum at Köngen (1987)
In Köngen, the Roman Museum (1987) was another first for pitched roofs, this one more
steeply and irregularly sloped than Tübingen (Figure 2.7). The architects’ vision for the
building, which reflects the dimensions of a Roman fort, was for two asymmetrical, triangle-
shaped green roofs to portray the ground under which visitors must pass in order to explore
the site’s history. The green roofs were fitted with wooden frames to prevent the substrate
from slipping. Documentation from ZinCo reports that both roofs were uniformly planted
with Sedum cuttings and an herb-grass mix, and installed with 50 mm substrate, but the
original installer remembers 70-80 mm (Hövekamp, 2010). The smaller (70 m2) north-facing
roof (15°) is relatively low to the ground (3-5 m) and partially sheltered by the row of trees
beside the building to the north-west and by the 3 m wall which supports the larger (230

58
m2), south-facing roof (17°). The latter is more exposed due to its higher elevation (3-30m
from ground-level), aspect, and lack of shade. A generic product sheet for
“Dachgärtnerenerde” (roof garden soil) associated with this roof indicates 39% expanded
shale, 15% volcanic clay (Vulkaton), 23% bark compost and 23% rice husks.
Figure 2.7. The Römermuseum in Köngen features a south-facing roof (left) and a smaller, lower roof facing north (right).
2.2.1.5 FH Nürtingen (1987)
The small EGR at the technical college in Nürtingen is easily observed through the windows
of its adjoining wall that faces north (Figure 2.8). It is neatly enclosed by another wall facing
east and by a parapet (1.5m). With landscape gardeners from the institute’s botanical
gardens based in the neighbouring building, FH staff expected the green roof and its
vegetation would be keenly observed for many years. Unfortunately, already after the first
five years, maintenance had been reduced to annual mowing and removal of biomass, and
no documented observations were made beyond the initial planning phase (Hüttenmoser,
2010). According to a sales receipt, the substrate comprised 80 L technical soil
(“Erdsubstrat”), 60 L each of expanded shale and Floraperl (an expanded aggregate) and 2.2
tons of moraine sand. In addition to the predominant Sedum meadow character, the shaded
zone from the adjoining wall supported a unique flora including woodland mosses and herbs
as well as a colony of Common spotted orchids (Dactylorhiza fuchsii). Apparently a single

59
orchid appeared in in 2000, and by 2010 a colony of 30 individuals had self-established
(Hüttenmoser, 2010). Unfortunately, the perimeter of this roof was destroyed a few months
after being surveyed, as it was held responsible for water damage in a lecture hall below.
Figure 2.8. Aerial view of the small roof sampled at FH Nürtingen. Image courtesy Google Maps.
2.2.1.6 Stuttgart Rathaus Parking Garage: PV and lower roof (1990)
In Stuttgart City Centre, the parking garage complex for the City Hall (Rathaus) consists of
two roofs (Figure 2.9), one with a row of PV panels (Rathaus PV) and a lower roof (Rathaus
lower) that receives some shelter from the PV roof and from neighbouring buildings.
Although predominantly covered by Sedum meadow, these roofs also feature mounds that
support higher statured plants (e.g., Yucca spp.). As shall be described in the methods, the
mounds were not sampled. Installed between spring and autumn 1990 with seed, pre-
grown plants and cuttings, these roofs were a pilot project with the intent to educate
councillors and others in order to gain support for the city’s green roof initiative. From 1992
until 2008, the roofs were maintained once per year, typically end-June to early July.
Maintenance ceased in 2008, as the parking facility was scheduled for demolition, but the
financial crisis of 2009 prevented this from happening. By summer 2011, the City was still
trying to decide what to do with the building.

60
Figure 2.9. Aerial view of the two roofs at Stuttgart Rathausgarage. Image courtesy Google Maps.
2.2.1.7 Stuttgart Killesberg (1991)
At Stuttgart Killesberg, a pitched Sedum meadow sits atop the City of Stuttgart’s
Department of Gardens, Cemetaries and Forests, but initially served as the headquarters for
the International Garden Exhibition (IGA) in 1990, during which time the green roof served
for demonstration. The contact person for accessing this roof had initiated and managed
Stuttgart’s green roof incentive and support program for nearly twenty years (Döveling,
2009) and was keenly interested in this research. According to architectural plans, this roof
was seeded with the same seed mix as the Rathausgarage roofs in July 1991. Herr Döveling
recalled that the substrate blend involved some topsoil (verbal communication), but no
records were available. A drip line ran the length of the roof peak and irrigation was
provided for the first three months. Due to the steep slope (Figure 2.10), substrate samples
were not collected from this roof although depth measurements were taken concurrent
with floristic sampling.

61
Figure 2.10. The roof at Killesberg features a clear north-south gradient.
2.2.2 Background and original information
Background information with original specifications was only available for some roofs, in
some cases from ZinCo GmbH (Köngen, Pliensau, Tübingen) or from buildings in which
interested staff had retained documents (FH Nürtingen, Tübingen, Killesberg). Some roofs
had technical drawings that included reference to species lists and substrate depths
(Köngen, Rathausgarage complex). Written documentation for four roofs (Köngen,
Tübingen, Verkehrsbetrieb roofs) were complemented by an interview with Thomas
Hövekamp who established ZinCo’s installation team in 1984. The two Verkehrsbetrieb
roofs were his first-ever installation, followed by Köngen and Tübingen. Written
documentation for these roofs, which he signed and/ or authored, was therefore extended
by his memory which included actions that were not documented (e.g., depth specified
versus depth installed). Other personal information gained on the roofs in question included
conversations with Frau Beate Hüttenmoser had just started working FH Nürtingen when
that roof was initially installed and who kept all the records. The former manager at
Tübingens Garden Department, Herr Braun, left several years’ worth of detailed work
records and observations of that green roofs vegetation development. Finally, information

62
on the Killesberg roof was forthcoming from John Döveling, who had observed it closely
since its installation.
Records from the oldest roof (Pliensaufriedhof) indicate probable observance to the
recommendations that eventually became akin to industry guidelines (FLL) and, since the
other roofs were all built during the time of the FLL guidelines, it is assumed that they
adhered to those specifications. This pertains mainly to the substrate properties, such as soil
pH between 6.5 and 8.0, soil organic content below 65 g/L, and substrate depth less than
200 mm. Even if the materials and methods were not yet established in those early years of
the industry, such as substrate components, it is possible that the materials used would
have satisfied the guidelines which were nascent recommendations at the time (Appl,
2014). Maintenance contracts for all the roofs had not been renewed about 10 years before
the surveys were conducted (Hövekamp, 2010, Starke, 2010, Hüttenmoser, 2010, Heller,
2011). However, given that some of these roofs are easily accessible (e.g., door-access to FH
Nürtingen, permanent ladder at Pliensaufriedhof and Tübingen) and located on buildings
associated with gardening departments (same roofs), independent maintenance in the form
of weeding cannot be ruled out entirely. Typical EGR maintenance includes weeding,
planting, fertilization, and irrigation (FLL, 2008).
2.2.3 Sampling methods
Primary survey methods with ecological objectives were used in order to describe the
vegetation and substrate of these EGRs. Sampling plots were defined using a 1m2 quadrat,
with between 12 and 18 quadrats per roof. The number and placement of quadrats was
determined by site conditions, vegetation homogeneity, environmental gradients, and the
statistical requirements of sampling (Kent and Coker, 1994). The random placement of
quadrats gives any point within the sampling area an equal chance of being sampled (Kent
and Coker, 1994). Since the aim of this work was to characterise EGR vegetation, quadrats
were sampled from areas based by EGR system constructions (e.g., depth) and therefore
featuring characteristic vegetation. Random placement was too simplistic for roofs with
mounds or shallow gravel edges, where the vegetation differs from the greater roof
expanse, so roof vegetation in those cases was stratified in advance of sampling. Stratifying,

63
or dividing, vegetation into homogeneous (uniform) versus heterogeneous (non-uniform)
patches prior to placing samples is beneficial for clustering major sources of variation (van
der Maarel, 2005). This and related sampling approaches are described per roof in the
section that follows.
2.2.3.1 Random sampling at systematic intervals (FH Nürtingen)
The vegetation of the small roof at at FH Nürtingen appeared to be completely uniform with
no obvious gradients, except for gravel edges, a few ant mounds and two skylights, sothe
roof was divided up length-wise by intervals of approximately 4.5 m and quadrats were
located along these intervals, for a total of 8 transects running the width of the roof (Figure
2.11). Quadrats were placed roughly every 3 m, following the length of the transects but
keeping clear of edges and structures.
Figure 2.11. Layout of quadrats in systematic interval sampling at FH Nürtingen.
2.2.3.2 Random sampling along transects (Köngen)
For the triangular shaped, pitched Sedum roofs in Köngen, a grid of transects was prepared
in advance of sampling along which quadrats were then randomly located (Figure 2.12).
Transects permit the description of maximum variation across an environmental gradient
and covering the shortest distance (Kent and Coker, 1994) In this case,the transects ensured
that the whole of the roof would be sampled (with the exception of the gravel edges). The
larger south-facing roof was surveyed with 13 quadrats and 5 quadrats sampled the north-
facing roof.

64
Figure 2.12. Quadrat placement at Köngen followed random sampling methods on a grid of transects for the two roofs.
2.2.3.3 Stratified random sampling (Pliensaufriedhof, Esslingen VB roofs, Stuttgart
Rathausgarage roofs)
Given the uniformity of the dominant roof vegetation and the clear distinction of this from
other planted forms, like mounds, stratified sampling methods helped to direct random
quadrat placement within the uniform vegetation. . In those cases, the physiognomic groups
present were defined first (e.g., succulent cover as distinct from shrubby mounds), and
sampling then followed for the vegetation of interest (i.e., EGR vegetation) through the
random placement of quadrats within the designated area. Thus, the Sedum dominated
areas on Pliensaufriedhof, the Esslingen Verkehrsbetrieb roofs and the Rathausgarage roofs
were randomly sampled with care taken to avoid gravel edges and non-uniform patches
featuring shrubby mounds, skylights or PV panels. The example of this approach is shown
for Rathaus PV in Figure 2.13.

65
Figure 2.13. Quadrats were randomly placed at Rathaus-PV following stratification, which avoided the vegetation of mounds and edges.
2.2.3.4 Transect sampling on pitched roofs (Tübingen, Killesberg)
Slope and aspect create visually obvious environmental gradients on the pitched roofs at
Tübingen and Killesberg, so these roofs were sampled using transects, avoiding roof edges
and any non-uniform vegetation. In Tübingen, for example, four randomly designated
transects were lain from the roof peak with two randomly located quadrats placed
symmetrically per aspect (i.e., at the same distance from the roof peak) (Figure 2.14). In
transect 1 (T1), quadrats 1 and 2 were randomly designated 6 m and 2.5 m from the roof
peak on the south-facing slope, so quadrats 3 and 4 on the same transect were located at 6
m and 2.5 m from the peak on the north-facing slope. Similarly, five randomly selected
transects were lain across the ridge of the Killesberg roof but, due to window gables which
interrupt the roof surface, only three transects ran the full width of the roof. These
systematic samples were as randomly placed as the quadrat they reflected on the opposite
slope.

66
Figure 2.14. Transects and systematic random symmetric quadrats were used at Tübingen and Killesberg.
2.2.4 Data collection
The surveys took place over two growing seasons (2010, 2011), with each roof sampled
once for vegetation and substrate, sometimes over the course of several days (Table 2.2).
Given the singular frequency of surveys per roof, they will sometimes be described as
“snapshot surveys” because the quality of the data is like that of a photograph: colourful
and detailed but static to that particular moment in time. In order to provide the option for
return sampling, the corners of all sample plots were marked with permanent labels and
detailed maps were prepared which illustrate quadrat locations.
Table 2.2. Sampling details and dates for nine old EGRs in south-west Germany.
Roofs in order surveyed Year Surveyed
Date of floristic sampling
Date of substrate sampling
Total # quadrats
Gärtnereihof Tübingen 2010 24 June, 7 July 14 October 16
FH Nürtingen 2010 2, 6 July 11 August, 11 October
12
Römermuseum, Köngen 2010 8, 12 July 13 October 18
Pliensaufriedhof 2010 9 July 13 August 15
Esslingen VB Area 1 2011 9, 10 June 6 September 14
Esslingen VB Area 2 2011 14, 15 June 5 September 14
S-Rathausgarage, PV 2011 8, 11, 12 July 8 September 15
S-Rathausgarage, lower 2011 12, 14, 15 July 9, 12 September 14
Killesberg 2011 7 June N/A 18

67
2.2.4.1 Floristic sampling
Methods on sampling and describing vegetation referred to the National Vegetation
Classification Users’ handbook (2006). Floristic description was accomplished using the
traditional tool of quantitative plant ecology, a 1 m2 quadrat (Braun-Blanquet, 1932,
Mueller-Dombois and Ellenberg, 1974). Floristic sampling occurred from mid-June to mid-
July and substrate collection occurred in late-summer or early-autumn from the same
quadrats, immediately following removal of above-ground biomass (this data was not used).
Plants falling within sampling quadrats were identified to the level of species and also
grouped into physiognomic growth form groups.
2.2.4.1.1 Percent cover
For every plant recorded in a sample, an estimate was made of its quantitative contribution
to the vegetation. Cover is a measure of the vertical projection on to the ground of the
extent of the living parts of a species (Rodwell, 2006), and describes how much of a species
or growth form is present in a sample, irrespective of how frequently the species is
encountered in other samples. Using the Domin cover thresholds (Figure 2.15), cover was
visually estimated per quadrat for various levels of detail, notably individual species and
growth form groups (%). The latter was estimated as the percent cover of the group as a
whole, and not as the sum of cover values of individual species. Using terminology of
vegetation description, abundance can be referred to as ‘dominant’, or ‘prominent’ and
‘abundant’ where there is high cover but no real dominance. For low cover, expressions
such as ‘sparse’ are used (Rodwell, 2006). Even within vegetation that is not conspicuously
layered, total cover values can exceed 100% because of structural overlap of the plants. This
overlap was included in some of the analyses, however, because it gives a fuller description
of the vegetation sampled.

68
Figure 2.15. Visual interpretation of Domin cover/ abundance thresholds. In the diagrams, each sub-square has the same total area of black. The top left diagram, for example, has 10% black in each sub-square. Modified from Rodwell (2006).
2.2.4.1.2 Growth forms
With the objective of describing different landscapes through plant physiognomy, various
classification systems for describing plant “life forms”, "growth forms" or "basic forms" have
been developed since von Humboldt (1806). Growth form is a purely morphological term, as
influenced by the environment, as opposed to “life form”, which is more encompassing and
broad (Mägdefrau, 1982). Since growth form describes the overall character of a plant this
shall be used here. Although it has been revised and modified by various authors, the main
structure of Raunkiaer's (1934) ecologically oriented system of classification makes it the
most widely applied scheme, whereby growth forms are defined by the position of the buds
(or organs from which new shoots or foliage develop after an unfavourable season)
(Mueller-Dombois and Ellenberg, 1974). In brief, Raunkiaer (1934) relied primarily on winter
characteristics and based his system on bud position:
phanerophytes (phanero = visible): buds at tips of branches (usually trees), associated with moist, warm environments;
chamaephytes (chamae = dwarf): buds near soil (shrubs and herbs), associated with cool, dry climates;
hemicryptophytes (hemicrypto = half hidden): buds die back to ground in winter; associated with cold, moist climates;
cryptophytes (crypto = hidden): buds buried by soil; associated with cold, moist climates;
therophytes (thero = summer): no buds but emphasis rather on seed production (i.e., annuals); associated with deserts and grassland

69
On the basis of their similarities in structure and function, species and individuals can be
grouped into classes which display obvious relationships to important environmental
factors. Since growth forms like grasses, shrubs and forbs represent different life history
strategies, resource use patterns, and suites of environmental adaptations, growth form
diversity can also be considered a coarse surrogate for the functional diversity of a plant
community (Lavorel and Garnier, 2002, Lundholm et al., 2010). Grouping species has the
drawback of masking the variation of ecological strategy within each group, but it can also
reveal important environmental factors influencing the structure of the vegetation. Viewing
plant communities as assemblages of functional types rather than species brings several
advantages: community complexity can be reduced without compromising the loss of
processes; processes are clarified, and modelling is greatly facilitated (Colasanti et al., 2001).
Likewise, treating large numbers of species individually can hinder the analysis and
interpretation of the broader functional aspects of the vegetation (van der Maarel, 2005).
Joenje and During (1977) showed that there is a strong correlation between growth form
and life strategy. For the purpose of this work, EGR vegetation was divided into
physiognomic groups with general consideration of plant strategies (Table 2.3). For
instance, although they qualify as forbs, succulents were treated as a distinct growth form
because of their unique structures and strategies. Succulents are popular on EGR plant lists
around the world (Snodgrass and Snodgrass, 2006) and many species/ cultivars from the
most prevalent genus, Sedum, can tolerate extreme conditions yet perform well in
favourable conditions (Durhman et al., 2007, Thuring et al., 2010). Shallow substrate depths
tend to limit the number of species that can survive on EGRs, but Sedums create reliable
vegetation cover which absorbs moisture, prevents erosion, inhibits colonisation, and
requires hardly any maintenance (Dvorak and Volder, 2010).
Table 2.3. Species were grouped into physiognomic growth form groups
Growth form Vegetation type
woody trees, shrubs, sub-shrubs
graminoid grasses, sedges
succulent succulent and crassulacean species
forb herbaceous flowering plants
geophyte bulbous flowering plants
cryptogam mosses, liverworts, lichens

70
Herbaceous plants, or forbs, encompass a great range of forms, life histories, and inter-
relationships. The forbs most commonly used on EGRs are species that can persist through
difficult conditions, but also colonise and self-establish through various dispersal strategies
(e.g., wind blown seeds). Forbs also represent the potential for ecological interest through
the provision of nectar and pollen sources for pollinating insects and animals, and trophic
impacts on food webs.
Geophytes, or bulbs like Allium spp, can maintain a dominant presence on some green
roofs, such as those described in Berlin (Köhler, 2006, Köhler and Poll, 2010). Given their
physical bulk and seed size (certainly compared with wind-dispersed seed), bulbs are less
ecologically dynamic in that they cannot colonise EGRs without human directive.
Woody growth forms here include tree and shrubs. On extensive green roofs, these usually
consist of spontaneously colonised seedlings that rarely persist because they are either
weeded or killed off by drought, extreme temperatures, or shallow depths, although they
may persist if the conditions permit. Although Thyme is woody, it was treated as a forb since
most of the other woody species encountered were colonizing tree saplings and/ or had
been planted in “non-uniform” (and therefore unsampled) parts of a roof.
Cryptogams, mainly mosses and lichens, colonise roofs easily but are generally unintentional
components of green roof vegetation. Without bryological expertise, identification can be
difficult, which makes the impact and dynamics of these organisms an elusive point for such
field studies. Experiments in Halifax (Canada) have started exploring the influence of mosses
and lichens on neighbouring species as well as temperatures of modular green roof boxes
(Heim and Lundholm, 2013, Heim et al., 2014).
2.2.4.1.3 Species diversity
The number of different species (or cultivars) is an important metric of representation
within the vegetation. Accurate identification of plants and cryptogams was verified by Prof.
Dr. Reinhard Böcker, Professor of Landscape Ecology and Vegetation Science at the
University of Hohenheim (and currently compiling a new Flora for Stuttgart). A record of
those identified species was kept in a small herbarium of pressed plants, and cryptogams
were kept in dry paper bags. For plants that could not be identified, simple identifier names

71
were given (such as “opposite-leaved herb”) and they were treated as a species within that
growth form. Any species recorded in the quadrats that were atypical of the uniform
vegetation were treated as outliers. Two sedges and an orchid at FH Nürtingen, for example,
extended beyond the drip zone and into one (Dactylorhiza fuchsii, Carex humilis) or more (C.
flava) quadrats. Since these species were exceptions to the uniform vegetation of this roof,
were not found on any of the other roofs, and were associated with the unique conditions
of shading and moisture beside the adjacent wall, they were removed from the dataset for
most analyses. If species from original lists were not encountered in the quadrat samples,
whole-roof reconnaissances were conducted in order to confirm their presence or absence.
2.2.4.2 Substrate sampling
The same quadrats sampled for vegetation were sampled for substrate. Depth
measurements included the substrate surface until the filter sheet separating the substrate
from the drainage layer. Mean depth per quadrat was calculated from three depth
measurements at different edges, and the values from all quadrats served to calculate mean
depth per roof. Killesberg was not sampled for physical and chemical soil properties due to
the difficulties and dangers associated with its steep slope, but sampling of the other eight
roofs was accomplished using a (100 mm) soil corer (Firma Schwab, Waidhofen). Between
ten and twenty-five litres are required for physico-chemical analysis (FLL, 2008), so twenty
litres (20 L) were collected per roof, with between one and two cores per quadrat. Cored
gaps were re-filled with a commercially available green roof substrate. Before being united
into a single sample for each roof, each core was cleared of vegetation and its core profile
was photographed for the record. Substrate data therefore include depth (n=134), and
nitrogen, phosphorus, potassium and magnesium (as measured in mg/L), soil organic
content (g/L) and soil pH (as measured by CaCl2) (all n=8).
Soil analyses were conducted in adherence with the FLL recommendations, which provide
detailed testing procedures. To begin with, any evaluation of EGR substrate properties is
based on a standardized level of compaction (i.e., the Proctor hammer compaction test as
per DIN 18127, or ASTM D698) in order to replicate the compression that occurs over time.
To determine maximum water capacity (MWC), substrate samples were fitted into 150 mm

72
cylindrical test samples, compacted, saturated and then left to drip freely for 2 hours (i.e.,
until field/ container capacity) (FLL, 2008). Maximum water capacity (vol. %) is the water
content that remains after the substrate has reached field capacity. Air volume (% vol.) is
the difference between total pore volume and water content at maximum water capacity.
The amount of organic content (g/ L) in a green roof substrate is determined by ash content
and loss due to burning, which is achieved by incinerating test samples at 550°C (in a muffle
oven) until the weight readings have stabilized and no more loss is detected. The standard
DIN 19684 method was used to measure soil pH whereby a 0.01 molar solution of CaCl2 was
added to the sample and then measured after three hours (using a pH-meter). More details
on the methods, analyses and results for substrate are given in Chapter 6.
2.2.4.3 Abiotic/ environmental variables
To account for environmental gradients influencing the roofs, variables were measured
which reflect quadrat-level and roof-wide influences that may vary across a roof and can
influence the vegetation per quadrat. Roof-wide variables are those that extend in influence
across the roof like roof age (time since installation) (n=136). Quadrat-level, or quadrat-
specific, variables included slope, aspect, and shade. Since aspect is an ordinal variable
lacking quantitative meaning, any results pertaining to this must be interpreted with
reference to field observation. For analysis, these were ranked into ordinal variables (Figure
2.16).
Roof level: age Quadrat-level: slope Quadrat-level: aspect
Quadrat-level: shade
1 20-21 years 0 0-4.5° (0 to 1/12) 0 none 0 none
2 22-23 years 1 5-9.5° (1 to 2/12) 1 N-facing 1 half-day
3 24-25 years 2 10-14° (2 to 3/12)
2 S-facing 2 majority of day
4 > 26 years 3 15-18.5° (3 to 4/12)
3 both
4 >19° (>4/12)
Figure 2.16. Ordinal rankings for environmental variables.

73
2.2.5 Data analysis
In order to encompass the diversity of EGR roof constructions and the numerous biotic and
environmental variables that influence EGR vegetation over time, this chapter introduces
preliminary correlation analyses with the aim of identifying important relationships
between vegetation, substrates, environmental variables, and time. Statistical tests were
performed in SPSS versions 19-22 (IBM Inc.). A two-tailed Spearman’s (rho) rank correlation
test was selected to detect relationships between the dependent (vegetation and substrate)
and independent variables (roof age, slope, aspect, shade). This non-parametric test was
useful because some of the data was ordinal and most of it was not normally distributed.
Interpretations of the strength of the different effect size statistics take reference from the
guidelines proposed by Cohen (1988); large effects had correlation coefficients 0.5-1.0;
medium strength effects were 0.3-0.49. Preliminary tests were performed to ensure no
violation of the assumptions of normality, linearity and homoscedasticity.
It is important to note that established correlations between two variables do not
necessarily imply that the relationships are causal, but simply that there may be causal
interactions. Two variables might appear to be correlated but their relationship can be
spurious if another “lurking” variable is producing that effect (rather than the two variables
alone). Correlation analysis cannot indicate when a given correlation is spurious, nor can it
identify any lurking variables that might cause a spurious correlation. The small sample size
also poses limitations to any conclusive interpretations from these results. With regards to
the matter of possible spurious correlations, these results may serve as points of
consideration for the scenarios or dynamics that they suggest, and as preliminary insights
into the direction of relationships.
Spearman’s is a robust measurement for the strength and direction of a relationship, as
indicated by the positive or negative sign in front of each correlation coefficient.
Accordingly, it should be noted that the relationships implied by the test always have two
possible interpretations, denoted in the discussion by vice versa. For example, if roof age
and grass cover are negatively correlated, this could be interpreted as older roofs having
less grass cover, but also as younger roofs having more. If the correlation test detected

74
significant relationships, further analyses were conducted to examine these further, either
here or in later chapters. The objectives of this analysis address the key questions
summarized by the following hypotheses.
2.3 Results
Overall, 94 species were identified on the nine EGRs sampled, including 6 woody species, 12
graminoids, 42 forbs, 11 succulents, 3 bulbs and 20 cryptogams. The master species list for
all roofs, organised by growth form grouping and with indication of how many quadrats
each species occurred in per roof (frequency), is given in Table 2.4. Taxonomic authority on
nomenclature followed Tutin et al. (1993) for vascular plants, Purvis et al. (1992) for
macrolichens, Hill et al. (2008) for bryophytes and The Plant List (2013) for graminoids.
Table 2.4. Full species list, with frequency, for the vegetation of nine EGRs.
Species by growth form
Pliens q=15
VBA1 q=16
VB A2 q=14
Tüb q=14
FH Nü q=12
Köng q=18
R-PV q=15
R-low q=14
K'berg q=18
Forb species frequency (# quadrat occurrences per roof)
Achillea millefolium L.
1 5 1
Campanula rotundifolia L.
3
Cerastium arvense L., Sp. Pl. 438 (1753)
1
Convolvulus arvensis L.
1
Coronilla varia L.
7
Crepis tectorum L.
2 12 15 14
Dianthus carthusianorum L.
6 12
Dianthus deltoides L.
1 4 1 1
Erigeron annuus (L.) Pers.
2

75
Fragaria vesca L.
2
Geranium spp.
1
Geum urbanum L.
1
Hieracium pilosella L.
2 2 12 5 6
Hypericum perfoliatum sensu Hayek pro parte, non L.
4
Hypericum perforatum L.
7 1 7
Linum perenne L.
13 12 2
Lotus corniculatus L.
9
Medicago lupulina L.
2
Nepeta mussinii Sprengel ex Henckel
2
"Opposite leaved herb"
4
Petrorhagia prolifera (L.) Ball & Heywood
3
Petrorhagia saxifraga (L.) Link.
1 9 8
Picris hieracioides L.
1 5
Potentilla argentea L.
2
Potentilla erecta (L.) Räuschel
6

76
Potentilla tabernaemontani Ascherson
3 11 11
Potentilla recta L.
1 8 4
Solidago canadensis L.
2
Taraxacum officinale Weber
6 4 1 7 9 7 2
Thymus praecox Opiz
10
Thymus pulegioides L.
2
Thymus serpyllum L.
14 10 3 6 5
Trifolium arvense L.
1 3 7
Trifolium campestre Schreber
2 5 2
Trifolium dubium Sibth.
1
Trifolium pratense L.
1 1
"Unknown herb"
1
Verbascum nigrum L.
1
Verbascum thapsus L.
1
Veronica spicata L.
5 8 3
Vicia hirsuta (L.) S.F. Gray
15
Vicia sepium L.
4

77
Pliens q=15
VB A1 q=16
VB A2 q=14
Tüb q=14
FH Nü q=12
Köng q=18
R-PV q=15
R-low q=14
K'berg q=18
Succulent species frequency (# quadrat occurrences per roof)
Sedum acre L.
1
Sedum album L.
2 1
Sedum album "Coral Carpet"
4 9
S. album "Murale"
12
S.kamtschaticum "Weihenstephaner Gold"
10 1 14 5
S. hybridum L.
10 11 14 16 10 9 3
S. rupestre L. 8 15 13 17
S. sexangulare L.
12 11 14 9 13 10 13
S. spurium Bieb.
10 13 5 12
S. telephium L.
1 2
Sempervivum tectorum L.
1
Pliens q=15
VB A1 q=16
VB A2 q=14
Tüb q=14
FH Nü q=12
Köng q=18
R-PV q=15
R-low q=14
K'berg q=18
Graminoid species frequency (# quadrat occurrences per roof)
Agrostis stolonifera L.
9
Agrostis tenuis Sibth.
4 4
Arrhenatherum elatius (L.) P. Beav. ex. J. & C. Presl.
3 6
Carex flava L. 4
Carex humilis Leyss.
1
Festuca ovina L.
1 1 5 6 18 7 7 8

78
Festuca rubra L.
3 3
Poa angustifolia L.
1 1
Poa compressa L.
2 11 2 5
Poa pratensis L.
2 2
Setaria viridis (L.) P.B
11 13 9
Vulpia myuros L. C.C. Gmel.
4 9
Pliens q=15
VB A1 q=16
VB A2 q=14
Tüb q=14
FH Nü q=12
Köng q=18
R-PV q=15
R-low q=14
K'berg q=18
Geophyte species frequency (# quadrat occurrences per roof)
Allium flavum L.
10 3
Allium schoenoprasum L.
7 14
Dactylorhiza fuchsii L.
1
Pliens q=15
VB A1 q=16
VB A2 q=14
Tüb q=14
FH Nü q=12
Köng q=18
R-PV q=15
R-low q=14
K'berg q=18
Crytogam species frequency (# quadrat occurrences per roof)
Cladonia furcata (Huds.) Schrader
1 14 1
Cladonia cf scabriscula (Huds.) Schrader
2 6 3 2
Peltigera spp.
3 3 3
Brachythecium rutabulum (Hedw.) Schimp.
4
Brachythecium cf. albicans1 (Hedw.) Schimp
3

79
Brachythecium cf. albicans2 (Hedw.) Schimp
4
Brachythecium cf. albicans3 (Hedw.) Schimp
1
Bryum1 5
Bryum2 8 13
Calliergonella cuspidata (Hedw.) Loeske
3 6
Ceratodon purpureus (Hedw.) Brid.
7
Dicranum scoparium Hedw.
3
Eurhynchium praelongum (Hedw.) B., S. & F (stokesii)
6
Hypnum1 9 8
Hypnum2 6 11
Philonotis fontana (Hedw.) Brid.
3
Polytrichum juniperinum Hedw.
2
Pseudoscleropodium purum (Hedw.) M. Fleisch
8
Racomitrium elongatum Ehrh. ex Frisvoll
6
Starry yellow moss
1 6

80
Pliens q=15
VB A1 q=16
VB A2 q=14
Tüb q=14
FH Nü q=12
Köng q=18
R-PV q=15
R-low q=14
K'berg q=18
Woody species frequency (# quadrat occurrences per roof)
Acer campestre L.
2
Acer pseudoplatanus L.
1 5 1 9
Carpinus betulus L.
2
Unidentified seedling
4
Pinus sylvestris L.
2
Teucrium chamaedrys L.
3
The most diverse roof (FH Nürtingen) recorded 32 species that included 15 forbs, 1 bulb, 7
graminoids (including 2 sedges), 7 cryptogams and 2 woody species. The next most diverse
roof (Rathaus lower) had 30 species that included 17 forbs, 4 grasses, 1 bulb, 7 cryptogams
and 1 woody species. Compared to its neighbouring roof with PV panels (Rathaus PV) which
apparently had the same original species list, the more sheltered conditions of the lower
roof may explain the greater number of species recorded. Four of the roofs surveyed
(Tübingen, VB A1, VB A2, Killesberg) had just over twenty species (20, 21, 21, 23,
respectively), all with similar numbers of forbs (8, 9, 7, 9, resp.), succulents (6, 5, 6, 4, resp.),
several grasses (5, 2, 4, 3, resp.) and most with cryptogams (0, 4, 3, 5, resp.). On the
opposite extreme, the most species depauperate roofs (Köngen and Pliensau), recording 9
and 11 species respectively, were predominantly covered by Sedum with sparse
representation by other growth forms.
2.3.1 Relating cover and species diversity of growth forms
Cover by the five growth forms correlated positively with species diversity of the same
growth forms, and different growth forms had varying relationships to each other’s cover.
Other than succulents, the other growth forms all had large and significant relationships

81
between their own cover and species diversity (shown bolded in Table 2.5). Some growth
forms had significant relationships with species diversity of other growth forms, too, most
notably bulb cover with species diversity of cryptogams (rho = -.425, p < .001, n = 136) and
cryptogam cover with bulb species diversity (rho = .361, p < .001, n = 136). Recalling that
bulbs are unlikely to colonise green roofs without human aid, and that cryptogams are
independent colonisers, these results may be linked with other relationships or dynamics
that this analysis can not reveal. The lacking relationship between species diversity and
cover by succulents may reflect the fact that Sedum-dominated roofs can be extensively
covered by just two or three species.
Table 2.5. Results from Spearman’s correlation (rho) relating growth form cover with species diversity
Growth form cover (%)
bulb cryptogam succulent forb grass
Spec
ies
div
ersi
ty # bulb species .742*** .361*** -.190* .137 -.077
# cryptogam .425*** .856*** -.485*** .248** .281**
# succulent .152 -.070 .287** .102 -.339***
# forb .083 .315*** -.374*** .732*** .124
# grass -.012 .225** -.248** .194* .783***
* p < 0.05 ** p < 0.01 *** p < 0.001
Cover by succulents correlated negatively with the diversity of other growth forms. The
large effects between succulent cover with species diversity of cryptogams (rho = -.485, p <
.001, n = 136) and forbs (rho = -.374, p < .001, n = 136) suggest that extensive succulent
cover inhibits the diversity of these growth forms (or vice versa). This may be true in some
cases, where Sedums with dense foliage and creeping stems inhibit such growth forms,
though it is not uncommon to see these growth forms growing together, either. Succulent
species diversity was negatively correlated with grass cover (rho = -.339, p < .001, n = 136),
which suggests that roofs with greater diversity of succulent species had less grass cover (or
vice versa). Only two growth forms were correlated in cover with each other. Cryptogam
cover had a negative correlation with succulent cover (rho = -.424, p < .01, n = 136) and a
positive relationship with bulb cover (rho = .357, p < .001, n = 136). This implies that
cryptogam cover was greater when bulb cover was greater, but that it declined when
succulent cover increased (or vice versa). Field observations challenge the generalization of

82
the latter, since mosses and lichens can often be observed growing alongside and beneath
Sedum species on green roofs.
2.3.2 Relating green roof vegetation with time (roof age)
Grasses had the strongest relationship with roof age, such that older roofs had significantly
less grass cover (rho = -.716, p < .001, n = 136) and significantly fewer grass species (rho = -
.595, p < .01, n = 136) (Table 2.6). Cryptogams also had a negative relationship with roof
age, such that older roofs had significantly less cryptogam cover (rho = -.314, p < .001, n =
136) and fewer cryptogam species (rho = -.445, p < .01, n = 136), through the effects were
only medium strength. This implies that the older roofs sampled often had fewer grass and
cryptogam species (and/ or that younger roofs had more). Succulent cover and diversity had
the smallest response to roof age.
Table 2.6. Results from Spearman’s rank correlation (rho) relating roof age with cover (%) and species diversity of five growth form groups.
Growth form Roof age
cover (%) bulb -.238**
cryptogam -.314***
succulent .128
forb -.134
grass -.716***
species diversity # bulb spp .030
# cryptogam spp
-.445***
# succulent spp
.102
# forb spp -.294**
# grass spp -.595**
* p < 0.05; ** p < 0.01; *** p < 0.001

83
2.3.3 Relating EGR vegetation development with environmental/ abiotic
conditions
Extensive green roofs are subject to harsh environmental conditions and green roof
vegetation typically receives little protection from solar radiation, wind, or precipitation and
the shallow, mineral substrates offer very little buffering capacity from extreme
temperatures, frost, drought, or other.
2.3.3.1 Vegetation and substrate depth
From the roofs surveyed, grasses were the only growth form with positive relationships to
substrate depth, and with the most significant relationships with depth (Table 2.7). Deeper
substrates supported more grass cover (rho = .432, p < .001, n = 134) and more grass cover
species diversity (rho = .351, p < .001, n = 134). Bulb species diversity also had a significant,
but negative, association with depth (rho = -.395, p < .001, n = 134). This implies that EGRs
with deeper substrates had less bulb species but more species of grass, as well as more
cover by grasses (or, vice versa, that shallower depths support less diversity and cover by
grasses and more bulb species). The other growth forms did not respond to depth, which is
to be expected for cryptogams and succulents, which have shallow rooting requirements.
Species-level responses to depth will be examined in Chapter 4.
Table 2.7. Results from Spearman’s rank correlation (rho) relating substrate depth with vegetation (cover and species diversity of five growth form groups, both variables n=134).
Substrate depth
cove
r (%
)
bulb -0.045
cryptogam -0.032
succulent -0.073
forb -0.101
grass .432***
spec
ies
div
ersi
ty # bulb -.395***
# cryptogam 0.002
# succulent -.227**
# forb -0.030
# grass .351***

84
Substrate depth also had significant correlations with abiotic variables, in particular a
negative relationship with roof age (rho = -.481, p < .001, n = 134) but also with slope,
aspect and, to a lesser degree, shade (Table 2.8). This suggests that substrate depths were
significantly shallower on older (versus younger) EGRs; on pitched (versus flat) roofs; on
roofs with both- or south-facing aspects (versus north-); and on roofs without shade (versus
shade for majority of day). The FLL guidelines were designed to rule out compaction
because EGR substrates are shallow to begin with, and such a trend could pose serious
issues to the long-term function of shallow EGRs. The effects associated with depth shall be
investigated more closely in Chapter 4.
Table 2.8. Results from Spearman’s rank correlation (rho) relating substrate depth with abiotic variables (n=134).
Substrate depth
Roof age -.481***
Slope .430***
Aspect .369***
Shade -.296**
* p < 0.05; ** p < 0.01; *** p < 0.001
2.3.3.2 Vegetation and slope, aspect and shade
Shade had negligible effects on the vegetation surveyed, while slope and aspect had
significant correlations, in particular with species diversity of bulbs (rho = -.451, p < .001, n =
136; rho = -.450, p < .001, n = 136, respectively), cryptogams (rho = -.324, p < .001, n = 136;
rho = -.449, p < .001, n = 136, resp.) and forbs (rho = -.486, p < .001, n = 136; rho = -.513, p <
.001, n = 136, resp.) (Table 2.9). This suggests that sloped roofs often supported fewer
species from these growth forms, while the flat roofs surveyed had more. Since shade has
only three possibilities, the average correlation (the correlation coefficients squared,
averaged, and square rooted) was tested in a post-hoc power analysis, revealing a power (1-
β err prob) of 0.54 (G-power, version 3.1, University of Düsseldorf, calculated December 15,
2015). This is not particularly powerful, and may reflect the small number of quadrats
sampled that bore any shade.

85
Table 2.9. Results from Spearman’s rank correlation (rho) relating slope, aspect and shade with cover (n=134) and species diversity of five growth form groups (n=134).
slope aspect shade
cove
r (%
)
bulb .017 -.123 -.106
cryptogam -.310*** -.411*** .098
succulent .185* .254** .095
forb -.309*** -.269** -.035
grass .281** .237** -.225**
spec
ies
div
ersi
ty # bulb -.451*** -.450*** .059
# cryptogam -.324*** -.449*** -.036
# succulent .153 .107 .009
# forb -.486*** -.513*** -.223**
# grass .115 .135 -.278**
* p < 0.05 ** p < 0.01 *** p < 0.001
Cover by grasses and succulents had negligible responses with slope and aspect. This means
that quadrats located on pitched roofs did not have significantly different cover or diversity
by these growth forms than flat roofs. It is interesting that the graminoid and succulent
growth forms had positive relationships to these variables, while the other growth forms
were negative.
Slope and aspect influence roof vegetation from the basis of incoming solar radiation, and
field observations can substantiate this distinction of growth form compartmentalization.
Three of the nine EGRs surveyed had slopes greater than 15°, of which Tübingen and
Killesberg had north-/ south-facing aspects and Köngen had north-west and south-east
facing aspects. The steeply pitched south-facing slopes at Killesberg supported mainly
Sedums, cryptogams and annual grasses, while the north-facing slopes supported Sedum
meadows, defined by tall herbs and grasses above a continuous succulent cover (recall
Figure 2.10). Although forb cover and diversity had significant correlation effects with slope
and aspect (while grass and succulents had none), the visual effect of these dynamics were
not as evident in situ. This may indicate the strength of influence by these abiotic variables,
and the different plant responses, but it may also imply the likelihood of lurking variables.
For instance, the large negative correlation between aspect and forb diversity may be a
result of competition by grasses rather than inadequacy by forbs in such conditions, and

86
might also implicate the effects of slope and aspect on moisture and nutrient availability,
pH, etc. Species-level responses to these variables, along with inter-relationships with
depth, will be examined in Chapter 4.
2.3.4 Relating vegetation development to substrate characteristics
Of the substrate variables sampled, the only significant correlations with vegetation were
between soil organic content (Corg) and bulbs, and a weak association between phosphorus
and succulent cover (Table 2.10). These results suggest that roofs with more Corg had
significantly less bulb cover (rho = -.934, p < .001, n = 8) and fewer bulb species (rho = -.976,
p < .001, n = 8), and that roofs with substrates high in phosphorus also had more cover by
succulents (rho = .708, p < .05, n = 8). Since bulbs only occurred on three roofs (FH
Nürtingen, Esslingen Verkehrsbetrieb roofs), and given that data analysis for these variables
limited the sample size so considerably, these effects are not exceptionally robust. The
consideration of individual species’ responses to different substrate variables may shed
more light on the role of substrate to vegetation development (Chapters 5 and 6).
Table 2.10. Results from Spearman’s rank correlation (rho) relating substrate variables (n=8) with cover and species diversity of five growth form groups.
Soil properties
Growth form
Soil organic content
pH
N
P
K
Mg
cove
r (%
)
bulb -.934** 0.349 0.06 -0.528 -0.419 -0.434
cryptogam -0.407 -0.229 0.036 -0.38 -0.539 -0.193
succulent 0.571 -0.06 0.048 .708* -0.143 0.108
forb -0.262 0.299 -0.214 0.024 0.429 -0.252
grass -0.238 0.144 0.238 -0.024 0.095 0.072
spec
ies
div
ersi
ty
# bulb -.976*** .344 .024 -.600 -.317 -.393
# cryptogam -0.647 0.639 0.299 -0.43 -0.06 -0.096
# succulent -0.31 -0.108 -0.571 0.244 0.024 -0.515
# forb -0.595 0.683 0.262 -0.268 0.31 -0.275
# grass -0.143 0.275 0.19 0 0.262 0.06
* p < 0.05 ** p < 0.01 *** p < 0.001
The quadrat-level variables of slope and aspect both had large, negative associations with
soil pH (rho = -.760, p < .05, n = 8; rho = -.768, p < .05, n = 8) which suggests that pitched

87
roofs often had lower pH values or, vice versa, that flat EGRs with no particular aspect often
had higher pH values (Table 2.11). In terms of soil nutrients, slope and aspect both had
large, positive associations with soil phosphorus (P) (rho = .775, p < .05, n = 8; rho = .751, p <
.05, n = 8), which means that pitched roofs often have higher P levels. Closer examination of
site conditions are required if the results for aspect are to be interpreted. Species-level
responses to substrate variables, including depth, will be examined in the chapters that
follow.
Table 2.11. Results from Spearman’s rank correlation (rho) relating substrate variables with slope (n=8), aspect (n=8) and shade (n=118).
slope aspect shade
C org 0.504 0.514 -.006
pH -.760* -.768* -.108
N -0.630 -0.592 -.260**
P .775* .751* -.288**
K -0.126 -0.218 -.235*
Mg -0.253 -0.204 .377***
* p < 0.05 ** p < 0.01 *** p < 0.001
2.4 Discussion
2.4.1 Distinguishing plant growth forms: different approaches
In retrospect, other approaches to distinguishing plant growth forms could have lent a
greater degree of detail to some of the descriptions made by these surveys, in particular
within the bryophytes and within the forbs. Glime (2015) suggests that the classification of
bryophytes as acro- or pleurocarpous is “somewhat analogous to Raunkiaer’s system” (4-5-
3), these terms implying individual shoot architecture and colony form or structure of
different bryophytes. Acrocarpous species are usually unbranched or sparsely branched and
generally upright, with the sporophyte at the apex of a stem or main branch and with
terminal sporangia. Pleurocarpous species, on the other hand, are typically prostrate and
form freely branched mats producing sporangia on short, specialized lateral branches or
buds (Glime, 2015). Regrettably, these distinctions were not familiar to the author at the
time of sampling but should be included in future work.

88
Similarly, the growth form defined as “forb” could have been distinguished further into
perennials and annuals. Within the Raukiaer system, annuals are described as “therophytes”
and are associated with conditions of drought and open grassland. Although many of the
spontaneous colonizers of the roofs surveyed were recognized to be annual, they were not
distinguished from perennial forbs in the methodology. As with the bryophytes, future work
should undoubtedly include this distinction. Indeed, the role of annual species to EGR
vegetation became a point of interest within the literature during the time of this research
(Nagase and Dunnett, 2013, Nagase et al., 2013, Van Mechelen et al., 2014a, Van Mechelen
et al., 2014b).
2.4.2 Treatment of aspect, slope and shade
The variable of aspect can pose statistical issues to quantitative field studies, and a variety
of mathematical and technical approaches have been developed for this and its influence on
other variables. These issues were unfortunately not known to the author at the time of
field surveys, nor were mathematical equations considered, but integrating such
quantification into future work of this nature may prove useful.
Taken together, the quadrat-level variables of slope, aspect and shade can yield a proxy to
solar radiation that, when combined with latitude, can yield estimates of incident radiation
and heat load index. The aspect of a slope can be defined as the direction (or azimuth) that
the slope faces and will strongly influence potential direct incident radiation and
temperature (McCune and Keon, 2002). For example, an unshaded roof on a northeast-
southwest axis will experience warmer temperatures on the southwest aspect because
afternoon sun produces higher maximum temperatures than the equivalent slope with
morning sun. McCune and Keon (2002) propose an equation for approximating heat load,
with aspect rescaled to a scale of zero (coolest, northeast) to one (warmest, southwest):
Heat load index: 1−cos(𝜃−45)
2
where Ɵ = aspect in degrees east of north.
However, a 1° south-facing slope will receive the same heat load as a 30° south-facing slope,
yet the latter would be considerably warmer, so an equation is required which considers the

89
steepness of the slope. McCune and Keon (2002) provide a useful starting point for such
calculations. A methodological approach, the sky-view factor (ѱs) can be used to
characterise the shade of neighbouring buildings or vegetation on a site. Although originally
developed for assessing the spatial variability of urban areas, like the geometry of urban
canyons (Grimmond et al., 2001), methods for calculating the sky-view factor could easily be
adapted for green roof ecological surveys.
2.5 Conclusions
The findings from these preliminary analyses serve as a first step towards answering the
research question about successional change, and towards the aim of characterising mature
EGR vegetation. The work from this chapter has therefore prepared the ground to address
these along with other questions and aims in the chapters that follow. From the basis of the
preliminary analyses here, it may be hypothesized that the main drivers behind vegetation
change on EGRs include the abiotic growing conditions of the roof environment, such as
slope and aspect, as well as substrate depth. There are probably also dynamics occurring
between the growth forms.
2.5.1 Vegetation dynamics
Most growth forms related significantly in cover with their own species diversity, with the
single exception of succulents, which lacked significant relationships with their own diversity
and with cover by other growth forms. Visual observations substantiated these results;
succulents dominated the vegetation of all the roofs surveyed and often created extensive
cover with only a few species. Some Sedums, like S. album, exhibit Crassulacean Acid
Metabolism (CAM), which allows them to avoid water stress by switching their carbon
metabolism to the CAM pathway (Sayed, 2001). When induced by water stress, CAM plants
can keep their stomata closed during hot days to reduce water loss, then open again in the
cooler evening to take up nocturnal CO2, and decarboxylate it during the day for
photosynthesis (Black and Osmond, 2003). When water is available S. album can assimilate
carbon following the C3 pathway, but then switch to CAM when drought occurs (Black and
Osmond, 2003). Still, in spite of this faculty, this plant was lost from the Rathausgarage
roofs. Other known CAM plants encountered on these old roofs include S. acre, S. telephium

90
and S. rupestre (alias S. reflexum) (Sayed, 2001), some of which did not persist either. CAM
plants have slow growth rates relative to C3 and C4 plants (Black and Osmond, 2003), and
typically qualify as S-strategists under CSR theory (Grime, 1974).
On a similar note, the exception of succulents (from other growth forms) of declining cover
abundance and species richness over time merits further reflection into the dynamics
occurring on EGRs over time. In addition to their well-suited life strategies, as described
already, these results suggest that succulents are immune to some of the pressures that
influence the other growth forms. The possibility that substrate depth declines over time,
for example, would impact roof vegetation in favour of taxa that are shallow-rooting and
able to access the resources they need from minimal soil volumes. Exposure of the roof
environment to atmospheric deposition and air pollution could, equally, favour this life form
over other taxa. To elaborate on these possibilities, closer examination of substrate
properties over time, including depth, will follow in later chapters.
2.5.2 Roof vegetation, time (roof age) and abiotic/ environmental conditions
Extensive green roofs are subject to harsh environmental conditions and green roof
vegetation typically receives little protection from solar radiation, wind, or precipitation and
the shallow, mineral substrates offer very little buffering capacity from extreme
temperatures, frost, drought, or other. With consideration of the growing conditions on
extensive green roofs (Köhler and Poll, 2010, Köhler, 2006, Köhler, 1990), and based on our
understanding of urban vegetation change over time (Kowarik, 1990, Pysek, 1993, Trepl,
1995, Chocholouskova and Pysek, 2003, Pysek et al., 2004, Knapp et al., 2010), these results
suggest that cover and diversity of growth forms on EGRs decline over time. In other words,
older roofs support extensive cover by fewer growth forms and fewer individual species,
while younger roofs would have more diverse cover, both for growth forms and species.
The only growth form that responded significantly to roof age was grass, as well as a
subdued response by cryptogams. The latter dynamic would be problematic if true, since
EGRs are shallow to begin with. Much green roof research substantiates this relationship
between grass cover and diversity with substrate depth, which (Monterusso et al., 2005,
Nagase and Dunnett, 2013, Dunnett et al., 2008, Schroll et al., 2011, Krupka, 1985).

91
However, grass cover and diversity also responded significantly to substrate depth, which
was negatively correlated with roof age. Substrate depth also had significant effects with
slope and aspect and with species diversity of all growth forms except succulents and
grasses. A study in Michigan USA found that different exposures to sunlight influenced soil
moisture content and chlorophyll fluorescence of some green roof plants, which would
clearly influence plant performance (Getter et al., 2009). In their study of native species for
EGRs in maritime Canada, MacIvor and Lundholm (2011) suggest that solar radiation should
be included as an important covariate for studies examining plant and green roof
performance. On two old EGRs in Berlin, Köhler (2006) found that floristic species diversity
was significantly affected by weather-related factors, like temperature and precipitation,
and that it could be increased through enhanced initial plantings and the provision of
microclimates (e.g., shaded areas). The complexity of these responses will be deconstructed
and these effects examined more closely in ensuing chapters.

92
3 Classifying mature EGR vegetation into types
The preliminary analyses of the previous chapter identified that the composition of mature
EGR vegetation is affected by a variety of conditions, often in combination. Of the variables
measured, the mechanisms driving EGR vegetation dynamics over time include abiotic
variables like substrate depth, slope and aspect. Although climatic variables were not
measured, factors such as temperature and precipitation patterns undoubtedly influence
vegetation dynamics, too. The preliminary characterisation of mature EGR vegetation in
terms of growth form cover and species diversity indicated that succulents and grasses
behaved differently from the other growth forms. Succulents were the only growth form
that did not relate significantly in cover abundance with its own species diversity; grass
cover and diversity were the only significant relationships with substrate depth. Yet
substrate depth had a significant negative relationship with roof age, and depth in turn had
significant associations with slope and aspect. Given the exceptional and strong responses
by succulents and grasses, closer examination of these growth forms may grant some insight
into EGR vegetation dynamics.
3.1 Literature Review: plant community ecology of green roof vegetation
This chapter reviews the main factors directing plant community formation as identified for
green roofs and other ecosystems. The results will consider species-level dynamics,
including presence/ absence of species from original lists, as well as colonising species. It
therefore builds upon the results from the previous chapter by considering the abundance
of persistent species along with the abundance of colonising species. What role do
unintentional species (ruderals, weeds) play to the long-term diversity of EGRs; how
prevalent are they? Are certain colonising species impossible to exclude, inevitably forming
an important component of green roof plant communities? Is there a roster of cosmopolitan
volunteers (i.e, weeds) that inevitably colonise every green roof, regardless of where or
when it was installed? This will further inform the question of the drivers and mechanisms
of successional change on EGRs, and support the continued characterisation of mature EGR
vegetation.
With respect to the two growth forms that responded so uniquely from the others, this
chapter will characterise them ecologically and thereby expand the research aim of
characterizing mature EGR vegetation. Based upon these species-level characterisations, the

93
chapter will begin to consider the research question of whether emergent community
characteristics result on EGRs with time. To this end, the characterised vegetation will be re-
configured by roof and grouped according to similarities/ dissimilarities.
3.1.1 Factors in green roof plant community formation
As might be expected, no single factor was deemed key to plant community development,
but rather a variety of factors in combination, including roof age, substrate depth,
accessibility, maintenance/ intensity of use, moisture, shade, slope, aspect, and history of
the roof. The loosely similar communities identified for spontaneous gravel roofs could be
due, on the one hand, to the similar local substrate used on the roofs per region and the
seed bank contained therein. On the other hand, if the exogenous factors on roofs are
consistently inhospitable, it is plausible that the vegetation is held in a sort of ‘early
successional sere’. Rather than the climax of traditional succession theory, the processes on
roofs can perhaps be better described by the edaphic (soil) and biotic (often anthropogenic)
plagioclimaxes, whereby community development is deflected or arrested by limited soil
depth and/ or human intervention, as per Tansley (1958).
The “Typical Poa meadow” was classified as a climax community for spontaneously
vegetated gravel roofs because it seems to be stable for decades at a time (Bornkamm,
1961, Darius and Drepper, 1983, Bossler and Suszka, 1988, Thommen, 1988, Buttschardt,
2001). In Göttingen, Bornkamm observed that this meadow community would attain cover
dominance on undisturbed, unshaded roofs with at least 100 mm gravel, and that
completely closed cover will occur in around 120 mm. This community exhibited exceptional
cover by higher plants, most of which die back in summer. Species richness was augmented
with weedy annuals through the provision of shade as well as shallower depths. In depths
under 100 mm, the grass loosened into a weedier meadow comprising Bromus tectorum,
Setaria viridia and Eragrostis minor which thrive in 50 to 120 mm (Darius and Drepper,
1983, Thommen, 1988). Buttschardt (2001) suggested that the communities of TPG roofs in
Karlsruhe developed after 30 to 40 years, and that establishment of the characteristic
species took between 10-30 years. He also pointed to variability and the short-term nature
of these communities as a result of limited propagule inputs and inevitable fluctuations in
environment and growing conditions. If the more demanding species of dry meadows are
envisioned for green roofs, and propagule source habitats are not present in the

94
surrounding areas, then seed should not be spared in the installation, and additional seed
would bolster the seed bank (Riedmüller, 1994, Buttschardt, 2001).
3.1.1.1 Persistence and regeneration
Persistence and regeneration within any plant community can be at least partially attributed
to seed bank and seed rain. Seed rain is basically the external input of propagules to a plant
community, and seed banks are populations of seeds in the soil that can persist for periods
ranging from a year to decades, depending on the species (Roberts and Feast, 1973,
Silvertown, 1981, Templeton and Levin, 1979). Soil seed banks are dynamic systems of
inputs and losses (Figure 3.1) that include inputs from local and distant sources as well as
human introductions. Seed banks hinge on the expression of dormancy in the soil (Luken,
1990), and losses occur through seed predation, physical destruction, and decay (Harper,
1977). Common environmental treatments that break seed dormancy include access to light
and oxygen, soil disturbances, and periods of cold or of mechanical damage (Burrows, 1990,
Luken, 1990). A number of seed bank oriented successional studies have shown that species
in seed banks are often not present in the vegetation (and vice versa, that species in the
vegetation may not be represented in the seed bank), suggesting that fundamental
differences exist in the abilities of species to regenerate from seed stored in the soil (Grubb,
1977, Rebele, 1992).
Figure 3.1. Feedbacks and dynamics of soil seed banks. Modified from Luken (1990: 41).
Early successional species (i.e., ruderals) produce large numbers of small seeds and form
persistent seed banks, which are stimulated to germinate by high and fluctuating
temperatures and light that is not filtered by a plant canopy (Fenner, 1987). By contrast,
competitive species like late-successional, shade-tolerant trees express little delay between
dispersal and germination, lack well-developed dormancy and do not develop persistent
seed banks (Canham and Marks, 1985). Unlike R- and C-strategists, stress-tolerators rely less
on seeds and more on vegetative expansion for their regeneration since attachment to the

95
parent reduces mortality risk for offspring (Grime, 2001). Propagule availability and
environmental conditions must be well matched in order to balance the complexity of seed
response with environmental stimuli. Even if germination has been successful, ensuing plant
growth requires resources and protection from destructive factors (Harper, 1977).
3.1.1.2 Colonisation and seed rain
Seed rain represents colonization through spatial dispersal, or the arrival of vegetative or
sexual propagules from locations outside of a site (Brown, 1992). The seed rain reaching a
site depends on the proximity and numbers of parents contributing seed as well as their
fruiting period, not to mention the agents of dispersal (e.g., wind, insect, bird, mammal)
(Burrows, 1990) (p. 361). Animals disperse seeds physically and intestinally, and human-
dispersed species, also known as weeds, include agrarian and ornamental escapees. Wind-
dispersed seed, which typify ruderal strategists, are smaller and lighter compared with other
forms of dispersal and often bear attributes to assist floating, like achenes. Wind-dispersed
species are more frequent in urban than agricultural habitats, which may be due to
fragmentation and the dynamic nature of urban landscapes (Lososova et al., 2006).
Given their physical disconnect from other vegetated areas both in elevation and by urban
infrastructure, seed dispersal on EGRs is largely limited to wind- and animal- dispersed
species, though human-dispersal is also a prevalent source. A survey of ninety vegetated
roofs in Karlsruhe found that a third of the vegetation (34%) was wind-dispersed and
animal-dispersed (32%), and the other third was human-dispersed (14%), self-seeded
(6.8%), and rain-dispersed (12.6%) (Buttschardt, 2001)(p. 83, 99). An experiment studying
colonization patterns across two depths of planted green roof subplots in Sheffield (UK)
found that wind-dispersed colonization yielded greater total biomass in 200 mm but that
the shallower depth (100 mm) supported greater proportions of weeds, both wind- and
animal-dispersed, as well as higher species-richness, diversity and biomass (Dunnett et al.,
2008). Compared with the deeper depth, the shallower depths presumably offered fewer
resources for planted species, making them less vigorous and thereby leaving open spaces
for weedy species to colonize.
In northern France, Madre et al. (2014) identified 176 colonizing vascular plant species on
115 green roofs. The majority were common urban species, of which 86% were native and a
few even had protected status in that region. Similar to the Sheffield study, and
corroborated by work in Berlin (Köhler and Poll, 2010), substrate depth played the most

96
important role in species diversity of spontaneously colonizing plant species. The functional
composition of spontaneous vegetation on green roofs may also be shaped by maintenance
intensity, building height, and green roof age (Madre et al., 2014). The same French study
found that the diversity and community composition of spontaneous green roof species
were not noticeably affected by habitats occurring nearby, probably due to the type of
habitats and the conditions on the roof. A sterile landscape of mown lawns and ornamental
planting beds will not deliver as many propagules as one supporting species-rich meadows
and naturalistic, multi-structured habitats.
3.1.2 Classifying EGR vegetation into recurring types: emergence?
To date, the classification of EGRs into vegetation types has largely been based upon their
construction, specifically the vegetation that can be expected for certain substrate depths.
The FLL (2008) specifies several types, with EGRs as the most lightweight system of which
the vegetation is defined by shallow growing substrate depths and low maintenance.
Intensive green roofs are permitted on buildings with greater structural loading are often
designed for aesthetic interest and physical access, such that greater depths support a great
diversity of vegetation, including trees and shrubs. Semi-intensive green roofs classify
between extensive and intensive systems in terms of weight, substrate depth, maintenance,
and species selection. As an alternative to these classifications, practitioners in the US have
developed the “comprehensive green roof”, which unites the attributes of intensive and
extensive system in order to improve the resiliency and function of green roofs in the more
extreme climate of the American Midwest (Meyer, 2014).Recent work has attempted to
classify roof vegetation on the basis of ecological principles. For example, a green roof
ecological typology was proposed on the basis of a survey of spontaneous vegetation on 115
green roofs in northern France (Madre et al., 2014). Similar to the results of this and other
studies (Köhler and Poll, 2010) the French researchers found that species diversity of
spontaneous vegetation was significantly influenced by roof age and substrate depth, with
small effects from surface area, building height and maintenance intensity. They proposed
using a stratum classification approach, which describes the changes in ecosystems over
time (e.g., accumulation of soil organic matter) through the layers of vegetation (Bournerias,
1979). A vegetation type under this system is named according to the upper stratum that
represents more than 20% of the total area of vegetated cover (and which includes the

97
strata of the lower classes). The three ecological types proposed by these authors for
extensive green roofs include:
Muscinal stratum: composed of cryptograms, fungi and small herbaceous plants including creeping succulents (like Sedum);
Herbaceous stratum: dominated by (non-woody) herbaceous flowering plants and grasses that can exceed 1 meter in height at maturity;
Arbustive stratum: woody species (shrubs, young trees) from 1 to 7 meters high;
In this classification, the muscinal stratum is equivalent to extensive green roof, the
herbaceous stratum to semi-intensive, and the arbustive stratum to simple-intensive green
roof. While this approach is helpful to awakening the notion of treating green roofs as
functional ecosystems, the classification framework proposed does not allow for the
characterisation of different types of plant communities within each stratum. Also, the
terminology does not facilitate understanding that these hierarchical strata may be nested
within each other. Just as phytosociology is perhaps too specific for green roofs, this
stratum method may be too vague.
With the aim of quantifying the functional diversity of different green roof systems, a study
in Belgium allocated a total of twenty-nine trait values to the species lists of 57 commerical
green roof systems (Van Mechelen et al., 2015). Resonant with most (if not all) ecological
green roof studies, the latter found that green roofs with deeper substrates supported the
greatest plant diversity; accordingly, deeper roofs also supported the highest functional
diversity. Clustering the 57 roof systems resulted in three types, each characterized by a
number of significant indicator species and attributes. The “Sedum type” (22 systems) has
the shallowest depth (50 mm on average), features succulent species installed mainly by
cuttings or mats, and has significantly lower species richness than the other two types. The
“Dianthus-Thyme type” (27 systems) occurs on depths of around 90 mm and, installed by
seeding, features diverse taxa including Sedum. Lastly, the “Linaria-Galium type” (8 systems)
has similar depths and species richness to the latter but is installed mainly by plugs and
features a near absence of succulent species. Being limited to lists of initial species
composition, field research is needed to advance the results of that work from theory to
practice.
Having been informed that the EGRs surveyed for this reseach had not been maintained for
several years, one research question that arose inquired whether emergent community
characteristics could be detected. The concept of emergence implies that the properties of a

98
species assemblage cannot be entirely explained by its individual components (Mayr, 1982).
Uncertain of what the fieldwork would reveal, the philosophical basis of this question placed
observation and description first, such that the possibility of discerning underlying processes
could potentially lead to theory. This approach is contrary to mainstream scientific practice,
which has traditionally created theory first (Ponge, 2005). In terms of the roofs surveyed,
emergent properties might be defined as convergence (or divergence) of species
assemblages, which could result if the patterns, processes and interactions on all EGRs lead
to similar (or different) outcomes. This could be measured at various levels, whether species
diversity and species assemblage, proportionate cover by different growth forms, or other.
If mature EGR vegetation expresses consistent characteristics on different roofs regardless
of location, supplier, installer, etc., then a degree of complexity greater than the effect of
individual species could be described as emergence. By contrast, emergence would not
apply if all EGRs support completely unique vegetation.
3.1.3 Research aims and questions
This chapter continues to refine the research questions and aims of the previous chapter,
and also undertakes the question of emergence, which can be condensed into three specific
objectives.
Aim: To characterize mature EGR vegetation in terms of LF cover abundance and species diversity
Question: If successional change can be observed on EGRs, what are the main drivers & mechanisms?
Question: Do emergent characteristics result with time?
3.1.3.1 Objectives of the chapter
The objective for this chapter is to classify the EGR vegetation surveyed according to
similarities/ dissimilarities, and applies different analyses to extract any patterns.
To determine species persistence and loss on EGRs after more than 20 years
To characterise EGR vegetation: grasses and succulents
To classify EGR vegetation into communities or vegetation types

99
3.2 Methods
The methods of data collection will not be repeated, but the methods and approaches taken
for the analyses are outlined. All statistical tests used the software package SPSS versions
19-22 (IBM, Inc.)
3.2.1 Data analysis
3.2.1.1 Defining persistence and colonisation
Documentation and background information were available for a few of the roofs surveyed
(Tübingen, Stuttgart roofs), and will be used to enhance the snapshot surveys in evaluating
EGR vegetation development. Technical documentation for some of the roofs was available
from ZinCo in the form of sale offers, technical drawings or roof summaries, and staff from
some of the buildings had retained original documentation in the form of invoices,
drawings, and correspondences. Species lists were limited to sales offers or footnotes from
architectural plans. Granted, without final invoices there is no guarantee that the materials
specified were used, particularly since species lists may be revised at the last minute with
substitutions (personal experience). Still, since the EGRs are assumed to line up with
industry standards, we can also assume that their species lists are relatively consistent.
Certain assumptions were therefore made to form a basis from which to understand how
the vegetation may have attained its current composition. Given the original species lists
that were available, and the knowledge of typical EGR plant lists, “intentionality” was
defined as a confident, if rudimentary, metric for characterising EGR vegetation. Intentional
species are defined as having been on the original plant lists, or are assumed to have been
planted or sown. It is highly likely, for instance, that typical green roof plants (e.g., Achillea
millefolium, Campanula rotundifolia, Dianthus spp, Sedum spp.) were intentional and have
therefore persisted over time. Intentional grass species, according to original
documentation, include Agrostis tenuis, Festuca ovina, F. rubra, Poa compressa, P.
angustifolia and Setaria viridis.
Non-intentional species, by contrast, are those that are able to colonise and self-establish
through dispersal mechanisms, like wind-blown seed. Cryptogams like mosses and lichens
are highly mobile growth forms because of their spore-based reproduction (Doyle, 1970). In
addition, it is unlikely that tree seedlings or wind-dispersed ruderals (e.g., Convolvulus
arvensis, Erigeron annuus, Medicago lupulina, Taraxacum agg.) were intentionally planted

100
or sown. Grass species absent from the species lists and likely colonisers include Agrostis
stolonifera, Arrhenatherum elatius, Poa angustifolia, Vulpia myuros. The distinctions of
intentional/ non-intentional are given in the master species list of Appendix 2.
3.2.1.2 Characterising grasses and succulents
Grasses are adaptable and variable growth forms that occupy a wide range of habitats, soil
types and climatic zones, including nutrient-rich agrarian landscapes, salt marshes, semi-arid
plains and harsh alpine crags (Hubbard, 1992, Burrows, 1990). By contrast, the succulents
most frequently used on EGRs, from the Crassulaceae, are hardy perennials of well-drained
sites and usually originate from habitats typified by limited moisture and direct exposure to
solar radiation (Stephenson, 1994, Snodgrass and Snodgrass, 2006). On the basis of the
ecological distinctions between these growth forms, different approaches are used to
characterise them.
3.2.1.2.1 Method for characterising EGR grasses
Given the range of ecological niches that grasses can occupy, not to mention their plasticity
(Hubbard, 1992), and considering that EGRs are especially susceptible to stress and
disturbance, which are two of three selective forces directing a plant’s adaptive strategy
(i.e., CSD equilibrium), allocating CSR signatures to grasses can help to characterise their
ecology, habitat, and their role to mature EGR vegetation. CSR theory was introduced in
Chapter 1 as a coherent and predictive a model for natural succession, but it can also give
insight into the properties of a habitat through the life history traits and phenologies of the
species living there (Grime, 2001). From a reference list of ca. 1,000 European species
allocated with CSR signatures, each grass species identified was ascribed with an adaptive
life strategy (Hunt et al., 2004). In cases where an EGR species was not on the reference list,
the signature of its nearest equivalent (from the basis of taxonomic and ecological
similarity) was used. This occurred only in the case of Agrostis tenuis, for which the nearest
equivalent chosen was A. canina.
3.2.1.2.2 Method for characterising succulents
Since the succulents typical of EGRs can create extensive cover with only a few species/
cultivars, usually reproducing vegetatively, cover abundance by proportion with the cover of
other growth forms is a practical measurement for assessing their role to mature EGR
vegetation. In order to evaluate the role of succulents to the EGR vegetation sampled, the
mean cover values that were estimated per growth form per quadrat were re-calculated as

101
proportionate to 100% total cover (Table 3.1). So, while the analyses of the previous
chapter(s) represented the vegetation as over-lapping layers, this analysis has the
advantage of removing the overlap above low-growing spreading succulents by taller
statured forbs, grasses and any woody species.
Table 3.1. Comparing cover by succulents/ quadrat in (versus not) in proportion with other growth forms.
Mean succulent cover/ quadrat Standard Deviation
Roof name Non-proportionate Proportionate Non-proportionate Proportionate
FH Nürtingen 6.50 19.73 6.03 39.80
Köngen 40.50 55.72 18.93 49.67
Pliensau 50.07 96.74 22.37 17.77
Tübingen 26.12 56.92 6.12 49.52
VB A1 27.34 33.41 7.88 47.17
VB A2 15.15 17.58 5.15 38.06
Rathaus-PV 33.52 42.80 9.14 49.48
Rathaus-lower 23.27 34.55 9.12 47.55
Killesberg 26.08 38.18 13.40 48.58
A comparison of the two datasets (not proportionately corrected versus proportionate)
illustrates that around 20% of the original data is not explained (R2=0.79202). Re-configuring
succulent cover proportionate to 100% with the other growth forms can therefore elucidate
some differences not yet addressed by the role of succulents to EGR vegetation. The upper
right quadrant of Figure 3.2 represents EGRs with both high succulent cover and a high
proportion of other growth forms. The data point in that corner, for Pliensaufriedhof,
illustrates that succulents had the most cover overall (mean: 50.7% ± 22.37) yet, when
calculated in proportion with other growth forms, succulent cover was nearly 100% (mean:
96.74% ± 17.77). The absence of data points at the top left of the graph mean that bare soil
was not observed on the roofs surveyed, while the bottom right implies that no roofs had
high cover by succulents and low proportion of other growth forms. The lower left quadrant
represents roofs that had low succulent cover and a low proportion of other growth forms.
The lowest two points (FH Nürtingen and VB Area 2) had low succulent cover whether
proportionately corrected with other growth forms (mean: 19.73% ± 39.80; 17.58% ± 38.06)
or not (mean: 6.50% ± 6.03; 15.15% ± 5.15) (resp.).

102
Figure 3.2. Re-configuring succulent cover proportionate to 100% with the other growth forms
explains more about this growth form than the original, not proportionately corrected data (R2=0.79).
In order to determine if there was a significant difference in proportionate cover by the six
growth forms on the nine roofs surveyed, a Related-Samples Friedman’s Two-Way Analysis
of Variance by Ranks was conducted. This non-parametric test was used because the
sampled populations are not normally distributed.
3.2.1.3 Method for classifying EGR vegetation types: cluster analysis
Using the data re-configured by the analyses above, the nine EGRs surveyed will be grouped
according to (dis)similarities in their vegetation composition. Cluster analysis is a multi-
variate statistical technique for grouping objects based on calculations of all the inter-object
(dis)similarities (Willett, 1988, Krzanowski, 2000, Divjak and Fieller, 2014). Clustering
methods are heuristic, or experience-based, techniques for problem solving and discovery
but, though the groups created take reference to some concept of “what a group embedded
in some space should be like” they cannot usually refer to the processes occurring in the
field (Legendre and Legendre, 2003) (p. 306). The hierarchical formation of clusters is
illustrated with a dendrogram model. If the EGRs sampled can be satisfactorily distinguished
into groups, then this may support the classification of different EGR vegetation types and
inform the research question of whether emergent properties arise on EGRs.
Specifically, the nine EGRs were clustered based on proportionate life form cover using
hierarchical clustering and average linkage. Agglomerative (“bottom up”) algorithms were
used whereby each observation begins in its own cluster and the groups gradually emerge
further up the hierarchy. The resulting polythetic classifications allow each roof in a cluster

103
to have some, or many, terms in common with each of the other roofs in that cluster, but
without any specific terms required for cluster membership (Divjak and Fieller, 2014).
Ward’s method was used because it is known to give a reliable result for uncertain analyses.
Ward’s allows two clusters to merge “if the increase in sum of squared distances of the
members of the new cluster from their mean is smaller than for any other possible merger
between two clusters” (Divjak and Fieller, 2014, p. 426). The use of squared distances
“penalises spread out clusters and so results in compact clusters without being as restrictive
as complete linkage” (ibid).
3.3 Results
3.3.1 EGR species composition after 20-30 years: persistence, loss and gain
As per the methods and materials described above, the abundance data from each roof was
re-calculated at the level of quadrat (i.e., sampling plot) for the proportion of persistent
(intentional) versus colonising (non-intentional) species coverage per roof. Most roofs had
between 60 and 95% cover by intentional species (Table 3.2). Maximum coverage by
intentional species for all roofs was upwards of 86%, of which three roofs had at least one
quadrat with 100% coverage by intentional species and five others had quadrats with over
90%. Minimum coverage by persistent species was generally above 50%, although one roof
(FH Nürtingen) had a minimum of 32% cover on one quadrat. Most of the roofs surveyed
had more than 70% mean cover by intentional species with a moderate range across
quadrats. The high mean values can be attributed to the Sedum basis of all roofs, and the
range may indicate the conditions that permit a diversification of vegetation, whether slope,
aspect, depth, or other.
Table 3.2. Proportion and cover (%) by intentional species for nine EGRs after 20-30 years.
Roof name (in order of age)
Total # species
Intentional species (%)
% cover abundance that was intentional
average plot min. max.
Killesberg 23 57 75.7 59.6 92.3
Rathaus-PV 26 62 77.5 64.9 94.0
Rathaus-low 30 47 69.8 52.8 86.4
FH Nürtingen 32 41 66.5 32.0 93.6
Köngen 9 56 89.7 55.0 100.0
Tübingen 21 67 89.3 74.7 99.5
VB A1 21 57 88.7 68.3 100.0
VB A2 21 62 78.1 63.6 94.7
Pliensau 11 36 96.5 81.6 100.0

104
FH Nürtingen (FH Nue) stands out from the other roofs with the largest range (32 to 93.6%
cover) (Figure 3.3). This variation is most certainly due to the range of conditions across this
roof and the opportunities presented to different species. In particular, one edge of this roof
touched the wall and occurred under the drip zone of that adjoining roof, which created
shaded, mesic conditions that supported (unintentional) species not found on any of the
other EGRs, including mosses (Polytrichum juniperum, Eurhynchium praelongum, Philonotis
fontana), forbs (e.g., Geum urbanum), and a colony of orchids (Dactylorhiza fuchsii). The
opposite edge of the same roof had an unusually shallow substrate that supported hardy
xerophytes including (unintentional) mosses and lichens (e.g., Racomitrium elongatum,
Cladonia spp).
Figure 3.3. Mean cover abundance (%) by intentional species for nine EGRs, as well as range.
The two roofs with the highest cover abundance by intentional species, Köngen and
Pliensau, also recorded the fewest species, which were dominated by Sedums. For Köngen,
the large range of intentional versus non-intentional species cover may be attributed to the
range of conditions provided by the two pitched roofs; while the north-face supported tall
grasses and herbs, as well as a moss (Calliergonella cuspidata) typical of moist, base-rich
habitats (British Bryological Society, 2015), the south-face was xeric and Sedum-dominated.
Mean cover (%) by intentional species per quadrat on this roof was quite high – almost 90%
–because the (intentional) Sedums maintained an extensive ground cover. Similar to

105
Köngen, Pliensaufriedhof in Esslingen had a very high mean cover (96.5%) by intentional
species due to dominance by Sedum species. The tiny range here is attributed to the small
species list on a homoegenous roof area; other than three species of Sedum and a patch of
Teucrium chamaedrys, the survey recorded single individuals of Convolvulus arvensis, an
unknown Geranium species, an unknown herb, a couple occurrences of Hieracium pilosella,
Taraxacum agg, and Vicia sepium, and a few Pinus seedlings.
The other six roofs are somewhat more consistent in the mean and range of cover by
intentional species. The Gärtnereihof Tübingen had extensive Sedum ground cover
diversified slightly by the 15 slope and the north-south gradient. The two roofs at Esslingen
Verkehrsbetrieb (VB A1 and VB A2) were apparently installed with identical materials and
species within days of each other, as were the three Stuttgart roofs (the Rathausgarage
complex within days; Killesberg a year later). Non-intentional species on these six roofs
included between two and seven species of cryptogams (lichens, mosses), a few individuals
of weedy herbs (e.g., Crepis tectorum, Hypericum perforatum, Potentilla argentea, P. recta,
Picris hieracioides, Taraxacum agg, Trifolium spp, Verbascum spp), a fine-leaved annual
grass (Vulpia myuros) and a few tree seedlings. In spite of their similarities, these roofs
recorded varying numbers of species and of intentional and colonising species.
By contrast to the mean cover values discussed above, percent cover by intentional species
is much less in relation to number of species (Figure 3.4). This graph shows a sort of
polarisation of extremes, in which the roofs with either the most or the fewest species also
had the lowest cover by intentional species. In spite of their domination by Sedum, cover by
intentional species on the two species-poor roofs accounted for less than 40% (Pliensau)
and just under 60% (Köngen). At the right of the graph, FH Nürtingen is apparent with its
thirty-two species, of which around 40% were intentional. Stuttgart Rathausgarage lower
roof had thirty species, of which just under 50% were intentional. These extremes contrast
quite clearly with the five other roofs, which had between twenty-one and twenty-six
species and higher cover by intentional species, between 55-70%.

106
Figure 3.4. Number of species and the proportion (%) that was intentional and persisted on nine EGRs
> 20 years.
In order to portray the composition of intentional/ non-intentional species, two roofs with
original species lists shall be investigated more closely. As mentioned in the methods, if
species from original lists did not appear in the quadrat sampling, whole-roof
reconnaissances were conducted to confirm presence or absence.
3.3.1.1 Gärtnereihof Tübingen
The twenty-one species recorded at Gärtnereihof Tübingen included half (twelve) of the
original list (total 24 species) while nine of the species observed were not on that list (Table
3.3). Of the fourteen species that persisted, six of the eight succulent species maintained
extensive cover, in particular Sedum floriferum, S. hybridum and S. sexangulare, which were
recorded in nearly all of the sixteen quadrats sampled. The other eight persistent species
are relatively common on EGRs, especially Dianthus deltoides, Festuca ovina, F. rubra and
Hieracium pilosella, Petrorhagia saxifraga and Thymus praecox, though most were found in
fewer quadrats than the persistent succulents. The twelve species from the original list that
were not found in the 2010 surveys included three succulent species (S. acre, S. cauticolum,
and Sempervivum spp.) and two cultivars of Festuca rubra. Cultivated form or not, the F.
rubra identified in 2010 did not form a visible component of the vegetation and was only
found in three of the sixteen quadrats. The other lost species are otherwise commonly
found on green roof plant lists (Achillea millefolium, Sedum acre, Sempervivum spp.) or
occur in analogous habitats, like dry meadows (Daucus carota, Origanum vulgare) or in

107
disturbed, anthropogenic habitats (Lolium perenne, Matricaria chamomilla). It’s possible
that these species were extirpated by an event, like intense drought, and lacked the
seedbank to rejuvenate.
Table 3.3. Of the twenty-four species originally planted/ sown on Tübingen Gärtnereihof, only fourteen remained and seven new species were recorded in 2010.
Gärtnereihof Tübingen, species list Total cover
# quadrats (of 16)
Achillea millefolium 0
Agrostis tenuis TRACENTA 0
Daucus carota 0
Dianthus alpinus 0
Dianthus deltoides 10 1
Festuca ovina duriusenta SCALDIS 61 5
Festuca rubra commutata ATLANTA 21 3
Festuca rubra rubra PERNILLE 0
Festuca rubra trichophylla ARTIST 0
Hieracium pilosella 6 2
Lolium perenne MAJESTIC 0
Matricaria chamomilla 0
Origanum vulgare 0
Petrorhagia saxifraga 84 8
Poa pratensis BARON 18 2
Poa pratensis angustifolia 1 1
Sedum acre 0
Sedum album Coral Carpet 17 4
Sedum cauticulum 0
Sedum floriferum "Weihenstephaner Gold" 565 14
Sedum hybridum "Immergrünchen" 1286 16
Sedum reflexum 35 8
Sedum sexangulare 612 14
Sedum spurium "Coccineum" 410 12
Sempervivum spp. 0
Thymus praecox cv 634 10
# species persistent: 14
# species lost: 12
New in 2010
Acer campestre 1 2
Acer pseudoplatanus 1 1
Arrhenatherum elatius 1 3
Fragaria vesca 26 2
Hypericum perforatum 5 1
Trifolium pratense 5 1
Vicia hirsuta 390 15
# species gained: 7

108
Total species recorded in 2010: 21
Of the seven new species identified in 2010 in Tübingen, most were limited to a few
quadrats although Hairy vetch (Vicia hirsuta) occurred in fifteen of the sixteen quadrats with
considerable cover. The other colonising species included two tree seedlings, a few
specimens of Wild strawberry (Fragaria vesca), and unique instances of Tall oat-grass
(Arrhenatherum elatius), Red clover (Trifolium pratense) and Perforate St. John’s Wort
(Hypericum perforatum). The success of the Vicia is likely due to its annual life cycle and its
capacity to fix nitrogen, while the limited extent of the other species may be due to the
same drivers and mechanisms that prevented some of the original species from persisting,
whether extinction from a drought event, lacking seedbank, or the limited resources
associated with EGR growing conditions.
3.3.1.2 Rathausgarage PV roof
The twenty-seven species recorded at Rathaus PV included sixteen from the original list and
eleven new species (Table 3.4). The most abundant of the intentional species included
Allium flavum, Linum perenne, Sedum reflexum, S. sexangulare, and Setaria viridis, all
occurring in ten or more of the fifteen quadrats sampled. The Small yellow onion (Allium
flavum) was visually prominent here during its flowering period, and the relatively low cover
values (compared to the Sedum species) reflect the vertical structure of this thin-leaved
growth form. The blue flowers of Perennial flax (Linum perenne) also make a strong visual
impression on this roof; its frequency (13/ 15 quadrats) and total abundance (307%) was
similar to S. sexangulare (347%). Although it was abundant and frequent, the Green bristle
grass (Setaria viridis) was only evident upon close inspection due to its small stature; it can
grow 100-600 mm high (Hubbard, 1992), but never exceeded 100 mm (data not shown).
Table 3.4. Of the 39 species originally planted/ sown on Rathaus-PV, only 16 remained and 11 new species were recorded in 2011.
Rathaus-PV, species list Total cover # quadrats (of 15)
Agrostis tenuis 0
Allium flavum 90 10
Dianthus carthusianorum 48 6
Dianthus deltoides 18 1
Digitaria sanguinalis 0
Festuca mairei 0
Festuca ovina 129 7
Hieracium pilosella 87 5
Inula hirta 0

109
Linum perenne 307 13
Nepeta musinii 0
Nepeta racemosa 49 2
Onobrychis sativa 0
Plantago major 0
Poa compressa 9 2
Poa nemoralis 0
Polygonum aviculare 0
Potentilla argentea 0
Rumex acetosella 0
Saponaria ocymoides 0
Saxifraga aizoon 0
Sedum acre 0
Sedum album 0
Sedum album Coral Carpet 0
Sedum album Murale 0
Sedum cauticolum 0
Sedum floriferum 0
Sedum hybridum 474 9
Sedum reflexum 1191 15
Sedum sexangulare 342 13
Sedum spurium 0
Sedum telephium 4 2
Sempervivum spp 0
Setaria viridis 851 11
Silene uniflora 0
Thymus pulegioides 0
Thymus serpyllum 50 6
Trifolium arvense 0
Veronica spicata 39 5
# species persistent: 16
# species lost: 23
New in 2011
Crepis tectorum 520 15
Lichen Cladonia cf. scabriscula 107 6
Lichen Peltigera spp. 10 3
Moss Hypnum1 163 9
Moss Bryum2 148 8
Moss starry yellow 40 1
Picris hieracioides 3 1
Potentilla erecta 39 6
Potentilla neumanniana 122 11
Taraxacum agg. 21 9
Trifolium campestre 51 5
# species gained: 11

110
Total species recorded in 2011: 27
The twenty-three species from the original list that were not found in 2011 (59%)
represented all growth forms, including grasses, succulents, and herbaceous perennials.
While it was not surprising that species normally found in mesic meadows did not persist
(e.g., Inula hirta, Nepeta musinii, Rumex acetosella), several species of disturbed wastelands
and rocky habitats did not persist either, including some with ruderal characteristics
(Polygonum aviculare, Plantago major, Poa nemoralis, Saponaria ocymoides, Saxifraga
aizoon, Trifolium arvense) and several stress-tolerant succulents (Sedum acre, S. album, S.
cauticolum, S. floriferum, S. spurium, Sempervivum spp.), suggesting that effects beyond
adaptive strategy can influence extirpation from an EGR.
Among the eleven spontaneous colonisers, Narrowleaf hawksbeard (Crepis tectorum) was
exceptionally prevalent and occurred in every quadrat; its high total abundance can be
explained by basal rosette leaves. The name of this species implies its affinity for the roof
habitat, which includes the cracks of roofing tiles (Archibold and Wagner, 2007) and
exemplifies its ruderal qualities (Grime, 2001). Five of the eleven new species were
cryptogams, some of which occurred in over half the quadrats (Hypnum 1, Bryum 2).
3.3.1.3 Rathausgarage lower roof
The thirty species recorded on the lower roof of the Rathausgarage complex included
thirteen from the original list and seventeen new species (Table 3.5). Compared to the
neighbouring PV roof, the lower roof had three fewer persistent species and seven more
colonisers. The most abundant of the intentional species included Dianthus carthusianorum,
Linum perenne, Sedum reflexum, S. sexangulare, and Setaria viridis, all occurring in ten or
more of the fifteen quadrats sampled. Of the 39 species on the original list, twenty-six were
no longer present in 2011. Some of these absent species could have been overlooked in the
sampling work, being fine and inconspicuous (Agrostis tenuis) or possibly confused with
other species/ cultivars in the sampling (Festuca marei, Potentilla spp, Thymus spp).
However, most of the absent species are easily recognizable and should have been apparent
in the reconnaissance surveys had they been present on this roof (e.g., Digitaria sanguinalis,
Inula hirta, Nepeta spp, Onobrychis sativa, Plantago major, Polygonum aviculare, Saponaria
ocymoides, Saxifraga aizoon, Silene uniflora).

111
Table 3.5. Of the 39 species originally planted/ sown on Rathaus-lower roof, 13 persisted and 17 new species were recorded in 2011.
Rathausgarage-lower, species list Total cover
# quadrats (of 14)
Agrostis tenuis 0
Allium flavum 74 3
Dianthus carthusianorum 283 12
Dianthus deltoides 0
Digitaria sanguinalis 0
Festuca mairei 0
Festuca ovina 116 7
Hieracium pilosella 210 6
Inula hirta 0
Linum perenne 168 12
Nepeta musinii 0
Nepeta racemosa 0
Onobrychis sativa 0
Plantago major 0
Poa compressa 42 5
Poa nemoralis 0
Polygonum aviculare 0
Potentilla argentea 0
Rumex acetosella 0
Saponaria ocymoides 0
Saxifraga aizoon 0
Sedum acre 1 1
Sedum album 0
Sedum album Coral Carpet 0
Sedum album Murale 0
Sedum cauticolum 0
Sedum floriferum 0
Sedum hybridum 280 3
Sedum reflexum 879 13
Sedum sexangulare 143 10
Sedum spurium 0
Sedum telephinium 0
Sempervivum spp 0
Setaria viridis 595 13
Silene uniflora 0
Thymus pulegioides 0
Thymus serpyllum 196 5
Trifolium arvense 0

112
Veronica spicata 105 8
# species persistent: 13
# species lost: 26
New in 2011
Acer pseudoplatanus 1 1
Crepis tectorum 509 14
Cladonia cf scabriscula 15 3
Peltigera spp. 4 3
Moss Hypnum1 183 8
Moss Bryum1 100 5
Moss Brachythecium cf. albicans1 96 4
Moss Brachythecium cf. albicans3 67 4
Moss Bryum2 235 13
Petrorhagia prolifera 30 3
Picris hieracioides 17 5
Potentilla neumanniana 167 11
Potentilla recta 36 4
Taraxacum agg. 18 7
Trifolium campestre 5 2
Verbascum nigrum 2 1
Vulpia myuros 53 4
# species gained: 17
Total species recorded in 2011: 30
Among the seventeen spontaneous colonisers, the most abundant species were Crepis
tectorum, Potentilla neumanniana and the Moss labelled Bryum2. The latter occurred in
thirteen (of fourteen) quadrats, but most of the other six colonising cryptogams occurred in
three to five quadrats, with one (Hypnum 1) found in eight. Potentilla neumanniana, a
stress-tolerator (Grime, 2001) commonly found on green roof species lists (ZinCo GmbH,
2014) was relatively frequent, occurring in eleven quadrats on this roof but only as a few
individuals. In addition to two additional cryptogams, some other colonising species
occurred on the lower but not the PV roof, like an Acer seedling, a few specimens of
Petrorhagia prolifera, the biennial Verbascum nigrum and the annual grass, Vulpia myuros.
3.3.1.4 Discussion
Comparisons between original species lists and the vegetation surveys of 2010 and 2011
suggest that up to half of the originally planted/ sown species did not persist after > 20
years. The conceptual framework relating biodiversity dynamics with environmental change

113
is useful for discussing this, particularly as EGR systems are known to be susceptible to
catastrophic climatic episodes that can lead to the extinction of entire taxonomic groups
[e.g., soil arthropods, as per Rumble and Gange (2013)]. A “forcing event” like this creates
complex causal chains and contingencies that cause the extinction or immigration of one or
more populations or species, whether immediate or delayed (Jackson and Sax, 2010). Such
stochastic factors can ultimately drive species over their extinction threshold, especially if
they are rare (and therefore vulnerable to extinction) (Hanski and Ovaskainen, 2002).
Central to this framework is the notion of “biodiversity balance”, however, which is defined
as the net difference between immigration (immediate or eventual) and extinction (Jackson
and Sax, 2010). So, while a climate extreme may induce mortality among remaining
populations, it can also lead to pulses of recruitment that facilitate persistence (Jackson et
al., 2009). growth form
With regards to the species that were observed by these surveys, the “new” or colonising
species were both more numerous (Rathaus lower) and less so (Rathaus PV, Tübingen) than
the species that persisted. Successful colonisation is only possible given a number of
requirements, including suitable sites, sequential successes in the dispersal of propagules,
establishment of individuals, survival to reproductive maturity, and growth and persistence
of populations via continued reproduction (Jackson and Sax, 2010). As described already, a
couple studies have examined colonisation on EGRs, with the longest observation being six
years (Dunnett et al., 2008). Several German studies that surveyed old green roofs refer to
the importance of seedbank for the maintenance of species diversity on green roofs over
time (Buttschardt, 2001, Köhler, 2006, Köhler and Poll, 2010). A similar commentary was
made by a comparative study of three mesocosms in the UK (two EGR build-ups with 100
and 150 mm substrate, and one control of 150 mm EGR substrate over topsoil), whereby
fewer species were able to flower and seed over one growing season due to the limitations
to seed bank recharge (Olly et al., 2011). It is also important to recall that “intentional” in
the case of EGR species lists may include species that are sometimes considered to be
‘weedy’, such as H. pilosella. This species has been on EGR species lists since the early days
(Krupka, 1992) and was present on the existing species lists (i.e., FH Nürtingen, Tübingen, all
3 Stuttgart roofs). While gardeners or horticulturalists might perceive it as a weed,
Hieracium maintains excellent cover with its basal rosette and its enduring yellow flowers
are a great resource for pollinators. With regards to grasses, colonising species were

114
minimal both in cover abundance and in stature. The annual grasses are so small they are
easy to overlook, while larger unintentional grasses like Arrhenatherum elatius and Poa
angustifolia only occurred in special conditions like deeper soils (e.g. on anthills or small
mounds), shade or sheltered edges.
3.3.2 Characterising EGR grasses and succulents
Since analyses from the previous chapter indicated that grasses and succulents responded
uniquely to many of the variables to which other growth forms had strong associations, they
shall be examined more closely using the methods described above, in order to further the
research aim of characterising mature EGR vegetation.
3.3.2.1 Grasses: relative cover with other growth forms
In order to determine the effect of grass cover on the vegetation composition of the EGRs
surveyed, mean cover values were calculated per roof and re-calculated as proportionate to
100% total cover (Table 3.6). The aim was to remove any physical overlap by the growth
forms and demonstrate their proportionate cover. Relative to total cover by all growth
forms per roof, grass cover appears to decline over time (column 3: Relative total abund. (%)
grass). The four oldest roofs had less than 5% relative cover abundance by grasses, whereas
the five youngest EGRs had around or over 20%. Of all the species identified on these roofs,
grasses rarely made up more than 20% of the species composition (column 4: % species that
were grasses). Other than Pliensaufriedhof, which did not feature any grasses in the
sampling area, most roofs had around or less than 20% cover by grasses. The final two
columns of Table 3.6 list the maximum and minimum grass cover recorded for each roof,
and demonstrate the variation in grass cover per quadrat. Several roofs feature at least one
quadrat without any grasses (0%) and others had considerable grass cover (e.g., Killesberg
over 65%, Rathaus-PV over 35%, VB A2 over 25%). The roof with the greatest maximum,
Köngen, had two quadrats with between 95- 98% grass cover (Festuca ovina, Q13, N-Q1)
and one quadrat with the minimum of 3% (Poa angustifolia, Q11).

115
Table 3.6. Proportional cover abundance on 9 EGRs with interest in grass cover and diversity.
Roof name (in order of age)
Total # species
Relative total abund. (%) that was grass
% species grasses
Grass cover (%) per plot
maximum minimum
Killesberg 23 34.50 13.00 65.79 0.00
Rathaus-low 30 17.40 13.30 37.89 0.92
Rathaus-PV 24 20.10 11.50 35.13 0.00
FH Nürtingen 32 40.20 21.90 57.91 28.99
Köngen 9 28.70 22.20 100.00 3.45
Tübingen 21 2.80 23.80 12.88 0.00
VB A1 21 0.80 9.50 5.45 0.00
VB A2 21 4.30 19.00 25.52 0.00
Pliensau 11 0.00 0.00 0.00 0.00
The relationship between total cover abundance (%) by grasses per roof (i.e., recorded in all
quadrats) and the proportion (%) of those grasses that were intentional and persisted over
time is illustrated in Figure 3.5 (values given in Table 3.7). This makes it clear, for example,
that a large proportion of FH Nürtingen (at the right extreme of the chart) was grassy.
Indeed, 138% of the total cover abundance on that roof comprised grass species and, of
those species, almost 70% were intentional. Next in grassy abundance, of the 80% cover
that grasses comprised of the total plant cover on Killesberg, almost 70% were intentional
species that had persisted over 20 years. At the opposite extreme, Tübingen and the two
Verkehrsbetrieb roofs supported very few grasses (as indicated by their location along the x-
axis), but over 80% of the grasses sampled were intentional species that had persisted over
time (Agrostis tenuis, Festuca ovina, F. rubra, Poa angustifolia, P. compressa). The other
roofs (Köngen and the Rathausgarage complex) had equally high proportions of intentional
grass species, from total cover abundance by grasses of between 40% and 70%. It appears
that the majority of grasses on the EGRs surveyed were intentional, suggesting that
colonisation pressure by grasses is low.

116
Figure 3.5. Total abundance (%) comprising intentional grass species for nine EGRs.
Table 3.7. Total grass cover abundance and the proportion (%) that comprised intentional species on nine EGRs.
Roof name (in order of age)
Total grass abundance
Intentional cover (%) that was grass
Killesberg 233.4 75.9
Rathaus-PV 330.7 70.4
Rathaus-low 327.5 77.6
FH Nürtingen 343.0 65.3
Köngen 142.8 85.8
Tübingen 262.8 89.4
VB A1 213.3 88.1
VB A2 209.1 78.5
Pliensau 156.9 96.7

117
3.3.2.2 Adaptive life strategies of typical EGR grass species
All grass species were ascribed with an adaptive life strategy from a reference list of ca.
1,000 European species allocated with CSR signatures (Hunt et al., 2004) (Table 3.8).
Table 3.8. Life strategies of the grasses identified on the EGRs surveyed, using CSR signatures
Grasses identified CSR signature
Original list?
Occurrence
Agrostis stolonifera L. CR FH Nürtingen
Agrostis tenuis L. SR/CSR Yes Esslingen VB roofs (both)
Arrhenatherum elatius L. C/CSR FH Nürtingen, Tübingen
Festuca ovina L. S Yes all roofs except Pliensau
Festuca rubra L. CSR Yes FH Nürtingen, Tübingen
Poa angustifolia L. Gaud. S/CSR Yes Tübingen, VB A2
Poa compressa L. S/CSR Yes FH Nürtingen, VB A2, both Rathaus
Poa angustifolia L. CSR Köngen, Tübingen
Setaria viridis L. P.B R Yes three Stuttgart roofs
Vulpia myuros L. C.C. Gmel. R Rathaus PV, Killesberg
One of the most popular grasses for EGRs, Festuca ovina, is a classic stress-tolerator (S-
strategist) (Grime, 2001). S-strategists can persist through frequently stressful conditions
that other species cannot tolerate, like shallow, well-drained mineral soils in high light
environments. Commonly known as Sheep’s fescue, this densely tufted perennial is
productive in open situations, like heath, moor or mountain grassland, on rather poor, well-
drained shallow soils (both basic and acidic) (Grime and Curtis, 1976, Hubbard, 1992). This
species does not have rhizomes but reproduces through profuse seed rain, such that the
gaps in the vegetation may be full of its seedlings (Grime and Curtis, 1976). F. ovina was
indeed the most prominent grass observed, occurring on every roof. It was on all the
available species lists, so may have been sown on the roofs for which no lists were available,
too. The fact that it remains so consistently abundant may be owing to its strategy as a
stress-tolerator.
The next most prominent grass, Poa compressa is both stress-tolerator and a generalist (S/
CSR) that occurred on four of the roofs surveyed (FH Nürtingen, VB A1, and both
Rathausgarage roofs). Commonly known as Flattened meadowgrass, this is the
characteristic species of the “Typical Poa meadow” identified by green roof
phytosociologists for spontaneously vegetated gravel roofs. That community covered the
greatest surface area of all the TPGs surveyed in Göttingen (Bornkamm, 1961), Berlin

118
(Darius and Drepper, 1983) and Osnabrück (Bossler and Suszka, 1988), but was less
represented in Karlsruhe (Buttschardt, 2001) and Switzerland (Thommen, 1988), possibly
due to climate or variations in substrate depth. Bornkamm found that recently installed TPG
roofs in Göttingen were first colonized by weedy annuals, and that this shifted after about
10 years to dominant cover by Poa compressa. A stiff perennial which spreads by wiry
rhizomes, P. compressa colonises sites with shallow, well-drained soils such as poor
grassland, dry banks and wasteground, as well as the tops of old walls and ruins (Hubbard,
1992). Its spreading root system sometimes develops into clonal colonies, which may
explain the cover it maintains over time. This grass was on some of the original species lists.
Given their stoloniferous habits and partly ruderal life strategies, the two tufted perennial
Agrostis species were not as prevalent as one might have expected. The competitive-ruderal
(CR) Agrostis stolonifera only occurred on one roof (FH Nürtingen), where its leafy stolons
formed a dense sward along with Poa compressa. The frequency of this grass (9/ 15
quadrats) contributed to the meadow character of this roof. Competitive ruderals are
adapted to circumstances of minimal stress where competition is restricted to moderate
intensity of disturbance (e.g., fertile pastures and meadows) (Grime, 1977). The stress-
tolerant generalist (S/ CSR), Agrostis tenuis, is associated with habitats of intermediate
fertility (Hubbard, 1992), and it spreads by shorts rhizomes and sometimes by stolons to
form loose or dense turfs. This grass was found with low cover abundance (between 2-12%
cover) in four quadrats on each of the Verkehrsbetrieb roofs. Though this roof complex was
not accompanied by an original species list, A. tenuis was specified on a few other roofs
(e.g., Tübingen, Rathausgarage) and could well have been sown on these roofs as well. If so,
then the individuals observed could be remnants from an earlier population.
Some grasses (Arrhenatherum elatius, Festuca rubra, Poa angustifolia) were found in only a
few circumstances, like the base of a sloped roof or slightly protected edges. These species
are associated with cultivated meadows, pastures, and slightly moist meadows and pastures
in central Europe (Ellenberg, 1986), and their pure CSR signatures (C/CSR for A. elatius)
indicate their capacity for perennial growth, which can be dominant in productive habitats
like meadows (Grime, 2001). This flexibility is exemplified by the loosely tufted coarse
perennial A. elatius, which is a frequent dominant of productive soils (Grime and Curtis,
1976). This competitive generalist colonised two patches at the base of Tübingen’s slope

119
(T3Q4, T4Q1) as well as one quadrat mid-slope (T3Q3), and maintained considerable cover
at FH Nürtingen, with cover abundance from 5 to 30% in six of the twelve quadrats sampled.
The two grasses designated as CSR strategists (Festuca rubra, Poa angustifolia) represent
plant forms that are restricted to habitats in which competition is limited to moderate
intensities by the combined effects of stress and disturbance (e.g., unfertilized pastures and
meadows) (Grime, 1977). The EGR locations on which they were found likely embody this
complex of conditions. The slender rhizomatous F. rubra was found sparsely on the EGRs at
Tübingen and FH Nürtingen. In Tübingen, it occurred in three quadrats at the base of the
slope (T2Q1, T2Q4, T3Q1), on both north- and south-faces, with low cover abundance (3%,
15%, 3%, respectively), while in Nürtingen it occurred in three quadrats ranging in cover
from 2% to 47% to 99%. Similarly, the creeping rhizomatous Smooth meadow grass, Poa
angustifolia, occurred sparsely in Tübingen (T2Q4, T3Q4, both north-facing) and in Köngen,
where it was represented by one quadrat each on the north- and south-faces.
Two small annual grasses (Setaria viridis, Vulpia myuros) were found only on the three
Stuttgart roofs (with the exception of Vulpia on Rathaus PV). Setaria was apparently in the
Stuttgart seed mix, which means that it has persisted over time, but Vulpia likely colonized
through dispersal. These ruderals often maintained extensive coverage, though their small
stature made little visual impression to the vegetation overall. These species were
associated with other drought-tolerant taxa in particularly xeric conditions. For example,
two south-facing quadrats at Killesberg (T1) in which Setaria and Vulpia were well-
represented (between 40 and 80% cover abundance) also featured between 40 and 85%
cover by Sedum album, S. reflexum and a few instances of F. ovina and the moss Ceratodon
purpureus. The south-facing quadrats on this roof featured cracked substrate which were
probably exacerbated by the steep slope. These two small grasses only occurred on the
south-facing quadrats of that roof, generally in the same cover abundance. While Setaria
was abundant in most of the quadrats of the Rathaus roofs, Vulpia was not observed on
Rathaus PV; on the lower roof it was abundant in one quadrat (Q1, 42%) and sparse in three
others (with 3-5% cover abundance).
3.3.2.3 Discussion
The disparity in grass cover may be associated with the fact that the younger roofs had
bigger species lists, as well as some unique environmental gradients (slope and aspect on
Killesberg; mesic versus xeric edges on FH Nürtingen; sheltering from adjacent buildings on

120
Rathaus lower). The older roofs, from Tübingen onwards, had varying degrees of cover and
representation by grass species. Grass cover on the two roofs at Esslingen Verkehrsbetrieb
(VB) was visibly associated with the microclimatic effects created by the differently arranged
light shafts, like shading or the effects of wind vortices. VB Area 1 has a compact
arrangement of long, rectangular shafts occupying most of that roofs surface area, while
Area 2 features square shafts scattered more widely apart. The former roof supported only
two grass species while the latter had four.
The reason some species occurred only on some roofs may be attributed to the variables
measured, like roof age, substrate depth, and environmental conditions per roof, but there
are likely other ecological variables in effect, such as colonisation through seed rain, supply
by seed bank, and conditions for germination, establishment and reproduction. In Berlin,
Köhler (2006) found that proximity to green spaces and exposure to seed rain influenced
species diversity on two old EGRs, and that grass establishment and persistence were most
influenced by exposure to irradiation and fluctuating ambient temperatures.
3.3.3 Succulents: in proportion to other growth forms
Correlation effects associated with the vegetation of the EGRs surveyed suggest that
succulents function differently from the other growth form groups. Whereas the other
growth forms interacted with each other, succulents hardly had any associations, neither
with other groups nor themselves. Whereas certain variables correlated with the same
direction relationship for all growth forms, succulents expressed the opposite direction.
Without the certainty of original species lists and proportions, it is difficult to know whether
these results are associated with vegetation dynamics or if such relationships have been in
place since the point of installation. It is possible, however, to consider the relative cover
abundance of these growth forms alongside the other growth form groups, and to test the
strength of the relationships identified. The relative cover of the six growth forms
comprising the vegetation are given as mean cover values re-calculated as proportionate to
100% total cover (Table 3.9).
The north-facing roof at Köngen was treated as an outlier for this analysis because the
vegetation and conditions on that small roof (5 quadrats) were so dramatically different
from the larger south-facing roof (13 quadrats) and from the other roofs. Three of Köngen’s
nine species were restricted to the north-facing roof (Achillea millefolium, Sedum floriferum

121
and Calliergonella cuspidata) and, although removing those five quadrats led to less
proportionate cover by cryptogams and forbs, grass cover was hardly affected and
succulents gained only marginally greater proportion of total cover. This is given for
reference (shaded row); only the results from the larger, south-facing roof are used for this
analysis.
Table 3.9. Relative proportionate cover abundance of growth forms on nine old EGRs, in order of roof age, showing mean with standard deviation.
Roof # spp
Succulent Forb Grass Bulb Cryptogam Woody
Killes-berg
23 38.18±30.60 2.78±6.85 37.11±30.27 12.44±12.19 5.17±7.28 4.31±12.81
Rathaus-lower
30 34.55±18.91 25.52±28.49 21.37±17.06 7.85±27.46 10.61±7.53 0.11±0.55
Rathaus-PV
24 42.80±22.50 13.51±16.04 28.06±28.62 7.66±18.82 7.97±14.02 0.00
FH Nürt. 32 19.73±23.65 30.08±29.56 23.00±9.73 2.02±9.06 24.32±26.16 0.84±1.84
Köngen (both)
9 55.72±30.79 4.18±9.24 28.24±24.25 0.00 11.85±35.71 0.00
Köngen South
6 68.61±21.93 2.44±2.73 28.95±12.30 0.00 0.00 0.00
Tübing. 21 56.92±26.16 37.14±26.07 3.19±24.57 0.00 0.00 2.75±23.20
VB A2 21 17.58±8.40 18.01±20.81 2.63±7.94 49.46±53.30 12.32±9.56 0.00
VB A1 21 33.41±17.51 52.80±41.55 1.09±3.57 5.67±23.42 7.03±13.94 0.00
Pliens. 11 96.74±87.31 1.59±5.59 0.00 0.00 0.00 1.67±7.09
Succulents on all the roofs had relatively consistent cover abundance, while the other
growth forms varied. Grasses had consistent cover (between 20-40%) on the younger roofs
(Killesberg, the Rathausgarage roofs, FH Nürtingen and Köngen), and considerably less on
the older roofs (between 0-3%), for example. These values suggest the visual composition
for a typical quadrat, and succulents clearly maintained the most consistent cover on all
roofs (Figure 3.6). Pliensaufriedhof, which had one of the smallest species lists (11 species)
had the most extensive cover by succulents (96.74%) (± 87.31%), while grasses, bulbs and
cryptogams were not at all represented. The south-face at Köngen, which was the second
most species depauperate roof, had 68.61% (± 21.93%) cover by succulents, with no cover
whatsoever by bulbs, cryptogams or woody species. Otherwise, the other roofs (with > 20
species) had more varying cover by succulents and other growth forms.

122
Figure 3.6. Relative cover abundance of growth forms on nine old EGRs [NB: Köngen South is used (n=13), exempting the 5 north-facing quadrats from that roof].
A Related-Samples Friedman’s Two-Way Analysis of Variance by Ranks was conducted to
determine if there was a significant difference in proportionate cover by the six growth
forms on the nine roofs. The roofs surveyed did indeed have significantly different
proportionate cover by the different growth forms, X2 (5, n = 9) = 20.62, p < .001).
Inspection of the means ranking showed succulents with the highest rank (5.33), followed
by forbs (4.44), grasses (3.67), bulbs (2.72), cryptogams (2.94) and woody species (1.89).
Friedman’s Pairwise Comparisons reveal that succulents had significantly different cover
abundance from woody species (T = 3.44, p < .001) and bulbs (T = 2.61, p < .001). Since
woody species were generally limited to self-established tree seedlings, this is an obvious
effect. Bulbs, on the other hand, are not as mobile for self-colonisation and therefore only
occur on roofs when they have been intentionally sown or planted. Bulbs only had
substantial cover on three of the roofs surveyed (VB A1, VB A2, Rathaus PV) (occurring in 7,
14, and 10 quadrats, respectively) and had sparse cover on Rathaus lower (3 quadrats).
3.3.4 EGR vegetation types
In order to determine which roofs had the strongest effects that led to the statistics
described above, a hierarchical cluster analysis using Ward method and average linkage was

123
conducted. Dissimilarity data provides information on the degree of ‘closeness’ or proximity
of each unit to every other unit. The dendrogram model allows clusters to form
hierarchically, such that the most broadly similar objects are loosely clustered to the right
and, as the similarity criterion becomes increasingly less relaxed (moving left on the
dendrogram), groups become formed by aggregating with one another. Roof name (and
roof number) are given on the y-axis, and the scale of clustering coefficients on the upper x-
axis indicates the gradation of similarity/ dissimilarity between the roof clusters (Figure 3.7).
Figure 3.7. A cluster analysis for nine old EGRs reveals two major groupings, or vegetation types, with
reference to proportionate cover abundance and three sub-groups.
With respect to proportionate growth form cover of the roofs surveyed, the dendrogram
shows two major hierarchical groupings of roofs, with the broadest differentiation occurring
at a linkage distance of twenty-five (Broadest distinction: two major groups). The two major
groups are distinguished as “Species-rich” and “Species-poor”. These groupings shall be
examined more closely to determine whether they serve to define recurring EGR vegetation
types and emergent properties.

124
3.3.4.1 “Species-poor Sedum roof” (2 roofs)
This group consists of two closely related roofs (linkage distance: 4) - Köngen (south) and
Pliensau - which are distinct from the other roofs by their low species counts (6, 11,
respectively), of which succulents had the highest cover while forbs had exceptionally low
numbers and cover. Plant cover on these roofs was predominantly succulent (68.61% ±
21.93 and 96.74% ± 87.31, resp.) with sparse cover by forbs (2.44% ± 2.73 and 1.59% ± 5.59,
resp.). As mentioned, the removal of the north-facing quadrats at Köngen reduced
cryptogam and forb cover, but hardly affected proportionate grass cover and only
marginally enhanced succulent cover. Both roofs lack any cover by cryptogams, bulbs or
woody species, and do not match up with any of the vegetation forms described by Krupka
(1992). This grouping can therefore be described as “Species-poor Sedum roof”.
3.3.4.2 “Species-rich Sedum meadow” (7 roofs)
The “Species-rich Sedum meadow” group contains the other seven roofs (linkage distance:
12), which are sub-divided into three sub-groups (a, b, c). Compared to the roofs described
above, these EGRs support more species and more cover by forbs, grasses and bulbs, but
still have consistent cover by succulents. Visually, these roofs give the impression of a
flowering meadow with sparse and often tufted wildflowers and grasses above a steady
ground cover of succulents and cryptogams. These roofs may be treated as expressing
floristic variations between Sedum-Moss-Herbaceous and Sedum-Grass-Herbaceous forms
(Krupka, 1992). Varying cover abundance by different growth forms led to three sub-
groupings, which will be described individually and given descriptive headings.
3.3.4.2.1 a) “Floristically-diverse Sedum meadow”
The roofs in Nürtingen and Stuttgart had the most recorded species of all the roofs
surveyed, and similar proportionate cover by succulents, grasses and forbs. Sedum cover on
FH Nürtingen was 19.73% (±23.65), while forbs covered around 30% (± 29.56), grasses
covered 23% (± 9.73) and cryptogams covered around 24% (± 26.16). This latter growth
form is likely the distinguishing point between that roof and the Stuttgart roofs (linkage
distance: four), as none of those had more than 10% cover by cryptogams. Killesberg was
similar to the Rathausgarage roofs in its proportionate cover by Sedums (38.18% ±30.60)
and grasses (37.11% ±30.27), but the sparse cover by forbs, bulbs and woody species on this
roof marks a point of distinction (linkage distance: two). The Rathausgarage roofs (PV and
lower) were floristically very similar (linkage distance: one), with succulent cover of 42.80%

125
(±22.50) and 34.55% (±18.91) (resp.); forb cover of 13.51% (±16.04) and 25.52% (±28.49)
(resp.); grass cover of 28.06% (±28.62) and 21.37% (±17.06) (resp.); bulb cover of 7.66%
(±18.82) and 7.85% (±27.46) (resp.); and cryptogam cover of 7.97% (±14.02) and 10.61%
(±7.53) (resp.). Woody species had negligible cover on these two roofs.
The three Stuttgart roofs featured several forb species not detected on any other roofs,
such as Linum perenne, Nepeta racemosa, Petrorhagia prolifera, Picris hieracioides,
Potentilla argentea, P. erecta, Sedum acre, Setaria viridis, Verbascum nigrum, Veronica
spicata and Vulpia myuros. The Rathausgarage complex and FH Nürtingen also featured
bulbs not found anywhere else, Allium flavum and Dactylorhiza fuchsii. Overall, however,
these roofs all had consistent and continuous ground cover of succulents beneath the taller
meadow species, hence this vegetation type can be described as “Floristically-diverse
Sedum meadow”.
3.3.4.2.2 b) “Sedum with Chives”
The Area 2 roof at Esslingen Verkehrsbetrieb was unique amongst all the roofs surveyed for
its extensive coverage by Chives, Allium schoenoprasum, which had proportionate cover of
49.46% (±53.30), considerably more bulb cover than any other roof. Succulents and forbs
had similar cover proportions on this roof (17.58% ± 8.40, 18.01% ± 20.81, resp.), followed
by cryptogams (12.32% ± 9.56). Grass cover was sparse (2.63% ± 7.94) and no woody
species were recorded. The forbs identified are typical EGR species (Achillea millefolium,
Petrorhagia saxifraga and Thymus serpyllum) as well as some common weedy ruderals
(Crepis tectorum, Hypericum perforatum, Potentilla recta, Taraxacum officinale). Sedums
and Chives had the most consistent cover, occurring in most (if not all) quadrats. This
combination of co-dominance by Sedum and Chives is not uncommon for EGRs (Köhler,
2006) and seems to define a distinct vegetation type: “Sedum with Chives”.
3.3.4.2.3 c) “Sparse Sedum meadow”
The roofs at Tübingen and Verkehrsbetrieb Area 1 are as closely related as the three
Stuttgart roofs (linkage distance: 2). The most notable difference distinguishing these roofs
from the seven others is the low proportionate cover by grasses (3.19% ± 24.57 and 1.09% ±
3.57, resp.). Cover by succulents and forbs are not dis-similar from the other roofs, although
these roofs have the highest number of species comprising these growth forms. Whereas
the two roofs that were defined by Sedums (Köngen, Pliensau) only supported two and
three species (resp.), Tübingen and VB A1 supported six and five species of succulents

126
(resp.). Similar to the “Sedum with Chives” roof, the forb species on these two roofs are
either typical green roof plants or weedy ruderals, but they supported a few more forb
species than VB A2. Floristically, the vegetation on these roofs may be considered
intermediate between the Floristically-diverse Sedum meadow and the Species-poor Sedum
roof, and is therefore defined as “Sparse Sedum meadow.”
3.3.4.3 Discussion
These results resonate with other works (Krupka, 1992, Madre et al., 2014, Van Mechelen et
al., 2015), but also express that vegetation development on green roof after more than two
decades may lead to site-specific compositions. The forms described by Krupka (1992) are
useful for the purpose of prescribing general vegetation for different depths; indeed, this
table is used in the FLL guidance (2008). The field surveys of this research disagree with the
results of Van Mechelen et al. (2015), likely because their theoretical analyses could not
incorporate time-based effects of ecological dynamism. While their “Sedum type” lines up
with the “Species-poor Sedum roof”, the other two types they describe ("Dianthus-Thyme”
and “Linaria-Galium”) feature species that were not even found on the roofs surveyed. This
could be owing to extinction of certain species over time; indeed, they refer to commercial
species lists and therefore presence/ absence of initial species composition without
reference to relative abundance or post-installation dynamics. In addition, the effect of
regional or local influences (e.g., climate, propagule sources) is not considered in their
model, which would likely have region-specific influences on the species composition of
EGRs over time.
As novel ecosystems, EGR vegetation can be classified according to technical properties and
diversity values (Madre et al., 2014, Van Mechelen et al., 2015). The role of green roofs for
providing ecosystem services is becoming increasingly acknowledged (Carter and Jackson,
2007, Cook-Patton and Bauerle, 2012, Gaston et al., 2013, Lundholm et al., 2010, Perring et
al., 2013, Norton et al., 2015, Lundholm, 2015). Methods for enhancing green roofs’
capacity to deliver services over the long-term can therefore have significant implications to
the health and well-being of current and future organisms, both human and other. First,
however, our understanding of the relationship between biodiversity and ecosystem
functioning on EGRs must be clarified. While the functional diversity of “Sedum type” roofs
was significantly lower than the other two roof types described by Van Mechelen et al.
(2015), species-poor EGRs have been observed to outperform more diverse systems on

127
some ecosystem services, like roof cooling (Lundholm et al., 2010). Thus, although scientific
evidence is accruing to show that biodiversity, species functional traits and phylogenetic
relationships are linked with ecosystem function (Cardinale et al., 2012, Hooper et al., 2005,
Isbell et al., 2011, Quijas et al., 2012), the application of this query to EGRs and other novel
ecosystems is still very limited.
The question of emergence on EGRs can be treated as a conceptual expression of the
phytosociological work of spontaneously vegetated roofs, by which ecologists tried to
classify the spontaneous vegetation of old gravel roofs according to plant community
science. Other than the very broad class, Sedo-Scleranthetea, no recurring associations
could be satisfactorily confirmed. The precise methods of phytosociology were developed
from many years’ work studying natural and semi-natural ecosystems (Braun-Blanquet,
1972) and may not be not appropriate for urban ecosystems (Hill et al., 2002). Still,
considering the adaptive strategies represented by the species on the EGRs surveyed, the
assemblages identified by the cluster analysis are not random. The broadness of the
vegetation types defined, both by this and the phytosociological work, supports the notion
that green roofs are novel ecosystems, which typically contain (historically) unprecedented
species combinations co-existing under new abiotic conditions (Hobbs et al., 2009). With
relation to the classification of anthropogenic plant communities, phytosociologists have
proposed deductive methods for synthesizing the vegetation units from the varied man-
made landscape within the framework of the Braun-Blanquet approach (Kopecky and Hejny,
1978). This approach may relate to green roofs because its “top-down” perspective (i.e.,
from Class to Order, Alliance to Association) allows for more generalized vegetation types.
These results suggest that the original designs and intents of the early EGR industry have
been partly successful. Extensive, low-maintenance plant cover is created by some of the
intentional species, and pressure by unintentional species is minimal. In this case, Sedums
are the champions having not only fared well but having also reduced opportunities for
colonisation by forming dense and closed cover. If the original intention was to create
species-rich meadows, with Sedum cover for seasonal resilience, however, then only some
of these roofs would qualify as successful. This ethos of seasonal planting design was
explained to the author during a 3-month internship with a green roof company near
Freiburg im Breisgau (2002): wet periods allow forbs and grasses to flourish, while extended
periods of drought have the reverse effect and promote succulents. Although not formally

128
recognised as a “best practice”, this may nevertheless convey the ecological intuition of
green roof contractors in southwest Germany, since their work includes maintenance
contracts for several years after installation.
3.4 Conclusions
3.4.1 EGR vegetation over time: persistence, gain and loss
These results suggest that a significant proportion of the intentional species planted/ sown
on the EGRs surveyed did not persist after twenty or more years, and that some new species
were able to colonise. The variations in coverage by persistent versus colonising species may
be attributed to the established vegetation, to the propagule inputs, and to environmental
site conditions. The species that persisted and those that were lost included typical and non-
typical green roof plants. Few of the colonising species were dominant enough to define the
vegetation character of the EGRs sampled. These dynamics of persistence, gain and loss may
be explained by the different forms of regeneration (e.g., seed bank, seed rain), by the
conditions required for regeneration to occur, and probably by disturbance. Moreover,
evidence of such dynamics implies consideration of EGRs as novel urban ecosystems
whereby abiotic factors can modify trophic interactions (Hobbs et al., 2009), and different
species mixes exhibit different suites of functional traits (Van Mechelen et al., 2015) that
can in turn affect ecosystem function (Diaz et al., 2004).
3.4.1.1 Persistence
If intentional species are to persist on EGRs over time, then they must be suited to EGR
growing conditions and they must have regenerative strategies that allow them to persist
over generations. Most of the species that persisted embody life histories or adaptive
strategies that allow them either to tolerate or avoid stress (e.g., succulence or annual life
cycles). For many ecosystems, seed (whether as seed bank or seed rain) determine the
persistence of individual species to that community (Janssens et al., 1998, Plue et al., 2010,
Kalamees and Zobel, 2002, Kalamees and Zobel, 1998, Partel et al., 1998). Furthermore, the
persistence and viability of seed in the soil is a crucial consideration (Thompson et al., 1997,
Bekker et al., 1998), not to mention the conditions required for the seedlings to survive and
develop there. The restoration of species-rich grassland, for example, requires sown seed
but also the conditions for germination (light, temperature, humidity) and growth (e.g., soil
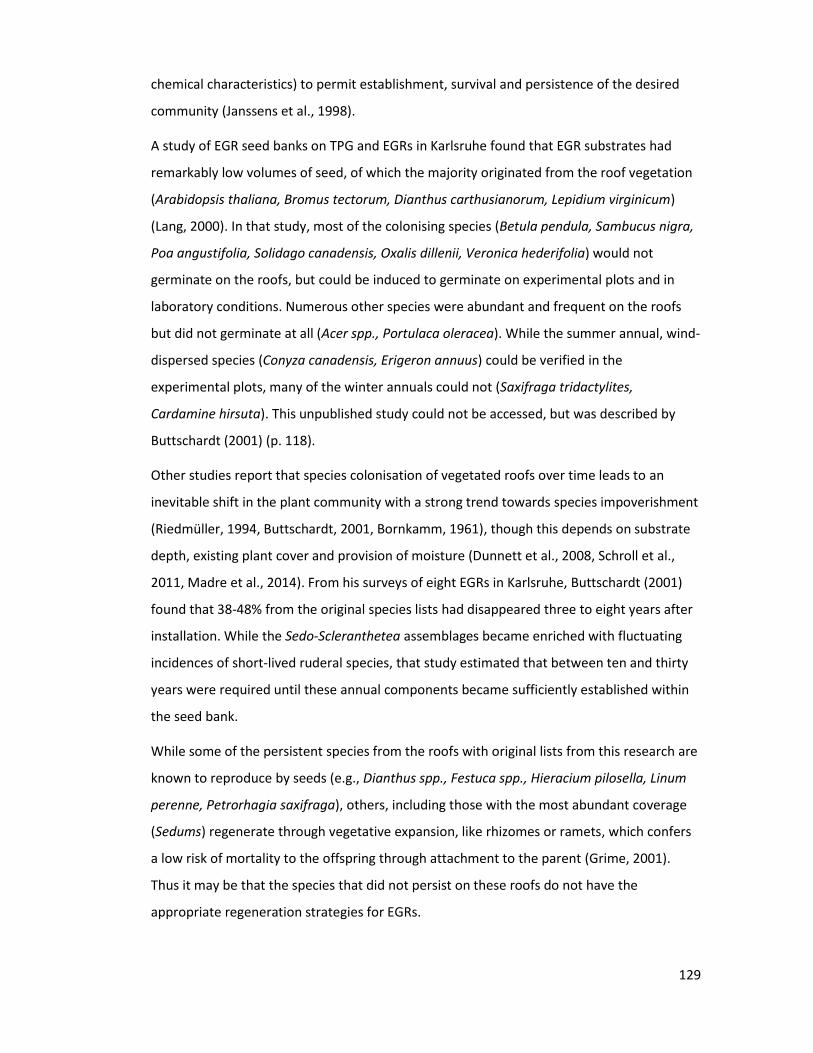
129
chemical characteristics) to permit establishment, survival and persistence of the desired
community (Janssens et al., 1998).
A study of EGR seed banks on TPG and EGRs in Karlsruhe found that EGR substrates had
remarkably low volumes of seed, of which the majority originated from the roof vegetation
(Arabidopsis thaliana, Bromus tectorum, Dianthus carthusianorum, Lepidium virginicum)
(Lang, 2000). In that study, most of the colonising species (Betula pendula, Sambucus nigra,
Poa angustifolia, Solidago canadensis, Oxalis dillenii, Veronica hederifolia) would not
germinate on the roofs, but could be induced to germinate on experimental plots and in
laboratory conditions. Numerous other species were abundant and frequent on the roofs
but did not germinate at all (Acer spp., Portulaca oleracea). While the summer annual, wind-
dispersed species (Conyza canadensis, Erigeron annuus) could be verified in the
experimental plots, many of the winter annuals could not (Saxifraga tridactylites,
Cardamine hirsuta). This unpublished study could not be accessed, but was described by
Buttschardt (2001) (p. 118).
Other studies report that species colonisation of vegetated roofs over time leads to an
inevitable shift in the plant community with a strong trend towards species impoverishment
(Riedmüller, 1994, Buttschardt, 2001, Bornkamm, 1961), though this depends on substrate
depth, existing plant cover and provision of moisture (Dunnett et al., 2008, Schroll et al.,
2011, Madre et al., 2014). From his surveys of eight EGRs in Karlsruhe, Buttschardt (2001)
found that 38-48% from the original species lists had disappeared three to eight years after
installation. While the Sedo-Scleranthetea assemblages became enriched with fluctuating
incidences of short-lived ruderal species, that study estimated that between ten and thirty
years were required until these annual components became sufficiently established within
the seed bank.
While some of the persistent species from the roofs with original lists from this research are
known to reproduce by seeds (e.g., Dianthus spp., Festuca spp., Hieracium pilosella, Linum
perenne, Petrorhagia saxifraga), others, including those with the most abundant coverage
(Sedums) regenerate through vegetative expansion, like rhizomes or ramets, which confers
a low risk of mortality to the offspring through attachment to the parent (Grime, 2001).
Thus it may be that the species that did not persist on these roofs do not have the
appropriate regeneration strategies for EGRs.

130
3.4.1.2 Gain
The colonising species arrived on their own, via mechanisms like wind-dispersal, which
implies that seed rain is an important aspect of EGR vegetation composition. A study of two
old EGR in different parts of Berlin noted that proximity to green spaces and exposure to
seed rain influenced species diversity (Köhler, 2006). Wind-dispersal was most prevalent
(34%) strategy comprising the vegetation of sixteen green roofs (12 TPG, 4 EGRs) in
Karlsruhe (Buttschardt, 2001) (p. 86). Plant invasion on green roofs seems to occur
predominantly on patches of bare substrate (Dunnett et al., 2008). In grassland ecosystems,
invasion by non-resident species often intensifies after drought disturbances, when
mortality leads to gaps in previously closed vegetation (Davis et al., 2000). This occurrence
on EGRs can be observed where annual grasses and xeric mosses colonise the cracked
substrate of particularly harsh roof locations. The invasion process depends upon
environmental conditions (e.g., resource enrichment or release) that have a variety of
causes but which occur only intermittently, and which coincide with the availability of
invading propagules (Davis et al., 2000).
3.4.1.3 Loss
Although the species lists comprised species originating from analogue habitats, many of
those original species were not found in the roof surveys. This loss of species could be due
to several reasons. For one, regionally native, non-xeric species may simply not be fit for
EGRs since the environmental conditions there may be better matched with analogue
habitats occurring further south. Given the episodic incidents of severe stress that occur on
EGRs, not to mention the other challenges of the EGR growing environment, xeric species
likely outcompete other functional types. If regeneration is not possible, then those species
become extinct. The shallow depths of well-drained EGR substrates and the growing
conditions imposed by exposure to wind, sun and extreme temperatures are known to limit
plant diversity (Boivin et al., 2001, Olly et al., 2011, Bates et al., 2013), and the diversity of
other organisms (Schrader and Boening, 2006, Rumble and Gange, 2013). The establishment
and persistence of grass on two old EGRs in Berlin were found to be most strongly
influenced by exposure to irradiation and to fluctuating ambient temperatures (Köhler,
2006). Considering that roof membranes can exceed 70°C, even in mild climates (Connelly et
al., 2006), any exposed substrate will become prohibitively hot, particularly if it is darkly
coloured (Buttschardt, 2001). Long-term monitoring could reveal whether species

131
impoverishment on EGRs occurs as the result of a single catastrophic event or as a gradual
process.
The popular notion that EGRs could support diverse plant communities over the long-term
was negated by early ecological studies of green roofs (Riedmüller, 1994, Buttschardt,
2001). From his surveys of TPG and EGRs, Buttschardt (2001) disagreed with the statement
by Kolb and Schwarz (1986) that EGRs can support red-listed species. Another study
concluded that the re-creation of species-rich dry meadow on green roofs could only be
accomplished if intensive maintenance comparable with that of a botanical garden were
provided (Riedmüller, 1994) (p. 35). From his experiments, that author stated that even if
species-rich dry meadows from that climate zone were to be successfully established, the
homogeneous EGR substrate, with its tendency to desiccate, would prevent long-term
persistence by that community and eventually shift to dominance by drought-tolerant
vegetation. As mentioned already, a subtle but crucial shortcoming to the approach of using
species from analogue habitats for EGRs is that the most appropriate analogues are
probably actually several latitudinal degrees to the south, and possibly also associated with
special geological and ecological features. To date, this biogeographic detail has not been
acknowledged.
3.4.2 EGR vegetation composition after > 20 years
Based on these results, the species identified as comprising mature EGR vegetation can be
classified according to the duration of their persistence. Consideration of life history and
adaptive strategies, with reference to CSR theory, was helpful to this end. The species that
classify as stress tolerators (e.g., most Sedum species/ cultivars, Festuca ovina) have
apparently persisted since being planted/ sown on these green roofs; such long-term
persistence in the form of compact, slow growth and vegetative reproduction are hallmarks
of the stress tolerator strategy (Grime, 1977). By contrast, persistence in the form of a life
cycle that is either rapid annual or short-lived perennial, with investment into seed rather
than vegetative development, is characteristic of the ruderal strategy (Harper, 1977). The
persistence by stress tolerators can therefore be classified as long-term, while persistence
by ruderals is can be defined as short-term but also incoming colonisers. Due to the
snapshot quality of the surveys, it is not possible to know how long the “lost” species
persisted, whether their persistence can be described as medium-term or short-term. Plant
adaptive strategies will be considered in more detail in the chapters that follow.

132
3.4.3 Characterising EGR vegetation: succulents and grasses
The most abundant grass species identified, Festuca ovina, persisted in great abundance
compared to other species. Since this species is a stress tolerator (or S-strategist), it may be
that the stressful EGR conditions impose filters that limit the persistence and establishment
of other life strategies over time. The two ruderals on the Stuttgart roofs imply that the
lethal combination of stress and disturbance is not uncommon on those roofs. Being
annuals, these grasses probably vary in cover per year and per season, along with the
weather. Recalling that these surveys are like a snapshot in time, it’s possible that the other
life strategies are not long-term components of EGR vegetation, either, but rather
opportunists that will claim and hold environmental niches offering suitable conditions
while they last. Succulents dominated the vegetation of all the roofs surveyed, often
creating extensive cover with only a few species. As mentioned already, some Sedums
exhibit Crassulacean Acid Metabolism (CAM), which allows them to avoid water stress by
switching their carbon metabolism to the CAM pathway (Sayed, 2001).
3.4.4 EGR vegetation communities or types
This chapter concludes that green roof vegetation does not remain static, and that it may
converge over time with subtle divergences into different vegetation types. Beyond the
small group of two “Species-poor Sedum roofs”, the “Species-rich Sedum meadow” type
was separated into three sub-types defined by a Sedum groundcover beneath tall grasses
and herbs (both intentional and colonising). Before confirming these EGR vegetation groups
as recurring emergent community types, the role of environmental conditions must be
integrated into the model. Chapter 5 will therefore investigate rooftop conditions more
explicitly and re-classify the EGR vegetation types accordingly.

133
4 Substrate depth over time
Preliminary analyses suggested that substrate depth decreases with time, and that roof
slope and aspect were significantly correlated to substrate depth. Such dynamics could pose
issues to the long-term function of these systems, especially a decline in substrate depth
since EGRs are the shallowest of all green roof types (FLL, 2008). The decline in depth on
shallow EGRs over time is an entirely undocumented phenomenon, so this chapter will
examine the results associated with depth more closely. The EGRs in this study are early
examples of systems that became widespread after the industry and market had
established. They may have adhered to the early recommendations, such as substrate
composition and particle size, even though standardised materials and methods were not
yet available (Appl, 2014). With regards to practical implications of this work, then, these
roofs can be considered comparable to the early installations of other markets, which might
also be susceptible to unanticipated changes.
4.1 Literature review
4.1.1 Depth and the FLL guideline
Substrate depth fundamentally affects EGR vegetation, whether in terms of establishment
and growth (Durhman et al., 2007, Getter and Rowe, 2009, Thuring et al., 2010, Rowe et al.,
2012), species dominance and cover diversity (Emilsson and Rolf, 2005, Dunnett et al.,
2008b, Nagase and Dunnett, 2010) or survival across challenging seasons (Boivin et al.,
2001, Getter and Rowe, 2007). Shallow depths limit the long-term resilience of green roof
floral assemblages (Olly et al., 2011, Madre et al., 2014), and inhibit the growth of taller
vegetation (Dunnett et al., 2008a, Durhman et al., 2007). However, when planted with a
diversity of life forms, like grasses and tall forbs (which require deeper depths than
succulents), EGRs can provide a greater range of ecosystem services, including stormwater
capture, roof temperature and albedo (Lundholm et al., 2010, 2014). Some suggest that EGR
substrate depths should not be less than 120 mm (Köhler and Poll, 2010, Nardini et al.,
2012) or 200 mm (Dunnett et al., 2008b) if they are to function for engineered performance
as well as visual and ecological diversity.
Species-depth tables have been used for EGR design guidelines since the early days of the
industry (Krupka, 1992), with the purpose of outlining the different types of vegetation that

134
can be supported by different depths. Accompanying the table in the guideline indicating
which life forms will grow best in different depths, the FLL attaches a note that “the regional
climatic conditions and the specific site conditions, which can vary considerably from each
other, necessitate a thinner or thicker construction layer within the given range” (p. 43). In
addition to this life form table, the guideline refers to the predicted effects that different
depths will have on runoff retention, and also recommends various approaches for
preventing substrate compaction or loss during planning, manufacture and installation.
In Germany, the FLL guidelines and industry practice together were designed to rule out
losses in depth from the point of installation. The DIN 18127 laboratory standard (Proctor
Test) for substrate manufacture ensures that a substrate has already factored compression
into its ordered volume; depending on the substrate many companies who provide EGR
substrates often calculate the volume for an installation using settlement factors of
between 1.1 and 1.25 [e.g., (ZinCo, 2013), p. 15]. These two practices should rule out any
significant compression. Another point of compaction occurs when green roof substrates
are installed using hydraulic blower trucks, which can compromise particle size distribution
due to shattering (Roth-Kleyer, 2006). Since 70% of EGR installations in Germany used
blower trucks in 2002 (Roth-Kleyer, 2002), the FLL (2008) recommends prescribing
granulometric distributions with greater proportions of large particles. From his survey of
relatively young EGRs Buttschardt (2001) observed that particle size distribution had shifted
beyond the FLL recommendations within four years, which he attributed to this form of
delivery.
For all the detailed specifications and methods in the FLL guidance, surprisingly little
reference is made explicitly to substrate depth over the long-term. No mention of depth
whatsoever is made in the chapter of inspection methods for post-installation tests on
drainage and substrate layers. Although each new edition is refined to include the most
current advances in materials, methods and approaches (Lösken, 2004), there is no
evidence of feedback from performance monitoring. Given how crucial substrate depth is to
green roof performance, this lack of time-oriented perspective seems a questionable blind
spot to such an important document. Without any contradicting information, it would seem
that the guidance is only intended for installation and the early years of establishment. The

135
physical and chemical properties of the EGRs surveyed will be contrasted with the FLL
recommendations in Chapter 6.
Beyond Germany, the FLL guidelines are an important reference for nascent green roof
markets; the best practice code for UK green roofs, for example, was adapted and
“significantly based on the German FLL guidelines” (GRO, 2014) (p. 2). In North America,
when loosely-regulated green roof technology was being implemented at the turn of the
21st century, the FLL guidelines were used in order to identify minimal performance
expectations and prevent error and failure (Philippi, 2005). As mentioned earlier, the FLL
guideline is not a standard but a measure of technical application for professionals,
suppliers, installers, and municipal or state regulators. The first page of the document
clarifies that users must employ common sense and that the guidance cannot guarantee
fault-free results (FLL, 2008). Since regions without any recent history or experience using
living architecture usually lack a culture of ecological or regenerative design and
intervention, emerging green roof markets that refer to these guidelines may lack the
common sense that it implies.
Green roofs can be twice as expensive in emerging compared to mature markets and
substrate is the biggest cost factor in green roof construction when materials, methods of
delivery, expertise, and standards have not yet been established (Philippi, 2011). So, if
pioneering practitioners in these situations refer to these guidelines for the minimum
requirements in order to keep costs down, it is likely that very shallow depths are specified.
If depth does in fact decline over time, various aspects of green roof performance by these
systems will be compromised. Without long-term research on EGR systems, such is the case
with stormwater performance (Li and Babcock, 2014), the effectiveness of the guidelines
cannot be substantiated beyond the period of establishment.
4.1.2 Depth and green roof ecology
All green roof phytosociological studies determined the various plant community
classifications according with substrate depth (Bornkamm, 1961; Darius and Drepper, 1983;
Bossler and Suszka, 1988; Thommen, 1988, Buttschardt, 2001). While depth is of
unequivocal importance to the vegetation that can grow and persist, it also influences soil-
based processes and the directions that natural succession may take; this is especially true
for hard surfaces with little soil (Yuan et al., 2006). The first systematic survey of

136
spontaneously vegetated TPGs (in Göttingen, Germany) classified plant communities
according to depth (Bornkamm, 1961). Based on the results from over thirty TPGs, the
shallowest depths (mean: 30 mm) were designated for Moss community, and increasing
depths supported a Weed community (mean: 84-96 mm), a Tread community (mean: 96
mm), and the Typical Poa meadow (mean: 134 mm, minimum 110 mm). Of the two forms of
Poa meadow identified, the “Typical Poa meadow” (Poetum anceptis-compressae) occurred
on unshaded gravel roofs (mean: 114 mm) which had 94% cover but were relatively species-
poor (six species) compared with shaded variants which had more species (twelve) but less
cover (68%). The “Poa meadow rich in weeds” (Poetum anceptis-compressae
chenopodietosum albi) occurred on gravel roofs (mean: 134 mm) and supported eleven
species that had 84% cover. A study of five (90 year-old) TPGs and three (20 year-old) gravel
roofs in Osnabrück found that younger gravel roofs were still in the early stages of very slow
humus formation, the lack of humus was attributed to the vegetation that was limited to
pioneering mosses and lichens (Bossler and Suszka, 1988). This and other TPG studies
demonstrate the importance of substrate depth not only in determining species
composition on green roofs, but concurrently in driving natural succession and long-term
soil processes, like humus formation.
Similarly, in Karlsruhe, Buttschardt (2001) outlined four types of roof vegetation according
to substrate depth on TPG and EGR roofs. Cryptogams dominated depths from 10-60 mm,
while 20-200 mm supported a carpet- or patchwork cover by Sedums interspersed by low-
growing spring annuals (e.g., Cerastium pumilum, Veronica praecox, Arabidopsis thaliana,
Erophila verna), creepers (e.g., Stellaria media) and grasses (e.g., Poa annua, Poa bulbosa,
Eragrostis minor). Depths of 100-400 mm supported low-growing herbaceous species,
including chamaephytes (e.g., Dianthus deltoides, D. carthusianorum Lamium hybridum,
Achillea millefolium, Anthemis tinctoria, Capsella bursa-pastoris), low-growing grasses (e.g.,
Koehleria glauca, Festuca spp, Setaria viridis), and geophytes (e.g., Allium schoenoprasum).
The deepest substrates surveyed, 300-1500 mm, were defined by tall, freestanding grasses
(Aspera spica-venti) and herbaceous perennials (Dianthus carthusianorum), and less
frequent ruderal species (Conyza canadensis, Erigeron canadensis).
Depth is widely accepted as the main point of distinction between green roofs and ground-
level ecosystems. This is usually attributed to the lack of resources available to green roof

137
plants, owing to the disconnection from a greater soil profile (Krupka, 1985). The influence
of stress caused by shallow, predominantly mineral substrates has not been thoroughly
quantified for EGRs, but it is an intuitively comfortable notion that plant growth and
diversity should be inhibited in a sun-baked and desiccated substrate. A London study of soil
microarthropods on EGRs described dramatic population crashes associated with periods of
extended drought and high temperatures (Rumble and Gange, 2013), but the environmental
conditions were not reported. In Birmingham, a replicated experiment of three EGR
microcosms (100 or 150 mm aggregate over typical EGR systems; 150 mm aggregate over a
topsoil control) found that shallower depths in the EGR plots correlated with the number
and severity of drought events, unlike the control plots (Olly et al., 2011). Those authors
attributed the poor performance of the EGRs plots to the substrate and the limited
rhizosphere (e.g, inadequate soil moisture and other resources), but made no mention to
the drainage layer beneath the EGR system, which augments water loss from the substrate
and out of the system. An additional treatment exempting drainage layers might indicate
the role that substrate depth alone plays to drought.
4.1.3 Research aims and questions
Since a significant loss of substrate depth over time would pose consequences to long-term
EGR performance, both in terms of vegetation but also engineered benefits, the objective of
this chapter is to examine these results more closely. The outcomes may further inform the
research question of identifying the main drivers and mechanism behind vegetation change
on EGRs, and address the aim of proposing models to illustrate EGR vegetation
development over time.
Aim: To continue characterising mature EGR vegetation
Question: If successional change can be observed on EGRs, what are the main drivers & mechanisms?
4.1.3.1 Objectives for the chapter
The objectives for this chapter involve the examination of the depth results more closely,
and refer to other datasets where applicable.
Quadrat-level detail: aspect, slope and depth
Roof-level detail: mean depth and expanded dataset

138
4.2 Methods
First, in order to assess the power of the result from this small sample size, the correlation
coefficient from depth and roof age (rho = -.481, p < .01, n = 136) was used for a post-hoc
power analysis. According to the power analysis, a sample of at least 37 roofs is required if
loss of substrate depth over time were to be sufficiently proven (G-power, version 3.1,
University of Düsseldorf, calculated May 1, 2013) (Faul et al., 2009). Considerable
coordination, time, and effort would be required to assemble a sample of such magnitude.
Since substrate depth was measured per quadrat, this variable can be examined at the level
of quadrat, as well as mean values per roof. Different approaches will be used to examine
these different levels of detail. Since depth was measured for every quadrat on the nine
roofs surveyed, this data will be examined with greater resolution as quadrat-level analyses.
Mean depth data from the nine EGRs will also be examined, together with an amalgamation
of data from eight EGRs of similar construction and geography (ca. 100 km from Stuttgart
region) surveyed by Buttschardt (2001).
4.2.1 Data analysis
4.2.1.1 Quadrat-level query
The variations in depth will be examined at the level of quadrat with reference to mean,
minimum and maximum records, and with speculation of how these might have changed
from initial depths. Background information on the original depth installed for each roof will
be introduced ( “assumed initial depth”) and then compared to the depths measured
(ranging from the filter cloth to the top of the substrate profile, but not including the litter
layer). To address the preliminary results that substrate depth was positively correlated with
slope (rho = .430, p < .001, n = 134) and aspect (rho =.369, p < .001, n = 134), depth
measurements taken per quadrat will be examined with regards to location along the roof
slope (ridge, central, base) and aspect. Lastly, in order to determine the relationship
between substrate depth and species composition, the abundance records of the 95 species
identified will be subjected to Spearman Rank Order Correlation analysis. Preliminary
analyses were performed to ensure no violation of the assumptions of normality, linearity,
and homoscedasticity. This non-parametric test was chosen because the data do not have a
normal distribution.

139
4.2.1.2 Roof-level query: mean depths
Using the records of mean depth per roof, the surveyed EGRs will be arranged into ordinal
age groupings in order to determine any significant differences in depth and roof age. A
Kruskal-Wallis test will be used as the non-parametric alternative to one-way between-
groups analysis of variance. The measurements from this small sample will then be
expanded with the inclusion of mean depth data from eight EGRs surveyed by Buttschardt
(2001) in Karlsruhe. Those roofs were installed around the same time as the youngest ones
in this study (i.e., early to mid-1990s) and adhered with the FLL guidelines of the time (FLL
1995). They were, therefore, all younger than the roofs surveyed for this study and surveyed
ten years earlier. Amalgamating these two datasets nearly doubles the sample size from
nine to seventeen and extends the timeframe to include roofs ranging from two to thirty-
three years after installation. After a brief description of those roofs, the records of mean
depth from this expanded sample size will be tested with a one-sample t-test.
4.3 Results
4.3.1 Quadrat-level query
4.3.1.1 Descriptive: depth measurements per quadrat/ roof
The mean, minimum and maximum depths per roof, along with median and standard
deviation, are given in Table 4.1. In addition to the mean values for Köngen, the
measurements for the north- and south-facing roofs are given separately, as two rows. The
final two columns refer to any assumed initial depths with reference to the sources of those
assumptions. Since this information was not available for all roofs surveyed, some cells are
blank. Of all the roofs surveyed, FH Nürtingen and Killesberg had the greatest variability in
substrate depth and VB Area 1 had the least. The latter roof had the smallest depth
measurements overall, including smallest mean depth (52. 8 mm), smallest median (51
mm), and smallest standard deviation (6.66 mm). Neighbouring VB Area 2 had the next
lowest values for depth (mean: 58.13 mm; median: 58.8 mm; SD 8.9 mm). By contrast, the
pitched roof at Killesberg had the deepest depth measurements of all roofs, with the
deepest mean (84.7 mm) and median (79.6 mm).

140
Table 4.1. Summary of substrate depth per roof (mm), presented in order of roof age.
Roof name (in order of age)
N Mean Min Max Range Med-ian
Assumed initial depth
Source of assumption
Killesberg 18 84.7 68.0 115.0 47.0 79.6 80 detail sections
(1:10)
Rathaus, lower
14 69.8 53.0 81.0 28.0 69.5 100 detail sections
(1:10)
Rathaus, PV 14 64.4 46.0 81.0 35.0 65.0 100 detail sections
(1:10)
Köngen (both) 16 70.6 54.0 111.5 57.5 70.0 70-80 T. Hövekamp
(verbal)
Köngen-S 11 71.2 54.0 89.3 35.3 70.3
Köngen-N 5 69.1 56.0 111.5 55.5 69.7
FH Nürtingen 11 72.3 45.0 92.0 47.0 70.3 20-90 hand-written record
Tübingen 16 61.5 47.0 84.3 37.3 58.8
VB A1 14 52.8 46.0 65.0 19.0 51.0 120 T. Hövekamp
(verbal)
VB A2 14 58.1 47.0 73.0 26.0 58.8 120 T. Hövekamp
(verbal)
Pliensau 15 61.6 50.0 76.7 26.7 63.3
Three roofs had outlier records for depth (Tübingen; VB Area 1; Köngen), but Köngen was
the only roof with a significant outlier (N-Q4) (Figure 4.1). The two outliers at Köngen were
recorded on the north-facing roof (111.70, 138.70 mm). One of the highest values within
the upper quartile for that roof was also from the north-face (N-Q2: 80.30). The south-facing
roof at Köngen had thirteen quadrats (depth measurements were taken for ten), which is
similar to the number of sampling plots on the other roofs (e.g., Rathaus-PV: 15; Rathaus-
lower: 14; FH Nürtingen: 12; Verkehrsbetrieb roofs: 14; Tübingen: 16), so any analyses
excluding the north-facing quadrats at Köngen do not compromise the dataset of that roof.

141
Figure 4.1. Depth measurements for the roofs surveyed show a few outliers, of which one was
significant.
No original depth values were available for the roofs of Pliensaufriedhof or the Gärtnereihof
in Tübingen. A letter from the architect of the Killesberg shows a detail from an architectural
drawing that specifies 80 mm substrate for the green roof. Detail sections (1:10) from
architectural drawings for the Rathausgarage complex (PV and lower roof) report a
specification of 100 mm substrate. Beyond these drawings, no further information was
available on original depth specifications. In Nürtingen, hand-written records from the time
of installation (1987) suggest 90 mm depth at roof centre and 20 mm substrate along the
edges. This discrepancy was intentional, owing to the interest in vegetation technologies by
the FH (Hüttenmoser, 2010). This documentation was received after the vegetation surveys
had been completed, but the stratified sampling method avoided non-homogeneous
vegetation so this variation in depth should not have skewed the data collected.
Documentation from a 1989 maintenance contract bid for the Römermuseum in Köngen by
ZinCo (then Metall Dachtechnik GmbH) reports that 50 mm substrate was originally installed
in 1987. However, in an interview in 2010, the lead contractor of the roofs construction
(who also signed this bid) said that 70 or 80 mm substrate were more likely installed
(Hövekamp, 2010). Hövekamp also explained that the substrate profile at the

142
Verkehrsbetrieb roofs comprised a 100 mm layer of LECA (Lightweight Expanded Clay)
topped by 10 or 20 mm organic matter, interspersed with the styrofoam modules.
The minimum and maximum values around the mean (Figure 4.1) illustrate that some roofs
had very large variations in substrate depth while others were quite small. The two roofs
with the greatest mean depths also had the largest range of depths measured; the north-
face of the Römermuseum roof in Köngen and Killesberg stand out with the greatest mean
depths. The youngest and steepest roof, Killesberg, had a mean depth of 85 mm with a
maximum of 115 mm and a minimum of 68 mm. On the two roofs of the Römermuseum in
Köngen, the small north-facing roof (n=5 quadrats) measured a wide range of depths, from
56 to 111.5 mm, while the larger south-facing roof (n=13 quadrats) had a similar minimum
depth (54 mm) but a shallower maximum (89 mm). FH Nürtingen also had a considerable
range in substrate depth measurements (47 mm), of which the maximum values (92 mm)
match up with the depths quoted for the central section of that roof (90 mm), but the
shallowest (45 mm) exceed the minimum depth quoted (20 mm).
Next in depth and range, Tübingen, had mean depth of 61 mm, with a smaller range of
measurements (37.3 mm) than the previous roofs. The Rathausgarage complex roofs were
similar, with mean substrate depths of 64 mm (PV) and 70 mm (lower roof), and ranges of
35 mm and 28 mm (respectively), of which 81 mm was the maximum depth measured for
both. The roof at Pliensaufriedhof ranged in depth from 50 to 77 mm, and had the smallest
range measured. The two roofs at Esslingen Verkehrsbetrieb (VB Areas 1 and 2) recorded
the shallowest mean depths (53 and 58 mm, respectively) as well as the lowest range of
depths (19 and 26 mm, respectively). Site visits confirmed the single comment offered by
the contact for this roof that it had not been maintained in at least 10 years; wind scour had
exposed the membrane in many areas and flooding (by evidently blocked drains) has led to
lightweight LECA particles everywhere (Figure 4.2). This extreme mobility by the LECA
aggregate can perhaps explain the decline in depth on this roof; indeed the styrofoam
modules featured on this roof in geometric patterns had originally been buried flush with
the substrate but were completely exposed in some locations. Personal experience has
witnessed a LECA-based green roof in the UK scoured and blown off by wind, so it’s possible
that the extremely shallow depths on these roofs is attributed to physical loss of this sort.

143
Figure 4.2. Blocked drains on VB A2 led to the re-positioning of the lightweight (LECA) substrate
component; several areas have been scoured to expose the waterproofing.
4.3.1.2 Substrate depth over time: assumed initial depth 100 mm
Building upon the variations in depth per quadrat presented above, the analysis that follows
is based upon the assumption that the EGRs surveyed were installed with 100 mm
substrate. According to conversations with Thomas Hövekamp (2010) and colleagues at
ZinCo, 100 mm was a common depth on these early roofs and any deviations could be
related to uneven levelling in spots. Depth was therefore re-calculated as “substrate loss”
(with 100 mm as the assumed initial depth), and roof age and substrate loss were tested as
co-variates against depth. The oldest and youngest roofs, Pliensaufriedhof and Killesberg,
were treated as outliers because their substrates were not representative of EGR substrates
(both with visibly less/ no lightweight aggregate and apparently blended with some topsoil).
Although not significant, Figure 4.3 suggests a slight trend of substrate loss over roof age for
the EGRs ranging from 21 to 25 years old (R2 = .275). The y-axis is loss of substrate depth, so
values lower down the axis mean that less depth was lost, or that a measurement was close
to 100 mm. The two oldest roofs shown here (25 years, VB Areas 1 and 2) are likely
responsible for the positive trend in substrate loss since no quadrats in these roofs were
deeper than 65 or 73 mm.

144
Figure 4.3. Substrate loss (assuming initial depth of 100 mm) for seven EGRs of various ages.
By contrast, the other roofs had at least some quadrats with under 20 mm loss, or depths
between 80 and 100 mm. FH Nürtingen and Köngen (both 23 years at time surveyed)
showed the greatest range of substrate lost, with several records of less than 20 mm and a
few between 40 and 55 mm (Table 4.2). These variations might simply represent the
variable depths described already (e.g., deeper substrate in centre of roof at FH Nürtingen
and on north-facing roof in Köngen). The quadrat-level measurements therefore illustrate
the considerable variability in depth on the roofs surveyed. Given that 100 mm initial depth
is a strong assumption, and considering the enormous variation recorded for substrate
depth, these results offer no conclusive evidence of decreasing depth over time as a general
trend. The next section will investigate whether sloped roofs exemplify any recurring
patterns in depth at the level of quadrat.

145
Table 4.2. Substrate loss per quadrat for seven EGRs (assuming 100 mm initial depth)
Depth (mm) Depth (mm)
Rathaus-PV Measured Loss Rathaus-lower Measured Loss
Q1 58.0 42.0 Q1 61.0 39.0
Q2 72.0 28.0 Q2 56.0 44.0
Q3 53.0 47.0 Q3 59.0 41.0
Q4 48.0 52.0 Q4 53.0 47.0
Q5 81.0 19.0 Q5 71.0 29.0
Q6 67.0 33.0 Q6 64.0 36.0
Q7 63.0 37.0 Q7 83.0 17.0
Q8 46.0 54.0 Q8 79.0 21.0
Q9 N/A 0.0 Q9 68.0 32.0
Q10 75.0 25.0 Q10 68.0 32.0
Q11 69.0 31.0 Q11 81.0 19.0
Q12 67.0 33.0 Q12 76.0 24.0
Q13 61.0 39.0 Q13 80.0 20.0
Q14 79.0 21.0 Q14 78.0 22.0
Q15 62.0 38.0
Depth (mm)
VB A1 Measured Loss VB A2 Measured Loss
Q1 46.0 54.0 Q1 72.8 27.2
Q2 63.0 37.0 Q2 73.3 26.7
Q3 65.0 35.0 Q3 61.3 38.7
Q4 49.0 51.0 Q4 63.5 36.5
Q5 48.0 52.0 Q5 63.8 36.2
Q6 51.0 49.0 Q6 53.0 47.0
Q7 52.0 48.0 Q7 54.0 46.0
Q8 49.0 51.0 Q8 47.0 53.0
Q9 47.0 53.0 Q9 61.5 38.5
Q10 52.0 48.0 Q10 63.3 36.7
Q11 47.0 53.0 Q11 48.5 51.5
Q12 65.0 35.0 Q12 50.5 49.5
Q13 54.0 46.0 Q13 45.0 55.0
Q14 51.0 49.0 Q14 56.3 43.7

146
Depth (mm) Depth (mm)
Köngen Measured Loss Tübingen Measured Loss
S-Q1 56.3 43.7 T1Q1 55.7 44.3
S-Q2 80.3 19.7 T1Q2 66.7 33.3
S-Q3 70.3 29.7 T1Q3 63.0 37.0
S-Q4 N/A T1Q4 47.3 52.7
S-Q5 N/A T2Q1 52.7 47.3
S-Q6 84.0 16.0 T2Q2 59.3 40.7
S-Q7 69.3 30.7 T2Q3 76.3 23.7
S-Q8 70.7 29.3 T2Q4 73.7 26.3
S-Q9 72.3 27.7 T3Q1 58.3 41.7
S-Q10 67.0 33.0 T3Q2 54.7 45.3
S-Q11 89.3 10.7 T3Q3 59.7 40.3
S-Q12 54.3 45.7 T3Q4 84.0 16.0
S-Q13 69.7 30.3 T4Q1 64.7 35.3
N-Q1 69.7 30.3 T4Q2 57.3 42.7
N-Q2 65.0 35.0 T4Q3 54.3 45.7
N-Q3 65.0 35.0 T4Q4 56.0 44.0
N-Q4 73.0 27.0
N-Q5 73.0 27.0
Depth (mm)
FH Nürtingen Measured Loss
Q1 78.7 21.3
Q2 45.0 55.0
Q3 85.0 15.0
Q4 70.3 29.7
Q5 88.3 11.7
Q6 64.0 36.0
Q7 62.5 37.5
Q8 80.5 19.5
Q9 66.0 34.0
Q10 91.5 8.5
Q11 63.3 36.7
Q12 N/A
4.3.1.3 Depth, slope and aspect
The final quadrat-level analysis of depth addresses the preliminary result that substrate
depth was correlated with slope and aspect. These results imply that greater depths usually

147
occurred on pitched roofs with south-facing aspects, or that shallower depths occurred on
flat roofs without a particular aspect. One might hypothesize that these results reflect the
location of sampling plots along a roof slope, such that deeper depths occur at the base of
the slope and shallower depths at the top. In order to examine this more closely, the depth
measurements recorded per quadrat for the pitched roofs were tested according to their
location along a slope (ridge, central, base) and whether they occurred on a north- or south-
facing slope (Table 4.3).
Table 4.3. Depth measurements per quadrat for three pitched EGRs (slope location, aspect)
Roof Quadrat Location Aspect Depth (mm)
Köngen N-Q1 ridge North 56.33
N-Q2 ridge North 80.33
N-Q3 ridge North 70.33
N-Q4 central North 138.67
N-Q5 base North 111.67
S-Q1 ridge South 84.00
S-Q2 ridge South 69.33
S-Q3 ridge South 70.67
S-Q4 central South 72.33
S-Q5 ridge South 67.00
S-Q6 central South 89.33
S-Q7 base South 54.33
S-Q8 ridge South 69.67
S-Q9 central South 0.00
S-Q10 base South 65.00
S-Q11 ridge South 0.00
S-Q12 central South 73.00
S-Q13 base South 0.00
Quadrat Location Aspect Depth (mm)
Tübingen T1Q4 base North 47.33
T2Q1 base South 52.67
T4Q3 ridge North 54.33
T3Q2 ridge South 54.67
T1Q1 base South 55.67
T4Q4 base North 56.00
T4Q2 ridge South 57.33
T3Q1 base South 58.33
T2Q2 ridge South 59.33
T3Q3 ridge North 59.67
T1Q3 ridge North 63.00
T4Q1 base South 64.67
T1Q2 ridge South 66.67
T2Q4 base North 73.67

148
T2Q3 ridge North 76.33
T3Q4 base North 84.00
Quadrat Location Aspect Depth (mm)
Killesberg T5Q1 base South 68.25
T2Q2 ridge South 73.75
T2Q1 base South 74.00
T3Q2 ridge South 74.75
T1Q4 base North 76.25
T3Q3 ridge North 76.50
T1Q4 base North 77.50
T3Q1 base South 78.00
T5Q3 ridge North 78.75
T1Q2 ridge South 80.25
T5Q2 ridge South 82.75
T5Q4 base North 88.00
T3Q4 base North 91.00
T1Q3 ridge North 91.75
T1Q3 ridge North 97.00
T4Q1 ridge South 99.75
T4Q2 ridge North 100.75
T1Q1 base South 115.00
A Kruskal-Wallis test revealed that substrate depths recorded at different locations along
the slope were not significantly different (ridge, n = 26, central, n = 4, base, n = 19), X2 (2, n =
49) = 2.011, p = .366. In Köngen, for example, although the two deepest depths were
recorded in the quadrats located centrally and at the base of the north-facing roofs slope
(N-Q4: 13.87 mm; N-Q5: 11.17 mm), the shallowest depth recorded on this roof complex
was a base measurement from the south-facing roof (S-Q7: 5.43 mm). In Tübingen, the two
shallowest depths were measured in quadrats located at the base of the slope, one facing
north (T1Q4: 47.3 mm) and the other facing south (T2Q1: 52.7 mm). The two quadrats at
the lowest possible sampling location of the roof slope (T4Q1; T4Q4) did not have
exceptionally deep nor shallow depths (64.7 mm; 56 mm), either. At Killesberg, the deepest
depth was a base location (T1Q1: 115 mm) but the next four deepest depths were near the
ridge (T4Q2: 100.8 mm, T4Q1: 99.8 mm, T2Q3: 97 mm, T1Q3: 91.8 mm). So, although the
preliminary analyses picked up on the trace of a trend from the overall data set, closer
inspection of the pitched roofs shows that the differences in depth were not significant
along the location of the slope.

149
Similarly, a Mann-Whitney U Test revealed no statistically significant differences in depth
measurements between north- (Md = 77, n = 22) and south-facing aspects (Md = 69.67, n =
27), U = 215.50, z = -1.638, p = .101, r = -0.234. Many of the deepest depths did occur on
north-facing slopes, as in Tübingen, but the four deepest depths in Köngen and Killesberg
occurred on two north and two south-facing slopes, comprising samples located at different
points of the roof slope (i.e., base, central, and ridge locations). These quadrats (N-Q4 at
Köngen: 138.67 mm; and at Killesberg T1Q1: 115 mm and T4Q1: 99.8 mm, both south-
facing) were outliers by comparison with the other measurements, although they were not
significant outliers (Figure 4.4).
Figure 4.4. Quadrats located on north-facing aspects had a greater range of depths measured but did
not differ significantly from south-facing quadrats.
Contrary to what one might expect, these results suggest that substrate depth was not
significantly influenced by location along a slope, nor the aspect it faces. In spite of their
prototypic constructions, the custom-built erosion control barriers at Köngen may therefore
be considered a tribute to these early systems. Still, Killesberg is even steeper and doesn't
feature such retention features, yet substrate depth was not deeper at base locations along
the slope. Of course, the survey methods only sampled uniform vegetation, which means
that extreme edges were avoided, such as the very base or top of a slope, but in some cases
such vegetation extended very near to the edges (e.g., Killesberg T5Q1 and Q4; Tübingen
T4Q1 and Q4).

150
4.3.1.4 Species-level responses to depth
The relationship between substrate depth and species composition is well researched from
the horticultural perspective, but the ecological dynamic between EGR vegetation and
substrate depth over time is unknown. The data from these surveys represent snapshot
observations of mature EGR vegetation. Abundance records of the ninety-five species
surveyed were subjected to a correlation analysis with depth. The relationship between
species cover abundance and substrate depth was investigated using Spearman’s rank
correlation coefficient. There were significant relationships between eleven species and
substrate depth (Table 4.4). The three species exhibiting the largest effects (Sedum
hybridum, S. spurium and Thymus serpyllum) all had negative relationships with depth [(rho
= -.403; rho = -.430; rho = -.436 (respectively), all n = 131, p < .001], which implies that these
species were less abundant in deeper depths and, vice versa, more abundant in shallower
depths. These species are popular green roof plants and occurred on the majority of the
roofs surveyed. According to these results, they were most abundant in shallow depths,
which concurs with field observations.
Table 4.4. Substrate depth had significant correlations with the cover abundance of eleven species.
Species abundance correlated with substrate depth (rho)
Correlation Coefficient
N Coefficient of determination
Allium schoenoprasum -.347** 131 12.04
Festuca ovina .377** 131 14.21
Moss_Hypnum2 -.333** 131 11.09
Moss_Calliergonella cuspidata .248** 131 6.15
Petrorhagia saxifraga -.257** 131 6.60
Sedum album Murale .351** 131 12.32
Sedum hybridum -.403** 131 16.24
Sedum spurium -.430** 131 18.49
Thymus serpyllum -.436** 131 19.01
Trifolium arvense .304** 131 9.24
Vulpia myuros .258** 131 6.66
The other species with significant responses to depth had weaker effect strengths [as per
Cohen (1988)], and the direction of relationships varied. Like the Sedums and Thyme
mentioned already, Allium schoenoprasum, the moss Hypnum2 and Petrorhagia saxifraga
all had negative relationships with depth. Little is known about the moss, which could only
be identified to genus, but the vascular species are popular green roof plants because of the

151
cover they maintain through self-seeding as well as their tolerance to drought (Kolb et al.,
1983, Krupka, 1992). By contrast, Festuca ovina, the moss Calliergonella cuspidata, Sedum
album Murale, Trifolium arvense and Vulpia myuros all had positive relationships meaning
that they had greater cover abundance in deeper depths. The strength of the relationship
and the amount of shared variance are important elements of this analysis (Pallant, 2010),
because of the small sample size. The coefficient of determination indicates that these
variables share very little of their variance; the three species with the largest effects and the
highest percentage of variance did not share more than 19% of their variance with substrate
depth. This is an important reminder of the influence of small sample size on significance
levels.
4.3.1.5 Discussion on quadrat-level analyses
Other studies that have examined the influence of slope and/ or aspect on EGRs have been
interested in the vegetation or substrate composition but have not reported on depth. For
example, Köhler and Poll (2010) found that north-facing aspects supported the greatest
plant coverage on vegetated roofs in Berlin, and that aspect played a significant role in
species composition due to light tolerance by different species, but they do not address how
these might influence substrate depth. Studies of spontaneous vegetation on TPG and flat
gravel roofs noted that shaded roofs had substantially more humus than sun-exposed roofs,
as a result of the accumulation of undecomposed vegetation and organic matter
(Bornkamm, 1961, Thommen, 1988), but they didn’t refer to the impact of this
accumulation on depth. Research into the substrate composition of EGR systems over time,
whether on actual roofs (Liesecke, 2006), on testing platforms (Rowe et al., 2012), or in test
plots (Jauch and Fischer, 2000) observed that soil organic content increases over time, but
again none reported on the depth over time.
Aspect and slope influence the climatic effects of light and temperature, among others,
which will certainly influence the vegetation, so the differing depths could be related to the
associated plant biomass and perhaps also the processes of decomposition under certain
climatic conditions. The north-facing roofs were located close to trees whose shade and
litter would affect soil moisture, pH and soil carbon, not to mention microclimate factors
like humidity, temperature. Such growing conditions affect not only decomposition rates
but also the proliferation of mosses and subsequent influences from this on the vegetation

152
and soil-based processes. Perhaps the influence of slope and aspect on substrate depth
cannot present clear and apparent trends because of the lurking variables and complex
ecological processes they are involved in.
In terms of substrate loss, the only physical disruptions observed that might have led to
losses in substrate depth were observed on the Esslingen Verkehrsbetrieb roofs, which had
the shallowest depths measured. If Hövekamp’s recollections were correct (100 mm LECA
with 10-20 mm organic layer over top), then these roofs lost over 60 mm in substrate depth.
The use of LECA has become less popular in Germany, with preference instead for recycled
materials like crushed brick (Appl and Ansel, 2004), but it is still listed as a green roof
substrate in other places (Molineux et al., 2009). Similarly, none of the depth measurements
on the Rathaus roofs exceeded 81 mm, so if they really were installed with 100 mm
substrate then up to 54 mm depth was lost in some places. No wind scour or other physical
removal was evident on these roofs, however. Location along the slope of pitched roofs was
not found to have a significant association with substrate depth, which may be a tribute to
the design of these roofs. The variability in depth measurements recorded can perhaps be
attributed more to the uneven distribution of the substrate upon installation than to
processes.
Of all the species identified, those that responded significantly to depth were typical green
roof plants (Allium schoenoprasum, Festuca ovina, Petrorhagia saxifraga, Sedum spp,
Thymus serpyllum) and ruderal colonisers (Trifolium arvense, Vulpia myuros) and two
mosses (Hypnum spp, Calliergonella cuspidata). The relationships revealed by this quadrat-
level analysis indicate that depth is an important factor to EGR species composition over
time. Recalling earlier analyses on persistence, gain and loss of species, substrate depth
might act as a selective filter for the species that persist over time, in conjunction with other
factors.
4.3.2 Roof-level query: mean depth
The results from the quadrat-level analyses were not conclusive that substrate depth
decreases with time, so this section will describe the observations at a broader scale, that of
mean values and including an expanded dataset. Working first with mean depth per roof,
the surveyed EGRs were arranged into ordinal age groupings (Table 4.5). A Kruskal-Wallis
Test revealed a statistically significant difference in substrate depth across the four age

153
groupings (Age 1, n = 46: 20-21 years; Age 2, n = 26: 22-23 years; Age 3, n = 44: 24-25 years;
Age 4, n = 15: > 26 years), 2 (3, n = 131) = 41.77, p < .001). The removal of the north-facing
quadrats at Köngen did not influence these results (p < .001), so data from both roofs were
included in the analysis. The two oldest roof age categories (24-25 yrs and >26 yrs) recorded
much smaller mean ranks (39. 43; 52.6, respectively) than the other two age groups, both of
which had mean ranks of 85. The youngest age group (20-21 years) recorded the highest
median score (Md = 34) of the other age groups, of which the second youngest group (22-23
years) had a median value of 19 while the two oldest groups had median values of 6. These
results suggest that substrate depth of the youngest EGRs surveyed was significantly deeper
than the older roofs.
Table 4.5. Mean substrate depth on nine EGRs of different age groups.
Roof name Roof age grouping
Mean depth (mm)
Rathaus-lower 20-21 69.79
Rathaus-PV 64.36
Killesberg 84.69
FH Nürtingen 22-23 72.28
Köngen 78.13
Tübingen 24-25 61.48
VB A1 52.79
VB A2 58.13
Pliensau > 26 yrs 61.56
Nine EGRs is considerably less than the minimum requirement of thirty-seven roofs (for
statistical rigour), but considering how little work has examined old EGRs in the first place,
this sample can be considered a starting point. In order to expand these limited results
further, a dataset from Karlsruhe may complement this work.
4.3.2.1 Amalgamated dataset: mean depth
The eight EGRs surveyed by Buttschardt are numbered in order of age, such that B1 is the
youngest roof (2 years since installation) and B8 was the oldest (7 years). The code name
given to each roof by Buttschardt is included in parentheses beside the roof name; the
prefix “sy-” implies that they are system roofs. Similar to the roofs in this study, the
Karlsruhe sample included a couple pitched examples (B2, B6), and large as well as small
surface areas (Table 4.6). Other than two single-layered systems (B4, B8), in which the

154
substrate concurrently serves for drainage, the Karlsruhe roofs were 3-layer constructions
(i.e., substrate and drainage layers are separated by a filter sheet). Only two of the
Karlsruhe roofs were located inside the old city centre (B3, B8), and the others were in less
dense, newer parts of the city. Two of the Karlsruhe EGRs were pitched, of which the 15
roof on B2 (Waldorfschule) had a western aspect, while the 12 apex slope on B6 (Turnhalle)
had equal aspects facing east and west, each 525 m2.
Table 4.6. Amalgamated dataset of 17 EGRs in south-west Germany installed between 1977-1997 in order of age at time surveyed
Roof code
Roof name (in order of age)
Year Installed
Age Area (m2)
Slope (°)
System (# layers)
Mean depth (mm)
B1 Forschungszentrum Umwelt (syFZU)
1997 2 230 3 + veg mat
50.0
B2 Pavillon Waldorfschule (syWDF)
1996 3 89 15 3 60.0
B3 Sparkasse Sophienstr. (sySk)
1995 4 110 3 140.0
B4 Jugendtreff Oststadt (syJTO)
1994 5 300 1 80.0
B5 Klinikum OP (syK) 1992 7 380 3 120.0
B6 Turnhalle RB (syRB) 1992 7 1050 12 3 60.0
B7 Haid & Neustr. (syH+N) 1992 7 410 3 60.0
B8 Garagen Rudolfstr. 6 (syR6)
1992 7 37 1 140.0
K-berg Killesberg 1991 20 450 30 3 85.0
R-low Stuttgart Rathausgarage, lower
1990 21 1000 3 70.0
R-PV Stuttgart Rathausgarage, PV
1990 21 1300 3 64.0
Köngen Römermuseum, Köngen 1987 23 230 17 3 71.0
FH-Nue FH Nürtingen 1987 23 258 3 72.0
VB A2 Verkehrsbetrieb Area 2 1986 25 2064 3 +modules
58.0
VB A1 Verkehrsbetrieb Area 1 1986 25 1860 3 +modules
53.0
Tueb Gärtnereihof Tübingen 1986 24 2160 15 3 + veg mat
61.0
Pliensau Pliensaufriedhof, Esslingen
1977 33 500 3 62.0

155
The 230 m2 EGR of B1 (Rotunde Forschungszentrum Umwelt) at the University of Karlsruhe
was installed with 20 mm deep, pre-cultivated coir vegetation mats on top of a multi-
layered system, and is framed by a border of concrete paving slabs. The north side of that
roof is directly neighboured by the Hardt forest. The 110 m2 EGR at B3 (Sparkasse) was on
an extension that served partly as terraces for flats on the first floor; it receives some shade
from the north-west wing of the building and the paving elements have led to some wet
patches. The single-layered system roof on the Jugendtreff (B4) featured a drainage element
consisting of coarse slag and recycled cinder waste. The 380 m2 EGR on B5 (Klinkum neuer
OP-Trakt) was divided into three sections divided by concrete borders; due to a higher
building to the west this roof received partial shade by afternoon. (Buttschardt, 2001) (p.
41). Of the eight EGRs surveyed, only four (RB, WDF, H+N, JTO) were granted access for
vegetation surveys, which involved permanent plots that were visited annually from 1997-
1999. Substrate depths on the Karlsruhe roofs ranged between 50 and 140 mm, but only
three (B3, B5, B8) had more than 100 mm.
Amalgamating this dataset with that from Buttschardt (2001) expands the sample to
seventeen roofs starting at two years after installation. The north-facing roof at Köngen was
excluded here because it was shown to be a significant outlier for mean depth. Extending
the assumption that the Karlsruhe roofs were also initially installed with 100 mm substrate,
a one-sample t-test found a statistically significant difference in mean substrate depth
between roofs (p < .05) with a mean difference in depth of 63.8 mm and a 95% confidence
interval ranging from 5.82 to 6.95. It seems unlikely that initial depth was under 70 mm,
which would suggest some loss over time. Three of the Karlsruhe roofs (B3, B5, B8) recorded
very deep mean depths of 120 mm or more, but the majority were under 60 mm. The
depths of the roofs measured in this study were less variable, with none over 85 mm. A best
fit line (R2 = 0.145) suggests a weak negative relationship between substrate depth and roof
age for this extended sample (Figure 4.5). This analysis affirms the variability in EGR
conditions and constructions in the early days of the German market. Clearly a larger
dataset is needed, as well as more monitoring of depth over time.

156
Figure 4.5. Mean substrate depth of EGRs over a timeframe from 3 to 33 years after installation
(using data from Buttschardt, 2001).
4.4 Conclusions
Closer inspection of the associations between substrate depth with time, slope and aspect
revealed subtle trends but no strong or consistent relationships. Indeed, the results from
the quadrat-level analyses echo the results of the power analysis, that at least thirty-seven
roofs are required to substantiate the relationship between depth and time. The provision
of convincing background information would facilitate such work considerably. In spite of
the amalgamated dataset featuring roofs of similar construction and regional location,
variability amongst the roofs makes conclusions difficult.
No documentation for the roofs surveyed here mention how the substrate was installed. In
any case, if the recommendations and guidelines for maintaining EGR substrate depths are
insufficient for the long-term, and depths shrink beyond the minimal threshold, this will
unequivocally have adverse repercussions for vegetation and ecosystem function, such as
stormwater retention and other green roof benefits.

157
Of the nine EGRs surveyed, the older EGRs surveyed had significantly less depth than the
younger ones. The amalgamated dataset of younger roofs from Karlsruhe suggested a
negative relationship of depth over time. The tests assuming 100 mm original depth also
suggested negative relationships between roof age and substrate depth, whether quadrat-
level for the nine EGRs or mean depths for the expanded dataset of seventeen roofs. Due to
the strength of that assumption, and given the variation recorded for depth, this chapter
cannot conclude that EGR depth decreases over time. Location of a quadrat along a roof
slope did not significantly influence substrate depth, nor did aspect (whether north- or
south-facing, or flat without any aspect).
4.4.1 How is depth over time addressed by the FLL guideline?
Since no observations of EGR substrate depth over time on have been published, the
opinions of German professionals with over 20 years’ experience in the green roof industry
and market were sought. Three colleagues (Dr. Gunter Mann, Optigrün International; Prof.
Dr. Stephan Roth-Kleyer, FH Geisenheim; Jörg Breuning, Green Roof Service, LLC) agreed
that substrate depth would likely have declined on older EGR systems, but that this would
not happen nowadays because of the improvements to the FLL guidelines, specifically the
specifications of less organic content and the refined parameters for substrate manufacture
and methods of installation (Mann et al., 2013). Still, none could confirm this by personal
observation. They declined to speak of the potential for declining substrate depth on EGRs
in new markets. These conversations demonstrate confidence in the FLL guidelines, and the
associated assumption that EGR substrate depth over time is stable and not a point of
consideration or concern.
A similar correspondence with North American practitioners suggested that substrate depth
on EGRs older than ten years is not commonly measured (Bass et al., 2013). One
professional in Vancouver (Randy Sharp, Principal, Sharp & Diamond Landscape
Architecture) did report “shrinkage” of 10 -20 mm on two roofs in that region: the Sechelt
RCMP Justice Facility (installed 2002 with 80 mm) and Campbell River City Hall (installed
2005 with 50 mm). Given that those green roofs were installed relatively early in the
development of Vancouver’s green roof industry, and juxtaposing this with the German
opinions, perhaps any occurrences of declining substrate depth over time is simply a

158
phenomenon that is restricted to the early days of an emerging industry, and which will
stabilise once standardised products, materials and methods are enforced.
The FLL guidelines are used as a reference for the development of green roof standards in
regions with emerging green roof movements (Dvorak, 2011). In North America, for
example, the American Society of Testing and Materials International (ASTM) Green Roof
Sub-Group has published five documents, including a standard guide for the selection,
installation and maintenance of green roof vegetation (ASTM E 2400 2006), standards for
determining structural loads under dry and saturated conditions of green roof systems
(ASTM E 2397 2005) and of dry and saturated substrates (ASTM E 2399 2005), and two
methods for testing water permeability rates through drainage materials (ASTM E 2396
2005; ASTM E 2398 2005). As with the German guidelines, there is no reference to
monitoring substrate depth over time.

159
5 Ecological conditions and processes on EGRs
The results presented in the previous chapters suggest that species diversity has
declined since the roofs surveyed were installed, and that dominant cover abundance is
often accomplished by succulent species (sometimes only a few). Succulents and grasses
behaved oppositely to other life forms with respect to many of the variables tested,
including slope, aspect, and cover abundance and species diversity of life forms. Two
main EGR vegetation types identified by a cluster analysis (“Species-poor Sedum roof”
and “Sedum meadow”), according to proportionate life form cover, were distinguished
mainly by species diversity and species composition. This chapter seeks out the role of
environmental and growing conditions on EGR vegetation, and the over-riding
processes, causes and mechanisms that led to those results. Since the sample size
available for this research was limited, this chapter elaborates into theoretical query as a
broader means of perceiving and predicting patterns on the roofs surveyed and,
potentially, on other roofs in other parts of the world.
5.1 Literature Review: the ecology of urban environments
After a thorough introduction to the environmental conditions of cities and urban
habitats, the classical ecological theories briefly introduced in Chapter 1 will be explored
in greater detail. In spite of the anthropogenic nature of EGRs, and the myriad
interlinked factors that affect each site uniquely from the next, do certain environmental
conditions determine species diversity or life form composition more than others over
time? What are the environmental conditions on EGRs and how do they influence
vegetation dynamics? Having characterised the vegetation with habitat indicators, this
chapter builds upon the vegetation types clustered in Chapter 3 by typifying EGR
vegetation further. With the EGRs accordingly distinguished into vegetation types, the
most philosophical question posed by this research can be examined, namely whether
emergent community properties develop on EGRs over time. In other words, do
emergent community characteristics develop, such that similar growing conditions lead
to similar EGR vegetation types and a convergence along common ecological trajectories
(e.g., homogenisation versus diversification)?
Do EGRs fit any ecological models, at least conceptually? For instance, does EGR
vegetation reach a steady state after a certain period of time (climax state of natural
succession) or do stochastic disturbances keep things in perpetual dynamism
(disturbance theory)? Can the proportion of persistent versus colonizing species on the
EGRs surveyed be related to the dimensions and location of the roof (island

160
biogeography theory, metapopulation dynamics)? Can the adaptive life strategies (CSR
theory) of the predominant flora serve to demonstrate the environmental conditions
that filter EGR species composition? Can the concepts of patch dynamics and
fragmentation aid the speculation of short-term dynamics that led to the results
observed?
5.1.1 The nature of urban ecosystems and urban vegetation
Zoomed out, the urban and urbanizing landscape is a complex mosaic of human
modifications and built structures, with natural spaces slotted wherever and however
urban designs and landscapes permit. Bearing very different conditions from rural
surroundings, the urban environment creates novel combinations of stress and
disturbance that can lead to altered ecosystem processes (Parlow, 2011) and a suite of
environmental modifications (Gilbert, 1989). Changes to the soil environment along the
rural-urban gradient, for example, lead to urban forests exhibiting highly altered litter
decomposition and nitrification rates, soil carbon pools, and fungal and faunal densities
(Pouyat et al., 1997), and such effects on nutrient and carbon cycling affect vegetation
and species composition in the long term (Zipperer et al., 2000). By contrast with non-
urban habitats, urban ecosystems are affected by a distinctly different kind, intensity
and frequency of anthropogenic influence (Breuste et al., 2008). It’s interesting to
consider that urban environments may have more in common, ecologically, with other
cities than with adjacent natural ecosystems (Savard et al., 2000, McKinney, 2002).
Extensive green roofs differ from other urban ecosystems in their occurrence at higher
elevations, exclusive use of engineered growing substrates, and their disconnect from
ground-level resources (e.g., greater soil profiles) and physical disturbances (e.g.,
trampling). Still, many of the conditions typical of the urban environment likely affect
roof- and ground-level vegetation similarly.
Urban vegetation can be described in as many ways as it can be perceived and the
complexity and heterogeneity of urban ecosystems poses a challenge to even the most
diligent ecologist. One major challenge to consistent descriptions is the implicit cultural
subjectivity of the observer; one ecologist might define an urban area as a singular,
homogeneous entity while another categorise it into distinct subunits. Similarly, some
might combine anthropogenic factors into a single environmental variable whereas
others correlate them with multivariate techniques. The classification and description of
urban vegetation is further challenged by the blurred objectivity of what is natural (or
native) and what is artificial (or non-native), not to mention the relevance of these
distinctions in the first place. Some ecologists suggest that the prevalence of many
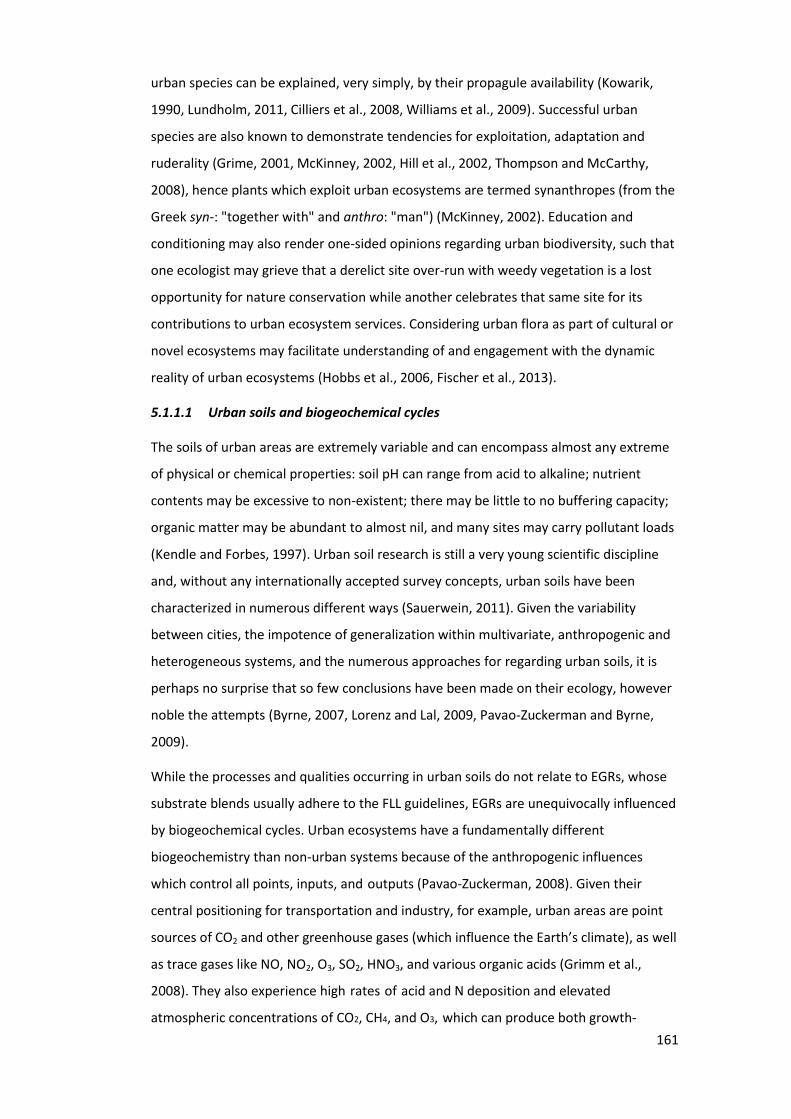
161
urban species can be explained, very simply, by their propagule availability (Kowarik,
1990, Lundholm, 2011, Cilliers et al., 2008, Williams et al., 2009). Successful urban
species are also known to demonstrate tendencies for exploitation, adaptation and
ruderality (Grime, 2001, McKinney, 2002, Hill et al., 2002, Thompson and McCarthy,
2008), hence plants which exploit urban ecosystems are termed synanthropes (from the
Greek syn-: "together with" and anthro: "man") (McKinney, 2002). Education and
conditioning may also render one-sided opinions regarding urban biodiversity, such that
one ecologist may grieve that a derelict site over-run with weedy vegetation is a lost
opportunity for nature conservation while another celebrates that same site for its
contributions to urban ecosystem services. Considering urban flora as part of cultural or
novel ecosystems may facilitate understanding of and engagement with the dynamic
reality of urban ecosystems (Hobbs et al., 2006, Fischer et al., 2013).
5.1.1.1 Urban soils and biogeochemical cycles
The soils of urban areas are extremely variable and can encompass almost any extreme
of physical or chemical properties: soil pH can range from acid to alkaline; nutrient
contents may be excessive to non-existent; there may be little to no buffering capacity;
organic matter may be abundant to almost nil, and many sites may carry pollutant loads
(Kendle and Forbes, 1997). Urban soil research is still a very young scientific discipline
and, without any internationally accepted survey concepts, urban soils have been
characterized in numerous different ways (Sauerwein, 2011). Given the variability
between cities, the impotence of generalization within multivariate, anthropogenic and
heterogeneous systems, and the numerous approaches for regarding urban soils, it is
perhaps no surprise that so few conclusions have been made on their ecology, however
noble the attempts (Byrne, 2007, Lorenz and Lal, 2009, Pavao-Zuckerman and Byrne,
2009).
While the processes and qualities occurring in urban soils do not relate to EGRs, whose
substrate blends usually adhere to the FLL guidelines, EGRs are unequivocally influenced
by biogeochemical cycles. Urban ecosystems have a fundamentally different
biogeochemistry than non-urban systems because of the anthropogenic influences
which control all points, inputs, and outputs (Pavao-Zuckerman, 2008). Given their
central positioning for transportation and industry, for example, urban areas are point
sources of CO2 and other greenhouse gases (which influence the Earth’s climate), as well
as trace gases like NO, NO2, O3, SO2, HNO3, and various organic acids (Grimm et al.,
2008). They also experience high rates of acid and N deposition and elevated
atmospheric concentrations of CO2, CH4, and O3, which can produce both growth-

162
enhancing and growth-inhibiting effects on organisms (Grimm et al., 2008). These net
effects fundamentally alter the physical, chemical and biological properties of urban
soils, thereby shifting ecosystem functions and processes related to biogeochemical
cycling. Green roofs are not exempt from these ubiquitous effects, but the effects on
EGR vegetation have not been explicitly studied.
5.1.1.2 Urban climate: temperature, air quality
Urbanisation is accompanied by local changes in climate, including higher minimum
temperatures and sometimes reduced maxima, as well as changes to precipitation
patterns and weekly cycles (Grimm et al., 2008). Due to the physical properties of
construction material, cities have completely different radiation and heat budgets (e.g.,
heat capacity, thermal conductivity) than non-urban landscapes (Parlow, 2011). The
urban heat island (UHI) effect is a well-documented example of anthropogenic climate
modification (Figure 5.1) that influences local and regional climates. Green roofs are
used to dampen the impacts of UHI on water resources, energy consumption, air quality,
human health, and biodiversity and ecosystem functioning (Crutzen, 2004, Hunter-Block
et al., 2012, Jim, 2014a, Jim, 2014b, Zhao et al., 2014). In hot climates, UHI exerts
additional stress on organisms, including humans, and may influence water resources by
changing the surface-energy balance, altering not only heat fluxes but also moisture
fluxes near the surface (Grimm et al., 2008). Continental climates experience the UHI
more intensely than maritime situations, which have complex and windy weather
systems (Kendle and Forbes, 1997). Still, green roofs’ positive abatement of UHI in Japan
(Takayama et al., 2008) has led to policy mechanisms supporting the implementation of
green roofs in that maritime island state (Tokyo Metropolitan Government, 2007).
Figure 5.1. On a sunny afternoon, urban air can be 1-3°C warmer than nearby rural air. Source: Berkeley Lab, Heat Island Group.

163
Urban warming induces the formation of smog, and atmospheric ozone and carbon
dioxide levels are frequently elevated in urban environments (Grimm et al., 2008). These
changes in atmospheric chemistry have been shown to affect plant physiology and
potentially also affect soil quality through alterations of plant-soil interactions and litter
quality (Pavao-Zuckerman, 2008). Pollution from dust is also an urban issue, particularly
if vegetation is inadequately provided; large trees can reduce over 50% of urban dust,
and moderate spacing of urban trees encourages air to filter through, rather than being
diverted, while also reducing wind speed (Kendle and Forbes, 1997). Several studies
have found that EGRs can help to reduce air pollution (Yang et al., 2008, Currie and Bass,
2008, Rowe, 2011, Speak et al., 2012), although little documentation has studied the
reverse, namely the effect of the urban climate on green roof vegetation. Lastly, wind
patterns through aerodynamics, vertical turbulence and wind field are all influenced by
the three-dimensional complexity and surface roughness of the urban boundary layer
(Parlow, 2011), all of which can have major impacts on urban vegetation. Indeed, wind
loading on green roofs can result in positive and negative pressures, friction, shearing,
erosion and uplift (FLL, 2008b) (p. 35), hence standards to minimise wind damage are
required for European (DIN 1-55-4) and North American green roofs (ANSI and SPRI,
2010).
5.1.1.3 Hydrology of urban environments
The hydrologic cycle is dramatically impacted by urbanisation, and reducing the
associated negative impacts has led to increasing use of green infrastructure in cities
around the world (U.S. Environmental Protection Agency, 2011, Hunter-Block et al.,
2012, Kimmel et al., 2013). The natural hydrologic cycle includes precipitation,
infiltration, groundwater flow and recharge, evaporation and condensation. Hard,
sealed surfaces (i.e., roads, roofs, pavements) disrupt percolation, soil infiltration and
aquifer replenishment, and stormwater infrastructure inhibits plant-water uptake and
evapo-transpiration because it channels precipitation directly to rivers and, eventually,
the sea. Urbanisation leads to significant changes in watershed behaviour, with local and
global effects (Illgen, 2011). The magnitude of these impacts relate directly to the extent
of surface sealing (Natural Resources Defense Council, 2013). In fact, some researchers
have proposed that global warming and climate change are more the result of disrupted
hydrologic cycles than atmospheric greenhouse gases (Kravčík et al., 2007, Schmidt,
2010); this ‘water paradigm’ states that reduced surface water and precipitation create
a warmer and drier terrestrial environment which is maintained as a negative feedback
(Schmidt, 2010). As introduced in Chapter 1, much research has quantified green roofs’

164
ability to retain and detain stormwater runoff and to improve the urban climate through
evapotranspiration.
5.1.1.4 Anthropogenic forces in urban ecology
Since urban environments are governed by human actions, anthropogenic forces are
necessary elements of any study of urban ecology. From an ecological perspective, cities
present unique mosaics of residential, commercial, industrial, and infrastructural sites
interspersed with green spaces. These green spaces may be formal (e.g., parks, gardens)
and informal (e.g., remnants of less modified vegetation), as well as “wild” functioning
habitats such as natural watercourses, derelict industrial sites and overgrown gardens
(Breuste et al., 2008, Williams et al., 2009). Many agree that conserving and enhancing
urban biodiversity has unique implications for human well-being and public health
(Gilbert, 1989, McKinney, 2002, Miller, 2005, Diaz et al., 2006, Goddard et al., 2010,
Kowarik, 2011, Kellert et al., 2008). For extensive green roofs, the direct anthropogenic
forces influencing EGR vegetation are typically intentional, such as species selection and
maintenance, but anthropogenic forces can be unintentional and indirect, too, like
species introductions via the substrate.
Cities and towns are hubs of transport and the networks to which they are connected
facilitate the spread of species across various spatial scales (Kowarik, 1990, Pysek, 1993,
McKinney, 2006, Ricotta et al., 2009). Particularly when they serve as ports for world
trade, cities can qualify as propagule sources which can launch species to distributions of
global scale. The concept of “biotic homogenization” implies that cities around the world
will eventually all feature the same cosmopolitan assemblage of generalist species. Even
though these species may enrich local biodiversity, this concerns conservationists
because global species and genetic diversity are compromised when biologically unique
ecosystems and species pools are lost (McKinney, 2006, Ricotta et al., 2008). The typical
conditions of cities (warmer, drier, etc.), not to mention a continually warming climate,
explain why many of the most prevalent urban weeds originate from dry, warm, high-
light, pioneer habitats (Diaz et al., 2004, Ricotta et al., 2009). In addition, weedy
organisms tend to have affinities to human activity (Thompson, 2014), and species like
Norway rat, House mouse, Starling and House sparrow are found in all cities of Europe
and North America (Jokimaki and Suhonen, 1998).
Little scientific research evidence backs the claims of biotic homogenization
(Hitchmough, 1994, Dunnett, 2004). Research coordinated by the Convention on
Biological Diversity (2012) found that the number of native species in cities is relatively

165
high in spite of the pressures that would suggest otherwise (e.g., habitat loss and
fragmentation), and that “concerns about biotic homogenization may be somewhat
unfounded” (p. 9). Particularly in the northern Hemisphere (which is better studied than
the south), 50% or more of the regional or even national species assemblage for many
taxonomic groups occurs in cities. Indeed, several studies report that urban areas
support important pools of biodiversity [e.g., Kühn et al. (2004), Kinzig et al. (2005),
Pickett et al. (2008)], with some reports of greater native diversity in urban than
neighbouring rural areas [e.g., Wania et al. (2006)]. A series of collaborative studies have
recently begun to assess the nature and extent of ecological homogenization in urban
USA (Groffman et al., 2014). Current understanding is conflicted; although towns and
cities clearly offer prospects for biodiversity and must not be overlooked as
opportunities for reversing the trends of extinction (Hooper et al., 2005), they also carry
a potentially large extinction debts (Hahs et al., 2009, Duncan et al., 2011). Furthermore,
the increase of impervious surfaces and compact urban development patterns offer
limited opportunities for native vegetation to persist or colonise (Hahs et al., 2009).
5.1.1.4.1 Filters of natural selection: urban ecology and evolution Anthropogenic forces also impact upon the behaviour, phenology, phylogenetics and
morphology of city-dwelling organisms. Over the short-term, species phenotypes may
change in response to anthropogenic forces, both direct (buildings, modified habitats,
wildlife feeding) and indirect (noise and air pollution, altered temperatures, productivity
and light). In the longer term, these selective forces can act as evolutionary filters that
influence population genetics and life-history traits of urban species (Shochat et al.,
2006, Grimm et al., 2008). From the perspective that the selective anthropogenic forces
of urban environments may create a new type of natural selection, Shochat et al. (2006)
suggest that the key to understanding urban patterns is to balance the study of
processes at the individual scale with an integrated examination of environmental forces
at the ecosystem scale. Mechanistic studies have demonstrated that urbanization can
lead to changes in animal behaviour (Slabbekoorn and Peet, 2003, Shochat et al., 2004),
including physical morphology (Yeh, 2004) and community structure (Shochat et al.,
2004).
In anthropogenic (urban) environments, plant species are sourced from three sources: i)
native species originally present in the area; ii) regionally native species originally absent
from the area but which have colonized novel habitats created by urbanization; iii) alien
species introduced by humans that escape to establish wild populations in urban
environments (Williams et al., 2009). A meta-analysis using data from twenty-one urban

166
floras in Europe and eight in the USA found that urban conditions constrain the
functional diversity of urban floras, as evidenced by the lower phylogenetic diversity of
urban alien species that are well adapted to these habitats (Ricotta et al., 2009). This
would imply that urban alien floras are composed of phylogenetically related species, as
a result of urban environmental conditions. Similarly, a time-series analysis covering
three centuries for Halle (Saale), Germany, identified that some of the drivers behind
urban floristic change included the higher urban temperatures, gardeners’ preferences,
and dispersal agents such as animals, vehicles, and greater wind turbulence (Knapp et
al., 2010).
The notion of environmental filters and assembly rules offers a useful conceptual
framework for modelling the forces that govern the assembly of biotic communities
(Lake et al., 2007, Rahel, 2002, Williams et al., 2009, Diamond, 1975), and for comparing
and contrasting restoration practices for different ecosystems (Nuttle, 2007). Within this
framework, the assemblage structure and membership of a local species assemblage are
determined by constraints, or filters, to dispersal, as well as biotic and abiotic features.
For instance, if a species from the regional species pool is able to arrive at a site by
dispersal, and if the environmental and biological conditions of the site are amenable to
its establishment and survival, then this species will become part of the local assemblage
(Figure 5.2). However, in heavily impacted systems the regional species pool may be
diminished and the same constraints can lead to different assemblages (Lake et al.,
2007).
Figure 5.2. Varying responses to the constraints of a site can lead to different species assemblages in the same habitat, especially if the regional species pool is (a) intact or (b) depleted. Adapted from Rahel (2002) and Lake et al. (2007).

167
This conceptual framework can also help to advance a clearer understanding of the
effects of urbanisation on urban floras, provided the inclusion of both remnant and
novel habitats, and species of all designations (native, cosmopolitan, garden escapees,
etc.). A framework proposed by Williams et al. (2009) is based on the assumption that
the species pool of an urban flora will include any species that have managed to pass
through four filters (Figure 5.3). The first two – habitat transformation and
fragmentation –are anthropogenic filters present in most ecosystems, while the latter
two – urban environmental conditions and human preference – are unique to cities.
Each of these filters creates selection pressures that leave a “signature” on urban floras,
owing to the non-random gain and loss of species, changes in species abundances,
altered distributions of functional traits, and so on.
Figure 5.3. A schematic model of major urban filters that add (grey arrows) and remove (white arrows) plant species resulting in altered species persistence (black arrows). The four panels represent filters of plant diversity that may select on floristic composition, plant functional traits or the phylogenetic structure of communities. Although displayed in temporal sequence, different parts of an urban environment will likely experience each filter at different times, resulting in filters acting simultaneously within the entire urban environment. (a) Habitat transformation adds species by creating novel urban environments, and removes species due to the loss of native vegetation. (b) Fragmentation removes species that are unable to persist in small isolated areas, which can then be colonized by additional species. (c) Urban environments are unlike non-urban environments due to a suite of environmental changes (e.g. pollution, urban heat island) that can select for or against species. (d) Human preferences add and remove species. Each filter contributes to a suite of taxa that can persist in urban environments. Modified from Williams et al (2009).
5.1.1.4.2 Social impacts: ecological ignorance leads to collective indifference An increasingly urbanised human population also influences urban vegetation and
biodiversity when ecological awareness and appreciation for non-human life is lost
(Savard et al., 2000, Millard, 2004, McKinney, 2006). If the relationship between
humanity and nature is ultimately determined by culture (Lapka et al., 2012), it is

168
unsettling that most Americans can identify hundreds of corporate logos but fewer than
ten plant species (Hawken, 1994). Without ready access to non-urban locations, most
city dwellers’ natural experiences are limited to ornamentals and cosmopolitan species.
As the gap widens between people and the natural world, collective ignorance may
ultimately lead to collective indifference (Papworth et al., 2009). Without ecological
awareness, public policies such as Endangered Species legislation lose public support
(Kendle and Forbes, 1997, Mehmood and Zhang, 2001). The social-psychological
condition of “shifting baseline syndrome” (SBS) defines the process whereby “the
environment encountered during childhood becomes the baseline against which
environmental degradation is measured later in life” (Papworth et al., 2009)(p. 93). The
decline of expectations by younger generations of the quality and function of natural
areas [as generational and personal amnesia, or the “extinction of experience” as per
Miller (2005)] leads to a gradual shift in perceptions. So if ‘normal’ conditions become
increasingly human-dominated, while sensitivity towards nature and non-human life
becomes weaker, many species and habitats will lose increasingly more value and
relevance in the public mind. Although little empirical evidence exists to test SBS, the
certain trend of urbanisation suggests that this is a concept worthy of consideration.
Some of the benefits popularly cited for EGRs include aesthetic improvement, general
health benefits and horticultural therapy, recreation and amenity space, and space for
community building (Oberndorfer et al., 2007, Peck et al., 1999). More specifically,
ecologically oriented green roof plantings, like “untidy” naturalistic vegetation, may
offer veritable opportunities to shift public preferences away from the scenic aesthetics
that are rooted in antiquated Victorian and modernist ideals (Loder, 2014). The latter
study, which examined office workers’ responses to views of prairie-style versus Sedum
green roofs in Chicago and Toronto, found that green roofs instilled fundamental
fascination and supported the biophilia hypothesis [as per Kellert et al. (2008)], but also
that growing appreciation levels could be linked with eco-literacy and stimulating more
contemporary world views. Intriguingly, that study noted exceptional sensitivity by
almost all the participants to the perceived intention behind the green roof; since
Sedum roofs represent the minimal planning requirement in those cities, they were less
favoured because they implied less effort on behalf of building owner or municipality
towards the quality of urban public life, public health, and larger environmental issues
(ibid). Similar to how naturalistic planting designs at landscape-level are more
acceptable when accompanied by signs of human care (Nassauer, 1995), green roofs
featuring naturalistic vegetation may help to usher in a new urban ecological aesthetic

169
(Loder, 2014). Given that human access to green roofs is usually limited to views
(sometimes from considerable distance), “cue to care” in this context might involve the
provision of interpretative materials in order to educate people about the multi-
functional benefits of certain design approaches .
5.1.2 Ecological principles for green roofs
All assemblages of plants, whether natural or designed, develop in accordance with
ecological principles (Hitchmough, 1994). One aim of this research was to identify
plausible ecological theories or models that describe the processes that occur on EGRs
over time. Can EGRs be treated as functioning ecosystems in the first place? Or are they
too contrived and highly engineered, too urbane, to be considered through the lens of
ecological theory? Over the course of the 20th century, numerous ecological theories,
hypotheses and models were developed with the central aim of conserving biodiversity
and habitat. Specifically, these theories emerged from the quest to better understand
how species diversity is influenced by broad habitat patterns of various shapes, sizes and
internal structures, as well as their spatial relationships together and with the habitats
of the surrounding landscape (Kendle and Forbes, 1997). An understanding of ecological
principles can facilitate effective management, planning and design (Hitchmough, 1994),
and ecological methods can offer insight into the dynamics and processes of urban
landscapes and vegetation (Breuste et al., 2008). However, it’s also important to recall
the limitations of conservation-oriented principles for urban ecosystems, for which
considerably smaller datasets and timeframes exist. It may be tempting for researchers
of urban ecology to borrow and apply models intended for unmanaged ecosystems, but
implicit in such a transfer is the assumption that urban ecosystems are qualitatively
similar to other ecosystem types (Kaye et al., 2006), which the previous section
illustrated is not true.
Green roofs are relatively new objects to the scope of ecological query (Piana and
Carlisle, 2014). Reference to a variety of ecological models may help to foster an
understanding of the mechanisms directing the functions and developments of green
roof vegetation as dynamic systems. Considering green roofs as plant communities
physically isolated from other vegetated areas by a contiguous urban matrix, for
example, recalls models of population dynamics resulting from biogeographic isolation
(MacArthur and Wilson, 1967, Diamond, 1975) and fragmentation (Hanski, 1994,
Harrison and Bruna, 1999). The effects of site-level pressures on EGR vegetation may be
interpreted with reference to disturbance theory (Connell, 1978, Grime, 2001).
Hierarchical patch dynamics (Wu and Loucks, 1995, Eriksson, 1996, White and Pickett,

170
1985) may prove useful for describing delineated vegetation types, and change in
vegetation over time can draw from the theory of natural succession. Given its central
role to the discipline of ecology, and its over-arching presence to the other theories,
natural succession will be reviewed first.
5.1.2.1 Natural succession
The theory of natural succession strives to describe the drivers and mechanisms behind
floristic change over time. The foundation set by the conceptual pioneers of the early
20th century has supported the development of a comprehensive framework that can
now relate to other ecological theories, as well as research on plant community change
and ecosystem management practices, like restoration ecology (Pickett et al., 2009). The
early viewpoint of successional change, which implied a progressive change in the
structure and species composition of the vegetation to a final “climax” community, was
eventually replaced in favour by cyclical change implying that similar vegetation types
will recur in the same place at various intervals of time (Grime, 2001). Using different
language, changes in “autogenic succession” are brought about by the species and
organisms already present (autogenesis means self-forming, from Greek: aut- = self; gen
= produce), while “allogenic succession” (Greek: allo- = different, diverging) is brought
about by external factors (Tansley, 1935).
Regardless of those contrary views, two main types of natural succession are recognised.
Primary succession involves the colonisation of a new, skeletal habitat (i.e., initially
lacking in soil and vegetation), such as a fresh lava field following a volcanic eruption.
Spontaneous colonization of EGRs that were installed with sterilised substrate but not
planted would theoretically qualify as primary succession, though this is not common
practice (Nagase et al., 2013). Secondary succession, the more common circumstance,
occurs in environments where higher plants are already present, if only as propagules in
the soil. Old-fields were the classic focus of secondary succession, whereby abandoned
cropland reverts back to forest in sequential stages (or “seres”). Mosaics of both types
of succession are possible, too. Since green roofs are initially planted with select species,
EGR vegetation is theoretically subject to secondary succession, although a catastrophic
event exterminating all life could theoretically return it to primary forces.
5.1.2.1.1 Early successional models: facilitation onwards The models of facilitation and initial floristic composition are of particular use to
landscape practitioners (Hitchmough, 1994). The facilitation model is the classic version
of plant succession and describes how, after a disturbance, a gradual succession of life
forms facilitates colonisation for other life forms. Climax-oriented “old field succession”

171
is illustrated by relay floristics (Figure 5.4a), where different life form groups colonize
the site at certain stages of development (seral stages), eventually making conditions
unsuitable for themselves but facilitating invasion by the next group (Clements, 1916).
This model was termed “relay floristics” because the colonization by different life forms
was seen to occur as in a relay, such that out-going species/ life forms create conditions
for incoming species (Egler, 1954). Many early ecologists disagreed with the directional
view of the facilitation model, but at the same time it was “so satisfying to most
ecologists that it … dominated the field“ (Connell and Slatyer, 1977).
Figure 5.4. (a) Facilitation model and relay floristics: after cropland is abandoned, annuals and perennial herbs are the first to colonize, followed by shade intolerant woody species and finally the shade-tolerant trees and shrubs, which represent the climax state. (b) Initial floristic composition model: secondary succession is strongly directed by the propagules of a site’s initial flora, which rise and fall from predominance in accordance with resources and stress. Adapted from Egler (1954).
The influence of seed rain, soil seed bank and propagule pressure on successional
change led Egler (1954) to propose the initial floristic composition model (Figure 5.4b),
which suggests that change across time in a plant community essentially comes from
within, rather than from outside. Contrary to waves of invasion, as in relay floristics, this
model illustrates that successional change is based upon pre-existing vegetation, seed
bank and physical impacts (e.g., grazing and ploughing versus abandonment). In other
words, most of the regenerating species after a disturbance event are already present
before the event, and the nature of the disturbance event and the condition of the
vegetation prior will determine which species arise. Although originally developed
through old-field studies, this model has proven useful in the urban context (Rebele,
1992, Bornkamm, 2007, Rebele, 2008). One study, which examined colonization and
early successional processes on three urban soils (representing a gradient of nutrient
status: topsoil, ruderal soil, sand), found that successional stages could be distinguished
by fertility level, organic matter content and seed pool. Specifically, the initial floristic

172
composition factor was most important on topsoil, less important but still contributed to
successional patterns on ruderal soil, and had no effect on sand (Rebele, 1992).
Developments on autogenic succession led to models based on stochastic processes,
including attributes of distribution, dispersal, and plant life strategies (Burrows, 1990).
Species competition with respect to changing resource and environmental gradients
gained importance (Tilman, 1982, Pickett, 1976, Diamond, 1975), but it was Connell and
Slatyer’s (1977) three-fold model of facilitation, tolerance and inhibition that
strengthened succession research and theory because it enhanced earlier models with
the growing understanding of disturbance and plant life strategies. In addition to the
original facilitation model, the “tolerance” model was based on the prediction that later
species can tolerate lower levels of resources than earlier ones (owing to differently
evolved life strategies for resource exploitation), and the “inhibition” model referred to
the mounting evidence on the importance of competition whereby all species resist, or
inhibit, invasion by competitors until they die or are damaged, thus releasing resources
and allowing those colonisers to reach maturity and a steady state, or climax
community.
5.1.2.1.2 Later successional models: environmental filters, functional traits As empirical evidence amassed, succession theory moved towards more individualistic,
kinetic schemes, which rejected the notion of stable end-points on the basis that
disturbance is continually changing the vegetation; change and cycles are evident but no
particular phase can be regarded as stable [e.g., (White, 1979)]. As originally proposed
by Gleason (1939), species’ individual strategies were seen to direct natural succession
and, moreover, no two vegetation samples are alike either in quantitative or qualitative
composition. As such, both species and ecosystem attributes play a role in succession.
Whittaker’s (1967) method of sampling vegetation along an elevation gradient was
originally developed to test the ‘community-unit theory’ related to natural succession,
but contributed more to the principle of community continuity. Gradient analysis also
became a tool for urban ecological studies, most notably to quantify disturbance along
urban-rural gradients.
Recalling CSR theory, one of its exceptional strengths for modeling succession is its
capacity to interpret the subtle dynamics of plant community composition via plant
adaptive strategies with direct relation to the conditions and resources of the site. For
long-term studies, the conversion of vegetation data to CSR signatures have been used
to over-ride interannual fluctuation in species’ abundance, and to indicate changes
“even within what may be thought of as relatively stable vegetation” (Hunt et al., 2004)

173
(p. 622). For example, by including CSR functional groupings to the species monitored in
a long-term study (38-years) of a grass verge in Bibury, UK, Dunnett et al. (1998) showed
how species adapted to environmental stress or disturbance (C-R, R, S) gained
competetive advantage after warm dry springs and summers, whereas species adapted
to more productive conditions (C, C-S) were disadvantaged.
5.1.2.2 Disturbance theory and patch dynamics
Disturbance is implicit in the theory of natural succession, and a body of theoretical and
practical work has accrued which focuses entirely on disturbance and the associated
dynamics. Indeed, the processes of growth, death and replacement, which define the
dynamism of biological systems, are all attributed to disturbance. According to White
and Pickett (1985), a disturbance is “any relatively discrete event in time that disrupts
ecosystem, community, or population structure and changes resources, substrate
availability or the physical environment” (p. 7). Resources are often made available by
disturbances (Canham and Marks, 1985), though this is not always the case (Vitousek,
1985). Disturbance introduces stochastic influences on community composition that
challenge the predictability of response. Fluctuating environments lead to multiple
resetting of the local successional trajectory (Botkin, 1981), making “normalcy” difficult
to define for any ecosystem (White and Pickett, 1985). Disturbances often create
patchiness in an ecosystem, but when the effects are diffuse the patches can be difficult
to define (Watt, 1947). As a fundamental and relatively discrete spatial unit, a “patch” is
the basic building block for models which integrate population, community and
ecosystem levels of organization (Forman and Godron, 1986). Definitions of patches are
always relative to the system at hand, since community structure and behaviour vary
locally, but the term does not establish any constraint on size, internal homogeneity, or
discreteness (White and Pickett, 1985).
From the ecological and landscape perspective, urbanization leads to an increasingly
fragmented landscape comprising numerous small patches with many edges and more
biodiversity (Grimm et al., 2008). As such, urban landscapes can be described as mosaics
of biological and physical patches within a greater matrix of infrastructure, social
institutions, cycles, order, and so on. Sources of spatial heterogeneity within cities are
both natural (e.g., disturbance regime, stresses) and human (e.g., introduction of exotic
species, control or modification of natural disturbance agents) (Zipperer et al., 2000).
The concept of shifting mosaic connotes a uniformity of patch distribution in time and
space (Bormann and Likens, 1979). The concept of patch dynamics can be useful to
describe situations in which local equilibria occur as feedbacks between community

174
characteristics and disturbance events (Pickett and White, 1985a). Under this
framework, an EGR could be defined as an elevated urban vegetation patch, whereby a
single roof can be treated as a patch, though a large roof with a variety of distinct
formations could be seen as comprising a variety of patches, too. Hierarchical patch
dynamics incorporates certain "emergent properties" of ecological systems, such as
metastability or persistence at the metascale, as opposed to the transient dynamics that
usually characterize local phenomena (Wu and Loucks, 1995) (p. 439). Patch dynamics
may be a useful conceptual approach for understanding (and managing) urban
ecosystems, as it focuses on the creation of spatial and temporal dynamics between
disturbance with consideration of how such heterogeneity influences the flow of
energy, matter, species, and information across a landscape (Zipperer et al. (2000). The
value of this approach is that disturbance is not treated as a key ecological principle but
rather as one of the many components which lead to structural and resource changes
within a landscape.
“Disaster” and “catastrophe” are two types of disturbance, whereby disaster occurs
frequently enough that successive generations will experience it while catastrophes are
rare occurrences unlikely to be experienced as a repeated, selective force (Harper,
1977). In evolutionary terms, disaster would likely increase fitness through selection,
while catastrophe would have the opposite effect (White and Pickett, 1985). Due to the
nature of their exposure and constructed form, EGRs are notably prone to disturbance,
although this has not been explicitly quantified as such (perhaps for the same reasons
that long-term green roof research is rare). Still, research has demonstrated that shallow
EGR substrates are subject to extreme temperature fluctuations (MacIvor and
Lundholm, 2011, Tabares-Velasco et al., 2012, Zhao et al., 2014) and that insufficient
plant cover will permit heat flux through the substrate and into a building (Connelly et
al., 2006, Simmons et al., 2008, MacIvor and Lundholm, 2011). Indeed, the harsh living
conditions of these substrates are exemplified by work characterising the soil-dwelling
invertebrates of typical EGRs as transient species of disturbance-prone habitats (Darius
and Drepper, 1983a, Buttschardt, 2001, Jones, 2002, Schrader and Boening, 2006,
Kadas, 2011, Madre et al., 2013, McGuire et al., 2013), which are unstable and
susceptible to catastrophic population crashes (Rumble and Gange, 2013). The heat gain
of the shallow mineral substrates explain why hot events will kill tree seedlings
(Buttschardt, 2001).
The intermediate disturbance hypothesis, which is attributed to Connell’s (1978) work in
tropical rainforests and coral reefs, states that species richness will be greatest in

175
communities experiencing some intermediate level of disturbance. Presented in
different terms, the “humped-back model of species richness” (Figure 5.5) was
developed through laboratory experiments and field surveys of herbaceous vegetation
in England (Grime, 1973b). A central tenet of the humped-back model is that in extreme
environments organisms must exhibit a high degree of adaptive specialisation to survive.
Many observations support these generalizations, although they can fall short in their
vagueness by leaving too much unspecified (e.g., will intermediate disturbance enhance
nutrient retention or productivity as well as richness?), but also by the challenges of
quantification (i.e., how should the impact of disturbance be measured?) and because
they do not explicitly state the maximum level of disturbance. Another disturbance
hypothesis suggests that species richness should be maintained when disturbance recurs
more frequently than the time required for competitive exclusion (Huston, 1979).
Unfortunately, this hypothesis suffers from the same shortcomings as the previous.
Figure 5.5. The “humped back model for species richness” describes the impact of a gradient of increasing stress and/ or disturbance upon the potential species density in herbaceous vegetation. Modified from Grime (1973a).
With the possibility of manipulating disturbance regimes, the urban context offers
opportunities to study the effects of urbanization and different disturbance types,
intensities, and frequencies on biotic communities and ecosystems (McDonnell and
Pickett, 1990). Gradient analysis has been used to examine the spatially variable effects
of urbanization by treating vegetation in terms of continuity and gradient relationships
along urban-rural gradients (McDonnell and Pickett, 1990). Such studies have reported
discernible peaks in species richness and diversity at moderate levels of disturbance

176
along urban-rural gradients, including butterflies (Blair and Launer, 1997) and birds
(Jokimaki and Suhonen, 1998). Urban areas are not uniform, however, and this pattern
was not always consistent, as in the case of Carabid beetles in Brussels (Godefroid and
Koedam, 2007). Whether the transect runs up a mountain or through a city, the gradient
method supports the view that “environmental variation is ordered in space, and that
spatial environmental patterns govern the corresponding structure and function of
ecological systems, be they populations, communities, or ecosystems” (McDonnell and
Pickett, 1990) (p. 1232). Interactions within the ecological systems, and between the
environmental gradient and the ecological systems, will affect the distribution and
behaviour of systems along the gradient.
5.1.2.3 Fragmentation, island biogeography, metapopulation theory
Dispersal is an important element of all theories intent on describing the mechanisms of
plant community assemblage; the effects of fragmentation, disturbance and patchiness
on species assemblage and community structure have interested ecologists for centuries
(Pickett and White, 1985b, Forman and Godron, 1986). Fragmented habitats are
typically biologically impoverished compared to intact habitats, and many studies have
found that remnant fragments support fewer specialists but more widespread generalist
species (Barbour et al., 1999). The loss of diversity and ecological function within habitat
fragments can be partly explained by the relative importance of different mechanisms,
like edge effects. In forests, for example, physical edges affect much of the biotic
community through direct and indirect effects like increased wind and light penetration,
and decreased humidity (Forman and Godron, 1986). Biological edge effects include
invasion by aggressive competitors, which may attain exceptionally high abundances
near edges thanks to subsidised resources from the greater matrix (Harrison and Bruna,
1999). Fragmentation may also lead to sequences or chain reactions of altered
ecological interactions, like when important predators or seed dispersers are lost.
Changes to the abundance of component species at lower trophic levels will also have
implications for food webs and ecosystem function.
Island biogeography was developed to explain the gain and loss of species as a function
of area and habitat fragmentation, with the basis of oceanic islands as truly isolated
examples. The model relates an island’s species diversity with competition and rates of
colonisation and extinction. More species are predicted on large, rather than small,
islands because the extinction rate is lower. The theory also proposes that islands closer
to the mainland or other islands would have more diversity than isolated islands
because the rate of arriving species and colonists would be higher (Forman and Godron,

177
1986). Unfortunately, confirmation of the island biogeographic model has proven
elusive (Forman and Godron, 1986). Some studies have supported aspects and certain
predictions from it, while others demonstrate quite different patterns. Terrestrial urban
habitats obviously differ from oceanic islands. Remnant habitats in urban environments
in particular are immersed in anthropogenic influence, not to mention intense exposure
to disturbance and pressure from introduced species (Godefroid and Koedam, 2003).
Moreover, it can be difficult to decide whether observed patterns of species numbers
are the result of environmental heterogeneity or the area as it is (Pysek, 1993). For
green roofs in Berlin, this has been exemplified as proximity to green spaces, like parks
or other sources of propagules (Köhler, 2006).
Broadening out from individual populations, metapopulation theory envisions that “a
suite of populations … make up the distribution of species within a region” (Barbour et
al., 1999) (p. 82). A metapopulation is therefore a system of spatially isolated species
populations that are connected by dispersing individuals. Species will be patchily
distributed over various scales (e.g., large, variously aged forest stands, or ant mounds in
chalk grasslands), and populations are often semi-isolated as a result of habitat
heterogeneity. So, a population on an island is considered a metapopulation because it’s
a subset of a greater population. Regionally, when habitats have become so fragmented
that isolated populations cannot be expected to last for long, persistence can occur only
via metapopulation dynamics (Hanski, 1998). While metapopulation theory has been
applied for urban ecological designs, such as planting roofs with food sources plants for
specific butterfly species (Snep et al., 2009), such projects rarely include follow-up
monitoring so the outcome is unknown (Kephart, July 11, 2013, Williams et al., 2014).
Metapopulation theory differs from island biogeography in its assumption of networks
of small patches with no persistent mainland habitat, and by focusing on the dynamics
of only one species. Also contrary to island biogeography but in line with fragmentation,
metapopulation theory makes an even stronger prediction about the importance of
dispersal among habitat fragments: since there is no mainland, inadequate dispersal will
lead not only to local but to regional species extinctions (Harrison and Bruna, 1999,
Williams et al., 2006). Empirical studies have covered all types of biotic communities, but
full validation of the metacommunity model has been forestalled for a variety of
reasons. Simplified assumptions around dispersal (e.g. all species have the same
dispersal ability) and competition (obeying a lottery with infinite number of sites and
single-site occupancy) pose limitations to real-world models, and the absence of
parameters that can be measured in the field challenge the empirical validation of

178
mechanistic effects (Mouquet and Loreau, 2003). The patchiness of urban green areas
can make dispersal difficult and risky, certainly for taxa with poor dispersal ability, and
less mobile species, such as non-flying and ground-dwelling arthropods (Gilbert, 1989).
Connectivity is an important aspect of metapopulation theory, and that model predicts
that providing a small amount of additional habitat and corridors should prevent
extinction by increasing rates of dispersal (Harrison and Bruna, 1999). Theoretically,
corridors and greenways can link and connect habitats to facilitate physical movement
through fragmented landscapes as well as genetic transfer among populations, but they
may also increase the vulnerability of the animals and plants using them, whether by
increased predation and competitive invasion or if the quality of the corridor (e.g.,
roadside verges) threatens survival (Kendle and Forbes, 1997). The concept of source-
sink dynamics purports that the long-term survival of a species may be better
guaranteed by the combined effect of many populations, rather than a single one
(Pulliam, 1988). By definition, source-sink populations are special cases of
metapopulations because they include both persistent refuge populations and
ephemeral populations that are maintained through dispersal (Eriksson, 1996)(p. 248).
This concept has been observed on EGRs in their benefit to ground-nesting birds, like
Lapwing (Vanellus vanellus). On Swiss EGRs without provision of water and nourishment,
hatched chicks will perish of starvation (Baumann, 2006) which effectively renders those
roofs as population sinks for this priority species. Overall, consistent and sufficient
evidence has yet to substantiate the demographic significance of ‘sink’ habitats or the
efficacy of corridors in promoting regional persistence (Harrison and Bruna, 1999).
Several studies have found that green corridors made “little difference to the diversity
of plants and beetles found in towns and cities by virtue of their function as corridors"
(Angold et al., 2006)(p. 203). Given the pressures inherent to urban environments
(including predation, exposure, erratic resources, and general stochasticity) and the
complex needs of organisms, corridors are insufficient provisions in themselves.
Indisputably, greenways and corridors should never substitute the protection of large,
intact nature reserves in urban or suburban landscapes (Breuste et al., 2008).
5.1.2.4 Reconciliation ecology: opportunities for change
Over a century of ecological study has invested tremendous energy and effort into the
central goal of halting the rate of biodiversity decline and preventing the forthcoming
(or current) extinction cascade (Chapin et al., 2000, Sala et al., 2000, Diaz et al., 2006,
Zalasiewicz et al., 2010), but the unabated loss of biodiversity and increase of
fragmented habitats (Millennium Ecosystem Assessment, 2005) suggests that these

179
efforts have not been relevant enough to match humanity’s economic and population
metabolisms. Combined with the anticipated yet unknown effects of global warming
and climate change, it is apparent that many of the assumptions underlying the theories
designed for conservation planning are too simplistic to guide management accurately
or to adequately explain the relationships observed (Kendle and Forbes, 1997). More
pragmatically, one might argue that it is not the gaps in knowledge, but rather the
lacking integration of conservation mandates with land use planning and policy.
Recognition of the complexities associated with unproven theories and, in some cases,
stagnated hypotheses herald a new generation of ecological query. Based upon the
knowledge of the importance of species-area relationships to conservation,
reconciliation ecology was proposed as a more realistic and practical solution to
conserve biodiversity because it recognizes that the greater proportion of the Earth’s
surface is human-dominated (Rosenzweig, 2003). This reality suggests that conservation
of species must occur here rather than in the limited and, by comparison, miniscule
areas set aside for reserves and restoration. This science-based approach alleviates the
ambition to develop and prove theories and accepts that the natural world and human
dominance are integrated forces unified by manifold processes and conditions.
Through reconciliation ecology, habitats that have been altered for human use can be
designed, spatially arranged, and managed to maximize biodiversity while providing
economic benefits (Marzluff, 2005) and ecosystem services (McKinney, 2006). To date,
this is perhaps the best articulated approach which calls upon the involvement of
ecologists in helping to design and manage new cities and reconstruct older ones
(Grimm et al., 2008). Within the urban realm, green roofs can contribute to
reconciliation ecology, as can living walls, road and railway buffers, private gardens,
allotments, and public parks (Francis and Lorimer, 2011). However, unless these
technologies and systems are widely implemented for their stated ecological benefits,
their true potential will never be fully realized (Henry and Frascaria-Lacoste, 2012). The
latter suggest that reconciliation ecology using green roofs will only be possible though
“adaptive collaborative management” involving citizens, ecologists, industry, urban
designers and architects. From the perspective of habitat creation, Lundholm &
Richardson (2010) suggest that seeking habitat analogues that can support biodiversity
should be taken as an important guiding principle for reconciliation ecology in urban and
post-industrial lands. This is especially true for regions where green roof technology is
just beginning to be introduced.

180
5.1.3 Research aims and questions
The research questions addressed in this chapter are directed by one of the aims of the
research, which is to identify plausible ecological theories or models that describe the
processes that occur on EGRs over time. The habitat conditions, which the EGR
vegetation surveyed either endured or benefited from, will be described using indicators
(Ellenberg Indicator Values) derived from the species data. The EGR vegetation types
defined previously will therefore be classified further with reference to roof
environmental conditions.
Aim: To continue characterising mature EGR vegetation
Aim: To identify ecological theories or models to describe the processes occurring on EGRs
Question: Do emergent characteristics result with time?
5.1.3.1 Objectives of the chapter
This chapter opened with a description of urban environmental conditions and an
introduction to the ecological theories that pertain to green roofs in order to prepare
the conceptual treatment of EGRs as urban ecosystems. The objectives for this chapter
therefore include:
Characterising EGR growing conditions (and mature EGR vegetation)
Deciding whether emergent properties can describe mature EGR species composition
Conceptual development of ecological theories for EGRs
5.2 Methods
The results of the previous chapters suggested that the environmental variables of
slope, aspect and depth had significant effects on EGR vegetation, and that EGR
vegetation types could be clustered into distinct groups as determined by species
diversity and life form composition. This chapter will more closely examine the role of
environmental conditions on the vegetation surveyed and will attempt to further
characterise different green roof vegetation types with the aim of understanding their
formation over time. Data from the nine extensive green roofs surveyed over two
growing seasons in 2010 and 2011 will be analysed with the aim of characterising the
environmental conditions and elucidating any ecological theories that might explain the
EGR vegetation surveyed.

181
5.2.1 Data and Analysis
5.2.1.1 Ellenberg Indicator Values (EIVs)
The ecological conditions of a site can be quantified directly by field measurements or
estimated from the ecology of plant species. Since species’ requirements reflect the
ecological factors of a site, plant species have a long and continuing tradition of serving
as bio-indicators (e.g., for agriculture, forestry, nature conservation) (Persson, 1981,
Ewald, 2003, Otypkova, 2009). Based on extensive research dating to the 1950s,
Ellenberg and colleagues (1991) were the first to list the ecological 'indicator values' for
most European species (Persson, 1981). Since conducting measurements in the field is
time-consuming and technically demanding (i.e., through the time and financing
required), and because single measurements cannot express the values of variables that
fluctuate strongly, ecological indicator values are beneficial for making visible what is
not immediately perceptible (Diekmann, 2003, Kollmann and Fischer, 2003). Habitat
qualities indicated by plant species and distributions include microclimate of light and
temperature, soil moisture, pH, fertility, salinity and presence of heavy metals. This
universally applicable numerical indicator value system has been widely used as well as
refined, extended and adopted for other regions (Ewald, 2003, van der Maarel, 2005).
In order to characterise the environmental conditions of the nine EGRs surveyed, the
species list was amended with available EIVs (Appendix 2). The environmental factors
and habitat indicators defined by the EIVs are divided into three climatic factors (light,
temperature, continentality) and three soil factors (humidity, soil reaction and nitrogen
availability). Numerically, EIVs can express the average “realized niches” of species along
these gradients on a nine point ordinal scale (1=low; 9=high), while a record of zero (0)
implies an indifferent response to that factor and a blank record represents “uncertain
classification” (Ellenberg et al., 1991). Mean EIVs are used for each species recorded per
quadrat, with reference to its abundance. Any trees recorded were seedlings.
Quotations within the results and discussion, which describe habitat conditions or
geographic scope, are directly from Ellenberg et al. (1991). No statistical significance is
attached to these descriptive observations.
It is important to note the appropriate use of EIVs and their limitations (Zeleny and
Schaffers, 2012, Hill et al., 2000). Since EIVs are ordinal, they are generalised, typified
observational knowledge that were never intended to replace measurements, but
instead reveal decisive factors to be investigated further (Ellenberg et al., 1991).
Similarly, calculated results are nothing more (or less) than evidence of trends with

182
reference to “normal” behaviour of central European species. Interpretation should
therefore be given breadth and critical attention. Ellenberg et al. (1991) stress that EIVs
are meant to identify the ecological characteristics of the plant taxon, and never their
requirements, since ecological requirements can only be credibly established through
physiological inquiry of competition-free cultures. For example, some species may
tolerate hostile and extreme conditions as a result of competitive pressure (e.g., acidic,
or very dry habitats), but would perform better in less harsh conditions. Lastly, the
potential range (physiological behaviour) of all plant taxa is typically greater than their
range of existence (ecological behaviour) within the greater landscape (ibid, p. 12).
5.2.1.2 Cluster analyses
As in Chapter 3, a descriptive clustering approach was taken to group the roofs surveyed
according to their (dis)similarities using the average linkage method. To determine the
best fit for these data, roofs were grouped according to similarities in the range of EIVs,
but with additional consideration of species richness (i.e., total number of species
recorded per roof) and of cover dominance by non-dominant species. The variable of
non-dominant species was included because most roofs featured one or two
exceptionally dominant species. Discounting that cover and calculating the cover
achieved by the other species was intended to reveal the floristic diversity of the roof
vegetation above and beyond any monoculture effects by the single most dominant
species.
5.3 Results and Discussion
5.3.1 Characterising EGR environmental conditions: EIVs
Not all of the species surveyed had EIV values assigned to them: of all the recorded
species, 67 had EIVs, although these were not always complete. Only 61 species had
allocated nitrogen EIVs. The habitat indicators used for the analyses that follow (climatic
and soil factors) used the mean EIV of the species surveyed, as well as the range, for
each roof. Salinity and heavy metal tolerance were not included. The results and
discussion include examples from the associated species that indicate certain conditions
and their definition. While trees and mosses were part of the analysis, they are not
included in the discussions. The mean results for the six EIV conditions examined are
given in Table 5.1.

183
Table 5.1. EIVs for the nine EGRs surveyed, showing minimum, mean (bold) and maximum values.
Light Temperature Continentality Moisture Reaction Nitrogen
4 - 8.0 - 9 2 - 5.7 - 7 2 - 4.1 - 7 2 - 2.7 - 9 2 - 5.6 - 9 1 - 2.0 - 8
5.3.1.1 EIV climatic factors on EGRs
5.3.1.1.1 Light The light EIV describes species’ “occurrence in relation to the relative light intensity”,
with shade-loving plants at the lowest value (L1) and full-light species at L9. According to
the vegetation surveyed, it appears that EGRs can support a range of light conditions,
except for deep shade (L1-3). As Figure 5.6a shows, most roofs had a mean of L8, and
the majority of species occurred in L7 (27 species) and L8 (23 species) (Figure 5.6b). The
indicator L7 refers to “plants generally in well lit places but also occurring in partial
shade” and includes species like Agrostis tenuis, Allium schoenoprasum, Campanula
rotundifolia, Hieracium pilosella, Hypericum perforatum. Light-loving species (L8), like
Achillea millefolium, Agrostis stolonifera, Arrhenatherum elatius, Crepis tectorum and
Dianthus carthusianorum, are “rarely found where there is less than 40% relative light”.
The only half-shade herbaceous species surveyed, Geum urbanum (L4), occurred on one
roof in shaded and moist conditions (FH Nürtingen, drip zone). The other L4 results were
tree seedlings or mosses. The herbaceous “plants of full light, found only in full sun;
rarely in less than 50% relative light” (L9) included Petrorhagia saxifraga, Poa
compressa, Potentilla recta and Sedum album.
Figure 5.6. a) Range and mean for light EIV on nine roofs; b) Distribution of species for 9 categories of light EIV.
Other surveys of EGRs and/ or spontaneous tar-paper-gravel (TPG) roofs have described
similar results and defined green roofs as full light environments with EIVs of 7-8 in

184
Osnabrück (Bossler and Suszka, 1988) and mean values of 7.1 in Karlsruhe (Buttschardt,
2001) and 7.2 in Berlin (Poll, 2008). The latter showed a majority of L7 and L8 for system
roofs. Green roofs can therefore be defined as well-lit to high light environments.
5.3.1.1.2 Temperature Temperature is defined by species’ occurrence in the European temperature gradients
from the Mediterranean to the Arctic and from lowland to alpine elevations (Ellenberg
et al., 1991). The majority of species (22) were identified with T6 (Figure 5.7b), which
was also the mean for most roofs (Figure 5.7a). T6 refers to a range of habitats (T5-T7),
including “temperate warm indicators” (T5) and “warm indicators (in north-central
Europe only, in relatively warm low-lying areas)” (T7). The T6 species identified include
Convolvulus varia, Crepis tectorum, Erigeron annuus, Hypericum perforatum, Poa
pratensis angustifolium, Potentilla argentea, Sedum acre, S. spurium, S. telephium,
Setaria viridis, Solidago canadensis, Thymus praecox, T. serpyllum, Trifolium arvense, T.
campestre, T. dubium, and Vicia hirsuta. The warm indicators (T7) included species like
Petrorhagia saxifraga, P. prolifera, Potentilla recta, Veronica spicata, and Vulpia myuros.
The only cool indicators (below T5) were three species of moss [Eurhynchium
praelongum (T4), Polytrichum juniperum (T2), Racomitrium elongatum (T3)]. These
mosses only occurred on FH Nürtingen, in the drip zone, and clearly stretch the range to
appear cooler than is typical for EGRs. The lacking range on Köngen is due to the small
species number (9) on that roof to begin with, of which many either lacked EIVs for
temperature (Hypericum perfoliatum, Sedum floriferum, S. hybridum) or behaved
indifferently (T0) (Achillea millefolium, Festuca ovina, Poa pratensis, Verbascum
thapsus). Coronilla varia had the only EIV value on that roof: T6.
Figure 5.7. a) Range and mean for temperature EIV on nine roofs; b) Distribution of species for 9 categories of temperature EIV.

185
In their surveys of EGRs and TPG roofs, Buttschardt (2001) and Poll (2008) found similar
results, with the majority of species at T6, though Bossler and Suska (1998) reported a
mean of 5.3 in Osnabrück. Observations from northern France considered that species
with high affinities for temperature may be more prevalent on older green roofs
because they would have endured more hot periods than recently installed systems
(Madre et al., 2014). Temperature measurements of vegetation layers on EGRs in
Heidelberg (Germany) recorded over 60°C in summer and well below 0°C in winter
(Riedmüller, 1994). Temperature conditions on EGRs are also influenced by the
microclimate created by evapotranspiration, and this latter point is described by the
next habitat indicator, continentality, which links temperature with moisture.
5.3.1.1.3 Continentality Continentality refers to species’ occurrence in the gradient from the Atlantic coast to the
inner parts of Eurasia. In the urban context, continentality reflects the thermally
enhanced situations, like urban heat island (UHI), which will influence urban vegetation,
including plants growing on green roofs. In particular, the UHI reduces the number of
annual frost days which, in relation to the continentality EIV, is associated with proximity
to maritime, or oceanic, climates. On a scale of 1 to 10, C1 species would occur in
oceanic climates with very few freezing days while species occurring in C8 through to
C10 are found as far from the ocean as possible and, therefore, more prone to freezing
temperatures.
In fact, the majority of the species surveyed (39) behaved indifferently to continentality
(C0) and the most prevalent response (18 species) was C5, meaning “intermediate,
weakly sub-oceanic to weakly sub-continental” (e.g., Agrostis stolonifera, Cerastium
arvense, Coronilla varia, Fragaria vesca, Geum urbanum). After C5, the next most
common record for continentality was C3 (15 species), which reflects conditions that
occur in “most parts of Europe” and support species like Agrostis tenuis, Arrhenatherum
elatius, Festuca ovina, Lotus corniculatus, Petrorhagia prolifera, Sedum acre, Potentilla
argentea, P. erecta, all Trifolium spp., and Vulpia myuros. Next in abundance (11
species), and the mean value for most roofs (Figure 5.8a), C4 reflects “suboceanic”
species occurring “mainly in central Europe but spreading towards the East” (Dianthus
spp., Poa compressa, Sedum sexangulare, S. spurium, Thymus pulegoides).

186
Figure 5.8. a) Range and mean for continentality EIV on nine roofs; b) Distribution of species for 9 categories of continentality EIV.
Sub-continental species (C6) “occurring mainly in the east of central Europe and the
adjoining parts of Eastern Europe” included Linum perenne, Veronica spicata, and some
mosses. The three species in C7 (Allium schoenoprasum, Crepis tectorum, Pinus
sylvestris) prefer the range between C6 and C8, and their sub-continental to continental
ranges “spread into Central Europe from the east only into particular sites.” The lowest
continentality value (C2), held by Sedum album, Sedum Coral carpet, and Sempervivum
tectorum (as well as Carex flava, in the drip zone at FH Nürtingen), define “oceanic,
mainly in the west including western Central Europe”. The lesser-represented extremes
of the continentality spectrum indicate absence of continental to extremely continental
(C8, C9) and extreme oceanic (C1) species. The majority of species from the surveys in
Osnabrück, Karlsruhe and Berlin were C3 to C4 (Bossler and Suszka, 1988, Buttschardt,
2001, Poll, 2008). While the main areas of distribution for the species list is likely far
more heterogeneous, a continental Eurasian core is nevertheless clear.
5.3.1.1.4 Climatic influences: discussion Green roofs were defined as well lit to high light environments; other studies concur
with the results here of light EIVs predominant between 7 and 8 (Bossler and Suszka,
1988, Buttschardt, 2001, Poll, 2008). EGRs also classify as warm habitats supporting
species with continental preferences, but the lack of extreme EIVs for temperature and
continentality suggest that these factors are tolerated in moderation. While EGRs were
defined as warm environments, the absence of extreme warm indicators (T9) (i.e., from
the Mediterranean to the warmest places in the Upper-Rhine region) or of species with
very warm preferences (T8, or mostly sub-Mediterranean) may reflect the exposed
nature of these habitats and the effect this has on temperatures. Parallel indicator
habitats, like mountaintops, may feature warm temperatures but their exposure (to

187
wind, frost, etc.) inhibits truly warm-loving (i.e., Mediterranean) species from
establishing. In addition, a large proportion of the species surveyed were indifferent to
continentality (C0), which implies that this is just one of several factors influencing
species composition on EGRs.
The central European plant community that most closely resembles EGR vegetation is
the Sedo-Scleranthetea (Thommen, 1988, Buttschardt, 2001), which occurs in full light
on soils under 100 mm deep and comprises evergreen vegetation that flowers without
pause from May through September (Ellenberg, 1986). Taken together, a few of the
investigations of spontaneous vegetation on TPG and gravel roofs (Bornkamm, 1961,
Thommen, 1988, Buttschardt, 2001) revealed a climatic gradient influencing species
composition. With reference to Raunkiær plant life forms (i.e., based on the location of
the plant's bud during seasons with adverse conditions, such as cold or dry seasons) (van
der Maarel, 2005), Bornkamm (1961) observed that recently installed TPG roofs in
Göttingen were first colonized by weedy annuals (therophytes) but after about ten years
dominant cover had shifted to Poa compressa, a hemicryptophyte (i.e., perennating
buds are above or just below ground). Noting that the grass roofs of Sweden were also
dominated by hemicryptophytes, while gravel roofs in Heidelberg and Stuttgart (300 and
400 km south of Göttingen, respectively) are colonized mainly by therophytes,
Bornkamm wondered whether the stable communities he observed in Göttingen were
related to the sub-Atlantic, summer-cool climate. In other words, if the Göttingen roofs
are at the southern limit of hemicryptophyte-roofs, this might explain why the Typical
Poa meadow there can develop after 30 years in shade but only after 50-70 years in
unshaded areas.
The effect of rooftop climatic conditions on plant community development can be
inferred from a replicated experiment which strove to re-create species-rich dry
meadows on a roof in Heidelberg (Riedmüller, 1994). When grown in depths under ten
cm and exposed to full sun, this study found that only forty-eight of 108 species/
cultivars survived multiple growing seasons. Four plant families comprised those species,
all typified by their capacities to avoid drought, whether through leaf physiology and
metabolism (Crassulaceae, Saxifragaceae) or through bulbs which have water storage
organs and limit their photosynthetic above-ground biomass to the cooler spring season
(Iridaceae, Liliaceae). As an example, according to its EIVs Allium schoenoprasum is
indifferent to temperature and moisture (Ellenberg et al., 1991).

188
5.3.1.2 EIV soil factors on EGRs
5.3.1.2.1 Moisture The moisture EIV describes species’ occurrences and habitats along a gradient from dry
shallow soils and rocky slopes to wet marshy ground. Water on green roofs is often a
limiting factor, so one would expect this EIV to characterise species of dry habitats and
with tolerance for dry conditions. As expected, none of the species are typical of
environments with fluctuating water tables, prone to inundation, or aquatic (L10-L12),
nor do any qualify as indicators of strongly changeable moisture conditions (~). Many
species (40) have not been classified with moisture EIVs (M0), but the sixty-seven
allocated species create something like a normal distribution, with most species (18)
occupying M4 and nine species in M3 and M5 (each) (Figure 5.9b). M4 is defined by
species with a preference between M3-M5, indicating that the EGRs surveyed
encompass the range between “dry site indicators” and “moist site indicators”. The
“moist site indicators” (M5), which “mainly occur on soils of average dampness, but are
absent from both wet ground and places which may dry out” included Arrhenatherum
elatius, Fragaria vesca, Geum urbanum, Poa pratensis, Taraxacum officinale, Trifolium
dubium,Verbascum nigrum and Vicia sepium, several of which occurred once or a few
times only. Some M4 species include Achillea millefolium, Cerastium arvense, Crepis
tectorum, Hieracium pilosella, Hypericum perforatum, Lotus corniculatus, Medicago
lupulina, Sedum telephium and Setaria viridis.
Figure 5.9. a) Range and mean for moisture EIV on nine roofs; b) Distribution of species for 9 categories of moisture EIV.
The mean EIV for most roofs was M2, which encompasses preferences between M1 and
M3, or “indicators of extreme dryness” and “dry site indicators”. The “dry site
indicators” (M3) are “more often found on dry ground than moist places” and included
many species common to dry, species-rich grassland, such as Dianthus carthusianorum,

189
D. deltoides, Petrorhagia prolifera, Potentilla recta, Thymus praecox, Veronica spicata, as
well as Sedum spurium. Twelve species were “indicators of extreme dryness” and “dry
site indicators” (M2), including Petrorhagia saxifraga, Poa compressa, Potentilla
argentea, Sedum album, S. acre, S. sexangulare, Sempervivum tectorum, Thymus
serpyllum and Vulpia myuros. At the other extreme, the three “damp-site” or “moisture-
loving” indicators (M7, M8) were found in the drip zone of FH Nürtingen and included
two mosses and a sedge. The Sedum species designated with EIVs ranged between M2-
M3. Another prevalent species, Festuca ovina, did not have an EIV for moisture and was
classified instead with “indifferent behaviour”, meaning great amplitude or irregular
behaviour in various regions.
5.3.1.2.2 Reaction (soil pH) Reaction defines the gradient of soil pH in which species can be found. The EIV scale
covers the full range of extremes: R9 infers basic reaction and indicates lime-loving
species, while R1 infers extreme acidity. The results (Figure 5.10) suggest that most EGR
species prefer weakly acid to weakly basic (i.e., neutral) substrates, with most occurring
between R5 and R8. R5 indicates “fairly acid soils”, typified by species that are “only
occasionally found in more acid, or in neutral to slightly alkaline situations”, while R8
encompasses the range of preferences between R7-R9 and features species that are
“mostly seen on limestone or chalk”. R6 encompasses the range of preferences between
R5-R7.
Figure 5.10. a) Range and mean for reaction EIV on nine roofs; b) Distribution of species for 9 categories of reaction EIV.
Most of the species (eleven) fell under R7, which is defined by “indicators of weakly acid
to weakly basic conditions, including species that are never found on very acid soils”
(e.g., Allium schoenoprasum, Arrhenatherum elatius, Convolvulus arvensis, Dianthus

190
carthusianorum, Lotus corniculatus, Petrorhagia saxifraga, Sedum telephium, Verbascum
thapsus, Veronica spicata). The species under R8, like Linum perenne, Medicago
lupulina, Picris hieracioides, and Thymus praecox, indicate a range of preferences for
weakly acid to weakly basic soils but also include lime-loving species that can always be
found on calcareous soils. The two species described by the highest EIV (R9) were
Coronilla varia and Poa compressa but these were not very prevalent to the vegetation.
C. varia occurred in a single count on one roof and, other than good representation on
FH Nürtingen (11 quadrats) P. compressa only occurred in a few quadrats on three roofs.
The lowest values recorded (R3) were “acid indicators” found “mainly on acid soils
but…also…where there is a neutral reaction” (e.g., Dianthus deltoides, Festuca ovina,
Potentilla argentea). The R2 record (Trifolium arvense) indicates preferences between
R1 and R2 (i.e. between extreme acidity and acid indicators); the other R2 record was
the moss, Philonotis fontana. The German studies reported similar distributions of soil
reaction for TPG and EGR roofs, with the majority of cases between R6 and R7 (Bossler
and Suszka, 1998, Buttschardt, 2001, Poll, 2008).
5.3.1.2.3 Nitrogen The EGRs surveyed indicate nutrient-poor conditions with respect to available nitrogen,
of which the majority of species occurred between N1-N3 (Figure 5.11). N2
encompasses the range between N1-N3 and included many species that were typical of
the meadow-like green roofs, like Allium schoenoprasum, Campanula rotundifolia,
Dianthus carthusianorum, D deltoides, Hieracium pilosella, Linum perenne, Petrorhagia
prolifera, Poa compressa, Potentilla erecta, P. recta, and Veronica spicata. N1 species
indicate “sites poor in available nitrogen” (Festuca ovina, Petrorhagia saxifraga,
Potentilla argentea, Sedum acre, S. album, S. sexangulare, all Thymus spp., Trifolium
arvense, Vulpia myuros), while N3 species are “more often found in N-deficient soils
than on richer ones” and included a few nitrogen-fixers (Coronilla varia, Lotus
corniculatus, Trifolium campestre). Next most abundant, N7 species are “more often
found in places rich in available nitrogen than in poor or average situations” and the
species allocated as such were all non-intentional species (Arrhenatherum elatius, Geum
urbanum, Taraxacum officinale, Verbascum spp.). Similarly, the single N8 species
(Erigeron annuus) was non-intentional, and was only recorded in two locations of one
roof. N8 species can occur in N7 conditions but also in “extremely rich situations” (N9)
(e.g., “cattle resting places”).

191
Figure 5.11. a) Range and mean for nitrogen EIV on nine roofs; b) Distribution of species for 9 categories of nitrogen EIV.
Finally, there were a number of species in N4, N5 and N6, indicating a range in
preferences for nutrient-poor habitats and average N-availability. N4 species prefer the
range between N3-N5 and included species like Agrostis tenuis, Cerastium arvense, Picris
hieracioides, and Vicia hirsuta. N5 indicates “sites with average N-availability” and
included species like Achillea millefolium, Agrostis stolonifera, Trifolium dubium and
Vicia sepium. Lastly, N6 species prefer the range between N5-N7, meaning sites with
average to rich N-availability and included species like Crepis tectorum, Fragaria vesca,
Poa pratensis, and Solidago canadensis.
5.3.1.2.4 Soil-based influence: discussion The species identified exhibited a range of tolerance for soil moisture and pH, but most
of the plant cover was by those with preference for drier, nutrient-poor and acidic
conditions. In terms of available nitrogen, typical EGR vegetation can be defined by
species that perform well in conditions of very low nitrogen availability. Some German
studies report similar results for moisture and soil reaction for TPG and EGR roofs
(Bossler and Suszka, 1998, Buttschardt, 2001, Poll, 2008). Although one might have
expected the old, sand-gravel substrate of TPGs to have different water-holding capacity
compared to engineered EGR substrates, these studies did not detect any difference in
moisture between EGR and TPG roofs (ibid). While the preponderance of moist site
indicators (M4) may seem a bit surprising, when considering the range of conditions that
occur on EGRs over the course of a single year one will recall that green roofs in
continental climates typically experience excess water and drought interchangeably and
by season. Accordingly, species that can tolerate both conditions will have a chance at
long-term survival.

192
The nitrogen EIV implies species’ occurrence in a gradient of fertility during the growing
period. Other than the highest value (N9), the species/ roofs surveyed covered the full
range of conditions. Buttschardt (2001) and Poll (2008) made identical observations on
their surveys of EGRs in Karlsruhe and Berlin, while Bossler and Suszka (1998) reported
nitrogen-poor conditions (mean: 2.9) for TPG roofs in Osnabrück. The distribution of
species across all nutrient classes suggests that nitrogen (and perhaps other soil
nutrients) is not a decisive factor to EGR species composition. Instead, since the species
composition includes the range of nitrogen tolerances (N-poor to N-rich), species
competition or functional traits could be a more informative point of consideration (e.g.,
nitrogen-fixers, stress-tolerators).
The habitat conditions ascertained here may be broadly representative of rooftop
growing conditions, as other studies found no difference in EIVs between EGRs and TPG
roofs (Bossler and Suszka, 1988, Buttschardt, 2001, Poll, 2008). Vegetation surveys in
Berlin (Köhler, 2006) and in Basel (Thommen, 1988) concluded that the most important
factors affecting plant diversity were climate-related, specifically temperature and
rainfall distribution. Species richness on the Berlin roofs was significantly influenced by
water availability, but comparatively unaffected by slope, roof age, or roof area (Köhler,
2006). Later surveys of the same roof in Berlin observed that increasing exposure to
sunlight led to less plant cover, and that different aspects supported different species
compositions (Köhler and Poll, 2010). While several experimental studies have tested
the effects of plant life forms on green roof performance (e.g., water capture, heat flux),
the reverse (i.e., the effect of these conditions on plant performance) has not been
widely examined.
5.3.2 Characterising EGR vegetation types using cluster analysis with EIVs
Depending on the environment, the world that ecologists try to understand is most
often a continuum and quite unlike the approach of other biological sciences; few
ecological theories predict the existence of discontinuities in nature. Still, methods that
distinguish similarities and differences are essential to numerical ecology (Legendre and
Legendre, 2003). To determine which of the six EIVs, or ecological indicators, carried the
most weight for EGR vegetation, cluster analysis was used to group roofs according to
their similarities. The result of clustering ecological objects sampled from a continuum is
often called a typology (i.e., a system of types), which may help to identify various object
types that can be used to describe the structure of the continuum (Legendre and
Legendre, 2003). By analysing environmental conditions (as EIVs) together with species
number and with consideration for cover dominance by non-dominant species, this

193
chapter refines the clustering from Chapter 3 to illuminate some of the key
environmental factors that drive vegetation composition and species diversity on old
EGRs (Table 5.2).
Table 5.2. Various proportions of cover by dominant species for nine EGRs
Proportions of cover by dominant species for nine EGRs
Roof name (in order of age)
Maximum abundance
Percent dominance
Average (by dominant spp)
Negative dominance
Negative average dominance
Killesberg 676.00 17.04 37.56 82.96 62.44
Rathaus-lower
879.00 18.98 62.79 81.02 37.21
Rathaus-PV 1191.00 24.25 79.40 75.75 20.60
FH Nürtingen
771.00 18.73 64.25 81.27 35.75
Köngen 1000.00 38.90 55.56 61.10 44.44
Tübingen 1286.00 30.58 80.38 69.42 19.63
VB A1 994.00 33.29 71.00 66.71 29.00
VB A2 1050.00 35.87 75.00 64.13 25.00
Pliensau 843.00 35.83 56.20 64.17 43.80
The dendrogram resulting from the analysis balancing EIV range, species number, and
cover dominance by non-dominant species grouped the EGRs into three main clusters,
termed “Sedum meadows”, “Species-poor Sedum roofs” and “Pitched Sedum meadow”
(Figure 5.12). The broadest distinction, at linkage distance 25, is identical to the cluster
analysis of Chapter 3, but in this analysis the roofs group into three groups (instead of
the two major groups, recall “Species-rich” and “Species-poor”). The main difference
from that analysis is that Killesberg does not associate with any roofs whatsoever but
clusters alone (in Chapter 3 it clustered with both Rathaus roofs at linkage of 2, and with
FH Nürtingen at linkage 4). Those results were purely on the basis of proportionate
cover abundance, however. Since Killesberg exemplifies unique conditions (i.e., extreme
slope, definite aspects), and since this chapter is interested in the environmental
conditions that shape EGR vegetation over time, the separation of this roof into a single
object cluster seems representative of the green roofs surveyed and their varying
conditions.

194
Figure 5.12. A cluster analysis for nine old EGRs reveals three major groupings with reference to environmental growing conditions (EIV range), species number, and dominance by non-dominant species.
Beyond the single object of Killesberg, the other roofs fall under a main distinction
(linkage distance: fifteen) and separate into four groups, all clustered in close
membership. Similar to Chapter 3, the group named “Species-poor Sedum roofs“ is
separated from the other roofs at the main point of distinction, and an aggregation of
six roofs is divided into three clusters under the heading “Sedum meadows”. These roof
clusters will be described in the following section.
5.3.2.1 “Pitched Sedum meadow” (Killesberg)
Killesberg stands isolated as a single object cluster (linkage distance: 25), which implies
that the vegetation on this steeply pitched roof is unlike all the other roofs with regards
to EIV range, species number and cover abundance by non-dominant species. The 30°
slope at Killesberg was unmatched by any of the roofs sampled. Indeed, the slope and
north-south aspects create a tremendous range of growing conditions. The south face
was visibly xeric, as the substrate was cracked in horizontal rills that only supported
Sedum species, drought-tolerant mosses and small annual grasses. In stark contrast, the
north face supported meadow-like vegetation with similar floristic composition to the
Rathausgarage roofs, namely tall flowering herbaceous species above a consistent
Sedum ground cover (attributed to the original species list). The inclusion of EIV range

195
and species composition in this analysis classified the vegetation as “Pitched Sedum
meadow”. The description nearly matches with the Sedum-Grass-Herbaceous
vegetation form described by Krupka (1992), with the exception that xeric mosses were
prevalent and that the substrate was shallower than his prescriptive 100-150 mm depth.
5.3.2.2 “Species-poor Sedum roofs” (Köngen and Pliensaufriedhof)
Köngen and Pliensaufriedhof clustered together in the cluster analysis of Chapter 3, too,
but were separated from the other roofs at the broadest distinction (linkage distance:
25) versus a distance of fifteen here. In that chapter, these roofs related to each other in
proportionate growth form cover at a linkage distance of four, whereas here the
inclusion of EIV range, species number and cover abundance by non-dominant species
tightens their membership to two. Since these roofs are Sedum-dominated with the
fewest species, the title “Species-poor Sedum roof” is descriptive as an EGR vegetation
type. With reference to Krupka (1992), this vegetation might be an example of the
transitory Sedum-Moss-Herbaceous form.
5.3.2.3 “Sedum meadows” (six roofs in three clusters)
The roofs aggregated into three clusters are distinguished from the “Species-poor
Sedum roofs” by their linkage distance (fifteen) and by their vegetation, which can be
described as “Sedum meadows”. Excluding the isolation of Killesberg, the roofs
clustered under this main distinction match the results from the cluster analysis of the
previous chapter but the affiliations between roofs have shifted somewhat. Since these
roofs all had similar numbers of species and species compositions, the distinctions
between the three clusters here must be attributed mainly to the varying environmental
conditions per site. The relationships, both within and between the designated clusters,
agree with field observations. The top cluster in the dendrogram (a: FH Nürtingen and
Rathaus-lower) is distinguished from the other clusters (b: Verkehrsbetrieb Areas 1 and
2; c: Rathaus-PV and Tübingen) at a linkage distance of 9. The latter two clusters related
to each other at a linkage distance of three. The roofs within each of the three clusters
related very closely at linkage distances of one. While these clusters all qualify as
“Sedum meadows”, their distinctions are described as follows.
5.3.2.3.1 a) “Floristically-diverse Sedum meadow” The analysis in Chapter 3 (with reference to proportionate cover) clustered these two
roofs along with three other roofs (at varying distances of membership) and was
descriptively named “Floristically-diverse Sedum meadow”. Of all the EGRs surveyed, FH
Nürtingen and Rathausgarage-lower roof had the greatest number of species identified

196
(32 and 30, respectively), and also bore some subtle environmental gradients from
neighbouring buildings (shade, moisture). This is most certainly the cause for their
clustering in this analysis since their species lists support much greater EIV ranges than
the other roofs. These roofs also had similar values of cover by dominant species (recall
Table 5.2) that were quite different from the values of other roofs. If the high species
diversity on these roofs can be attributed to the EIV ranges (i.e., the environmental
conditions sustained by the vegetation), then this vegetation type can retain the name
given previously: Floristically-diverse Sedum meadow.
5.3.2.3.2 b) “Sparse Sedum meadow with Chives” The analysis in Chapter 3 grouped VB Area 2 alone as “Sedum with Chives”, while VB
Area 1 was clustered with Tübingen. Compared to VB A2, Allium schoenoprasum was not
nearly as prevalent on VB A1, but Tübingen didn’t support a single bulb, so the
aggregation of those roofs in this analysis reflects the fact that they supported the same
number of species (21) and, being identical neighbours, have similar environmental
conditions and EIVs. These roofs also had the shallowest mean substrate depth, and
little variation in those measurements. The sampling quadrats were restricted to
uniform vegetation, but the variations in depth at other parts of the roof (e.g., scoured
areas) obviously impacted species abundance and dominance on these roofs overall;
this could have affected the areas surveyed, too. Considering their similar species
composition and EIV ranges, the close membership between these roofs can be
attributed to removing the weight of dominance by Allium. Recalling that the vegetation
types for these roofs were formerly described as “Sedum with Chives” and “Sparse
Sedum meadow”, the results from this analysis can summarise the vegetation of the
Verkehrsbetrieb roofs as “Sparse Sedum meadow with Chives”.
5.3.2.3.3 c) “Sparse Sedum meadow” The Chapter 3 cluster analysis grouped Tübingen together with VB Area 1 (named
“Sparse Sedum meadow”) while Rathaus-PV was clustered with the other Stuttgart roofs
and FH Nürtingen (and named “Floristically-diverse Sedum meadow”). Here, Tübingen
and Rathaus-PV are grouped together, most likely because both roofs lacked shade and
were therefore more exposed (certainly by comparison with FH Nürtingen and Rathaus-
lower), which led to a sparser meadow flora above a dominant Sedum cover. In addition
to EIV range and species number, inclusion of the weighting factor of cover abundance
by dominant species sets these roofs apart from the others. These roofs shared the
highest values of maximum abundance (1286 and 1191, respectively), and of mean
cover by dominant species (80.38, 79.40) compared to the other EGRs surveyed, which
can be explained by the structural layering of the different life forms and species

197
identified, of which dominant species maintained most of the cover. In other words, the
combination of taller statured with creeping, ground cover species are responsible for
the high values of maximum abundance, but the dominant species (in this case, Sedums)
had over-riding dominance to the vegetation on these EGRs. Accordingly, these roofs
can be described as “Sparse Sedum meadow.”
5.3.2.4 EGR vegetation types: discussion
The results from this cluster analysis represent the vegetation on these roofs well. All
the roofs surveyed are Sedum-dominated, so the roof clusters represent subtle
differences in vegetation responses to the range of conditions that may occur. The
extreme gradients on Killesberg result in its dissimilarity from the other roofs, and the
clustered roofs bear resemblance to each other in floristic character and with regards to
environmental conditions. Considering the range of growing conditions (implied by the
EIVs), EGR vegetation dynamics like persistence, colonisation, competition and diversity
may be explained by species’ tolerance and opportunism to these conditions. Rather
than grassy monoculture that may emerge in unmaintained grasslands, community
simplification on EGRs may be described as dominant cover by few succulent species. It
is important to recall that these differences are drawn from a small sample size, which
limits the strength of conclusions. Nevertheless, the consistency of EIVs for EGRs
surveyed in different cities, not to mention their similarity with TPGs (Bossler and
Suszka, 1988, Buttschardt, 2001, Poll, 2008) and the consistent vegetation types
described by these old roofs suggest that these results may qualify for other EGRs. Still,
if more roofs in this region were to be sampled and analysed as such, it is likely that a
number of new vegetation types would be defined.
5.4 Conclusions
5.4.1 Characterising EGR environmental conditions
These results indicate that the species that will persist on EGRs over the long-term must
be able to tolerate a range of conditions, though opportunities sometimes exist for
species that are less tolerant to extremes. With reference to EIVs, the species occurring
on 20-30 year old EGRs are tolerant of warm temperatures, but also exposure to harsh
conditions (irradiation, wind, frost, etc.). For European EGRs, this explains why most of
the species identified had continental to Eurasian distributions, rather than originating
from mild and humid oceanic climates. Indeed, moisture preferences ranged from
extreme dry to moist sites of average dampness, but the dominant species prefer dry
over moist sites. Preferences for soil reaction were neutral, but ranged from fairly acid

198
to weakly basic conditions. Nitrogen preferences covered the full spectrum from
nutrient poor to nutrient rich, but typical EGR species prefer nitrogen-poor conditions.
Knowledge of these growing conditions permits inference into the forces and
mechanisms directing species assemblage over time for EGRs, at least for southwest
Germany. The two broad EGR vegetation types (“Species-poor Sedum roof” and
“Sedum-meadow roof”) may represent assemblages that emerge as a result of roof-level
environmental conditions, in combination with other factors like substrate depth,
propagule availability, etc. Recalling the gaps in understanding of how EGR and other
urban vegetation as influenced by urban environmental conditions, it is possible that
these conditions (e.g., biogeochemical deposition, UHI, air quality) have influenced
these results. More samples are obviously required if these vegetation types are to be
empirically confirmed as recurring community types.
A series of experiments in Halifax (Canada) found that plant selection, survival and
growth can improve ecosystem function (Lundholm et al., 2010), but that environmental
conditions have an over-arching influence on this performance (MacIvor and Lundholm,
2011). With regards to roof surface cooling, different life forms reduced surface
temperatures quite variably, but the treatments containing tall forbs performed the best
for temperature and albedo (Lundholm et al., 2010). Considering the extended influence
of vegetation types on substrate temperature, this would imply that taller plants with
broad basal leaves or horizontal, large foliage are more effective than Sedum ground
cover (Del Barrio, 1998, Lundholm et al., 2010, MacIvor and Lundholm, 2011, Blanusa et
al., 2013). These observations convey the role of feedbacks by the microclimate created
by different vegetation types, in which substrate properties (including the variables
described here as well as depth) and the according vegetation affect each other and
ensuing processes (e.g., decomposition, mineralisation, natural succession).
Closer examination of the EGR substrates sampled will build upon these results (Chapter
6), with consideration of the role that substrate composition on the EGR vegetation
surveyed (e.g., factors of fertility, pH, or soil organic content). In addition to
environmental conditions described as EIVs, other forms of pressure will be considered
for their influence on species composition of mature EGRs (Chapter 7).
5.4.2 EGR species composition over time: emergent properties?
One of the original research questions asked whether emergent community
characteristics develop over time, such that roofs with similar constructions (substrate,
depth, species list) and properties (age, location, growing conditions, etc.) eventually

199
assume the same species composition over time. Chapter 3 concluded that green roof
vegetation is not static, and suggested that the roofs surveyed converged over time into
two broad distinctions. While this chapter integrated more detail into the cluster
analyses, the broadest distinction remained (“Species-poor” and “Species-rich”) but with
the addition at the same linkage distance of a third “Pitched Sedum meadow”, and a few
roofs shifted their cluster memberships.
Given the urban context, the question of emergence on EGRs may benefit from
appropriate framing. For this purpose, EGRs can be considered novel ecosystems
(Lundholm et al., 2010, Madre et al., 2014, Van Mechelen et al., 2015b, Lundholm,
2015), which support anthropogenic plant communities whose classification is most
realistically achieved through deductive methods (c.f. Kopecky and Hejny, 1978). Indeed,
every known phytosociological study that attempted to classify green roof vegetation
identified unique flora for every roof surveyed, regardless of similarities in age, system
build-up, location, environmental conditions, or otherwise (Thommen, 1988, Darius and
Drepper, 1983b, Buttschardt, 2001, Köhler, 2006, Köhler and Poll, 2010). The consistent
vegetation type identified by those works was the Class Sedo-Scleranthetea; more
detailed classifications (i.e., Order, Alliance, Association) led to the equivalent of roofs
clustering as solitary, individual groups.
The consideration of earlier works through this frame reveals that some proposals are
too simplistic (Krupka, 1992, FLL, 2008a, Madre et al., 2014), whereas the results of
others have been too specific (the phytosociology references above, but see Van
Mechelen et al., 2015). On the conjoined basis of the literature and these results, we
therefore hypothesise that green roofs with identical starting points (construction,
properties) will probably converge at general points of similarity; however, the
emergence of identical and recurring species compositions is highly unlikely. It might be
argued that the notion of emergence is interesting as a theoretical construct, but
without methods for empirical validation or for generating and testing hypotheses it is
practically useless. By contrast, calls have been issued for the detailed examination of
novel ecosystems, and in particular the development of methods for recognising,
quantifying and managing them (Hobbs et al., 2009) such that we can “deal effectively
with the new ecological world order” (ibid, p. 604). Such efforts can apply to green roofs
as novel ecosystems; this gap in contemporary ecological understanding seems an
obvious bridge where ecological research on green roofs could directly support urban
ecology. The consideration of green roofs as novel ecosystems is still very new, so

200
concepts other than emergence may be more suitable for explaining and predicting
vegetation change over time.
5.4.3 Relevant ecological theories and models for EGRs
Conceptually, elements from certain ecological models resonate with the interests of
this work, particularly natural succession and disturbance theory, but also
fragmentation, island biogeography and metapopulation theories. The latter three may
be applicable at the meta-scale, but this work is oriented to site-level processes and
focused on vegetation change, so the theory of natural succession is the most relevant
theory for this research. Even so, with validation of all these theories and models
consistently forestalled, their application to this applied research may be more pedantic
and academically interesting than genuinely useful. Certainly, its limitations of sample
size, variables measured and time scale (i.e., static, “snapshot” surveys) prevent this
work from directly engaging with theoretical development for urban ecological
understanding. However, as it ultimately leads to Chapter 7, which will propose some
models on vegetation development for EGRs, the questions raised and the gaps in
knowledge and empirical evidence identified all contribute to that framework, thereby
engaging theoretical discourse with pragmatic outcomes. To that end, the relevant
aspects of succession and disturbance theory shall be outlined.
5.4.3.1 Natural succession and disturbance theory
Sedum-dominated EGRs are the industry standard, and if the EGR vegetation types
surveyed are considered stable, then the concept of the edaphic plagioclimax (sensu
Tansley, 1965) may help to describe the processes that create and maintain these
vegetation types. In these terms, species assemblages that establish and persist (as
stable, sub-climaxes) are the product of edaphic (but also drought-) stress issued by the
shallow EGR substrate. In this context, the harsh conditions confronting plants at various
life cycle points are sufficient to re-set the successional clock, such that the plant
communities that result are determined by whatever is able to persist and by whatever
is able to colonise rooftop habitats. Initial floristic composition can be useful to
illuminate the importance of originally planted/ sown species to long-term EGR
vegetation.
The European analogue identified for EGR vegetation, the Sedo-Scleranthetea, is highly
dependent on annual precipitation and though species diversity will vary according to
prevalent climatic conditions, overall the community remains intact and stable
(Ellenberg, 1986). Through the lens of plant ecology, EGRs may be seen as unproductive,

201
relatively undisturbed communities of which the most conspicuous feature is “the
absence or low abundance of species capable of attaining biomass peaks in the summer
and the presence of a variety of S-strategists, many of which [have] long-lived leaves
forming ever-green canopies showing little change in structure throughout the year”
(Grime and Pierce, 2012) (p. 111). This statement describes EGR vegetation very well,
but actually refers to a limestone outcrop on ancient sheep pasture in which the short
turf is composed exclusively of stress-tolerators (including cryptogams, herbaceous
perennials and grasses). Models of vegetation dynamics for EGRs will be considered
further in Chapter 7.
Countless studies have observed that drought stress (and/ or lacking moisture) is a
major factor directing EGR species composition over time, but little research has directly
quantified this or its impacts on biotic life on green roofs. If more sample sites were
attainable, then there is every reason for green roofs to add to the development of
disturbance or CSR theory and to urban ecological understanding (Felson and Pickett,
2005). Even for ground-level habitats, the basic concepts of stress and disturbance
require clarification and new ways of translating different spatial scales and
organisational levels must be developed (Rykiel, 1985). Indeed, until the hypothesis is
translated into operational terms, and the interactions of stress and disturbance with
other system-organizing disequilibrating factors examined, little progress can be made
(Pickett et al., 1994). EGRs could be positioned to examine some fundamental questions
since they are relatively discrete, protected ecosystems.
If stress and disturbance-related hypotheses are to be tested on EGRs, rigour must be
employed. Major errors to ecological understanding occur when field measurements
taken during stress- or disturbance-free years are incorrectly used for extrapolation in
order to predict future system states (Pickett et al., 1994). When misleading
extrapolations are made from insufficient information, the variance generated is also
misunderstood. Considering that most ecological green roof research has been
conducted as ‘snapshots’ this is clearly an important methodological aspect requiring
amendment, namely the insistence of frequent and regular monitoring.
5.4.3.2 Reconciliation ecology
If urban ecological research has arrived to a point where ecologists must reach for the
‘higher-hanging fruit’ (McDonnell and Hahs, 2013), then green roof research must also
begin asking more refined questions that are robust and ecologically relevant such that
the resulting scientific outputs can provide explicit advice to practitioners. If EGRs are to

202
match the contemporary issues of urbanisation, ecosystem services and biodiversity
decline, then it is time for a renewal of their original intentions. This sentiment is
expressed by the critique by Henry and Frascaria-Lacoste (2012) who challenge that
EGRs are irrelevant means of reconciliation ecology if their installation is limited to
products of the commercial green roof market.

203
6 EGR substrate development after > twenty years
6.1 Literature review
Soil serves as the central interface between the atmosphere and biotic life, being crucial to
plant growth and the development of food webs, biotic communities and ecosystems. The
belowground ecological processes of litter and stock reduction are related with mobilisation
of nutrients and soil biota, all of which relate back to soil conditions like pH, organic content
and soil moisture holding capacity. Despite the fundamental importance of soil to
vegetation (and, by extension, to life on Earth), the soil environment and the plant
rhizosphere are among the least understood habitats and communities on Earth (Bardgett,
2005). Indeed, soils may actually contain the majority of the Earth’s species but most have
yet to be identified by science (Wardle, 2002). This is largely owing to the scales of
complexity around sampling natural soils without issuing human impact (Bardgett, 2005).
Before introducing the essential properties, composition and behaviour of good EGR
substrates, this chapter opens with a background on the commonalities of all soils, whether
natural field soils, horticultural potting media or green roof substrates. This introduction will
lead to the discussion and the aim of understanding for describing soil-based ecological
processes on EGRs. For ease of discussion, the term ‘soil’ will be used in this introductory
section to generalise all types of soil.
6.1.1 Soil basics
Depending on their origins and locations, soils can vary tremendously in their proportions,
qualities and properties but there are some fundamental basics for classifying and defining
them. Soils can be subdivided into five major components: i) mineral particles (the inorganic
fraction); ii) organic matter (the remains of living organisms); iii) water (the ‘soil solution’ in
which nutrients for plants are dissolved); iv) air (which fills the space between solid particles
not filled with water); and v) living organisms (small animals and microbes, mycorrhizal
fungi, plant propagules), all of which can be classified into three characteristics: physical,
chemical and biological (Handreck and Black, 2010). Physical properties are those we can
see and feel and include colour, structure, texture and behaviour towards water and air
(Handreck and Black, 2010). At its most basic, the physical structure of mineral soil (i.e.,

204
sand grains and silt particles) is known as the soil skeleton (Ricklefs, 2001). As opposed with
a purely organic soil (like peat), a skeletal soil is a weakly developed soil with minimal to no
profile development (WRB, 2014), and is also defined as regosol by the FAO (WRB, 2014) or
entisol by the USDA (1999). The chemical characteristics of soil are involved in soil-based
chemical reactions and the supply of plant nutrients, and include pH, buffering capacity,
cation exchange capacity (CEC) and nutrient charge. Lastly, the biological properties of soils
are related to the activities of living organisms (Handreck and Black, 2010). In order to
support biological processes, soils must provide root anchorage and serve as a reservoir for
plant available nutrients and water while also maintaining sufficient air voids for root
respiration (Nelson, 2011).
6.1.1.1 Soil structure
By definition, soil structure is “the arrangement, or organization, of the particles in the soil
(i.e., the internal configuration of the soil matrix)” (Hillel, 1998: p. 101). Soil structure is
strongly influenced by changes in climate and biological activity, and is vulnerable to
destructive forces, both mechanical and physico-chemical. Altogether, soil particles form a
mass of irregularly shaped and sized particles and is generally inconstant over time and non-
uniform in space. In a sense, then, soil structure is impossible to measure quantitatively; the
methods developed for characterising it don’t measure structure itself, but rather the
attributes that determine the structure (Hillel, 1998).
Soil can also be described as a system of phases, namely the solid phase (soil matrix), the
liquid phase (soil solution), and the gaseous phase (soil atmosphere) (Hillel, 1998).
Hypothetically, a soil that provides optimal growing conditions for plants comprises 50%
solid matter (mineral and organic) and 50% pore space (water and air) by volume (ibid). In
these proportions, more than half of the solid phase is occupied by mineral matter (meaning
less organic matter), while the pore space is equally shared by water and air (since an
increase in one is associated with a decrease in the other) (Hillel, 1998). Good soil structure
is therefore based upon a balance of components, generally with moderate organic matter
content (perhaps 3% or more), some clay, and calcium as the main exchangeable cation
(Handreck and Black, 2010) (Figure 6.1).

205
Figure 6.1. The proportions of solids, air and water in soils of various growing conditions: a) Good
topsoil (approximate proportions of solids and pore space); b) Waterlogged; c) Completely dried; d) Minimum air-filled porosity for good growth of many plants; e) “Ideal” proportions of air and water for excellent growth; f) Severe compaction. Modified from Handreck and Black (2010) (p. 59).
A number of parameters have been defined for characterizing soils physically, elaborating
upon volume-mass relationships amongst the soil phases and constituent parts. Since a
comprehensive background in soil physics is beyond the scope of this thesis, only a selection
of volume-mass relationships relevant to EGRs will be introduced. The sections that follow
therefore describe the main constituents which determine soil structure, and how soil
physical function is influenced by different situations and proportions of these.
6.1.1.1.1 Soil crumbs
The solid component of soil structure is defined by the bound aggregates of mineral and
organic matter (Hillel, 1998). Soil crumbs, which come in all sizes and shapes, determine
what kind of plants a soil can support, and how well. Natural soil crumbs, or soil aggregates,
are also termed peds: when moist, a highly pedal soil contains many natural crumbs,
whereas an apedal soil doesn’t demonstrate peds. Crumb formation can be enhanced by
increasing organic matter, iron and aluminum, clay and exchangeable cations, and is
compromised by increasing the levels of exchangeable sodium and (to a lesser extent)
magnesium (Handreck and Black, 2010). Organic matter helps to form crumbs mainly

206
because the organisms it supports – slugs, worms, fungi, etc. – produce sticky slimes, casts
and hyphae which bind mineral particles together. In addition to organic matter and
microbes, soil crumbs are made stable by clay particles, which can form ‘skins’ around
crumbs, and by positively charged cations, including especially calcium but also iron,
aluminum and hydrogen. If levels of exchangeable magnesium exceed those of calcium, soil
structure becomes ‘tough’ and difficult to cultivate, and high levels of sodium will render
crumbs unstable when wet (Handreck and Black, 2010). As mentioned, soils low in organic
content and which lack the organisms described above may be described as skeletal
because their mineral particles do not bind together (Coleman and Crossley, 1996).
6.1.1.1.2 Pore space
Good soil structure requires spaces between crumbs, namely the pores that exist both
between and within the crumbs and particles. Like crumbs, pores come in all shapes and
sizes, from animal burrows to fissures created by plant roots. Total pore space is the
percentage of soil volume that is not filled with solids. Compaction reduces total pores and
it can vary “from as little as 30% in a heavily trafficked field and turf soil to about 95% in
some peats” (Handreck and Black, 2010: p. 57). Ultimately, the shape and size of soil pores
are the most important aspect of pore space on soil structure and on how well the soil can
support plants. The size of a soil’s pore space will influence the way in which the soil
manages its air-water balance and how amenable the soil is to plant root exploration
(Handreck and Black, 2010). The amount of water that a soil can hold implies its ability to
support plants (Handreck and Black, 2010), and pore sizes influence water flow in mineral
growing media, which may occur as film creep along the walls of wide pores, or as tube flow
through narrow pores (Hillel, 1998). Large pores lead excess water away, while tighter,
smaller pores hold water for plant use (USDA, 1999). As media become progressively drier,
increasing matric suction causes hydraulic conductivity to drop; the physical affinity
between water and the medium matrix is strengthened by negative pressure potential
(Hillel, 1998).
Saturation, the wettest possible condition of a soil, occurs when all pores are filled with
water. This rarely occurs in nature, however because air bubbles may remain encapsulated
within the soil matrix, even when flooded, and a rise in temperature may cause these to

207
effervesce within the soil (Hillel, 1998). Otherwise, pore size will determine different
hydraulic behaviour by soils. Micropores are narrow, often discontinuous pores typically less
than a micrometer wide which are tightly held within clayey soils. Water held in micropores
“do not participate in ordinary liquid flow phenomena” (Hillel, 1998) (p. 119) and may
deviate from hydrologic laws (e.g., capillarity, Darcian flow). Such water may be referred to
as ‘adsorbed’, ‘bound’ or ‘residual’. Adsorption occurs when water creates a film over
particle surfaces with strong matric suction, or negative metric potential (Figure 6.2). The
phenomenon of capillarity is illustrated by the meniscus that forms when a capillary tube is
dipped in a body of free water (i.e., water at atmospheric pressure), and by the height of the
water column that rises up inside the tube. The narrower the tube, the higher the water
column. The water inside the tube is driven up by the pressure difference between the
water outside and inside the tube, and will stabilize once this pressure is countered by
gravity (Hillel, 1998; Handreck and Black, 2010). Capillary pressure potential (or matric
potential) is an important mechanism for soil-water affinity (Hillel, 1998).
Figure 6.2. Water in unsaturated soil is subject to capillarity and adsorption, which combine to
produce a “negative” matric potential, or a matric suction. Source: Hillel (1998) (p. 149).
Next in size, capillary pores range from several micrometers to a few millimeters. The water
within these pores is retained by surface tension and moves as a result of capillary forces
(Bunt, 1988). In coarse-textured soils, water may be confined almost entirely to the capillary
wedges at the contact points between particles (Figure 6.3). This adhesion forms separate
and discontinuous pockets of water, and does not promote vertical capillary rise (Hillel,
1998). EGR substrates contain relatively few fine particles, especially compared to field soils,
which results in different conditions influencing capillary rise (and perched water tables)
(Beattie and Berghage, 2004). Lastly, macropores can be visible to the naked eye and may

208
occur as cracks or fissures in dried clayey soils or as a result of biological activity (e.g.,
burrows, root decay), and are therefore planar or tubular in shape. When empty of water,
macropores form barriers to capillary flow and permit only very slow film-creep along their
walls. When filled with water, however, they permit very rapid flow (Hillel, 1998).
Figure 6.3. Water in an unsaturated course-textured soil. Source: Hillel (1998) (p. 205).
6.1.1.1.3 Bulk density
The volumetric distribution of solids, water, and air within a soil must ensure that critical
pore spaces are available for root respiration and water storage. The density of solids in
relation to pore spaces is a central element defining the volume and mass relationships of
soil constituents, and includes density of solids (mean particle density), dry bulk density,
total (wet) bulk density, dry specific volume, porosity, and void ratio. The various
expressions of soil water content (mass wetness, volume wetness, water volume ratio, and
degree of saturation) and of air-filled porosity (or fractional air content) are of equal
importance to soil function (Hillel, 1998). The latter measurements are beyond the scope of
this thesis and shall therefore not be elaborated upon, but a general introduction to bulk
density will be presented in a way that respects the other volume and mass relationships
occurring within soils.
Bulk density can be considered “a kind of opposite to the total pore space of a soil”
(Handreck and Black, 2010: p. 59). Bulk density expresses the ratio of solid mass to total soil
volume (including solids and pores together), often as grams of a dried cubic centimetre
(cm3) or millilitre (mL) of soil (Hillel, 1998, Handreck and Black, 2010). Bulk density is rarely
constant, being affected by the structure of the soil (i.e., degree of compaction) and by its
characteristics of swelling and shrinkage that are related to clay and water contents (Hillell,

209
1998). In general, more pore spaces mean a lower bulk density, which implies a lighter-
weight soil. Organic materials have lower bulk densities than mineral soils because they
have and create more pore spaces. Thus when considering volumetric quantities of different
soil types, 1 m3 of (dry) mineral soil typically weighs between 1000-1900 kg, while the same
volume of (dry) organic material (e.g., peat moss) has a mass of 50-200 kg, which is between
3% and 20% the mass of the same volume sand or soil. In practice, soil weights are
expressed as saturated weights so it is prudent to specify soils by mass rather than volume,
and perhaps even to state the water content (Handreck and Black, 2010).
Bulk density represents the balance of air void spaces in the soil matrix volumetrically (e.g.,
mg/ m3), and includes particle density (dry and wet), apparent density, and loose bulk
density. If weight loading is the main limiting factor for a green roof, then bulk density is the
most important physical characteristic of the substrate to be installed (Beattie and
Berghage, 2004). The bulk density for green roof substrates is specified through particle size
distribution (FLL, 2008, p. 58). Recalling that organic materials have lower bulk densities
than mineral soils, this is an important point for EGR systems that are predominantly
mineral and which must be lightweight. When mixed, the bulk density of the green roof
substrate should be about 5 lbs/ ft2 per inch of substrate depth (or approximately 960 kg/
m3) (Beattie and Berghage, 2004).
6.1.1.1.4 Compression, compaction, and consolidation
When subjected to pressure, soil tends to compress, or increase in bulk density (Hillel,
1998). Similarly, compaction of pore spaces and settling while in transport may reduce the
volume of soil ultimately delivered (Handreck and Black, 2010). When soils are compacted,
crumbs and particles are pressed together which reduces the size of the spaces between
them (Handreck and Black, 2010). When larger pores are collapsed by compaction, water
movement into and within the soil is hindered which leads to reduced infiltration rates.
When average pore size is reduced, i) water is held more tightly in small pores, which leads
to reduced water availability (i.e., plants must use more force to access water), and ii) more
water is retained in the soil after drainage has stopped (leading to a reduced air supply to
roots). Compacted soils also have higher soil strength, which means that roots must
navigate a matrix with few large pores and/ or pores with walls that cannot easily be pushed

210
aside. Due to the energy required for navigating ‘strong’ soils, and to the physical barriers
preventing the extensive development of a main root network for accessing nutrients and
water, plants in compacted soils are usually stunted. Lastly, in systems where the water
table is perched on top of a mineral layer, compaction of the materials comprising the root
zone forces the water of the capillary fringe closer to the soil surface which can damage
roots through lack of oxygen (Handreck and Black, 2010).
The nature of soil compression will vary depending on the degree of moisture, because
water is 50 to 100 times more viscous than air; expulsion of air from a soil is nearly
instantaneous whereas water escapes at a much slower rate (Hillel, 1998). Compression of a
completely dry soil, whether under static pressure or vibration, “causes the particles to
reorient and to assume a closer packing arrangement, thereby reducing the fractional
volume of air” (ibid, p. 357). In saturated soils, by contrast, “any such reduction of porosity
must necessarily take place at the expense of the fractional volume of water” (ibid, p. 357).
The latter (compression of a saturated soil) is more precisely known as consolidation, and
the term compaction “applies to the densification of an unsaturated soil by the reduction of
the fractional air volume” (ibid, p. 358). Intense traffic on a wet soil can render the surface
soil into a slurry which, upon drying, may set into a hard crust that is inhospitable for plant
growth (Handreck and Black, 2010). Although soil compaction on roofs is nowhere near as
problematic to field operations like agriculture and athletic turf, the physical repercussions
do nevertheless merit attention for EGR substrates (Beattie and Berghage, 2004). Since
EGRs have minimal depth from the start, and lack resources that natural soils can access for
replenishment (e.g., fissured bedrock for exploration, large plants for organic inputs), the
risk of compression is thoroughly addressed by the FLL guidelines (introduced later).
6.1.1.2 Organic content
Organic matter has numerous important benefits for soils and for vegetation. For one,
organic matter binds together the soils mineral particles to form aggregates, thereby
improving soil structure, water retention, and the supply of oxygen and water to plant roots
(Havlin et al., 2005, Handreck and Black, 2010). Organic matter serves both as a source and
regulator of nutrient supply because it increases cation exchange capacity, thereby reducing
nutrient leaching (e.g., P, K, Ca, Mg) and concurrently makes those nutrients more available

211
to plants (Havlin et al., 2005). Organic material can act as a reservoir for soil nitrogen, and
its mineralization provides a continuous (if limited) supply of essential macronutrients like
nitrogen, phosphorus, and sulphur to plants (Havlin et al., 2005). Organic matter helps to
buffer soils against rapid changes in pH, thereby helping to control root disease. This is
partly because the microorganisms that decompose organic matter concurrently reduce the
level of disease-causing organisms in the soil (Handreck and Black, 2010). Soil organic
content can also increase plants’ ability to resist pathogens and other organisms causing
diseases to roots and shoots (Handreck and Black, 2010).
Plants are the primary source of all organic matter through their biomass, both above-
(shoots, twigs, branches, flowers, fruits) and below-ground (roots). The process of
decomposition reduces plant parts to tiny and unrecognizable bits, which may occur as
quickly as a few months in the case of softer plant parts (e.g., small roots, leaves, flowers) in
moist environments (Wardle, 2002). Decomposition is caused by millions of microorganisms
(mainly fungi, bacteria, actinomycetes) which feed upon plant tissues and upon each other,
recycling the nutrient elements from the plant material for renewed use (Bardgett, 2005,
Wardle, 2005). The dark-coloured humus that results is basically microorganism excreta,
whereby microorganisms have rearranged the atoms through their decompositional
activities to form large conglomerates (Handreck and Black, 2010). Humus therefore
consists of large organic molecules containing mainly carbon, hydrogen and oxygen but also
nitrogen and sulphur, plus smaller amounts of other elements. Humus is the most stable
component of soil organic matter and has major effects on soil structure and a soils ability
to hold and supply plant nutrients (Handreck and Black, 2010). The organic matter content
of a soil will change with relation to its environment (Handreck and Black, 2010). Organic
matter will accumulate when plant growth exceeds decomposition rates, as when plant
growth is enhanced through fertilization on soils that can only support slow rates of
decomposition (e.g., acidic) or it will decrease when plant material and litter is removed, or
when the soil and vegetation are disrupted by water-logging, fire or cultivation.
6.1.1.3 Biological component: soil fauna
The recycling of nutrients from vegetation and substrate and the formation of soil crumbs
and soil structure are essential functions for any ecosystem. Soil-based herbivores and

212
carnivores, as well as soil microorganisms, are required for ecological processes like
decomposition and nutrient recycling; as such, soil fauna can serve as indicators of
ecosystem function and vitality (Bardgett, 2005). Macrofauna, like ants and earthworms, are
known as ecosystem engineers because their feeding and burrowing activities amend soil
structure and hydrology (Eldridge, 1993, Eldridge and Pickard, 1994, Debruyn and Conacher,
1994, Bardgett et al., 2001). Earthworms, for example, which are both voracious litter
transformers and important soil engineers, can have dramatic effects on soil porosity and
infiltration (Knight et al., 1992, Lavelle et al., 1995), significantly enhance rates of
decomposition and C mineralization, stimulate total soil nutrient availability (N, P), and
enhance plant nutrient uptake (Hobbie, 1992, Knight et al., 1992, Lavelle et al., 1995).
Though mutualism is widespread, these organisms can also have adverse effects on
ecosystems [e.g., see Yeates (1981), Martin (1991), Hyvonen et al. (1994)]. Consideration of
the role that these biotic populations play for soil ecological processes may shine light upon
the results already described in this and previous chapters, and on the nature of soil-based
ecological processes on EGRs.
6.1.2 EGR substrates
The FLL (2008) specifies that organic content should not exceed 65 g/ L for any multi-layered
green roof type, and no more than 40 g/ L for single layer constructions (both intensive and
extensive). The guidelines agree that greater proportions of organic matter may be
required, depending on the vegetation used (p. 61). The ideal EGR substrate comprises a
balance of light-weight, well-drained mineral aggregate with sufficient organic matter to
provide adequate water- and nutrient-holding capacity (Rowe et al., 2006). Good EGR
substrates will maintain their structure and proportions over time, will not break down or
lose too much depth by compaction or erosion, and will not leach nutrients in the runoff
(Kolb and Schwarz, 1999). As a result, EGR substrates are 70-90% mineral (by volume) (Kolb
and Schwarz, 1999), and may have 10-25% organic content (Beattie and Berghage, 2004)
but usually less. Most research has explored the influence of different proportions of
organic matter in EGR substrates on Sedum species, which have low demands (Rowe et al.,
2006, Getter et al., 2007, Emilsson, 2008, Molineux et al., 2009), certainly by contrast with
herbaceous perennials (Nagase and Dunnett, 2011). So, although it has numerous

213
advantages to soil structure, water retention and plant performance, EGR substrates are
specified with low proportions of organic matter (Miller, 2003, Beattie and Berghage, 2004,
Dunnett and Kingsbury, 2004, Friedrich, 2005). The mineral and organic components are
considered individually.
6.1.2.1 EGR mineral component
Early EGR research in Germany found that organic material does not hold up over time due
to oxidation and compression (Kolb et al., 1983), so engineered “soil-less media” became
commonly used. When designed with appropriate particle sizes, predominantly mineral
substrates have been lauded for providing comparable moisture holding properties to high-
organic mixes (Miller, 2003, Friedrich, 2005). The porosity of mineral substrates promotes
excellent drainage and oxygenation for the root environment, but also holds sufficient
water to support plant growth between rain events (Handreck and Black, 2010). Mineral
aggregates also resist compression and shrinkage, thereby maintaining soil structure and
further promoting drainage and aeration (Dunnett and Kingsbury, 2004) and longevity (Kolb
and Schwarz, 1999). Other reasons for high mineral proportions are related to the EGR
requirements of loading, water retention, resilience to compaction, and so on. The addition
of aggregate fines or sand can help with water retention and possibly also with capillary
action (Friedrich, 2005). The FLL (2008) provides specifications for several physical
properties of the mineral component of EGR substrates. By mass, the proportion of slurry-
forming components (particle size diameter less than .063) should be less than or equal to
15%, and the proportion of gravel (d > 4 mm) should be less than or equal to 50%. The
limited nutrient and organic content of these substrates gives EGR vegetation (i.e., hardy
perennials like Sedums) advantage over competitive species that require more fertile soils
(Kolb and Schwarz, 1999). Fewer weeds imply less maintenance, of course, which satisfies
one of the economic arguments for EGR installations.
Ideal mineral aggregates for EGRs are lightweight, durable and inert. These may be derived
from natural sources (e.g., volcanic materials like lava, scoria or pumice), recycled products
(e.g., crushed brick or tile), or manufactured materials (e.g., LECA, expanded shale, clay or
shale). Due to the energy required for their sourcing and manufacture, the latter materials
have very high embodied energy and their use can impact the sustainability goals of a

214
building due to life cycle costs (Oberndorfer et al., 2007, Kosareo and Ries, 2007). The
expanded aggregates that are popular in North America are manufactured by passing raw
minerals through rotary kilns which form, dry and fire the particles at temperatures over
1,200 C (Spomer, 1998), liberating gases as bubbles within the minerals and causing them
to bloat, or “expand”, to 1.5 to 2 times their original size. Concurrent with this process, each
particle is calcined, or covered by a ceramic-like coating, rendering the product chemically
inert with high compressive strength (Northeast Solite Corporation, 2007, Expanded Slate
Clay and Shale Institute, 2010). Since the 1990s, crushed brick and tile have become popular
for EGR substrates in Germany, as they fulfil the mineral component requirements and are
widely available as recycled materials (Roth-Kleyer, 2002, Appl and Ansel, 2004). Roofing tile
is fired differently than brick and cannot be interchanged with the same results (Friedrich,
2005). In England, Molineux et al. (2009) found that three alternative aggregates (pellets of
clay and sewage sludge; paper ash; and carbonated limestone) performed as well, if not
better, as the standard brick-based EGR substrate that was imported from Germany. Other
by-products like blast furnace slag, bottom ash, and diatomite filter waste are not
recommended for EGR substrates (Friedrich, 2005).
6.1.2.2 EGR organic component
Although most plants prefer to grow in higher organic content, organic matter in EGR
substrates is quite low. Early EGR research found that organic materials like humus
decomposed and disappeared within the first few years (Kolb et al., 1983, Krupka, 1992).
Too much organic content was also perceived as having negative consequences on soil
aeration, plant performance and higher potential risks of nutrient leaching (Beattie and
Berghage, 2004, Bilderback et al., 2005, Rowe et al., 2006). For all the research,
discrepancies in the specification of organic materials and in the metric (volume versus
mass) have led to confusion of how much organic content is best for regions with emerging
green roof industries (Buist and Friedrich, 2008). Low organic content certainly offers
advantages for EGR vegetation because moderately stressed plants are hardier and
ultimately stand a better chance of survival when resources become suddenly limited, as in
the case of drought (Rowe et al., 2006; Handreck and Black, 2010; Nagase and Dunnett,
2011). By investing more energy into root rather than leaf growth, as required to access

215
deeper water and nutrients, moderately stressed plants will use those resources more
efficiently (Handreck and Black, 2010).
Still, more organic content in EGR substrates can stimulate seed germination and root
development, and improve general plant growth (Nagase and Dunnett, 2011). Of four
different percentages organic matter (0%, 10%, 25%, 50% by volume) in a crushed brick
substrate, 10% proved best for maintaining diversity and stable growth by four different
growth forms regardless of watering regime (Nagase and Dunnett, 2011). Of equal
importance, less organic matter on EGRs produces smaller plants and also invites fewer
weeds to colonise, which means less maintenance is required (Nagase and Dunnett, 2011).
Using low organic content in EGR substrates can reduce the leaching of nutrients, like N and
P, which pollute surface waters (Moran et al., 2004, Emilsson et al., 2007, Villarreal and
Bengtsson, 2005). Assuming healthy plant growth and normal biomass turnover, Beattie and
Berghage (2004) estimated that organic matter on a well-established EGR would “probably
stabilise at around 2-5% of the total roof medium volume” (p. 2).
6.1.3 Hydrologic-horticultural concepts for green roof substrates
The confined volume of EGR substrates may result in intense plant requirements for not
only water, but also air and nutrients. Similar to field soils, EGR substrates must balance
solid matter (mineral and organic) and pore space (water and air) by volume. Beattie and
Berghage (2004) specify the allocation of water and air within pore space and state that the
ideal EGR substrate consists of about 40% solids, 40% water storage and 20% aerated pore
space, which is close to the “ideal proportions” illustrated in Figure 6.1e, which allocates
45% to solids, 35% to water and 20% to air. Maintaining both good drainage and water
retention is vital, if somewhat contradictory, for plant survival on EGR systems designed for
drought-tolerant vegetation. On the one hand, enough water must be retained to support
plants through periods of drought, yet waterlogging from poor drainage can cause root
damage from inadequate aeration. Waterlogging causes more mortality to green roof plants
than intermittent drought (Dunnett and Kingsbury, 2004). The hydrologic parameters that
are central to soil-water relations on EGRs are outlined below.

216
6.1.3.1 Maximum water holding capacity
The hydrologic properties of the substrate will ultimately influence the design load of a
green roof. So, in order to prudently determine the “dead load” of a green roof for the
purpose of structural engineering, maximum water capacity and field capacity of the
substrate must be included into the calculations. On extensive green roofs, maximum water
capacity (MWC) is a measure of the capacity for water retention by both substrate and
granular drainage layers. For EGRs designed for drought-adapted vegetation, the MWC of
substrate in an installed/ compacted state should be greater than or equal to (≥) 35% by
volume. For single-layer constructions, intensive greenings should have MWC ≥ 30% by
volume, and extensive greenings ≥ 20% by volume (FLL, 2008: p. 62). For systems using
aggregate drainage layers, “the engineering and materials used must ensure that the
artificial water table can rise” and, in addition to providing for this perched water table,
“sufficient dry space must be left above the maximum water table level” (FLL, 2008: p. 51)
to prevent waterlogging and to ensure that excess water can freely drain away. The FLL
states that MWC should never exceed 65% for any green roof system, whether intensive or
extensive. In horticultural terms, MWC is known as available water (Handreck and Black,
2010), namely the amount of water a substrate can hold when between field capacity and
the permanent wilting point.
6.1.3.2 Water permeability
Water permeability (Kf mod.) calculates how quickly water will infiltrate and drain through a
material, whether substrate or drainage layer, as a function of the gradient and depth. To
the latter, flow rate by the drainage layer is a function of the volume cleared via the
drainage course, the surface area drained, the coefficient of discharge, maximum rainfall,
altogether calculated as runoff width in meters (FLL, 2008: p. 51). Manufacturers must
provide a runoff rate [L / (s * m)] characterizing the efficiency of the materials used in their
drainage layers, presumably on the basis of industry standards.
6.1.3.3 Air content requirements
Total pore volume, described in the FLL guidelines as air content (at pF 1.8), should be no
less than 10% volume when a substrate is at MWC (FLL, 2008: p. 62). To account for the

217
water held in the fine pores at pF > 4.2, the volume of plant-available water can be
calculated by subtracting around 10-15 % from the MWC. In the case of substrates with
large pores (at pF 1.8), air content should be ≥ 20% volume. Dunnett and Kingsbury (2004)
suggest EGR substrates should have 60-70% pore volume.
6.1.3.4 Permanent wilting point
When a plant cannot access enough water, either because there is not enough in the
substrate, it is held too tightly, or it is too far from the roots to access it quickly enough, it
begins to wilt permanently and if water is not supplied quickly enough it will begin to die
(Handreck and Black, 2010). In testing scenarios, permanent wilting point is also defined as
water content at 1.5 MPa suction pressure. Since green roof plants are typically drought
tolerant and therefore have high wilting points, MWC for green roof substrates may be
better explained by the nearest point to saturation (Miller, 2003), which is related to its field
capacity.
6.1.3.5 Field/ container capacity
A soil is at field capacity when most of the drainage following irrigation or rain has stopped.
The soil can hold this volume of water for some time provided that evaporation (from the
soil surface) and transpiration (by the vegetation) are prevented. The smallest- and
medium-sized pores, as well as capillary pores, retain water against the pull of gravity, and
the particles forming large pores retain a film of water. Good soil structure gives soils more
pores of the size that hold water against the pull of gravity, and texture is a useful guide to
the ability of natural soils to hold water. The term ‘container capacity’ describes the similar
circumstance of a soil or substrate that occur not over a subsoil but rather large pockets of
air, like EGRs or golf greens. Beneath a multi-layered EGR system with a synthetic drainage
layer (i.e., not a granular one), there is only one large pore – the whole of the atmosphere –
and its surfaces do not exert any pull on the water retained in the substrate. Recalling that
water is attracted to solid surfaces, and that small pores hold water more firmly than larger
pores, soil structure and texture play a big role on how much water the substrate will hold.
Container capacity can be illustrated by the example of placing a saturated sponge over a
screen or a layer of gravel or sand. Unless it is sitting on an absorbent surface, a layer of

218
saturation will remain at the bottom of the sponge because water can only drain under
gravity or if there is a slight “head”, or weight, in the water above.
Container capacity is always greater than field capacity for the same soil, because the latter
defines the water content at a suction pressure of 33.3 kPa. It’s interesting to note that the
height of the saturation layer will be the same no matter what the height of the container,
which means that a substrate in a shallow container will have a higher average water
content (and a lower air-filled porosity) than the same substrate in a taller container (ibid).
Factors that determine the field, or container, capacity of EGRs at any point in time include
substrate depth, substrate physical properties and organic matter content, antecedent dry
weather period and the weather conditions associated with this, rainfall intensity and
duration, season, roof slope and orientation, roof area, number and type of system layers,
and the types of plants used (VanWoert et al., 2005, Villarreal and Bengtsson, 2005, Stovin
et al., 2012, Yio et al., 2013). In general, once the substrates’ retention (i.e., field or
container capacity) is filled past about half of the maximum water holding capacity (MWC),
the temporarily detained water will begin to run off (DeNardo et al., 2005).
6.1.3.6 Perched water table
A complication with shallow, contained media is the occurrence of perched water tables,
which occurs when the air spaces at the bottom of the substrate are filled with water. This
level of saturation destroys soil tubes, which prevents capillary action from pulling water
from the soil to drain it (Boodley, 1998), and roots receive too few air voids (Bunt, 1988). In
natural soils, a perched water table is an aquifer, or zone of saturation, located on top of an
impermeable layer (e.g., clay pan), but below the soil surface. Ideally, perched water tables
are small and short-lived, and any decent growing medium should balance water holding
capacity with aerated pore space (Beattie and Berghage, 2004).
This phenomenon is often used in horticulture (with regards to container capacity) but also
in the design of high-quality athletics turf, in particular cricket pitches and golfing greens. In
fact, the United States Golf Association (USGA) has developed the very popular “perched or
suspended water table method of construction” (Handreck and Black, 2010: p. 219), which
is not unlike a green roof. In brief, below the rapidly-draining root zone (i.e., ≥ 90% sand
content) lies a layering system of coarse sand/ fine gravel followed by a gravel drainage

219
layer that incorporates a piped drainage system, and a shaped subgrade at base. Together,
this system provides a firm surface ensuring continued high quality turf under intense use
and aids drainage, thereby preventing soggy mud and maintaining good plant growth
(Handreck and Black, 2010). In this context, the perched water table allows longer times
between irrigations and gives turf a larger reserve of water to draw in hot weather (ibid: p.
224). With regards to EGRs, perched water tables can be considered in conjunction with the
incidence of container capacity, specifically that the saturated depth (i.e., water vs. air
content) will keep the same vertical height regardless of the depth of the system.
In multi-layered EGRs that use drainage boards filled with aggregate, this layer may behave
as an ‘anti-drainage’ layer because it prevents percolation of water from the finer material
above (Vesuviano, 2013). Water can only drain into the drainage layer from a soil with small
pores after the soil has become completely saturated (Handreck and Black, 2010). The
drainage layer therefore creates a sort of perched water table. The problem with perched
water tables is they can induce anaerobic conditions within the root zone (Hillel, 1998).
Maintaining such a layer of water on a green roof has been attributed to reducing heat flux
and internal room temperatures into buildings (Niachou et al., 2001), and green roof
systems that incorporate water retention into the drainage layer may increase the amount
of water available for evapotranspiration (Hunter-Block et al., 2012). That being said,
Vesuviano (2013) found that drainage layers without granular infill effectively separate the
substrate from any stored water, such that the resulting air gap prevents capillary action so,
unless this water transfers to the substrate by evaporation, it is not available to plants.
6.1.4 Research aims and questions
Soil is the foundation that determines the vegetation of terrestrial ecosystems, and this
chapter evaluates the substrate properties and characteristics of the EGRs surveyed. As with
mature green roof vegetation, little research has examined the substrates of old (versus
newly installed) green roof substrates. Fortunately, a few German studies offer precedence.
By characterising EGR substrates over the long-term, this research may help to elucidate the
actual contribution that commercial EGRs can offer to urban ecology over the long-term.
Aim: To characterise the substrate old EGRs (>20 years after installation).

220
Question: do EGR substrates retain their recommended properties, as per FLL, over time?
Question: if successional changes can be observed on EGRs, what are the main drivers and mechanisms?
6.1.4.1 Objectives of the chapter
In addition to its aim of characterising the physical and chemical parameters of the EGR
substrate sampled, this chapter is interested in the possibility of soil ecological processes on
these systems. Does soil formation, or pedogenesis, occur on EGR systems over time, or are
the substrates too artificial and engineered, the conditions too harsh, and the soil biota too
impoverished for processes like humus and crumb formation to occur? This chapter also
complements the results of previous chapters for characterising EGR vegetation and
determining the mechanisms driving natural succession and vegetation dynamics. Specific
to this chapter, what happens to EGR substrate over the long-term, and how does this
impact the growing conditions for plants? How do the physical and chemical properties of
EGR substrates relate to the ecological dynamics deduced in previous chapters?
6.2 Methods
The pitched roof at Killesberg could not be sampled for soil, so eight of the nine roofs were
sampled for substrate physical and chemical properties using a (10 cm) soil corer (Firma
Schwab, Waidhofen). The samples were collected at the same time as the harvest of above-
ground biomass in autumn 2010 and 2011. After all surface vegetation was removed, one or
two soil cores were taken from the same quadrat area; any remaining plant biomass was
removed thereafter. In the process of coring, care was given to avoid damaging the deeper
layers of system, such as filter sheets or drainage boards. If ant nests were disturbed, the
cores were carefully fit back into place and alternate cores taken. Before being bagged, core
profiles were photographed beside a ruler for scale reference. Loose substrate was removed
from the cored gap with a small shovel. Empty cores were re-filled with a commercially
available green roof substrate, “Steinrosenflur.”

221
6.2.1 Data and analysis
A minimum of fifteen litres (15 L) substrate is required for physical and chemical analysis for
a single roof (FLL, 2008). Cored samples were therefore united into a single sample for each
roof, and these data are given as mean values per roof. Samples were analysed in
adherence with the FLL standards by the University of Hohenheim LA-Chemistry
laboratories. The FLL gives standardized testing procedures for evaluating the properties of
EGR substrates, like the Proctor hammer compaction test as per DIN 18127 or ASTM D698
which replicates compression over time. To determine maximum water capacity, substrate
samples were fitted into 150 mm cylindrical test samples, compacted, saturated and then
left to drip freely for 2 hours (i.e., until container capacity). Air volume (% vol.) is the
difference between total pore volume and water content at maximum water capacity. The
amount of organic content (g/ L) in a green roof substrate is determined by ash content and
loss due to burning, which is achieved by incinerating test samples at 550°C in a muffle oven
until the weight readings have stabilized and no more loss is detected. The standard DIN
19684 method was used to measure soil pH whereby a 0.01 molar solution of CaCl2 was
added to the sample and measured using a pH-meter after three hours.
6.2.1.1 Biological component: ant survey
A thorough soil fauna survey was not possible, but one of the roofs (Pliensaufriedhof) was
sampled on a sunny warm day in June 2014 to identify the species there. Ants were often
seen traveling along the roof parapet, and the rounded mounds were evident. This roof was
selected because it is easily accessible at short notice and because the one-off sampling was
expected to be successful (low parapets, visible mounds, known populations). Dr. Sophie
Evison from the School of Biology at University of Leeds provided materials and support on
methods. For the parapet, five “honey baits” were placed along an evident travel route from
which ants could be picked off with pincers; five individuals were collected per trap in vials
of 90% ethanol. For the mounds, one free standing mound and one bordering the parapet
were lifted and five individuals collected per nest. The samples were sent for identification
to Dr. Bernhard Seifert, of the Department of Entomology at the Senckenberg Museum for
Natural History in Görlitz. Similar to EIVs for plants, identifying ant species can infer

222
information about the habitat conditions experienced by soil organisms, certainly on this
roof and possibly on others.
6.3 Results and Discussion
The substrate results presented here endeavour to explain and understand soil-based
processes on EGRs. Specifically, the most basic question inquires whether EGR substrates’
recommended properties (as specified by the FLL) change over time.
6.3.1 Physical characteristics: water holding capacity, soil organic content
Three physical soil parameters for EGRs are defined by reference values specified by the FLL
(2008): maximum water capacity (MWC) (vol. %); air content (vol. % at MWC); and water
permeability (mm/ min). Of the eight roofs sampled, only two diverged from two of these
recommendations (see bold italicised values in Table 6.1).
Table 6.1. Physical soil parameters from EGRs sampled in Stuttgart region (2010, 2011).
Apparent density, dry (g/cm3)
Total pore volume (vol. %)
Maximum water capacity (vol. %)
Air content at MWK (vol. %)
Apparent density at MWK (g/cm3)
Water permeability (mm/ min)
Rathaus lower
1.18 54.00 38.00 16.00 1.57 N/A
Rathaus PV
1.17 55.00 32.00 23.00 1.49 N/A
FH Nürt. 0.88 66.00 53.00 13.00 1.41 0.70
Köngen 0.78 68.00 62.00 6.00 1.39 2.70
Tüb. 1.18 54.00 44.00 10.00 1.62 11.00
VB A1 0.54 79.00 44.00 35.00 0.98 N/A
VB A2 0.48 82.00 32.00 50.00 0.80 N/A
Pliensau 0.64 72.00 71.00 1.00 1.35 0.10
FLL guide: none none ≥ 35 ≤ 65 ≥ 10 none 0.6-70

223
6.3.1.1 Maximum water holding capacity (MWC)
The FLL specifies that the substrates of multi-layered EGRs (in their compacted or installed
state) should have ≥35% vol. maximum water capacity and, because of issues from water
logging, no green roof system of any type should ever exceed 65% vol. maximum (FLL, 2008:
62). Other than the oldest roof, Pliensaufriedhof, which exceeded the recommended limit
(71%), all the roofs sampled fell within or only slightly outside the prescribed range for
MWC. The Römermuseum at Köngen was close to the limit (62%), and two roofs (VB A2,
Rathaus PV) were slightly below the recommended minimum (both at 32%). Even though
stormwater mitigation performance by these roofs is not known, these results imply that
they probably perform fine for runoff detention and retention.
It’s interesting that the roofs that were classified as “Species-poor Sedum roof” vegetation
types had the highest MWC of all the roofs sampled, rather than the more floristically
diverse roofs, as one might expect species requiring more moisture to exploit such
opportunities and out-compete Sedums, which are susceptible to root rot in wet conditions.
The cover by Sedum on these roofs was dense and vigorous, however, without any apparent
competition by other growth forms nor symptoms of physiological stress by water-logging.
The latter could be attributed to the drainage layers at both sites, and to the slope at
Köngen. Considering how flat Pliensaufriedhof is, and the observations of earthworms and
ants there, it is also possible that the engineering activities by these organisms regulates the
water and air content in that roofs substrate (Wardle and Lavelle, 1997). This shall be
considered in more detail later.
6.3.1.2 Air content at MWC (vol. %)
The air content at MWC is recommended by the FLL (2008) to be equal to or greater than
10% by volume, which was matched by all roofs except Köngen (6%) and Pliensaufriedhof
(1%). This metric implies an unequal balance between air and water on those roofs, such
that the roots do not receive sufficient air (recalls compacted soil, Figure 6.1f). This is not
likely too grave a matter in Köngen since that roof is pitched, but Pliensaufriedhof at
maximum water capacity must be at risk of saturation (recall Figure 6.1b). As mentioned,
however, the Sedum vegetation there did not show any signs of stress in this regard, neither
to waterlogging nor to competition by other growth forms. EGRs in Berlin were noted to

224
have lower porosity in the early years after installation, but this increased significantly after
about ten years, to the same total pore-volume as 100-year old TPG roofs (Köhler and Poll,
2010). Biological and physical processes may be responsible for these developments, as
plant roots and soil biota create pore spaces through their activities while water flux and
drought events also contribute to physical changes.
6.3.1.3 Soil organic content (Corg)
The correlation analyses in Chapter 2 found that older roofs had more soil organic content
(Corg) than younger roofs (rho=-.338, p<.000, n=118). Of the eight roofs sampled, half fell
within and half were above the recommended limit for extensive greenings (≤65 g/L) (Table
6.2). The paired roofs in Stuttgart and Esslingen, aged 21 and 25 years (respectively), fell
within the FLL recommendation while the other roofs were in excess (Figure 6.4).
Considering the variability of the measurements, even on the paired sets of nearly identical
roofs in Stuttgart and Esslingen (i.e., same age, construction and location), roof age is not
likely the sole factor influencing soil organic content. Of the Verkehrsbetrieb (VB) roofs in
Esslingen, VB Area 2 had the lowest Corg record of all roofs surveyed (25 g/ L), followed by
Rathausgarage PV (49 g/ L). The neighbouring counterparts of these two roofs – VB Area 1
and Rathausgarage lower – had Corg values at the upper limit of the FLL recommendation (60
and 61 g/L, respectively). When sampled, the substrate cores did not hold together the way
that a topsoil would and seemed to comprise predominantly loose mineral aggregate.
Table 6.2. Soil organic content (Corg) for eight EGRs of various ages.
Roof name (in order of age) Roof age
C-org (g/L)
Rathaus, lower 21 61.0
Rathaus, PV 21 49.0
FH Nürtingen 23 72.0
Köngen 23 126.0
Gärtnereihof Tübingen 24 79.0
Verkehrsbetrieb Area 1 25 60.0
Verkehrsbetrieb Area 2 25 25.0
Pliensaufriedhof 33 186.0

225
Figure 6.4. Mean soil organic content (Corg) for eight EGRs of various ages.
The EGR in Köngen had a high value for Corg (126 g/ L); this was likely owing to the 5
quadrats sampled from the north-facing roof which was shaded (two stories below) a
neighbouring row of trees and had more herbaceous vegetation than the Sedum-dominated
south-face. Since the soil samples from the north and south roofs had to be united into a
single sample, it was not possible to separate the difference in Corg values for this building.
The pitched roof in Tübingen also had excessive Corg (79 g/ L); the conditions leading to this
might be similar to those in Köngen as the North-facing aspect in Tübingen also featured
slightly less xeric vegetation and had an adjacent tree canopy. However, unlike the shading
received at Köngen, the tree canopy in Tübingen is at roof-level so its influence (e.g., leaf
litter, microclimatic effects) is limited to the edges of the roof immediately adjacent (which
the quadrats did not sample). The floristically diverse Sedum meadow at FH Nürtingen also
had Corg in excess of the FLL recommendation (72 g/ L). Notably, this roof had a number of

226
thriving ant communities, whose mounded hills provided opportunities for deeper rooting
grasses and forbs (though these were not sampled).
Of the four roofs exceeding the FLL guideline on soil organic content, the 189 g/ L at
Pliensaufriedhof sets this roof well apart from the others, most likely reflecting the fact that
it was installed as a simple intensive roof in the late 1970s. As a rule, this type of roof
construction is the second of three green roof types, midway between “cheap” extensive
green roofs and “complex” intensive systems (Krupka, 1992) (p. 142). Nevertheless, even
multi-layered intensive green roofs are recommended to have ≤ 90 g/ L organic content
(FLL, 2008: p. 61), which this roof exceeds two-fold. The substrate on this roof was a moist,
dark humus with far fewer mineral components so apparent on the other roofs sampled.
Given that it was installed prior to the publication of first edition of the FLL guidelines and
that it is based by a system that is still used today, it is possible that the original blend
aligned with the nascent FLL recommendations, even if engineered substrates were not yet
available (Appl, 2014). It was interesting to note that several soil cores revealed large
earthworms, as well as thriving ant communities.
6.3.1.3.1 Physical characteristics: discussion
Particle size wasn’t recorded here, but a number of early studies have noted changes to
particle size distribution and pore size in EGR substrates over time, though these were
conducted in order to verify the impact of installation by hydraulic blower trucks (Roth-
Kleyer, 2006a, Roth-Kleyer, 2006b, Roth-Kleyer, 2002). From his survey of relatively young
EGRs Buttschardt (2001) observed that particle size distribution had shifted beyond the FLL
recommendations within four years. By 2002, 70% of EGR installations in Germany used
blower trucks (Roth-Kleyer, 2002); hence the FLL (2008) recommends prescribing
granulometric distributions with greater proportions of large particles.
Most of the ecological research of spontaneous roof vegetation has also examined the
sandy-gravel growing substrate, in some cases with the simple intention of classifying
(Buttschardt, 2001) or characterising it (Bornkamm, 1961, Darius and Drepper, 1983),
though some have aimed to determine the occurrence of pedogenesis (Bossler and Suszka,
1988, Köhler and Poll, 2010, Schrader and Boening, 2006, Thommen, 1988). Unfortunately,
as a result of the analytic method (i.e., loss on ignition at 550°C), it is impossible to know the

227
constitution of the soil organic matter identified in these studies. To explain the high values
for C/N ratio measured in Berlin, Köhler & Poll (2010) reported “a measuring fault of the C-
N-Analyser which cannot differentiate between organic carbon (humus) and black carbon
(likely originating in the chimney emissions)” (p. 727). In other words, because soil organic
content is determined by ash content after incinerating the sample, organic content is a
deceptive term that may indiscriminately include black carbon from chimney soot,
biologically active humus, or undecomposed litter all under the same heading. Some of the
studies referred to here use the term humus, but do not specify what this means. For the
purpose of clarity, then, terminology used by the authors will be used and, beyond
translation, no further interpretations will be made.
The accumulation of soil organic carbon seems to occur around 20 years after installation
for all types of vegetated roof, although the lower substrate profiles of gravel roofs remain
loose and skeletal, regardless of age (Bornkamm, 1961, Thommen, 1988, Köhler & Poll
2010). A survey of >thirty TPGs of various ages in Göttingen identified distinctive horizons
resulting in the substrates of younger versus older roofs (Bornkamm, 1961). Soil organic
content on younger roofs (i.e., renovated 1-8 years earlier) was typically higher in the lower
layers of the substrate compared to the upper layers, though a couple young roofs
presented exceptions (i.e., higher Corg in upper, rather than lower, layers). That study
concluded that the first decade after TPG installation leads to varied humus development,
but that it occurs mainly in upper horizons after ten years. Soil formation on those roofs was
associated not with roof age, however, but more explicitly with its ongoing history, its
vegetation, and the moisture regimes present. In Switzerland, a chronosequence of gravel
roofs suggested an accumulation of humus over twenty years, to an average of 3% by fifty
years (Thommen, 1988). That author noted that local microclimatic effects, like shading, had
a significant impact on humus development and Corg accumulation (ibid, p. 35).
In Berlin, nutrient levels and organic content of twenty-four TPG roofs that had been
undisturbed for at least 60 years, and ranging in depth from 20 to 240 mm, were likened to
that of urban fallow land, although this was mainly to explain the ruderal character of the
vegetation (Darius and Drepper, 1983: 68). These TPG roofs would not have included any
nutrients at their point of installation, and the original substrate did not include organic

228
content (just 50 mm sand, 100 mm gravel), yet a mean record of 6.3 kg/ m2 organic content
was assessed in 1982 (ibid). Twenty years later, soil organic content on those same roofs
had not changed much, nor did the C/N-ratios (Köhler and Poll, 2010). The latter (which
considered the results of green roof surveys starting in the 1980s) found that Corg (% vol.) on
EGRs increased significantly between 1980 to 2008, from 2.5% to 4%, while TPG roofs
remained just above 4% in that same timeframe (Köhler and Poll, 2010). On EGRs, soil
organic content sank from 2.5% to 1.9% in the early years after being installed (possibly due
to rapid decomposition, as observed by a study in Sweden) (Emilsson and Rolf, 2005), but
had increased to significantly greater volume (3%) after twenty-five years (Köhler and Poll,
2010). The unique conditions and factors of each of the roofs in that survey may explain
deviations in Corg, since grassy meadow assemblages (Poa compressae anceptis) produce
more biomass than stress-tolerant vegetation of the Sedo Scleranthetea (Köhler & Poll,
2010). So, while Corg fluctuated more on the EGRs than the older TPGs, the roofs eventually
all attained similar values.
In Karlsruhe, Buttschardt (2001) found that the EGRs sampled had “high to very high humus
contents… to the magnitude of topsoil or humus-rich A horizons… [and] most of them
exceeded the FLL guidelines” (p. 63). The substrate with the highest value in that study
(51.6%) occurred on a 6 year-old, single-layered roof (syJTO) and was composed of red ash
(Rotasche), a slag product with high proportion of carbon black (Russ). Interestingly, the
spontaneous TPG roofs sampled had equally high values which did not differ significantly
from the modern EGR roofs, although younger roofs had significantly less humus content. In
a study of twelve roofs sampled after 12 or 16 years in northern Germany, increased soil
organic content was correlated with declining pH and shallow, mineral substrates (Liesecke,
2006). Of the various roof constructions surveyed, the highest Corg concentrations were
observed on the four single-layer EGRs featuring expanded shale, and the shallowest of
those (50, 80 mm) had the highest Corg of all twelve roofs. In addition, after more than ten
years, those single-layered EGRs retained considerably more water than the multi-layered
systems (Liesecke, 2006). Similarly, a study in Michigan (USA) of variously pitched EGR
platforms (all 60 mm depth) found that organic matter content nearly doubled after five
years, as did water holding capacity (Getter et al., 2007). That study also noted greater
values for porosity and more free space (macropores). The accumulation of organic matter,

229
in the form of litter, on shallow mineral substrates (especially single-layer systems) may
suggest that those conditions inhibit decomposition processes.
A study of five (90-year old) TPGs and three (20-year old) gravel roofs in Osnabrück found
that organic content varied considerably between all roofs, regardless of roof type (Bossler
and Suszka, 1988). The TPG roofs in that study were based by 80-150 mm sand with high
skeletal proportions, in which the sand was darkly coloured by humic acid and the skeletal
component consisted of sandstone, pieces of brick fragments, mortar chunks and marginal
proportions of bitumen, and the gravel roofs (from the late 1960s) had 25-90 mm of
predominantly medium-grade construction gravel. Both roof substrates showed
pronounced soil structure, had high total pore volume (mean 53%) and poor water holding
capacity (13.6 L soil water/ m2 in 15 cm), and humus content ranged between 0.4 and
21.6%. After 90 years, the TPGs had developed distinct profiles through humus
accumulation and the shifting of carbonates, leading the authors to define the vertical
gradation as horizons (Y-Ah to YC, ending at the waterproofing) and defining TPG soils as
sandy “para-rendzinas” (p. 221). By contrast, they classified the younger gravel roofs as
“loose immature soil” according with the minimal accumulation of fine-earth component.
Echoing the Berlin study of undisturbed TPG roofs (Darius and Drepper, 1983), these
authors concluded that time and initial parent materials determined the different soil types
that developed on the different roofs, and that the key factors to soil development over
twenty years were precipitation and dust deposition, as well as the vegetation itself. Both of
these studied agreed that these systems had established a steady state of litter production,
humus formation and mineralization, although these processes were very slow because of
the limited flora of the shallow depths (pioneering mosses and lichens).
As mentioned, the type and quality of organic material cannot be evaluated without a
suitable testing mechanism, which inhibits the use of these analyses for ecological research
on green roofs. Although Köhler & Poll (2010) suggest that the accumulation of soil organic
content after twenty years on EGRs in Berlin indicates pedogenesis, or soil formation,
Liesecke (2006) described the organic content from his samples as incompletely
decomposed material, or litter. If the organic content that accumulates on EGRs over time is
litter rather than humus, then there are several consequences of such developments.

230
Firstly, feedbacks associated with accumulated litter can influence plant establishment,
growth and community composition via a range of interacting mechanisms (e.g., changes to
light regimes and microclimate, nutrient immobilization) (Facelli and Pickett, 1991). Other
repercussions for EGRs include enhanced water retention and associated increases in roof
loading. Twelve years after installation, the shallow shale-based roofs in Hannover retained
between 38.8 and 57 L/m2 more water and were 42 to 76 kg/ m2 heavier, with the
shallowest depths nearly twice as heavy (Liesecke, 2006). This can obviously be problematic
if the roof was not designed with sufficient structural capacity. No studies have addressed
the changes in hydraulic performance of established green roofs (Li and Babcock, 2014),
although some research has begun (Stovin et al., 2013).
6.3.2 Chemical characteristics: soil pH and nutrients
Soil reaction, or pH, determines the availability of nutrient elements to plants growing in
mineral soils (Handreck and Black, 2010). The pH range recommended by the FLL (6.5-8.0)
covers the greatest nutrient availability for macronutrients (N,P,K) and good availabilities of
micronutrients (S, Ca, Mg, Fe, Mn) and trace elements (B, Cu, Zn, Mo). With reference to soil
pH classifications by USDA (1998), the substrates surveyed ranged from “strongly acid” (5.2,
Köngen) to “moderately acid” (Tübingen, the two Verkehrsbetrieb roofs and FH Nürtingen)
to slightly acid (Pliensaufriedhof). Only the two youngest roofs (Stuttgart Rathausgarage
roofs, both 7.2) fell within the recommended “neutral” range. Most roofs fell within the
recommended range for nutrient concentrations, but Pliensaufriedhof had too much
nitrogen (93 mg/ L, versus recommended limit of 80 mg/ L) and phosphorus levels in
Tübingen were at the precise limit of the recommendations (50 mg/ L) (Table 6.3). The
range of pH measured (pH 5.2 to 7.2) (Figure 6.5) indicates that nutrient availability for the
essential macro- and micronutrients to the vegetation of the EGRs surveyed is potentially
quite constrained (especially P, K, S, Ca, Mg) while trace elements become more available
(and potentially toxic) (e.g., Fe, Mn, B, Cu, Zn).

231
Table 6.3. Chemical soil parameters for eight EGRs (in order of age) (bolded values fall beyond the FLL
recommendation)
Roof name (in order of age) soil pH (CaCl2)
N (mg/ L)
P2O5 (mg/ L)
K2O (mg/ L)
Mg (mg/ L)
Rathausgarage, low 7.2 53 11 71 120
Rathausgarage, PV 7.2 52 6 68 120
FH Nürtingen 6 62 < 5 130 N/A
Köngen 5.2 20 32 27 130
Gärtnereihof Tübingen 5.6 17 50 97 110
Esslingen VB Area 1 5.9 19 < 5 58 140
Esslingen VB Area 2 5.8 30 < 5 37 44
Pliensaufriedhof 6.3 93 7 88 150
FLL recommendation: 6.5-8.0 ≤ 80 ≤ 50 ≤ 500 ≤ 200
Figure 6.5. The availability of nutrient elements to plants in mineral soils varies with soil pH; the measured range for the EGRs surveyed is shown by the dashed lines (pH 5.2 to 7.2). Modified from Handreck and Black (2010).

232
The EGR at Gärtnereihof Tübingen was accompanied by documentation of a soil survey
conducted six years after its installation, or seventeen years before it was surveyed for this
research. The soil analyses by Sailer-Schmid (1993) report that soil pH on the Tübingen roof
was at the lowest limit of the recommended range (6.5), while phosphorus and potassium
concentrations were extremely high and magnesium concentrations were too low (Table
6.4). This probably reflects that the roof had been over-fertilized; indeed, the Head
Gardener’s maintenance record reports annual fertilisation for the first seven years’ after
installation (Braun, 1992). Maintenance of this roof by the Department (including irrigation,
weeding and filling in any gaps in the substrate or vegetation) apparently consumed 150-
200 hours each year from 1988 until 1992, but in 1993 this was reduced to 60 hours and by
2000 hardly any maintenance took place. By 2005, roof maintenance had ceased altogether
(Starke, 2010). This knowledge advises caution for sites that lack background information, as
human involvement on easily accessible green roofs must be considered alongside
ecological data.
Table 6.4. Nutrient analyses for Gärtnereihof Tübingen six years after installation show excessive
levels of P, K and Mg.
Tübingen substrate 1993 2010 Difference (16 years) FLL reference
pH 6.5 5.6 0.90 6.5-8.0
Phosphorus (P2O5) 41.70 50.00 -8.30 5-15 mg/ 100g
Potash (K20) 38.00 97.00 -59.00 10-20 mg/ 100g
Magnesium (Mg) 26.00 110.00 -84.00 6-12 mg/ 100g
In Karlsruhe, Buttschardt (2001) found that plant available nutrients like phosphorus were in
excessive concentrations on most of the EGRs sampled (Table 6.5: bold and italicised). The
only roof that did not have excessive phosphorus levels (B7: Haid and Neustr.) was deficient,
but the cause of this was attributed to the substrate manufacturer (Buttschardt, 2001: p.
67). Nitrogen was only measured for a few of the spontaneous TPG roofs in this study, of
which the high concentrations recorded were associated with pigeons. Otherwise,
perceptible levels of phosphorus and potassium only occurred on TPG roofs with deeper
substrates and higher volumes of humus.

233
Table 6.5. Six of seven EGRs surveyed in Karlsruhe by Buttschardt (2001) had excessive phosphorus.
Roof # Buttschardt EGRs in Karlsruhe (in order of age)
Roof age
P2O5 (mg/ L)
K2O (mg/ L)
Mg (mg/ L)
B1 Forschungszentrum Umwelt 2 80 100 40
B2 Pavillon Waldorfschule 3 230 90 110
B3 Sparkasse Sophienstr. 4 150 120 30
B4 Jugendtreff Oststadt 5 320 50 150
B5 Klinikum OP 7 390 90 10
B6 Turnhalle RB 7 70 160 30
B7 Haid & Neustr. 7 10 190 70
B8 Garagen Rudolfstr. 6 7 N/A N/A N/A
FLL recommendations: ≤ 50 ≤ 500 ≤ 200
6.3.2.1.1 Chemical characteristics: discussion
Other studies attribute differences in soil pH on EGRs to their variable carbonate amounts
(Poll, 2008) and/ or to the varying carbonate levels in the recycled materials used by
different substrate manufacturers (Buttschardt, 2001, Bossler and Suszka, 1988). A study in
in Göttingen noted vertical gradation of pH, such that young roofs (renovated 1-8 years
earlier) had equal pH values in upper and lower layers of the substrate, while older roofs
(>10 years) had higher pH in the lower layers of the substrate (Bornkamm, 1961). Some
studies reported relatively high concentrations of heavy metals in the substrates of various
green roof types, including cadmium, lead and zinc (Bossler and Suszka, 1988, Poll, 2008).
Green roofs in Berlin – both EGR and TPG – were treated with lime in the 1980s in order to
offset acid rain; by 2008 EGRs had declined from slightly alkaline (pH 7.4) to neutral (pH 7.1)
while TPGs increased from slightly acidic (pH 6.4) to nearly neutral (pH 7.0) (Köhler and Poll,
2010). The TPG with the lowest pH from the 1983 surveys (pH 5.2) occurred on the only roof
on which no mortar chunks were found in the substrate (Darius and Drepper, 1983),
suggesting that the substrate of these Berlin roofs would have been far more acidic were it
not for carbonate amendments (Poll, 2008). Both EGRs and TPGs had heterogeneous
distributions of carbonate components and did not indicate any short- or long-term
acidification (Poll, 2008). In Karlsruhe, old TPG roofs had a greater pH range (3.9 to 7.1) than

234
modern EGRs (5.8 to 7.6) (Buttschardt, 2001). The TPG roofs were between 40 and 110
years old at the time surveyed (of which over half were >100 years old), so the large
amplitude in soil pH would have occurred over a long and continuous period; indeed,
Buttschardt (2001) reported a strong relationship between pH and roof age. The older TPGs
surveyed had lower carbonate (CaCO3) content than younger TPG roofs because they were
based by dune sand and/ or sand that was decalcified at the time of extraction, while
younger TPGs used sediment from the Rhine, which is derived from deeper layers that were
never decalcified (Buttschardt, 2001, p. 62-63).
On the TPG roofs in Osnabrück, Bossler and Suszka (1988) also assessed neutral to slightly
acidic pH, with a minimum record of pH 4.6 and maximum pH 7.5. These authors identified
that carbonate (CaCO3) from the mortar on TPG roofs influenced soil pH. One TPG roof
(Nobbenburger Str.) had a full unit less pH than all others, which these authors attribute to
the exhaustion of reactive carbonate reserves on that roof. The authors also proposed that
aerial ash deposits from coal chimneys played a role to the acidification of the roofs
sampled. At the time of that survey, acid rain and “Waldsterben” were familiar news: the
annual value in 1982 for rain in Germany was pH 4.3, and Osnabrück itself recorded pH 4.6,
whereas “normal” rain has a pH of 5.6 (Bossler and Suszka, 1988). These authors concluded
that the volume, distribution and pH of rainfall influenced soil reaction, the rate of nutrient
leaching, and plant-water relations, and thereby soil formation on the roofs. In Hannover, a
comparison of EGR substrates on young (3-4 years after installation) versus older (8-12
years) roofs, all ca. 80 mm deep, revealed significant differences between the age classes
owing to lower pH and higher organic content by the older roofs (Schrader and Boening,
2006). These authors suggest that the trajectories of acidification and the accumulation of
Corg and nitrogen may themselves represent ongoing soil-formation processes on these
systems, such that EGR substrates will develop towards states similar to those of natural
soils, regardless of how artificial they may have initially been.
At FH Weihenstephan, a seven-year study of 23 mineral substrates (without organic
content) were installed as single-layer systems at 80mm depth in 1.21 m2 roof-top plots
(with three replications). After seven years, pH had declined significantly from initial values
and only four substrates still matched the FLL specifications (6.5-8.5) (Jauch and Fischer,

235
2000b). The same study found that crushed brick substrates were more stable than those
based by lava or expanded clay and shale. Although the macronutrients on the roofs
sampled fell within the recommended range, low pH can inhibit their availability to some
plant species. This may partly explain the dominance by Sedum species on EGRs since they
are stress tolerators [sensu Grime (1977)] which have the lowest nutrient requirements of
any plant growth form (Grime, 2001). Indeed, a container study found that five species of
Sedum produced the most dry weight in moderately to slightly acidic conditions, from pH
5.7 to 6.4 (Zheng and Clark, 2013). That study found that some species were exceptionally
productive, in fact, for example Sedum spurium had 95 times more dry weight at pH 6.3
compared to pH 8.3 (ibid).
These observations recall concerns in Germany in the mid- to late 1990s regarding the
accumulation of limescale (sintering) inside roof drains by the residue of poor-quality
carbonate materials (Roth-Kleyer, 1996, Kolb, 1997). Those concerns were eventually
calmed by results from FH Weihenstephan and FH Geisenheim which showed that sintering
of roof drains could not be traced back to the EGR substrate, even when extremely high
carbonate amounts were included (Jauch and Fischer, 2000a, Roth-Kleyer, 2002). As a
result, even though some soil-based parameters were updated in the 1995 FLL guidelines
(e.g., C/N ratio, absorption capacity), fixed targets or specifications for carbonate did not
follow (Roth-Kleyer, 2002).
Many factors can lead to soil acidification, including cation leaching, acid deposition, and the
accumulation of organic acids in soil organic matter during succession (Chapin et al., 2002).
Changes in pH on green roofs (both TPG and EGR) are apparently influenced by substrate
composition, but likely also to atmospheric deposition and other urban environmental
conditions. While substrate composition on TPG roofs is very different from EGRs, it appears
that climate and precipitation influence all green roof systems equally. The precedent works
cited make it clear that acid buffering on green roofs over time is determined by the
substrates material composition. The main reasons for concern regarding the acidification of
EGR substrates over time relates to the effect of pH on plant nutrient uptake and any
implications of nutrient leaching through runoff (Emilsson et al., 2007, Villarreal and
Bengtsson, 2005, Teemusk and Mander, 2011), but it will also influence the vegetation and

236
the ecological processes that can occur there. In parallel, declining pH and locked up
nutrients may permit Sedum vegetation the conditions for competitive exclusion, creating
feedback dynamics that maintain the vegetation as such. While it is straightforward to
accept that vegetation is influenced by a soil’s characteristics, it may be instructive to
consider the opposite as well, namely the effects that the vegetation has upon the soil.
6.3.3 Biological component: ants and earthworms
Although green roof substrates are engineered and contrived compared to natural field
soils, to some extent the biological principles of soil ecology must apply. Biological
characterisation was not the remit of this research, but incidental encounters of ant nests
and earthworms during soil sampling insinuated that biological activity was occurring on
some of the roofs surveyed (Figure 6.6). Most soil development occurs in the presence of
live organisms (Ugolini and Spaltenstein, 1992), so consideration of these observations was
treated as significant to the aim of characterising EGR substrate development.
Figure 6.6. A few soil cores disturbed ant colonies, which appeared to be thriving given the visible
abundance of eggs (this core is from Tübingen, T3Q4).
Mounded anthills were observed on Pliensaufriedhof and FH Nürtingen, and it is known that
most green roofs support ant colonies (Mann, 1999a, Kadas, 2006, MacIvor and Lundholm,
2011, Madre et al., 2013). Ants influence plant communities by creating patchiness and
potentially increasing plant species richness through activities such as central-place
foraging, discarding of food remains around nests, soil-dumping and mound-building (Dean

237
et al., 1997). The roof at Pliensaufriedhof visibly supported numerous thriving ant
populations, in particular the conspicuous above-ground nests of Lasius flavius, whose tall
mounds (↕ ca. 30 cm, ø ca. 80 cm) house both colony and root aphid farms (Ivens et al.,
2012). The populations on that roof may be attributed to the rigid polystyrene foam of the
drainage layer (Floratherm® WD 180), which is a useful building material for ants to build
their nests (Seifert, 2014). The relative dryness of these mounds can give plants that are
poor competitors an advantage in habitats that would otherwise favour grasses, but the
activities of nest-mounds also influence soil nutrient status and soil pH (Dean et al., 1997).
So, beyond the effect of providing deeper depths and heterogeneity to EGR vegetation, the
presence of ants on EGRs could have further-reaching effects on EGR substrate and soil-
based dynamics.
Pliensaufriedhof also supported ants that build subterranean nests (Lasius niger and
Formica cunicularia), species which have been identified by green roof studies in Nova
Scotia (MacIvor and Lundholm, 2011) and northern France (Madre et al., 2013). The latter,
which surveyed three types of EGRs, found that ants comprised the majority (103) of the
163 hymenopterans sampled. A London study of green roof invertebrate diversity conceded
poor results for ants due to inadequate sampling methods (Kadas, 2006). Closer
investigation into ant populations on EGRs could help gain a better understanding of green
roof ecology.
Little is known about the role of earthworms on EGRs, but a few of the roofs surveyed
revealed worms during substrate sampling (Pliensaufriedhof, Rathaus-PV, and VB Area 1)
(Figure 6.7). They probably arrived in the organic materials of the roof components
(substrate and plants) or through the activities of birds. Since EGR substrates are relatively
shallow and predominantly mineral systems with warm and dry growing conditions, it was
remarkable to encounter these organism, and to consider that they have survived in these
systems (at least generationally, if not individually). On green roofs, earthworms are
believed to be limited to intensive systems (Schrader and Boening, 2006), although a study
of 125 green roofs in southern Germany found that some EGRs with depths of 50 mm
supported earthworms (Mann, 1999a). Considering the chance of an earthworm occurring
in a random soil core, EGRs may support more worms than is thought. Worms are important

238
to soil formation, as they alter the structure and function of decomposer food webs in
natural soils (i.e., populations of fungi, nematodes, and microarthropods like springtails)
(Lorenz and Lal, 2009). Given the importance of earthworms to soil ecology, their presence
on green roofs could have tremendous implications for soil structure, soil formation and
nutrient recycling, and far-reaching effects on the vegetation and on green roof
performance for ecosystem services.
Figure 6.7. A few soil cores uncovered earthworms, such as this core from Rathaus-PV (Q4).
6.4 Conclusions
6.4.1 EGR substrate properties over time: FLL recommendations?
The roofs sampled would have aligned with the FLL recommendations when they were
installed, so how did they line up more than 20 years later? The physical parameters of
MWC and air content at MWC fell within the recommended ranges for most roofs; only the
two “Species-poor Sedum roofs” (Pliensaufriedhof and Köngen) had insufficient air content
and excessive MWC, while two “Sedum meadow” roofs (VB Area 2, Rathausgarage-PV) were
slightly below the minimum recommendation for MWC. If the roofs that diverged from the
recommendations are taken as a minority, then this work can conclude that the physical
characteristics of EGR substrates over time are stable. Without measurements for particle
size distribution, however, this is only speculation.

239
Most of the EGRs surveyed were near or above the limit for soil organic content, and all but
the two youngest EGRs were too acidic, suggesting that the chemical characteristics are not
as stable as the physical properties. With one exception (nitrogen on Pliensaufriedhof), the
nutrients measured were within the recommended concentrations, but low pH probably
inhibits their availability to plants, which could partly explain the vigorous Sedum
dominance on these roofs. Incidental observations of ants and earthworms suggest
biological characteristics of the substrates, thereby implying that soil formation on EGRs is
possible. Although most studies have reported horizons on most vegetated roofs, some with
colouration and textures suggesting humus formation, the substrates sampled did not hold
together as would a topsoil and seemed rather skeletal, with weakly developed profiles, if
any at all.
The studies referred to bring to light the important anthropogenic influence affecting EGR
substrates, even decades or years after installation: just as soil pH may be related to
substrate manufacture, lime amendments or atmospheric deposition, nutrient
concentrations can be attributed to fertilisation by tenants, atmospheric deposition or soil
processes. Without the documentation from Tübingen’s Head Gardener, one might have
been tempted to deduce that the high nutrient concentrations on that roof were due to the
same circumstances leading to the high concentrations on the Karlsruhe roofs. The reverse
might be true, however, as the documentation from Tübingen could equally suggest that
the Karlsruhe roofs were diligently maintained in the early years after installation. So, unless
a roof is known to have been inaccessible and its maintenance regime faithfully
documented, human influence must be considered a lurking variable to all of the results
reported here.
The guidelines developed by the FLL were designed to create a standard for quality in
central Europe. The results from this and other studies suggests that numerous substrate
parameters change over time, in particular increasing Corg and decreasing soil pH. The effect
of these parameters, and of their variation of change over time, together with the possibility
of decreasing substrate depth, undoubtedly have implications for EGR vegetation, and
probably also for performance metrics like stormwater retention and loading. If floristic
diversity and persistent biotic communities were desirable for EGRs, as would be assumed if

240
they are to deliver urban ecosystem services, then these results suggest that those
parameters must be taken into consideration. Promoting the conditions for complete
decomposition of organic material into humus, for example, will obviously benefit the
vegetation but can also facilitate nutrient recycling and create positive feedback
mechanisms that maintain greater floristic diversity. This can be achieved by ensuring the
pH does not become too acidic, and by creating habitat provisions for litter transformers
like ants and worms, such as providing mounds and other forms of refuge from heat or
frost. Of course, long-term monitoring programs are required in order to better understand
the full potential of EGRs as ecosystems and for urban ecology.
6.4.2 Soil ecological processes on EGRs
To a certain degree, pH levels will direct nutrient availability and plant growth but also
decomposition and other processes. Acidic soils may result in incomplete decomposition,
and lead to accumulation of litter. Likewise, if plants growing in slightly acidic soils can
access sufficient nutrients for strong growth, and if their litter is acidic, then this
combination of vigorous plant growth and incomplete decomposition can lead to even more
litter accumulation and continued or sustained acidification. Organic matter decomposition,
as well as nitrogen mineralization, are affected by periods of extreme drought and the
process of drying and rewetting (Denef et al., 2001). When soils become dry they can
become hydrophobic (Handreck and Black, 2010); dried TPG substrates in Berlin did not
absorb heavy downpours of rain because the water ran off as surface flow instead (Darius
and Drepper, 1983). This presents problems of erosion and substrate loss. Intermittent
water shortages were attributed to the enrichment of humus-rich soil components over the
long-term on EGRs in Karlsruhe (Buttschardt, 2001). At the other extreme, perched water
tables and incomplete drainage will also influence soil processes and vegetation. The
dramatic increase in litter accumulation observed on shallow (Getter et al., 2007) and/ or
single-layered EGRs (compared with multiple-layered systems) (Liesecke, 2006) implies that
substrate depth plays an important role to decomposition processes. Thus, it appears that
soil ecological processes and pedogenesis may occur on green roofs, but only very slowly.

241
6.4.2.1 Hypothesis: soil-plant feedback cycles perpetuate acidification, litter
accumulation and other trends.
Vegetation can exert important influences on soil organic content through its effects on the
soil biotic community, on the activities of soil micro-organisms and, accordingly, on litter
decomposition rates (Boettcher and Kalisz, 1991, Saetre, 1998, Wardle, 2002). The
macronutrients on the roofs sampled were in suitable concentrations, but low pH and
incomplete decomposition inhibit their availability to some taxa (Handreck and Black, 2010).
This may partly explain the floristic simplification described for these roofs over time, with
the loss of most herbaceous species and grasses and dominance by Sedums. As stress
tolerators [sensu Grime (1977)], Sedums have lower mineral nutrition requirements than
taxa with other adaptive strategies (Grime, 2001). Indeed, a container study of five species
of Sedum found that moderately to slightly acidic conditions (pH 5.7 to 6.4) yielded the most
productivity, with Sedum spurium producing 95 times more dry weight at pH 6.3 compared
to pH 8.3 (Zheng and Clark, 2013).
When slow-growing, stress-tolerant plants, like Sedums, dominate a site, decomposition
rates are slower and nutrients are bound in complexes of low biological availability (Grime,
2001). Stress-tolerant plants often produce smaller, less photosynthetically active leaves
with a higher content of structural carbohydrates and higher concentrations of secondary
metabolites, like phenolics (Poorter and Bergkotte, 1992). Taken together, these properties
make the leaf litter less favourable as a resource for the microflora and fauna and is
therefore decomposed more slowly (Cornelissen, 1996). The two-way feedbacks between
plants and soil seem to be important drivers of ecosystem properties and processes globally,
though only few studies have explored the mechanisms [e.g., Hunt et al. (1988), Setälä and
Huhta (1991)]. If feedbacks associated with litter influence plant establishment, growth and
community composition (via a range of interacting mechanisms, like changes to light
regimes and microclimate or nutrient immobilization) (Facelli and Pickett, 1991), then the
dominance of Sedums on EGRs may be owing not only to tolerance of stressful rooftop
conditions but perhaps also to competitive exclusion. Given that plants are the ultimate
determinant of how the decomposer subsystem works (Wardle, 2002), it is reasonable to
expect that different ecophysiological attributes and plant strategies are likely to influence

242
the effects of plant species on ecosystem properties. Some soil scientists have suggested
that species effects can be as or more important than abiotic factors (e.g., climate) in
controlling ecosystem fertility (Hobbie, 1992).
6.4.2.2 Hypothesis: EGR substrates may approximate natural soil processes when they
support persistent populations of soil macrofauna
Given the incidental encounters during substrate sampling of ant and earthworms, soil
formation could be possible in EGR substrates since most soil development occurs in the
presence of live organisms (Ugolini and Spaltenstein, 1992). Although these organisms were
only encountered by chance, it is entirely possible that they have far-reaching effects on
these systems. While some EGR studies refer to ants (Kadas, 2006, MacIvor and Lundholm,
2011, Madre et al., 2013), they do not consider the impacts of these taxa on vegetation or
soil ecology. Earthworms have received little attention for EGR substrates, other than
commentary that they would not likely survive there over the long-term (Mann, 1999b,
Mann, 1996, Buttschardt, 2005, Schrader and Boening, 2006). This may be the first work
that has observed earthworms on mature EGRs.
Since earthworms are effective litter transformers (Bardgett, 2005), their presence on EGR
substrates over the long term could presumably alter the soil dynamics away from litter
accumulation towards nutrient recycling, which would have knock-on effects with
acidification, soil-plant feedbacks and any associated dynamics (Wardle, 2002). One study of
250 mm green roof microcosms observed the dramatic decline in biomass by an anecic
earthworm (Lumbricus terrestris) after 28 days, owing to the conditions imparted by
aggregate abrasion and shallow, mineral substrates (Scharenbroch and Johnston, 2011). For
future investigations of earthworm habitat potential in such substrates, the latter authors
suggest testing endogeic species (ibid). Although they were not identified, the presence of
earthworms on the old EGRs sampled indicates that such organisms can persist over time,
given the right conditions.

243
6.4.3 Recommendations
Some approaches for improving conditions for soil processes to occur on EGRs might include
the addition of carbonate to the substrate blends in order to prevent acidification, whether
at the point of installation or integrated into a maintenance regime(e.g., lime amendments
every 5 years). If our hypothesis is true, that Sedum dominance is a response to
acidification, then curtailing Sedum dominance can be accomplished both by maintaining
neutral pH but also by ensuring a diverse seed bank or seed rain to support greater floristic
diversity over time. This could be accomplished by sowing seed as part of a maintenance
regime, perhaps together with lime amendments.
Given the proof that soil fauna can persist on EGRs over time, their contributions to soil
ecological processes can be provided for in various ways. The provision of sufficient depths,
whether across the roof or in mounded areas, can serve as valuable refuge for soil
organisms and litter transformers from sun, wind, extreme temperatures and other hostile
phenomena. Such provision could also benefit the conditions required for decomposition,
nutrient recycling and humus formation. As well, inoculating the substrate with microbes
and fungi, in particular mycorrhizal fungi, can promote the development of this essential
community.
Of course, the monitoring of EGR substrates over time will advance our understanding of
the soil ecological function of these systems, and of the yet-undiscovered potential that
these results hint at. Given the great volumes required for substrate analysis, and the
limitations of certain diagnostic methods (e.g., soil organic content), future work must
develop alternative methods and will ideally arrange for replicated roofs as part of well-
planned experimental design.

244
7 Proposing models for EGR vegetation development over time
The preceding chapters analyzed vegetation and substrate data from a small sample of
some of the oldest extensive green roofs in southwestern Germany. The basic intent was to
describe the biotic attributes, each roof an individual snapshot in time. The trend of species
impoverishment appears to be associated with dominance by stress-tolerant species and
prevalence of ruderals. Some of the key factors that influence EGR vegetation development
include variable growing conditions that select species tolerant of warm temperatures, dry
substrates, full sun, and limited nutrients. The acidification of the substrate, the
accumulation of soil organic content and, potentially, the decrease in substrate depth are
also important factors. Although the dataset was too small to make definite conclusions, a
degree of confidence was gained by the corroborations from other studies and, where
possible, by meta-analyses with other work. The causes, mechanisms and ecological
processes that led to the results observed will be addressed in this chapter, with the broad
goal of synthesizing these results with other works and ascertaining opportunities for
practical application as well as theoretical developments.
7.1 Literature review: the role of models to ecological research
Every map is a simplification of a real landscape; nevertheless, maps are enormously
helpful, and it is hard to imagine how we could get along without them. (Raymo,
1991) (p. 147)
Due to their inherent complexities, ecological systems can only be observed and studied in
the absence of complete information. Models are helpful because they can serve as
simplified yet reasonably accurate representations of reality and because they can capture
patterns in the data of individual variables that may not otherwise be obvious (Starfield and
Bleloch, 1986). Fundamentally, “understanding is the overarching goal of any science,
especially pluralistic and diverse disciplines like ecology, because understanding facilitates
integration between sub-disciplines, divergent scales, causal alternatives, conceptual
difficulties, etc.” (Pickett et al., 1994) (p. 24). By definition, understanding is “an objectively
determined, empirical match between some set of confirmable, observable phenomena in
the natural world and a conceptual construct” (ibid, p. 28). It may also be referred to as “the
degree of match between reality and theory, a match between what scientists observe and
what they think” (ibid).

245
Ecological understanding has three components: observable phenomena, conceptual
constructs, and the tools that relate these while facilitating dialogue. These tools, which
relate the observable phenomena of nature with conceptual constructs, include causal
explanation, generalization, and testing within a specific domain. However, ecological
understanding can only be practical to the real world if it is integrated (i.e., with sub- and
other disciplines) and if the conceptual constructs are updated through empirical
developments. Such ongoing developments, by a diverse community of ecologists, are
essential for such integration to develop. The value of theoretical models depends upon the
extent to which they are able to explain phenomena and generate testable predictions
(Grime and Pierce, 2012). Beyond the efforts of science, “the fruits of understanding can be
applied… to management or policy concerns raised by society” (Pickett et al. 1994) (p. 28,
Fig .2.1). This chapter shall engage in this spirit of inquiry with the basic aim of advancing
ecological understanding to EGR research, design and implementation. A positive outcome
of this goal might be integrating practical measures into green roof system design and
installation, as well as education at the level of management and policy.
Theories and models are conceptual constructs that represent and simplify reality by
showing the relationships between objects, the causal interactions, and the states of the
system (Nagel, 1961, Suppe, 1977). Models are not the entirety of theory; instead theories
can be considered as families of models (Thompson, 1989, Lloyd, 1988). There are different
types of models and accordingly different uses for them. Quantitative models, based on
statistical analysis of data, are useful for approximation and, therefore, for comparative
ecology. Since quantitative models lack fine details, they are not useful for prediction but
they can prompt questions and consideration of consequences. Qualitative models are
descriptive, in the form of a narrative or diagram, and their simplicity has the benefit of
making it easy to add more detail. The drawback of qualitative models, however, is that they
may choose to include convenient rather than sufficient elements and that they may only
represent matters of opinion (McCarthy, 2009). Models can cover an enormous range of
descriptive/ predictive quality.
Organization of research and ideas is just as important as the ideas themselves, and
conceptual frameworks are tools that help evaluate the state of a subject area (Pickett et
al., 2007). Hierarchical structure shall be used in various parts of this chapter, as this can
accommodate both specificity and comprehensiveness within a framework (Cadenasso et

246
al., 2003). The higher levels of a framework are more abstract and therefore more
generalizable, which helps identify the core concepts and processes to be addressed
(Cadenasso et al., 2003). Accordingly, hierarchical structure also permits the disaggregation
of high level, or general, causes into lower level, more specific mechanisms (Foxcroft et al.,
2011).
7.1.1 Application of CSR triangle model for natural succession to EGRs
Previous chapters characterised certain components of EGR vegetation with CSR signatures,
as this granted some insight into their ecological behavior and habitat preferences. The
pressures of stress and disturbance, which are central to the theory (Grime, 1977), are clear
and obvious influences on EGR vegetation. CSR theory is particularly useful for this work
because it can explain trajectories of natural succession. These theories have both been
introduced in previous chapters and will be elaborated upon here with regards to their
applications in this chapter.
7.1.1.1 Successional trajectories using CSR triangle model
Natural habitats bearing environmental conditions similar to those occurring on EGRs and
which have been studied under the lens of natural succession can complement the
discussion on the processes of vegetation change occurring on EGRs. As stress-prone
habitats featuring limited soil depth, highly mineral substrates, and exposure to the
elements, rocky outcrops and dry grassland have served as habitat analogues for EGRs and
as models for describing primary and secondary succession (Usher and Jefferson, 1990,
Gibson and Brown, 1991, Gibson and Brown, 1992, Grime, 2001, Alard et al., 2005). The
difference between primary and secondary succession can be seen as the difference in basic
resource availability or in stress or climatic limitations: primary succession is slow because of
low resource levels, while secondary succession is faster because the sites support more
biological activity as a result of the higher resource levels (del Moral, 2007).
Primary succession on a rock outcrop begins from the initial basis of stress-tolerant
colonizers, such as mosses and lichens, which have low biomass. As implied by the arrow in
Figure 7.1a, after 100 years sufficient biomass and soil has accumulated to facilitate
colonization by C-R strategists like small, slow-growing herbs and shrubs. These strategists
produce more biomass than their predecessors (shown by the size of the circles); if
undisturbed, the community will rest in this position (S/ C-S) for ca. 500 years. In addition to

247
the minimal biomass of the rock outcrop, decomposition rates are also very slow; the
coincident process of soil formation is a key factor driving this successional trajectory
(Grime, 2001).
Figure 7.1. (a) Primary succession in a skeletal habitat such as a rock outcrop; (b) Secondary succession for a site of low fertility, such as unimproved calcareous grassland. Modified from Grime (2001).
Granted, EGRs are dramatically different from rock outcrops and, being planted with
carefully selected species, they are subject to secondary, not primary, succession. Dry
calcareous grassland, such as Xerobrometum, is an EGR analogue habitat that has been
researched and applied in many parts of the world (Kolb et al., 1983, Choi and Dunnett,
2008, Macdonough et al., 2006). Knowledge of the factors and processes occurring on these
semi-natural ecosystems are relevant for EGRs since both communities occur on special soils
of limited profile, with limited plant available nutrients, and the relatively steady floristic
character of both is strongly influenced by human intervention and stress. The intensity and
form of stress that is integral to this ecosystem deflects competitive invasion by
uncharacteristic species (which would lead to species-poor coarse grassland and woody
encroachment) and helps maintain the characteristic species composition and diversity in a
steady state (plagioclimax).
Secondary succession in low nutrient habitats such as dry calcareous grassland develops as a
shallow parabola across CSR space (Figure 7.1b), as the early deficiencies limit plant biomass
and inhibits dominance by competitive species. (The successional parabola for high fertility
sites reaches higher into the competitor corner of the model and features greater biomass.)
After about 100 years, the course of secondary succession begins to deflect towards the
stress-tolerator corner, beginning even when plant biomass is expanding appreciably. This

248
occurs for both high- and low-nutrient sites and reflects a change in rates of resource
capture and loss, particularly mineral nutrients, to one in which resources are efficiently
retained in the biomass (Grime, 2001). This example would apply to EGRs that do not
receive regular subsidies of nutrients.
Beyond the fact that plant ecology research on mature EGRs is rare, it is worth reflecting on
the purpose of a model for EGR vegetation development. In a practical sense and for the
short term, an applicable model can offer guidance to managers, policy-makers and
designers interested in enhancing conditions for supporting biodiversity. As global
biodiversity continues its downward spiral while urbanization and human population
continue to grow, a model for long-term EGR vegetation development can help the EGR
industry and designers to introduce measures that can augment the beneficial outcomes of
their work. For example, integrating green roof installations or system designs with
provisions for floristic diversity and below-ground biota (through policy requirements and
other mechanisms) could maximize green roof potential for ecosystem services over the
long-term, rather than simply maintaining the lowest denominator of engineered function
(e.g., stormwater runoff).
This chapter therefore unites research with theories that are conceptually relevant to the
urban environment and specifically for rooftops. For process-oriented models, succession
theory is an obvious starting point since it examines mechanisms and dynamics over
temporal scales. Although natural succession has been of interest on spontaneously
vegetated gravel/ TPG roofs, other than a few German studies with access to EGRs (Poll,
2008, Schrader and Boening, 2006) this has only been applied to relatively young systems
(<10 years) (Buttschardt, 2001, Dunnett et al., 2008, Rowe et al., 2012, Bates et al., 2013,
Piana and Carlisle, 2014). Classification of EGR vegetation into adaptive strategies with CSR
theory helps to relate EGR systems with the fundamental aspects of ecosystem function.
Species with high S-coordinates, for example, tend to grow slowly even under favorable
conditions, have long-lived leaves unpalatable to generalist herbivores and produce litter
that decomposes very slowly (Grime et al., 1997, Diaz et al., 2004), which is the case of
Sedum species (Stephenson, 1994). By contrast, species with low S-coordinates have the
opposite characteristics (e.g., rapid growth rate, palatable) (Hunt et al., 2004). Such
differences have major impacts upon ecosystem functions relating to nutrient recycling
(Chapin et al., 2002).

249
7.1.2 Research aims and questions
This chapter unites the results from the research (i.e., observable phenomena) with
ecological theories (i.e., conceptual constructs) in order to propose models at various
degrees of detail (i.e., generalizations and practical use). Being the final chapter of the
dissertation, it therefore determines the final conclusions for the various aims and questions
underpinning this work.
Aim: To propose models illustrating vegetation development on EGRs over time.
Question: If successional change can be observed on EGRs, what are the main drivers and mechanisms?
7.1.2.1 Objective of the chapter
The objective of this chapter is to unite the findings from this research with precedent
works and relevant ecological theories into a functioning model that can describe the
mechanisms driving EGR vegetation change over time.
7.2 Methods
With reference to Grime’s (1974, 1977, 2001) theoretical triangular scheme of competitor,
stress-tolerator and ruderal plant strategies (CSR theory), a series of quantitative models
shall locate the vegetation of individual roofs and of EGR vegetation types (as defined by the
cluster analyses of Chapters 3 and 5) within CSR space. A conceptual model shall follow
which proposes the trajectories of EGR vegetation (using adaptive strategies) over time,
using original species lists where available and with reference to patterns from analogue
habitats. These lead to the final model which integrates the general causes, specific
mechanisms and ecological filters into a model of community assembly, specifically adapted
for EGRs.
7.2.1 Methods for the quantitative model (EGR vegetation by CSR signatures)
The same methods and software tool (Hunt et al., 2004) that were used for characterising
EGR grasses into CSR adaptive strategies in Chapter 3 are used here. In other words, each
species was allocated with a CSR signature in order to depict the adaptive strategies
present. The spreadsheet tool includes a list of ca. 1,000 species with their CSR allocations,
which can be matched up with the species lists of the roofs surveyed. The standard
coordinate values for the different signatures within CSR space range from 0 to 1 (Table

250
7.1). In cases where the species identified lack a nomenclatural match from that list, the first
of three options was taken, namely substituting for the name of the species that of a
presumptive CSR type with reference to taxonomic and ecological similarity. The other
options were either not possible [calculating the CSR type by means of literary and
laboratory procedure described by Hodgson et al. (1999)] or undesirable (grouping all
unknowns under the single eliminator ‘unknown’). Other databases (e.g., BiolFlor) were not
used because knowledge of their existence arose too late, and the associated expense was
prohibitive anyway. Although other methods and CSR tools have been developed (Hodgson
et al., 1999, Pierce et al., 2013), this was deemed the best fit at the time of this work. It is
encouraging that improvements to CSR classification methods using the same species in
northern Italy (Pierce et al., 2013) were sufficiently accurate with the original predictions
based on the Integrated Screening Programme from northern England (Grime et al., 2007).
Table 7.1. Standard coordinate values within CSR space (reference from spreadsheet tool).
C S R
C 1.00 0.00 0.00
C/CR 0.75 0.00 0.25
C/CSR 0.67 0.17 0.17
C/SC 0.75 0.25 0.00
CR 0.50 0.00 0.50
CR/CSR 0.42 0.17 0.42
CSR 0.33 0.33 0.33
R 0.00 0.00 1.00
R/CR 0.25 0.00 0.75
R/CSR 0.17 0.17 0.67
R/SR 0.00 0.25 0.75
S 0.00 1.00 0.00
S/CSR 0.17 0.67 0.17
S/SC 0.25 0.75 0.00
S/SR 0.00 0.75 0.25
SC 0.50 0.50 0.00
SC/CSR 0.42 0.42 0.17
SR 0.00 0.50 0.50
SR/CSR 0.17 0.42 0.42
Corners have value 1, opposite sides have value 0, intermediates are equidistant from each parent, and C + S + R = 1

251
The adjusted species list with allocations of CSR signatures (or nearest equivalent) reflects
the proportionate cover of adaptive strategies on the roofs surveyed, and also includes the
relative cover for each species calculated for all the roofs. Proportionate cover by adaptive
strategies for EGR vegetation types or other lists will be given as required in the results
sections that follow. The results therefore embody a range of detail, from species lists per
roof to the proportionate groupings of strategies per EGR vegetation type. The amended
species list is given in the results section.
Of the ninety-five (94) species identified in the roof surveys, nearly half (forty-three, or
45.7%) were listed in the “CSR lookup sheet” of the software tool. Of the species that were
not listed, twenty-seven (28.7%) were confidently matched with the CSR signatures of other
species on the basis of comparable genera, growth habits, and/ or habitat affinities. With
reference to a variety of sources, species from the following genera were matched with
confidence: Agrostis, Allium, Carex, Crepis, Dianthus, Erigeron, Geranium, Hypericum, Linum,
Nepeta, Poa, Sedum, Teucrium, Thymus and Veronica. For example, only four of the ten
Sedum species/ cultivars had allocated CSR signatures (S. acre = S/SR; S. album = S; S.
spurium = S/SR; S. telephium = S/CSR), but most had the same habitat preferences and
growth habits so the unlisted species were designated as S-strategists. Similarly, the single
species of Thymus in the signature list (T. polytrichus) is a S-strategist, and the three species
identified on the roofs bear the characteristics of successful stress tolerators so they were
designated as such.
Twenty-four species (25.5%) were given CSR signatures based on educated guess, in other
words through observation and literature. Most of these (seventeen) were cryptogams,
which were designated as stress-tolerators (S), stress-tolerant ruderals (SR) or ruderals (R)
on the basis of literature (Rogers, 1988) and on observation of their habitats and apparent
strategies (During, 1979). The mosses found uniquely in the drip zone at FH Nürtingen or on
the north-face of the roof at Köngen are pioneer species that occur in dry habitats like the
other mosses, but have additional associations to wet habitats (e.g., Calliergonella
cuspidata), woodland (Eurynchium praelongum), grassland and forested tracks (Polytrichum
juniperinum) (Atherton et al., 2010), so they were designated as R/CSR strategists. The two
Petrorhagia species were classified as stress-tolerant ruderals (SR) based on their ecological
similarity with Saxifraga tridactylites (SR) and because they are stress tolerant but also

252
behave like annuals (e.g., prolific seed production) (Kolb and Schwarz, 1986, Snodgrass and
Snodgrass, 2006).
Once every species was designated a CSR signature, the software tool could calculate the
position for the vegetation entered per sample, and then compare the vegetation of up to
three roofs. The vegetation data from the clustered EGR vegetation types were used for the
comparison. Since they were clustered according to site-specific attributes (species
diversity, dominance, and habitat conditions or EIVs), evaluating the vegetation with CSR
theory can offer further insight into the relations between stress and disturbance on EGRs.
Mean cover proportions of the species surveyed for each roof cluster are thus corrected
proportionally for total cover of 100% and then entered into the “Calculator” sheet of the
spreadsheet tool which converts the floristic data to define a “nearest CSR vegetation type”
for that sample. The output also provides a summary of the proportions of adaptive
strategies per sample and a plot showing the position of the community’s growth form
composition within the triangular ordination of CSR space.
7.3 Results and Discussion
Using the CSR triangle diagram and output tables, the community composition for different
roof samples is shown with resolution of the adaptive strategies defining the vegetation.
Within the diagram, competition implies conflict over resources, stress implies any factors
that place prior restriction on plant production, and disturbance implies factors causing
partial or total destruction of plant biomass that has already been formed (Hunt et al.,
2004).
7.3.1 Quantifying EGR vegetation types by adaptive life strategies (CSR)
The master species list, with total relative proportionate cover for all the roofs surveyed
(Table 7.2) was entered into the software tool first, followed by the EGR vegetation types.
Table 7.2. Master species list with CSR signatures and relative total abundance per species.
Master species list (all roofs) Blank = given in tool; Name = confident match; CSR = educated guess
Total abundance (all roofs) (%)
CSR type entered into tool
Acer campestre L. 0.006 SC
Acer pseudoplatanus L. 0.490 C/SC
Achillea millefolium L. 0.227 CSR
Agrostis stolonifera L. 1.356 CR

253
Agrostis tenuis Sibth. Agrostis canina 0.138 CSR
Allium flavum L. Allium scorodoprasum 0.502 S/CSR
Allium schoenoprasum L. Allium oleraceum 2.027 S/CSR
Arrhenatherum elatius (L.) P. Beav. ex. J. & C. Presl.
0.334 C/CSR
Campanula rotundifolia L. 0.015 S/CSR
Carex flava L. Carex disticha 0.361 C/CSR
Carex humilis Leyss. Carex disticha 0.046 C/CSR
Carpinus betulus L. 0.046 SC
Cerastium arvense L., Sp. Pl. 438 (1753)
0.009 SR/CSR
Convolvulus arvensis L. 0.009 CR
Coronilla varia L. Securigera varia 0.508 C/CSR
Crepis tectorum L. Crepis capillaris 3.425 R/SR
Dactylorhiza fuchsii L. 0.024 SR
Dianthus carthusianorum L. Dianthus deltoides 1.013 S/CSR
Dianthus deltoides L. 0.165 S/CSR
Erigeron annuus (L.) Pers. Erigeron acer 0.021 SR/CSR
Festuca ovina L. 5.743 S
Festuca rubra L. 0.517 CSR
Fragaria vesca L. 0.080 S/CSR
Geranium spp. Geranium robertianum 0.077 R/CSR
Geum urbanum L. 0.040 CR/CSR
Hieracium pilosella L. 3.288 S/CSR
Hypericum perfoliatum sensu Hayek pro parte, non L.
Hypericum perforatum 0.129 CR/CSR
Hypericum perforatum L. 0.422 CR/CSR
Lichen_Cladonia furcata (Huds.) Schrader
S 0.670 S
Lichen_Cladonia cf scabriscula (Huds.) Schrader
S 0.539 S
Lichen_Peltigera spp. S 0.110 S
Linum perenne L. Linum catharticum 1.494 SR
Lotus corniculatus L. 0.441 S/CSR
Medicago lupulina L. 0.113 R/CSR
Moss_Hypnum1 S 1.059 S
Moss_Hypnum2 S 0.796 S
Moss_Dicranum scoparium Hedw. sr 0.098 SR
Moss_Eurhynchium praelongum (Hedw.) B., S. & F (stokesii)
r/csr 0.334 R/CSR
Moss_Scleropodium purum (Hedw.) M. Fleisch
sr 0.722 SR

254
Moss_Brachythecium rutabulum (Hedw.) Schimp.
sr 0.012 SR
Moss_Bryum1 sr 0.306 SR
Moss_Brachythecium cf. albicans1 (Hedw.) Schimp
sr 0.294 SR
Moss_Philonotis fontana (Hedw.) Brid. sr 0.239 SR
Moss_Polytrichum juniperinum Hedw. r/csr 0.135 R/CSR
Moss_Racomitrium elongatum Ehrh. ex Frisvoll
sr 1.053 SR
Moss_Brachythecium cf. albicans2 (Hedw.) Schimp
sr 0.214 SR
Moss_Brachythecium cf. albicans3 (Hedw.) Schimp
sr 0.205 SR
Moss_Bryum2 sr 1.172 SR
Moss_Calliergonella cuspidata (Hedw.) Loeske
r/csr 0.680 R/CSR
Moss_Ceratodon purpureus (Hedw.) Brid.
sr 0.490 SR
Moss_Starry yellow sr 0.306 SR
Nepeta mussinii Sprengel ex Henckel Nepeta cataria 0.150 C/CSR
Petrorhagia prolifera (L.) Ball & Heywood
SR 0.092 SR
Petrorhagia saxifraga (L.) Link. SR 0.582 SR
Picris hieracioides L. 0.061 R/CSR
Pinus sylvestris L. sc 0.009 SC
Poa angustifolia L. 0.024 SC/CSR
Poa compressa L. 2.452 SR/CSR
Poa pratensis L. 0.156 CSR
Potentilla argentea L. 0.021 S/CSR
Potentilla erecta (L.) Räuschel 0.119 S/CSR
Potentilla tabernaemontani Ascherson 0.970 S
Potentilla recta L. 0.300 C/CSR
Sedum acre L. 0.003 S/SR
Sedum album L. 0.070 S
Sedum album "Coral Carpet" Sedum album 0.918 S
Sedum album "Murale" Sedum album 1.956 S
Sedum kamtschaticum "Weihenstephaner Gold"
s 5.345 S
Sedum hybridum L. s 17.688 S
Sedum rupestre L. s 8.063 S
Sedum sexangulare L. s 7.889 S
Sedum spurium Bieb. 5.682 S/SR
Sedum telephium L. 0.018 S/CSR

255
Sempervivum tectorum L. 0.003 S
Setaria viridis (L.) P.B r 5.180 R
Solidago canadensis L. 0.012 C
Taraxacum officinale Weber 0.291 R/CSR
Teucrium chamaedrys L. Teucrium scorodonia 0.070 S/CSR
Thymus praecox Opiz s 1.941 S
Thymus pulegioides L. s 0.049 S
Thymus serpyllum L. s 3.187 S
Trifolium arvense L. 0.542 R/SR
Trifolium campestre Schreber 0.199 R/SR
Trifolium dubium Sibth. 0.046 R/SR
Trifolium pratense L. 0.055 CSR
Verbascum nigrum L. 0.006 C/CSR
Verbascum thapsus L. 0.003 SR/CSR
Veronica spicata L. Veronica arvensis 0.471 SC
Vicia hirsuta (L.) S.F. Gray 1.194 R/CR
Vicia sepium L. 0.037 C/CSR
Vulpia myuros L. C.C. Gmel. 1.531 R/SR
On a whole, the master species list for all the roofs surveyed classified as S/SR vegetation
(Figure 7.2). Seventeen types of adaptive strategies were present overall, with C-strategists
a minority (0.05) relative to the other strategies, of which S-strategists dominated (0.74) and
R-strategists had the remaining representative cover (0.21) (Table 7.3). According to the CSR
model, the S-corner of the triangle diagram is typified by conditions of high stress and low
disturbance (Grime, 1977). Climatic conditions were not monitored but earlier chapters
have discussed and shown how widely it is known and accepted that EGRs are stressful
environments for most forms of life. The slight pull towards the R-corner can be explained
by the substrate results, as all the roofs (except one) had optimal mineral nutrient
concentrations (N, P, K, Mg). Although this implies low disturbance in the context of CSR
theory, the ruderal component on these roofs is not as strong as one might expect, probably
because all (except the two youngest roofs) were slightly to strongly acidic. The consequent
inhibition of nutrient availability, combined with the physical effects of the stressful roof
environment, explains why the species list for all the roofs taken together classified as S/SR.

256
Figure 7.2. The master species list (from all roofs) in relative proportionate cover, classifies as a S/ SR community.
The results from this tool therefore make it clear that the vegetation of the EGRs surveyed is
dominated by stress-tolerators, but that other adaptive strategists occur as well. By plotting
the proportionate representation of each species’ adaptive strategy, the tool illustrates the
type of vegetation present on these EGRs after 20-30 years, while also elucidating the
environmental conditions that direct vegetation composition. The sections that follow shall
examine the vegetation of these roofs more closely, using the same CSR tool, starting with
the five major EGR vegetation types (also Table 7.3). Similar to the output from the master
species list, the EGR vegetation types (defined by the clustered roofs) are all located
towards the S corner of the CSR triangle (Figure 7.3).
Table 7.3. Results for CSR proportions for the five EGR vegetation types, including master species list.
EGR vegetation types Nearest type
# types
C S R
Master species (all species, all roofs) S/SR 17 0.05 0.74 0.21
“Species-poor Sedum roof” S 11 0.04 0.88 0.08
“Sparse Sedum meadow” S/SR 15 0.03 0.73 0.24
“Sedum with Chives” S/SR 11 0.04 0.85 0.11
“Pitched Sedum meadow” S/SR 10 0.03 0.74 0.23
“Floristically-diverse Sedum meadow” S/CSR 15 0.11 0.58 0.31

257
Figure 7.3. The clustered EGR vegetation types within CSR space.
The three EGR vegetation types described as different “Sedum meadow” roofs all classified
as S/SR vegetation and positioned closely together in CSR space (overlapping circles and
triangle icon). The triangle icon in this group represents the “Pitched Sedum meadow” of
Killesberg roof. Although that roof stood alone in the cluster analysis, with respect to
functional type composition it is nearly identically to the “Sparse Sedum meadow” and
“Sparse Sedum meadow with Chives” (overlapping circles). These roofs all remain very low
on the R-S axis, indicating that C-strategists had little influence. The “Species-poor Sedum
roof” (square icon), located closest to the S-corner, is defined as pure S-community. The two
roofs defining this vegetation type (Pliensaufriedhof and Köngen) had the fewest species of
all the roofs surveyed, and their simple and homogeneous vegetation was dominated by
only a few Sedum species. The “Floristically-diverse Sedum meadow” cluster (FH Nürtingen
and Rathaus lower) classified uniquely as S/CSR, and is located slightly further from the S-
corner towards the central CSR part of the triangle diagram (black circle icon).
7.3.1.1 S-vegetation
Stress can be defined as “the external constraints which limit the rate of dry matter
production of all or part of the vegetation” (Grime, 2001) (p. 48), and the most frequent
constraints on plant growth are related to shortages and excesses of solar energy, water,
and mineral nutrients. Plant-induced stress can also arise, such as the shading and resource

258
depletion that result from the accumulation of plant biomass, or through growth inhibitors
secreted into the soil or produced by microbial decay (ibid). The severity of stress often
varies from one growing season to the next, but is usually sufficient to restrict annual
production to well below that achieved in habitats dominated by ruderals or competitive-
ruderals (ibid, p. 124). Severe stress can occur in various types of habitat, such as arctic and
alpine habitats, arid habitats, shaded habitats, nutrient-deficient habitats and urban
habitats.
The general features of stress-tolerance employed by vascular plants exploiting various
types of chronically-unproductive habitats include a range of adaptations that serve for
endurance in unfavourable conditions (Grime, 2001). Some of these features are obvious in
the Sedums used on green roofs, such as the long functional life of individual shoots and
roots, and comparatively slow growth rate (Stephenson, 1994). Defense from physical
damage is also important for plants of reduced stature and slow growth rates, so many S-
strategists deter herbivory and palatability using physical mechanisms (e.g., hard or leathery
texture, needle-like leaves) (Coley, 1983, Reader and Southwood, 1981) or allelopathic
mechanisms (phytotoxic compounds) (Muller and Muller, 1956, Peng et al., 2004).
Associated with low palatability, decomposition of litter from stress-tolerators is quite slow.
This is true for particularly slow-growing evergreens of unproductive vegetation
(Cornelissen et al., 1999, Cornelissen, 1996), and explains the deep accumulation of litter
under many slow-growing woody species (e.g., Calluna vulgaris, Fagus sylvatica,
Rhododendron ponticum, Quercus petrea) (Kubiena, 1953). This could also explain the high
soil organic content on old EGRs (Buttschardt, 2001, Jauch and Fischer, 2000, Liesecke,
2006, Schrader and Boening, 2006).
7.3.1.2 S/SR vegetation
Species classified as stress-tolerant ruderals occur in habitats where moderate intensities of
stress and disturbance coincide; the distinguishing point is that stress conditions are
experienced during the period of growth rather than dormancy or other points in the life
cycle (Grime, 2001). When climatic factors like low temperature and low rainfall inhibit plant
productivity, they may be considered forms of stress but if the same factors disrupt plant
growth and occur regularly, they can be considered an agent of disturbance (ibid, p. 81).
Specifically, when climatic conditions encourage establishment but periodically become
severe and interrupt plant growth, and neither competitors nor stress-tolerators can gain

259
secure advantage then natural selection will favour fast-growing ephemerals. Ruderals are
defined by their rapid life-cycles as a response to stress (Grime, 2001). Among the stress-
tolerant ruderals, the two most strongly represented growth forms include bryophytes and
small herbs, the latter consisting of small annuals and short-lived perennials as well as small
geophytes (ibid, p. 125). Such species were indeed present within the vegetation of the
roofs classified as S/SR vegetation, in combination with the dominant Sedum cover. The
species lists for these vegetation types, with proportionate cover, and output from the CSR
spreadsheet tool are given in the tables that follow.
Table 7.4 “Sparse Sedum meadow”: species list with CSR signatures, proportionate cover and output from CSR calculator.
"Sparse Sedum meadow" (S/SR)
CSR signature
Abundance (mean %)
Total abundance
Proportionate cover (%) Tübingen
Rathaus-PV
Acer campestre L. SC 2 2 0.022
Acer pseudoplatanus L. C/SC 1 1 0.011
Allium flavum L. S/CSR 90 90 1.012
Arrhenatherum elatius (L.) P. Beav. ex. J. & C. Presl. C/CSR 16 16 0.180
Crepis tectorum L. R/SR 0 520 520 5.849
Dianthus carthusianorum L. S/CSR 0 48 48 0.540
Dianthus deltoides L. S/CSR 10 18 28 0.315
Festuca ovina L. S 57 129 186 2.092
Festuca rubra L. CSR 21 0 21 0.236
Fragaria vesca L. S/CSR 26 0 26 0.292
Hieracium pilosella L. S/CSR 6 87 93 1.046
Hypericum perforatum L. CR/CSR 5 0 5 0.056
Lichen_Cladonia cf scabriscula (Huds.) Schrader S 107 107 1.204
Lichen_Peltigera spp. S 10 10 0.112
Linum perenne L. SR 307 307 3.453
Moss_Hypnum1 S 0 163 163 1.834
Moss_Bryum2 SR 0 148 148 1.665
Moss_Starry yellow SR 0 40 40 0.450
Nepeta mussinii Sprengel ex Henckel C/CSR 0 49 49 0.551
Petrorhagia saxifraga R/CSR 84 0 84 0.945

260
Picris hieracioides L. R/CSR 3 3 0.034
Poa compressa L. SR/CSR 0 9 9 0.101
Poa pratensis L. CSR 18 18 0.202
Poa angustifolia L. SC/CSR 1 1 0.011
Potentilla erecta (L.) Räuschel S/CSR 0 39 39 0.439
Potentilla tabernaemontani Ascherson S 0 122 122 1.372
Sedum album "Coral Carpet" S 17 17 0.191
Sedum kamtschaticum "Weihenstephaner Gold" S 543 543 6.108
Sedum hybridum L. S 1204 474 1678 18.875
Sedum rupestre L. S 35 1191 1226 13.791
Sedum sexangulare L. S 612 342 954 10.731
Sedum spurium Bieb. S/SR 410 0 410 4.612
Sedum telephium L. S/CSR 0 4 4 0.045
Setaria viridis (L.) P.B R 0 851 851 9.573
Taraxacum officinale Weber R/CSR 0 21 21 0.236
Thymus praecox Opiz S 550 0 550 6.187
Thymus serpyllum L. S 0 50 50 0.562
Trifolium campestre Schreber R/SR 0 51 51 0.574
Trifolium pratense L. CSR 5 5 0.056
Veronica spicata L. SC 0 39 39 0.439
Vicia hirsuta (L.) S.F. Gray R/CR 355 0 355 3.993
Nearest type # types
C S R
S/SR 15 0.028 0.732 0.24
Table 7.4. “Sparse Sedum meadow with Chives” (VB A1, A2): species list with CSR signatures, proportionate cover and output from CSR calculator.
"Sparse Sedum with Chives" (S/SR)
CSR signature
Abundance (mean %) Total Proportionate
VB A1 VB A2 abundance cover (%)
Achillea millefolium L. CSR 25 39 64 1.082
Agrostis tenuis Sibth. SR/CSR 24 21 45 0.761
Allium schoenoprasum L. S/CSR 65 597 662 11.196
Crepis tectorum L. R/SR 4 86 90 1.522
Erigeron annuus (L.) SR/CSR 7 0 7 0.118

261
Festuca ovina L. S 1 12 13 0.220
Hypericum perforatum L. CR/CSR 0 30 30 0.507
Lichen_Cladonia furcata (Huds.) Schrader S 2 196 198 3.349
Moss_Hypnum2 S 80 180 260 4.397
Moss_Scleropodium purum (Hedw.) M. Fleisch SR 236 0 236 3.991
Moss_Brachythecium rutabulum (Hedw.) Schimp. SR 4 0 4 0.068
Moss_Brachythecium cf. albicans1 (Hedw.) Schimp SR 0 70 70 1.184
Petrorhagia saxifraga (L.) Link. R/CSR 1 105 106 1.793
Poa angustifolia L. SC/CSR 0 8 8 0.135
Poa compressa L. SR/CSR 0 86 86 1.454
Potentilla recta L. C/CSR 3 59 62 1.049
Sedum album L. S 16 7 23 0.389
Sedum kamtschaticum "Weihenstephaner Gold" S 0 7 7 0.118
Sedum hybridum L. S 994 1050 2044 34.568
Sedum sexangulare L. S 333 174 507 8.574
Sedum spurium Bieb. S/SR 570 33 603 10.198
Sedum telephium L. S/CSR 0 2 2 0.034
Sempervivum tectorum L. S 1 0 1 0.017
Taraxacum officinale Weber R/CSR 9 1 10 0.169
Thymus serpyllum L. S 597 164 761 12.870
Trifolium arvense L. R/SR 5 0 5 0.085
Trifolium campestre Schreber R/SR 9 0 9 0.152
Nearest type
# types
C S R
S/SR 11 0.039 0.847 0.114

262
Table 7.5. “Pitched Sedum meadow” (Killesberg): species list with CSR signatures, proportionate cover and output from CSR calculator.
"Pitched Sedum meadow" CSR signature
Abundance (mean %)
Proportionate
(S/SR) (Killesberg) cover (%)
Acer pseudoplatanus L. C/SC 146 3.680
Carpinus betulus L. SC 15 0.378
Cerastium arvense L., Sp. Pl. 438 (1753) SR/CSR 3 0.076
Dianthus deltoides L. S/CSR 7 0.176
Festuca ovina L. S 676 17.041
Lichen_Cladonia cf scabriscula (Huds.) Schrader S 9 0.227
Lichen_Peltigera spp. S 22 0.555
Linum perenne L. SR 13 0.328
Moss_Calliergonella cuspidata (Hedw.) Loeske CSR 67 1.689
Moss_Ceratodon purpureus (Hedw.) Brid. SR 160 4.033
Moss_Starry yellow SR 60 1.512
Opposite leaved herb CSR 27 0.681
Potentilla argentea L. S/CSR 7 0.176
Sedum album "Coral Carpet" S 283 7.134
Sedum album "Murale" S 639 16.108
Sedum rupestre L. S 529 13.335
Sedum sexangulare L. S 427 10.764
Setaria viridis (L.) P.B R 246 6.201
Taraxacum officinale Weber R/CSR 5 0.126
Thymus pulegioides L. S 16 0.403
Trifolium arvense L. R/SR 153 3.857
Veronica spicata L. SC 10 0.252
Vulpia myuros L. C.C. Gmel. R/SR 447 11.268
# types C S R
10 0.040 0.746 0.214
7.3.1.3 S/CSR vegetation
The “Floristically-diverse Sedum meadow” vegetation type (FH Nürtingen and Rathaus
lower) classified uniquely from the other roofs as S/CSR. Physically, the roofs of this cluster
had the most protection of all the roofs surveyed, granted by adjoining walls and roofs, as
well as mounds (which were not sampled) that supported higher statured plants and the
associated seed rain. As such, the vegetation included the typical stress tolerators and

263
stress-tolerant ruderals in the open roof expanses and along the xeric edges, while patches
of more competitive perennials thrived in areas with some protection. Overall, the
proportion of competitive species was 0.115, while ruderals had 0.303 and stress-tolerators
had 0.582 cover (Table 7.7). Species classified as stress-tolerant competitors are associated
with vegetation types that exhibit moderate productivity and experience very low
intensities of disturbance, and are usually typified by herbaceous and woody plants (Grime,
2001). Some of the S/CSR species identified on these roofs include Allium flavum,
Campanula rotundifolia, Dianthus spp., Lotus corniculatus. A number of competitive CSR
species (C/CSR) were identified that did not occur on other roofs, like Arrhenatherum
elatius, Carex spp., Potentilla recta, and Verbascum nigrum. This strategy is described as
being proportionately composed of 0.1667 each C- and R-strategists and 0.667 S-strategists
(Hunt et al., 2004).
Table 7.6. “Floristically-diverse Sedum meadow” (FH Nürtingen, Rathaus-low): species list with CSR signatures, proportionate cover and output from CSR calculator.
"Floristically-diverse Sedum meadow" (S/CSR)
CSR signature
Abundance (mean %) Total Proportionate
FH Nürtingen
Rathaus-low abundance cover (%)
Acer pseudoplatanus L. C/SC 12 1 13 0.1486
Agrostis stolonifera L. CR 443 0 443 5.0652
Allium flavum L. S/CSR 0 74 74 0.8461
Arrhenatherum elatius (L.) P. Beav. ex. J. & C. Presl. C/CSR 93 0 93 1.0633
Campanula rotundifolia L. S/CSR 5 0 5 0.0572
Carex flava L. C/CSR 118 0 118 1.3492
Carex humilis Leyss. SC 15 0 15 0.1715
Crepis tectorum L. R/SR 0 509 509 5.8198
Dactylorhiza fuchsii L. SR 8 0 8 0.0915
Dianthus carthusianorum L. S/CSR 0 283 283 3.2358
Dianthus deltoides L. S/CSR 19 0 19 0.2172
Festuca ovina L. S 175 116 291 3.3272
Festuca rubra L. CSR 148 0 148 1.6922
Geum urbanum L. CR/CSR 11 0 11 0.1258
Hieracium pilosella L. S/CSR 771 210 981 11.2166
Hypericum perfoliatum sensu Hayek pro parte CR/CSR 103 0 103 1.1777
Lichen_Cladonia furcata (Huds.) Schrader S 21 0 21 0.2401

264
Lichen_Cladonia cf scabriscula (Huds.) Schrader S 45 15 60 0.6860
Lichen_Peltigera spp. R 0 4 4 0.0457
Linum perenne L. SR 0 168 168 1.9209
Lotus corniculatus L. S/CSR 144 0 144 1.6465
Medicago lupulina L. R/CSR 37 0 37 0.4231
Moss_Hypnum1 S 0 183 183 2.0924
Moss_Dicranum scoparium Hedw. SR 32 0 32 0.3659
Moss_Eurhynchium praelongum (Hedw.) B., S. & F (stokesii) R/CSR 109 0 109 1.2463
Moss_Bryum1 SR 0 100 100 1.1434
Moss_Brachythecium cf. albicans1 (Hedw.) Schimp SR 0 96 96 1.0976
Moss_Philonotis fontana (Hedw.) Brid. SR 78 0 78 0.8918
Moss_Polytrichum juniperinum Hedw. R/CSR 44 0 44 0.5031
Moss_Racomitrium elongatum Ehrh. ex Frisvoll SR 344 0 344 3.9332
Moss_Brachythecium cf. albicans3 (Hedw.) Schimp SR 0 67 67 0.7661
Moss_Bryum2 SR 0 235 235 2.6869
Other small tree R/CSR 5 0 5 0.0572
Petrorhagia prolifera (L.) Ball & Heywood R/CSR 0 30 30 0.3430
Picris hieracioides L. R/CSR 0 17 17 0.1944
Poa compressa L. SR/CSR 664 42 706 8.0723
Potentilla tabernaemontani Ascherson S 28 167 195 2.2296
Potentilla recta L. C/CSR 0 36 36 0.4116
Sedum acre L. S/SR 0 1 1 0.0114
Sedum hybridum L. S 0 280 280 3.2015
Sedum rupestre L. S 0 879 879 10.0503
Sedum sexangulare L. S 546 143 689 7.8779
Setaria viridis (L.) P.B R 0 595 595 6.8031
Solidago canadensis L. C 4 0 4 0.0457
Taraxacum officinale Weber R/CSR 13 18 31 0.3544
Thymus serpyllum L. S 34 196 230 2.6298

265
Trifolium arvense L. R/SR 19 0 19 0.2172
Trifolium campestre Schreber R/SR 0 5 5 0.0572
Trifolium dubium Sibth. R/SR 15 0 15 0.1715
Trifolium pratense L. CSR 13 0 13 0.1486
Verbascum nigrum L. C/CSR 0 2 2 0.0229
Veronica spicata L. SC 0 105 105 1.2005
Vulpia myuros L. C.C. Gmel. R/SR 0 53 53 0.6060
Nearest type # types
C S R
S/CSR 15 0.115 0.582 0.303
7.3.2 Comparing EGR vegetation types by adaptive strategies
The second part of the spreadsheet tool (Hunt et al., 2004) compares the vegetation of up
to three sites and calculates the proportionate difference in adaptive strategies between
sites. This works very well here, since three major distinctions were identified by the cluster
analysis: i) “Pitched Sedum meadow” (Killesberg); ii) “Species-poor Sedum roof” (Pliensau
and Köngen); and iii) “Sedum meadows” (with three sub-divided clusters of two roofs each).
Entering the results of the proportionate rankings for C, S, and R strategies present in each
vegetation type into this part of the software tool reveals that the greatest dissimilarity
between the vegetation types occurs between Species-poor Sedum roofs and the Sedum
meadows (Table 7.8).
Table 7.7. Comparator tool output for three EGR vegetation types by CSR proportionate cover.
3 main EGR vegetation types C S R
“Pitched Sedum meadow” 0.034 0.741 0.225
“Species-poor Sedum roofs” 0.036 0.884 0.080
“Sedum meadows” (3 types) 0.063 0.710 0.227
Measure between: Difference Distance
“Pitched Sedum meadow” C 0.002
and S 0.143 0.1663
“Species-poor Sedum roofs” R -0.145
“Species-poor Sedum roofs” C 0.027
and S -0.174 0.1873
“Sedum meadows” (3 types) R 0.147
“Pitched Sedum meadow” C 0.029
and S -0.031 0.0344
“Sedum meadows” (3 types) R 0.002

266
All three EGR vegetation types had negligible cover by C-strategists (0.034; 0.036; 0.063,
respectively). The “Species-poor Sedum roof” had the greatest proportionate
representation by S-strategists (0.884) and the lowest by R-strategists (0.080), probably
because the two roofs in this cluster had the smallest species lists, of which the majority
were Sedums. Few R-strategists were identified on that roof; the dense Sedum cover and
lack of bare substrate clearly prevented opportunities for colonization. The other two
vegetation types (“Pitched Sedum meadow” and “Sedum meadows”) had similar
proportions of S-strategists (0.741; 0.710, resp.) and R-strategists (0.225; 0.227, resp.).
These roofs supported more diverse vegetation than the “Species-poor Sedum roofs”, likely
the result of gradients like microclimates issued by shade and shelter, as well as patches of
bare substrate that supported small-statured ruderal species. The triangle diagram
illustrating these results (Figure 7.4) shows that the roofs clustered as “Species-poor Sedum
roof” occur close to the S-corner while the other two clusters defined as different sorts of
“Sedum meadow” are a bit further from the S-corner in the direction of the R-corner. All
three are located extremely low on the S-R axis.
Figure 7.4. Comparative results of CSR classification for three roof types: Species-poor Sedum roof (S); Sedum meadows (S/SR); and Pitched Sedum roof (S/SR).
7.3.2.1 Discussion: EGR vegetation types in CSR space
This analysis confirms the observation that EGR vegetation largely comprises stress-
tolerators (S) and stress-tolerating ruderals (SR), and reinforces other analyses from

267
previous chapters that site-specific features (slope, aspect) and micro-climate (shade)
permit a diversification of plant life strategies. Viewed from another perspective, the
provision of gradients and a diversity of niches can shift EGR vegetation from “Species-poor
Sedum roofs” in the S-corner to support a more diverse flora. This is hardly a new insight:
ecology-oriented EGR research has consistently advocated the inclusion of topographic
variation and heterogeneous substrates as essential for biodiversity (Mann, 1996, Mann,
1999, Buttschardt, 2001, Brenneisen, 2009, Kadas, 2011).
Another explanation for the strong S/SR classification of these old EGRs may reflect the
properties of their growing substrates. The soil cores collected tended to be loosely bound
aggregates whose particle cohesion was often similar to that of recently installed substrates,
which makes them skeletal by definition (IUSS and WRB, 2014). Some ecological studies of
green roofs have observed minimal horizon formation on mineral-based roof substrates
(whether gravel, TPG or EGR roofs) decades to a century after installation (Darius and
Drepper, 1983, Bossler and Suszka, 1988, Bornkamm, 1961, Köhler and Poll, 2010, Poll,
2008, Thommen, 1988). The skeletal nature of shallow rooftop substrates will affect any soil
ecological processes with likely feedbacks with the vegetation. Indeed, many of the
analogue habitats from which species were selected and then screened for green roofs are
defined by free-draining, low nutrient soils (recall Chapter 1).
7.3.3 Quantifying EGR vegetation change over time
Successional trajectories showing how vegetation has changed over time can be
accomplished using original species lists and the CSR triangle diagram. A few roofs surveyed
had original species lists available, although the proportions were not given. Still, with
reference to the few lists available, and to practical experience designing and installing
green roofs, we can be confident that EGRs are typically planted/ sown with a variety of
strategists and growth forms, including a substantial proportion of stress-tolerating
succulent species.
The architectural section plans for the Stuttgart Rathausgarage roof complex (PV and lower
roof) provides a species list of which many were identified in the 2011 surveys. The original
species list for the extensive areas of these two roofs featured thirty-five species of which
eleven were pure S-strategists, fourteen were S-intermediary strategists, and ten were
intermediary strategists that did not include S-strategists (Table 7.9). Since proportions

268
were not available, this classification is based on an equally proportioned species list, which
is probably not realistic, but serves the purpose of illustration. According to the spreadsheet
tool, the original Rathausgarage species list classified as S/CSR vegetation (Figure 7.5).
Table 7.8. Original species list for Stuttgart Rathausgarage roof complex (35 species, 12 CSR types)
Species/ cultivar CSR signature
Species/ cultivar CSR signature
Agrostis tenuis CR Saxifraga aizoon
S/CSR
Dianthus deltoides S/CSR Sedum acre S/SR
Digitaria sanguinalis SR Sedum album S
Festuca mairei CSR Sedum album Coral Carpet S
Festuca ovina
S Sedum album Murale S
Hieracium pilosella S/CSR Sedum floriferum "W. Gold" S
Inula hirta SR/CSR Sedum hybridum S
Linum perenne SR Sedum reflexum S
Nepeta musinii C/CSR Sedum sexangulare S
Onobrychis sativa CSR Sedum spurium
S/SR
Plantago major R/CSR Sedum telephium S/CSR
Poa compressa Reubens SR/CSR Setaria viridis R
Poa nemoralis Enh. SR/CSR Silene uniflora "Weisskehlchen"
CSR
Polygonum aviculare R Thymus pulegioides S
Potentilla argentea S/CSR Thymus serpyllum S
Potentilla verna S Trifolium arvense R/SR
Rumex acetosella SR/CSR Veronica spicata SR
Saponaria ocymoides C/CR
Nearest type
# types C S R
S/CSR 12 0.131 0.588 0.281

269
Figure 7.5. The original species list for Stuttgart Rathausgarage roofs classified as S/ CSR vegetation.
The two EGRs on this complex were apparently installed within days of each other and used
the same materials, specifications and methods. Yet, on the basis of the 2011 surveys, the
vegetation on each roof developed somewhat differently. The lower roof, which recorded
thirty species, was classified as a “Floristically-diverse Sedum meadow” (together with FH
Nürtingen), while Rathaus PV recorded twenty-six species and was clustered with Tübingen
as “Sparse Sedum meadow”. Both roofs classified as S/SR vegetation (Table 7.10). Common
to both roofs were Linum perenne (SR) and Poa compressa (SR/CSR). The majority of the
pure S-strategists (four on PV; six on lower) were Sedum species but included other typical
EGR species, too, like Festuca ovina, Potentilla neumanniana and Thymus serpyllum. The
lower roof had eight pure R-strategists, of which seven were xeric bryophytes and one,
Setaria viridis, was common to both roofs. This marks the divergence in vegetation
character of the two roofs, as the more exposed PV roof had more S-strategists while the
sheltered lower roof had more R-strategists. The roofs shall henceforth be described
separately.
Table 7.9. Adaptive strategy proportions on the two Rathaus roofs after 21 years
Rathausgarage roofs C S R Nearest type
Original list (1990) 0.131 0.581 0.288 S/ CSR
Rathaus PV (2011) 0.011 0.657 0.332 S/SR
Rathaus lower (2011) 0.041 0.632 0.327 S/SR

270
The “Sparse Sedum meadow” on Rathaus PV was defined by S-strategists (seven species)
followed by stress-tolerant ruderals (SR) as the next most abundant strategy (six species)
(Table 7.11), of which the majority were bryophytes but also included two forbs that make a
strong impression throughout summer, Linum perenne and Veronica spicata. The next most
abundant grouping was S/CSR, of which the five species included typical EGR species like
Allium flavum, Dianthus carthusianorum, D. deltoides, Hieracium pillosella and also
Potentilla erecta. The two R/ CSR species included Picris hieracioides and Taraxacum
officinale, both wind-dispersed weedy species. Finally, the two pure ruderals (R) on this roof
comprised a xeric moss and the annual grass, Setaria viridis.
Table 7.10. The species composition for Rathaus PV in 2011 comprised seven CSR strategies.
Rathaus PV species list (S/SR) Total abundance (%)
Proportionate abundance (%) CSR strategy
Allium flavum L. 90 1.85 S/CSR
Crepis tectorum L. 520 10.69 R/SR
Dianthus carthusianorum L. 48 0.99 S/CSR
Dianthus deltoides L. 18 0.37 S/CSR
Festuca ovina L. 129 2.65 S
Hieracium pilosella L. 87 1.79 S/CSR
Lichen_Cladonia cf scabriscula (Huds.) Schrader 107 2.20 S
Lichen_Peltigera spp. 10 0.21 S
Linum perenne L. 307 6.31 SR
Moss_Hypnum1 163 3.35 S
Moss_Bryum2 148 3.04 SR
Moss_Starry yellow 40 0.82 SR
Picris hieracioides L. 3 0.06 R/CSR
Poa compressa L. 9 0.19 SR/CSR
Potentilla erecta (L.) Räuschel 39 0.80 S/CSR
Potentilla tabernaemontani Ascherson 122 2.51 S
Sedum hybridum L. 474 9.75 S
Sedum rupestre L. 1191 24.49 S
Sedum sexangulare L. 342 7.03 S
Sedum telephium L. 4 0.08 S/CSR
Setaria viridis (L.) P.B 851 17.50 R
Taraxacum officinale Weber 21 0.43 R/CSR
Thymus serpyllum L. 50 1.03 S
Trifolium campestre Schreber 51 1.05 R/SR
Veronica spicata L. 39 0.80 SR
# types C S R
7 0.011 0.657 0.332

271
Although the vegetation of the Rathaus lower roof classified identically (S/SR) with its
neighbour, the thirty species of this “Floristically-diverse Sedum meadow” encompassed
four more adaptive strategies (Table 7.12). Following the dominant strategists as described
above, Rathaus lower roof had three of the same R/CSR strategists (Petrorhagia prolifera,
Picris hieracioides, Taraxacum officinale), two of the same R/SR species (Crepis tectorum,
Trifolium campestre), as well as a third ruderal stress-tolerator (Vulpia myuros). Unlike PV,
the lower roof had a number of C-intermediary strategists, likely owing to the more
sheltered conditions here. The single C/SC strategist was an Acer seedling, and the two
C/CSR strategists were Potentilla recta and Verbascum nigrum.
Table 7.11. The thirty species recorded at Rathaus lower roof (2011) comprises eleven life strategies.
Rathaus lower roof species list (S/SR)
Total abundance (%)
Proportionate abundance (%) CSR strategy
Acer pseudoplatanus L. 1 0.022 C/SC
Allium flavum L. 74 1.598 S/CSR
Crepis tectorum L. 509 10.994 R/SR
Dianthus carthusianorum L. 283 6.112 S/CSR
Festuca ovina L. 116 2.505 S
Hieracium pilosella L. 210 4.536 S/CSR
Lichen_Cladonia cf scabriscula (Huds.) Schrader 15 0.324 S
Lichen_Peltigera spp. 4 0.086 S
Linum perenne L. 168 3.629 SR
Moss_Hypnum1 183 3.952 S
Moss_Bryum1 100 2.160 SR
Moss_Brachythecium cf. albicans1 (Hedw.) Schimp 96 2.073 SR
Moss_Brachythecium cf. albicans3 (Hedw.) Schimp 67 1.447 SR
Moss_Bryum2 235 5.076 SR
Petrorhagia prolifera (L.) Ball & Heywood 30 0.648 R/CSR
Picris hieracioides L. 17 0.367 R/CSR
Poa compressa L. 42 0.907 SR/CSR
Potentilla tabernaemontani Ascherson 167 3.607 S
Potentilla recta L. 36 0.778 C/CSR
Sedum acre L. 1 0.022 S/SR
Sedum hybridum L. 280 6.048 S
Sedum rupestre L. 879 18.985 S
Sedum sexangulare L. 143 3.089 S
Setaria viridis (L.) P.B 595 12.851 R
Taraxacum officinale Weber 18 0.389 R/CSR
Thymus serpyllum L. 196 4.233 S
Trifolium campestre Schreber 5 0.108 R/SR
Verbascum nigrum L. 2 0.043 C/CSR

272
Veronica spicata L. 105 2.268 SC
Vulpia myuros L. C.C. Gmel. 53 1.145 R/SR
# types C S R
11 0.041 0.632 0.327
The lower Rathaus roof had a much stronger presence of intermediary R-strategists than the
PV roof, yet the location of these two roofs within CSR space suggests that they are more
similar to each other than to the vegetation with which they were both originally planted
(Figure 7.6). This suggests a compositional shift from S/CSR vegetation towards the ultimate
position of S/SR. The uncertainty of the original species list and its proportions may limit the
degree of confidence in the universality of this shift. Still, given the results from the
substrate analyses and substantiation from other studies (Buttschardt, 2001, Poll, 2008), not
to mention personal observation and intuition, it is reasonable to expect that shallow EGRs
in a climate like that of south-west Germany will shift to a more simple vegetation,
dominated by stress-tolerant ruderal strategists, including colonising bryophytes.
Figure 7.6. The vegetation surveyed in 2011 on Rathausgarage roofs can be described as S/SR vegetation, shifting from the S/CSR location of the original (though not proportional) list.
7.3.3.1 Discussion: successional trajectories on EGRs using CSR theory
The results from these analyses suggest that the EGR vegetation sampled here ranges
between S- and S/CSR communities, but S/SR vegetation was the most prevalent vegetation
observed. One of the aims of the research was to propose models illustrating and predicting
vegetation change on EGRs over time, using plausible ecological theories, so this section will

273
combine these results with different applications of ecological theory. Assuming that the
initial species list for the Rathausgarage complex is not uncommon, and bringing together
the results of this chapter thus far, Figure 7.7 proposes a generalized successional trajectory
that explains how EGR vegetation changes over time with reference to plant strategies.
Initial vegetation is located in the S/CSR part of the triangle, and vegetation shifts to either
of two main types: the “Species-poor Sedum roof” (S) or the “Sedum meadow” (S/SR), of
which there are various types. The timeframe here is based on the observations made by
this work, so twenty years or more after installation. It’s possible, probably even likely, that
smaller shifts continually occur throughout a growing season, and that the processes are
much more dynamic.
Figure 7.7. Proposed successional trajectories for Sedum-based EGR systems.
The successional trajectories that EGR vegetation take are influenced by various conditions
and factors, as discussed in previous chapters, whether site specific (shade, aspect, slope) or
owing to the system design and construction (substrate depth and composition). However,
other factors that were not measured likely play a role as well, including mechanisms
associated with persistence and regeneration, stress imposed by drought and the greater
environment (irradiation, temperature, precipitation, pollution), or feedback mechanisms
between vegetation and soil. Such factors could for example cause the vegetation of large
and unshaded EGRs to deflect more steeply towards the S-corner, while EGRs with some
provision of shade and shelter would tend towards S/SR character.

274
Building upon these results for various EGR vegetation types, green roof types were added
into Gilbert’s (1989) adaptation of the CSR model for urban habitats (Figure 7.8). The clear
circles represent that author’s allocations of different urban habitats into CSR space, and the
additional green roof types are shaded. As per the results here, Sedum-based EGRs are
located in the S-corner of the triangle and extend along the S-R axis. The “living roof”
designed for Black Restarts, which is basically an EGR replicating brownfield habitat, was
located more towards CSR since these systems are slightly richer than EGRs (Kadas, 2011).
Recalling the Lake Water Filtration Facility near Zurich, “Swiss orchid roofs” were located
towards the centre of CSR space since this mesic vegetation includes a variety of herbaceous
perennials and bulbs (but no Sedums). This vegetation type is still closer to the S-R axis than
either of the other two axes because the rooftop habitat is prone to disturbance and stress.
Figure 7.8. Compared with other urban habitats, extensive green roofs (EGRs) are among the most stressful with vegetation limited predominantly to S-strategists, or stress tolerators. Modified from Gilbert (1989) (p. 16).
At the opposite end of the green roof spectrum, highly maintained intensive green roofs
were located in the R corner of the CSR triangle. Intensive green roofs that are used as roof
gardens are probably just as “disturbed” as ornamental bedding, though they probably have
much greater range than is proposed here. From the perspective of landscape management,

275
cultivation is one of the most common forms of disturbance (Hitchmough, 1994), which
explains why Gilbert (1989) allocated seasonal ornamental bedding to this corner.
7.3.4 Modeling successional change on EGRs over time: conceptual framework
The role of factors that could not be measured but which bear meaning to vegetation
dynamics will be introduced in this final section which will propose a conceptual model of
EGR vegetation change over time. Conceptual models on natural succession have
continually built upon the classic Clementsian view and applied various methods for treating
vegetation. This section shall more closely consider the causes and mechanisms that led to
the results of the previous section, as well as filters that regulate species entry and exclusion
into plant communities. The models proposed thereby combine the findings from this
research with observations and findings from other works, and use theoretical constructs
from plant ecology.
7.3.4.1 Framework of successional causes and mechanisms
The specific mechanisms that lead to changes in plant community composition occur both
within and outside the system, and are due to different general causes. “Mechanism” in
ecology connotes an interaction that is nested within the entity or system to be explained
(Pickett et al., 1994), meaning it is a subtle driving force that can have varying degrees of
impact on the processes of that system. The general causes can be organized hierarchically
within a framework that allows the identification of different types of causes and
relationships operating within the processes of change, while independently allowing
consideration of varying levels of detail without compromising overview. A three-level
hierarchical framework from contemporary process studies of succession by Pickett et al.
(1987, 2009) was adapted to outline the general causes and specific mechanisms leading to
vegetation change on EGRs (Figure 7.9). This arrangement emphasizes a mechanistic
approach to understanding, rather than a focus on the net effects of species interactions
(Pickett and McDonnell, 1989, Pickett et al., 2009). In order to clarify their role to vegetation
change on EGRs, these will be introduced and then incorporated into a diagrammatic model
of multi-layered processes.

276
Figure 7.9. A hierarchical causal framework for EGR vegetation dynamics. Adapted from Pickett et al. (1987, 2009).
The first level in the framework (I. Process) specifies the most inclusive processes with the
broadest, minimal defining phenomena. In other words, the process of interest here,
natural succession, is specified as change in vegetation or species composition. The second
level (II. General Causes) presents three major causes of natural succession, namely
differential site conditions, differential species availability and differential species
performance. The third level (III. Specific Mechanisms) consists of the particular
mechanisms that determine the outcome of the three general causes, and are discernable
or quantifiable at specific sites. Interactions may occur across all levels of this causal
framework. For example, repercussions from the mechanisms of coarse scale disturbance
will influence the other two general causes influencing vegetation change, the differential
species availability and species performance. The causes of vegetation dynamics may each
act independently or jointly in various combinations. Since these causes and mechanisms
were not measured, they will be described in some detail before integrating them into a
diagrammatic model of EGR successional change.
7.3.4.1.1 Differential site conditions
The basic resources available at a site and the incidence of coarse scale disturbance are two
site-specific features that can direct the influence of differential site conditions on

277
vegetation dynamics (Pickett et al., 2009). For green roofs, resource availability is
determined by the system construction and design, in particular substrate composition and
depth. Coarse scale disturbance on EGRs may be issued by slope, aspect, geographic
location, maintenance frequency and intensity, and so on. Coarse scale disturbance
influences vegetation when events like drought or extreme temperatures damage plant
biomass or open the soil or substrate through cracking, erosion or scouring. The severity of
the disturbance event, the area affected, the spatial heterogeneity within the site, the
spatial relationship to other disturbed areas, and the temporal frequency of disturbances
can all affect the conditions of the opened site (Pickett and White, 1985, Coffin and
Lauenroth, 1989, Dale et al., 1998). Likewise, the availability of soil resources, especially
nutrients and moisture, critically influences individual plant growth, population dynamics,
competitive interactions, community structure, and successional change (Bazzaz, 1996).
i) EGR system construction as mechanism of successional change
The direction of vegetation change on EGRs can partly be attributed to their construction
and the system used. Extensive green roofs are the product of decades of research and
development, and the stable Sedum roof may well epitomize the low-maintenance, self-
sustaining ideal. Commercial EGR systems regulate resource availability and disturbance
intensity through the shallow, free-draining, mineral substrates and drainage elements. It is
meaningful here to consider that alternative green roof constructions with the same loading
constraints can support different flora. Experiments with wetland species have shown that
green roofs can support mesic species (MacIvor et al., 2011, Song et al., 2013), and a few
projects exemplify this potential, such as the wetland roof installed on the Victoria & Albert
Museum in London (The Green Roof Consultancy, 2013). Orchids can also be cultivated on
extensive green roofs given the appropriate conditions (Schneider, 2012). The Swiss
technique of spreading hay from species-rich dry meadows onto extensive green roofs
based by an organic substrate (100 mm water absorbent foam or straw and 50 mm natural
topsoil) eventually comes to replicate the species composition of those meadows
(Brenneisen, 2012). The species composition of those roofs may well be dominated by S-
strategists, but lacking plant ecological studies limit this knowledge.
ii) Coarse scale disturbance as mechanism of successional change
Countless studies have observed that stress imposed by drought (and/ or lacking moisture)
is the main controlling factor directing EGR species composition over time. There is

278
mounting evidence that influence of drought on EGRs will vary depending on site
productivity since species and phenotypes adapted for less fertile microhabitats are be
more resilient in face of drought (VanWoert et al., 2005, Monterusso et al., 2005, Rowe et
al., 2006, Durhman et al., 2007, Getter and Rowe, 2008, Nagase and Dunnett, 2010, Nagase
and Dunnett, 2011, Schroll et al., 2011). Exposure is a source of coarse scale disturbance for
green roofs, whether as direct solar radiation, unabated wind, or exposure to hail, intensive
rainfall, or other. Shading provisions for reducing solar exposure can improve EGR plant
cover and diversity (Köhler and Poll, 2010), particularly when combined with greater depths
(80 vs. 100 mm) (Getter et al., 2009). Shelter from wind can reduce evapotranspiration
rates, thereby helping to preserve water availability in the growing substrate (Bates et al.,
2013).
Very severe environments with open and sparse plant cover do not show consistent
patterns of vegetation change, presumably because autogenic influences and competition
are minimal (Burrows, 1990). Even when vegetation in some extreme environments seem to
be stable in the sense that the general composition is maintained on the same area of
ground, this may be a result of the limited niche variety, combined with the relatively wide
fundamental niches of species in those habitats. In other words, the vegetation of severe
environments may be in a continual state of flux in terms of local changes, though the
overall vegetation complex seems to be stable and resilient in face of disturbance. The
limited range of species that can inhabit severe sites may therefore be attributed more to
life history strategies, physiological specialization, vital attributes, etc. than to vegetation
dynamics (Noble and Slatyer, 1980, Lavorel and Garnier, 2002, Chapin et al., 1994). Although
no research has formally quantified coarse scale disturbance for EGRs, it seems that severe
conditions do occur at least periodically (Rumble and Gange, 2013).
7.3.4.1.2 Differential species availability
Successional change can be simplified as the “dynamic balance between colonization and
extinction” (Usher and Jefferson, 1990) (p. 149). A major insight into natural succession was
that the disturbance that initiates change is often the very access point by which many
individuals and species arrive (Pickett et al., 2009, Grime and Pierce, 2012). The second
general cause of vegetation change on EGRs is therefore related to the species pool, or
differential species availability and regenerative strategies. The propagules which give rise
to plant communities are derived from immigrant and resident propagules, including

279
vegetative parts but also seed rain and seed bank. Seeds are the primary means whereby
plants colonize new sites, and also represent a stage in a plant’s life cycle where it can resist
unfavourable environmental conditions (Harper, 1977). Beyond vegetative spread, local
seed bank and dispersal by seed rain are two specific mechanisms that determine
differential species availability for EGRs.
The CSR successional models developed by Grime (1987, 2001) illustrate the role that
abundantly dispersed propagules (W), vegetative spread (V), persistent seed bank (Bs) and
persistent seedlings (Bsd) have on uninterrupted successional trajectories of certain habitats
(Figure 7.10). In low fertility sites, like calcareous grassland, where succession is initiated by
a disturbance, recolonisation usually involves species that produce an abundance of small,
wind-dispersed seeds (W). As the vegetation attains dense cover, vegetative spread
becomes more prevalent and those small, relatively fast-growing species must wait for
renewed disturbance. Once resource limitation becomes the dominant selective force, the
most successful regenerative strategy combines vegetative expansion (V) with a seed bank
of persistent seedlings (Bsd), which are recruited from established populations (Grime,
2001). On skeletal sites, regeneration by W is not an effective mechanism of persistence and
is replaced by perennial species that can expand vegetatively (V) and establish founder
populations. This model predicts that a bank of persistent seedlings (Bsd) plays an
inconspicuous but important role throughout primary succession.

280
Figure 7.10. The role of regenerative strategies in the successional pathways of low fertility sites (left) and of skeletal habitats (right). W = numerous, small, widely dispersed propagules; V = vegetative spread; Bs = persistent seed bank; Bsd = persistent seedlings. Adapted from Grime (2001).
7.3.4.1.3 Differential species performance
Once the species are in place, the differential performance by those species further
determines vegetation dynamics and change. Species, as well as individuals within a given
species, often perform differently from one another (Pickett, 1976, Tilman, 1982), and
species performance includes the responses of physiology, architecture, and life history to
the environment (Grime, 1977, Noble and Slatyer, 1980, Connell et al., 1987, Pickett et al.,
1987). In terms of growth, survival and reproduction, species performance will vary
depending on resource availability (Grime, 2001), ecophysiology and life history (Chapin et
al., 1994), competition (Grime, 1973), environmental stress (Desteven, 1991),
allelochemicals (Peng et al., 2004), and by relationships with consumers, mutualists and
predators (Chapin et al., 1994, Titus and Bishop, 2014). Differential species performance in
this context can be exemplified by temporal offset when contrasting life cycles co-exist, such
as the germination, growth and life cycle of annuals versus biennials. Also, different species
can occupy the same space at different times when resource demands are contrasted, such
as species requiring high levels of light dominating earlier in succession on infertile soils
while those requiring high nitrogen occur later (Tilman, 1988, Bazzaz, 1996). “Floristically
diverse Sedum meadows” demonstrate temporal co-existence well: grasses and forbs

281
overshadow the Sedum ground cover when moisture is not limited, but die back in dry
summers such that Sedums maintain the prevalent vegetation cover. Such species lists
indicate the degree of climatic and ecological awareness to the region in which they were
developed, and the intent of consistent plant cover on EGRs.
7.3.5 Ecological filters influencing EGR vegetation dynamics
Selective filters will further regulate entry and exclusion of species from a site and will
complement this conceptual framework. Responsive with the dynamics of a site and
occurring at all levels, filters operate generally, with regional factors modifying the relative
strength of their effects (Williams et al., 2009). For example, seasonal drought and
disturbances from climate can exert selective pressure that exclude unsuitable phenotypes
from a site and permit some functional types to enter and persist (Woodward and Diament,
1991). Species that colonize and persist in urban habitats can be considered a subset of the
regional species pool, from which successful traits are selected, or filtered, by urban
environmental conditions and human preference (Williams et al., 2009). On extensive green
roofs, disturbance and environmental stress are two obvious filters that determine whether
a species or growth form can persist or colonise a roof. If the vitality of planted or sown
species is compromised by drought, if they are outcompeted by more vigorous species, and/
or if their seeds or vegetative parts are not viable, then these species become filtered out of
that plant community and make space for other species, such as colonisers with suited
dispersal strategies. In other words, competition, stress and disturbance can be treated as
ecological filters that determine the species and adaptive strategies that persist over time.
A key element from Universal Adaptive Strategy Theory (UAST), the twin-filter model of
community assembly proposed by Grime and Pierce (2012) builds upon theoretical models
of disturbance and community ecology (i.e., intermediate disturbance hypothesis and
humped-back model). In the first part, the CSD filter determines the primary adaptive
strategies that may enter a habitat from a species pool, which includes intentionally planted
species and their seed bank as well as spontaneous colonisers. Successful establishment is
limited to the subset of the strategists from that pool that can survive the CSD equilibrium
prevailing in that habitat (Figure 7.11). Sites of varying productivity and disturbance will
admit suitable strategies and exclude unsuitable ones. This filter selects on a day-to-day
basis for convergence (similarity) in the general adaptive strategies that can survive locally,
and is very important in early- to mid-successional stages (Grime and Pierce, 2012).

282
Figure 7.11. The CSD filter excludes adaptive strategies (represented by different geometric shapes) from niches characterized by contrasting levels of productivity and disturbance, sorting the local species pool into admissible and inadmissible strategies. Adapted and used with permission from Wiley & Sons, Ltd.
When individuals from the species pool have passed through the CSD filter, they are
subjected to secondary pressures by the “proximal selection pressures filter”. This proximal
filter represents the worldly conditions of a particular site because it is defined by
innumerable factors, such as local pollinators or the presence of seed dispersal vectors.
Notably, the traits of this filter are independent of CSR adaptive strategies. Figure 7.12
details three possible scenarios of divergence determined by the proximal filter. In some
cases, species (black arrow) cannot pass the filter because none of the individuals (white
arrows) are suitably adapted (Figure 7.12a), while those individuals that are suitably
adapted (e.g., by intraspecific trait variability) may enter and become established within the
community (Figure 7.12b). Divergence occurs when two sub-populations with extreme trait
values find suitable niches, while individuals with average traits do not (Figure 7.12c). To
this end, the proximal filter selects intermittently against particular traits, rather than the
strategy as a whole, and the resulting micro-evolutionary trait divergence has consequent
implications for eco-evolutionary feedback, which may initiate sympatric and allopatric
speciation and thus adaptive radiation. Single traits or small sets of traits differing between
coexisting species with similar CSR strategies may represent subtle evolutionary differences
that increase local biodiversity. United as a series of filters, the CSD equilibrium is a major
determinant of ecosystem processes because it selects traits governing the movement of
matter and energy (Grime and Pierce, 2012).

283
Figure 7.12. The proximal filter of community assembly, showing how species (black arrow) and individuals (white arrows) must pass through selection filters in order to enter a community. Adapted and used with permission from Wiley & Sons, Ltd.
7.3.6 Modeling EGR vegetation assembly over time
The causes and mechanisms driving successional change will combine in all sorts of
relationships, but the twin filters (CSD and proximal filters) determine the final outcome of
entry and exclusion into a community. This section integrates Grime and Pierce’s (2012)
twin filter model with the hierarchical causal framework for EGR vegetation dynamics
outlined earlier in order to explain EGR vegetation dynamics, with particular reference to
species availability and performance, disturbance issued by exposure, and stress caused by
limited substrate depths and drought. These factors all exert pressures on the vegetation,
independently and in combination, and across various scales of time. Interpreted through
the model of the CSD filter, EGR vegetation after twenty years is located towards the S-
corner of CSD equilibrium (the grey area in Figure 7.13), having emerged as a result of
general causes and specific mechanisms.

284
Figure 7.13. The CSD filter on EGRs leads to species composition predominated by S-strategists.
Beyond this general location in CSR space, the vegetation of the roofs surveyed was
classified into several types, and their formation over time can be explained using the
secondary, proximal filter (Figure 7.14). This filter is subject to the same causes and
mechanisms as the CSD filter, but refines EGR species composition through exponentially
more factors. These may include physical factors, like degree of maintenance (e.g.,
supplemental nutrition, frequency of weeding, elevation above the ground, or roof age);
ecological factors (e.g., pollination, soil fauna populations, bird activity and associated
fertilization); geochemical factors (e.g., atmospheric deposition, heat island effect,
pollution), and any number of other effects. The factors represented by this filter are too
numerous and interactive to itemize, but the obvious ones will be described in order to
explain the divergence of trajectories.
Figure 7.14. The proximal filter on EGRs leads to divergence in EGR vegetation types.

285
The realized communities defined for the EGR vegetation types identified can be explained
by integrating the twin filter model with conceptual input from the hierarchical causal
framework of vegetation change (Figure 17.15). As a simple example, the species
composition of the “Species-poor Sedum roofs” (S-vegetation) was dominated by a few
Sedum species/ cultivars. This vegetation had ostensibly attained dominant cover through
vegetative spread, but likely also by other factors. The substrate on these two roofs, for
example, probably played a key role in the vegetation dynamics over time; both roofs had
the lowest records for air content at MWC and a few other parameters fell beyond the FLL
guidelines maintained by the other EGRs surveyed. Even without assuming that the initial
vegetation was more diverse, or located at S/CSR, Sedum dominance might be maintained
on these roofs through feedbacks, whether from physical saturation of the species pool (by
vegetative and sexual propagules) or by competitive regulation of entry and persistence of
other growth forms (e.g., dense competitive spread, low pH, perhaps biochemical root
exudates). By contrast, the more species diverse “Sedum meadow” variations were
associated with more diverse site conditions and with greater availability of local seed rain
as provided by deeper mounds in other parts of the roof.
Figure 7.15. A series of ecological filters as well as feedback mechanisms determine species composition on EGRs over time.

286
The plant communities that emerge on EGRs after the succession of causes, mechanisms
and filters will vary in accordance with the conditions and factors of the site and species.
The dominant S-strategists maintain their dominance through their optimally suited
strategies for surviving the recurrent stress and disturbance associated with shallow mineral
substrates, high degrees of exposure and, possibly, through subtle competitive exclusion by
feedbacks with substrate conditions, like low pH. On EGRs, the abandonment of roof
maintenance may lead to the establishment of tree seedlings (C-strategists), though these
rarely survive due to limitations like rooting depth (Buttschardt, 2001). When patches of
particularly shallow substrates become cracked by drought or frost, only suitably adapted
growth forms can establish (R-strategists) though persistence over the long term may be
limited to stress tolerators (S-strategists).
7.4 Conclusions
7.4.1 To propose models illustrating and predicting vegetation development on
EGRs over time
Vegetation change on EGRs over the long term was illustrated and predicted using a model
that integrates a hierarchical causal framework of vegetation dynamics with a twin filter
model for community composition. These two components were adapted from ground-level
successional models, and the sources of reference have committed decades of rigorous
science towards an improved and contemporary understanding natural succession and
vegetation dynamics (Pickett, 1976, Grime, 1977, Pickett et al., 1987, Grime, 2001, Pickett et
al., 2009, Grime and Pierce, 2012).
7.4.2 If successional change can be observed on EGRs, what are the main drivers
and mechanisms?
The main drivers of vegetation change on EGRs relate to interactions between differential
site conditions and resource availability, differential species availability and regenerative
mechanisms, differential species performance, all of which are mediated by ecological
filters. Numerous mechanisms are nested within the general causes of vegetation change.
Resource availability is partly determined by EGR system construction and/ or design (e.g.,
substrate depth, substrate composition, system build-up), and coarse scale disturbances will
influence the conditions for plant establishment, growth, colonization and persistence.
While vegetative spread is an important mechanism by which stress-tolerators maintain

287
dominant cover on EGRs, differential species availability hinges on the presence of seed
bank and seed rain, specifically their species composition, proximity and quality, and
viability for germination. Considering the prevalence of stess and disturbance on EGRs,
some of the key mechanisms associated with differential species performance include
ecophysiology and life history (e.g., germination requirements, growth rates, reproductive
timing), although countless dynamics will also be generated by competition for resources
(both within-community and predators), allelopathy (with respect to soil characteristics and
microbes), community composition, patchiness, site history, microclimate, and so on. The
twin ecological filters (CSD equilibrium and the proximal filter of worldly conditions)
ultimately regulate species entry and exclusion onto EGR vegetation.
Our understanding of natural succession has evolved quite dramatically since the concept
was first introduced, so its use for green roofs and urban ecology may benefit from more
contemporary terminology. The term “climax” is encumbered with history and fraught with
problems (Burrows, 1990), but many alternative terms have been proposed over the years.
For example, Selleck (1960) proposed “most advanced stages”, while Bray (1958) and Park
(1970) advocated “steady state”, by which they meant a “temporary state of dynamic
equilibrium in an open system” (Burrows, 1990). Odum (1971) and others used the term
“mature”. More recently, Pickett et al. (2009) suggest that “vegetation dynamics” more
realistically portray the nature of plant community change, but recommend that
“succession” as a term acknowledges the conceptual development of this theme. This
research concedes with the practicality of the latter.

288
8 Concluding summary
This concluding chapter summarises the main points made by this research, proceeding
methodically through the research aims with reference to the research questions outlined
at the beginning of the dissertation.
8.1 Aim: To characterise mature EGR vegetation in terms of growth form cover
and species diversity.
As a growth form, succulents were the most prevalent with the greatest cover on the roofs
surveyed, and behaved contrarily to the other growth forms on most measures. Unlike the
other growth forms, species richness of succulents did not correlate to their cover
abundance, which reflects the fact that Sedum-dominated roofs can be extensively covered
by just two or three species. Cover by succulents correlated negatively with the diversity of
other growth forms, except for bryophytes. Of all growth forms, succulents showed the
weakest response to roof age and substrate depth. The succulents identified classify as
stress tolerators according to Grime (1977), which may partly explain why this growth form
was notably immune to some of the factors that influenced the other growth forms.
In addition to the prevalence of stress tolerators, ruderals also formed an important
component of long-term EGR vegetation. In the context of CSR theory, species with annual
life cycles and the capacity for rapid recovery and easy colonisation indicate the degree of
disturbance that EGRs sustain. This characterizes the vegetation of these old EGRs as
combining both hardy and stress tolerant components together with a dynamic component
of opportunistic colonizing ruderals.
One of the research questions asked whether emergent community characteristics result
with time, such that roofs with similar properties end up with similar species composition/
abundance/ diversity after a period of decades. The analyses of Chapters 3 and 5 concluded
that green roof vegetation is not static and that it converges over time with subtle
divergences into different vegetation types.

289
Based on site-specific attributes for the roofs surveyed (species diversity, dominance, and
ecological indicators given as Ellenberg Indicator Values), two broad EGR vegetation types
were identified:
1. “Species-poor Sedum roof” (typically less than 12 species, mainly Sedums)
2. “Species-rich Sedum meadow” (typically more than 12 species, with a base cover of
Sedums) of which three sub-types were described:
2.1. “Floristically-diverse Sedum meadow”
2.2. “Sparse Sedum meadow”
2.3. “Sparse Sedum meadow with Chives”
With the consideration of EGRs as novel ecosystems that support anthropogenic plant
communities, and recalling that phytosociological efforts of spontaneously vegetated TPG
roofs could only manage very general classifications, this work hypothesises that EGRs with
identical starting points, constructions, and conditions will probably converge at certain
points of similarity, but not to the point of the emergence of identical and recurring species
compositions. Although the classifications here were limited to nine roofs, this work reveals
how previous efforts of classifying EGR vegetation have been either too simplistic (Krupka,
1992, FLL, 2008, Madre et al., 2014) or too specific (as per phytosociology but also Van
Mechelen et al. 2015). Suggestions for future research are proposed in section 8.4.3.
8.2 Aim: To characterise EGR substrate development > 20 years after installation.
This research substantiates other studies that the substrate of EGRs decline in soil pH over
time and increase in soil organic content. Depth may also decrease over time, though
insufficient samples with original documentation inhibit strong conclusions. Anthropogenic
influence through unreported maintenance efforts was deemed a lurking variable that could
influence nutrient concentrations and pH. Incidental observations of ants and earthworms
suggest biological activity in the substrates and imply that soil formation processes on EGRs
are possible. Still, the acidic conditions of the substrates may prevent the decomposition of
organic content, which is an important soil process.
Assuming that the roofs sampled aligned with the FLL recommendations when they were
installed, one of the research questions sought to establish how the physical and chemical
parameters lined up with those values more than 20 years later. The physical parameters of
maximum water content (MWC) and air content at MWC fell within the recommended

290
ranges for most roofs; only the two “Species-poor Sedum roofs” (Pliensaufriedhof and
Köngen) had insufficient air content and excessive MWC, while two “Sedum meadow” roofs
(VB Area 2, Rathausgarage-PV) were slightly below the minimum recommendation for
MWC. Most of the EGRs surveyed were near or above the limit for soil organic content.
Except for the two youngest EGRs, the pH of all the roofs sampled was acidic, and below the
FLL recommendations. The nutrients measured were within the recommended
concentrations in all but one exception (Nitrogen, Pliensaufriedhof).
Given the lack of published research or long-term observations of EGR substrates after
installation, the suggestion that substrate depth decreases over time cannot be ruled out.
This is especially pertinent for regions with emerging green roof movements where the
materials and methods for installation are new, and where the intuition and common sense
advised by the FLL with regards to green roof design is not culturally inherent. Less substrate
depth on EGRs basically means a simpler flora, dominated by stress tolerators and species
with annual life cyles. Proponents stating that green roofs can support diverse vegetation
and habitat for organisms would therefore be advised to take this time-based phenomenon
into account, which has not otherwise been considered.
Based on the previously unknown German research, the soil organic content of old EGR
substrates is probably undecomposed litter (rather than humus). Coupled with the
vegetation results, this work hypothesises that the floristic simplification observed on the
roofs surveyed could be at least partly due to soil-plant feedback cycles. Unlike most
species, Sedums perform well in acidic conditions and, by perpetuating acidification through
their litter, can become increasingly dominant over time. Although more observations are
required, this work also hypothesizes that EGR substrates could potentially come to
approximate natural soil processes when they support persistent populations of soil
macrofauna.
8.3 Aim: To identify plausible ecological theories or models which describe the
processes that occur on EGRs over time
Conceptually, the ecological models of fragmentation, island biogeography and
metapopulation theory resonated with the interests of this work, but natural succession,
disturbance theory, and CSR theory were deemed most relevant for describing the
processes occurring on EGRs since they focus on vegetation change and are site-level

291
processes. With its emphasis on environmental stress and disturbance, CSR theory was
useful for connecting up individual species’ functional traits and adaptive strategies with
community level perspective, including successional change. As alluded to already, the
application of CSR theory for characterising EGR species was useful for describing the
vegetation of the roofs surveyed.
One of the research questions asked whether successional changes could be observed and,
if so, what might be the main drivers and mechanisms. The results suggest that EGR species
diversity and composition over the long term are influenced by substrate variables (depth,
composition, nutrient status, pH, Corg) and site conditions (e.g., aspect and slope), and that
feedbacks may be involved. Initial species selection (with reference to strategies for
persistence and self-regeneration) and species recruitment (including possibilities in seed
bank and proximity to wind-dispersed propagule sources) are important factors, too. This
work agrees with general consensus from green roof practice and research that substrate
depth should not be less than 100 mm, both for species richness and green roof function.
The prospect of declining soil pH and depth over time should be examined through
monitoring.
8.4 Aim: To propose models illustrating and predicting vegetation development
on EGRs over time.
Integrated with the hierarchical causal framework outlining various levels of detail for EGR
vegetation dynamics, the modification to Grime and Pierce’s (2012) twin-filter model was
adapted to explain why some species or growth forms may persist on EGRs over time better
than others. The CSR triangle diagram proved useful for characterising EGR vegetation
components according to adaptive strategies, and provided a dynamic approach for
considering the processes of EGR vegetation assembly over time. It is noteworthy that the
twin-filter model advances the unification of ecology with evolutionary biology and provides
the basis for a mechanistic model of the dominant forces shaping evolution across the
spectrum of ecological situations (Grime and Pierce, 2012). To the author’s knowledge, the
application of natural succession and CSR theory to novel ecosystems like green roofs is
unprecedented.

292
8.5 Future research
This research can be viewed from two perspectives. On the one hand, it can be seen as one
of the few examples of plant ecology oriented green roof research; in other words, as a
minority within an area of research that has otherwise been led largely by engineering,
architecture and construction (Blank et al., 2013). In this light, a preliminary understanding
of long-term plant ecological development on EGRs can help establish a foundation for EGR
research within the context of urban ecological studies. On the other hand, this work can be
viewed as a preliminary attempt at urban ecological research using EGRs as a particular type
of novel ecosystem within the built environment. Just as the green roof movement is due to
refresh its ecological goals and mandates, similarly the discipline of urban ecology has yet to
integrate the potential of living architecture into its program.
8.5.1 EGRs and urban ecological research
To date, EGRs have been treated as engineered systems whose implementation rests largely
in the domain of policy-makers and industry. Ecological investigation of EGRs, and
consideration by ecologists in general ,have been hampered by inaccessibility. Now that
urban ecology is a more firmly established discipline (Pickett et al., 2004) and greater rigor is
being encouraged for urban ecological research (McDonnell and Hahs, 2013, Felson et al.,
2013), green roofs could serve as discrete experimental systems for all sorts of ecological
research. Further to vegetation dynamics and soil processes of novel ecosystems, applied
research projects on actual roofs could facilitate interactions between ecologists and other
disciplines and offer ecologists access to the design process of urban areas. Such
collaborations with architects, landscape architects and urban designers could offer the
additional benefit of infusing designed experiments into the goals and monitoring
approaches of projects (Felson and Pickett, 2005). Since EGRs are very closely tied to socio-
economic systems, their integration with ecological models and with socio-economic and
physical systems will help to better understand the importance of different processes in
different locations (Grimm et al., 2000, McDonnell et al., 2009, McCarthy, 2009).
Given the ground that urban ecology continues to gain, and considering how the EGR
industry is expanding to all regions of the world, this work can benefit the pragmatic and
intellectual development of both disciplines. The abandonment of antiquated philosophies,
in exchange for contemporary- and future-oriented views, can help us approach human

293
habitats more intelligently (Groffman et al., 2014). Ecological research on EGRs can aim
towards supporting urban ecological research through the collaborative development and
improvement of methods, along with clarification of factors to be monitored and quantified.
The establishment of coordinated research programs in different parts of the world would
help to enhance the quality of output from EGR ecological research. The implementation of
permanent plots on newly installed EGRs, with monitoring devices installed from the start,
can build synoptic datasets. Research into soil processes on EGRs would greatly advance our
understanding of these systems and of their ecological potential, with attention to nutrient
cycling, soil fauna, physical compression, nitrification and humification. Still, though
comparative studies are of great value, estimates of the size of effects being studied and
measured must be clearly provided, and the precision of any estimates duly reported, as
these are crucial for providing suitable data for meta-analysis (McCarthy, 2009).
8.5.2 EGRs and urban soil ecology
Interesting questions raised here that could be addressed by future research might ask
whether soil ecological processes on EGRs are more, or less, dynamic at different periods in
time (e.g., early years after installation or after twenty years). Establishing methods and
metrics to determine the quality of soil organic content, will be crucial if distinctions
between litter and humus are to be made. Clarifying ecological relationships, such as plant-
soil feedbacks, the role of ecosystem engineers like ants, and the effects of episodic
phenomena, like extreme stress, can help to understand EGRs as novel ecosystems.
Research into soil processes on EGRs would greatly advance our understanding of these
systems and of their ecological potential, with attention to nutrient cycling, soil fauna,
physical compression, nitrification and humification.
Future-oriented land use planning must integrate opportunities for soil carbon
sequestration and enhancement of nitrogen sinks, even in cities (Lorenz and Lal, 2009), and
strategies that strengthen soil ecological functions (e.g., retention of nutrients, hazardous
compounds and water) can help to improve ecosystem services, but little work has
examined the enhancement of EGRs for carbon sequestration (Getter et al., 2009). The soil-
based processes of individual EGRs are undoubtedly affected by the effects of urbanization,
like increased concentrations of reactive nitrogen and atmospheric CO2 (Brown et al., 2005,
Kaye et al., 2006), or changes to global biogeochemical cycles (Grimm et al., 2000), but this
has never been measured or quantified.

294
8.5.3 EGRs and plant ecological research
An improved understanding of EGR ecology and function, including responses, feedbacks
and processes, is essential if green roofs are to be treated as novel ecosystems and/ or as
meaningful components of green infrastructure. A greater number of roofs that can be
sampled over short-and long-terms, and accompanied by consistent and reliable
information (on installation, materials, construction, etc.), will help develop our
understanding of the processes influencing EGR vegetation over time. Such replicability
could also serve to test fundamental questions of plant ecology, such as the vegetation
dynamics that occur over time with regards to stress and disturbance, but also to novel and
urban influences. The emerging trend of research that examines functional (and
phylogenetic) diversity within EGR vegetation may lead towards the enhancement of green
roofs’ potential for ecosystem services.
In terms of viability, the commercial success of EGR implementation could be a real support
for such research, since long-term research would benefit from commencing at the point of
installation and especially in circumstances where blocks of identical buildings are installed
with green roofs around the same time. This would require skillful communication and
effective coordination between ecologists and researchers with town planners, building
owners, contractors and other stakeholders. A forum or network of international
researchers with resources or interests in such work would facilitate the progress of such
work, including the means by which potential collaborators can find each other.
8.5.4 EGRs for testing theories and generating hypotheses
The application of CSR theory and its contemporary offshoots (CSD equilibrium and
Universal Adaptive Strategies Theory) may be of value for the treatment of EGR vegetation,
and vice versa. A recently developed method for designating vegetation with CSR strategies
(Pierce et al., 2013), as an improvement to the laborious plant screening trials conducted in
the UK, appears to hold promise for a variety of applications, including the rapid description
of vegetation and ecology of entire landscapes, from local to continental scales (Pierce et
al., 2013), the remote sensing and mapping of vegetation at local scales (Schmidtlein et al.,
2012), and four-dimensional representations of global vegetation showing ecological
changes in response to large-scale anthropogenic disturbances such as deforestation,
species invasions, nitrogen deposition or climate change (Pierce et al., 2013). Instilling plant

295
ecology with greater predictive power at local, regional and global scales can offer better
insights for better practices.
8.6 Possible implications for the research
The integration of green roof and urban ecological research will have no meaning unless it is
connected in partnerships that facilitate the transfer of knowledge to application, including
the EGR industry, policy, planning and the design disciplines. Increased calls for
environmental remediation, ecological health and biodiversity suggests the need to re-
imagine urban futures (Mostafavi and Doherty, 2010). Although EGRs are becoming
increasingly common in cities, dynamic progress in research and the implementation of
well-thought-out policies is essential if they are to become integral parts of urban green
infrastructure strategies (Henry and Frascaria-Lacoste, 2012). While research is accruing
which affirms that EGRs can deliver ecosystem services when designed in certain ways
(Lundholm et al., 2010, Connelly and Hodgson, 2013, MacIvor and Lundholm, 2011, MacIvor
et al., 2011, Madre et al., 2014, Rowe et al., 2012, Getter et al., 2011, Getter et al., 2009,
Van Mechelen et al., 2015), their actual contribution to biodiversity and ecosystem function
falls under scrutiny (Williams et al., 2014).
Green roofs are central to one of the future scenarios proposed by the Millennium
Ecosystem Assessment (2005) – the TechnoGarden – yet the form and construction type
proposed are as vague as the assumptions this is based upon. In order for green roofs to
claim this noble position – one which benefits both human well-being and the natural world
– this work suggests reviewing the industry standards and the FLL guidelines that are
exported to other parts of the world. While the Sedum meadow is an excellent climatic
match for south-western Germany, the rigid adherence to of the physical specifications of
commercial systems (e.g., depth, system construction) to other climates and bioregions
inherently misses the great opportunity that green roofs implicitly provide. If biotic
homegenisation is to be avoided, and local biodiversity to be supported, then the
involvement and imagination of local ecologists is required. Mechanisms such as
Biodiversity Action Plans, in the UK, have proven beneficial to enhancing the ecological
potential of commercial EGR systems.
This work presents evidence that green roof systems from the 1980s have successfully
achieved their original vision of low-maintenance, self-sustaining vegetation. It observes

296
that ecological processes do occur on EGR systems, but that they are inhibited by
disturbance, stress and other mechanisms associated with these systems and the urban
environment. With respect to current issues of global climate change, increasing
urbanization and declining biodiversity, this work reflects that the original vision from the
1980s no longer align with contemporary issues and future-oriented projections, and that
these system constructions may be inadequate for the pressing challenges and needs of the
present and future. Particularly when so many other options are possible (e.g., orchid roofs,
dry meadow or wetland roofs), the apparent trend of species impoverishment and
dominance by stress tolerators suggests lost opportunities.. After thirty years of market
development, and with a globally burgeoning industry, the green roof movement has a
decisive opportunity to help turn the trend on declining biodiversity and ecosystem services.
8.7 In closing
This thesis was written during the Decade on Biodiversity and soon after the Millennium
Ecosystem Assessment’s call for concerted efforts on slowing the decline of biodiversity, and
therefore hopes to inspire greater involvement of ecological disciplines in the roof domain.

297
Bibliography
ADLER, P. 2005. Die Dachbegrünung im Wandel der Zeit. Master's Dissertation, FH Nürtingen.
ALARD, D., CHABRERIE, O., DUTOIT, T., ROCHE, P. & LANGLOIS, E. 2005. Patterns of secondary succession in calcareous grasslands: can we distinguish the influence of former land uses from present vegetation data? Basic and Applied Ecology, 6, 161-173.
ALBERTI, M., MARZLUFF, J. M., SHULENBERGER, E., BRADLEY, G., RYAN, C. & ZUMBRUNNEN, C. 2003. Integrating humans into ecology: Opportunities and challenges for studying urban ecosystems. Bioscience, 53, 1169-1179.
ANDERSON, D. J. 1986. Ecological Succession. In: KIKKAWA, J. & ANDERSON, D. J. (eds.) Community Ecology, Pattern and Process. Oxford, UK: Blackwell Scientific Publications.
ANDERSON, D. J. & KIKKAWA, J. 1986. Development of concepts. In: ANDERSON, D. J. & KIKKAWA, J. (eds.) Community Ecology: Pattern and Process. London, UK: Blackwell Scientific Publications.
ANGOLD, P. G., SADLER, J. P., HILL, M. O., PULLIN, A., RUSHTON, S., AUSTIN, K., SMALL, E., WOOD, B., WADSWORTH, R., SANDERSON, R. & THOMPSON, K. 2006. Biodiversity in urban habitat patches. Science of the Total Environment, 360, 196-204.
ANSEL, W., BAUMGARTEN, H., DICKHAUT, W., KRUSE, E. & MEIER, R. 2011. Leitfaden Dachbegrünung für Kommunen: Nutzen, Fördermöglichkeiten, Praxisbeispiele. Nürtingen: Deutsche Bundesstiftung Umwelt.
ANSI & SPRI 2010. ANSI/SPRI RP-14: Wind Design Standard for Vegetative Roofing Systems. Waltham, MA: Single Ply Roofing Industry.
APPL, R. 2014.05.28 2014. RE: Email regarding Pliensaufriedhof substrat. To THURING, C.
APPL, R. & ANSEL, W. 2004. Future oriented and sustainable green roofs in Germany. Greening Rooftops for Sustainable Communities. Portland, OR: Green Roofs for Healthy Cities.
ARCHIBOLD, O. W. & WAGNER, L. 2007. Volunteer vascular plant establishment on roofs at the University of Saskatchewan. Landscape and Urban Planning, 79, 20-28.
ARHENDT, J. 2007. Historische Gründächer: Ihr Entwicklungsgang bis zur Erfindung des Eisenbetons. Teil I. PhD (Dr.-Ing.), Technische Universität Berlin.
ATHERTON, I., BOSANQUET, S. & LAWLEY, M. (eds.) 2010. Mosses and liverworts of Britain and Ireland: a field guide, Plymouth, UK: British Bryological Society.
BAKKER, J. P. 2005. Vegetation conservation, management and restoration. In: VAN DER MAAREL, E. (ed.) Vegetation Ecology. Oxford, UK: Blackwell Science Ltd.
BAKKER, J. P., DELEEUW, J. & VANWIEREN, S. E. 1984. Micro-Patterns in Grassland Vegetation Created and Sustained by Sheep-Grazing. Vegetatio, 55, 153-161.
BAKKER, J. P., OLFF, H., WILLEMS, J. H. & ZOBEL, M. 1996. Why do we need permanent plots in the study of long-term vegetation dynamics? Journal of Vegetation Science, 7, 147-155.

298
BARBOUR, M. G., BURK, J. H., PITTS, W. D., GILLIAM, F. S. & SCHWARTZ, M. W. 1999. Terrestrial plant ecology, Menlo Park, CA (USA), Benjamin/ Cummings, an imprint of Addison Wesley Longman, Inc.
BARDGETT, R. D. 2005. The biology of soil: a community and ecosystem approach, Oxford, UK, Oxford University Press.
BARDGETT, R. D., ANDERSON, J. M., BEHAN-PELLETIER, V., BRUSSAARD, L., COLEMAN, D. C., ETTEMA, C., MOLDENKE, A., SCHIMEL, J. P. & WALL, D. H. 2001. The influence of soil biodiversity on hydrological pathways and the transfer of materials between terrestrial and aquatic ecosystems. Ecosystems, 4, 421-429.
BARDGETT, R. D., HOBBS, P. J. & FROSTEGARD, A. 1996. Changes in soil fungal:bacterial biomass ratios following reductions in the intensity of management of an upland grassland. Biology and Fertility of Soils, 22, 261-264.
BASS, B., LUKETT, K., LUNDHOLM, J., MILLER, C., RETZLAFF, B., ROWE, B., SHARP, R. & WEIR, A. 2013. RE: EGR substrate depth over time on North American green roofs? To THURING, C. E.
BATES, A. J., SADLER, J. P. & MACKAY, R. 2013. Vegetation development over four years on two green roofs in the UK. Urban Forestry & Urban Greening, 12, 98-108.
BAUMANN, N. 2006. Ground-nesting birds on green roofs in Switzerland: preliminary observations. Urban Habitats, 4, 37-50.
BAZZAZ, F. A. 1979. Physiological ecology of plant succession. Annual Review of Ecology and Systematics, 10, 351-371.
BAZZAZ, F. A. 1996. Plants in changing environments: linking physiological, population and community ecology, Cambridge, UK, Cambridge University Press.
BAZZAZ, F. A. & PICKETT, S. T. A. 1980. Physiological ecology of tropical succession: a comparative review. Annual Review of Ecology and Systematics, 11, 287-310.
BEATTIE, D. & BERGHAGE, R. 2004. Green roof media characteristics: the basics. Greening Rooftops for Sustainable Communities. Portland, OR: Green Roofs for Healthy Cities.
BECKNER, M. 1968. The biological way of thought., Berkely, USA, University of California Press.
BEKKER, R. M., BAKKER, J. P., GRANDIN, U., KALAMEES, R., MILBERG, P., POSCHLOD, P., THOMPSON, K. & WILLEMS, J. H. 1998. Seed size, shape and vertical distribution in the soil: indicators of seed longevity. Functional Ecology, 12, 834-842.
BENVENUTI, S. & BACCI, D. 2010. Initial agronomic performances of Mediterranean xerophytes in simulated dry green roofs. Urban Ecosystems, 13, 349-363.
BILDERBACK, T. E., WARREN, S. L., OWEN, J. S. & ALBANO, J. P. 2005. Healthy substrates need physicals too! Horttechnology, 15, 747-751.
BLACK, C. C. & OSMOND, C. B. 2003. Crassulacean acid metabolism photosynthesis: 'working the night shift'. Photosynthesis Research, 76, 329-341.
BLAIR, R. B. & LAUNER, A. E. 1997. Butterfly diversity and human land use: Species assemblages along an urban gradient. Biological Conservation, 80, 113-125.

299
BLANK, L., VASL, A., LEVY, S., GRANT, G., KADAS, G., DAFNI, A. & BLAUSTEIN, L. 2013. Directions in green roof research: A bibliometric study. Building and Environment, 66, 23-28.
BLANUSA, T., MONTEIRO, M. M. V., FANTOZZI, F., VYSINI, E., LI, Y. & CAMERON, R. W. F. 2013. Alternatives to Sedum on green roofs: Can broad leaf perennial plants offer better 'cooling service'? Building and Environment, 59, 99-106.
BOETTCHER, S. E. & KALISZ, P. J. 1991. Single-tree influence on earthworms in forest soils in eastern Kentucky. Soil Science Society of America Journal, 55, 862-865.
BOIVIN, M. A., LAMY, M. P., GOSSELIN, A. & DANSEREAU, B. 2001. Effect of artificial substrate depth on freezing injury of six herbaceous perennials grown in a green roof system. Horttechnology, 11, 409-412.
BOLKER, B. M. & PACALA, S. W. 1999. Spatial moment equations for plant competition: Understanding spatial strategies and the advantages of short dispersal. American Naturalist, 153, 575-602.
BOODLEY, J. W. 1998. The commercial greenhouse, Albany, NY, Delmar Publishers.
BORMANN, F. & LIKENS, G. E. 1979. Pattern and process in a forested ecosystem: disturbance, development and the steady state based on the Hubbard Brook ecosystem study, New York, NY, Springer-Verlag.
BORNKAMM, R. 1961. Vegetation und Vegetations-Entwicklung auf Kiesdächern. Vegetatio, 10, 1-24.
BORNKAMM, R. 2007. Spontaneous development of urban woody vegetation on differing soils. Flora, 202, 695-704.
BOSSLER, S. & SUSZKA, B. 1988. Spontanvegetation auf Dächern in Osnabrück. Das Gartenamt, 37, 209-221.
BOTKIN, D. B. 1981. Causality and succession. In: WEST, D. C., SHUGART, H. H. & BOTKIN, D. B. (eds.) Forest Succession: Concepts and Application. New York, NY: Springer-Verlag.
BOTKIN, D. B. 1990. Discordant Harmonies: A New Ecology for the Twenty-First Century, New York, Oxford University Press.
BOURNERIAS, M. 1979. Guide des groupements vegetaux de la region parisienne: Bassin parisien-Nord de la France., Paris, F, SEDES(Societe d'edition d'enseignement superieur).
BRAAKER, S., GHAZOUL, J., OBRIST, M. K. & MORETTI, M. 2014. Habitat connectivity shapes urban arthropod communities: the key role of green roofs. Ecology, 95, 1010-1021.
BRAUN, H. 1986-1992 1992. RE: Pflegemassnahmen auf dem begrünten Schrägdach (Fertigstellung Juni '86).
BRAUN-BLANQUET, J. 1932. Plant sociology : the study of plant communities / translated revised and edited by George D. Fuller and Henry S. Conrad., New York ; London, McGraw-Hill.
BRAUN-BLANQUET, J. 1972. Plant sociology: the study of plant communities : authorized English translation of Pflanzensoziologie, New York, USA, Hafner Pub. Co.

300
BRENNEISEN, S. 2003. The benefits of biodiversity from green roofs: key design consequences. Greening Rooftops for Sustainable Communities. Chicago: Green Roofs for Healthy Cities.
BRENNEISEN, S. Green roofs - How nature returns to the city. International Conference on Urban Horticulture, SEPT 2-6, 2002 2004 Wadenswil SWITZERLAND. PROCEEDINGS OF THE INTERNATIONAL CONFERENCE ON URBAN HORTICULTURE, 289-293.
BRENNEISEN, S. 2009. Ökologisches Ausgleichspotenzial von Extensiven Dachbegrünungen: Bedeutung des Ersatz-Ökotops für den Arten- und Naturschutz und die Stadtentwicklungsplanung, Liestal, Physiogeographie und Umweltwandel des Geographischen Instituts der Universität Basel.
BRENNEISEN, S. 2010a. From pilot to mainstream: Green roofs in Basel, Switzerland. Cities Alive. Vancouver: Green Roofs for Healthy Cities.
BRENNEISEN, S. 2010b. Moos water filtration plant (Seewasserwerk Moos) [Online]. The Greenroof Projects Database: Greenroofs.com. Available: http://www.greenroofs.com/projects/pview.php?id=680 [Accessed].
BRENNEISEN, S. 2012. New light weight solutions for green roofs. Cities Alive: 10th Annual Green Roof & Wall Conference. Chicago, IL: Green Roofs for Healthy Cities.
BREUSTE, J., NIEMELAE, J. & SNEP, R. P. H. 2008. Applying landscape ecological principles in urban environments. Landscape Ecology, 23, 1139-1142.
BRITISH BRYOLOGICAL SOCIETY 2015. BBC Field Guide online pages. http://britishbryologicalsociety.org.uk: BBS.
BROWN, D. G., JOHNSON, K. M., LOVELAND, T. R. & THEOBALD, D. M. 2005. Rural land-use trends in the conterminous United States, 1950-2000. Ecological Applications, 15, 1851-1863.
BROWN, V. K. 1992. Plant succession and life-history strategy. Trends in Ecology & Evolution, 7, 143-144.
BUIST, R. & FRIEDRICH, C. 2008. Best Practice: The Organic Question Living Architecture Monitor. Toronto, ON.: Green Roofs for Healthy Cities.
BULL, J. W., SUTTLE, K. B., GORDON, A., SINGH, N. J. & MILNER-GULLAND, E. J. 2013. Biodiversity offsets in theory and practice. Oryx, 47, 369-380.
BUNT, A. C. 1988. Media and mixes for container-grown plants: a manual on the preparation and use of growing media for pot plants, London, UK, Unwin Hyman Ltd.
BURROWS, C. J. 1990. Processes of vegetation change, London, UK, Unwin Hyman Ltd.
BUTLER, C., BUTLER, E. & ORIANS, C. M. 2012. Native plant enthusiasm reaches new heights: Perceptions, evidence, and the future of green roofs. Urban Forestry & Urban Greening, 11, 1-10.
BUTTSCHARDT, T. 2005. Long-term development of extensive green roofs: Are they suitable as permanent habitat for soil meso- and macrofauna? World Green Roof Congress. Basel, CH: International Green Roof Association.
BUTTSCHARDT, T. K. 2001. Extensive Dachbegrünungen und Naturschutz. PhD Dissertation, Universität Karlsruhe (TH).

301
BYRNE, L. B. 2007. Habitat structure: A fundamental concept and framework for urban soil ecology. Urban Ecosystems, 10, 255-274.
CALLAHAN, J. T. 1984. Long-term ecological research. Bioscience, 34, 363-367.
CANHAM, C. D. & MARKS, P. L. 1985a. The response of woody plants to disturbance: patterns of establishment and growth. In: PICKETT, S. T. A. & WHITE, P. S. (eds.) The Ecology of Natural Disturbance and Patch Dynamics. San Diego, CA: Academic Press, Inc.
CANHAM, C. D. & MARKS, P. L. 1985b. The responses of woody plants to disturbance: patterns of establishment and growth. In: PICKETT, S. T. A. & WHITE, P. S. (eds.) The Ecology of Natural Disturbance and Patch Dynamics. London, UK: Academic Press, Inc.
CANTOR, S. L. 2008. Green roofs in sustainable landscape design, London, UK, W. W. Norton.
CARDINALE, B. J., DUFFY, J. E., GONZALEZ, A., HOOPER, D. U., PERRINGS, C., VENAIL, P., NARWANI, A., MACE, G. M., TILMAN, D., WARDLE, D. A., KINZIG, A. P., DAILY, G. C., LOREAU, M., GRACE, J. B., LARIGAUDERIE, A., SRIVASTAVA, D. S. & NAEEM, S. 2012. Biodiversity loss and its impact on humanity. Nature, 486, 59-67.
CARTER, T. & JACKSON, C. R. 2007. Vegetated roofs for stormwater management at multiple spatial scales. Landscape and Urban Planning, 80, 84-94.
CBD 2006. Global Biodiversity Outlook 2. Montreal, Canada: UN Secretariat of the Convention on Biological Diversity.
CBD. 2010a. 2010-2020: UN Decade on Biodiversity [Online]. Montreal, Canada: UN Secretariat of the Convention on Biological Diversity. Available: http://www.cbd.int/2011-2020/ [Accessed 06.18. 2012].
CBD 2010b. Global Biodiversity Outlook 3. Montreal, Canada: UN Secretariat of the Convention on Biological Diversity.
CBD 2012. Cities and Biodiversity Outlook: Action and Policy. Montreal, Canada: UN Secretariat of the Convention on Biological Diversity.
CERABOLINI, B. E. L., BRUSA, G., CERIANI, R. M., DE ANDREIS, R., LUZZARO, A. & PIERCE, S. 2010. Can CSR classification be generally applied outside Britain? Plant Ecology, 210, 253-261.
CHAPIN, F. S., WALKER, L. R., FASTIE, C. L. & SHARMAN, L. C. 1994. Mechanisms of primary succession following deglaciation at Glacier Bay, Alaska. Ecological Monographs, 64, 149-175.
CHAPIN, F. S., ZAVALETA, E. S., EVINER, V. T., NAYLOR, R. L., VITOUSEK, P. M., REYNOLDS, H. L., HOOPER, D. U., LAVOREL, S., SALA, O. E., HOBBIE, S. E., MACK, M. C. & DIAZ, S. 2000. Consequences of changing biodiversity. Nature, 405, 234-242.
CHAPIN, F. S. I., MATSON, P. A. & MOONEY, H. A. 2002. Principles of terrestrial ecosystem ecology, New York, Springer.
CHIESURA, A. 2004. The role of urban parks for the sustainable city. Landscape and Urban Planning, 68, 129-138.
CHOCHOLOUSKOVA, Z. & PYSEK, P. 2003. Changes in composition and structure of urban flora over 120 years: a case study of the city of Plzen. Flora, 198, 366-376.

302
CHOI, M.-S. & DUNNETT, N. 2008. Plant selections for calcareous grasslands on green roofs in the UK. World Green Roof Congress. London: World Green Roof Congress.
CILLIERS, S. S. & SIEBERT, S. J. 2011. Urban flora and vegetation: patterns and processes. In: NIEMELA, J. (ed.) Urban ecology: patterns, processes, and applications. New York: Oxford University Press Inc.
CILLIERS, S. S., WILLIAMS, N. S. G. & BARNARD, F. J. 2008. Patterns of exotic plant invasions in fragmented urban and rural grasslands across continents. Landscape Ecology, 23, 1243-1256.
CLEMENTS, F. E. 1916. Succession, Washington, DC, Carnegie Institute of Washington.
COFFIN, D. P. & LAUENROTH, W. K. 1989. Disturbances and gap dynamics in a semiarid grassland: A landscape-level approach. Landscape Ecology, 3, 19-27.
COHEN, J. W. 1988. Statistical power analysis for the behavioural sciences, Hillsdale, NJ, Lawrence Erlbaum Associates.
COLASANTI, R. L., HUNT, R. & ASKEW, A. P. 2001. A self-assembling model of resource dynamics and plant growth incorporating plant functional types. Functional Ecology, 15, 676-687.
COLEMAN, D. C. & CROSSLEY, D. A. 1996. Fundamentals of soil ecology, San Diego, USA, Academic Press.
COLEY, P. D. 1983. Herbivory and defensive characteristics of tree species in a lowland tropical forest. Ecological Monographs, 53, 209-233.
CONNELL, J. H. 1978. Diversity in tropical rain forests and coral reefs: high diversity of trees and corals is maintained only in a non-equilibrium state. Science, 199, 1302-1310.
CONNELL, J. H., NOBLE, I. R. & SLATYER, R. O. 1987. On the mechanisms producing successional change. Oikos, 50, 136-137.
CONNELL, J. H. & SLATYER, R. O. 1977. Mechanisms of succession in natural communities and their role in community stability and oragnization. American Naturalist, 111, 1119-1144.
CONNELLY, M. & HODGSON, M. 2013. Experimental investigation of the sound transmission of vegetated roofs. Applied Acoustics, 74, 1136-1143.
CONNELLY, M., LIU, K. & SCHAUB, J. 2006. BCIT Green Roof Research Program, Phase 1. Summary of Data Analysis. Observation Period: Jan. 1, 2005 to Dec. 31, 2005. In: CORPORATION, C. M. A. H. (ed.). Vancouver, B.C.: BC Institute of Technology.
COOK-PATTON, S. C. & BAUERLE, T. L. 2012. Potential benefits of plant diversity on vegetated roofs: A literature review. Journal of environmental management, 106, 85-92.
CORNELISSEN, J. H. C. 1996. An experimental comparison of leaf decomposition rates in a wide range of temperate plant species and types. Journal of Ecology, 84, 573-582.
CORNELISSEN, J. H. C., PEREZ-HARGUINDEGUY, N., DIAZ, S., GRIME, J. P., MARZANO, B., CABIDO, M., VENDRAMINI, F. & CERABOLINI, B. 1999. Leaf structure and defence control litter decomposition rate across species and life forms in regional floras on two continents. New Phytologist, 143, 191-200.

303
CRUTZEN, P. J. 2004. New Directions: The growing urban heat and pollution "island" effect - impact on chemistry and climate. Atmospheric Environment, 38, 3539-3540.
CURRIE, B. A. & BASS, B. 2008. Estimates of air pollution mitigation with green plants and green roofs using the UFORE model. Urban Ecosystems, 11, 409-422.
DALE, V. H., LUGO, A. E., MACMAHON, J. A. & PICKETT, S. T. A. 1998. Ecosystem management in the context of large, infrequent disturbances. Ecosystems, 1, 546-557.
DALLIMER, M., IRVINE, K. N., SKINNER, A. M. J., DAVIES, Z. G., ROUQUETTE, J. R., MALTBY, L. L., WARREN, P. H., ARMSWORTH, P. R. & GASTON, K. J. 2012. Biodiversity and the Feel-Good Factor: Understanding Associations between Self-Reported Human Well-being and Species Richness. Bioscience, 62, 47-55.
DARIUS, F. & DREPPER, J. 1983. Ökologische Untersuchungen auf bewachsenen Kiesdächern in West-Berlin. Master's dissertation (Diplomarbeit), Technical-University Berlin.
DAVIES, A. & DAVIES, O. 1980. English agriculturalists' attitudes towards grassland vegetation, 1780-1914: an ecological perspective. Landscape History, 18, 71-80.
DAVIS, M. A., GRIME, J. P. & THOMPSON, K. 2000. Fluctuating resources in plant communities: a general theory of invasibility. Journal of Ecology, 88, 528-534.
DAWKINS, R. 2004. The ancestor's tale: a pilgrimage to the dawn of life, London, UK, Weidenfield & Nicholson.
DE RUITER, P. C., NEUTEL, A.-M. & MOORE, J. 2005. The balance between productivity and food web structure in soil ecosystems. In: BARDGETT, R. D., USHER, M. B. & HOPKINS, D. W. (eds.) Biological Diversity and Function in Soils. Cambridge, UK: Cambridge University PressBritish Ecological Society
DEAN, W. R. J., MILTON, S. J. & KLOTZ, S. 1997. The role of ant nest-mounds in maintaining small-scale patchiness in dry grasslands in Central Germany. Biodiversity and Conservation, 6, 1293-1307.
DEBRUYN, L. A. L. & CONACHER, A. J. 1994. The effect of ant biopores on water infiltration in soils in undisturbed bushland and in farmland in a semiarid environment. Pedobiologia, 38, 193-207.
DEL BARRIO, E. P. 1998. Analysis of the green roofs cooling potential in buildings. Energy and Buildings, 27, 179-193.
DEL MORAL, R. 2007. Limits to convergence of vegetation during early primary succession. Journal of Vegetation Science, 18, 479-488.
DELCOURT, H. R. & DELCOURT, P. A. 1988. Quaternary landscape ecology: Relevant scales in space and time. Landscape Ecology, 2, 23-44.
DENARDO, J. C., JARRETT, A. R., MANBECK, H. B., BEATTIE, D. J. & BERGHAGE, R. D. 2005. Stormwater mitigation and surface temperature reduction by green roofs. Transactions of the Asae, 48, 1491-1496.
DENEF, K., SIX, J., BOSSUYT, H., FREY, S. D., ELLIOTT, E. T., MERCKX, R. & PAUSTIAN, K. 2001. Influence of dry-wet cycles on the interrelationship between aggregate, particulate organic matter, and microbial community dynamics. Soil Biology & Biochemistry, 33, 1599-1611.

304
DESTEVEN, D. 1991. Experiments on mechanisms of tree establishment in old-field succession: seedling survival and growth. Ecology, 72, 1076-1088.
DIAMOND, J. M. 1975. The island dilemma: lessons of modern biogeographic studies for the design of natural reserves. Biological Conservation, 7, 129-146.
DIAZ, S., FARGIONE, J., CHAPIN, F. S., III & TILMAN, D. 2006. Biodiversity loss threatens human well-being. Plos Biology, 4, 1300-1305.
DIAZ, S., HODGSON, J. G., THOMPSON, K., CABIDO, M., CORNELISSEN, J. H. C., JALILI, A., MONTSERRAT-MARTI, G., GRIME, J. P., ZARRINKAMAR, F., ASRI, Y., BAND, S. R., BASCONCELO, S., CASTRO-DIEZ, P., FUNES, G., HAMZEHEE, B., KHOSHNEVI, M., PEREZ-HARGUINDEGUY, N., PEREZ-RONTOME, M. C., SHIRVANY, F. A., VENDRAMINI, F., YAZDANI, S., ABBAS-AZIMI, R., BOGAARD, A., BOUSTANI, S., CHARLES, M., DEHGHAN, M., DE TORRES-ESPUNY, L., FALCZUK, V., GUERRERO-CAMPO, J., HYND, A., JONES, G., KOWSARY, E., KAZEMI-SAEED, F., MAESTRO-MARTINEZ, M., ROMO-DIEZ, A., SHAW, S., SIAVASH, B., VILLAR-SALVADOR, P. & ZAK, M. R. 2004. The plant traits that drive ecosystems: Evidence from three continents. Journal of Vegetation Science, 15, 295-304.
DIEKMANN, M. 2003. Species indicator values as an important tool in applied plant ecology - a review. Basic and Applied Ecology, 4, 493-506.
DIMOUDI, A. & NIKOLOPOULOU, M. 2003. Vegetation in the urban environment: microclimatic analysis and benefits. Energy and Buildings, 35, 69-76.
DIVJAK, D. & FIELLER, N. 2014. Cluster analysis: finding structure in linguistic data. In: GLYNN, D. & ROBINSON, J. A. (eds.) Corpus methods for semantics: quantitative studies in polysemy and synonymy. Amsterdam/ Philadephia: John Benjamins Publishing Company.
DODD, M., SILVERTOWN, J., MCCONWAY, K., POTTS, J. & CRAWLEY, M. 1995. Community stability: a 60-year record of trends and outbreaks in the occurrence of species in the Park Grass Experiment. Journal of Ecology, 83, 277-285.
DOYLE, W. T. 1970. The biology of higher cryptogams, London, UK, Collier-Macmillan.
DRURY, W. H. & NISBET, I. C. T. 1973. Succession. Journal of the Arnold Arboretum, 54, 331-368.
DUNCAN, R. P., CLEMANTS, S. E., CORLETT, R. T., HAHS, A. K., MCCARTHY, M. A., MCDONNELL, M. J., SCHWARTZ, M. W., THOMPSON, K., VESK, P. A. & WILLIAMS, N. S. G. 2011. Plant traits and extinction in urban areas: a meta-analysis of 11 cities. Global Ecology and Biogeography, 20, 509-519.
DUNNETT, N. 2004. The dynamic nature of plant communities: pattern and process in designed plant communities. In: DUNNETT, N. & HITCHMOUGH, J. (eds.) The dynamic landscape. London: Spon Press.
DUNNETT, N. 2006. Green roofs for biodiversity: reconciling aesthetics with ecology. Greening Rooftops for Sustainable Communities. Boston, MA: Green Roofs for Healthy Cities.
DUNNETT, N. & KINGSBURY, N. 2004. Planting green roofs and living walls, Portland, OR, Timber Press.

305
DUNNETT, N., NAGASE, A., BOOTH, R. & GRIME, P. 2008a. Influence of vegetation composition on runoff in two simulated green roof experiments. Urban Ecosystems, 11, 385-398.
DUNNETT, N., NAGASE, A. & HALLAM, A. 2008b. The dynamics of planted and colonising species on a green roof over six growing seasons 2001-2006: influence of substrate depth. Urban Ecosystems, 11, 373-384.
DUNNETT, N. P. & WILLIS, A. J. 2000. Dynamics of Chamerion angustifolium in grassland vegetation over a thirty-nine-year period. Plant Ecology, 148, 43-50.
DUNNETT, N. P., WILLIS, A. J., HUNT, R. & GRIME, J. P. 1998. A 38-year study of relations between weather and vegetation dynamics in road verges near Bibury, Gloucestershire. Journal of Ecology, 86, 610-623.
DURHMAN, A. K., ROWE, D. B. & RUGH, C. L. 2006. Effect of watering regimen on chlorophyll fluorescence and growth of selected green roof plant taxa. Hortscience, 41, 1623-1628.
DURHMAN, A. K., ROWE, D. B. & RUGH, C. L. 2007. Effect of substrate depth on initial growth, coverage, and survival of 25 succulent green roof plant taxa. Hortscience, 42, 588-595.
DVORAK, B. 2011. Comparative analysis of green roof guidelines and standards in Europe and North America. Journal of Green Building, 6, 170-191.
DVORAK, B. & VOLDER, A. 2010. Green roof vegetation for North American ecoregions: A literature review. Landscape and Urban Planning, 96, 197-213.
DÖVELING, J. 2009. Two decades of green roof policies in Stuttgart: a field report. In: APPL, R. & ANSEL, W. (eds.) 2nd International Green Roof Congress. Nürtingen, Germany: International Green Roof Association E.V. (IGRA).
EDSON, M. M., FOIN, T. C. & KNAPP, C. M. 1981. Emergent properties and ecological research. American Naturalist, 118, 593-596.
EFB. 2013. European Federation of Green Roof Associations, [Online]. European Federation of Green Roof Associations,. Available: http://www.efb-greenroof.eu [Accessed 31 Oct 2013].
EGLER, F. E. 1954. Vegetation science concepts I. Initial floristic composition, a factor in old-field vegetation development with 2 figs. Vegetatio, 4, 412-417.
ELDRIDGE, D. J. 1993. Effects of ants on sandy soils in semiarid eastern Australia: local distribution of nest entrances and their effect on infiltration of water. Australian Journal of Soil Research, 31, 509-518.
ELDRIDGE, D. J. & PICKARD, J. 1994. Effects of ants on sandy soils in semiarid eastern Australia. 2: Relocation of nest entrances and consequences for bioturbation. Australian Journal of Soil Research, 32, 323-333.
ELLENBERG, H. 1986. Vegetation ecology of Central Europe, Cambridge, Cambridge University Press.
ELLENBERG, H., WEBER, H. E., DÜLL, R., WIRTH, V., WERNER, W. & PAULISEN, D. 1991. Zeigerwerte von Pflanzen in Mitteleuropa, Göttingen, Erich Goltze KG, Göttingen.
ELMQVIST, T., FRAGKIAS, M., GOODNESS, J., GUENERALP, B., MARCOTULLIO, P. J., MCDONALD, R. I., PARNELL, S., SCHEWENIUS, M., SENDSTAD, M., SETO, K. C.,

306
WILKINSON, C., ALBERTI, M., FOLKE, C., FRANTZESKAKI, N., HAASE, D., KATTI, M., NAGENDRA, H., NIEMELA, J., PICKETT, S. T. A., REDMAN, C. L. & TIDBALL, K. 2013. Stewardship of the Biosphere in the Urban Era. In: ELMQVIST, T., FRAGKIAS, M., GOODNESS, J., GUENERALP, B., MARCOTULLIO, P. J., MCDONALD, R. I., PARNELL, S., SCHEWENIUS, M., SENDSTAD, M., SETO, K. C. & WILKINSON, C. (eds.) Urbanization, Biodiversity and Ecosystem Services: Challenges and Opportunities: A Global Assessment. Springer.
EMILSSON, T. 2008. Vegetation development on extensive vegetated green roofs: Influence of substrate composition, establishment method and species mix. Ecological Engineering, 33, 265-277.
EMILSSON, T., BERNDTSSON, J. C., MATTSSON, J. E. & ROLF, K. 2007. Effect of using conventional and controlled release fertiliser on nutrient runoff from various vegetated roof systems. Ecological Engineering, 29, 260-271.
EMILSSON, T. & ROLF, K. 2005. Comparison of establishment methods for extensive green roofs in southern Sweden. Urban Forestry & Urban Greening, 3, 103-111.
ERIKSSON, O. 1996. Regional dynamics of plants: A review of evidence for remnant, source-sink and metapopulations. Oikos, 77, 248-258.
EWALD, J. 2003. The sensitivity of Ellenberg indicator values to the completeness of vegetation releves. Basic and Applied Ecology, 4, 507-513.
EXPANDED SLATE CLAY AND SHALE INSTITUTE. 2010. ESCS Lightweight Aggregate [Online]. http://www.escsi.org. Available: http://www.escsi.org/ContentPage.aspx?id=524 [Accessed July 8 2013].
FACELLI, J. M. & PICKETT, S. T. A. 1991. Plant litter: its dynamics and effects on plant community structure. Botanical Review, 57, 1-32.
FARRELL, C., MITCHELL, R. E., SZOTA, C., RAYNER, J. P. & WILLIAMS, N. S. G. 2012. Green roofs for hot and dry climates: Interacting effects of plant water use, succulence and substrate. Ecological Engineering, 49, 270-276.
FAUL, F., ERDFELDER, E., BUCHNER, A. & LANG, A.-G. 2009. Statistical power analyses using G*Power 3.1: tests for correlation and regression analyses. Behaviour Research Methods, 41, 1149-1160.
FBB. 2012. Gründachmarkt von 2008 auf 2011 um etwa 19% gewachsen! [Online]. Saarbrücken, Germany: Fachvereinigung Bauwerksbegrünung e.V. (FBB). Available: http://www.fbb.de/aktuelles/detailansicht/gruendachmarkt-von-2008-auf-2011-um-etwa-19-gewachsen-/53/ [Accessed 2012.07.06 2012].
FELSON, A. J., BRADFORD, M. A. & TERWAY, T. M. 2013. Promoting Earth Stewardship through urban design experiments. Frontiers in Ecology and the Environment, 11, 362-367.
FELSON, A. J. & PICKETT, S. T. A. 2005. Designed experiments: new approaches to studying urban ecosystems. Frontiers in Ecology and the Environment, 3, 549-556.
FENNER, M. 1987. Seed characteristics in relation to succession. In: GRAY, A. J., CRAWLEY, M. J. & EDWARDS, P. J. (eds.) Colonization, Succession and Stability. Oxford: Blackwell Scientific, British Ecological Society.

307
FISCHER, L. K., VON DER LIPPE, M. & KOWARIK, I. 2013a. Urban grassland restoration: which plant traits make desired species successful colonizers? Applied Vegetation Science, 16, 272-285.
FISCHER, L. K., VON DER LIPPE, M., RILLIG, M. C. & KOWARIK, I. 2013b. Creating novel urban grasslands by reintroducing native species in wasteland vegetation. Biological Conservation, 159, 119-126.
FLL 2008. Guidelines for the planning, construction and maintenance of green roofing: green roofing guideline. 7 ed. Bonn, Germany: Forschungsgesellschaft Landschaftsentwicklung Landschaftsbau E.V. -FLL.
FORMAN, R. & GODRON, M. 1986. Landscape ecology, New York, John Wiley & Sons, Inc.
FOXCROFT, L. C., PICKETT, S. T. A. & CADENASSO, M. L. 2011. Expanding the conceptual frameworks of plant invasion ecology. Perspectives in Plant Ecology Evolution and Systematics, 13, 89-100.
FRANCIS, R. A. & LORIMER, J. 2011. Urban reconciliation ecology: The potential of living roofs and walls. Journal of Environmental Management, 92, 1429-1437.
FRANKLIN, J. F., BLEDSOE, C. S. & CALLAHAN, J. T. 1990. Contributions of the long-term ecological research program: an expanded network of scientists, sites, and programs can provide crucial comparative analyses. Bioscience, 40, 509-523.
FRESCHET, G. T., AERTS, R. & CORNELISSEN, J. H. C. 2012. A plant economics spectrum of litter decomposability. Functional Ecology, 26, 56-65.
FRIDLEY, J. D., GRIME, J. P., ASKEW, A. P., MOSER, B. & STEVENS, C. J. 2011. Soil heterogeneity buffers community response to climate change in species-rich grassland. Global Change Biology, 17, 2002-2011.
FRIEDRICH, C. R. 2005. Principles for selecting the proper components for a green roof growing media. Greening Rooftops for Sustainable Communities. Washington, DC: Green Roofs for Healthy Cities.
GALTUNG, J. 1986. The green movement: a socio-historical exploration. International Sociology, 1, 75-90.
GASTON, K. J., AVILA-JIMENEZ, M. L. & EDMONDSON, J. L. 2013. Review: Managing urban ecosystems for goods and services. Journal of Applied Ecology, 50, 830-840.
GEDGE, D. 2003. ‘…From Rubble to Redstarts…’. Greening Rooftops for Sustainable Communities. Chicago: Green Roofs for Healthy Cities.
GEDGE, D. & FRITH, M. 2005. An eye for the green top: an independent voice for green roofs in the UK. Greening Rooftops for Sustainable Communities. Washington, D.C.: Green Roofs for Healthy Cities.
GEDGE, D. & KADAS, G. 2004. Bugs, bees and spiders: green roof design for rare invertebrates. Greening Rooftops for Sustainable Communities. Portland, OR: Green Roofs for Healthy Cities.
GETTER, K. L. & ROWE, D. B. 2006. The role of extensive green roofs in sustainable development. Hortscience, 41, 1276-1285.
GETTER, K. L. & ROWE, D. B. 2007. Effect of substrate depth and planting season on Sedum plug survival on green roofs. Journal of Environmental Horticulture, 25, 95-99.

308
GETTER, K. L. & ROWE, D. B. 2008. Media depth influences Sedum green roof establishment. Urban Ecosystems, 11, 361-372.
GETTER, K. L. & ROWE, D. B. 2009. Substrate Depth Influences Sedum Plant Community on a Green Roof. Hortscience, 44, 401-407.
GETTER, K. L., ROWE, D. B. & ANDRESEN, J. A. 2007. Quantifying the effect of slope on extensive green roof stormwater retention. Ecological Engineering, 31, 225-231.
GETTER, K. L., ROWE, D. B., ANDRESEN, J. A. & WICHMAN, I. S. 2011. Seasonal heat flux properties of an extensive green roof in a Midwestern US climate. Energy and Buildings, 43, 3548-3557.
GETTER, K. L., ROWE, D. B. & CREGG, B. M. 2009a. Solar radiation intensity influences extensive green roof plant communities. Urban Forestry & Urban Greening, 8, 269-281.
GETTER, K. L., ROWE, D. B., ROBERTSON, G. P., CREGG, B. M. & ANDRESEN, J. A. 2009b. Carbon Sequestration Potential of Extensive Green Roofs. Environmental Science & Technology, 43, 7564-7570.
GIBSON, C. W. D. & BROWN, V. K. 1991. The nature and rate of development of calcareous grassland in southern Britain. Biological Conservation, 58, 297-316.
GIBSON, C. W. D. & BROWN, V. K. 1992. Grazing and vegetation change: deflected or modified succession. Journal of Applied Ecology, 29, 120-131.
GILBERT, O. L. 1989. The ecology of urban habitats, London, Chapman and Hall.
GLEASON, H. A. 1939a. The individualistic concept of the plant association. Amer Midland Nat, 21, 92-110.
GLEASON, H. A. 1939b. The individualistic concept of the plant association. In: KELLER, D. R. & GOLLEY, F. B. (eds.) The Philosophy of Ecology (2000). Athens, Georgia, USA: University of Georgia.
GLENN-LEWIN, D. C. & VAN DER MAAREL, E. 1992. Patterns and processes of vegetation dynamics. In: GLENN-LEWIN, D. C., PEET, R. K. & VEBLEN, T. T. (eds.) Plant succession: theory and prediction. London, UK: Chapman & Hall
GLIME, J. 2015. Bryophyte Ecology. 10 ed. Michigan, USA: Michigan Technological University and the International Association of Bryologists.
GODDARD, M. A., DOUGILL, A. J. & BENTON, T. G. 2010. Scaling up from gardens: biodiversity conservation in urban environments. Trends in Ecology & Evolution, 25, 90-98.
GODEFROID, S. & KOEDAM, N. 2003. How important are large vs. small forest remnants for the conservation of the woodland flora in an urban context? Global Ecology and Biogeography, 12, 287-298.
GODEFROID, S. & KOEDAM, N. 2007. Urban plant species patterns are highly driven by density and function of built-up areas. Landscape Ecology, 22, 1227-1239.
GOMEZ-BAGGETHUN, E. & BARTON, D. N. 2013. Classifying and valuing ecosystem services for urban planning. Ecological Economics, 86, 235-245.
GOODALL, D. W. 2014. A century of vegetation science. Journal of Vegetation Science, 25, 913-916.

309
GRAHAM, D. J. & HUTCHINGS, M. J. 1988. Estimation of the seed bank of a chalk grassland ley established on former arable land. Journal of Applied Ecology, 25, 241-252.
GRANT, G. 2006. Green roofs and facades, Bracknell, UK, IHS BRE Press.
GRANT, G. 2012. Ecosystem services come to town: greening cities by working with nature, Oxford, UK, John Wiley & Sons, Ltd.
GREATER LONDON AUTHORITY 2008. Living roofs and wallsTechnical report: Supporting London Plan Policy. London, UK: Greater London Authority.
GREEN ROOF SYSTEMS PROJECT. 2013. Marie Curie IAPP Green Roof Systems Project [Online]. University of Sheffield. Available: http://www.green-roof-systems.co.uk [Accessed Aug. 1st 2013].
GREEN ROOFS AUSTRALASIA. 2012. Green Roofs Australasia, [Online]. Green Roofs Australasia,. Available: https://greenroofsaustralasia.com.au [Accessed 31 Oct 2013].
GREENSLADE, P. J. M. 1983. Adversity selection and the habitat templet. American Naturalist, 122, 352-365.
GRHC 2012. Annual Green Roof Industry Survey for 2011. Toronto, Canada: Green Roofs for Healthy Cities.
GRHC 2014. 2013 Annual Green Roof Industry Survey. Toronto, ON: Green Roofs for Healthy Cities.
GRIME, J. P. 1973a. Competitive exclusion in herbaceous vegetation. Nature, 242, 344-347.
GRIME, J. P. 1973b. Control of species density in herbeaceous vegetation. Journal of Environmental Management, 1, 151-167.
GRIME, J. P. 1974. Vegetation classification by reference to strategies. Nature, 250, 26-31.
GRIME, J. P. 1977. Evidence for existence of three primary strategies in plants and its relevance to ecological and evolutionary theory. American Naturalist, 111, 1169-1194.
GRIME, J. P. 1987. Dominant and subordinate components of plant communities: implications for succession, stability and diversity. In: GRAY, A. J., CRAWLEY, M. J. & EDWARDS, P. J. (eds.) Colonization, Succession, and Stability. Oxford, UK: Blackwell Scientific, British Ecological Society.
GRIME, J. P. 2001. Plant strategies, vegetation processes, and ecosystem properties, Chichester, John Wiley & Sons, Ltd.
GRIME, J. P. & CURTIS, A. V. 1976. Interaction of Drought and Mineral Nutrient Stress in Calcareous Grassland. Journal of Ecology, 64, 975-988.
GRIME, J. P., FRIDLEY, J. D., ASKEW, A. P. & BUCKLAND, S. M. 2013. Buxton Climate Change Impacts Laboratory (BCCIL) [Online]. Sheffield, UK: University of Sheffield. Available: http://bccil.group.shef.ac.uk/ [Accessed 5 Nov 2013].
GRIME, J. P., HODGSON, J. G. & HUNT, R. 2007. Comparative Plant Ecology: a functional approach to common British species, Colvend, UK, Castlepoint Press.
GRIME, J. P. & PIERCE, S. 2012. The evolutionary strategies that shape ecosystems, Chichester, UK, John Wiley & Sons, Ltd.

310
GRIME, J. P., THOMPSON, K., HUNT, R., HODGSON, J. G., CORNELISSEN, J. H. C., RORISON, I. H., HENDRY, G. A. F., ASHENDEN, T. W., ASKEW, A. P., BAND, S. R., BOOTH, R. E., BOSSARD, C. C., CAMPBELL, B. D., COOPER, J. E. L., DAVISON, A. W., GUPTA, P. L., HALL, W., HAND, D. W., HANNAH, M. A., HILLIER, S. H., HODKINSON, D. J., JALILI, A., LIU, Z., MACKEY, J. M. L., MATTHEWS, N., MOWFORTH, M. A., NEAL, A. M., READER, R. J., REILING, K., ROSSFRASER, W., SPENCER, R. E., SUTTON, F., TASKER, D. E., THORPE, P. C. & WHITEHOUSE, J. 1997. Integrated screening validates primary axes of specialisation in plants. Oikos, 79, 259-281.
GRIMM, N. B., FAETH, S. H., GOLUBIEWSKI, N. E., REDMAN, C. L., WU, J. G., BAI, X. M. & BRIGGS, J. M. 2008. Global change and the ecology of cities. Science, 319, 756-760.
GRIMM, N. B., GROVE, J. M., PICKETT, S. T. A. & REDMAN, C. L. 2000. Integrated approaches to long-term studies of urban ecological systems. Bioscience, 50, 571-584.
GRIMMOND, C. S. B., POTTER, S. K., ZUTTER, H. N. & SOUCH, C. 2001. Rapid methods to estimate sky-view factors applied to urban areas. International Journal of Climatology, 21, 903-913.
GRO 2014. The GRO green roof code: green roof code of best practice for the UK 2014. 2nd ed. Sheffield, UK: Green Roof Organisation (GRO).
GROFFMAN, P. M., CAVENDER-BARES, J., BETTEZ, N. D., GROVE, J. M., HALL, S. J., HEFFERNAN, J. B., HOBBIE, S. E., LARSON, K. L., MORSE, J. L., NEILL, C., NELSON, K., O'NEIL-DUNNE, J., OGDEN, L., PATAKI, D. E., POLSKY, C., CHOWDHURY, R. R. & STEELE, M. K. 2014. Ecological homogenization of urban USA. Frontiers in Ecology and the Environment, 12, 74-81.
GRUBB, P. J. 1977. Maintenance of species-richness in plant communities: importance of regeneration niche. Biological Reviews of the Cambridge Philosophical Society, 52, 107-145.
GRÜTZMACHER, B. 1993. Grasdach und Dachbegrünung: Planung, Aufbau, Eigenleistung für moderne Grasdächer, München, Georg D. W. Callwey Verlag.
GÖBELSMANN, M. & HIPPERT, S. 2004. Die historische Entwicklung der Dachbegrünung und ihre ökologischen Auswirkungen heute. Master's, Ruhr-Universität Bochum.
HAHS, A. K., MCDONNELL, M. J., MCCARTHY, M. A., VESK, P. A., CORLETT, R. T., NORTON, B. A., CLEMANTS, S. E., DUNCAN, R. P., THOMPSON, K., SCHWARTZ, M. W. & WILLIAMS, N. S. G. 2009. A global synthesis of plant extinction rates in urban areas. Ecology Letters, 12, 1165-1173.
HANDRECK, K. & BLACK, N. 2010. Growing media for ornamental plants and turf, Sydney, Australia, University of New South Wales Press Ltd.
HANSKI, I. 1994. A practical model of metapopulation dynamics. Journal of Animal Ecology, 63, 151-162.
HANSKI, I. 1998. Metapopulation dynamics. Nature, 396, 41-49.
HANSKI, I. & OVASKAINEN, O. 2002. Extinction debt at extinction threshold. Conservation Biology, 16, 666-673.
HARPER, J. L. 1977. Population biology of plants, London, UK, Academic Press, Inc.
HARRISON, S. & BRUNA, E. 1999. Habitat fragmentation and large-scale conservation: what do we know for sure? Ecography, 22, 225-232.

311
HAVLIN, J. L., TISDALE, S. L., NELSON, W. L. & BEATON, J. D. 2005. Soil fertility and fertilizers, Upper Saddle River, NJ, Pearson/ Prentice Hall.
HAWKEN, P. 1994. The ecology of commerce: a declaration of sustainability, London, Weidenfeld & Nicolson.
HECTOR, A., SCHMID, B., BEIERKUHNLEIN, C., CALDEIRA, M. C., DIEMER, M., DIMITRAKOPOULOS, P. G., FINN, J. A., FREITAS, H., GILLER, P. S., GOOD, J., HARRIS, R., HOGBERG, P., HUSS-DANELL, K., JOSHI, J., JUMPPONEN, A., KORNER, C., LEADLEY, P. W., LOREAU, M., MINNS, A., MULDER, C. P. H., O'DONOVAN, G., OTWAY, S. J., PEREIRA, J. S., PRINZ, A., READ, D. J., SCHERER-LORENZEN, M., SCHULZE, E. D., SIAMANTZIOURAS, A. S. D., SPEHN, E. M., TERRY, A. C., TROUMBIS, A. Y., WOODWARD, F. I., YACHI, S. & LAWTON, J. H. 1999. Plant diversity and productivity experiments in European grasslands. Science, 286, 1123-1127.
HEIM, A. & LUNDHOLM, J. 2013. Cladonia lichens on extensive green roofs: evapotranspiration, substrate temperature, and albedo. F1000Research, 2, 274-274.
HEIM, A. & LUNDHOLM, J. 2014. Species interactions in green roof vegetation suggest complementary planting mixtures. Landscape and Urban Planning, 130, 125-133.
HEIM, A., LUNDHOLM, J. & PHILIP, L. 2014. The impact of mosses on the growth of neighbouring vascular plants, substrate temperature and evapotranspiration on an extensive green roof. Urban Ecosystems, 17, 1119-1133.
HELLER, A. 2011. RE: Personal communication regarding Stuttgart Rathausgarage green roofs. To THÜRING, C.
HEMPEL, C. G. & OPPENHEIM, P. 1948. Studies in the logic of explanation. Philosophy of Science, 15, 135-175.
HENLE, P. 1942. The status of emergence. Journal of Philosophy, 39, 486-93.
HENNEBERG, M. & MANN, G. 2010. Spagat zwischen Entwässerung und klimawirksamer Retention Deutsches IngenieurBlatt. Berlin: Schiele&Schön.
HENRY, A. & FRASCARIA-LACOSTE, N. 2012. The green roof dilemma - Discussion of Francis and Lorimer (2011). Journal of Environmental Management, 104, 91-92.
HERITAGE LOTTERY FUND 2014. State of UK Public Parks 2014 - Research Report. UK: Heritage Lottery Fund.
HIGGS, E. 2003. Nature by design: people, natural process, and ecological restoration, Cambridge, USA, MIT Press.
HILL, M. O., BLACKSTOCK, T. H., LONG, D. G. & ROTHERO, G. P. 2008. A Checklist and Census Catalogue of British and Irish Bryophytes (updated 2008), Cardiff, Wales, British Bryological Society.
HILL, M. O., ROY, D. B., MOUNTFORD, J. O. & BUNCE, R. G. H. 2000. Extending Ellenberg's indicator values to a new area: an algorithmic approach. Journal of Applied Ecology, 37, 3-15.
HILL, M. O., ROY, D. B. & THOMPSON, K. 2002. Hemeroby, urbanity and ruderality: bioindicators of disturbance and human impact. Journal of Applied Ecology, 39, 708-720.
HILLEL, D. 1998. Environmental Soil Physics, San Diego, CA, Academic Press.

312
HITCHMOUGH, J. D. 1994. The principles underlying the management of urban vegetation. In: LEYDON, R. (ed.) Urban landscape management. Sydney: Inkata Press.
HOBBIE, S. E. 1992. Effects of plant-species on nutrient cycling. Trends in Ecology & Evolution, 7, 336-339.
HOBBS, R. J., ARICO, S., ARONSON, J., BARON, J. S., BRIDGEWATER, P., CRAMER, V. A., EPSTEIN, P. R., EWEL, J. J., KLINK, C. A., LUGO, A. E., NORTON, D., OJIMA, D., RICHARDSON, D. M., SANDERSON, E. W., VALLADARES, F., VILA, M., ZAMORA, R. & ZOBEL, M. 2006. Novel ecosystems: theoretical and management aspects of the new ecological world order. Global Ecology and Biogeography, 15, 1-7.
HOBBS, R. J., HIGGS, E., HALL, C. M., BRIDGEWATER, P., CHAPIN, F. S., III, ELLIS, E. C., EWEL, J. J., HALLETT, L. M., HARRIS, J., HULVEY, K. B., JACKSON, S. T., KENNEDY, P. L., KUEFFER, C., LACH, L., LANTZ, T. C., LUGO, A. E., MASCARO, J., MURPHY, S. D., NELSON, C. R., PERRING, M. P., RICHARDSON, D. M., SEASTEDT, T. R., STANDISH, R. J., STARZOMSKI, B. M., SUDING, K. N., TOGNETTI, P. M., YAKOB, L. & YUNG, L. 2014. Managing the whole landscape: historical, hybrid, and novel ecosystems. Frontiers in Ecology and the Environment, 12, 557-564.
HOBBS, R. J., HIGGS, E. & HARRIS, J. A. 2009. Novel ecosystems: implications for conservation and restoration. Trends in Ecology & Evolution, 24, 599-605.
HODGSON, J. G., WILSON, P. J., HUNT, R., GRIME, J. P. & THOMPSON, K. 1999. Allocating C-S-R plant functional types: a soft approach to a hard problem. Oikos, 85, 282-294.
HONEY-ROSES, J., SCHNEIDER, D. W. & BROZOVIC, N. 2014. Changing Ecosystem Service Values Following Technological Change. Environmental Management, 53, 1146-1157.
HOOPER, D. U., CHAPIN, F. S., EWEL, J. J., HECTOR, A., INCHAUSTI, P., LAVOREL, S., LAWTON, J. H., LODGE, D. M., LOREAU, M., NAEEM, S., SCHMID, B., SETALA, H., SYMSTAD, A. J., VANDERMEER, J. & WARDLE, D. A. 2005. Effects of biodiversity on ecosystem functioning: A consensus of current knowledge. Ecological Monographs, 75, 3-35.
HOPE-SIMPSON, J. F. 1940. Studies of the vegetation of the English chalk. VI. Late stages in succession leading to chalk grassland. Jour Ecol, 28, 386-402.
HUBBARD, C. E. 1992. Grasses: a guide to their structure, identification, uses, and distribution in the British Isles, Harmondsworth, UK, Penguin Books Ltd.
HUNT, H. W., INGHAM, E. R., COLEMAN, D. C., ELLIOTT, E. T. & REID, C. P. P. 1988. Nitrogen limitation of production and decomposition in prairie, mountain meadow, and pine forest. Ecology, 69, 1009-1016.
HUNT, R., HODGSON, J. G., THOMPSON, K., BUNGENER, P., DUNNETT, N. P. & ASKEW, A. P. 2004. A new practical tool for deriving a functional signature for herbaceous vegetation. Applied Vegetation Science, 7.
HUNTER-BLOCK, A., LIVESLEY, S. J. & WILLIAMS, N. S. G. 2012. Responding to the Urban Heat Island: A Review of the Potential of Green Infrastructure. Victoria, AU: Victorian Centre for Climate Change Adaptation Research,.
HUSTON, M. 1979. General hypothesis of species-diversity. American Naturalist, 113, 81-101.
HUSTON, M. & SMITH, T. 1987. Plant succession: life-history and competition. American Naturalist, 130, 168-198.

313
HYVONEN, R., ANDERSSON, S., CLARHOLM, M. & PERSSON, T. 1994. Effects of Lumbricids and Enchytraeids on nematodes in limed and unlimed coniferous mor humus. Biology and Fertility of Soils, 17, 201-205.
HÖVEKAMP, T. 2010. RE: Conversation with Thomas Hövekamp, first green roof installer at ZinCo GmbH. To THURING, C.
HÜTTENMOSER, B. 2010. RE: Personal communication regarding FH Nürtingen green roof. To THÜRING, C.
ICLEI 2011. Financing the Resilient City: A demand driven approach to development, disaster risk reduction and climate adaptation - An ICLEI White Paper, ICLEI Global Report. Bonn, Germany: ICLEI - Local Governments for Sustainability.
ILLGEN, M. 2011. Hydrology of urban environments. In: NIEMELA, J. (ed.) Urban ecology: patterns, processes, and applications. Oxford: Oxford University Press Inc.
ISBELL, F., CALCAGNO, V., HECTOR, A., CONNOLLY, J., HARPOLE, W. S., REICH, P. B., SCHERER-LORENZEN, M., SCHMID, B., TILMAN, D., VAN RUIJVEN, J., WEIGELT, A., WILSEY, B. J., ZAVALETA, E. S. & LOREAU, M. 2011. High plant diversity is needed to maintain ecosystem services. Nature, 477, 199-U96.
IUSS & WRB, W. G. 2014. World Reference Base for Soil Resources 2014
International soil classification system for naming soils and creating legends for soil maps. In: SCIENCES, I. U. O. S. (ed.) World Soil Resources Report. Rome, I: Food and Agriculture Organisation of the United Nations.
IVENS, A. B. F., KRONAUER, D. J. C., PEN, I., WEISSING, F. J. & BOOMSMA, J. J. 2012. Ants farm subterranean aphids mostly in single clone groups - an example of prudent husbandry for carbohydrates and proteins? Bmc Evolutionary Biology, 12.
JACKSON, S. T., BETANCOURT, J. L., BOOTH, R. K. & GRAY, S. T. 2009. Ecology and the ratchet of events: Climate variability, niche dimensions, and species distributions. Proceedings of the National Academy of Sciences of the United States of America, 106, 19685-19692.
JACKSON, S. T. & SAX, D. F. 2010. Balancing biodiversity in a changing environment: extinction debt, immigration credit and species turnover. Trends in Ecology & Evolution, 25, 153-160.
JANSSENS, F., PEETERS, A., TALLOWIN, J. R. B., BAKKER, J. P., BEKKER, R. M., FILLAT, F. & OOMES, M. J. M. 1998. Relationship between soil chemical factors and grassland diversity. Plant and Soil, 202, 69-78.
JAUCH, M. & FISCHER, P. 2000a. Sintering of roof drains: do calcium-rich growing media lead to sintering? Stadt & Grün.
JAUCH, M. & FISCHER, P. 2000b. Substrate im Dauertest. Deutscher Gartenbau, DeGa Spezial "GaLaBau Dachbegrünung". Stuttgart: Verlag Eugen Ulmer.
JIM, C. Y. 2014a. Air-conditioning energy consumption due to green roofs with different building thermal insulation. Applied Energy, 128, 49-59.
JIM, C. Y. 2014b. Building thermal-insulation effect on ambient and indoor thermal performance of green roofs. Ecological Engineering, 69, 265-275.
JOENJE, W. & DURING, H. J. 1977. Colonization of a de-salinating wadden-polder by bryophytes. Vegetatio, 35, 177-185.

314
JOHN, J., LUNDHOLM, J. & KERNAGHAN, G. 2014. Colonization of green roof plants by mycorrhizal and root endophytic fungi. Ecological Engineering, 71, 651-659.
JOHNSTON, A. E. 1991. Benefits from long-term ecosystem research: some examples from Rothamsted. In: RISSER, P. G. (ed.) Long-term ecological research Chichester, UK: Wiley.
JOKIMAKI, J. & SUHONEN, J. 1998. Distribution and habitat selection of wintering birds in urban environments. Landscape and Urban Planning, 39, 253-263.
JONES, R. A. 2002. Tecticolous invertebrates: A preliminary investigation of the invertebrate fauna on green roofs in urban London. London, UK: English Nature.
KADAS, G. 2006. Rare invertebrates colonizing green roofs in London. Urban Habitats, 4, 66-73.
KADAS, G. 2011. Green roofs and biodiversity: can green roofs provide habitat for invertebrates in an urban environment?, London, LAP LAMBERT Academic Publishing.
KALAMEES, R. & ZOBEL, M. 1998. Soil seed bank composition in different successional stages of a species rich wooded meadow in Laelatu, western Estonia. Acta Oecologica-International Journal of Ecology, 19, 175-180.
KALAMEES, R. & ZOBEL, M. 2002. The role of the seed bank in gap regeneration in a calcareous grassland community. Ecology, 83, 1017-1025.
KAYE, J. P., GROFFMAN, P. M., GRIMM, N. B., BAKER, L. A. & POUYAT, R. V. 2006. A distinct urban biogeochemistry? Trends in Ecology & Evolution, 21, 192-199.
KELLERT, S. R., HEERWAGEN, J. & MADOR, M. 2008. Biophilic design: the theory, science and practice of bringing buildings to life, Hoboken, N.J., Wiley.
KENDLE, T. & FORBES, S. 1997. Urban nature conservation: landscape management in the urban countryside, London, E & FN Spon.
KENT, M. & COKER, P. 1994. Vegetation description and analysis: a practical approach, Chichester, Wiley.
KEPHART, P. July 11, 2013. RE: Green roofs designed for biodiversity. To THURING, C.
KIMMEL, C., ROBERTSON, D., HULL, R. B., MORTIMER, M. & WERNSTEDT, K. 2013. Greening the Grey: An Institutional Analysis of Green Infrastructure for Sustainable Development in the U.S. Virginia Tech: Center for Leadership in Global Sustainability.
KINZIG, A. P., WARREN, P., MARTIN, C., HOPE, D. & KATTI, M. 2005. The effects of human socioeconomic status and cultural characteristics on urban patterns of biodiversity. Ecology and Society, 10.
KNAPP, S., KUEHN, I., STOLLE, J. & KLOTZ, S. 2010. Changes in the functional composition of a Central European urban flora over three centuries. Perspectives in Plant Ecology Evolution and Systematics, 12, 235-244.
KNIGHT, D., ELLIOTT, P. W., ANDERSON, J. M. & SCHOLEFIELD, D. 1992. The role of earthworms in managed, permanent pastures in Devon, England. Soil Biology & Biochemistry, 24, 1511-1517.
KOCH, H. 1894. Holzcementdächer. Handbuch der Architektur. Darmstadt, Germany: Verlag von Arnold Bergstrasser.

315
KOLB, W. June 20 1997. RE: Versinterung von Dachabläufen bei Dachbegrünungen. To HEIKE SCHÄFER AND OTHER GERMAN GREEN ROOF PROFESSIONALS.
KOLB, W. & SCHWARZ, T. 1986. New habitats on the roof: The possibilities for the provision of extensive verdure. Anthos.
KOLB, W. & SCHWARZ, T. 1999. Dachbegrünung: intensiv und extensiv, Stuttgart, Eugen Ulmer.
KOLB, W., SCHWARZ, T. & MANSOURIE, P. 1982. Extensivbegrünung von Dachflächen: Vegetationstechnische Eigenschaften und Kosten von 10 verschiedenen Substraten. Zeitschrift für Vegetationstechnik, 5, 106-112.
KOLB, W., SCHWARZ, T. & TRUNK, R. 1983. Zur Begruenung von Kiesdaechern. Zeitschrift fuer Vegetationstechnik, 6, 143-151.
KOLLMANN, J. & FISCHER, A. 2003. Special feature: Vegetation as indicator for habitat quality. Basic and Applied Ecology, 4, 489-491.
KOPECKY, K. & HEJNY, S. 1978. Use of a so-called deductive method in syn-taxonomic classification of roadside plant communities in NE Bohemia. Vegetatio, 36, 43-51.
KOSAREO, L. & RIES, R. 2007. Comparative environmental life cycle assessment of green roofs. Building and Environment, 42, 2606-2613.
KOWARIK, I. 1990. Some responses of flora and vegetation to urbanization in central Europe. In: SUKOPP, H. (ed.) Urban ecology: plants and plant communities in urban environments. The Hague: SPB Academic Publishing.
KOWARIK, I. 2011. Novel urban ecosystems, biodiversity, and conservation. Environmental Pollution, 159, 1974-1983.
KRAVČÍK, M., POKORNÝ, J., KOHUTIAR, J., KOVÁČ, M. & TÓTH, E. 2007. Water for the recovery of the climate: a new water paradigm. Žilina: Krupa Print.
KRUPKA, B. 1985. Standortfaktoren, Pflanzen und Vegetationsformen für extensive Dachbegrünungen. In: LIESECKE, H. J. (ed.) Dachbegrünung-Beiträge zur Extensivbegrünung. Berlin-Hannover: Patzer.
KRUPKA, B. W. 1992. Dachbegrünung Pflanzen- und Vegetationsanwendung an Bauwerken, Stuttgart, Verlag Eugen Ulmer.
KRUPKA, B. W. 2006. Einschichtige Extensivbegrünungen auf Flachdächern ohne Gefälle. Dach+Grün.
KRZANOWSKI, W. J. 2000. Principles of multivariate analysis: a user's perspective, New York, Oxford University Press Inc.
KUBIENA, W. L. 1953. The soils of Europe: illustrated diagnosis and systematics. London, UK: Allen and Unwin.
KÖHLER, M. 1990. The living conditions of plants on the roofs of buildings. A preliminary report. In: SUKOPP, H., HEJNY, S. & KOWARIK, I. (eds.) Urban Ecology. The Hague: SPB Academic Publishing bv.
KÖHLER, M. 2006. Long-term vegetation research on two extensive green roofs in Berlin. Urban Habitats, 4, 3-26.

316
KÖHLER, M. & POLL, P. H. 2010. Long-term performance of selected old Berlin greenroofs in comparison to younger extensive greenroofs in Berlin. Ecological Engineering, 36, 722-729.
KÖHLER, M., SCHMIDT, M., GRIMME, F. W., LAAR, M., LÚCIA DE ASSUNÇÃO PAIVA, V. & TAVARES, S. 2002. Green roofs in temperate climates and in the hot-humid tropics: far beyond the aesthetics. Environmental Management and Health, 13, 382 - 391.
KÜHN, I., BRANDL, R. & KLOTZ, S. 2004. The flora of German cities is naturally species rich. Evolutionary Ecology Research, 6, 749-764.
KÜHN, N. 2000. Spontane Pflanzen für urbane Freiflächen. Garten + Landschaft. München: Callwey Verlag GmbH & Co. KG.
LAKE, P. S., BOND, N. & REICH, P. 2007. Linking ecological theory with stream restoration. Freshwater Biology, 52, 597-615.
LANG, A. 2000. Experimental studies of seed inputs on vegetated roofs, both system and spontaneous. Karlsruhe, D: University Karlsruhe.
LAPKA, M., VÁVRA, J. & SOKOLÍČKOVÁ, Z. 2012. Cultural ecology: contemporary understanding of the relationship between humans and the environment. Journal of Landscape Ecology, 5, 12-24.
LAVELLE, P., LATTAUD, C., TRIGO, D. & BAROIS, I. 1995. Mutualism and biodiversity in soils. Plant and Soil, 170, 23-33.
LAVOREL, S. & GARNIER, E. 2002. Predicting changes in community composition and ecosystem functioning from plant traits: revisiting the Holy Grail. Functional Ecology, 16, 545-556.
LEE, K. E., WILLIAMS, K. J. H., SARGENT, L. D., WILLIAMS, N. S. G. & JOHNSON, K. A. 2015. 40-second green roof views sustain attention: The role of micro-breaks in attention restoration. Journal of Environmental Psychology, 42, 182-189.
LEGENDRE, P. & LEGENDRE, L. 2003. Numercial ecology, Amsterdam, NL, Elsevier Science B.V.
LEWES, G. H. 1891. Problems of Life and Mind, First Series, Boston, UK, Houghton Mifflin and Co.
LI, Y. & BABCOCK, R. W., JR. 2014. Green roof hydrologic performance and modeling: a review. Water Science and Technology, 69, 727-738.
LICHT, J. & LUNDHOLM, J. 2006. Native coast plants for northeastern extensive and intensive green roof trays: substrates, fabrics and plant selection. The Fourth Annual Greening Rooftops for Sustainable Communities Conference. Boston, MA: Green Roofs for Healthy Cities.
LIESECKE, H.-J. 2006. Langzeitentwicklung von Substraten für die extensive Dachbegrünung. Dach+Grün, 3, 4-7.
LIESECKE, H. J. 1979. Funktionsgerechter Aufbau von Dachbegrünungen. Das Gartenamt, 28, 277-288.
LIESECKE, H. J. 1981. Funktionsgerechter Aufbau von Dachbegrünungen aus vegetationstechnischer Sicht. Das Gartenamt, 30, 579-584.
317
LIESECKE, H. J. 1995. Wasserrückhaltung und Abflussbeiwerte bei extensiven Dachbegrünungen. Stadt und Grün, 10, 683-687.
LIESECKE, H. J. 1998. Das Retentionsvermögen von Dachbegrünungen. Stadt und Grün, 1, 46-53.
LIKENS, G. E. 1989. Long-Term Studies in Ecology: Approaches and Alternatives, New York, NY, Springer Verlag.
LLOYD, E. A. 1988. The structure and confirmation of evolutionary theory., New York, USA, Greenwood Press.
LODER, A. 2014. 'There's a meadow outside my workplace': A phenomenological exploration of aesthetics and green roofs in Chicago and Toronto. Landscape and Urban Planning, 126, 94-106.
LORENZ, K. & LAL, R. 2009. Biogeochemical C and N cycles in urban soils. Environment International, 35, 1-8.
LOSOSOVA, Z., CHYTRY, M., KUEHN, I., HAJEK, O., HORAKOVA, V., PYSEK, P. & TICHY, L. 2006. Patterns of plant traits in annual vegetation of man-made habitats in central Europe. Perspectives in Plant Ecology Evolution and Systematics, 8, 69-81.
LUKEN, J. O. 1990. Directing ecological succession, London, Chapman and Hall.
LUNDHOLM, J. 2011. Vegetation of urban hard surfaces. In: NIEMELA, J. (ed.) Urban ecology: patterns, processes, and applications. New York: Oxford University Press Inc.
LUNDHOLM, J., HEIM, A., TRAN, S. & SMITH, T. 2014. Leaf and Life History Traits Predict Plant Growth in a Green Roof Ecosystem. Plos One, 9.
LUNDHOLM, J., MACIVOR, J. S., MACDOUGALL, Z. & RANALLI, M. 2010. Plant Species and Functional Group Combinations Affect Green Roof Ecosystem Functions. Plos One, 5.
LUNDHOLM, J. T. 2015. Green roof plant species diversity improves ecosystem multifunctionality. Journal of Applied Ecology, 52, 726-734.
LUNDHOLM, J. T. & RICHARDSON, P. J. 2010. Habitat analogues for reconciliation ecology in urban and industrial environments. Journal of Applied Ecology, 47, 966-975.
LYYTIMAKI, J. 2014. Bad nature: Newspaper representations of ecosystem disservices. Urban Forestry & Urban Greening, 13, 418-424.
LÖSKEN, G. 2004. Die FLL-Dachbegrünungsrichtlinie. International Green Roof Congress. Nürtingen, Germany: IGRA.
MACARTHUR, R. H. & WILSON, E. O. 1967. The theory of island biogeography, Princeton N.J., Princeton University Press.
MACDONOUGH, L. P., HALLYN, N. M. & ROLF, S. 2006. Midwestern USA plant communities + design = bedrock bluff prairie greenroofs. Greening Rooftops for Sustainable Communities. Boston, MA: Green Roofs for Healthy Cities.
MACIVOR, J. S. & LUNDHOLM, J. 2011a. Insect species composition and diversity on intensive green roofs and adjacent level-ground habitats. Urban Ecosystems, 14, 225-241.
MACIVOR, J. S. & LUNDHOLM, J. 2011b. Performance evaluation of native plants suited to extensive green roof conditions in a maritime climate. Ecological Engineering, 37, 407-417.

318
MACIVOR, J. S., RANALLI, M. A. & LUNDHOLM, J. T. 2011. Performance of dryland and wetland plant species on extensive green roofs. Annals of Botany, 107, 671-679.
MACIVOR, J. S., RUTTAN, A. & SALEHI, B. 2014. Exotics on exotics: Pollen analysis of urban bees visiting Sedum on a green roof. Urban Ecosystems.
MADRE, F., VERGNES, A., MACHON, N. & CLERGEAU, P. 2013. A comparison of 3 types of green roof as habitats for arthropods. Ecological Engineering, 57, 109-117.
MADRE, F., VERGNES, A., MACHON, N. & CLERGEAU, P. 2014. Green roofs as habitats for wild plant species in urban landscapes: First insights from a large-scale sampling. Landscape and Urban Planning, 122, 100-107.
MANN, G. 1996. Die Rolle begrünter Dächer in der Stadtökologie. Biologie in unserer Zeit, 5, 292-299.
MANN, G. 1999a. Begrünte Dächer als Lebensraum. Teil 2: Ergebnisse und Schlussfolgerungen ökologischer Untersuchungen. Stadt & Grün, 5, 328-333.
MANN, G. 1999b. Begrünte Dächer als Lebensraum. Teil I: Ergebnisse ökologisch-faunisticher Untersuchungen. Stadt & Grün, 3, 194-199.
MANN, G. O. I. A., HARZMANN, U. O. I. A., ROTH-KLEYER, S. F. G. & BREUNING, J. G. R. S., LLC). 2013. RE: Questions of the green roof industry (development and experiences)Fragen zur Gründach-Industrie (Entwicklungen und Erfahrungen). To THURING, C.
MARGALEF, R. 1968. Perspectives in ecological theory, London, UK, University of Chicago Press.
MARSH, G. P. 1864. Man and nature; or; Physical geography as modified by human action, Cambridge, Massachusetts, The Belknap Press of Harvard University Press.
MARTIN, A. 1991. Short-term and long-term effects of the endogeic earthworm Millsonia-animala (Omodeo) (Megascolecidae, Oligochaeta) of tropical savannas, on soil organic-matter. Biology and Fertility of Soils, 11, 234-238.
MARZLUFF, J. M. 2005. Island biogeography for an urbanizing world: how extinction and colonization may determine biological diversity in human-dominated landscapes. Urban Ecosystems, 8, 157-177.
MARZLUFF, J. M., SCHULENBERGER, E. & ENDLICHER, W. 2008. Urban ecology: an international perspective on the interaction between humans and nature, New York, Springer.
MAUZ, I., PELTOLA, T., GRANJOU, C., VAN BOMMEL, S. & BUIJS, A. 2012. How scientific visions matter: insights from three long-term socio-ecological research (LTSER) platforms under construction in Europe. Environmental Science & Policy, 19-20, 90-99.
MAYR, E. 1982. The growth of biological thought: diversity, evolution and inheritance, London, UK, Belknap Press.
MCCARTHY, M. 2009. Using models to compare the ecology of cities. In: MCDONNELL, M., HAHS, A. & BREUSTE, J. (eds.) Ecology of Cities and Towns: A Comparative Approach. Cambridge, UK: Cambridge University Press.
MCCUNE, B. & KEON, D. 2002. Equations for potential annual direct incident radiation and heat load. Journal of Vegetation Science, 13, 603-606.

319
MCDONALD, R. I., MARCOTULLIO, P. J. & GUENERALP, B. 2013. Urbanisation and global trends in biodiversity and ecosystem services. In: PICKETT, S. T. A., CADENASSO, M. L. & MCGRATH, B. (eds.) Resilience in ecology and urban design: linking theory and practice for sustainability. London, UK: Springer.
MCDONNELL, M. J. 2011. The history of urban ecology: an ecologist's perspective. In: NIEMELÄ, J. (ed.) Urban ecology: patterns, processes, and applications. New York: Oxford University Press Inc.
MCDONNELL, M. J. & HAHS, A. K. 2013. The future of urban biodiversity research: moving beyond the 'low-hanging fruit'. Urban ecosystems, 16, 397-409.
MCDONNELL, M. J., HAHS, A. K. & BREUSTE, J. H. (eds.) 2009. Ecology of cities and towns: a comparative approach, Cambridge: Cambridge University Press.
MCDONNELL, M. J. & PICKETT, S. T. A. 1990. Ecosystem structure and function along urban rural gradients: an unexploited opportunity for ecology. Ecology, 71, 1232-1237.
MCGUIRE, K. L., PAYNE, S. G., PALMER, M. I., GILLIKIN, C. M., KEEFE, D., KIM, S. J., GEDALLOVICH, S. M., DISCENZA, J., RANGAMANNAR, R., KOSHNER, J. A., MASSMANN, A. L., ORAZI, G., ESSENE, A., LEFF, J. W. & FIERER, N. 2013. Digging the New York City Skyline: Soil Fungal Communities in Green Roofs and City Parks. Plos One, 8.
MCKINNEY, M. L. 2002. Urbanization, biodiversity, and conservation. Bioscience, 52, 883-890.
MCKINNEY, M. L. 2006. Urbanization as a major cause of biotic homogenization. Biological Conservation, 127, 247-260.
MEHMOOD, S. R. & ZHANG, D. W. 2001. A roll call analysis of the Endangered Species Act amendments. American Journal of Agricultural Economics, 83, 501-512.
MENTENS, J., RAES, D. & HERMY, M. 2006. Green roofs as a tool for solving the rainwater runoff problem in the urbanized 21st century? Landscape and Urban Planning, 77, 217-226.
MEYER, M. 2014. Green roof irrigation: considerations and case studies. Cities Alive: 12th annual green roof and wall conference. Nashville, TN: Green Roofs for Healthy Cities.
MEYERSON, L. A. & MOONEY, H. A. 2007. Invasive alien species in an era of globalization. Frontiers in Ecology and the Environment, 5, 199-208.
MILLARD, A. 2004. Indigenous and spontaneous vegetation: their relationship to urban development in the city of Leeds, UK. Urban Forestry & Urban Greening, 3, 39-47.
MILLENNIUM ECOSYSTEM ASSESSMENT 2005a. Ecosystems and human well-being: biodiversity synthesis. Washington, D.C.: World Resources Institute.
MILLENNIUM ECOSYSTEM ASSESSMENT 2005b. Ecosystems and human well-being: synthesis. Washington, D.C.: World Resources Institute.
MILLER, C. 2003. Moisture management in green roofs. Greening Rooftops for Sustainable Communities. Chicago, IL: Green Roofs for Healthy Cities.
MILLER, J. R. 2005. Biodiversity conservation and the extinction of experience. Trends in Ecology & Evolution, 20, 430-434.

320
MILTON, S. J. 2003. 'Emerging ecosystems' - a washing-stone for ecologists, economists and sociologists? South African Journal of Science, 99, 404-406.
MINKE, G. & WITTER, G. 1983. Häuser mit grünem Pelz: ein Handbuch zur Hausbegrünung, Frankfurt/ Main, Fricke Verlag.
MOLINEUX, C. J., CONNOP, S. P. & GANGE, A. C. 2014. Manipulating soil microbial communities in extensive green roof substrates. Science of the Total Environment, 493, 632-638.
MOLINEUX, C. J., FENTIMAN, C. H. & GANGE, A. C. 2009. Characterising alternative recycled waste materials for use as green roof growing media in the UK. Ecological Engineering, 35, 1507-1513.
MONTERUSSO, M. A., ROWE, D. B. & RUGH, C. L. 2005. Establishment and persistence of Sedum spp. and native taxa for green roof applications. Hortscience, 40, 391-396.
MOORE, J. C. & HUNT, H. W. 1988. Resource compartmentation and the stability of real ecosystems. Nature, 333, 261-263.
MORAN, A., HUNT, B. & JENNINGS, G. 2004. A North Carolina field study to evaluate greenroof runoff quantity, runoff quality, and plant growth. Greening Rooftops for Sustainable Communities. Portland, OR: Green Roofs for Healthy Cities.
MORECROFT, M. D., MASTERS, G. J., BROWN, V. K., CLARKE, I. P., TAYLOR, M. E. & WHITEHOUSE, A. T. 2004. Changing precipitation patterns alter plant community dynamics and succession in an ex-arable grassland. Functional Ecology, 18, 648-655.
MOSER, B., FRIDLEY, J. D., ASKEW, A. P. & GRIME, J. P. 2011. Simulated migration in a long-term climate change experiment: invasions impeded by dispersal limitation, not biotic resistance. Journal of Ecology, 99, 1229-1236.
MOSTAFAVI, M. & DOHERTY, G. 2010. Ecological urbanism, Baden, Switzerland, Lars Müller Publishers and the President and Fellows of Harvard College.
MOSTAVI, M. & DOHERTY, G. 2010. Ecological urbanism, Baden, Lars Müller in association with Harvard University Graduate School of Design.
MOUQUET, N. & LOREAU, M. 2003. Community patterns in source-sink metacommunities. American Naturalist, 162, 544-557.
MUELLER-DOMBOIS, D. & ELLENBERG, H. 1974. Aims and methods of vegetation ecology, U.S.A., John Wiley & Sons, Inc.
MULLER, W. H. & MULLER, C. H. 1956. Association patterns involving desert plants that contain toxic products. American Journal of Botany, 43, 354-361.
MÄGDEFRAU, K. 1982. Life forms of bryophytes. In: SMITH, A. J. E. (ed.) Bryophyte Ecology. London, UK: Chapman and Hall.
NAGASE, A. & DUNNETT, N. 2010. Drought tolerance in different vegetation types for extensive green roofs: Effects of watering and diversity. Landscape and Urban Planning, 97, 318-327.
NAGASE, A. & DUNNETT, N. 2011. The relationship between percentage of organic matter in substrate and plant growth in extensive green roofs. Landscape and Urban Planning, 103, 230-236.

321
NAGASE, A. & DUNNETT, N. 2013. Establishment of an annual meadow on extensive green roofs in the UK. Landscape and Urban Planning, 112, 50-62.
NAGASE, A., DUNNETT, N. & CHOI, M.-S. 2013. Investigation of weed phenology in an establishing semi-extensive green roof. Ecological Engineering, 58, 156-164.
NAGEL, E. 1961. The structure of science., New York, USA, Harcourt, Brace and World.
NARDINI, A., ANDRI, S. & CRASSO, M. 2012. Influence of substrate depth and vegetation type on temperature and water runoff mitigation by extensive green roofs: shrubs versus herbaceous plants. Urban Ecosystems, 15, 697-708.
NASSAUER, J. I. 1995. Messy ecosystems, orderly frames. Landscape Journal, 14, 161-170.
NATURAL RESOURCES DEFENSE COUNCIL 2013. New partnership releases path-breaking guide to stimulate private investment in natural infrastructure nationwide. In: WEI, J. (ed.) Report is first effort of “NatLab”, an Innovative Cross-Sector Partnership between the Nature Conservancy, the Natural Resources Defense Council and EKO Asset Management Partners. New York: NRDC.
NELSON, P. V. 2011. Greenhouse operation and management, Upper Saddle River, NJ, Prentice-Hall/ Pearson.
NIACHOU, A., PAPAKONSTANTINOU, K., SANTAMOURIS, M., TSANGRASSOULIS, A. & MIHALAKAKOU, G. 2001. Analysis of the green roof thermal properties and investigation of its energy performance. Energy and Buildings, 33, 719-729.
NIEMELA, J. (ed.) 2011. Urban ecology: patterns, processes, and applications, New York: Oxford University Press Inc.
NOBLE, I. R. & SLATYER, R. O. 1980. The use of vital attributes to predict successional changes in plant-commuinties subject to recurrent disturbances. Vegetatio, 43, 5-21.
NORTHEAST SOLITE CORPORATION. 2007. Landscape, horticulture and green roof [Online]. http://www.nesolite.com/hortland.htm. [Accessed July 8, 2013].
NORTON, B. A., COUTTS, A. M., LIVESLEY, S. J., HARRIS, R. J., HUNTER, A. M. & WILLIAMS, N. S. G. 2015. Planning for cooler cities: A framework to prioritise green infrastructure to mitigate high temperatures in urban landscapes. Landscape and Urban Planning, 134, 127-138.
NUTTLE, T. 2007. Evaluation of restoration practice based on environmental filters. Restoration Ecology, 15, 330-333.
OBERNDORFER, E., LUNDHOLM, J., BASS, B., COFFMAN, R. R., DOSHI, H., DUNNETT, N., GAFFIN, S., KOHLER, M., LIU, K. K. Y. & ROWE, B. 2007. Green roofs as urban ecosystems: Ecological structures, functions, and services. Bioscience, 57, 823-833.
ODUM, E. P. 1971. Fundamentals of ecology, London, UK, Saunders.
OLLY, L. M., BATES, A. J., SADLER, J. P. & MACKAY, R. 2011. An initial experimental assessment of the influence of substrate depth on floral assemblage for extensive green roofs. Urban Forestry & Urban Greening, 10, 311-316.
ORR, D. 1999. Architecture as Pedagogy. In: KIBERT, C. (ed.) Reshaping the Built Environment. Washington, DC: Island Press.
OSMUNDSON, T. 1999. Roof gardens: history, design, and construction, London, W.W. Norton & Company.

322
OTYPKOVA, Z. 2009. The influence of sample plot size on evaluations with Ellenberg indicator values. Biologia, 64, 1123-1128.
PALLANT, J. 2010. SPSS survival manual: A step by step guide to data analysis using SPSS, McGraw-Hill House, Open University Press.
PAPWORTH, S. K., RIST, J., COAD, L. & MILNER-GULLAND, E. J. 2009. Evidence for shifting baseline syndrome in conservation. Conservation Letters, 2, 93-100.
PARLOW, E. 2011. Urban climate. In: NIEMELA, J. (ed.) Urban ecology: patterns, processes, and applications. Oxford: Oxford University Press.
PARTEL, M., KALAMEES, R., ZOBEL, M. & ROSEN, E. 1998. Restoration of species-rich limestone grassland communities from overgrown land: the importance of propagule availability. Ecological Engineering, 10, 275-286.
PAVAO-ZUCKERMAN, M. A. 2008. The Nature of Urban Soils and Their Role in Ecological Restoration in Cities. Restoration Ecology, 16, 642-649.
PAVAO-ZUCKERMAN, M. A. & BYRNE, L. B. 2009. Scratching the surface and digging deeper: exploring ecological theories in urban soils. Urban Ecosystems, 12, 9-20.
PECK, S. W. 2012. Green roof industry begins era of triple digit growth! Living Architecture Monitor. Toronto: Green Roofs for Healthy Cities.
PECK, S. W., CALLAGHAN, C., KUHN, M. E. & BASS, B. 1999. Greenbacks from Green Roofs: Forging a New Industry in CanadaStatus report on benefits, barriers and opportunities for green roof and vertical garden technology diffusion. Toronto, ON.: Canada Mortgage and Housing Corporation.
PENG, S. L., CHEN, Z. Q., WEN, J. & SHAO, H. 2004. Is allelopathy a driving force in forest succession? Allelopathy Journal, 14, 197-204.
PENNINGSFELD, F. 1979. Substrate für die Begrünung von Dachflächen und anderen extremen Standorten. Das Gartenamt, 28, 301-304.
PERRING, M. P., MANNING, P., HOBBS, R. J., LUGO, A., RAMALHO, C. E. & STANDISH, R. J. 2013. Novel urban ecosystems and ecosystem services. In: HOBBS, R. J., HIGGS, E. S. & HALL, C. M. (eds.) Novel ecosystems: intervening in the new ecological world order. Chichester, UK: John Wiley & Sons, Ltd.
PERSSON, S. 1981. Ecological indicator values as an aid in the interpretation of ordination diagrams. Journal of Ecology, 69, 71-84.
PHILIPPI, P. 2011. How to get cost reduction in green roof construction. Fourth Annual Greening Rooftops for Sustainable Communities. Boston, MA: Green Roofs for Healthy Cities.
PHILIPPI, P. M. 2005. Introduction to the German FLL-Guideline for the planning, execution and upkeep of green-roof sites. The Third Annual Greening Rooftops for Sustainable Communities Conference. Washington, D.C.: The Cardinal Group.
PIANA, M. R. & CARLISLE, S. C. 2014. Green roofs over time: a spatially explicit method for studying green roof vegetative dynamics and performance. Cities and the Environment (CATE), 7.
PIANKA, E. R. 1970. R- selection and K-selection. American Naturalist, 104, 592-&.

323
PICKETT, S. T. A. 1976. Succession: evolutionary interpretation. American Naturalist, 110, 107-119.
PICKETT, S. T. A., CADENASSO, M. L. & GROVE, J. M. 2004. Resilient cities: meaning, models, and metaphor for integrating the ecological, socio-economic, and planning realms. Landscape and Urban Planning, 69, 369-384.
PICKETT, S. T. A., CADENASSO, M. L., GROVE, J. M., GROFFMAN, P. M., BAND, L. E., BOONE, C. G., BURCH, W. R., JR., GRIMMOND, C. S. B., HOM, J., JENKINS, J. C., LAW, N. L., NILON, C. H., POUYAT, R. V., SZLAVECZ, K., WARREN, P. S. & WILSON, M. A. 2008. Beyond urban legends: An emerging framework of urban ecology, as illustrated by the Baltimore Ecosystem Study. Bioscience, 58, 139-150.
PICKETT, S. T. A., CADENASSO, M. L. & MEINERS, S. J. 2009. Ever since Clements: from succession to vegetation dynamics and understanding to intervention. Applied Vegetation Science, 12, 9-21.
PICKETT, S. T. A., COLLINS, S. L. & ARMESTO, J. J. 1987. A hierarchical consideration of causes and mechanisms of succession. Vegetatio, 69, 109-114.
PICKETT, S. T. A., KOLASA, J. & JONES, C. J. 1994. Ecological Understanding: The Nature of Theory and the Theory of Nature, London, Academic Press, Inc.
PICKETT, S. T. A. & MCDONNELL, M. J. 1989. Changing perspectives in community dynamics: a theory of successional forces. Trends in Ecology & Evolution, 4, 241-245.
PICKETT, S. T. A., MCGRATH, B., CADENASSO, M. L. & FELSON, A. J. 2014. Ecological resilience and resilient cities. Building Research and Information, 42, 143-157.
PICKETT, S. T. A., PARKER, V. T. & FIEDLER, P. L. 1992. The new paradigm in ecology: Implications for conservation biology above the species level. In: FIEDLER, P. L. & JAIN, S. K. (eds.) Conservation Biology: The theory and practice of nature conservation, preservation and management. New York: Chapman and Hall.
PICKETT, S. T. A. & WHITE, P. S. 1985a. Patch dynamics: a synthesis. In: PICKETT, S. T. A. & WHITE, P. S. (eds.) The Ecology of Natural Disturbance and Patch Dynamics. San Diego, CA: Academic Press, Inc.
PICKETT, S. T. A. & WHITE, P. S. (eds.) 1985b. The Ecology of Natural Disturbance and Patch Dynamics, San Diego, CA: Academic Press, Inc.
PIERCE, S., BRUSA, G., VAGGE, I. & CERABOLINI, B. E. L. 2013. Allocating CSR plant functional types: the use of leaf economics and size traits to classify woody and herbaceous vascular plants. Functional Ecology, 27, 1002-1010.
PIMM, S. L. 1991. The Balance of Nature?, Chicago, IL, University of Chicago Press.
PLUE, J., VERHEYEN, K., VAN CALSTER, H., MARAGE, D., THOMPSON, K., KALAMEES, R., JANKOWSKA-BLASZCZUK, M., BOSSUYT, B. & HERMY, M. 2010. Seed banks of temperate deciduous forests during secondary succession. Journal of Vegetation Science, 21, 965-978.
POLL, P. H. 2008. Ökologie alter Dachbegrünungen - Ein Vergleich zwischen einfachen Jahrhundertwededaechern und komplexen Systemdaechern der 80er Jahre. Master's Dissertation Diplomarbeit, Freien Universität Berlin.
PONGE, J. F. 2005. Emergent properties from organisms to ecosystems: towards a realistic approach. Biological Reviews, 80, 403-411.

324
POORTER, H. & BERGKOTTE, M. 1992. Chemical-composition of 24 wild-species differing in relative growth rate. Plant Cell and Environment, 15, 221-229.
POUYAT, R. V., MCDONNELL, M. J. & PICKETT, S. T. A. 1997. Litter decomposition and nitrogen mineralization in oak stands along an urban-rural land use gradient. Urban Ecosystems, 1, 117-131.
PUGH, G. J. F. 1980. STRATEGIES IN FUNGAL ECOLOGY. Transactions of the British Mycological Society, 75, 1-14.
PULLIAM, H. R. 1988. SOURCES, SINKS, AND POPULATION REGULATION. American Naturalist, 132, 652-661.
PURVIS, O. W., COPPING, B. J., HAWKSWORTH, D. L., JAMES, P. W. & MOORE, D. M. (eds.) 1992. The Lichen flora of Great Britain and Ireland, London, UK: Natural History Museum in association with The British Lichen Society.
PYSEK, P. 1993. Factors affecting the diversity of flora and vegetation in central-European settlements. Vegetatio, 106, 89-100.
PYSEK, P., CHOCHOLOUSKOVA, Z., PYSEK, A., JAROSIK, V., CHYTRY, M. & TICHY, L. 2004. Trends in species diversity and composition of urban vegetation over three decades. Journal of Vegetation Science, 15, 781-788.
QUIJAS, S., JACKSON, L. E., MAASS, M., SCHMID, B., RAFFAELLI, D. & BALVANERA, P. 2012. Plant diversity and generation of ecosystem services at the landscape scale: expert knowledge assessment. Journal of Applied Ecology, 49, 929-940.
RAHEL, F. J. 2002. Homogenization of freshwater faunas. Annual Review of Ecology and Systematics, 33, 291-315.
RAMENSKII, L. G. 1938. Introduction to the Geobotanical study of Complex Vegetation, Moscow, Russia, Selkozgiz.
RAUNKIAER, C. 1934. The life forms of plants and statistical plant geography. The life forms of plants and statistical plant geography, xvi + 632p. Portrait, 189 fig.-xvi + 632p. Portrait, 189 fig.
RAYMO, C. 1991. The virgin and the mousetrap: essays in search of the soul of science., New York, USA, Viking Press.
RAZZAGHMANESH, M., BEECHAM, S. & BRIEN, C. J. 2014. Developing resilient green roofs in a dry climate. Science of the Total Environment, 490, 579-589.
READER, P. M. & SOUTHWOOD, T. R. E. 1981. The relationship between palatability to invertebrates and the successional status of a plant. Oecologia, 51, 271-275.
REBELE, F. 1992. Colonization and early succession on anthropogenic soils. Journal of Vegetation Science, 3, 201-208.
REBELE, F. 1994. Urban ecology and special features of urban ecosystems. Global Ecology and Biogeography Letters, 4, 173-187.
REBELE, F. 2008. Vegetation development on deposit soils starting at different seasons. Plant Ecology, 195, 1-12.
RICKLEFS, R. E. 2001. The economy of nature, Portland, OR, Chiron Press.

325
RICOTTA, C., GODEFROID, S. & CELESTI-GRAPOW, L. 2008. Common species have lower taxonomic diversity: evidence from the urban floras of Brussels and Rome. Diversity and Distributions, 14, 530-537.
RICOTTA, C., LA SORTE, F. A., PYSEK, P., RAPSON, G. L., CELESTI-GRAPOW, L. & THOMPSON, K. 2009. Phyloecology of urban alien floras. Journal of Ecology, 97, 1243-1251.
RIEDMÜLLER, J. 1994. Untersuchungen zur Anlage, Besiedlung und Vernetzung von anthropogenen Sekundärbiotopen auf Dachflächen. Ruprecht-Karls-Universität.
ROBERTS, H. A. & FEAST, P. M. 1973. Emergence and longevity of seeds of annual weeds in cultivated and undisturbed soil. Journal of Applied Ecology, 10, 133-143.
ROBERTSON, G. P., COLLINS, S. L., FOSTER, D. R., BROKAW, N., DUCKLOW, H. W., GRAGSON, T. L., GRIES, C., HAMILTON, S. K., MCGUIRE, A. D., MOORE, J. C., STANLEY, E. H., WAIDE, R. B. & WILLIAMS, M. W. 2012. Long-Term Ecological Research in a Human-Dominated World. Bioscience, 62, 342-353.
ROCKSTROM, J., STEFFEN, W., NOONE, K., PERSSON, A., CHAPIN, F. S., III, LAMBIN, E. F., LENTON, T. M., SCHEFFER, M., FOLKE, C., SCHELLNHUBER, H. J., NYKVIST, B., DE WIT, C. A., HUGHES, T., VAN DER LEEUW, S., RODHE, H., SORLIN, S., SNYDER, P. K., COSTANZA, R., SVEDIN, U., FALKENMARK, M., KARLBERG, L., CORELL, R. W., FABRY, V. J., HANSEN, J., WALKER, B., LIVERMAN, D., RICHARDSON, K., CRUTZEN, P. & FOLEY, J. A. 2009. A safe operating space for humanity. Nature, 461, 472-475.
RODWELL, J. S. 2006. National Vegetation Classification: Users' handbook. In: COMMITTEE, J. N. C. (ed.). Peterborough, UK: Joint Nature Conservation Committee.
ROGERS, R. W. 1988. Succession and survival strategies in lichen populations on a palm trunk. Journal of Ecology, 76, 759-776.
ROSENZWEIG, M. L. 2003. Reconciliation ecology and the future of species diversity. Oryx, 37, 194-205.
ROTH-KLEYER, S. Dec. 4 1996. RE: Schadensfälle durch Versinterung: Ihr Schreiben vom 29.11.96. To REXILIUS, R.
ROTH-KLEYER, S. 2002. Was Dachsubstrate leisten müssen. Jahrbuch Dachbegrünung 2002. Bad Honnef: Bundesverband Garten-, Landschafts- und Sportplatzbau.
ROTH-KLEYER, S. 2006a. Probleme beim Aufbringen von Substraten durch Gebläse, Teil 1. Neue Landschaft, 51, 27-30.
ROTH-KLEYER, S. 2006b. Probleme beim Aufbringen von Substraten durch Gebläse, Teil 2. Neue Landschaft, 51, 35-39.
ROWE, B. D., MONTERRUSO, M. A. & RUGH, C. L. 2006. Assessment of heat-expanded slate and fertility requirements in green roof substrates. HortTechnology, 16, 471-477.
ROWE, D. B. 2011. Green roofs as a means of pollution abatement. Environmental Pollution, 159, 2100-2110.
ROWE, D. B., GETTER, K. L. & DURHMAN, A. K. 2012. Effect of green roof media depth on Crassulacean plant succession over seven years. Landscape and Urban Planning, 104, 310-319.
RUMBLE, H. & GANGE, A. C. 2013. Soil microarthropod community dynamics in extensive green roofs. Ecological Engineering, 57, 197-204.

326
RYKIEL, E. J. 1985. Towards a definition of ecological disturbance. Australian Journal of Ecology, 10, 361-365.
SAETRE, P. 1998. Decomposition, microbial community structure, and earthworm effects along a birch-spruce soil gradient. Ecology, 79, 834-846.
SAILER-SCHMID, A. 1993. Untersuchungsbericht: Untersuchung eines Dachgartensubstrates hinsichtlich pH-Wert und Nährstoffversorgung. Wirtsäckerstrasse 14, 7406 Mössingen: Andrea Sailer-Schmid: Angewandte Geoökologie, Bodenkunde, Feld- und Laboruntersuchung, Substrat- Materialprüfung.
SALA, O. E., CHAPIN, F. S., ARMESTO, J. J., BERLOW, E., BLOOMFIELD, J., DIRZO, R., HUBER-SANWALD, E., HUENNEKE, L. F., JACKSON, R. B., KINZIG, A., LEEMANS, R., LODGE, D. M., MOONEY, H. A., OESTERHELD, M., POFF, N. L., SYKES, M. T., WALKER, B. H., WALKER, M. & WALL, D. H. 2000. Biodiversity - Global biodiversity scenarios for the year 2100. Science, 287, 1770-1774.
SALISBURY, E. J. 1943. The flora of bombed areas. Nature, 151, 462-466.
SALT, G. W. 1979. Use of the term emergent properties: comment. American Naturalist, 113, 145-148.
SAUERWEIN, M. 2011. Urban soils: characterisation, pollution, and relevance in urban ecosystems. In: NIEMELA, J. (ed.) Urban ecology: patterns, processes, and applications. Oxford: Oxford University Press.
SAVARD, J. P. L., CLERGEAU, P. & MENNECHEZ, G. 2000. Biodiversity concepts and urban ecosystems. Landscape and Urban Planning, 48, 131-142.
SAYED, O. H. 2001. Crassulacean acid metabolism 1975-2000, a check list. Photosynthetica, 39, 339-352.
SCHARENBROCH, B. C. & JOHNSTON, D. P. 2011. A microcosm study of the common night crawler earthworm (Lumbricus terrestris) and physical, chemical and biological properties of a designed urban soil. Urban Ecosystems, 14, 119-134.
SCHMIDT, M. 2010. A new paradigm in sustainable land use. Topos. Munich: Callwey Verlag.
SCHMIDTLEIN, S., FEILHAUER, H. & BRUELHEIDE, H. 2012. Mapping plant strategy types using remote sensing. Journal of Vegetation Science, 23, 395-405.
SCHNEIDER, R. 2012. Orchids on green roofs: occurrence in Switzerland and planting conditions. World Green Roof Congress. Copenhagen, DK: LivingRoofs.org.
SCHRADER, S. & BOENING, M. 2006. Soil formation on green roofs and its contribution to urban biodiversity with emphasis on Collembolans. Pedobiologia, 50, 347-356.
SCHROLL, E., LAMBRINOS, J. G. & SANDROCK, D. 2011. An Evaluation of Plant Selections and Irrigation Requirements for Extensive Green Roofs in the Pacific Northwestern United States. Horttechnology, 21, 314-322.
SEIFERT, D. B. 22 May-23 October, 2014 2014. RE: Bodenfauna auf begrünten Dächern. To THURING, C.
SELLECK, G. W. 1960. The climax concept. Botanical Review, 26, 534-569.
SETALA, H. & HUHTA, V. 1991. Soil fauna increase Betula-pendula growth: laboratory experiments with coniferous forest floor. Ecology, 72, 665-671.

327
SHOCHAT, E., LERMAN, S. B., KATTI, M. & LEWIS, D. B. 2004. Linking optimal foraging behavior to bird community structure in an urban-desert landscape: Field experiments with artificial food patches. American Naturalist, 164, 232-243.
SHOCHAT, E., WARREN, P. S., FAETH, S. H., MCINTYRE, N. E. & HOPE, D. 2006. From patterns to emerging processes in mechanistic urban ecology. Trends in Ecology & Evolution, 21, 186-191.
SILVERTOWN, J., DODD, M. E., MCCONWAY, K., POTTS, J. & CRAWLEY, M. 1994. Rainfall, biomass variation, and community composition in the Park Grass Experiment. Ecology, 75, 2430-2437.
SILVERTOWN, J. W. 1981. Seed size, life-span, and germination dates as co-adapted features of plant life-history. American Naturalist, 118, 860-864.
SIMMONS, M. T., GARDINER, B., WINDHAGER, S. & TINSLEY, J. 2008. Green roofs are not created equal: the hydrologic and thermal performance of six different extensive green roofs and reflective and non-reflective roofs in a sub-tropical climate. Urban Ecosystems, 11, 339-348.
SLABBEKOORN, H. & PEET, M. 2003. Ecology: Birds sing at a higher pitch in urban noise - Great tits hit the high notes to ensure that their mating calls are heard above the city's din. Nature, 424, 267-267.
SNEP, R., TIMMERMANS, W. & KWAK, R. 2009. Applying landscape ecological principles to a fascinating landscape: the city. In: MCDONNELL, M. J., HAHS, A. K. & BREUSTE, J. H. (eds.) Ecology and cities and towns: a comparative approach. Cambridge, UK: Cambridge University Press.
SNODGRASS, E. C. & SNODGRASS, L. L. 2006. Green roof plants: a resource and planting guide, Portland, OR, Timber Press, Inc.
SONG, U., KIM, E., BANG, J. H., SON, D. J., WALDMAN, B. & LEE, E. J. 2013. Wetlands are an effective green roof system. Building and Environment, 66, 141-147.
SOUTHWOOD, T. R. E. 1977. Habitat, the templet for ecological strategies? Journal of Animal Ecology, 46, 336-365.
SPEAK, A. F., ROTHWELL, J. J., LINDLEY, S. J. & SMITH, C. L. 2012. Urban particulate pollution reduction by four species of green roof vegetation in a UK city. Atmospheric Environment, 61, 283-293.
SPOMER, L. A. 1998. Water retention of light expanded clay amendment. Communications in Soil Science and Plant Analysis, 29, 1265-1276.
STARFIELD, N. M. & BLELOCH, A. L. 1986. Building models for conservation and wildlife management., New York, USA, MacMillan.
STARKE, B. 2010. RE: personal communication. To THÜRING, C.
STEFFEN, W., CRUTZEN, P. J. & MCNEILL, J. R. 2007. The Anthropocene: Are humans now overwhelming the great forces of nature. Ambio, 36, 614-621.
STEINER, F., SIMMONS, M., GALLAGHER, M., RANGANATHAN, J. & ROBERTSON, C. 2013. The ecological imperative for environmental design and planning. Frontiers in Ecology and the Environment, 11, 355-361.
STEPHENSON, R. 1994. Sedum: cultivated stonecrops, Portland, OR, Timber Press, Inc.

328
STOVIN, V., POE, S. & BERRETTA, C. 2013. A modelling study of long term green roof retention performance. Journal of Environmental Management, 131, 206-215.
STOVIN, V., VESUVIANO, G. & KASMIN, H. 2012a. The hydrological performance of a green roof test bed under UK climatic conditions. Journal of Hydrology, 414–415, 148-161.
STOVIN, V., VESUVIANO, G. & KASMIN, H. 2012b. The hydrological performance of a green roof test bed under UK climatic conditions. Journal of Hydrology, 414, 148-161.
SUKOPP, H. 2002. On the early history of urban ecology in Europe. Preslia (Prague), 74, 373-393.
SUPPE, F. 1977. Afterword. In: SUPPE, F. (ed.) The structure of scientific theories. Urbana, USA: University of Illinois Press.
TABARES-VELASCO, P. C., ZHAO, M., PETERSON, N., SREBRIC, J. & BERGHAGE, R. 2012. Validation of predictive heat and mass transfer green roof model with extensive green roof field data. Ecological Engineering, 47, 165-173.
TAKAYAMA, N., YAMAMOTO, H., IWAYA, K., FEI, W., HARADA, Y., HIGASHIYAMA, M., TSUCHIYA, Y., KANEISHI, A. & SHIROZU, T. 2008. Quantitative Evaluation of Urban Heat Island Mitigation Effect and Reduction Human Heat Stress by Large Greening of Roof. Journal of Agricultural Meteorology, 64, 257-270.
TAKEBAYASHI, H. & MORIYAMA, M. 2007. Surface heat budget on green roof and high reflection roof for mitigation of urban heat island. Building and Environment, 42, 2971-2979.
TANSLEY, A. G. 1920. The classification of vegetation and the concept of development. Journal of Ecology, 8, 118-149.
TANSLEY, A. G. 1935. The use and abuse of vegetational concepts and terms. Ecology, 16, 284-307.
TANSLEY, A. G. 1958. Introduction to Plant Ecology: A Guide for Beginners in the Study of Plant Communities, Woking and London, UK, Unwin Brothers Ltd.
TANSLEY, A. G. 1965. Basic Grasslands. The British Islands and their vegetation. Fourth ed. Cambridge: Cambridge University Press.
TAYLOR, D. R., AARSSEN, L. W. & LOEHLE, C. 1990. On the Relationship between R/K Selection and Environmental Carrying-Capacity - a New Habitat Templet for Plant Life-History Strategies. Oikos, 58, 239-250.
TEEMUSK, A. & MANDER, U. 2011. The Influence of Green Roofs on Runoff Water Quality: A Case Study from Estonia. Water Resources Management, 25, 3699-3713.
TEMPLETON, A. R. & LEVIN, D. A. 1979. Evolutionary consequences of seed pools. American Naturalist, 114, 232-249.
THE GREEN ROOF CONSULTANCY. 2013. London's first wetland green roof [Online]. London, UK: GRC. Available: http://greenroofconsultancy.com/londons-first-wetland-green-roof/ [Accessed 10 March 2014].
THE PLANT LIST. http://www.theplantlist.org/. [Accessed 1 Jan. 2012].
THOMMEN, M. S. 1988. Pflanzengemeinschaften natürlich besiedelter Kiesdächer und extensiver Dachbegrünungen. Master's Dissertation, Universität Basel.

329
THOMPSON, K. 2014. Where do camels belong? The story and science of invasive species., United Kingdom, Profile Books, Ltd.
THOMPSON, K., BAKKER, J. P. & BEKKER, R. M. 1997. The soil seed banks of North West Europe: methodology, density and longevity., Cambridge, UK, Cambridge University Press.
THOMPSON, K. & MCCARTHY, M. A. 2008. Traits of British alien and native urban plants. Journal of Ecology, 96, 853-859.
THOMPSON, P. 1989. The structure of biological theories., Albany, USA, State University of New York Press.
THURING, C. 2009. Reporting on the 2nd International Green Roof Congress 2009: Bringing Nature Back to Town [Online]. Atlanta, GA: Greenroofs.com. Available: http://www.greenroofs.com/content/exclusives001.htm [Accessed 2012.06.18 2012].
THURING, C. E., BERGHAGE, R. D. & BEATTIE, D. J. 2010. Green roof plant responses to different substrate types and depths under various drought conditions. HortTechnology, 20, 395-401.
TILMAN, D. 1982. Resource competition and community structure, Princeton, NJ, Princeton University Press.
TILMAN, D. 1985. The resource-ration hypothesis of plant succession. American Naturalist, 125, 827-852.
TILMAN, D., WEDIN, D. & KNOPS, J. 1996. Productivity and sustainability influenced by biodiversity in grassland ecosystems. Nature, 379, 718-720.
TILMAN, D. A. 1988. Plant strategies and the dynamics and structure of plant communities, Princeton, NJ, Princeton University Press.
TITUS, J. H. & BISHOP, J. G. 2014. Propagule limitation and competition with nitrogen fixers limit conifer colonization during primary succession. Journal of Vegetation Science, 25, 990-1003.
TOKYO METROPOLITAN GOVERNMENT 2007. Basic policy for the 10-year project for Green Tokyo. Tokyo, JP: Tokyo Metropolitan Government,.
TONIETTO, R., FANT, J., ASCHER, J., ELLIS, K. & LARKIN, D. 2011. A comparison of bee communities of Chicago green roofs, parks and prairies. Landscape and Urban Planning, 103, 102-108.
TREPL, L. 1995. Toward a theory of urban biocoenoses - some hypotheses and research questions. In: SUKOPP, H., M. NUMATA, A. HUBER (ed.) Urban ecology as the basis of urban planning. Amsterdam, The Netherlands: SPB Academic Publishing bv.
TURNER, W. R., NAKAMURA, T. & DINETTI, M. 2004. Global urbanization and the separation of humans from nature. Bioscience, 54, 585-590.
TUTIN, T. G. 1993. Flora Europaea, Cambridge, UK, Cambridge University Press.
U.S. ENVIRONMENTAL PROTECTION AGENCY. 2011. Why green infrastructure? [Online]. Washington, DC: EPA. Available: http://water.epa.gov/infrastructure/greeninfrastructure/gi_why.cfm - WaterQuality [Accessed May 25 2013].

330
UGOLINI, F. C. & SPALTENSTEIN, H. 1992. Pedosphere. In: BUTCHER, S. S., CHARLSON, R. J., ORIANS, G. H. & WOLFE, G. V. (eds.) Global Biogeochemical Cycles. London, UK: Academic Press, Inc.
UHL, M., SCHIEDT, L., MANN, G. & HENNEBERG, M. 2003. Langzeitstudie zum Abflussverhalten begrünter Dächer. Wasser & Boden. Berlin: Parey Buchverlag.
UK NATIONAL ECOSYSTEM ASSESSMENT 2014. The UK National Ecosystem Assessment: Synthesis of the Key Findings. UK: UNEP-WCMC, LWEC,.
ULRICH, R. S. 1984. View through a window may influence recovery from surgery. Science, 224, 420-421.
UNFPA 2007. State of World Population 2007: Unleashing the Potential of Urban Growth. United Nations Population Fund.
UNFPA 2011. The State of World Population 2011. United Nations Population Fund.
USDA 1999. Soil taxonomy: a basic system of soil classification for making and interpreting soil surveys. In: SERVICE, N. R. C. (ed.) 2nd ed. Washington DC, USA: Government Printing Office.
USDA, CENTRE, N. S. S., INSTITUTE, S. Q. & LABORATORY, N. S. T. 1998. Soil quality information sheet. In: SERVICES, U. N. R. C. (ed.). Washington, DC: U.S. Department of Agriculture.
USHER, M. B. & JEFFERSON, R. G. 1990. The concepts of colonization and succession: their role in nature reserve management. In: HILLIER, S. H., WALTON, D. W. H. & WELLS, D. A. (eds.) Calcareous Grasslands: Ecology and Management. Huntingdon, UK: Bluntisham Books.
VAN DER MAAREL, E. 1971. Plant species diversity in relation to management. In: DUFFEY, E. & WATT, A. S. (eds.) The scientific management of animal and plant communities for conservation. Chatham, Kent: Blackwell Scientific Publications.
VAN DER MAAREL, E. 2005. Vegetation Ecology, Oxford, Blackwell.
VAN MECHELEN, C., DUTOIT, T. & HERMY, M. 2014a. Mediterranean open habitat vegetation offers great potential for extensive green roof design. Landscape and Urban Planning, 121, 81-91.
VAN MECHELEN, C., DUTOIT, T. & HERMY, M. 2015a. Vegetation development on different extensive green roof types in a Mediterranean and temperate maritime climate. Ecological Engineering, 82, 571-582.
VAN MECHELEN, C., DUTOIT, T., KATTGE, J. & HERMY, M. 2014b. Plant trait analysis delivers an extensive list of potential green roof species for Mediterranean France. Ecological Engineering, 67, 48-59.
VAN MECHELEN, C., VAN MEERBEEK, K., DUTOIT, T. & HERMY, M. 2015b. Functional diversity as a framework for novel ecosystem design: The example of extensive green roofs. Landscape and Urban Planning, 136, 165-173.
VANWOERT, N. D., ROWE, D. B., ANDRESEN, J. A., RUGH, C. L., FERNANDEZ, R. T. & XIAO, L. 2005a. Green roof stormwater retention: Effects of roof surface, slope, and media depth. Journal of Environmental Quality, 34, 1036-1044.

331
VANWOERT, N. D., ROWE, D. B., ANDRESEN, J. A., RUGH, C. L. & XIAO, L. 2005b. Watering regime and green roof substrate design affect Sedum plant growth. Hortscience, 40, 659-664.
VESUVIANO, G. 2013. A Two-Stage Runoff Detention Model for a Green Roof. PhD thesis, The University of Sheffield.
VILLARREAL, E. L. & BENGTSSON, L. 2005. Response of a Sedum green-roof to individual rain events. Ecological Engineering, 25, 1-7.
VITOUSEK, P. M. 1985. Community turnover and ecosystem nutrient dynamics. In: PICKETT, S. T. A. & WHITE, P. S. (eds.) The Ecology of Natural Disturbance and Patch Dynamics. San Diego, CA: Academic Press, Inc.
VITOUSEK, P. M. & WHITE, P. S. 1981. Process studies in succession. In: WEST, D. C., SHUGART, H. H. & BOTKIN, D. B. (eds.) Forest succession: concepts and application. New York, NY: Springer Verlag.
VON HUMBOLDT, A. 1806. Ideen zu einer Physiognomie der Gewächse., Tuebingen, Germany, J.G. Cotta Buchhandlung.
WANIA, A., KUHN, I. & KLOTZ, S. 2006. Plant richness patterns in agricultural and urban landscapes in Central Germany - spatial gradients of species richness. Landscape and Urban Planning, 75, 97-110.
WARDLE, D. A. 2002. Communities and Ecosystems: Linking the Aboveground and Belowground Components, Princeton, NJ, Princeton University Press.
WARDLE, D. A. 2005. How plant communities influence decomposer communities. In: BARDGETT, R. D., USHER, M. B. & HOPKINS, D. W. (eds.) Biological Diversity and Function in Soils. Cambridge, UK: Cambridge University PressBritish Ecological Society.
WARDLE, D. A. & LAVELLE, P. 1997. Linkages between soil biota, plant litter quality and decomposition. Driven by nature: Plant litter quality and decomposition, 107-124.
WATT, A. S. 1947. Pattern and process in the plant community. Journal of Ecology, 35, 1-22.
WEILER, S. K. & SCHOLZ-BARTH, K. 2009. Green roof systems: a guide to the planning, design, and construction of landscapes over structure, Hoboken, N.J., John Wiley & Sons.
WHITE, P. S. 1979. Pattern, process, and natural disturbance in vegetation. Botanical Review, 45, 229-299.
WHITE, P. S. & PICKETT, S. T. A. 1985. Natural disturbances and patch dynamics: an introduction. In: PICKETT, S. T. A. & WHITE, P. S. (eds.) The Ecology of Natural Disturbance and Patch Dynamics. San Diego, CA: Academic Press, Inc.
WHITTAKER, R. H. 1967. Gradient analysis of vegetation. Biological Reviews of the Cambridge Philosophical Society, 42, 207-264.
WHITTAKER, R. H. 1972. Convergences of ordination and classification. In: TÜXEN, R. (ed.) Basic Problems and Methods in Phytosociology. The Hague, NL: Dr. W. Junk N.V. Publishers.
WHITTAKER, R. H. & LEVIN, S. A. 1977. Role of mosaic phenomena in natural communities. Theoretical Population Biology, 12, 117-139.

332
WIKIPEDIA CONTRIBUTORS. 2014. Geography of Germany [Online]. Wikipedia, The Free Encyclopedia. Available: http://en.wikipedia.org/w/index.php?title=Geography_of_Germany&oldid=633858868 [Accessed 18 Nov 2014 17:42].
WILLETT, P. 1988. Recent trends in hierarchic document clustering: a critical review. Information Processing & Management, 24, 577-597.
WILLIAMS, J. W. & JACKSON, S. T. 2007. Novel climates, no-analog communities, and ecological surprises. Frontiers in Ecology and the Environment, 5, 475-482.
WILLIAMS, N. S. G., LUNDHOLM, J. & MACIVOR, J. S. 2014. Do green roofs help urban biodiversity conservation? Journal of Applied Ecology, 51, 1643-1649.
WILLIAMS, N. S. G., MORGAN, J. W., MCCARTHY, M. A. & MCDONNELL, M. J. 2006. Local extinction of grassland plants: The landscape matrix is more important than patch attributes. Ecology, 87, 3000-3006.
WILLIAMS, N. S. G., RAYNER, J. P. & RAYNOR, K. J. 2010. Green roofs for a wide brown land: Opportunities and barriers for rooftop greening in Australia. Urban Forestry & Urban Greening, 9, 245-251.
WILLIAMS, N. S. G., SCHWARTZ, M. W., VESK, P. A., MCCARTHY, M. A., HAHS, A. K., CLEMANTS, S. E., CORLETT, R. T., DUNCAN, R. P., NORTON, B. A., THOMPSON, K. & MCDONNELL, M. J. 2009. A conceptual framework for predicting the effects of urban environments on floras. Journal of Ecology, 97, 4-9.
WILSON, E. O. 1984. Biophilia, USA, Harvard University Press.
WOLF, D. & LUNDHOLM, J. T. 2008. Water uptake in green roof microcosms: Effects of plant species and water availability. Ecological Engineering, 33, 179-186.
WONG, N. H., CHEN, Y., ONG, C. L. & SIA, A. 2003a. Investigation of thermal benefits of rooftop garden in the tropical environment. Building and Environment, 38, 261-270.
WONG, N. H., CHEONG, D. K. W., YAN, H., SOH, J., ONG, C. L. & SIA, A. 2003b. The effects of rooftop garden on energy consumption of a commercial building in Singapore. Energy and Buildings, 35, 353-364.
WOODWARD, F. I. & DIAMENT, A. D. 1991. Functional approaches to predicting the ecological effects of global change. Functional Ecology, 5, 202-212.
WRB, I. W. G. 2014. World Reference Base for Soil Resources 2014International soil classification system for naming soils and creating legends for soil maps. In: SCIENCES, I. U. O. S. (ed.) World Soil Resources Report. Rome, I: Food and Agriculture Organisation of the United Nations.
WRIGHT, I. J., REICH, P. B., WESTOBY, M., ACKERLY, D. D., BARUCH, Z., BONGERS, F., CAVENDER-BARES, J., CHAPIN, T., CORNELISSEN, J. H. C., DIEMER, M., FLEXAS, J., GARNIER, E., GROOM, P. K., GULIAS, J., HIKOSAKA, K., LAMONT, B. B., LEE, T., LEE, W., LUSK, C., MIDGLEY, J. J., NAVAS, M. L., NIINEMETS, U., OLEKSYN, J., OSADA, N., POORTER, H., POOT, P., PRIOR, L., PYANKOV, V. I., ROUMET, C., THOMAS, S. C., TJOELKER, M. G., VENEKLAAS, E. J. & VILLAR, R. 2004. The worldwide leaf economics spectrum. Nature, 428, 821-827.
WU, J. G. & LOUCKS, O. L. 1995. From balance of nature to hierarchical patch dynamics: A paradigm shift in ecology. Quarterly Review of Biology, 70, 439-466.

333
YANG, J., YU, Q. & GONG, P. 2008. Quantifying air pollution removal by green roofs in Chicago. Atmospheric Environment, 42, 7266-7273.
YEATES, G. W. 1981. Soil nematode populations depressed in the presence of earthworms. Pedobiologia, 22, 191-195.
YEH, P. J. 2004. Rapid evolution of a sexually selected trait following population establishment in a novel habitat. Evolution, 58, 166-174.
YIO, M. H. N., STOVIN, V., WERDIN, J. & VESUVIANO, G. 2013. Experimental analysis of green roof substrate detention characteristics. Water Science and Technology, 68, 1477-1486.
YUAN, J.-G., FANG, W., FAN, L., CHEN, Y., WANG, D.-Q. & YANG, Z.-Y. 2006. Soil formation and vegetation establishment on the cliff face of abandoned quarries in the early stages of natural colonization. Restoration Ecology, 14, 349-356.
ZALASIEWICZ, J., WILLIAMS, M., STEFFEN, W. & CRUTZEN, P. 2010. The New World of the Anthropocene. Environmental Science & Technology, 44, 2228-2231.
ZELENY, D. & SCHAFFERS, A. P. 2012. Too good to be true: pitfalls of using mean Ellenberg indicator values in vegetation analyses. Journal of Vegetation Science, 23.
ZHAO, M., TABARES-VELASCO, P. C., SREBRIC, J., KOMARNENI, S. & BERGHAGE, R. 2014. Effects of plant and substrate selection on thermal performance of green roofs during the summer. Building and Environment, 78, 199-211.
ZHENG, Y. & CLARK, M. J. 2013. Optimal Growing Substrate pH for Five Sedum Species. Hortscience, 48, 448-452.
ZINCO 2013. Product list: systems and components for roof landscapes. In: ZINCO GMBH (ed.). Nürtingen: ZinCo GmbH,.
ZINCO GMBH 2014. Planning guide: system solutions for extensive green roofs. In: GMBH, Z. (ed.). Nurtingen, Germany.
ZIPPERER, W. C., WU, J. G., POUYAT, R. V. & PICKETT, S. T. A. 2000. The application of ecological principles to urban and urbanizing landscapes. Ecological Applications, 10, 685-688.

334
Appendix 1. Roof details
Stuttgart Killesberg Year installed/ background:
Installed in July 1991, this steeply-sloped green roof was built as part of the International
Garden Show (IGA), which occupied the site for one year. The City moved into the site
after the IGA left, and the Dept of Gardens, Cemeteries and Forests occupied the building
since then. John Döveling, landscape architect for the city, worked here and kept a close
eye on the vegetation from the start. John also developed and managed the green roof
incentive program for the City from 1986 until 2009. Type: Pitched Sedum meadow
Size (m2): 450 m2
Location: Gartenbauaumt, Maybachstr. 3, 7000 Stuttgart
Slope/ Aspect: 30° pitch, exact N-S gradient
Shading: none
Original depth: 80 mm at time of installation (according to plan)
Construction: Soil: 40% compressable fill; 40% sieved topsoil; 20% screened gravel
(16/32 particle size); nutrient- and humus-poor blend
styrofoam (120 mm)
Protection mat
Root-resistant waterproofing
Description: This is not a ZinCo roof. The S-facing vegetation is xeric with horizontal
cracks (from erosion?), covered mainly by drought- and stress tolerators.
The N-facing roof is dense with grass and flowering herbs, Sedums are in
the understory.
Vegetation type: S-face: extensive Sedum-Moss cover
N-face: grassy sward (F. ovina, P. pratensis, H. perfoliatum, S. hybridum)
Sampling method: Stratified random along systematic transects
Substrate results (Killesberg)
No details on physical and chemical properties

335
Killesberg documentation (2 pages)

336

337
Stuttgart Rathausgarage - lower roof Year installed/ background:
Installed spring/ summer 1990 as pilot project. Maintenance contract handed over to
municipality in Oct 1991 (the 1-yr warranty had expired).
Type: Sedum meadow
Size (m2): ca. 1,100 m
2
Location: Eichstraße 7, 70173 Stuttgart
Slope/ Aspect: none
Shading: none
Original depth: 100 mm
Construction: ca 100 mm "Dachgartenerde, flächig"
Nora-Drain Mat (30 mm) with filter fleece; Protection layer SSM 45
Waterproofing: PE-Folie 0.2 mm/ 2-layered
Description: This is not a ZinCo roof. A central circular island defines this lower roof,
which is also vegetated both on top and up the sides with climbers. Far less
Allium cover on this roof as on PV roof, and six more species (Dianthus
deltoides, 3 mosses, Poa compressa, Potentilla erecta, Sedum sexangulare,
Setaria viridis, Vulpia myuros)
Vegetation type: Extensive Sedum-Thyme-Dianthus moss meadow with ruderal grasses
Sampling method: Stratified random
Substrate results (Rathaus-lower)
Physical properties Unit Result FLL reference value
Proportion of slurry-forming components mass % 8.5 ≤ 15
(d < 0.063 mm)
Proportion gravel (d > 4mm) mass % 54 ≤ 50
Apparent density, dry g/cm3 1.18 no requirement
Apparent density, at mWK g/cm3 1.57 no requirement
Total pore volume (GPV) vol. % 54 no requirement
Maximum water capacity (mWK) vol. % 38 ≥ 35 ≤ 65
Air content at mKW vol. % 16 ≥ 10
Water permeability mod. kf mm/ min - 0.6-70
Chemical properties Unit Result FLL reference value pH value (CaCl2) - 7.2 6.0-8.5
Salt content (KCl) (water extract) g/ L 0.3 ≤ 3.5
Organic content g/ L 61 ≤ 65
Nitrogen (N) (in CAT) mg/ L 52 ≤ 80
Phosphorus (P2O5) (in CAT) mg/ L 6 ≤ 50
Potash (K2O) (in CAT) mg/ L 68 ≤ 500
Magnesium (Mg) (in CAT) mg/ L 120 ≤ 200

338
Stuttgart Rathausgarage - PV roof Year installed/ background:
Installed spring/ summer 1990 as pilot project. Maintenance contract handed over to
municipality in Oct 1991 (the 1-yr warranty had expired).
Type: Sedum meadow
Size (m2): ca. 1,300 m
2
Location: Eichstraße 7, 70173 Stuttgart
Slope/ Aspect: none
Shading: only from PV panels, but vegetation beneath was not sampled
Original depth: 100 mm
Construction: ca 100 mm "Dachgartenerde, flächig"
Nora-Drain Mat (30 mm) with filter fleece; Protection layer SSM 45
Waterproofing: PE-Folie 0.2 mm/ 2-layered
Description: This is not a ZinCo roof. Some construction as lower roof.
Sampling method: Stratified random
Substrate results (Rathaus-PV)
Physical properties Unit Result FLL reference value
Proportion slurry-forming components mass % 10 ≤ 15
(d < 0.063 mm)
Proportion gravel (d > 4mm) mass % 60 ≤ 50
Apparent density, dry g/cm3 1.17 no requirement
Apparent density, at mWK g/cm3 1.49 no requirement
Total pore volume (GPV) vol. % 55 no requirement
Maximum water capacity (mWK) vol. % 32 ≥ 35 ≤ 65
Air content at mKW vol. % 23 ≥ 10
Water permeability mod. kf mm/ min - 0.6-70
Chemical properties Unit Result FLL reference value
pH value (CaCl2) - 7.2 6.0-8.5
Salt content (KCl) (water extract) g/ L 0.4 ≤ 3.5
Organic content g/ L 49 ≤ 65
Nitrogen (N) (in CAT) mg/ L 53 ≤ 80
Phosphorus (P2O5) (in CAT) mg/ L 11 ≤ 50
Potash (K2O) (in CAT) mg/ L 71 ≤ 500
Magnesium (Mg) (in CAT) mg/ L 120 ≤ 200

339
Stuttgart Rathausgarage documentation (2 pages)

340
(Species list as excerpt on construction plan)

341
FH Nürtingen Year installed/ background:
Installed and planted autumn 1986; dead/ missing plants replaced in autumn 1987.
Until 1992 maintenance was frequent and regular; this was reduced to annual mowing
(late summer). In 2000, orchids and anthills appeared; by 2010 this had expanded to 30
individuals. The edges of the green roof were renovated in autumn 2010, after sampling.
Type: Sedum meadow
Size (m2): 258 m
2
Location: Neuffenerstr. 139, 7440 Nürtingen
Slope/ Aspect: flat, roof facing North but protected by 1.5 m parapet
Shading: yes, edges beside walls receive shade from 11:00
Original depth: 90 mm centre, 20 mm along edges (initial interest to see what happens)
Construction: Soil blend: expanded shale with Floraperl, humousy (top?)soil
50 mm Floradrain with filter fleece; Protection layer;
Root-resistant PE layer atop bituminous waterproofing
Description: Protected on the south- and west-sides by walls, and contained by
parapet on the other sides. The north edge is very xeric, while the south
edge seems rather damp (supports orchids and lush mosses.)
Vegetation type: Edges = Sedum-Moss-Lichen; Central area = meadow vegetation
(Poa compressa, Hypericum perforatum, Campanula rotundifolia)
Sampling method: Stratified random with transect grid: roof divided into transects every 4m, quadrats every 3m = 12 quadrats total
Substrate results (FH Nürtingen)
Physical properties Unit Result FLL reference value
Proportion slurry-forming
components (d < 0.063 mm) mass % 1.4 ≤ 15
Proportion gravel (d > 4mm) mass % 39 ≤ 50
Apparent density, dry g/cm3 0.88 no requirement
Apparent density, at mWK g/cm3 1.41 no requirement
Total pore volume (GPV) vol. % 66 no requirement
Maximum water capacity (mWK) vol. % 53 ≥ 35 ≤ 65
Air content at mKW vol. % 13 ≥ 10
Water permeability mod. kf mm/ min 0.7 0.6-70
Chemical properties Unit Result FLL reference value
pH value (CaCl2) - 6 6.0-8.5
Salt content (KCl) (water extract) g/ L 0.5 ≤ 3.5
Organic content g/ L 72 ≤ 65
Nitrogen (N) (in CAT) mg/ L 62 ≤ 80
Phosphorus (P2O5) (in CAT) mg/ L < 5 ≤ 50
Potash (K2O) (in CAT) mg/ L 130 ≤ 500
Magnesium (Mg) (in CAT) mg/ L 160 ≤ 200

342
FH Nürtingen documentation (5 pages)

343

344

345

346

347
Römermuseum Köngen Year installed/ background:
Installed over 7 days in 1987, including construction of erosion barriers (50 mm) (sloped
roofs were new territory). Sown with herb-grass mix, plus cuttings. Substrate was an “early
version" of Steinrosenflur. Regular maintenance by municipal crews.
Type: Species-poor Sedum roof
Size (m2): S-facing roof: 230 m
2, N-facing roof: 120 m
2.
Location: Römerpark, south-west Köngen
Slope/ Aspect: S-facing roof: 17°, N-facing roof: 15°
Shading: Some shade from trees at north-west edge of roof
Original depth: 70-80 mm at installation (Hövekamp)
Construction: Soil: 39% exp-shale, 23% rice husks, 23% bark compost, 15% lava-clay
Floraset FS 100 with filter fleece
Protection layer SSM 45
Root-resistant waterproofing
Description: This is one of ZinCo's earliest pitched roofs. The S-facing roof is mainly
Sedum, with a patch of Coronilla, a Verbascum and some grass. The smaller
N-facing roof is dense with grass. Mosses form a consistent undercover.
Vegetation type: S-face: extensive Sedum-Moss cover
N-face: grassy sward (F. ovina, P. pratensis, H. perfoliatum, S. hybridum)
Sampling method: Stratified random with transect grid: 13 quadrats on S-face, 5 on N-face.
Substrate results (Köngen)
Physical properties Unit Result FLL reference value
Proportion slurry-forming components mass % 10 ≤ 15
(d < 0.063 mm)
Proportion gravel (d > 4mm) mass % 10 ≤ 50
Apparent density, dry g/cm3 0.78 no requirement
Apparent density, at mWK g/cm3 1.39 no requirement
Total pore volume (GPV) vol. % 68 no requirement
Maximum water capacity (mWK) vol. % 62 ≥ 35 ≤ 65
Air content at mKW vol. % 6 ≥ 10
Water permeability mod. kf mm/ min 2.7 0.6-70
Chemical properties Unit Result FLL reference value
pH value (CaCl2) - 5.2 6.0-8.5
Salt content (KCl) (water extract) g/ L 0.3 ≤ 3.5
Organic content g/ L 126 ≤ 65
Nitrogen (N) (in CAT) mg/ L 20 ≤ 80
Phosphorus (P2O5) (in CAT) mg/ L 32 ≤ 50
Potash (K2O) (in CAT) mg/ L 27 ≤ 500
Magnesium (Mg) (in CAT) mg/ L 130 ≤ 200

348
Köngen documentation (6 pages)

349

350

351

352

353

354
Gärtnereihof Tübingen Year installed/ background:
Installed in May 1986, this was the first pitched extensive green roof in sw-Germany.
The City wanted a grass roof, but ZinCo arranged to restrict grass to the north-face,
and use drought-tolerant species for the south-face (cuttings, seeds, and 4 plugs/ m2).
The turf didn't survive; gaps from die-off were replaced by species from the south-face.
Maintenance (by garden staff) was considerable in the first 7 years; by 2000, all
maintenance had ceased.
Type: Pitched Sedum roof
Size (m2): 2,160 m
2
Location: Europastr. 30, (south-west) Tuebingen
Slope/ Aspect: ca. 15°
Shading: only at the very edges (NW) where tree canopies come close to roof
Original depth: unknown
Construction: unknown
Description: This was ZinCo's earliest pitched roofs. The south facing aspect was
mainly Sedum interspersed with Thyme, Festuca, Petrorhagia, etc. While
the N-facing roof is similar but has more grass. Mosses formed a consistent undercover but were not recorded as this was one of the
first roofs surveyed.
Vegetation type: S-face: extensive Sedum; N-face: extensive Sedum with more grasses
Sampling method: Stratified random along systematic transects
Substrate results (Tübingen)
Physical properties Unit Result FLL reference value
Proportion slurry-forming components mass % 2.7 ≤ 15
(d < 0.063 mm)
Proportion gravel (d > 4mm) mass % 71 ≤ 50
Apparent density, dry g/cm3 1.18 no requirement
Apparent density, at mWK g/cm3 1.62 no requirement
Total pore volume (GPV) vol. % 54 no requirement
Maximum water capacity (mWK) vol. % 44 ≥ 35 ≤ 65
Air content at mKW vol. % 10 ≥ 10
Water permeability mod. kf mm/ min 11 0.6-70
Chemical properties Unit Result FLL reference value
pH value (CaCl2) - 5.6 6.0-8.5
Salt content (KCl) (water extract) g/ L 0.4 ≤ 3.5
Organic content g/ L 79 ≤ 65
Nitrogen (N) (in CAT) mg/ L 17 ≤ 80
Phosphorus (P2O5) (in CAT) mg/ L 50 ≤ 50
Potash (K2O) (in CAT) mg/ L 97 ≤ 500
Magnesium (Mg) (in CAT) mg/ L 110 ≤ 200
Tübingen documentation (7 pages)

355
Correspondence between Tübingen and FH Nürtingen regarding green roofs (3 pages)

356

357

358
Species list for pitched roofs (1 page) (this appears to be a generic list that was recommended/ used for the Tübingen roof)

359
Newspaper article about the green roof at Gärtnereihof Tübingen (1 page)

360
Results from soil analyses of Tübingen roof (2 pages)

361

362
Verkehrsbetrieb Esslingen, Area 1 Year installed/ background:
Thomas Hövekamp’s first green roof construction site, installed May-June 1986. Over
3,000 styrofoam Floraterra boxes were pre-grown with Sedum, Thyme (these were over-
due by installation). It had clearly not been maintained for some time, judging from the
large Rose, clogged drains, exposed membrane, shredded bits of filter cloth and debris.
Type: Sedum meadow with Floraterra modules every m2
Size (m2): 1,860 m
2
Location: Heilbronner Straße 70, east of Esslingen centre
Slope/ Aspect: none
Shading: none
Original depth: 100 mm plus 10-20 mm organic substrate
Construction: As described above (expanded clay looked like Leca or lava); Floraterra
modules interspersed every 1 m2, flush with surface; 2 protection layers
Description: Area 1 is dominated by 5 light shafts, each ca 50 m long. The vegetation
between the shafts is mainly Sedum and Thyme, while that in the more
open area to the west supports grasses. Floraterra boxes could not be
avoided in sampling, but their vegetation was similar to that of the other parts of the roof.
Vegetation type: Extensive Sedum-Moss cover with Allium schoenoprasum, Thymus.
Sampling method: Stratified random
Substrate results (VB A1)
Physical properties Unit Result FLL reference value
Proportion slurry-forming components mass % 0.5 ≤ 15
(d < 0.063 mm)
Proportion gravel (d > 4mm) mass % 68 ≤ 50
Apparent density, dry g/cm-3 0.54 no requirement
Apparent density, at mWK g/cm-3 0.98 no requirement
Total pore volume (GPV) vol. % 79 no requirement
Maximum water capacity (mWK) vol. % 44 ≥ 35 ≤ 65
Air content at mKW vol. % 35 ≥ 10
Water permeability mod. kf mm/ min - 0.6-70
Chemical properties Unit Result FLL reference value
pH value (CaCl2) - 5.9 6.0-8.5
Salt content (KCl) (water extract) g/ L 0.2 ≤ 3.5
Organic content g/ L 60 ≤ 65
Nitrogen (N) (in CAT) mg/ L 19 ≤ 80
Phosphorus (P2O5) (in CAT) mg/ L < 5 ≤ 50
Potash (K2O) (in CAT) mg/ L 58 ≤ 500
Magnesium (Mg) (in CAT) mg/ L 140 ≤ 200

363
Verkehrsbetrieb Esslingen, Area 2 Year installed/ background:
Installed May-June 1986, same as Area 1.
Type: Sedum meadow with Floraterra modules every m2
Size (m2): 2,064 m
2
Location: Heilbronner Straße 70, east of Esslingen centre
Slope/ Aspect: none
Shading: none
Original depth: 100 mm plus 10-20 mm organic substrate
Construction: 10-20 mm organic substrate and 100 mm expanded clay (looks like Leca or lava); Floraterra modules interspersed every 1 m
2, flush with surface;
2 protection layers
Description: Area 2 is more open than Area 1, with 12 evenly spaced light shafts
Gravel paths connect the light shafts with each other and with the gravel
edges of the roof. Floraterra modules are evenly spaced, too.
Vegetation type: Extensive Sedum-Moss cover with Allium schoenoprasum, Thymus,
and some grasses.
Sampling method: Stratified random
Substrate results (VB A2)
Physical properties Unit Result FLL reference value
Proportion slurry-forming components mass % 2.3 ≤ 15
(d < 0.063 mm)
Proportion gravel (d > 4mm) mass % 77 ≤ 50
Apparent density, dry g/cm-3 0.48 no requirement
Apparent density, at mWK g/cm-3 0.8 no requirement
Total pore volume (GPV) vol. % 82 no requirement
Maximum water capacity (mWK) vol. % 32 ≥ 35 ≤ 65
Air content at mKW vol. % 50 ≥ 10
Water permeability mod. kf mm/ min - 0.6-70
Chemical properties Unit Result FLL reference value
pH value (CaCl2) - 5.8 6.0-8.5
Salt content (KCl) (water extract) g/ L 0.3 ≤ 3.5
Organic content g/ L 25 ≤ 65
Nitrogen (N) (in CAT) mg/ L 30 ≤ 80
Phosphorus (P2O5) (in CAT) mg/ L < 5 ≤ 50
Potash (K2O) (in CAT) mg/ L 37 ≤ 500
Magnesium (Mg) (in CAT) mg/ L 44 ≤ 200

364
Pliensaufriedhof, Esslingen Year installed/ background:
The only information is from a ZinCo product sheet which describes the concept and site;
the illustrated system cross-section does not specify substrate depth. Maintenance
was apparently considerable, as gardening staff in the building below have easy access
to the roof via permanent ladder.
Type: Species-poor Sedum roof
Size (m2): ~ 500 m
2
Location: Eichendorfstrasse, 73732 Esslingen am Neckar
Slope/ Aspect: none
Shading: large Pinus sylvestris at east end of the roof
Original depth: unknown
Construction: Soil: "Systemerde Dachgarten"
Floratherm WD 180 with system filter SF; Water storage, ca. 70 mm;
Protection layer ISM 50; Root-resistant waterproofing
Description: Perhaps the happiest Sedum roof in the world, the plants are lush and
not bothered by competition of any sort, it seems. Just the odd herb in
between and the odd pine sapling. A few distinct patches of Teuchrium
and Festuca were avoided as best possible in the sampling.
Vegetation type: extensive Sedum-Moss cover
Sampling method: Stratified random, total 15 quadrats distributed over homogeneous vegetation
Substrate results (Pliensau)
Physical properties Unit Result FLL reference value
Proportion slurry-forming components mass % 1.3 ≤ 15
(d < 0.063 mm)
Proportion gravel (d > 4mm) mass % 24 ≤ 50
Apparent density, dry g/cm-3 0.64 no requirement
Apparent density, at mWK g/cm-3 1.35 no requirement
Total pore volume (GPV) vol. % 72 no requirement
Maximum water capacity (mWK) vol. % 71 ≥ 35 ≤ 65
Air content at mKW vol. % 1 ≥ 10
Water permeability mod. kf mm/ min 0.1 0.6-70
Chemical properties Unit Result FLL reference value
pH value (CaCl2) - 6.3 6.0-8.5
Salt content (KCl) (water extract) g/ L 0.6 ≤ 3.5
Organic content g/ L 189 ≤ 65
Nitrogen (N) (in CAT) mg/ L 93 ≤ 80
Phosphorus (P2O5) (in CAT) mg/ L 7 ≤ 50
Potash (K2O) (in CAT) mg/ L 88 ≤ 500
Magnesium (Mg) (in CAT) mg/ L 150 ≤ 200

365
Pliensaufriedhof documentation (1 page)

366
Appendix 2. Master species list (including intentional species and EIVs)
Master species list Intentional (1) or colonising (0)
Ellenberg Indicator Values
Species name L T C M R N
Acer campestre L. 0 5 6 4 5 7 6
Acer pseudoplatanus L. 0 4 0 4 6 0 7
Achillea millefolium L. 1 8 0 0 4 0 5
Agrostis stolonifera L. 0 8 0 5 0 0 5
Agrostis tenuis L. 1 7 0 3 0 4 4
Allium flavum L. 1 Allium schoenoprasum L. 1 7 0 7 0 7 2
Arrhenatherum elatius (L.) J. et C. Presl. 0 8 5 3 5 7 7
Campanula rotundifolia L. 1 7 5 0 0 0 2
Carex flava L. 1 8 0 2 9 8 2
Carex humilis Leyss. 1 7 6 5 2 8 3
Carpinus betulus L. 0 4 6 4 0 0 0
Cerastium arvense L. 1 8 0 5 4 6 4
Convolvulus arvensis L. 0 7 6 0 4 7 0
Coronilla varia L. 0 7 6 5 4 9 3
Crepis tectorum L. 0 8 6 7 4 0 6
Dactylorhiza fuchsii 0 Dianthus carthusianorum L. 1 8 5 4 3 7 2
Dianthus deltoides L. 1 8 5 4 3 3 2
Erigeron annuus (L.) Pers. 0 7 6 0 6 0 8
Festuca ovina L. 1 7 0 3 0 3 1
Festuca rubra L. 1 0 0 5 6 6 0
Fragaria vesca L. 0 7 0 5 5 0 6
Geranium spp. 0 Geum urbanum L. 0 4 5 5 5 0 7
Hieracium pilosella L. 1 7 0 3 4 0 2
Hypericum perforatum L. 0 7 6 5 4 6 3
Hypericum perfoliatum L. 0 Lichen_Cladonia furcata 0 Lichen_Cladonia cf scabriscula 0 Lichen_Peltigera 0 Linum perenne 1 7 0 6 3 8 2
Lotus corniculatus L. 1 7 0 3 4 7 3
Medicago lupulina L. 0 7 5 0 4 8 0
Moss_Hypnum1 0 Moss_Hypnum2 0 Moss_Dicranum scoparium 0 5 0 5 4 4
Moss_Eurhynchium praelongum 0 6 4 5 6 5

367
Moss_Scleropodium purum 0 6 4 5 4 5 Moss_Brachythecium rutabulum 0 5 x 5 4 x Moss_Bryum1 0
Moss_Brachythecium_cf_albicans1 0 9 3 5 2 x Moss_Philonotis fontana 0 8 0 6 7 2 Moss_Polytrichum juniperum 0 8 2 ? 4 3 Moss_Racomitrium elongatum 0 8 3 6 9 5 Moss_Brachythecium_cf_albicans2 0 9 3 5 2 x Moss_Brachythecium_cf_albicans3 0 9 3 5 2 x Moss_Bryum2 0
Moss_Calliergonella cuspidata 0 Moss_Ceratodon purpureus 0 Moss_starry_yellow 0 Nepeta racemosa 1 opplved herb 0 Other small tree 0 Petrorhagia prolifera (L.) Ball. U.
Heyw. 0 8 7 3 3 5 2
Petrorhagia saxifraga (L.) Lk. 1 9 7 4 2 7 1
Picris hieracioides L. 0 8 0 5 4 8 4
Pinus sylvestris L. 0 7 0 7 0 0 0
Poa angustifolia (L.) Gaud. 0 7 5 0 0 0 3
Poa compressa L. 1 9 0 4 2 9 2
Poa pratensis L. 1 6 0 0 5 0 6
Poa pratensis angustifolia 1 7 6 0 0 0 3
Potentilla argentea L. 1 9 6 3 2 3 1
Potentilla erecta L. 0 6 0 3 0 0 2
Potentilla neumanniana 1 Potentilla recta 0 9 7 5 3 5 2
Sedum acre L. 1 8 6 3 2 0 1
Sedum album L. 1 9 0 2 2 0 1
Sedum album Coral Carpet 1 Sedum album Murale 1 Sedum floriferum 1 Sedum hybridum 1 Sedum rupestre 1 7 5 4 2 5 1
Sedum sexangulare L. emend. Grimm 1 7 5 4 2 6 1
Sedum spurium 1 8 6 4 3 5 3
Sedum telephium L.s.str. 1 7 6 0 4 7 0
Sempervivum tectorum L. 1 8 0 2 2 4 0
Setaria viridis (L.) P.B 1 7 6 0 4 0 7
Solidago canadensis L. 0 8 6 5 0 0 6

368
Taraxacum officinale Web. 0 7 0 0 5 0 7
Teucrium chamaedrys L. 1 7 6 4 2 8 1
Thymus praecox Opiz 1 8 6 5 3 8 1
Thymus pulegioides L. 1 8 0 4 4 0 1
Thymus serpyllum L. 1 7 6 5 2 5 1
Trifolium arvense L. 1 8 6 3 3 2 1
Trifolium campestre Schreb. 0 8 6 3 4 6 3
Trifolium dubium Sibth. 0 6 6 3 5 6 5
Trifolium pratense L. 0 7 0 3 0 0 0
Unknown herb 0 Verbascum nigrum L. 0 7 5 5 5 7 7
Verbascum thapsus L. 0 8 0 3 4 7 7
Veronica spicata L. 1 7 7 6 3 7 2
Vicia hirsuta (L.) S.F. Gray 0 7 6 5 4 0 4
Vicia sepium L. 0 0 0 5 5 6 5
Vulpia myuros L. C.C. Gmel. 0 8 7 3 2 5 1


