Embed Size (px)
Citation preview

247
© The Ecological Society of America wwwwww..ffrroonnttiieerrssiinneeccoollooggyy..oorrgg
Maintaining the diversity of genes, species, and habi-tats is essential for sustainable development (UNO
1998). Agricultural policy has a strong impact on landuse and, as a consequence, on farmland biodiversity(Mattison and Norris 2005). Agri-environmental schemesdesigned to promote wildlife-friendly farming have beena major policy instrument for the past two decades, andmore than 100 programs that aim specifically at improv-ing biodiversity exist in the member countries of theOrganisation for Economic Co-operation and Develop-ment (OECD 2007). Between 2000 and 2003, the totalaverage annual expenditure on agri-environmental pay-ments was approximately €2.2 billion for the EuropeanUnion (EU) and US$2.0 billion for the United States(OECD 2003). However, the effectiveness of these pay-ments is often questioned. A review of agri-environmen-tal schemes revealed that, in Europe, only 54% of inves-tigated faunistic and floristic groups exhibited increasesin species richness or abundance in response to agri-envi-ronmental measures, and 6% exhibited decreases (Kleijnand Sutherland 2003).
Although the expenditures for agri-environmentalschemes are impressive, they represent only 5% (EU) and8% (US) of the total budgetary spending on agriculture(OECD 2003). The bulk of government subsidies reach
farmers through direct payments, production-linked pay-ments, grants for the reduction, control, or cessation ofproduction and – indirectly – through export subsidiesand import tariffs. Linking ecological standards to thesesubsidies is a potentially powerful lever for achievingenvironmental objectives, because subsidies contributesubstantially to farmers’ income, whereas agri-environ-mental schemes provide payments for voluntary environ-mental services (Baldock et al. 2002).
The concept of requiring farmers to comply with envi-ronmental standards in order to qualify for subsidies iscalled “cross compliance”. It was first introduced in theUS in 1985, mainly to control soil erosion and to preventfarmers from reclaiming wetlands (Hoag and Holloway1991). Its first application for the promotion of biodiver-sity in the wider countryside was in Switzerland, whereecological compensation areas (ECAs) had been intro-duced progressively since 1993, on a voluntary basis, andbecame conditional cross-compliance requirements in1998. In order to qualify for direct payments, farmersmust manage 7% or more of their land as ECAs (Figure 1).Of the 120 000 ha of ECAs (12% of Swiss farmland),three quarters are extensively managed hay meadows(SFOA 2007). Fallows, which are sown with seed mix-tures of 20 to 40 herbaceous plant species (wildflowerstrips), are less extensive in area (3500 ha) but are char-acteristic ECA types for arable regions (SFOA 2007).The cross-compliance standards also comprise otherrestrictions at the farm level that may be beneficial forbiodiversity, including balanced nutrient budgets, a mini-mum diversity of cultivated species involved in crop rota-tion, and the integrated use of pesticides.
Evaluating the effectiveness of cross compliance is of
RESEARCH COMMUNICATIONS RESEARCH COMMUNICATIONS
Ecological cross compliance promotesfarmland biodiversity in Switzerland SSttéépphhaanniiee AAvviirroonn11,, HHeeiikkee NNiittsscchh22,, PPhhiilliippppee JJeeaannnneerreett11,, SSeerrggee BBuuhhoollzzeerr11,, HHeennrryykk LLuukkaa33,, LLuukkaass PPffiiffffnneerr33,,SStteeffaannoo PPoozzzzii44,, BBeeaattrriiccee SScchhüüppbbaacchh11,, TThhoommaass WWaalltteerr11,, aanndd FFeelliixx HHeerrzzoogg11**
In ecological cross compliance, farmers have to meet environmental standards in order to qualify for area-related direct payments. Because this is a strong financial incentive, cross compliance is a potentially pow-erful policy instrument. We monitored the effectiveness of cross compliance in promoting biodiversity ongrassland and on arable land in Switzerland over 8 years. We observed measurable benefits for flora, butter-flies, ground beetles, and spiders, in terms of species numbers and/or community composition. However,populations of threatened species showed no signs of benefit. While cross compliance has been in force inSwitzerland for almost a decade, it has only recently been introduced in the neighboring European Union.We argue that – provided the environmental standards relating to biodiversity are increased in the future –common farmland biodiversity could be enhanced at the continental scale under cross compliance. TheSwiss example shows that appropriate cross-compliance standards benefit farmland biodiversity at field andfarm scales, while the conservation of threatened species needs to be addressed by specific programs, actingat the scale of agricultural landscapes.
Front Ecol Environ 2009; 7(5): 247–252, doi:10.1890/070197 (published online 7 Jul 2008)
1Agroscope Reckenholz-Tänikon Research Station ART, Zurich,Switzerland *([email protected]); 2Johann Heinrich vonThünen-Institute, Federal Research Institute for Rural Areas,Forestry and Fisheries, Braunschweig, Germany; 3ResearchInstitute of Organic Agriculture FiBL, Frick, Switzerland;4Agroscope Changins-Wädenswil Research Station ACW, Nyon,Switzerland
Ecological cross compliance S Aviron et al.
248
wwwwww..ffrroonnttiieerrssiinneeccoollooggyy..oorrgg ©© The Ecological Society of America
great importance, because the associated expenditureswill only be justified if ecological goals can be reached.Cross compliance has been implemented in Switzerlandfor almost a decade, but only became obligatory in theEU in 2005. We evaluated the effectiveness of cross-com-pliance regulations in Switzerland with respect to biodi-versity by investigating species richness and compositionof plants and several invertebrate groups (butterflies, spi-ders, ground beetles) on ECA farmland as compared toconventionally managed farmland. Based on the resultsobtained in Switzerland, we discuss the potential effec-tiveness of this policy instrument for promoting farmlandbiodiversity at the continental scale.
�Methods
We carried out a long-term assessment to evaluate theeffects of cross compliance on species richness in threeregions representative of the different farming types(arable, mixed arable–grassland, grassland) in centralSwitzerland (WebPanel 1). Vascular plants, butterflies(Rhopalocera and Hesperiidae), ground beetles (Carabi-dae), and spiders (Araneae) were investigated between1997 and 2004 on ECA and conventionally managedfields. In total, 315 ECA meadows and 216 conventionalmeadows were sampled in the grassland and mixedarable–grassland regions, while 78 wildflower strip ECAsand 72 crop fields were evaluated in the arable region.We analyzed the difference in the numbers of species ofvascular plants, butterflies, ground beetles, and spidersbetween ECA and conventionally managed fields usingmixed general linear models. Because we were interestedin the effect of ECA rather than in a regional effect, thedata from the grassland and the mixed arable–grasslandregions were pooled (however, the impact of “region” was
investigated). Rarefaction methods(Hurlbert 1971) were used to com-pute expected numbers of arthropodspecies for a given abundance level,to correct for each species’ detectabil-ity and sample sizes in each habitattype. The numbers of vascular plantspecies derived from presence/absencedata were compared between pairs ofECA and conventional fields.Normal log-linear regressions wereused to analyze the number of plantsand arthropod species. Two separatemodels were built with managementtype as explanatory factor, in order totest for differences in species numbersbetween (1) ECA meadows and con-ventional meadows and (2) wild-flower strip ECAs and crop fields. Totake into account their confoundingeffects, local field conditions, land-scape context, the region, and the
sampling year were introduced as covariates in the mod-els. See WebPanel 1 for details on methods and analysis.
� Results
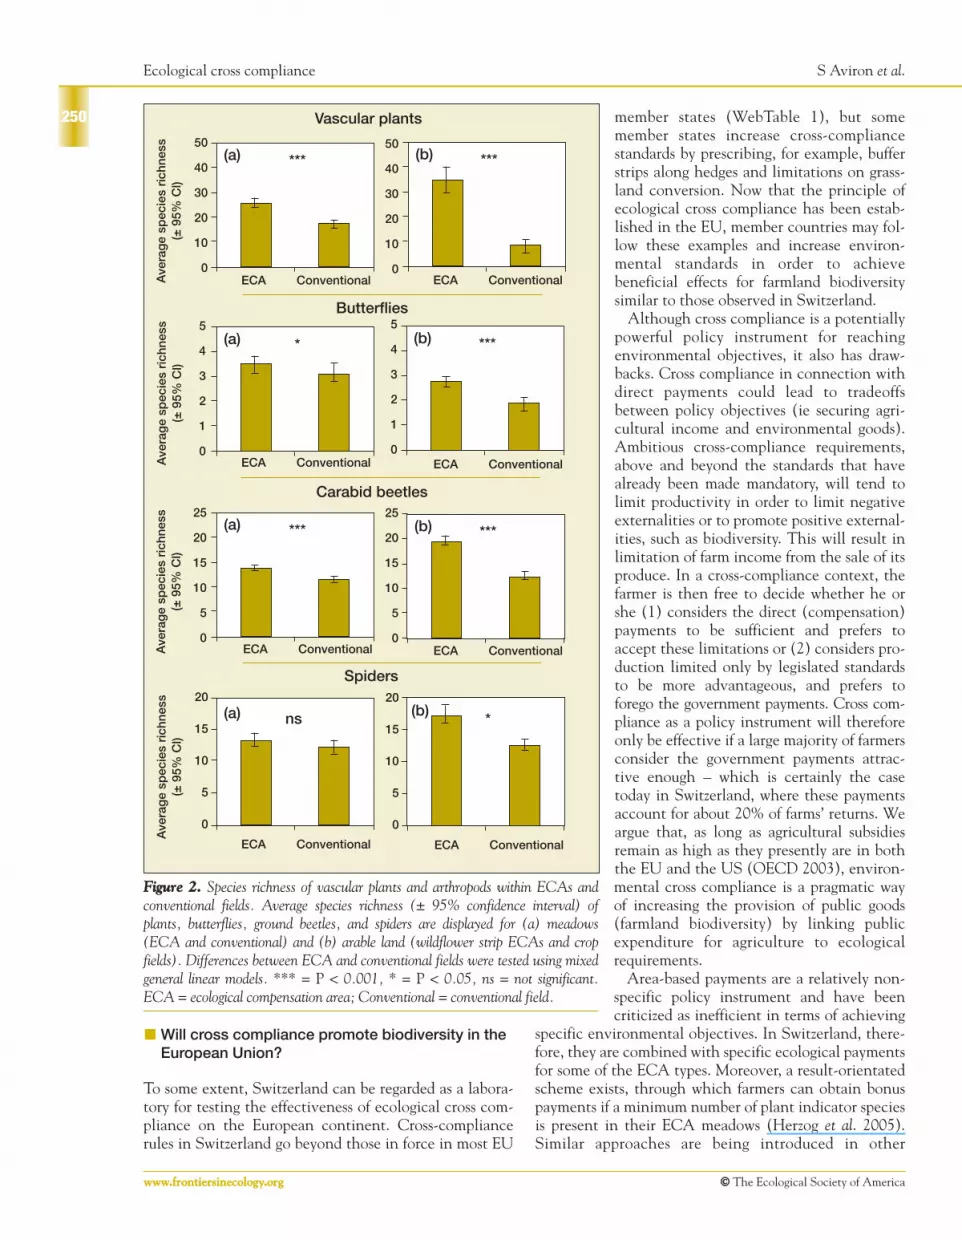
ECA meadows contained greater numbers of species ofplants, ground beetles, and butterflies, but not of spiders(Table 1; Figure 2). The total expected numbers of plants,spiders, and ground beetles (as estimated by rarefaction)were also higher in ECAs than in conventional meadows(Table 2). Moreover, ECA meadows harbored plants (35species), spiders (32 species), ground beetles (10 species),and butterflies (2 species) that were not recorded in con-ventional meadows. On wildflower strip ECAs, therewere between 8% and 60% more species of plants, groundbeetles, and spiders than on arable crops (Table 1; Figure2), and the total expected numbers were higher forplants, spiders, and ground beetles (Table 2).
The average species richness of plants and arthropodsin ECA meadows varied significantly across regions.Moreover, the diversity of arthropods was also influencedby sampling year and (for spiders and ground beetles) bythe relative proportion of ECA or crop fields in the land-scape surrounding the fields under investigation (Table1). However, the effect of ECA management remainedsubstantial after removing the influence of significantcovariates.
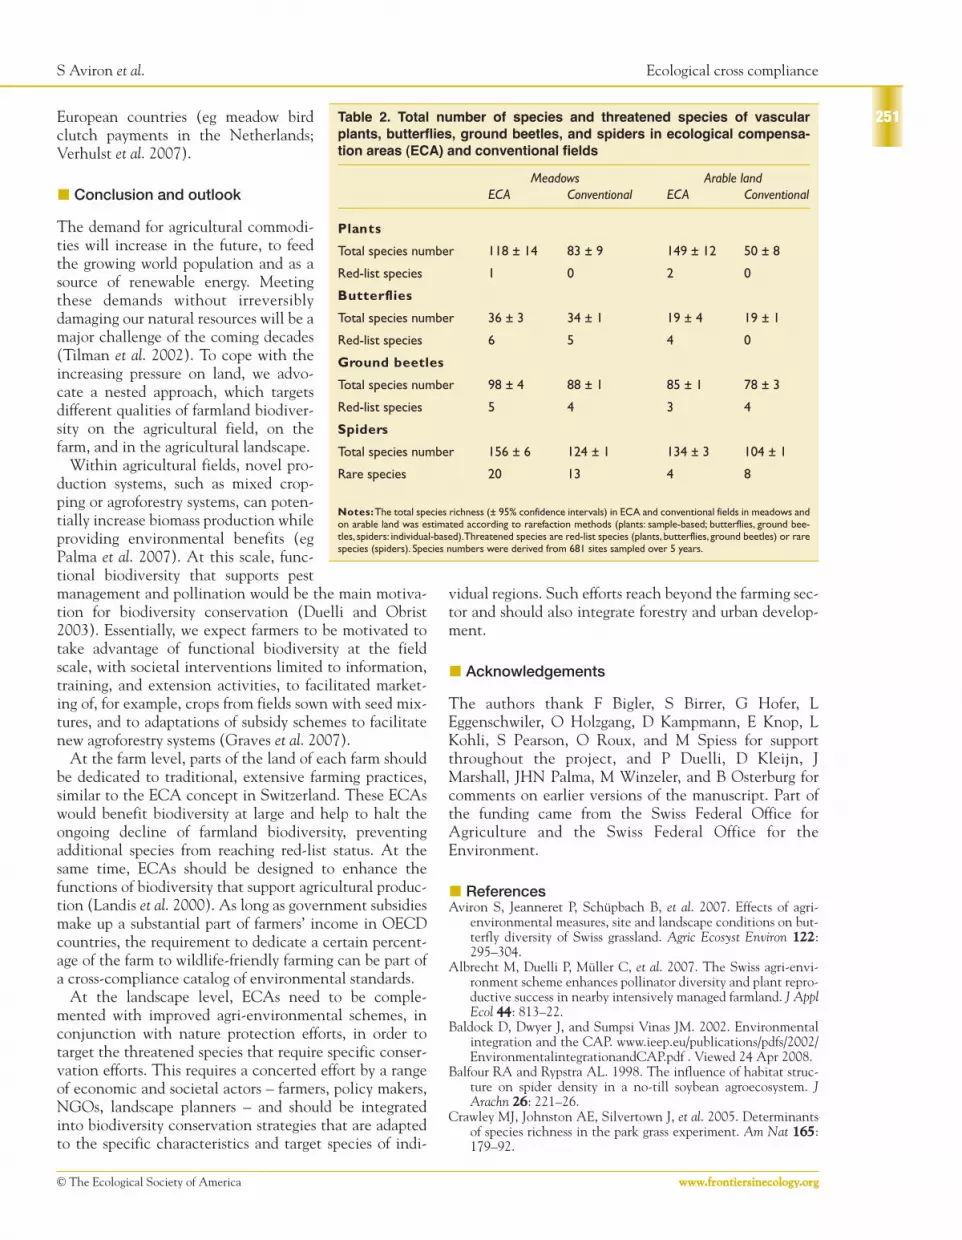
Very few of the plant and arthropod species observed inthe three Swiss regions were red-list or rare species (Table2). Among the 280 plant species recorded on the ECAmeadows and wildflower strips, only two were classified asthreatened. Seven ground beetle species and six butterflyspecies were listed in Red Data books, but they repre-sented only 4% and 14% of the total number of observedspecies. Ten percent of the arachnid species occurring in
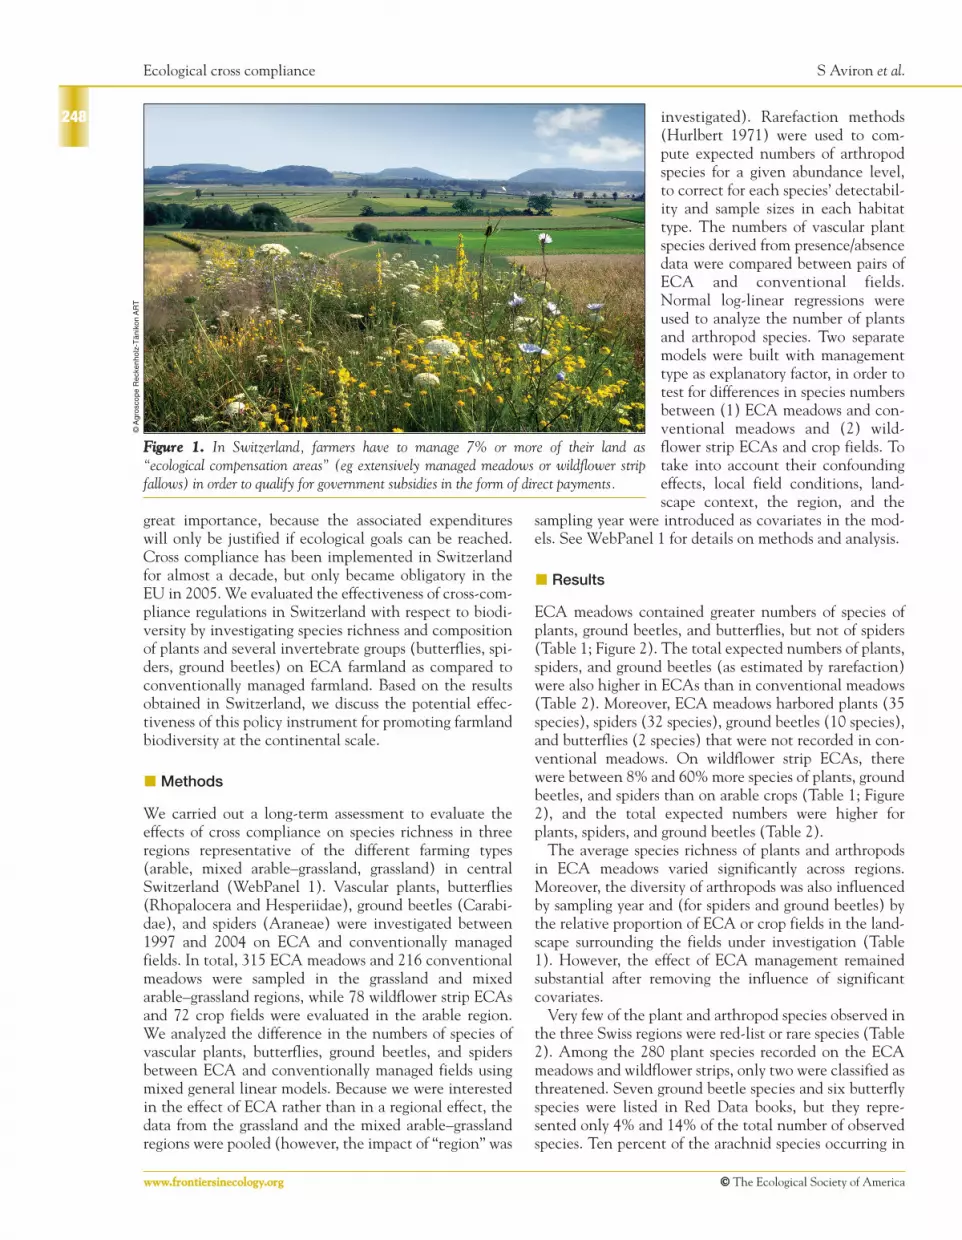
FFiigguurree 11.. In Switzerland, farmers have to manage 7% or more of their land as“ecological compensation areas” (eg extensively managed meadows or wildflower stripfallows) in order to qualify for government subsidies in the form of direct payments.
©A
gros
cope
Rec
kenh
olz-
Tän
ikon
AR
T

S Aviron et al. Ecological cross compliance
249
© The Ecological Society of America wwwwww..ffrroonnttiieerrssiinneeccoollooggyy..oorrgg
population increases as a result of ECAs, threatenedbird species showed no increase in numbers (Herzog etal. 2005). Thus, increases in the total number of speciesin ECAs reflect responses of common species, probablybecause many threatened species no longer occur in theregions investigated.
Other evaluation studies on agri-environmentalschemes in several European countries also failed to findpositive effects of the schemes on threatened species, andKleijn et al. (2006) concluded that their effectiveness forbiodiversity conservation is very limited. Efforts musttherefore be intensified beyond the mere introduction ofagri-environmental schemes (and/or cross-compliancemechanisms) if the ambitious goal of preserving threat-ened farmland species is to be reached. It has been sug-gested that biodiversity is enhanced by the ECA schemebeyond the boundaries of individual ECA fields(Albrecht et al. 2007), and that species use the ECA net-work to disperse in the landscape and complete their lifecycles (Jeanneret et al. 2003). Thus, the restoration ofthreatened and endangered species might require suffi-cient connectivity of ECA and other semi-natural habi-tats in the agricultural landscape.
ECAs were rare, and the numbers of rarespiders in ECAs were the same as in con-ventional fields.
� Discussion
Do ECAs promote farmland biodiversityin Switzerland?
ECA meadows and wildflower strip ECAsharbored higher overall diversity of vascu-lar plants and arthropods than did conven-tionally managed fields. The higher diver-sity of plants in ECAs could be the result oflower fertilizer usage, as the opposite effect– the reduction of floristic diversity of grass-lands by increased use of fertilizers – is wellestablished (Crawley et al. 2005). Higherarthropod diversity in ECAs could be inter-preted as a consequence of the increasedplant diversity and of late cutting, whichallows more species to complete their lifecycles (Aviron et al. 2007). The high diver-sity of flowering plants in ECAs provideshosts for herbivore arthropods and pollina-tors, which are, in turn, prey for predators(Marshall et al. 2006). For spiders, theabsence of an effect of ECA managementin meadows might be explained by the sim-ilar vertical structure of the two habitattypes, as spider diversity is affected more byvegetation structure than by plant speciesrichness (Balfour and Rypstra 1998).
The environmental variation linked tosite conditions, landscape context, regional factors, andtemporal variation can confound the measured effects ofagri-environmental schemes if ignored in evaluationstudies (Kleijn et al. 2006). The majority of Swiss farmerslocate ECAs in areas that bear little potential for intensi-fication and that have traditionally been extensivelymanaged. They are therefore more often located on steephillsides or shaded forest edges than are intensively man-aged fields (Herzog et al. 2005). However, even if theeffects of site conditions, landscape context, and regionallocation are accounted for, the ECA managementscheme still had a significant positive effect on biodiver-sity and added ecological value.
The most ambitious objective for agri-environmentalmeasures is to increase the size of populations of threat-ened species listed in Red Data books. Our results showthat ECAs do not benefit red-list or rare species, andthat individual species or groups of species reacted dif-ferently to ECA management. Among plants andarthropods, only certain groups of species showedincreased numbers in ECA meadows (Knop 2006).Similarly, although some bird species whose habitats arehedgerows, traditional orchards, or wetlands showed
Table 1. Effect of ecological compensation areas (ECAs) and environ-mental and temporal factors on species richness of vascular plants,butterflies, ground beetles, and spiders
Variable df F value P value
Vascular plantsMeadows Region 1 4.43 0.0379
ECA management 1 55.17 <0.0001Arable land ECA management 1 85.83 <0.0001
ButterfliesMeadows Region 1 3013.29 <0.0001
ECA management 1 6.52 0.0129Year 1 8.73 0.0035
Arable land ECA management 1 26.28 <0.0001Year 1 9.58 0.0031
Ground beetlesMeadows Region 1 79.96 <0.0001
ECA management 1 43.52 <0.0001Region*ECA management 1 16.00 <0.0001Year 1 3.95 0.0483
Arable land ECA management 1 210.18 <0.0001Percent cover of crop fields
(200-m radius) 1 17.77 <0.0001
SpidersMeadows Region 1 470.51 <0.0001
ECA management 1 3.56 0.0620Arable land ECA management 1 4.90 0.0296
Year 1 12.23 0.0008Year*ECA management 1 4.93 0.0292Percent cover of ECA
(200-m radius) 1 4.84 0.0306
Notes: Effects are tested for meadows (ECA and conventional) and arable land (wildflower strip ECAsand crop fields), using mixed general linear models. Degrees of freedom for variables (df), values of theF statistic (F value), and actual significance level (P value) are indicated for each model.
Ecological cross compliance S Aviron et al.
250
wwwwww..ffrroonnttiieerrssiinneeccoollooggyy..oorrgg ©© The Ecological Society of America
member states (WebTable 1), but somemember states increase cross-compliancestandards by prescribing, for example, bufferstrips along hedges and limitations on grass-land conversion. Now that the principle ofecological cross compliance has been estab-lished in the EU, member countries may fol-low these examples and increase environ-mental standards in order to achievebeneficial effects for farmland biodiversitysimilar to those observed in Switzerland.
Although cross compliance is a potentiallypowerful policy instrument for reachingenvironmental objectives, it also has draw-backs. Cross compliance in connection withdirect payments could lead to tradeoffsbetween policy objectives (ie securing agri-cultural income and environmental goods).Ambitious cross-compliance requirements,above and beyond the standards that havealready been made mandatory, will tend tolimit productivity in order to limit negativeexternalities or to promote positive external-ities, such as biodiversity. This will result inlimitation of farm income from the sale of itsproduce. In a cross-compliance context, thefarmer is then free to decide whether he orshe (1) considers the direct (compensation)payments to be sufficient and prefers toaccept these limitations or (2) considers pro-duction limited only by legislated standardsto be more advantageous, and prefers toforego the government payments. Cross com-pliance as a policy instrument will thereforeonly be effective if a large majority of farmersconsider the government payments attrac-tive enough – which is certainly the casetoday in Switzerland, where these paymentsaccount for about 20% of farms’ returns. Weargue that, as long as agricultural subsidiesremain as high as they presently are in boththe EU and the US (OECD 2003), environ-mental cross compliance is a pragmatic wayof increasing the provision of public goods(farmland biodiversity) by linking publicexpenditure for agriculture to ecologicalrequirements.
Area-based payments are a relatively non-specific policy instrument and have beencriticized as inefficient in terms of achieving
specific environmental objectives. In Switzerland, there-fore, they are combined with specific ecological paymentsfor some of the ECA types. Moreover, a result-orientatedscheme exists, through which farmers can obtain bonuspayments if a minimum number of plant indicator speciesis present in their ECA meadows (Herzog et al. 2005).Similar approaches are being introduced in other
�Will cross compliance promote biodiversity in theEuropean Union?
To some extent, Switzerland can be regarded as a labora-tory for testing the effectiveness of ecological cross com-pliance on the European continent. Cross-compliancerules in Switzerland go beyond those in force in most EU
FFiigguurree 22.. Species richness of vascular plants and arthropods within ECAs andconventional fields. Average species richness (± 95% confidence interval) ofplants, butterflies, ground beetles, and spiders are displayed for (a) meadows(ECA and conventional) and (b) arable land (wildflower strip ECAs and cropfields). Differences between ECA and conventional fields were tested using mixedgeneral linear models. *** = P < 0.001, * = P < 0.05, ns = not significant.ECA = ecological compensation area; Conventional = conventional field.
(a) *** (b) ***50
40
30
20
10
0ECA ConventionalA
vera
ge
spec
ies
rich
ness
(±95
% C
l)
50
40
30
20
10
0ECA Conventional
(a) * (b) ***
Vascular plants
Ave
rag
e sp
ecie
s ri
chne
ss(±
95%
Cl)
5
4
3
2
1
0ECA Conventional
5
4
3
2
1
0ECA Conventional
Butterflies
(a) *** (b) ***
(a) ns (b) *
Carabid beetles
Ave
rag
e sp
ecie
s ri
chne
ss(±
95%
Cl)
25
20
15
10
5
0
25
20
15
10
5
0ECA Conventional ECA Conventional
Spiders
Ave
rag
e sp
ecie
s ri
chne
ss(±
95%
Cl)
ECA Conventional ECA Conventional
20
15
10
5
0
20
15
10
5
0
S Aviron et al. Ecological cross compliance
251
© The Ecological Society of America wwwwww..ffrroonnttiieerrssiinneeccoollooggyy..oorrgg
European countries (eg meadow birdclutch payments in the Netherlands;Verhulst et al. 2007).
� Conclusion and outlook
The demand for agricultural commodi-ties will increase in the future, to feedthe growing world population and as asource of renewable energy. Meetingthese demands without irreversiblydamaging our natural resources will be amajor challenge of the coming decades(Tilman et al. 2002). To cope with theincreasing pressure on land, we advo-cate a nested approach, which targetsdifferent qualities of farmland biodiver-sity on the agricultural field, on thefarm, and in the agricultural landscape.
Within agricultural fields, novel pro-duction systems, such as mixed crop-ping or agroforestry systems, can poten-tially increase biomass production whileproviding environmental benefits (egPalma et al. 2007). At this scale, func-tional biodiversity that supports pestmanagement and pollination would be the main motiva-tion for biodiversity conservation (Duelli and Obrist2003). Essentially, we expect farmers to be motivated totake advantage of functional biodiversity at the fieldscale, with societal interventions limited to information,training, and extension activities, to facilitated market-ing of, for example, crops from fields sown with seed mix-tures, and to adaptations of subsidy schemes to facilitatenew agroforestry systems (Graves et al. 2007).
At the farm level, parts of the land of each farm shouldbe dedicated to traditional, extensive farming practices,similar to the ECA concept in Switzerland. These ECAswould benefit biodiversity at large and help to halt theongoing decline of farmland biodiversity, preventingadditional species from reaching red-list status. At thesame time, ECAs should be designed to enhance thefunctions of biodiversity that support agricultural produc-tion (Landis et al. 2000). As long as government subsidiesmake up a substantial part of farmers’ income in OECDcountries, the requirement to dedicate a certain percent-age of the farm to wildlife-friendly farming can be part ofa cross-compliance catalog of environmental standards.
At the landscape level, ECAs need to be comple-mented with improved agri-environmental schemes, inconjunction with nature protection efforts, in order totarget the threatened species that require specific conser-vation efforts. This requires a concerted effort by a rangeof economic and societal actors – farmers, policy makers,NGOs, landscape planners – and should be integratedinto biodiversity conservation strategies that are adaptedto the specific characteristics and target species of indi-
vidual regions. Such efforts reach beyond the farming sec-tor and should also integrate forestry and urban develop-ment.
� Acknowledgements
The authors thank F Bigler, S Birrer, G Hofer, LEggenschwiler, O Holzgang, D Kampmann, E Knop, LKohli, S Pearson, O Roux, and M Spiess for supportthroughout the project, and P Duelli, D Kleijn, JMarshall, JHN Palma, M Winzeler, and B Osterburg forcomments on earlier versions of the manuscript. Part ofthe funding came from the Swiss Federal Office forAgriculture and the Swiss Federal Office for theEnvironment.
� References Aviron S, Jeanneret P, Schüpbach B, et al. 2007. Effects of agri-
environmental measures, site and landscape conditions on but-terfly diversity of Swiss grassland. Agric Ecosyst Environ 112222:295–304.
Albrecht M, Duelli P, Müller C, et al. 2007. The Swiss agri-envi-ronment scheme enhances pollinator diversity and plant repro-ductive success in nearby intensively managed farmland. J ApplEcol 4444: 813–22.
Baldock D, Dwyer J, and Sumpsi Vinas JM. 2002. Environmentalintegration and the CAP. www.ieep.eu/publications/pdfs/2002/EnvironmentalintegrationandCAP.pdf . Viewed 24 Apr 2008.
Balfour RA and Rypstra AL. 1998. The influence of habitat struc-ture on spider density in a no-till soybean agroecosystem. JArachn 2266: 221–26.
Crawley MJ, Johnston AE, Silvertown J, et al. 2005. Determinantsof species richness in the park grass experiment. Am Nat 116655:179–92.
Table 2. Total number of species and threatened species of vascularplants, butterflies, ground beetles, and spiders in ecological compensa-tion areas (ECA) and conventional fields
Meadows Arable landECA Conventional ECA Conventional
Plants
Total species number 118 ± 14 83 ± 9 149 ± 12 50 ± 8
Red-list species 1 0 2 0
Butterflies
Total species number 36 ± 3 34 ± 1 19 ± 4 19 ± 1
Red-list species 6 5 4 0
Ground beetles
Total species number 98 ± 4 88 ± 1 85 ± 1 78 ± 3
Red-list species 5 4 3 4
Spiders
Total species number 156 ± 6 124 ± 1 134 ± 3 104 ± 1
Rare species 20 13 4 8
Notes:The total species richness (± 95% confidence intervals) in ECA and conventional fields in meadows andon arable land was estimated according to rarefaction methods (plants: sample-based; butterflies, ground bee-tles, spiders: individual-based).Threatened species are red-list species (plants, butterflies, ground beetles) or rarespecies (spiders). Species numbers were derived from 681 sites sampled over 5 years.

Ecological cross compliance S Aviron et al.
Duelli P and Obrist MK. 2003. Biodiversity indicators: the choiceof values and measures. Agric Ecosyst Environ 9988: 87–98.
Graves AR, Burgess PJ, Palma JHN, et al. 2007. Development andapplication of bio-economic modelling to compare silvoarable,arable, and forestry systems in three European countries. EcolEng 2299: 434–49.
Herzog F, Dreier S, Hofer G, et al. 2005. Effect of ecological com-pensation areas on floristic and breeding bird diversity in Swissagricultural landscapes. Agric Ecosyst Environ 110088: 189–204.
Hoag DL and Holloway HA. 1991. Farm production decisionsunder cross and conservation compliance. Am J Agric Econ 7711:184–93.
Hurlbert SH. 1971. The nonconcept of species diversity: a critiqueand alternative parameters. Ecol Monogr 5544: 187–211.
Jeanneret P, Schüpbach B, Pfiffner L, et al. 2003. Arthropod reac-tion to landscape and habitat features in agricultural land-scapes. Landscape Ecol 1188: 253–63.
Kleijn D and Sutherland WJ. 2003. How effective are Europeanagri-environmental schemes in conserving and promoting bio-diversity? J Appl Ecol 4400: 947–69.
Kleijn D, Baquero RA, Clough Y, et al. 2006. Mixed biodiversitybenefits of agri-environment schemes in five European coun-tries. Ecol Lett 99: 243–54.
Knop E. 2006. Effectiveness of the Swiss agri-environment scheme(PhD dissertation). Zurich, Switzerland: University of Zurich.
Landis DA, Wratten SD, and Gurr GM. 2000. Habitat manage-ment to conserve natural enemies of arthropod pests in agricul-ture. Annu Rev Entomol 4455: 175–201.
Marshall EJP, West TM, and Kleijn D. 2006. Impacts of an agri-environment field margin prescription on the flora and fauna ofarable farmland in different landscapes. Agric Ecosyst Environ111133: 36–44.
Mattison EHA and Norris K. 2005. Bridging the gaps between agri-cultural policy, land use and biodiversity. Trends Ecol Evol 2200:610–16.
OECD (Organisation for Economic Co-operation and Develop-ment). 2003. Agricultural policies in OECD countries: moni-toring and evaluation. Paris, France: OECD.
OECD (Organisation for Economic Co-operation and Develop-ment). 2007. Inventory of policy measures addressing environ-mental issues in agriculture. Paris, France: OECD. www2.oecd.org/agr-envdbo/index.asp. Viewed 2 Nov 2007.
Palma JHN, Graves AR, Burgess PJ, et al. 2007. Integrating envi-ronmental and economic performance to assess modern sil-voarable agroforestry in Europe. Ecol Econ 6633: 759–67.
SFOA (Swiss Federal Office for Agriculture). 2007. Rapport agri-cole. Berne, Switzerland: SFOA.
Tilman D, Cassman KG, Matson PA, et al. 2002. Agricultural sus-tainability and intensive production practices. Nature 441188:671–77.
UNO (United Nations Organisation). 1998. Convention on bio-logical diversity. New York, NY: Secretariat of the UnitedNations Organisation.
Verhulst J, Kleijn D, and Berendse F. 2007. Direct and indirecteffects of the most widely implemented Dutch agri-environ-ment schemes on breeding waders. J Appl Ecol 4444: 70–80.
252
wwwwww..ffrroonnttiieerrssiinneeccoollooggyy..oorrgg ©© The Ecological Society of America
TAKE THIS JOURNAL TO YOUR LIBRARIAN, PLEASEAre you enjoying this issue of Frontiers?
If your library had a subscription, colleagues and students could enjoy it too.Please consider recommending Frontiers in Ecology and the Environment to your library.
Clip or copy the form below. Thank you for your support.
LLiibbrraarryy RReeccoommmmeennddaattiioonn FFoorrmm
To Acquisition Librarian, Serials
From
Dept
Signature Date
II rreeccoommmmeenndd tthhee lliibbrraarryy ssuubbssccrriibbee ttoo:: Frontiers in Ecology and the Environment ((IISSSSNN 11554400--99229955))
To request a free sample issue of Frontiers in Ecology and the Environment, call (301) 588-4691 or email Eric Gordon
at [email protected]. Order Frontiers by contacting ESA Headquarters at (202) 833-8773, online at www.esa.org, or through your subscription agent.
�
�

© The Ecological Society of America wwwwww..ffrroonnttiieerrssiinneeccoollooggyy..oorrgg
S Aviron et al. – Supplemental information
WebPanel 1. Study area and methods
The study areas were each 8–10 km2. They were located in theSwiss lowlands, in an arable region (8.1 km2; 8˚32’ N, 47˚35 30”E; 450 m above sea level [asl]; annual precipitation 900 mm;average annual temperature 8.5˚C), in a mixed arable–grasslandregion (7.2 km2, 6˚49’ 30” N / 46˚46’30” E, 650 m asl; annualprecipitation 900 mm; average annual temperature 8.4°C), andin a grassland region (8.8 km2; 8˚7’ N / 47˚6’ E,750 m asl; annualprecipitation 1400 mm; average annual temperature 6.8˚C).Thetypes of ECA and their share (percentage) of the farmland inthe three regions were representative of the three larger bio-geographic regions in which they were located.
SamplingThe diversity of vascular plants, butterflies, ground beetles, andspiders was investigated between 1997 and 2004 in both ECAand conventionally managed fields (total fields = 681). Thenumber of sampled fields per ECA type and type of conven-tional field was determined according to the proportion ofeach type occurring in studied regions (Jeanneret et al. 2003).Consequently, ECA meadows and conventional meadowswere sampled in the grassland and mixed arable–grasslandregions, while observations of wildflower strip ECAs and cropfields were limited to the arable region. Only a few fields couldbe observed throughout the entire period, because crop rota-tions lead to very dynamic land use in agricultural landscapes.In total, 315 ECA meadows and 216 conventional meadowswere investigated in the grassland and mixed arable–grasslandregions. In the arable region, 78 wildflower strip ECAs and 72crop fields were evaluated.
Vascular plants were recorded every year between 1997and 2003. However, only the records of the last year of obser-vation (2003) were analyzed, as we did not observe substan-tial changes in the plant species richness and composition inECA and conventional grasslands over the period of study(Buholzer et al. 2005). Presence/absence of plant species wassampled in a 100-m2 plot centred in each field. Observationsin crop fields and wildflower strips were made after cropbloom (ie between late June and early July), while observa-tions in meadows were made in late May, before the first cut.Observations of butterflies were repeated biennially between1998 and 2004. Butterflies were observed between May andAugust in a 0.25-ha surface area within sampled fields for fiveperiods of 10 minutes each. Observations were conductedbetween 9:00 am and 6:00 pm, under sunny weather condi-tions, with no or light wind and a minimum temperature of18˚C (Pollard 1977).The five censuses per field were pooledfor analysis. Ground beetles and spiders were also observedbi-annually between 1997 and 2003. Ground beetles and spi-ders were collected using three pitfall traps located in thecenter of each field and spaced 3 m apart from one another.The traps consisted of funnel traps of 10.5-cm diameter, con-taining 2 cm of 90% alcohol/water solution.Trapping was con-ducted during the first 3 weeks of May and the last 2 weeks ofJune (Duelli 1997) to optimize the number of catches per unitof sampling effort. Traps were emptied once per week. Thethree pitfall traps and the 5 weeks were pooled for analysis.Threatened species of plants, butterflies, and ground beetles
were identified by means of national Red Data books. Red-listspecies of spiders have not been inventoried in Switzerland,and their rarity status was used instead (Pozzi et al. 1998).
Local field conditions were described by soil type, field ori-entation, and field slope, which might affect plant and arthro-pod diversity. Soil type was characterized for each field usinggeological maps of study areas and categorized into 13 classesfollowing nomenclatures of soil types in Switzerland. Field ori-entation (south versus non-south facing) and slope (less than35˚ versus more than 35˚) were derived from a digital eleva-tion model.
Land-cover maps of study areas were digitized from aerialphotographs and topographic maps using a geographic informa-tion system (Arcview 8.1, ESRI). Each region was visited annuallyand all fields categorized according to their use. For each sam-pled field and every year, landscape context was described bythe percent cover of ECA (wildflower strip ECAs, ECA mead-ows, ECA hedges, ECA orchards), of conventional meadows, ofcrop fields, and of woody elements (non-ECA hedges and for-est) in a 200-m radius circle around the field.The extent of semi-natural habitat and cultivated fields is positively related to biodi-versity (Schmidt et al. 2005). A 200-m radius size was selectedbecause the study was designed to consider effects of the neigh-boring landscape and not to test possible effects of landscapefeatures over a wide range of spatial scales.The Euclidian dis-tance from sampled fields to the nearest forest edge was alsocalculated, to account for the potentially biased location ofECAs,which are more often on unproductive sites along shadedforest edges (Herzog et al. 2005).
Data transformation and statistical analysisWe analyzed the difference in species richness (ie number) ofvascular plant, butterfly, ground beetle, and spider speciesbetween ECA and conventionally managed fields. Counts ofobserved species cannot be directly compared between differ-ent habitat types, as the number of individuals varies within andbetween each kind of habitat, leading to variable sampling effi-ciency (Gotelli and Colwell 2001).The number of species foundin a given area also increases with the number of sampling sites.We therefore corrected for the varying detectability of speciesin habitat types and for the different sample sizes in each habi-tat type by computing the expected number of spider, groundbeetle, and butterfly species for a given number of sampledindividuals according to the rarefaction method (Hurlbert1971).The total number of arthropod species expected for thefour management types (ECA meadow, wildflower strip ECA,conventional meadow, and crop field) and expected number ofarthropod species for each sampled field were estimated usingthe vegan community ecology statistical package for R(Oksanen et al. 2005). Because only presence/absence datawere recorded for vascular plants, expected numbers of plantspecies for a given number of sampled individuals could not bederived. The total number of plant species expected for thefour management types was instead computed for a given num-ber of samples (sampled fields), according to rarefactionmethod (Hurlbert 1971), and sample sizes were reduced forthe statistical comparisons between ECA and conventional
Supplemental information S Aviron et al.
wwwwww..ffrroonnttiieerrssiinneeccoollooggyy..oorrgg ©© The Ecological Society of America
WebPanel 1. (Continued)
� References Buholzer S, Jeanneret P, and Bigler F. 2005. Arthropodes dans les
surfaces de compensation écologique du Plateau. In: Herzog Fand Walter T (Eds). Evaluation des mesures écologiques –domaine biodiversité. Zurich, Switzerland: Agroscope FALReckenholz.
Duelli P. 1997. Biodiversity evaluation in agricultural landscapes:an approach at two different scales. Agric Ecosyst Environ 6622:81–91.
Gotelli NJ and Colwell RK. 2001. Quantifying biodiversity: pro-cedures and pitfalls in the measurement and comparison ofspecies richness. Ecol Lett 44: 379–91.
Herzog F, Dreier S, Hofer G, et al. 2005. Effect of ecological com-pensation areas on floristic and breeding bird diversity inSwiss agricultural landscapes. Agric Ecosyst Environ 110088:189–204.
Hurlbert SH. 1971. The nonconcept of species diversity: a cri-
tique and alternative parameters. Ecol Monogr 5544: 187–211.Jeanneret P, Schüpbach B, Pfiffner L, et al. 2003. The Swiss agri-
environmental programme and its effects on selected biodi-versity indicators. J Nature Conserv 1111: 213–20.
Oksanen J, Kindt R, and O’Hara RB. 2005. Vegan: communityecology package version 1.6–9. http://cc.oulu.fi/~jarioksa.Viewed 24 Apr 2008.
Pollard E. 1977. A method for assessing changes in the abun-dance of butterflies. Biol Conserv 1122: 115–34.
Pozzi S, Gonseth Y, and Hänggi A. 1998. Evaluation de l’entre-tien des prairies sèches du plateau occidental Suisse par lebiais de leur arachnologique (Arachnida, Araneae). RevSuisse Zool 110055: 465–85.
Schmidt MH, Roschewitz I, Thies C, and Tscharntke T. 2005.Differential effects of landscape and management on diver-sity and density of ground-dwelling farmland spiders. J ApplEcol 4422: 281–87.
meadows (n = 49 pairs) and between wildflower strip ECAsand crop fields (n = 22 pairs). The differences in vascularplant, butterfly, ground beetle, and spider species numbersbetween ECA and conventionally managed fields were testedusing mixed general linear models (GLM) within the statisti-cal program SAS (SAS Institute Inc). Normal log-linearregressions were used to analyze numbers of plant andarthropod species. Two separate models were built, withmanagement type as explanatory factor (ECA versus con-ventional), in order to test differences in species numbersbetween (1) ECA meadows and conventional meadows in
the grassland and mixed arable–grassland regions and (2)wildflower strip ECAs and crop fields in the arable region.Totake into account their confounding effects, local field condi-tions (type of soil, orientation, and slope), landscape context(percent cover of land uses in 200-m radii, distance to for-est), and the region (in cases in which two regions wereinvolved) were introduced as covariates in the models.Sampling year (in the case of arthropods) was also entered asa random variable in the models, to account for yearly varia-tions. Data were square-root or log transformed to over-come departure from normality.

S Aviron et al. Supplemental information
© The Ecological Society of America wwwwww..ffrroonnttiieerrssiinneeccoollooggyy..oorrgg
WebTable 1. Cross compliance in Switzerland and the European Union
Minimum Minimum Wildlife- Immediate QuantitativeRetention share of maintenance friendly restrictions on minimum Constraintsof existing landscape of grassland cutting of conversion of standards on nutrient andlandscape elements/ beyond yearly set-aside permanent for crop pesticide inputselements1 buffer strips mulching2 grassland grassland3 rotation (above legislation)
Austria � � � On certain locations
Belgium WalloniaDenmark � On fallowFinland � � �
France � (3%) Regional rules Regional rules � On ECAGermany � � �
Greece � � (�)Ireland � � �
Italy Regional rules Unless for renewal
Luxembourg � �
NetherlandsPortugal � �
Spain � Unless for On fallowrenewal
Sweden � On fallowEngland � � � On unculti- On buffer
vated and stripssemi-naturalland
Switzerland � (7%) For ECA For ECA � �
Notes: Selected requirements with biodiversity impacts, which farmers have to fulfil in order to qualify for direct payments in EU-15 (EC 1782/2003,Annex IV) and for areapayments in Switzerland. From Alliance Environnement. 2007. Evaluation of the application of cross compliance as foreseen under Regulation 1782/2003. http://ec.europa.eu/agriculture/eval/reports/cross_compliance/index_en.htm.Viewed 3 Jun 2008. 1Biodiversity related (eg hedges, groups of trees,wetlands); 2eg limit on mulching or grazing requiredor removing of vegetation; 3or only after official authorization.


