Embed Size (px)
Citation preview

Report
38298-5.2.3
EASTERN STORMWATER MANAGEMENT FACILITY DESIGN WATERIDGE VILLAGE AT ROCKCLIFFE PHASE 1A
Prepared for Canada Lands Company
By IBI Group
REVISED JANUARY 2016
REVISED FEBRUARY 2016
IBI GROUP REPORT
38298-5.2.3
EASTERN STORMWATER MANAGEMENT FACILITY DESIGN
WATERIDGE VILLAGE AT ROCKCLIFFE
PHASE 1A
Prepared for Canada Lands Company
Table of Contents
REVISED JANUARY 2016
REVISED FEBRUARY 2016
i
1 Introduction .............................................................................................................. 1
1.1 Study Objectives ........................................................................................... 1
1.2 Synopsis of Previous Studies ....................................................................... 1
2 Design Constraints and Regulatory Requirements ............................................. 3
2.1 Water Quality Control .................................................................................... 3
2.2 Water Quantity Control ................................................................................. 3
2.3 Baseflow Augmentation ................................................................................ 3
3 Overall Stormwater Management Approach ......................................................... 4
3.1 Dual Drainage Concept ................................................................................. 4
3.2 End-of-Pipe Stormwater Management Facilities .......................................... 4
3.2.1 Eastern SWMF ................................................................................. 5
4 Hydrologic and Hydraulic Modeling ...................................................................... 6
4.1 Hydrologic Modeling ..................................................................................... 6
4.2 Hydraulic Modeling ....................................................................................... 6
4.2.1 Performance of the SWM Facility .................................................... 7
4.2.2 Hydraulic Grade Line Evaluation ..................................................... 8
5 Stormwater Management Facility ........................................................................ 10
5.1 Water Quantity Control ............................................................................... 10
5.2 Water Quality Control .................................................................................. 10
5.3 Baseflow Augmentation .............................................................................. 10
6 Design Components of the SWMF ....................................................................... 12
6.1 Inlet System ................................................................................................ 12

IBI GROUP REPORT
38298-5.2.3
EASTERN STORMWATER MANAGEMENT FACILITY DESIGN
WATERIDGE VILLAGE AT ROCKCLIFFE
PHASE 1A
Prepared for Canada Lands Company
Table of Contents (continued)
REVISED JANUARY 2016
REVISED FEBRUARY 2016
ii
6.2 Inlet Flow Splitter ........................................................................................ 12
6.3 Sediment Forebay ....................................................................................... 13
6.4 Wet Pond .................................................................................................... 13
6.5 Outlet Structure ........................................................................................... 13
6.6 Eastern SWMF Outlet Pipe ......................................................................... 14
6.7 Western SWMF Overflow Pipe ................................................................... 14
6.8 Baseflow Augmentation Pipe ...................................................................... 15
6.9 Emergency Overflow ................................................................................... 15
6.10 Additional Features ..................................................................................... 15
7 Facility operation, Maintenance and Monitoring Recommendation ................ 17
7.1 Routine Maintenance .................................................................................. 17
7.2 Visual Inspection ......................................................................................... 17
7.3 Sediment Removal and Disposal ................................................................ 18
7.4 Maintenance Schedule ............................................................................... 18
7.5 Facility Monitoring ....................................................................................... 19
7.6 Erosion and Sedimentation Control Plan .................................................... 19
8 Summary of Eastern SWMF .................................................................................. 20
References ........................................................................................................................ 21

IBI GROUP REPORT
38298-5.2.3
EASTERN STORMWATER MANAGEMENT FACILITY DESIGN
WATERIDGE VILLAGE AT ROCKCLIFFE
PHASE 1A
Prepared for Canada Lands Company
REVISED JANUARY 2016
REVISED FEBRUARY 2016
i
LIST OF APPENDIX
Appendix A XPSWMM Schematic and XPSWMM Computer Output
(refer to enclosed CD for full computer output files)
Appendix B Water Quality and Sediment Forebay Calculations

IBI GROUP REPORT
38298-5.2.3
EASTERN STORMWATER MANAGEMENT FACILITY DESIGN
WATERIDGE VILLAGE AT ROCKCLIFFE
PHASE 1A
Prepared for Canada Lands Company
REVISED JANUARY 2016
REVISED FEBRUARY 2016
1
1 Introduction
1.1 Study Objectives
Canada Lands Company retained IBI Group to prepare the design brief for the Eastern Stormwater
Management Facility (SWMF), which is part of the Rockcliffe development. The Eastern SWMF is
designed to service the central and eastern portions of the Rockcliffe development. The lands
tributary to the Eastern SWMF are located south of the Charles Etienne Cartier Parkway and
extend south to Montreal Road, east to the NRC Campus, and west to the western boundary of
the Phase 1A development and the future museum site. The 100.88 ha study area is illustrated in
Figure 1.
The main objective of this study is to provide design brief for the proposed Eastern SWMF to meet
regulatory requirements for the tributary drainage area of the Rockcliffe Development assuming
ultimate development conditions.
1.2 Synopsis of Previous Studies
In August 2015, IBI Group completed the “Former CFB Rockcliffe Master Servicing Study1” (MSS)
in conjunction with the Community Design Plan2 (MMM Group and Meloshe & Associates, August
2015). The CDP was supported by an Existing Conditions Report, a Community Transportation
Study, and by the MSS1.
The MSS1 and CDP2 process evaluated basic servicing alternatives and selected a preferred
servicing solution for the redevelopment of former CFB Rockcliffe. The evaluation was completed
in sufficient detail to satisfy Phases 1 and 2 of the Municipal Class EA process and, as part of the
CDP process, included consultation with review agencies, stakeholders, and the public.
An integral component of the process of selecting a preferred servicing solution is the City of
Ottawa and CLC's desire to advance the Rockcliffe CDP as a pilot project for Low Impact
Development (LID). CLC’s goal is for the development to be a model community for LID.
Since proposed LID elements are to be constructed as pilot projects for which the stormwater
benefit’s are presently unknown, the early developments of the subject site will include traditional
stormwater management infrastructure based on current City and MOE criteria. LID measures will
be incorporated into specific areas of the site as additional stormwater management elements with
an aim of future monitoring to confirm potential benefits.
The MSS1 recommended that the preferred stormwater management solution accommodate
sustainable development while protecting the existing natural environment. The selected servicing
solution is to construct a dual drainage system to be completed with end-of-pipe SWMF’s. Two
end-of-pipe SWMF, Eastern and Western ponds, were recommended to balance stormwater
discharge between the existing outlets. The Eastern SWMF is to service the central and eastern
portions of the Rockcliffe development lands and the Western SWMF is to service the western
portion of the development lands.
In November 2015, IBI Group completed the Draft “Design Brief Wateridge Village at Rockcliffe
Phase 1A”. That Draft report outlined the detailed site stormwater management design and
analysis for the Phase 1A development. In January 2016, concurrent with the SWM facility design,
the revised submission of Phase 1A design is being completed and is henceforth referred to as
the January 2016 Phase 1A Design Brief Report3.

IBI GROUP REPORT
38298-5.2.3
EASTERN STORMWATER MANAGEMENT FACILITY DESIGN
WATERIDGE VILLAGE AT ROCKCLIFFE
PHASE 1A
Prepared for Canada Lands Company
REVISED JANUARY 2016
REVISED FEBRUARY 2016
2
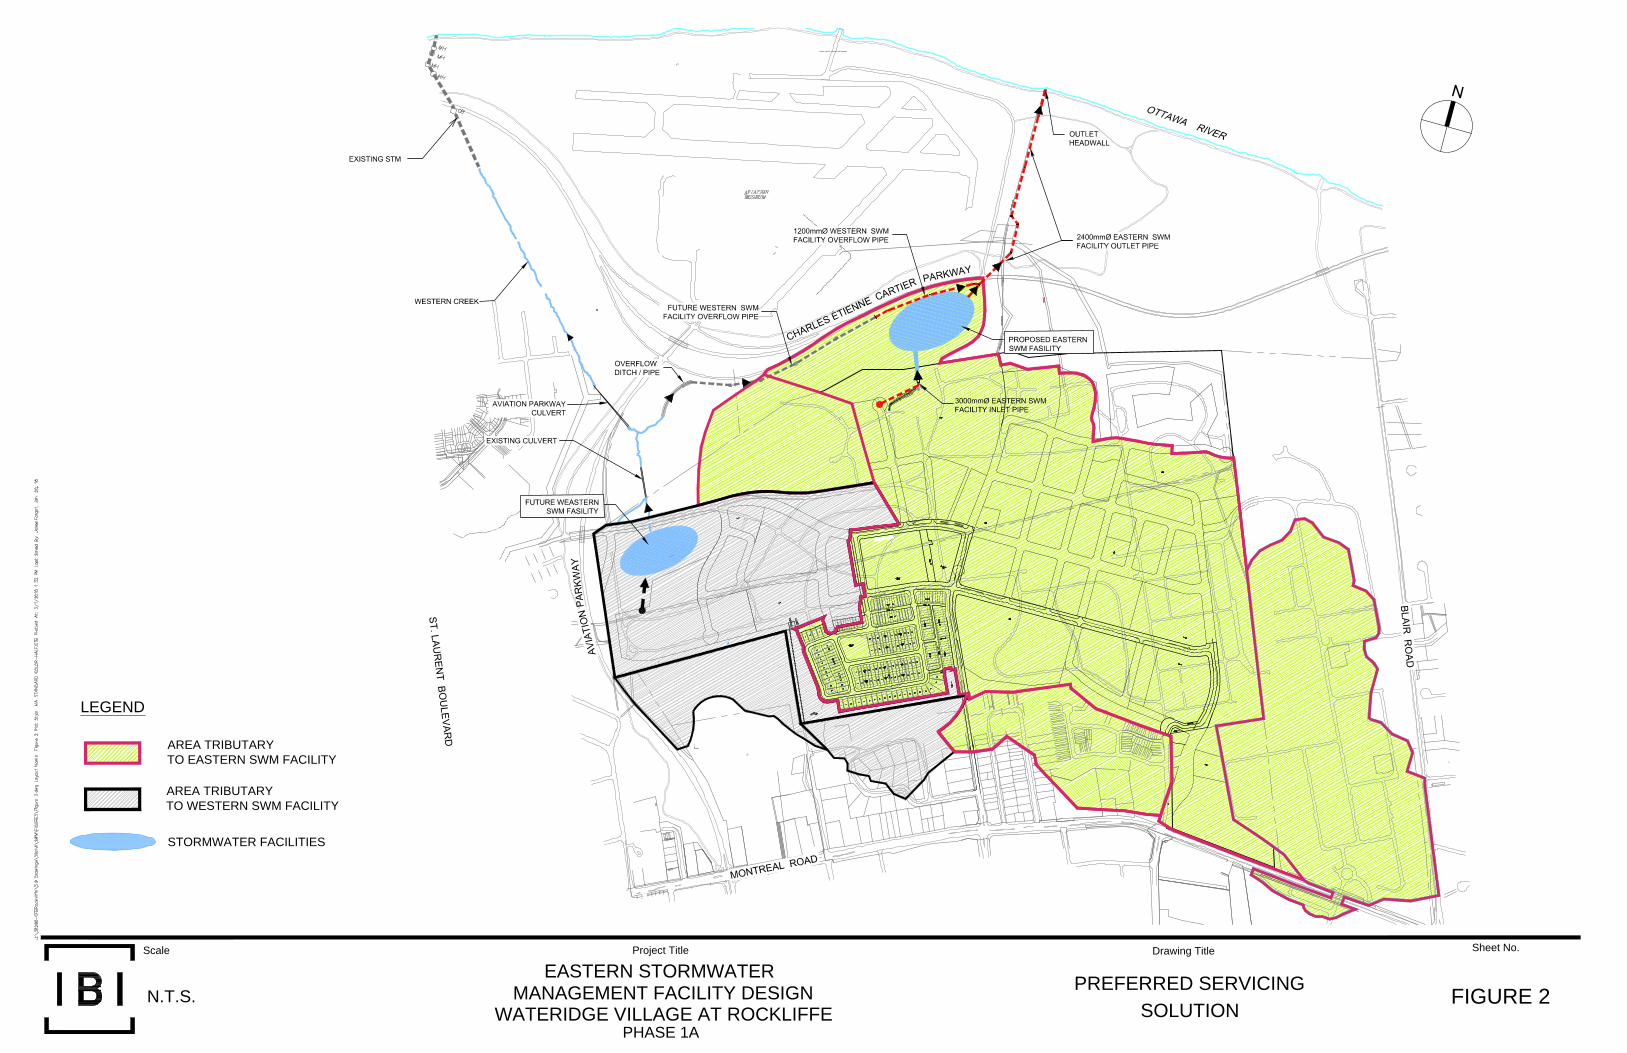
The preferred servicing solution for stormwater is outlined in Figure 2. This report builds upon the
recommendations and findings of the above reports, and is intended to aid in the review and
approval of the design for the Eastern SWMF.
IBI GROUP REPORT
38298-5.2.3
EASTERN STORMWATER MANAGEMENT FACILITY DESIGN
WATERIDGE VILLAGE AT ROCKCLIFFE
PHASE 1A
Prepared for Canada Lands Company
REVISED JANUARY 2016
REVISED FEBRUARY 2016
3
2 Design Constraints and Regulatory Requirements
2.1 Water Quality Control
As outlined within the MSS1, the Eastern SWMF is to be designed to provide an Enhanced Level
of Protection. The Enhanced Level of Protection corresponds to end-of-pipe storage volumes
required for the long-term average removal of 80% of Total Suspended Solids (TSS) in
accordance with the MOE Stormwater Management Planning and Design Manual (March, 2003).
2.2 Water Quantity Control
The MSS1 concluded that it would not be necessary for the Eastern SWMF to provide water
quantity control as the facility will be directly connected to the Ottawa River.
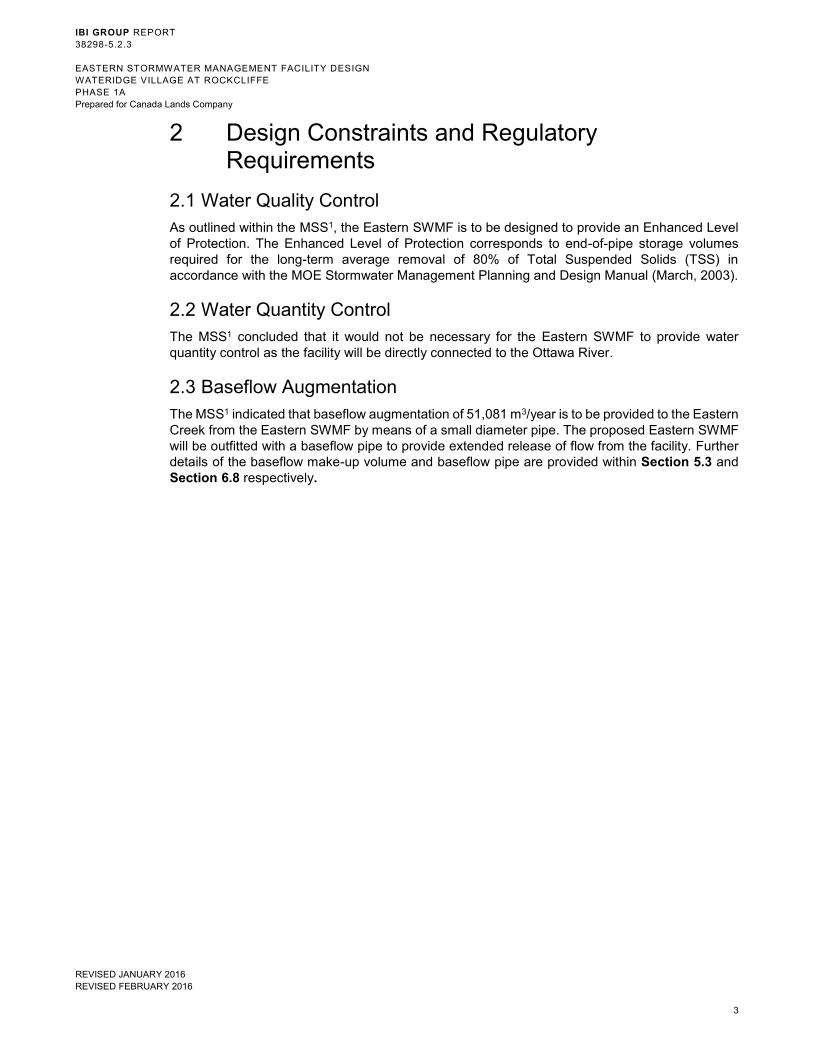
2.3 Baseflow Augmentation
The MSS1 indicated that baseflow augmentation of 51,081 m3/year is to be provided to the Eastern
Creek from the Eastern SWMF by means of a small diameter pipe. The proposed Eastern SWMF
will be outfitted with a baseflow pipe to provide extended release of flow from the facility. Further
details of the baseflow make-up volume and baseflow pipe are provided within Section 5.3 and
Section 6.8 respectively.

IBI GROUP REPORT
38298-5.2.3
EASTERN STORMWATER MANAGEMENT FACILITY DESIGN
WATERIDGE VILLAGE AT ROCKCLIFFE
PHASE 1A
Prepared for Canada Lands Company
REVISED JANUARY 2016
REVISED FEBRUARY 2016
4
3 Overall Stormwater Management Approach
The existing storm sewer system within former CFB Rockcliffe has reached the end of its useful
lifespan and requires replacement. The proposed stormwater management concept consists of a
new separated storm sewer system including a dual drainage network and Eastern and Western
end-of-pipe stormwater management facilities.
The drainage area tributary to the Eastern SWMF is 161.46 ha, including the external areas.
Consideration has also been given to the long term potential for a new museum to be built in the
northwest corner of the site as shown in Figure 1.The MSS presented a tributary drainage area
of 160.58 ha. The small increase in area is due to the revised drainage area boundaries. The
storm sewer system is designed to collect runoff from the eastern portion of the former CFB
Rockcliffe site as well as runoff from several external areas including NRC Campus and Thorncliffe
and route those flows to the Eastern Facility.
The trunk storm sewer servicing the study area is to extend north from the development towards
the escarpment bordering the study area. The Phase 1A design will follow the recommendations
of the approved MSS report, including construction of the large diameter sewers, up to 3000 mm
diameter. The 3000 mm diameter trunk storm sewer terminates at the top of the escarpment and
the runoff cascades to the Eastern SWMF below via a waterfall.
In summary the proposed stormwater system incorporates standard urban drainage design and
stormwater management features such as dual drainage and the end-of-pipe stormwater
management facilities as discussed below.
3.1 Dual Drainage Concept
The dual drainage system for the site tributary to the proposed SWM facility accommodates both
major and minor stormwater runoff. During frequent storms, the effective runoff collected by
catchment areas is directly released via catchbasin inlets into the network of storm sewers, called
the minor system. During less frequent storms, the balance of the flow (in excess of the minor
flow) is accommodated by a system of rear yard swales and street segments called the major
system. The main advantage of this arrangement is its ability to adjust the rate of total inflow into
the minor system to satisfy the required level of service. The proposed dual drainage system for
post-development conditions of former CFB Rockcliffe was evaluated using the SWMHYMO
model and is outlined in detail in the MSS1. It should be noted that the design of the Phase 1A
design is being completed concurrently with the SWM facility design. The dual drainage evaluation
of Phase 1A was evaluated using DDSWMM hydrological model. Detailed discussion is provided
in the Draft “Design Brief Wateridge Village at Rockcliffe Phase 1A3” (IBI, January 2016) report.
3.2 End-of-Pipe Stormwater Management Facilities
The overall drainage concept includes two end-of-pipe SWM facilities to meet the stormwater
regulatory requirements for the redeveloped former CFB Rockcliffe site. The attenuated runoff
from both SWM Facilities will be released to the Ottawa River.
As indicated in Section 1.1 the main objective of this study is to provide design brief for the
proposed Eastern SWMF to meet regulatory requirements for the drainage area tributary to the
Rockcliffe development assuming ultimate development conditions. The Eastern SWMF is
proposed to be located north of the development site adjacent to the Charles Etienne Cartier
Parkway (see Figure 2). The facility is designed to provide water quality control for the subject
lands with limited quantity control. The present study is focused on ensuring optimal design of the

IBI GROUP REPORT
38298-5.2.3
EASTERN STORMWATER MANAGEMENT FACILITY DESIGN
WATERIDGE VILLAGE AT ROCKCLIFFE
PHASE 1A
Prepared for Canada Lands Company
REVISED JANUARY 2016
REVISED FEBRUARY 2016
5
Eastern SWMF in accordance with the required levels of service and stormwater quality control
criteria.
The Western SWMF is outlined at a conceptual level of detail in the MSS1. The Western SWMF
is proposed to be located in the northwest corner of the Rockcliffe development, south of Hemlock
Road adjacent to Aviation Parkway (see Figure 2). The minor system runoff for the western portion
of the site will be routed to the western facility for water quality treatment. As established in the
MSS1, treated runoff from the western SWMF will be routed to the Ottawa River via two conduits.
Some flows will be routed to the River through the Western Creek starting at the existing 900 mm
diameter culvert under the Aviation Parkway (see Figure 2). Flows in excess of the culvert
capacity will be routed eastward through a channel and pipe conduit, called Western SWM Facility
(WSWMF) Overflow Pipe (see Figure 2). The WSWMF Overflow pipe is designed to bypass the
Eastern facility and will be tie into the outlet pipe from the Eastern SWMF to convey the excess
flow directly to the Ottawa River. As part of Phase 1A, a portion of the WSWMF Overflow pipe
(indicated in red on Figure 2) will be constructed. The WSWMF Overflow pipe will be terminated
and capped at the proximity of the western property limits of the Eastern SWM facility, allowing for
the future extension.
3.2.1 Eastern SWMF
The Eastern SWMF is comprised of a stilling basing, a sediment forebay and a wet cell, with an
outlet structure connected to a proposed storm sewer, called Eastern SWMF (ESWMF) Outlet
Pipe, to the Ottawa River. The overall plan of the proposed stormwater management system is
presented on Drawing 700. At the upstream end of the facility, the stilling basin provides energy
dissipation for the proposed waterfall. It also diverts the “first flush” to the sediment forebay via a
first flush weir. Flows in excess of the first flush discharge directly to the wet cell via an overflow
weir. Outflow from the facility is discharged via the outlet structure to the ESWMF Outlet pipe,
which conveys runoff from the pond directly to the Ottawa River. Detailed discussion on each
component is provided in Section 6.
As mentioned in Section 3.2, the WSWMF Overflow pipe is designed to bypass the Eastern SWM
facility and will be tie into the ESWMF Outlet pipe to convey the excess flow directly to the Ottawa
River. As part of the Eastern SWM facility construction, approximately only 288 m of the WSWMF
Overflow pipe will be constructed (refer to Drawing 700 and 707). The WSWMF Overflow pipe
will be tie into the ESWMF Outlet pipe at MH1004 and will be capped at its upstream end. The
extension of the WSWMF Overflow pipe will be completed as part of the Western SWMF
construction. Detailed discussion is given in Section 6.7.

IBI GROUP REPORT
38298-5.2.3
EASTERN STORMWATER MANAGEMENT FACILITY DESIGN
WATERIDGE VILLAGE AT ROCKCLIFFE
PHASE 1A
Prepared for Canada Lands Company
REVISED JANUARY 2016
REVISED FEBRUARY 2016
6
4 Hydrologic and Hydraulic Modeling
4.1 Hydrologic Modeling
An overall SWMHYMO hydrological model was developed in the MSS1 for post-development
conditions of former CFB Rockcliffe and for external drainage areas. Subsequently, in order to
support detail design of the Phase 1A development, more detail hydrological DDSWMM model
was developed (refer to Draft January 2016 Phase 1A Design Brief Report3).
Therefore, the updated XPSWMM minor system hydraulic model is based on the composite
downloaded hydrographs generated by both abovementioned hydrological models (SWMHYMO
and DDSWMM). Both modelling techniques offer single storm event flow generation and routing.
Refer to Draft January 2016 Phase 1A Design Brief Report3 for detailed discussion.
In addition, an independent XPSWMM model was developed to support design of the stormwater
management facility. Summary of manholes receiving pertaining hydrographs is provided in
Section 4.2.
Runoff simulations were performed using the 2, 5, and 100 year SCS Type II design storm events,
the 25mm 4 hour Chicago storm event (for water quality simulation, and to approximate first flush
conditions), the 100 year SCS Type II storm with 20% increase in intensity, and the three historical
storms of July 1 1979, August 4 1988 and August 8 1996 with a 5 minute time step.
The proposed ultimate development area will be developed as a mixed-use community featuring
residential (low-rise and mid-rise), retail, mixed-use, and employment land use. The development
will also include school sites, parks, and natural areas. For land use, selected modeling routines,
hydrologic input parameters and simulated results of the SWMHYMO model please refer to
Section 6.5 of the MSS1, and for the design parameters used in DDSWMM model please refer to
the Draft January 2016 Phase 1A Design Brief Report3.
4.2 Hydraulic Modeling
The hydraulic function of the proposed Eastern SWMF was evaluated using the XPSWMM
hydraulic model. The XPSWMM model schematic is provided in Figure 3 within Appendix A and
model files are provided on CD within Appendix B. Minor system losses along the outlet pipes
were accounted for in accordance with Appendix 6-B of the City of Ottawa Sewer Design
Guidelines (November 2004).
The model includes the Eastern SWMF, ESWMF Outlet pipe, and the portion of the WSWMF
Overflow pipe which will be constructed as part of the Eastern SWMF construction. All drainage
areas tributary to the Eastern SWMF were modelled on a semi-lumped basis in the MSS1 using
SWMHYMO model. Relevant hydrographs developed in the MSS1 study were downloaded into
the XPSWMM model, with the exception of Phase 1A, for which the detailed design has been
initiated using DDSWMM. Figure 4 shows the drainage areas used in both hydrological models
to generate relevant hydrographs for Eastern SWMF evaluation.
As mentioned in Section 4.1, the XPSWMM analysis of the Phase 1A detailed design was used
to support the detailed design of Eastern SWMF. The runoff hydrograph, generated in detailed
design hydraulic model, along with relevant MSS SWMHYMO hydrographs was imported into the
XPSWMM at the following locations as indicated in Figure 3:
STBSN: stilling basin, at the inlet of the Eastern SWMF ( the cascading runoff from the
upstream development, generated in Draft January 2016 Phase 1A Design Brief3 );

IBI GROUP REPORT
38298-5.2.3
EASTERN STORMWATER MANAGEMENT FACILITY DESIGN
WATERIDGE VILLAGE AT ROCKCLIFFE
PHASE 1A
Prepared for Canada Lands Company
REVISED JANUARY 2016
REVISED FEBRUARY 2016
7
ESWM: Wet cell (total runoff from the future museum site and the SWM block, generated
in MSS1 study)
S1005: at the ESWMF Outlet pipe prior to being released to the Ottawa River (the runoff
from the small area close to the pump station, generated in MSS1 study. The area was
delineated as part of the MSS1 study);
S1008: at the ESWMF Outlet Pipe prior to being released to the Ottawa River (the runoff
from part of the Rockcliffe airport/Aviation museum area, generated in MSS1 study. The
area was delineated as part of the MSS1 study);
and PLUG: at the WSWMF Overflow pipe from the Western SWMF (the runoff in excess
of the Aviation Parkway culvert capacity, generated in MSS study. It should be noted that
during Phase 1A, the WSWMF Overflow pipe is capped and it is not receiving any flow
from the western portion of the site. However, the excess flows have been accounted at
this node for the design of the Eastern SWM Facility).
The corresponding nodes are indicated on the model schematic in Figures 3. The downloaded
hydrographs represent outflow assuming ultimate development conditions of the Rockcliffe
development.
The main XPSWMM model parameters include: stage/storage characteristics of the Eastern
SWMF (the sediment forebay, and the wet cell), the outlet structure, and ESWMF outlet sewer
system, WSWMF overflow pipe from the Western SWMF, hydraulic losses, and Ottawa River
boundary conditions. Based on the topography at the downstream end of the outlet storm sewer,
there is no effect from the Ottawa River flood levels on the stormwater management facility. The
fixed water level assumed at the boundary condition was based on the surveyed water level taken
on May 11, 2015. It should be noted that the surveyed water level taken on November 16, 2015
confirmed that the outlet pipe is not submerged. The detailed output from the model can be found
in Appendix A.
4.2.1 Performance of the SWM Facility
A hydraulic evaluation of the Eastern SWM Facility was completed for the following storm events:
25 mm 4 hour Chicago with a 12 minute time step (for water quality simulation, and to
approximate first flush conditions)
2 and 5 year 24 hour SCS Type II storm event with a 12 minute time step
100 year 24 hour SCS Type II storm event with a 12 minute time step
July 1 1979, August 4 1988 and August 8 1996 historical storms with a 5 minute time step
and 100 year 24 hour SCS design storm event with a 20% increase in intensity, 12 minute
time step
The performance of the Eastern SWM facility is summarized in Table 4-1.

IBI GROUP REPORT
38298-5.2.3
EASTERN STORMWATER MANAGEMENT FACILITY DESIGN
WATERIDGE VILLAGE AT ROCKCLIFFE
PHASE 1A
Prepared for Canada Lands Company
REVISED JANUARY 2016
REVISED FEBRUARY 2016
8
Table 4-1: Performance of the Eastern SWM Facility (XPSWMM model files listed in table)
Storm Event Extended Storage (ha-m)
Discharge
(cms) SWM Facility Elevation (m)
Permanent Storage: 2.95 N/A 56.00
25 mm 4 hr Chicago Storm (38298-ESWM-25mm.xp/out)
1.92 0.43 57.00
24 hour SCS Type II
2 year (38298-ESWM-2SCS.xp/out)
2.62 2.38 57.35
5 year (38298-ESWM-5SCS.xp/out)
2.98 4.81 57.53
100 year (38298-ESWM-100SCS.xp/out)
3.92 12.37 57.96
Sensitivity Analysis
Historical Storms
Aug-88 (38298-ESWM-Aug88.xp/out)
3.94 13.21 57.97
Aug-96 (38298-ESWM-Aug96.xp/out)
3.45 8.44 57.75
Jul-79 (38298-ESWM-Jul79.xp/out)
4.20 15.61 58.09
100 year 24 Hour SCS Type II – 20% increase in intensity
(38298-ESWM-120SCS.xp/out) 4.21 15.47 58.09
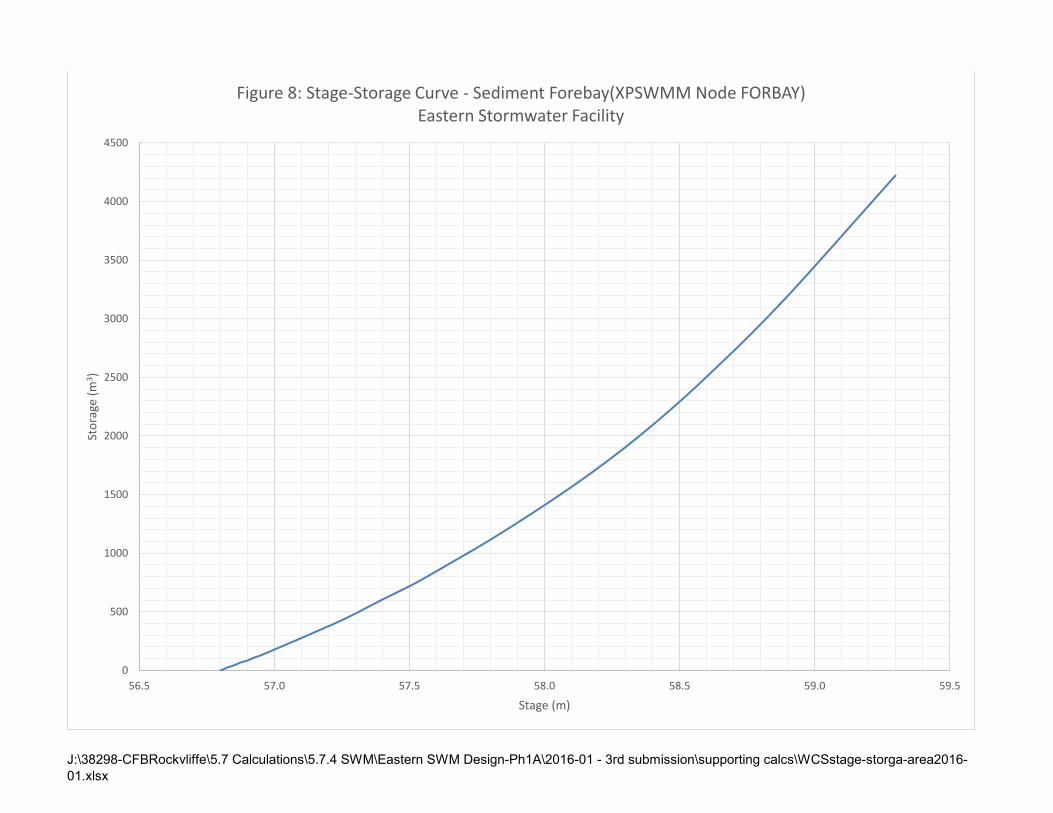
The stage-area curves for the wet pond and sediment forebay are illustrated in Figure 5 and
Figure 6, respectively. The stage-storage curves for the wet pond and sediment forebay are
presented in Figures 7 and Figure 8, respectively. The stage-outflow curve for the wet pond is
presented in Figures 9.
4.2.2 Hydraulic Grade Line Evaluation
The hydraulic grade line (HGL) in the eastern SWMF outlet pipe and the portion of the western
SWMF overflow pipe was assessed using the dynamic XPSWMM model. The XPSWMM
schematic is presented on Figure 3 within Appendix A and model files are provided on CD within
Appendix B.
The results of the HGL evaluation for 100 SCS Type II design storm and a sensitivity analysis
using the 100 SCS Type II with 20% increase are presented within the following table.
Table 4-2 Summary of Hydraulic Grade Line Elevations for Eastern SWMF Outlet Pipe and Part of Western SWMF Overflow Pipe (XPSWMM model files listed in table)
XPSWMM NODE EG(m) Obvert
Elevation (m)
100 YEAR 24 HOUR SCS 100 YEAR 24 HOUR SCS with 20% increase
HGL (m) EG – HGL (m) HGL (m) EG – HGL (m)
STLBSN n/a n/a 59.16 N/A 59.19 N/A
FORBAY n/a n/a 58.96 N/A 58.97 N/A
ESWM n/a n/a 57.95 N/A 58.09 N/A

IBI GROUP REPORT
38298-5.2.3
EASTERN STORMWATER MANAGEMENT FACILITY DESIGN
WATERIDGE VILLAGE AT ROCKCLIFFE
PHASE 1A
Prepared for Canada Lands Company
REVISED JANUARY 2016
REVISED FEBRUARY 2016
9
XPSWMM NODE EG(m) Obvert
Elevation (m)
100 YEAR 24 HOUR SCS 100 YEAR 24 HOUR SCS with 20% increase
HGL (m) EG – HGL (m) HGL (m) EG – HGL (m)
NODE 57.5 n/a 53.66 3.84 53.89 3.61
MH1004 55.8 52.86 52.80 3.00 53.32 2.48
S1005 54.5 52.5 50.92 3.58 51.62 2.88
MH1006 53 50.786 50.47 2.53 51.04 1.96
MH1007 53 50.1 49.92 3.08 50.57 2.43
S1008 51.5 49.695 49.39 2.11 49.75 1.75
MH1009 51.8 47.48 47.05 4.75 47.23 4.57
MH1010 n/a 45.02 44.23 N/A 44.41 N/A
HW n/a n/a 43.70 N/A 43.70 N/A
PLUG 58.7 56.9 56.27 2.43 56.42 2.28
MH1001 58.5 56.6 55.96 2.54 56.11 2.39
MH1002 57.5 54.956 54.30 3.20 54.45 3.05
MH1003 55.8 54.08 53.67 2.13 53.89 1.91
The results of the hydraulic evaluation indicate that the HGL in the eastern and western trunks is
below the pipe obvert elevations, during 100 year SCS Type II. The results of the sensitivity
analysis show that the HGL is significantly below the existing ground. The clearance to the existing
ground (EG) is also indicated in the Table 4-2.
IBI GROUP REPORT
38298-5.2.3
EASTERN STORMWATER MANAGEMENT FACILITY DESIGN
WATERIDGE VILLAGE AT ROCKCLIFFE
PHASE 1A
Prepared for Canada Lands Company
REVISED JANUARY 2016
REVISED FEBRUARY 2016
10
5 Stormwater Management Facility
5.1 Water Quantity Control
Based on recommendations provided in the MSS1 water quantity control is not required. However,
the design of the facility has provided some water quantity control to optimize the cost of the outlet
system to the Ottawa River as well as minimize the footprint of SWM facility on NCC lands.
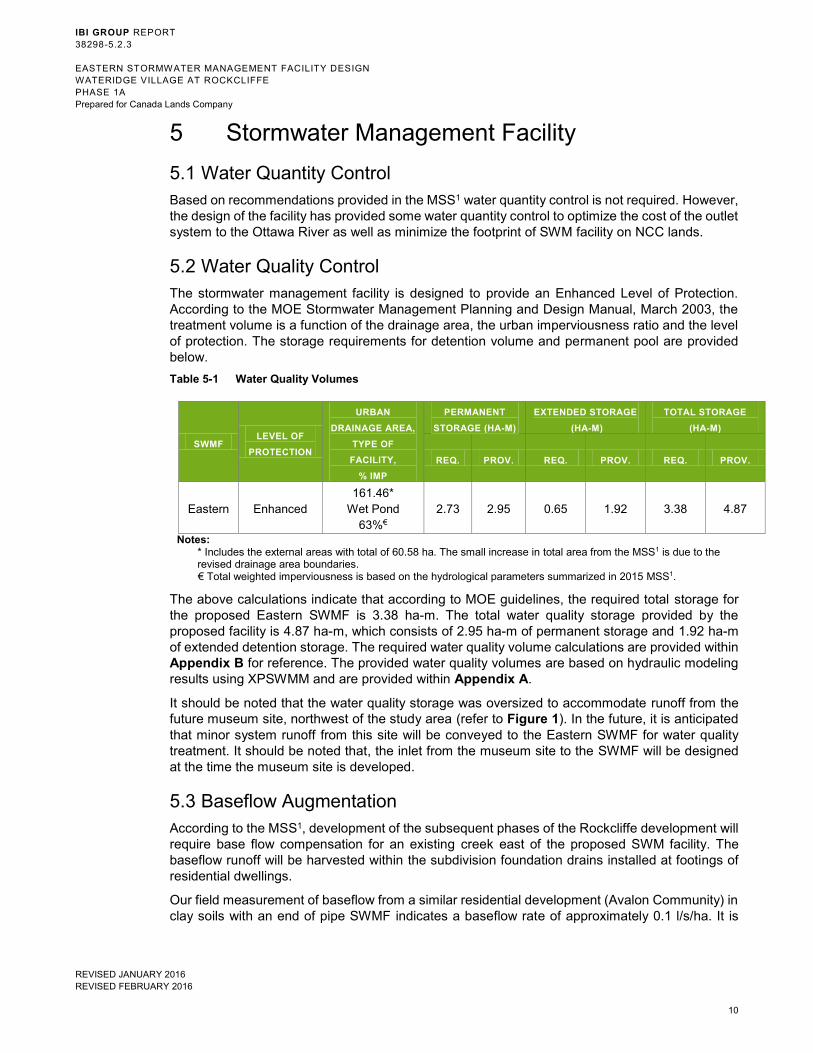
5.2 Water Quality Control
The stormwater management facility is designed to provide an Enhanced Level of Protection.
According to the MOE Stormwater Management Planning and Design Manual, March 2003, the
treatment volume is a function of the drainage area, the urban imperviousness ratio and the level
of protection. The storage requirements for detention volume and permanent pool are provided
below.
Table 5-1 Water Quality Volumes
SWMF LEVEL OF
PROTECTION
URBAN
DRAINAGE AREA,
TYPE OF
FACILITY,
% IMP
PERMANENT
STORAGE (HA-M)
EXTENDED STORAGE
(HA-M)
TOTAL STORAGE
(HA-M)
REQ. PROV. REQ. PROV. REQ. PROV.
Eastern Enhanced
161.46*
Wet Pond
63%€
2.73 2.95 0.65 1.92 3.38 4.87
Notes: * Includes the external areas with total of 60.58 ha. The small increase in total area from the MSS1 is due to the revised drainage area boundaries. € Total weighted imperviousness is based on the hydrological parameters summarized in 2015 MSS1.
The above calculations indicate that according to MOE guidelines, the required total storage for
the proposed Eastern SWMF is 3.38 ha-m. The total water quality storage provided by the
proposed facility is 4.87 ha-m, which consists of 2.95 ha-m of permanent storage and 1.92 ha-m
of extended detention storage. The required water quality volume calculations are provided within
Appendix B for reference. The provided water quality volumes are based on hydraulic modeling
results using XPSWMM and are provided within Appendix A.
It should be noted that the water quality storage was oversized to accommodate runoff from the
future museum site, northwest of the study area (refer to Figure 1). In the future, it is anticipated
that minor system runoff from this site will be conveyed to the Eastern SWMF for water quality
treatment. It should be noted that, the inlet from the museum site to the SWMF will be designed
at the time the museum site is developed.
5.3 Baseflow Augmentation
According to the MSS1, development of the subsequent phases of the Rockcliffe development will
require base flow compensation for an existing creek east of the proposed SWM facility. The
baseflow runoff will be harvested within the subdivision foundation drains installed at footings of
residential dwellings.
Our field measurement of baseflow from a similar residential development (Avalon Community) in
clay soils with an end of pipe SWMF indicates a baseflow rate of approximately 0.1 l/s/ha. It is

IBI GROUP REPORT
38298-5.2.3
EASTERN STORMWATER MANAGEMENT FACILITY DESIGN
WATERIDGE VILLAGE AT ROCKCLIFFE
PHASE 1A
Prepared for Canada Lands Company
REVISED JANUARY 2016
REVISED FEBRUARY 2016
11
anticipated that the development area of 100.88 ha (tributary to the Eastern SWMF, excluding the
external areas) can generate a continuous baseflow of 10.09 l/s (Q = 0.1 l/s/ha x 100.88 ha).
This equates to approximately 26,502 m3/month. The above calculation indicates that the baseflow
augmentation requirement determined in the MSS1 of 51,081 m3/year can be accomplished within
a 2 month period.

IBI GROUP REPORT
38298-5.2.3
EASTERN STORMWATER MANAGEMENT FACILITY DESIGN
WATERIDGE VILLAGE AT ROCKCLIFFE
PHASE 1A
Prepared for Canada Lands Company
REVISED JANUARY 2016
REVISED FEBRUARY 2016
12
6 Design Components of the SWMF
The Eastern SWMF will be constructed as a wet pond providing water quality and limited quantity
control as discussed in Section 5.1. The facility incorporates the following features:
Inlet System
Inlet Flow Splitter
Sediment Forebay
Wet Pond
Outlet Structure
Eastern SWMF Outlet Pipe
Western SWMF Overflow Pipe
Baseflow Augmentation Pipe
Emergency Overflow
The overall plan of the facility is presented on Drawing 700 and the facility profiles and cross
sections are presented on Drawings 703 to 704. A description regarding the main features of the
facility is presented in the following sections.
6.1 Inlet System
Runoff from the development (Phase 1 and 3) will be conveyed to the Eastern SWM facility through
two main trunk storm sewers, a 3000 mm diameter and a 1650 mm diameter. As outlined in the
approved MSS, the 3000 mm diameter trunk sewer will be constructed during Phase 1A and the
1650 mm diameter pipe will be constructed as part of Phase 3. Only 10 m of the 1650 mm diameter
sewer will be built as part of the Eastern SWM facility construction. Further discussion is provided
in January 2016 Phase 1A Design Brief Report3.
The 3000 mm diameter trunk storm sewer terminates at the top of the escarpment and the runoff
cascades to the Eastern SWMF below via a waterfall. A proposed waterfall is located on NCC
property. Detail design of the waterfall is included in January 2016 Phase 1A Design Brief Report3.
6.2 Inlet Flow Splitter
The inlet flow splitter consists of a 43 m (L) x 21.7 m (w) x 3.05 m (d) stilling basin with a bottom
elevation of 55.00 m, complete with two weirs to split the flow between the sediment forebay and
the wet cell. As discussed in Section 3, runoff from the site cascades to the SWMF via the
waterfall. The stilling basin is designed to first dissipate the energy of the falling flow and then to
divert the first flush flow to the sediment forebay, prior to the wet cell via a first flush weir. Flows in
excess of the first flush (25 mm storm event) discharge directly to the wet cell via an overflow weir.
Relevant calculations to support the size of the stilling basin is provided within Appendix B.
The first flush weir will direct the first 25 mm of runoff to the sediment forebay. The weir is 7 m
long at elevation of 58.05 m (see Drawings 702 and 703). The first flush weir is installed at the
connection of stilling basin to the sediment forebay. At the base of the first flush weir, 600 mm
diameter rip-rap will be installed to a depth of 800 mm to protect the weir. Under the 25mm storm
event, the water elevation at the stilling basin is 58.95 m which provides 0.90 m head over the
weir. The water elevation at the sediment forebay is 58.88 m.

IBI GROUP REPORT
38298-5.2.3
EASTERN STORMWATER MANAGEMENT FACILITY DESIGN
WATERIDGE VILLAGE AT ROCKCLIFFE
PHASE 1A
Prepared for Canada Lands Company
REVISED JANUARY 2016
REVISED FEBRUARY 2016
13
The overflow weir will direct flow in excess of the 25 mm storm event (first flush flow) to the wet
cell directly. The overflow weir is 60 m long at elevation of 58.95 m and it is installed along the
east side of the stilling basin facing the stormwater management facility (refer to Drawing 702).
Under the 100 year design storm the water elevation at the stilling basin and at the sediment
forebay is at elevation of 59.16 m and 58.96 m respectively.
6.3 Sediment Forebay
The sediment forebay is designed for pre-treatment of runoff. The sediment forebay will capture
the majority of the sediment transported by the stormwater runoff. The forebay will be
approximately 19.22 m wide average and 88.60 m in length at the permanent pool elevation of
58.05 m. The bottom elevation of the forebay is 56.80 m, resulting in a permanent depth of 1.25
m (refer to Drawing 703).
The first flush flow will discharge via the first flush weir into the sediment forebay. The forebay is
separated from the wet cell by a berm to elevation 59.26 m and by a permeable rock check dam
to elevation 58.05 m (refer to Drawings 702 and 703). The permeable rock check dam provides
a separation between the forebay and the main cell of the facility in order to facilitate cleanout.
The sediment forebay profile promotes deposition of sediment in the forebay, rather than the main
cell, to allow for more efficient clean-out. A pathway (asphalt) has been provided along the western
side of the forebay to elevation 59.30 m to assist with maintenance and clean-out (refer to Drawing
702).
The sediment forebay design is based on the guidelines set forth by the MOE Stormwater
Management Planning and Design Manual, March 2003. The forebay dimensions satisfy the
dispersion and settling length guidelines, allowing for adequate sedimentation as well as for
maintenance using standard equipment. Calculations are presented within Appendix B.
6.4 Wet Pond
From the sediment forebay, water flows into the wet cell, which is designed as a wet pond. It
consists of deep pools with shallow peninsulas to increase the efficiency of dilution of the first flush
during treatment (Drawings 702 and 703). The bottom elevation of the pools is 53.70 m. The
permanent water level in the facility is 56.0 m, resulting in a maximum permanent depth of 2.30
m. This corresponds to a permanent volume of 29524 m3 (2.95 ha-m). The water quality elevation
is 57.00 m during the 25 mm 4 hour Chicago storm event, resulting in a water quality depth of 1.00
m. The maximum 100 year water level in the facility is 57.96 m, which is 1.96 m above the
permanent water level. This corresponds to an extended storage of 39189 m3 (3.92 ha-m). The
total volume in the SWMF at this elevation is 68713 m3 (6.87 ha-m). The maximum water level in
the facility is 58.09 m during the July 1 1979 historical storm and the 100 SCS Type II with 20%
increase in intensity.
6.5 Outlet Structure
The outlet structure will be comprised of a 1500 mm x 3000 mm box manhole complete with outlet
control orifice and weir, baseflow augmentation pipe, outlet pipe, de-watering pipe with sluice gate,
and maintenance access (refer to Drawing 706).
The orifice will be 520 mm diameter with an invert of 56 m which will control the permanent water
level in the facility, and has been sized to provide at least 24 hour drawdown time of extended
water quality storage requirements as per MOE Stormwater Management Planning and Design
Manual, March 2003. The 24 hour drawdown graph is provided within Appendix B.

IBI GROUP REPORT
38298-5.2.3
EASTERN STORMWATER MANAGEMENT FACILITY DESIGN
WATERIDGE VILLAGE AT ROCKCLIFFE
PHASE 1A
Prepared for Canada Lands Company
REVISED JANUARY 2016
REVISED FEBRUARY 2016
14
The flow control weir will provide conveyance of flows from the SWMF during infrequent storm
events. The flow control weir will be 9 m in length with crest elevation set at 57.11 m. the flow
control weir is the four side weir (see Drawing 706).
The baseflow augmentation pipe will provide base flow compensation for an existing creek east
of the proposed SWM facility. The baseflow pipe is at an elevation of 55.85 m which is slightly
below the permanent water level of 56.00 m. The baseflow pipe will consist of 200 mm diameter
PVC pipe, 591 m in length (see Drawings 706, 711 and 712). A valve with extended stem, shown
on Drawing 706, is provided to provide opportunity for capturing the SWM facility baseflow.
Detailed discussion is provided in Section 6.8.
The de-watering pipe and sluice gate will facilitate de-watering of the SWMF during maintenance
and cleaning activities. The sluice gate is at an elevation of 53.70 m which matches the bottom
elevation of a small depression area (plunge pool) which is designed to provide clearance for the
maintenance pipe (see Drawing 706). When maintenance is required, the sluice gate can be
opened and water will be released into the outlet structure via a 6.5 m long 600 mm diameter
concrete pipe. From the outlet structure flow will be discharged to the outlet pipe at an elevation
of 51.90 m (Drawing 706).
The dynamic model XPSWMM was used to evaluate the hydraulic design and performance of the
outlet structure (refer to Appendix A for output).
6.6 Eastern SWMF Outlet Pipe
Outflow from the stormwater management facility will discharge from the outlet structure to Ottawa
River via an outlet pipe (Drawing 706). Due to the topography at the downstream end of the outlet
pipe, the outlet pipe will consist of two parts. The first part will be a 597.20 m - 2400 mm diameter
concrete pipe with 0.3% slope. The upstream invert elevation will be set to 51.90 m. The outlet
pipe will terminate by a 42.40 m – 1200 x 3000 concrete box with 0.3% slope. The downstream
invert elevation will be set to 42.50 m. The outlet of the pipe will be provided with concrete
headwall. The ESWMF Outlet pipe profile is provided on Drawings 708 and 709.
It should be noted that the existing 1200 mm diameter pipe (shown on Drawing 708) was the
combined sewer outlet for the northern portion of the former development at the Rockcliffe site. It
is now proposed to be abandoned since the upstream development has been removed. With the
abandonment of the upstream development, there should be no further flows in this pipe so there
are no implication to upstream areas.
6.7 Western SWMF Overflow Pipe
As discussed in Section 3.2.1, only 288 m of the WSWMF Overflow pipe will be constructed as
part of the Phase 1A. The extension of the WSWMF Overflow pipe will be completed as part of
the Western SWMF construction to convey the flows in excess of the Aviation culvert capacity to
the Ottawa River.
The WSWMF Overflow pipe will be a 1200 mm diameter concrete pipe, 288 m in length at 0.70%
slope. The upstream invert elevation will be set to 55.70 m, and the downstream invert elevation
will be set to 50.46 m. The WSWMF Overflow pipe will be tie into the ESWMF Outlet pipe at MH
1004. The 1200 mm pipe will be extended west parallel to Charles Etienne Cartier Parkway and
will be capped at its upstream end allowing for the future extension. The WSWMF Overflow pipe
profile is provided on Drawing 707.

IBI GROUP REPORT
38298-5.2.3
EASTERN STORMWATER MANAGEMENT FACILITY DESIGN
WATERIDGE VILLAGE AT ROCKCLIFFE
PHASE 1A
Prepared for Canada Lands Company
REVISED JANUARY 2016
REVISED FEBRUARY 2016
15
6.8 Baseflow Augmentation Pipe
The SWMF will be outfitted with a baseflow pipe to provide base flow compensation for an existing
creek east of the proposed SWM facility. The baseflow pipe will tie into the outlet structure at an
invert of 55.85 m, slightly below the permanent water level of 56.00 m, to provide outflow into the
receiving Eastern Creek. The downstream invert elevation will be set to 52.60 m and will be
terminated at upstream of the existing 1140 mm diameter steel culvert (CSP) with an invert of
52.52 m. The flow will be discharged into an existing ditch, upstream of the CSP, and will be routed
through the culvert. 600 mm diameter rip-rap will be provided around the outlet to the existing
ditch to minimize erosion potential. During the full flow condition of the CSP, the outlet pipe will
function under the surcharge condition.
The baseflow pipe will consist of 200 mm diameter PVC pipe, 591 m in length. The baseflow pipe
will convey flows from the outlet structure to MH 6 as shown on Drawing 710. The baseflow pipe
profile is presented on Drawings 710 and 711.
6.9 Emergency Overflow
In the event where the outlet structure becomes fully blocked and the SWMF continues to receive
inflow there is potential for the water level to rise and overtop the facility. The runoff will discharge
into the Eastern Creek via a provided route. An emergency overflow route is provided via a
depressed road located immediately downstream of the outlet structure along the provided 3 m
service road. The berm is graded 0.05 m below the rest of the road, at elevation 58.35, for
approximately 10m section of the service road (see Drawings 702 and 706).
6.10 Additional Features
In addition to the major structures of the stormwater management facility, there are several smaller
features that should be noted.
Service Roads and Pathways:
An asphalt service road has been provided to allow City of Ottawa maintenance crews to access
the major structures (inlet and outlet) and sediment forebay. The asphalt service road will run
along the western side of the facility from the stilling basin to the outlet structure and extends south
along the eastern shore of the facility as shown in Drawing 702. The service road will be
comprised of asphalt of 3 m width with 1 m shoulders reinforced with granular ‘B,’ and covered by
topsoil and seed and will provide access to the forebay from the west.
For service road locations see Drawing 702 and refer to Drawing 710 for details.
Guardrails
Galvanized steel rails are proposed on each inlet, outlet and overflow structure for safety reasons.
Railing details are shown on Drawings 710.
Hydric Soils
During construction, hydric soils will be harvested from the top 100 mm of naturally moist areas.
This soil is considered ideal for re-establishing native growth in an area since it contains all the
natural grasses and seeds native to a site. Use of hydric soils allows for faster establishment of
vegetation after construction is completed and gives the facility immediate biodiversity compared
to topsoil and seeding. These soils will be dispersed in the facility by a backhoe once the facility
has been constructed.

IBI GROUP REPORT
38298-5.2.3
EASTERN STORMWATER MANAGEMENT FACILITY DESIGN
WATERIDGE VILLAGE AT ROCKCLIFFE
PHASE 1A
Prepared for Canada Lands Company
REVISED JANUARY 2016
REVISED FEBRUARY 2016
16
In this particular facility, hydric soils will be placed between elevations 55.70 m and 56 m, creating
a safety bench with gentle slopes. It is recommended that a qualified landscape architect approve
the suitability of hydric soils. In addition, to ensure that the hydric soils provide vegetation to the
facility, it will be the responsibility of the consultant to inspect and provide a report of the status of
vegetation in the facility during the late spring/early summer.

IBI GROUP REPORT
38298-5.2.3
EASTERN STORMWATER MANAGEMENT FACILITY DESIGN
WATERIDGE VILLAGE AT ROCKCLIFFE
PHASE 1A
Prepared for Canada Lands Company
REVISED JANUARY 2016
REVISED FEBRUARY 2016
17
7 Facility operation, Maintenance and Monitoring Recommendation
From the time of the facility commissioning, the developer is responsible for the stormwater facility
at all times which includes operation, maintenance, monitoring and fulfilling requirements of the
MOE for the stormwater facility until the facility is assumed by the City of Ottawa.
Prior to City of Ottawa assumption of the stormwater facility, the developer is responsible, at their
cost, for the following:
Providing a functional draft of the Operation, Maintenance and Monitoring Manual for the
facility at time of the facility completion/commissioning with finalization of the manual at
the time of facility assumption by the City.
Clean-out and off-site disposal of any accumulated sediments in the facility and
reinstatement of the facility and its lands to an as-designed state. This clean out would
occur following at least 80% development of the lands tributary to the facility.
Completion of monitoring program and demonstrating that the facility is performing
satisfactorily in accordance with its design from water quality perspective. Irrespective of
any conditions which may have included in the MOE, a monitoring program will be
required to demonstrate satisfactory performance of facility is required prior to
assumption.
Addressing and repairing any deficiencies identified in any pre-assumption inspections.
For any of the above activities, securities will be required to be held by the City of Ottawa to cover
anticipated costs of sediment clean-out and disposal, facility reinstatement, monitoring program,
repair of deficiencies, etc.
7.1 Routine Maintenance
Routine maintenance is essential to ensure the facility continues to perform as designed.
Standardized forms should be developed and completed at the time of each inspection. These
completed questionnaire forms would be filed with the City of Ottawa for future reference. Utilizing
a standardized format will assist in the interpretation of the collected data and the identification of
future maintenance needs.Maintenance Features
Maintenance access to the Eastern SWM Facility is provided from the Charles Etienne Cartier
Parkway (see Drawing 702):
Access to the wet cell, outlet structure and sediment forebay is via an asphalt service road as
discussed in Section 6.
As noted in Section 6.5, the facility can be drained by gravity to an elevation of 53.70 m by opening
the sluice gate within the outlet structure. However, for cleaning the forebay, lowering the water
level to 53.70 m should be more than sufficient.
7.2 Visual Inspection
It is recommended that visual inspection of the facility occur after significant storm events. Items
to note include, but are not limited to, the following:
general site conditions, including landscaping;

IBI GROUP REPORT
38298-5.2.3
EASTERN STORMWATER MANAGEMENT FACILITY DESIGN
WATERIDGE VILLAGE AT ROCKCLIFFE
PHASE 1A
Prepared for Canada Lands Company
REVISED JANUARY 2016
REVISED FEBRUARY 2016
18
condition of service roads;
condition of inlet (first flush and overflow) and outlet structures;
location of outlet structure sluice gate (open or closed);
debris at grates and forebay;
sediment accumulation in the forebay; and,
vandalism.
A sample maintenance checklist for the facility is provided in Appendix C.
7.3 Sediment Removal and Disposal
The proposed sediment forebay will capture much of the suspended solids being transported by
the storm flow. To facilitate cleanout, the submerged permeable berm located at the end of the
forebay will assist in identifying the forebay limit and areas for maintenance. Because the forebay
is proposed to be generally submerged, timing for cleanout would have to be scheduled during
dry periods of the summer or in the autumn.
Sediment accumulation rates to the forebay will vary dramatically depending on numerous factors
including the status and maturity of the upstream development, the effectiveness of the adopted
silt and erosion control plan implemented during the construction activities, etc. During
development of the subdivision, sediment loading to the facility could be high. This would
necessitate more frequent cleanout of the forebay. Once construction has been completed within
the upstream catchment area, the frequency of sediment removal would be dictated by the results
of the field monitoring program.
7.4 Maintenance Schedule
The recommended maintenance schedule for the Eastern SWM Facility is presented below. It
should be noted that all items in this schedule are subject to MOE-ECA approval. The post-
development monitoring program should be coordinated with the city of Ottawa and MOE-ECA
certification
Table 7-1: Maintenance Schedule
ELEMENT FREQUENCY DESCRIPTION
Maintain Concrete Features
Annually
Make repairs to concrete surfaces and joints, including:
Patching spalled areas with a bonding agent
Strengthening areas by applying coatings or by adding reinforcements
Repairing minor cracks
Water Quality Monitoring
As needed As per MOE-ECA certificate
Service Road Annually Inspect pathways for signs of fatigue or failure caused by erosion or heavy equipment
Sediment Forebay
Annually Inspect for debris and sedimentation
As needed Collect sample of sediment for laboratory analysis
Measure depth of sediment accumulation

IBI GROUP REPORT
38298-5.2.3
EASTERN STORMWATER MANAGEMENT FACILITY DESIGN
WATERIDGE VILLAGE AT ROCKCLIFFE
PHASE 1A
Prepared for Canada Lands Company
REVISED JANUARY 2016
REVISED FEBRUARY 2016
19
ELEMENT FREQUENCY DESCRIPTION
Remove sediments from forebay and dispose of at an appropriate location based on results of sediment sampling
Wet Cell Annually Inspect for debris and sedimentation
Outlet Structure Annually
Remove any debris from grate and ensure that it is unobstructed
Inspect for acts of vandalism and take corrective action
Landscape
Monthly from May to September
Coordinate grass cutting, if applicable
Annually Remove any dead trees and replace, if desired
7.5 Facility Monitoring
From the time of facility commissioning to the 80% development level, the developer must ensure
that the water discharged from the facility is of an acceptable quality. Effluent monitoring will
involve sampling during three storm events (as per MOE-ECA certificate) over a two year period
for total suspended solids.
The development of the water quality monitoring program, including the locations of sampling,
timing requirements, sampling period, method of sample collection, and parameters to be
analyzed, will be dictated by the Environmental Compliance Approval (ECA) from the Ontario
Ministry of the Environment and the City of Ottawa requirements.
If it is found that the suspended sediment removal efficiency does not meet the specified criteria,
then an examination of the facility performance would be required (i.e. sediment accumulation,
performance of outlet structure affected by debris accumulation, etc.) and recommendations
provided by future undertakings. During development of the site, the efficiency of the stormwater
management facilities could be impacted upon by the performance of the erosion and
sedimentation control plan implemented upstream. Recommendations resulting from the
monitoring program may, therefore, not be restricted to just the stormwater management facility.
7.6 Erosion and Sedimentation Control Plan
An Erosion and Sediment Control Plan has been provided on Drawing 38298-900SWM. This plan
will provide guidance to the contractor during the preparation of their own plan. The contractor’s
submitted plan will need to be reviewed and stamped by a Professional Engineer licensed to work
in Ontario. The plan shall be submitted to the Contract Administrator and Rideau Valley
Conservation Authority (RVCA) for approval. In addition, to Drawing 38298-900SWM, the
contractor’s plan must also follow the requirements outlined in the City of Ottawa specifications F-
1004.
In addition to the erosion and sediment control plan, it is also recommended that visual monitoring
of the sediment controls (i.e., photographs, reporting, site visits) be undertaken. If any dewatering
is required during construction of the facility, a Permit to Take Water must be obtained from the
Ontario Ministry of the Environment. A dewatering plan may be required to be prepared by the
contractor and reviewed and stamped by a Professional Engineer licensed to work in Ontario. The
dewatering plan shall be submitted to the Contract Administrator and Rideau Valley Conservation
Authority (RVCA) for approval. It should be noted that the erosion and sediment control plan and
dewatering plan shall be approved by all appropriate regulatory agencies prior to implementation.

IBI GROUP REPORT
38298-5.2.3
EASTERN STORMWATER MANAGEMENT FACILITY DESIGN
WATERIDGE VILLAGE AT ROCKCLIFFE
PHASE 1A
Prepared for Canada Lands Company
REVISED JANUARY 2016
REVISED FEBRUARY 2016
21
References
1. “Former CFB Rockcliffe Master Servicing Study”, IBI GROUP, August 2015
2. “Community Design Plan”, MMM Group and Meloshe & Associates, August 2015
3. Draft “Design Brief Waterdige Village at Rockcliffe Phase 1A”, IBI Group, January 2016
J:\38298-CFBRockvliffe\5.2 Reports\5.2.3 SWM\EASTERN POND DESIGN BRIEF\2016-02-4th Sub\WTR_Eswm_pond_rpt_rev2-2016-02-02-
RevCityComm.docx

Scale Project TitleDrawing Title
Sheet No.
FIGURE 1STUDY AREA
EASTERN STORMWATER
WATERIDGE VILLAGE AT ROCKLIFFE
MANAGEMENT FACILITY DESIGN
N.T.S.
PHASE 1A
STUDY AREA

Scale Project TitleDrawing Title
Sheet No.
FIGURE 4
DRAINAGE AREA
SCHEMATIC
EASTERN STORMWATER
WATERIDGE VILLAGE AT ROCKLIFFE
MANAGEMENT FACILITY DESIGN
N.T.S.
STORMWATER FACILITIES
LEGEND
MSS DRAINAGE MODELED IN
FORMER CFB ROCKLIFFE MSS, AUG. 2015
PHASE 1A
DETAILED DRAINAGE MODELED IN DESIGN BRIEF
WATERIDGE VILLAGE ROCKLIFFE PHASE 1A, JAN. 2016
Scale Project TitleDrawing Title
Sheet No.
FIGURE 2
PREFERRED SERVICING
SOLUTION
EASTERN STORMWATER
WATERIDGE VILLAGE AT ROCKLIFFE
MANAGEMENT FACILITY DESIGN
N.T.S.
STORMWATER FACILITIES
LEGEND
AREA TRIBUTARY
TO EASTERN SWM FACILITY
AREA TRIBUTARY
TO WESTERN SWM FACILITY
PHASE 1A

J:\38298-CFBRockvliffe\5.7 Calculations\5.7.4 SWM\Eastern SWM Design-Ph1A\2016-01 - 3rd submission\supporting calcs\WCSstage-storga-area2016-01.xlsx
0.00
0.50
1.00
1.50
2.00
2.50
0.0 0.5 1.0 1.5 2.0 2.5 3.0 3.5 4.0 4.5 5.0
Are
a (h
a)
Stage (m)
Figure 5: Stage-Area Curve - Wet Pond (XPSWMM Node ESWM)Eastern Stormwater Facility

J:\38298-CFBRockvliffe\5.7 Calculations\5.7.4 SWM\Eastern SWM Design-Ph1A\2016-01 - 3rd submission\supporting calcs\WCSstage-storga-area2016-01.xlsx
0.00
0.05
0.10
0.15
0.20
0.25
0.30
0.0 0.5 1.0 1.5 2.0 2.5
Are
a (h
a)
Stage (m)
Figure 6 : Stage -Area Curve - Sediment Forebay (XPSWMM Node FORBAY)Eastern Stromwater Facility

J:\38298-CFBRockvliffe\5.7 Calculations\5.7.4 SWM\Eastern SWM Design-Ph1A\2016-01 - 3rd submission\supporting calcs\WCSstage-storga-area2016-01.xlsx
0
20000
40000
60000
80000
100000
120000
140000
160000
53 54 55 56 57 58 59 60 61 62
Sto
rage
(m
3 )
Stage (m)
Figure 7: Stage-Storage Curve - Wet Pond (XPSWMM Node ESWM)Eastern Stormwater Facility
J:\38298-CFBRockvliffe\5.7 Calculations\5.7.4 SWM\Eastern SWM Design-Ph1A\2016-01 - 3rd submission\supporting calcs\WCSstage-storga-area2016-
01.xlsx
0
500
1000
1500
2000
2500
3000
3500
4000
4500
56.5 57.0 57.5 58.0 58.5 59.0 59.5
Sto
rage
(m
3 )
Stage (m)
Figure 8: Stage-Storage Curve - Sediment Forebay(XPSWMM Node FORBAY)Eastern Stormwater Facility

J:\38298-CFBRockvliffe\5.7 Calculations\5.7.4 SWM\Eastern SWM Design-Ph1A\2016-01 - 3rd submission\supporting calcs\WCSstage-storga-area2016-
01.xlsx
0
2
4
6
8
10
12
14
16
18
57.0 57.5 58.0 58.5
Ou
tflo
w (
cms)
Stage (m)
Figure 9: Stage-Ouflow Curve - Wet PondEastern Stormwater Facility

A-1
Appendix A
XPSWMM Schematic and XPSWMM Computer Output

Figure 3: XPSWMM Schematic for Eastern SWM Facility including Eastern Outlet pipe and Western
Overflow Pipe (XPSWMM Version 10.6)
STLBSN

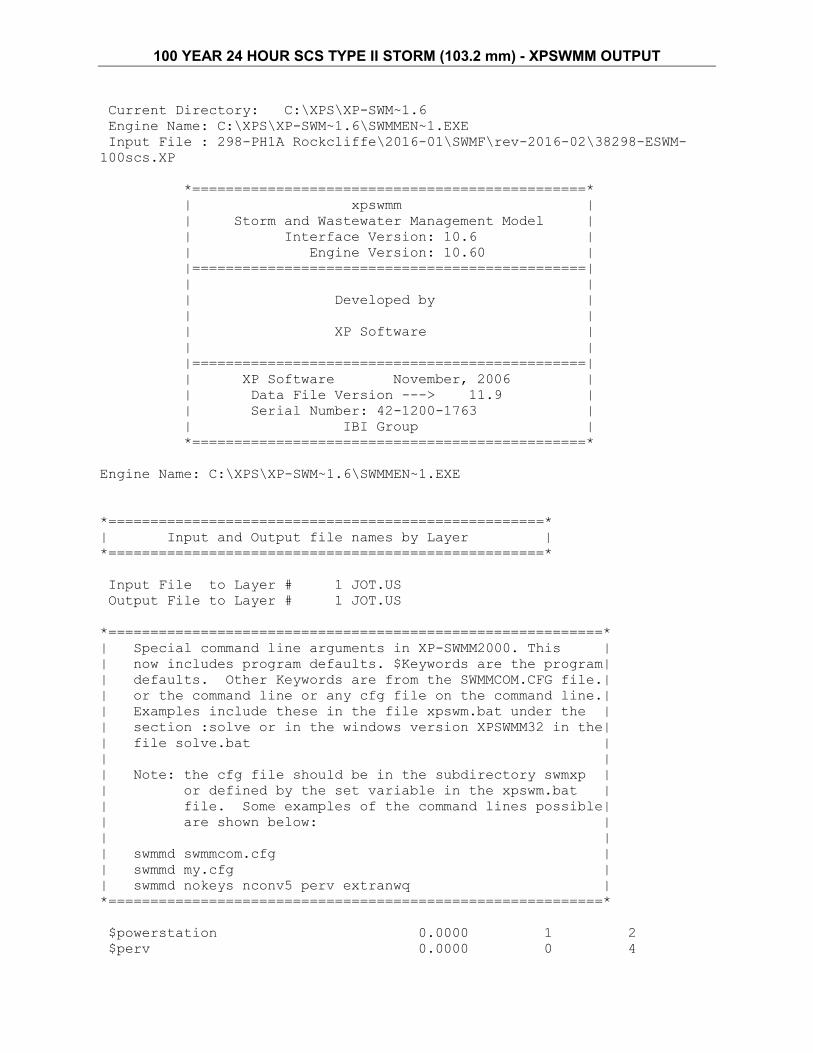
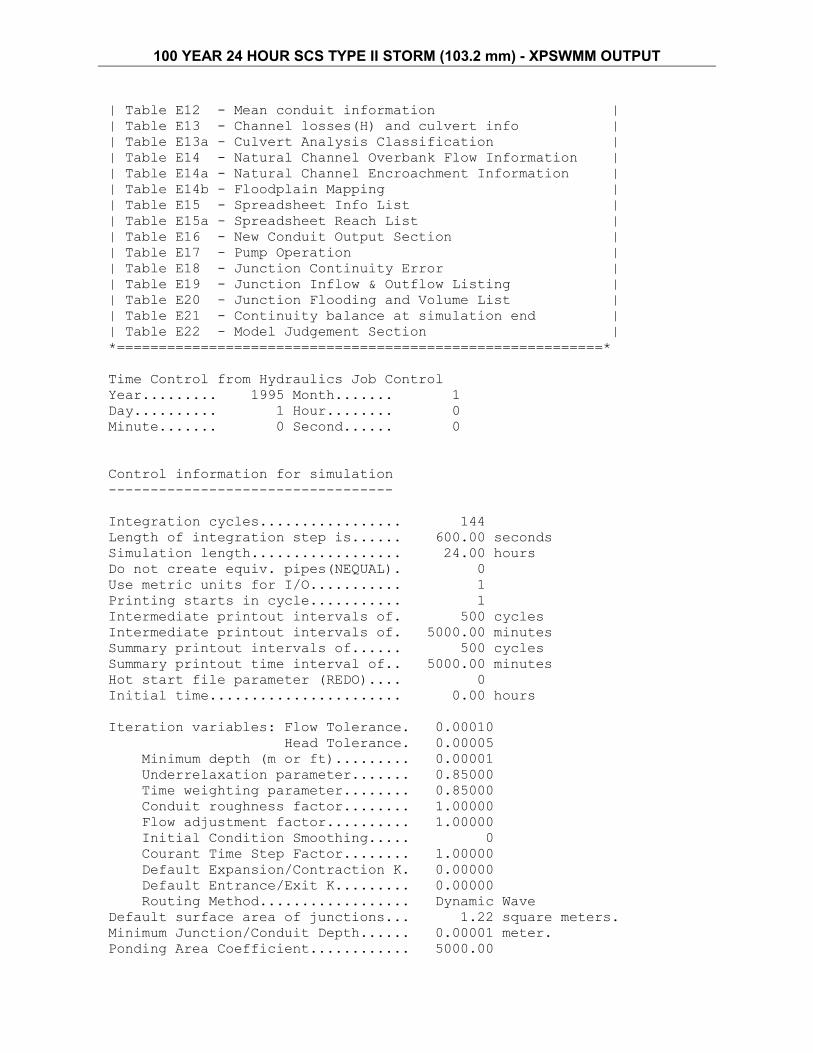
100 YEAR 24 HOUR SCS TYPE II STORM (103.2 mm) - XPSWMM OUTPUT
Current Directory: C:\XPS\XP-SWM~1.6
Engine Name: C:\XPS\XP-SWM~1.6\SWMMEN~1.EXE
Input File : 298-PH1A Rockcliffe\2016-01\SWMF\rev-2016-02\38298-ESWM-
100scs.XP
*===============================================*
| xpswmm |
| Storm and Wastewater Management Model |
| Interface Version: 10.6 |
| Engine Version: 10.60 |
|===============================================|
| |
| Developed by |
| |
| XP Software |
| |
|===============================================|
| XP Software November, 2006 |
| Data File Version ---> 11.9 |
| Serial Number: 42-1200-1763 |
| IBI Group |
*===============================================*
Engine Name: C:\XPS\XP-SWM~1.6\SWMMEN~1.EXE
*====================================================*
| Input and Output file names by Layer |
*====================================================*
Input File to Layer # 1 JOT.US
Output File to Layer # 1 JOT.US
*===========================================================*
| Special command line arguments in XP-SWMM2000. This |
| now includes program defaults. $Keywords are the program|
| defaults. Other Keywords are from the SWMMCOM.CFG file.|
| or the command line or any cfg file on the command line.|
| Examples include these in the file xpswm.bat under the |
| section :solve or in the windows version XPSWMM32 in the|
| file solve.bat |
| |
| Note: the cfg file should be in the subdirectory swmxp |
| or defined by the set variable in the xpswm.bat |
| file. Some examples of the command lines possible|
| are shown below: |
| |
| swmmd swmmcom.cfg |
| swmmd my.cfg |
| swmmd nokeys nconv5 perv extranwq |
*===========================================================*
$powerstation 0.0000 1 2
$perv 0.0000 0 4
100 YEAR 24 HOUR SCS TYPE II STORM (103.2 mm) - XPSWMM OUTPUT
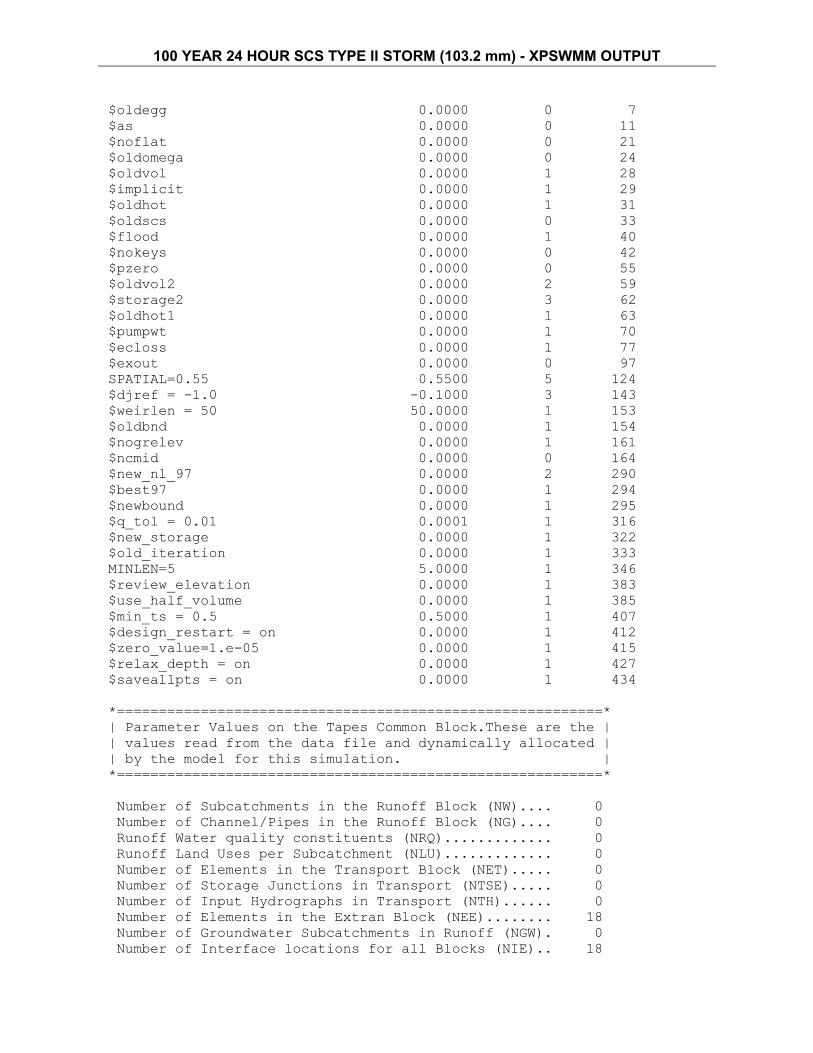
$oldegg 0.0000 0 7
$as 0.0000 0 11
$noflat 0.0000 0 21
$oldomega 0.0000 0 24
$oldvol 0.0000 1 28
$implicit 0.0000 1 29
$oldhot 0.0000 1 31
$oldscs 0.0000 0 33
$flood 0.0000 1 40
$nokeys 0.0000 0 42
$pzero 0.0000 0 55
$oldvol2 0.0000 2 59
$storage2 0.0000 3 62
$oldhot1 0.0000 1 63
$pumpwt 0.0000 1 70
$ecloss 0.0000 1 77
$exout 0.0000 0 97
SPATIAL=0.55 0.5500 5 124
$djref = -1.0 -0.1000 3 143
$weirlen = 50 50.0000 1 153
$oldbnd 0.0000 1 154
$nogrelev 0.0000 1 161
$ncmid 0.0000 0 164
$new_nl_97 0.0000 2 290
$best97 0.0000 1 294
$newbound 0.0000 1 295
$q_tol = 0.01 0.0001 1 316
$new_storage 0.0000 1 322
$old_iteration 0.0000 1 333
MINLEN=5 5.0000 1 346
$review_elevation 0.0000 1 383
$use_half_volume 0.0000 1 385
$min_ts = 0.5 0.5000 1 407
$design_restart = on 0.0000 1 412
$zero_value=1.e-05 0.0000 1 415
$relax_depth = on 0.0000 1 427
$saveallpts = on 0.0000 1 434
*==========================================================*
| Parameter Values on the Tapes Common Block.These are the |
| values read from the data file and dynamically allocated |
| by the model for this simulation. |
*==========================================================*
Number of Subcatchments in the Runoff Block (NW).... 0
Number of Channel/Pipes in the Runoff Block (NG).... 0
Runoff Water quality constituents (NRQ)............. 0
Runoff Land Uses per Subcatchment (NLU)............. 0
Number of Elements in the Transport Block (NET)..... 0
Number of Storage Junctions in Transport (NTSE)..... 0
Number of Input Hydrographs in Transport (NTH)...... 0
Number of Elements in the Extran Block (NEE)........ 18
Number of Groundwater Subcatchments in Runoff (NGW). 0
Number of Interface locations for all Blocks (NIE).. 18

100 YEAR 24 HOUR SCS TYPE II STORM (103.2 mm) - XPSWMM OUTPUT
Number of Pumps in Extran (NEP)..................... 0
Number of Orifices in Extran (NEO).................. 1
Number of Tide Gates/Free Outfalls in Extran (NTG).. 1
Number of Extran Weirs (NEW)........................ 4
Number of scs hydrograph points..................... 1
Number of Extran printout locations (NPO)........... 0
Number of Tide elements in Extran (NTE)............. 1
Number of Natural channels (NNC).................... 0
Number of Storage junctions in Extran (NVSE)........ 2
Number of Time history data points in Extran(NTVAL). 0
Number of Variable storage elements in Extran (NVST) 6
Number of Input Hydrographs in Extran (NEH)......... 5
Number of Particle sizes in Transport Block (NPS)... 0
Number of User defined conduits (NHW)............... 18
Number of Connecting conduits in Extran (NECC)...... 20
Number of Upstream elements in Transport (NTCC)..... 10
Number of Storage/treatment plants (NSTU)........... 1
Number of Values for R1 lines in Transport (NR1).... 0
Number of Nodes to be allowed for (NNOD)............ 18
Number of Plugs in a Storage Treatment Unit......... 1
#######################################################
# Entry made to the HYDRAULIC Layer(Block) of SWMM #
# Last Updated June,2005 by XP Software #
rockcliffe
*===========================================================*
| HYDRAULICS TABLES IN THE OUTPUT FILE |
| These are the more important tables in the output file. |
| You can use your editor to find the table numbers, |
| for example: search for Table E20 to check continuity. |
| This output file can be imported into a Word Processor |
| and printed on US letter or A4 paper using portrait |
| mode, courier font, a size of 8 pt. and margins of 0.75 |
| |
| Table E1 - Basic Conduit Data |
| Table E2 - Conduit Factor Data |
| Table E3a - Junction Data |
| Table E3b - Junction Data |
| Table E4 - Conduit Connectivity Data |
| Table E4a - Dry Weather Flow Data |
| Table E4b - Real Time Control Data |
| Table E5 - Junction Time Step Limitation Summary |
| Table E5a - Conduit Explicit Condition Summary |
| Table E6 - Final Model Condition |
| Table E7 - Iteration Summary |
| Table E8 - Junction Time Step Limitation Summary |
| Table E9 - Junction Summary Statistics |
| Table E10 - Conduit Summary Statistics |
| Table E11 - Area assumptions used in the analysis |
100 YEAR 24 HOUR SCS TYPE II STORM (103.2 mm) - XPSWMM OUTPUT
| Table E12 - Mean conduit information |
| Table E13 - Channel losses(H) and culvert info |
| Table E13a - Culvert Analysis Classification |
| Table E14 - Natural Channel Overbank Flow Information |
| Table E14a - Natural Channel Encroachment Information |
| Table E14b - Floodplain Mapping |
| Table E15 - Spreadsheet Info List |
| Table E15a - Spreadsheet Reach List |
| Table E16 - New Conduit Output Section |
| Table E17 - Pump Operation |
| Table E18 - Junction Continuity Error |
| Table E19 - Junction Inflow & Outflow Listing |
| Table E20 - Junction Flooding and Volume List |
| Table E21 - Continuity balance at simulation end |
| Table E22 - Model Judgement Section |
*==========================================================*
Time Control from Hydraulics Job Control
Year......... 1995 Month....... 1
Day.......... 1 Hour........ 0
Minute....... 0 Second...... 0
Control information for simulation
----------------------------------
Integration cycles................. 144
Length of integration step is...... 600.00 seconds
Simulation length.................. 24.00 hours
Do not create equiv. pipes(NEQUAL). 0
Use metric units for I/O........... 1
Printing starts in cycle........... 1
Intermediate printout intervals of. 500 cycles
Intermediate printout intervals of. 5000.00 minutes
Summary printout intervals of...... 500 cycles
Summary printout time interval of.. 5000.00 minutes
Hot start file parameter (REDO).... 0
Initial time....................... 0.00 hours
Iteration variables: Flow Tolerance. 0.00010
Head Tolerance. 0.00005
Minimum depth (m or ft)......... 0.00001
Underrelaxation parameter....... 0.85000
Time weighting parameter........ 0.85000
Conduit roughness factor........ 1.00000
Flow adjustment factor.......... 1.00000
Initial Condition Smoothing..... 0
Courant Time Step Factor........ 1.00000
Default Expansion/Contraction K. 0.00000
Default Entrance/Exit K......... 0.00000
Routing Method.................. Dynamic Wave
Default surface area of junctions... 1.22 square meters.
Minimum Junction/Conduit Depth...... 0.00001 meter.
Ponding Area Coefficient............ 5000.00
100 YEAR 24 HOUR SCS TYPE II STORM (103.2 mm) - XPSWMM OUTPUT
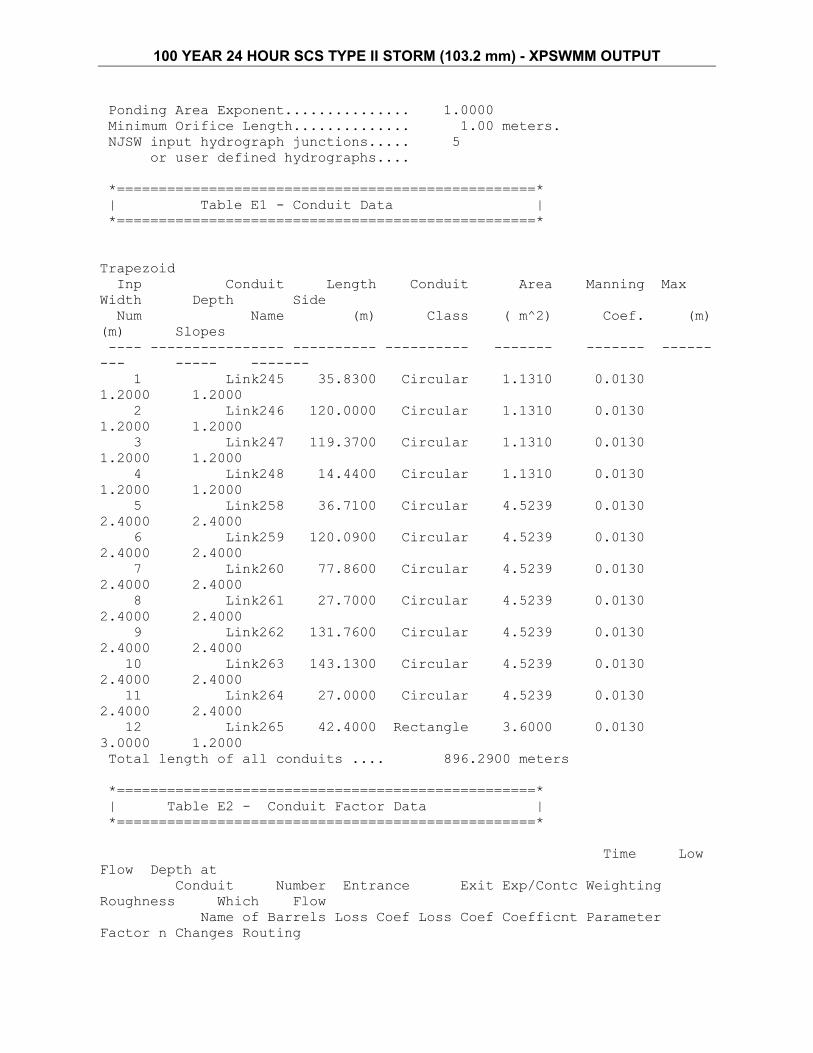
Ponding Area Exponent............... 1.0000
Minimum Orifice Length.............. 1.00 meters.
NJSW input hydrograph junctions..... 5
or user defined hydrographs....
*==================================================*
| Table E1 - Conduit Data |
*==================================================*
Trapezoid
Inp Conduit Length Conduit Area Manning Max
Width Depth Side
Num Name (m) Class ( m^2) Coef. (m)
(m) Slopes
---- ---------------- ---------- ---------- ------- ------- ------
--- ----- -------
1 Link245 35.8300 Circular 1.1310 0.0130
1.2000 1.2000
2 Link246 120.0000 Circular 1.1310 0.0130
1.2000 1.2000
3 Link247 119.3700 Circular 1.1310 0.0130
1.2000 1.2000
4 Link248 14.4400 Circular 1.1310 0.0130
1.2000 1.2000
5 Link258 36.7100 Circular 4.5239 0.0130
2.4000 2.4000
6 Link259 120.0900 Circular 4.5239 0.0130
2.4000 2.4000
7 Link260 77.8600 Circular 4.5239 0.0130
2.4000 2.4000
8 Link261 27.7000 Circular 4.5239 0.0130
2.4000 2.4000
9 Link262 131.7600 Circular 4.5239 0.0130
2.4000 2.4000
10 Link263 143.1300 Circular 4.5239 0.0130
2.4000 2.4000
11 Link264 27.0000 Circular 4.5239 0.0130
2.4000 2.4000
12 Link265 42.4000 Rectangle 3.6000 0.0130
3.0000 1.2000
Total length of all conduits .... 896.2900 meters
*==================================================*
| Table E2 - Conduit Factor Data |
*==================================================*
Time Low
Flow Depth at
Conduit Number Entrance Exit Exp/Contc Weighting
Roughness Which Flow
Name of Barrels Loss Coef Loss Coef Coefficnt Parameter
Factor n Changes Routing

100 YEAR 24 HOUR SCS TYPE II STORM (103.2 mm) - XPSWMM OUTPUT
--------------- ---------- --------- --------- --------- --------- -----
---- --------- -------
Link245 1.0000 0.0500 0.0500 0.0000 0.8500
1.0000 0.0000 Standard - Dynamic Wave
Link246 1.0000 0.0500 0.0500 0.0000 0.8500
1.0000 0.0000 Standard - Dynamic Wave
Link247 1.0000 0.0500 0.2000 0.0000 0.8500
1.0000 0.0000 Standard - Dynamic Wave
Link248 1.0000 0.2000 0.6750 0.0000 0.8500
1.0000 0.0000 Standard - Dynamic Wave
Link258 1.0000 0.0500 0.0500 0.0000 0.8500
1.0000 0.0000 Standard - Dynamic Wave
Link259 1.0000 0.6750 0.1500 0.0000 0.8500
1.0000 0.0000 Standard - Dynamic Wave
Link260 1.0000 0.1500 0.2000 0.0000 0.8500
1.0000 0.0000 Standard - Dynamic Wave
Link261 1.0000 0.2000 0.2000 0.0000 0.8500
1.0000 0.0000 Standard - Dynamic Wave
Link262 1.0000 0.2000 0.0500 0.0000 0.8500
1.0000 0.0000 Standard - Dynamic Wave
Link263 1.0000 0.0500 0.0500 0.0000 0.8500
1.0000 0.0000 Standard - Dynamic Wave
Link264 1.0000 0.0500 0.0500 0.0000 0.8500
1.0000 0.0000 Standard - Dynamic Wave
Link265 1.0000 0.0500 0.0500 0.0000 0.8500
1.0000 0.0000 Standard - Dynamic Wave
*===================================================*
| If there are messages about (sqrt(g*d)*dt/dx), or |
| the sqrt(wave celerity)*time step/conduit length |
| in the output file all it means is that the |
| program will lower the internal time step to |
| satisfy this condition (explicit condition). |
| You control the actual internal time step by |
| using the minimum courant time step factor in the |
| HYDRAULICS job control. The message put in words |
| states that the smallest conduit with the fastest |
| velocity will control the time step selection. |
| You have further control by using the modify |
| conduit option in the HYDRAULICS Job Control. |
*===================================================*
Conduit Courant
Name Ratio
--------------- ---------
Link245 57.44 ===> Warning ! (sqrt(wave celerity)*time
step/conduit length)
Link246 17.15 ===> Warning ! (sqrt(wave celerity)*time
step/conduit length)
Link247 17.24 ===> Warning ! (sqrt(wave celerity)*time
step/conduit length)
Link248 142.53 ===> Warning ! (sqrt(wave celerity)*time
step/conduit length)

100 YEAR 24 HOUR SCS TYPE II STORM (103.2 mm) - XPSWMM OUTPUT
Link258 79.29 ===> Warning ! (sqrt(wave celerity)*time
step/conduit length)
Link259 24.24 ===> Warning ! (sqrt(wave celerity)*time
step/conduit length)
Link260 37.38 ===> Warning ! (sqrt(wave celerity)*time
step/conduit length)
Link261 105.08 ===> Warning ! (sqrt(wave celerity)*time
step/conduit length)
Link262 22.09 ===> Warning ! (sqrt(wave celerity)*time
step/conduit length)
Link263 20.34 ===> Warning ! (sqrt(wave celerity)*time
step/conduit length)
Link264 107.81 ===> Warning ! (sqrt(wave celerity)*time
step/conduit length)
Link265 48.54 ===> Warning ! (sqrt(wave celerity)*time
step/conduit length)
*==================*
| Conduit Volume |
*==================*
Full pipe or full open conduit volume
Input full depth volume............ 3.0328E+03 cubic meters
*===================================================*
| Table E3a - Junction Data |
*===================================================*
Inp Junction Ground Crown Invert Qinst Initial
Interface
Num Name Elevation Elevation Elevation cms Depth-m
Flow (%)
--- --------------- --------- --------- --------- -------- ---------
---------
1 ESWM 61.0000 53.7000 53.7000 0.0000 2.3000
100.0000
2 MH1004 56.0000 54.1900 50.4600 0.0000 0.0000
100.0000
3 STLBSN 59.2000 55.0000 55.0000 0.0000 0.0000
100.0000
4 PLUG 60.0000 56.9000 55.7000 0.0000 0.0000
100.0000
5 MH1001 59.0000 56.6490 55.4000 0.0000 0.0000
100.0000
6 MH1002 58.5000 55.7600 53.7560 0.0000 0.0000
100.0000
7 MH1003 57.5000 54.1200 52.8800 0.0000 0.0000
100.0000
8 FORBAY 59.3000 56.8000 56.8000 0.0000 1.2500
100.0000
9 NODE 58.0000 54.3000 51.9000 0.0000 0.0000
100.0000

100 YEAR 24 HOUR SCS TYPE II STORM (103.2 mm) - XPSWMM OUTPUT
10 S1005 55.0000 52.5000 48.6500 0.0000 0.0000
100.0000
11 MH1006 54.0000 50.8160 48.3860 0.0000 0.0000
100.0000
12 MH1007 53.0000 50.7030 47.7000 0.0000 0.0000
100.0000
13 S1008 52.0000 49.7040 47.2950 0.0000 0.0000
100.0000
14 MH1009 52.0000 49.2600 45.0800 0.0000 0.0000
100.0000
15 MH1010 48.0000 47.4000 42.6200 0.0000 0.0000
100.0000
16 HW 45.0000 43.7000 42.5000 0.0000 0.0000
100.0000
*===================================================*
| Table E3b - Junction Data |
*===================================================*
Inp Junction X Y Type of Type
of Maximum Pavement
Num Name Coord. Coord. Manhole
Inlet Capacity Shape Slope
--- --------------- ----------- ----------- ---------- -----------
- -------- -------- -------
1 ESWM 372182.2980 5.03553E+06 No P
Normal 0 0.0000
2 MH1004 372247.3115 5.03572E+06 No P
Normal 0 0.0000
3 STLBSN 372203.5435 5.03546E+06 No P
Normal 0 0.0000
4 PLUG 371854.2610 5.03559E+06 No P
Normal 0 0.0000
5 MH1001 371959.9600 5.03566E+06 No P
Normal 0 0.0000
6 MH1002 372030.7400 5.03571E+06 No P
Normal 0 0.0000
7 MH1003 372082.9135 5.03574E+06 No P
Normal 0 0.0000
8 FORBAY 372145.6915 5.03550E+06 No P
Normal 0 0.0000
9 NODE 372216.5900 5.03561E+06 No P
Normal 0 0.0000
10 S1005 372295.0435 5.03580E+06 No P
Normal 0 0.0000
11 MH1006 372278.4915 5.03588E+06 No P
Normal 0 0.0000
12 MH1007 372194.2820 5.03595E+06 No P
Normal 0 0.0000
13 S1008 372172.4335 5.03603E+06 No P
Normal 0 0.0000
14 MH1009 372147.4730 5.03612E+06 No P
Normal 0 0.0000

100 YEAR 24 HOUR SCS TYPE II STORM (103.2 mm) - XPSWMM OUTPUT
15 MH1010 372114.7125 5.03622E+06 No P
Normal 0 0.0000
16 HW 372085.0715 5.03630E+06 No P
Normal 0 0.0000
*===================================================*
| Table E4 - Conduit Connectivity |
*===================================================*
Input Conduit Upstream Downstream Upstream
Downstream
Number Name Node Node Elevation
Elevation
====== ================ ============== =============== =========
=========
1 Link245 PLUG MH1001 55.7000
55.4490 No Design
2 Link246 MH1001 MH1002 55.4000
54.5600 No Design
3 Link247 MH1002 MH1003 53.7560
52.9200 No Design
4 Link248 MH1003 MH1004 52.8800
52.7800 No Design
5 Link258 NODE MH1004 51.9000
51.7900 No Design
6 Link259 MH1004 S1005 50.4600
50.1000 No Design
7 Link260 S1005 MH1006 48.6500
48.4160 No Design
8 Link261 MH1006 MH1007 48.3860
48.3030 No Design
9 Link262 MH1007 S1008 47.7000
47.3040 No Design
10 Link263 S1008 MH1009 47.2950
46.8600 No Design
11 Link264 MH1009 MH1010 45.0800
45.0000 No Design
12 Link265 MH1010 HW 42.6200
42.5000 No Design
*==========================================*
| Storage Junction Data |
*==========================================*
MAXIMUM OR PEAK OR CROWN
DEPTH
STORAGE JUNCTION JUNCTION CONSTANT SURFACE CONSTANT VOLUME
ELEVATION STARTS
NUMBER OR NAME TYPE AREA (M2) (CUBIC MET.) (M)
FROM
-------------- -------- ---------------- --------------- --------
- -----------

100 YEAR 24 HOUR SCS TYPE II STORM (103.2 mm) - XPSWMM OUTPUT
ESWM Stage/Area 22460.0000 133622.2663
61.0000 Node Invert
FORBAY Stage/Area 2580.0000 4198.0733
59.3000 Node Invert
*==================================*
| Variable storage data for node |ESWM
*==================================*
Data Elevation Depth Area Volume
Point meters meters m^2 m^3
===== ========= ====== =========== ============
1 53.7000 0.0000 9230.0000 0.0000
2 53.7375 0.0375 9330.0000 347.9983
3 53.7750 0.0750 9430.0000 699.7467
4 53.8125 0.1125 9530.0000 1055.2450
5 53.8500 0.1500 9630.0000 1414.4934
6 53.8875 0.1875 9730.0000 1777.4918
7 53.9250 0.2250 9830.0000 2144.2402
8 53.9625 0.2625 9930.0000 2514.7386
9 54.0000 0.3000 10030.0000 2888.9870
10 54.1250 0.4250 10265.0000 4157.3962
11 54.2500 0.5500 10500.0000 5455.1810
12 54.3750 0.6750 10735.0000 6782.3414
13 54.5000 0.8000 10970.0000 8138.8774
14 54.6250 0.9250 11205.0000 9524.7889
15 54.7500 1.0500 11440.0000 10940.0760
16 54.8750 1.1750 11675.0000 12384.7386
17 55.0000 1.3000 11910.0000 13858.7767
18 55.1250 1.4250 12433.7500 15380.1437
19 55.2500 1.5500 12957.5000 16966.9843
20 55.3750 1.6750 13481.2500 18619.2981
21 55.5000 1.8000 14005.0000 20337.0847
22 55.6250 1.9250 14528.7500 22120.3440
23 55.7500 2.0500 15052.5000 23969.0755
24 55.8750 2.1750 15576.2500 25883.2791
25 56.0000 2.3000 16100.0000 27862.9545
26 56.1250 2.4250 16475.0000 29898.8470
27 56.2500 2.5500 16850.0000 31981.6155
28 56.3750 2.6750 17225.0000 34111.2601
29 56.5000 2.8000 17600.0000 36287.7805
30 56.6250 2.9250 17975.0000 38511.1768
31 56.7500 3.0500 18350.0000 40781.4490
32 56.8750 3.1750 18725.0000 43098.5970
33 57.0000 3.3000 19100.0000 45462.6208
34 57.1250 3.4250 19520.0000 47876.3232
35 57.2500 3.5500 19940.0000 50342.5266
36 57.3750 3.6750 20360.0000 52861.2310
37 57.5000 3.8000 20780.0000 55432.4363
38 57.6250 3.9250 21200.0000 58056.1426
39 57.7500 4.0500 21620.0000 60732.3497
40 57.8750 4.1750 22040.0000 63461.0576
41 58.0000 4.3000 22460.0000 66242.2663
42 61.0000 7.3000 22460.0000 133622.2663
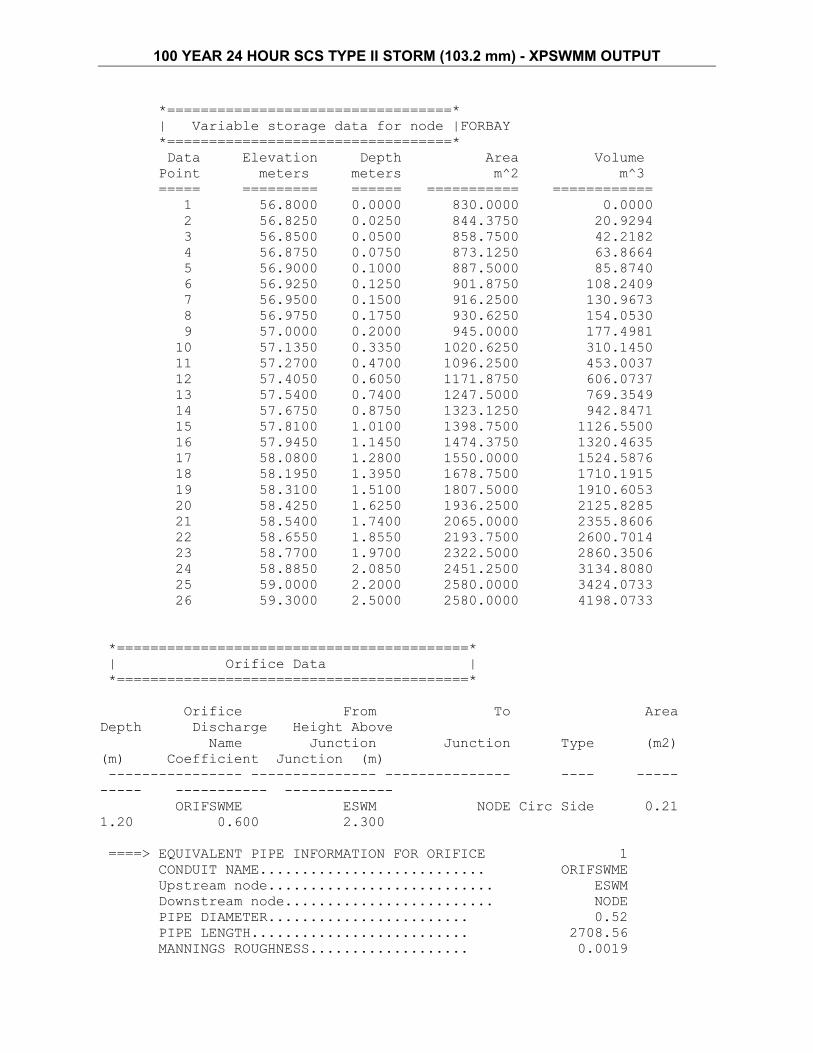
100 YEAR 24 HOUR SCS TYPE II STORM (103.2 mm) - XPSWMM OUTPUT
*==================================*
| Variable storage data for node |FORBAY
*==================================*
Data Elevation Depth Area Volume
Point meters meters m^2 m^3
===== ========= ====== =========== ============
1 56.8000 0.0000 830.0000 0.0000
2 56.8250 0.0250 844.3750 20.9294
3 56.8500 0.0500 858.7500 42.2182
4 56.8750 0.0750 873.1250 63.8664
5 56.9000 0.1000 887.5000 85.8740
6 56.9250 0.1250 901.8750 108.2409
7 56.9500 0.1500 916.2500 130.9673
8 56.9750 0.1750 930.6250 154.0530
9 57.0000 0.2000 945.0000 177.4981
10 57.1350 0.3350 1020.6250 310.1450
11 57.2700 0.4700 1096.2500 453.0037
12 57.4050 0.6050 1171.8750 606.0737
13 57.5400 0.7400 1247.5000 769.3549
14 57.6750 0.8750 1323.1250 942.8471
15 57.8100 1.0100 1398.7500 1126.5500
16 57.9450 1.1450 1474.3750 1320.4635
17 58.0800 1.2800 1550.0000 1524.5876
18 58.1950 1.3950 1678.7500 1710.1915
19 58.3100 1.5100 1807.5000 1910.6053
20 58.4250 1.6250 1936.2500 2125.8285
21 58.5400 1.7400 2065.0000 2355.8606
22 58.6550 1.8550 2193.7500 2600.7014
23 58.7700 1.9700 2322.5000 2860.3506
24 58.8850 2.0850 2451.2500 3134.8080
25 59.0000 2.2000 2580.0000 3424.0733
26 59.3000 2.5000 2580.0000 4198.0733
*==========================================*
| Orifice Data |
*==========================================*
Orifice From To Area
Depth Discharge Height Above
Name Junction Junction Type (m2)
(m) Coefficient Junction (m)
---------------- --------------- --------------- ---- -----
----- ----------- -------------
ORIFSWME ESWM NODE Circ Side 0.21
1.20 0.600 2.300
====> EQUIVALENT PIPE INFORMATION FOR ORIFICE 1
CONDUIT NAME........................... ORIFSWME
Upstream node........................... ESWM
Downstream node......................... NODE
PIPE DIAMETER........................ 0.52
PIPE LENGTH.......................... 2708.56
MANNINGS ROUGHNESS................... 0.0019

100 YEAR 24 HOUR SCS TYPE II STORM (103.2 mm) - XPSWMM OUTPUT
INVERT ELEVATION AT UPSTREAM END..... 56.0000
INVERT ELEVATION AT DOWNSTREAM END... 55.9970
Note: For a Bottom-outlet orifice the invert elevation of the downstream
node will be
adjusted to accomodate the equivalent conduit. Conduit grades are
not affected.
*===========================================*
| Weir Data |
*===========================================*
Weir From To Crest
Weir Weir Discharge Weir
Name Junction Junction Type Height(ft) Top
(m) Length (m) Coefficient Power
---------------- --------------- --------------- ---- ---------- ---
---- ---------- ----------- -----------
WEIR ESWM NODE 1 3.41
7.30 9.00 1.7000 1.5000
FF Weir STLBSN FORBAY 1 3.05
4.00 7.00 1.7000 1.5000
OVF weir STLBSN ESWM 1 3.95
4.20 60.00 1.7000 1.5000
forTpnd FORBAY ESWM 1 1.25
2.20 4.00 1.7000 1.5000
*================================================*
| FREE OUTFALL DATA (DATA GROUP I1) |
| BOUNDARY CONDITION ON DATA GROUP J1 |
*================================================*
Outfall at Junction....HW has boundary condition number...
1
*=============================================*
| Weir Outfall Data |
| Boundary Condition on data group J1 |
*=============================================*
*================================================*
| INTERNAL CONNECTIVITY INFORMATION |
*================================================*
CONDUIT JUNCTION JUNCTION
---------------- ---------------- ----------------
ORIFSWME ESWM NODE
WEIR ESWM NODE
FF Weir STLBSN FORBAY

100 YEAR 24 HOUR SCS TYPE II STORM (103.2 mm) - XPSWMM OUTPUT
OVF weir STLBSN ESWM
forTpnd FORBAY ESWM
FREE # 1 HW BOUNDARY
*===================================================*
| Boundary Condition Information |
| Data Groups J1-J4 |
*===================================================*
BC NUMBER.. 1 Control water surface elevation is.. 42.250
meters.
*===================================================*
| XP Note Field Summary |
*===================================================*
*=================================*
| Conduit Convergence Criteria |
*=================================*
Conduit Full Conduit
Name Flow Slope
----------------- ---------- ----------
Link245 3.2631 0.0070
Link246 3.2619 0.0070
Link247 3.2627 0.0070
Link248 3.2444 0.0069
Link258 13.5511 0.0030
Link259 13.5540 0.0030
Link260 13.5713 0.0030
Link261 13.5509 0.0030
Link262 13.5714 0.0030
Link263 13.6474 0.0030
Link264 13.4751 0.0030
Link265 8.3743 0.0028
ORIFSWME 0.4060 0.0000
*=================================*
| Initial Model Condition |
| Initial Time = 0.17 hours |
*=================================*
Junction / Depth / Elevation ===> "*" Junction is Surcharged.
ESWM/ 2.30 / 56.00 MH1004/ 0.00 / 50.46
STLBSN/ 0.00 / 55.00
PLUG/ 0.00 / 55.70 MH1001/ 0.00 / 55.40
MH1002/ 0.00 / 53.76
MH1003/ 0.00 / 52.88 FORBAY/ 1.25 / 58.05
NODE/ 0.00 / 51.90

100 YEAR 24 HOUR SCS TYPE II STORM (103.2 mm) - XPSWMM OUTPUT
S1005/ 0.00 / 48.65 MH1006/ 0.00 / 48.39
MH1007/ 0.00 / 47.70
S1008/ 0.00 / 47.30 MH1009/ 0.00 / 45.08
MH1010/ 0.00 / 42.62
HW/ 0.00 / 42.50
Conduit/ FLOW ===> "*" Conduit uses the normal flow
option.
Link245/ 0.00 Link246/ 0.00
Link247/ 0.00
Link248/ 0.00 Link258/ 0.00
Link259/ 0.00
Link260/ 0.00 Link261/ 0.00
Link262/ 0.00
Link263/ 0.00 Link264/ 0.00
Link265/ 0.00
ORIFSWME/ 0.00 WEIR/ 0.00 FF
Weir/ 0.00
OVF weir/ 0.00 forTpnd/ 0.00 FREE #
1/ 0.00
Conduit/ Velocity
Link245/ 0.00 Link246/ 0.00
Link247/ 0.00
Link248/ 0.00 Link258/ 0.00
Link259/ 0.00
Link260/ 0.00 Link261/ 0.00
Link262/ 0.00
Link263/ 0.00 Link264/ 0.00
Link265/ 0.00
ORIFSWME/ 0.00
Conduit/ Cross Sectional Area
Link245/ 0.00 Link246/ 0.00
Link247/ 0.00
Link248/ 0.00 Link258/ 0.00
Link259/ 0.00
Link260/ 0.00 Link261/ 0.00
Link262/ 0.00
Link263/ 0.00 Link264/ 0.00
Link265/ 0.00
ORIFSWME/ 0.00
Conduit/ Hydraulic Radius
Link245/ 0.00 Link246/ 0.00
Link247/ 0.00
Link248/ 0.00 Link258/ 0.00
Link259/ 0.00
Link260/ 0.00 Link261/ 0.00
Link262/ 0.00
Link263/ 0.00 Link264/ 0.00
Link265/ 0.00
ORIFSWME/ 0.00

100 YEAR 24 HOUR SCS TYPE II STORM (103.2 mm) - XPSWMM OUTPUT
Conduit/ Upstream/ Downstream Elevation
Link245/ 55.40/ 55.40 Link246/ 53.76/ 53.76
Link247/ 52.88/ 52.88
Link248/ 50.46/ 50.46 Link258/ 50.46/ 50.46
Link259/ 48.65/ 48.65
Link260/ 48.39/ 48.39 Link261/ 47.70/ 47.70
Link262/ 47.30/ 47.30
Link263/ 45.08/ 45.08 Link264/ 42.62/ 42.62
Link265/ 42.50/ 42.50
ORIFSWME/ 51.90/ 51.90
######## Important Information ########
Start time of user hydrographs was... 0.000000000000000E+000
Start time of the simulation was..... 0.000000000000000E+000
Found a match between user hydrograph and simulation start time.
# # # # # # # # # # # # # # # # # # # # # # # # # # # # # # # # # # # # #
# # #
*===================================================*
| Table E5 - Junction Time Limitation Summary |
| (0.10 or 0.25)* Depth * Area |
| Time step = ------------------------------ |
| Sum of Flow |
*===================================================*
| The time this junction was the limiting junction |
| is listed in the third column. |
*===================================================*
Junction Time(.10) Time(.25) Time(sec)
----------------- --------- --------- ---------
ESWM 47.5310 118.8274 4200.0000
MH1004 22.1544 55.3861 9000.0000
STLBSN 0.5335 1.3338 51600.0000
PLUG 68.6248 171.5620 0.0000
MH1001 64.7233 161.8083 0.0000
MH1002 64.8602 162.1505 0.0000
MH1003 81.9120 204.7800 600.0000
FORBAY 57.8910 144.7275 2400.0000
NODE 35.7312 89.3281 3000.0000
S1005 25.0136 62.5341 0.0000
MH1006 93.2897 233.2244 0.0000
MH1007 23.2223 58.0558 0.0000
S1008 20.0276 50.0690 13200.0000
MH1009 27.7014 69.2535 0.0000
MH1010 10.5394 26.3486 2400.0000
HW 6000.0000 6000.0000 0.0000
The junction requiring the smallest time step was...STLBSN
*==========================================================*
| Table E5a - Conduit Explicit Condition Summary |
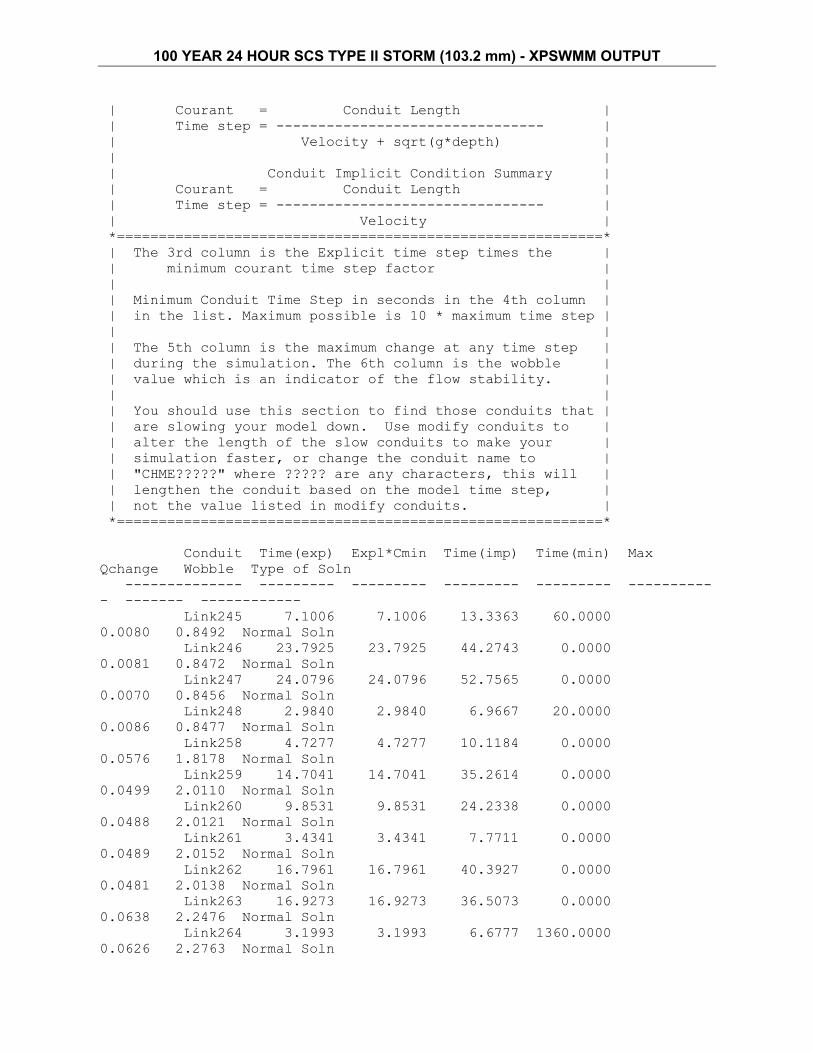
100 YEAR 24 HOUR SCS TYPE II STORM (103.2 mm) - XPSWMM OUTPUT
| Courant = Conduit Length |
| Time step = -------------------------------- |
| Velocity + sqrt(g*depth) |
| |
| Conduit Implicit Condition Summary |
| Courant = Conduit Length |
| Time step = -------------------------------- |
| Velocity |
*==========================================================*
| The 3rd column is the Explicit time step times the |
| minimum courant time step factor |
| |
| Minimum Conduit Time Step in seconds in the 4th column |
| in the list. Maximum possible is 10 * maximum time step |
| |
| The 5th column is the maximum change at any time step |
| during the simulation. The 6th column is the wobble |
| value which is an indicator of the flow stability. |
| |
| You should use this section to find those conduits that |
| are slowing your model down. Use modify conduits to |
| alter the length of the slow conduits to make your |
| simulation faster, or change the conduit name to |
| "CHME?????" where ????? are any characters, this will |
| lengthen the conduit based on the model time step, |
| not the value listed in modify conduits. |
*==========================================================*
Conduit Time(exp) Expl*Cmin Time(imp) Time(min) Max
Qchange Wobble Type of Soln
-------------- --------- --------- --------- --------- ----------
- ------- ------------
Link245 7.1006 7.1006 13.3363 60.0000
0.0080 0.8492 Normal Soln
Link246 23.7925 23.7925 44.2743 0.0000
0.0081 0.8472 Normal Soln
Link247 24.0796 24.0796 52.7565 0.0000
0.0070 0.8456 Normal Soln
Link248 2.9840 2.9840 6.9667 20.0000
0.0086 0.8477 Normal Soln
Link258 4.7277 4.7277 10.1184 0.0000
0.0576 1.8178 Normal Soln
Link259 14.7041 14.7041 35.2614 0.0000
0.0499 2.0110 Normal Soln
Link260 9.8531 9.8531 24.2338 0.0000
0.0488 2.0121 Normal Soln
Link261 3.4341 3.4341 7.7711 0.0000
0.0489 2.0152 Normal Soln
Link262 16.7961 16.7961 40.3927 0.0000
0.0481 2.0138 Normal Soln
Link263 16.9273 16.9273 36.5073 0.0000
0.0638 2.2476 Normal Soln
Link264 3.1993 3.1993 6.6777 1360.0000
0.0626 2.2763 Normal Soln

100 YEAR 24 HOUR SCS TYPE II STORM (103.2 mm) - XPSWMM OUTPUT
Link265 5.1160 5.1160 9.8153 0.0000
0.0622 4.1387 Normal Soln
ORIFSWME 359.0169 359.0169 852.2564 0.0000
0.0009 2.2020 Normal Soln
The conduit with the smallest time step limitation was..Link264
The conduit with the largest wobble was.................Link265
The conduit with the largest flow change in any
consecutive time step...................................Link263
*==================================================*
| Table E6. Final Model Condition |
| This table is used for steady state |
| flow comparison and is the information|
| saved to the hot-restart file. |
| Final Time = 24.167 hours |
*==================================================*
Junction / Depth / Elevation ===> "*" Junction is Surcharged.
ESWM/ 3.40 / 57.10/ MH1004/ 0.33 / 50.79/
STLBSN/ 3.18*/ 58.18/
PLUG/ 0.00 / 55.70/ MH1001/ 0.00 / 55.40/
MH1002/ 0.00 / 53.76/
MH1003/ 0.00 / 52.88/ FORBAY/ 1.37 / 58.17/
NODE/ 0.31 / 52.21/
S1005/ 0.32 / 48.97/ MH1006/ 0.33 / 48.72/
MH1007/ 0.31 / 48.01/
S1008/ 0.32 / 47.61/ MH1009/ 0.32 / 45.40/
MH1010/ 0.16 / 42.78/
HW/ 0.14 / 42.64/
Conduit/ Flow ===> "*" Conduit uses the normal flow option.
Link245/ 0.00 / Link246/ 0.00 /
Link247/ 0.00 /
Link248/ 0.00 / Link258/ 0.47 /
Link259/ 0.47 /
Link260/ 0.47 / Link261/ 0.47 /
Link262/ 0.47 /
Link263/ 0.49 / Link264/ 0.49 /
Link265/ 0.49 /
ORIFSWME/ 0.47 / WEIR/ 0.00 / FF
Weir/ 0.27 /
OVF weir/ 0.00 / forTpnd/ 0.30 / FREE
# 1/ 0.49 /
Conduit/ Velocity
Link245/ 0.00 / Link246/ 0.00 /
Link247/ 0.00 /
Link248/ 0.00 / Link258/ 1.38 /
Link259/ 1.32 /
Link260/ 1.34 / Link261/ 1.30 /
Link262/ 1.37 /
Link263/ 1.41 / Link264/ 1.39 /
Link265/ 1.10 /
ORIFSWME/ 2.27 /

100 YEAR 24 HOUR SCS TYPE II STORM (103.2 mm) - XPSWMM OUTPUT
Conduit/ Width
Link245/ 0.47 / Link246/ 0.47 /
Link247/ 0.47 /
Link248/ 0.47 / Link258/ 1.60 /
Link259/ 1.62 /
Link260/ 1.61 / Link261/ 1.62 /
Link262/ 1.60 /
Link263/ 1.61 / Link264/ 1.61 /
Link265/ 3.00 /
ORIFSWME/ 0.16 /
Junction/ EGL
ESWM/ 3.40 / MH1004/ 2.32 /
STLBSN/ 3.18 /
PLUG/ 0.00 / MH1001/ 0.05 /
MH1002/ 0.80 /
MH1003/ 0.04 / FORBAY/ 1.37 /
NODE/ 4.81 /
S1005/ 1.84 / MH1006/ 0.43 /
MH1007/ 0.99 /
S1008/ 0.41 / MH1009/ 2.19 /
MH1010/ 2.79 /
HW/ 0.20 /
Junction/ Freeboard
ESWM/ 3.90 / MH1004/ 5.21 /
STLBSN/ 1.02 /
PLUG/ 4.30 / MH1001/ 3.60 /
MH1002/ 4.74 /
MH1003/ 4.62 / FORBAY/ 1.13 /
NODE/ 5.79 /
S1005/ 6.03 / MH1006/ 5.28 /
MH1007/ 4.99 /
S1008/ 4.39 / MH1009/ 6.60 /
MH1010/ 5.22 /
HW/ 2.36 /
Junction/ Max Volume
ESWM/ 65220.01 / MH1004/ 2.86 /
STLBSN/ 5.08 /
PLUG/ 0.69 / MH1001/ 0.68 /
MH1002/ 0.66 /
MH1003/ 0.96 / FORBAY/ 3315.78 /
NODE/ 2.15 /
S1005/ 2.76 / MH1006/ 2.54 /
MH1007/ 2.71 /
S1008/ 2.56 / MH1009/ 2.41 /
MH1010/ 1.97 /
HW/ 1.46 /
Junction/Total Fldng
ESWM/ 0.00 / MH1004/ 0.00 /
STLBSN/ 0.00 /

100 YEAR 24 HOUR SCS TYPE II STORM (103.2 mm) - XPSWMM OUTPUT
PLUG/ 0.00 / MH1001/ 0.00 /
MH1002/ 0.00 /
MH1003/ 0.00 / FORBAY/ 0.00 /
NODE/ 0.00 /
S1005/ 0.00 / MH1006/ 0.00 /
MH1007/ 0.00 /
S1008/ 0.00 / MH1009/ 0.00 /
MH1010/ 0.00 /
HW/ 0.00 /
Conduit/ Cross Sectional Area
Link245/ 0.00 / Link246/ 0.00 /
Link247/ 0.00 /
Link248/ 0.00 / Link258/ 0.34 /
Link259/ 0.35 /
Link260/ 0.35 / Link261/ 0.36 /
Link262/ 0.34 /
Link263/ 0.35 / Link264/ 0.35 /
Link265/ 0.44 /
ORIFSWME/ 0.21 /
Conduit/ Final Volume
Link245/ 0.00 / Link246/ 0.00 /
Link247/ 0.00 /
Link248/ 0.00 / Link258/ 12.41 /
Link259/ 42.62 /
Link260/ 27.16 / Link261/ 9.95 /
Link262/ 45.04 /
Link263/ 49.49 / Link264/ 9.46 /
Link265/ 18.82 /
ORIFSWME/ 557.73 /
Conduit/ Hydraulic Radius
Link245/ 0.00 / Link246/ 0.00 /
Link247/ 0.00 /
Link248/ 0.00 / Link258/ 0.19 /
Link259/ 0.20 /
Link260/ 0.20 / Link261/ 0.20 /
Link262/ 0.19 /
Link263/ 0.19 / Link264/ 0.20 /
Link265/ 0.13 /
ORIFSWME/ 0.14 /
Conduit/ Upstream/ Downstream Elevation
Link245/ 55.70/ 55.45 Link246/ 55.40/ 54.56
Link247/ 53.76/ 52.92/
Link248/ 52.88/ 52.78 Link258/ 52.21/ 52.09
Link259/ 50.79/ 50.40/
Link260/ 48.97/ 48.72 Link261/ 48.72/ 48.60
Link262/ 48.01/ 47.61/
Link263/ 47.61/ 47.17 Link264/ 45.40/ 45.31
Link265/ 42.78/ 42.64/
ORIFSWME/ 57.10/ 56.45

100 YEAR 24 HOUR SCS TYPE II STORM (103.2 mm) - XPSWMM OUTPUT
*=========================================================*
| Table E7 - Iteration Summary |
*=========================================================*
Total number of time steps simulated............ 144
Total number of passes in the simulation........ 17298
Total number of time steps during simulation.... 11595
Ratio of actual # of time steps / NTCYC......... 80.521
Average number of iterations per time step...... 1.492
Average time step size(seconds)................ 7.451
Smallest time step size(seconds)................ 0.533
Largest time step size(seconds)................ 600.000
Average minimum Conduit Courant time step (sec). 26.162
Average minimum implicit time step (sec)........ 7.353
Average minimum junction time step (sec)........ 7.353
Average Courant Factor Tf....................... 7.353
Number of times omega reduced................... 0
*=========================================================*
| Table E8 - Junction Time Step Limitation Summary |
*=========================================================*
| Not Convr = Number of times this junction did not |
| converge during the simulation. |
| Avg Convr = Average junction iterations. |
| Conv err = Mean convergence error. |
| Omega Cng = Change of omega during iterations |
| Max Itern = Maximum number of iterations |
*=========================================================*
Junction Not Convr Avg Convr Total Itt Omega Cng Max Itern
Ittrn >10 Ittrn >25 Ittrn >40
-------------- --------- --------- --------- -------- --------- ---
------ --------- ---------
ESWM 0 1.85 21492 0 18
2 0 0
MH1004 0 1.84 21364 0 7
0 0 0
STLBSN 1 2.93 33927 0 501
50 14 13
PLUG 0 1.16 13419 0 9
0 0 0
MH1001 0 1.28 14894 0 7
0 0 0
MH1002 0 1.33 15365 0 8
0 0 0
MH1003 0 1.29 14932 0 78
5 2 1
FORBAY 0 2.44 28262 0 35
8 1 0
NODE 0 1.84 21340 0 71
1 1 1
S1005 0 2.04 23608 0 132
7 3 2

100 YEAR 24 HOUR SCS TYPE II STORM (103.2 mm) - XPSWMM OUTPUT
MH1006 0 2.22 25688 0 118
14 9 6
MH1007 0 1.97 22866 0 6
0 0 0
S1008 0 2.14 24820 0 9
0 0 0
MH1009 0 2.20 25510 0 20
1 0 0
MH1010 0 3.35 38833 0 68
654 502 29
HW 0 2.29 26606 0 23
1 0 0
Total number of iterations for all junctions.. 372926
Minimum number of possible iterations......... 185520
Efficiency of the simulation.................. 2.01
Excellent Efficiency
*==========================================================*
| Extran Efficiency is an indicator of the efficiency of |
| the simulation. Ideal efficiency is one iteration per |
| time step. Altering the underrelaxation parameter, |
| lowering the time step, increasing the flow and head |
| tolerance are good ways of improving the efficiency, |
| another is lowering the internal time step. The lower the|
| efficiency generally the faster your model will run. |
| If your efficiency is less than 1.5 then you may try |
| increasing your time step so that your overall simulation|
| is faster. Ideal efficiency would be around 2.0 |
| |
| Good Efficiency < 1.5 mean iterations |
| Excellent Efficiency < 2.5 and > 1.5 mean iterations |
| Good Efficiency < 4.0 and > 2.5 mean iterations |
| Fair Efficiency < 7.5 and > 4.0 mean iterations |
| Poor Efficiency > 7.5 mean iterations |
*==========================================================*
*======================================================*
| Table E9 - JUNCTION SUMMARY STATISTICS |
| The Maximum area is only the area of the node, it |
| does not include the area of the surrounding conduits|
*======================================================*
Uppermost Maximum Time Meters of
Maximum Maximum Maximum Maximum
Ground PipeCrown Junction of Surcharge
Freeboard Junction Gutter Gutter Gutter
Junction Elevation Elevation Elevation Occurence at Max
of node Area Depth Width Velocity
Name meters meters meters Hr. Min. Elevation
meters m^2 meters meters m/s
--------------- --------- -------- -------- --------- ---------
-------- -------- --------- --------- ---------

100 YEAR 24 HOUR SCS TYPE II STORM (103.2 mm) - XPSWMM OUTPUT
ESWM 61.0000 53.7000 57.9543 12 34 4.2543
3.0457 22306.542 0.0000 0.0000 0.0000
MH1004 56.0000 54.1900 52.8008 12 32 0.0000
3.1992 1.2200 0.0000 0.0000 0.0000
STLBSN 59.2000 55.0000 59.1616 12 20 4.1616
0.0384 1.2200 0.0000 0.0000 0.0000
PLUG 60.0000 56.9000 56.2678 12 30 0.0000
3.7322 1.2200 0.0000 0.0000 0.0000
MH1001 59.0000 56.6490 55.9570 12 30 0.0000
3.0430 1.2200 0.0000 0.0000 0.0000
MH1002 58.5000 55.7600 54.3008 12 30 0.0000
4.1992 1.2200 0.0000 0.0000 0.0000
MH1003 57.5000 54.1200 53.6696 12 31 0.0000
3.8304 1.2200 0.0000 0.0000 0.0000
FORBAY 59.3000 56.8000 58.9576 12 20 2.1576
0.3424 2532.5612 0.0000 0.0000 0.0000
NODE 58.0000 54.3000 53.6603 12 34 0.0000
4.3397 1.2200 0.0000 0.0000 0.0000
S1005 55.0000 52.5000 50.9158 12 32 0.0000
4.0842 1.2200 0.0000 0.0000 0.0000
MH1006 54.0000 50.8160 50.4712 12 32 0.0000
3.5288 1.2200 0.0000 0.0000 0.0000
MH1007 53.0000 50.7030 49.9212 12 32 0.0000
3.0788 1.2200 0.0000 0.0000 0.0000
S1008 52.0000 49.7040 49.3943 12 32 0.0000
2.6057 1.2200 0.0000 0.0000 0.0000
MH1009 52.0000 49.2600 47.0518 12 32 0.0000
4.9482 1.2200 0.0000 0.0000 0.0000
MH1010 48.0000 47.4000 44.2339 12 32 0.0000
3.7661 1.2200 0.0000 0.0000 0.0000
HW 45.0000 43.7000 43.7000 12 19 0.0000
1.3000 1.2200 0.0000 0.0000 0.0000
*======================================================*
| Table E10 - CONDUIT SUMMARY STATISTICS |
| Note: The peak flow may be less than the design flow |
| and the conduit may still surcharge because of the |
| downstream boundary conditions. |
| |
| * denotes an open conduit that has been overtopped |
| this is a potential source of severe errors |
*======================================================*
Conduit Maximum Maximum Time Maximum
Time Ratio of Maximum Water Ratio
Design Design Vertical Computed of Computed
of Max. to Elev at Pipe Ends d/D
Conduit Flow Velocity Depth Flow Occurence Velocity
Occurence Design Upstream Dwnstrm US DS
Name (cms) (m/s) (mm) (cms) Hr. Min. (m/s)
Hr. Min. Flow (m) (m)
--------------- ------- -------- -------- ------- ----------- -------
---------- ------- -------- -------- ----- -----

100 YEAR 24 HOUR SCS TYPE II STORM (103.2 mm) - XPSWMM OUTPUT
Link245 3.2631 2.8853 1200.000 1.3855 12 30 2.7026
12 30 0.4246 56.2678 55.9948 0.473 0.455
Link246 3.2619 2.8842 1200.000 1.3817 12 30 2.7379
12 31 0.4236 55.9570 55.1051 0.464 0.454
Link247 3.2627 2.8849 1200.000 1.3795 12 30 2.2691
12 30 0.4228 54.3008 53.6696 0.454 0.625
Link248 3.2444 2.8687 1200.000 1.3752 12 31 2.0875
12 31 0.4239 53.6696 53.3253 0.658 0.454
Link258 13.5511 2.9954 2400.000 12.5499 12 34 3.6499
12 34 0.9261 53.6603 53.4313 0.733 0.684
Link259 13.5540 2.9961 2400.000 13.8612 12 32 3.4355
12 32 1.0227 52.8008 51.8262 0.975 0.719
Link260 13.5713 2.9999 2400.000 13.8866 12 32 3.2403
12 32 1.0232 50.9158 50.4712 0.944 0.856
Link261 13.5509 2.9954 2400.000 13.8873 12 33 3.5946
12 33 1.0248 50.4712 50.0309 0.869 0.720
Link262 13.5714 2.9999 2400.000 13.8979 12 33 3.2636
12 37 1.0241 49.9212 49.3943 0.925 0.871
Link263 13.6474 3.0167 2400.000 15.5760 12 32 3.9231
12 33 1.1413 49.3943 48.6884 0.875 0.762
Link264 13.4751 2.9787 2400.000 15.5764 12 32 4.0457
12 32 1.1559 47.0518 46.8284 0.822 0.762
Link265 8.3743 2.3262 1200.000 15.6315 12 33 4.3380
12 33 1.8666 44.2339 43.7000 1.345 1.000
ORIFSWME 0.4060 0.1467 519.5450 0.6804 12 38 3.1787
12 38 1.6757 57.9543 56.5165 3.762 1.000
WEIR Undefnd Undefnd Undefn 11.8702 12 34
FF Weir Undefnd Undefnd Undefn 8.2816 13 1
OVF weir Undefnd Undefnd Undefn 9.9250 12 20
forTpnd Undefnd Undefnd Undefn 5.8799 12 20
FREE # 1 Undefnd Undefnd Undefn 15.6320 12 33
*==================================================*
| Table E11. Area assumptions used in the analysis|
| Subcritical and Critical flow assumptions from |
| Subroutine Head. See manual for more information.|
*==================================================*
Duration Duration Durat. of Durat. of
of of Sub- Upstream Downstream Maximum
Maximum Maximum
Conduit Dry Critical Critical Critical Hydraulic
X-Sect Vel*D
Name Flow(min) Flow(min) Flow(min) Flow(min) Radius-m
Area(m^2) (m^2/s)
--------------- ---------- ---------- --------- --------- --------- -
-------- --------
Link245 730.0000 0.0000 0.0000 710.0000 0.2857
0.5148 1.4949
Link246 730.0000 0.0000 0.0000 710.0000 0.2835
0.5073 1.4868
Link247 730.0000 54.0766 0.0000 655.9234 0.3073
0.6087 1.4493

100 YEAR 24 HOUR SCS TYPE II STORM (103.2 mm) - XPSWMM OUTPUT
Link248 730.0714 0.0000 0.0000 709.9286 0.3176
0.6589 1.3673
Link258 30.0000 0.0000 0.0000 1410.0000 0.7133
3.4385 6.1215
Link259 60.0000 0.0000 0.0000 1380.0000 0.7128
4.0348 6.8547
Link260 60.0000 826.2088 0.0000 553.7912 0.7287
4.2858 6.8739
Link261 60.0000 0.0000 0.0000 1380.0000 0.7205
3.8634 6.7363
Link262 60.0000 1377.0000 0.0000 3.0000 0.7301
4.2843 6.8571
Link263 50.0000 0.0000 0.0000 1390.0000 0.7258
3.9712 7.6938
Link264 50.0000 0.0000 0.0000 1390.0000 0.7280
3.8502 7.6786
Link265 60.0000 1380.0000 0.0000 0.0000 0.6181
3.6034 6.0599
ORIFSWME 22.8089 0.0000 0.0000 1417.1911 0.1463
0.2140 3.9150
*===========================================*
| Table E12. Mean Conduit Flow Information |
*===========================================*
Mean Total Mean Low Mean
Mean Mean Mean
Conduit Flow Flow Percent Flow Froude
Hydraulic Cross Conduit
Name (cms) (m^3) Change Weightng Number
Radius Area Roughness
--------------- -------- -------- -------- -------- ------ -----
--- ------ ---------
Link245 0.0285 2464.2007 0.0000 0.3021 0.5215
0.0223 0.0284 0.0130
Link246 0.0285 2465.1914 0.0000 0.4204 0.9580
0.0225 0.0283 0.0130
Link247 0.0284 2457.7931 0.0000 0.4700 1.0842
0.0242 0.0332 0.0130
Link248 0.0285 2461.7835 0.0000 0.4708 1.0470
0.0254 0.0366 0.0130
Link258 1.1263 97316.405 0.0000 0.9024 0.8788
0.2478 0.7262 0.0130
Link259 1.1545 99749.260 0.0000 0.9022 0.7828
0.2560 0.8062 0.0130
Link260 1.1586 100105.70 0.0000 0.9020 0.7641
0.2585 0.8333 0.0130
Link261 1.1584 100088.33 0.0000 0.9020 0.8030
0.2568 0.7915 0.0130
Link262 1.1581 100058.84 0.0000 0.9020 0.6071
0.2600 0.8142 0.0130
Link263 1.3473 116407.63 0.0000 0.9022 0.7517
0.2703 0.8188 0.0130
Link264 1.3472 116394.13 0.0000 0.9022 0.7438
0.2724 0.8219 0.0130

100 YEAR 24 HOUR SCS TYPE II STORM (103.2 mm) - XPSWMM OUTPUT
Link265 1.3470 116380.31 0.0000 0.9020 0.8708
0.2002 0.9101 0.0130
ORIFSWME 0.3094 26729.448 0.0000 0.9479 0.8990
0.1148 0.1589 0.0019
WEIR 0.8171 70600.415
FF Weir 0.9319 80519.739
OVF weir 0.2589 22371.848
forTpnd 0.9287 80243.714
FREE # 1 1.3470 116377.33
*===============================================================*
| Table E13. Channel losses(H), headwater depth (HW), tailwater |
| depth (TW), critical and normal depth (Yc and Yn). |
| Use this section for culvert comparisons |
*===============================================================*
Conduit Maximum Head Friction Critical Normal
HW TW
Name Flow Loss Loss Depth Depth
Elevat Elevat
--------------- --------- --------- --------- --------- --------- ------
--- ---------
Link245 1.3824 0.0366 0.2324 0.6414 0.5451
56.2677 55.9941 Max Flow
Link246 1.3676 0.0373 0.8029 0.6378 0.5419
55.9552 55.1019 Max Flow
Link247 1.3606 0.0546 0.5017 0.6361 0.5403
54.2966 53.6605 Max Flow
Link248 1.3466 0.2375 0.0488 0.6327 0.5389
53.6605 53.3189 Max Flow
Link258 12.3686 0.0667 0.1285 1.6293 1.8024
53.6452 53.4193 Max Flow
Link259 13.6648 0.4060 0.3850 1.7135 1.9876
52.7720 51.8135 Max Flow
Link260 13.6783 0.1850 0.2142 1.7143 1.9870
50.8923 50.4527 Max Flow
Link261 13.6583 0.2566 0.0921 1.7130 1.9871
50.4526 50.0160 Max Flow
Link262 13.6457 0.1263 0.3554 1.7122 1.9817
49.9065 49.3924 Max Flow
Link263 15.5592 0.0777 0.5715 1.8275 2.4000
49.3923 48.6875 Max Flow
Link264 15.5597 0.0829 0.1139 1.8275 2.4000
47.0507 46.8275 Max Flow
Link265 15.5657 0.0951 0.4138 1.6057 1.2000
44.2257 43.7000 Max Flow
ORIFSWME 0.6802 0.0000 1.4306 4.2442 0.5195
57.9442 56.5165 Max Flow
*==========================================================*
| Table E13a. CULVERT ANALYSIS CLASSIFICATION, |
| and the time the culvert was in a particular |
| classification during the simulation. The time is |
| in minutes. The Dynamic Wave Equation is used for |

100 YEAR 24 HOUR SCS TYPE II STORM (103.2 mm) - XPSWMM OUTPUT
| all conduit analysis but the culvert flow classification |
| condition is based on the HW and TW depths. |
*==========================================================*
Mild Mild Steep Mild
Mild
Slope Slope TW Slope TW Slug Flow Slope
Slope
Critical D Control Insignf Outlet/ TW > D TW
<= D
Conduit Outlet Outlet Entrance Entrance Outlet
Outlet Outlet Inlet Inlet
Name Control Control Control Control Control
Control Control Control Configuration
--------------- --------- --------- --------- --------- --------- ------
--- --------- --------- -------------
Link245 0.0000 0.0000 1400.0000 0.0000 0.0000
0.0000 40.0000 0.0000 None
Link246 0.0000 0.0000 1440.0000 0.0000 0.0000
0.0000 0.0000 0.0000 None
Link247 0.0000 0.0000 1440.0000 0.0000 0.0000
0.0000 0.0000 0.0000 None
Link248 0.0000 0.0000 1380.0000 0.0000 0.0000
0.0000 60.0000 0.0000 None
Link258 420.0000 690.0000 30.0000 0.0000 0.0000
0.0000 300.0000 0.0000 None
Link259 600.0000 480.0000 60.0000 0.0000 0.0000
0.0000 300.0000 0.0000 None
Link260 440.0000 620.0000 60.0000 0.0000 0.0000
0.0000 320.0000 0.0000 None
Link261 510.0000 570.0000 60.0000 0.0000 0.0000
0.0000 300.0000 0.0000 None
Link262 0.0000 1060.0000 60.0000 0.0000 0.0000
0.0000 320.0000 0.0000 None
Link263 570.0000 330.0000 270.0000 0.0000 0.0000
0.0000 270.0000 0.0000 None
Link264 580.0000 510.0000 50.0000 0.0000 0.0000
0.0000 300.0000 0.0000 None
Link265 630.0000 710.0000 60.0000 0.0000 0.0000
0.0000 40.0000 0.0000 None
ORIFSWME 600.0000 50.0000 20.0000 0.0000 0.0000
0.0000 770.0000 0.0000 None
*=====================================*
| Kinematic Wave Approximations |
| Time in Minutes for Each Condition |
*=====================================*
Conduit Duration of Slope Super- Roll
Name Normal Flow Criteria Critical Waves
--------------- ----------- --------- --------- ---------
Link245 0.0000 0.0000 708.5000 0.0000
Link246 1.0510 1.3277 708.3571 0.0000
Link247 52.1467 52.9726 676.8373 0.0000

100 YEAR 24 HOUR SCS TYPE II STORM (103.2 mm) - XPSWMM OUTPUT
Link248 0.0000 0.0000 609.9780 0.0000
Link258 0.0000 5.0000 5.0000 0.0000
Link259 0.0000 25.0000 331.1224 0.0000
Link260 0.0000 197.0955 293.7500 0.0000
Link261 0.0000 0.0000 0.0000 0.0000
Link262 654.7619 1213.2111 5.3333 0.0000
Link263 0.0000 5.0000 21.1765 0.0000
Link264 0.0000 0.0000 24.1176 0.0000
Link265 0.0000 0.0000 24.9167 0.0000
ORIFSWME 0.0000 0.0000 0.0000 0.0000
*=========================================================*
| Table E15 - SPREADSHEET INFO LIST |
| Conduit Flow and Junction Depth Information for use in |
| spreadsheets. The maximum values in this table are the |
| true maximum values because they sample every time step.|
| The values in the review results may only be the |
| maximum of a subset of all the time steps in the run. |
| Note: These flows are only the flows in a single barrel.|
*=========================================================*
Conduit Maximum Total Maximum Maximum ##
Junction Invert Maximum
Name Flow Flow Velocity Volume ##
Name Elevation Elevation
(cms) (m^3) (m/s) (m^3) ##
(m) (m)
--------------- ---------- ---------- ---------- ---------- ##
---------------- --------- ---------
Link245 1.3855 2464.2007 2.7026 18.3859 ##
ESWM 53.7000 57.9543
Link246 1.3817 2465.1914 2.7379 39.0022 ##
MH1004 50.4600 52.8008
Link247 1.3795 2457.7931 2.2691 64.4277 ##
STLBSN 55.0000 59.1616
Link248 1.3752 2461.7835 2.0875 9.0957 ##
PLUG 55.7000 56.2678
Link258 12.5499 97316.4051 3.6499 124.7401 ##
MH1001 55.4000 55.9570
Link259 13.8612 99749.2598 3.4355 474.4532 ##
MH1002 53.7560 54.3008
Link260 13.8866 100105.7034 3.2403 330.2297 ##
MH1003 52.8800 53.6696
Link261 13.8873 100088.3258 3.5946 105.0459 ##
FORBAY 56.8000 58.9576
Link262 13.8979 100058.8372 3.2636 561.8943 ##
NODE 51.9000 53.6603
Link263 15.5760 116407.6346 3.9231 564.1025 ##
S1005 48.6500 50.9158
Link264 15.5764 116394.1300 4.0457 103.5064 ##
MH1006 48.3860 50.4712
Link265 15.6315 116380.3094 4.3380 152.7690 ##
MH1007 47.7000 49.9212

100 YEAR 24 HOUR SCS TYPE II STORM (103.2 mm) - XPSWMM OUTPUT
ORIFSWME 0.6804 26729.4483 3.1787 579.2198 ##
S1008 47.2950 49.3943
WEIR 11.8702 70600.4152 0.0000 0.0000 ##
MH1009 45.0800 47.0518
FF Weir 8.2816 80519.7394 0.0000 0.0000 ##
MH1010 42.6200 44.2339
OVF weir 9.9250 22371.8483 0.0000 0.0000 ##
HW 42.5000 43.7000
forTpnd 5.8799 80243.7143 0.0000 0.0000 ##
FREE # 1 15.6320 116377.3339 0.0000 0.0000 ##
*====================================================*
| Table E15a - SPREADSHEET REACH LIST |
| Peak flow and Total Flow listed by Reach or those |
| conduits or diversions having the same |
| upstream and downstream nodes. |
*====================================================*
Upstream Downstream Maximum Total
Node Node Flow Flow
(cms) (m^3)
--------------- ---------------- ---------- ---------
PLUG MH1001 1.3855 2464.2007
MH1001 MH1002 1.3817 2465.1914
MH1002 MH1003 1.3795 2457.7931
MH1003 MH1004 1.3752 2461.7835
NODE MH1004 12.5499 97316.4051
MH1004 S1005 13.8612 99749.2598
S1005 MH1006 13.8866 100105.703
MH1006 MH1007 13.8873 100088.326
MH1007 S1008 13.8979 100058.837
S1008 MH1009 15.5760 116407.635
MH1009 MH1010 15.5764 116394.130
MH1010 HW 15.6315 116380.309
ESWM NODE 12.5497 97329.8635
STLBSN FORBAY 8.2816 80519.7394
STLBSN ESWM 9.9250 22371.8483
FORBAY ESWM 5.8799 80243.7143
#########################################################
# Table E16. New Conduit Information Section #
# Conduit Invert (IE) Elevation and Conduit #
# Maximum Water Surface (WS) Elevations #
#########################################################
Conduit Name Upstream Node Downstream Node IE Up IE Dn
WS Up WS Dn Conduit Type
--------------- ---------------- ---------------- --------- --------- --
------- --------- -------------
Link245 PLUG MH1001 55.7000 55.4490
56.2678 55.9948 Circular
Link246 MH1001 MH1002 55.4000 54.5600
55.9570 55.1051 Circular

100 YEAR 24 HOUR SCS TYPE II STORM (103.2 mm) - XPSWMM OUTPUT
Link247 MH1002 MH1003 53.7560 52.9200
54.3008 53.6696 Circular
Link248 MH1003 MH1004 52.8800 52.7800
53.6696 53.3253 Circular
Link258 NODE MH1004 51.9000 51.7900
53.6603 53.4313 Circular
Link259 MH1004 S1005 50.4600 50.1000
52.8008 51.8262 Circular
Link260 S1005 MH1006 48.6500 48.4160
50.9158 50.4712 Circular
Link261 MH1006 MH1007 48.3860 48.3030
50.4712 50.0309 Circular
Link262 MH1007 S1008 47.7000 47.3040
49.9212 49.3943 Circular
Link263 S1008 MH1009 47.2950 46.8600
49.3943 48.6884 Circular
Link264 MH1009 MH1010 45.0800 45.0000
47.0518 46.8284 Circular
Link265 MH1010 HW 42.6200 42.5000
44.2339 43.7000 Rectangle
ORIFSWME ESWM NODE 56.0000 55.9970
57.9543 56.5165 Circ Orif
*========================================================================
=====*
| Table E18 - Junction Continuity Error. Division by Volume added
11/96 |
|
|
| Continuity Error = Net Flow + Beginning Volume - Ending Volume
|
| -------------------------------------------------
|
| Total Flow + (Beginning Volume + Ending Volume)/2
|
|
|
| Net Flow = Node Inflow - Node Outflow
|
| Total Flow = absolute (Inflow + Outflow)
|
| Intermediate column is a judgement on the node continuity error.
|
|
|
| Excellent < 1 percent Great 1 to 2 percent Good 2 to 5
percent |
| Fair 5 to 10 percent Poor 10 to 25 percent Bad 25 to 50
percent |
| Terrible > 50 percent
|

100 YEAR 24 HOUR SCS TYPE II STORM (103.2 mm) - XPSWMM OUTPUT
*========================================================================
=====*
Junction <------Continuity Error -------> Remaining
Beginning Net Flow Total Flow Failed to
Name Volume % of Node % of Inflow Volume
Volume Thru Node Thru Node Converge
--------------- -------- ---------- ---------- -------- -------
--- ---------- ---------- ---------
ESWM 3599.9873 1.4079 2.5667 47580.6378
27862.9545 23317.6707 217976.1912 0
MH1004 -3.3849 -0.0017 0.0024 27.7257
0.0000 24.3408 199527.4484 0
STLBSN 42.1524 0.0205 0.0301 3.8828
0.0000 46.0351 205817.9199 1
PLUG -2.5055 -0.0509 0.0018 0.0002
0.0000 -2.5053 4926.1480 0
MH1001 -1.3449 -0.0273 0.0010 0.0008
0.0000 -1.3441 4929.3921 0
MH1002 7.1388 0.1450 0.0051 0.0012
0.0000 7.1400 4922.9846 0
MH1003 -3.7822 -0.0769 0.0027 0.0007
0.0000 -3.7815 4919.5766 0
FORBAY 60.4010 0.0372 0.0431 1676.3144
1478.3509 258.3645 160763.4538 0
NODE -273.4288 -0.1404 0.1949 284.2118
0.0000 10.7830 194646.2686 0
S1005 1.9934 0.0010 0.0014 35.0538
0.0000 37.0473 200256.0711 0
MH1006 -3.8770 -0.0019 0.0028 18.8661
0.0000 14.9892 200194.0291 0
MH1007 -1.2340 -0.0006 0.0009 27.8054
0.0000 26.5713 200147.1630 0
S1008 37.8283 0.0162 0.0270 47.5701
0.0000 85.3983 232905.4897 0
MH1009 -19.2638 -0.0083 0.0137 29.7936
0.0000 10.5299 232801.7646 0
MH1010 -11.8633 -0.0051 0.0085 14.2584
0.0000 2.3951 232774.4393 0
HW -9.2232 -0.0040 0.0066 9.5245
0.0000 0.3012 232757.6432 0
The total continuity error was 3419.6 cubic meters
The remaining total volume was 49756. cubic meters
Your mean node continuity error was Excellent
Your worst node continuity error was Good
*===================================================*
| Table E19 - Junction Inflow & Outflow Listing |
| Units are either ft^3 or m^3 |
| depending on the units in your model.|
*===================================================*

100 YEAR 24 HOUR SCS TYPE II STORM (103.2 mm) - XPSWMM OUTPUT
Constant User Interface DWF
Inflow RNF Layer Inflow
Junction Inflow Inflow Inflow Inlow
through Inflow Outflow Evaporation from
Name to Node to Node to Node to Node
Outfall to Node from Node from Node 2D Layer
--------------- ---------- ----------- ----------- ----------- ----
------- ----------- ----------- ----------- -----------
ESWM 0.0000 18029.6000 0.0000 0.0000
0.0000 0.0000 0.0000 0.0000 0.0000
STLBSN 0.0000 102992.3000 0.0000 0.0000
0.0000 0.0000 0.0000 0.0000 0.0000
PLUG 0.0000 2461.3471 0.0000 0.0000
0.0000 0.0000 -0.1184 0.0000 0.0000
S1005 0.0000 401.2471 0.0000 0.0000
0.0000 0.0000 0.0000 0.0000 0.0000
S1008 0.0000 16438.5529 0.0000 0.0000
0.0000 0.0000 0.0000 0.0000 0.0000
HW 0.0000 0.0000 0.0000 0.0000
0.0000 0.0000 116377.3339 0.0000 0.0000
*=====================================================*
| Table E20 - Junction Flooding and Volume Listing. |
| The maximum volume is the total volume |
| in the node including the volume in the |
| flooded storage area. This is the max |
| volume at any time. The volume in the |
| flooded storage area is the total volume|
| above the ground elevation, where the |
| flooded pond storage area starts. |
| The fourth column is instantaneous, the fifth is the|
| sum of the flooded volume over the entire simulation|
| Units are either ft^3 or m^3 depending on the units.|
*=====================================================*
Out of
Passed to 2D cell
1D-System OR
Volume Stored
Junction Surcharged Flooded (Flooded Maximum in
allowed Flood
Name Time (min) Time(min) Volume) Volume Pond
of 1D-System
--------------- ---------- --------- --------- --------- ----
-------------
ESWM 1440.0000 0.0000 0.0000 65220.0092
0.0000
MH1004 0.0000 0.0000 0.0000 2.8558
0.0000
STLBSN 1430.0000 0.0000 0.0000 5.0771
0.0000
PLUG 0.0000 0.0000 0.0000 0.6927
0.0000

100 YEAR 24 HOUR SCS TYPE II STORM (103.2 mm) - XPSWMM OUTPUT
MH1001 0.0000 0.0000 0.0000 0.6796
0.0000
MH1002 0.0000 0.0000 0.0000 0.6647
0.0000
MH1003 0.0000 0.0000 0.0000 0.9634
0.0000
FORBAY 1440.0000 0.0000 0.0000 3315.7807
0.0000
NODE 0.0000 0.0000 0.0000 2.1476
0.0000
S1005 0.0000 0.0000 0.0000 2.7643
0.0000
MH1006 0.0000 0.0000 0.0000 2.5439
0.0000
MH1007 0.0000 0.0000 0.0000 2.7098
0.0000
S1008 0.0000 0.0000 0.0000 2.5612
0.0000
MH1009 0.0000 0.0000 0.0000 2.4055
0.0000
MH1010 0.0000 0.0000 0.0000 1.9702
0.0000
HW 0.0000 0.0000 0.0000 1.4640
0.0000
*==================================*
| Simulation Specific Information |
*==================================*
Number of Input Conduits.......... 12 Number of Simulated
Conduits...... 18
Number of Natural Channels........ 0 Number of
Junctions............... 16
Number of Storage Junctions....... 2 Number of
Weirs................... 4
Number of Orifices................ 1 Number of
Pumps................... 0
Number of Free Outfalls........... 1 Number of Tide Gate
Outfalls...... 0
*=========================================================*
| Average % Change in Junction or Conduit is defined as: |
| Conduit % Change ==> 100.0 ( Q(n+1) - Q(n) ) / Qfull |
| Junction % Change ==> 100.0 ( Y(n+1) - Y(n) ) / Yfull |
*=========================================================*
The Conduit with the largest average change was..FF Weir with
0.000 percent
The Junction with the largest average change was.MH1004 with
0.046 percent
The Conduit with the largest sinuosity was.......Link265 with
4.139
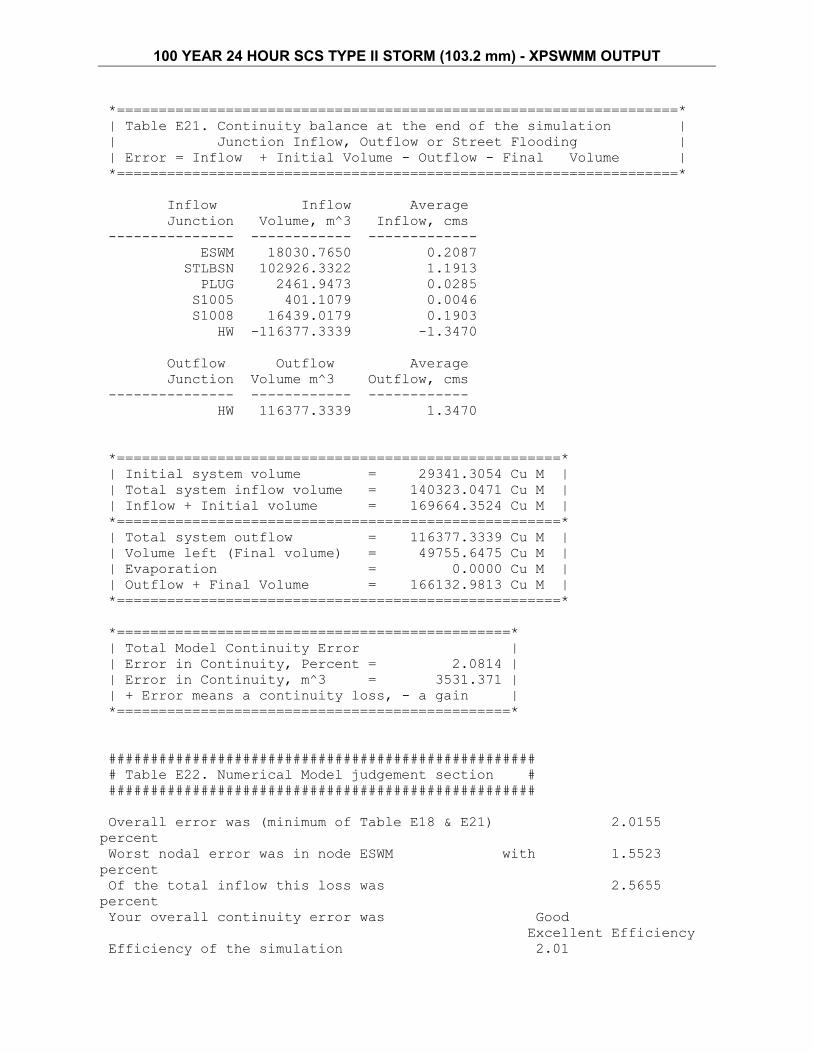
100 YEAR 24 HOUR SCS TYPE II STORM (103.2 mm) - XPSWMM OUTPUT
*===================================================================*
| Table E21. Continuity balance at the end of the simulation |
| Junction Inflow, Outflow or Street Flooding |
| Error = Inflow + Initial Volume - Outflow - Final Volume |
*===================================================================*
Inflow Inflow Average
Junction Volume, m^3 Inflow, cms
--------------- ------------ -------------
ESWM 18030.7650 0.2087
STLBSN 102926.3322 1.1913
PLUG 2461.9473 0.0285
S1005 401.1079 0.0046
S1008 16439.0179 0.1903
HW -116377.3339 -1.3470
Outflow Outflow Average
Junction Volume m^3 Outflow, cms
--------------- ------------ ------------
HW 116377.3339 1.3470
*=====================================================*
| Initial system volume = 29341.3054 Cu M |
| Total system inflow volume = 140323.0471 Cu M |
| Inflow + Initial volume = 169664.3524 Cu M |
*=====================================================*
| Total system outflow = 116377.3339 Cu M |
| Volume left (Final volume) = 49755.6475 Cu M |
| Evaporation = 0.0000 Cu M |
| Outflow + Final Volume = 166132.9813 Cu M |
*=====================================================*
*===============================================*
| Total Model Continuity Error |
| Error in Continuity, Percent = 2.0814 |
| Error in Continuity, m^3 = 3531.371 |
| + Error means a continuity loss, - a gain |
*===============================================*
###################################################
# Table E22. Numerical Model judgement section #
###################################################
Overall error was (minimum of Table E18 & E21) 2.0155
percent
Worst nodal error was in node ESWM with 1.5523
percent
Of the total inflow this loss was 2.5655
percent
Your overall continuity error was Good
Excellent Efficiency
Efficiency of the simulation 2.01

100 YEAR 24 HOUR SCS TYPE II STORM (103.2 mm) - XPSWMM OUTPUT
Most Number of Non Convergences at one Node 1.
Total Number Non Convergences at all Nodes 1.
Total Number of Nodes with Non Convergences 1.
===> Hydraulic model simulation ended normally.
===> XP-SWMM Simulation ended normally.
===> Your input file was named : D:\38298-PH1A Rockcliffe\2016-
01\SWMF\rev-2016-02\38298-ESWM-100scs.DAT
===> Your output file was named : D:\38298-PH1A Rockcliffe\2016-
01\SWMF\rev-2016-02\38298-ESWM-100scs.out
*==============================================================*
| SWMM Simulation Date and Time Summary |
*==============================================================*
| Starting Date... February 1, 2016 Time... 11:31:37:33 |
| Ending Date... February 1, 2016 Time... 11:31:38:90 |
| Elapsed Time... 0.02617 minutes or 1.57000 seconds |
*==============================================================*
J:\38298-CFBRockvliffe\5.2 Reports\5.2.3 SWM\EASTERN POND DESIGN BRIEF\2016-02-4th Sub\38298-100yr XPSWMM output-2016-02-.docx
A-2
Appendix B
Water Quality, Sediment Forebay, and Stilling Basin Calculations

Water Quality Volume Calculations for Eastern Stormwater Facility
Stormwater Management Facility Sizing The Stormwater Management Facility is being designed as a wet pond at an Enhanced Level of Protection. Drainage area = 161.46 ha Total imperviousness ratio = 63% From MOE Stormwater Management Planning and Design Manual, March 2003. p. 3-10:
Protection Level SWMP Type
Storage Volume (m3/ha) for Impervious Level
55 % 70 %
Enhanced 80% long-term S.S. removal
Wet Pond 190 225
Total storage volume for wet pond:
Y3 = Y2+(X3-X2)[(Y2-Y1)/(X2-X1)] = 190 + (225 – 190)[(63 – 55)/(70 – 55)] = 208.7 m3/ha
An imperviousness ratio of 66% corresponds to a total storage volume of 209 m3/ha. If extended detention = 40 m3/ha Then permanent storage = (209 m3/ha – 40 m3/ha) = 169 m3/ha Therefore: Permanent storage volume = 169 m3/ha x 161.46 ha = 27286.74 m3 = 2.73ha-m Extended detention volume = 40 m3/ha x 161.46 ha = 6458.40 m3 = 0.65 ha-m
J:\38298-CFBRockvliffe\5.7 Calculations\5.7.4 SWM\Eastern SWM Design-Ph1A\2015-11 - 2nd Submission\Supporting Calculations\WTRwaterquality2015-11-09.docx
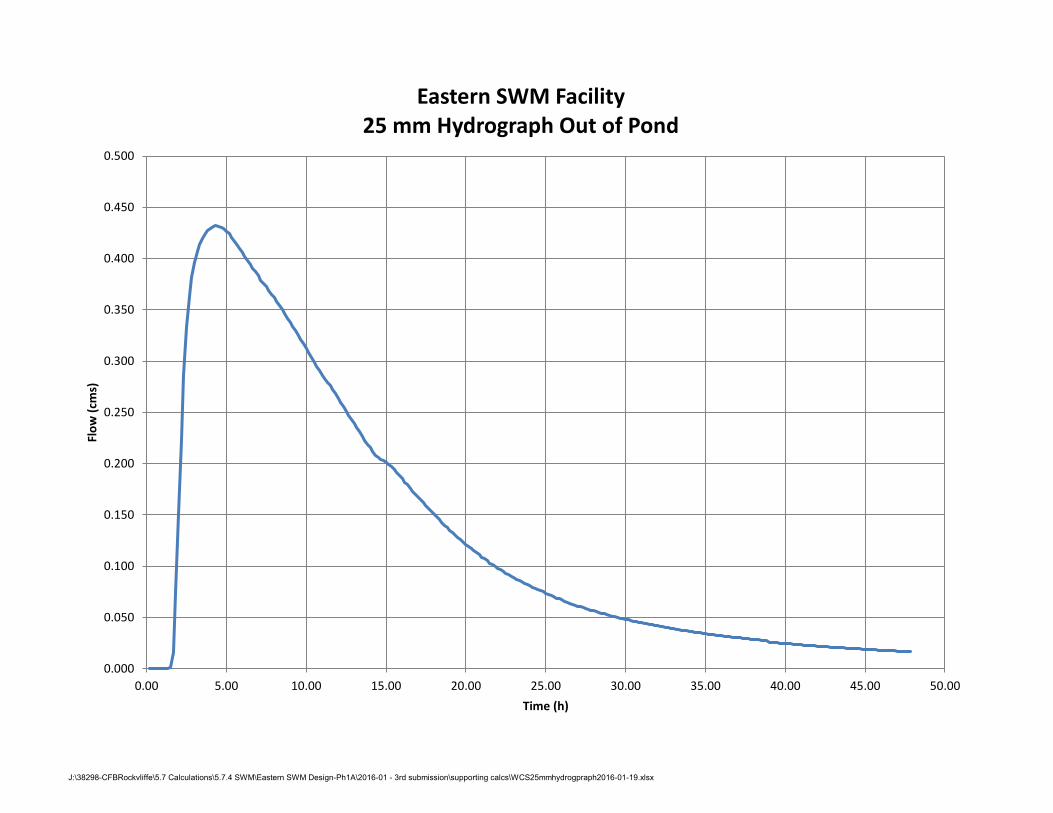
J:\38298-CFBRockvliffe\5.7 Calculations\5.7.4 SWM\Eastern SWM Design-Ph1A\2016-01 - 3rd submission\supporting calcs\WCS25mmhydrogpraph2016-01-19.xlsx
0.000
0.050
0.100
0.150
0.200
0.250
0.300
0.350
0.400
0.450
0.500
0.00 5.00 10.00 15.00 20.00 25.00 30.00 35.00 40.00 45.00 50.00
Flo
w (
cms)
Time (h)
Eastern SWM Facility25 mm Hydrograph Out of Pond

ROCKCLIFFE - EASTERN STORMWATER FACILITY SEDIMENT FOREBAY CALCULATIONS
The following is the calculation to support the sizing of the sediment forebays for the Rockcliffe - Eastern Stormwater Facility, based on the MOE Stormwater Management Planning and Design Manual (March 2003). Dispersion Length (Equation 4.6)
fdV
QDist
8
where Dist = length of dispersion (m) Q = inlet flowrate (cms) d = depth of the permanent pool in the forebay (m)
Vf = desired velocity in the forebay (m/s) Forebay Settling Length (Equation 4.5)
s
p
V
rQDist
where Dist = forebay length (m) r = length-to-width ratio of forebay Qp = peak flow rate from the pond during design quality storm (cms) Vs = settling velocity (0.0003 m/s)
SEDIMENT FOREBAY
Forebay designed: 88.60 m long, 24.45 m wide
Dispersion Length Calculation
Inlet flowrate into sediment forebay (100 yr 24 hr SCS Type II OSDG - XPSWMM): 5.94 cms
Depth of permanent pool in forebay: 58.96 – 56.80 m = 2.16 m
)5.0(07.2
)94.5(8Dist = 44.00 m
Forebay Settling Length
Peak flow rate during quality storm: 0.43 cms
Desired length-to-width ratio of forebay: 88.60 / 24.45 = 3.62
0003.0
)43.0(62.3Dist = 72.03 m
Therefore, the dispersion length governs in terms of forebay sizing. The design length of 88.60 m exceeds the design requirement of 72.03 m.

SETTLING VELOCITY
Average Velocity
Vavg = Q / A
The average bottom width is 11.45 m.
Where A = [(11.45 + 24.45) / 2] * [58.96 - 56.8] = 38.77 m2
Q = 5.94 cms (100 year SCS)
Vavg = 5.94 cms / 38.77 m2
Vavg = 0.15 m/s
This velocity is at the recommended maximum velocity of 0.15 m/s in MOE Stormwater Management Planning and Design Manual, p. 4-56.
J:\38298-CFBRockvliffe\5.7 Calculations\5.7.4 SWM\Eastern SWM Design-Ph1A\2016-01 - 3rd submission\supporting calcs\WTR-sedimentforebay-2016-01.doc


A-3
Appendix C
Sample Maintenance Checklist

AVALON SWM FACILITY MAINTENANCE INSPECTION SHEET DATE: _______________________ PG ___ OF ___
TIME: FIELD PERSONNEL:
WEATHER CONDITIONS:
□ PHOTOS TAKEN: YES□ NO□ IF YES, FILED HERE:
□ ACCESS ROADS □ ACCESS CONTROL GATE:
□ ROAD CONDITION:
□ VISIBLE DETERIORATION:
□ REQUIRED MAINTENANCE:
□ ADDITIONAL COMMENTS:
□ WESTERN FIRST FLUSH INLET □ CONCRETE STRUCTURE:
□ DEBRIS GRATE: □ SAFETY RAIL:
□ SLUICE GATE:
□ VISIBLE DETERIORATION:
□ REQUIRED MAINTENANCE:
□ ADDITIONAL COMMENTS:
□ WESTERN SEDIMENT FOREBAY
□ SEDIMENT ACCUMULATION:
□ DEBRIS:
□ EROSION/DETERIORATION:
□ REQUIRED MAINTENANCE:
□ ADDITIONAL COMMENTS:
□ EASTERN FIRST FLUSH INLET □ CONCRETE STRUCTURE:
□ DEBRIS GRATE: □ SAFETY RAIL:
□ SLUICE GATE:
□ VISIBLE DETERIORATION:
□ REQUIRED MAINTENANCE:
□ ADDITIONAL COMMENTS:

AVALON SWM FACILITY MAINTENANCE INSPECTION SHEET DATE: _______________________ PG ___ OF ___
□ EASTERN SEDIMENT FOREBAY
□ SEDIMENT ACCUMULATION:
□ DEBRIS:
□ EROSION/DETERIORATION:
□ REQUIRED MAINTENANCE:
□ ADDITIONAL COMMENTS:
□ OUTLET STRUCTURE
□ CONCRETE STRUCTURES:
□ SAFETY RAIL:
□ CONTROL WEIR:
□ CONTROL ORIFICE:
□ SLUICE GATE:
□ VISIBLE DETERIORATION:
□ REQUIRED MAINTENANCE:
□ ADDITIONAL COMMENTS:
MISCELLANEOUS ITEMS:
□ LANDSCAPING: □ TREES DAMAGED:
□ PROBLEM WITH WILDLIFE (BEAVER ACTIVITY):
□ IMMEDIATE REPAIRS REQUIRED: □ WHO CONTACTED:
□ MISSING EQUIPMENT:
□ HEALTH & SAFETY
COMMENTS:


