Embed Size (px)
Citation preview

Dynamics of the OH group and the electronic structure of liquid alcoholsSimon Schreck, Annette Pietzsch, Kristjan Kunnus, Brian Kennedy, Wilson Quevedo, Piter S. Miedema, PhilippeWernet, and Alexander Föhlisch Citation: Structural Dynamics 1, 054901 (2014); doi: 10.1063/1.4897981 View online: http://dx.doi.org/10.1063/1.4897981 View Table of Contents: http://scitation.aip.org/content/aip/journal/sdy/1/5?ver=pdfcov Published by the AIP Publishing

Dynamics of the OH group and the electronic structureof liquid alcohols
Simon Schreck,1,2,a) Annette Pietzsch,1 Kristjan Kunnus,1,2 Brian Kennedy,1
Wilson Quevedo,1 Piter S. Miedema,1 Philippe Wernet,1 andAlexander F€ohlisch1,2,b)
1Institute for Methods and Instrumentation for Synchrotron Radiation Research,Helmholtz-Zentrum Berlin f€ur Materialien und Energie GmbH, Albert-Einstein-Strasse 15,Berlin 12489, Germany2Institut f€ur Physik und Astronomie, Universit€at Potsdam, Karl-Liebknecht-Strasse 24/25,Potsdam 14476, Germany
(Received 11 July 2014; accepted 30 September 2014; published online 14 October 2014)
In resonant inelastic soft x-ray scattering (RIXS) from molecular and liquid sys-
tems, the interplay of ground state structural and core-excited state dynamical con-
tributions leads to complex spectral shapes that partially allow for ambiguous
interpretations. In this work, we dissect these contributions in oxygen K-edge
RIXS from liquid alcohols. We use the scattering into the electronic ground state as
an accurate measure of nuclear dynamics in the intermediate core-excited state of
the RIXS process. We determine the characteristic time in the core-excited state
until nuclear dynamics give a measurable contribution to the RIXS spectral profiles
to sdyn¼ 1.2 6 0.8 fs. By detuning the excitation energy below the absorption reso-
nance we reduce the effective scattering time below sdyn, and hence suppress these
dynamical contributions to a minimum. From the corresponding RIXS spectra of
liquid methanol, we retrieve the “dynamic-free” density of states and find that it is
described solely by the electronic states of the free methanol molecule. From this
and from the comparison of normal and deuterated methanol, we conclude that the
split peak structure found in the lone-pair emission region at non-resonant excita-
tion originates from dynamics in the O–H bond in the core-excited state. We find
no evidence that this split peak feature is a signature of distinct ground state struc-
tural complexes in liquid methanol. However, we demonstrate how changes in the
hydrogen bond coordination within the series of linear alcohols from methanol to
hexanol affect the split peak structure in the liquid alcohols. VC 2014 Author(s). Allarticle content, except where otherwise noted, is licensed under a CreativeCommons Attribution 3.0 Unported License. [http://dx.doi.org/10.1063/1.4897981]
I. INTRODUCTION
Soft x-ray spectroscopies are well-established electronic structure tools. Their ability to
probe local charge distributions in an element specific and symmetry resolved manner has been
demonstrated and exploited in numerous studies of molecules, solids, and surfaces to reveal
their structure and bonding as well as the dynamics of elementary chemical processes.1–3 In the
past decade, soft x-ray spectroscopies, furthermore, have been used increasingly to study the
structure of complex molecular and liquid systems. In particular, the fluctuating hydrogen bond
network in liquid water was investigated intensively.4–15
In x-ray emission (XE) spectroscopy and resonant inelastic x-ray scattering (RIXS) at the
oxygen K-edge of liquid water, a debate about ground state structural and core-excited state dy-
namical contributions to the measured spectra is ongoing.11,12,14,16,17 In particular, the origin of
a)Electronic mail: [email protected])Electronic mail: [email protected]
2329-7778/2014/1(5)/054901/14 VC Author(s) 20141, 054901-1
STRUCTURAL DYNAMICS 1, 054901 (2014)

a splitting in the region of the 1b1 lone-pair derived emission feature is controversially dis-
cussed. On one hand, the two split components have been assigned to two distinct structural
motifs, denoted as high and low density liquid water, which coexist in the liquid phase. In this
picture, the splitting is primarily an intrinsic ground state feature of liquid water and originates
from an energy shift of the oxygen 1s core level between the two structural motifs.11,14 Here,
contributions from nuclear dynamics in the intermediate core-excited state of the RIXS process
are found to mainly cause an asymmetric broadening of the lone-pair emission line.18 On the
other hand, the splitting was interpreted fully as a dynamical effect resulting from nuclear
motion in the intermediate state.12,16,17 In this picture, the splitting is not a ground state prop-
erty of liquid water but induced by the core level excitation. Both interpretations have been
supported and challenged18–23 and no consensus seems to be found.
In this debate, surprisingly less attention has been given to the liquid alcohols, which also
show a splitting in the lone-pair region of the oxygen K-edge RIXS spectra.24–27 So far,
Kashtanov et al.26 performed the most detailed RIXS study of liquid methanol. With the help
of density functional theory calculations they assigned the two split components in the lone-
pair region to hydrogen bonded rings and chains, respectively, with a length of six or eight
molecules, which should dominate the structure of liquid methanol. Recent high-level molecular
dynamics simulations28,29 are at variance with this interpretation, and suggest that liquid metha-
nol consists mainly of hydrogen bonded chains with less than seven molecules, which may link
to branched aggregates. The core-excited state dynamical contributions in RIXS from liquid
alcohols have so far not been studied in detail.
In this work, we dissect the ground state structural and core-excited state dynamical contri-
butions in RIXS from liquid alcohols. We present experimental RIXS spectra of liquid metha-
nol in its normal (CH3OH) as well as in its deuterated form (CD3OD) and analyze the spectral
changes as the excitation energy is tuned below the absorption resonance. The concept of
effective scattering time30 enables us to control the degree of nuclear dynamics in the interme-
diate core-excited state of the RIXS process. The vibrational progression of elastic scattering
into the electronic ground state (participator decay) serves as an “internal clock” to measure
the degree of nuclear dynamics. We determine the characteristic time in the core-excited state
until nuclear dynamics have a measurable contribution to the RIXS spectral profiles for liquid
methanol. We use an approximation to the generalized Kramers-Heisenberg scattering formal-
ism to model the strongly detuned RIXS spectra, where nuclear dynamics in the intermediate
state is suppressed to a minimum. This way we are able to extract the “dynamic-free” local
partial density of states (DOS) of liquid methanol and find that it is fully described by the elec-
tronic states of the free methanol molecule. From the comparison of normal and deuterated
methanol, we find evidence that the split peak structure in the liquid alcohols originates from
dynamics in the O–H bond in the core-excited state. We propose a mechanism based on quali-
tative potential energy curves of the hydrogen bond donating OH group that explains the for-
mation of the split peak structure. In the series of the liquid alcohols from methanol to hexanol
the hydrogen bond environment gradually changes and we show how this affects the split peak
structure.
II. EXPERIMENTAL
The experimental procedures are depicted schematically in Figure 1(a). We recorded the x-
ray absorption (XA) spectrum of liquid methanol in transmission mode using the specialized
sample holder described by Schreck et al.31 The measurements were performed at the dipole
beamline PM3 at the synchrotron radiation source BESSY II of the Helmholtz-Zentrum Berlin.
We measured RIXS spectra from a liquid microjet in vacuum using the setup described by
Kunnus et al.32 The setup uses a Grace XES 350 x-ray emission spectrometer, which is
mounted under 90� with respect to the incident x-ray beam, Figure 1(a). We used linearly
polarized x-rays with the polarization vector in the scattering plane. In addition, we used this
setup to measure total fluorescence yield (TFY) XA spectra from the liquid jet with a GaAsP
photodiode (Hamamatsu, model G-112704) for the alcohols from methanol to hexanol. The
054901-2 Schreck et al. Struct. Dyn. 1, 054901 (2014)

measurements were performed at beamlines U41-PGM and UE52-SGM at the synchrotron radi-
ation source BESSY II of the Helmholtz-Zentrum Berlin.
For energy calibration of the incident x-ray beam in the RIXS measurements we used the
sharp p* XA peak of liquid acetone at 531.5 eV.27 We calibrated the emission energy scale
using the elastically scattered light. The energy scale of the transmission mode XA spectrum
was aligned by overlapping it with the TFY XA spectrum of liquid methanol, which was
recorded in the same experimental run as the RIXS measurements.
Samples were purchased from Sigma-Aldrich, had a purity of 99.5% or higher and were
used as received. Deuterated methanol was handled in nitrogen atmosphere only.
III. RESULTS
A. XA and RIXS spectra from liquid methanol
In Figure 1(b), we present an overview of the experimental data from liquid methanol
(CH3OH). The oxygen K-edge XA spectrum measured in transmission mode is presented to-
gether with respective RIXS spectra for excitation energies tuned through the XA resonance.
The XA spectrum features a broad resonance between 534 and 544 eV with a maximum at
around 538 eV and a weak shoulder on the low energy flank around 535 eV. The shoulder origi-
nates from the O–H anti-bonding r* orbital, as was established by density functional theory cal-
culations and comparison to gas phase data.33 In the broad absorption maximum, the C–O r*
orbital as well as 3p type Rydberg states overlap.33
The RIXS spectra in Figure 1(b) agree with previously published data.24–26 However, the
data presented here exhibit significantly increased signal-to-noise ratio, a slightly enhanced
spectral resolution as well as a broader range of excitation energies as compared to all publica-
tions that are known to the authors.
The non-resonant XE spectrum at 550.9 eV excitation energy features three well-separated
emission lines at around 515, 521, and 523 eV emission energy as well as the split peak struc-
ture mentioned in the introduction at around 527 eV emission energy.
As the incident photon energy is tuned to resonant excitations and consequently detuned
below resonance, the main changes in the RIXS spectra occur in the split peak structure. This
FIG. 1. X-ray absorption and emission spectroscopy (XAS and XES) as well as RIXS from liquid methanol: (a) Illustration
of the experimental procedures for XAS in transmission mode and XES/RIXS from a liquid jet. The simplified energy
scheme shows how in the one electron picture XAS and XES/RIXS probe the unoccupied and occupied DOS. (b)
Experimental XA spectrum of liquid methanol (CH3OH) together with the corresponding RIXS spectra for excitation ener-
gies tuned through the XA resonance. The RIXS spectra are offset by their respective excitation energy. Grey lines indicate
the excitation energies in the XA spectrum.
054901-3 Schreck et al. Struct. Dyn. 1, 054901 (2014)

structure collapses into a single peak and at the same time reveals a shoulder on its low energy
flank around 525.5 eV (see also Figure 2(b)). After close inspection, this weak shoulder can
also be identified in the non-resonant spectrum. All emission features undergo Raman disper-
sion, as the excitation energy is tuned below resonance. For strongly detuned excitation ener-
gies (below 533.3 eV) the emission lines get significantly broadened and the RIXS spectra turn
into one broad feature with weak substructure. We analyze this effect in detail in Sec. III C.
We observe elastic scattering, where the emission energy equals the excitation energy, for
incident photon energies below 536.3 eV. For higher excitation energies, the probability for the
excited electron to fill the core hole gets relatively small and we detect no elastic scattering
(not shown in Figure 1(b)). For the lowest excitation energies, the elastic peak is symmetric,
whereas it develops a low energy tail for higher excitation energies. This low energy tail is
related to nuclear dynamics in the intermediate state of the RIXS process, and we analyze this
in detail in Sec. III B.
B. Vibrational progression as a measure for nuclear dynamics in the core-excited state
We now concentrate on excitation energies in the low energy flank of the XA resonance
between 533.1 and 536.3 eV, where the major changes in the RIXS spectra occur. In Figure 2,
we present a zoom into the corresponding region of the XA spectrum (Figure 2(a)), the split
peak emission feature (Figure 2(b)) as well as the elastic scattering (Figure 2(c)).
We subdivide the spectral intensity around the elastic scattering (Figure 2(c)) into contribu-
tions from three distinctly different decay processes of the core-excited state. These decay proc-
esses are depicted schematically in Figure 2(e). First, the high-energy tail of decay into
electronic valence-excited states extends into the region of elastic scattering (light blue area in
Figure 2(c)). We model this intensity by interpolation between the high energy flank of the split
peak feature and the zero intensity at emission energies higher than the excitation energy.34
Second, there is purely elastic scattering at zero energy loss (green area in Figure 2(c)), which
corresponds to decay into the vibrational and electronic ground state. This intensity is modeled
by fitting a symmetric Gaussian peak centered at zero energy loss to the high energy flank of
the elastic scattering. The remaining spectral intensity (orange area in Figure 2(c)) corresponds
FIG. 2. Excitation energy detuning and control of nuclear dynamics in RIXS. (a) Low energy flank of the XA resonance.
(b) Split peak emission feature of the RIXS spectra excited in the XA flank and below the resonance. (c) Region of elastic
scattering for excitation in the XA flank and below the resonance. The spectral intensity is subdivided into the three decay
channels from the core-excited state, which are depicted in (e) of the figure. See main text for details. The experimental
data in (a)-(c) are the same as in Figure 1. (d) Probability for nuclear dynamics in the core-excited state as determined from
the intensities in (c). See main text for details. (e) Schematic illustration of how nuclear dynamics are manifested in the
vibrational progression.
054901-4 Schreck et al. Struct. Dyn. 1, 054901 (2014)

to decay into vibrational excited states of the electronic ground state, the vibrational progres-
sion. At very high spectral resolution, individual vibrational states are observed in the progres-
sion also for liquid systems.15,27,35 This is not the case in the present study. However, we
observe a significant decrease of intensity in the progression when the excitation energy is
detuned below the absorption resonance.
The vibrational progression and its collapse for detuned excitation energies are connected
to nuclear dynamics in the intermediate core-excited state of the RIXS process and to the con-
cept of the effective scattering time of RIXS.30,36,37 In a quantum mechanical picture, nuclear
dynamics in the intermediate state correspond to the propagation of the nuclear wave packet on
the core-excited state potential. The XA process projects the electronic and vibrational ground
state nuclear wave packet onto the core-excited state potential (Figure 2(e)). The ground state
wave packet will propagate on the excited state potential, since it is, in general, not an
Eigenstate of this potential. The propagated wave packet reaches Franck-Condon overlap with
vibrational excited states of the electronic ground state, and hence decay into these vibrational
excited states is possible. This gives rise to the vibrational progression. On the other hand, the
purely elastic scattering corresponds to the case, where the nuclear wave packet has not propa-
gated significantly on the excited state potential. That is, it results from decays immediately af-
ter the XA process.
The concept of effective scattering time determines for Raman-type scattering processes,
like RIXS, the time the system spends in the intermediate state. This time shortens upon detun-
ing the excitation energy from the scattering resonance and is given by30
sscat ¼1ffiffiffiffiffiffiffiffiffiffiffiffiffiffiffiffiffiffi
X2 þ C2ch
q : (1)
Here, X is the detuning and Cch is the core level lifetime broadening, which is directly con-
nected to the natural core hole lifetime sch¼ 1/Cch. Atomic units are used. The oxygen 1s core
hole lifetime is �4 fs.38
For a shortened effective scattering time, the nuclear wave packet has less time to propa-
gate on the excited state potential, and hence reaches overlap with less vibrational excited states
of the electronic ground state; the vibrational progression collapses.
We now use the relative intensity of the vibrational progression as a measure for the degree
of nuclear dynamics in the core-excited state. We define the probability Pdyn that the core-
excited state decays after significant nuclear dynamics give rise to vibrational progression in
the spectra. This probability can be determined from the experimental data in Figure 2(c) for
each excitation energy
Pdyn ¼Avib
Avib þ Aelast
: (2)
Avib corresponds to the spectral intensity of the vibrational progression (orange area in
Figure 2(c)) and Aelast to the elastic scattering (green area in Figure 2(c)).
We depict Pdyn as a function of the excitation energy in Figure 2(d). Comparing the trend
of Pdyn to the evolution of the split peak structure in Figure 2(b), we find that the splitting starts
to appear at excitation energies, where also Pdyn gets significant. This is a first indicator that
the split peak structure in liquid methanol is related to nuclear dynamics in the intermediate
core-excited state of the RIXS process.
Within a “core hole clock”39–41 type of approach, we can now retrieve the characteristic
time sdyn until dynamics in the core-excited state have a measurable impact on the RIXS spec-
tral profiles. For simplicity, we assume an exponential rate Cdyn¼ 1/sdyn that describes nuclear
dynamics in the excited state. This is a good approximation as long as sdyn and sscat are on the
same order of magnitude (see Br€uhwiler et al.41 as well as references therein for a detailed dis-
cussion). Pdyn is connected to Cdyn and to the scattering rate (core hole decay) Cscat¼ 1/sscat by
054901-5 Schreck et al. Struct. Dyn. 1, 054901 (2014)

Pdyn ¼Cdyn
Cscat þ Cdyn
: (3)
The scattering rate Cscat depends on the detuning X (Eq. (1)) and hence on the excitation
energy with respect to the resonance energy. A precise definition of the position of the lowest
scattering resonance is difficult for the broad XA spectrum in liquid methanol. However, the
resonance will be slightly below 535 eV close to the shoulder on the XA flank. For these excita-
tion energies, Pdyn has its maximum and is almost constant. For an isolated scattering resonance,
Pdyn should peak at the resonance position. We determine sdyn¼ 1.2 6 0.8 fs (see also Ref. 34)
using a scattering rate on resonance of Cscat¼ 1/4 fs–1 and an averaged value for Pdyn from excita-
tion energies around the resonance position (534.6, 534.8, and 535.0 eV). The relatively big uncer-
tainty in sdyn can be reduced by higher signal-to-noise ratio as well as by higher spectral resolu-
tion. Resolving single vibrational peaks in the vibrational progression would, e.g., allow for a
more accurate separation of purely elastic scattering and the vibrational progression.
We note that sdyn should not be associated with a dissociation time that characterizes the
breaking of a molecular bond. It rather quantifies the time after which nuclear dynamics in the
core-excited state have a measurable contribution to the RIXS spectral profiles. In that sense,
sdyn may decrease for higher spectral resolution, but the value determined here provides an
upper limit. Dissociation times were determined by other groups40,42 for different molecular
systems from Auger electron spectroscopy using a similar approach.
C. “Dynamic-free” DOS of liquid methanol
For a detuning of X� 1.5 eV, which corresponds to the lowest excitation energy used in
this work (533.1 eV), the effective scattering time is reduced to 0.2 fs. At this excitation energy
contributions from nuclear dynamics in the intermediate state are basically absent, which can
be seen directly from the absence of the orange shaded intensity in the corresponding spectrum
in Figure 2(c). Furthermore, the selectivity in the excitation process is lost at such detuned exci-
tation energies, since the excitation is into the Lorentzian tails of all excited states with almost
the same probability.43 This clears out resonance effects such as the enhancement of particular
chemical species. Accordingly, the strongly detuned RIXS spectra should give the best (free of
effects from nuclear dynamics and resonant excitation) measure of the local partial (oxygen p-
type) occupied DOS. However, a direct detailed analysis of these spectra is hindered due to the
broadening introduced at detuned excitation energies. This broadening has been observed before
in different systems and the corresponding spectra can be modeled by
IRIXS Ein;Eoutð Þ /ðEloss
0
dEe
qu Eeð Þqo Eloss � Eeð Þ
X� Eeð Þ2 þ Cch
2
� �2: (4)
This formula is based on the generalized Kramers-Heisenberg scattering formalism intro-
duced by Tulkki and Aberg.44,45 Jim�enez-Mier et al.46 followed an approach from Cowan47 and
were the first who presented Eq. (4) in the form used here. Other groups used a Green’s func-
tion approach48 or considered energy conservation in the scattering process49 to develop a very
similar expression.
In Eq. (4), Ein and Eout are the energy of the incident (excitation) and outgoing (emission)
photon. The integration is over all possible energies Ee of the excited electron in the intermedi-
ate state, which can take values between zero and Eloss¼Ein � Eout. X is the detuning of the
incident energy from the resonance energy Eres: X¼Ein � Eres. Cch is the natural core level
lifetime broadening. The spectral shape resulting from Eq. (4) is mostly determined by the
occupied (qo) and unoccupied (qu) local partial DOS and the detuning X. For excitation ener-
gies below resonance (X< 0), the Lorentzian in Eq. (4) has its maximum at negative Ee, i.e.,
outside the integration boundaries. For strong detuning (X � –Cch) only the Lorentzian tail is
054901-6 Schreck et al. Struct. Dyn. 1, 054901 (2014)
included in the integration, and Eq. (4) turns into a convolution of occupied and unoccupied
DOS.
In the hard x-ray regime, the approach from Tulkki and Aberg44,45 is used as an established
technique to retrieve (single shot) XA spectra from detuned RIXS spectra for, e.g., time
resolved XA spectroscopy.50–53 In the soft x-ray regime, the model was applied to describe
RIXS spectra of metals excited above and below threshold.43,49,54
We will use Eq. (4) to retrieve the “dynamic-free” occupied DOS from the RIXS spectra at
strong detuning. For this, we approximate the unoccupied DOS qu by the measured XA spec-
trum. To account for the core hole induced shift of the XA spectrum, we align qo and qu rela-
tive to each other.34 For the comparably broad and featureless XA spectrum of liquid methanol
core hole induced effects should mainly cause an energy shift and affect the shape of the spec-
trum marginally.1,55
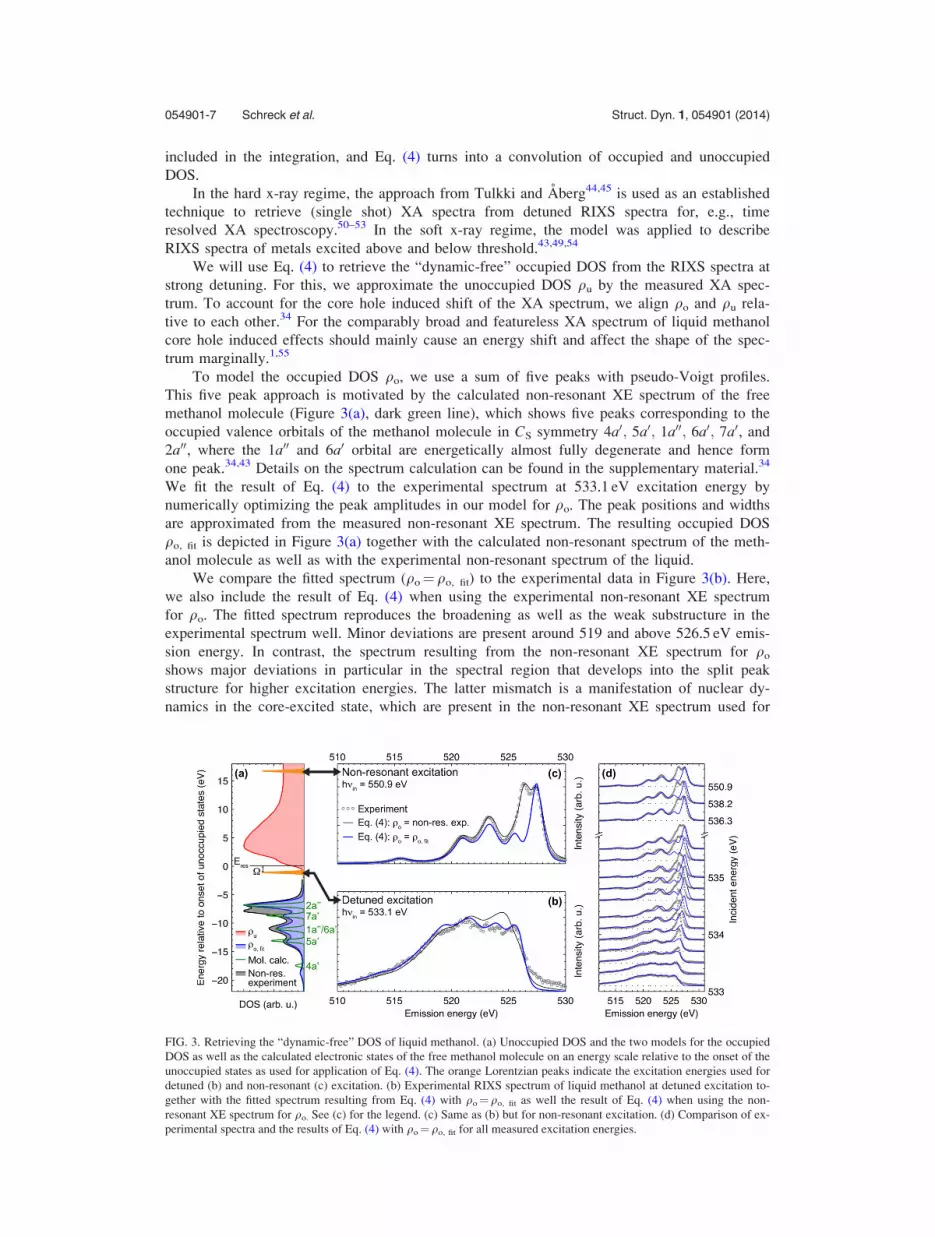
To model the occupied DOS qo, we use a sum of five peaks with pseudo-Voigt profiles.
This five peak approach is motivated by the calculated non-resonant XE spectrum of the free
methanol molecule (Figure 3(a), dark green line), which shows five peaks corresponding to the
occupied valence orbitals of the methanol molecule in CS symmetry 4a0; 5a0; 1a00; 6a0; 7a0, and
2a00, where the 1a00 and 6a0 orbital are energetically almost fully degenerate and hence form
one peak.34,43 Details on the spectrum calculation can be found in the supplementary material.34
We fit the result of Eq. (4) to the experimental spectrum at 533.1 eV excitation energy by
numerically optimizing the peak amplitudes in our model for qo. The peak positions and widths
are approximated from the measured non-resonant XE spectrum. The resulting occupied DOS
qo, fit is depicted in Figure 3(a) together with the calculated non-resonant spectrum of the meth-
anol molecule as well as with the experimental non-resonant spectrum of the liquid.
We compare the fitted spectrum (qo¼qo, fit) to the experimental data in Figure 3(b). Here,
we also include the result of Eq. (4) when using the experimental non-resonant XE spectrum
for qo. The fitted spectrum reproduces the broadening as well as the weak substructure in the
experimental spectrum well. Minor deviations are present around 519 and above 526.5 eV emis-
sion energy. In contrast, the spectrum resulting from the non-resonant XE spectrum for qo
shows major deviations in particular in the spectral region that develops into the split peak
structure for higher excitation energies. The latter mismatch is a manifestation of nuclear dy-
namics in the core-excited state, which are present in the non-resonant XE spectrum used for
FIG. 3. Retrieving the “dynamic-free” DOS of liquid methanol. (a) Unoccupied DOS and the two models for the occupied
DOS as well as the calculated electronic states of the free methanol molecule on an energy scale relative to the onset of the
unoccupied states as used for application of Eq. (4). The orange Lorentzian peaks indicate the excitation energies used for
detuned (b) and non-resonant (c) excitation. (b) Experimental RIXS spectrum of liquid methanol at detuned excitation to-
gether with the fitted spectrum resulting from Eq. (4) with qo¼qo, fit as well the result of Eq. (4) when using the non-
resonant XE spectrum for qo. See (c) for the legend. (c) Same as (b) but for non-resonant excitation. (d) Comparison of ex-
perimental spectra and the results of Eq. (4) with qo¼qo, fit for all measured excitation energies.
054901-7 Schreck et al. Struct. Dyn. 1, 054901 (2014)

qo but suppressed in the experimental spectrum at detuned excitation. We can therefore, on the
other hand, denote qo, fit that resulted from the fit to the detuned spectrum as the occupied
“dynamic-free” DOS of liquid methanol. This “dynamic-free” DOS is solely based on the elec-
tronic states of the free methanol molecule. There is no need for additional states in qo, fit to
account for, e.g., distinct hydrogen bonded structural complexes in the liquid phase.
In Figure 3(c), we depict the results of Eq. (4) for the two approaches for qo together with
the experimental data, but now for non-resonant excitation. In this case, the Lorentzian in Eq.
(4) has its maximum inside the integration boundaries, and therefore, the unoccupied DOS qu
has only minor impact on the resulting spectrum. Consistently, the spectrum resulting from the
non-resonant XE spectrum for qo reproduces the experimental data at non-resonant excitation
almost fully. The spectrum resulting from the “dynamic-free” DOS qo, fit is lacking the domi-
nant split peak structure of the experimental spectrum. This confirms our tentative assignment
from Sec. III B that the split peak structure is mostly related to nuclear dynamics in the inter-
mediate state.
Finally, we apply Eq. (4) to all measured excitation energies using qo, fit for the occupied
DOS. We compare the results to the experimental data in Figure 3(d). The modeled spectra
reproduce the general trend of Raman dispersion up to the resonance position and development
of sharp spectral features for excitations above the resonance. However, for excitation energies,
where Pdyn becomes significant (around 533.7 eV—compare Figure 2(d)), the modeled spectra
clearly deviate from the experimental data. Most significant is the fast increase of the spectral
component that develops into the low energy split peak component as well as an energy shift
of the complete spectrum. For excitations around the O–H r* shoulder the intermediate state
has anti-bonding character with respect to the O–H bond. This enhances nuclear dynamics and
their effect on the RIXS spectra. In addition, screening effects23,56,57 from the excited electron
result in energy shifts (spectator shift) for resonant excitation energies.
D. Normal vs. deuterated methanol
To further investigate the impact of dynamics in the O–H(D) bond on the RIXS spectral
profiles, we compare now normal and deuterated methanol (CH3OH and CD3OD). For the
heavier isotope, these dynamics will be significantly slower.
In Figure 4, we present RIXS spectra of the two methanol forms for three characteristic ex-
citation energies: 535.3 eV (low energy flank), 538.3 eV (absorption maximum), and 549.8 eV
(non-resonant). We find a clear difference in the split peak structure between the two isotopes.
The low energy component is significantly reduced for deuterated methanol. The remaining
spectral features seem to be not sensitive to isotope substitution. This suggests that dynamics in
the O–H(D) bond are the main response to the core-excitation and are responsible for formation
of the split peak structure.
IV. DISCUSSION
A. Dynamics of the O–H bond and formation of the split peak structure
In this section, we propose a scenario that explains the formation of the split peak structure
due to dynamics in the O–H bond of the hydrogen bond donating OH group in the core-excited
state.
In Figure 5, we present qualitative one dimensional potential energy curves of a hydrogen
bond donating OH group along the O–H � � � O hydrogen bond coordinate. We depict those
states involved in the formation of the split peak structure at non-resonant excitation (ioniza-
tion): initial ground state, intermediate core-ionized state, and the 2a00 lone-pair-ionized final
state. We limit the discussion here to the 2a00 lone-pair-ionized final state, since this state gives
the biggest contribution to the split peak structure. However, also the 7a0 ionized final state will
contribute to some extent. The potential energy curves in Figure 5 are qualitative in the sense
that they are not the result of a quantum mechanical ab initio theory. But they are based on the
results of extensive calculations for the hydrogen bond donating OH group in the water
054901-8 Schreck et al. Struct. Dyn. 1, 054901 (2014)

dimer.18,58 Quantitatively methanol and water exhibit distinctly different potential energy curves
in ground and excited states, especially because of only one hydrogen bond donating OH group
in methanol. Yet, the characteristic features of the potentials will be the same for all hydrogen
bond donating OH groups, in particular, along the hydrogen bond coordinate. These characteris-
tic features are (see Figure 5): The ground state potential has a single minimum close to the
hydrogen bond donating oxygen atom. In the core-ionized state, the potential is repulsive with
respect to the initial covalent O–H bond, but bound by the hydrogen bond accepting oxygen
atom. The lone-pair-ionized state features a shallow double well potential with a minimum
close to each of the oxygen atoms.
Based on these potentials we can understand the formation of the split peak structure as
follows: In the core-ionized state, the nuclear wave packet delocalizes between the two oxygen
atoms. Hence, the wave packet reaches Franck-Condon overlap with vibrational states in both
minima of the lone-pair-ionized final state. Decays into the two minima result in emission at
different photon energies. The difference in emission energy depends on the exact shape of the
potential and the corresponding vibrational levels. Ljungberg et al.18 applied the full Kramers-
Heisenberg scattering formalism (in particular, including interference effects in the scattering
process38,59) to the quantitatively calculated potentials of the hydrogen bond donating molecule
in the water dimer. They found indeed a significant effect on the lone-pair emission line from
dynamics in the O–H bond. In their calculations, the vibronic transitions group into two regions
separated by about 0.5 eV in emission energy. After adding environmental as well as instrumen-
tal broadening, this two peak structure turned into one asymmetric peak for the simple model
water dimer. Ljungberg et al.18 interpret the split lone-pair peak in liquid water by the presence
of a second peak originating from differently hydrogen bonded species next to the lone-pair
peak in liquid water. The asymmetry of the lone-pair peak lifts the second peak, which explains
also the isotope effect in liquid water according to these authors.
Ljungberg et al.18 used a comparable short O–O distance of 2.75 A, as found in water ice
to model a typical strong hydrogen bond. Using the O–O distances of liquid methanol as well
as including the methyl group in the calculations could increase the asymmetry of the lone-pair
emission line more towards a split peak structure as observed in our experimental data. We
note that the 7a0
peak close to the lone-pair peak is lifted in intensity by the asymmetry of the
lone-pair peak similar to what Ljungberg et al.18 describe for liquid water. The 7a0
state
FIG. 4. RIXS spectra of normal and deuterated methanol (D-Methanol) for three characteristic excitation energies.
054901-9 Schreck et al. Struct. Dyn. 1, 054901 (2014)

therefore partly contributes to the low energy component of the split peak. However, we can
not exclusively assign the low energy component to the 7a0
state, since for excitation energies
between 534.8 and 535.5 eV (see Figures 1 and 2(b)), the 7a0
state is well resolved next to the
two components of the lone-pair peak.
Within the, here, described mechanism, the collapse of the split peak structure into a single
emission line when detuning the excitation energy is analog to the collapse of the vibrational
progression for decay into the electronic ground state (compare Sec. III B). This narrowing of
emission features from electronic excited final states with detuning has been recently described
for liquid acetone and isopropanol.27,35
B. The effect of hydrogen bonding
The scenario for the formation of the split peak structure described in Sec. IV A applies
solely for hydrogen bond donating OH groups, since they just feature the repulsive but bound
potential in the core-ionized state and the double well potential in the lone-pair-ionized state.
For hydrogen bond accepting or non-hydrogen-bonded OH groups, the scenario will be quite
different. Felic�ıssimo et al.58 have calculated the O–H and O–O potentials of the geometry
FIG. 5. Proposed mechanism for the formation of the split peak emission feature: Shown are qualitative potential energy
curves along the O–H coordinate of a hydrogen bond donating OH group in the ground state, the oxygen 1s core-ionized
state and the lone-pair-ionized state.
054901-10 Schreck et al. Struct. Dyn. 1, 054901 (2014)

optimized water dimer for ionization at the donor and acceptor oxygen site. From the calculated
potentials it follows that ionization at the hydrogen bond accepting molecule does not result in
significant dynamics in the O–H bond. Instead, the O–O potential is slightly repulsive resulting
in a weakening of the hydrogen bond after core level ionization. Similar results have been
obtained by Odelius et al.10 For an OH group, that is accepting and donating a hydrogen bond
at the same time (as it is the case for most of the molecules in liquid alcohols28,29), the situa-
tion will be different again. Ultimately changes in the hydrogen bond configuration and strength
can influence the dynamics in the core-exited state and hence also affect the split peak structure
in RIXS spectra.
To verify this expected influence of the hydrogen bond environment on the RIXS spectral
profiles, we compare in Figure 6 RIXS spectra of the linear alcohols from methanol to hexanol
in the liquid phase. All alcohols feature a well-resolved split peak structure around 527 eV
emission energy for excitation at the absorption maximum (Figure 6(a)) as well as for non-
resonant excitation (Figure 6(b)). However, we observe variations in the relative intensities of
the two split peak components as a function of carbon chain length. We quantify these varia-
tions for both excitation energies in Figure 6(c), where the ratio of the two split peak compo-
nents (peak heights of the experimental data are divided) is shown as a function of the carbon
FIG. 6. Impact of the hydrogen bond network on the split peak structure. RIXS spectra for (a) resonant and (b) non-
resonant excitation of linear alcohols in the liquid phase with one to six carbon atoms (methanol to hexanol). The spectra
are offset for clarity. The corresponding XA spectra measured in total fluorescence yield are shown in the supplementary
material34 (c) Mean number of hydrogen bonds per molecule29 (red line) as a function carbon chain length together with
the ratio of the two split peak components (high-energy/low-energy). Thick and thin blue lines correspond to the ratio at
resonant and non-resonant excitation. A description of the error estimate is given in the supplementary material.34 All val-
ues are normalized to the value for methanol (left y-scale). The y-scale on the right gives the number of hydrogen bonds.
054901-11 Schreck et al. Struct. Dyn. 1, 054901 (2014)

chain length. We also include the mean number of hydrogen bonds per molecule in the liquid
as determined by Lehtola et al.29 We find a weak but clear correlation between the variation in
the split peak intensities and the mean number of hydrogen bonds. In particular, the anomalous
behavior of propanol (C3H7OH) of having the fewest hydrogen bonds per molecule is also
found in the RIXS spectra: The relative intensity of the high emission energy split peak is
smallest for propanol.
Accordingly, the split peak structure is also affected by the hydrogen bond environment,
even though it has a local molecular origin (dynamics of the O–H bond in the core-excited
state). Therefore, we expect that changes in the hydrogen bond environment induced by, e.g.,
temperature changes also affect the split peak structure.
V. SUMMARY AND CONCLUSIONS
We have performed an experimental RIXS study of liquid methanol in its normal (CH3OH)
and deuterated form (CD3OD) as well as of the liquid alcohols with longer carbon chains up to
hexanol. All liquid alcohols feature a split peak structure in the lone-pair emission region of the
non-resonant XE spectrum.
The high quality of the data from liquid methanol in terms of signal-to-noise ratio, spectral
resolution, and excitation energy range allowed for a detailed analysis of the vibrational pro-
gression of the decay into the electronic ground state and the connected nuclear dynamics in
the intermediate core-excited state.
We determined the characteristic time in the core-excited state until nuclear dynamics give
a measurable contribution to the RIXS spectral profiles to sdyn¼ 1.2 6 0.8 fs for liquid metha-
nol. By detuning the excitation energy from the absorption resonance, we reduced the effective
scattering time well below sdyn and hereby suppressed nuclear dynamics in the RIXS process to
a minimum.
From the RIXS spectra at strong detuning we retrieved the “dynamic-free” local partial
DOS of liquid methanol. The “dynamic-free” DOS is fully described by the electronic states of
the free methanol molecule and it features, in particular, no split peak structure in the lone-pair
region. This, together with the comparison of normal and deuterated methanol gave evidence
that the split peak structure in liquid alcohols originates from dynamics in the O–H bond in the
core-excited state.
We proposed a mechanism for the formation of the split peak structure that is based on
qualitative potential energy curves of the hydrogen bond donating OH group in the core- and
lone-pair-ionized state. In this picture, the splitting originates from the local dynamics of the
O–H bond in the core-excited state. At the same time, we showed that the splitting is also sen-
sitive to changes in the hydrogen bond network since the specific hydrogen bond configuration
has influence on the O–H bond dynamics.
We conclude that the split peak structure in RIXS spectra from liquid alcohols originates
from local dynamics of the O–H bond in the core-excited state of hydrogen bond donating OH
groups. The splitting is not a signature of distinct structural motifs in the liquid alcohols. This
finding is at variance with the study of Kashtanov et al.,26 where the two split components in
the lone-pair region have been assigned to hydrogen bonded rings and chains, respectively.
However, we note that our analysis does not exclude the existence of different structural motifs.
Our findings contribute to a better understanding of local molecular, dynamical, as well as
structural contributions in RIXS from the liquid phase. We expect that the detuning approach
and the retrieval of the “dynamic-free” DOS will find broader application in the investigation
of complex molecular and liquid systems.
ACKNOWLEDGMENTS
We are grateful to the Institute for Nanometer Optics and Technology at the Helmholtz-
Zentrum Berlin and to Christian Weniger for manufacturing the silicon based sample cells for the
transmission measurements. Continuous assistance of the BESSY II staff is acknowledged.
Furthermore, we thank Henning Schr€oder for his support during the measurements.
054901-12 Schreck et al. Struct. Dyn. 1, 054901 (2014)
1J. St€ohr, NEXAFS Spectroscopy (Springer Verlag, 1992).2F. de Groot and A. Kotani, Core Level Spectroscopy of Solids (CRC Press, 2008).3A. Nilsson and L. G. M. Petterson, “Adsorbate electronic structure and bonding on metal surfaces,” in Chemical Bondingat Surfaces and Interfaces, edited by A. Nilsson, L. G. M. Petterson, and J. K. Nørskov (Elsevier B. V., 2008).
4P. Wernet, D. Nordlund, U. Bergmann, M. Cavalleri, M. Odelius, H. Ogasawara, L.-A. N€aslund, T. K. Hirsch, L.Ojam€ae, P. Glatzel, L. G. M. Pettersson, and A. Nilsson, “The structure of the first coordination shell in liquid water,”Science 304, 995–999 (2004).
5J. D. Smith, C. D. Cappa, K. R. Wilson, B. M. Messer, R. C. Cohen, and R. J. Saykally, “Energetics of hydrogen bondnetwork rearrangements in liquid water,” Science 306, 851–853 (2004).
6A. Nilsson, D. Nordlund, I. Waluyo, N. Huang, H. Ogasawara, S. Kaya, U. Bergmann, L.-A. N€aslund, H. €Ostr€om, P.Wernet, K. Andersson, T. Schiros, and L. G. M. Pettersson, “X-ray absorption spectroscopy and X-ray Raman scatteringof water and ice; an experimental view,” J. Electron Spectrosc. Relat. Phenom. 177, 99–129 (2010).
7B. Winter, U. Hergenhahn, M. Faubel, O. Bj€orneholm, and I. V. Hertel, “Hydrogen bonding in liquid water probed by res-onant Auger-electron spectroscopy,” J. Chem. Phys. 127, 094501 (2007).
8D. Nordlund, H. Ogasawara, H. Bluhm, O. Takahashi, M. Odelius, M. Nagasono, L. G. M. Pettersson, and A. Nilsson,“Probing the electron delocalization in liquid water and ice at attosecond time scales,” Phys. Rev. Lett. 99, 217406(2007).
9J.-H. Guo, Y. Luo, A. Augustsson, J.-E. Rubensson, C. Sathe, H. Agren, H. Siegbahn, and J. Nordgren, “X-Ray emissionspectroscopy of hydrogen bonding and electronic structure of liquid water,” Phys. Rev. Lett. 89, 137402 (2002).
10M. Odelius, H. Ogasawara, D. Nordlund, O. Fuchs, L. Weinhardt, F. Maier, E. Umbach, C. Heske, Y. Zubavichus, M.Grunze, J. Denlinger, L. G. M. Pettersson, and A. Nilsson, “Ultrafast core-hole-induced dynamics in water probed by x-ray emission spectroscopy,” Phys. Rev. Lett. 94, 227401 (2005).
11T. Tokushima, Y. Harada, O. Takahashi, Y. Senba, H. Ohashi, L. G. M. Pettersson, A. Nilsson, and S. Shin, “High resolu-tion x-ray emission spectroscopy of liquid water: The observation of two structural motifs,” Chem. Phys. Lett. 460,387–400 (2008).
12O. Fuchs, M. Zharnikov, L. Weinhardt, M. Blum, M. Weigand, Y. Zubavichus, M. B€ar, F. Maier, J. Denlinger, C. Heske,M. Grunze, and E. Umbach, “Isotope and temperature effects in liquid water probed by x-ray absorption and resonant x-ray emission spectroscopy,” Phys. Rev. Lett. 100, 027801 (2008).
13K. M. Lange, R. K€onnecke, S. Ghadimi, R. Golnak, M. A. Soldatov, K. F. Hodeck, A. Soldatov, and E. F. Aziz, “High re-solution x-ray emission spectroscopy of water and aqueous ions using the micro-jet technique,” Chem. Phys. 377, 1–5(2010).
14A. Nilsson, T. Tokushima, Y. Horikawa, Y. Harada, M. P. Ljungberg, S. Shin, and L. G. M. Pettersson, “Resonant inelas-tic x-ray scattering of liquid water,” J. Electron Spectrosc. Relat. Phenom. 188, 84–100 (2013).
15Y. Harada, T. Tokushima, Y. Horikawa, O. Takahashi, H. Niwa, M. Kobayashi, M. Oshima, Y. Senba, H. Ohashi, K. T.Wikfeldt, A. Nilsson, L. G. M. Pettersson, and S. Shin, “Selective probing of the OH or OD stretch vibration in liquidwater using resonant inelastic soft-x-ray scattering,” Phys. Rev. Lett. 111, 193001 (2013).
16M. Odelius, “Molecular dynamics simulations of fine structure in oxygen K-edge x-ray emission spectra of liquid waterand ice,” Phys. Rev. B 79, 144204 (2009).
17M. Odelius, “Information content in O[1s] K-edge x-ray emission spectroscopy of liquid water,” J. Phys. Chem. A 113,8176–8181 (2009).
18M. P. Ljungberg, L. G. M. Pettersson, and A. Nilsson, “Vibrational interference effects in x-ray emission of a modelwater dimer: Implications for the interpretation of the liquid spectrum,” J. Chem. Phys. 134, 044513 (2011).
19L. G. M. Pettersson, T. Tokushima, Y. Harada, O. Takahashi, S. Shin, and A. Nilsson, “Comment on ‘Isotope and temper-ature effects in liquid water probed by x-ray absorption and resonant x-ray emission spectroscopy,’ ” Phys. Rev. Lett.100, 249801 (2008).
20O. Fuchs, M. Zharnikov, L. Weinhardt, M. Blum, M. Weigand, Y. Zubavichus, M. B€ar, F. Maier, J. Denlinger, C. Heske,M. Grunze, and E. Umbach, “Fuchs et al. Reply:,” Phys. Rev. Lett. 100, 249802 (2008).
21J. Forsberg, J. Grasj€o, B. Brena, J. Nordgren, L.-C. Duda, and J.-E. Rubensson, “Angular anisotropy of resonant inelasticsoft x-ray scattering from liquid water,” Phys. Rev. B 79, 132203 (2009).
22K. M. Lange, M. Soldatov, R. Golnak, M. Gotz, N. Engel, R. K€onnecke, J.-E. Rubensson, and E. F. Aziz, “X-ray emis-sion from pure and dilute H2O and D2O in a liquid microjet: Hydrogen bonds and nuclear dynamics,” Phys. Rev. B 85,155104 (2012).
23L. Weinhardt, A. Benkert, F. Meyer, M. Blum, R. G. Wilks, W. Yang, M. B€ar, F. Reinert, and C. Heske, “Nuclear dynam-ics and spectator effects in resonant inelastic soft x-ray scattering of gas-phase water molecules,” J. Chem. Phys. 136,144311 (2012).
24J.-H. Guo, Y. Luo, A. Augustsson, S. Kashtanov, J.-E. Rubensson, D. K. Shuh, H. Agren, and J. Nordgren, “Molecularstructure of alcohol-water mixtures,” Phys. Rev. Lett. 91, 157401 (2003).
25J.-H. Guo, Y. Luo, A. Augustsson, S. Kashtanov, J.-E. Rubensson, D. Shuh, V. Zhuang, P. Ross, H. Agren, and J.Nordgren, “The molecular structure of alcohol-water mixtures determined by soft-x-ray absorption and emissionspectroscopy,” J. Electron Spectrosc. Relat. Phenom. 137–140, 425–428 (2004).
26S. Kashtanov, A. Augustson, J.-E. Rubensson, J. Nordgren, H. Agren, J.-H. Guo, and Y. Luo, “Chemical and electronicstructures of liquid methanol from x-ray emission spectroscopy and density functional theory,” Phys. Rev. B 71, 104205(2005).
27Schreck et al., “Local valence electronic structure and extended potential energy surfaces of the hydrogen and covalentO-H bond from vibrational resolved resonant inelastic x-ray scattering,” Phys. Rev. B (to be submitted).
28M. Tom�sic, A. Jamnik, G. Fritz-Popovski, O. Glatter, and L. Vlcek, “Structural properties of pure simple alcohols fromethanol, propanol, butanol, pentanol, to hexanol: Comparing Monte Carlo simulations with experimental SAXS data,”J. Phys. Chem. B 111, 1738–1751 (2007).
29J. Lehtola, M. Hakala, and K. H€am€al€ainen, “Structure of liquid linear alcohols,” J. Phys. Chem. B 114, 6426–6436(2010).
30F. Gel’mukhanov and H. Agren, “Resonant x-ray Raman scattering,” Phys. Rep. 312, 87–330 (1999).
054901-13 Schreck et al. Struct. Dyn. 1, 054901 (2014)
31S. Schreck, G. Gavrila, C. Weniger, and P. Wernet, “A sample holder for soft x-ray absorption spectroscopy of liquids intransmission mode,” Rev. Sci. Instrum. 82, 103101 (2011).
32K. Kunnus, I. Rajkovic, S. Schreck, W. Quevedo, S. Eckert, M. Beye, E. Suljoti, C. Weniger, C. Kalus, S. Gr€ubel, M.Scholz, D. Nordlund, W. Zhang, R. W. Hartsock, K. J. Gaffney, W. F. Schlotter, J. J. Turner, B. Kennedy, F. Hennies, S.Techert, P. Wernet, and A. F€ohlisch, “A setup for resonant inelastic soft x-ray scattering on liquids at free electron laserlight sources,” Rev. Sci. Instrum. 83, 123109 (2012).
33K. R. Wilson, M. Cavalleri, B. S. Rude, R. D. Schaller, T. Catalano, A. Nilsson, R. J. Saykally, and L. G. M. Pettersson,“X-ray absorption spectroscopy of liquid methanol microjets: Bulk electronic structure and hydrogen bonding network,”J. Phys. Chem. B 109, 10194–10203 (2005).
34See supplementary material at http://dx.doi.org/10.1063/1.4897981 for the description of the interpolation of the high-energy tail of decay into electronic excited states in Figure 2(c), a discussion of the uncertainties and error bars in Figures2 and 6, the alignment of the DOS in Eq. (4), details on the spectrum calculations for the methanol molecule and the TFYXA spectra of the linear alcohols.
35Y.-P. Sun, F. Hennies, A. Pietzsch, B. Kennedy, T. Schmitt, V. N. Strocov, J. Andersson, M. Berglund, J.-E. Rubensson,K. Aidas, F. Gel’mukhanov, M. Odelius, and A. F€ohlisch, “Intramolecular soft modes and intermolecular interactions inliquid acetone,” Phys. Rev. B 84, 132202 (2011).
36F. Gel’mukhanov, T. Privalov, and H. Agren, “Collapse of vibrational structure in spectra of resonant x-ray Ramanscattering,” Phys. Rev. A 56, 256–264 (1997).
37M. Neeb, J.-E. Rubensson, M. Biermann, and W. Eberhardt, “Coherent excitation of vibrational wave functions observedin core hole decay spectra of O2, N2, and CO,” J. Electron Spectrosc. Relat. Phenom. 67, 261–274 (1994).
38F. Gel’mukhanov, H. Agren, M. Neeb, J.-E. Rubensson, and A. Bringer, “Integral properties of channel interference inresonant x-ray scattering,” Phys. Lett. A 211, 101–108 (1996).
39O. Bj€orneholm, A. Nilsson, A. Sandell, B. Hernn€as, and N. Martensson, “Determination of time scales for charge-transferscreening in physisorbed molecules,” Phys. Rev. Lett. 68, 1892–1895 (1992).
40A. Naves de Brito, A. Naves de Brito, O. Bj€orneholm, J. S. Neto, A. Machado, S. Svensson, A. Ausmees, S. J. Osborne,L. J. Sæthre, H. Aksela, O.-P. Sairanen, A. Kivim€aki, E. N~ommiste, and S. Aksela, “Fast dissociation of resonantly coreexcited H2S studied by vibrational and temporal analysis of the Auger spectra,” J. Mol. Struct.: THEOCHEM 394,135–145 (1997).
41P. A. Br€uhwiler, O. Karis, and N. Martensson, “Charge-transfer dynamics studied using resonant core spectroscopies,”Rev. Mod. Phys. 74, 703–740 (2002).
42I. Hjelte, M. Piancastelli, C. Jansson, K. Wiesner, O. Bj€orneholm, M. B€assler, S. Sorensen, and S. Svensson, “Evidenceof ultra-fast dissociation in ammonia observed by resonant Auger electron spectroscopy,” Chem. Phys. Lett. 370,781–788 (2003).
43J.-E. Rubensson, “RIXS dynamics for beginners,” J. Electron Spectrosc. Relat. Phenom. 110–111, 135–151 (2000).44J. Tulkki and T. Aberg, “Statistical theory of electronic Raman resonance scattering by oriented atoms,” J. Phys. B: At.
Mol. Phys. 13, 3341–3360 (1980).45J. Tulkki and T. Aberg, “Behaviour of Raman resonance scattering across the K x-ray absorption edge,” J. Phys. B: At.
Mol. Phys. 15, L435–L440 (1982).46J. Jim�enez-Mier, J. van Ek, D. Ederer, T. Callcott, J. Jia, J. Carlisle, L. Terminello, A. Asfaw, and R. Perera, “Dynamical
behavior of x-ray absorption and scattering at the L edge of titanium compounds: Experiment and theory,” Phys. Rev. B59, 2649–2658 (1999).
47P. L. Cowan, “Resonant x-ray Raman scattering from atoms and molecules,” in Resonant Anomalous X-Ray Scattering:Theory and Applications, edited by G. Materlik, C. J. Sparks, and K. Fischer (North-Holland, Amsterdam, 1994).
48J. J. Kas, J. J. Rehr, J. A. Soininen, and P. Glatzel, “Real-space Green’s function approach to resonant inelastic x-rayscattering,” Phys. Rev. B 83, 235114 (2011).
49M. Magnuson, J.-E. Rubensson, A. F€ohlisch, N. Wassdahl, A. Nilsson, and N. Martensson, “X-ray fluorescence spectraof metals excited below threshold,” Phys. Rev. B 68, 045119 (2003).
50H. Hayashi, R. Takeda, Y. Udagawa, T. Nakamura, H. Miyagawa, H. Shoji, S. Nanao, and N. Kawamura, “Lifetime-broadening-suppressed/free XANES spectroscopy by high-resolution resonant inelastic x-ray scattering,” Phys. Rev. B68, 045122 (2003).
51H. Hayashi, “Lifetime-broadening-suppressed selective XAFS spectroscopy,” Anal. Sci. 24, 15–23 (2008).52J. Szlachetko, D. Ferri, V. Marchionni, A. Kambolis, O. V. Safonova, C. J. Milne, O. Kr€ocher, M. Nachtegaal, and J. S�a,
“Subsecond and in situ chemical speciation of Pt/Al2O3 during oxidation-reduction cycles monitored by high-energy re-solution off-resonant X-ray spectroscopy,” J. Am. Chem. Soc. 135, 19071–19074 (2013).
53J. Szlachetko, C. J. Milne, J. Hoszowska, J.-C. Dousse, W. Błachucki, J. S�a, Y. Kayser, M. Messerschmidt, R. Abela, S.Boutet, C. David, G. Williams, M. Pajek, B. D. Patterson, G. Smolentsev, J. A. van Bokhoven, and M. Nachtegaal,“Communication: The electronic structure of matter probed with a single femtosecond hard x-ray pulse,” Struct. Dyn. 1,021101 (2014).
54C. Glover, T. Schmitt, M. Mattesini, M. Adell, L. Ilver, J. Kanski, L. Kjeldgaard, M. Agaker, N. Martensson, R. Ahuja, J.Nordgren, and J.-E. Rubensson, “Stationary and dispersive features in resonant inelastic soft X-ray scattering at the Ge3p resonances,” J. Electron Spectrosc. Relat. Phenom. 173, 103–107 (2009).
55A. Nilsson and N. Martensson, “Initial and final state rules in x-ray spectroscopies of adsorbates,” Physica B 208–209,19–22 (1995).
56H. Agren, Y. Luo, F. Gel’mukhanov, and H. J. A. Jensen, “Screening in resonant x-ray emission of molecules,”J. Electron Spectrosc. Relat. Phenom. 82, 125–134 (1996).
57P. Skytt, P. Glans, K. Gunnelin, J. Guo, J. Nordgren, Y. Luo, and H. Agren, “Role of screening and angular distributionsin resonant x-ray emission of CO,” Phys. Rev. A 55, 134–145 (1997).
58V. Felic�ıssimo, I. Minkov, F. Guimar~aes, F. Gel’mukhanov, A. Cesar, and H. Agren, “A theoretical study of the role ofthe hydrogen bond on core ionization of the water dimer,” Chem. Phys. 312, 311–318 (2005).
59F. Gel’mukhanov, L. Mazalov, and A. Kondratenko, “A theory of vibrational structure in the x-ray spectra of molecules,”Chem. Phys. Lett. 46, 133–137 (1977).
054901-14 Schreck et al. Struct. Dyn. 1, 054901 (2014)


