Embed Size (px)
Citation preview
233
Dynamic Stresses in Electric Overhead Travelling Cranes due to the Hoisting and Lowering of Loads
By E. Lightfoot, M.SC.J A.M.I.C.E.*J and B. L. Clarkson, Ph.D.t
The paper describes a series of tests which were carried out on three lattice-type electric overhead travelling (E.O.T.) cranes to determine the impulsive effects due to the sudden hoisting and lowering of loads. Dynamic strains were measured from electric-resistance strain-gauge recordings taken during the tests. The stresses computed from these strains are compared with values from a complete theoretical analysis and with values obtained from three approximate formulae. Finally, a method is proposed for the evaluation of the dynamic factor in design.
I N T R O D U C T I O N
An investigation of the stresses in electric overhead travelling (E.O.T.) cranes has been in progress in the Civil Engineering Department of the University of Leeds since July 1951. It was instigated at the request of the Crane Makers’ Association and has been guided by terms of reference prepared by the Maxi- mum Permissible Stress Committee of the British Standards Institution. Its object is to find experimental and theoretical evidence on which to base revisions of some of the structural design clauses in B.S. 466. The complete investigation is con- cerned with all the effects set up by normal crane usage but this paper deals only with the dynamic stresses set up in the girders during the hoisting and lowering motions. The various tests indicate that the highest dynamic stresses induced in the girders during normal crane operation are those due to impulsive effects in the hoisting motion.
An earlier series of crane tests was conducted by Madsen (1941)$ of Lehigh University, Bethlehem, Pennsylvania. That investigation was chiefly concerned with the plate-box girder type of E.O.T. crane which is extensively used in the United States. Mechanical strain gauges were used in the static loading tests and De Forest scratch gauges in the dynamic loading tests. I t is considered that with the use of electric-resistance strain-gauge equipment greater accuracy has been achieved in this new investigation. The information obtained should lead to a better understanding of crane performance and to a more precise specification for structural design.
Notation. Distance of crab from end of girder. Dynamic factor. Forces in springs. Deceleration of hoisting velocity. Impact factor, (D - 1). Girder and tackle stiffness values. Length of girder. Mass of part of crab supported by girder. Equivalent concentrated mass of girder at position of
Mass per unit length of girder. Equivalent masses. Time from commencement of loading due to hoisting. Time at which load is lifted from support. Hoisting velocity. V-fry hoisting velocity at any instant of time c. Constants.
crab.
The MS. of this paper was received at the Institution on 6th November 1953. For the report of the meeting in London, on 26th November 1954, at which this paper was presented, see p. 252. * Lecturer in Civil Engineering, Leeds University.
t Technical Assistant, De Havilland Aircraft Co., Ltd. + An alphabetical list of references is given in Appendix 11.
X,, xb Constants. X
*O Yay Yb Constants.
Y B Constants.
Defining downward displacement of ml. Deflexion of girder corresponding to to.
Defining upward movement of m2.
L O A D I N G O N A C R A N E G I R D E R D U R I N G H O I S T I N G A N D L O W E R I N G
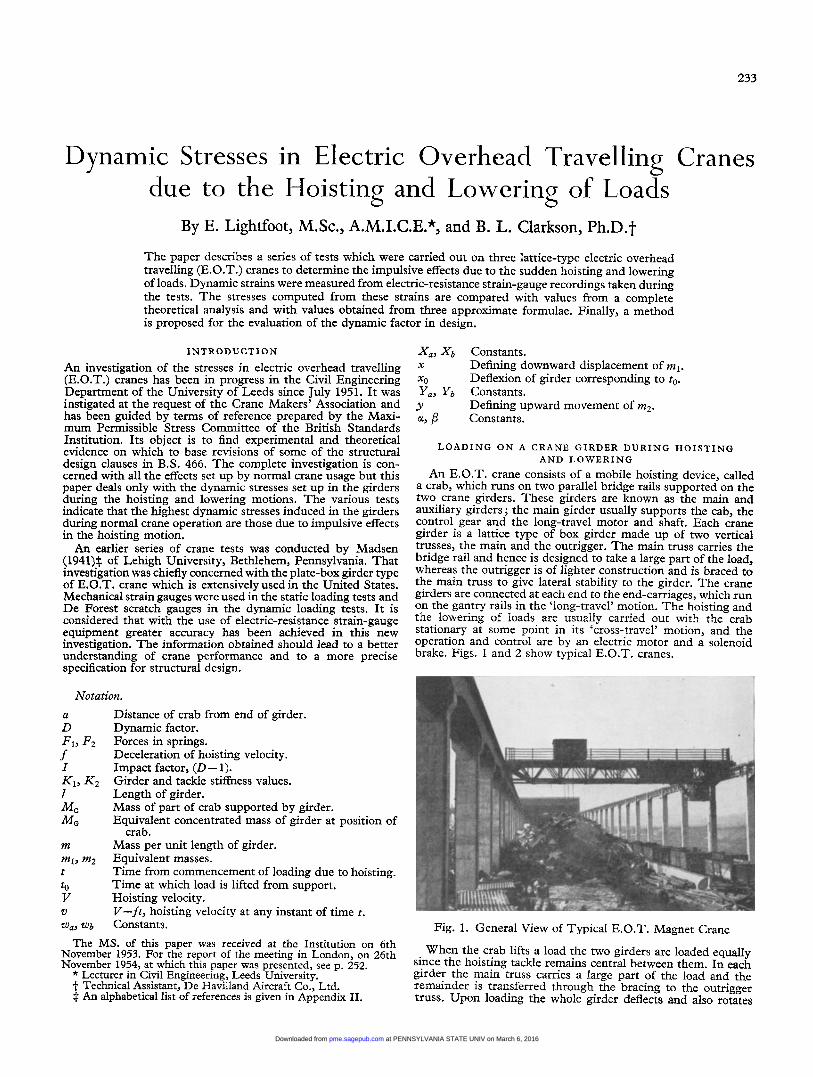
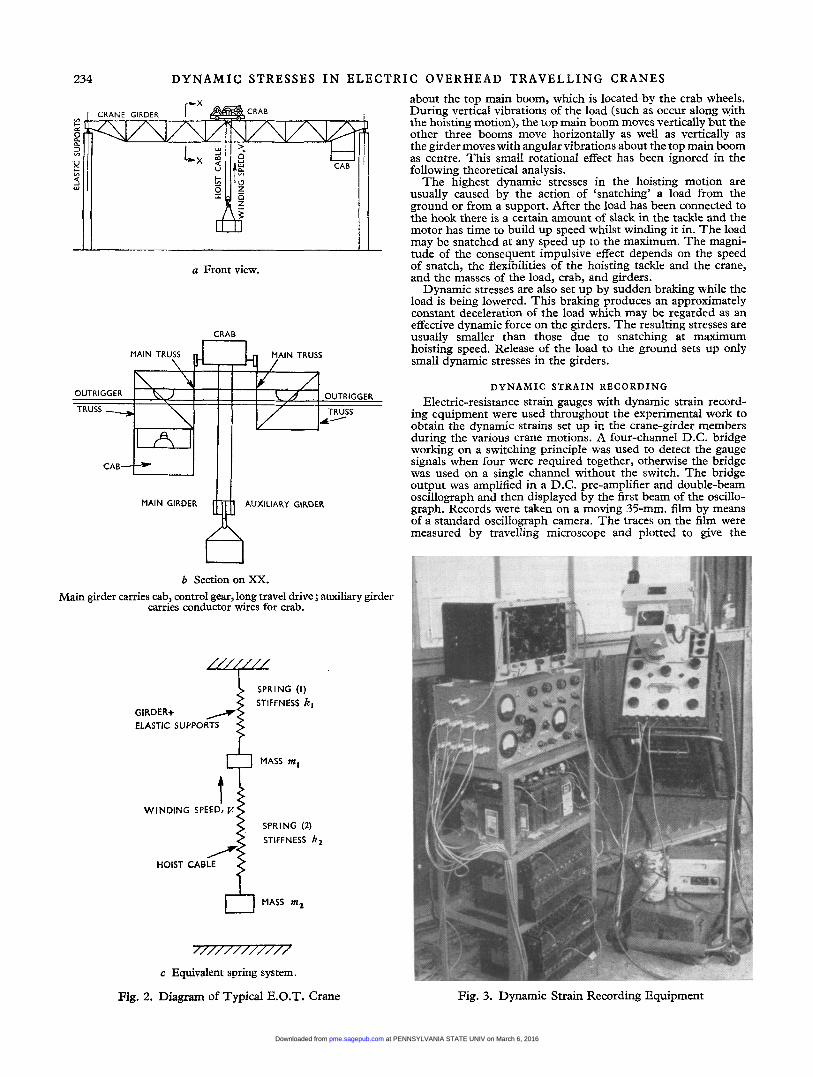
An E.O.T. crane consists of a mobile hoisting device, called a crab, which runs on two parallel bridge rails supported on the two crane girders. These girders are known as the main and auxiliary girders; the main girder usually supports the cab, the control gear and the long-travel motor and shaft. Each crane girder is a lattice type of box girder made up of two vertical trusses, the main and the outrigger. The main truss carries the bridge rail and hence is designed to take a large part of the load, whereas the outrigger is of lighter construction and is braced to the main truss to give lateral stability to the girder. The crane girders are connected at each end to the end-carriages, which run on the gantry rails in the ‘long-travel’ motion. The hoisting and the lowering of loads are usually carried out with the crab stationary at some point in its ‘cross-travel’ motion, and the operation and control are by an electric motor and a solenoid brake. Figs. 1 and 2 show typical E.O.T. cranes.
Fig. 1. General View of Typical E.O.T. Magnet Crane
When the crab lifts a load the two girders are loaded equally since the hoisting tackle remains central between them. In each girder the main truss carries a large part of the Load and the remainder is transferred through the bracing to the outrigger truss. Upon loading the whole girder deflects and also rotates
at PENNSYLVANIA STATE UNIV on March 6, 2016pme.sagepub.comDownloaded from
234 DYNAMIC STRESSES I N E L E C T R I C OVERHEAD T R A V E L L I N G CRANES
CRAB
a Front view.
CRAB -
MAIN GIRDER AUXILIARY GIRDER
b SectiononXX. Main girder carries cab, control gear, long travel drive ; auxiliary girder
carries conductor wires for crab.
SPRING ( I ) STIFFNESS kl
ELASTIC SUPPORTS
MASS m,
7/7/1//1//// c Equivalent spring system.
Fig. 2. Diagram of Typical E.O.T. Crane
about the top main boom, which is located by the crab wheels. During vertical vibrations of the load (such as occur along with the hoisting motion) , the top main boom moves vertically but the other three booms move horizontally as well as vertically as the girder moves with angular vibrations about the top main boom as centre. This small rotational effect has been ignored in the following theoretical analysis.
The highest dynamic stresses in the hoisting motion are usually caused by the action of ‘snatching’ a load from the ground or from a support. After the load has been connected to the hook there is a certain amount of slack in the tackle and the motor has time to build up speed whilst winding it in. The load may be snatched at any speed up to the maximum. The magni- tude of the consequent impulsive effect depends on the speed of snatch, the flexibilities of the hoisting tackle and the crane, and the masses of the load, crab, and girders.
Dynamic stresses are also set up by sudden braking while the load is being lowered. This braking produces an approximately constant deceleration of the load which may be regarded as an effective dynamic force on the girders. The resulting stresses are usually smaller than those due to snatching at maximum hoisting speed. Release of the load to the ground sets up only small dynamic stresses in the girders.
D Y N A M I C S T R A I N RECORDING
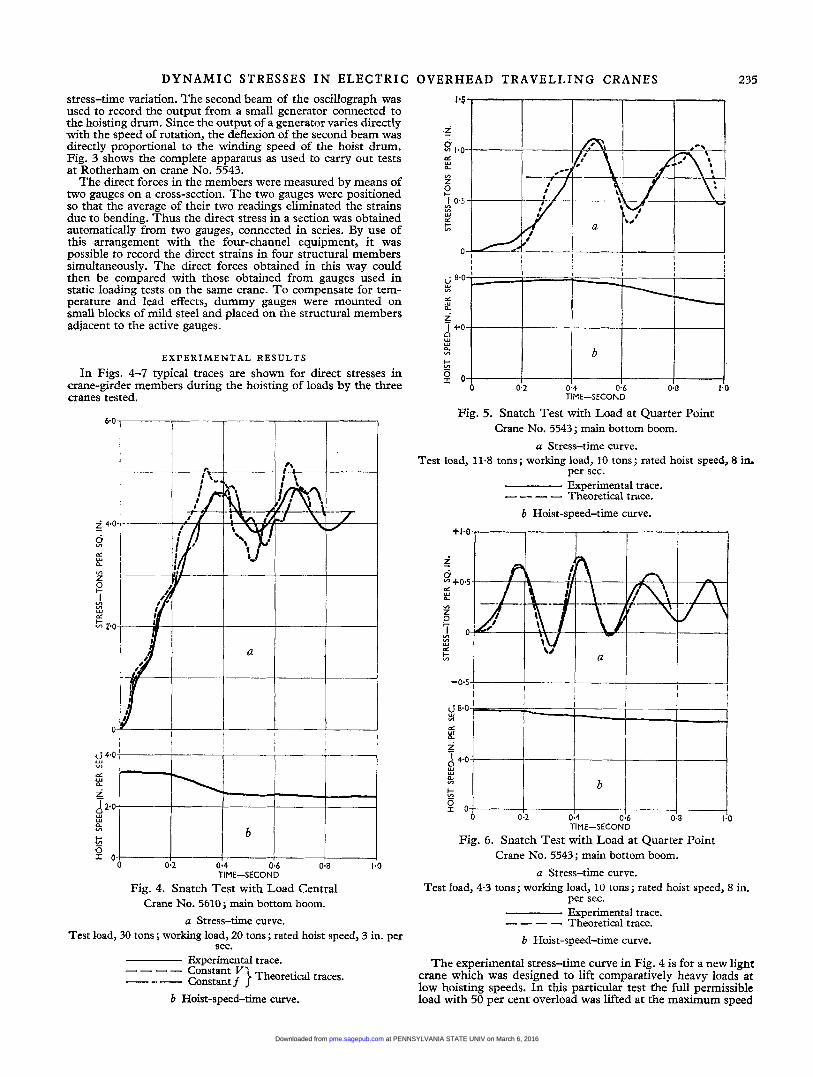
Electric-resistance strain gauges with dynamic strain record- ing equipment were used throughout the experimental work to obtain the dynamic strains set up in the crane-girder members during the various crane motions. A four-channel D.C. bridge working on a switching principle was used to detect the gauge signals when four were required together , otherwise the bridge was used on a single channel without the switch. The bridge output was amplified in a D.C. pre-amplifier and double-beam oscillograph and then displayed by the first beam of the oscillo- graph. Records were taken on a moving 35-mm. film by means of a standard oscillograph camera. The traces on the film were measured by travelling microscope and plotted to give the
Fig. 3. Dynamic Strain Recording Equipment
at PENNSYLVANIA STATE UNIV on March 6, 2016pme.sagepub.comDownloaded from
D Y N A M I C S T R E S S E S I N E L E C T R I C
8.0 2 f5 2 9
t;
VI
0
I 4.0
Y n. Ln
g o
stress-time variation. The second beam of the oscillograph was used to record the output from a small generator connected to the hoisting drum. Since the output of a generator varies directly with the speed of rotation, the deflexion of the second beam was directly proportional to the winding speed of the hoist drum. Fig. 3 shows the complete apparatus as used to carry out tests at Rotherham on crane No. 5543.
The direct forces in the members were measured by means of two gauges on a cross-section. The two gauges were positioned so that the average of their two readings eliminated the strains due to bending. Thus the direct stress in a section was obtained automatically from two gauges, connected in series. By use of this arrangement with the four-channel equipment, it was possible to record the direct strains in four structural members simultaneously. The direct forces obtained in this way could then be compared with those obtained from gauges used in static loading tests on the same crane. To compensate for tem- perature and lead effects, dummy gauges were mounted on small blocks of mild steel and placed on the structural members adjacent to the active gauges.
I 4
I
b E X P E R I M E N T A L RESULTS
In Figs. 4-7 typical traces are shown for direct stresses in crane-girder members during the hoisting of loads by the three cranes tested.
I
, I
I I I I
I I I I I I I
TIME-SECOND
Fig. 4. Snatch Test with Load Central Crane No. 5610; main bottom boom.
a Stress-time curve. Test load, 30 tons ; working load, 20 tons ; rated hoist speed, 3 in. per
Exoerimental trace. sec.
---- --- 222; 7 } Theoretical traces.
b Hoist-speed-time curve.
O V E R H E A D T R A V E L L I N G C R A N E S 235
Fig. 5. Snatch Test with Load at Quarter Point Crane No. 5543 ; main bottom boom.
u Stress-time curve. Test load, 11.8 tons; working load, 10 tons; rated hoist speed, 8 in.
per sec. Experimental trace. ---- Theoretical trace.
b Hoist-speed-time curve.
I I I I I I I
I : ~ I I
u'8-0 I I
3 t-r I I I I I
I I
TIME-SECOND
Fig. 6 . Snatch Test with Load at Quarter Point Crane No. 5543; main bottom boom.
a Stress-time curve. Test load, 4.3 tons; working load, 10 tons; rated hoist speed, 8 in.
per sec. Experimental trace. ---- Theoretical trace.
b Hoist-speed-time curve.
The experimental stress-time curve in Fig. 4 is for a new light crane which was designed to lift comparatively heavy loads at low hoisting speeds. In this particular test rhe full permissible load with 50 per cent overload was lifted at the maximum speed
at PENNSYLVANIA STATE UNIV on March 6, 2016pme.sagepub.comDownloaded from
236 D Y N A M I C STRESSES I N E L E C T R I C O V E R H E A D T R A V E L L I N G CRANES possible. There is no precise time instant for the origin of any of the traces because slight initial stresses occur as the last of the slack in the tackle and the sling is taken up. There are three N1 vibrations occurring before the load is carried and the rate of stress development decreases slightly as the stress builds up.
There seems to be little damping of the subsequent vibrations and stresses. The hoisting speed falls away as the load comes on and continues to fall until after the first peak stress is reached.
Figs. 5 and 6 show the stress-time variation for a heavy magnet crane which was designed to lift comparatively light loads at fairly high hoisting speeds. There is an appreciable amount of damping apparent in the second motion in both instances. The hoisting speed is maintained quite well and deceleration occurs only after the maximum impulsive stress.
In Fig. 7 an intermediate type of stress-time curve occurs, as would be expected for a crane with intermediate characteristics- a light crane hoisting comparatively medium loads at fairly high speeds. Here the winding speed falls away more than in Fig. 5, but less than in Fig. 4. There is negligible deceleration before the maximum stress occurs. Damping also is intermediate between that for the first and that for the second crane.
The dynamic factors are obtained from the traces shown by dividing the ordinate to the maximum stress by the ordinate to the mean stress in the second motion. Figs. 5 and 6 show that when a comparatively light load is lifted the dynamic factor, D, is increased in such a manner that the ‘impact factor’ I = (D - 1) varies approximately inversely with the load. For the trace in Fig. 6 the value of D is 2.60 and negative stresses are set up during the vibrations.
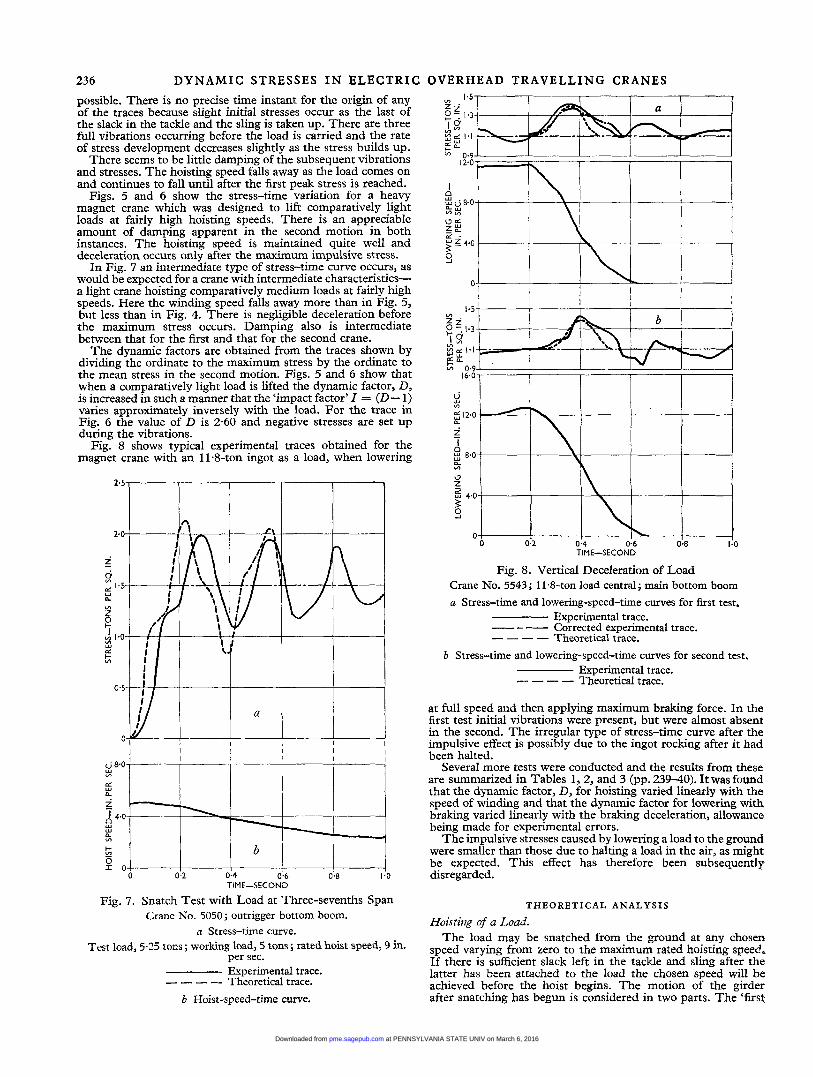
Fig. 8 shows typical experimental traces obtained for the magnet crane with an 11-8-ton ingot as a load, when lowering
I I I I I I
TIME-SECOND
Fig. 7. Snatch Test with Load at Three-sevenths Span Crane No. 5050; outrigger bottom boom.
a Stress-time curve. Test load, 525 tons; working load, 5 tons; rated hoist speed, 9 in.
per sec. Experimental trace. ---- Theoretical trace.
b Hoist-speed-time curve.
I I I I r
I I I I I
2 I0
512.0
z I a “w 8.0
z
II
.% In
0
2 4.0
3 0
0 TIME-SECOND
Fig. 8. Vertical Deceleration of Load Crane No. 5543 ; I IS-ton load central; main bottom boom a Stress-time and lowering-speed-time curves for first test.
--- Corrected experimental trace. ---- Theoretical trace.
b Stress-time and lowering-speed-time curves for second test.
Experimental trace.
Experimental trace. ---- Theoretical trace.
at full speed and then applying maximum braking force. In the first test initial vibrations were present, but were almost absent in the second. The irregular type of stress-time curve after the impulsive effect is possibly due to the ingot rocking after it had been halted.
Several more tests were conducted and the results from these are summarized in Tables 1, 2, and 3 (pp. 239-40). It was found that the dynamic factor, D, for hoisting varied linearly with the speed of winding and that the dynamic factor for lowering with braking varied linearly with the braking deceleration, allowance being made for experimental errors.
The impulsive stresses caused by lowering a load to the ground were smaller than those due to halting a load in the air, as might be expected. This effect has therefore been subsequently disregarded.
T H E O R E T I C A L A N A L Y S I S
Hoisting of a Load. The load may be snatched from the ground at any chosen
speed varying from zero to the maximum rated hoisting speed, If there is sufficient slack left in the tackle and sling after the latter has been attached to the load the chosen speed will be achieved before the hoist begins. The motion of the girder after snatching has begun is considered in two parts. The ‘first
at PENNSYLVANIA STATE UNIV on March 6, 2016pme.sagepub.comDownloaded from
DYNAMIC STRESSES I N ELECTRIC
motion’ is the deflexion of the girder from its zero-load paition to the moment the load leaves the ground. When sufficient tension has been developed in the hoist cable the load begins to rise and the ‘second motion’ commences. Shortly after the start of this motion the maximum stresses occur in the crane girder members.
For analysis the girder and tackle are assumed to be repre- sented by an equivalent double-spring system, as shown in Fig. 2. The test girder considered carries the reaction from only half of the hook load. The girder and its supports (if these are elastic) are represented by spring (l), which is weightless and has an identical stiffness, K 1 . The sriffness of the girder itself depends on the position of the crab. Half the hoisting tackle is represented by spring (2), which is taken as weightless and of a stiffness, K2, assumed to vary inversely with the length of the tackle but not at all during any of the effects considered here.
The masses attached to the springs are ml and m2, the latter being half the mass of the load lifted. The crane girder is replaced by a spring of the same stiffness, and mass ml has to be so chosen that the spring and mass together have the same frequency of vibration as the crab-loaded girder. To a close approximation the equivalent mass, ml, may be taken as the mass, M,, of the part of the crab supported by the girder, plus the equivalent concentrated mass, M,, of the girder at the position of the crab. I t may be shown that M, placed on the weightless girder at the position of the crab should have the same frequency of vibration as the unloaded girder, that is, the natural frequency of the girder. This may be expressed mathematically as 2MG sin2 (mall) = ml, where a is the distance of the crab from the end of the girder, which has a length I and a mass per unit length of m. Thus
ml ml = M,+M, = M c + y a
2 sin2 - 1 The downward displacement of the mass, ml, from its equili-
brium position under its own weight only is defined by x and the upward movement of the load, m2, is defined by y. The hoisting tackle is wound in at a constant speed so that the hook moves towards the crab at a relative velocity, V, which is taken to be uniform in a first analysis and subject to a deceleration, f, in a second analysis. It was found experimentally that in most instances V was sensibly constant, but, at excessive hoisting speeds and/or loads, deceleration started about halfway through the first motion.
Before the load lifts the equation of motion of ml is
( I ) First Analysis.
mlx = F2-F1 = K ~ ( V ~ - X ) - K ~ X = K 2 V t l t - ( K 1 + K 2 ) ~ . . . . (1)
It can easily be shown that with x and t as the only variables, and with li. and x zero when t equals zero,
x = - K2V (t-ksinwt) . . . . K1+K2
Kl+K2 where w2 = -. ml
As the force in the lower spring builds up there will come a point when it is equal to m2g. A further increase in the force will cause a small resultant upward force and a consequent accelera- tion of the mass m2. Thus, as the resultant vertical force on the mass builds up from zero, the vertical acceleration of the mass will also build up from zero. Thus m2 leaves the ground with zero acceleration. (The same argument applies for the crane girder at t = 0.) The load begins to rise when
F2 = m2g that is, when
where to is the time at which the second motion begins and xo is the corresponding deflexion of the girder. Treating xo and to as current co-ordinates the actual values of xo and to may be determined graphically, from the solution of equations (2) and (3). (Approximate values may be calculated by neglecting the
K2(Vto-xo) = m2g . . . . (3)
OVERHEAD TRAVELLING CRANES 237 superimposed vibration in equation (2).) It is seen from the figure that the values of xo, io, and fo, which are initial values for the second motion, may occur at any part of a vibration in the first motion and that different values will occur with different hoisting speeds.
The two equations of motion after the load leaves the ground are
mlx‘ = F2-F1 = m2g+K2(Vt’-x’-y)-K1(xo+x’) * (4) where x’ = (x-xo) and t‘ = 0 at the start of the second motion, and
mzjj = F2-m2g = K2(lTt‘-x’-y) . . (5)
Since at t‘ = 0 mlR‘ = mlxo = m2g-Klxo equations (4) and (5) may be written (changing the form)
( m l D 2 + K 1 + K 2 ) x ’ + K 2 ~ = m&+K2Vf . . (6 )
K2x’+(m2D2+K2)y = K2Vt‘ . . . . (7) whence
x’ = xp’+xc’
= mxo+X, sin (w,t’+ct)+Xb sin (wbt’+P) . . . (8) K1
and
Y = YP+YC
where Xu, xb, Y,, Yb, way wb, u, and ,6 are constants which may be evaluated from the data and the deduced initial conditions for the second motion (Appendix I).
It is thus possible to evaluate x’ and y for values of t‘ and so to obtain values of the forces F1 and F2 in the springs, the former representing the force acting on the crane girder. The stress variation for the girder is the same as the variation of F1 with t, and the maximum dynamic factor for stresses may be obtained from the curve of F1 against t , as the value of F1 (maximum) divided by m2g. This dynamic factor applies only to the particular test considered.
(2) Second Analysis. When it is assumed that the hoisting velocity is subject to a constant deceleration,f, the analysis may be modified as follows: at any instant of time, t, the hoisting velocity is given by v = V-ft, where t is measured from the commencement of the deceleration taken here as the start of the first motion.
Then for the first motion
m1fw (K1+ K2) V
where tan y =
T o a close approximate equation (10) may be written
The values of xo and to are obtained by solving this equation with m2g = K2(Vt0--)fro2-xO) . . . (12)
again treating xo and to as current co-ordinates.
from equation ( l l ) , using the value of to. The initial values for the second motion may thus be obtained
In the second motion the values of x‘ and y are found to be
m1xo m2f K1 K1
x’ = + X , sin (w,t’+a)+Xb sin (Wbc‘+p) . (13)
at PENNSYLVANIA STATE UNIV on March 6, 2016pme.sagepub.comDownloaded from
238 DYNAMIC STRESSES I N ELECTRIC OVERHEAD TRAVELLING CRANES
and and to that which would apply for a rigid girder with a ffexible mlXQ m 2 f m2f y = - - + - + - + (3iOt' - + f t ' 2 ) + Y, sin (wat' + u) Ki Ki K2
+ Y b sin(wbt'+/3) . . . (14) These equations enable the variation in F1 to be calculated for the entire hoisting motion.
The above analyses are based on the assumption that a steel- wire rope tackle has a linear load-extension relation. There is a small amount of damping in the crane vibrations, but this has been disregarded.
I t is clear that the method used above is much too unwieldy for the design office, where a simple method is required to give a quick, close estimate of the actual conditions. The formulae which have been developed for design use are outlined below.
APPROXIMATE FORMULAE FOR ESTIMATING THE D Y N A M I C FACTOR
For Hoisting. (I) From Dimensional Analysis. The ruling variables for the
impulsive effect of hoisting a load may be taken as D, V, ml, m2, K1, and K2, with g also to be considered. The symbols have already been defined above. (Here D is to be calculated for the auxiliary girder only and may have a slightly different value for the main girder which carries the additional masses of the cab, control gear, etc. An overall value of D would be used for the crane in design, and the variables above would be altered to be more convenient.)
From dimensional analysis it is possible to derive three equations connecting the variables. Buckingham's method (1 915) leads to three pi-terms, which may be conveniently taken as
Assuming simple power functions the variables may be related m h 2 , K 1 / G and ( V l d . v ' (Kh2) .
as follows :
where I = impact factor = (D-1). It was confirmed experimentally that with ml , m2, K1, and K2
constant, I varied directly with V. This may be seen from Table 1, with allowance made for experimental errors.
In the tests on crane No. 5543 it was observed that D increased when m2 was decreased, the other variables remaining constant. In Table 1 the average value of ( I / V ) . m2 for the first three and the fourth results for this crane are 48.3 and 51.3, respectively, and the values for the fourth and fifth results (with K1 and ml altered) are 79.7 and 87.0, respectively. Thus, allowing for experi- mental errors, it is seen that I varies inversely with m2, provided that the other variables are constant.
A special test was performed on crane No. 5050 at constant hoisting speed, to determine the relation between I and K2. The test load was hoisted from the ground, from a bogey and from a B.S. beam crib erected on the bogey, and the values of I and the length of tackle were measured. It was found that the dynamic factor increased as the tackle was shortened. From these results (Table 2) a direct relation was discerned between I
Assuming the relations, IaV and Ial/m2, it has been found that the other results in Table 1 are in good agreement with this third relation IadK, .
Thus in equation (19) (below) the following values apply: a = +1, b = +f, c = 0. From the various results in Table 1 the value of C works out at 0.88 and the equation may be written
V m2g
with V in in. per sec., m in tons mass, and kl in tons weight per in., or in other consistent units.
This equation is similar in form to that which would apply for a flexible girder with an inextensible tackle
and .\/Kz.
I = 0.88-d(mlK2) . . . . (16)
V I = ~ v ' { ( m , + m z ) K I )
tackle V
I = ,,gd(m&2)
and to equation (17) below.
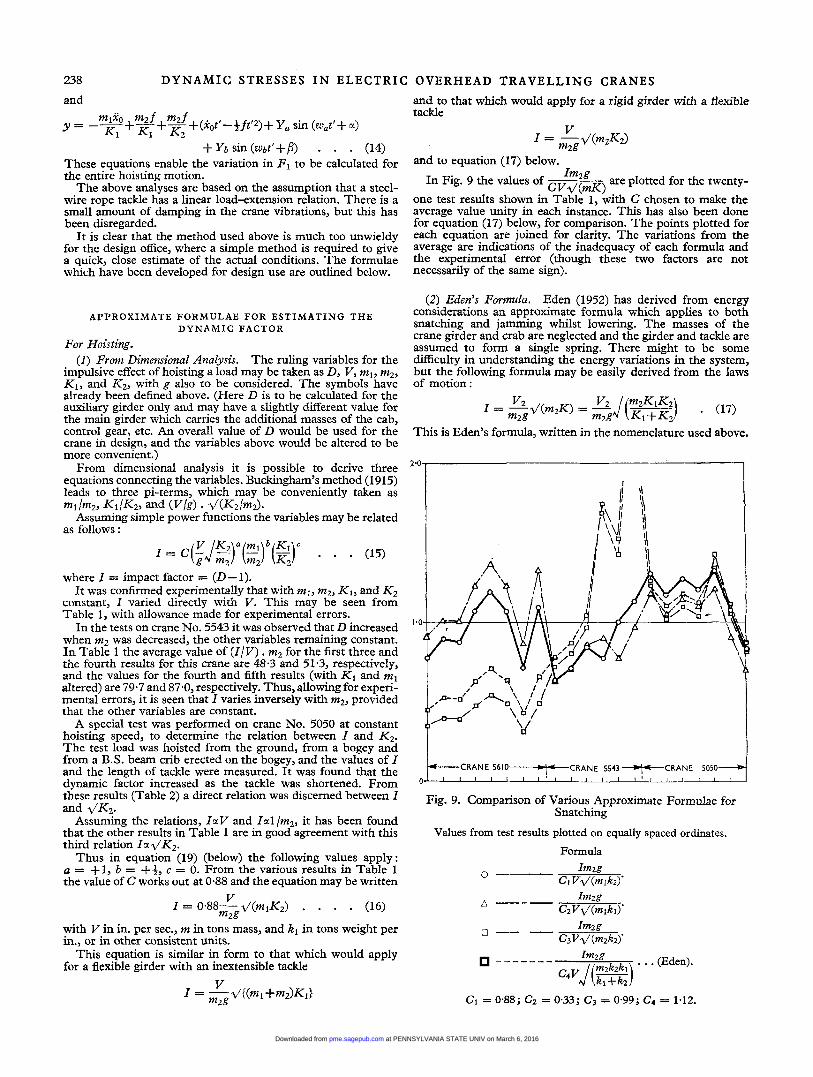
In Fig. 9 the values of Cv,,lmK) Im2g are plotted for the twenty- " \-----,
one test results shown inTable 1, with C chosen to make the average value Unity in each instance. This has also been done for equation (17) below, for comparison. The points plotted for each equation are joined for clarity. The variations from the average are indications of the inadequacy of each formula and the experimental error (though these two factors are not necessarily of the same sign).
(2) Eden's Formrrla. Eden (1952) has derived from energy considerations an approximate formula which applies to both snatching and jamming whilst lowering. The masses of the crane girder and crab are neglected and the girder and tackle are assumed to form a single spring. There might to be some difficulty in understanding the energy variations in the system, but the following formula may be easily derived from the laws of motion:
This is Eden's formula, written in the nomenclature used above.
CRANE 5610.-+CRANE 5543 *CRANE 5050
i I I I I ' I I ' I ! ' 1 I ' 1
Fig. 9. Comparison of Various Approximate Formulae for Snatching
Values from test results plotted on equally spaced ordinates. Formula
ImZg . . . (Eden). - - - - - - - C ~ V J(-)
at PENNSYLVANIA STATE UNIV on March 6, 2016pme.sagepub.comDownloaded from
DYNAMIC STRESSES I N E L E C T R I C O V E R H E A D TRAVELLING CRANES 239 The calculated periods of vibration in the first motion are
sometimes quite different from those measured and are always shorter; there is good agreement, however, in the second motion. A complete number of vibrations amears to occur in the first
(3) Madsen’s Formula. This is quoted in an Appendix to the Specifications of the Association of Iron and Steel Engineers (A.I.S.E.) in the United States for E.0.T. Travelling Cranes for Steel Mill Service (Madsen 1941) :
Particulars of cranes
Rated Classifica- %?: I speed, 1 tion tons in. per
V2 W motion (where there is time) and-;here may be a physical = %73%!0.00201+d per cent * (18) explanation for this.
Crane load, tons
Hoist
in. per sec.
speed, Test result
Class I1 ’ 30.0 30.0 30.0 30.0 30.0 30.0
Central Central Central Central f$ span i%~pan Central
(crab rail
3.35 1.09 3.06 1.10 2.60 1.08 2.40 1.09 2.80 1.12 2.60 1.10 3.20 1.08
Central Central Central Central
span
11.75 1.42 7.80 1.31 5.70 1 *27 9.30 2.1 1 7.70 1.52
4 span 7.90 2.60
8 span 6.00 +span 5.10
span 4.30
+span 6.20 I span 3.00
5 span 6.20
1 2.00
1.46 1 *35 1.32 1.21 1.54 1 44 1.11
Measured impact factor
Average, measurec imuact
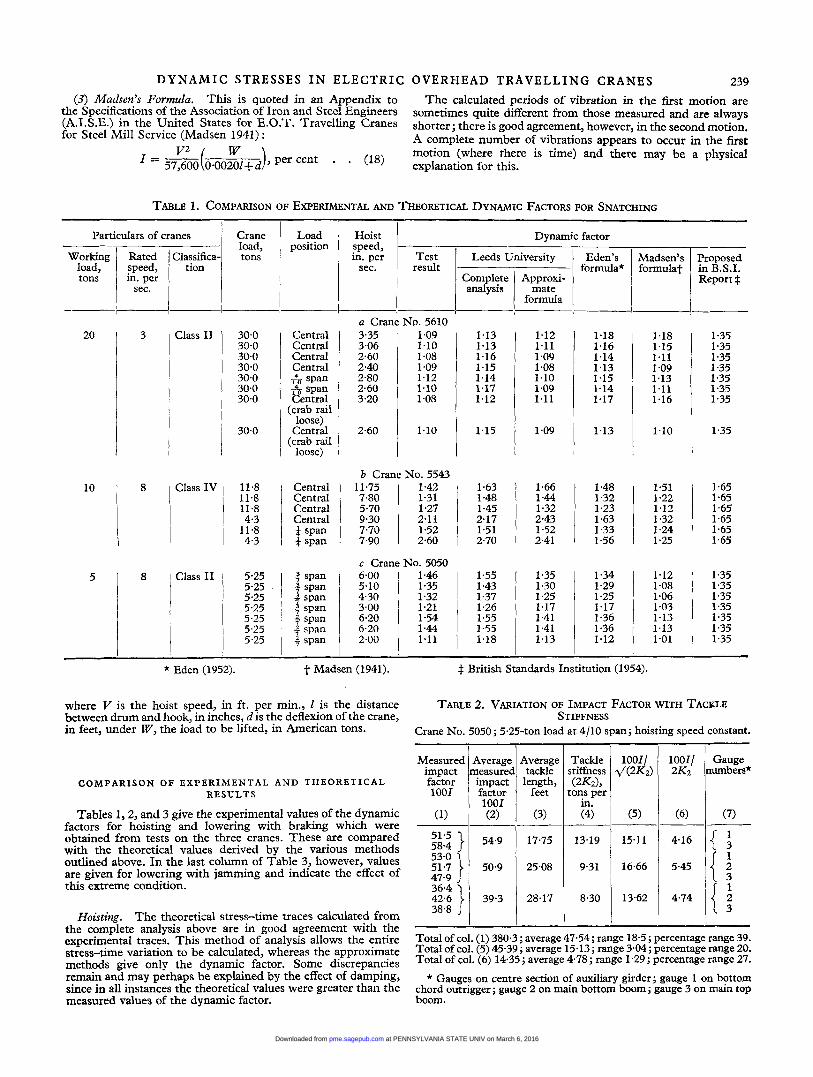
TABLE 1. COMPARISON OF EXPERIMENTAL AND THEORETICAL DYNAMIC FACTORS FOR SNATCHING
Load position
Dynamic factor
1.13 1.13 1.16 1.15 1.14 1.17 1.12
1.15
1.63 1 -48 1.45 2.17 1.51 2.70
1.55 1.43 1.37 1.26 1.55 155 1.18
1.12 1.11 1 so9 1.08 1.10 1.09 1.11
1.09
1.66 1 -44 1.32 2.43 1.52 2.41
1.35 1.30 1.25 1.17 1.41 1.41 1.13
1.18 1.16 1.14 1.13 1.15 1.14 1.17
1.13
1.48 1.32 1.23 1.63 1 -33 1.56
1.34 1.29 1.25 1.17 1.36 1.36 1.12
1.18 1.15 1.11 1.09 1-13 1.11 1.16
1.10
1.51 1.22 1.12 1.32 1.24 1.25
1.12 1.08 1-06 1-03 1-13 1.13 1.01
1.35 I .35 1 -35 1.35 1.35 1.35 1.35
1.35
1.65 1 -65 1.65 1.65 1.65 1.65
1.35 1.35 1.35 1.35 1.35 1.35 1.35
20
10
5 l
I 1 30’0 (crab
loose) I 11.8 11.8 11.8 4.3
11.8 4.3
5.25 5.25 5.25 5.25 5.25 5.25 5.25
Class IV
I I1
$ British Standards Institution (1954). * Eden (1952).
where V is the hoist speed, in ft. per min., I is the distance between drum and hook, in inches, d is the deflexion of the crane, in feet, under W , the load to be lifted, in American tons.
TABLE 2. VARIATION OF IMPACT FACTOR WITH TACKLE STIFFNESS
Crane No. 5050; 5.25-ton load at 4/10 span; hoisting speed constant. ~ ~
Tackle stiffness (2K2),
tons per in. (4)
Gauge lumbers*
(7)
Average tackle length,
feet
(3)
COMPARISON O F E X P E R I M E N T A L AND T H E O R E T I C A L RESULTS
Tables 1 , 2, and 3 give the experimental values of the dynamic factors for hoisting and lowering with braking which were obtained from tests on the three cranes. These are compared with the theoretical values derived by the various methods outlined above. In the last column of Table 3, however, values are given for lowering with jamming and indicate the effect of this extreme condition.
17.75
25.08
28.17
-
13.19
9.31
8.30
15-11 I 4.16 53.0 i I I
16.66 5.45
13.62 4.74 38.8 J 1
Hoisting. The theoretical stress-time traces calculated from the complete analysis above are in good agreement with the experimental traces. This method of analysis allows the entire stress-time variation to be calculated, whereas the approximate methods give only the dynamic factor. Some discrepancies remain and may perhaps be explained by the effect of damping, since in all instances the theoretical values were greater than the measured values of the dynamic factor.
Total of col. (1) 380.3 ; average 47.54; range 18.5 ; percentage range 39. Total of col. (5) 45.39; average 15.13; range 3.04; percentage range 20. Total of col. (6) 14.35 ; average 4.78 ; range 1.29; percentage range 27.
* Gauges on centre section of auxiliary girder; gauge 1 on bottom chord outrigger ; gauge 2 on main bottom boom ; gauge 3 on main top boom.
at PENNSYLVANIA STATE UNIV on March 6, 2016pme.sagepub.comDownloaded from
240 DYNAMIC STRESSES I N ELECTRIC
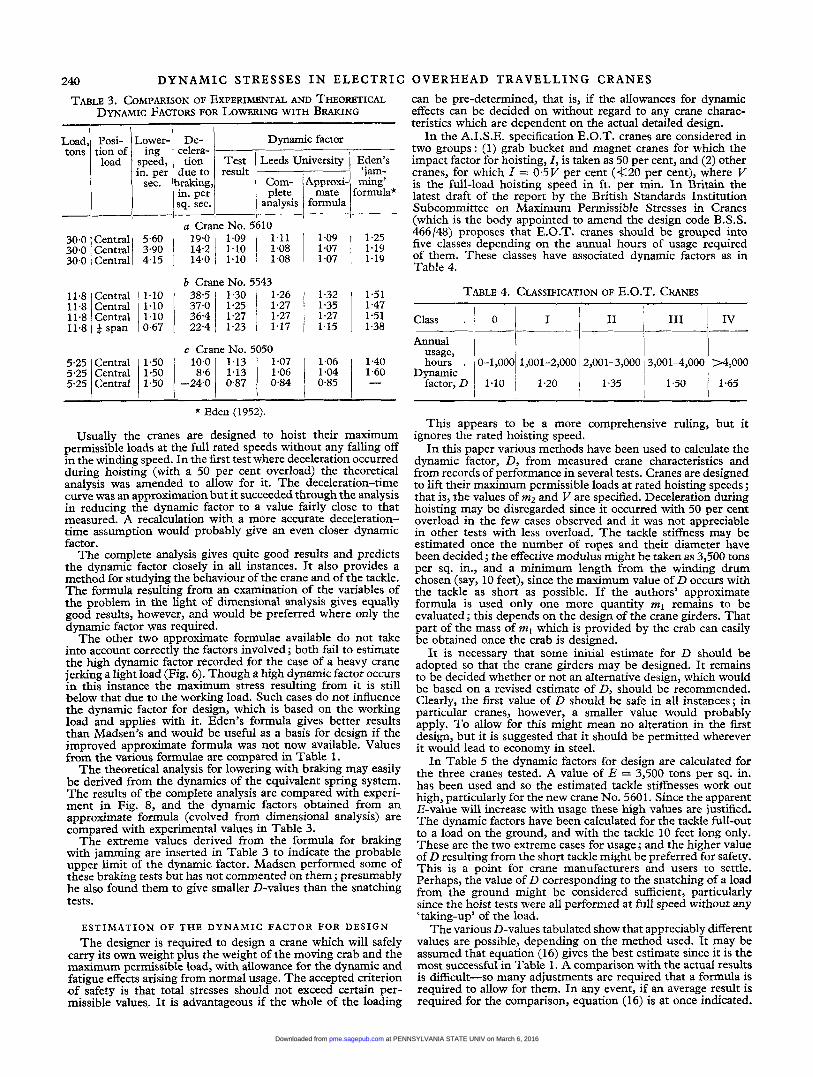
TABLE 3. COMPARISON OF EXPERIMENTAL AND THEORETICAL DYNAMIC FACTORS FOR LOWERING WITH BRAKING
~
Load, Posi- tons tion of
load
Lower- ing
speed, in. uer
kpproxi- mate
formula sec.
5.60 3.90 4.15
1.10 1.10 1.10 0.67
‘jam- mng’
formula* I_____
due to )raking, in. per sq. sec.
result ____ Com- plete
analysis --- 19.0 1-09 1.11 14.2 I 1.10 I 1.08 14.0 1.10 1.08
11.8 11.8 11.8
b Crane No. 5543 38-5 1.30 1.26 33:: 1 ::$ 1 1.27
1.27 22-4 1.23 1.17
Central Central t span
c Crane No. 5050 hours . 0-1,000 1,001-2,000
Annual usage,
Dynamic factor, D 1-10
I
I 2,001-3,000 3,0014,000 >4,000 I
1.32 1.51 1.35 1 1.47 1.27 1.51
1.20 1.35 ~ 1.50 I I
1.15 1 1.38
1 -65
1.06 1.40
::g i ““O
OVERHEAD TRAVELLING CRANES
can be pre-determined, that is, if the allowances for dynamic effects can be decided on without regard to any crane charac- teristics which are dependent on the actual detailed design.
In the A.I.S.E. specification E.O.T. cranes are considered in two groups: (1) grab bucket and magnet cranes for which the impact factor for hoisting, I , is taken as 50 per cent, and (2) other cranes, for which I = 0.5V per cent (K20 per cent), where Y is the full-load hoisting speed in ft. per min. I n Britain the latest draft of the report by the British Standards Institution Subcommittee on Maximum Permissible Stresses in Cranes (which is the body appointed to amend the design code B.S.S. 466/48) proposes that E.O.T. cranes should be grouped into five classes depending on the annual hours of usage required of them. These classes have associated dynamic factors as in Table 4.
TABLE 4. CLASSIFICATION OF E.O.T. CRANES
* Eden (1952).
Usually the cranes are designed to hoist their maximum permissible loads at the full rated speeds without any falling off in the winding speed. In the first test where deceleration occurred during hoisting (with a 50 per cent overload) the theoretical analysis was amended to allow for it. The deceleration-time curve was an approximation but it succeeded through the analysis in reducing the dynamic factor to a value fairly close to that measured. A recalculation with a more accurate deceleration- time assumption would probably give an even closer dynamic factor.
The complete analysis gives quite good results and predicts the dynamic factor closely in all instances. It also provides a method for studying the behaviour of the crane and of the tackle. The formula resulting from an examination of the variables of the problem in the light of dimensional analysis gives equally good results, however, and would be preferred where only the dynamic factor was required.
The other two approximate formulae available do not take into account correctly the factors involved; both fail to estimate the high dynamic factor recorded for the case of a heavy crane jerking a light load (Fig. 6). Though a high dynamic factor occurs in this instance the maximum stress resulting from it is still below that due to the working load. Such cases do not influence the dynamic factor for design, which is based on the working load and applies with it. Eden’s formula gives better results than Madsen’s and would be useful as a basis for design if the improved approximate formula was not now available. Values from the various formulae are compared in Table 1.
The theoretical analysis for lowering with braking may easily be derived from the dynamics of the equivalent spring system. The results of the complete analysis are compared with experi- ment in Fig. 8, and the dynamic factors obtained from an approximate formula (evolved from dimensional analysis) are compared with experimental values in Table 3.
The extreme values derived from the formula for braking with jamming are inserted in Table 3 to indicate the probable upper limit of the dynamic factor. Madsen performed some of these braking tests but has not commented on them; presumably he also found them to give smaller D-values than the snatching tests.
E S T I M A T I O N OF THE D Y N A M I C FACTOR FOR D E S I G N
The designer is required to design a crane which will safely carry its own weight plus the weight of the moving crab and the maximum permissible load, with allowance for the dynamic and fatigue effects arising from normal usage. The accepted criterion of safety is that total stresses should not exceed certain per- missible values,. I t is advantageous if the whole of the loading
This appears to be a more comprehensive ruling, but it ignores the rated hoisting speed.
In this paper various methods have been used to calculate the dynamic factor, D, from measured crane characteristics and from records of performance in several tests. Cranes are designed to lift their maximum permissible loads at rated hoisting speeds j that is, the values of mZ and Y are specified. Deceleration during hoisting may be disregarded since it occurred with 50 per cent overload in the few cases observed and it was not appreciable in other tests with less overload. The tackle stiffness may be estimated once the number of ropes and their diameter have been decided; the effective modulus might be taken as 3,500 tons per sq. in., and a minimum length from the winding drum chosen (say, 10 feet), since the maximum value of D occurs with the tackle as short as possible. If the authors’ approximate formula is used only one more quantity ml remains to be evaluated; this depends on the design of the crane girders. That part of the mass of ml which is provided by the crab can easily be obtained once the crab is designed.
It is necessary that some initial estimate for D should be adopted so that the crane girders may be designed. I t remains to be decided whether or not an alternative design, which would be based on a revised estimate of D, should be recommended. Clearly, the first value of D should be safe in all instances; in particular cranes, however, a smaller value would probably apply. To allow for this might mean no alteration in the first design, but it is suggested that it should be permitted wherever it would lead to economy in steel.
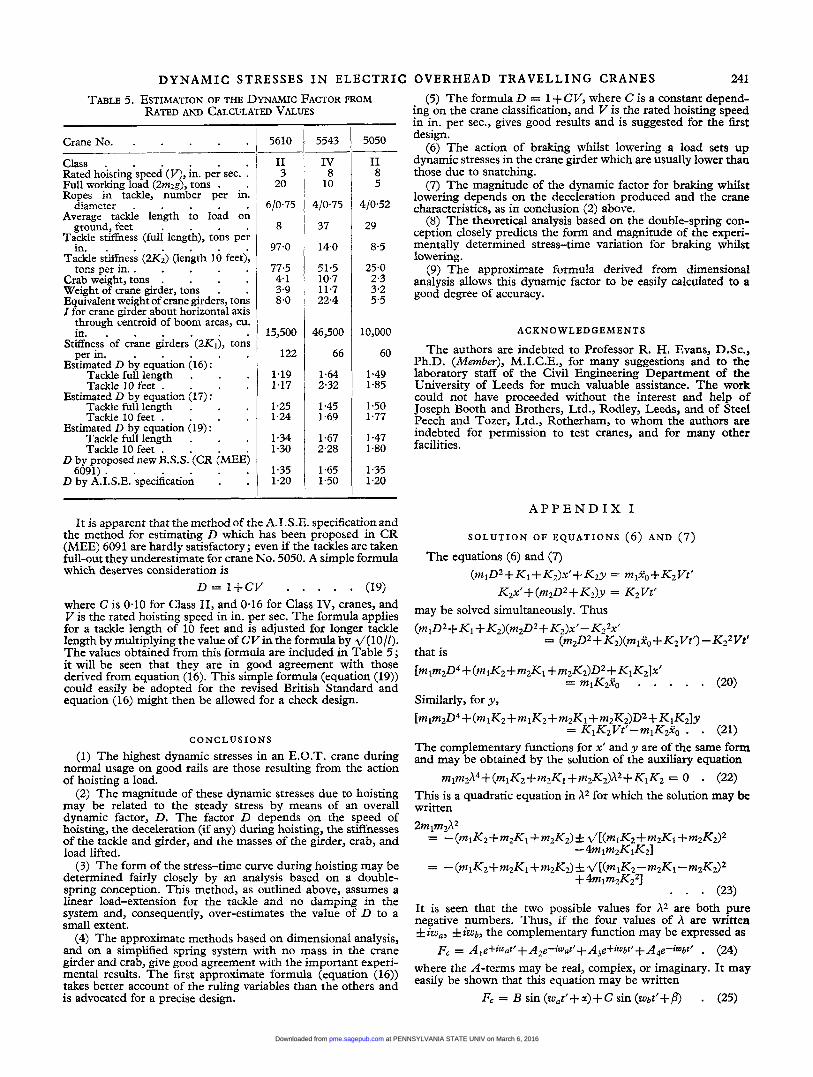
In Table 5 the dynamic factors for design are calculated for the three cranes tested. A value of E = 3,500 tons per sq. in. has been used and so the estimated tackle stiffnesses work out high, particularly for the new crane No. 5601. Since the apparent E-value will increase with usage these high values are justified. The dynamic factors have been calculated for the tackle full-out to a load on the ground, and with the tackle 10 feet long only. These are the two extreme cases for usage; and the higher value of D resulting from the short tackle might be preferred for safety. This is a point for crane manufacturers and users to settle. Perhaps, the value of D corresponding to the snatching of a load from the ground might be considered sufficient, particularly since the hoist tests were all performed at full speed without any ‘taking-up’ of the load.
The various D-values tabulated show that appreciably different values are possible, depending on the method used. It may be assumed that equation (16) gives the best estimate since it is the most successful in Table 1. A comparison with the actual results is difficult-so many adjustments are required that a formula is required to allow for them. In any event, if an average result is required for the comparison, equation (16) is at once indicated.
at PENNSYLVANIA STATE UNIV on March 6, 2016pme.sagepub.comDownloaded from
DYNAMIC STRESSES I N ELECTRIC
TABLE 5. ESTIMATION OF THE DYNAMIC FACTOR FROM RATED AND CALCULATED VALUES
CraneNo. . . . Class . Rated hoisting speed (V), in. per sec. . Full working load (2rn2g), tons . Ropes in tackle, number per in.
Average tackle length to load on diameter . ground, feet .
Tackle stiffness (full length), tons per in.
tons per in. . . Tackle s k n e s s (2K;) (length 10 feeti,
Weight of crane girder, tons Equivalent weight of crane girders, tons I for crane girder about horizontal axis
Fhrough centroid of boom areas, cu. in. .
Stiffness of crane girders’(2Klj, ton;
Crab weight, tons . . . .
per in. Estimated D by equation (16) : *
Tackle full length . Tackle 10 feet .
Estimated D by equation (17) : Tackle full lencrth . Tackle 10 feet-.
Estimated D by equation (19) : * Tackle full length . Tackle 10 feet .
D by proposed new B.S.S.’(CR (MEEj
D by A.I.S.E. specification . 6091) .
- 5610
I1 3
20
610.75
8
97.0
77.5 4.1 3.9 8.0
15,500
122
1.19 1.17
1 *25 1.24
1.34 1.30
1.35 1.20
5543
IV 8
10
410.75
37
14.0
51.5 10.7 11.7 22.4
46,500
66
1.64 2.32
1.45 1.69
1.67 2.28
1.65 1.50
- 5050
I1 8 5
41052
29
8.5
25.0 2.3 3.2 5.5
10,000
60
1.49 1.85
1.50 1.77
1.47 1.80
1.35 1.20
It is apparent that the method of the A.I.S.E. specification and the method for estimating D which has been proposed in CR (MEE) 6091 are hardly satisfactory; even if the tackles are taken full-out they underestimate for crane No. 5050. A simple formula which deserves consideration is
where C is 0.10 for Class 11, and 0.16 for Class IV, cranes, and I.‘ is the rated hoisting speed in in. per sec. The formula applies for a tackle length of 10 feet and is adjusted for longer tackle length by multiplying the value of CV in the formula by d( lO/Z). The values obtained from this formula are included in Table 5; it will be seen that they are in good agreement with those derived from equation (16). This simple formula (equation (19)) could easily be adopted for the revised British Standard and equation (16) might then be allowed for a check design.
D = I + C V . . . . . (19)
C O N C L U S I O N S
(1) The highest dynamic stresses in an E.O.T. crane during normal usage on good rails are those resulting from the action of hoisting a load.
(2) The magnitude of these dynamic stresses due to hoisting may be related to the steady stress by means of an overall dynamic factor, D. The factor D depends on the speed of hoisting, the deceleration (if any) during hoisting, the stiffnesses of the tackle and girder, and the masses of the girder, crab, and load lifted.
(3) The form of the stress-time curve during hoisting may be determined fairly closely by an analysis based on a double- spring conception. This method, as outlined above, assumes a linear load-extension for the tackle and no damping in the system and, consequently, over-estimates the value of D to a small extent.
(4) The approximate methods based on dimensional analysis, and on a simplified spring system with no mass in the crane girder and crab, give good agreement with the important experi- mental results. The first approximate formula (equation (16)) takes better account of the ruling variables than the others and is advocated for a precise design.
OVERHEAD TRAVELLING CRANES 241 (5) The formula D = 1 + CV, where C is a constant depend-
ing on the crane classification, and V is the rated hoisting speed in in. per sec., gives good results and is suggested for the first design.
(6) The action of braking whilst lowering a load sets up dynamic stresses in the crane girder which are usually lower than those due to snatching.
(7) The magnitude of the dynamic factor for braking whilst lowering depends on the deceleration produced and the crane characteristics, as in conclusion (2) above.
(8) The theoretical analysis based on the double-spring con- ception closely predicts the form and magnitude of the experi- mentally determined stress-time variation for braking whilst lowering.
(9) The approximate formula derived from dimensional analysis allows this dynamic factor to be easily calculated to a good degree of accuracy.
ACKNOWLEDGEMENTS
The authors are indebted to Professor R. H. Evans, D.Sc., Ph.D. (Member), M.I.C.E., for many suggestions and to the laboratory staff of the Civil Engineering Department of the University of Leeds for much valuable assistance. The work could not have proceeded without the interest and help of Joseph Booth and Brothers, Ltd., Rodley, Leeds, and of Steel Peech and Tozer, Ltd., Rotherham, to whom the authors are indebted for permission to test cranes, and for many other facilities.
A P P E N D I X I
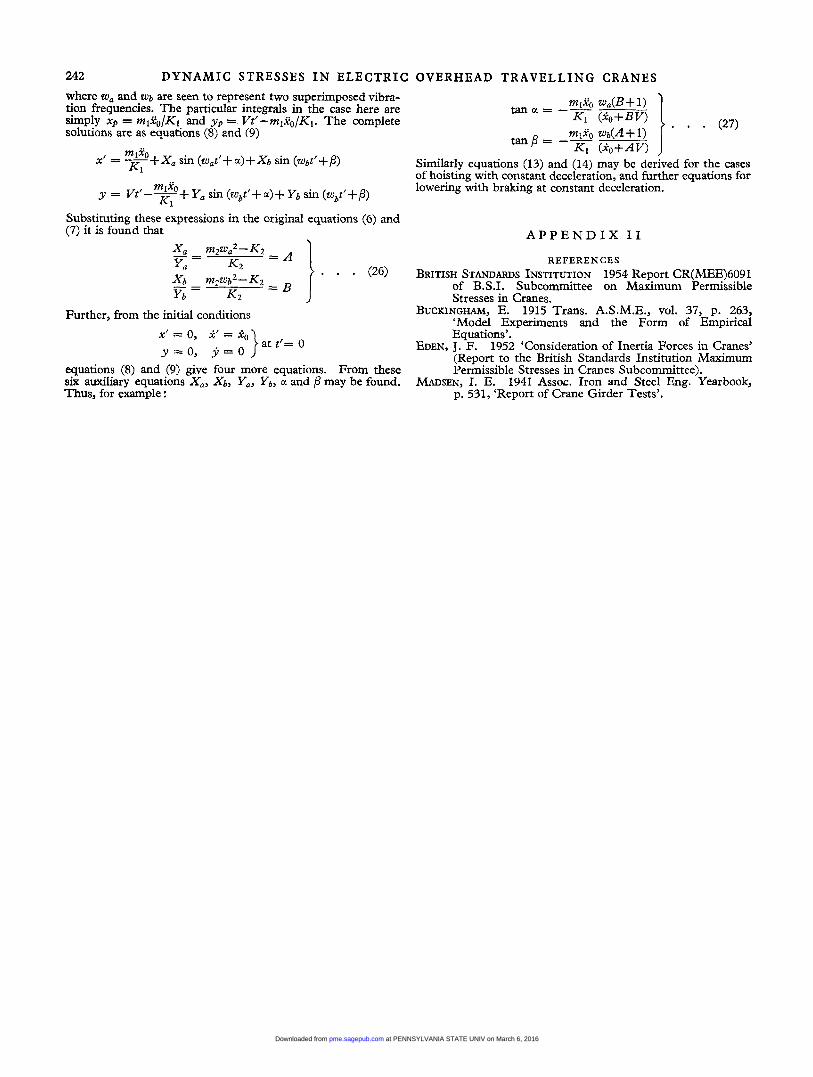
S O L U T I O N OF E Q U A T I O N S (6) A N D (7)
(ml 0 2 + K1+ K2)x‘+ K2y = mlZo + Kz Vc‘ The equations (6) and (7)
Kzx’+(m2D2+K2)y = K2Vt’ may be solved simultaneously. Thus (mlD2+K1+ Kz)(mzD2+ K ~ ) x ’ - K 2 ~ x ’
that is = ( m z ~ 2 + K z ) ( m ~ x ~ + K ~ ~ t ‘ ) - K ~ 2 V t ’
[mlmzD4+ (mlKz+m2K1 +m2K2)D2+KlK~lx’ = mlK2jt0 . . . . . (20)
Similarly, for y ,
The complementary functions for x’ and y are of the same form and may be obtained by the solution of the auxiliary equation
This is a quadratic equation in A2 for which the solution may be written 2mlm2h2
m~m2X4+(m~K~+m2K~+mzKz)Xz+KIKz = 0 . (22)
= - (mlK2 + m z K ~ + m2K2) f z/[(m1Kz+mzK1 +mtKd2
= - (mlKz+m2K1 +m2K2) f v“(mlK2-m2K1 -mzKd2 -4mim2KlKzl
+ 4 m l m 2 K ~ ~ l . . . (23) It is seen that the two possible values for A2 are both pure negative numbers. Thus, if the four values of X are written fiw,, fiwb, the complementary function may be expressed as
where the A-terms may be real, complex, or imaginary. It may easily be shown that this equation may be written
F, = B sin (w,t’+ a)+ C sin (wbt‘+P)
Fc = Ale+iw,t’+A2e-iw,t’+A3e+iwbt‘+A4e-i~a” . (24)
. (25)
at PENNSYLVANIA STATE UNIV on March 6, 2016pme.sagepub.comDownloaded from
242 DYNAMIC STRESSES I N ELECTRIC OVERHEAD TRAVELLING CRANES
. . . (27) i where w, and wb are seen to represent two superimposed vibra- tion frequencies. The particular integrals in the case here are simply x p = mljro/Kl and yp =. Vt‘-mlXo/Kl. The complete solutions are as equations (8) and (9)
tan cc = mlzo wa(B+1) Ki (io+BV)
migo Wb(A + 1) t a n p = -- m l x o K1 ( io+AV)
x’ = -+Xu sin (w,t’+u)+Xb sin (Wbt’+,8)
y = Vf--
Similarly equations (13) and (14) may be derived for the cases of hoisting with constant deceleration, and further equations for lowering with braking at constant deceleration. Y a sin (wbt’+ a)+ Yb sin (Wbt‘+,8)
K1 Substituting these expressions in the original equations (6) and (7) it is found that
. . . (26)
xa -- nZ2Wa2-K2 = A - YCa K2 3 - mPb2-Kz yb- K2 = B
Further, from the initial conditions
equations (8) and (9) give four more equations. From these six auxiliary equations xu, xb, Yay Yb, u and j? may be found. Thus, for example :
A P P E N D I X I 1
REFERENCES BRITISH STANDARDS INSTITUTION 1954 Report CR(MEE)6091
of B.S.I. Subcommittee on Maximum Permissible Stresses in Cranes.
BUCKINGHAM, E. 1915 Trans. A.S.M.E., vol. 37, p. 263, ‘Model Experiments and the Form of Empirical Equations’.
EDEN. T. F. 1952 ‘Consideration of Inertia Forces in Cranes’ - v
(Report to the British Standards Institution Maximum Permissible Stresses in Cranes Subcommittee).
1941 Assoc. Iron and Steel Eng. Yearbook, p. 531, ‘Report of Crane Girder Tests’.
MADSEN, I. E.
at PENNSYLVANIA STATE UNIV on March 6, 2016pme.sagepub.comDownloaded from
243
Discussion Mr. J. BAKER, M.B.E. (Member), in opening the discussion said that as one of the members of the British Standards Institution Maximum Stress Committee which had sponsored a research into stresses in overhead-travelling-crane girders, he considered that it would help in appreciating the authors’ approach to the subject if he were to give some details of the background against which those investigations had been made.
There had been few failures of overhead-crane structures, in spite of much overloading and rough usage. Failures that had occurred had been of a secondary nature and not failures in primary members, so that there was abundant evidence that overhead-crane structures were not too light.
B.S. 466 might be said to be the basic code of practice in use in most crane drawing offices. The current tendency was for more conditions of loading to be taken into consideration when designing structures so that working to existing limiting stresses tended to make structures too heavy.
It was one thing to have the knowledge at the back of the mind that a structure was lightly stressed and therefore extravagant in cost and in the use of steel, but it was another thing to prove it. Moreover, with lifting tackle one could not afford to take risks and continue lightening down to the point of failure.
Various attempts had been made in the past to measure stresses in crane girders but those had been limited by the availability of testing equipment. The development of the electrical-resistance strain gauge provided the instrument which had been awaited for years.
The British Standards Institution Maximum Stress Com- mittee when drafting a code of practice which included higher working stresses had wisely decided that they had to be prepared to back their recommendations with proof and that a physical testing investigation should be done by an independent body. The University of Leeds had kindly offered to undertake that work and the authors’ paper was the result of part of it.
The authors had been very modest and had not mentioned many of the difficulties with which they had had to contend. In the initial stages the idea had been to put at the disposal of the authors a complete crane structure for testing, but there were so many variables in crane design that it had been realized that it would have been impossible to get a complete answer from one set of crane girders. Thus it had been decided to carry out tests on a series of cranes.
It had been peculiarly difficult to find specimens for testing purposes. Most existing cranes had been ruled out either because the design data had not been available for comparison with test results or because the user was not in a position to free the crane long enough for test purposes. There was a further difficulty since, apart from the immediate building programme, the individual crane builder did not know what sizes and spans of crane would be coming through from the next batch of orders.
Overhead cranes, to a much greater extent than, for example, locomotives and aircraft, had their overall dimensions controlled by building and site conditions.
It had finally been agreed that the first batch of tests should be on cranes in production in a maker’s works.
At that point he himself had come into the picture because he had been in the position of having to maintain a delicate balance between the requirements of the authors who wanted a crane on test as long as possible and a works manager who was anxious to get the crane out of the way and keep the output of his works flowing.
While there had been many complaints about the hold-up in production, he did not think there had been any serious trouble, and it spoke volumes for the tact of the authors. They had, however, been at a serious disadvantage because they could not leave their strain gauges and instruments upon the test speci- mens until they had worked out their results, so that there had rarely been a chance to make a re-check on the same
structure, and he was sure that some of the results must have had to be discarded for that reason.
Again, the authors had been up against difficulties because many cranes, particularly the heavy-duty ones, had so many non-stress-carrying members in the way of hand rails, platforms, and stairways, which tended to absorb some of the load meant to be carried by the main members.
One of the disappointments from his own point of view was that the authors had not yet devised a method for measuring the total stress in a member. All they were measuring was the variation in stress due to change of load. He still hoped that it would be possible to devise some means of measuring the combined stress due to the dead weight of the structure and the load because, from a designer’s point of view, it was the total stress which was the limiting factor. In comparing the curves given in the paper, it should be borne
in mind that the slower cranes tested had been on A.C. supply whereas the fast ones had been on D.C., with the result that the maximum speed on the crane on A.C. supply had been limited to full-load speed of the motor whereas on D.C. supply the motors exceeded the full-load speeds, so that the difference shown between low- and high-speed cranes tended to be slightly exaggerated.
On p. 238 the authors had mentioned that they had neglected a small amount of damping in a steel-wire rope. As far as those tests were concerned, that might be acceptable, but he suspected that rope makers would take issue on that point since, of course, the damping effect of a wire rope was a well-recognized factor and, were it not for that damping effect, winding from deep shafts would not be possible.
In Table 1 the most interesting result, in his opinion, was the fact that the fixing of the crab rail did not appear to have any effect on the dynamic factor. There was no doubt that the crab rail distributed the load in the top boom of the girder to a greater extent than had been allowed for in calculations, and further investigation would be useful to see if there was any scope for economy in design by taking account of the spreading of the load by the crab rail.
On p. 240 the authors had pointed out that the agreed dynamic factors ignored hoisting speeds. That was not correct, because there was a definite range of hoisting speeds associated with each class of crane, the speeds getting faster as the duties increased; although the speed range was not stated, it was, in fact, implied.
In addition, Table 4 in the form shown was apt to be mis- leading since it was extracted from a larger table which gave in addition graded stress factors. For design purposes the load was increased through multiplying by the dynamic factor. The maximum allowable stress was also reduced by multiplying by a correction factor. It would be seen, therefore, that a small change in stress and dynamic factor could make a considerable difference in the allowable load on a given member in a structure.
Finally, although he knew that the authors were fully aware of it, he considered that it should be made clear that shock loading due to hoisting was only one form of shock loading to which an overhead crane was subjected.
Mr. A. G. WESTMORELAND (Member) said that he was interested to note that the paper, which provided a useful comparison of experimental and theoretical evidence, was in agreement with tests which had been carried out about three years previously on a 20-ton crane which his company had built for handling plates in a steel mill.
In that instance the conclusion from electric-resistance strain- gauge tests had given a maximum dynamic factor of 1.4 when snatching a load of 20 tons from the ground with slack ropes and a hoisting speed of 6 in. per sec.
Comparative calculations, based also on tackle stiffness with
at PENNSYLVANIA STATE UNIV on March 6, 2016pme.sagepub.comDownloaded from
244 DISCUSSION ON DYNAMIC STRESSES I N ELECTRIC OVERHEAD TRAVELLING CRANES
the load resting on the ground, were as followed. With the approximate formula, equation (1 6) gave a value for D of 1.55. With Eden’s formula, equation (17) gave D as 1.385. With Madsen’s formula, equation (18) gave D as 1.246. With that formula he had had some difficulty in getting satisfactory results because the notation given in the paper was not in agreement with that given in the specification of the Association of Iron and Steel Engineers. He was of the opinion that there was a slight error in the figure given in the paper. With the simple formula, equation (19) gave D as 1.552.
Those results showed that equations (16) and (19) were in good agreement for the crane and were also a little in excess of the test result.
The experimental and theoretical values given in Table 1 did not take into account the duty and working conditions, while the classification (Table 4) ignored rate of hoisting and tackle stiffness.
It was difficult to arrive at a standard set of values which would take all of those variables into account. The authors’ suggestion that a simple formula such as equation (19) should be considered was a solution which provided for both classification and speed of hoisting and required adjustment for tackle stiffness only. He considered that to be a type of formula which com- mended itself for adoption for the revised British Standard.
With reference to Table 1, it was noted that for crane No. 5610 the complete analysis gave lower dynamic factors for hoist speeds of 3.35 and 3.06 in. per sec. than for 2.60 in. per sec. That did not agree with other formulae which gave higher dynamic factors for snatching at higher speeds of hoisting.
Dr. N. JACKSON, B.Sc., Grad.1.C.E. (Bristol), said that in the paper it had been stated that the highest dynamic stresses in the girders during normal crane operation on good rails were those due to impulsive effects in hoisting motion.
He was wondering whether any tests had been carried out on rails with bad joints. The reason why he wondered that was that for extremely long-span cranes-100 feet or more-the static dead-load stresses might be considerably greater than the live-load stresses, and it might be expected that the shock on going over a bad rail joint would, owing to the relatively high dead load, cause larger dynamic stresses than would the hoisting motion. He would be pleased to hear whether the authors had investigated that aspect of dynamic stresses.
There was another aspect of dynamic stressing due to shock. The crane used for test purposes in the scrap yard at Rotherham was a magnet crane. He had seen such cranes used with the current switched on when the magnetic pick-up was still a number of inches from the load. When the current was switched on, the load then jumped from the ground to the pick-up. That might, perhaps, cause high stresses. He asked the authors to say whether that had been considered and whether such a dynamic effect was likely to cause stresses comparable with those under more normal usage.
In Figs. 4, 5, and 6, there were shown some interesting com- parisons between the theoretical and experimental stress-time curves in the hoisting motion. The first point he would like to mention was the fact that, during the second part of the motion, although the theoretical curves showed a stepped wave because of the superposition of vibrations of two different frequencies, the actual wave appeared to approximate closely to a sine wave (that applied particularly to Figs. 4 and 5). He wondered whether that might be due to the fact that the vibration of the hoisting cable (spring (2)) was already completely damped out, leaving only that of the loaded crane girders, which would be a sinusoidal wave. He would like to hear whether any stress measurements had been made at the pick-up between the hoisting cable and the applied load to assess the magnitude of the damping of the hoisting-cable vibrations.
The frequencies of the crane girder used in the theoretical analysis had been based on theoretical stiffnesses. It was seen that the actual frequencies on the curve differed slightly from those found on the actual girder. He wondered whether any analysis had been carried out, using the observed frequencies rather than the theoretical stiffness of the crane girders, and, if so, whether the theoretical traces were then in closer agreement with the experimental values.
In regard to Fig. 6 it had been stated that considerable damp- ing had been observed. He considered that that was possibly an overstatement because it was noted that the theoretical stress- time curve indicated an inherent apparent damping.
On p. 241 there was quoted the formula D = 1 + CV, and the values given for C were 0.10 for class I1 and 0.16 for class IV cranes. There did not appear to be any values of C quoted for class I or class I11 cranes, and he wondered whether any further work was in progress to determine such constants or whether it was considered that for class I11 one would interpolate between the values for class I1 and class IV and extrapolate from those for class I cranes.
Mr. J. F. EDEN, B.Sc. (Eng.) (Member), said that the authors’ paper threw some light on a matter which had long been an issue with those interested in the design of cranes. The object of assessing dynamic stresses more accurately was, of course, to enable designers to produce lighter and stronger cranes. Dynamic stresses had never been ignored by crane designers, but in the past it had been customary to allow for those by using a large factor of safety in the design of the whole crane. More recently and more logically, it had been customary to make some allowance for dynamic loads due to the motion of the hook rope by adding something to the weight of the load.
That had led to a practice on the continent of Europe, which appeared to be gaining ground in Britain, of using a factor to assess the dynamic load, a factor multiplied by the static load. That was a practice with which he heartily disagreed since it tacitly assumed that the extra force due to snatching was directly proportional to the static load. Any theoretical investiga- tion or any test that he had seen showed that that was not the case. He could never quite understand why that was done. It was just as easy to add something to the load as it was to multiply something. He could not see the point of it.
The real issue was, of course, to measure and account for the dynamic forces caused by the motion of the hook load.
As the authors had pointed out, the dynamic force produced when snatching a load was likely to be higher than any other. The only circumstance, in his opinion, when the dynamic force due to braking would be greater than the snatch force would be when the velocity of lowering was greatly in excess of that of hoisting. However, to his mind there was little point in establishing formulae for the force in the hoist rope due to decelerating a load. That force was the braking force, and the braking force was caused by the brake. That was calculated when the brake was designed and could easily be added to the hook load.
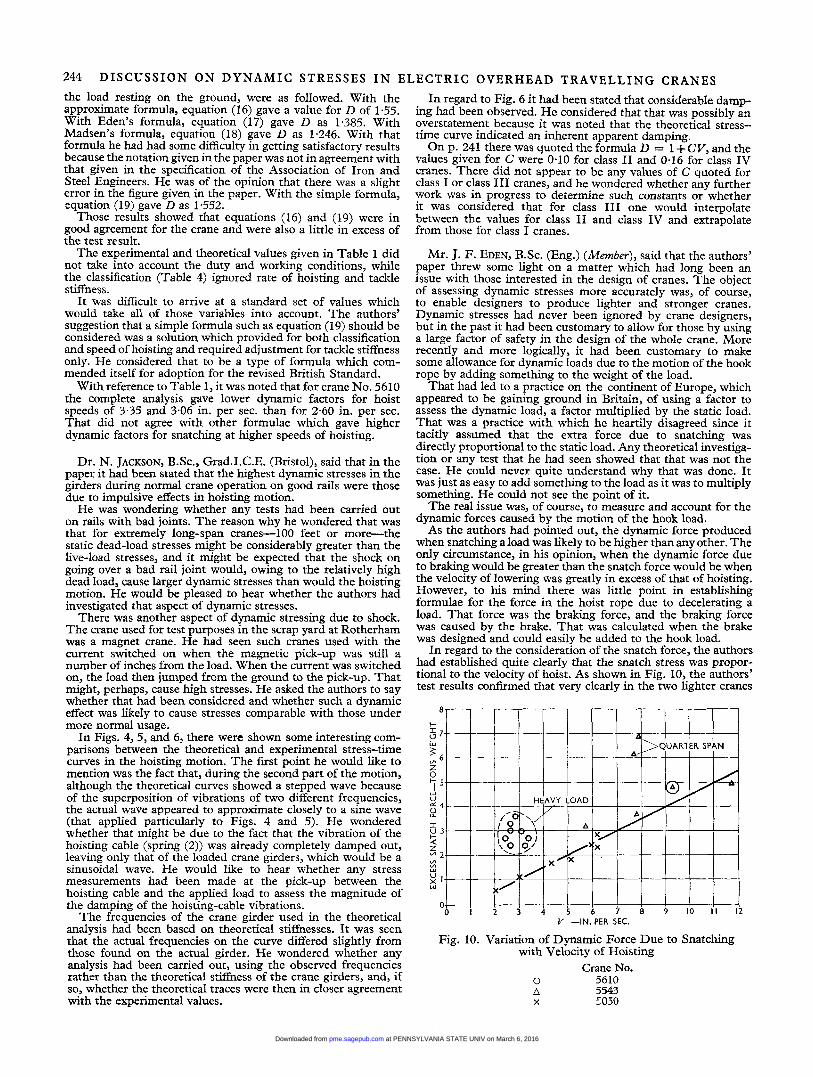
In regard to the consideration of the snatch force, the authors had established quite clearly that the snatch stress was propor- tional to the velocity of hoist. As shown in Fig. 10, the authors’ test results confirmed that very clearly in the two lighter cranes
V -IN. PER SEC.
Fig. 10. Variation of Dynamic Force Due to Snatching with Velocity of Hoisting
Crane No. 0 5610 A 5543 X 5050
at PENNSYLVANIA STATE UNIV on March 6, 2016pme.sagepub.comDownloaded from
D I S C U S S I O N O N D Y N A M I C STRESSES I N ELECTRIC OVERHEAD T R A V E L L I N G CRANES 245
Lu '.
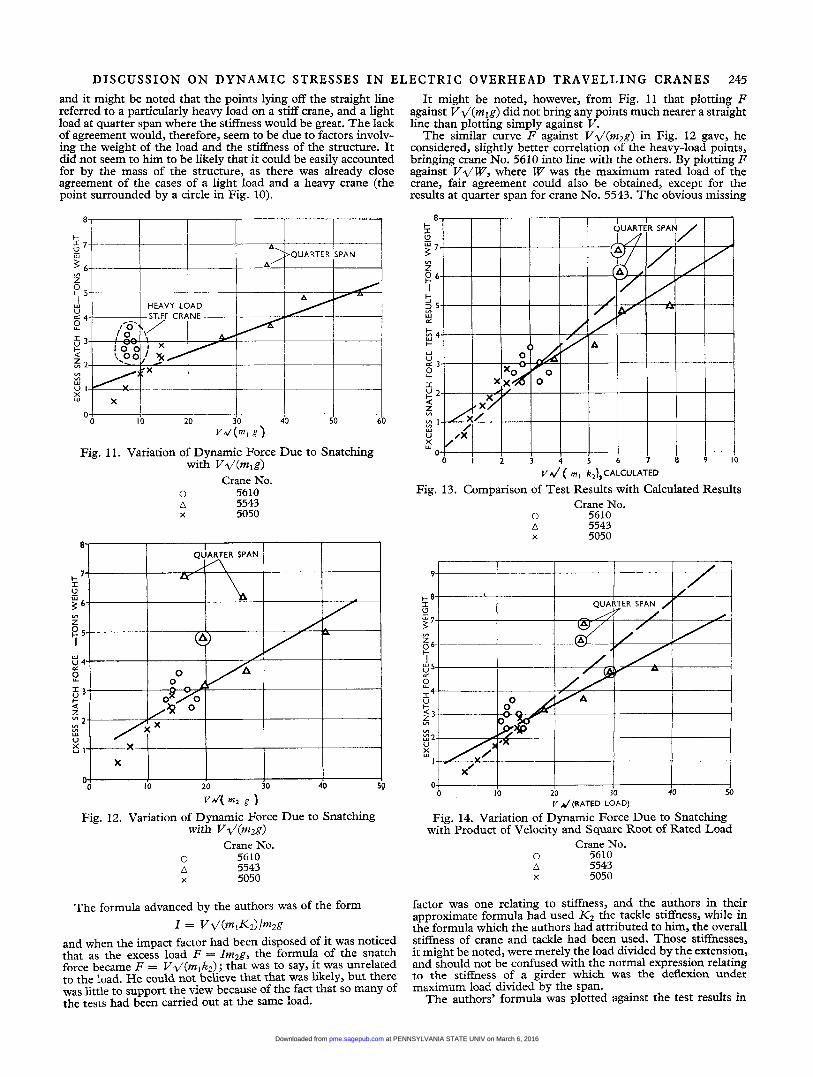
and it might be noted that the points lying off the straight line referred to a particularly heavy load on a stiff crane, and a light load at quarter span where the stiffness would be great. The lack of agreement would, therefore, seem to be due to factors involv- ing the weight of the load and the stiffness of the structure. It did not seem to him to be likely that it could be easily accounted for by the mass of the structure, as there was already close agreement of the cases of a light load and a heavy crane (the point surrounded by a circle in Fig. 10).
QUARTER SPAN
L"
x I I
Z
P 5 I
9 I 3 Y $ 2
Y '
w U " 4
4
v) v) Y
0 ,
0-.
X
0 10 20 30 40 5Q
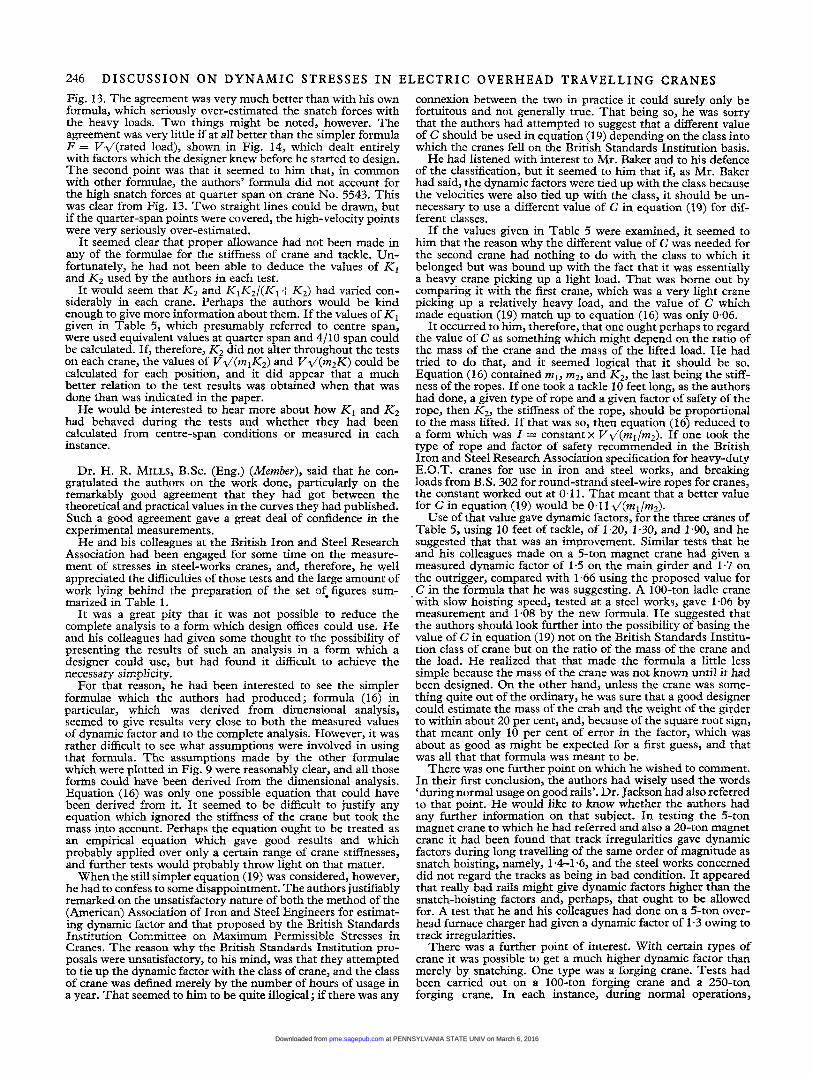
?'4 m2 g I Fig. 12. Variation of Dynamic Force Due to Snatching
with V.\/(m2g) Crane No.
n 5610 v
A 5543 X 5050
The formula advanced by the authors was of the form I = Vd(mdG)/mzg
and when the impact factor had been disposed of it was noticed that as the excess load F = Im2g, the formula of the snatch force became F = V4(mlk2); that was to say, it was unrelated to the load. He could not believe that that was likely, but there was little to support the view because of the fact that so many of the tests had been carried out at the same bad.
It might be noted, however, from Fig. 11 that plotting F against Vl / (mlg ) did not bring any points much nearer a straight line than plotting simply against V.
The similar curve F against Vd(m2g) in Fig. 12 gave, he considered, slightly better correlation of the heavy-load points, bringing crane No. 5610 into line with the others. By plotting F against V d W , where W was the maximum rated load of the crane, fair agreement could also be obtained, except for the results at quarter span for crane No. 5543. The obvious missing
V d J ( m l k2),CALCULATED
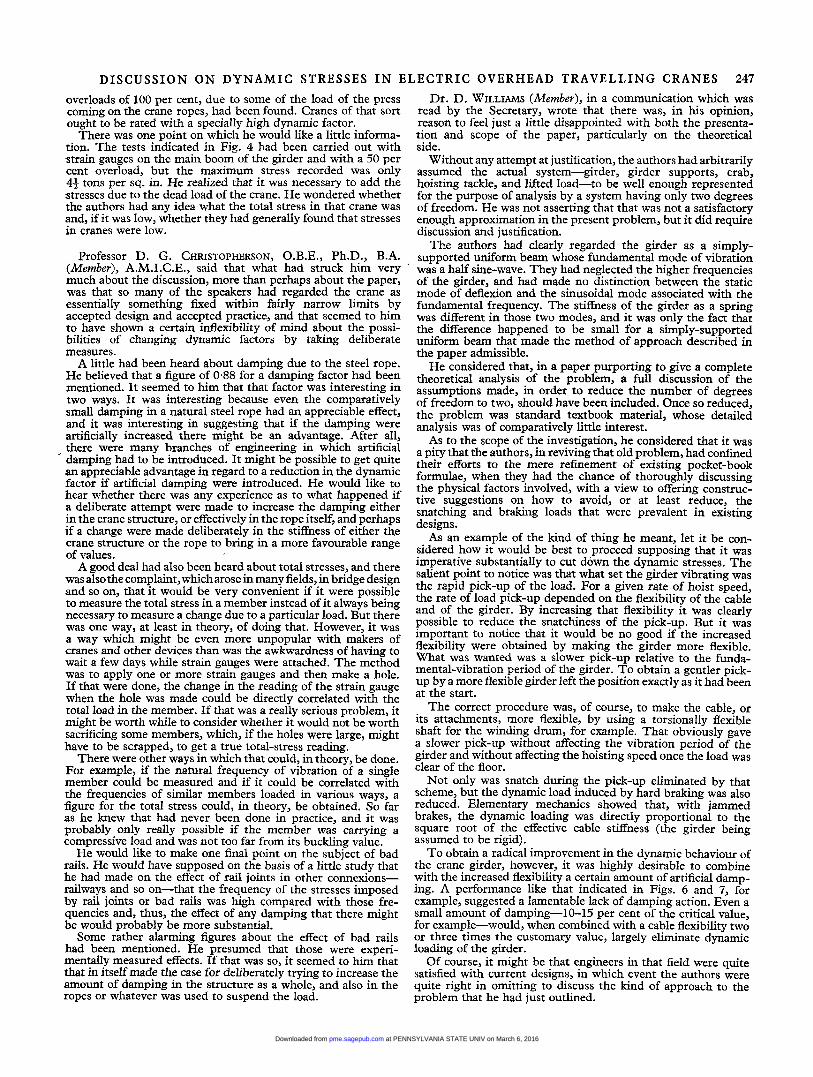
Fig. 13. Comparison of Test Results with Calculated Results Crane No.
0 5610 A 5543 X 5050
04 I I I I I 1 10 20 30 40 50 0
V /(RATED LOAD)
Fig. 14. Variation of Dynamic Force Due to Snatching with Product of Velocity and Square Root of Rated Load
Crane NO. 0 5610 A 5543 X 5050
factor was one relating to stiffness, and the authors in their approximate formula had used K2 the tackle stiffness, while in the formula which the authors had attributed to him, the overall stiffness of crane and tackle had been used. Those stiffnesses, it might be noted, were merely the load divided by the extension, and should not be confused with the normal expression relating to the stiffness of a girder which was the deflexion under maximum load divided by the span.
The authors' formula was plotted against the test results in
at PENNSYLVANIA STATE UNIV on March 6, 2016pme.sagepub.comDownloaded from
246 DISCUSSION ON DYNAMIC STRESSES I N ELECTRIC OVERHEAD TRAVELLING CRANES
Fig. 13. The agreement was very much better than with his own formula, which seriously over-estimated the snatch forces with the heavy loads. Two things might be noted, however. The agreement was very little if at all better than the simpler formula F = Yd(rated load), shown in Fig. 14, which dealt entirely with factors which the designer knew before he started to design. The second point was that it seemed to him that, in common with other formulae, the authors’ formula did not account for the high snatch forces at quarter span on crane No. 5543. This was clear from Fig. 13. Two straight lines could be drawn, but if the quarter-span points were covered, the high-velocity points were very seriously over-estimated.
It seemed clear that proper allowance had not been made in any of the formulae for the stiffness of crane and tackle. Un- fortunately, he had not been able to deduce the values of K1 and K2 used by the authors in each test.
It would seem that K2 and KIK2/(K1+K2) had varied con- siderably in each crane. Perhaps the authors would be kind enough to give more information about them. If the values of K1 given in Table 5, which presumably referred to centre span, were used equivalent values at quarter span and 4/10 span could be calculated. If, therefore, K2 did not alter throughout the tests on each crane, the values of V.\/(rnlK~) and V.\/(mzK) could be calculated for each position, and it did appear that a much better relation to the test results was obtained when that was done than was indicated in the paper.
He would be interested to hear more about how K1 and K2 had behaved during the tests and whether they had been calculated from centre-span conditions or measured in each mstance.
Dr. H. R. MILLS, B.Sc. (Eng.) (Member), said that he con- gratulated the authors on the work done, particularly on the remarkably good agreement that they had got between the theoretical and practical values in the curves they had published. Such a good agreement gave a great deal of confidence in the experimental measurements.
He and his colleagues at the British Iron and Steel Research Association had been engaged for some time on the measure- ment of stresses in steel-works cranes, and, therefore, he well appreciated the difficulties of those tests and the large amount of work lying behind the preparation of the set of.figures sum- marized in Table 1.
It was a great pity that it was not possible to reduce the complete analysis to a form which design offices could use. He and his colleagues had given some thought to the possibility of presenting the results of such an analysis in a form which a designer could use, but had found it difficult to achieve the necessary simplicity.
For that reason, he had been interested to see the simpler formulae which the authors had produced; formula (16) in particular, which was derived from dimensional analysis, seemed to give results very close to both the measured values of dynamic factor and to the complete analysis. However, it was rather difficult to see what assumptions were involved in using that formula. The assumptions made by the other formulae which were plotted in Fig. 9 were reasonably clear, and all those forms could have been derived from the dimensional analysis. Equation (16) was only one possible equation that could have been derived from it. It seemed to be difficult to justify any equation which ignored the stiffness of the crane but took the mass into account. Perhaps the equation ought to be treated as an empirical equation which gave good results and which probably applied over only a certain range of crane stsnesses, and further tests would probably throw light on that matter.
When the still simpler equation (19) was considered, however, he had to confess to some disappointment. The authors justifiably remarked on the unsatisfactory nature of both the method of the (American) Association of Iron and Steel Engineers for estimat- ing dynamic factor and that proposed by the British Standards Institution Committee on Maximum Permissible Stresses in Cranes. The reason why the British Standards Institution pro- posals were unsatisfactory, to his mind, was that they attempted to tie up the dynamic factor with the class of crane, and the class of crane was defined merely by the number of hours of usage in a year. That seemed to him to be quite illogical; if there was any
connexion between the two in practice it could surely only be fortuitous and not generally true. That being so, he was sorry that the authors had attempted to suggest that a different value of C should be used in equation (19) depending on the class into which the cranes fell on the British Standards Institution basis.
He had listened with interest to Mr. Baker and to his defence of the classification, but it seemed to him that if, as Mr. Baker had said, the dynamic factors were tied up with the class because the velocities were also tied up with the class, it should be un- necessary to use a different value of C in equation (19) for dif- ferent classes.
If the values given in Table 5 were examined, it seemed to him that the reason why the different value of C was needed for the second crane had nothing to do with the class to which it belonged but was bound up with the fact that it was essentially a heavy crane picking up a light load. That was borne out by comparing it with the first crane, which was a very light crane picking up a relatively heavy load, and the value of C which made equation (19) match up to equation (16) was only 0.06.
It occurred to him, therefore, that one ought perhaps to regard the value of C as something which might depend on the ratio of the mass of the crane and the mass of the lifted load. He had tried to do that, and it seemed logical that it should be so. Equation (16) contained m l , m2, and K2, the last being the stiff- ness of the ropes. If one took a tackle 10 feet long, as the authors had done, a given type of rope and a given factor of safety of the rope, then K2, the stiffness of the rope, should be proportional to the mass lifted. If that was so, then equation (16) reduced to a form which was I = constant x V 4 ( m l / m 2 ) . If one took the type of rope and factor of safety recommended in the British Iron and Steel Research Association specification for heavy-duty E.O.T. cranes for use in iron and steel works, and breaking loads from B.S. 302 for round-strand steel-wire ropes for cranes, the constant worked out at 0.1 1. That meant that a better value for C in equation (19) would be 0.11.\/(ml/m2).
Use of that value gave dynamic factors, for the three cranes of Table 5, using 10 feet of tackle, of 1.20, 1.30, and 1.90, and he suggested that that was an improvement. Similar tests that he and his colleagues made on a 5-ton magnet crane had given a measured dynamic factor of 1-5 on the main girder and 1.7 on the outrigger, compared with 1.66 using the proposed value for C in the formula that he was suggesting. A 100-ton ladle crane
‘with slow hoisting speed, tested at a steel works, gave 1.06 by measurement and 1.08 by the new formula. He suggested that the authors should look further into the possibility of basing the value of C in equation (19) not on the British Standards Institu- tion class of crane but on the ratio of the mass of the crane and the load. He realized that that made the formula a little less simple because the mass of the crane was not known until it had been designed, On the other hand, unless the crane was some- thing quite out of the ordinary, he was sure that a good designer could estimate the mass of the crab and the weight of the girder to within about 20 per cent, and, because of the square root sign, that meant only 10 per cent of error in the factor, which was about as good as might be expected for a first guess, and that was all that that formula was meant to be.
There was one further point on which he wished to comment. In their first conclusion, the authors had wisely used the words ‘during normal usage on good rails’. Dr. Jackson had also referred to that point. He would like to know whether the authors had any further information on that subject. In testing the 5-ton magnet crane to which he had referred and also a 20-ton magnet crane it had been found that track irregularities gave dynamic factors during long travelling of the same order of magnitude as snatch hoisting, namely, 14-1.6, and the steel works concerned did not regard the tracks as being in bad condition. It appeared that really bad rails might give dynamic factors higher than the snatch-hoisting factors and, perhaps, that ought to be allowed for. A test that he and his colleagues had done on a 5-ton over- head furnace charger had given a dynamic factor of 1.3 owing to track irregularities.
There was a further point of interest. With certain types of crane it was possible to get a much higher dynamic factor than merely by snatching. One type was a forging crane. Tests had been carried out on a 100-ton forging crane and a 250-ton forging crane. In each instance, during normal operations,
at PENNSYLVANIA STATE UNIV on March 6, 2016pme.sagepub.comDownloaded from
DISCUSSION ON DYNAMIC STRESSES I N ELECTRIC OVERHEAD TRAVELLING CRANES 247
overloads of 100 per cent, due to some of the load of the press coming on the crane ropes, had been found. Cranes of that sort ought to be rated with a specially high dynamic factor.
There was one point on which he would like a little informa- tion. The tests indicated in Fig. 4 had been carried out with strain gauges on the main boom of the girder and with a 50 per cent overload, but the maximum stress recorded was only 45 tons per sq. in. He realized that it was necessary to add the stresses due to the dead load of the crane. He wondered whether the authors had any idea what the total stress in that crane was and, if it was low, whether they had generally found that stresses in cranes were low.
Professor D. G. CHRISTOPHERSON, O.B.E., Ph.D., B.A. {Member), A.M.I.C.E., said that what had struck him very much about the discussion, more than perhaps about the paper, was that so many of the speakers had regarded the crane as essentially something fixed within fairly narrow limits by accepted design and accepted practice, and that seemed to him to have shown a certain inflexibility of mind about the possi- bilities of changing dynamic factors by taking deliberate measures.
A little had been heard about damping due to the steel rope. He believed that a figure of 0.88 for a damping factor had been mentioned. It seemed to him that that factor was interesting in two ways. It was interesting because even the comparatively small damping in a natural steel rope had an appreciable effect, and it was interesting in suggesting that if the damping were artificially increased there might be an advantage. After all, there were many branches of engineering in which artificial
' damping had to be introduced. It might be possible to get quite an appreciable advantage in regard to a reduction in the dynamic factor if artificial damping were introduced. He would like to hear whether there was any experience as to what happened if a deliberate attempt were made to increase the damping either in the crane structure, or effectively in the rope itsell; and perhaps if a change were made deliberately in the stiffness of either the crane structure or the rope to bring in a more favourable range of values.
A good deal had also been heard about total stresses, and there was also the complaint, whicharose in many fields ,.in bridge design and so on, that it would be very convenient if it were possible to measure the total stress in a member instead of it always being necessary to measure a change due to a particular load. But there was one way, at least in theory, of doing that. However, it was a way which might be even more unpopular with makers of cranes and other devices than was the awkwardness of having to wait a few days while strain gauges were attached. The method was to apply one or more strain gauges and then make a hole. If that were done, the change in the reading of the strain gauge when the hole was made could be directly correlated with the total load in the member. If that was a really serious problem, it might be worth while to consider whether it would not be worth sacrificing some members, which, if the holes were large, might have to be scrapped, to get a true total-stress reading.
There were other ways in which that could, in theory, be done. For example, if the natural frequency of vibration of a single member could be measured and if it could be correlated with the frequencies of similar members loaded in various ways, a figure for the total stress could, in theory, be obtained. So far as he knew that had never been done in practice, and it was probably only really possible if the member was carrying a compressive load and was not too far from its buckling value.
He would like to make one final point on the subject of bad rails. He would have supposed on the basis of a little study that he had made on the effect of rail joints in other connexions- railways and so on-that the frequency of the stresses imposed by rail joints or bad rails was high compared with those fre- quencies and, thus, the effect of any damping that there might be would probably be more substantial.
Some rather alarming figures about the effect of bad rails had been mentioned. He presumed that those were experi- mentally measured effects. If that was so, it seemed to him that that in itself made the case for deliberately trying to increase the amount of damping in the structure as a whole, and also in the ropes or whatever was used to suspend the load.
Dr. D. WILLIAMS (Member), in a communication which was read by the Secretary, wrote that there was, in his opinion, reason to feel just a little disappointed with both the presenta- tion and scope of the paper, particularly on the theoretical side.
Without any attempt at justification, the authors had arbitrarily assumed the actual system-girder, girder supports, crab, hoisting tackle, and lifted load-to be well enough represented for the purpose of analysis by a system having only two degrees of freedom. He was not asserting that that was not a satisfactory enough approximation in the present problem, but it did require discussion and justification.
The authors had clearly regarded the girder as a simply- supported uniform beam whose fundamental mode of vibration was a half sine-wave. They had neglected the higher frequencies of the girder, and had made no distinction between the static mode of deflexion and the sinusoidal mode associated with the fundamental frequency. The stiffness of the girder as a spring was different in those two modes, and it was only the fact that the difference happened to be small for a simply-supported uniform beam that made the method of approach described in the paper admissible.
He considered that, in a paper purporting to give a complete theoretical analysis of the problem, a full discussion of the assumptions made, in order to reduce the number of degrees of freedom to two, should have been included. Once so reduced, the problem was standard textbook material, whose detailed analysis was of comparatively little interest.
As to the scope of the investigation, he considered that it was a pity that the authors, in reviving that old problem, had confined their efforts to the mere refinement of existing pocket-book formulae, when they had the chance of thoroughly discussing the physical factors involved, with a view to offering construc- tive suggestions on how to avoid, or at least reduce, the snatching and braking loads that were prevalent in existing designs.
As an example of the kind of thing he meant, let it be con- sidered how it would be best to proceed supposing that it was imperative substantially to cut down the dynamic stresses. The salient point to notice was that what set the girder vibrating was the rapid pick-up of the load. For a given rate of hoist speed, the rate of load pick-up depended on the flexibility of the cable and of the girder. By increasing that flexibility it was clearly possible to reduce the snatchiness of the pick-up. But it was important to notice that it would be no good if the increased flexibility were obtained by making the girder more flexible. What was wanted was a slower pick-up relative to the funda- mental-vibration period of the girder. To obtain a gentler pick- up by a more flexible girder left the position exactly as it had been at the start.
The correct procedure was, of course, to make the cable, or its attachments, more flexible, by using a torsionally flexible shaft for the winding drum, for example. That obviously gave a slower pick-up without affecting the vibration period of the girder and without affecting the hoisting speed once the load was clear of the floor.
Not only was snatch during the pick-up eliminated by that scheme, but the dynamic load induced by hard braking was also reduced. Elementary mechanics showed that, with jammed brakes, the dynamic loading was directly proportional to the square root of the effective cable stiffness (the girder being assumed to be rigid).
To obtain a radical improvement in the dynamic behaviour of the crane girder, however, it was highly desirable to combine with the increased flexibility a certain amount of artificial damp- ing. A performance like that indicated in Figs. 6 and 7, for example, suggested a lamentable lack of damping action. Even a small amount of damping-10-15 per cent of the critical value, for example-would, when combined with a cable flexibility two or three times the customary value, largely eliminate dynamic loading of the girder.
Of course, it might be that engineers in that field were quite satisfied with current designs, in which event the authors were quite right in omitting to discuss the kind of approach to the problem that he had just outlined.
at PENNSYLVANIA STATE UNIV on March 6, 2016pme.sagepub.comDownloaded from
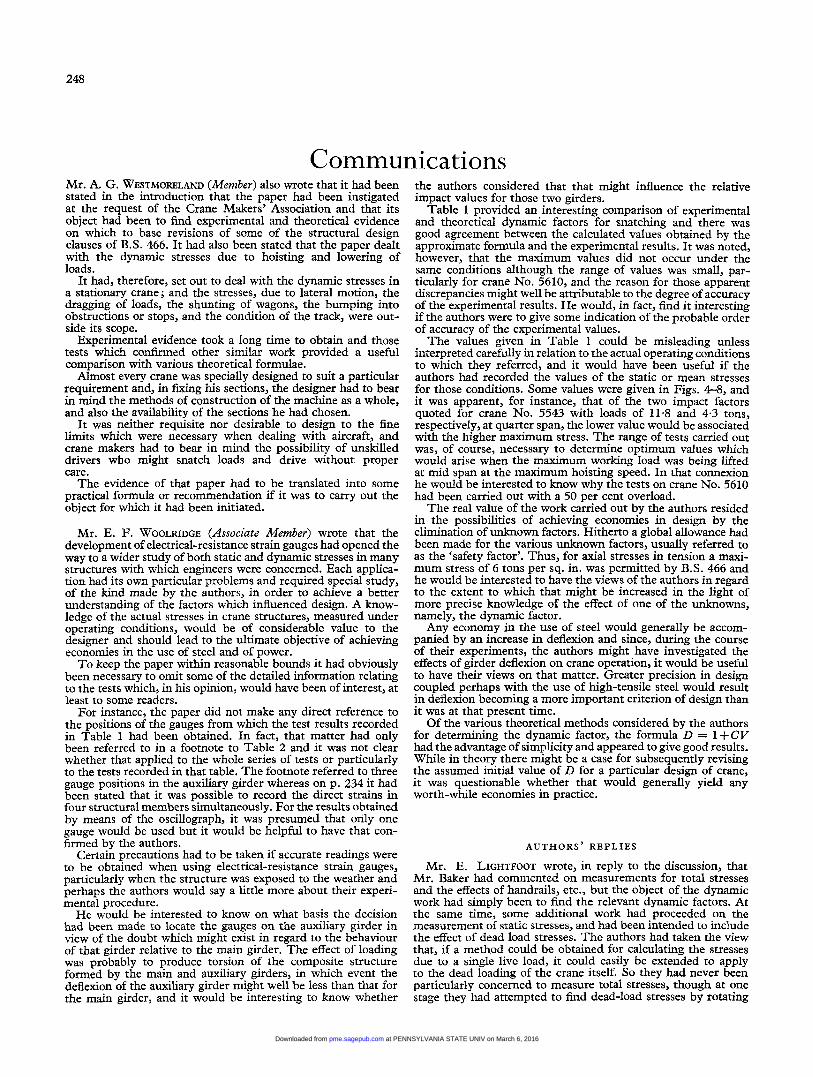
248
Communications Mr. A. G. WESTMORELAND (Member) also wrote that it had been stated in the introduction that the paper had been instigated at the request of the Crane Makers’ Association and that its object had been to find experimental and theoretical evidence on which to base revisions of some of the structural design clauses of B.S. 466. It had also been stated that the paper dealt with the dynamic stresses due to hoisting and lowering of loads.
It had, therefore, set out to deal with the dynamic stresses in a stationary crane; and the stresses, due to lateral motion, the dragging of loads, the shunting of wagons, the bumping into obstructions or stops, and the condition of the track, were out- side its scope.
Experimental evidence took a long time to obtain and those tests which confirmed other similar work provided a useful comparison with various theoretical formulae.
Almost every crane was specially designed to suit a particular requirement and, in fixing his sections, the designer had to bear in mind the methods of construction of the machine as a whole, and also the availability of the sections he had chosen.
It was neither requisite nor desirable to design to the fine limits which were necessary when dealing with aircraft, and crane makers had to bear in mind the possibility of unskilled drivers who might snatch loads and drive without proper care.
The evidence of that paper had to be translated into some practical formula or recommendation if it was to carry out the object for which it had been initiated.
Mr. E. F. WOOLRIDGE (Associate Member) wrote that the development of electrical-resistance strain gauges had opened the way to a wider study of both static and dynamic stresses in many structures with which engineers were concerned. Each applica- tion had its own particular problems and required special study, of the kind made by the authors, in order to achieve a better understanding of the factors which influenced design. A know- ledge of the actual stresses in crane structures, measured under operating conditions, would be of considerable value to the designer and should lead to the ultimate objective of achieving economies in the use of steel and of power.
To keep the paper within reasonable bounds it had obviously been necessary to omit some of the detailed information relating to the tests which, in his opinion, would have been of interest, at least to some readers.
For instance, the paper did not make any direct reference to the positions of the gauges from which the test results recorded in Table 1 had been obtained. In fact, that matter had only been referred to in a footnote to Table 2 and it was not clear whether that applied to the whole series of tests or particularly to the tests recorded in that table. The footnote referred to three gauge positions in the auxiliary girder whereas on p. 234 it had been stated that it was possible to record the direct strains in four structural members simultaneously. For the results obtained by means of the oscillograph, it was presumed that only one gauge would be used but it would be helpful to have that con- firmed by the authors.
Certain precautions had to be taken if accurate readings were to be obtained when using electrical-resistance strain gauges, particularly when the structure was exposed to the weather and perhaps the authors would say a little more about their experi- mental procedure.
He would be interested to know on what basis the decision had been made to locate the gauges on the auxiliary girder in view of the doubt which might exist in regard to the behaviour of that girder relative to the main girder. The effect of loading was probably to produce torsion of the composite structure formed by the main and auxiliary girders, in which event the &flexion of the auxiliary girder might well be less than that for the main girder, and it would be interesting to know whether
the authors considered that that might influence the relative impact values for those two girders.
Table 1 provided an interesting comparison of experimental and theoretical dynamic factors for snatching and there was good agreement between the calculated values obtained by the approximate formula and the experimental results. It was noted, however, that the maximum values did not occur under the same conditions although the range of values was small, par- ticularly for crane No. 5610, and the reason for those apparent discrepancies might well be attributable to the degree of accuracy of the experimental results. He would, in fact, find it interesting if the authors were to give some indication of the probable order of accuracy of the experimental values.
The values given in Table 1 could be misleading unless interpreted carefully in relation to the actual operating conditions to which they referred, and it would have been useful if the authors had recorded the values of the static or mean stresses for those conditions. Some values were given in Figs. 4-8, and it was apparent, for instance, that of the two impact factors quoted for crane No. 5543 with loads of 11.8 and 4.3 tons, respectively, at quarter span, the lower value would be associated with the higher maximum stress. The range of tests carried out was, of course, necessary to determine optimum values which would arise when the maximum working load was being lifted at mid span at the maximum hoisting speed. In that connexion he would be interested to know why the tests on crane No. 5610 had been carried out with a 50 per cent overload.
The real value of the work carried out by the authors resided in the possibilities of achieving economies in design by the elimination of unknown factors. Hitherto a global allowance had been made for the various unknown factors, usually referred to as the ‘safety factor’. Thus, for axial stresses in tension a maxi- mum stress of 6 tons per sq. in. was permitted by B.S. 466 and he would be interested to have the views of the authors in regard to the extent to which that might be increased in the light of more precise knowledge of the effect of one of the unknowns, namely, the dynamic factor.
Any economy in the use of steel would generally be accom- panied by an increase in deflexion and since, during the course of their experiments, the authors might have investigated the effects of girder deflexion on crane operation, it would be useful to have their views on that matter. Greater precision in design coupled perhaps with the use of high-tensile steel would result in deflexion becoming a more important criterion of design than it was at that present time.
Of the various theoretical methods considered by the authors for determining the dynamic factor, the formula D = 1 + CV had the advantage of simplicity and appeared to give good results. While in theory there might be a case for subsequently revising the assumed initial value of D for a particular design of crane, it was questionable whether that would generally yield any worth-while economies in practice.
AUTHORS’ R E P L I E S
Mr. E. LIGHTFOOT wrote, in reply to the discussion, that Mr. Baker had commented on measurements for total stresses and the effects of handrails, etc., but the object of the dynamic work had simply been to find the relevant dynamic factors. At the same time, some additional work had proceeded on the measurement of static stresses, and had been intended to include the effect of dead load stresses. The authors had taken the view that, if a method could be obtained for calculating the stresses due to a single live load, it could easily be extended to apply to the dead loading of the crane itself. So they had never been particularly concerned to measure total stresses, though at one stage they had attempted to find dead-load stresses by rotating
at PENNSYLVANIA STATE UNIV on March 6, 2016pme.sagepub.comDownloaded from
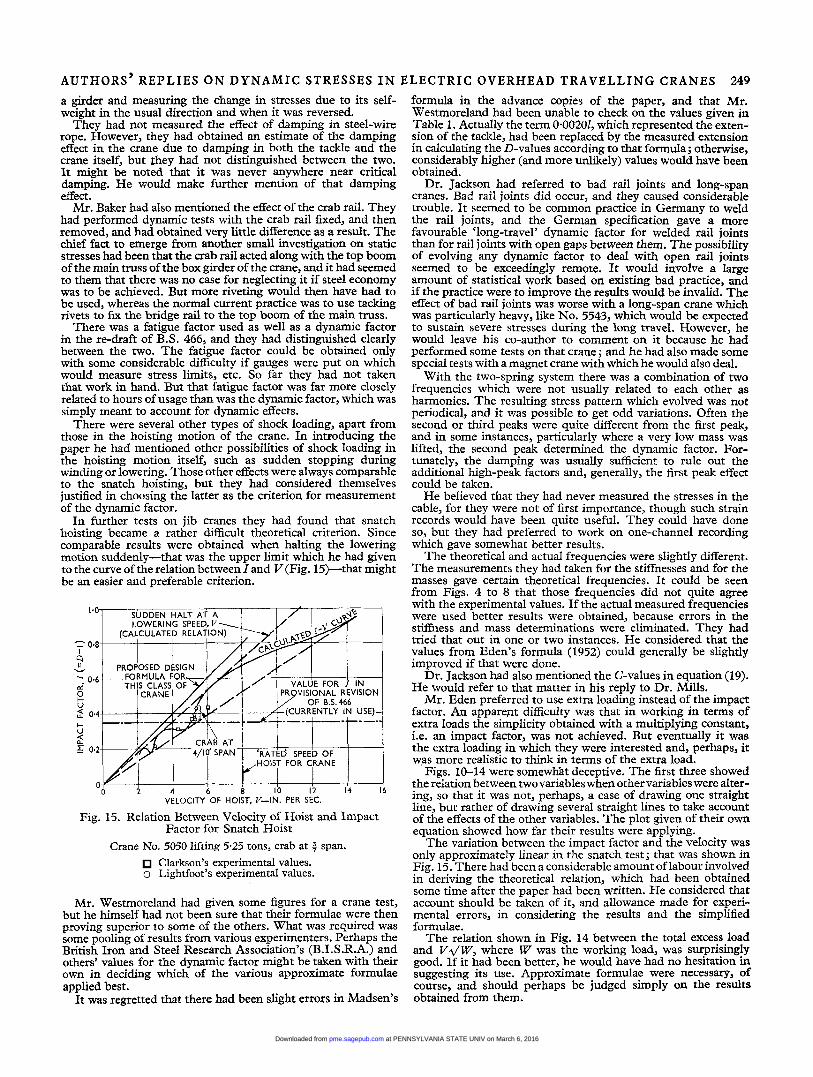
AUTHORS’ REPLIES O N DYNAMIC STRESSES I N E L E C T R I C O V E R H E A D T R A V E L L I N G CRANES 249
a girder and measuring the change in stresses due to its self- weight in the usual direction and when it was reversed.
They had not measured the effect of damping in steel-wire rope. However, they had obtained an estimate of the damping effect in the crane due to damping in both the tackle and the crane itself, but they had not distinguished between the two. It might be noted that it was never anywhere near critical damping. He would make further mention of that damping effect.
Mr. Baker had also mentioned the effect of the crab rail. They had performed dynamic tests with the crab rail fixed, and then removed, and had obtained very little difference as a result. The chief fact to emerge from another small investigation on static stresses had been that the crab rail acted along with the top boom of the main truss of the box girder of the crane, and it had seemed to them that there was no case for neglecting it if steel economy was to be achieved. But more riveting would then have had to be used, whereas the normal current practice was to use tacking rivets to fix the bridge rail to the top boom of the main truss.
There was a fatigue factor used as well as a dynamic factor in the re-draft of B.S. 466, and they had distinguished clearly between the two. The fatigue factor could be obtained only with some considerable difficulty if gauges were put on which would measure stress limits, etc. So far they had not taken that work in hand. But that fatigue factor was far more closely related to hours of usage than was the dynamic factor, which was simply meant to account for dynamic effects.
There were several other types of shock loading, apart from those in the hoisting motion of the crane. In introducing the paper he had mentioned other possibilities of shock loading in the hoisting motion itself, such as sudden stopping during winding or lowering. Those other effects were always comparable to the snatch hoisting, but they had considered themselves justified in choosing the latter as the criterion for measurement of the dynamic factor.
In further tests on jib cranes they had found that snatch hoisting became a rather diacult theoretical criterion. Since comparable results were obtained when halting the lowering motion suddenly-that was the upper limit which he had given to the curve of the relation between I and V(Fig. 15)-that might be an easier and preferable criterion.
! HOIST FOR CRANE
8 Ib l i 14 16
y/r 2 4 6
VELOCITY OF HOIST, V-IN. PER SEC. OO
I I I I I I I 2 4 6 8 Ib l i 14 16
VELOCITY OF HOIST, V-IN. PER SEC.
Fig. 15. Relation Between Velocity of Hoist and Impact Factor for Snatch Hoist
Crane No. 5050 lifting 5.25 tons, crab at + span. Clarkson’s experimental values.
o Lightfoot’s experimental values.
Mr. Westmoreland had given some figures for a crane test, but he himself had not been sure that their formulae were then proving superior to some of the others. What was required was some pooling of results from various experimenters. Perhaps the British Iron and Steel Research Association’s (B.I.S.R.A.) and others’ values for the dynamic factor might be taken with their own in deciding which of the various approximate formulae applied best.
It was regretted that there had been slight errors in Madsen’s
formula in the advance copies of the paper, and that Mr. Westmoreland had been unable to check on the values given in Table 1. Actually the term 0-OOZOZ, which represented the exten- sion of the tackle, had been replaced by the measured extension in calculating the D-values according to that formula ; otherwise, considerably higher (and more unlikely) values would have been obtained.
Dr. Jackson had referred to bad rail joints and long-span cranes. Bad rail joints did occur, and they caused considerable trouble. It seemed to be common practice in Germany to weld the rail joints, and the German specification gave a more favourable ‘long-travel’ dynamic factor for welded rail joints than for rail joints with open gaps between them. The possibility of evolving any dynamic factor to deal with open rail joints seemed to be exceedingly remote. It would involve a large amount of statistical work based on existing bad practice, and if the practice were to improve the results would be invalid. The effect of bad rail joints was worse with a long-span crane which was particularly heavy, like No. 5543, which would be expected to sustain severe stresses during the long travel. However, he would leave his co-author to comment on it because he had performed some tests on that crane; and he had also made some special tests with a magnet crane with which he would also deal.
With the two-spring system there was a combination of two frequencies which were not usually related to each other as harmonics. The resulting stress pattern which evolved was not periodical, and it was possible to get odd variations. Often the second or third peaks were quite different from the first peak, and in some instances, particularly where a very low mass was lifted, the second peak determined the dynamic factor. For- tunately, the damping was usually sufficient to rule out the additional high-peak factors and, generally, the first peak effect could be taken.
He believed that they had never measured the stresses in the cable, for they were not of first importance, though such strain records would have been quite useful. They could have done so, but they had preferred to work on one-channel recording which gave somewhat better results.
The theoretical and actual frequencies were slightly different. The measurements they had taken for the stiffnesses and for the masses gave certain theoretical frequencies. I t could be seen from Figs. 4 to 8 that those frequencies did not quite agree with the experimental values. If the actual measured frequencies were used better results were obtained, because errors in the stiffness and mass determinations were eliminated. They had tried that out in one or two instances. He considered that the values from Eden’s formula (1952) could generally be slightly improved if that were done.
Dr. Jackson had also mentioned the C-values in equation (19). He would refer to that matter in his reply to Dr. Mills.
Mr. Eden preferred to use extra loading instead of the impact factor. An apparent difficulty was that in working in terms of extra loads the simplicity obtained with a multiplying constant, i.e. an impact factor, was not achieved. But eventually it was the extra loading in which they were interested and, perhaps, it was more realistic to think in terms of the extra load.
Figs. 10-14 were somewhat deceptive. The first three showed the relation between two variables when other variables were alter- ing, so that it was not, perhaps, a case of drawing one straight line, but rather of drawing several straight lines to take account of the effects of the other variables. The plot given of their own equation showed how far their results were applying.
The variation between the impact factor and the velocity was only approximately linear in the snatch test; that was shown in Fig. 15. There had been a considerable amount of labour involved in deriving the theoretical relation, which had been obtained some time after the paper had been written. He considered that account should be taken of it, and allowance made for experi- mental errors, in considering the results and the simplified formulae.
The relation shown in Fig. 14 between the total excess load and V d W , where W was the working load, was surprisingly good. I f it had been better, he would have had no hesitation in suggesting its use. Approximate formulae were necessary, of course, and should perhaps be judged simply on the results obtained from them.
at PENNSYLVANIA STATE UNIV on March 6, 2016pme.sagepub.comDownloaded from
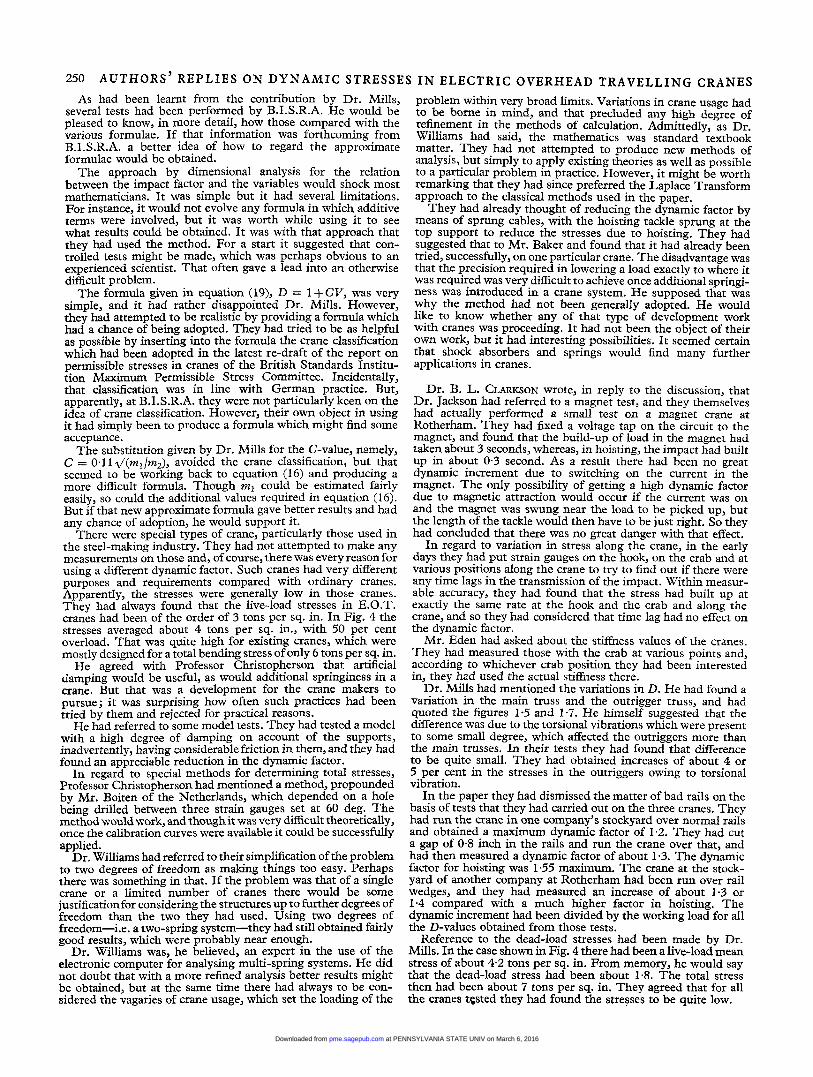
250 AUTHORS’ REPLIES O N D Y N A M I C STRESSES IN ELECTRIC OVERHEAD TRAVELLING CRANES As had been learnt from the contribution by Dr. Mills,
several tests had been performed by B.I.S.R.A. He would be pleased to know, in more detail, how those compared with the various formulae. If that information was forthcoming from B.I.S.R.A. a better idea of how to regard the approximate formulae would be obtained.
The approach by dimensional analysis for the relation between the impact factor and the variables would shock most mathematicians. It was simple but it had several limitations. For instance, it would not evolve any formula in which additive terms were involved, but it was worth while using it to see what results could be obtained. It was with that approach that they had used the method. For a start it suggested that con- trolled tests might be made, which was perhaps obvious to an experienced scientist. That often gave a lead into an otherwise difficult problem.
The formula given in equation (19), D = 1 + CV, was very simple, and it had rather disappointed Dr. Mills. However, they had attempted to be realistic by providing a formula which had a chance of being adopted. They had tried to be as helpful as possible by inserting into the formula the crane classification which had been adopted in the latest re-draft of the report on permissible stresses in cranes of the British Standards Institu- tion Maximum Permissible Stress Committee. Incidentally, that classification was in line with German practice. But, apparently, at B.I.S.R.A. they were not particularly keen on the idea of crane classification. However, their own object in using it had simply been to produce a formula which might find some acceptance.
The substitution given by Dr. Mills for the C-value, namely, C = 0.1 1 l /(ml /m2), avoided the crane classification, but that seemed to be working back to equation (16) and producing a more difficult formula. Though ml could be estimated fairly easily, so could the additional values required in equation (16). But if that new approximate formula gave better results and had any chance of adoption, he would support it.
There were special types of crane, particularly those used in the steel-making industry. They had not attempted to make any measurements on those and, of course, there was every reason for using a different dynamic factor. Such cranes had very different purposes and requirements compared with ordinary cranes. Apparently, the stresses were generally low in those cranes. They had always found that the live-load stresses in E.O.T. cranes had been of the order of 3 tons per sq. in. In Fig. 4 the stresses averaged about 4 tons per sq. in., with 50 per cent overload. That was quite high for existing cranes, which were mostly designed for a total bending stress of only 6 tons per sq. in.
He agreed with Professor Christopherson that artificial damping wodd be useful, as would additional springiness in a crane. But that was a development for the crane makers to pursue; it was surprising how often such practices had been tried by them and rejected for practical reasons.
He had referred to some model tests. They had tested a model with a high degree of damping on account of the supports, inadvertently, having considerable friction in them, and they had found an appreciable reduction in the dynamic factor.
In regard to special methods for determining total stresses, Professor Christopherson had mentioned a method, propounded by Mr. Boiten of the Netherlands, which depended on a hole being drilled between three strain gauges set at 60 deg. The method would work, and though it was very difficult theoretically, once the calibration curves were available it could be successfully applied.
Dr. Williams had referred to their simplification of the problem to two degrees of freedom as making things too easy. Perhaps there was something in that. If the problem was that of a single crane or a limited number of cranes there would be some justification for considering the structures up to further degrees of freedom than the two they had used. Using two degrees of freedom-i.e. a two-spring system-they had still obtained fairly good results, which were probably near enough.
Dr. Williams was, he believed, an expert in the use of the electronic computer for analysing multi-spring systems. He did not doubt that with a more refined analysis better results might be obtained, but at the same time there had always to be con- sidered the vagaries of crane usage, which set the loading of the
problem within very broad limits. Variations in crane usage had to be borne in mind, and that precluded any high degree of refinement in the methods of calculation. Admittedly, as Dr. Williams had said, the mathematics was standard textbook matter. They had not attempted to produce new methods of analysis, but simply to apply existing theories as well as possible to a particular problem in practice. However, it might be worth remarking that they had since preferred the Laplace Transform approach to the classical methods used in the paper.
They had already thought of reducing the dynamic factor by means of sprung cables, with the hoisting tackle sprung at the top support to reduce the stresses due to hoisting. They had suggested that to Mr. Baker and found that it had already been tried, successfully, on one particular crane. The disadvantage was that the precision required in Iowering a load exactly to where it was required was very difficult to achieve once additional springi- ness was introduced in a crane system. He supposed that was why the method had not been generally adopted. He would like to know whether any of that type of development work with cranes was proceeding. It had not been the object of their own work, but it had interesting possibilities. It seemed certain that shock absorbers and springs would find many further applications in cranes.
Dr. B. L. CLARKSON wrote, in reply to the discussion, that Dr. Jackson had referred to a magnet test, and they themselves had actually performed a small test on a magnet crane at Rotherham. They had fixed a voltage tap on the circuit to the magnet, and found that the build-up of load in the magnet had taken about 3 seconds, whereas, in hoisting, the impact had built up in about 0.3 second. As a result there had been no great dynamic increment due to switching on the current in the magnet. The only possibility of getting a high dynamic factor due to magnetic attraction would occur if the current was on and the magnet was swung near the load to be picked up, but the length of the tackle would then have to be just right. So they had concluded that there was no great danger with that effect.
In regard to variation in stress along the crane, in the early days they had put strain gauges on the hook, on the crab and at various positions along the crane to try to find out if there were any time lags in the transmission of the impact. Within measur- able accuracy, they had found that the stress had built up at exactly the same rate at the hook and the crab and along the crane, and so they had considered that time lag had no effect on the dynamic factor.
Mr. Eden had asked about the stiffness values of the cranes. They had measured those with the crab at various points and, according to whichever crab position they had been interested in, they had used the actual stiffness there.
Dr. Mills had mentioned the variations in D. He had found a variation in the main truss and the outrigger truss, and had quoted the figures 1.5 and 1-7. He himself suggested that the difference was due to the torsional vibrations which were present to some small degree, which affected the outriggers more than the main trusses. In their tests they had found that difference to be quite small. They had obtained increases of about 4 or 5 per cent in the stresses in the outriggers owing to torsional vibration.
In the paper they had dismissed the matter of bad rails on the basis of tests that they had carried out on the three cranes. They had run the crane in one company’s stockyard over normal rails and obtained a maximum dynamic factor of 1.2. They had cut a gap of 0.8 inch in the rails and run the crane over that, and had then measured a dynamic factor of about 1.3. The dynamic factor for hoisting was 1.55 maximum. The crane at the stock- yard of another company at Rotherham had been run over rail wedges, and they had measured an increase of about 1.3 or 1.4 compared with a much higher factor in hoisting. The dynamic increment had been divided by the working load for all the D-values obtained from those tests.
Reference to the dead-load stresses had been made by Dr. Mills. In the case shown in Fig. 4 there had been a live-load mean stress of about 4.2 tons per sq. in. From memory, he would say that the dead-load stress had been about 1-8. The total stress then had been about 7 tons per sq. in. They agreed that for all the cranes tested they had found the stresses to be quite low.
at PENNSYLVANIA STATE UNIV on March 6, 2016pme.sagepub.comDownloaded from
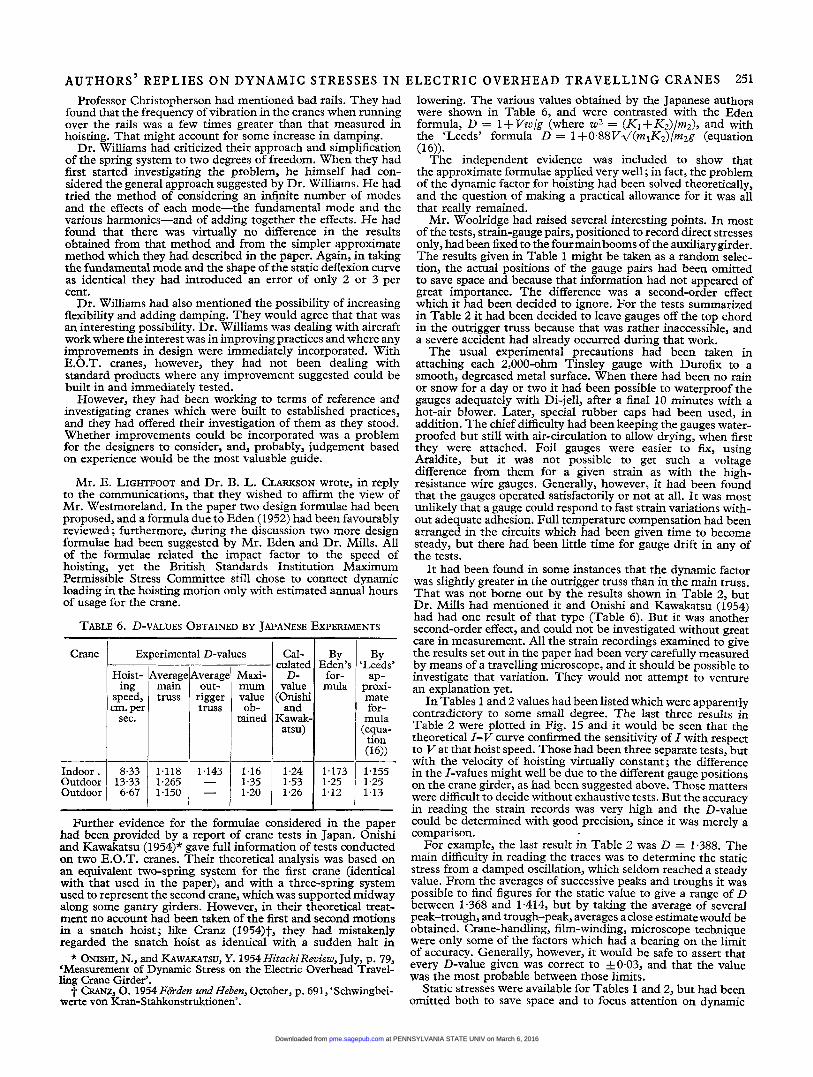
AUTHORS’ REPLIES ON DYNAMIC STRESSES I N E L E C T R I C O V E R H E A D T R A V E L L I N G CRANES 251
Cal- d a t e d
D- value
and Kawak- atsu)
(Onishi
Professor Christopherson had mentioned bad rails. They had found that the frequency of vibration in the cranes when running over the rails was a few times greater than that measured in hoisting. That might account for some increase in damping.
Dr. Williams had criticized their approach and simplification of the spring system to two degrees of freedom. When they had first started investigating the problem, he himself had con- sidered the general approach suggested by Dr. Williams. He had tried the method of considering an infinite number of modes and the effects of each mode-the fundamental mode and the various harmonics-and of adding together the effects. He had found that there was virtually no difference in the results obtained from that method and from the simpler approximate method which they had described in the paper. Again, in taking the fundamental mode and the shape of the static deffexion curve as identical they had introduced an error of only 2 or 3 per cent.
Dr. Williams had also mentioned the possibility of increasing flexibility and adding damping. They would agree that that was an interesting possibility. Dr. Williams was dealing with aircraft work where the interest was in improving practices and where any improvements in design were immediately incorporated. With E.O.T. cranes, however, they had not been dealing with standard products where any improvement suggested could be built in and immediately tested.
However, they had been working to terms of reference and investigating cranes which were built to established practices, and they had offered their investigation of them as they stood. Whether improvements could be incorporated was a problem for the designers to consider, and, probably, judgement based on experience would be the most valuable guide.
Mr. E. LIGHTFOOT and Dr. B. L. CLARKSON wrote, in reply to the communications, that they wished to affirm the view of Mr. Westmoreland. In the paper two design formulae had been proposed, and a formula due to Eden (1952) had been favourably reviewed; furthermore, during the discussion two more design formulae had been suggested by Mr. Eden and Dr. Mills. All of the formulae related the impact factor to the speed of hoisting, yet the British Standards Institution Maximum Permissible Stress Committee still chose to connect dynamic loading in the hoisting motion only with estimated annual hours of usage for the crane.
TABLE 6. D-VALUES OBTAINED BY JAPANESE EXPERIMENTS
By Eden’s
for- mula
Crane 1 Experimental D-values
cm. per
Indoor. 8.33 1.118 1.143 1.16 Outdoor 13.33 1.265 1.35 Outdoor1 6.67 1 1.150 1 1 I 1.20
I- ;:;; 1 ::::’ 1.26 1.12
BY ‘Leeds’
ap-. prom- mate for-
mula (equa- tion (16))
1.155 1.25 1.13 -
Further evidence for the formulae considered in the paper had been provided by a report of crane tests in Japan. Onishi and Kawakatsu (1954)* gave full information of tests conducted on two E.O.T. cranes. Their theoretical analysis was based on an equivalent two-spring system for the first crane (identical with that used in the paper), and with a three-spring system used to represent the second crane, which was supported midway along some gantry girders. However, in their theoretical treat- ment no account had been taken of the first and second motions in a snatch hoist; like Cranz (1954))t, they had mistakenly regarded the snatch hoist as identical with a sudden halt in
* ONISHI, N., and KAWAKATSU, Y . 1954 HitachiReview, July, p. 79, ‘Measurement of Dynamic Stress on the Electric Overhead Travel- ling Crane Girder’.
t CRANZ, 0. 1954 Forden und Heben, October, p. 691, ‘Schwingbei- werte von Kran-Stahkonstruktionen’.
lowering. The various values obtained by the Japanese authors were shown in Table 6, and were contrasted with the Eden formula, D = 1 + V w / g (where w 2 = (K, +Kz)/m2), and with the ‘Leeds’ formula D = 1 +0.88V4(m,Kz) /m2g (equation (16)).
The independent evidence was included to show that the approximate formulae applied very well; in fact, the problem of the dynamic factor for hoisting had been solved theoretically, and the question of making a practical allowance for it was all that really remained.
Mr. Woolridge had raised several interesting points. In most of the tests, strain-gauge pairs, positioned to record direct stresses only, hadbeen fixed to the fourmainbooms of the auxiliarygirder. The results given in Table 1 might be taken as a random selec- tion, the actual positions of the gauge pairs had been omitted to save space and because that information had not appeared of great importance. The difference was a second-order effect which it had been decided to ignore. For the tests summarized in Table 2 it had been decided to leave gauges off the top chord in the outrigger truss because that was rather inaccessible, and a severe accident had already occurred during that work.
The usual experimental precautions had been taken in attaching each 2,000-ohm Tinsley gauge with Durofix to a smooth, degreased metal surface. When there had been no rain or snow for a day or two it had been possible to waterproof the gauges adequately with Di-jell, after a final 10 minutes with a hot-air blower. Later, special rubber caps had been used, in addition. The chief difficulty had been keeping the gauges water- proofed but still with air-circulation to allow drying, when first they were attached. Foil gauges were easier to fix, using Araldite, but it was not possible to get such a voltage difference from them for a given strain as with the high- resistance wire gauges. Generally, however, it had been found that the gauges operated satisfactorily or not at all. It was most unlikely that a gauge could respond to fast strain variations with- out adequate adhesion. Full temperature compensation had been arranged in the circuits which had been given time to become steady, but there had been little time for gauge drift in any of the tests.
It had been found in some instances that the dynamic factor was slightly greater in the outrigger truss than in the main truss. That was not borne out by the results shown in Table 2, but Dr. Mills had mentioned it and Onishi and Kawakatsu (1954) had had one result of that type (Table 6). But it was another second-order effect, and could not be investigated without great care in measurement. All the strain recordings examined to give the results set out in the paper had been very carefully measured by means of a travelling microscope, and it should be possible to investigate that variation. They would not attempt to venture an explanation yet.
In Tables 1 and 2 values had been listed which were apparently contradictory to some small degree. The last three results in Table 2 were plotted in Fig. 15 and it would be seen that the theoretical I-V curve confirmed the sensitivity of I with respect to Vat that hoist speed. Those had been three separate tests, but with the velocity of hoisting virtually constant; the difference in the I-values might well be due to the different gauge positions on the crane girder, as had been suggested above. Those matters were difficult to decide without exhaustive tests. But the accuracy in reading the strain records was very high and the D-value could be determined with good precision, since it was merely a comparison.
For example, the last result in Table 2 was D = 1.388. The main difficulty in reading the traces was to determine the static stress from a damped oscillation, which seldom reached a steady value. From the averages of successive peaks and troughs it was possible to find figures for the static value to give a range of D between 1.368 and 1.414, but by taking the average of several peak-trough, and trough-peak, averages a close estimate would be obtained. Crane-handling, film-winding, microscope technique were only some of the factors which had a bearing on the limit of accuracy. Generally, however, it would be safe to assert that every D-value given was correct to f0.03, and that the value was the most probable between those limits.
Static stresses were available for Tables 1 and 2, but had been omitted both to save space and to focus attention on dynamic
at PENNSYLVANIA STATE UNIV on March 6, 2016pme.sagepub.comDownloaded from
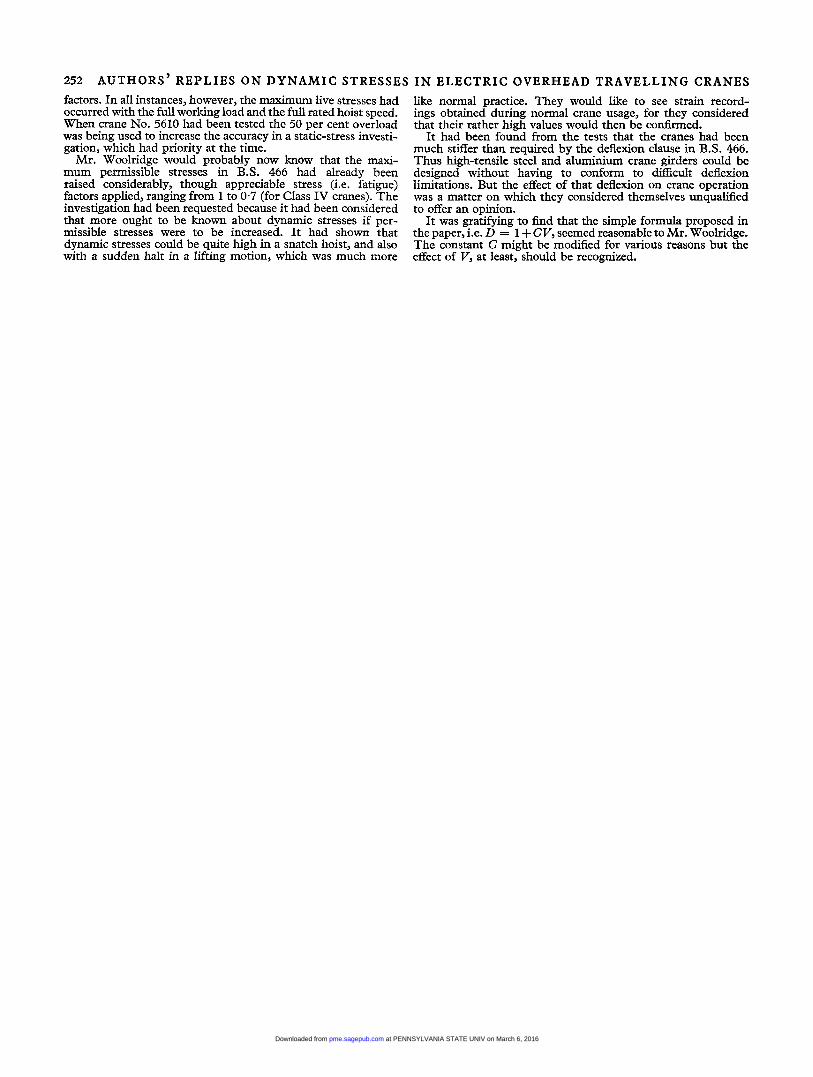
252 AUTHORS’ REPLIES O N D Y N A M I C STRESSES I N ELECTRIC OVERHEAD TRAVELLING CRANES factors. In all instances, however, the maximum live stresses had occurred with the full working load and the full rated hoist speed. When crane No. 5610 had been tested the 50 per cent overload was being used to increase the accuracy in a static-stress investi- gation, which had priority at the time.
Mr. Woolridge would probably now know that the maxi- mum permissible stresses in B.S. 466 had already been raised considerably, though appreciable stress (i.e. fatigue) factors applied, ranging from 1 to 0.7 (for Class IV cranes). The investigation had been requested because it had been considered that more ought to be known about dynamic stresses if per- missible stresses were to be increased. It had shown that dynamic stresses could be quite high in a snatch hoist, and also with a sudden halt in a lifting motion, which was much more
like normal practice. They would like to see strain record- ings obtained during normal crane usage, for they considered that their rather high values would then be confirmed.
It had been found from the tests that the cranes had been much stiffer than required by the deflexion clause in B.S. 466. Thus high-tensile steel and aluminium crane girders could be designed without having to conform to ditiicult deflexion limitations. But the effect of that deflexion on crane operation was a matter on which they considered themselves unqualified to offer an opinion.
It was gratifying to find that the simple formula proposed in the paper, i.e. D = 1 + CV, seemed reasonable to Mr. Woolridge. The constant C might be modified for various reasons but the effect of V, at least, should be recognized.
at PENNSYLVANIA STATE UNIV on March 6, 2016pme.sagepub.comDownloaded from


