Embed Size (px)
Citation preview
Research articleDynamic rerouting of the carbohydrate flux is key tocounteracting oxidative stressMarkus Ralser*, Mirjam M Wamelink†, Axel Kowald*¶, Birgit Gerisch*,Gino Heeren§, Eduard A Struys†, Edda Klipp*, Cornelis Jakobs†, Michael Breitenbach§, Hans Lehrach* and Sylvia Krobitsch*
Addresses: *Max Planck Institute for Molecular Genetics, Ihnestrasse 73, 14195 Berlin, Germany. †Department of Clinical Chemistry,Metabolic Unit, VU University Medical Center, Amsterdam, de Boelelaan 1117, 1081 HV Amsterdam, The Netherlands. §Department of CellBiology, University of Salzburg, Hellbrunnerstrasse 34, 5020 Salzburg, Austria.
¶Current address: Medical Proteome Center, Ruhr University Bochum, Universitätsstrasse 150, 44801 Bochum, Germany.
Correspondence: Markus Ralser. Email: [email protected]; Sylvia Krobitsch. Email: [email protected]
Abstract
Background: Eukaryotic cells have evolved various response mechanisms to counteract thedeleterious consequences of oxidative stress. Among these processes, metabolic alterationsseem to play an important role.
Results: We recently discovered that yeast cells with reduced activity of the key glycolyticenzyme triosephosphate isomerase exhibit an increased resistance to the thiol-oxidizingreagent diamide. Here we show that this phenotype is conserved in Caenorhabditis elegans andthat the underlying mechanism is based on a redirection of the metabolic flux from glycolysisto the pentose phosphate pathway, altering the redox equilibrium of the cytoplasmicNADP(H) pool. Remarkably, another key glycolytic enzyme, glyceraldehyde-3-phosphatedehydrogenase (GAPDH), is known to be inactivated in response to various oxidanttreatments, and we show that this provokes a similar redirection of the metabolic flux.
Conclusions: The naturally occurring inactivation of GAPDH functions as a metabolic switchfor rerouting the carbohydrate flux to counteract oxidative stress. As a consequence, alteringthe homoeostasis of cytoplasmic metabolites is a fundamental mechanism for balancing theredox state of eukaryotic cells under stress conditions.
BioMed Central
Journal of Biology 2007, 6:10
Open Access
Published: 21 December 2007
Journal of Biology 2007, 6:10 (doi:10.1186/jbiol61)
The electronic version of this article is the complete one and can befound online at http://jbiol.com/content/6/4/10
Received: 21 May 2007Revised: 7 August 2007Accepted: 12 October 2007
© 2007 Ralser et al.; licensee BioMed Central Ltd. This is an Open Access article distributed under the terms of the Creative Commons Attribution License (http://creativecommons.org/licenses/by/2.0),which permits unrestricted use, distribution, and reproduction in any medium, provided the original work is properly cited.
BackgroundReactive oxygen species (ROS) cause damage to cellular
processes in all living organisms and contribute to a
number of human disorders such as cancer, cardiovascular
diseases, stroke, and late-onset neurodegenerative disorders,
and to the aging process itself. To cope with the fatal cellular
consequences triggered by ROS, eukaryotic cells have
evolved a number of defense and repair mechanisms, which
are based on enzymatic as well as non-enzymatic processes
and appear to be highly conserved from unicellular to
multicellular eukaryotes. In bacteria and yeast, these anti-
oxidant defense mechanisms are partially induced on the
basis of changes in global gene expression [1,2]. However, a
recent study analyzing a number of genetic and environ-
mental perturbations in Escherichia coli demonstrated that
the changes in the transcriptome and proteome are unex-
pectedly small [3]. Moreover, the transcription of genes
encoding enzymes capable of neutralizing ROS is not gener-
ally increased in mammalian cells that are subjected to
oxidative stress [4].
In all organisms studied, however, treatment with oxidants
prompts immediate de novo post-translational modifica-
tions of a number of proteins, probably affecting their local-
ization and functionality. One of the key targets of those
processes is the glycolytic enzyme glyceraldehyde-3-phos-
phate dehydrogenase (GAPDH), which catalyzes the
reversible oxidative phosphorylation of glyceraldehyde-3-
phosphate (gly3p) to 1,3-bisphosphoglycerate. Remarkably,
in response to various oxidant treatments this enzyme is
inactivated and transported into the nucleus of the cell, and
has been found S-nitrosylated, S-thiolated, S-glutathiony-
lated, carbonylated and ADP-ribosylated in numerous cell
types and organisms under these conditions [5-10].
Recently, we discovered that yeast cells with reduced cat-
alytic activity of another key glycolytic enzyme, triose-
phosphate isomerase (TPI), are highly resistant to the
oxidant diamide [11]. This essential enzyme precedes
GAPDH in glycolysis, catalyzing the interconversion of di-
hydroxyacetone phosphate (dhap) and gly3p, the substrate
of GAPDH, and a reduction in its activity results in an ele-
vated cellular dhap concentration [12-14]. In this light, it is
remarkable that the expression of a subset of glycolytic pro-
teins and proteins implicated in related pathways is repres-
sed, while the expression of a few enzymes involved in the
pentose phosphate pathway (PPP), which is directly con-
nected to the glycolytic pathway, is induced under oxidative
stress conditions [1]. Furthermore, enhanced activity of the
PPP has been observed in neonatal rat cardiomyocytes and
in human epithelial cells under oxidative stress conditions
[15,16]. Enzymes of the PPP are crucial for maintaining the
cytoplasmic NADPH concentration, which provides the
redox power for known antioxidant systems [17,18]. The
observations above suggest that alterations in the carbohy-
drate metabolism could be central for cellular protection
against ROS and, moreover, that cells reroute the carbohy-
drate flux from glycolysis to the PPP to counteract perturba-
tions in the cytoplasmic redox state. However, direct
evidence for this hypothesis is missing so far. By combining
genetic and quantitative metabolite analyses along with in
silico modeling, we present the first direct proof that eukary-
otic cells indeed actively reroute the metabolic flux from
glycolysis to the PPP as an immediate and protective
response to counteract oxidative stress.
ResultsReduced intracellular TPI concentration results inenhanced oxidant resistance of Saccharomycescerevisiae and Caenorhabditis elegansWe reported earlier that a change of the amino acid
isoleucine to valine at position 170 in the human TPI
protein (TPIIle170Val) causes a reduction of about 70% in the
enzyme’s catalytic activity [11]. Interestingly, we discovered
that yeast cells expressing this human TPI variant exhibit
increased resistance to the oxidant diamide (N,N,N’,N’-
tetramethylazodicarboxamide, Chemical Abstracts Service
(CAS) No. 10465-78-8) compared with isogenic yeast cells
expressing wild-type human TPI, indicating that low TPI
activity confers resistance to specific conditions of oxidative
stress. The synthetic reagent diamide is known to oxidize
cellular thiols, especially protein-integrated cysteines [19],
provoking a rapid decrease in cellular glutathione and
hence causing oxidative stress. To dissect the underlying
mechanism, we first analyzed whether decreasing the
expression level of wild-type human TPI would result in a
similar phenotype. For this, we generated plasmids for the
expression of wild-type human TPI under the control of
established yeast promoters of different strengths, namely
the CYC1, TEF1 and GPD1 promoters [20]. Subsequently,
the ∆tpi1 strain MR100, which is deleted for the yeast TPI1
gene and is inviable on medium containing glucose as sole
carbon source, was transformed with the respective plas-
mids along with control plasmids encoding yeast TPIIle170Val
or yeast TPI. Single colonies were selected and the intracel-
lular TPI concentration of plate-grown yeast cells was ana-
lyzed (Figure 1a, left panel). As expected, yeast cells
expressing the different TPI proteins under the strong GPD1
promoter had a higher TPI concentration compared with
cells in which the expression was controlled by the interme-
diate TEF1 or the weak CYC1 promoter. Next, we spotted
the respective yeast cells onto medium supplemented with
differing diamide concentrations. As shown in Figure 1a
(right panel), yeast cells expressing human TPI under the
control of the weakest promoter used, the CYC1 promoter,
10.2 Journal of Biology 2007, Volume 6, Article 10 Krobitsch et al. http://jbiol.com/content/6/4/10
Journal of Biology 2007, 6:10
grew slowly on standard medium compared with the other
yeast strains. Notably, growth of these cells on plates con-
taining 1.6-1.8 mM diamide was comparable to the growth
of control yeast cells expressing the TPIIle170Val protein with
reduced catalytic activity, demonstrating that a reduction in
TPI expression or specific activity confers resistance against
this oxidant. Furthermore, yeast cells expressing wild-type
human TPI under the control of the intermediate TEF1 pro-
moter grew on medium containing 1.8 mM diamide, albeit
to a much lesser extent than yeast cells in which TPI expres-
sion is controlled by the weak CYC1 promoter. This finding
excludes the possibility that the observed oxidant resistance
of yeast cells with CYC1-controlled TPI expression is based
solely on their slower growth rate. In support of this, yeast
cells in which the strong GPD1 promoter controls TPI
expression did not grow at all on medium containing 1.6-
1.8 mM diamide. Moreover, yeast cells ectopically express-
ing yeast TPI from the same promoter, which is
approximately 30% more active than human wild-type TPI
in yeast [11], were even more sensitive to diamide. Thus,
diminishing the expression level or activity of TPI increases
the diamide tolerance of yeast.
Next, we investigated whether this phenomenon is con-
served in multicellular eukaryotes, and addressed this by
using Caenorhabditis elegans as a model. RNA interference
(RNAi) technology was used to reduce (knock down) the
intracellular concentration of TPI by feeding worms with E.
coli producing double-stranded RNA of the C. elegans tpi-1
gene (Y17G7B.7); the empty RNAi vector (L4440) was used
as control. The reduction of the intracellular TPI concentra-
tion was analyzed by immunoblotting (Figure 1b, left
panel). Then, tpi-1 knock-down worms were placed on agar
plates supplemented with the oxidant juglone (5-hydroxy-
1,4-naphthalenedione, CAS No. 481-39-0), a natural naph-
thoquinone found particularly in the black walnut Juglans
nigra. This oxidant triggers the generation of superoxide rad-
icals as a result of its capacity for redox cycling that involves
a one-electron redox reaction generating semiquinone and
superoxide radicals [21]. As controls, multi-stress-resistant
http://jbiol.com/content/6/4/10 Journal of Biology 2007, Volume 6, Article 10 Krobitsch et al. 10.3
Journal of Biology 2007, 6:10
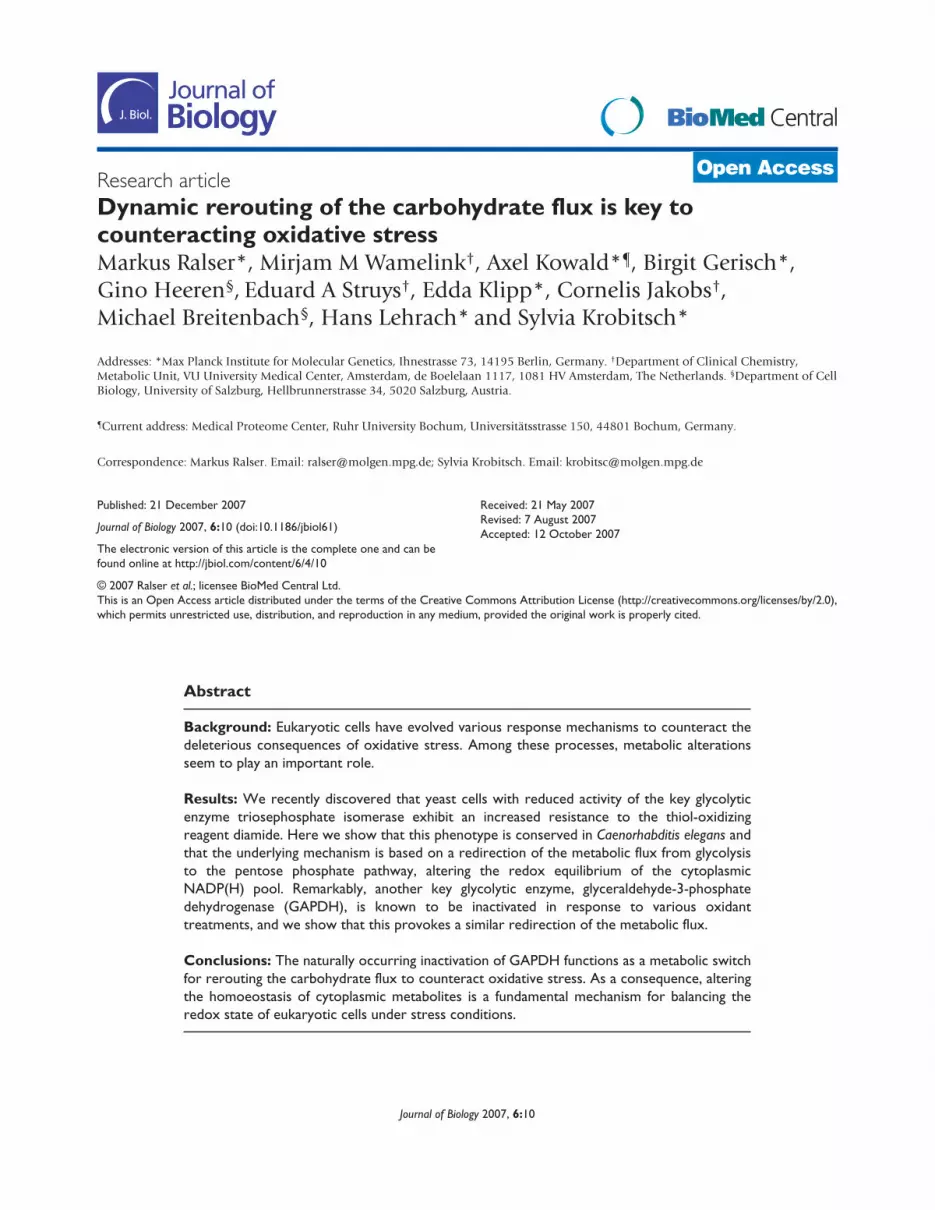
Figure 1Reduced triosephosphate isomerase (TPI) activity increases oxidant resistance of S. cerevisiae and C. elegans. (a) The left panel shows a Western blotanalysis of yeast cells expressing wild-type human TPI under the control of promoters of different strengths: GPD1 (GPDpr), TEF1 (TEFpr), and CYC1(CYCpr). Yeast cells expressing human TPIIle170Val or yeast TPI under the control of the strong GPD1 promoter were used as controls. Equal loading ofthe lysates was controlled by visualizing G6PDH. The right panel shows yeast cells expressing yeast TPI and human TPIIle170Val controlled by the GPD1promoter or yeast expressing wild-type human TPI controlled by the GPD1, TEF1 or CYC1 promoters, respectively. Yeast were spotted as fivefoldserial dilutions on SC medium supplemented with different concentrations of diamide. Plates were incubated at 30°C for 3 days. (b) The left panelshows western blot analysis of cell extracts prepared from adult C. elegans that were fed with E. coli producing double-stranded RNA of theC. elegans tpi-1 gene (Y17G7B.7) (tpi-1 RNAi) or harboring the empty plasmid L4440 (control). The right panel shows the effects of the oxidantsjuglone and diamide on these worms. After feeding with E. coli as described above, worms were placed on agar plates supplemented with juglone ordiamide. Multi-resistant daf-2 (e1370) mutant worms were included in every experiment as controls.
0 1 2 3 4 5 6 7 8Ani
mal
s al
ive
(per
cent
age)
0102030405060708090
100
Ani
mal
s al
ive
(per
cent
age)
010203040506070 Wild-type
tpi-1 RNAi
daf-2 (e1370)
8090
100
0 1 2
Without diamide 1.4 mM diamide 1.6 mM diamide 1.8 mM diamide
3 4 5
DiamideJuglone
6 7 8 9
GPD pr -TPI lle
170V
al
GPDpr -TPIlle170ValGPD pr -ye
ast T
PI
GPDpr -yeast TPI
GPD pr -TPI
GPDpr -TPI
TEF pr -TPI
Contro
l
tpi-1
RNAi
TEFpr -TPI
CYC pr -TPI
CYCpr -TPI
TPI
TPI-1
DAF-21
G6PDH
(a)
(b)
Time (h) Time (h)
daf-2 mutant worms were included in every experiment, and
surviving worms were counted each hour. Worms with
reduced TPI concentration placed on 10 µM juglone plates
survived significantly longer than wild-type animals under
the same conditions (Figure 1b, middle panel). In addition,
the average survival time of wild-type worms on 10 µM
juglone plates was 4.2 ± 0.8 hours, whereas TPI knock-
down animals survived for 5.5 ± 0.4 hours (p-value of
1.13e-07, see Additional data file 1 for more quantitative
information). We also carried out the same set of experi-
ments using the oxidant diamide, which is not usually used
in C. elegans laboratories. We discovered that worms were
highly resistant to this oxidant, and very high concentra-
tions had to be applied for growth inhibition (data not
shown). Notably, we showed, by applying as much as
250 mM diamide, that TPI knock-down worms displayed an
increased resistance (Figure 1b, right panel). The knock-down
of TPI resulted in a greater average survival time compared
with wild-type animals (8.6 ± 0.3 hours vs 7.5 ± 0.3 hours,
p-value of 0.011, see Additional data file 1). Thus, these
experiments clearly show that a reduction in TPI activity
increases oxidant resistance of the multicellular eukaryote
C. elegans.
Reduced TPI activity protects against diamide byincreasing the activity of the PPPWe next aimed to dissect the molecular basis for the
observed diamide resistance in yeast by genetic means. The
glycolytic pathway is directly interconnected with the PPP,
which is one of the key pathways in reducing the pyridine
nucleotide NADP+ to NADPH within the eukaryotic cyto-
plasm and, hence, one of the main cellular sources of the
cytoplasmic NADPH that is required as a redox cofactor by
the main antioxidant enzymes to neutralize ROS (see [18]
for a review). We speculated that the inactivation of TPI,
resulting in a block on glycolysis, should counteract oxida-
tive stress by elevating the metabolic flux of the PPP
(Figure 2a). To test this assumption, we aimed to genetically
target the first two steps of the PPP. As indicated in
Figure 2a, the rate-limiting generation of D-6-phospho-
glucono-δ-lactone from glucose-6-phosphate (g6p), the
metabolite for which glycolysis and PPP are competing for,
is catalyzed by the yeast glucose-6-phosphate dehydroge-
nase (G6PDH) Zwf1p [17,22]. In the second step of the
PPP, this metabolite is converted by the paralogous 6-
phospho-gluconolactonases Sol3p and Sol4p into 6-phos-
phogluconate [23]. Blocking these two essential steps would
impair the activity of the PPP and lessen the observed pro-
tective effect of reduced TPI activity.
We therefore generated yeast strains expressing wild-type
human TPI or TPIIle170Val in which the yeast genes TPI1 and
ZWF1, TPI1 and SOL3, or TPI1 and SOL4 were deleted.
These strains were then spotted as fivefold serial dilutions
on synthetic media containing different concentrations of
diamide. As shown in Figure 2b, growth of the correspond-
ing ∆tpi1∆zwf1, ∆tpi1∆sol3 and ∆tpi1∆sol4 yeast cells was
strongly reduced compared with the respective ∆tpi1 yeast
cells on medium containing 1.4-2.0 mM diamide. Notably,
∆tpi1∆zwf1 cells, which are unable to metabolize g6p to
enter the PPP, exhibited the strongest sensitivity; these cells
already grew poorly on medium supplemented with 1.2 mM
diamide. As expected, ∆tpi1 yeast cells expressing
TPIIle170Val grew better on media containing high diamide
concentrations compared with yeast cells expressing wild-
type TPI, confirming the protective effect observed earlier.
Strikingly, the protective effect of TPIIle170Val was no longer
observed in ∆tpi1∆zwf1 cells, in which the interplay
between glycolysis and the PPP is blocked. In addition, the
protective effect of TPIIle170Val against diamide in
∆tpi1∆sol3 and ∆tpi1∆sol4 cells was detectable, but weaker.
This was expected, since ∆tpi1∆sol3 and ∆tpi1∆sol4 cells
are still able to convert D-6-phospho-glucono-δ-lactone to
6-phosphogluconate by reducing one equivalent of NADP+
due to the presence of one wild-type copy of either SOL4 or
SOL3. Thus, these experiments clearly demonstrate that the
protective effect of reduced TPI activity is indeed based on the
activity of the PPP and is absent if the first and rate-limiting
step of the PPP is inhibited.
Preventing the accumulation of NADPH sensitizesyeast cells to diamideAs most antioxidant enzymes are coupled to NADPH as a
redox cofactor and a functional defense mechanism against
oxidative stress depends upon the availability of NADPH, we
hypothesized that increased activity of the PPP might protect
against oxidative stress due to the enhanced cellular produc-
tion of this molecule. To test this hypothesis, we set out to
measure the overall NADPH/NADP+ ratio of MR101 cells
expressing human wild-type TPI and MR105 cells expressing
TPIIle170Val. The respective strains were grown in duplicate to
mid-log phase and pyridine nucleotides were extracted simul-
taneously as described by Noack et al. [24], performing a
three-step protocol that is based on a 34:24:1 phenol:chloro-
form:isoamyl-alcohol pyridine-nucleotide extraction that is
followed by two diethylether re-extractions of the aqueous
phase. As measured by liquid chromatography - tandem mass
spectrometry (LC-MS/MS), the overall NADPH/NADP+ ratio
was indeed highly increased in MR105 cells expressing
TPIIle170Val in comparison to MR101 cells expressing wild-type
TPI (Figure 3a). Although the LC-MS/MS analysis does not
allow discrimination between cytoplasmic and mitochond-
rial NADP(H), the measurements clearly show that the redox
equilibrium of the NADP(H) pool strongly shifts towards
NADPH in cells with reduced TPI activity; the increase in the
sole cytoplasmic NADPH/NADP+ ratio is expected to be
10.4 Journal of Biology 2007, Volume 6, Article 10 Krobitsch et al. http://jbiol.com/content/6/4/10
Journal of Biology 2007, 6:10
even higher than the measured values of the overall
NADPH/NADP+ ratio.
To substantiate these results in vivo and to correlate with the
observed oxidant-resistance phenotype, we investigated the
effect of the Gdp1 protein of the yeast Kluyveromyces lactis, a
phosphorylating (NADP+-dependent) glyceraldehyde-3-
phosphate dehydrogenase (GenBank accession number
CAD23142, Enzyme Commission classification EC 1.2.1.13
[25]). Except for K. lactis, this enzyme has not been detected
in non-plant eukaryotes; it was discovered in a screen
designed to find suppressors for the lethal effects of phos-
phoglucose isomerase (Pgi1) deletion in S. cerevisiae on
glucose media [25]. The absence of Pgi1p is lethal for S.
cerevisiae on standard media, because a strong NADPH accu-
mulation occurs at the expense of its oxidized form [26].
http://jbiol.com/content/6/4/10 Journal of Biology 2007, Volume 6, Article 10 Krobitsch et al. 10.5
Journal of Biology 2007, 6:10
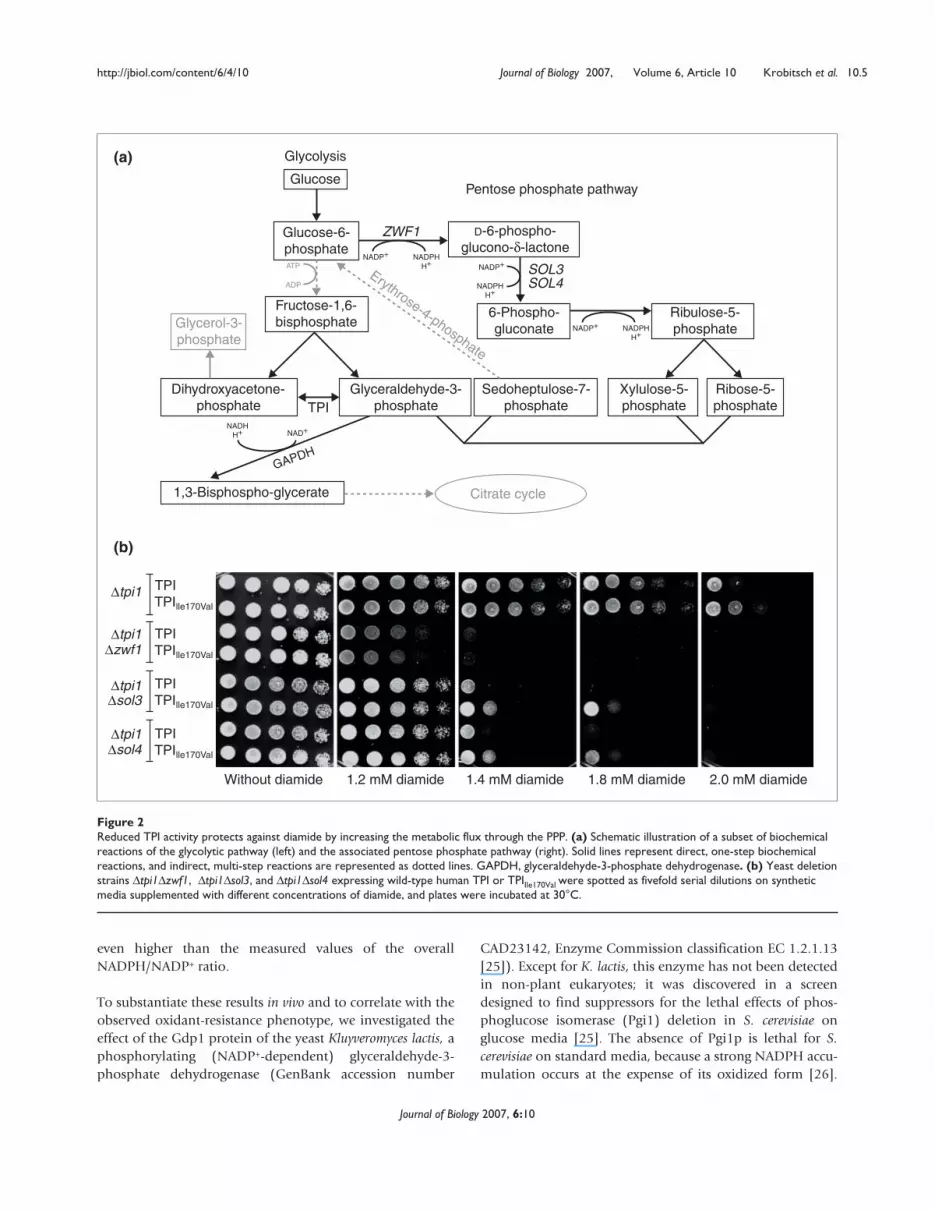
Figure 2Reduced TPI activity protects against diamide by increasing the metabolic flux through the PPP. (a) Schematic illustration of a subset of biochemicalreactions of the glycolytic pathway (left) and the associated pentose phosphate pathway (right). Solid lines represent direct, one-step biochemicalreactions, and indirect, multi-step reactions are represented as dotted lines. GAPDH, glyceraldehyde-3-phosphate dehydrogenase. (b) Yeast deletionstrains ∆tpi1∆zwf1, ∆tpi1∆sol3, and ∆tpi1∆sol4 expressing wild-type human TPI or TPIIle170Val were spotted as fivefold serial dilutions on syntheticmedia supplemented with different concentrations of diamide, and plates were incubated at 30°C.
Glucose
NADP+
NADP+
NAD+
ATP
ADP
NADPHH+
NADPHH+
NADHH+
Glycolysis
Pentose phosphate pathway
Erythrose-4-phosphate
ZWF1
TPI
SOL3SOL4
Glucose-6-phosphate
Glycerol-3-phosphate
Fructose-1,6-bisphosphate
6-Phospho-gluconate
Ribulose-5-phosphate
Dihydroxyacetone-phosphate
Glyceraldehyde-3-phosphate
1,3-Bisphospho-glycerate Citrate cycle
Sedoheptulose-7-phosphate
D-6-phospho-glucono-δ-lactone
Xylulose-5-phosphate
Ribose-5-phosphate
NADP+ NADPHH+
∆tpi1
∆tpi1
∆tpi1
∆sol3
∆sol4
∆tpi1∆zwf1
TPIlle170Val
TPI
TPIlle170Val
TPI
TPIlle170Val
TPI
TPIlle170Val
TPI
Without diamide 1.2 mM diamide 1.4 mM diamide 1.8 mM diamide 2.0 mM diamide
(a)
(b)
GAPDH

Expression of K. lactis Gdp1 rescued the lethality of ∆pgi1 S.
cerevisiae cells because it catalyzes the oxidation of NADPH
to NADP+ [25], thus preventing the accumulation of
NADPH in ∆pgi1 cells [25]. Gdp1 can therefore be applied
in vivo to analyze the impact of NADPH accumulation in
regard to the observed oxidant resistance of yeast cells with
reduced TPI activity. To do this, we transformed the yeast
strain BY4741 with either a plasmid encoding K. lactis GDP1
under the control of a constitutive promoter or with an
empty control plasmid and selected the respective transfor-
mants on plates of synthetic complete (SC) medium lacking
uracil (SC-ura). Yeast cultures were then grown and spotted
10.6 Journal of Biology 2007, Volume 6, Article 10 Krobitsch et al. http://jbiol.com/content/6/4/10
Journal of Biology 2007, 6:10
Figure 3Reduced TPI activity protects against diamide by increasing NADPH. (a) S. cerevisiae strains MR101 and MR105 were grown in duplicate to mid-logphase, pyridine nucleotides were extracted, and LC-MS/MS measurements were performed in triplicate. MR105 cells expressing TPIIle170Val had ahigher overall NADPH/NADP+ ratio compared with MR101 cells expressing wild-type TPI. (b) S. cerevisiae strain BY4741 was transformed with anempty 2µ plasmid or with a 2µ plasmid encoding K. lactis GDP1 (p1696). Afterwards, single transformants were selected, grown overnight and thesame number of cells were spotted as fivefold serial dilutions on agar plates supplemented with different concentrations of diamide. Growth wasmonitored after plates were incubated at 30°C for 3 days. (c) The isogenic yeast strains MR101 expressing wild-type human TPI or MR105expressing human TPIIle170Val were transformed with plasmids for expression of K. lactis GDP1 and processed as described in (b).
Vecto
r
TPI
TPITPI +
Gdp
1
TPI lle17
0Val
TPI lle17
0Val +
Gdp
1
TPITPI +
Gdp
1
TPI lle17
0Val
TPI lle17
0Val +
Gdp
1
TPITPI +
Gdp
1
TPI lle17
0Val
TPI lle17
0Val +
Gdp
1
Withoutdiamide
Without diamide
1.6 mMdiamide
2.0 mM diamide 2.2 mM diamide
1.8 mMdiamide
2.0 mMdiamide
0.0
0.1
0.2
Ove
rall
NA
DP
H/N
AD
P+ r
atio
0.3
TPIlle170Val
Gdp1
Vecto
r
Gdp1
Vecto
r
Gdp1
Vecto
r
Gdp1
(a)
(c)
(b)
as fivefold dilution series on solid medium supplemented
with varying concentrations of diamide. As shown in
Figure 3b, yeast cells expressing Gdp1 were highly sensitive
to diamide in the concentration range of 1.8-2.0 mM com-
pared with control cells, indicating that the cellular
NADPH/NADP+ balance is crucial for the cellular resistance
to diamide. To further validate that increased activity of the
PPP leading to an elevated cellular reduction of NADP+ to
NADPH underlies the observed resistance to diamide, we
addressed the impact of GDP1 expression in ∆tpi1 yeast
strains expressing the human protein TPIIle170Val. We
observed that growth of ∆tpi1 yeast expressing the human
TPI proteins and K. lactis Gdp1 was strongly impaired on
medium supplemented with 2.0 or 2.2 mM diamide
(Figure 3c). Remarkably, the effects of GDP1 expression
were less dramatic in yeast cells expressing TPIIle170Val, which
have an increased NADPH/NADP+ ratio. Thus, these results
suggest that the enhanced diamide resistance of yeast cells
with reduced TPI activity is based on increased conversion
of NADP+ to NADPH within the PPP.
Inactivation of TPI and GAPDH increases theconcentration of PPP metabolitesWe observed in an earlier study [11] that yeast cells with
reduced TPI activity are not resistant to oxidative stress
caused by hydroperoxides such as hydrogen peroxide
(H2O2), cumene hydroperoxide or tert-butylhydroperoxide.
Strikingly, treatment of yeast cells with these oxidants leads
to a rapid inactivation of GAPDH; however, this inactivation
is not observed when cells are treated with diamide [6,27].
As GAPDH is the first enzyme downstream of TPI, we specu-
lated that the block of GAPDH activity in hydroperoxide-
treated yeast cells prevents the protective effects of reduced
TPI activity. This hypothesis would imply that cells do inac-
tivate GAPDH to reroute the metabolic flux to the PPP for
protection against ROS. To corroborate this, we comprehen-
sively measured a number of glycolytic and PPP metabo-
lites, and compared changes between their intracellular
concentration in yeast cells expressing TPI variants with
reduced activity and wild-type yeast cells treated with H2O2.
For this analysis, the corresponding yeast cultures were
grown in rich medium (YPD) to an equal optical density
and lysed as described in Materials and methods. In the
quantitative metabolomic analyses, we focused on the
metabolites dhap, glucose-6-phosphate/fructose-6-phos-
phate (g6p), 6-phosphogluconate (6pg), ribose-5-phosphate
(r5p), xylulose-5-phosphate/ribulose-5-phosphate (x5p),
sedoheptulose-7-phosphate (s7p), glyceraldehyde-3-phos-
phate (gly3p) and glycerol-3-phosphate (gol3p). Quantifi-
cation was carried out using LC-MS/MS.
We first set out to analyze the experimental quality of our
measurements, and prepared two samples from each culture
for measurements of the various metabolites. The measure-
ments of the parallel samples were plotted on a two-dimen-
sional graph and analyzed statistically (Figure 4a, upper
panel). The coefficient of determination (R²) equaled
0.9989 when including all measurements (0.98 for values
smaller than 10), indicating high reproducibility of the
analysis. Next, we assayed the comparability of the metabo-
lite content of yeast cultures cultivated in duplicate. Two
lysate samples of each culture were prepared in parallel and
the metabolite content of each sample was measured in
duplicate. The average concentration of each metabolite was
plotted on a two-dimensional graph and analyzed statisti-
cally (Figure 4a, lower panel). Here, the R² value of 0.995
(0.96 analyzing values smaller than 10) demonstrated excel-
lent comparability of the metabolite content of yeast cul-
tures grown in parallel.
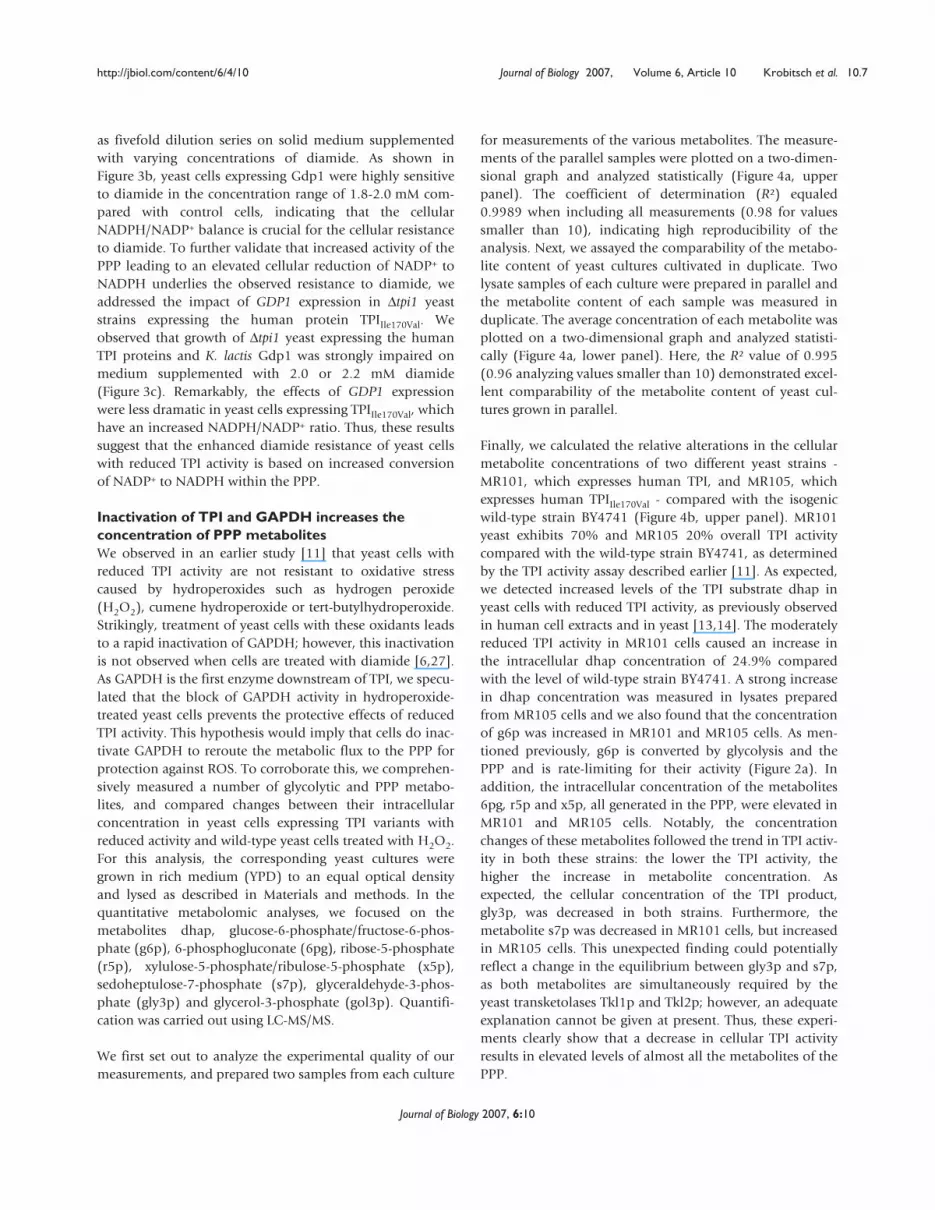
Finally, we calculated the relative alterations in the cellular
metabolite concentrations of two different yeast strains -
MR101, which expresses human TPI, and MR105, which
expresses human TPIIle170Val - compared with the isogenic
wild-type strain BY4741 (Figure 4b, upper panel). MR101
yeast exhibits 70% and MR105 20% overall TPI activity
compared with the wild-type strain BY4741, as determined
by the TPI activity assay described earlier [11]. As expected,
we detected increased levels of the TPI substrate dhap in
yeast cells with reduced TPI activity, as previously observed
in human cell extracts and in yeast [13,14]. The moderately
reduced TPI activity in MR101 cells caused an increase in
the intracellular dhap concentration of 24.9% compared
with the level of wild-type strain BY4741. A strong increase
in dhap concentration was measured in lysates prepared
from MR105 cells and we also found that the concentration
of g6p was increased in MR101 and MR105 cells. As men-
tioned previously, g6p is converted by glycolysis and the
PPP and is rate-limiting for their activity (Figure 2a). In
addition, the intracellular concentration of the metabolites
6pg, r5p and x5p, all generated in the PPP, were elevated in
MR101 and MR105 cells. Notably, the concentration
changes of these metabolites followed the trend in TPI activ-
ity in both these strains: the lower the TPI activity, the
higher the increase in metabolite concentration. As
expected, the cellular concentration of the TPI product,
gly3p, was decreased in both strains. Furthermore, the
metabolite s7p was decreased in MR101 cells, but increased
in MR105 cells. This unexpected finding could potentially
reflect a change in the equilibrium between gly3p and s7p,
as both metabolites are simultaneously required by the
yeast transketolases Tkl1p and Tkl2p; however, an adequate
explanation cannot be given at present. Thus, these experi-
ments clearly show that a decrease in cellular TPI activity
results in elevated levels of almost all the metabolites of the
PPP.
http://jbiol.com/content/6/4/10 Journal of Biology 2007, Volume 6, Article 10 Krobitsch et al. 10.7
Journal of Biology 2007, 6:10
10.8 Journal of Biology 2007, Volume 6, Article 10 Krobitsch et al. http://jbiol.com/content/6/4/10
Journal of Biology 2007, 6:10
Figure 4TPI and GAPDH inactivation increases the concentration of PPP metabolites. (a) For quality control of the metabolite quantifications and foranalyzing the technical reproducibility, each metabolite was measured in duplicate (top panel). For analyzing the biological reproducibility, themetabolite concentrations were measured from cultures grown in parallel (bottom panel). Please note that for the purpose of illustration valuesgreater than 10 are not shown. The complete plots are presented in Additional data file 3. (b) Upper panel, changes in metabolite levels in yeaststrains with differing TPI activity. Lysates of yeast strains BY4741 (100% TPI activity), MR101 (70% TPI activity) and MR105 (20% TPI activity) wereprepared and metabolites were quantified by LC-MS/MS. The absolute metabolite concentrations of MR101 and MR105 yeast were normalized andplotted as change given in percent relative to the wild-type (BY4741) strain. Middle panel, changes in metabolite levels in yeast with GAPDHinactivation. Cultures of strain BY4741 were treated with H2O2 or left untreated. The relative changes of the various metabolites of theH2O2-treated cells in comparison to untreated cells were plotted. Bottom panel, predicted qualitative changes in metabolite concentrations using thenon-fitted metabolic model. Note that for technical reasons, the abbreviation g6p refers to the sum of glucose-6-phosphate and fructose-6-phosphate and x5p to the sum of xylulose-5-phosphate and ribulose-5-phosphate. (c) Upper panel, GAPDH activity in yeast cells treated with andwithout H2O2 as in (b). Lower panel, effect of H2O2 on wild-type yeast cells transformed with the 2µ plasmids p423GPD, p423GPD-EcoGAP encodingE. coli GAPDH, or p423GPD-TDH3 encoding the yeast GAPDH Tdh3p. Transformants were selected, grown overnight and the same number of cellswere spotted as fivefold serial dilutions on SC-his-ade media supplemented with H2O2 as indicated.
R2 = 0.98
R2 = 0.96
8
6
4
2
00 2 4 6 8 10
+250%Reduced TPI activity
Inactivated GAPDH
Metabolic modeling
Rel
ativ
e ch
ange
com
pare
d w
ith w
ild-t
ype
+200%
+150%
+100%
dhap g6p 6pg r5p x5p s7p gly3p gol3p
dhap
dhap
g6p
g6p
6pg
6pg
509.9 700.3 2435.8
r5p
r5p
x5p
x5p
s7p
s7p
gly3p
gly3p
gol3p
+50%
0%
−50%
+250%
100%
0
Rel
ativ
e ch
ange
com
pare
d w
ith w
ild-t
ype
+200%
+150%
+100%
+
0
−
+50%
0%
−50%
10
8
6
4
2
00 2 4 6
Culture B
Normal
Vecto
r
EcoGAP
TDH3
Vecto
r
EcoGAP
TDH3
GAPDH activity
Measurement B
Mea
sure
men
t AC
ultu
re A
8 10
MR101 (70% TPI activity)
MR105 (20% TPI activity)
Reduced TPI activity Reduced GAPDH activity
H2O2
H2O2
Without H2O2 0.2 mM H2O2
(a)
(c)
(b)10
We next analyzed whether treatment of yeast cells with
H2O2, known to cause inactivation of GAPDH [10,27,28],
would result in a similar rerouting of the carbohydrate flux.
Wild-type cells were treated with H2O2 for 30 minutes as
described [28], collected by centrifugation, and the GAPDH
activity was measured as described in Materials and
methods. As shown in Figure 4c (upper panel), GAPDH was
inactivated in H2O2-treated yeast cells. To further demon-
strate the contribution of GAPDH to resistance to H2O2, we
investigated the H2O2-tolerance of yeast cells overexpressing
either the most abundant yeast GAPDH paralog, Tdh3p, or
the E. coli GAPDH, EcoGAP. As anticipated, cells over-
expressing Tdh3p or EcoGAP were more sensitive to H2O2
treatment compared with cells harboring the empty vector
(Figure 4c, lower panel). Moreover, Tdh3p or EcoGAP over-
expression in another yeast background, the W303 derivate
Y2546, also caused sensitivity to H2O2 (data not shown).
Subsequently, we analyzed the changes in metabolite con-
centrations of H2O2-treated yeast cells and found that con-
centrations of all measured PPP metabolites were greatly
increased (Figure 4b, middle panel). The greatest increases
were observed for 6pg, x5p and s7p. Moreover, we found
decreased concentrations of the glycolytic metabolite gol3p,
which is generated intracellularly from dhap by the enzyme
Gpd1p (also known as Hor1p). Strikingly, all measured
metabolites showed a similar tendency in the case of inacti-
vated GADPH as was observed for low TPI activity, with the
exception of gly3p. Indeed, gly3p represents the metabolic
intermediate of both enzymes. These results show that yeast
cells reroute the carbohydrate flux in response to H2O2
treatment in the same manner as cells with low TPI activity.
This implies that rerouting of the metabolic flux is a basic
mechanism in counteracting oxidative stress that is natu-
rally switched on in the course of GAPDH inactivation.
Mathematical modeling and computer simulationsBecause our experimental data imply that inactivation of
GAPDH may serve as a cellular switch to reroute the meta-
bolic flux from glycolysis to the PPP under oxidative stress
conditions, we set out to develop a mathematical model
that describes the dynamic behavior of the metabolic reac-
tions under consideration. Most of the reactions involved
have been intensely studied in vitro and, hence, sufficient
kinetic parameters (Km, Vmax) are available for modeling
and simulating the entire pathway in silico. For this, we
modeled enzymatic reactions (see Additional data file 2) as
a set of ordinary differential equations using the CellDe-
signer software [29]. The model allows calculation of the
concentrations of 19 different metabolites, the amount of
high-energy phosphate groups (P), and the NAD+/NADH
and NADP+/NADPH ratios. Three types of in silico simula-
tions were run: with normal TPI and GAPDH activity; with
25% residual TPI activity; and with 25% residual GAPDH
activity. The results of these simulations were compared
with the LC-MS/MS measurements from wild-type yeast,
from strain MR105, which expresses TPIIle170Val, and from
H2O2-treated wild-type cells with inactivated GAPDH. The
simulations revealed that 13 of the 14 qualitative changes in
metabolite concentrations were correctly predicted by the
mathematical model (Figure 4b, lower panel). A difference
between the experimental data and the predictions was only
observed for the metabolite s7p. The simulations predicted
a decline of s7p in H2O2-treated yeast cells whereas the
respective experiments showed that the concentration of
s7p increased.
As the qualitative predictions of the unfitted model
matched well with the experimental data set, we calculated
the influence of reduced TPI or GAPDH activity on the cel-
lular NADPH/NADP+ ratio without any further parameter
fitting. Like other mathematical models [30,31], our model
is based on the fact that the nicotinamide nucleotide moiety
is conserved: that is, that the sum of cellular NADP+ and
NADPH is constant. The free-energy change (∆G) of a reac-
tion is given by ∆G = ∆G0’+RT·ln(k), (where ∆G0’ is the stan-
dard free-energy change and k is the equilibrium constant).
For a redox reaction involving NADPH and NADP+ (k =
reduced form/oxidized form), it is therefore the
NADPH/NADP+ ratio, and not the absolute concentrations,
that drives the reaction. Hence, we calculated the corre-
sponding steady-state values of the NADPH/NADP+ ratio
depending on the activity of GAPDH or TPI using the
program Copasi 4B20 [32] (Figure 5a). Reduction of TPI
activity resulted in an increased NADPH/NADP+ ratio from
approximately 6.5 to 9. The simulated reduction in GAPDH
activity resulted in an even greater increase in the
NADPH/NADP+ ratio, from approximately 6.5 to 19. Taken
together, simulations using a dynamic, unfitted mathemati-
cal model corroborate the experimental finding that
reduced TPI and GAPDH activities redirect the carbohydrate
flux. Moreover, the model predicts an elevated
NADPH/NADP+ ratio if the activity of the PPP is increased,
a result that agrees with earlier experimental observations.
Although the qualitative results of the simulations fit very
well with the measurements without modifying any of the
kinetic parameters taken from the literature, it should be
noted that the kinetic constants were determined using
enzymes from five different species (human, cow, rabbit,
yeast, E. coli) in different laboratories over a period of more
than three decades. Consequently, it cannot be expected
that the simulations coincide quantitatively with the mea-
sured metabolite concentrations. However, the high-quality
LC-MS/MS data allowed us to adjust the numerical values of
the kinetic parameters so that the predicted metabolite con-
centrations agree better with the measured ones. For this
http://jbiol.com/content/6/4/10 Journal of Biology 2007, Volume 6, Article 10 Krobitsch et al. 10.9
Journal of Biology 2007, 6:10
10.10 Journal of Biology 2007, Volume 6, Article 10 Krobitsch et al. http://jbiol.com/content/6/4/10
Journal of Biology 2007, 6:10
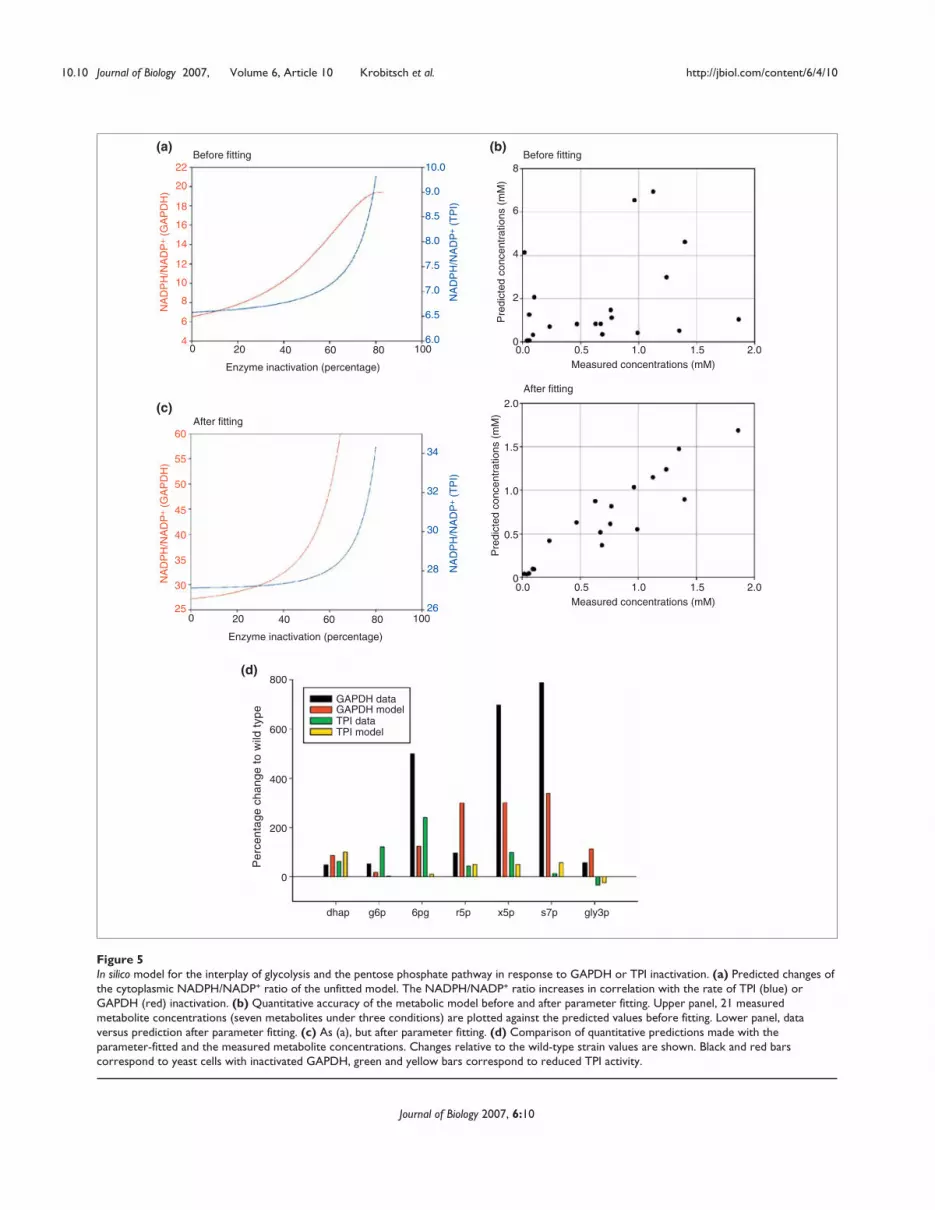
Figure 5In silico model for the interplay of glycolysis and the pentose phosphate pathway in response to GAPDH or TPI inactivation. (a) Predicted changes ofthe cytoplasmic NADPH/NADP+ ratio of the unfitted model. The NADPH/NADP+ ratio increases in correlation with the rate of TPI (blue) orGAPDH (red) inactivation. (b) Quantitative accuracy of the metabolic model before and after parameter fitting. Upper panel, 21 measuredmetabolite concentrations (seven metabolites under three conditions) are plotted against the predicted values before fitting. Lower panel, dataversus prediction after parameter fitting. (c) As (a), but after parameter fitting. (d) Comparison of quantitative predictions made with theparameter-fitted and the measured metabolite concentrations. Changes relative to the wild-type strain values are shown. Black and red barscorrespond to yeast cells with inactivated GAPDH, green and yellow bars correspond to reduced TPI activity.
Before fitting
Pre
dict
ed c
once
ntra
tions
(m
M)
Pre
dict
ed c
once
ntra
tions
(m
M)
Measured concentrations (mM)
NA
DP
H/N
AD
P+ (
GA
PD
H)
NA
DP
H/N
AD
P+ (
TP
I)
NA
DP
H/N
AD
P+ (
GA
PD
H)
NA
DP
H/N
AD
P+ (
TP
I)
25
30
35
40
45
50
55
10.0
9.0
8.5
8.0
7.5
7.0
6.5
6.0
26
28
30
32
34
60
0 20 40 60 80 0.0 0.5 1.0 1.5 2.0
Measured concentrations (mM)0.0 0.5 1.0 1.5 2.0
100
After fitting
Before fitting
After fitting
Enzyme inactivation (percentage)
0 20 40 60 80 100
Enzyme inactivation (percentage)
0
2
0
0.5
1.0
1.5
2.0
4
6
8
Per
cent
age
chan
ge t
o w
ild t
ype
4
6
8
10
12
14
16
18
20
22
dhap g6p
800
600
400
200
0
6pg r5p x5p s7p gly3p
GAPDH dataGAPDH modelTPI dataTPI model
(a)
(c)
(d)
(b)
parameter fitting, we used the measured metabolite concen-
trations (see Figure 4 and Additional data files 2 and 3) and
the Copasi software using the Hook and Jeeves algorithm
with the constraint that the literature parameters can only
vary by a factor of 4. The results of this fitting process are
shown in summary form in Figure 5b. The 21 measured
concentrations (seven metabolites, three conditions) were
plotted against the concentrations predicted by the model.
Before fitting (Figure 5b, upper panel), a general trend
existed that large predicted concentrations corresponded to
large measured concentrations, but the correlation was not
sufficient for quantitative prediction. After fitting, however,
the experimental data and the mathematical model showed
a much better correlation (Figure 5b, lower panel). Here,
one of the data points deserves special attention: the mea-
sured s7p concentration in H2O2-treated yeast cells was
extremely high (17 mM, see Additional data file 3 for
metabolite concentrations), which differs greatly from the
predicted value of 0.5 mM before fitting and 2.27 mM after
fitting. The most likely explanation is that s7p undergoes
reactions that were not included in the model or that have
not been identified. For instance, the enzyme heptulokinase
is known to phosphorylate sedoheptulose to sedoheptu-
lose-7-phosphate, and vice versa, but a dependence of this
reaction on GAPDH has not been reported so far. Moreover,
H2O2 treatment could influence other parts of the reaction
network, and indeed, transketolase activity appears to be
reduced in oxidant-treated cells [33,34]. Nonetheless, the
oxidant sensitivity of the transketolase is not sufficient to
explain the unexpected concentration changes of s7p
observed in yeast cells with reduced TPI activity as described
above. Thus, the most likely explanation for the phenome-
non remains that s7p is involved in as yet unknown cellular
processes that are implicated in the oxidative stress
response.
To improve the visualization of the quantitative output of
our calculations, we grouped the quantitative results of the
experimental measurements and the calculations from the
fitted model by each metabolite (Figure 5d). Because the
fitted model showed improved correlation between the
experimental data and the mathematical model, we reana-
lyzed the prediction made for the intracellular NADPH/
NADP+ ratio (Figure 5a) with the quantitatively fitted model.
The simulation confirmed the earlier result that inactivating
TPI or GAPDH leads to increased NADPH/NADP+ ratios
(see Figures 5c and 3a). Inactivation of GAPDH again
resulted in a greater increase in the cellular NADPH/NADP+
ratio than that resulting from reduced TPI activity. Thus,
GAPDH can be regarded as a cellular switch causing rerout-
ing between both metabolic pathways, and the naturally-
occurring GAPDH inactivation appears to be more effective
and sufficient in terms of redirecting the carbohydrate flux
from glycolysis to the PPP. Notably, our modeling approach
revealed that the experimentally observed alteration in s7p
levels cannot be explained by the current knowledge of the
kinetics of glycolysis and PPP. It would be therefore of inter-
est to focus in future on the sedoheptulose metabolism in
order to close this gap. The good quantitative agreement
between the model and the experimental results underlines
the solidness of the model and provides a firm base for
further comprehensive simulations of eukaryotic carbohy-
drate metabolism integrating other metabolic pathways that
are associated with glycolysis and the PPP.
PPP activity is a regulator of normal lifespan ofS. cerevisiae and C. elegansMuch evidence exists that oxidative damage to diverse cellu-
lar components is implicated in the aging process. Intrigu-
ingly, several genetic mutations that have been reported to
increase the overall lifespan of a variety of organisms lead to
increased oxidant-resistance as well [35]. However, conclud-
ing the converse, that genetic mutations mediating oxidant
resistance generally increase the overall or maximum life-
span, is not feasible. Cultured foreskin fibroblasts lacking
the human ortholog of ZWF1, hG6PDH, display premature
aging [36], and so we set out to analyze whether rerouting
the carbohydrate flux influences the aging process. We first
determined the median replicative lifespan of ∆tpi1 and
∆tpi1∆zwf1 yeast cells expressing TPI or TPIIle170Val. As
shown in Figure 6a, MR130 yeast cells expressing wild-type
TPI had a median replicative lifespan of 21 cell divisions, a
number that did not differ significantly from the lifespan of
the parent strain BY4741. However, isogenic ∆zwf1 yeast
cells, which are not capable of redirecting the carbohydrate
flux from glycolysis to the PPP, had a statistically significant
lower replicative lifespan of 17 cell divisions. Moreover,
MR131 yeast expressing TPIIle170Val, which had an average of
18 cell divisions, did not significantly differ in their median
replicative lifespan from ∆tpi1∆zwf1 cells expressing wild-
type TPI (MR136), but were short-lived compared with the
respective wild-type cells, which had a median lifespan of
21 cell divisions. Finally, the median lifespan of ∆tpi1∆zwf1
cells expressing TPIIle170Val (MR137) was even lower, at only
16 cell divisions. These results show that proper interplay
between glycolysis and the PPP is required for normal life-
span in yeast. Interestingly, we observed additive effects of
reduced TPI activity and ZWF1 deletion on the replicative
lifespan, indicating that the negative influence of reduced
TPI activity on replicative aging does not depend on the
activity of the PPP.
We also analyzed the effect of reduced TPI activity on the
lifespan of C. elegans. Like the stress experiments, the life-
span experiments were carried out with worms that were fed
E. coli producing double-stranded RNA for knockdown of
http://jbiol.com/content/6/4/10 Journal of Biology 2007, Volume 6, Article 10 Krobitsch et al. 10.11
Journal of Biology 2007, 6:10

the C. elegans tpi-1 gene (Y17G7B.7) with empty RNAi
vector as control. Surviving animals were counted daily. We
observed that the mean lifespan of wild-type worms on the
vector control was 15.7 ± 0.9 days, whereas the average life-
span of tpi-1 knock-down worms, with 14.4 ± 0.9 days, was
significantly shorter (p = 0.0016; Figure 6b, right panel).
Also, the maximum lifespan of 21.0 ± 1.4 days for tpi-1
knock-down worms was shorter than the 23.0 ± 0 day life-
span of wild-type worms (see Additional data file 1 for
more details). Furthermore, a similar shortening of lifespan
was observed when TPI expression was also reduced, begin-
ning with late larval stage L4 parental generation and during
the development of the F1 (Figure 6b, left panel). These
findings confirm earlier studies showing that normal activ-
ity of the PPP is central to the native lifespan of eukaryotic
organisms. In addition, our results revealed that yeast and
C. elegans with reduced TPI activity were short-lived. In this
context, it should be noted that the TPI substrate dhap,
which is greatly increased in cells with reduced TPI activity
([13,14] and see Figure 4) is thought to be a main biologi-
cal source of methylglyoxal, a potent precursor of advanced
glycation endproducts (AGEs) [37]. Moreover, it is feasible
that the altered redox state of cells with reduced TPI activity
(‘reductive stress’) has a negative impact on natural lifespan.
10.12 Journal of Biology 2007, Volume 6, Article 10 Krobitsch et al. http://jbiol.com/content/6/4/10
Journal of Biology 2007, 6:10
Figure 6Lifespan analysis of S. cerevisiae and C. elegans. (a) The median replicative lifespan of yeast strains BY4741, MR130, MR131, MR136, and MR137 wasdetermined by counting surviving mother cells per generation. (b) For the lifespan analysis of C. elegans the parental and the F1 generation (leftpanel, 117 wild-type and 80 tpi-1 RNAi animals were analyzed) or the F1 generation only (right panel, 74 wild-type and 47 tpi-1 RNAi animals) wereplaced on the respective agar plates and survival of the worms was monitored every day.
(a)
(b)
100
90
80
70
60
50
40
30
20
10
00
0 40
20
40
60
80
100
8 12Time (days)
Ani
mal
s al
ive
(per
cent
age)
16 20 0 40
20
40
60
80
100
8 12Time (days)
Ani
mal
s al
ive
(per
cent
age)
16 20
5 10 15 20 25Generations
Cel
ls a
live
(per
cent
age)
30 35 40 45 50
BY4741MR130 (TPI)
MR136 (∆ZWF1 TPI)MR137 (∆ZWF1 TPIlle170Val)
Control
Parental and F1 generation on RNAi F1 generation on RNAi
tpl-1 RNAiControltpl-1 RNAi
MR131 (TPIlle170Val)
BY4741MR130MR131MR136MR137
23.00
Median lifespan
21.0018.0017.0016.00
0.61
Standarderror
Median
1.622.301.351.47
DiscussionHere we provide the first evidence, by means of genetic and
metabolic datasets along with in silico modeling, that active
dynamic rerouting of the carbohydrate flux represents an
immediate key to counteracting oxidative stress. Although
earlier studies reported that an enhanced activity of the
well-conserved PPP, which is strongly interconnected with
the glycolytic pathway, was observed in mammalian cells
under conditions of oxidative stress [7,15], the underlying
cellular mechanism is far from being understood. Encour-
aged by the discovery that a reduction in intracellular TPI
activity results in enhanced oxidant resistance in S. cerevisiae
and C. elegans, we directly addressed the question of
whether blockage of TPI causes a redirection of the meta-
bolic flux from glycolysis to the PPP. By genetic means, we
showed that the oxidant resistant phenotype of cells with
reduced TPI activity is based on the activity of the PPP; this
effect is absent in yeast cells in which the first and rate-limit-
ing step of the PPP is inhibited. In addition, our metabolic
datasets clearly support the idea that decreasing the cellular
TPI activity leads to raised levels of PPP metabolites. We
also provide experimental and in silico evidence that
increased reduction of NADP+ to NADPH within the PPP,
which raises the electrochemical potential of the cell, is
responsible for the enhanced oxidant tolerance.
Because ROS provoke a shift of the cellular redox state,
which is often defined as the balance of the overall
NADH/NAD+ and NADPH/NADP+ ratios, a central task in
counteracting oxidative damage is to maintain the cytoplas-
mic NADPH/NADP+ ratio. For this process, enzymes of the
PPP are crucial. In contrast to NAD(H), whose redox equiva-
lents are shuttled between mitochondria and cytoplasm
[38], the cellular pools of NADP(H) seem to be maintained
independently; NADPH generated in the cytoplasm is not
available to mitochondria, and vice versa. In addition, cyto-
plasmic and mitochondrial NADP(H) are synthesized inde-
pendently from NAD(H) by different NAD and NADH
kinases [39]. Moreover, the intracellular concentration of
NADP(H) is low compared with that of NAD(H); it has also
been reported that the majority of cellular pyridine
nucleotides are found bound to protein and so a minority
of the NADP(H) pool remains free [18]. Besides metabolic
pathways, the cellular redox state influences cellular control
tasks such as signaling and transcription, and its mainte-
nance is therefore central to proper biological function and
survival.
Although inactivation of GAPDH, the enzyme acting
directly downstream of TPI, had been observed in most cell
types subjected to oxidants such as hydroperoxides
[5,8,9,15,27,40], the significance of this at the cellular level
remained unclear. It has been speculated that GAPDH inac-
tivation might result in a redirection of the carbohydrate
flux [6,8]; however, no direct evidence for this had been
presented. Here, we were able to address this question by
combining genetic and metabolic analyses. Our model
system is based on the fact that diamide treatment, in con-
trast to other oxidants, does not affect GAPDH activity in
yeast. Our experiments showed that blocking GAPDH activ-
ity led to similar changes in levels of PPP metabolites as
observed in cells with low TPI activity. Thus, the inactiva-
tion of GAPDH functions as a cellular switch that reroutes
the carbohydrate flux to maintain the cytoplasmic
NADPH/NADP+ equilibrium to counteract oxidative stress.
In addition, it is fairly likely that the altered levels of
metabolites act as an early signaling event in cell-cycle pro-
gression and control, as it has been shown that GAPDH
activity is a main regulator of H2O2-induced apoptosis [41].
In general, oxidative stress contributes profoundly to the
cellular aging process, as well as to a large number of
genetic and infectious diseases. Therefore, understanding
the mechanisms that counteract the cellular consequences
of oxidative stress is of immense interest, in particular in the
perspective that enhancing cellular tolerance of eukaryotic
cells to oxidative stress may result in the identification of
proteins exploitable as therapeutic targets. In this light, the
glucose analog and glycolytic inhibitor 2-deoxy-D-glucose
(2DG) is in clinical trials as an anti-cancer therapeutic
(reviewed in [42]), and was recently shown to have potent
anti-epileptic properties [43]. Of note, 2DG seems to inhibit
glycolysis mainly by interfering with the enzyme phospho-
glucose isomerase [44,45]. Thus, it is conceivable that 2DG
induces a deviation of the carbohydrate flux similar to that
we have demonstrated in this study. Since epilepsy is
strongly associated with oxidative stress (for review see
[46]), 2DG and other glycolytic inhibitors may have
promising potential as therapeutics for oxidative stress-
related neuronal disorders, such as Alzheimer’s disease,
Parkinson’s disease and trinucleotide expansion disorders.
Materials and methodsPlasmidsThe plasmid encoding K. lactis GDP1 (p1696) and the
p416GPD-based plasmids encoding wild-type human TPI
or TPIIle170Val were described earlier [11,47]. The generation
of additional plasmids used in this study is described in
Additional data file 4.
Yeast cultivation and strainsYeast was cultivated in YPD medium or synthetic complete
(SC) medium lacking the indicated amino acids/bases and
containing 2% glucose as described [11]. All yeast strains
generated and used in this study are listed in Table 1.
http://jbiol.com/content/6/4/10 Journal of Biology 2007, Volume 6, Article 10 Krobitsch et al. 10.13
Journal of Biology 2007, 6:10
The deletion strains ∆tpi1∆zwf1 (MR123), ∆tpi1∆sol3 (MR120)
and ∆tpi1∆sol4 (MR121) were generated by single gene
replacement approaches using the kanMX4 marker in case
of the ZWF1 gene deletion or MET15 in case of the SOL3
and SOL4 gene deletion. Briefly, PCR products encoding the
MET15 gene or the kanMX4 gene were amplified by PCR
using plasmids pRS411 [48] or pUG6 [49] as a template.
The respective primer pairs encompassing a homologous
boundary 5’ and 3’ to the target locus are listed in Addi-
tional data file 4. After transformation of the parental ∆tpi1
strain MR101, single recombinants were selected on syn-
thetic minimal media supplemented with histidine or com-
plete media (YPD) containing 200 µg/ml G418 (Gibco,
Invitrogen, Carlsbad, CA). After selection and validation of
the respective clones, the newly generated strains were trans-
formed with p413GPD-based centromeric plasmids encod-
ing human TPI or TPIIle170Val. Subsequently, single clones
were isolated on SC-his media, and counterselected against
the URA3-CEN plasmid on SC-his media containing 0.15%
5-fluoroorotic acid.
For the oxidative stress resistance experiments, yeast cells
were grown overnight in SC medium lacking the amino
acids or bases as indicated, diluted to the same optical
density at 600 nm and spotted as fivefold dilution series
onto agar plates supplemented with differing concentra-
tions of diamide (in 0.2 mM steps) or H2O2 (in 0.05 mM
steps). Using liquid cultures, oxidative stress was induced by
adding 2 mM H2O2 to exponentially growing cultures for
30 min as described earlier [28].
Yeast median replicative lifespan was assayed by micro-
dissection of a cohort of at least 40 cells per strain on
defined SC medium as described earlier [50]. To determine
whether two given lifespan distributions were significantly
different at the 95% confidence level, Breslow, Tarone-Ware
and log-rank statistics were used, and statistical calculations
were performed using the SPSS 13.0 software package.
SDS-PAGE and western blottingSDS-PAGE and western blotting were carried out as
described previously [11] using a BioRad Mini Protean gel
chamber and a semi-dry electroblotter. Primary antibodies
were used in the following dilutions: anti-TPI (1:4000 [51]),
anti-G6PDH (1:5000, Sigma Aldrich A9521), anti-HSP82
(cross-reacts with C. elegans daf21, 1:4000, provided by
Susan Lindquist) and polyclonal anti-GAPDH (1:2500,
Abcam 36840-1).
10.14 Journal of Biology 2007, Volume 6, Article 10 Krobitsch et al. http://jbiol.com/content/6/4/10
Journal of Biology 2007, 6:10
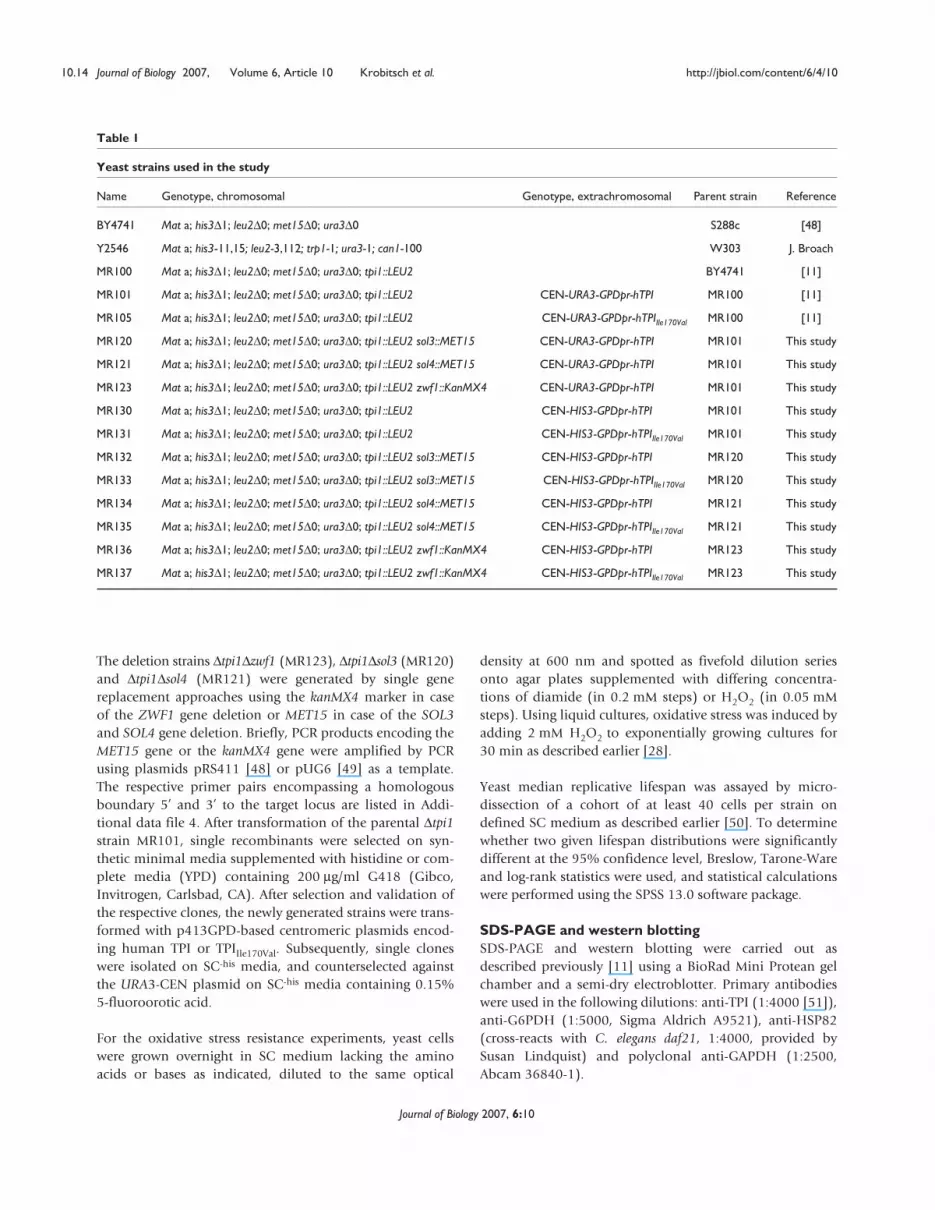
Table 1
Yeast strains used in the study
Name Genotype, chromosomal Genotype, extrachromosomal Parent strain Reference
BY4741 Mat a; his3∆1; leu2∆0; met15∆0; ura3∆0 S288c [48]
Y2546 Mat a; his3-11,15; leu2-3,112; trp1-1; ura3-1; can1-100 W303 J. Broach
MR100 Mat a; his3∆1; leu2∆0; met15∆0; ura3∆0; tpi1::LEU2 BY4741 [11]
MR101 Mat a; his3∆1; leu2∆0; met15∆0; ura3∆0; tpi1::LEU2 CEN-URA3-GPDpr-hTPI MR100 [11]
MR105 Mat a; his3∆1; leu2∆0; met15∆0; ura3∆0; tpi1::LEU2 CEN-URA3-GPDpr-hTPIIle170Val MR100 [11]
MR120 Mat a; his3∆1; leu2∆0; met15∆0; ura3∆0; tpi1::LEU2 sol3::MET15 CEN-URA3-GPDpr-hTPI MR101 This study
MR121 Mat a; his3∆1; leu2∆0; met15∆0; ura3∆0; tpi1::LEU2 sol4::MET15 CEN-URA3-GPDpr-hTPI MR101 This study
MR123 Mat a; his3∆1; leu2∆0; met15∆0; ura3∆0; tpi1::LEU2 zwf1::KanMX4 CEN-URA3-GPDpr-hTPI MR101 This study
MR130 Mat a; his3∆1; leu2∆0; met15∆0; ura3∆0; tpi1::LEU2 CEN-HIS3-GPDpr-hTPI MR101 This study
MR131 Mat a; his3∆1; leu2∆0; met15∆0; ura3∆0; tpi1::LEU2 CEN-HIS3-GPDpr-hTPIIle170Val MR101 This study
MR132 Mat a; his3∆1; leu2∆0; met15∆0; ura3∆0; tpi1::LEU2 sol3::MET15 CEN-HIS3-GPDpr-hTPI MR120 This study
MR133 Mat a; his3∆1; leu2∆0; met15∆0; ura3∆0; tpi1::LEU2 sol3::MET15 CEN-HIS3-GPDpr-hTPIIle170Val MR120 This study
MR134 Mat a; his3∆1; leu2∆0; met15∆0; ura3∆0; tpi1::LEU2 sol4::MET15 CEN-HIS3-GPDpr-hTPI MR121 This study
MR135 Mat a; his3∆1; leu2∆0; met15∆0; ura3∆0; tpi1::LEU2 sol4::MET15 CEN-HIS3-GPDpr-hTPIIle170Val MR121 This study
MR136 Mat a; his3∆1; leu2∆0; met15∆0; ura3∆0; tpi1::LEU2 zwf1::KanMX4 CEN-HIS3-GPDpr-hTPI MR123 This study
MR137 Mat a; his3∆1; leu2∆0; met15∆0; ura3∆0; tpi1::LEU2 zwf1::KanMX4 CEN-HIS3-GPDpr-hTPIIle170Val MR123 This study

Enzyme activity assaysGAPDH activity assays were performed with minor modi-
fications as described [52]. Briefly, cell lysates were added
to a photometric cuvette containing 1 ml of 1 mM NAD+
dissolved in 30 mM Na-pyrophosphate buffer, pH 8.4.
The reaction was started at room temperature by adding
10 µl 40 mM gly3p. Enzyme activity under steady-state
conditions was calculated as the rate of NAD+ reduction
per minute determined in 5-10 sec intervals as the
absorbance of NADH at a wavelength of 340 nm using an
Amersham Ultrospec 3100 spectrophotometer. TPI activ-
ity of whole-cell extracts was determined as described pre-
viously [11].
C. elegans culture and assaysNematodes were cultured at 20°C on NG agar plates with
the E. coli strain OP50. We used the strains N2 and daf-
2(e1370). RNAi experiments were carried out on NGM agar
plates supplemented with 50 µg/ml ampicillin and 1 mM
isopropyl-beta-D-thiogalactopyranoside. Overnight bacterial
cultures (LB medium with 100 µg/ml ampicillin) of RNAi-
producing E.coli from the RNAi library [53] (Geneservice,
Cambridge, UK) were concentrated by half and seeded on
the plates, dried overnight at room temperature and then
kept at 4°C for subsequent use.
C. elegans lifespan assays were performed at 20°C. Wild-
type N2 worms were fed with E. coli that produce double-
stranded RNA of the C. elegans tpi-1 gene (Y17G7B.7; MRC
Geneservice_Location: II-8I11) or contain the empty RNAi
vector L4440 as control. Twenty-five L4 worms of the F1
generation were set up onto one RNAi plate. During the
reproductive period the worms were transferred daily; later
on every week. The RNAi plates were not older than 4 days
and were seeded one or two days before use. The number of
dead versus live animals was determined every day. Day 0
corresponds to the L4 stage. P-values were calculated on the
pooled data of all of the experiments done in each set by
using the log-rank (Mantel-Cox) [54].
Oxidative stress resistance was assayed by transferring 1-
day-old adults on plates containing 250 mM diamide
(Sigma) or 10 µM juglone (Sigma). Survival was scored over
a 10-h period at 20°C. Diamide and juglone plates were
produced one day before use and experiments were
repeated at least twice. p-values were calculated by using the
log-rank (Mante-Cox) method.
Quantitative metabolite measurementsFor the measurements of sugar phosphates, yeast cultures
were grown in rich medium (YPD) overnight. Subsequently,
cell cultures were diluted to an OD600 of 0.15, and two yeast
cultures of each overnight culture were grown in parallel to
mid-log phase. Cells were then collected by centrifugation,
washed, shock-frozen in liquid nitrogen and lysed by glass
beads in cold Hank’s Balanced Salt Solution (without
phenol red) containing 2% perchloric acid for immediate
denaturation of proteins after lysis. All steps of the lysate
generation were carried out in a cold room at 4°C.
Samples were then stored at -80°C, thawed and 50 µl
internal standard (10 µM 13C6-glucose-6-phosphate) was
added to 50 µl of the lysate. Samples were then neutral-
ized with 1 M phosphate buffer (pH 11.5) and centrifuged
for 5 min at 21,000g at 4°C. Supernatants were transferred
to glass vials and capped. Calibrators of dhap, r5p, x5p,
g6p, s7p, 6pg, gly3p and gol3p were included in each
batch of samples and were processed as described above.
LC-MS/MS analysis for quantification of metabolites was
carried out as described earlier [55]. Briefly, liquid chro-
matography was performed using a Perkin-Elmer series
200 pump with a 3.9 x 150 mm Symmetry C18 HPLC
column (bead size 5 µm, Waters Chromatography, Etten-
Leur, The Netherlands). For gradient elution, a binary
solvent was used as described before [55]. Solvent A con-
sisted of 12.5% acetonitrile (ACN)/water containing
500 mg/l octylammonium acetate (pH 7.5) and solvent B
consisted of 50% ACN/water containing 500 mg/l octy-
lammonium acetate (pH 7.5). The column was rinsed with
solvent A for 3 min to load the column with ion-pairs. The
initial composition of the binary solvent was 100% A, fol-
lowed by a linear gradient to 40% A and 60% B in 8 min.
Thereafter, the mobile-phase composition was changed to
100% B and stayed there for 2 min. Finally the mobile-
phase composition was changed to 100% A for 5 min to
reload the column with ion-pairs. The flow rate was set to
1 ml/min and was split post-column into a ratio of 1:4,
resulting in an inlet flow into the tandem mass spectrome-
ter of 200 µl/min; 3 µl sample was injected onto the
column and the total run time was 20 min.
Detection of the sugar phosphates was carried out on an
API-3000 tandem mass spectrometer (PE-Sciex, Applied
Biosystems, Foster City, CA) equipped with an electron ion
spray source (Turbo Ion Spray, Applied Biosystems) operat-
ing in negative multiple reaction monitoring (MRM-mode).
The MRM transitions (Q1/Q3) settings for the different
sugar phosphates were: dhap/Gly3p, m/z -169/-97; gol3p,
m/z -171/-79; r5p and x5p, m/z -229/-97; g6p, m/z
-259/-97; 13C6-g6p (internal standard): m/z -265/-97; 6pg:
m/z -275/-97, and s7p, m/z -289/-97. Data were acquired and
processed using Analyst™ for Windows NT software (Ver.
1.3.1). To convert the quantitative measurements into esti-
mated, absolute cellular metabolite concentrations (required
for parameter fitting of the mathematical model), we used a
dhap concentration of 0.76 mM, which was recently deter-
mined enzymatically in mid-log phase wild-type yeast cells
http://jbiol.com/content/6/4/10 Journal of Biology 2007, Volume 6, Article 10 Krobitsch et al. 10.15
Journal of Biology 2007, 6:10
[14], as a base to calculate a calibration factor of 0.477.
Absolute as well as relative metabolite concentrations are
given in Additional data file 3.
To determine the cellular NADPH/NADP+ concentration,
yeast was grown in YPD to mid-log phase, collected by cen-
trifugation and washed in Tris-EDTA buffer. Afterwards, the
cell pellet was shock-frozen, thawed, and resuspended in
TE buffer. Cells were lysed by rigorous mixing (3 x 2 min,
4°C) using acid-washed glass beads before the supernatant
was cleared by centrifugation. Subsequently, 34:24:1
phenol:chloroform:isoamyl-alcohol was added to the
supernatant and supplemented with 6.6 mM EDTA as
described by Noack et al. [24]. After rigorous mixing, phase
separation was enforced by centrifugation and the aqueous
phase was then extracted twice with water-saturated dieth-
lyether. These extracts were immediately frozen in liquid
nitrogen and stored at -80°C until LC-MS/MS analysis. The
quality of the extraction method was controlled by HPLC
analysis using an C18 (RP) column and UV detection at
254 nm (data not shown). Liquid chromatography and
MS/MS detection was performed as described above for the
other metabolites; the MRM transitions (Q1/Q3) settings
were m/z -742.2/-620.1 for NADP+ and m/z -744.2/-79.0
for NADPH. Standards were obtained from Sigma (St
Louis, MO).
Kinetic modelingTo develop a kinetic model of the combined reactions
of glycolysis and the PPP, we used the model of Teusink
et al. [31] as a basis for the glycolytic reactions (avail-
able in SBML format from JWS online at [56]). In brief,
we included the reaction between dhap and gly3p as
reversible Michaelis-Menten kinetics and added all the
reactions belonging to the PPP. The following equa-
tions were used for the different kinetic types (V+ =
maximum rate of forward reaction, V- = maximum rate
of backward reaction, Ks = Michaelis-Menten constant
of the substrate, Kp = Michaelis-Menten constant of the
product).
Irreversible uni-uni Michaelis-Menten (MM):
V+ · Sv = ————
S + Ks
Reversible uni-uni MM:
V+ · S—Ks
– V- · P—Kp
v = ————————————
1 + S—Ks
+ P—Kp
Reversible bi-bi MM:
V+ · S1—Ks1
· S2—Ks2
– V- · P1—Kp1
· P2—Kp2
v = ——————————————————
(1 + S1—Ks1
+ P1—Kp1) · (1 +
S2—Ks2
+ P2—Kp2)
Irreversible bi-bi MM with inhibition by product 1:
V+ · S1—Ks1
· S2—Ks2
v = ———————————————
(1 + S1—Ks1
+ P1—Kp1) · (1 +
S2—Ks2)
All the reactions included in the model, with the kinetic
type and kinetic parameters used, are given in Additional
data file 2. The type of kinetics was, in most cases, derived
using information from Stryer [57]. Enzyme activity that
was only provided as U/mg protein in the literature was
converted to mM/min on the assumption that the typical
protein concentration in the cytoplasm is around 0.26 µg/µl
(J. Snoep, personal communication). Another relationship
that was used to convert different units is the following
constraint:
V+ ΠKmProductskeq = —— · ——————
V- ΠKmSubstrates
Because almost all reactions use some form of saturation
kinetics, it is possible that the system does not enter a steady
state (that is, some metabolites accumulate without limit).
Using the kinetic data from five different species (human,
cow, rabbit, yeast, E. coli) that were measured over a time
span of more than 30 years, this indeed happened. To avoid
this non-physiological situation, a Vmax of 4 mM/min was
used instead of the calculated 0.53 mM/min for reaction 17,
and Vmax values of 4 and 2 mM/min were used instead of
the calculated values of 0.04 and 0.02 mM/min for reaction
22 (see Additional data file 2). The model was implemented
using CellDesigner 3.2 [58]. The generated SBML code was
then used with Copasi 4B20 [32] to perform the parameter
fitting. The SBML code of the model is available as Addi-
tional data file 5.
Additional data filesAdditional data are available with this article online. Addi-
tional data file 1 contains details of the C. elegans experi-
ment. Additional data file 2 contains a figure and a table of
the reactions included in the mathematical model to study
the effects of a diminished TPI or GAPDH activity on the
10.16 Journal of Biology 2007, Volume 6, Article 10 Krobitsch et al. http://jbiol.com/content/6/4/10
Journal of Biology 2007, 6:10
flux through glycolysis and the pentose phosphate pathway.
Additional data file 3 contains tables of metabolite concen-
trations. Additional data file 4 contains information on the
generation of plasmids and oligonucleotides used in this
study. Additional data file 5 contains the SBML code for the
mathematical model.
Acknowledgements We thank Peter Richard (VTT Biotech, Finland), James Broach (PrincetonUniversity, USA), Dieter Edbauer (MIT, USA), Susan Lindquist (White-head Institute for Biomedical Research, USA) and Ryoichi Yamaji (OsakaPrefecture University, Japan) for providing reagents. We are grateful toour lab members, especially to Ute Nonhoff and Josmar Langner, for criti-cal and productive discussions, to Joyce So for critical reading of the man-uscript, to Dan Shenton (University of Manchester, UK) Erwin Jansen(VUMC, Amsterdam, The Netherlands) for helpful technical advice and G.Kustatscher (EMBL, Heidelberg, Germany) for inspiring debates. Thework was supported by the Max Planck Society, the FWF (Vienna,Austria, project S9302-B05 to M.B.), the Ministry of Innovation, Science,Research and Technology of North Rhine-Westphalia (PtJ-Az.:z0511V01to A.K.), the Federal Ministry of Education and Research (BMBF) in theframework of the National Genome Research Network (0313359, B.G.),and by the European Union (Yeast Systems Biology Network, LSHG-CT-2005-018942 to E.K.).
References1. Godon C, Lagniel G, Lee J, Buhler JM, Kieffer S, Perrot M,
Boucherie H, Toledano MB, Labarre J: The H2O2 stimulon inSaccharomyces cerevisiae. J Biol Chem 1998, 273:22480-22489.
2. Demple B, Amabile-Cuevas CF: Redox redux: the control ofoxidative stress responses. Cell 1991, 67:837-839.
3. Ishii N, Nakahigashi K, Baba T, Robert M, Soga T, Kanai A, Hira-sawa T, Naba M, Hirai K, Hoque A, et al.: Multiple high-throughput analyses monitor the response of E. coli toperturbations. Science 2007, 316:593-597.
4. Desaint S, Luriau S, Aude JC, Rousselet G, Toledano MB:Mammalian antioxidant defenses are not inducible byH2O2. J Biol Chem 2004, 279:31157-31163.
5. Newman SF, Sultana R, Perluigi M, Coccina R, Cai J, PierceWM, Klein JB, Turner DM, Butterfield DA: An increase inS-glutathionylated proteins in the Alzheimer’sdisease inferior parietal lobule, a proteomicsapproach. J Neurosci Res 2007, 85:1506–1514.
6. Shenton D, Grant CM: Protein S-thiolation targets glycoly-sis and protein synthesis in response to oxidative stressin the yeast Saccharomyces cerevisiae. Biochem J 2003,374:513-519.
7. Colussi C, Albertini MC, Coppola S, Rovidati S, Galli F, Ghibelli L:H2O2-induced block of glycolysis as an active ADP-ribosy-lation reaction protecting cells from apoptosis. FASEB J2000, 14:2266-2276.
8. Chuang DM, Hough C, Senatorov VV: Glyceraldehyde-3-phosphate dehydrogenase, apoptosis, and neurodegener-ative diseases. Annu Rev Pharmacol Toxicol 2005, 45:269-290.
9. Dastoor Z, Dreyer JL: Potential role of nuclear translocationof glyceraldehyde-3-phosphate dehydrogenase in apopto-sis and oxidative stress. J Cell Sci 2001, 114:1643-1653.
10. Ravichandran V, Seres T, Moriguchi T, Thomas JA, Johnston RB Jr.:S-thiolation of glyceraldehyde-3-phosphate dehydroge-nase induced by the phagocytosis-associated respiratoryburst in blood monocytes. J Biol Chem 1994, 269:25010-25015.
11. Ralser M, Heeren G, Breitenbach M, Lehrach H, Krobitsch S:Triose phosphate isomerase deficiency is caused byaltered dimerization - not catalytic inactivity - of themutant enzymes. PLoS ONE 2006, 1:e30.
12. Ciriacy M, Breitenbach I: Physiological effects of seven differ-ent blocks in glycolysis in Saccharomyces cerevisiae. J Bacte-riol 1979, 139:152-160.
13. Hollan S, Fujii H, Hirono A, Hirono K, Karro H, Miwa S, Harsanyi V,Gyodi E, Inselt-Kovacs M: Hereditary triosephosphate iso-merase (TPI) deficiency: two severely affected brothersone with and one without neurological symptoms. HumGenet 1993, 92:486-490.
14. Shi Y, Vaden DL, Ju S, Ding D, Geiger JH, Greenberg ML: Geneticperturbation of glycolysis results in inhibition of de novoinositol biosynthesis. J Biol Chem 2005, 280:41805-41810.
15. Janero DR, Hreniuk D, Sharif HM: Hydroperoxide-inducedoxidative stress impairs heart muscle cell carbohydratemetabolism. Am J Physiol 1994, 266:C179-188.
16. Le Goffe C, Vallette G, Charrier L, Candelon T, Bou-Hanna C,Bouhours JF, Laboisse CL: Metabolic control of resistance ofhuman epithelial cells to H2O2 and NO stresses. Biochem J2002, 364:349-359.
17. Nogae I, Johnston M: Isolation and characterization of theZWF1 gene of Saccharomyces cerevisiae, encoding glucose-6-phosphate dehydrogenase. Gene 1990, 96:161-169.
18. Pollak N, Dolle C, Ziegler M: The power to reduce: pyridinenucleotides - small molecules with a multitude of func-tions. Biochem J 2007, 402:205-218.
19. Kosower NS, Kosower EM, Wertheim B, Correa WS:Diamide, a new reagent for the intracellular oxidationof glutathione to the disulfide. Biochem Biophys Res Commun1969, 37:593-596.
20. Mumberg D, Muller R, Funk M: Yeast vectors for the con-trolled expression of heterologous proteins in differentgenetic backgrounds. Gene 1995, 156:119-122.
21. O’Brien PJ: Molecular mechanisms of quinone cytotoxicity.Chem Biol Interact 1991, 80:1-41.
22. Thomas D, Cherest H, Surdin-Kerjan Y: Identification of thestructural gene for glucose-6-phosphate dehydrogenase inyeast. Inactivation leads to a nutritional requirement fororganic sulfur. EMBO J 1991, 10:547-553.
23. Stanford DR, Whitney ML, Hurto RL, Eisaman DM, Shen WC,Hopper AK: Division of labor among the yeast Sol proteinsimplicated in tRNA nuclear export and carbohydratemetabolism. Genetics 2004, 168:117-127.
24. Noack H, Kunz WS, Augustin W: Evaluation of a procedurefor the simultaneous determination of oxidized andreduced pyridine nucleotides and adenylates in organicphenol extracts from mitochondria. Anal Biochem 1992,202:162-165.
25. Verho R, Richard P, Jonson PH, Sundqvist L, Londesborough J,Penttila M: Identification of the first fungal NADP-GAPDHfrom Kluyveromyces lactis. Biochemistry 2002, 41:13833-13838.
26. Boles E, Lehnert W, Zimmermann FK: The role of the NAD-dependent glutamate dehydrogenase in restoring growthon glucose of a Saccharomyces cerevisiae phosphoglucoseisomerase mutant. Eur J Biochem 1993, 217:469-477.
27. Shenton D, Perrone G, Quinn KA, Dawes IW, Grant CM: Reg-ulation of protein S-thiolation by glutaredoxin 5 in theyeast Saccharomyces cerevisiae. J Biol Chem 2002,277:16853-16859.
28. Grant CM, Quinn KA, Dawes IW: Differential protein S-thio-lation of glyceraldehyde-3-phosphate dehydrogenaseisoenzymes influences sensitivity to oxidative stress. MolCell Biol 1999, 19:2650-2656.
29. Funahashi A, Tanimura N, Morohashi M, and Kitano H: Cell-Designer: a process diagram editor for gene-regulatoryand biochemical networks. BIOSILICO 2003, 1:159-162.
30. Hynne F, Dano S, Sorensen PG: Full-scale model of glycolysisin Saccharomyces cerevisiae. Biophys Chem 2001, 94:121-163.
31. Teusink B, Passarge J, Reijenga CA, Esgalhado E, van der Weijden CC,Schepper M, Walsh MC, Bakker BM, van Dam K, Westerhoff HV,Snoep JL: Can yeast glycolysis be understood in terms of invitro kinetics of the constituent enzymes? Testing bio-chemistry. Eur J Biochem 2000, 267:5313-5329.
32. COPASI [http://www.copasi.org]
http://jbiol.com/content/6/4/10 Journal of Biology 2007, Volume 6, Article 10 Krobitsch et al. 10.17
Journal of Biology 2007, 6:10
33. Kaiser W: The effect of hydrogen peroxide on CO2 fixa-tion of isolated intact chloroplasts. Biochim Biophys Acta 1976,440:476-482.
34. Rodriguez-Manzaneque MT, Ros J, Cabiscol E, Sorribas A, Herrero E:Grx5 glutaredoxin plays a central role in protectionagainst protein oxidative damage in Saccharomyces cere-visiae. Mol Cell Biol 1999, 19:8180-8190.
35. Vijg J, Suh Y: Genetics of longevity and aging. Annu Rev Med2005, 56:193-212.
36. Ho HY, Cheng ML, Lu FJ, Chou YH, Stern A, Liang CM, Chiu DT:Enhanced oxidative stress and accelerated cellularsenescence in glucose-6-phosphate dehydrogenase(G6PD)-deficient human fibroblasts. Free Radic Biol Med2000, 29:156-169.
37. Ahmed N, Battah S, Karachalias N, Babaei-Jadidi R, Horanyi M,Baroti K, Hollan S, Thornalley PJ: Increased formation ofmethylglyoxal and protein glycation, oxidation and nitro-sation in triosephosphate isomerase deficiency. BiochimBiophys Acta 2003, 1639:121-132.
38. Bakker BM, Overkamp KM, van Maris AJ, Kotter P, Luttik MA,van Dijken JP, Pronk JT: Stoichiometry and compartmenta-tion of NADH metabolism in Saccharomyces cerevisiae.FEMS Microbiol Rev 2001, 25:15-37.
39. Bieganowski P, Seidle HF, Wojcik M, Brenner C: Synthetic lethaland biochemical analyses of NAD and NADH kinases inSaccharomyces cerevisiae establish separation of cellularfunctions. J Biol Chem 2006, 281:22439-22445.
40. Du X, Matsumura T, Edelstein D, Rossetti L, Zsengeller Z, Szabo C,Brownlee M: Inhibition of GAPDH activity by poly(ADP-ribose) polymerase activates three major pathways ofhyperglycemic damage in endothelial cells. J Clin Invest 2003,112:1049-1057.
41. Magherini F, Tani C, Gamberi T, Caselli A, Bianchi L, Bini L,Modesti A: Protein expression profiles in Saccharomycescerevisiae during apoptosis induced by H2O2. Proteomics2007, 7:1434-1445.
42. Pelicano H, Martin DS, Xu RH, Huang P: Glycolysis inhibitionfor anticancer treatment. Oncogene 2006, 25:4633-4646.
43. Garriga-Canut M, Schoenike B, Qazi R, Bergendahl K, Daley TJ,Pfender RM, Morrison JF, Ockuly J, Stafstrom C, Sutula T, Roopra A:2-Deoxy-D-glucose reduces epilepsy progression by NRSF-CtBP-dependent metabolic regulation of chromatin struc-ture. Nat Neurosci 2006, 9:1382-1387.
44. Wick AN, Drury DR, Nakada HI, Wolfe JB: Localization ofthe primary metabolic block produced by 2-deoxyglu-cose. J Biol Chem 1957, 224:963-969.
45. Kuo SC, Lampen JO: Inhibition by 2-deoxy-D-glucose of syn-thesis of glycoprotein enzymes by protoplasts of Saccha-romyces: relation to inhibition of sugar uptake andmetabolism. J Bacteriol 1972, 111:419-429.
46. Costello DJ, Delanty N: Oxidative injury in epilepsy: poten-tial for antioxidant therapy? Expert Rev Neurother 2004,4:541-553.
47. Verho R, Londesborough J, Penttila M, Richard P: Engineeringredox cofactor regeneration for improved pentose fer-mentation in Saccharomyces cerevisiae. Appl Environ Microbiol2003, 69:5892-5897.
48. Brachmann CB, Davies A, Cost GJ, Caputo E, Li J, Hieter P,Boeke JD: Designer deletion strains derived from Saccha-romyces cerevisiae S288C: a useful set of strains and plas-mids for PCR-mediated gene disruption and otherapplications. Yeast 1998, 14:115-132.
49. Guldener U, Heck S, Fielder T, Beinhauer J, Hegemann JH: A newefficient gene disruption cassette for repeated use inbudding yeast. Nucleic Acids Res 1996, 24:2519-2524.
50. Heeren G, Jarolim S, Laun P, Rinnerthaler M, Stolze K, Perrone GG,Kohlwein SD, Nohl H, Dawes IW, Breitenbach M: The role ofrespiration, reactive oxygen species and oxidative stressin mother cell-specific ageing of yeast strains defective inthe RAS signalling pathway. FEMS Yeast Res 2004, 5:157-167.
51. Yamaji R, Fujita K, Nakanishi I, Nagao K, Naito M, Tsuruo T,Inui H, Nakano Y: Hypoxic up-regulation of triosephosphate
isomerase expression in mouse brain capillary endothelialcells. Arch Biochem Biophys 2004, 423:332-342.
52. Hsu SC, Molday RS: Glyceraldehyde-3-phosphate dehydro-genase is a major protein associated with the plasmamembrane of retinal photoreceptor outer segments. J BiolChem 1990, 265:13308-13313.
53. Kamath RS, Ahringer J: Genome-wide RNAi screening inCaenorhabditis elegans. Methods 2003, 30:313-321.
54. Log rank test[http://bioinf.wehi.edu.au/software/russell/logrank/index.html]
55. Wamelink MM, Struys EA, Huck JH, Roos B, van der Knaap MS,Jakobs C, Verhoeven NM: Quantification of sugar phos-phate intermediates of the pentose phosphate pathwayby LC-MS/MS: application to two new inherited defects ofmetabolism. J Chromatogr B Analyt Technol Biomed Life Sci 2005,823:18-25.
56. JWS Online Cellular Systems Modelling[http://jjj.biochem.sun.ac.za]
57. Stryer L: Biochemistry. 4th edition. New York: WH Freeman; 1995.58. CellDesigner [http://celldesigner.org]
10.18 Journal of Biology 2007, Volume 6, Article 10 Krobitsch et al. http://jbiol.com/content/6/4/10
Journal of Biology 2007, 6:10


