Embed Size (px)
Citation preview

Dynamic angling effort influences the value ofminimum-length limits to prevent recruitmentoverfishingM. S . A L L EN & R . N . M . AHRENSFisheries and Aquatic Sciences Program, School of Forest Resources and Conservation, The University of Florida, Gainesville,FL, USA
M. J . HANSENUniversity of Wisconsin – Stevens Point, College of Natural Resources, Stevens Point, WI, USA
R . AR L INGHAUSDepartment of Biology and Ecology of Fishes, Leibniz-Institute of Freshwater Ecology and Inland Fisheries & Inland FisheriesManagement Laboratory, Humboldt-Universität zu Berlin, Berlin, Germany
Abstract Recruitment overfishing occurs when stocks are fished to a level where recruitment declines proportionallywith adult abundance. Although typically considered a commercial fishery problem, recruitment overfishing can alsooccur in freshwater recreational fisheries. This study developed an age-structured model to determine if minimum-length limits can prevent recruitment overfishing in black crappie, Pomoxis nigromaculatus (LeSueur), and walleye,Sander vitreus (Mitchill) fisheries considering angling effort response to changes in fish abundance. Simulationsshowed that minimum-length limits prevented recruitment overfishing of black crappie and walleye, but largerminimum-length limits were required if angler effort showed only weak responses to changes in fish abundance. Lowangler-effort responsiveness caused fishing mortality rates to remain high when stock abundance declined. By contrast,at high effort responsiveness, anglers left the fishery in response to stock declines and allowed stocks to recover.Angler effort for black crappie and walleye fisheries suggested that angler effort could be highly responsive for somefisheries and relatively stable for others, thereby increasing the risk of recruitment overfishing in real fisheries.Recruitment overfishing should be considered seriously in freshwater recreational fisheries, and more studies areneeded to evaluate the responsiveness of angler effort to changes in fish abundance.
K E Y W O R D S : angler behaviour, black crappie, recreational fisheries, regulations, sustainability, walleye.
Introduction
Preventing overfishing is a central management goal forboth recreational and commercial fisheries. Limiting fish-ing mortality to a level that provides maximum sustain-able yield (MSY) is a common benchmark in fisherystock assessment (Hilborn & Stokes 2010). Fishing mor-tality rates that exceed FMAX cause growth overfishing,and regulations such as minimum-length limits, dailybag limits and gear restrictions are commonly used to
prevent growth overfishing in both recreational and com-mercial fisheries.Recruitment overfishing is a more severe form of
overfishing and occurs when spawning stock size isreduced to the point where future recruitment (or popu-lation renewal rate) declines strongly. This is the pointon a stock-recruitment curve where recruitmentbecomes proportional to adult abundance (at smallspawning stock sizes), so that further reductions inadult abundance directly reduce recruitment (Walters &
Correspondence: Mike Allen, Fisheries and Aquatic Sciences Program, School of Forest Resources and Conservation, The University of Florida,7922 NW 71st Street, Gainesville, FL 32653, USA (e-mail: [email protected]; [email protected])
© 2012 Blackwell Publishing Ltd doi: 10.1111/j.1365-2400.2012.00871.x
Fisheries Management and Ecology, 2013, 20, 247–257
247
Fisheries Managementand Ecology

Martell 2004). Recruitment overfishing is usually con-sidered a greater concern than growth overfishingbecause it substantially impairs stock productivity andmay lead to collapse. High-profile commercial fisherycollapses like the northern cod, Gadus morhua L., inthe late 1980s proved that fisheries are capable ofexerting mortality rates sufficiently high to causerecruitment overfishing (Walters & Maguire 1996).Recruitment overfishing does not always lead to col-lapse or extinction, but recovery of the stock could beprevented by regimes shifts that accompany overfishing,as happened for northern cod (Walters & Kitchell2001). Despite the potential for rebound, recruitmentoverfishing and the associated sharp age and size trun-cation should be avoided for precautionary reasons toreduce the potential for destabilised stock dynamics(Anderson et al. 2008; but see Lobón-Cervia 2011),regime shifts (Walters & Kitchell 2001; Carpenter et al.2011) and collective economic and social welfare lossesthat may follow strong stock declines.Most high-profile cases of recruitment overfishing
have occurred in commercial marine fisheries, but it canalso occur in freshwater recreational fisheries (Post et al.2002). Chronic recruitment overfishing of walleye, San-der vitreus (Mitchill), fisheries in Alberta, Canada, werecaused by recreational fishing alone in some fisheriesand from joint exploitation by recreational and commer-cial fisheries in others (Sullivan 2003). Low-lake produc-tivity and high regional angler density causedrecreational fishing effort to remain high, despite low-walleye abundance, which caused recruitment overfish-ing (Sullivan 2003). Similarly, angling exploitation likelycaused recruitment overfishing of a Kansas walleye pop-ulation (Quist et al. 2010). A recreational black crappie,Pomoxis nigromaculatus (LeSueur), fishery exerted a42% exploitation rate, which was near the recruitmentoverfishing threshold (Dotson et al. 2009). Bunnell et al.(2006) suggested that harvest restrictions would improverecruitment of white crappie P. annularis for some Ohioreservoirs, which indicated that some stocks wererecruitment overfished. Canadian rainbow trout, On-corhynchus mykiss (Walbaum), northern pike, Esoxlucius L. and lake trout, Salvelinus namaycush (Wal-baum), recreational fisheries near urban areas have beenoverfished to the point that stocks could only be sus-tained by stocking or highly restrictive harvest regula-tions (Parkinson et al. 2004; Post et al. 2008). Similarly,a Canadian bull trout, Salvelinus confluentus (Suckley),population collapsed in response to recreational fishing,but populations rebounded quickly after a total catch-and-release policy and a natural bait ban displaced har-vest-oriented anglers away from the fishery (Johnstonet al. 2011).
Angler effort responses to changing fishery conditionscould influence the likelihood of recruitment overfishingin recreational fisheries. Changes in habitat quality andenvironmental stochasticity (e.g. Lobón-Cervia 2011)occasionally produce strong year classes, and periods ofhigh fish abundance are expected to attract anglers (Coxet al. 2003; Carpenter & Brock 2004; Post et al. 2008).Temporarily aggregated angling effort may cause peri-odic overfishing. If anglers leave a fishery when stocksdecline through year-class fluctuation, boom-and-bustcycles of effort dynamics could result. Walters and Mar-tell (2004) and Parkinson et al. (2004) argued that anglermovement among lakes to seek high catch rates wouldhomogenise fishery resources as anglers seek out andsequentially deplete systems with above-average catchrates. However, Hunt et al. (2011) showed that this out-come is not likely if anglers seek fishing outcomes thatare unrelated to catching or harvesting (e.g. close traveldistance, high visual attractiveness, facilities). Therefore,understanding the potential for recruitment overfishingby recreational fisheries requires exploring interactionsbetween angler-effort dynamics and commonly appliedharvest regulations on overfishing and fishing quality(Johnston et al. 2010).The objective of this article was to assess the utility of
minimum-length limits to prevent recruitment overfishingand maximise angler use while accounting for anglingeffort responses to changes in the status of fisheries. Asimulation model was built using two example speciesof high interest to consumptive (i.e. harvest oriented)anglers in North America, black crappie and walleye.
Methods
A simple model of dynamic recreational fisheriesexploitation
A single-species fisheries simulation model was con-structed to include two hypotheses about how anglereffort would vary with fish abundance (i.e. responsive vsrelatively unresponsive angler effort to changes in catchrates associated with stock size). The biological sub-model was constructed as an age-structured populationmodel similar to those described elsewhere (Table 1;Walters & Martell 2004, Chapter 3; Allen et al. 2009;Dotson et al. 2009). Model components that are unpub-lished elsewhere are described below.The fisheries model was parameterised to simulate
black crappie and walleye fisheries, both of which sup-port popular harvest-oriented fisheries across much ofNorth America. The walleye was chosen because thebiology of this species is similar to the zander, Sanderlucioperca (L.), a popular recreational fish species across
© 2012 Blackwell Publishing Ltd
M. S. ALLEN ET AL.248

much of Europe (Arlinghaus & Mehner 2004). Bothblack crappie and walleye are sought by anglers as afood fish, so recruitment overfishing is possible (Postet al. 2002; Sullivan 2003; Dotson et al. 2009). Blackcrappie and walleye populations also exhibit sharprecruitment fluctuations (Allen & Pine 2000; Nate et al.2011) that result in large changes in adult abundance.These fluctuations would be expected to affect anglingeffort strongly. Therefore, black crappie and walleye aregood candidate species to explore impacts of recruitmentoverfishing associated with recreational fishing.The black crappie model was informed with data from
Lake Lochloosa, Florida (Table 1). Beverton–Holt andRicker stock-recruitment models were equally descriptivefor crappies in Ohio (Bunnell et al. 2006), but the moregeneral Beverton–Holt model was chosen for the model(Table 1). Recruitment fluctuated stochastically around
the stock-recruit curve in similar magnitude to age-0 blackcrappie survey CPUE data at Lake Lochloosa from 1998to 2011 (CV = 75%) using a log-normal deviate aroundthe Beverton-Holt curve with mean of 1 and SD of 0.75.This was similar to recruitment variability for other blackcrappie populations in southern USA (Allen & Pine 2000).The walleye fishery was calibrated by dynamics from
Escanaba Lake, Wisconsin, where long-term data ongrowth, mortality and recruitment were available(Table 1, Hansen et al. 1998, 2011; Nate et al. 2011).Escanaba Lake was managed with no minimum-lengthlimit, no bag limit and no closed season between 1946and 2003. In 2003, a 711-mm minimum-length limit andone-fish daily bag limit was imposed on the angling fish-ery. The walleye model included a Ricker stock-recruit-ment curve for walleye in Escanaba Lake (Hansen et al.1998; Table 1). Recruitment was varied around this
Table 1. Model formulation and parameter estimates for black crappie and walleye population models
Life-history characteristics
Parameter Values
Black crappie Walleye
Growth (length L at age a) La ¼ L1ð1� e�KaÞ L∞ = 414 mmK = 0.258 yr�1
L∞ = 924 mmK = 0.2 yr�1
Length(mm)-to-weight (kg) W ¼ aLb a = 2.49e-9b = 3.345
a = 3.52e-9b = 3.18
Fecundity maxf0; ðWa �WmatÞg Wmat = 0.123fa ¼ 1=ð1þ e1��nða�amatÞ ÞWa g = 1.73 amat = 4.77
Instantaneous natural mortality M M = 0.4 M = 0.3Eggs-per recruit ue ¼
Pafalajla ¼ e�Mða�1Þ
Recruitment Rt ¼ aEggst1þbEggst
evt����
a ¼ X=ue
b ¼ ðX� 1Þ=ðR0ueÞΩ = 15R0 = 1.5e5
Rt ¼ Stea�bStþvt
a ¼ lnðX=unÞ;un ¼X1
a¼5e�Mða�1Þ
b ¼ ð�lnð1=XÞÞ=ðR0unÞSt ¼
X1a¼5
Na;t
��������٠= 26 R0 = 2.6e3
Fishery characteristics
Vulnerability to capture vca ¼ 1�
1þ e� La�Lhð Þ=r� �Lh = 175 mmr = 17.5
Lh = 300 mmr = 30
Vulnerability to harvest vha ¼ 1�
1þ e� La�Lhð Þ=r� �Lh = variabler = 0.1*Lh
Lh = variabler = 0.1*Lh
Vulnerable biomass (F = 0) VB0 ¼PaR0e�M a�1ð ÞWavha
Vulnerable biomass VBt ¼P
a Na;tWavhaEffort Et ¼ 1
�1þ e� VBh�VBtð Þ=r� �� �
Etotal VBh = 0.5VB0
r = cVBh
c = 0.1 or 0.9Etotal = 50
VBh = 0.5VB0
r = cVBh
c = 0.1 or 0.9Etotal = 200
Time dynamics
Numbers-at-age Na;t ¼ Na�1;t�1e�Msdsh
sd ¼ 1� vca�1 � vha�1
� �1� eqEt�1� �� �
d� �
sh ¼ 1� vha�1 1� eqEt�1� �� �
d = 0.1q = 0.06
d = 0.1q = 0.01
© 2012 Blackwell Publishing Ltd
DYNAMIC ANGLING EFFORT TO PREVENT RECRUITMENT OVERFISHING 249

curve according to a CV of age-0 fish of 86%, in agree-ment with catch-at-age estimates of age-0 abundancefrom 1956 to 1986 (Nate et al. 2011).Analysing how angler effort might respond to changes
in fish abundance and interact with minimum-length lim-its to cause (or prevent) recruitment overfishing was akey issue to address in this study. In general, freshwateranglers move among multiple fish populations (i.e. lakesor rivers within a fisheries landscape) in response to var-iation in expected catch or harvest rates and other fishingquality attributes offered by various sites (Carpenter &Brock 2004; Johnston et al. 2010; Hunt et al. 2011).For angler populations mainly interested in keeping fishfor harvest, the expected harvest at a site and the possi-bility to keep fish should strongly determine site choiceand drive angling effort dynamics (Cox et al. 2002;Beard et al. 2003; Johnston et al. 2010). Anglers wouldthen be expected to change locations in response toexpected catch or harvest rates, which are usuallyassumed to be directly proportional to fish density (New-by et al. 2000; Hansen et al. 2005). For many less har-vest-oriented angler populations or angler types, factorsother than expected catch or harvest rate determine sitechoices (Hunt et al. 2011), but this work assumed thatharvest-based fishery utility drove angling effort for con-sumptive-based black crappie and walleye fisheries simu-lated here.The model simulated a fishery where angler effort
would respond to changes in vulnerable harvest stockbiomass, as would occur if expected harvest is an impor-tant motivation of anglers choosing when and where tofish. The numerical response to angler effort in year t(Et, h (ha yr�1)) was assumed to be related to vulnerablebiomass using a logistic function, similar to recreationalfisheries models by Post et al. (2003) and Arlinghauset al. (2009):
Et ¼ 1.
1þ e� VBh�VBtð Þ=r� h i
Etotal: ð1Þ
In Equation 1, VBh is the vulnerable biomass (kg)where 50% of the total maximum angler effort (Etotal hha�1 yr�1) is realised, VBt is the annual vulnerable bio-mass (kg) in the fished condition (Table 1), and t repre-sents time (yr). Total maximum angling effort is thetotal angling population size multiplied by a maximumpotential annual investment of hours that is constrainedby available leisure time. Only a fraction of this maxi-mum angling effort potential is directed at a fishery,depending on fishing quality of the fishery. The parame-ter r is a shape parameter that describes how stronglyfishing effort responds to changes in vulnerable biomassto enable simulation of a range of slow to fast angling
effort responses to changes in vulnerable fish biomassavailable for harvest. The model assumed that informa-tion about vulnerable biomass is obtained early in theseason and shared instantaneously among anglers, whichis likely with modern fishing information technology.Low values of r cause fishing effort to react rapidly tochanges in vulnerable biomass (i.e. high fishing effortresponsiveness), and high values of r cause fishingeffort to respond slowly to vulnerable biomass (i.e. lowfishing effort responsiveness). The value of r was variedto explore how angler effort responsiveness influencedstock dynamics and the outcome of management actions(i.e. length limits designed to protect small fish fromharvest).The annual exploitation rate (Ut) was calculated in the
model from annual effort as Ut = 1 – eqEt , where q isthe catchability coefficient or the fraction of the fishstock caught per unit effort. The values of Etotal, VBh
and q were scaled for each species to produce fishingeffort and annual exploitation estimates that were similarto those for black crappie and walleye fisheries fromwhich model parameters were derived. The q value washeld constant and did not vary with density of fish. Thisresulted in conservative estimates of recruitment overf-ishing because inverse density-dependence in catchabilitythat is common in some recreational fish species, includ-ing walleye (Post et al. 2002; Hansen et al. 2005),would cause greater probabilities of population collapse(Post et al. 2008; Hunt et al. 2011).Parameters were set to reflect realistic values for black
crappie and walleye for each fishery. For black crappie,Ro was set at 58 age-1 recruits ha�1, a scale parameter(Table 1) that resulted in an equilibrium 32 kg ha�1 ofvulnerable black crappie biomass in the un-fished condi-tion. The walleye model using the stock-recruitmentcurve for Escanaba Lake (Table 1) scaled the populationto the population size in Escanaba Lake (Hansen et al.1998, 2011). The value of VBh was set at 50% of theun-fished vulnerable biomass for both walleye and blackcrappie fisheries, which infers that 50% of a fixed maxi-mum fishing effort would occur at 50% of un-fished bio-mass (Table 1). Maximum fishing effort was set at 50angling h ha�1 yr�1 for black crappie, and 200 hha�1 yr�1 for walleye based on creel survey data fromFlorida for crappie and creel census data from EscanabaLake, Wisconsin for walleye.To represent two hypotheses about angler responsive-
ness to changes in vulnerable biomass, the value of rwas set at 10 and 90% of VBh. Accordingly, a r of 10%(high angler effort responsiveness) resulted in a steep,logistic relationship between fishing effort and vulnera-ble biomass, whereas a r of 90% (low angler effortresponsiveness) caused a weaker, linear relationship
© 2012 Blackwell Publishing Ltd
M. S. ALLEN ET AL.250

between fishing effort and vulnerable biomass (examplefor black crappie, Fig. 1). Therefore, changes in vulnera-ble biomass caused by recruitment fluctuations or regula-tion changes caused substantial changes in fishing effortand exploitation when r was low, but only marginalchanges in effort when r was high.Models were used to evaluate fishery performance,
including biological sustainability and socio-economicfactors indexed by attractiveness of the fishery to anglers.First, no minimum-length limit was simulated by assum-ing fish recruited to the fishery at 200 mm for black crap-pie and 300 mm for walleye. These simulated liberalharvest restrictions where size at harvest was at or abovethe size at maturation. Second, two more-restrictive mini-mum-length limits were modelled for each species, 250and 300 mm for black crappie and 450 and 600 mm forwalleye. Biological sustainability was measured with aweighted spawning potential ratio (SPR), which was com-puted as the population fecundity in the fished conditionrelative to the un-fished condition. Values of SPR below35% are often considered recruitment overfishing in mar-ine systems (Goodyear 1993). Socio-economic benefitsgenerated by recreational fisheries in a region may be per-ceived by managers as directly related to the number ofpeople fishing (i.e. angler effort), so the socio-economicmeasure of fishery performance was total annual fishingeffort attracted to the fishery. The model was used to eval-uate how SPR and fishing effort changed for 1000 modelruns of random recruitment variation for each minimum-length limit and hypothesised level of angler responsive-ness. Model estimates of fishing effort were compared toempirical estimates of fishing effort for black crappie andwalleye fisheries.
Results
Black crappie
Recruitment overfishing by recreational fishing was pos-sible for black crappie, particularly at low minimum-length limits and low fishing-effort responsiveness (Fig.2). The SPR increased with increases in MLL for bothhypothesised values of r, which suggests that lengthlimits could prevent recruitment overfishing independentof angler behaviour (Fig. 2). However, if recreational-fishing effort reacted slowly to changes in expected har-vest, MLLs of 250 mm or more were required to preventrecruitment overfishing for black crappie. Even at aMLL of 300 mm, some probability of recruitment overf-ishing remained if angler effort responsiveness was low.The SPR was generally lower at low fishing effortresponsiveness than for high fishing effort responsive-ness, because at low angler effort responsiveness, fishingeffort stayed nearly constant regardless of vulnerablebiomass (Fig. 1). Conversely, high fishing effort respon-siveness caused fishing effort to decline rapidly if stockabundance declined. In black crappie, a MLL of250 mm or more was particularly effective at preventingrecruitment overfishing at high fishing effort responsive-ness, but less effective if angler effort remained high,despite decreases in fish abundance.Fishing effort was relatively stable across MLLs at
low fishing effort responsiveness (r = 90%) and highlydynamic at high fishing effort responsiveness (r of 10%,Fig. 2). Coefficients of variation in fishing effort ranged8–11% for low fishing effort responsiveness and 76–139% for high fishing effort responsiveness, which mim-icked boom and bust cycles of effort. The MLLsproduced modest increases in average fishing effort forall scenarios, and variability in fishing effort variedamong MLLs. Angler effort variability was highest witha 200-mm MLL and high fishing effort responsivenessbecause strong or weak year classes elicited a rapidresponse in angler effort. Increased angler effort (boom)substantially reduced vulnerable biomass in the sub-sequent 1–3 years to cause periods of low effort as effortshifted away from the stock (bust). For low fishing effortresponsiveness, fishing effort remained relatively con-stant as the MLL increased because effort did notrespond strongly to changes in vulnerable biomass of thestock. Annual exploitation rates mirrored changes inangler effort.Time-dynamic fishing effort did not always increase
with vulnerable biomass of the stock. For example, vul-nerable biomass declined at the 300-mm MLL underhigh fishing effort responsiveness because this largeMLL allowed natural mortality to reduce fish biomass
Figure 1. Example of two hypothesised angler responses to changesin vulnerable biomass. Both lines represent 1000 model runs for blackcrappie under a 200 mm minimum length limit. Angler effort(h ha�1 yr�1) varied according to random recruitment fluctuations inboth scenarios.
© 2012 Blackwell Publishing Ltd
DYNAMIC ANGLING EFFORT TO PREVENT RECRUITMENT OVERFISHING 251

prior to recruitment to the 300-mm MLL. However,average annual fishing effort and annual exploitationincreased slightly and became more stable with a 300-mm MLL than with smaller MLLs (Fig. 2). The higherMLL prevented large declines in stock biomass andthereby allowed fishing effort and fishing mortality to beslightly higher than for the lower MLL. If fishing effortexhibited low responsiveness to changes in biomass,fishing effort increased slightly as the MLL increased.
The model suggested that MLLs would increase fishingeffort at both levels of effort responsiveness by prevent-ing periodic overfishing and low stock biomass.Roving creel survey data for black crappie fisheries in
Florida lakes indicated that angling effort was highlydynamic in some lakes and relatively consistent inothers. Fishing effort at Lake Lochloosa was highly vari-able and ranged 20-fold over the time series (Fig. 3).Lake Griffin had less variable fishing effort and Lake
Figure 2. Model-predicted fishing effort, vulnerable biomass, annual exploitation (U) and spawning potential ratio (SPR) for black crappie. Low(left panels) and high (right panels) fishing effort responsiveness results are shown. Boxplots represent 95% confidence intervals from 1000 simu-lated sets of random recruitment deviations. Horizontal line within each box represents the mean. The SPR value of 35% is shown (dashed line),values below which indicate potential for recruitment overfishing.
© 2012 Blackwell Publishing Ltd
M. S. ALLEN ET AL.252

Istokpoga fishing effort ranged 6–11 angler h ha�1 yr�1
over the time series. Variability in fishing effort declinedwith lake size, which suggests that large lakes (Istokpoga)may have more consistent fishing effort than smallerlakes (Lochloosa). Therefore, empirical data for blackcrappie effort indicated that fishing effort could behighly dynamic, similar to simulations with r of 0.10 insome cases and relatively consistent (i.e. like the loweffort responsiveness scenario) in others. Lakes with rel-atively constant fishing effort (low responsiveness ofeffort) had higher risk of recruitment overfishing thanlakes where effort varied more strongly with stock size.
Walleye
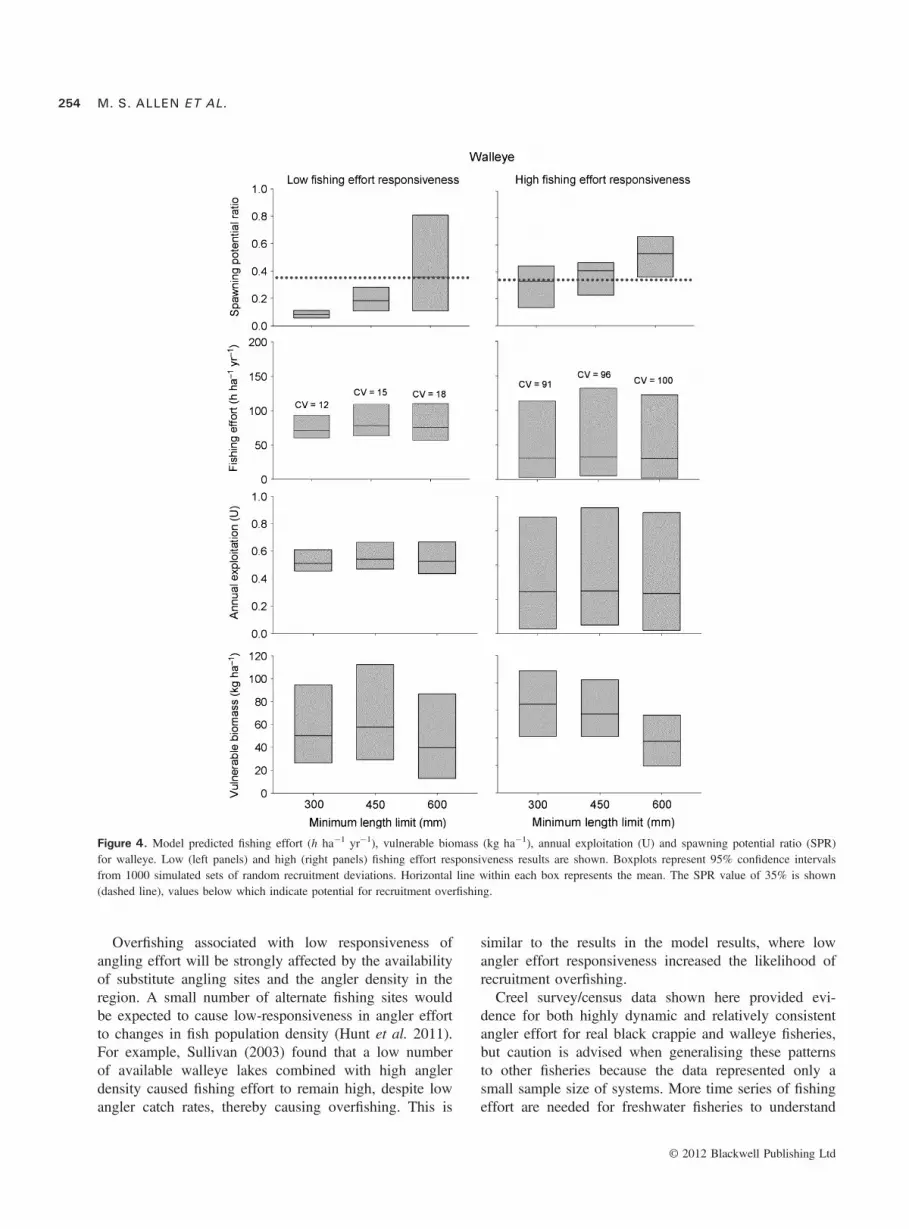
For walleye, SPR increased with MLL for high and lowfishing effort responsiveness, but remained highest underhigh fishing effort responsiveness because anglers leftthe fishery when vulnerable biomass declined (Fig. 4).Even at a high MLL of 600 mm the likelihood ofrecruitment overfishing did not drop to zero when wall-eye angling effort responded slowly to expected harvest.However, if angler effort was highly responsive, the600 mm MLL avoided recruitment overfishing. TheMLLs did not influence fishing effort for either low orhigh fishing effort responsiveness. Vulnerable biomassdeclined under a 600-mm MLL through natural mortalityof the protected biomass, but average fishing effortremained similar as the MLL increased. Variability infishing effort and annual exploitation rate increased forhigh angling effort responsiveness, but variability inangler effort did not decline as the MLL increased foreither low or high fishing effort responsiveness.Creel census data from Escanaba Lake showed that
fishing effort was intermediate between the low and higheffort responsiveness scenarios (Fig. 5). The CV of wall-eye angling effort since 1956 was 40%, which indicatesthat angler effort was higher than the low fishing effortresponsiveness, (CV = 12–18%, Fig. 5) but substantiallylower than the high fishing effort responsiveness. Someof the variability in angler effort was because of veryhigh fishing effort in the 1950s and 1960s, so overallvariability in more recent years was only slightly higher(i.e. 34%) than the low fishing effort responsiveness.This suggests that walleye populations would be rela-tively vulnerable to recruitment overfishing, if this is truefor most walleye fisheries.
Discussion
Angler effort dynamics strongly influenced the potentialfor recruitment overfishing in this study, particularlywith low angler effort responsiveness predicted to cause
recruitment overfishing for both black crappie and wall-eye. Relatively low responsiveness was found empiri-cally for some black crappie fisheries in Florida, and thewalleye fishery in Escanaba Lake, Wisconsin was nothighly responsive to population density. This poses astrong challenge for management of recreational fisheriesbecause effort will remain high even after stocks declineif anglers do not react to changes in fish abundance.Similar findings were reported in a simulation study byJohnston et al. (2010), who showed that overfishing wasmost likely where angler site choice was driven by arange of catch and catch-independent factors, rather thanexpected catch or harvest alone. The resulting multi-attri-bute utility function maintained high fishing effort evenfor declining catch and harvest rates associated withoverfishing by angling (Johnston et al. 2010).
Figure 3. Fishing effort for Florida Lakes Lochloosa (top panel), Grif-fin (centre panel) and Istokpoga, (bottom panel) measured with rovingcreel surveys. The coefficient of variation (CV = SD
�x 9100%) of fishingeffort and lake size is shown. Data were provided by the Florida Fishand Wildlife Conservation Commission.
© 2012 Blackwell Publishing Ltd
DYNAMIC ANGLING EFFORT TO PREVENT RECRUITMENT OVERFISHING 253
Overfishing associated with low responsiveness ofangling effort will be strongly affected by the availabilityof substitute angling sites and the angler density in theregion. A small number of alternate fishing sites wouldbe expected to cause low-responsiveness in angler effortto changes in fish population density (Hunt et al. 2011).For example, Sullivan (2003) found that a low numberof available walleye lakes combined with high anglerdensity caused fishing effort to remain high, despite lowangler catch rates, thereby causing overfishing. This is
similar to the results in the model results, where lowangler effort responsiveness increased the likelihood ofrecruitment overfishing.Creel survey/census data shown here provided evi-
dence for both highly dynamic and relatively consistentangler effort for real black crappie and walleye fisheries,but caution is advised when generalising these patternsto other fisheries because the data represented only asmall sample size of systems. More time series of fishingeffort are needed for freshwater fisheries to understand
Figure 4. Model predicted fishing effort (h ha�1 yr�1), vulnerable biomass (kg ha�1), annual exploitation (U) and spawning potential ratio (SPR)for walleye. Low (left panels) and high (right panels) fishing effort responsiveness results are shown. Boxplots represent 95% confidence intervalsfrom 1000 simulated sets of random recruitment deviations. Horizontal line within each box represents the mean. The SPR value of 35% is shown(dashed line), values below which indicate potential for recruitment overfishing.
© 2012 Blackwell Publishing Ltd
M. S. ALLEN ET AL.254

how fishing effort varies across systems and regions.More research is needed to evaluate why angling effortdynamics vary to understand the shape of fishing effortresponses to changes in fish abundance and other fisheryattributes (sensu Carpenter et al. 1994; Post et al. 2008;Johnston et al. 2011; Hunt et al. 2011; Martin & Pope2011). The model in this study assumed that anglereffort would decline proportionally with stock abundanceas anglers sought areas with higher expected catches(Carpenter et al. 1994; Cox et al. 2003; Parkinson et al.2004; Post et al. 2008), but future research should testthis hypothesis for a wide range of fish species, lakelandscapes and proximities to population centres.Fishing effort responsiveness influenced the potential
for overfishing and should be considered when deliberat-ing management actions. High fishing effort responsive-ness created a greater degree of biological self-regulationthan low fishing effort responsiveness. However, highcatch or harvest orientation by anglers will not necessar-ily prevent recruitment overfishing if overall angler pop-ulation density is high (Sullivan 2003; Hunt et al. 2011).Management actions on one system could displace theproblem from one location to another, thereby resultingin domino-like overfishing patterns under high regionalfishing effort (Carpenter & Brock 2004; Post et al.2008; Hunt et al. 2011). In such situations, even highlyrestrictive harvest regulations may not prevent recruit-ment overfishing if overall effort density is sufficientlyhigh. For example, recruitment overfishing was possibleeven when fishing effort was highly responsive if theMLL was too small for both black crappie and walleye.The findings and related work (e.g. Lester et al. 2003)require a regional perspective for modelling anglingeffort dynamics and a better understanding of howanglers interact with spatially structured fisheries (Huntet al. 2011). In general, available evidence cautionsagainst a one-size-fits-all policy that is applied across
landscapes (Carpenter & Brock 2004). Therefore, anyspecific MLL from this study should not be misinter-preted as being useful to prevent overfishing acrossbroad spatial scales. Locally existing impacts of fishingwill be a function of the availability of sites in a regionrelative to angler density, movement patterns and cul-ture.The model in this study evaluated the utility of simple
length-based harvest limits to prevent recruitment overf-ishing, but the model did not consider angler aversion tolength limits. Large MLLs like 300 mm for black crap-pie and 600 mm for walleye could deter harvest-orientedanglers because implementation of restrictive harvestregulations can cause effort to shift in walleye fisheries(Beard et al. 2003; Fayram et al. 2006). Similarly, wall-eye fishery attractiveness declined despite increasedcatch rates because the ability to harvest was constrained(Sullivan 2003). A similar aversion to restrictive catchand release policies was evident for bull trout anglers(Johnston et al. 2010). Effort responses to implementa-tion of regulations have also been reported for blackcrappie, where experimental use of a 300-mm MLL inFlorida substantially reduced angler effort (Florida Fishand Wildlife Conservation Commission, unpublisheddata). The simulations showed that for black crappiefisheries angler effort could be slightly improved by useof a length limit. Effort responses to changes in size orbag limits will vary among species and regulations, andthis study was not intended to infer that fishing effortwill always increase or remain stable with increasingMLLs. The purpose of this work was to explore howhypotheses about angler effort dynamics could influencerecreational fishing effort and biological sustainability toavoid recruitment overfishing. The results showed that ifanglers are not averse to regulations, use of MLLs couldmaintain angler effort (despite lower vulnerable fish bio-mass in some cases) and improve SPR in recreationalfisheries. Improvements in effort resulted from less fre-quent periods of very low fish biomass owing to thelength limits.The present model assumed constant catchability with
changes in fish abundance, which makes the results con-servative. Catchability is inversely related to populationdensity for many recreationally important species (Postet al. 2002). This would cause fishing mortality rates toremain high as the population declines despite lowerangler effort (Post et al. 2002; Hunt et al. 2011). Anglerswould then not perceive the decline in population abun-dance, if fish spatial distribution contracts as abundancedeclines, thereby increasing or sustaining high individualangler catch rates despite low stock abundance. Further,experienced anglers with higher catchability may continuefishing as population density declines because they are
Figure 5. Fishing effort for Lake Escanaba, Wisconsin. The coefficientof variation (CV = SD
�x 9100%) of fishing effort and lake size (ha) isshown. Data were provided by the Wisconsin Department of NaturalResources.
© 2012 Blackwell Publishing Ltd
DYNAMIC ANGLING EFFORT TO PREVENT RECRUITMENT OVERFISHING 255

able to maintain a high catch rate, thereby increasing aver-age catchability of the angling population (but see Seekellet al. 2011). Incorporating density dependent catchabilityinto the model would not alter relative changes in modeloutput metrics across MLLs but would make recruitmentoverfishing more likely for all MLLs and levels of anglereffort responsiveness. Therefore, the results presentedshould be considered conservative because recruitmentoverfishing would be more likely if angler site choice isdetermined by more than expected harvest and if catch-ability increases as stock size declines (Hunt et al. 2011).The model used in this study evaluated only the effects
of fishing and did not include other perturbations thatcould influence fish stocks and fishing quality. Changes inhabitat quantity and quality will influence recruitment pat-terns and fishing quality regardless of fishing effortdynamics (Minns et al. 1996). Long-term changes in rain-fall patterns and temperature can influence fish abundancethrough recruitment changes (e.g. Busch et al. 2011). Themodel included stochastic recruitment but did not simulatetrends in recruitment or interactions between environmen-tal variation and fishing effort. Future simulations shouldexplore how long-term changes in habitat quality andquantity could interact with angler effort patterns to influ-ence fishery sustainability.The present study showed that recruitment overfishing
can occur in recreational fisheries and is difficult toavoid if angling effort remains attracted to a fishery,despite declines in fish abundance (e.g. Sullivan 2003;Quist et al. 2010). However, the spatial and temporalextent of recruitment overfishing in recreational fisheriesis poorly understood. The model presented here andrelated work (e.g. Hunt et al. 2011) suggests that recruit-ment overfishing should be evaluated more thoroughlywith field studies. Management actions such as MLLscan improve fish populations and socio-economic bene-fits of fisheries by maintaining and increasing anglereffort if angling effort is responsive to fish abundanceand catchability is only weakly density dependent. How-ever, recruitment overfishing is probably more pro-nounced than previously believed based on the anglingresponsiveness values evaluated in this modelling effortand compared with the observed creel survey data.Understanding how anglers respond to changes in fishabundance is a key need for future studies, which shouldquantify angler effort responsiveness to changes in fishabundance and fishery attributes across a range of fisher-ies to improve model predictions.
Acknowledgments
RA acknowledges the funding by the Federal GermanMinistry for Education and Research for the grant Bes-
atzfisch within the Program for Social-EcologicalResearch (grant # 01UU0907, www.besatz-fisch.de). Wethank J. Dotson, T. Tuten, B. Pouder and the FloridaFish and Wildlife Conservation Commission for compi-lation and use of creel survey data from Florida lakes.
References
Allen M.S. & Pine III W.E. (2000) Detecting fish populationresponses to minimum length limits: effects of variablerecruitment and duration of evaluation. North AmericanJournal of Fisheries Management 20, 672–682.
Allen M.S., Brown P., Douglas J., Fulton W. & Catalano M.(2009) An assessment of recreational fishery harvest policiesfor Murray cod in southeast Australia. Fisheries Research 95,260–267.
Anderson C.N.K., Hsieh C., Sandin S.A., Hewitt R., HollowedA., Beddington J. et al. (2008) Why fishing magnifiesfluctuations in fish abundance. Nature 452, 835–839.
Arlinghaus R. & Mehner T. (2004) A management-orientatedcomparative analysis of urban and rural anglers living in ametropolis (Berlin, Germany). Environmental Management 33,331–344.
Arlinghaus R., Shuichi M. & Dieckmann U. (2009) Quantifyingselection differentials caused by recreational fishing:development of modeling framework and application toreproductive investment in pike (Esox lucius). EvolutionaryApplications 2, 335–355.
Beard Jr T.D., Cox S.P. & Carpenter S.R. (2003) Impacts ofdaily bag limit reductions on angler effort in Wisconsinwalleye lakes. North American Journal of FisheriesManagement 23, 1283–1293.
Bunnell D.B., Hale R.S., Vanni M.J. & Stein R.A. (2006)Predicting crappie recruitment in Ohio reservoirs withspawning stock, larval density, and chlorophyll concentrations.North American Journal of Fisheries Management 26, 1–12.
Busch W.N., Scholl R.L. & Hartman W.L. (2011)Environmental factors affecting the strength of walleye(Stizostedion vitreum vitreum) year-classes in western lakeErie, 1960–70. Canadian Journal of Fisheries and AquaticSciences 32, 1733–1743.
Carpenter S. & Brock W. (2004) Spatial complexity, resilience,and policy diversity: fishing on lake-rich landscapes. Ecologyand Society 9, 8.
Carpenter S.R., Munoz-Del-Rio A., Newman S., Rasmussen P.W. & Johnson B.M. (1994) Interactions of anglers andwalleyes in Escanaba Lake, Wisconsin. EcologicalApplications 4, 822–832.
Carpenter S.R., Cole J.J., Pace M.L., Batt R., Brock W.A., ClineT., et al. (2011) Early warnings of regime shifts: a whole-ecosystem experiment. Science 333, 1079–1082.
Cox S.P., Beard Jr T.D. & Walters C. (2002) Harvest control inopen-access sport fisheries: hot rod or asleep at the reel?Bulletin of Marine Science 70, 749–761.
© 2012 Blackwell Publishing Ltd
M. S. ALLEN ET AL.256

Cox S.P., Beard Jr T.D., Walters C.J. & Post J.R. (2003) Activemanagement of recreational fishing effort: a model basedevaluation of policies for British Columbia rainbow troutlakes. North American Journal of Fisheries Management 23,1294–1303.
Dotson J.R., Allen M.S., Johnson W.E. & Benton J. (2009)Impacts of commercial gill net bycatch and recreational fishingon a Florida black crappie population. North AmericanJournal of Fisheries Management 29, 1454–1465.
Fayram A.H., Hansen M.J. & Ehlinger T.J. (2006) Influence ofwalleye stocking on angler effort in Wisconsin. HumanDimensions of Wildlife 11, 129–141.
Goodyear C.P. (1993) Spawning stock biomass per recruit infisheries management: foundation and current use. CanadianSpecial Publication Fisheries and Aquatic Sciences 120, 67–81.
Hansen M.J., Bozek M.A., Newby J.R., Newman S.P. & StaggsM.D. (1998) Factors affecting recruitment of walleyes inEscanaba Lake, Wisconsin, 1958–1996. North AmericanJournal of Fisheries Management 18, 764–774.
Hansen M.J., Beard Jr T.D. & Hewett S.W. (2005) Effort ofmeasurement error of tests of density dependence ofcatchability for walleyes in northern Wisconsin angling andspearing fisheries. North American Journal of FisheriesManagement 25, 1010–1015.
Hansen M.J., Fayram A.H. & Newman S.P. (2011) Naturalmortality in relation to age and fishing mortality on walleyesin Escanaba Lake, Wisconsin, during 1956–2009. NorthAmerican Journal of Fisheries Management 31, 506–514.
Hilborn R. & Stokes K. (2010) Defining overfished stocks: havewe lost the plot? Fisheries 35, 113–120.
Hunt L.M., Arlinghaus R., Lester N. & Kushneriuk R. (2011)The effects of regional angling effort, angler behavior, andharvesting efficiency on landscape patterns of overfishing.Ecological Applications 21, 2555–2575.
Johnston F.D., Arlinghaus R. & Diekmann U. (2010) Diversityand complexity of angler behavior drive socially optimal inputand output regulations in a bioeconomic recreational fisheriesmodel. Canadian Journal of Fisheries and Aquatic Sciences67, 1507–1531.
Johnston F.D., Arlinghaus R., Stelfox J. & Post J.R. (2011)Decline in angler use despite increased catch rates: Anglers’response to the implementation of a total catch-and-releaseregulation. Fisheries Research 110, 189–187.
Lester N.P., Marshall T.R., Armstrong K., Dunlop W.I. &Ritchie B. (2003) A broad-scale approach to management ofOntario’s recreational fisheries. North American Journal ofFisheries Management 23, 1312–1328.
Lobón-Cervia J. (2011) Why fishing does not magnify temporalfluctuations in the population abundance of stream-livingsalmonids. Reviews in Fisheries Science 19, 246–256.
Martin D.R. & Pope K.L. (2011) Luring anglers to enhancefisheries. Journal of Environmental Management 92, 1409–1413.
Minns C.K., Kelso J.R.M. & Randall R.G. (1996) Detecting theresponse of fish to habitat alterations in freshwater ecosystems.Canadian Journal of Fisheries and Aquatic Sciences 53(Suppl1), 403–414.
Nate N.A., Hansen M.J., Rudstam L.G., Knight R.L. & NewmanS.P. (2011) Population and community dynamics of walleye.In: B.A. Barton (ed.) Biology, Management, and Culture ofSauger and Walleye. Bethseda, MD: American FisheriesSociety, pp. 321–374.
Newby J.R., Hansen M.J., Newman S.P. & Edwards C.J. (2000)Catchability of walleyes to angling in Escanaba Lake,Wisconsin. North American Journal of Fisheries Management20, 873–881.
Parkinson E.A., Post J.R. & Cox S.P. (2004) Linking thedynamics of harvest effort to recruitment dynamics in a multi-stock, spatially-structured fishery. Canadian Journal ofFisheries and Aquatic Sciences 61, 1658–1670.
Post J.R., Sullivan M., Cox S.P., Lester N.P., Walters C.J.,Parkinson E.A., et al. (2002) Canada’s recreational fisheries:the invisible collapse? Fisheries 27, 6–17.
Post J.R., Mushens C., Paul A. & Sullivan M. (2003)Assessment of alternative harvest regulations for sustainingrecreational fisheries: model development and application tobull trout. North American Journal of Fisheries Management23, 22–34.
Post J.R., Persson L., Parkinson E.A. & Van Kooten T. (2008)Angler numerical response across landscapes and the collapseof freshwater fisheries. Ecological Applications 18, 1038–1049.
Quist M.C., Stephen J.L., Lynott S.T., Goeckler J.M. & SchultzR.D. (2010) Exploitation of walleye in a Great Plainsreservoir: harvest patterns and management scenarios.Fisheries Management and Ecology 17, 522–531.
Seekell D.A., Brosseau C.J., Cline T.J., Winchcombe R.J. &Zinn L.J. (2011) Long-term changes in recreational catchinequality in a trout stream. North American Journal ofFisheries Management 31, 1100–1105.
Sullivan M.G. (2003) Active management of walleye fisheries inAlberta: dilemmas of managing recovering fisheries. NorthAmerican Journal of Fisheries Management 23, 1343–1358.
Walters C.J. & Kitchell J.F. (2001) Cultivation/depensationeffects on juvenile survival and recruitment: implications forthe theory of fishing. Canadian Journal of Fisheries andAquatic Sciences 58, 39–50.
Walters C.J. & Maguire J. (1996) Lessons for stock assessmentfrom the Northern cod collapse. Reviews in Fish Biology andFisheries 6, 125–137.
Walters C.J. & Martell S.J.D. (2004) Fisheries Ecology andManagement. Princeton, New Jersey: Princeton UniversityPress, 399 pp.
© 2012 Blackwell Publishing Ltd
DYNAMIC ANGLING EFFORT TO PREVENT RECRUITMENT OVERFISHING 257


