Embed Size (px)
Citation preview
1
Phil Jones
From: Phil Jones [[email protected]]Sent: 09 July 2014 17:12To: '[email protected]'Cc: Andrew Kelton FL <[email protected]>; Ray Lockyer PASAS
<[email protected]>; Dave Hooper PASAS <[email protected]>; Des Williams PASAS <[email protected]>; Mark Hughes <[email protected]>
Subject: EN010049 - Swansea Bay Tidal Lagoon
PASAS Written Representation 2...
PASAS Written Representation 2...
PASAS Ltd esponse to TLSB PEI
Angling Trust and Fish Legal r...
Fish Legal response to TLSB dr...
Fish Legal to PINS about accep...
413196 Swansea tidal lagoon ex...
Tawe Neath Afan Catches 2014-0...
Salmon stock performance in Wa..
Sea trout stock performance 20...
PASAS Answers to ExA Questions...
We attach:
- our (PASAS) written submission (9,181 words and 12 images)
- a summary of our written submission (708 words)
- our (PASAS) response to PEIR 2/8/13
- Fish Legal letters of - 5/8/13 (response to PEIR) - 17/12/13 (response to draft ES) - 3/3/14 (to PINS about acceptance of the application)
- APEM Ltd expert fisheries assessment
- Excel workbook of catch statistics
- NRW document "Salmon stock performance in Wales 2013_2.docx"
- NRW document "Sea trout stock performance 2013.docx"
- our (PASAS) responses to some of the Examining Authority's first round of questions
Phil Jones
=====================================================Phil Jones, Director (Treasurer)44 Bwllfa Rd, Ynystawe, Swansea, SA6 5ALTel: 01792 843951 Mob: 07957 154992
Pontardawe and Swansea Angling Society Ltdwww.pasas.org.ukReg'd in Wales No 6736638Reg'd Office: 8 Bwllfa Rd, Ynystawe, Swansea, SA6 5AL=====================================================

Page 1 of 2
PROPOSED SWANSEA BAY TIDAL LAGOON – REF EN010049
SUMMARY OF THE WRITTEN REPRESENTATION BY PONTARDAWE AND SWANSEA ANGLING SOCIETY LTD – REF 10026500 (9,181 words and 12 images)
1. The first section is “About us and our fishery”:
1.1. We explain who we are, who our members are, the nature of our fishery and of our fishing rights.
1.2. We mention the well-recognised benefits to the community of fishing.
2. The second section questions “Justification for the development”: We:
2.1. argue that the huge environmental impacts are not justified by the modest power generating capacity
2.2. draw attention to relevant parts of national renewable energy policy
2.3. question whether the proposed development is really a “nationally significant infrastructure project” within the meaning of the legislation and ask the Examining Authority to rule on the meaning of “capacity”.
3. The third section is “Our concerns – summary” where we quickly summarise concerns (developed in more detail later) about:
3.1. effects on fish and our fishery
3.2. the applicant’s environmental statement
3.3. the possible re-siting of the turbines
3.4. the Water Framework Directive (WFD) assessment.
4. The fourth section is about “Consultation” where we:
4.1. counter the applicant’s suggestions that we have failed to engage properly
4.2. argue that the applicant has not consulted properly in accordance with the law, PINS guidance and their own consultation strategy
4.3. explain the contact which has taken place
4.4. submit that the application has been submitted prematurely.
5. The fifth section is about “Environment Statement – Flows, Fish Movements, Turbine Encounter, Etc” where we:
5.1. refer to previous correspondence
5.2. agree with warnings about “a clear distinction between precision and accuracy” and “the potential false impression of accuracy due to precision”
5.3. give details of latest Tawe salmon and sea trout stock assessments (“at risk”, not “stable” as claimed in the ES)
5.4. describe likely effects on flows in Swansea Bay and their effects on fish movements
5.5. explain concerns about the scope for re-location of the turbines
5.6. indicate parts of the ES which we accept and parts which we don’t accept
5.7. draw attention to parts of the ES which call into question the approach to modelling and the ES conclusions
5.8. draw attention to the independent expert report (by APEM), to which the applicant has not responded

Page 2 of 2
5.9. explain our concerns about the turbine encounter modelling, draw attention to fallacies in its assumptions, argue that it fails to take account of significant factors, etc
5.10. discuss the proposed use of AFD in the context of Salmon & Freshwater Fisheries Act requirement for screens and argue that the proposal to let NRW agree details after the examination / decision and before construction is unsatisfactory
5.11. point out inconsistencies and errors in the assessment of impacts and disagree with conclusions in respect of both fish and recreational fisheries
5.12. draw attention to impacts overlooked (eg, capital value of fisheries) and other shortcomings in the ES
6. The sixth section is about the “WFD” assessment where we:
6.1. draw attention to errors in the identification of relevant waterbodies, which affects all assessments
6.2. draw attention to impacts not mentioned or assessed
6.3. argue that impacts discuss in the ES are likely to affect achievement of WFD objectives
6.4. note that important WFD articles 4.7 and 4.8 have not been mentioned
6.5. conclude that the WFD assessment is defective and wholly inadequate
7. The seventh section is about “Our status and the protection of fisheries interests” where we:
7.1. discuss our status as “category 3 affected persons”
7.2. explain that the applicant has denied that status and failed to comply with various requirements of the Planning ACt
7.3. explain that the applicant has failed, by diligent enquiry, to identify and involve other category 3 affected persons
7.4. explain that the applicant has wrongly certified compliance with Planning Act requirements
7.5. argue that the applicant has submitted the application prematurely, before completing the required consultations
7.6. ask the Examining Authority to reject the application
7.7. ask the Examining Authority, if the application is allowed, to ensure that measures for our protection (mitigation, monitoring, offsetting at an assumed level of harm, compensation, remediation arrangements, etc) are securely included in the DCO.
Pontardawe and Swansea Angling Society Ltd
9 July 2014

Page 1 of 21
PROPOSED SWANSEA BAY TIDAL LAGOON – REF EN010049
WRITTEN REPRESENTATION 9 JULY 2014 BY PONTARDAWE AND SWANSEA ANGLING SOCIETY LTD – REF 10026500
1. ABOUT US AND OUR FISHERY
1.1. We are a well-known, not-for-profit club with 300 (mainly local) members, founded in 1946. We own, control or enjoy fishing rights on about 8 miles of the River Tawe. Our website is at www.pasas.org.uk.
1.2. The fishing rights that we own on the Tawe cost us tens of thousands of pounds and their current value will be several times that. In addition we lease several miles of fishing. The money to fund this has been derived from membership subscriptions over many years.
1.3. Our fishing is available to members at modest cost and provides an important recreational amenity. We have no restrictions on membership and any member of the public may join us on payment of subscriptions (£5 or £10 for juniors; £20 for seniors and disabled; £60 for other adults).
1.4. The benefits to the community of fishing are well recognised. See for example “Fishing For Answers – The Final Report of the Social and Community Benefits of Angling Project, 2012”1
1.5. The Tawe supports salmon and sea trout (known locally as sewin), migratory fish which spend the early part of their life in freshwater before migrating to sea. Adults later return to spawn in the rivers of their birth as highly prized, valuable fish. Young fish leaving the river (smolts), adults returning to spawn and adults leaving again after spawning (kelts) have to migrate through Swansea Bay, past the proposed lagoon and its turbine array.
1.6. The Tawe also supports an important brown trout fishery, which are biologically the same species as sea trout. Some of the progeny of sea trout remain in the river as non-migratory brown trout.
1.7. Over the 10 years 2003-2012 the Tawe was ranked 7th in Wales for salmon catches and 18th in Wales for sea trout catches.
Before the construction of the Tawe Barrage, Tawe catches of sea trout in the 1980s were in the top ten in Wales. Salmon numbers were then building up from a 200 year period of extinction but were already in the Wales top 20.
Sea trout catches in the Tawe have declined since the construction of the Barrage, whilst those in the adjacent River Neath have considerably improved.
According to provisional catch return data, Tawe rankings in 2013 were 7th for salmon and 17th for sea trout, although stocks and catches are declining generally in Wales for reasons which are poorly understood.
After a peak in 2010, Tawe salmon catches have declined in 2011, 2012 and 2013 and, like those of most other South Wales rivers, are now classed by Natural Resources Wales (NRW) as “at risk”, requiring immediate action to stop the killing of fish until numbers have recovered. Measures to ensure this are apparently being drawn up by NRW at the moment.
1.8. Our rules already encourage members to return salmon and sea trout to the water unharmed.
1.9. We are members of many organisations, including the Welsh Salmon and Trout Angling Association (WSTAA), the Salmon and Trout Association Wales (S&TA), the Angling Trust (AT) and Fish Legal (FL, an organisation which provides specialist legal
1 http://resources.anglingresearch.org.uk/project_reports/final_report_2012

Page 2 of 21
assistance with issues threatening fisheries). We and Fish Legal have worked together in this case.
2. JUSTIFICATION FOR THE DEVELOPMENT.
2.1. We don’t accept that this development, which will have huge environmental impacts and only generate modest amounts of electricity, is justified within the terms of national energy policy.
2.2. Although described as a 240 MW project, actual production over time cannot achieve this because of utterly predictable tidal conditions. If annual production is 400 GWH, as claimed, that equates to 46 MW on average. That represents a capacity factor of under 20%, which doesn’t compare well with, for example, onshore or offshore wind.
2.3. We aren’t satisfied that the scheme meets the definition of a “nationally significant infrastructure project” for the purposes of the Planning Act 2008:
2.3.1. Section 15(3) says “A generating station is […a nationally significant infrastructure project…] if— (a) it is an offshore generating station, and (b) its capacity is more than 100 megawatts.”
2.3.2. “Capacity” is not defined in the Planning Act 2008 or other relevant legislation.
2.3.3. The Planning Inspectorate (PINS) has said that it believes that “"capacity", as used in the PA2008, probably … means the rated maximum gross output, or 'nameplate capacity', of the station”.
2.3.4. We believe that in the context of the contribution that a project can make to national renewable energy needs, a station’s maximum achievable annual average production (46 MW in this case) is more relevant than the nominal capacity of the turbines.
2.3.5. PINS has also said “the Planning Inspectorate, on behalf of the Secretary of State, is only able to decide whether development consent is required for a project, under PA 2008 s.55, once an application has been formally submitted.”
We therefore ask the Examining Authority to make a ruling on this.
2.4. The Overarching National Policy Statement for Energy (EN-1) says (our underlining):
“3.1.1 The UK needs all the types of energy infrastructure covered by this NPS in order to achieve energy security at the same time as dramatically reducing greenhouse gas emissions.
3.1.2 It is for industry to propose new energy infrastructure projects within the strategic framework set by Government. The Government does not consider it appropriate for planning policy to set targets for or limits on different technologies.
3.1.3 The IPC2 should therefore assess all applications for development consent for the types of infrastructure covered by the energy NPSs on the basis that the Government has demonstrated that there is a need for those types of infrastructure and that the scale and urgency of that need is as described for each of them in this Part.
3.1.4 The IPC should give substantial weight to the contribution which projects would make towards satisfying this need when considering applications for development consent under the Planning Act 2008.”
2.5. The National Policy Statement for Renewable Energy Infrastructure (EN-3) states specifically that it doesn’t cover tidal range schemes like this so there is no Government demonstrated / accepted need for this type of infrastructure.
2 IPC (Infrastructure Planning Commission) replaced by Planning Inspectorate (PINS)
Page 3 of 21
2.6. We support the over-arching policy in EN-1 that “The IPC should give substantial weight to the contribution which projects would make towards satisfying this need when considering applications for development consent under the Planning Act 2008”.
3. OUR CONCERNS – SUMMARY
3.1. EFFECTS ON FISH AND OUR FISHERY.
3.1.1. We are concerned that the proposed lagoon will harm salmon and sea trout, detrimentally affecting our fishery and its value. This is likely to arise as a result of:
• massive, unnatural flows in Swansea Bay interfering with normal migration routes and behaviour;
• fish (smolts, returning adults and kelts) being drawn into the turbines and killed;
• fish being drawn through the turbines into the impoundment and trapped;
• fish being driven away from the area by unfavourable conditions;
• other miscellaneous and unpredictable effects.
3.1.2. As some of the progeny of sea trout remain in the river as non-migratory brown trout, the scheme also has the potential to harm our wild brown trout fishery.
3.1.3. Because of these concerns we are opposed to the proposals and we ask the Examining Authority to recommend refusal of the application.
3.2. THE APPLICANT’S ENVIRONMENTAL IMPACT ASSESSMENT. An independent expert fisheries analysis commissioned by us and others supports our view that the developer’s environmental impact assessment is flawed and understates the likely harm to salmon and sea trout:
3.2.1. their turbine encounter modelling uses incorrect assumptions for fish movements in Swansea Bay, over-optimistic assumptions for the proposed acoustic fish deterrent scheme and fails to allow for important factors such as river flows and migration delays caused by the nearby Tawe Barrage;
3.2.2. their turbine mortality modelling uses incorrect fish sizes, fails to estimate population effects (lifetime egg deposition effects) and fails to allow for indirect mortality from post-passage predation, etc;
3.2.3. they fail to acknowledge the effect on fish from rivers further afield;
3.2.4. the assessment fails to set out a worst case for the effects on fish.
3.3. RE-SITING OF THE TURBINES. The application provides for the re-siting the turbine array, away from the location where the modelling has been carried out. This would invalidate the modelling and require re-assessment.
3.4. WATER FRAMEWORK DIRECTIVE (WFD). The WFD assessment is flawed in a number of ways and fails to take full account of the likely damaging effects on River Tawe waterbodies.
4. CONSULTATION
4.1. The applicant has implied (eg, in application document “5.1 A10.7 Inland fishing table.pdf”) that we have failed to engage in discussions about these concerns. At the Preliminary Meeting on 10 June 2014 they said that they had been seeking to meet us since October 2013. These claims are misleading.

Page 4 of 21
4.2. Although the applicant has failed to consult us as “category 3 affected persons” (discussed in more detail later), we have made every effort to respond properly at each stage but the applicant has made this very difficult.
4.3. PINS guidance (in Advice Note 16 ) is that “The overriding intention of the legislation is to ensure that detailed matters are consulted upon and solutions or mitigation negotiated with the local community, landowners, statutory consultees and local authorities before submission of the application for development consent.”
4.4. We and Fish Legal responded in detail to the Preliminary Environmental Information Report (PEIR) – our letters of 2 August 2013 (from ourselves, PASAS) and 5 August 2013 (from Fish Legal) are provided herewith. We received no response.
4.5. We made oral representations at a public presentation on 17 October 2013 and on 18 November received a draft copy of the Environmental Statement (ES) with a request to respond within a month.
4.6. Replies to our responses to the PEIR were eventually provided, at our request, on 20 November and 5 December 2013 with a grudging comment in email that the applicant’s “… responsibility is not so much to respond to [representations] individually, but rather to “have regard” to them”.
4.7. We came to the conclusion that we needed independent expert fisheries assistance, which Fish Legal commissioned from APEM Ltd (with funding provided by Fish Legal, the Angling Trust, ourselves, Tawe & Tributaries Angling Association and Afan Valley Angling Club).
4.8. Fish Legal provided an initial response to the draft ES on 17 December 2013 (copy provided herewith) and informed the applicant that we were obtaining independent advice to help us to respond further.
4.9. We received the APEM report on 10 February 2014 (copy provided herewith) but TLSB had by then submitted their DCO application (on 7 February).
4.10. On 3 March 2014 Fish Legal wrote to the Planning Inspectorate (and TLSB, enclosing the APEM report) arguing in detail that, in view of the lack of proper consultation, the application should not be “accepted”. PINS nevertheless accepted the application for examination on 6 March.
4.11. On 4 April 2014 TLSB asked us to meet them to discuss (in confidence and without prejudice) a paper relating to their “efforts to maximise the benefits of the Swansea Bay Tidal Lagoon Project” or “other matters arising from the submitted application”. Such a meeting has now been arranged for 16 July 2014, subject to the production by TLSB of essential information (as to monitoring, mitigation, compensation, etc) which has been sorely lacking to date.
4.12. We’ve still received no response to the APEM report supplied to TLSB on 3 March 2014. When we pointed this out to TLSB at the Preliminary Meeting, in response to their implication that we we’d been dragging our feet, their immediate reaction was that they had addressed it in the ES as submitted with the application.
That was incorrect, which they subsequently acknowledged in email, saying then that “The ES chapter which was issued in November 2013 (and on which APEM’s comments were based) was an early draft and had not been internally reviewed. As such many of the comments APEM picked up on the draft chapter were also picked up in our own parallel review and as such were addressed in the final ES where relevant.”
That’s also incorrect, as made clear in the Fish Legal letter of 3 March 2014.
TLSB have now agreed to respond to the APEM report before we meet on 16 July.
4.13. Bizarrely, the consent application includes a proposal, not discussed with us, for our membership of a fisheries reference group to investigate the effects of the Tawe Barrage – presumably in connection with possible mitigation / offset measures.
Page 5 of 21
4.14. We maintain, therefore, that:
• there has been a lack of proper consultation, as required by the legislation and PINS guidance
• the application has been submitted prematurely
• the applicant’s implication that we’ve been dragging our feet is disingenuous.
5. ENVIRONMENT STATEMENT – FLOWS, FISH MOVEMENTS, TURBINE ENCOUNTER, ETC
5.1. GENERAL
5.1.1. Much of that which follows has already been set out in detail in correspondence, which we ask the Examining Authority to regard as part of this submission, particularly
• 2 August 2013 (PASAS)
• 5 August 2013 (FL)
• 17 December 2013 (FL)
• 3 March 2014 (FL).
5.1.2. Fish Legal will submit a written representation alongside this and their submission is likely to be more expert than ours. Ours is a layman’s attempt to set out the issues as we see them.
5.1.3. Our experience (for example, with the Tawe Barrage, which we opposed in the 1980s and which was commissioned in the 1990s and has harmed our fishery ever since) is that the gut feeling (call it “expert opinion” if you like) of experienced anglers who understand fish, rivers, flows, tides and man’s interference is that our predictions as to the likely consequences of major schemes are likely to be as sound as those of paid consultants, whose assurances and “expert opinion” need to be taken with very large doses of salt.
Everything we predicted in the case of the Tawe Barrage has come to pass and the assurances we were given have proved worthless.
5.1.4. We agree with ES Appendix 9.5 (“Accuracy And Limitations”) where it refers to “a clear distinction between precision and accuracy” and “the potential false impression of accuracy due to precision”.
5.2. ABOUT THE FISH
5.2.1. Salmon and sea trout (both adults returning to the Tawe and smolts and kelts leaving the river) have to navigate through Swansea Bay.
5.2.2. Table 9.12 shows migration and spawning periods for salmon and sea trout. We don’t accept the accuracy of this table:
• fresh salmon enter the river as late as December or even January;
• spawning is unlikely to start as early as September for either salmon or sea trout;
• smolts probably leave the system most months of the year – certainly into June – and departure is also delayed by the Tawe Barrage.
5.2.3. We don’t accept the statement in para 9.5.6.7. of ES Annex 9.1 that (our underlining) “Inter-annual variation in salmon and trout numbers according to rod catch data is evident, however broad scale estimates of fish numbers seem to indicate fairly stable populations. It should be noted that populations across the UK are in decline.”
Page 6 of 21
5.2.4. Recent data released by NRW show that populations of salmon and sea trout in the Tawe (and other South Wales rivers) are declining.
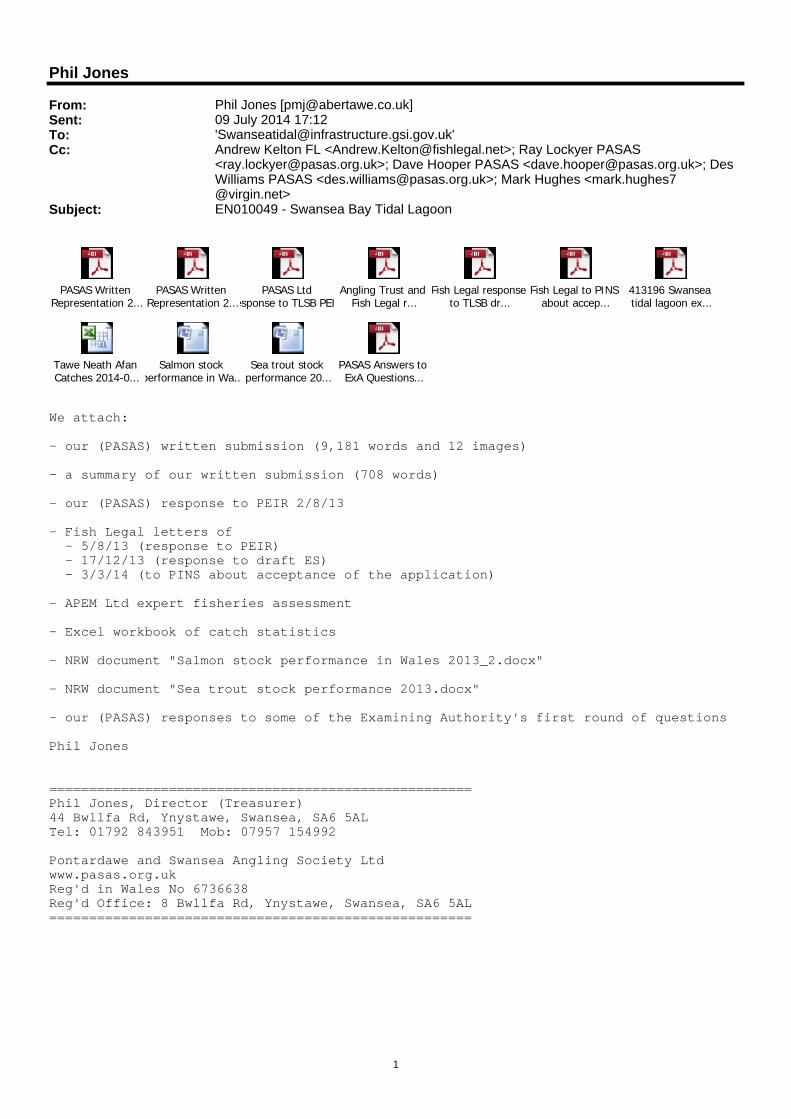
5.2.5. Tawe salmon are now classed by NRW as “at risk” and “at risk of failing in 2018”, requiring immediate measures to stop the killing of fish. The NRW graphs below, based on figures for 2012 and 2013, illustrate the position.
5.2.6. Tawe sea trout are classed as “probably at risk”, down a category from 2012
when they were “probably not at risk”.
5.2.7. We are supplying herewith, as well as in response to Question 7.22 of the Examining Authority’s first round of questions:
5.2.7.1. further information on methodology etc relating to the above assessments
5.2.7.2. rod catch data for salmon and sea trout in all Welsh rivers from the 1970s to 2013, highlighting the rankings of the Tawe, Neath and Afan.
5.3. FLOWS
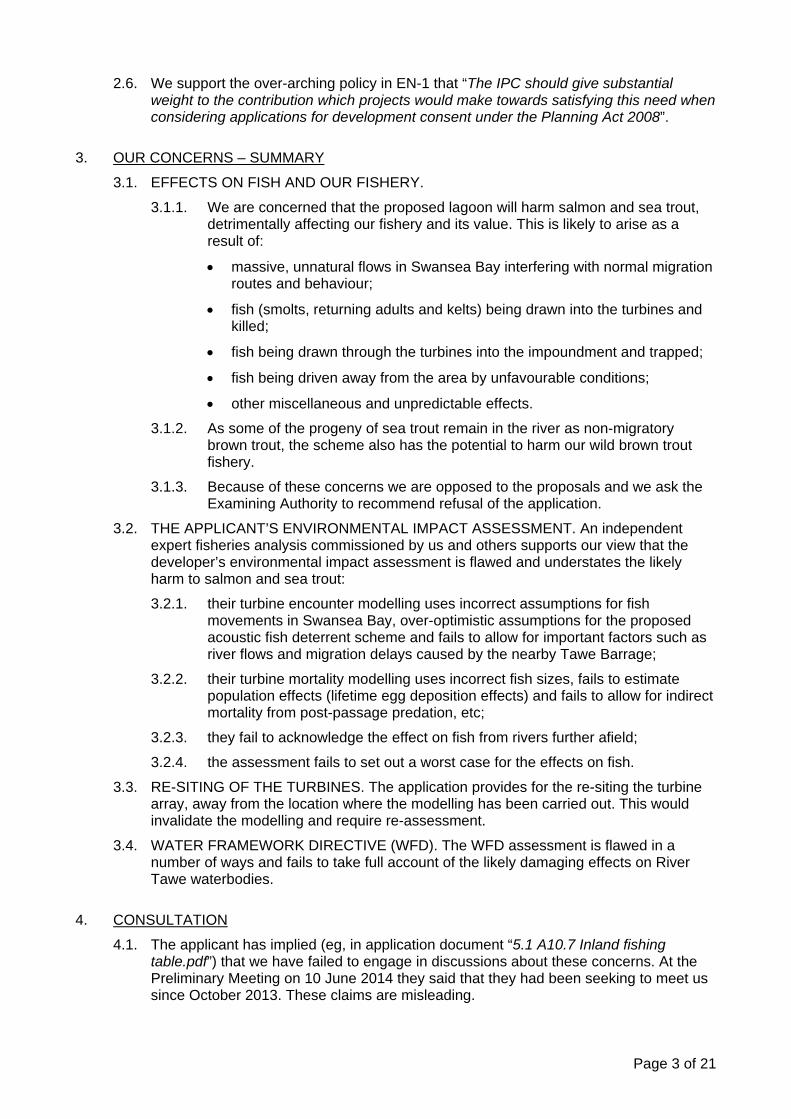
5.3.1. Baseline residual flows in Swansea Bay are illustrated in Figure 6.40 (location of Tawe added by us)
(included for illustration only - please refer to application document for more detail)
Page 7 of 21
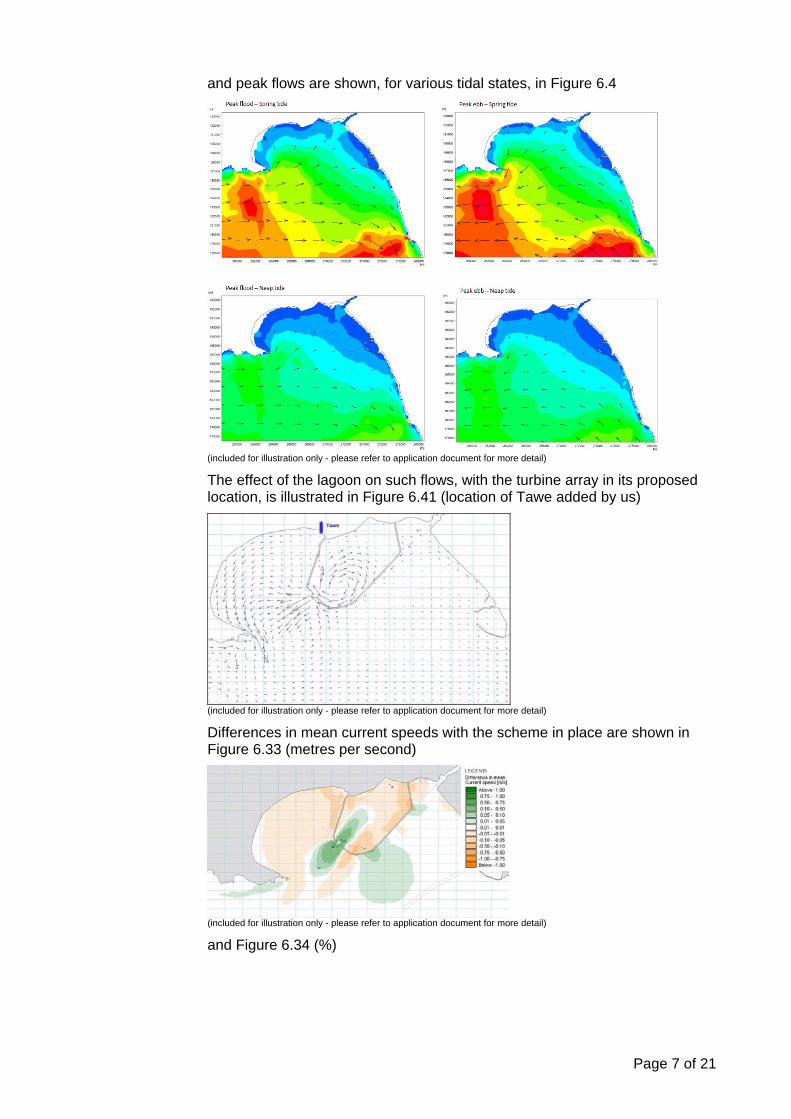
and peak flows are shown, for various tidal states, in Figure 6.4
(included for illustration only - please refer to application document for more detail)
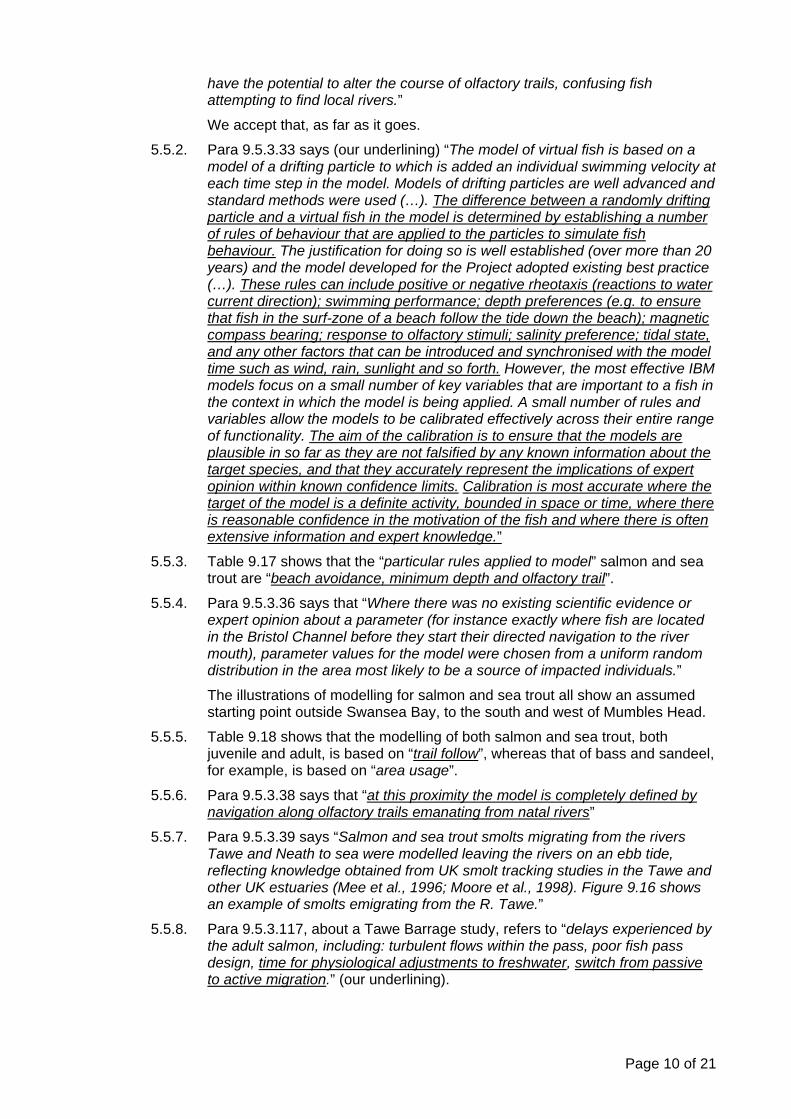
The effect of the lagoon on such flows, with the turbine array in its proposed location, is illustrated in Figure 6.41 (location of Tawe added by us)
(included for illustration only - please refer to application document for more detail)
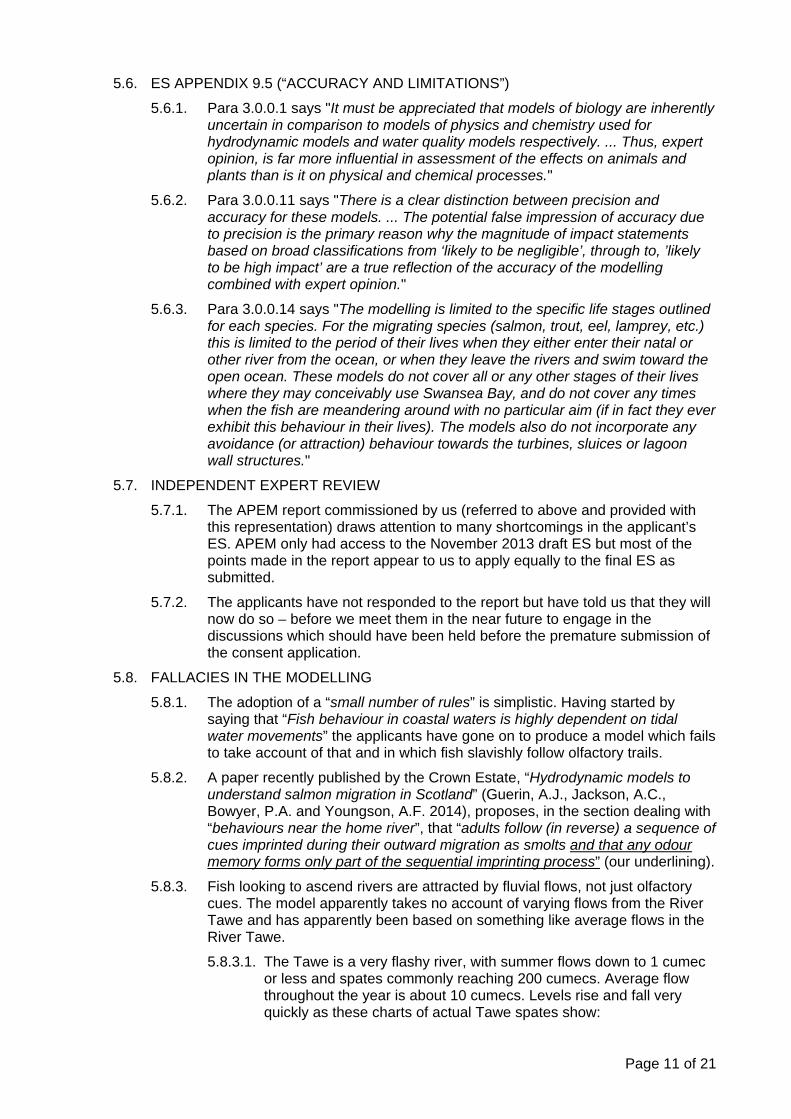
Differences in mean current speeds with the scheme in place are shown in Figure 6.33 (metres per second)
(included for illustration only - please refer to application document for more detail)
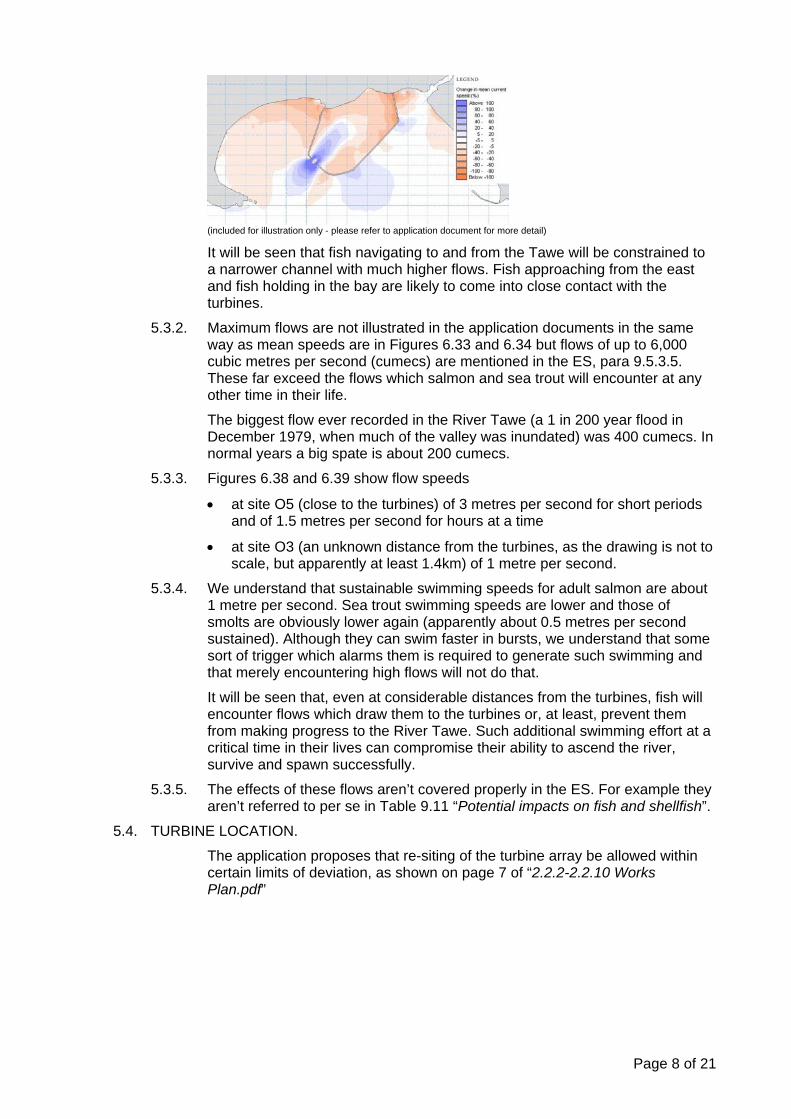
and Figure 6.34 (%)
Page 8 of 21
(included for illustration only - please refer to application document for more detail)
It will be seen that fish navigating to and from the Tawe will be constrained to a narrower channel with much higher flows. Fish approaching from the east and fish holding in the bay are likely to come into close contact with the turbines.
5.3.2. Maximum flows are not illustrated in the application documents in the same way as mean speeds are in Figures 6.33 and 6.34 but flows of up to 6,000 cubic metres per second (cumecs) are mentioned in the ES, para 9.5.3.5. These far exceed the flows which salmon and sea trout will encounter at any other time in their life.
The biggest flow ever recorded in the River Tawe (a 1 in 200 year flood in December 1979, when much of the valley was inundated) was 400 cumecs. In normal years a big spate is about 200 cumecs.
5.3.3. Figures 6.38 and 6.39 show flow speeds
• at site O5 (close to the turbines) of 3 metres per second for short periods and of 1.5 metres per second for hours at a time
• at site O3 (an unknown distance from the turbines, as the drawing is not to scale, but apparently at least 1.4km) of 1 metre per second.
5.3.4. We understand that sustainable swimming speeds for adult salmon are about 1 metre per second. Sea trout swimming speeds are lower and those of smolts are obviously lower again (apparently about 0.5 metres per second sustained). Although they can swim faster in bursts, we understand that some sort of trigger which alarms them is required to generate such swimming and that merely encountering high flows will not do that.
It will be seen that, even at considerable distances from the turbines, fish will encounter flows which draw them to the turbines or, at least, prevent them from making progress to the River Tawe. Such additional swimming effort at a critical time in their lives can compromise their ability to ascend the river, survive and spawn successfully.
5.3.5. The effects of these flows aren’t covered properly in the ES. For example they aren’t referred to per se in Table 9.11 “Potential impacts on fish and shellfish”.
5.4. TURBINE LOCATION.
The application proposes that re-siting of the turbine array be allowed within certain limits of deviation, as shown on page 7 of “2.2.2-2.2.10 Works Plan.pdf”

Page 9 of 21
(included for illustration only - please refer to application document for more detail)
This would allow: (a) deviation of up to 150m to the west and rotation of up to 15degrees clockwise; or (b) deviation of up to 1,150m to the east and rotation of up to 45degrees anti-clockwise.
Either of these or any permutation in between would have a significant effect on the flows illustrated in Figure 6.41.
Figure 4.13 in “6.2.4 ES Project Description.pdf” shows two main alternative locations for the turbine array.
(included for illustration only - please refer to application document for more detail)
Additional document “Annexe 8 - Submission in respect of location of turbine and sluice gate housing structure.pdf”, published on the PINS website on 16 June 2014, indicates that “TLSB proposes not to pursue Option B further” and “TLSB proposes only to pursue Option A as part of the authorised development pursuant to the Application”.
The schedule of works and drawings in Part 3 of Schedule 1 to the draft DCO is inconsistent with the files submitted with the application so it’s unclear (to us) whether the proposal in the additional document is binding or whether re-siting of the turbines within the limits of deviation shown on “2.2.2-2.2.10 Works Plan.pdf” (say, to a location C) would still be allowable. If re-siting were still allowed, we submit that it would invalidate many of the assumptions in the application.
5.5. ENVIRONMENT STATEMENT
5.5.1. The applicant’s ES says (para 9.5.3.31) that “Fish behaviour in coastal waters is highly dependent on tidal water movements and on features such as water depth and habitat characteristics (…). ... Diadromous migratory species also use characteristics such as the earth’s magnetic field (…), fluvial flow and associated salinity changes and olfactory cues to find their way into river systems. Features of the Project that may affect these behaviours include physical impedance by the seawalls, changes to hydraulic patterns, interactions with the turbine and sluices and temporary entrapment within the Lagoon. Changes in patterns of tidal movement can also be envisaged to
Page 10 of 21
have the potential to alter the course of olfactory trails, confusing fish attempting to find local rivers.”
We accept that, as far as it goes.
5.5.2. Para 9.5.3.33 says (our underlining) “The model of virtual fish is based on a model of a drifting particle to which is added an individual swimming velocity at each time step in the model. Models of drifting particles are well advanced and standard methods were used (…). The difference between a randomly drifting particle and a virtual fish in the model is determined by establishing a number of rules of behaviour that are applied to the particles to simulate fish behaviour. The justification for doing so is well established (over more than 20 years) and the model developed for the Project adopted existing best practice (…). These rules can include positive or negative rheotaxis (reactions to water current direction); swimming performance; depth preferences (e.g. to ensure that fish in the surf-zone of a beach follow the tide down the beach); magnetic compass bearing; response to olfactory stimuli; salinity preference; tidal state, and any other factors that can be introduced and synchronised with the model time such as wind, rain, sunlight and so forth. However, the most effective IBM models focus on a small number of key variables that are important to a fish in the context in which the model is being applied. A small number of rules and variables allow the models to be calibrated effectively across their entire range of functionality. The aim of the calibration is to ensure that the models are plausible in so far as they are not falsified by any known information about the target species, and that they accurately represent the implications of expert opinion within known confidence limits. Calibration is most accurate where the target of the model is a definite activity, bounded in space or time, where there is reasonable confidence in the motivation of the fish and where there is often extensive information and expert knowledge.”
5.5.3. Table 9.17 shows that the “particular rules applied to model” salmon and sea trout are “beach avoidance, minimum depth and olfactory trail”.
5.5.4. Para 9.5.3.36 says that “Where there was no existing scientific evidence or expert opinion about a parameter (for instance exactly where fish are located in the Bristol Channel before they start their directed navigation to the river mouth), parameter values for the model were chosen from a uniform random distribution in the area most likely to be a source of impacted individuals.”
The illustrations of modelling for salmon and sea trout all show an assumed starting point outside Swansea Bay, to the south and west of Mumbles Head.
5.5.5. Table 9.18 shows that the modelling of both salmon and sea trout, both juvenile and adult, is based on “trail follow”, whereas that of bass and sandeel, for example, is based on “area usage”.
5.5.6. Para 9.5.3.38 says that “at this proximity the model is completely defined by navigation along olfactory trails emanating from natal rivers”
5.5.7. Para 9.5.3.39 says “Salmon and sea trout smolts migrating from the rivers Tawe and Neath to sea were modelled leaving the rivers on an ebb tide, reflecting knowledge obtained from UK smolt tracking studies in the Tawe and other UK estuaries (Mee et al., 1996; Moore et al., 1998). Figure 9.16 shows an example of smolts emigrating from the R. Tawe.”
5.5.8. Para 9.5.3.117, about a Tawe Barrage study, refers to “delays experienced by the adult salmon, including: turbulent flows within the pass, poor fish pass design, time for physiological adjustments to freshwater, switch from passive to active migration.” (our underlining).
Page 11 of 21
5.6. ES APPENDIX 9.5 (“ACCURACY AND LIMITATIONS”)
5.6.1. Para 3.0.0.1 says "It must be appreciated that models of biology are inherently uncertain in comparison to models of physics and chemistry used for hydrodynamic models and water quality models respectively. ... Thus, expert opinion, is far more influential in assessment of the effects on animals and plants than is it on physical and chemical processes."
5.6.2. Para 3.0.0.11 says "There is a clear distinction between precision and accuracy for these models. ... The potential false impression of accuracy due to precision is the primary reason why the magnitude of impact statements based on broad classifications from ‘likely to be negligible’, through to, ’likely to be high impact’ are a true reflection of the accuracy of the modelling combined with expert opinion."
5.6.3. Para 3.0.0.14 says "The modelling is limited to the specific life stages outlined for each species. For the migrating species (salmon, trout, eel, lamprey, etc.) this is limited to the period of their lives when they either enter their natal or other river from the ocean, or when they leave the rivers and swim toward the open ocean. These models do not cover all or any other stages of their lives where they may conceivably use Swansea Bay, and do not cover any times when the fish are meandering around with no particular aim (if in fact they ever exhibit this behaviour in their lives). The models also do not incorporate any avoidance (or attraction) behaviour towards the turbines, sluices or lagoon wall structures."
5.7. INDEPENDENT EXPERT REVIEW
5.7.1. The APEM report commissioned by us (referred to above and provided with this representation) draws attention to many shortcomings in the applicant’s ES. APEM only had access to the November 2013 draft ES but most of the points made in the report appear to us to apply equally to the final ES as submitted.
5.7.2. The applicants have not responded to the report but have told us that they will now do so – before we meet them in the near future to engage in the discussions which should have been held before the premature submission of the consent application.
5.8. FALLACIES IN THE MODELLING
5.8.1. The adoption of a “small number of rules” is simplistic. Having started by saying that “Fish behaviour in coastal waters is highly dependent on tidal water movements” the applicants have gone on to produce a model which fails to take account of that and in which fish slavishly follow olfactory trails.
5.8.2. A paper recently published by the Crown Estate, “Hydrodynamic models to understand salmon migration in Scotland” (Guerin, A.J., Jackson, A.C., Bowyer, P.A. and Youngson, A.F. 2014), proposes, in the section dealing with “behaviours near the home river”, that “adults follow (in reverse) a sequence of cues imprinted during their outward migration as smolts and that any odour memory forms only part of the sequential imprinting process” (our underlining).
5.8.3. Fish looking to ascend rivers are attracted by fluvial flows, not just olfactory cues. The model apparently takes no account of varying flows from the River Tawe and has apparently been based on something like average flows in the River Tawe.
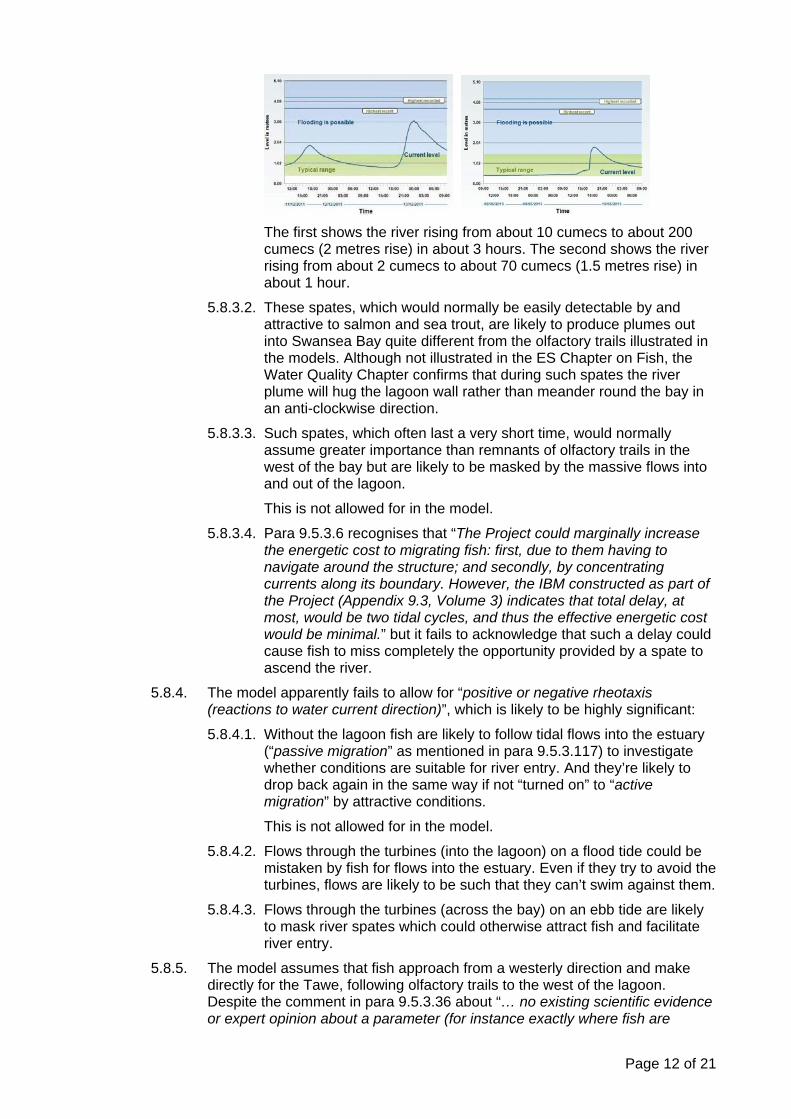
5.8.3.1. The Tawe is a very flashy river, with summer flows down to 1 cumec or less and spates commonly reaching 200 cumecs. Average flow throughout the year is about 10 cumecs. Levels rise and fall very quickly as these charts of actual Tawe spates show:
Page 12 of 21
The first shows the river rising from about 10 cumecs to about 200 cumecs (2 metres rise) in about 3 hours. The second shows the river rising from about 2 cumecs to about 70 cumecs (1.5 metres rise) in about 1 hour.
5.8.3.2. These spates, which would normally be easily detectable by and attractive to salmon and sea trout, are likely to produce plumes out into Swansea Bay quite different from the olfactory trails illustrated in the models. Although not illustrated in the ES Chapter on Fish, the Water Quality Chapter confirms that during such spates the river plume will hug the lagoon wall rather than meander round the bay in an anti-clockwise direction.
5.8.3.3. Such spates, which often last a very short time, would normally assume greater importance than remnants of olfactory trails in the west of the bay but are likely to be masked by the massive flows into and out of the lagoon.
This is not allowed for in the model.
5.8.3.4. Para 9.5.3.6 recognises that “The Project could marginally increase the energetic cost to migrating fish: first, due to them having to navigate around the structure; and secondly, by concentrating currents along its boundary. However, the IBM constructed as part of the Project (Appendix 9.3, Volume 3) indicates that total delay, at most, would be two tidal cycles, and thus the effective energetic cost would be minimal.” but it fails to acknowledge that such a delay could cause fish to miss completely the opportunity provided by a spate to ascend the river.
5.8.4. The model apparently fails to allow for “positive or negative rheotaxis (reactions to water current direction)”, which is likely to be highly significant:
5.8.4.1. Without the lagoon fish are likely to follow tidal flows into the estuary (“passive migration” as mentioned in para 9.5.3.117) to investigate whether conditions are suitable for river entry. And they’re likely to drop back again in the same way if not “turned on” to “active migration” by attractive conditions.
This is not allowed for in the model.
5.8.4.2. Flows through the turbines (into the lagoon) on a flood tide could be mistaken by fish for flows into the estuary. Even if they try to avoid the turbines, flows are likely to be such that they can’t swim against them.
5.8.4.3. Flows through the turbines (across the bay) on an ebb tide are likely to mask river spates which could otherwise attract fish and facilitate river entry.
5.8.5. The model assumes that fish approach from a westerly direction and make directly for the Tawe, following olfactory trails to the west of the lagoon. Despite the comment in para 9.5.3.36 about “… no existing scientific evidence or expert opinion about a parameter (for instance exactly where fish are
Page 13 of 21
located in the Bristol Channel before they start their directed navigation to the river mouth)”, it is known and has been pointed out to the applicant (with evidence) that fish are just as likely to approach from the east. See for example the section on “adult salmon model” on page 14 of the APEM report
5.8.6. The model assumes that each fish, released at 60 second intervals, makes its own way at its own speed to the mouth of the river. But it’s known that fish travel in groups so that, if one fish encounters the turbines, the others in its group are also likely to do so. Failure to recognise this is failure to allow for worst case.
5.8.7. The model assumes that once a fish reaches the river mouth, it has achieved its objective and it’s removed from the model. This is known to be wholly incorrect and has been pointed out to the applicants. It’s quite normal for large numbers of fish entering a river mouth to drop back, hang around until conditions for river entry are more favourable, try again or even move to another river. The Tawe Barrage, which hinders entry into the Tawe, exaggerates this.
5.8.8. The statements in para 9.5.3.39 about smolts are wrong:
5.8.8.1. The Mee et al 1996 paper says nothing about smolts – it’s about returning adults.
5.8.8.2. The Moore et al 1998 paper was about “The migratory behaviour of wild Atlantic salmon smolts in the River Test and Southampton Water, southern England” and it says “There was also a significant seaward migration of smolts during the latter part of the flood tide suggesting active directed swimming”
5.8.8.3. Moore et al also produced a 1996 paper “The movements of emigrating salmonid smolts in relation to the Tawe Barrage, Swansea” which said “The movement of salmonid smolts past the sonar buoys located immediately downstream of the barrage in the lower estuary was random with respect to the tidal cycle and occurred during both ebbing and flooding tides.”
Smolts leaving for sea on a flood tide will be exposed to the large flows into the turbines.
5.8.9. The model assumes that sea trout in Swansea Bay are in “trail follow” mode but sea trout inhabit coastal waters and, if there are good stocks of sandeel and other prey species in Swansea Bay, as indicated in Fish baseline Appendix 9.1, it has to be assumed that a proportion of the sea trout will be in “area usage” mode, greatly increasing the risk of turbine encounter.
5.9. MITIGATION PROPOSED:
5.9.1. The only mitigation proposed to counter operational effects is the use of acoustic fish deterrent (AFD (devices). No details are given.
5.9.2. Sections 14 and 41 of the Salmon & Freshwater Fisheries Act 1975 provide that:
“in any case where— (a) by means of any conduit or artificial channel, water is diverted from waters frequented by salmon or migratory trout; and (b) any of the water so diverted is used for the purposes of [...] any mill [...]; "the responsible person" [...] [the occupier of the mill] [...] shall, unless an exemption from the obligation is granted by the appropriate agency, ensure (at his own cost) that there is placed and maintained at the entrance of, or within, the conduit or channel a screen which [...] prevents the descent of the salmon or migratory trout; and [...] Any exemption [...] may be granted subject to conditions."”

Page 14 of 21
“"mill" includes any erection for the purpose of developing water power”
“"screen" means a grating or other device which, or any apparatus the operation of which, prevents [...] the passage of salmon or migratory trout”
5.9.3. It’s understood that NRW, normally the “appropriate agency”, accept acoustic fish deterrent (AFD) devices as “screens” for the purposes of the SAFF Act and they have detailed guidance on the subject “Science Report – Screening for intake and outfalls: a best practice guide”. Some extracts:
“the effectiveness of the screening measures should reflect the level of risk to the fish stock or fish community and the importance attached to the stock, community or associated habitat”
“It is strongly recommended that the principles of risk analysis are applied to any intake screening proposal. However, the requirements of the relevant legislation must be taken fully into account.”
“a number of factors that may be used in a risk assessment [...]: the value of the fish stock in economic or conservation terms; the percentage of the fish stock that must pass the scheme; the percentage of those fish that pass successfully; the additional loss due to other schemes (i.e. cumulative impacts); the significance of given percentage levels of loss in economic and conservation terms.”
“The key elements of the Environment Agency’s s.14 policy are: 1. A standard risk assessment checklist procedure is used [...]; 2. Full recognition is given to the precautionary approach (“where there are threats of serious or irreversible damage, lack of full scientific certainty shall not be used as a reason for postponing cost-effective measures to prevent environmental degradation”). This is complementary to the approach adopted in the Habitats Regulations.”
“Projects within or connected with a designated SAC and therefore regulated under the Habitats Regulations demand more stringent risk assessment criteria. The critical test is whether the appropriate assessment can demonstrate no adverse effect on integrity of the European site. In this context, the BATNEEC criteria are replaced by BAT (Best Available Technology), without consideration to cost. The project may not proceed if adverse effect on site integrity cannot be avoided. The appropriate assessment therefore is the form of risk assessment procedure used in such cases.”
5.9.4. There’s no serious discussion in the ES of the effectiveness of such devices in circumstances such as these, merely some passing comments in para 9.5.6.14 et seq such as:
“Results indicate that sounds with frequencies between 20 and 600 Hz can effectively repel fish from the intakes of power stations. Efficiency is species-specific, with hearing specialists, such as herring, being much more susceptible to AFDs than generalists such as goby. For salmonid fish (salmon and sea trout), deflection efficiencies of around 70% appear to be typical”
“An important factor to consider when planning the installation of AFDs are the velocities in proximity to the turbine intakes, and the range at which avoidance behaviour is expected. For maximum effectiveness the avoidance range should extend beyond the range at which current velocities exceed the swimming capacity of the target species. If velocities are above these, fish may become entrained regardless of the operation of AFDs. This is particularly important in a tidal context, where currents are naturally strong, and fish may not necessarily perceive an abstraction until they are very close to it.”
Page 15 of 21
“Installation of AFD systems should be preceded by acoustic modelling of installation to ensure that the spread of noise is not excessive, which might interfere with the natural movements of fish or marine mammals”
This is wholly inadequate.
5.9.5. The draft DCO says “No part of the authorised development shall commence until a written strategy for the mitigation of the impacts of the authorised development on fish [...] has been submitted to and approved in writing by NRW. [...] The fish mitigation strategy shall provide for [...] use of behavioural fish guidance systems to discourage movement of fish through the turbines.”
This would place NRW under huge pressure. What would happen if they were not satisfied about the effectiveness of a proposed AFD system? What level of effectiveness should they require? This is a matter which should be resolved by the Examining Authority.
5.10. ES ASSESSMENTS AND CONCLUSIONS
5.10.1. METHODOLOGY.
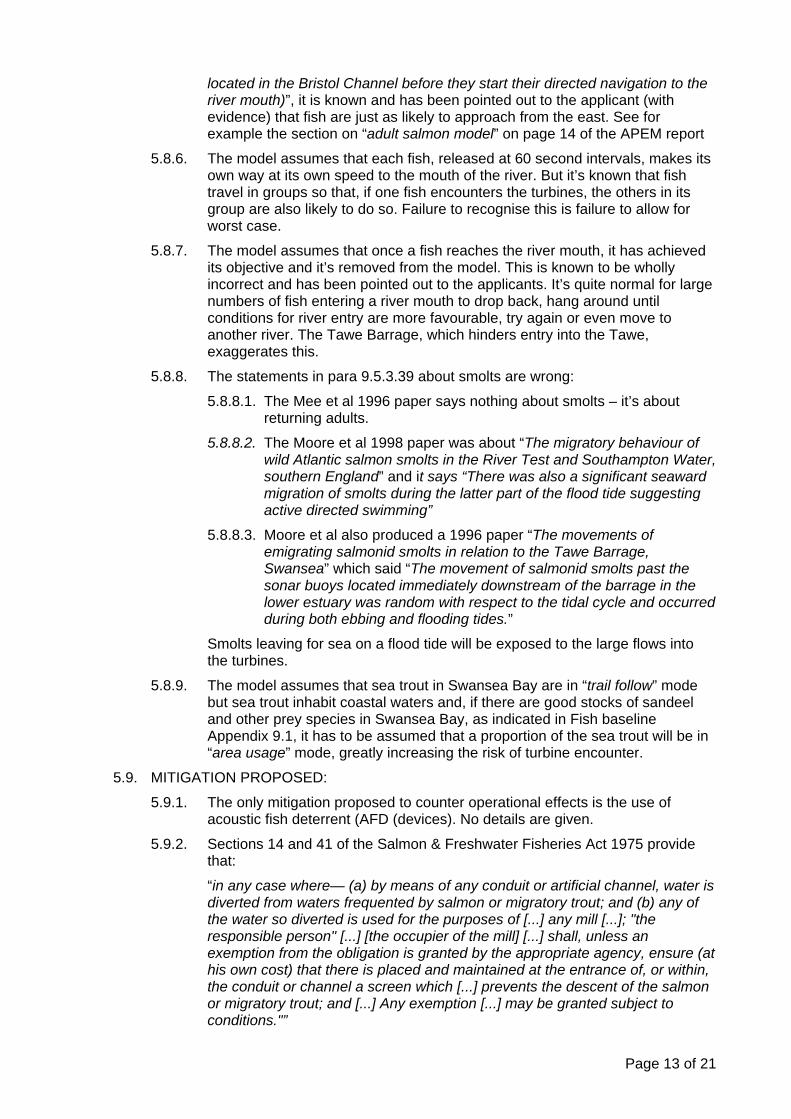
5.10.1.1. The significance of an impact (Table 9.4) is based on the “value” of the receptor and the “magnitude” of the impact and can be: no impact, insignificant, minor to insignificant, minor, moderate to minor, moderate or major:
5.10.1.2. The value of salmon and sea trout as fish is assessed (Table 9.2) as
“National / High” and the value of the salmon and sea trout fishery is also assessed as “National / High”.
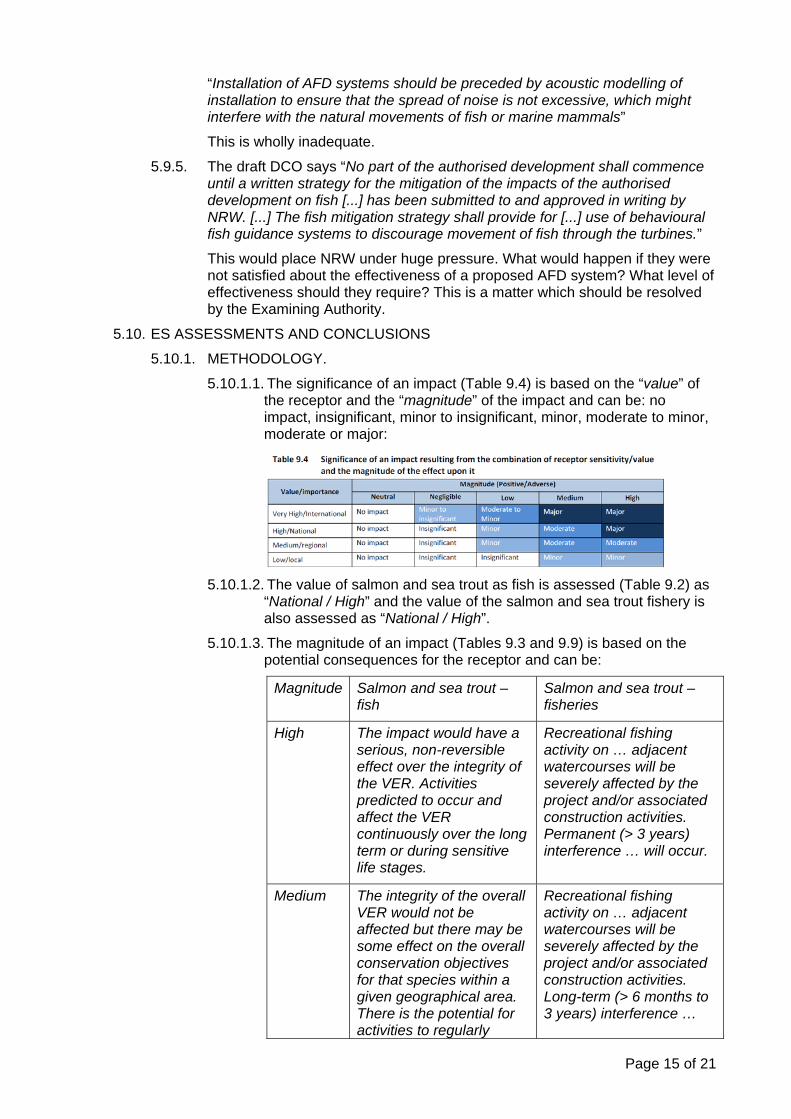
5.10.1.3. The magnitude of an impact (Tables 9.3 and 9.9) is based on the potential consequences for the receptor and can be:
Magnitude Salmon and sea trout – fish
Salmon and sea trout – fisheries
High The impact would have a serious, non-reversible effect over the integrity of the VER. Activities predicted to occur and affect the VER continuously over the long term or during sensitive life stages.
Recreational fishing activity on … adjacent watercourses will be severely affected by the project and/or associated construction activities. Permanent (> 3 years) interference … will occur.
Medium The integrity of the overall VER would not be affected but there may be some effect on the overall conservation objectives for that species within a given geographical area. There is the potential for activities to regularly
Recreational fishing activity on … adjacent watercourses will be severely affected by the project and/or associated construction activities. Long-term (> 6 months to 3 years) interference …
Page 16 of 21
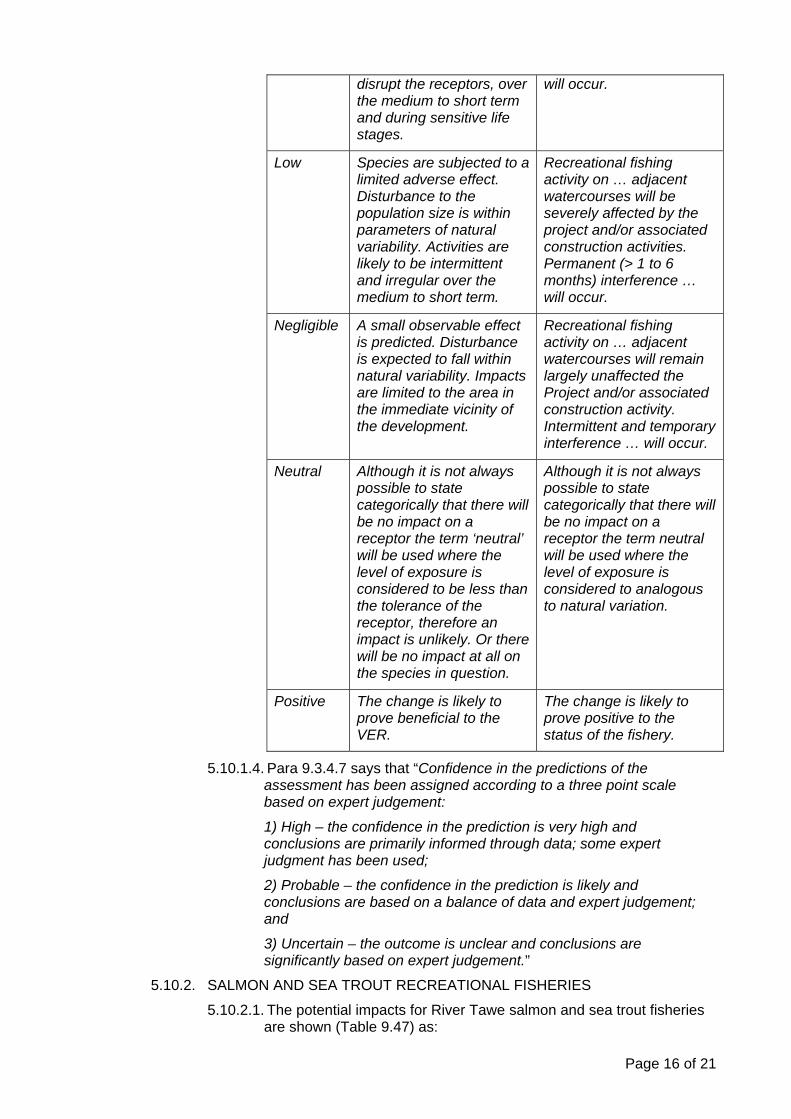
disrupt the receptors, over the medium to short term and during sensitive life stages.
will occur.
Low Species are subjected to a limited adverse effect. Disturbance to the population size is within parameters of natural variability. Activities are likely to be intermittent and irregular over the medium to short term.
Recreational fishing activity on … adjacent watercourses will be severely affected by the project and/or associated construction activities. Permanent (> 1 to 6 months) interference … will occur.
Negligible A small observable effect is predicted. Disturbance is expected to fall within natural variability. Impacts are limited to the area in the immediate vicinity of the development.
Recreational fishing activity on … adjacent watercourses will remain largely unaffected the Project and/or associated construction activity. Intermittent and temporary interference … will occur.
Neutral Although it is not always possible to state categorically that there will be no impact on a receptor the term ‘neutral’ will be used where the level of exposure is considered to be less than the tolerance of the receptor, therefore an impact is unlikely. Or there will be no impact at all on the species in question.
Although it is not always possible to state categorically that there will be no impact on a receptor the term neutral will be used where the level of exposure is considered to analogous to natural variation.
Positive The change is likely to prove beneficial to the VER.
The change is likely to prove positive to the status of the fishery.
5.10.1.4. Para 9.3.4.7 says that “Confidence in the predictions of the assessment has been assigned according to a three point scale based on expert judgement:
1) High – the confidence in the prediction is very high and conclusions are primarily informed through data; some expert judgment has been used;
2) Probable – the confidence in the prediction is likely and conclusions are based on a balance of data and expert judgement; and
3) Uncertain – the outcome is unclear and conclusions are significantly based on expert judgement.”
5.10.2. SALMON AND SEA TROUT RECREATIONAL FISHERIES
5.10.2.1. The potential impacts for River Tawe salmon and sea trout fisheries are shown (Table 9.47) as:

Page 17 of 21
• Reduction in salmon and sea trout returns.
• Reduction in revenue for fishing right owners, lease holders and angling clubs.
5.10.2.2. As we have pointed out several times, we own salmon and sea trout fishing rights which have a capital value of many tens of thousands of pounds so another major potential (likely) impact is reduction in their value.
5.10.2.3. As some of the progeny of sea trout remain in the river as non-migratory brown trout, the scheme also has the potential to harm our wild brown trout fishery. This is not mentioned anywhere in the ES.
5.10.2.4. Para 9.7.4.18 says that “The impact of the operational phase on salmon and sea trout smolt and adult migration, including entrainment and injury in the turbines, has been assessed as being of Minor significance post mitigation. This is due to the low proportion of fish that are predicted to pass through the turbines, the relatively fish-friendly design (small number of blades, slow rotation rate and minimum gap runner) of the turbines and the proposed deployment of fish deterrent systems as a mitigation measure.”
Para 9.7.4.19 concludes that during the operational phase “the overall predicted long-term impact on the salmon and sea trout fishery is expected to be of Low magnitude with a significance value of Minor, and a confidence of Probable”.
We don’t accept this.
5.10.2.5. The definition of low magnitude in Table 9.7 is “Recreational fishing activity on … adjacent watercourses will be severely affected by the project and/or associated construction activities. Permanent (> 1 to 6 months) interference … will occur.”
This is not of “minor” significance.
5.10.2.6. And operational effects will last longer than 3 years, so according to Table 9.9 magnitude should be “high”.
That produces a significance of “major”.
5.10.2.7. Turbine encounter is likely to be under-stated because of incorrect assumptions about fish movements, failure to apply an appropriate set of model rules, failure to take account of river flows and fish reactions to Tawe Barrage, etc.
In view of the current status of Tawe salmon, described above, we believe turbine encounters are likely to be of “high” magnitude.
This again produces a significance of “major”.
5.10.2.8. Turbine encounter is just one of a number of potential impacts identified and assessed in tables 9.32 and 9.34 (15 for salmon, 17 for sea trout), with a range of magnitudes, significances and probabilities, some of which are challenged. It isn’t clear how they’ve been distilled down to the overall conclusion in para 9.7.4.19.
5.10.2.9. Para 3.0.0.1 (“Accuracy and Limitations”) says "It must be appreciated that models of biology are inherently uncertain in comparison to models of physics and chemistry used for hydrodynamic models and water quality models respectively. ... Thus, expert opinion, is far more influential in assessment of the effects on animals and plants than is it on physical and chemical processes."
Page 18 of 21
Assessments incorporating a significant element of expert judgement, such as the turbine encounter assessment, cannot according to the principles set out above be given a confidence rating of “High”.
5.10.3. SALMON AND SEA TROUT – FISH
5.10.3.1. Tables 9.32 and 9.34 contain a number of errors and inconsistencies, for example:
• mitigation code F in Table 9.34 doesn’t appear in Table 9.32
• impact of waterborne noise and vibration from turbines – Table 9.32 different from 9.34
• significance of impact of waterborne noise and vibration from turbines goes from high to certain after mitigation when mitigation is n/a.
5.10.3.2. For the reasons set out above and below, we don’t accept the conclusions relating to:
• Turbine encounter. The mortality modelling counts only fish killed and fails to take account of lifetime egg deposition effects, ie the loss of killed fish from future breeding populations.
• Habitat fragmentation. Interference with normal migration through the masking of Tawe spates and delays due to entrapment in the lagoon is not fully recognised.
• Habitat modification. It’s ridiculous to suggest a positive impact for sea trout through the provision of foraging habitat. Sea trout can already forage in Swansea Bay without the risk of turbine encounter.
• Increased predation. Adult sea trout (up to a couple of pounds or more) are just as vulnerable to predation by cormorants as smolts.
5.10.3.3. As some of the progeny of sea trout remain in the river as non-migratory brown trout, the scheme also has the potential to harm our wild brown trout fishery. This is not mentioned anywhere in the ES.
5.10.4. OTHER SHORTCOMINGS IN THE ES
5.10.4.1. There’s no mention of the cumulative effects of building further tidal lagoons in the Bristol Channel, which is apparently the applicant’s intention, according to press reports.
5.10.4.2. The APEM report explains in section 3.1 that “Due to extensive movement of migratory salmonids along the South Wales coast there is potential for populations of more rivers to be impacted than currently included within the far-field zone.” Some of these will be fish from Special Areas of Conservation – eg, the Usk.
6. WATER FRAMEWORK DIRECTIVE (WFD)
6.1. STAGE 1 – RELEVANT WATERBODIES:
6.1.1. In the WFD Assessment (application document “8.3 Water Framework directive.pdf”) paras 3.2.0.3 (coastal waterbodies), 3.2.0.4 (transitional waterbodies) and 3.2.0.5 (river waterbodies) identify the waterbodies likely to be affected by the scheme and therefore to be assessed.
6.1.2. Para 3.2.0.3 includes only two River Tawe waterbodies:
Page 19 of 21
6.1.2.1. GB110059032180 – River Tawe – confluence with Twrch to tidal limit. This is the main stem of the Tawe and its ecological status could be jeopardised by the effects of the scheme on fish described above.
6.1.2.2. GB110059025690 – River Tawe – confluence with Nant Cwmgelli to tidal limit. We think this is a misdescription (by NRW) of an insignificant, largely culverted, stream entering the Tawe between the Tawe Barrage and Morriston. The waterbody is Nant Cwmgelli itself, not that part of the Tawe between the Tawe / Cwmgelli confluence and the tidal limit (wherever that might be).
6.1.3. Para 3.2.0.3 fails to include a number of others, linked to the proposed lagoon by migratory fish, and for which such fish are an essential element of their ecological classification, for example:
6.1.3.1. GB110059032200 – Lower Clydach – headwaters to confluence with Tawe. An impassable man-made barrier at the bottom of the Lower Clydach is currently being addressed to allow salmon and sea trout to re-populate approx 20km of this tributary, which could become a major spawning stream. The effects on fish, described above, could jeopardise this and the attempt to bring its WFD “fish” and ecological status up to good by 2015.
6.1.3.2. GB110059032190 – Upper Clydach – headwaters to confluence with Tawe.
6.1.3.3. GB110059032280 – Giedd – headwaters to confluence to Tawe.
6.1.3.4. Etc.
6.1.4. Para 3.2.0.4 fails to include the Tawe estuary between the Tawe Barrage and the highest point reached by tides at the Beaufort Weir in Morriston – about 3.5 miles of water with serious water quality issues caused by the Tawe Barrage.
(Waterbody GB541005900900 described as Tawe Estuary doesn’t extend above the Tawe Barrage.)
Unfortunately NRW (or rather, Environment Agency Wales before them) have failed to give this a WFD waterbody identifier or to include it in any other waterbody. NRW have indicated that for the next WFD cycle (2016-2021) they propose to incorporate this stretch of water in existing waterbody GB110059032180 (Tawe –confluence with Twrch to tidal limit).
6.2. STAGE 2 – BASELINE. This is incomplete because of the omission of the waterbodies mentioned above.
6.3. STAGE 3 – RELATIONSHIP OF PROJECT COMPONENTS TO RELEVANT WATERBODIES:
6.3.1. This assessment is incomplete because of the omission of the various waterbodies mentioned above.
6.3.2. Table 3.3 – Turbines and sluice gates. Fails to acknowledge fish turbine encounters and associated mortality.
6.3.3. Table 3.3 – Various construction components (cofferdam, seawalls, etc) which will cause suspension of sediments and contaminants, which will be swept into the estuary by incoming tides, fail to acknowledge the likely damaging effects on the stretch between the Barrage and Morriston.
6.4. STAGE 4 – PRELIMINARY ASSESSMENT:
6.4.1. This assessment is incomplete because of the omission of the various waterbodies mentioned above.
Page 20 of 21
6.4.2. Table 3.5, GB110059032180 – River Tawe – confluence with Twrch to tidal limit:
6.4.2.1. This fails to acknowledge the likely damaging effects on the stretch between the Barrage and Morriston of construction works and dredging, which will lead to the suspension of sediments and contaminants, which will be swept into the estuary by incoming tides. The Barrage is likely to prevent all these materials returning to the Bay on the ebb tide and they are likely to settle out in the Barrage impoundment. Water quality here is already poor because of stratification and sedimentation.
6.4.2.2. It does acknowledge the likely effects on fish but not in way which is consistent with tables 9.32, 9.34 and 9.47 in the ES. The impacts discussed in more detail in the ES are likely to compromise the waterbody’s good ecological status.
6.4.3. Table 3.6, GB110059025690 – River Tawe – confluence with Nant Cwmgelli to tidal limit. No further comment.
6.4.4. Table 3.9, GB541005900900 – Tawe Estuary. Fish are not a component of this waterbody’s classification.
6.5. STAGE 5 – DETAILED ASSESSMENT:
6.5.1. This assessment is incomplete because of the omission of the various waterbodies mentioned above.
6.5.2. Para 3.6.0.5 says “the pressures exerted from the Project on anadromous fish populations are by far outweighed by the natural dynamics (e.g. predation at sea) which influence stock recruitment. Additionally, risks posed from in-river sources, are likely to have a much greater impact than the Project itself.” We don’t think these are relevant considerations. Two wrongs don’t make a right. The development must not compromise achievement of WFD objectives.
6.5.3. We have argued above that the detrimental effects of the project have been under-stated and we submit that it would in fact compromise achievement of such objectives.
6.6. WFD ARTICLES 4.7 AND 4.8:
6.6.1. ARTICLE 4.7. The assessment makes no attempt to justify the damaging development on the grounds of overriding public interest etc.
6.6.2. ARTICLE 4.8. This article appears to completely preclude any development which will permanently exclude or compromise the achievement of objectives in other waterbodies within the same River Basin District – eg, the River Tawe waterbodies mentioned above.
6.7. CONCLUSION. The WFD assessment is therefore defective and wholly inadequate. If the applicant seeks to correct these shortcomings with new information:
6.7.1. it seems to us that Regulation 17 of The Infrastructure Planning (Environmental Impact Assessment) Regulations 2009 would apply and that the examination should be suspended pending compliance with the requirements of the Regulation;
6.7.2. we would want to make further representations in accordance with the Regulation.

Page 21 of 21
7. OUR STATUS AND PROTECTION OF FISHERIES INTERESTS
7.1. OUR STATUS
7.1.1. Damage to our property rights might entitle us to make a “relevant claim”. We are therefore “category 3 affected persons” for the purposes of the Planning Act 2008.
7.1.2. The Examining Authority has recently confirmed this by according category 3 status to the Tawe and Tributaries Angling Association Ltd under section 102A of the Planning Act 2008.
7.2. APPLICANT’S FAILURE TO RECOGNISE OUR STATUS
7.2.1. We are giving details separately, in reply to Question 7.16 in the Examining Authority’s first round of questions, of:
• the way in which the applicant has denied us category 3 status and failed to consult us properly in accordance with its own consultation strategy
• the applicant’s failure by diligent enquiry to identify and consult other category 3 persons (including other riparian and fishery owners like ourselves)
• the applicant’s failure to notify us and other category 3 affected persons of the acceptance of the application
• the applicant’s wrongful certification of compliance with the section 58 notification requirements.
7.2.2. We submit that, because of the above failings, the consent application was submitted prematurely:
• before we were able to discuss our expert fisheries analysis with the applicant
• before discussions about monitoring, mitigation or compensation arrangements.
7.3. PROTECTION OF OUR INTERESTS
7.3.1. As stated above, we are opposed to the application and ask the Examining Authority to recommend refusal.
7.3.2. If the application is allowed, we ask the Examining Authority to ensure that secure measures for our protection are included in the Development Consent Order, including:
7.3.2.1. requirements to implement any mitigation and offsetting measures devised as a result of discussions between the applicant, NRW, ourselves and other interested parties
7.3.2.2. proper monitoring, at the applicant’s expense, of the effects of the construction, operation and maintenance of the project
7.3.2.3. offsetting measures to counter an assumed level of harm (as in the case of the Cardiff Bay Barrage), whether or not demonstrated by monitoring, because of the possibility that monitoring might not identify true impacts
7.3.2.4. compensation arrangements to take effect if monitoring shows that fish and therefore our fishery have been harmed
7.3.2.5. requirements to remedy any damaging effects of the project
7.3.2.6. security (eg in the form of a bond) to cover any liabilities which the developer, or any other entity to which responsibility is transferred, fails to honour.

Pontardawe and Swansea Angling Society Ltd www.pasas.org.uk
Treasurer – Phil Jones
Pontardawe and Swansea Angling Society Ltd Reg’d Office 8 Bwllfa Rd Ynystawe Swansea SA6 5AL Registered in Wales No 6736638 Our Disabled Membership Section operates as Tawe Disabled Fishers
Directors: Life President and Secretary Ray Lockyer 8 Bwllfa Rd Ynystawe Swansea SA6 5AL Tel 01792 844014 Email [email protected] Chairman Dave Hooper Berwyn 19 Cefn Rd Glais Swansea SA7 9EZ Tel 01792 844887 Mob 07813 519859 Email [email protected] Treasurer Phil Jones 44 Bwllfa Road Ynystawe Swansea SA6 5AL Tel 01792 843951 Mob 07957 154992 Email [email protected]
Social Secretary Spencer Williams 81 Capel Rd Clydach Swansea SA6 5PY Tel 01792 849293 Mob 07968 332119 Email [email protected] Head Bailiff Dave Hooper Berwyn 19 Cefn Rd Glais Swansea SA7 9EZ Tel 01792 844887 Mob 07813 519859 Email [email protected] Tawe Disabled Fishers Secretary Des Williams 2 Heol Hen Seven Sisters Neath SA10 9AF Mob 07971 639404 Email [email protected]
Members of Welsh Salmon & Trout Angling Association Angling Trust Fish Legal Salmon and Trout Association
Wild Trout Trust Carmarthenshire Rivers Trust Inst of Fisheries Mgt Canoe Wales
Tidal Lagoon (Swansea Bay) plc Suite 6, J-Shed Kings Road Swansea SA1 8PL Emailed as a PDF to [email protected] 2 August 2013 Dear Sirs PROPOSED TIDAL LAGOON, SWANSEA BAY 1. INTRODUCTION.
This is a response to your public notice which appeared in the South Wales Evening Post on 29 June 2013. That notice is unclear because it says that “Any response or representation in respect of the proposed Project, Application and/or DCO must be received by the Applicant on or before 5 August 2013”. But our understanding, based on the advice at http://infrastructure.planningportal.gov.uk/application-process/the-process/ is that this is only a pre-application consultation on the Preliminary Environmental Information Report (PEIR) and that we’ll be able later, at the pre-examination stage (after acceptance of the application by the Planning Inspectorate), to register, submit further views and attend a preliminary meeting run and chaired by an Inspector. This is not therefore our final response to your proposals. We expect to present further objections later, when we’ve been able to study your completed Environmental Impact Assessment (EIA).
2. ABOUT US AND OTHER FISHING ORGANISATIONS. a. Firstly, Section 9.7 and Appendix A of Appendix 9.1 need to be corrected:
i. Para 9.7.3 says
“Angling associations offer a framework of representation to small, local clubs and individual members. Incentives for joining may include: public liability insurance; legal advice; discounted goods from partners; and government lobbying on members’ behalf.” Your terminology is confused and your distinction between clubs and associations is incorrect:

Pontardawe and Swansea Angling Society Ltd Page 2 of 9
(1) Individual anglers tend to form local organisations which might be known as clubs, associations, societies or by other names. Most of the “local clubs” in this area are not “small” – they have hundreds of members each and between them the clubs on the rivers Tawe, Neath and Afan have more than a thousand members.
(2) Those first-tier organisations also form second-tier organisations for the purposes of joint representation. These can also be known as associations – eg, many game angling clubs in Wales belong to the Welsh Salmon & Trout Angling Association (WSTAA). Most of the clubs on the rivers Tawe, Neath and Afan belong to the Gower Region of WSTAA.
(3) Second-tier organisations also form third-tier organisations for higher level joint representation across disciplines – eg, WSTAA is a member of the Federation of Welsh Anglers, along with the Welsh Federation of Coarse Anglers and the Welsh Federation of Sea Anglers.
(4) The Angling Trust is a comprehensive first-, second- and third-tier organisation with individuals as well as first- and second-tier organisations in membership.
ii. Para 9.7.3 also says “The Angling Trust offers club and individual membership and is very active in terms of conservation, fisheries management and protecting anglers’ rights. However, no affiliated clubs exist in South Wales.” This is not correct. We have been members of the Angling Trust for several years (and its legal arm, Fish Legal, for several decades) and we are not the only members in South Wales.
iii. Appendix A gets “clubs” and “associations” mixed up and says “awaiting responses” for clubs. That’s not correct. Table 9.21 shows that we were consulted and expressed our views at an early stage. We met Eva Bishop (then Director of Tidal Development of Inazin) on 11 April 2012 and told her then of our interest and our concerns.
b. We are a not-for-profit angling club in the Swansea Valley. We are a reputable club of long standing, having been formed in the 1940s and incorporated as a company limited by guarantee in 2008. We own, control or enjoy the fishing on most of the River Tawe between Ynysmeudwy and Morriston – about 8 miles of the lower part of the river. Our fishing is for salmon, sea trout and brown trout.
c. We are not just “recreational anglers”. We are a business. Ownership and leasing of river bed / bank and fishing rights are property rights which carry entitlements.
d. We have about 300 members – about 130 adult (£60 per annum), about 120 OAP/disabled (£20 per annum) and about 50 juniors (£5 or £10 per annum). These charges only partially reflect the value we place on our fishing as we minimise costs to members. We have no restrictions on membership. Most of our members are local. Our level of membership is lower than usual at the moment, apparently because of the recession – it’s

Pontardawe and Swansea Angling Society Ltd Page 3 of 9
normally over 400.
e. We are members of: the Welsh Salmon and Trout Angling Association; Angling Trust; Fish Legal; Wild Trout Trust; Carmarthenshire Rivers Trust; Institute of Fisheries Management and the Salmon and Trout Association.
f. The benefits to the community from fishing are well-recognised both across the United Kingdom and specifically in Wales. See for example: i. Fishing For Answers – The Final Report of the Social and Community Benefits of Angling Project
http://resources.anglingresearch.org.uk/sites/resources.anglingresearch.org.uk/files/Final%20report.pdf);
ii. the Welsh Government guidance to Natural Resources Wales under section 4 of the Environment Act 1995; and
iii. the Welsh Government Wales Fisheries Strategy 2008,
3. FISH AND FISHING IN THE RIVER TAWE. a. As mentioned above, our fishing in the River Tawe is for salmon, sea trout and brown trout.
Over the 10 years 2003-2012 Environment Agency catch returns show that the Tawe was ranked 7th in Wales for salmon catches and 18th in Wales for sea trout catches.
b. The quality of the salmon fishing has been improving steadily since the 1970s. The sea trout fishing is not as good now as it was in the 1970s and 80s, when the Tawe was ranked in the top ten in Wales. The decline is due in part to the River Tawe Barrage which was commissioned in the late 1980s. Although sea trout catches have declined generally in Wales in recent years, the Tawe has declined more than most.
c. Salmon and sea trout are important species. The salmon is a protected species under the EU Habitats Directive. Both are priority fish species in the UK Biodiversity Action Plan and the Swansea BAP. They are also highly valued by the public as indicators of environmental quality, in addition to the social and economic benefits of fishing – see, for example: i. Mawle, G.W. & Peirson, G.(2009). ‘Economic Evaluation of Inland Fisheries’. Managers report from
science project SC050026/SR2, Environment Agency. http://a0768b4a8a31e106d8b0-50dc802554eb38a24458b98ff72d550b.r19.cf3.rackcdn.com/scho0109bpgi-e-e.pdf; and
ii. O’Reilly, P.O. and Mawle, G.W. (2006). ‘An appreciation of the social and economic values of sea trout in England and Wales’ in ‘Sea trout: Biology, Conservation and Management: Proceedings of First International Sea Trout Symposium, Cardiff, July 2004’, editors Graeme Harris and Nigel Milner.
d. The latest annual assessment for Welsh Government as reported to the North Atlantic Salmon Conservation Organisation through the European Union, is that the Tawe salmon stock is ‘At risk’ though may be improving. It is therefore important to protect both species from damage by developments.

Pontardawe and Swansea Angling Society Ltd Page 4 of 9
The mouth of the River Tawe, used by juvenile and adult salmon and sea trout leaving the river and by adults returning to the river, is right alongside the proposed lagoon.
e. The Tawe catchment contains 14 water bodies for WFD purposes. Of those that are assessed for Fish, only 3 are ‘Good’ while 5 are only ‘Moderate’ (EAW River Basin Management Plan Western Wales River Basin District Annex B: Water body status objectives). The objective is for all the water bodies to have good ecological status or potential. We need measures to improve fisheries, not developments which are likely to harm them.
4. JUSTIFICATION AND CLAIMED BENEFITS FOR THE PROPOSED LAGOON. a. Approach.
The benefits to the Swansea area and to Wales appear trifling and over-stated compared with the potential environmental damage. The Welsh Government and Natural Resources Wales approach to developments is “to ensure that our natural resources are healthy and resilient and are efficiently managed for Wales’ long-term economic, social and environmental benefit”. We fail to see how this proposal would fit in with those aspirations and we’ll expect to see a detailed justification using the ecosystem services methodology favoured by Welsh Government. It seems to us that Swansea Bay and Wales would suffer the environmental impacts but that the commercial profit, largely derived from public subsidy, would be siphoned off and accrue elsewhere.
b. Electricity generation. It’s claimed that the “nominal capacity” of the generating station would be 240MW. But that’s misleading. Because of utterly predictable tidal conditions, actual capacity would be a lot less. The PEIR concedes that actual generation over a year can never be any more than 400GWh, which is shown by simple calculation to equate to a maximum overall generating rate of just 46MW. It isn’t clear, therefore, why the procedure in sections 14 and 15 of the Planning Act 2008 is being used, because that procedure applies to onshore generating stations with a capacity of more than 50MW and offshore generating stations with a capacity of more than 100MW.
c. Public access to the structure. The likely periods when the walkway on top of the structure is available to the public needs to be described and quantified. We believe that they’re likely to be quite limited. The eastern breakwater to Swansea Docks is closed to the public because of the risks from high seas and this structure would be subject to the same risks – more so, because the proposed height is lower than the existing eastern breakwater. Because the proposed structure is so large, it would take a dangerously long time to evacuate visitors when weather deteriorates unexpectedly. So the claimed benefit of allowing public assess to the structure for recreation is likely to be minimal and the images in the publicity literature of the public taking a stroll along

Pontardawe and Swansea Angling Society Ltd Page 5 of 9
the top of it are fanciful.
5. PERCEIVED THREATS FROM THE PROPOSED LAGOON. a. The effect of the lagoon needs to be looked at cumulatively with the effects of the barrage and other issues.
b. Chapter 9 of the PEIR appears to identify many of the issues that occur to us so we won’t list them all here,
although some of the more important points as far as salmon and sea trout are concerned, some points of detail and apparent errors and omissions are commented on below.
c. We are concerned that the lagoon proposal has reached such an advanced stage without your having carried out the necessary investigations to establish the likelihood and extent of the “potential effects” listed in Table 9.5. We believe that any of the potential effects described there would be sufficient to preclude the development and for that reason we oppose this proposal and will continue to do so vigorously at all stages, enlisting all the support we can muster. We would point out that the Governments’ Feasibility Study in relation to tidal power lagoons on the Welsh Grounds and Bridgwater Bay further up the Severn Estuary concluded that they might cause local extinction of salmon stocks in the Wye, Usk and Severn salmon stocks. Given its proximity to the Tawe estuary, the impact on salmon and sea trout populations of the Swansea Tidal Lagoon will be even more severe, with even greater probability of local extinction.
d. Fish likely to be affected. We are mainly concerned with salmon and sea trout but there are also other important species bound for or leaving the River Tawe, such as sea lamprey, eel, etc. i. Table 9.2 is not laid out correctly. It shows sea trout incorrectly as “Other fish species”, as though they
are not “Migratory” or “Diadromous” – they should be in the top part of the table, with salmon and lamprey.
ii. Table 9.6 in the PEIR shows the fish species and life stages to be considered for modelling. (1) For adult sea trout the entry is “sea trout adult – local feeding behaviour”. Whilst some sea
trout are likely to feed in the area, it should also be recognised that most returning adults are likely to arrive from more distant waters intent on finding the Tawe and entering it to spawn. Table 9.6 doesn’t appear to cover these important fish. Neither does it cover the out migration behaviour of sea trout and salmon kelts.
(2) For adult salmon the entry is “salmon adult – immigration / river entry” but for juvenile eels and adult lamprey the entries say “coastal river searching”. The reason for the different wording is not understood. If this is meant to imply that salmon proceed directly to the river mouth without having to search for their river and without milling about outside, it would be a mistake. The arrival of salmon in Swansea Bay is likely to be driven by tides but their entry into the river is driven by river flows. They can hang around outside the river for lengthy periods waiting for a spate in the river. This is exacerbated by the Tawe Barrage, which prevents fish from entering

Pontardawe and Swansea Angling Society Ltd Page 6 of 9
the estuary until river flows are quite high.
iii. Table 9.7 in the PEIR shows migration periods for salmon and sea trout. (1) Smolt (spring, autumn) – you need to be aware that salmon smolt growth and migration from
the River Tawe isn’t typical. We understand that they grow quickly and migrate early.
(2) Kelt (winter). If winter is taken as December, January and February, you need to be aware that kelts are observed in the river Tawe in March. The emigration of both salmon and sea trout kelts seems to be given little consideration in this report. Indeed this table, copied from elsewhere, is the only reference to them. Sea trout kelts are particularly important as multiple spawners may contribute a large proportion of the annual run and even bigger proportion of egg deposition. Even for salmon, previous spawners generally contribute about 10 percent of the run, so kelts will also need protection.
iv. Table 9.7 doesn’t mention returning adult salmon and sea trout, looking to ascend the Tawe to spawn. These fish arrive in the area of the proposed lagoon all the way through from March to December.
v. Table 9.13 in Appendix 9.1 doesn’t even mention kelt migration as well as being muddled over migration and spawning times.
e. Unnatural flows. i. Releases from the impoundment at times other than normal ebb. The inclusion in the scheme of large
sluice gates suggests to us that they will be used to control the way in which impounded water is released. Without knowing how they might be used, we’re unable to assess the effect but it occurs to us that strong flows of water from the impoundment at low tide are likely to have various damaging effects.
ii. Our experience of the Tawe Barrage is that incoming tidal flows can be so great that levels upstream of the barrage can be lower than those outside the impoundment, creating a wholly unnatural “upstream waterfall”. It seems likely that the same will apply in the case of the lagoon. Even with large sluice gates, it won’t be possible for the impoundment to fill quickly enough for levels inside to match those outside. So there will be a powerful flume of water entering the impoundment, creating massive erosion / disturbance of the bed of the impoundment.
f. Fish passing through turbines. i. We understand that mortality / damage to fish is likely to be high, if they pass through the turbines. It
seems highly likely to us that fish will be drawn through the turbines for a number of reasons.
ii. As we understand it, returning adult salmon swim up the south side of the Bristol Channel and then back along the north side, hugging the coast, looking for their river. (Tawe salmon used to be caught
Pontardawe and Swansea Angling Society Ltd Page 7 of 9
in the nets which used to operate outside the Usk.) If we’re right, Tawe salmon seem likely to encounter the eastern wall of the lagoon and swim around it to the west – right past the turbine array.
iii. Although less is known about the movements of sea trout, adult sea trout seem likely to encounter the lagoon wall in the same way. We understand that there’s generally an anti-clockwise flow in Swansea Bay which is likely to carry them past the turbine array.
iv. Strong flows into the impoundment on an incoming tide seem likely to sweep adult salmon and sea trout through the turbines, as they pass.
v. If Tawe river water is carried into the impoundment on incoming tides, it follows that it will be expelled through the turbines on an ebbing tide. Salmon and sea trout looking for the river Tawe are likely to be attracted to this, making it likely that they’ll also pass through the turbines on ebbing tides, when flows allow.
vi. When trapped inside the impoundment, fish are likely to detect Tawe river water being drawn into the impoundment. They are likely to be attracted to this.
vii. Salmonid movement is generally with the tide. Given that large volumes of water will pass into and out of the lagoon, we anticipate that a large proportion, perhaps the majority, of smolts and adults (fresh-run or kelts) will be entrained, probably several times. The consequences for the populations of both species of migratory salmonid, and our fisheries, are likely to be severe.
g. Fish passing through power station cooling water intake screens and industrial supply intakes. This risk is mentioned in the PEIR. It needs to be covered comprehensively in the EIA.
h. Fish deterred from ascending the river to spawn or from proceeding to distant feeding grounds on departure from the river, leading to extinction of River Tawe salmon and sea trout: i. Because of unnatural flows close to the river mouth.
Fish looking to ascend the River Tawe currently find river water discharging into the bay from the mouth of the river between the two docks breakwaters. If the scheme goes ahead, these flows will be completely disrupted. Even if not entrained and swept into the impoundment, fish are likely to have difficulty finding the river. Fish are literally unlikely to know whether they’re coming or going.
ii. Because of very high levels of suspended sediment. As explained above, unnatural flows are likely to create extremely turbid conditions. It’s said in the PEIR that salmon and sea trout are used to experiencing this in the Severn estuary and can cope with it. But there’s a big difference between fish going with the flow in the massive Severn estuary and fish close to the River Tawe trying to find its mouth so that they can enter it.
Pontardawe and Swansea Angling Society Ltd Page 8 of 9
iii. Because of noise and vibration. The PEIR mentions the risk. It needs to be covered comprehensively in the EIA.
iv. Because of entrapment within the lagoon. The risk of fish passing repeatedly through the turbines, in and out of the impoundment, is mentioned above. But it seems likely that some fish will become trapped in the impoundment and never find their way out. This would be as bad as killing them because, if they are prevented from migrating in the normal way to and from the river and their feeding grounds, they are lost from the stock of the River Tawe.
i. Fish affected by water quality issues. i. From increases in suspended sediment and disturbance of historic contaminants.
Apart from the obvious risk of fish kills, there’s also the risk of fish becoming tainted and unsuitable for consumption. In the case of salmon and sea trout, this would be a major concern.
ii. From sewage discharges. Again, the risk is mentioned in the PEIR and it needs to be addressed comprehensively in the EIA.
6. OTHER POINTS. a. Monitoring.
We can’t see any provision in the PEIR for pre-and post-construction monitoring, with a view to quantifying the effects on salmon and sea trout. If the proposal went ahead, we would require such monitoring so that compensation could be claimed for any damage to our fishery and remediation could be arranged. Such monitoring and remediation would obviously need to be at the developer’s expense. A level of remediation should be assumed to reflect the precision of the monitoring programme. We would point out that the precision of any monitoring programme will depend on the number of years monitoring pre- as well as post-construction. We reiterate the advice of EA Wales to learn from the monitoring and mitigation programme for the Cardiff Bay Barrage, as well as the studies in relation to the Swansea Barrage. There is no evidence in the PEIR that this advice has been followed. The stocks of both migratory salmonids in the Tawe are currently below their target levels. The target, rather than current, levels should be taken as baseline against which the impact of the lagoon would be assessed.
b. Security. If approved, this will be a high risk scheme for investors. In case it failed and the developer became insolvent, security would need to be provided to cover the costs of removing the structure and putting right any damage done. We can’t see any provision in the PEIR for such security. It’s something which we will

Pontardawe and Swansea Angling Society Ltd Page 9 of 9
pursue at the highest levels before any decision on the proposal. Any such security arrangements will need to provide for transfers of responsibility from the initial developers to any other entities. There has already been one transfer from Inazin to Tidal Lagoon Swansea Bay plc since the scheme was first promoted in 2012.
c. Appendix 9.1 contains some inaccurate information (e.g. the life history of salmon; rod catches being described as ‘non-quantitative’) as well as textual errors. We hope that greater care will be taken with the full EIR.
Finally, we repeat that any damaging effect on the important River Tawe runs of salmon and sea trout would be enough to preclude the proposed development. We would not be satisfied with mitigation, remediation or compensation. As far as we are concerned, YOU MUST NOT DAMAGE RUNS OF THESE FISH. We fail to see how you would be able to eliminate any risk of this so WE ARE UTTERLY OPPOSED TO THE PROPOSAL.
Yours faithfully
Phil Jones for Pontardawe and Swansea Angling Society Ltd
Copies to: Welsh Salmon & Trout Angling Association Other affected clubs on the Tawe, Neath and Afan Angling Trust and Fish Legal Natural Resources Wales (Fisheries) Welsh Govt (Fisheries) Carmarthenshire Rivers Trust Salmon and Trout Association Councillors Welsh Assembly Members MPs MEPs


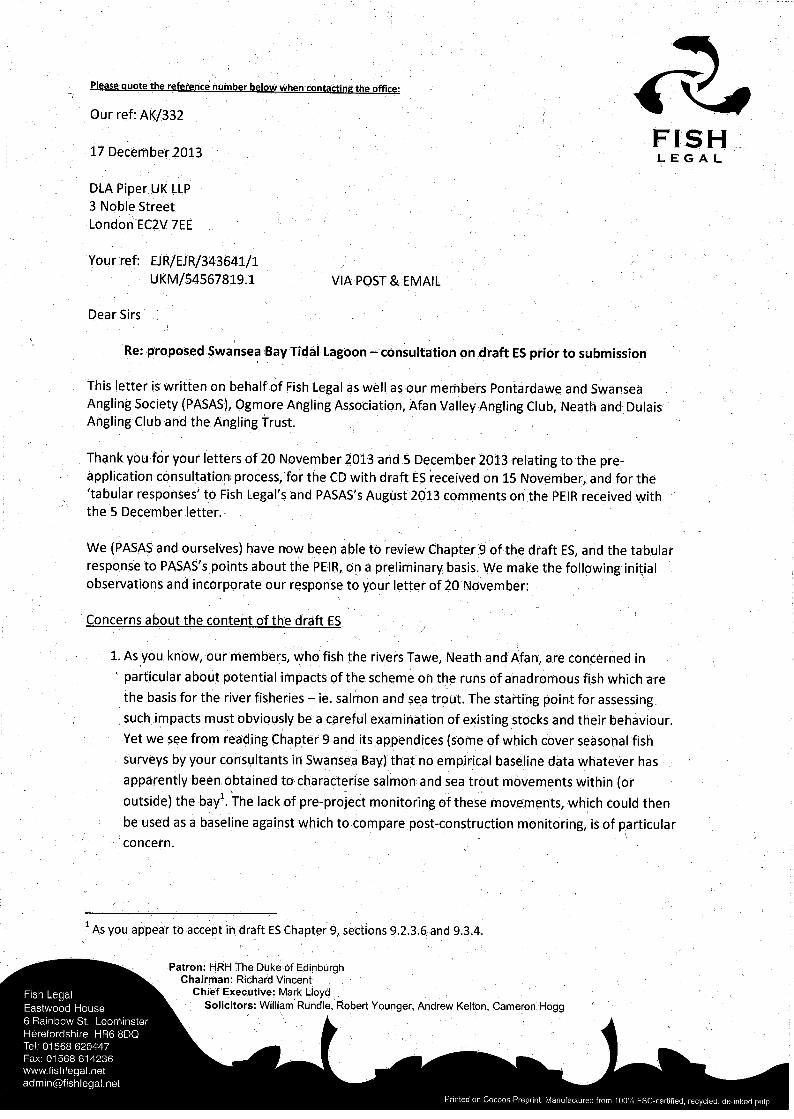

1
2

3
4
5
6
7
8
9

10

11

12

13

F
Phin
R
Fe
A
ish Legal
Proposed Shydropowndepende
REPORT
ebruary 20
APEM REF: 4
Swansea Ber develoent expert
14
413196
Bay Tidal pment – t fisheries
Lagoon
analysis
CLIENT:
PROJEC
DATE O
REPORT
:
CT No:
OF ISSUE:
T AUTHORS
R
S:
GrouGwaun
SouthTel:
Website: Registered i
Fish Legal
413196
February 2
Nicola TeagNigel Milne
APEM Ltd.und Floor, Un Elai Medi CLlantrisant
h Wales, CF: 01443 239 www.apemin England N
2014
gue er
Unit 2 Campus t 72 8XL 9205 mltd.co.ukNo. 2530851
A
CON
1
1.1.
2
3
3.3.3.3.
4
4.4.4.
5
5.5.5.5.5.5.5.5.5.5.
6 9.0)
6.6.
6.
7
7.7.
8
8.8.
APEM Report 4
NTENTS .....
AUTHOR
.1 NIGEL M
.2 NICOLA T
SUMMAR
BASELINE
.1 SECTION
.2 SECTION
.3 SECTION
.4 SECTION
FISH TUR
.1 MODEL A
.2 MODEL P
.3 MODEL O
FISH TUR
.1 MODEL A
.2 MECHAN
.3 PRESSUR
.4 SHEAR ST
.5 CAVITATI
.6 POST PAS
.7 MODEL T
.8 MODEL B
.9 MODEL O
.10 SLUICE PA
FISH, INC) 29
.1 SECTION
.2 SECTION TURBIN
.3 SECTION
MITIGAT
.1 CHAPTER
.2 POTENTIA
MONITO
.1 MONITO
.2 MONITO
413196 – Swa
..................
RS QUALIFIC
MILNER ..........TEAGUE (NEE
RY OF KEY P
E (APPENDI
9.5.2 METHO
9.5.3 MIGRA
9.5.4 MIGRA
9.5.5 PRESEN
RBINE ENCO
APPROPRIATEN
PARAMETERISA
OUTPUTS AND
RBINE PASS
APPROPRIATEN
NICAL INJURY ..E CHANGE ....TRESS AND TU
ION .............SSAGE EFFECTTECHNICAL INP
BIOLOGICAL IN
OUTPUTS AND
ASSAGE AND I
CLUDING RE
9.4.3 STUDY9.4.8 ASSESSES...............9.5.3 OPERA
TION (OFFSE
R 9 ...............AL OPPORTUN
ORING .........
RING OF IMPA
RING THE EFFE
ansea Bay Tida
C
..................
CATIONS ....
..................O’KEEFFE)....
POINTS ......
IX 9.1, SECT
ODOLOGY .....ATORY FISH POATORY FISH CHNCE OF MIGRA
OUNTER MO
NESS AND GEN
ATION AND CA
CONCLUSION
AGE MODE
NESS AND GEN
..................
..................RBULENCE ......................TS ................PUT DATA ......NPUT DATA ....CONCLUSION
NJURIES .......
ECREATION
AREA ..........SMENT OF THE
..................ATIONAL PHAS
ETTING) .....
..................NITIES ...........
..................
ACTS AND A BA
ECTIVENESS O
al Lagoon hyd
CONTENT
..................
..................
...................
...................
..................
TION 9.5 M
...................OPULATIONS A
HARACTERISAT
ATORY FISH S
ODELLING (
NERAL METHO
ALIBRATION ...S ................
ELLING (APP
NERAL METHO
...................
...................
...................
...................
...................
...................
...................S ...................................
AL AND CO
...................E SIGNIFICANC
...................E EFFECTS .....
..................
...................
...................
..................
ASIS FOR COM
F MITIGATION
dropower dev
S
..................
..................
...................
...................
..................
IGRATORY
...................AND RIVER QU
TION ............PECIES, SPAW
APPENDIX
D ......................................................
PENDIX 9.4)
D ...........................................................................................................................................................................................
OMMERCIAL
...................CE OF FISH MO
...................
...................
..................
...................
...................
..................
PENSATION CL
N MEASURES ...
elopment – in
..................
..................
...................
...................
..................
FISH) .........
...................UALITY STATUS...................
WNING AND NU
9.3) ...........
...................
...................
...................
) ................
...................
...................
...................
...................
...................
...................
...................
...................
...................
...................
L FISHERIES
...................RTALITY THRO
...................
...................
..................
...................
...................
..................
LAIMS ..............................
ndependent efisheries an
.................
.................
..................
..................
.................
.................
..................S ..................................URSERY AREAS
.................
..................
..................
..................
.................
..................
..................
..................
..................
..................
..................
..................
..................
..................
..................
S (CHAPTER
..................OUGH TIDAL
..................
..................
.................
..................
..................
.................
..................
..................
xpert alysis
... III
.... 5
..... 5
..... 6
.... 7
.... 9
..... 9
... 10
... 10 S . 12
.. 14
... 14
... 14
... 19
.. 21
... 21
... 23
... 24
... 24
... 24
... 24
... 24
... 25
... 28
... 28
R
... 29
... 29
... 31
.. 33
... 33
... 33
.. 37
... 37
... 41

A
9
10
APEM Report 4
STATEME
REFEREN
413196 – Swa
ENT OF TRU
NCES ...........
ansea Bay Tida
UTH ...........
..................
al Lagoon hyd
..................
..................
dropower dev
..................
..................
elopment – in
..................
..................
ndependent efisheries an
.................
.................
xpert alysis
.. 42
.. 43
5
1 AUTHORS QUALIFICATIONS
1.1 Nigel Milner
BSc Hons2.1, Zoology, Swansea University College Swansea, 1970. PhD University of East Anglia, 1976. The distribution and toxicity of zinc in juvenile flatfish. (in receipt of NERC Fisheries Research Studentship). Five years (1975‐80) as Research Associate for University of Wales Institute of Science and Technology, Cardiff (UWIST) working on reservoir impacts on salmonid ecology. Joined Welsh Water Authority 1980; led various multidisciplinary environmental teams in water industry and regulators (Welsh Water 1980 ‐ 1979; National Rivers Authority 1979‐1989, Environment Agency 1989 – 2007). Left as Fisheries Science Manager for EA England and Wales. Joined APEM as associate in 2007. Currently honorary Lecturer and Research Fellow at Bangor University, School of Biological Science, Molecular Ecology and Fisheries Genetics Laboratory. Member of Atlantic Salmom Trust Honorary Scientific Advisory Panel. Member of Salmon and Trout Association Science Advisory Panel. Relevant recent projects
Severn Tidal Barrage, responsible for salmonid assessment and impact modelling.
Aberdeen Harbour Development (2008). Impact assessment of quay construction on salmonid passage through estuary and effects on fisheries.
King Street Gas Storage‐Pipelines (2008). Impact assessment of brine discharge on salmonid migration through Mersey estuary and effects on fisheries.
Co‐convener AST conference (York 2010) and workshop (Pitlochry, 2011) on fish and flows, Editor and contributor to various reports Milner et al., 2011) and papers (Milner et al., 2011).
Burbo Bank Extension: migratory salmonid noise risk assessment (2013). Review of salmonid migration in coastal zones and potential for impact from windfarm development.
Celtic Sea Trout Project (2009‐2013) Management Group member and Task leader for Task 7 “Marine ecology, life histories and modelling for Management”. Report in preparation.
Co‐Chair of ICES Working Group on Sea Trout (WKTRUTTA), November 2013), report writing in progress.
Some Publications relevant to Swansea Bay Tidal Lagoon EIA 1. Milner , N.J., Elliott, J.M., Armstrong, J.D., Gardiner, R., Welton, J.S. and Ladle, M. (2003)
The natural control of salmon and trout populations in streams. Fisheries Research 62,11‐125.
2. Milner, N.J. and Evans, R. (2003) The incidence of escaped Irish farmed salmon in English and Welsh rivers. Fisheries Management and Ecology 10, 403‐406.
3. Armstrong, J.D., Kemp, P.S., Kennedy, G.J.A., Ladle, M. and Milner, N.J. (2003) Habitat requirements of Atlantic salmon and brown trout in streams. Fisheries Research 62, 143‐170.
4. Milner, N.J., Karlsson, L., Degerman, E., Jholander, A., MacLean, J.C & Hansen, L‐P. (2006). Sea trout (Salmo trutta L.) in Atlantic salmon (Salmo salar L.) rivers in
6
Scandinavia and Europe. In G.S. Harris and N.J. Milner. Sea Trout: Biology, Conservation and Management. Proceedings of First International Sea Trout Symposium, Cardiff, July 2004. Blackwell Scientific Publications, Oxford, 139‐153.
5. Milner, N.J., Harris, G.S., Gargan, P., Beveridge, M., Pawson, M.G., Walker, A. and Whelan,K. (2006) Perspectives on sea trout science and management In G.S. Harris and N.J. Milner. Sea Trout: Biology, Conservation and Management. Proceedings of First International Sea Trout Symposium, Cardiff, July 2004. Blackwell Scientific Publications, Oxford, 480‐489.
6. Evans, M., Milner, N.J. and Aprahamian, M. (2008) Life in Welsh Rivers: Fishes. In: D.D. Williams and C.A. Duigan, (Eds) Rivers of Wales: A Natural Resource of International and Historical Significance, Backhuys Publishers, Leiden.
7. G.S. Harris and N.J. Milner (2006) Sea Trout: Biology, Conservation and Management. Proceedings of First International Sea Trout Symposium, Cardiff, July 2004. Blackwell Scientific Publications, Oxford, 499pp.
8. Milner N.J., Solomon D.J. & Smith G.W. (2012) The role of river flow in the migration of adult Atlantic salmon, Salmo salar, through estuaries and rivers. Fisheries Management and Ecology 19, 537‐547.
9. Milner N.J., Cowx, I.G & Whelan, K.F. (2012) Salmonids and flows: a perspective on the state of the science and its application. Fisheries Management and Ecology 19, 445‐450.
1.2 Nicola Teague (nee O’Keeffe)
Nicola has a bachelors degree in Zoology from the University of Sheffield and achieved a distinction in her MSc in Marine Resource Development and Protection from Herriot‐Watt University. She is a Chartered Biologist with the Society of Biology as well as being a member. She is also a member of the Institute of Fisheries Management and is actively involved with the Institute being both on its Council and Training committees as well as deputising on the Executive Committee on behalf of APEM Managing Director, Keith Hendry. Nicola is an Associate Director at APEM Aquatic Scientists and heads up the Marine Ecology and Fisheries Engineering teams. She has specialised in migratory fish and fisheries engineering throughout her career and has been actively involved in the tidal power generation sector. She was lead migratory and estuarine fisheries advisor to DECC for the Severn Tidal Power study and lead marine ecology advisor to Peel Energy for the Mersey Tidal Power study. One of her specialist skills is the assessment of fish passage through hydropower turbines which has included the development of a bespoke compound mortality model for the passage of fish through the proposed Severn tidal power turbines.
7
2 SUMMARY OF KEY POINTS
1. Due to extensive movement of migratory salmonids along the South Wales coast
there is potential for populations of more rivers to be impacted than currently
included within the far‐field zone.
2. Migratory salmonids could approach from any seaward direction rather than the
currently predominantly assumed oceanic westerly direction.
3. The fish characterisation could be improved by looking at longer term data and
referring to conservation limit assessment information.
4. The main migratory periods reported are questionable for adult salmonids in general
and more crucially for sea trout which may be present within the area for feeding
throughout the year, if their principal prey species are present.
5. There are large elements of uncertainty in the modelling approaches and their input
data which are not currently sufficiently discussed or their potential implications
acknowledged.
6. The presence of the Tawe barrage and its potential influence on migratory fish
behaviour has not been discussed or incorporated into the encounter modelling
which could result in underestimates of delay to passage and the potential for
multiple returns to the estuarine/coastal environment before entering freshwater.
7. There does not appear to be any mechanism for incorporating environmental
conditions in particular river flows into the encounter modelling which may be an
important factor in relation to passage past the Tawe barrage.
8. The fish size distribution data used for the encounter model and STRIKER estimates
are not fully appropriate to the local river populations of adult salmon and sea trout.
9. The fish turbine passage modelling is currently based on a deterministic model
however, due to the uncertainty in input parameters a stochastic model may be
more appropriate to allow interpretation of the potential range of model outputs.
10. There should be some acknowledgement within the assessment that the turbine
passage compound mortality estimates cannot be considered as complete mortality
rates as it is not possible to quantify a number of the impacts such as predation risk
and sluice passage.
11. It is understood that the EIA in general has adopted a Rochdale Envelope approach. It s not clear however, how a worse case approach has been implemented for fish.
12. Population effects are not estimated. Even if direct fish number losses (at least from
turbine M) are small, there are additional potential mortality effects (e.g.predation).
The eventual effects on populations would give added confidence about the impacts.
There is precedent for this for salmon on the DECC Severn Tidal Power SEA study.
13. In absence of population modelling. Life time egg deposition offers an improved way
to estimate impacts giving a more realistic representation of the importance of
larger fish.

8
14. Given the inherent uncertainty in fully quantitatively assessing impacts, qualitative
magnitudes of effects focusing on effects upon the species or population may be
more appropriate than the quantitative thresholds used within the assessment.
15. There is discussion in the assessment chapter regarding modelling impacts upon
Wye and Usk fish however, there is no presentation of the modelling outputs and no
discussion of this further within the assessment.
16. The summary tables of impacts are incomplete for increased predation and
entrainment and injury from turbines. It is not therefore possible to comment on the
final assessment conclusions at this time.
17. There is limited discussion of mitigation measures within chapter 9, the main one for
fish being the use of an Acoustic Fish Deterrent. There is however, some uncertainty
regarding the proven effectiveness of this technique for this specific application.
18. There are further potential mitigation options that could be considered which are
discussed within this document.
19. In the absence of monitoring methods being provided within the assessment, some
potential options are discussed within this document.
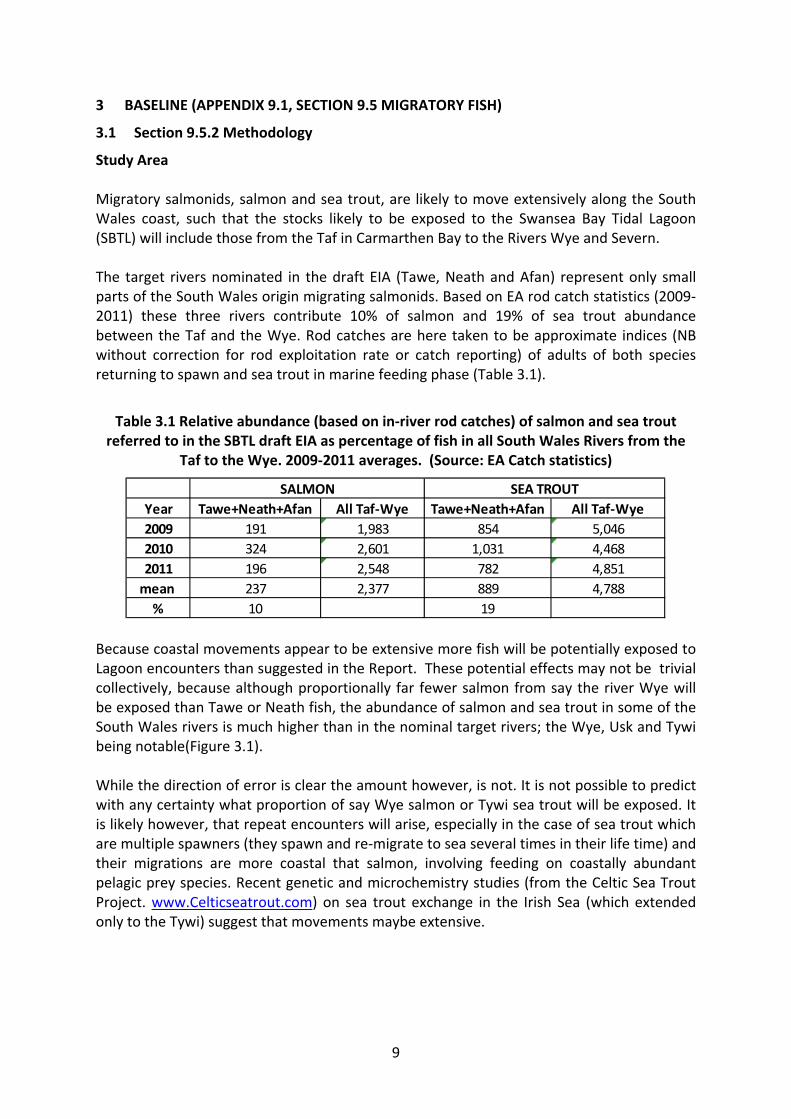
9
3 BASELINE (APPENDIX 9.1, SECTION 9.5 MIGRATORY FISH)
3.1 Section 9.5.2 Methodology
Study Area Migratory salmonids, salmon and sea trout, are likely to move extensively along the South Wales coast, such that the stocks likely to be exposed to the Swansea Bay Tidal Lagoon (SBTL) will include those from the Taf in Carmarthen Bay to the Rivers Wye and Severn. The target rivers nominated in the draft EIA (Tawe, Neath and Afan) represent only small parts of the South Wales origin migrating salmonids. Based on EA rod catch statistics (2009‐2011) these three rivers contribute 10% of salmon and 19% of sea trout abundance between the Taf and the Wye. Rod catches are here taken to be approximate indices (NB without correction for rod exploitation rate or catch reporting) of adults of both species returning to spawn and sea trout in marine feeding phase (Table 3.1).
Table 3.1 Relative abundance (based on in‐river rod catches) of salmon and sea trout referred to in the SBTL draft EIA as percentage of fish in all South Wales Rivers from the
Taf to the Wye. 2009‐2011 averages. (Source: EA Catch statistics)
Because coastal movements appear to be extensive more fish will be potentially exposed to Lagoon encounters than suggested in the Report. These potential effects may not be trivial collectively, because although proportionally far fewer salmon from say the river Wye will be exposed than Tawe or Neath fish, the abundance of salmon and sea trout in some of the South Wales rivers is much higher than in the nominal target rivers; the Wye, Usk and Tywi being notable(Figure 3.1). While the direction of error is clear the amount however, is not. It is not possible to predict with any certainty what proportion of say Wye salmon or Tywi sea trout will be exposed. It is likely however, that repeat encounters will arise, especially in the case of sea trout which are multiple spawners (they spawn and re‐migrate to sea several times in their life time) and their migrations are more coastal that salmon, involving feeding on coastally abundant pelagic prey species. Recent genetic and microchemistry studies (from the Celtic Sea Trout Project. www.Celticseatrout.com) on sea trout exchange in the Irish Sea (which extended only to the Tywi) suggest that movements maybe extensive.
Year Tawe+Neath+Afan All Taf‐Wye Tawe+Neath+Afan All Taf‐Wye
2009 191 1,983 854 5,046
2010 324 2,601 1,031 4,468
2011 196 2,548 782 4,851
mean 237 2,377 889 4,788
% 10 19
SALMON SEA TROUT
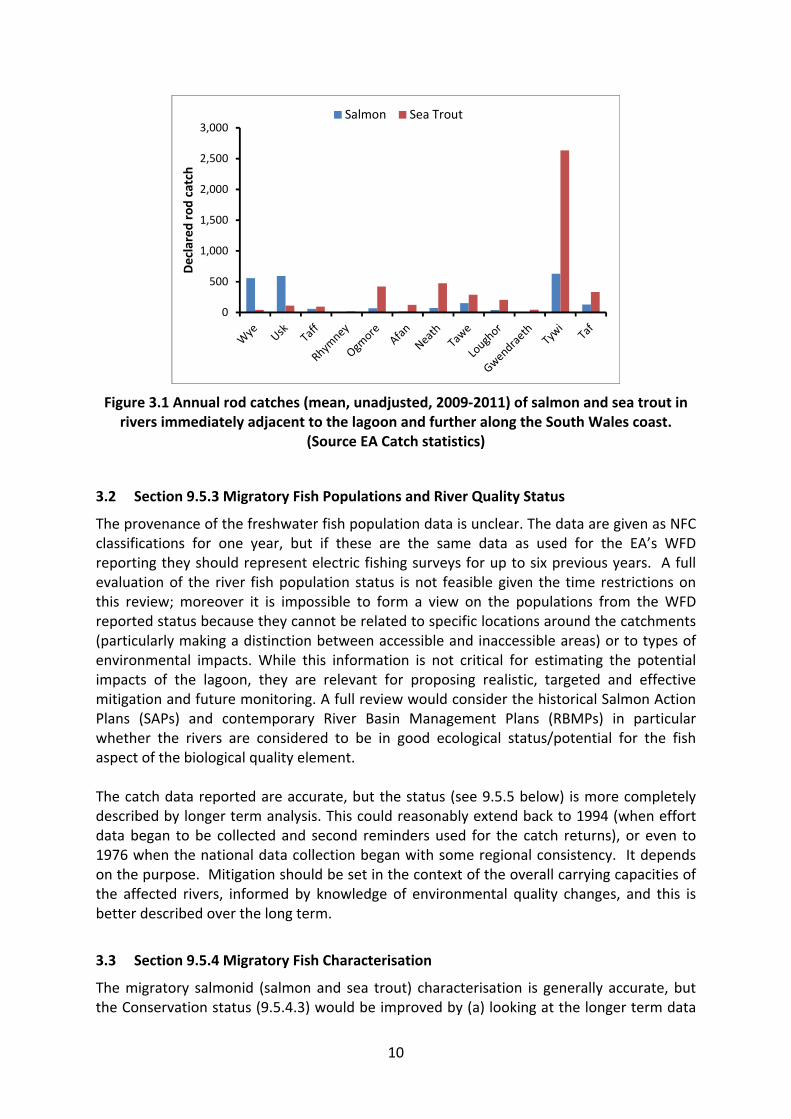
10
Figure 3.1 Annual rod catches (mean, unadjusted, 2009‐2011) of salmon and sea trout in rivers immediately adjacent to the lagoon and further along the South Wales coast.
(Source EA Catch statistics)
3.2 Section 9.5.3 Migratory Fish Populations and River Quality Status
The provenance of the freshwater fish population data is unclear. The data are given as NFC classifications for one year, but if these are the same data as used for the EA’s WFD reporting they should represent electric fishing surveys for up to six previous years. A full evaluation of the river fish population status is not feasible given the time restrictions on this review; moreover it is impossible to form a view on the populations from the WFD reported status because they cannot be related to specific locations around the catchments (particularly making a distinction between accessible and inaccessible areas) or to types of environmental impacts. While this information is not critical for estimating the potential impacts of the lagoon, they are relevant for proposing realistic, targeted and effective mitigation and future monitoring. A full review would consider the historical Salmon Action Plans (SAPs) and contemporary River Basin Management Plans (RBMPs) in particular whether the rivers are considered to be in good ecological status/potential for the fish aspect of the biological quality element. The catch data reported are accurate, but the status (see 9.5.5 below) is more completely described by longer term analysis. This could reasonably extend back to 1994 (when effort data began to be collected and second reminders used for the catch returns), or even to 1976 when the national data collection began with some regional consistency. It depends on the purpose. Mitigation should be set in the context of the overall carrying capacities of the affected rivers, informed by knowledge of environmental quality changes, and this is better described over the long term.
3.3 Section 9.5.4 Migratory Fish Characterisation
The migratory salmonid (salmon and sea trout) characterisation is generally accurate, but the Conservation status (9.5.4.3) would be improved by (a) looking at the longer term data
0
500
1,000
1,500
2,000
2,500
3,000
Declared rod catch
Salmon Sea Trout
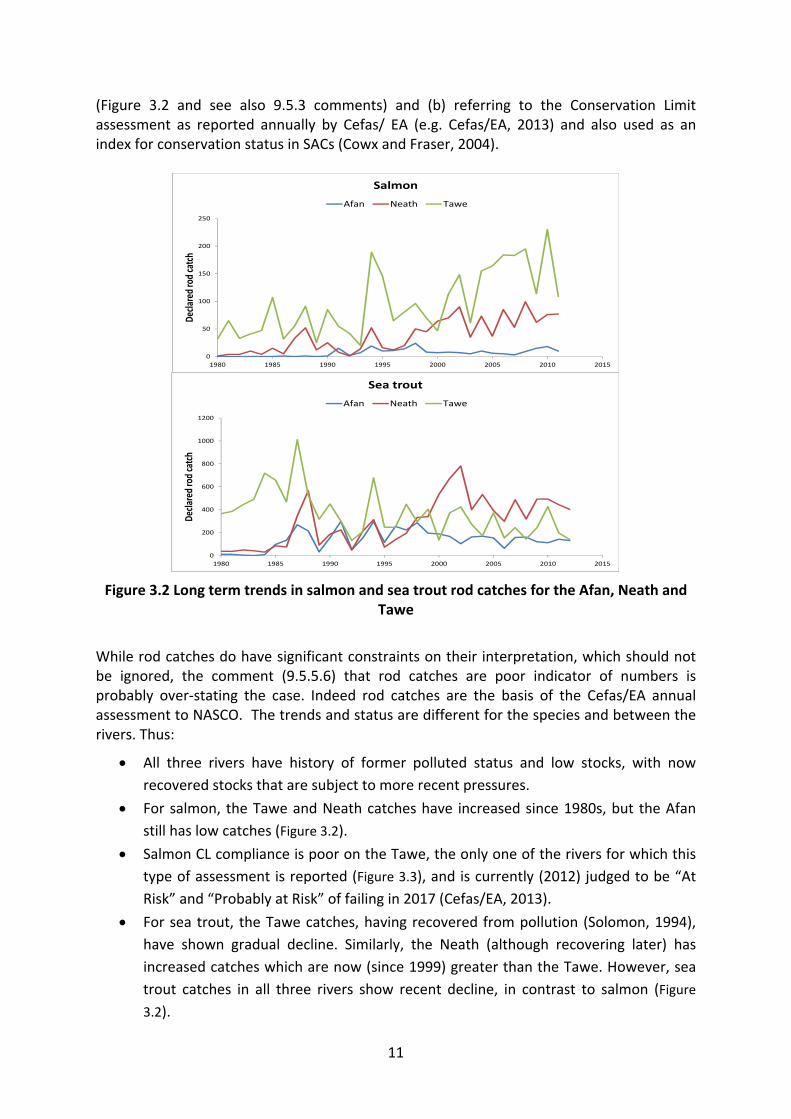
11
(Figure 3.2 and see also 9.5.3 comments) and (b) referring to the Conservation Limit assessment as reported annually by Cefas/ EA (e.g. Cefas/EA, 2013) and also used as an index for conservation status in SACs (Cowx and Fraser, 2004).
Figure 3.2 Long term trends in salmon and sea trout rod catches for the Afan, Neath and Tawe
While rod catches do have significant constraints on their interpretation, which should not be ignored, the comment (9.5.5.6) that rod catches are poor indicator of numbers is probably over‐stating the case. Indeed rod catches are the basis of the Cefas/EA annual assessment to NASCO. The trends and status are different for the species and between the rivers. Thus:
All three rivers have history of former polluted status and low stocks, with now
recovered stocks that are subject to more recent pressures.
For salmon, the Tawe and Neath catches have increased since 1980s, but the Afan
still has low catches (Figure 3.2).
Salmon CL compliance is poor on the Tawe, the only one of the rivers for which this
type of assessment is reported (Figure 3.3), and is currently (2012) judged to be “At
Risk” and “Probably at Risk” of failing in 2017 (Cefas/EA, 2013).
For sea trout, the Tawe catches, having recovered from pollution (Solomon, 1994),
have shown gradual decline. Similarly, the Neath (although recovering later) has
increased catches which are now (since 1999) greater than the Tawe. However, sea
trout catches in all three rivers show recent decline, in contrast to salmon (Figure
3.2).
0
50
100
150
200
250
1980 1985 1990 1995 2000 2005 2010 2015
Declared rod catch
Salmon
Afan Neath Tawe
0
200
400
600
800
1000
1200
1980 1985 1990 1995 2000 2005 2010 2015
Declared rod catch
Sea trout
Afan Neath Tawe

Figushow
20%ile
These rthe likethat all Figure 3comprocomme
3.4 Se
Table 9receiveperiodscan be angling for the about 3be presSea tropassed River Tyto be .1sea troube preseel and
ure 3.3 Salmws the Conse observed e
river‐specifiely cumulatthree river3.1) have caomised by ents on impa
ection 9.5.5
9.13 (p39 bd. Is this s appear to characterisseason (e.gTywi and 1
3 weeks aftsent in coasout have a their first pywi 47% of 1+ maidens ut in the Irisent in coas sprat) are
mon Conservservation Legg deposit
c conservative effects rs (and otheapacity for ithe projectact).
5 Presence
baseline repthe origin be shown ased from thg. March 3r
1st April to er river enttal waters fhigh propopost‐smolt returning sor older (Hish Sea feedtal waters tpresent.
vation Limiimit (total etion and the
tion and enof the scheers that miincrease in t (albeit pr
of Migrato
port) is a lof tables 9as Septembhe rod catcrd to Octobe17th Octobtry (Davidsofor about a rtion of fiwinter at ssea trout adHarris 2002)d and growthroughout
12
it Complianegg deposite yellow bathat trend.
nvironmenteme and mght be imptheir stocksrobably at
ry Fish Spec
ittle unclea9.7 and 9.8ber to Januach data (Figer 17th for Wber for the on et al., 19month priosh of age .sea before fdult sample. Their exa
w during winthe year, if
nce assessmtion), the band is the 9.
al observatitigation op
pacted in Sos and fishernotionally
cies, Spawn
ar for migr8 in the EIAary, which isgure 3.4), wWye and Uothers). Sa996; Sheltoor to the sta1+ (and sofirst return ed in the roact location nter monthsf their princ
ment for thelack line is t5% probabi
tions are reptions (see outh Wales,ries which c“Minor” le
ning and Nu
atory salmoA draft? Ths not correcwhich are csk; March 2almon are n, 2001); thart of recordme at .2+);to the rived catch (19in the wints (CSTP, uncipal prey sp
e Tawe. Redthe trend inility bound
elevant to abelow). It , see Table could potenevel, but s
ursery Area
onids on the main mct. Adult pconstrained2th to Octocaught on herefore fisded seasona; that is thers. On the996‐98) werter is unknopublished) pecies (mai
d line n the aries of
ssessing is likely 3.1 and
ntially be ee later
s
he copy migratory presence d by the ober 17th average sh might al catch. ey have e nearby re found own, but and will nly sand
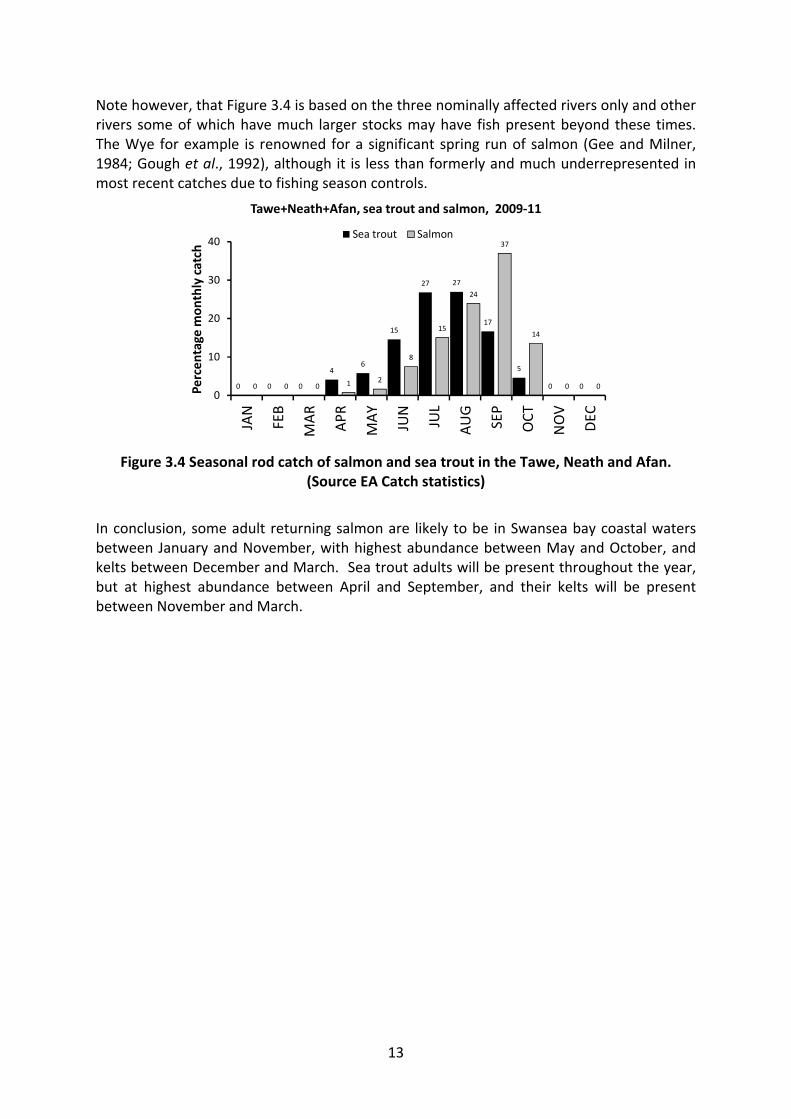
13
Note however, that Figure 3.4 is based on the three nominally affected rivers only and other rivers some of which have much larger stocks may have fish present beyond these times. The Wye for example is renowned for a significant spring run of salmon (Gee and Milner, 1984; Gough et al., 1992), although it is less than formerly and much underrepresented in most recent catches due to fishing season controls.
Figure 3.4 Seasonal rod catch of salmon and sea trout in the Tawe, Neath and Afan. (Source EA Catch statistics)
In conclusion, some adult returning salmon are likely to be in Swansea bay coastal waters between January and November, with highest abundance between May and October, and kelts between December and March. Sea trout adults will be present throughout the year, but at highest abundance between April and September, and their kelts will be present between November and March.
0 0 0
46
15
27 27
17
5
0 00 0 0 1 2
8
15
24
37
14
0 0
0
10
20
30
40JAN
FEB
MAR
APR
MAY
JUN
JUL
AUG
SEP
OCT
NOV
DEC
Percentage m
onthly catch
Tawe+Neath+Afan, sea trout and salmon, 2009‐11
Sea trout Salmon
14
4 FISH TURBINE ENCOUNTER MODELLING (APPENDIX 9.3)
4.1 Model appropriateness and general method
Fish encounter with a tidal power scheme is the single biggest factor which sets a tidal scheme apart from a freshwater hydro scheme and likely represents both the greatest determinant of predicting resultant mortality and highest factor of uncertainty within the assessment process. This factor is unique to the individual site and cannot be inferred from any other existing schemes. It will be dependent upon the site location and conditions, the fish populations that may pass through the area and the design and operation of the scheme itself. Modelling through the combination of a hydrodynamic model of the site and species specific Individual Based Model (IBM) is the only means of predicting fish encounter prior to construction. As with any modelling approach however, it is based on theoretical information often backed up with limited or uncertain data and as such is fraught with uncertainty and open to challenge and criticism of in particular the input data. Although uncertainty in the model technique and calibration are discussed in the upfront sections of this appendix, there is limited discussion of the uncertainty and limitations of the input data in particular and how these may have influenced the model outputs and ultimately the predicted impacts from turbine passage. There is no mention in this appendix of the presence of the Tawe barrage and how it may influence the behaviour of migratory fish or consideration or reference to the various studies that have been undertaken since it was constructed on this issue. It is not clear from the appendix whether the release point of fish within the Tawe was above or below the barrage but it is assumed to be below as no mention has been made of the delay of entry and exit resulting from the impoundment structure. The lack of consideration of this key factor on fish behaviour upon entering and exiting the Tawe may have affected the model running and resultant outputs which could potentially be falsifying the results of the assessment in either direction. It is not clear from the reporting as to what rivers are included within the modelling and the final turbine passes within the overview results. All of the video capture figures appear to be for the Tawe only. The appendix would benefit from clearer discussion on the rivers included.
4.2 Model parameterisation and calibration
Salmon smolt model The input parameters for salmon smolts appear to be predominantly based on a tracking study reported by Moore et al., 1998 undertaken in Southampton Water. Given the potential impacts of the Tawe barrage upon salmon smolt movement into and within the estuary in particular however, it is recommended that data from a more locally based study is considered to determine if differing input parameters have any bearing on the outputs of the model. A suitable study would be that reported by Moore in 1997 on ‘The movements of Atlantic salmon and sea trout smolts in the impounded estuary of the R. Tawe, South Wales’. Part of the study includes reporting on a single salmon smolt 145 mm in length which was tracked both above the impoundment and below it through the lower estuary and into Swansea Bay for a period of 6 hours and 8 minutes over a distance of 12.6Km. The
15
track shown in Figure 6 within the report shows time of transit and route which appears to move close along the wall of the proposed barrage. Oranges were also released at the time of tracking the individual to represent random drifting particles. It is reported that tracking the oranges had to be abandoned to keep up with the smolt. Speed over the ground was reported as 57 cms‐1 which could be compared with data in the hydrodynamic model to give an indication of swimming speed for this individual. The Moore (1997) study also indicated that due to delays resulting from the Tawe Barrage entry into the lower estuary can be during any state of tide as smolts are largely unable to detect the state of tide below the barrage unless it is overtopping. It may therefore be necessary to look at other release times to determine if this factor has any bearing on the number of passes into the barrage. Although only for a single individual the information presented from this study could provide useful local input parameters for the model. Adult salmon model The report assumes rather strong directional swimming towards natal rivers as soon as they enter coastal waters. At some stage immediately prior to eventual river entry, that must be so. However, there is strong evidence for temporary straying by salmon, in addition to the true (reproductive) straying referred to by Quinn (1993) and others and noted in this Report. The key reference (Davidsen, et al.,2013) describes behaviour of fish well inside a fiord system with a comparatively constrained coast. In the open coastal zone, more representative of Gower and Swansea, one might expect salmon to make more extensive search patterns, influenced in part by tidal direction. This has been shown for salmon on the Aberdeen coast (Hawkins et al., 1979). Conventional tagging (Swain, 1982) and micro‐tagging (Jones, 1994) of salmon in the South Wales rivers have shown extensive recaptures of non‐natal fish in rivers along the North Bristol Channel coast. The strong tidal currents of the Bristol Channel may enhance this effect. The recapture of tagged smolts from the rivers Usk, Wye and Severn (Swain, 1982) indicate that around 4% of recaptured fish in the vicinity of their home river were recorded in the non‐tidal reaches of non‐home rivers and a further 48% in tidal waters of the Severn estuary and Bristol Channel. In addition to ‘overshooting’ to nearby rivers, a number were also recaptured in the River Parrett on the south coast of the Bristol channel. It is unknown whether these fish would have later returned to their home river had they not been captured or would have remained as ‘stray’ fish. Jones (1994) undertook a review of the microtagging programme of salmon and sea trout in Wales between 1984 and 1993 investigating the return of tagged stocked salmon in particular. The review determined that some returning adults were regularly captured in non‐natal rivers both east and west of their natal river. Tagged smolts released in the Afan were recorded to the East in the neighbouring Ogmore. Those in the Ebbw were recorded in its westerly neighbouring Taff. Loughor, Ogmore, Rhymney, Taff and Tawe releases were recorded to the east in the Severn estuary fishery. In addition to the Severn estuary fishery Tawe fish were recorded in the eastern rivers Ogmore and Usk. As above it is not possible to say whether these fish would have returned to their natal rivers had they not been captured or would have remained ‘strays’. There is a possibility however, that they indicate that adult salmon could be presented to the Tawe and other impacted rivers not just from the West as modelled but also from the East. Additionally, it further indicates that fish from other rivers
16
than those identified within the assessment may also interact with the scheme and potentially be impacted by it. There is however, still much uncertainty over return migration behaviour to South wales coast and regional behaviours are likely to vary depending upon how salmon return from oceanic residence (Malcolm et al., 2010). Nevertheless, there is a good case for proposing that coastal wandering is more than assumed in the report and from that come two consequences: (1) Tawe and Neath fish might be expected to experience more repeat turbine encounters, and (2) the salmon exposed to the scheme may include fish from other rivers, similarly making coastal migrations.
Sea trout smolts
There are no detailed notes on the calibration model input parameters for sea trout smolts
within this appendix. There are however, brief output notes on p 28. Again the Moore
(1997) study may provide insight for the calibration for this species life stage. A single sea
trout smolt was tracked as part of the study both above and below the barrage. The smolt
was detected moving through the barrage lock into the lower estuary where the track was
subsequently lost for a period of 4 days. It was then again detected below the barrage
before moving back into the lock and finally detected above the barrage for the last time.
The 4 day period over which it was not detected in the lower estuary before returning
suggests that at least some sea trout smolts could remain in the estuary and coastal
environment for a prolonged period and make returns into the freshwater environment.
This behaviour could have a significant impact upon the risk of the barrage and its turbine
structures to this species lifestage which is otherwise assumed to swim continuously
towards the ocean.
The output notes also indicate that a 4 hour release time each side of spring high tide was
adopted. The Moore (1997) study however, suggests that they may in fact enter the lower
estuary during any state of the tide due to the presence of the Tawe barrage.
Adult sea trout
There are greater concerns over the post‐smolt sea trout encounter modelling due to their
use of the estuarine and coastal environment as discussed below.
Sea trout will be feeding in the area for much of the year (including the winter, see above, if suitable prey species are present) and as such repeat encounters are therefore likely. The model currently assumes that as with salmon they will only appear in the area prior to entry into the freshwater system and will make directed movement from the oceanic environment into the estuary and ultimately river. This is however, less likely to be the case for sea trout which if possible needs to be represented within the model to give a more realistic worse case of impacts upon the population.
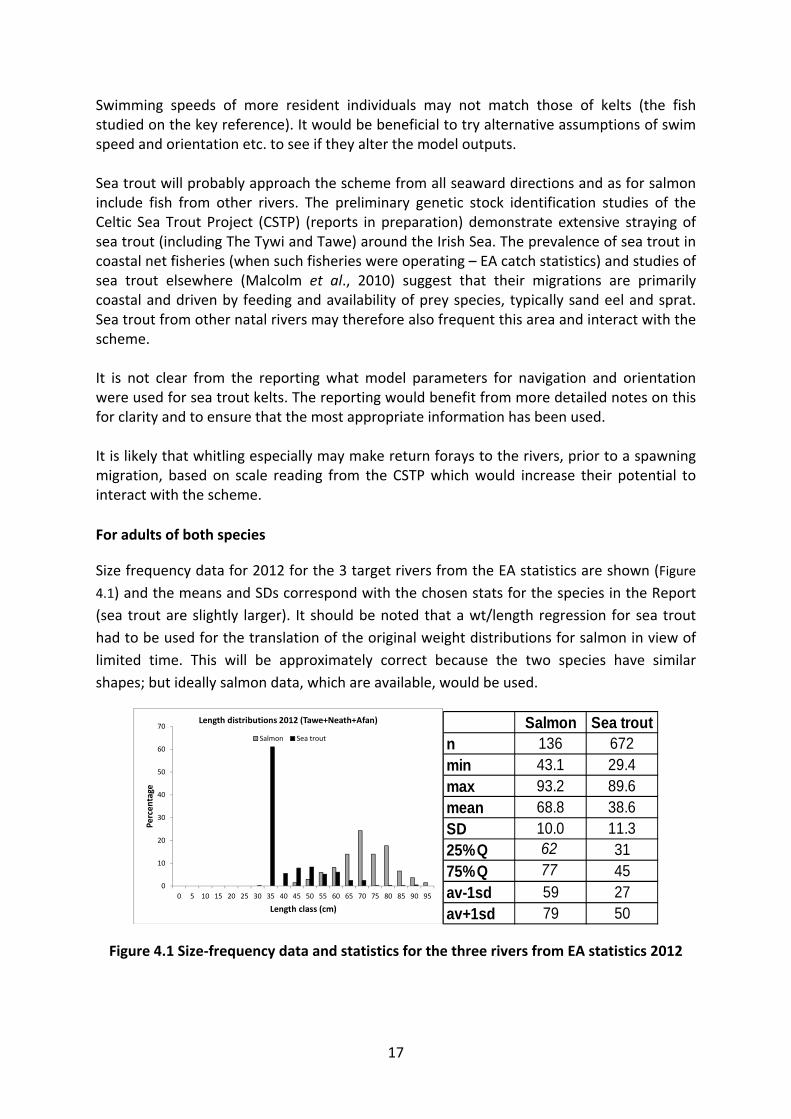
17
Swimming speeds of more resident individuals may not match those of kelts (the fish studied on the key reference). It would be beneficial to try alternative assumptions of swim speed and orientation etc. to see if they alter the model outputs. Sea trout will probably approach the scheme from all seaward directions and as for salmon include fish from other rivers. The preliminary genetic stock identification studies of the Celtic Sea Trout Project (CSTP) (reports in preparation) demonstrate extensive straying of sea trout (including The Tywi and Tawe) around the Irish Sea. The prevalence of sea trout in coastal net fisheries (when such fisheries were operating – EA catch statistics) and studies of sea trout elsewhere (Malcolm et al., 2010) suggest that their migrations are primarily coastal and driven by feeding and availability of prey species, typically sand eel and sprat. Sea trout from other natal rivers may therefore also frequent this area and interact with the scheme. It is not clear from the reporting what model parameters for navigation and orientation were used for sea trout kelts. The reporting would benefit from more detailed notes on this for clarity and to ensure that the most appropriate information has been used. It is likely that whitling especially may make return forays to the rivers, prior to a spawning migration, based on scale reading from the CSTP which would increase their potential to interact with the scheme.
For adults of both species
Size frequency data for 2012 for the 3 target rivers from the EA statistics are shown (Figure
4.1) and the means and SDs correspond with the chosen stats for the species in the Report
(sea trout are slightly larger). It should be noted that a wt/length regression for sea trout
had to be used for the translation of the original weight distributions for salmon in view of
limited time. This will be approximately correct because the two species have similar
shapes; but ideally salmon data, which are available, would be used.
Figure 4.1 Size‐frequency data and statistics for the three rivers from EA statistics 2012
0
10
20
30
40
50
60
70
0 5 10 15 20 25 30 35 40 45 50 55 60 65 70 75 80 85 90 95
Percentage
Length class (cm)
Length distributions 2012 (Tawe+Neath+Afan)
Salmon Sea trout
Salmon Sea troutn 136 672min 43.1 29.4max 93.2 89.6mean 68.8 38.6SD 10.0 11.325%Q 62 3175%Q 77 45av-1sd 59 27av+1sd 79 50
18
It would be informative to model contrasting groups of small and large salmon and sea trout to see if there is any effect of swimming speed if this is not already included in the modelling approach (Figure 4.1). There may be an impact of temperature upon the model results in particular resulting from likely lower swimming speeds in spring and winter. It would be good to include this factor within the modelling if it is not already. In Report Table 5 adult salmon “encounters” is 603 vs 2,044 for sea trout. It is not clear what creates this difference in outputs within the model. Also and related, sea trout turbine passes are proportionally even higher than salmon (3,906 vs 997) compared with encounters. Is this a function of size and swimming speed, and /or some imposed behaviour in the model? The ratios (seatrout/salmon) of passes and encounters are close to the relative abundance of the two species (if the catches can be taken as indices of abundance (see Table 1 and text above). But given their migratory behaviours it is likely that sea trout will be disproportionately prevalent in the area (to their true abundance), and thus even higher proportionate lagoon encounters and turbine passes might be expected. There does not appear to be any mechanism of factoring environmental conditions in to the model such as river flows. This condition is likely to influence time of entry and potentially residence time and movement within the estuary and bay especially due to the presence of the Tawe barrage which is known to cause delay to river entry. Mee et al. (1996) determined from tracking studies of adult salmon in the Tawe estuary in 1993 and 1994 that individuals were only detected traversing the barrage at flows between 1.9 and 9.6 m3s‐1. Over the two study years of the 81 adult salmon tracked 38 (46.9%) were last detected in the estuary and were not observed to pass the barrage. Of the 46 sea trout adults tracked 15 (32.6%) were last detected in the estuary. Those fish that did traverse the barrage took between 8 days and 15 weeks to do so. The 64 fish attempting to pass the barrage made a total of 222 approaches with 41 fish succeeding. Russell et al. (1998) reported on a tracking study of adult salmon in the Tawe estuary in relation to the barrage. A total of 68% of the salmon adults successfully tracked and observed to approach the barrage were not recorded as passing upstream within the period of tag life (3 to 35 days) indicating that they moved back out of the estuary or away from the sonar buoys. A study of the movement of adult Atlantic salmon in the Usk estuary tracked 56 adult salmon (Aprahamian et al., 1998). 23 of the fish moved into freshwater of which 7 then returned to sea, 20 were recorded migrating out of the estuary and 11 were last detected in the inner estuary although 2 of these were later detected outside of the estuary; one in the Severn Estuary and the other in the River Wye. This study demonstrates that adult salmon upon entering the inner estuary of a river can regularly (over 50% in this study) migrate back out of the estuary. They may therefore come into contact with the scheme multiple times. This behavioural trait does not seem to have been factored into the model.
Attraction to turbines during generation (both species)
Regarding the effect of freshwater flow per se as an attractant to migrating salmon entering
rivers from the sea, the evidence is usually confounded by the likely role of chemical cues
19
(e.g. pheromonal or geochemical origin). Thorstad et al.(2003) reported that freshwater HEP
discharge into a Norwegian fiord had minimal effect on salmon homing to a nearby river. It
is difficult however, to extrapolate this result to the Swansea Bay situation because the
environment and local topography are very different. Moreover the salinity of the
generating flow is predicted to be virtually the same as the sea, so this mechanism is
unlikely be a problem. While chemical attractants are undoubtedly important cues for
coastal and in‐river orientation, the roles of water volume flow, turbulence and velocity
should not be forgotten. These hydraulic variables are important and in rivers HEP releases
have been demonstrated frequently to attract salmon and cause significant migration delays
(Thorstad et al., 2008), with salmon being preferentially attracted to areas of high velocity
(Karpinnen et al., 2004). The Swansea Bay lagoon ebb generating discharge might therefore
present locally important attraction to migratory fish and cause deviation from a migration
route located by chemical cues. This effect will be related to the size of generating flow, its
configuration and attenuation in the sea, which will be partly influenced by the tidal cycle.
It is not clear from the reporting what determined the olfaction strength upon release. In
reality this is likely to alter seasonally in particular in relation to river discharge. Changes in
olfaction strength may alter the navigation time and route made by adult salmonids
returning to their natal river and could influence the potential for them to pass into the
lagoon.
4.3 Model outputs and conclusions
Were re‐modelling to be undertaken on the basis of some or all of the points detailed above then this is likely to result in changes to the modelling results in the following ways:
Adult salmon and sea trout populations from other Rivers along the Welsh coast may come into contact with the scheme and potentially be impacted by it increasing the number of rivers to be assessed.
As a result of ‘straying’ salmon and particularly sea trout adults may approach the scheme from potentially any seaward direction rather than just the west which is the situation currently modelled. This could result in changes to the model outputs in either direction.
Sea trout are likely to be resident within the area for longer periods than currently modelled and as such have greater potential to interact with the scheme.
The influence of Tawe barrage is likely to result in delayed adult entry into the freshwater environment and potentially increased ‘straying’ back into the estuary and coastal environment. It may also result in random entry into the estuary in relation to tidal state. These factors if incorporated into the model may influence the outputs.
Factoring environmental conditions into the model in particular in relation to passage over the Tawe barrage may influence the outputs.

20
Amending the input parameters for salmon and sea trout smolts from alternative local tracking studies may influence their route of passage within the Bay.
Incorporating different swimming speeds in relation to size frequency and environmental conditions in particular temperature in to the model may influence the rate and route of passage through the Bay.
21
5 FISH TURBINE PASSAGE MODELLING (APPENDIX 9.4)
5.1 Model appropriateness and general method
The STRIKER fish turbine passage modelling approach adopted within this assessment is generally an appropriate technique for predicting quantitative estimates of fish mortality for a tidal power scheme. It is a similar modelling approach based on the original Von Raben method to that used for other tidal power scheme assessments including the operating Annapolis Royal development and the DECC Severn Tidal Power Scheme study options. Specific comments regarding the model parameters and setup are discussed in detail below. Other relevant studies Within the introduction, studies in relation to tidal barrages are discussed and a list of references given. Studies undertaken for DECC in relation to the Severn Tidal Power Scheme however, are notable exceptions which included a review of Fish Passage through Tidal Power Turbines (APEM, 2010a) and the development and running of a stochastic compound mortality model (APEM, 2010a & b). It should be noted that Andy Turnpenny of THA was a peer reviewer for the former document. There is also no mention of the Annapolis Royal scheme in the Bay of Fundy, Canada. Although this scheme only has a single STRAFLO unit it has been generating since 1984 and a number of studies have been undertaken to monitor fish passage and mortality through the turbines, sluices and fishways including pre and post generation population estimates for some species. This site represents the best available information for an operating tidal turbine. It should be noted however, that comparison opportunities are limited as it has a differing turbine type, the turbine was a test unit and is not optimally sized for the physical characteristics of the location and has relatively inefficient operation due to its manual operation. Due to it being the only monitored operating site it does however, warrant some note in the Swansea scheme assessment. Deterministic vs stochastic modelling approaches The model used for the assessment is the STRIKER v.4 Turbine Fish Passage Model which is a version of the model specifically developed for tidal hydropower applications. It is a deterministic model with fixed input parameters per run of the model. A review of blade strike models as part of the Severn Tidal Power Scheme (APEM, 2010a) included consideration of both deterministic and stochastic models and where possible comparison of the results against empirical site specific data. A stochastic model operates within a Monte Carlo platform to enable variation of numerous parameters such as discharge, net head, flow, guide vane angle, fish orientation, fish behaviour, mutilation ratios, fish length and the number of potential passes over a specified range. When run over a series of iterations (usually 1,000) a range of potential predicted mortality rates can be provided to take account of inherent uncertainties and give indications of different levels of probability of a situation occurring (see Figure 5.1). Rather than just obtaining a single mortality probability figure this therefore takes account of inherent uncertainty in the modelling approach and its input parameters to provide a minimum and maximum mortality rate as well as a mean, to give an indication of the range of potential outcomes upon the populations.
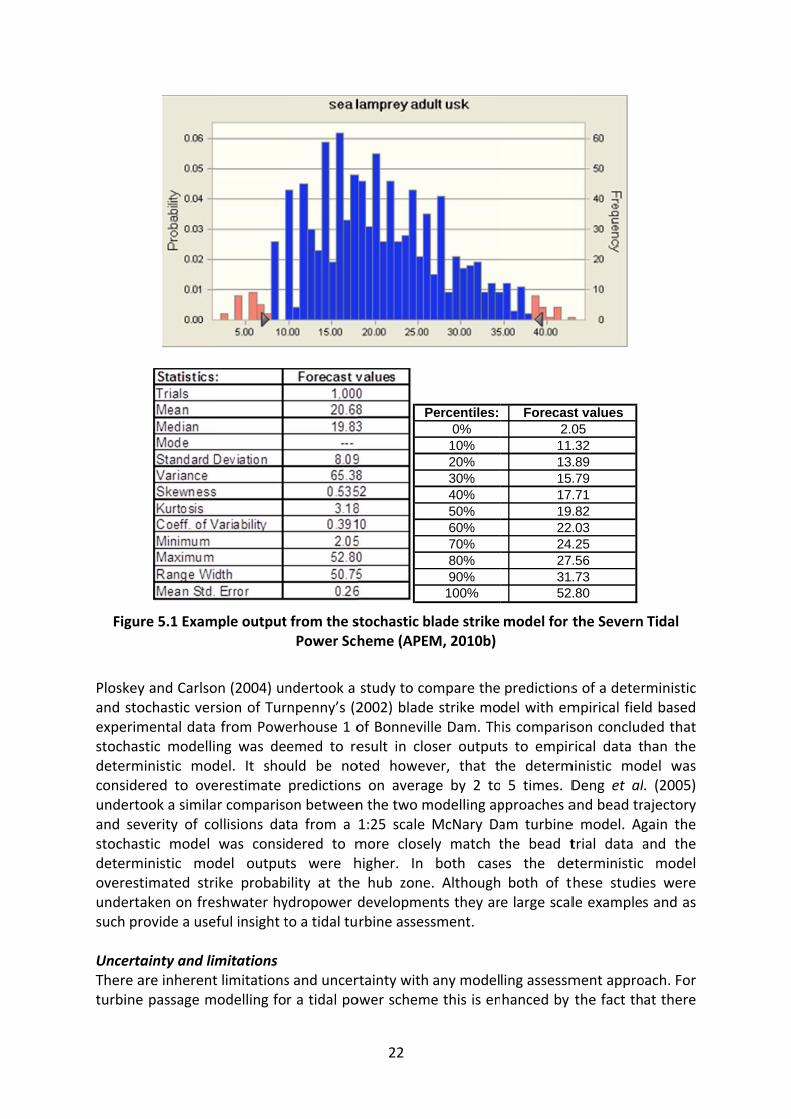
Figur
Ploskeyand stoexperimstochasdetermconsideundertoand sevstochasdetermoverestundertasuch pr UncertaThere aturbine
re 5.1 Exam
y and Carlsoochastic vermental datastic modelliinistic modered to oveook a similaverity of costic model inistic motimated straken on freovide a use
ainty and liare inherent passage m
mple output
on (2004) unrsion of Tura from Poweing was dedel. It shoerestimate ar comparisollisions dawas considel outputike probabeshwater hyeful insight t
imitations t limitationsmodelling fo
t from the sPower Sch
ndertook a rnpenny’s (2erhouse 1 oemed to reuld be nopredictionson betweenta from a dered to mts were hbility at theydropower dto a tidal tu
s and uncerr a tidal po
22
stochastic bheme (APE
study to co2002) bladeof Bonnevilesult in clooted howevs on averagn the two m1:25 scale more closehigher. In e hub zonedevelopmerbine asses
rtainty withower schem
P
blade strike M, 2010b)
ompare thee strike molle Dam. Thoser outputver, that tge by 2 tomodelling apMcNary Da
ely match tboth case
e. Althoughnts they arssment.
any modelme this is en
Percentiles:0%10%20%30%40%50%60%70%80%90%100%
model for t
predictionsdel with emis comparists to empirhe determ 5 times. Dpproaches aam turbinethe bead tes the de both of te large scal
ling assessmhanced by
Forecas2.011131517192224273152
the Severn
s of a determpirical fielson concludrical data tministic modDeng et aland bead tre model. Agtrial data aeterministichese studiele examples
ment approthe fact th
st values05.32.89.79.71.82.03.25.56.73.80
Tidal
rministic d based ded that han the del was . (2005) ajectory gain the and the model
es were s and as
oach. For at there
23
are very few operating schemes and for those that do exist there is little empirical data. The behaviour of migratory fish in estuarine and bay environments is also not well known in addition to their potential interaction with a tidal power impoundment and its turbine and sluice structures. This appendix would benefit from text discussing uncertainty and limitations to allow the outputs of the modelling to be viewed in this context. The use of a more stochastic model to provide a range of potential probabilities would also assist with understanding the uncertainty and potential range of outcomes.
5.2 Mechanical injury
Fish orientation The model assumes random orientation of fish as it passes through the turbine through the use of an average ‘apparent’ length and a factor of 0.67. An alternative method for accounting for this factor would be to have this input value as a variable function within a stochastic version of the model which would result in a range of final outputs. Although providing a range of outputs to assist with the assessment of uncertainty in the modelling approach it is unlikely however, to make a significant difference in the mean model output. Vertical fish position It is unclear from the information provided how the vertical position of the fish as it approaches the turbine and passes the blades has been accounted for within the model. It would appear from the model description however, that it is accounted for. This is a key factor which can be influenced by fish species and life stage and their swimming behaviour. In general higher mortality rates are observed for fish passing at the tip of the blade. It is noted however that the design being assessed here is a Minimum Gap Runner technology which has been documented to reduce the mortality of tip passing fish by up to 3% (Normandeau et al, 2000 cited in Ploskey et al., 2007) compared to a standard Kaplan design. For a horizontal turbine there is also the potential for swirl and as a result random orientation reducing the influence of species specific behaviour. Abrasion, grinding and collision with fixed structures It is agreed that it is not possible to quantitatively assess the potential injury and mortality rates resulting from abrasion, grinding or collision with fixed structures such as the guide vanes and draft piers. Collision with fixed structures however, is considered likely to increase as turbulence within the turbine increased. As the turbine moves away from optimal efficiency such as during flood tide generation the risk of this injury mechanism may therefore increase. The potential for injuries to be sustained may also be increased in a tidal power turbine than a riverine scheme due to the potential for biofouling and a resultant abrasive surface as can be observed at the La Rance scheme.

Figure
5.3 P
The forchange pressurtaken frmodel pthe turb
5.4 Sh
It is notwithin tundertathat theso, this the abs
5.5 Ca
It is agcavitatishould
5.6 P
Althougpassagethat mothe ove
5.7 M
RotatioThere aturbinehoweve
5.2 Evidenc
ressure cha
rmulae useare approp
res were usrom Figure parametersbine units p
hear stress
t specificalthe STRIKEaken by Tue mortality is a suitablence of ded
avitation
reed that ion and thabe minimal
ost Passage
gh not spece effects haortality rateerall assessm
Model techn
on rate appears to s which is rer, just be d
ce of biofouRa
ange
ed within tpriate for aed within th5 within ths in the abseproposed fo
and turbul
ly stated wR model tornpenny etformulae cae techniquedicated CFD
t is not pot if designe.
e Effects
cifically stave not beenes cannot bement of effe
nical input d
be an inconreported as due to a rep
uling and a ance turbine
he STRIKERa study of the assessmis appendixence of sper this devel
ence
within this ao predict mt al., 1992 aalculated fre for predicD modelling.
ossible to qed and oper
ted it woun quantitatie predicted ects.
data
nsistency in67rpm (ma
porting of m
24
resultant ae (photo: N
R model tothis type. Itent. It is asx from Turnecific Compuopment.
appendix wmortality froare howeverom these tcting morta.
uantitativerated efficie
ld appear tively assess from this c
n the documaximum) onmaximum an
brasive surNicola Teagu
o predict mt is not howsumed thatpenny, 199utational Fl
hat formulaom shear ster mentionrials was uslity from th
ly predict mently that m
that potentsed within tcause but sh
ment as to tn page 5 andnd average.
rface on theue)
mortality rawever, cleat the exposu8 which areuid Dynami
ae or othertress. The eed and as sed (Turnpehis factor of
mortality ramortality rat
tial mortalithe STRIKER hould be ac
the rotationd 60rpm onIt is genera
e draft tube
ates from pr what accure pressure again appic (CFD) pro
r values weexperimentsuch it is aenny et al., 2f turbine pa
ates resultites from th
ty rates froR model. It iscknowledge
n rate (rpmn page 18. Tally conside
e of a La
pressure limation res were ropriate ofiles for
ere used tal trials assumed 2000). If ssage in
ng from his cause
om post s agreed d within
m) of the This may red that
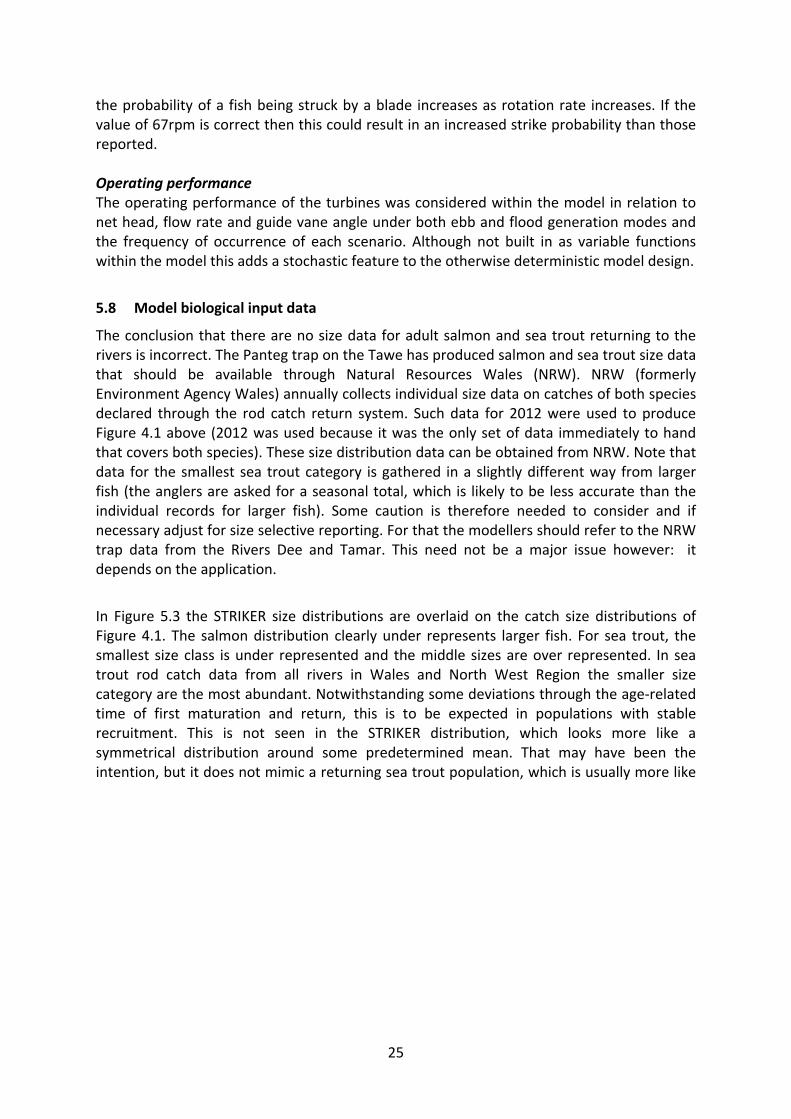
25
the probability of a fish being struck by a blade increases as rotation rate increases. If the value of 67rpm is correct then this could result in an increased strike probability than those reported. Operating performance The operating performance of the turbines was considered within the model in relation to net head, flow rate and guide vane angle under both ebb and flood generation modes and the frequency of occurrence of each scenario. Although not built in as variable functions within the model this adds a stochastic feature to the otherwise deterministic model design.
5.8 Model biological input data
The conclusion that there are no size data for adult salmon and sea trout returning to the rivers is incorrect. The Panteg trap on the Tawe has produced salmon and sea trout size data that should be available through Natural Resources Wales (NRW). NRW (formerly Environment Agency Wales) annually collects individual size data on catches of both species declared through the rod catch return system. Such data for 2012 were used to produce Figure 4.1 above (2012 was used because it was the only set of data immediately to hand that covers both species). These size distribution data can be obtained from NRW. Note that data for the smallest sea trout category is gathered in a slightly different way from larger fish (the anglers are asked for a seasonal total, which is likely to be less accurate than the individual records for larger fish). Some caution is therefore needed to consider and if necessary adjust for size selective reporting. For that the modellers should refer to the NRW trap data from the Rivers Dee and Tamar. This need not be a major issue however: it depends on the application.
In Figure 5.3 the STRIKER size distributions are overlaid on the catch size distributions of Figure 4.1. The salmon distribution clearly under represents larger fish. For sea trout, the smallest size class is under represented and the middle sizes are over represented. In sea trout rod catch data from all rivers in Wales and North West Region the smaller size category are the most abundant. Notwithstanding some deviations through the age‐related time of first maturation and return, this is to be expected in populations with stable recruitment. This is not seen in the STRIKER distribution, which looks more like a symmetrical distribution around some predetermined mean. That may have been the intention, but it does not mimic a returning sea trout population, which is usually more like
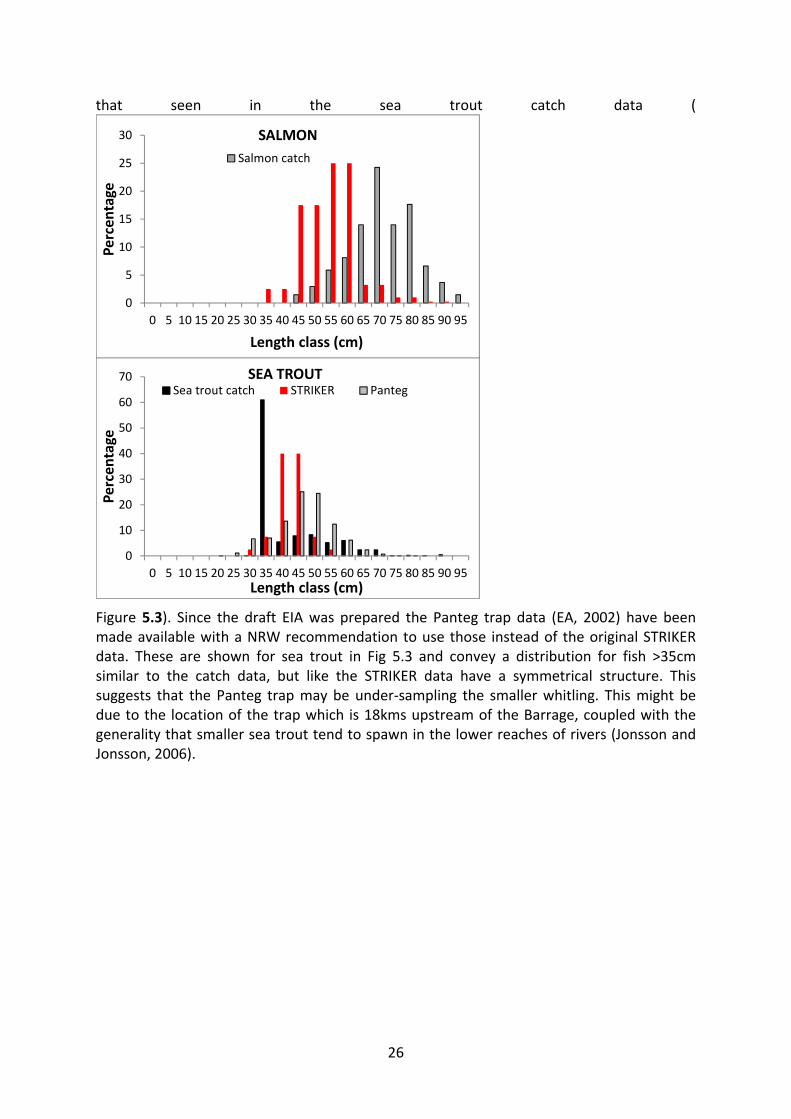
26
that seen in the sea trout catch data (
Figure 5.3). Since the draft EIA was prepared the Panteg trap data (EA, 2002) have been made available with a NRW recommendation to use those instead of the original STRIKER data. These are shown for sea trout in Fig 5.3 and convey a distribution for fish >35cm similar to the catch data, but like the STRIKER data have a symmetrical structure. This suggests that the Panteg trap may be under‐sampling the smaller whitling. This might be due to the location of the trap which is 18kms upstream of the Barrage, coupled with the generality that smaller sea trout tend to spawn in the lower reaches of rivers (Jonsson and Jonsson, 2006).
0
10
20
30
40
50
60
70
0 5 10 15 20 25 30 35 40 45 50 55 60 65 70 75 80 85 90 95
Percentage
Length class (cm)
SEA TROUTSea trout catch STRIKER Panteg
0
5
10
15
20
25
30
0 5 10 15 20 25 30 35 40 45 50 55 60 65 70 75 80 85 90 95
Percentage
Length class (cm)
SALMON
Salmon catch
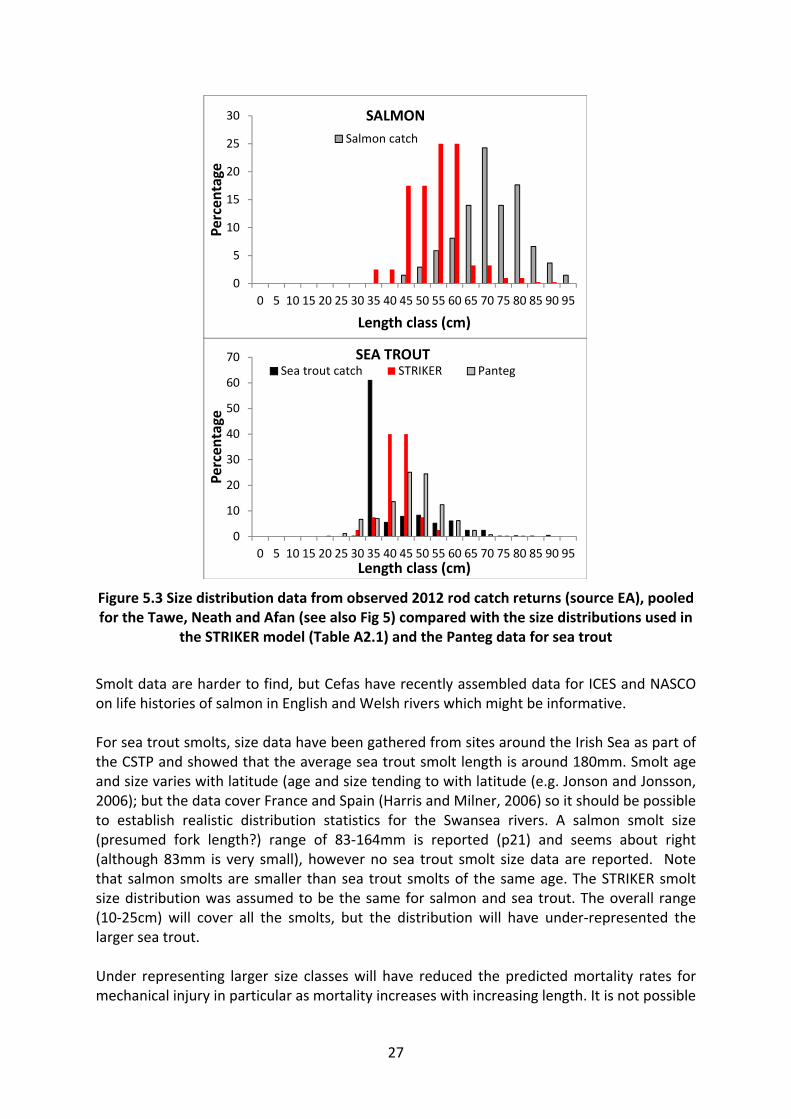
27
Figure 5.3 Size distribution data from observed 2012 rod catch returns (source EA), pooled for the Tawe, Neath and Afan (see also Fig 5) compared with the size distributions used in
the STRIKER model (Table A2.1) and the Panteg data for sea trout
Smolt data are harder to find, but Cefas have recently assembled data for ICES and NASCO on life histories of salmon in English and Welsh rivers which might be informative. For sea trout smolts, size data have been gathered from sites around the Irish Sea as part of the CSTP and showed that the average sea trout smolt length is around 180mm. Smolt age and size varies with latitude (age and size tending to with latitude (e.g. Jonson and Jonsson, 2006); but the data cover France and Spain (Harris and Milner, 2006) so it should be possible to establish realistic distribution statistics for the Swansea rivers. A salmon smolt size (presumed fork length?) range of 83‐164mm is reported (p21) and seems about right (although 83mm is very small), however no sea trout smolt size data are reported. Note that salmon smolts are smaller than sea trout smolts of the same age. The STRIKER smolt size distribution was assumed to be the same for salmon and sea trout. The overall range (10‐25cm) will cover all the smolts, but the distribution will have under‐represented the larger sea trout. Under representing larger size classes will have reduced the predicted mortality rates for mechanical injury in particular as mortality increases with increasing length. It is not possible
0
10
20
30
40
50
60
70
0 5 10 15 20 25 30 35 40 45 50 55 60 65 70 75 80 85 90 95
Percentage
Length class (cm)
SEA TROUTSea trout catch STRIKER Panteg
0
5
10
15
20
25
30
0 5 10 15 20 25 30 35 40 45 50 55 60 65 70 75 80 85 90 95
Percentage
Length class (cm)
SALMON
Salmon catch

28
however, without re‐running the model to determine what level of effect altering the size classes would have on mortality predictions.
5.9 Model outputs and conclusions
All predictions of fish injury from the modelling outputs have been taken to represent mortality events, which is a recommended approach for modelling of this type. The main comments regarding the model outputs and conclusions mirror those discussed in section 5.1 in that the limitations and uncertainty in the modelling approach and data inputs are not discussed at all within the document. Furthermore, that the model is deterministic presenting single mortality rates for each species/lifestage only rather than a range of potential rates borne from the uncertainty in the modelling approach. Presenting a range of rates would provide a better indication of the uncertainty in the approach and allow a more informed interpretation of how the impacts upon the populations could in fact vary especially when combined with the further uncertainty within the outputs of the turbine encounter model. There should be some acknowledgment within the conclusions that the predicted mortalities cannot be considered as complete compound mortalities due to the aspects discussed above for which it is not possible to quantitatively assess risk in particular cavitation and post passage effects and sluice passage discussed below. The predicted mortality rates should therefore be considered as minimum estimates as post passage effects in particular predation resulting from disorientation may well increase the observed mortality rates.
5.10 Sluice passage and injuries There is no empirical information available from which to quantitatively inform the prediction of mortality rates from sluice passage. Any assessment could therefore only be qualitative.
29
6 FISH, INCLUDING RECREATIONAL AND COMMERCIAL FISHERIES (CHAPTER 9.0)
It is understood that the assessment in general has adopted a Rochdale Envelope approach whereby it is acknowledged that the design of the scheme and the assessment of environmental impacts is an iterative process and the exact design is still evolving. In this situation the EIA usually therefore adopts a cautions worse case approach to the assessment. This is often complex with differing scenarios having different implications for the different groups of receptors under consideration.
It is not clear from the information to date how a worse case approach has been adopted in relation to the assessment of the design of the scheme upon fish. In the absence of this information it is therefore assumed that the alignment, design and operation of the turbines in particular will not alter for the final scheme in a way that could potentially result in greater impact upon migratory fish populations.
It is recommended that the final EIA details how the scheme assessed represents the worse case for the fish receptors for clarity.
6.1 Section 9.4.3 Study area
See section 3.1 above for text relating to study area and the rivers included within the far‐field zone.
6.2 Section 9.4.8 Assessment of the significance of fish mortality through tidal turbines
There is a precedent in the UK for assessment of tidal range power schemes on fish,
including, migratory salmonids in particular the DECC Severn Tidal Power Scheme (APEM
2010c). In that assessment matrix projection models were used to model the effects of
turbines on salmon populations, in addition taking into account the long term effects of
climate change to explore those cumulative effects during the lifetime of the scheme.
Leslie matrix projection models were used based on the approach used for turbine strike
mortality in a freshwater HEP context (Ferguson et al.,2008; Lundqvist et al., 2008), but
incorporating density‐dependent freshwater mortality and parameterised realistically for
the Severn estuary salmon stocks. Such an approach should be possible for salmon in
relation to this scheme. Sea trout may be more problematic because of the complexity of
their life cycle and the difficulty of parameterisation (Ferguson et al., 2008).
The application of life history‐based models would recognise that the actual effect on stocks is not a function of just the number of fish killed, but of the number of eggs lost and the translation of that into the longer term rate population increase. Numbers alone may underestimate effects if mortality is positively size selective. For sea trout a simpler approach may help in which the losses are enumerated not by numbers but by future life time egg losses of killed fish. Larger sea trout tend to be predominantly female, and thus to carry more eggs than smaller fish. An example of how this might be done for sea trout is shown below, using data from the Celtic Sea Trout Project. In this case the rod catch size distribution data for 2012 (Fig 6) were used. Loss estimates were reworked using data summarised in the Report Table A2.1, in which the
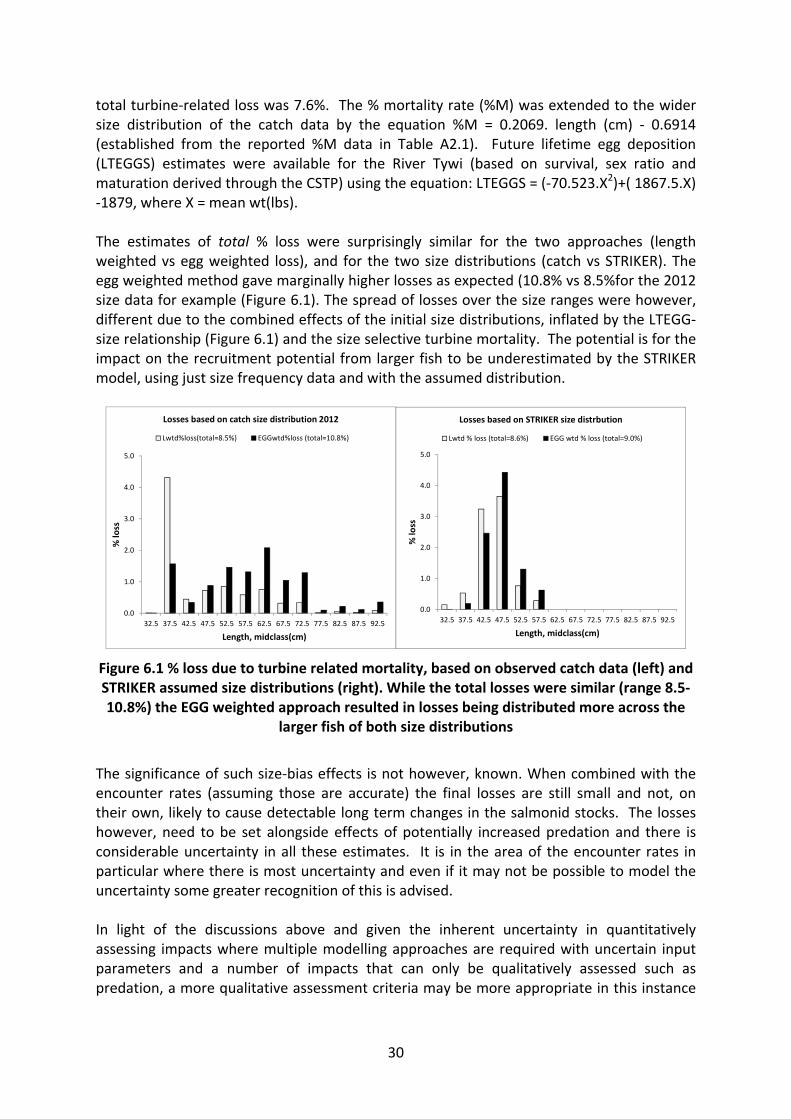
30
total turbine‐related loss was 7.6%. The % mortality rate (%M) was extended to the wider size distribution of the catch data by the equation %M = 0.2069. length (cm) ‐ 0.6914 (established from the reported %M data in Table A2.1). Future lifetime egg deposition (LTEGGS) estimates were available for the River Tywi (based on survival, sex ratio and maturation derived through the CSTP) using the equation: LTEGGS = (‐70.523.X2)+( 1867.5.X) ‐1879, where X = mean wt(lbs). The estimates of total % loss were surprisingly similar for the two approaches (length weighted vs egg weighted loss), and for the two size distributions (catch vs STRIKER). The egg weighted method gave marginally higher losses as expected (10.8% vs 8.5%for the 2012 size data for example (Figure 6.1). The spread of losses over the size ranges were however, different due to the combined effects of the initial size distributions, inflated by the LTEGG‐size relationship (Figure 6.1) and the size selective turbine mortality. The potential is for the impact on the recruitment potential from larger fish to be underestimated by the STRIKER model, using just size frequency data and with the assumed distribution.
Figure 6.1 % loss due to turbine related mortality, based on observed catch data (left) and STRIKER assumed size distributions (right). While the total losses were similar (range 8.5‐10.8%) the EGG weighted approach resulted in losses being distributed more across the
larger fish of both size distributions
The significance of such size‐bias effects is not however, known. When combined with the encounter rates (assuming those are accurate) the final losses are still small and not, on their own, likely to cause detectable long term changes in the salmonid stocks. The losses however, need to be set alongside effects of potentially increased predation and there is considerable uncertainty in all these estimates. It is in the area of the encounter rates in particular where there is most uncertainty and even if it may not be possible to model the uncertainty some greater recognition of this is advised. In light of the discussions above and given the inherent uncertainty in quantitatively assessing impacts where multiple modelling approaches are required with uncertain input parameters and a number of impacts that can only be qualitatively assessed such as predation, a more qualitative assessment criteria may be more appropriate in this instance
0.0
1.0
2.0
3.0
4.0
5.0
32.5 37.5 42.5 47.5 52.5 57.5 62.5 67.5 72.5 77.5 82.5 87.5 92.5
% lo
ss
Length, midclass(cm)
Losses based on catch size distribution 2012
Lwtd%loss(total=8.5%) EGGwtd%loss (total=10.8%)
0.0
1.0
2.0
3.0
4.0
5.0
32.5 37.5 42.5 47.5 52.5 57.5 62.5 67.5 72.5 77.5 82.5 87.5 92.5
% lo
ss
Length, midclass(cm)
Losses based on STRIKER size distrbution
Lwtd % loss (total=8.6%) EGG wtd % loss (total=9.0%)
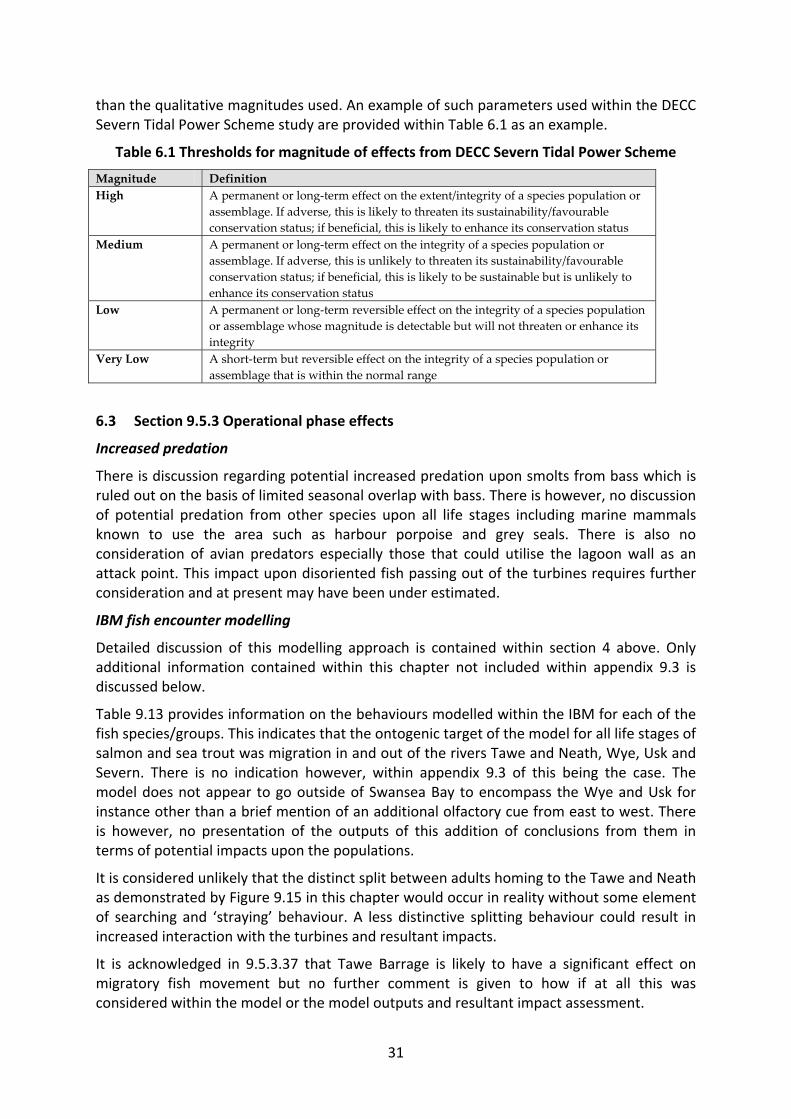
31
than the qualitative magnitudes used. An example of such parameters used within the DECC Severn Tidal Power Scheme study are provided within Table 6.1 as an example.
Table 6.1 Thresholds for magnitude of effects from DECC Severn Tidal Power Scheme
Magnitude Definition
High A permanent or long‐term effect on the extent/integrity of a species population or
assemblage. If adverse, this is likely to threaten its sustainability/favourable
conservation status; if beneficial, this is likely to enhance its conservation status
Medium A permanent or long‐term effect on the integrity of a species population or
assemblage. If adverse, this is unlikely to threaten its sustainability/favourable
conservation status; if beneficial, this is likely to be sustainable but is unlikely to
enhance its conservation status
Low A permanent or long‐term reversible effect on the integrity of a species population
or assemblage whose magnitude is detectable but will not threaten or enhance its
integrity
Very Low A short‐term but reversible effect on the integrity of a species population or
assemblage that is within the normal range
6.3 Section 9.5.3 Operational phase effects
Increased predation
There is discussion regarding potential increased predation upon smolts from bass which is ruled out on the basis of limited seasonal overlap with bass. There is however, no discussion of potential predation from other species upon all life stages including marine mammals known to use the area such as harbour porpoise and grey seals. There is also no consideration of avian predators especially those that could utilise the lagoon wall as an attack point. This impact upon disoriented fish passing out of the turbines requires further consideration and at present may have been under estimated.
IBM fish encounter modelling
Detailed discussion of this modelling approach is contained within section 4 above. Only additional information contained within this chapter not included within appendix 9.3 is discussed below.
Table 9.13 provides information on the behaviours modelled within the IBM for each of the fish species/groups. This indicates that the ontogenic target of the model for all life stages of salmon and sea trout was migration in and out of the rivers Tawe and Neath, Wye, Usk and Severn. There is no indication however, within appendix 9.3 of this being the case. The model does not appear to go outside of Swansea Bay to encompass the Wye and Usk for instance other than a brief mention of an additional olfactory cue from east to west. There is however, no presentation of the outputs of this addition of conclusions from them in terms of potential impacts upon the populations.
It is considered unlikely that the distinct split between adults homing to the Tawe and Neath as demonstrated by Figure 9.15 in this chapter would occur in reality without some element of searching and ‘straying’ behaviour. A less distinctive splitting behaviour could result in increased interaction with the turbines and resultant impacts.
It is acknowledged in 9.5.3.37 that Tawe Barrage is likely to have a significant effect on migratory fish movement but no further comment is given to how if at all this was considered within the model or the model outputs and resultant impact assessment.
32
Fish modelling for designated sites
There is no mention of the Severn Estuary European designated sites (SAC and Ramsar) within the list of designated sites.
Fish injury mechanisms in tidal power turbines
The results in table 9.18 represent those impacts from passage through the turbines that can be quantified and forms the basis of the impact assessment judgements. It is recommended that this section also contain some discussion of the fact that these are effectively minimum estimates of mortality as they do not take account of other impacts for which it is not possible to determine a quantitative assessment of impact such as sluice passage, predation etc.
Summary of impacts on fish and shellfish
In the tables summarising the potential environmental effects on salmon and sea trout some information is not yet complete within the version reviewed. In particular information is missing for significance, confidence, mitigation and residual significance and confidence level for a number of operational phase impacts such as; Increased predation and entrainment and injury from turbines.
Presumably on the basis of the assessment criteria detailed in table 9.5 of the chapter with all mortality rates coming out as less than 1% impacts for entrainment and injury from turbines has been classed as Low magnitude. As discussed above it is recommended that where possible these impacts are assessed in the context of impacts upon the populations.
33
7 MITIGATION (OFFSETTING)
7.1 Chapter 9
There are a number of mitigation measures identified within chapter 9 of the draft EIA. Those suitable for mitigating impacts upon salmon and sea trout are as follows:
Waterborne noise – measures to reduce the impact of underwater noise and vibration during construction are discussed in particular low‐noise piling techniques where feasible and ‘soft‐start’ procedures. These are both valid techniques for reducing impacts upon fish. In addition however, other options could also be considered such as using sound absorption/reflection techniques such as bubble screens. The most appropriate techniques would however, have to be researched further for the specific techniques to be used for this scheme.
Behavioural fish guidance – The use of an Acoustic Fish Deterrent (AFD) has been proposed for the scheme and fish mortality calculated on the basis of its use which it is assumed are the mortality rates that will be taken forward for the residual impacts assessment. It is agreed that in some circumstances high deflection efficiencies can be observed for salmonids with appropriately designed and operated acoustic deterrent systems. There is no discussion however, of how the examples provided in the text relate to such a large and likely unprecedented situation as is likely to be experienced for the Swansea lagoon. Consideration would need to be given to the approach velocities at the point at which the acoustic deterrents could be realistically operated in front of the turbines. Approach velocities will have to be kept low to allow fish that respond to the deterrent to alter their behaviour and direction of travel and move away from the deterrent and as a result the turbines. More information would therefore have to be provided on the intended design and operation of the scheme and the approach velocities that would be experienced before expected efficiencies can realistically be applied to the assessment. It is considered likely however, that due to the likely unprecedented scale that would be required in this case and the additional complications resulting from the environmental conditions that efficiencies could be lower than observed elsewhere. Results from any similar case studies with data on salmonids would be beneficial for assessing whether the deflection efficiencies stated could realistically be achieved in this case.
Suspended sediment and deposition – the measures proposed look to be appropriate for this scheme.
Increases in light emissions ‐ the measures proposed look to be appropriate for this scheme.
7.2 Potential opportunities
If impacts are deemed to be below moderate and have no significant impact upon the populations then there is no legal requirement to undertake mitigation for the scheme.

34
If measures are required then options might include activities on “impacted” rivers or offsets elsewhere. In any event the most crucial recommendation is that the associated monitoring is properly designed to detect the effectiveness of the mitigation as well as to evaluate residual impacts of the scheme, with the intention of follow‐up adaptive management, as far as the scheme design allows. Further, the mitigation should be planned jointly with the stakeholders because early inclusion and ownership are essential to successful long term delivery.
In principle, mitigation should be designed to compensate for the anticipated unavoidable significant losses from the Lagoon Scheme. These have not yet been estimated satisfactorily; but should be based on population models as far as data and other constraints allow and should be assessed to optimise the spatial distribution of mitigation, within and between catchments.
Potential options that can be considered as ‘mitigation’ or more commonly now ‘offsetting’ include measures to prevent impacts, reduce them or offset them. Measures to prevent and reduce impacts are usually directly connected with the design and operation of the scheme where as offsetting measures are in connection with the population as a whole and may not be at all associated with the scheme itself.
Potential options under each of the categories above are discussed below. It must be noted however, that these are discussed on the basis of the limited information available to date and would need to be assessed in more detail for this specific scheme with greater information on the planned design and operational regime of the scheme. Options to prevent and reduce impacts
Potential prevent and reduce options in addition to those already identified within chapter 9 may include:
Timing of construction works – avoiding key migration or residence periods may
prevent or reduce any impacts resulting from construction works.
Timing of operational generation – it may be possible for some schemes to alter the
timing of generation to reduce impacts during key sensitive periods. This is unlikely
to be realistic for a tidal power scheme however, as there are so many different
species and life stages to consider and generation is obviously dictated by the tidal
cycle. It is unlikely to be economically acceptable to alter generation in any
significant way as to have a true reduction upon impacts.
Efficiency of operation – As efficiency of the turbines reduces injuries and mortality
of fish passing through them tends to also increase. It is therefore recommended
that where possible periods of lower efficiency are reduced or avoided to decrease
impacts upon fish passing through the turbines.
Passage easement – in some cases there are advantages to easing passage in and out
of the lagoon through measures such as increased permeability and dedicated fish
passage structures. The preference for this scheme however, would most likely to be
35
to keep migratory salmonids out and as such this may not be a beneficial measure in
this circumstance.
Fish exclusion and diversion structures – The use of AFD’s have been proposed for
the scheme and are discussed in section 7.1 above. Alternative fish exclusion
measures for migratory salmonids would be the operation of physical screen
structures. Further information would be required however, to assess whether this
would be a feasible option in relation to the approach velocities likely to be
experienced in front of the turbines. Given the scale of the scheme this would likely
be a complex and costly (both during construction and ongoing operation) option
that may not be practical in terms of effective and safe fish protection.
Predator control – If predation is considered to be a significant impact upon
migratory salmonid populations as a result of the scheme then there may be some
benefit in assessing options for predator control where possible. Acceptable long‐
term options for this are however likely to be limited.
Offsetting options
It may be possible to improve salmonid populations in ways not directly connected with the scheme to effectively mitigate for losses resulting from it. The majority of effective measures are likely to be most feasible within the freshwater environment. It should be noted however, that improvements to freshwater habitats are commonly conducted within river catchments as part of ongoing management programmes implemented by the statutory authorities and others to meet the requirements of national and European legislation such as the Water Framework Directive to meet Good Ecological Status/Potential. Measures proposed as mitigation under this scheme may therefore represent an additionality conflict as there may already be an obligation to undertake them under another driver. For example the lower reach of the Tawe which is designated as a Heavily Modified Water Body due to flood protection is currently graded as moderate ecological potential although with no specific fish assessment. It is therefore likely that measures will need to be undertaken to reach the intended classification of good ecological potential by 2027 which may include measures to improve fish stocks. Given the presence of Tawe Barrage it is likely that this would include an element of improved fish passage past this structure. There may not however, be funds available to undertake this work. Fish passage easement past this structure as a mitigation measure may therefore have additionality conflict as the measure should be undertaken in the future anyway. Many measures identified as potential mitigation options for this scheme would therefore have to be discussed with NRW to determine if they are realistic options. Habitat restoration Barrier removal The extent and location of these will determine their value in increasing fish production. NRW has a barrier database and doubtless these opportunities will be apparent to them. There is likely to be a lot of scope in the target rivers, which have been subject to human
36
influence for centuries. A key aspect to consider is the ranking of factors limiting fish passage. These might include flow regimes or water quality barriers as well as downstream physical barriers. Cost benefit appraisal is vital and there is Defra guidance on this as well as a functioning EA fish pass/barrier group. Riparian and in channel works to increase carrying capacity Evaluation of the potential of the opportunities for in channel works will require a survey of the existing catchments to assess and quantify habitat quality. As for barriers NRW should have a full inventory of the opportunities, but may not have this in a quantified form that allows estimation of the benefits accruing. Note that there are many other, wider ecological benefits from restoring naturalness to banks beyond simply salmonid production. Habitat enhancement “Enhancement” takes improvement beyond the notionally pristine natural state of the rivers. This might include increasing in‐channel habitat complexity by installing structures, or installation of specific habitat types deemed to be bottle necks such as spawning beds. These can be costly to install and to maintain; therefore the need and cost‐effectiveness should be carefully assessed. It is not normally as useful as habitat “restoration”. Stocking Likely to be a popular option with anglers, because it appears to be simple and effective. It can work and has a place, but has substantial costs and can bring significant ecological and genetic risks. It is essential to seek good objective advice on this and any stocking should be managed as part of an agreed catchment scale stocking programme, and always as a second preferred option after habitat management. Stocking of badly reared fish or of any fish into waters having poor environmental quality from whatever cause is a waste of money. There are very many advisory texts and a recent (2013) AST workshop on this topic. Fishing quality enhancement Physical access to angling locations may be limited in some sections and this will require negotiation with the riparian interests, local angling owners, clubs, NRW and river trusts. Caution is needed to avoid over‐exploitation (manageable by catch controls) and to minimise conflicts of interests amongst fishery types (e.g. trout vs salmon) and other water users.
37
8 MONITORING
8.1 Monitoring of impacts and a basis for compensation claims
Article 5(3) of the European EIA Directive contains no explicit monitoring requirements, but these are implicit in the identification of “measures to prevent, reduce and where possible offset any significant adverse effects”. Predicted impacts should be monitored as well as delivery of commitments in the Environmental Statement. It is likely that the Competent Authorities will also attach monitoring conditions to the scheme consents. Furthermore, best practice for adaptive management necessitates an appropriate, well designed and effective monitoring programme to inform the environmental optimisation of the scheme. The mitigation measures proposed for this scheme should ensure that no significant impacts arise. Nevertheless residual impacts may arise. Pre‐agreed compensation needs to be assessed for its effectiveness (IEEM, 2010). Other factors could lead to changes in fisheries which might lead to unexpected compensation claims and monitoring should be able to disentangle causal factors. A good monitoring programme is therefore, beneficial at several levels and is integral to the Compensation, Mitigation and Monitoring Agreement (CMMA) (IEEM, 2010) and is particularly desirable in this case, which is the first of such large lagoon schemes in the British Isles. Potential impacts of the scheme arise in two stages: construction and long term operations. The monitoring of the impacts of the scheme requires:
Identification of agreed indicators and their geographical extent that reflect the
priority receptors, or acceptable surrogates.
Setting of predetermined performance targets
A statistically scoped survey programme of performance with predetermined levels
of compliance that identify significant change in the face of the inevitable
uncertainty.
A feedback mechanism that unambiguously links monitoring results to changes in
operational practice or mitigation.
A transparent and prompt reporting procedure
These principles apply to construction and operational phases, but the time scale and detail of monitoring would be different and appropriate to each. Indicators The salmonid receptors (salmon and sea trout) each have two components:
The fishery (the exploitation through catch and release or harvest) of the fish stock
The fish stocks (comprising multiple populations)
Potential indicators with a qualitative ranking of their value for the context of this scheme and likely feasibility are detailed within Table 8.1 below.
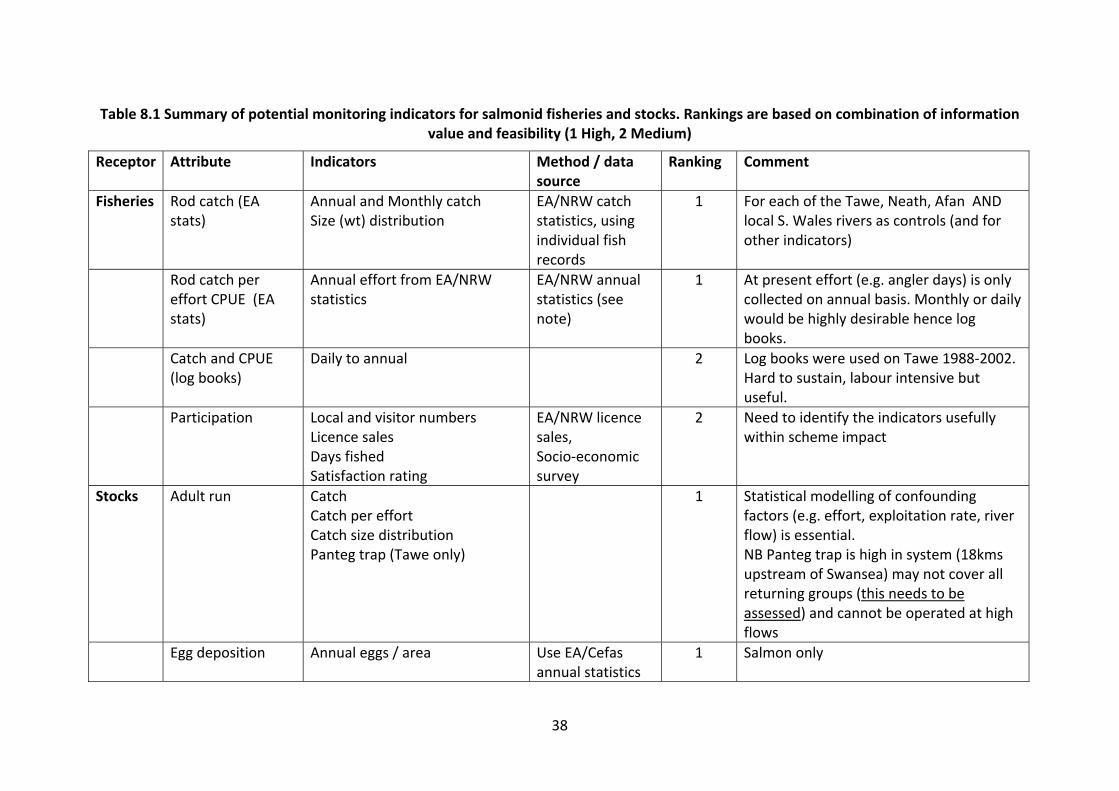
38
Table 8.1 Summary of potential monitoring indicators for salmonid fisheries and stocks. Rankings are based on combination of information value and feasibility (1 High, 2 Medium)
Receptor Attribute Indicators Method / data source
Ranking Comment
Fisheries Rod catch (EA stats)
Annual and Monthly catch Size (wt) distribution
EA/NRW catch statistics, using individual fish records
1 For each of the Tawe, Neath, Afan AND local S. Wales rivers as controls (and for other indicators)
Rod catch per effort CPUE (EA stats)
Annual effort from EA/NRW statistics
EA/NRW annual statistics (see note)
1 At present effort (e.g. angler days) is only collected on annual basis. Monthly or daily would be highly desirable hence log books.
Catch and CPUE (log books)
Daily to annual 2 Log books were used on Tawe 1988‐2002. Hard to sustain, labour intensive but useful.
Participation Local and visitor numbers Licence sales Days fished Satisfaction rating
EA/NRW licence sales, Socio‐economic survey
2 Need to identify the indicators usefully within scheme impact
Stocks Adult run Catch Catch per effort Catch size distribution Panteg trap (Tawe only)
1
Statistical modelling of confounding factors (e.g. effort, exploitation rate, river flow) is essential. NB Panteg trap is high in system (18kms upstream of Swansea) may not cover all returning groups (this needs to be assessed) and cannot be operated at high flows
Egg deposition Annual eggs / area Use EA/Cefas annual statistics
1 Salmon only
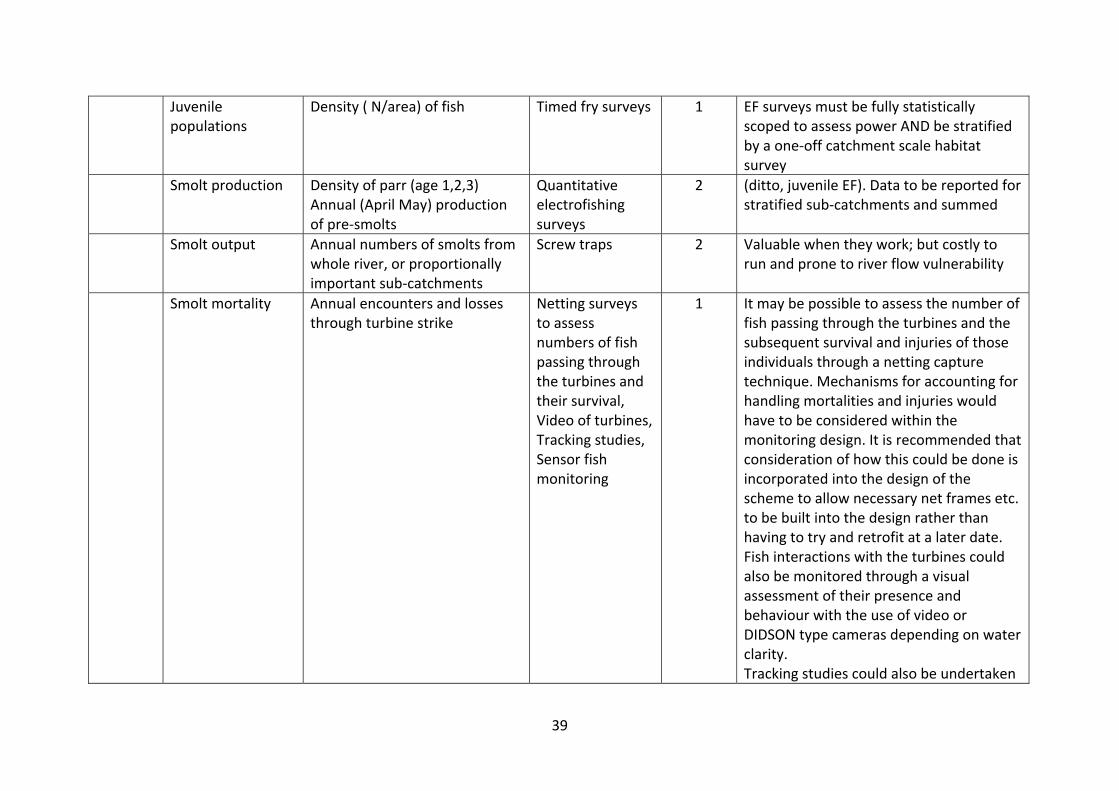
39
Juvenile populations
Density ( N/area) of fish Timed fry surveys 1 EF surveys must be fully statistically scoped to assess power AND be stratified by a one‐off catchment scale habitat survey
Smolt production Density of parr (age 1,2,3) Annual (April May) production of pre‐smolts
Quantitative electrofishing surveys
2 (ditto, juvenile EF). Data to be reported for stratified sub‐catchments and summed
Smolt output Annual numbers of smolts from whole river, or proportionally important sub‐catchments
Screw traps 2 Valuable when they work; but costly to run and prone to river flow vulnerability
Smolt mortality Annual encounters and losses through turbine strike
Netting surveys to assess numbers of fish passing through the turbines and their survival, Video of turbines, Tracking studies, Sensor fish monitoring
1 It may be possible to assess the number of fish passing through the turbines and the subsequent survival and injuries of those individuals through a netting capture technique. Mechanisms for accounting for handling mortalities and injuries would have to be considered within the monitoring design. It is recommended that consideration of how this could be done is incorporated into the design of the scheme to allow necessary net frames etc. to be built into the design rather than having to try and retrofit at a later date. Fish interactions with the turbines could also be monitored through a visual assessment of their presence and behaviour with the use of video or DIDSON type cameras depending on water clarity. Tracking studies could also be undertaken

40
to monitor the route of passage of individuals passed or into the scheme. If monitoring of fish passing through the turbines was not possible it may be appropriate to use a surrogate ‘sensor fish’ which is an electronic device which can be passed through a turbine and detect encounters of blade strike, shear, pressure etc. which could then be compared with biological data to determine if the rates of injury/mortality calculated using the STRIKER model were accurate. It would not however, give an indication of the number of individuals passing through the turbines and as such would have to be used in combination with another technique such as tracking.
Adult mortality Annual encounters and losses through turbine strike
Netting surveys to assess numbers of fish passing through the turbines and their survival, Video of turbines
1 As above.
41
Some of the detail in Table 8.1 would vary between salmon and trout because their life cycles are different in important aspects. Sea trout have partially migrating populations (Chapman et al., 2012) and in the freshwater juvenile stage are indistinguishable from resident brown trout; they are in fact the same species and interbreed. The boundaries between anadromous migrants and non‐migrants are imprecise and so parr surveys are less valuable for estimating future smolt production than in the case of salmon. Costs can be attached to these options, but the minimum would comprise:
1. The rod catch and effort (numbers and size distributions). They service both fisheries
and stocks evaluation; but note the essential inclusion of the factor analysis for the
stock application.
2. Panteg trap (assuming appropriate review, cf its functionality and application to
catchment scale assessment has been questioned, Environment Agency(2002))
3. The time fry surveys, appropriately stratified
4. The salmon egg deposition indices, these are produced anyway by Cefas/ NRW
Fisheries monitoring has suffered significant decline from reduced resourcing in NRW and its predecessors, yet is necessary for proper delivery of most environmental and fisheries management. Given the growing body of opinion that new developments should try to deliver net ecological gain (IEEM, 2010) the wider benefits of a robust monitoring programme extend beyond the immediate scheme. Also, there is a body of motived stakeholders who could be brought collaboratively into some aspects of monitoring (trapping, logbooks, electro‐fishing) and this is highly recommended.
8.2 Monitoring the effectiveness of mitigation measures
Many of the monitoring options discussed above would also aid in assessing the effectiveness of mitigation measures whilst otherwise would require dedicated specific monitoring techniques. Monitoring techniques would need to be defined once specific mitigation measures are identified and developed.

42
9 STATEMENT OF TRUTH
We confirm that insofar as the facts stated in our report are within our own knowledge, we have made clear which they are and we believe them to be true, and that the opinions we have expressed represent our true and complete professional opinion.
43
10 REFERENCES
APEM (2010a). Severn Tidal Power SEA Topic Paper: Migratory and Estuarine Fish. Annex 5: Fish Passage through Tidal Power Turbines. APEM (2010b). Severn Tidal Power SEA Topic Paper: Migratory and Estuarine Fish. Annex 1: Evaluation of Plan Alternatives. APEM (2010c). Severn Tidal Power SEA Topic Paper: Migratory and Estuarine Fish. Annex 4: Migratory Fish Life Cycle Models. Aprahamian, M.W., Jones, G.O. & Gough, P.J. (1998). Movement of adult Atlantic salmon in the Usk estuary, Wales. Journal of Fish Biology 53, 221‐225. Cefas/ EA (2013) Annual Assessment of Salmon Stocks and Fisheries in England and Wales 2012. EA Bristol, 138pp. Chapman, B.B., Hulthén, K.,Brodersen, J., Nilsson,P.A., Skov, C., Hansson, L,‐A and Brönmark, C. (2012) Partial migration in fishes: cause and consequences. Journal of Fish Biology 81, 456‐478. Cowx, I.G. and Fraser, D. (2004). Monitoring the Atlantic salmon (Salmo salar). Conserving Natura 2000 Rivers Monitoring Series No. 7. English Nature, Peterborough. Davidsen, J.G. et al., (2013). Homing behaviour of Atlantic salmon (Salmo salar) during final phase of marine migration and river entry. Canadian Journal of Fish and Aquatic Sciences, 70(5), pp.794–802. Davidson, I.C., Cove, R.J., Milner, N.J. & Purvis, W.K (1996) Estimation of Atlantic salmon (Salmo salar L.) and sea trout (Salmo trutta L.) run size and angling exploitation on the Welsh Dee using mark‐recapture and trap indices. In: Stock Assessment in Inland Fisheries (Cowx, I.G Ed.).Fishing News Books, Blackwell Science, Oxford, 293‐307. Deng, Z., Carlson, T.J., Ploskey, G.R. & Richmond, M.C. (2005). Evaluation of blade‐strike models for estimating the biological performance of large Kaplan hydro turbines. Pacific Northwest National Laboratory Technical Report PNNL‐15370 to the US Department of Energy. Environment Agency (2002) River Tawe Fisheries Performance Annual report, Environment Agency, Llandarcy. Ferguson, J.W., Ploskey, G.R., Leonardsson, K., Zabel, R.W. & Lundqvist, H. (2008) Combining turbine blade‐strike and life‐cycle models to assess mitigation strategies for fish passing dams. Canadian Journal of Fisheries and Aquatic Sciences. 65, 1568‐1585. Gee, A. S., Milner, N. J. (1980) Analysis of 70 year catch statistics for Atlantic Salmon (Salmo salar) in the river Wye and implications for management of stocks. J. Appl. Ecol. 17, 41‐57
44
Gough, P.G, Winstone, A.J. and Hilder, P.G. (1992) Spring salmon: a review of factors affecting the abundance and catch of spring salmon from the River Wye and elsewhere, and proposals for stock maintenance and enhancement. National Rivers Authority Technical Report No. 2. NRA, Cardiff. Harris, G.S. (2002) Sea Trout Stock Description: the Structure and Composition of Adult Sea Trout Stocks from 16 Rivers in England and Wales. Environment Agency R&D Technical Report W224. 93pp. Harris, G.S. & Milner, N.J. (2006). Sea trout: Biology, conservation and management. Proceedings of First International Sea Trout Symposium, Cardiff, July 2004. Blackwell Scientific Publictaions, Oxford, 499pp. Hawkins, G.W., Urqhart, G.G. & Shearer, W.M. (1979) The coastal movements of returning Atlantis salmon Salmo salar (L.) Scottish Fisheries Research Report Number 15 1979, Department of Agriculture and Fisheries for Scotland. IEEM (2010) Guidelines for Ecological Impact Assessment in Britain and Ireland: Marine and Coastal. Institute of Ecology and Environmental Management. Jones, G. (1994) A Review of the Welsh Microtagging Programme 1984‐1993. Nationla Rivers Authority Welsh Region Report. 76pp Jonsson, B. and Jonsson, N. (2006) Life‐history effects of migratory costs in anadromous brown trout. Journal of Fish Biology 69, 860–869. Lundqvist, H., Rivinoja, P., Leonardsson, K. & McKinnell, S. (2008) Upstream passage problems for wild Atlantic salmon (Salmo salar L.) in a regulated river and its effect on the population. Hydrobiologia 602,11–127 Karppinen P., Erkinaro J., Niemela E., Moen K. & Økland F. (2004) Return migration of one‐sea‐winter Atlantic salmon in the Tana River. Journal of Fish Biology 64, 1179–1192. Malcolm, I.A. Malcolm, Godfrey,J. & Youngson, A.F. (2010) Review of migratory routes and behaviour of Atlantic salmon, sea trout and European eel in Scotland’s coastal environment: implications for the development of marine renewables. Scottish Marine and Freshwater Science Vol 1 No 14.Gee, A. S., Milner, N. J. (1980) Analysis of 70 year catch statistics for Atlantic Salmon (Salmo salar) in the river Wye and implications for management of stocks. J. Appl. Ecol. 17, 41‐57 Mee, D.M., Kirkpatrick, A.J. & Stonehewer, R.O. (1996). Barrages – engineering design and environmental impacts. International Conference 10‐13 September 1996, Cardiff. 395‐408. Moore, A. (1997). The Movements of Atlantic salmon (Salmo salar L.) and sea trout (Salmo trutta L.) smolts in the impounded estuary of the R.Tawe, South Wales. Environment Agency R & D Technical Report W81.
45
Moore, A., Ives, S., Mead, T.A., Talks, L. (1998). The migratory behaviour of wild Atlantic salmon (Salmo salar L.) smolts in the River Test and Southampton Water, southern England, Hydrobiologia 371/372: 295‐304. Ploskey, G.R. & Carlson, T.J. (2004). Comparison of blade‐strike modelling results with empirical data. Pacific Northwest National Laboratory Technical Report PNNL – 14603 to the US Department of Energy. Ploskey, G.R., Johnson, G.E., Giorgi, A.E., Johnson, R.L., Stevenson, J.R., Schilt, C.R., Johnson, P.N. & Patterson, D.S. (2007). Synthesis of biological research on juvenile fish passage and survival at Bonneville Dam through 2005. Pacific Northwest National Laboratory Technical Report prepared for the U.S. Army Corps of Engineers and the U.S. Department of Energy. PNNL‐15041. Quinn, T.P. (1993) A review of homing and straying of wild and hatchery‐produced salmon. Fisheries Research 18, 29‐44. Russell, I.C., Moore, A., Ives, S., Kell, L.T., Ives, M.J. & Stonehewer, R.O. (1998). The migratory behaviour of juvenile and adult salmonids in relation to an estuarine barrage. Hydrobiologia 371/372. 321‐333. Shelton, R.G. (Ed) (2001) Proceedings of Atlantic Salmon Trust Workshop, Lowestoft, November 2001. Solomon, D.J. (1994) Sea trout Investigations. Phase 1, Final Report. National Rivers Authority R&D Report 318. NRA, Bristol Swain, A. (1982). The migrations of salmon (Salmo salar L.) from three rivers entering the Severn estuary. J. Cons. Int. Explor. Mer, 40 (1): 76‐80. Thorstad, E . B . Økland, F. Johnsen, B . O. & Næsje, T. F. (2003) Return migration of adult Atlantic salmon, Salmo salar, in relation to water diverted through a power station. Fisheries Management and Ecology, 2003, 10, 13–22. Thorstad, E.B., Økland F., Aarestrup K. & Heggberget T.O. (2008) Factors affecting the within river spawning migration of Atlantic salmon, with emphasis on human impacts. Reviews in Fish Biology and Fisheries 18, 345–371. Turnpenny, A.W.H. (1998). Chapter 23: mechanisms of fish damage in low‐head turbines: an experimental appraisal. Jungwirth, M., Schmutz, S. & Weiss, S. (ed.) Fish migration and fish bypasses. Fishing News Books, Oxford 300‐314. Turnpenny, A.W.H., Davis, M.H., Fleming, J.M. & Davies, J.K. (1992). Experimental studies relating to the passage of fish and shrimps through tidal power turbines. Technical Report for AEA Technology, Harwell National Power PLC.
1
Phil Jones
From: Phil Jones [[email protected]]Sent: 10 July 2014 18:05To: 'Katherine Chapman'Cc: Andrew Kelton FL <[email protected]>; Ray Lockyer PASAS
<[email protected]>Subject: RE: Swansea Bay Tidal Lagoon - attachments to PASAS submission
Follow Up Flag: Follow upFlag Status: Blue
Salmon and Sewin Rod Catches.p...
Katherine
Thanks, that's very helpful.
I see that our written representation also made it into the first batch, together with our attachments. The Excel workbook that we submitted (of rod catch statistics) actually contained 9 worksheets, the first 4 of which print on 3 pages each, 1 of which ("chart data") prints on 2 pages and four of which (charts) print on 1 page each. Only one page appears in our published representation (the first page of the "chart data" sheet).
To help you to put this right I've assembled all the pages of all the worksheets in the attached 14-page .PDF which you might want to substitute for the single page published at the moment. In the course of doing that I've noticed a couple of glitches, which I've ironed out. I've also excluded the "chart data" sheet, which is just an intermediate sheet and won't help anyone looking at the content. I hope that's OK. The actual .XLS workbook that I sent you is OK but it's probably better to give people this PDF.
RegardsPhil
-----Original Message-----From: Katherine Chapman [mailto:[email protected]] Sent: 10 July 2014 14:26To: [email protected]: [email protected]; [email protected]: RE: Swansea Bay Tidal Lagoon
Mr Jones,
We are aiming to get as many submissions published this afternoon as possible. The representation from NRW is within the first batch that we have prepared.
Many thanksKatherine
[...PINS sig snipped...]
-----Original Message-----From: Phil Jones [mailto:[email protected]] Sent: 10 July 2014 11:57To: Katherine ChapmanCc: [email protected]; [email protected]: Swansea Bay Tidal Lagoon
Dear Katherine

2
No doubt you're now snowed under with written representations, etc, and have a huge job preparing them for publication on the website.
Could we please ask that you give priority to publication of the representations of Natural Resources Wales? Most interested parties will be anxious to see what they've said.
RegardsPhil
=====================================================Phil Jones, Director / Treasurer44 Bwllfa Rd, Ynystawe, Swansea, SA6 5ALTel: 01792 843951 Mob: 07957 154992
Pontardawe and Swansea Angling Society Ltd www.pasas.org.uk Reg'd in Wales No 6736638 Reg'd Office: 8 Bwllfa Rd, Ynystawe, Swansea, SA6 5AL =====================================================
[...PINS disclaimers snipped...]

Declared Salmon Catches, Rod
RIVER 1979 1980 1981 1982 1983 1984 1985 1986 1987 1988 1989 1990 1991 1992 1993 1994 1995
Aber 1 1 6 1 4 1 1 1 1Aeron 8 9 27 5 9 9 34 8 20 52 4 2 6 4 11 8 3Afan 1 1 1 15 2 7 19 10Alaw 3AlwenAmmanAngleseyArth 1 3 4 1 1Artro 3 5 1 4 1 11 15 12 6 3 7 1 5 8 8 7CefniClwyd catchment 70 112 88 65 99 103 145 160 207 281 97 103 71 17 122 167 63Conwy catchment 266 380 405 401 478 272 401 472 413 733 342 428 249 81 195 226 199CothiCresswellDee catchment 507 580 707 582 520 273 486 739 633 1019 273 427 376 164 455 729 499Dulas 1Dwyfach 1 2 1 4 5 14 6Dwyfawr 108 69 72 56 45 31 82 64 68 96 32 67 14 14 9 42 18Dwyryd 25 38 40 35 48 12 33 45 31 59 25 37 15 1 23 29 21Dyfi catchment 386 287 266 179 293 263 441 229 416 638 223 301 176 74 222 274 158Dysynni 17 14 15 13 10 4 17 9 13 33 6 20 11 11 8 16 2EbbwEdenE / W Cleddau 104 99 96 126 104 40 115 87 66 142 61 17 34 31 76 86 41ElwyElyErch 8 1 4 3 3 3 2 1 5 1 2 1Glaslyn 27 40 41 33 29 6 62 59 73 85 76 73 48 18 47 51Gwaun 1 1 2Gwendraeth Fach / Fawr 1 3 1 5 6 2 2GwiliGwyrfai 7 10 11 12 22 3 13 9 23 36 1 8 1 1 5 5 3IrfonKenfig 1 7 1LledrLeri 2 1LuggLlugwyLlyfni 38 47 43 22 33 13 42 24 28 54 29 12 7 3 19 33 22Loughor 14 12 9 7 15 5 25 12 9 26 7 9 5 5 8 13 1Mawddach catchment 258 221 224 149 264 141 131 233 286 365 331 304 145 39 115 291 126Neath 4 1 4 4 10 4 15 5 33 52 12 25 8 1 14 52 16Nevern 13 43 18 16 23 22 14 20 19 38 37 22 15 5 25 69 56Ogmore / Ewenny 1 14 4 9 3 6 41 37 24 39 11 19 12 14 59 73 50Ogwen 56 69 39 51 73 79 83 122 146 197 151 87 99 16 95 111 76Others 204 734 175 85 70 44 26 14 15 19 10 15 25 2 44 8 1Rheidol 41 17 15 22 60 24 54 73 106 126 81 48 24 2 18 46 50Rhydir 2 3 1 1 3 2Rhymney 1 1 10 2 1Seiont 38 66 43 183 103 51 49 63 82 305 72 84 40 7 30 31 24Soch 2 4 1Solva 1 6Taf 148 258 150 134 156 25 129 107 77 165 24 35 65 17 64 153 32Taff 2 15 12 38 114 4 72 38 10 43 87 62Tawe 20 32 65 33 41 47 107 32 55 91 25 85 55 42 20 189 146Teifi 545 545 679 517 807 282 850 857 934 1889 331 536 414 133 433 736 307Tywi catchment 1094 960 915 829 1033 602 943 568 757 1446 544 471 485 147 388 896 523Usk 345 799 874 447 481 155 831 561 328 1385 326 265 316 101 735 1068 518WnionWye 2135 4195 5693 2228 2460 1263 3613 3832 3223 6401 2300 1757 1746 1849 2050 2338 1048Wyre 8 6 3 23 8 12 5 3 2Ystwyth 13 11 9 31 61 8 24 9 22 56 14 24 1 11 23 9UnknownWales total 6503 9672 10742 6287 7372 3802 8871 8498 8202 15983 5454 5370 4524 2809 5332 7876 4145
Tawe as %age of total 0.31 0.33 0.61 0.52 0.56 1.24 1.21 0.38 0.67 0.57 0.46 1.58 1.22 1.50 0.38 2.40 3.52Tawe rank 20 20 14 17 19 12 12 19 17 17 18 11 12 8 19 9 8
Neath as %age of total 0.06 0.01 0.04 0.06 0.14 0.11 0.17 0.06 0.40 0.33 0.22 0.47 0.18 0.04 0.26 0.66 0.39Neath rank 28 30 28 28 25 26 27 31 19 22 22 19 25 28 23 17 23
Afan as %age of total 0.01 0.01 0.02 0.33 0.07 0.13 0.24 0.24Afan rank 34 37 34 19 25 30 25 24

Declared Salmon Catches, Rod
RIVER
AberAeronAfanAlawAlwenAmmanAngleseyArthArtroCefniClwyd catchmentConwy catchmentCothiCresswellDee catchmentDulasDwyfachDwyfawrDwyrydDyfi catchmentDysynniEbbwEdenE / W Cleddau ElwyElyErchGlaslynGwaunGwendraeth Fach / FawrGwiliGwyrfaiIrfonKenfigLledrLeriLuggLlugwyLlyfniLoughorMawddach catchmentNeathNevernOgmore / EwennyOgwenOthersRheidolRhydirRhymneySeiontSochSolvaTafTaffTaweTeifiTywi catchmentUskWnionWyeWyreYstwythUnknownWales total
Tawe as %age of totalTawe rank
Neath as %age of totalNeath rank
Afan as %age of totalAfan rank
1996 1997 1998 1999 2000 2001 2002 2003 2004 2005 2006 2007 2008 2009 2010 2011 2012
32 3 1 6 6 7 12 12 18 2 1 3 2 3 10
11 14 24 8 7 8 7 7 10 6 5 3 9 15 18 10 15
12
4 4 6 3 1 4 4 3 4 7 5 2 3 11
42 24 110 71 60 74 49 35 77 18 31 135 176 79 228 153 49214 118 134 89 199 220 110 147 260 162 157 192 190 144 327 172 104
40
433 433 627 390 359 616 493 421 1080 812 605 683 885 510 793 778 7131
520 23 11 12 18 11 8 7 31 11 14 9 18 4 26 16 1020 20 20 10 6 17 33 16 42 17 22 10 21 5 4 8 3
238 118 148 106 134 145 49 46 160 114 169 159 197 84 168 186 1147 8 11 2 7 2 5 1 5 2 2 2 3 5 4 82
130 50 60 34 58 46 34 36 51 40 32 72 102 78 75 46 57
502
1 132 40 21 11 9 11 19 4 30 9 17 29 43 22 22 29 26
12 2
61 1 4 1 1 1 1 2 3
101 6
34
23
23 38 28 9 12 11 22 14 9 2 4 1 3 3 34 7 7 11 16 13 13 8 38 29 10 39 51 30 60 38 18
140 131 140 146 127 130 121 101 206 126 116 111 94 51 136 133 8112 20 50 45 64 70 90 35 73 37 85 53 99 62 76 77 5622 14 17 18 27 30 19 34 45 27 65 46 38 17 43 22 2255 89 92 82 81 62 51 27 107 33 39 54 76 51 106 49 4259 85 110 54 101 122 68 43 114 125 52 101 121 65 109 84 787 18 25 7 10 9 10 5 23 19 7 11 3
59 44 34 27 25 30 15 12 50 38 27 31 62 16 18 31 222
224 26 32 18 39 39 9 12 99 57 50 35 32 12 41 19 29
50 76 58 69 83 99 41 32 178 103 95 64 92 61 223 105 6048 10 19 44 66 18 4 11 15 28 14 21 20 53 102 8265 81 96 70 47 113 148 61 155 164 184 183 195 113 230 109 65
854 555 531 554 584 616 507 333 1062 472 539 518 571 325 923 577 441559 322 408 356 420 227 390 432 795 507 631 737 720 441 917 599 344579 494 680 539 872 857 616 305 1115 772 724 1158 1157 491 579 707 1065
251838 733 793 567 592 733 357 460 788 683 519 675 1099 620 346 706 1022
10 23 32 11 18 11 8 1 9 3 5 10 3 5 11 10 915 1
5469 3622 4325 3369 4049 4351 3312 2647 6648 4408 4254 5136 6085 3345 5539 4784 4737
1.19 2.24 2.22 2.08 1.16 2.60 4.47 2.30 2.33 3.72 4.33 3.56 3.20 3.38 4.15 2.28 1.379 11 11 11 16 10 6 8 10 6 6 7 7 7 7 10 11
0.22 0.55 1.16 1.34 1.58 1.61 2.72 1.32 1.10 0.84 2.00 1.03 1.63 1.85 1.37 1.61 1.1823 21 15 14 13 13 9 12 15 15 11 15 12 12 14 14 14
0.20 0.39 0.55 0.24 0.17 0.18 0.21 0.26 0.15 0.14 0.12 0.06 0.15 0.45 0.32 0.21 0.3224 24 21 26 26 27 27 23 26 25 27 27 24 21 22 23 26
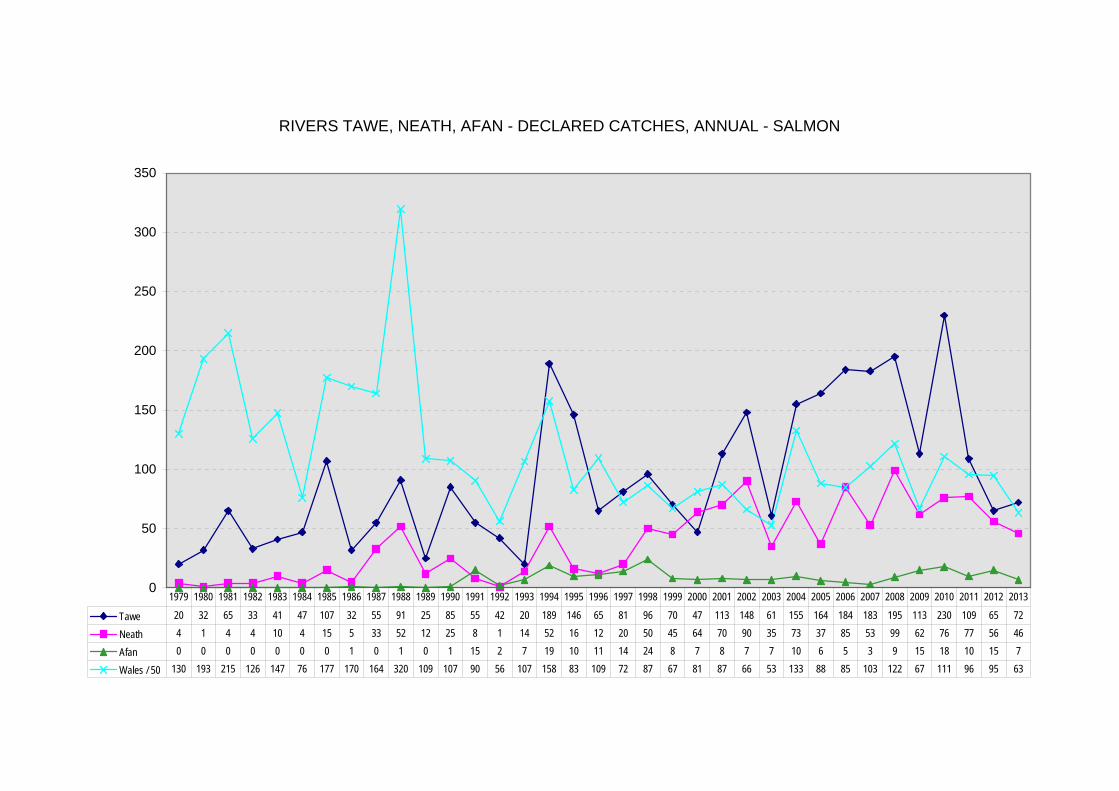
RIVERS TAWE, NEATH, AFAN - DECLARED CATCHES, ANNUAL - SALMON
0
50
100
150
200
250
300
350
Tawe 20 32 65 33 41 47 107 32 55 91 25 85 55 42 20 189 146 65 81 96 70 47 113 148 61 155 164 184 183 195 113 230 109 65 72
Neath 4 1 4 4 10 4 15 5 33 52 12 25 8 1 14 52 16 12 20 50 45 64 70 90 35 73 37 85 53 99 62 76 77 56 46
Afan 0 0 0 0 0 0 0 1 0 1 0 1 15 2 7 19 10 11 14 24 8 7 8 7 7 10 6 5 3 9 15 18 10 15 7
Wales / 50 130 193 215 126 147 76 177 170 164 320 109 107 90 56 107 158 83 109 72 87 67 81 87 66 53 133 88 85 103 122 67 111 96 95 63
1979 1980 1981 1982 1983 1984 1985 1986 1987 1988 1989 1990 1991 1992 1993 1994 1995 1996 1997 1998 1999 2000 2001 2002 2003 2004 2005 2006 2007 2008 2009 2010 2011 2012 2013

Declared Sewin Catches, Rod
RIVER 1979 1980 1981 1982 1983 1984 1985 1986 1987 1988 1989 1990 1991 1992 1993 1994
Aber 3 4 5 4 10 2 4 2 4 36 7 1 3Aeron 678 686 794 942 328 694 1216 695 985 1032 204 190 470 367 548 537Afan 10 10 3 7 97 133 268 214 32 155 300 50 152 295Alaw 2AlwenAmmanAnglesey 16 4 6Arth 60 41 52 11 15 117 28 157 79 6 1 1 12Artro 151 193 108 128 124 33 150 230 201 214 140 48 101 28 47 108Cefni 6CleifonClwyd catchment 1058 704 768 891 1514 1447 1744 1654 1548 1078 596 368 237 89 605 597ColwynConwy catchment 475 496 411 324 422 230 390 608 794 479 224 276 247 57 158 295CothiCresswell 43 6 53CychDee catchment 58 43 36 58 161 92 140 155 124 146 76 84 41 67 103 398Dulas 4 20 22 12 4 43Dwyfach 10 5 29 83 62 27 56 166 50 21 4 7Dwyfawr 2390 1776 2650 1605 1615 429 964 1281 1592 1693 696 688 513 60 274 1236Dwyryd 79 229 170 134 83 51 78 219 217 209 213 138 175 43 90 191Dyfi catchment 2320 2349 2418 1963 1434 984 1287 1755 2393 2601 1074 891 1117 413 1331 1987Dysynni 208 173 143 115 201 101 147 192 460 398 242 276 189 143 604 670EbbwEdenE / W Cleddau 561 494 553 1010 849 1238 866 966 2300 1222 446 365 346 139 1418 1214ElwyEly 6Erch 34 85 76 27 47 32 51 63 63 39 6 9 8 1 35EwennyGlaslyn 470 694 360 367 435 403 307 239 728 786 408 544 631 106 176 536Gwaun 8 1 5 6 2 36 26 27 41 17 8 14Gwendraeth Fach / Fawr 107 58 37 76 33 114 258 518 776 93 69 212 124 26 393GwiliGwyrfai 66 34 57 33 96 7 70 32 123 53 9 5 5 2 4 25IthonKenfig 2 2 9LledrLeri 4 2 2 7 8 2Llyfni 902 302 833 633 575 141 399 1070 511 803 131 57 60 9 206 808Loughor 103 162 204 125 96 88 287 83 428 407 87 156 176 70 176 314Mawddach catchment 1320 1453 1226 1110 1018 620 452 1391 1306 1548 1205 527 608 134 640 1338Neath 67 37 36 48 41 30 85 74 346 565 91 186 224 49 210 313Nevern 117 173 155 357 487 380 245 204 413 976 390 275 188 109 477 1182Ogmore / Ewenny 291 271 161 207 252 352 803 634 1061 974 221 393 342 207 395 583Ogwen 203 123 156 98 306 178 194 224 259 128 49 59 70 5 24 36Others 1309 2330 1064 746 627 123 169 96 326 241 92 81 85 11 167 232Rheidol 1017 524 502 888 962 660 532 625 814 819 410 176 137 17 134 717Rhydir 2 9 3 2 1 1 2Rhymney 6 7 8 14 11 6 6 19 29 16Seiont 412 445 666 643 862 186 337 290 476 489 127 117 132 9 56 125Soch 1 8 1Solva 37 14Taf 225 465 513 580 491 198 325 463 427 497 98 108 115 45 143 273Taff 84 135 257 227 208 22 85 61 40 130 111Tawe 585 365 385 443 490 719 658 469 1011 525 317 450 301 132 208 677Teifi 2572 2630 2504 2497 2786 2649 2558 2498 4999 3554 1236 813 1140 671 1566 3704TmymynTywi catchment 4534 4480 4862 4915 6312 5911 5079 3948 9580 7134 3907 2243 3109 1379 2821 4946UnknownUsk 28 30 38 55 43 89 95 68 31 56 95 64 41 14 81 265WnionWye 9 16 17 68 29 54 60 12 29 17 3 38 94Wyre 3 5 7 1 79 8 81 101 7 15 11Ystwyth 399 495 512 559 697 105 524 248 626 437 96 55 89 3 313 218OthersWales total 22641 22444 22485 21632 23561 18406 20856 21308 35727 30685 13203 10034 11586 4635 13350 24524
Tawe as %age of total 2.58 1.63 1.71 2.05 2.08 3.91 3.15 2.20 2.83 1.71 2.40 4.48 2.60 2.85 1.56 2.76Tawe position 11 16 16 15 14 6 9 13 9 16 11 7 10 9 14 10
Neath as %age of total 0.30 0.16 0.16 0.22 0.17 0.16 0.41 0.35 0.97 1.84 0.69 1.85 1.93 1.06 1.57 1.28Neath rank 25 29 30 28 31 31 30 29 22 15 25 15 14 19 13 19
Afan as %age of total 0.04 0.04 0.01 0.04 0.47 0.62 0.75 0.70 0.24 1.54 2.59 1.08 1.14 1.20Afan rank 32 32 35 35 28 26 24 24 31 18 11 18 20 20

Declared Sewin Catches, Rod
RIVER
AberAeronAfanAlawAlwenAmmanAngleseyArthArtroCefniCleifonClwyd catchmentColwynConwy catchmentCothiCresswellCychDee catchmentDulasDwyfachDwyfawrDwyrydDyfi catchmentDysynniEbbwEdenE / W Cleddau ElwyElyErchEwennyGlaslynGwaunGwendraeth Fach / FawrGwiliGwyrfaiIthonKenfigLledrLeriLlyfniLoughorMawddach catchmentNeathNevernOgmore / EwennyOgwenOthersRheidolRhydirRhymneySeiontSochSolvaTafTaffTaweTeifiTmymynTywi catchmentUnknownUskWnionWyeWyreYstwythOthersWales total
Tawe as %age of totalTawe position
Neath as %age of totalNeath rank
Afan as %age of totalAfan rank
1995 1996 1997 1998 1999 2000 2001 2002 2003 2004 2005 2006 2007 2008 2009 2010
6 11 854 152 196 481 568 280 364 777 422 396 205 35 306 151 96 126
115 254 223 286 195 188 166 103 162 168 153 63 158 161 120 104
7 431 36 30 37 24 40 94 63 44 30 29 23 17 24 12 28
491 528 717 1730 765 708 1319 868 982 1085 782 490 728 949 880 1498
435 304 232 514 351 391 583 630 572 468 489 282 585 434 423 498
1 1
141 152 148 265 159 177 283 414 249 265 303 253 276 192 181 49311 9 150
227 766 389 1337 765 1027 1261 1111 1246 347 691 235 455 145 187 552294 200 101 153 181 124 367 381 147 70 50 57 48 78 60 26721 752 1316 1787 2070 2032 2185 1793 1474 1362 1439 974 1459 1215 1425 2093221 499 552 729 464 435 406 343 688 471 502 284 410 315 420 396
33 30 3 4 16 16 6 4 6
433 425 578 1123 1297 755 651 869 738 439 937 227 511 681 496 564
124 33
491 491 553 393 436 383 240 1096 534 567 592 489 682 520 533 82611 3 186 15 10 114 111 58 99 154 101 59 56 61 71 67 10 47
5 5 4 23 1 2 3 22 4 4 9 7
1
1328 358 288 1035 182 384 542 290 518 187 221 108 257 63 85 13428 109 184 392 509 322 258 550 577 369 538 184 277 361 258 247
808 1145 714 934 1448 1020 1974 1529 1196 1127 1024 367 594 325 411 70473 138 194 332 340 535 673 782 400 532 393 298 487 317 492 493
414 598 180 756 893 584 1078 846 1125 606 722 539 415 674 488 755334 479 810 911 646 677 547 878 572 584 784 193 386 418 463 23263 99 129 182 88 104 112 193 148 130 177 86 170 65 146 2877 28 137 140 25 68 72 94 120 186 177 201 85
772 536 390 431 927 473 693 703 961 551 741 744 587 231 238 1971
13 1 4 11 7 10 14 55 28 17 9 11 23 28 26 2038 30 53 50 54 26 89 85 82 112 29 19 21 28 69 71
19 79 250 481 540 273 224 562 475 204 528 204 280 447 377 29592 133 91 236 229 105 174 90 71 62 55 14 45 115 67 54
247 246 447 294 404 136 373 424 272 173 372 153 243 144 241 4261212 2325 2146 3605 3809 3235 3694 4841 3997 3126 4342 1954 1774 1746 2058 2177
2300 1838 2462 4593 6242 4134 2056 4554 4175 2587 4698 2037 3271 2570 2833 2758
170 222 190 410 611 520 125 290 320 238 244 184 129 191 100 119
14 28 16 43 16 19 45 27 24 36 84 42 39 48 39 25
50 49 150 593 259 211 223 256 83 276 107 19 376 132 166 185
10693 13117 13914 24401 24616 19439 20991 25689 22519 16840 21477 10643 15290 12839 13498 16598
2.31 1.88 3.21 1.20 1.64 0.70 1.78 1.65 1.21 1.03 1.73 1.44 1.59 1.12 1.79 2.5714 16 10 21 17 23 15 17 20 23 17 19 21 21 15 13
0.68 1.05 1.39 1.36 1.38 2.75 3.21 3.04 1.78 3.16 1.83 2.80 3.19 2.47 3.64 2.9721 21 18 20 19 10 9 11 18 10 16 9 10 13 7 11
1.08 1.94 1.60 1.17 0.79 0.97 0.79 0.40 0.72 1.00 0.71 0.59 1.03 1.25 0.89 0.6319 15 16 22 22 21 24 26 22 24 24 22 24 18 21 25
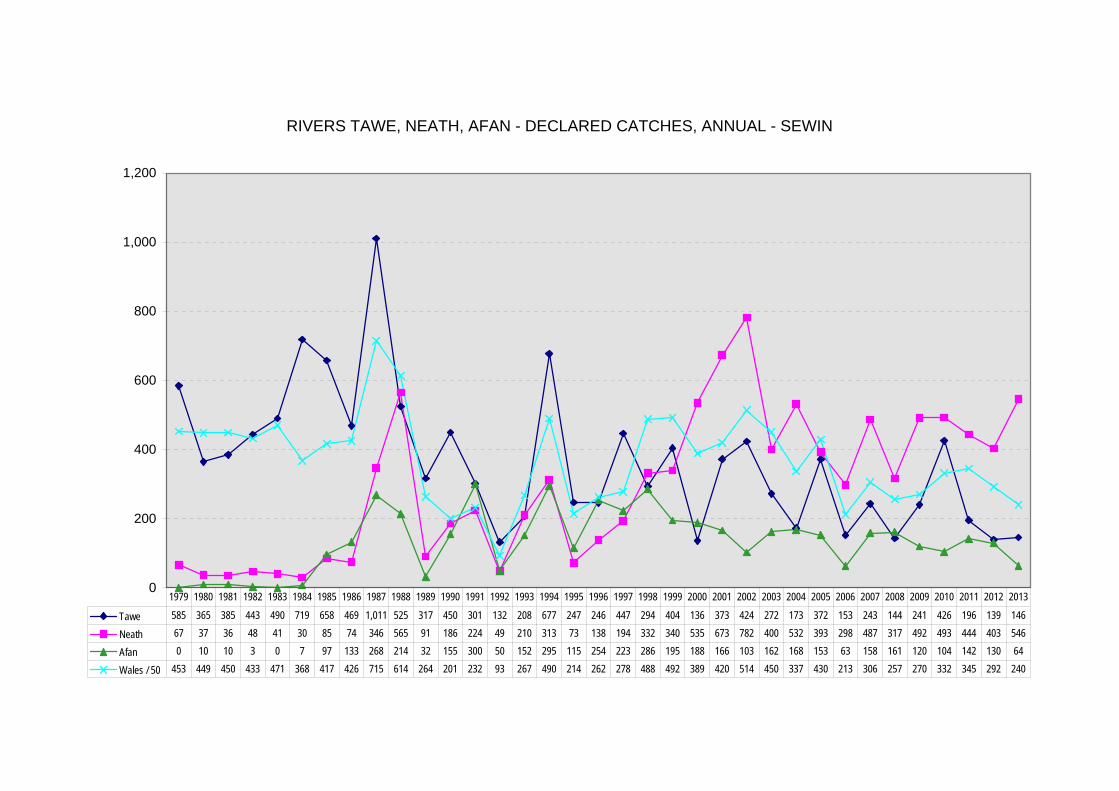
RIVERS TAWE, NEATH, AFAN - DECLARED CATCHES, ANNUAL - SEWIN
0
200
400
600
800
1,000
1,200
Tawe 585 365 385 443 490 719 658 469 1,011 525 317 450 301 132 208 677 247 246 447 294 404 136 373 424 272 173 372 153 243 144 241 426 196 139 146
Neath 67 37 36 48 41 30 85 74 346 565 91 186 224 49 210 313 73 138 194 332 340 535 673 782 400 532 393 298 487 317 492 493 444 403 546
Afan 0 10 10 3 0 7 97 133 268 214 32 155 300 50 152 295 115 254 223 286 195 188 166 103 162 168 153 63 158 161 120 104 142 130 64
Wales / 50 453 449 450 433 471 368 417 426 715 614 264 201 232 93 267 490 214 262 278 488 492 389 420 514 450 337 430 213 306 257 270 332 345 292 240
1979 1980 1981 1982 1983 1984 1985 1986 1987 1988 1989 1990 1991 1992 1993 1994 1995 1996 1997 1998 1999 2000 2001 2002 2003 2004 2005 2006 2007 2008 2009 2010 2011 2012 2013

Declared Salmon Catches, Rod, 5 Yr Averages
RIVER 79 to 83 80 to 84 81 to 85 82 to 86 83 to 87 84 to 88 85 to 89 86 to 90 87 to 91 88 to 92 89 to 93
Aber 2 2 2 2 2 1 1 1 1 1 0Aeron 12 12 17 13 16 25 24 17 17 14 5Afan 0 0 0 0 0 0 0 1 3 4 5Alaw 1 1 0 0 0 0 0 0 0 0 0Alwen 0 0 0 0 0 0 0 0 0 0 0Amman 0 0 0 0 0 0 0 0 0 0 0Anglesey 0 0 0 0 0 0 0 0 0 0 0Arth 0 0 0 0 1 2 1 1 2 1 0Artro 3 2 3 6 8 9 9 9 6 4 5Cefni 0 0 0 0 0 0 0 0 0 0 0Clwyd catchment 87 93 100 114 143 179 178 170 152 114 82Conwy catchment 386 387 391 405 407 458 472 478 433 367 259Cothi 0 0 0 0 0 0 0 0 0 0 0Cresswell 0 0 0 0 0 0 0 0 0 0 0Dee catchment 579 532 514 520 530 630 630 618 546 452 339Dulas 0 0 0 0 0 0 0 0 0 0 0Dwyfach 1 1 2 2 5 6 6 5 4 1 0Dwyfawr 70 55 57 56 58 68 68 65 55 45 27Dwyryd 37 35 34 35 34 36 39 39 33 27 20Dyfi catchment 282 258 288 281 328 397 389 361 351 282 199Dysynni 14 11 12 11 11 15 16 16 17 16 11Ebbw 0 0 0 0 0 0 0 0 0 0 0Eden 0 0 0 0 0 0 0 0 0 0 0E / W Cleddau 106 93 96 94 82 90 94 75 64 57 44Elwy 0 0 0 0 0 0 0 0 0 0 0Ely 0 0 0 0 0 0 0 0 0 0 0Erch 4 3 3 2 3 2 2 2 2 1 0Glaslyn 34 30 34 38 46 57 71 73 71 56 43Gwaun 0 0 0 0 0 0 0 0 1 1 1Gwendraeth Fach / Fawr 1 1 2 2 1 2 2 2 2 2 0Gwili 0 0 0 0 0 0 0 0 0 0 0Gwyrfai 12 12 12 12 14 17 16 15 14 9 3Irfon 0 0 0 0 0 0 0 0 0 0 0Kenfig 0 0 0 0 0 2 2 2 2 1 0Lledr 0 0 0 0 0 0 0 0 0 0 0Leri 0 0 0 0 1 0 0 0 0 0 0Lugg 0 0 0 0 0 0 0 0 0 0 0Llugwy 0 0 0 0 0 0 0 0 0 0 0Llyfni 37 32 31 27 28 32 35 29 26 21 14Loughor 11 10 12 13 13 15 16 13 11 10 7Mawddach catchment 223 200 182 184 211 231 269 304 286 237 187Neath 5 5 7 8 13 22 23 25 26 20 12Nevern 23 24 19 19 20 23 26 27 26 23 21Ogmore / Ewenny 6 7 13 19 22 29 30 26 21 19 23Ogwen 58 62 65 82 101 125 140 141 136 110 90Others 254 222 80 48 34 24 17 15 17 14 19Rheidol 31 28 35 47 63 77 88 87 77 56 35Rhydir 0 1 1 1 1 2 1 1 1 1 0Rhymney 0 0 0 0 0 0 0 0 0 2 3Seiont 87 89 86 90 70 110 114 121 117 102 47Soch 0 0 1 1 1 1 1 0 0 0 0Solva 0 0 0 0 1 1 1 1 1 0 0Taf 169 145 119 110 99 101 100 82 73 61 41Taff 0 0 3 6 13 36 37 48 53 48 33Tawe 38 44 59 52 56 66 62 58 62 60 45Teifi 619 566 627 663 746 962 972 909 821 661 369Tywi catchment 966 868 864 795 781 863 852 757 741 619 407Usk 589 551 558 495 471 652 686 573 524 479 349Wnion 0 0 0 0 0 0 0 0 0 0 0Wye 3342 3168 3051 2679 2878 3666 3874 3503 3085 2811 1940Wyre 3 3 8 8 10 10 10 6 4 2 1Ystwyth 25 24 27 27 25 24 25 25 23 19 10Unknown 0 0 0 0 0 0 0 0 0 0 0Wales total 8115 7575 7415 6966 7349 9071 9402 8701 7907 6828 4698
Tawe as %age of total 0.47 0.58 0.79 0.75 0.77 0.73 0.66 0.66 0.79 0.87 0.97Tawe rank 16 16 15 15 16 16 17 17 16 13 12
Neath as %age of total 0.06 0.06 0.10 0.11 0.18 0.24 0.25 0.29 0.33 0.29 0.26Neath rank 28 28 29 29 26 26 25 23 21 22 24
Afan as %age of total 0.00 0.00 0.00 0.00 0.00 0.00 0.00 0.01 0.04 0.06 0.11Afan rank 38 41 41 39 41 41 41 40 33 31 29

Declared Salmon Catches, Rod, 5 Yr Averages
RIVER
AberAeronAfanAlawAlwenAmmanAngleseyArthArtroCefniClwyd catchmentConwy catchmentCothiCresswellDee catchmentDulasDwyfachDwyfawrDwyrydDyfi catchmentDysynniEbbwEdenE / W Cleddau ElwyElyErchGlaslynGwaunGwendraeth Fach / FawrGwiliGwyrfaiIrfonKenfigLledrLeriLuggLlugwyLlyfniLoughorMawddach catchmentNeathNevernOgmore / EwennyOgwenOthersRheidolRhydirRhymneySeiontSochSolvaTafTaffTaweTeifiTywi catchmentUskWnionWyeWyreYstwythUnknownWales total
Tawe as %age of totalTawe rank
Neath as %age of totalNeath rank
Afan as %age of totalAfan rank
90 to 94 91 to 95 92 to 96 93 to 97 94 to 98 95 to 99 96 to 00 97 to 01 98 to 02 99 to 03 00 to 04
0 0 1 1 1 1 1 0 0 0 06 6 6 5 3 3 4 5 6 9 119 11 10 12 16 13 13 12 11 7 80 0 0 0 0 0 0 0 0 0 00 0 0 0 0 0 0 0 0 0 00 0 0 0 0 0 0 0 0 0 00 0 0 0 0 0 0 0 0 0 00 0 0 0 0 0 0 0 0 0 06 6 6 6 6 5 4 4 4 2 20 0 0 0 0 0 0 0 0 0 0
96 88 82 84 81 62 61 68 73 58 59236 190 183 190 178 151 151 152 150 153 187
0 0 0 0 0 0 0 0 0 0 00 0 0 0 0 0 0 0 0 0 0
430 445 456 510 544 476 448 485 497 456 5940 0 0 0 0 0 0 0 0 0 00 0 0 0 0 0 0 0 0 0 0
29 19 21 22 23 17 17 15 12 11 1521 18 19 23 22 18 15 15 17 16 23
209 181 193 202 187 154 149 130 116 96 10713 10 9 8 9 6 7 6 5 3 40 0 0 0 0 0 0 0 0 0 00 0 0 0 0 0 0 0 0 0 0
49 54 53 57 53 43 46 50 46 42 450 0 0 0 0 0 0 0 0 0 00 0 0 0 0 0 0 0 0 0 00 0 0 0 0 0 0 0 0 0 0
37 33 30 38 38 31 23 18 14 11 151 0 0 0 0 0 0 0 0 0 01 0 0 0 0 0 0 0 0 0 00 0 0 0 0 0 0 0 0 0 04 3 3 3 2 1 0 0 0 0 10 0 0 0 0 0 0 0 0 0 00 0 0 0 0 0 0 0 0 0 00 0 0 0 0 0 0 0 0 0 00 0 0 0 0 0 0 0 0 0 00 0 0 0 0 0 0 0 0 0 00 0 0 0 0 0 0 0 0 0 0
15 17 20 27 29 24 22 20 16 14 148 6 6 7 6 6 9 11 12 12 18
179 143 142 161 166 137 137 135 133 125 13720 18 19 23 30 29 38 50 64 61 6627 34 35 37 36 25 20 21 22 26 3135 42 50 65 72 74 80 81 74 61 6682 79 71 85 88 77 82 94 91 78 9019 16 12 16 12 12 13 14 12 8 1128 28 35 43 47 43 38 32 26 22 260 0 0 0 0 0 0 0 0 0 03 3 3 1 0 0 0 0 0 0 0
38 26 23 27 27 25 28 31 27 23 400 0 0 0 0 0 0 0 0 0 00 0 0 0 0 0 0 0 0 0 0
67 66 63 75 74 57 67 77 70 65 8750 48 50 50 45 37 37 31 30 26 2078 90 92 100 115 92 72 81 95 88 105
450 405 493 577 597 560 616 568 558 519 620477 488 503 538 542 434 413 347 360 365 453497 548 600 679 668 562 633 688 713 638 753
0 0 0 0 0 0 0 0 0 0 01948 1806 1825 1601 1350 996 905 684 608 542 586
1 0 0 0 0 0 0 0 0 0 012 9 11 15 19 17 19 19 16 10 90 0 0 0 0 0 0 0 0 0 0
5182 4937 5126 5289 5087 4186 4167 3943 3881 3546 4201
1.51 1.83 1.80 1.89 2.27 2.19 1.72 2.06 2.44 2.48 2.4911 9 9 9 9 9 11 10 9 9 9
0.39 0.37 0.37 0.43 0.59 0.68 0.92 1.26 1.64 1.71 1.5822 21 22 21 19 18 15 14 14 12 12
0.17 0.21 0.19 0.23 0.31 0.32 0.31 0.31 0.28 0.21 0.1927 25 26 26 25 25 26 26 27 28 28

Declared Salmon Catches, Rod, 5 Yr Averages
RIVER
AberAeronAfanAlawAlwenAmmanAngleseyArthArtroCefniClwyd catchmentConwy catchmentCothiCresswellDee catchmentDulasDwyfachDwyfawrDwyrydDyfi catchmentDysynniEbbwEdenE / W Cleddau ElwyElyErchGlaslynGwaunGwendraeth Fach / FawrGwiliGwyrfaiIrfonKenfigLledrLeriLuggLlugwyLlyfniLoughorMawddach catchmentNeathNevernOgmore / EwennyOgwenOthersRheidolRhydirRhymneySeiontSochSolvaTafTaffTaweTeifiTywi catchmentUskWnionWyeWyreYstwythUnknownWales total
Tawe as %age of totalTawe rank
Neath as %age of totalNeath rank
Afan as %age of totalAfan rank
01 to 05 02 to 06 03 to 07 04 to 08 05 to 09 06 to 10 07 to 11 08 to 12 09 to 13
0 0 0 0 0 0 0 0 010 9 7 5 2 2 2 4 38 7 6 7 8 10 11 13 130 0 0 0 0 0 0 0 00 0 0 0 0 0 0 0 00 0 0 0 0 0 0 0 00 0 0 0 0 0 0 0 00 0 0 0 0 0 0 0 03 4 3 4 4 3 2 2 10 0 0 0 0 0 0 0 0
51 42 59 87 88 130 154 137 107180 167 184 192 169 202 205 187 170
0 0 0 0 0 0 0 8 80 0 0 0 0 0 0 0 0
684 682 720 813 699 695 730 736 6370 0 0 0 0 0 0 0 00 0 0 0 0 0 1 1 1
14 14 14 17 11 14 15 15 1225 26 21 22 15 12 10 8 5
103 108 130 160 145 155 159 150 1193 3 2 3 3 3 3 4 40 0 0 0 0 0 0 0 10 0 0 0 0 0 0 0 0
41 39 46 59 65 72 75 72 590 0 0 0 0 0 0 10 100 0 0 0 0 0 0 0 00 0 0 0 0 0 0 0 0
15 16 18 26 24 27 29 28 290 0 0 0 0 0 0 0 00 0 0 0 0 0 0 1 10 0 0 0 0 0 0 1 11 1 1 1 1 1 1 1 20 0 0 0 0 0 0 2 20 1 1 1 1 1 0 0 00 0 0 0 0 0 0 7 70 0 0 0 0 0 0 0 00 0 0 0 0 0 0 0 00 0 0 0 0 0 0 1 1
12 9 6 3 2 2 2 2 220 20 25 33 32 38 44 39 33
137 134 132 131 100 102 105 99 8761 64 57 69 67 75 73 74 6331 38 43 44 39 42 33 28 2756 51 52 62 51 65 67 65 5294 80 87 103 93 90 96 91 7413 11 11 10 7 4 4 3 329 28 32 42 35 31 32 30 240 0 0 0 0 0 0 0 00 0 0 0 0 0 0 0 0
43 45 51 55 37 34 28 27 220 0 0 0 0 0 0 0 00 0 0 0 0 0 0 0 0
91 90 94 106 83 107 109 108 9910 12 14 18 20 27 42 56 59
128 142 149 176 168 181 166 142 118598 583 585 632 485 575 583 567 520470 551 620 678 607 689 683 604 546733 706 815 985 860 822 818 800 676
0 0 0 0 0 0 0 5 5604 561 625 753 719 652 689 759 698
0 0 0 0 0 0 0 0 06 5 6 6 5 7 8 8 90 3 3 3 3 3 0 0 0
4273 4254 4619 5306 4646 4872 4978 4898 4314
3.00 3.35 3.23 3.32 3.61 3.72 3.33 2.91 2.738 7 7 7 7 7 7 8 8
1.43 1.50 1.23 1.31 1.45 1.54 1.47 1.51 1.4712 12 13 13 13 13 14 13 13
0.18 0.16 0.13 0.12 0.16 0.21 0.22 0.27 0.3027 27 26 25 24 24 23 23 22
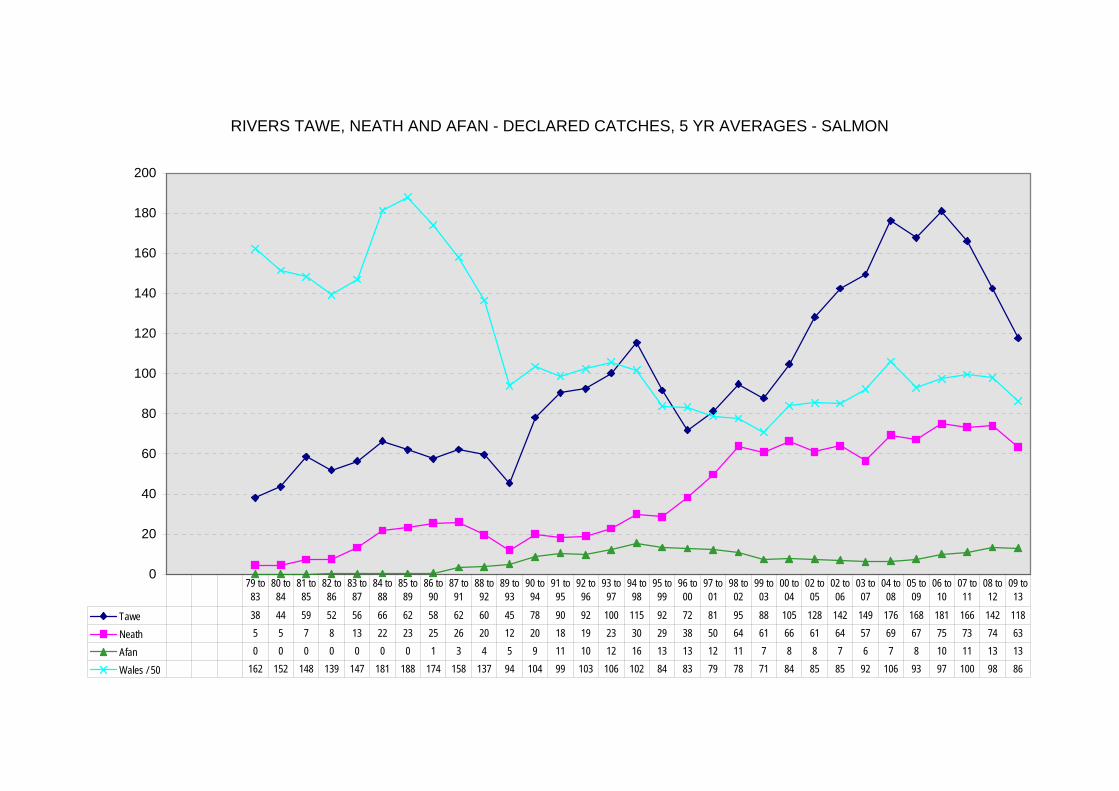
RIVERS TAWE, NEATH AND AFAN - DECLARED CATCHES, 5 YR AVERAGES - SALMON
0
20
40
60
80
100
120
140
160
180
200
Tawe 38 44 59 52 56 66 62 58 62 60 45 78 90 92 100 115 92 72 81 95 88 105 128 142 149 176 168 181 166 142 118
Neath 5 5 7 8 13 22 23 25 26 20 12 20 18 19 23 30 29 38 50 64 61 66 61 64 57 69 67 75 73 74 63
Afan 0 0 0 0 0 0 0 1 3 4 5 9 11 10 12 16 13 13 12 11 7 8 8 7 6 7 8 10 11 13 13
Wales / 50 162 152 148 139 147 181 188 174 158 137 94 104 99 103 106 102 84 83 79 78 71 84 85 85 92 106 93 97 100 98 86
79 to 83
80 to 84
81 to 85
82 to 86
83 to 87
84 to 88
85 to 89
86 to 90
87 to 91
88 to 92
89 to 93
90 to 94
91 to 95
92 to 96
93 to 97
94 to 98
95 to 99
96 to 00
97 to 01
98 to 02
99 to 03
00 to 04
02 to 05
02 to 06
03 to 07
04 to 08
05 to 09
06 to 10
07 to 11
08 to 12
09 to 13

Declared Sewin Catches, Rod, 5 Yr Averages
RIVER 79 to 83 80 to 84 81 to 85 82 to 86 83 to 87 84 to 88 85 to 89 86 to 90 87 to 91 88 to 92 89 to 93 90 to 94
Aber 3 5 5 5 4 4 10 11 10 10 9 2Aeron 686 689 795 775 784 924 826 621 576 453 356 422Afan 5 6 23 48 101 144 149 160 194 150 138 190Alaw 0 0 0 0 0 0 0 0 0 0 0 0Alwen 0 0 0 0 0 0 0 0 0 0 0 0Amman 0 0 0 0 0 0 0 0 0 0 0 0Anglesey 0 0 0 0 0 0 3 4 5 5 5 2Arth 33 36 47 45 66 79 77 54 49 17 2 3Artro 141 117 109 133 148 166 187 167 141 106 73 66Cefni 0 0 0 0 0 0 0 0 0 1 1 1Cleifon 0 0 0 0 0 0 0 0 0 0 0 0Clwyd catchment 987 1065 1273 1450 1581 1494 1324 1049 765 474 379 379Colwyn 0 0 0 0 0 0 0 0 0 0 0 0Conwy catchment 426 377 355 395 489 500 499 476 404 257 192 207Cothi 0 0 0 0 0 0 0 0 0 0 0 0Cresswell 0 0 0 0 0 0 9 10 20 20 20 12Cych 0 0 0 0 0 0 0 0 0 0 0 0Dee catchment 71 78 97 121 134 131 128 117 94 83 74 139Dulas 0 0 1 5 9 12 12 11 7 3 1 9Dwyfach 25 38 41 51 79 72 64 59 50 16 6 2Dwyfawr 2007 1615 1453 1179 1176 1192 1245 1190 1036 730 446 554Dwyryd 139 133 103 113 130 155 187 199 190 156 132 127Dyfi catchment 2097 1830 1617 1485 1571 1804 1822 1743 1615 1219 965 1148Dysynni 168 147 141 151 220 260 288 314 313 250 291 376Ebbw 0 0 0 0 0 0 0 0 0 0 0 0Eden 0 0 0 0 0 0 0 0 0 0 0 0E / W Cleddau 693 829 903 986 1244 1318 1160 1060 936 504 543 696Elwy 0 0 0 0 0 0 0 0 0 0 0 0Ely 0 0 0 0 0 0 0 0 0 1 1 1Erch 54 53 47 44 51 50 44 36 25 13 5 11Ewenny 0 0 0 0 0 0 0 0 0 0 0 0Glaslyn 465 452 374 350 422 493 494 541 619 495 373 399Gwaun 4 4 10 15 19 26 29 24 21 16 8 4Gwendraeth Fach / Fawr 56 62 64 104 200 340 352 343 334 255 105 165Gwili 0 0 0 0 0 0 0 0 0 0 0 0Gwyrfai 57 45 53 48 66 57 57 44 39 15 5 8Ithon 0 0 0 0 0 0 0 0 0 0 0 0Kenfig 0 0 0 1 3 3 2 2 2 0 0 0Lledr 0 0 0 0 0 0 0 0 0 0 0 0Leri 1 1 1 2 3 4 4 4 3 2 0 0Llyfni 649 497 516 564 539 585 583 514 312 212 93 228Loughor 138 135 160 136 196 259 258 232 251 179 133 178Mawddach catchment 1225 1085 885 918 957 1063 1180 1195 1039 804 623 649Neath 46 38 48 56 115 220 232 252 282 223 152 196Nevern 258 310 325 335 346 444 446 452 448 388 288 446Ogmore / Ewenny 236 249 355 450 620 765 739 657 598 427 312 384Ogwen 177 172 186 200 232 197 171 144 113 62 41 39Others 1215 978 546 352 268 191 185 167 165 102 87 115Rheidol 779 707 709 733 719 690 640 569 471 312 175 236Rhydir 0 0 2 3 3 3 3 2 1 1 1 0Rhymney 0 0 1 3 4 7 9 9 9 11 14 15Seiont 606 560 539 464 430 356 344 300 268 175 88 88Soch 0 0 2 2 2 2 2 0 0 0 0 0Solva 0 0 0 0 7 10 10 10 10 3 0 0Taf 455 449 421 411 381 382 362 319 249 173 102 137Taff 0 17 44 95 141 182 170 160 121 83 68 85Tawe 454 480 539 556 669 676 596 554 521 345 282 354Teifi 2598 2613 2599 2598 3098 3252 2969 2620 2348 1483 1085 1579Tmymyn 0 0 0 0 0 0 0 0 0 0 0 0Tywi catchment 5021 5296 5416 5233 6166 6330 5930 5362 5195 3554 2692 2900Unknown 0 0 0 0 0 0 0 0 0 0 0 0Usk 39 51 64 70 65 68 69 63 57 54 59 93Wnion 0 0 0 0 0 0 0 0 0 0 0 0Wye 5 7 20 26 37 46 45 37 34 24 20 36Wyre 3 3 18 19 35 54 55 42 43 27 7 5Ystwyth 532 474 479 427 440 388 386 292 261 136 111 136Others 0 0 0 0 0 0 0 0 0 0 0 0Wales total 22553 21706 21388 21153 23972 25396 24356 22191 20247 14029 10562 12826
Tawe as %age of total 2.01 2.21 2.52 2.63 2.79 2.66 2.45 2.50 2.57 2.46 2.67 2.76Tawe rank 16 13 11 11 10 11 11 11 11 12 13 13
Neath as %age of total 0.20 0.18 0.22 0.26 0.48 0.87 0.95 1.14 1.39 1.59 1.44 1.53Neath rank 29 30 29 29 28 22 22 21 18 17 16 17
Afan as %age of total 0.02 0.03 0.11 0.23 0.42 0.57 0.61 0.72 0.96 1.07 1.30 1.48Afan rank 34 35 34 31 29 28 28 26 23 23 17 18

Declared Sewin Catches, Rod, 5 Yr Averages
RIVER
AberAeronAfanAlawAlwenAmmanAngleseyArthArtroCefniCleifonClwyd catchmentColwynConwy catchmentCothiCresswellCychDee catchmentDulasDwyfachDwyfawrDwyrydDyfi catchmentDysynniEbbwEdenE / W Cleddau ElwyElyErchEwennyGlaslynGwaunGwendraeth Fach / FawrGwiliGwyrfaiIthonKenfigLledrLeriLlyfniLoughorMawddach catchmentNeathNevernOgmore / EwennyOgwenOthersRheidolRhydirRhymneySeiontSochSolvaTafTaffTaweTeifiTmymynTywi catchmentUnknownUskWnionWyeWyreYstwythOthersWales total
Tawe as %age of totalTawe rank
Neath as %age of totalNeath rank
Afan as %age of totalAfan rank
91 to 95 92 to 96 93 to 97 94 to 98 95 to 99 96 to 00 97 to 01 98 to 02 99 to 03 00 to 04 02 to 05 02 to 06
2 4 3 3 3 2 0 0 0 0 0 2395 332 297 284 290 335 378 494 482 448 433 367182 173 208 235 215 229 212 188 163 157 150 130
0 0 0 0 0 0 0 0 0 0 0 00 0 0 0 0 0 0 0 0 0 0 00 0 0 0 0 0 0 0 0 0 0 01 0 0 0 0 0 0 0 0 0 0 03 4 4 4 1 1 0 0 0 0 0 1
63 50 50 48 32 33 45 52 53 54 52 381 1 0 0 0 0 0 0 0 0 0 00 0 0 0 0 0 0 0 0 0 0 0
404 462 588 813 846 890 1048 1078 928 992 1007 8410 0 0 0 0 0 0 0 0 0 0 0
238 250 285 356 367 358 414 494 505 529 548 4880 0 0 0 0 0 0 0 0 0 0 0
11 0 0 0 0 0 0 0 0 0 0 00 0 0 0 0 0 0 0 0 0 0 0
150 172 188 221 173 180 206 260 256 278 303 29710 10 9 9 0 0 0 0 0 0 0 02 2 2 2 2 2 0 0 0 0 0 0
462 513 578 791 697 857 956 1100 1082 998 931 726159 164 175 188 186 152 185 241 240 218 203 141
1114 1041 1221 1313 1329 1591 1878 1973 1911 1769 1651 1408365 427 509 534 493 536 517 475 467 469 482 458
0 7 13 13 13 13 7 5 8 9 8 80 0 0 0 0 0 0 0 0 0 0 0
710 726 814 755 771 836 881 939 862 690 727 6420 0 0 0 0 0 0 0 0 0 0 01 1 0 0 0 0 0 0 0 0 0 0
14 19 18 18 11 7 0 0 0 0 0 00 0 0 0 0 0 0 0 0 0 0 0
388 360 449 493 473 451 401 510 538 564 606 6565 3 3 3 3 1 0 0 0 0 0 0
152 113 90 108 51 62 78 107 105 94 94 860 0 0 0 0 0 0 0 0 0 0 08 8 9 12 8 7 7 10 6 6 7 60 0 0 0 0 0 0 0 0 0 0 00 0 0 0 0 0 0 0 0 0 0 00 0 0 0 0 0 0 0 0 0 0 00 0 0 0 0 0 0 0 0 0 0 0
282 342 398 563 438 449 486 487 383 384 352 265153 139 162 205 244 303 333 406 443 415 458 444706 813 929 988 1010 1052 1218 1381 1433 1369 1370 1049174 157 186 210 215 308 415 532 546 584 556 481474 556 570 626 568 602 698 831 905 848 875 768372 400 520 623 636 705 718 732 664 652 673 60240 45 70 102 112 120 123 136 129 137 152 147
100 89 114 109 67 80 88 80 76 108 130 115355 435 510 569 611 551 583 645 751 676 730 740
0 0 0 0 0 0 0 0 0 0 0 017 16 13 9 7 7 9 19 23 25 25 2472 52 60 59 45 43 54 61 67 79 79 650 0 0 0 0 0 0 0 0 0 0 00 0 0 0 0 0 0 0 0 0 0 0
119 112 153 220 274 325 354 416 415 348 399 39587 101 111 133 156 159 167 167 134 100 90 58
313 302 365 382 328 305 331 326 322 276 323 2791659 1896 2191 2598 2619 3024 3298 3837 3915 3779 4000 3652
0 0 0 0 0 0 0 0 0 0 0 02911 2657 2873 3228 3487 3854 3897 4316 4232 3501 3614 3610
0 0 0 0 0 0 0 0 0 0 0 0114 150 186 251 321 391 371 391 373 299 243 255
0 0 0 0 0 0 0 0 0 0 0 033 35 38 39 23 24 28 30 26 30 43 432 0 0 0 0 0 0 0 0 0 0 0
135 127 156 212 220 252 287 308 206 210 189 1480 0 0 0 0 0 0 0 0 0 0 0
12958 13264 15120 17330 17348 19097 20672 23027 22651 21096 21503 19434
2.42 2.28 2.41 2.21 1.89 1.60 1.60 1.42 1.42 1.31 1.50 1.4314 15 14 14 15 19 20 20 20 21 19 19
1.34 1.18 1.23 1.21 1.24 1.61 2.01 2.31 2.41 2.77 2.59 2.4818 20 19 22 21 18 13 11 11 11 12 13
1.41 1.31 1.37 1.35 1.24 1.20 1.02 0.81 0.72 0.75 0.70 0.6717 17 17 18 22 22 22 24 24 24 25 25

Declared Sewin Catches, Rod, 5 Yr Averages
RIVER
AberAeronAfanAlawAlwenAmmanAngleseyArthArtroCefniCleifonClwyd catchmentColwynConwy catchmentCothiCresswellCychDee catchmentDulasDwyfachDwyfawrDwyrydDyfi catchmentDysynniEbbwEdenE / W Cleddau ElwyElyErchEwennyGlaslynGwaunGwendraeth Fach / FawrGwiliGwyrfaiIthonKenfigLledrLeriLlyfniLoughorMawddach catchmentNeathNevernOgmore / EwennyOgwenOthersRheidolRhydirRhymneySeiontSochSolvaTafTaffTaweTeifiTmymynTywi catchmentUnknownUskWnionWyeWyreYstwythOthersWales total
Tawe as %age of totalTawe rank
Neath as %age of totalNeath rank
Afan as %age of totalAfan rank
03 to 07 04 to 08 05 to 09 06 to 10 07 to 11 08 to 12 09 to 13
2 2 2 2 0 0 0273 219 159 143 165 166 148141 141 131 121 137 131 112
0 0 0 0 0 0 00 0 0 0 0 1 10 0 0 0 0 0 00 0 0 0 0 0 01 1 1 1 0 1 1
29 25 21 21 23 21 210 0 0 0 0 0 10 0 0 0 0 0 0
813 807 766 909 1005 1056 10170 0 0 0 0 0 0
479 452 443 444 484 444 4610 0 0 0 0 0 00 0 0 0 0 4 40 0 0 0 0 5 5
269 258 241 279 330 366 4190 0 0 0 1 4 40 0 0 30 48 50 50
595 375 343 315 327 285 43874 61 59 54 47 45 36
1342 1290 1302 1433 1768 1898 2009471 396 386 365 396 388 411
4 2 2 2 3 5 40 0 0 0 0 0 0
570 559 570 496 556 521 4390 0 0 0 0 85 850 0 0 0 0 1 10 0 0 0 0 4 40 0 0 0 0 0 0
573 570 563 610 648 603 6710 0 0 4 4 11 11
70 63 53 51 51 47 410 0 0 0 0 31 313 3 4 3 5 4 50 0 0 0 0 0 00 0 0 0 0 0 00 0 0 0 0 2 20 0 0 0 1 1 1
258 167 147 129 154 129 136389 346 324 265 258 253 195862 687 544 480 578 536 558422 405 397 417 447 430 476681 591 568 574 566 598 532504 473 449 338 417 475 443142 126 129 151 181 189 206137 113 93 57 60 20 20717 571 508 399 321 290 310
0 0 0 0 0 0 018 18 19 22 20 16 1153 42 33 42 62 68 690 0 0 0 0 0 00 0 0 0 0 0 0
338 333 367 321 346 336 25649 58 59 59 89 80 58
243 217 231 241 250 229 2303039 2588 2375 1942 2147 2176 2107
0 0 0 0 0 0 03354 3033 3082 2694 2808 2561 2399
0 0 0 0 0 0 0223 197 170 145 130 131 112
0 0 0 0 0 28 2845 50 50 39 42 44 430 0 0 0 0 0 0
172 182 160 176 224 183 1650 0 0 0 0 7 7
17354 15418 14749 13774 15100 14963 14797
1.40 1.41 1.56 1.75 1.66 1.53 1.5520 19 18 18 18 18 17
2.43 2.63 2.69 3.03 2.96 2.87 3.2114 12 12 10 10 11 8
0.81 0.91 0.89 0.88 0.91 0.88 0.7624 23 23 24 23 22 23
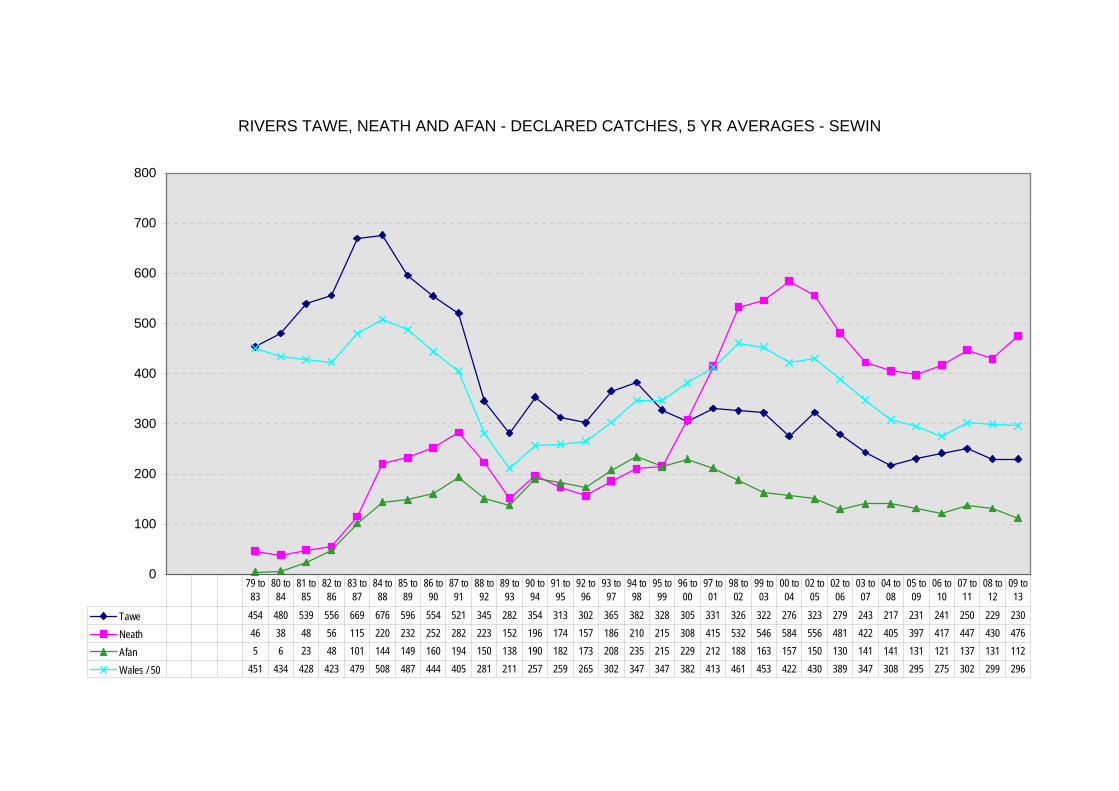
RIVERS TAWE, NEATH AND AFAN - DECLARED CATCHES, 5 YR AVERAGES - SEWIN
0
100
200
300
400
500
600
700
800
Tawe 454 480 539 556 669 676 596 554 521 345 282 354 313 302 365 382 328 305 331 326 322 276 323 279 243 217 231 241 250 229 230
Neath 46 38 48 56 115 220 232 252 282 223 152 196 174 157 186 210 215 308 415 532 546 584 556 481 422 405 397 417 447 430 476
Afan 5 6 23 48 101 144 149 160 194 150 138 190 182 173 208 235 215 229 212 188 163 157 150 130 141 141 131 121 137 131 112
Wales / 50 451 434 428 423 479 508 487 444 405 281 211 257 259 265 302 347 347 382 413 461 453 422 430 389 347 308 295 275 302 299 296
79 to 83
80 to 84
81 to 85
82 to 86
83 to 87
84 to 88
85 to 89
86 to 90
87 to 91
88 to 92
89 to 93
90 to 94
91 to 95
92 to 96
93 to 97
94 to 98
95 to 99
96 to 00
97 to 01
98 to 02
99 to 03
00 to 04
02 to 05
02 to 06
03 to 07
04 to 08
05 to 09
06 to 10
07 to 11
08 to 12
09 to 13
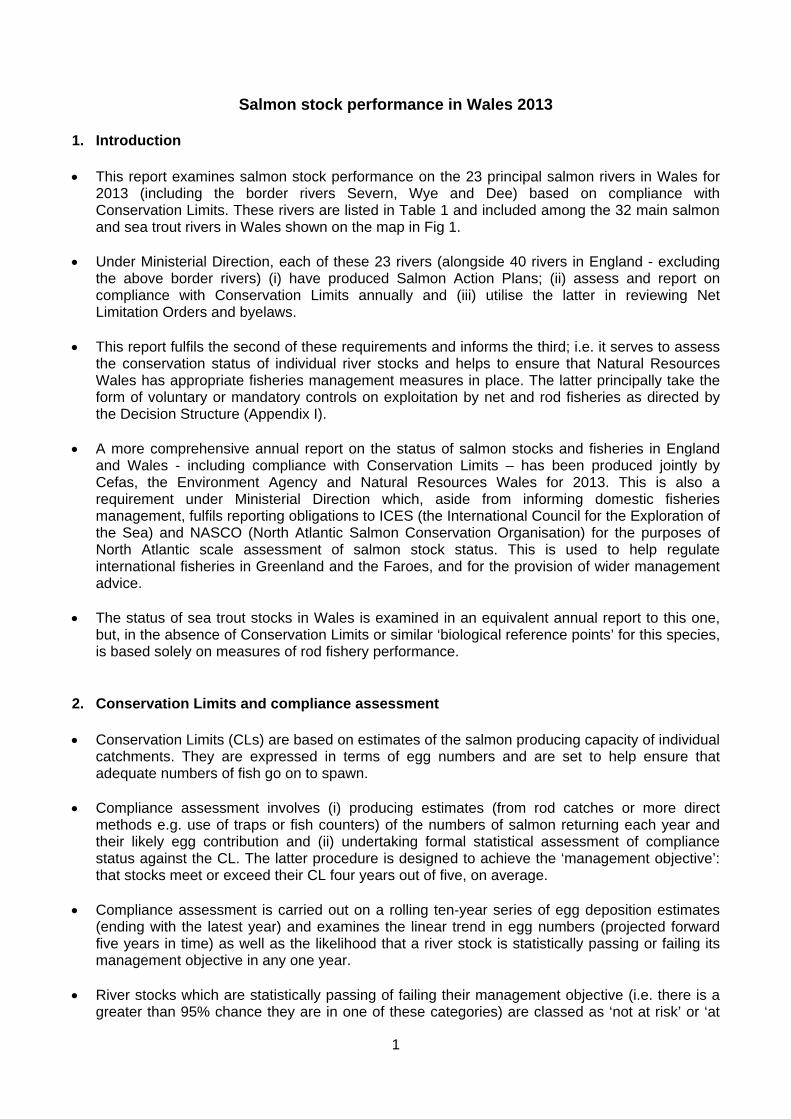
1
Salmon stock performance in Wales 2013 1. Introduction
• This report examines salmon stock performance on the 23 principal salmon rivers in Wales for
2013 (including the border rivers Severn, Wye and Dee) based on compliance with Conservation Limits. These rivers are listed in Table 1 and included among the 32 main salmon and sea trout rivers in Wales shown on the map in Fig 1.
• Under Ministerial Direction, each of these 23 rivers (alongside 40 rivers in England - excluding
the above border rivers) (i) have produced Salmon Action Plans; (ii) assess and report on compliance with Conservation Limits annually and (iii) utilise the latter in reviewing Net Limitation Orders and byelaws.
• This report fulfils the second of these requirements and informs the third; i.e. it serves to assess
the conservation status of individual river stocks and helps to ensure that Natural Resources Wales has appropriate fisheries management measures in place. The latter principally take the form of voluntary or mandatory controls on exploitation by net and rod fisheries as directed by the Decision Structure (Appendix I).
• A more comprehensive annual report on the status of salmon stocks and fisheries in England
and Wales - including compliance with Conservation Limits – has been produced jointly by Cefas, the Environment Agency and Natural Resources Wales for 2013. This is also a requirement under Ministerial Direction which, aside from informing domestic fisheries management, fulfils reporting obligations to ICES (the International Council for the Exploration of the Sea) and NASCO (North Atlantic Salmon Conservation Organisation) for the purposes of North Atlantic scale assessment of salmon stock status. This is used to help regulate international fisheries in Greenland and the Faroes, and for the provision of wider management advice.
• The status of sea trout stocks in Wales is examined in an equivalent annual report to this one,
but, in the absence of Conservation Limits or similar ‘biological reference points’ for this species, is based solely on measures of rod fishery performance.
2. Conservation Limits and compliance assessment • Conservation Limits (CLs) are based on estimates of the salmon producing capacity of individual
catchments. They are expressed in terms of egg numbers and are set to help ensure that adequate numbers of fish go on to spawn.
• Compliance assessment involves (i) producing estimates (from rod catches or more direct
methods e.g. use of traps or fish counters) of the numbers of salmon returning each year and their likely egg contribution and (ii) undertaking formal statistical assessment of compliance status against the CL. The latter procedure is designed to achieve the ‘management objective’: that stocks meet or exceed their CL four years out of five, on average.
• Compliance assessment is carried out on a rolling ten-year series of egg deposition estimates
(ending with the latest year) and examines the linear trend in egg numbers (projected forward five years in time) as well as the likelihood that a river stock is statistically passing or failing its management objective in any one year.
• River stocks which are statistically passing of failing their management objective (i.e. there is a
greater than 95% chance they are in one of these categories) are classed as ‘not at risk’ or ‘at
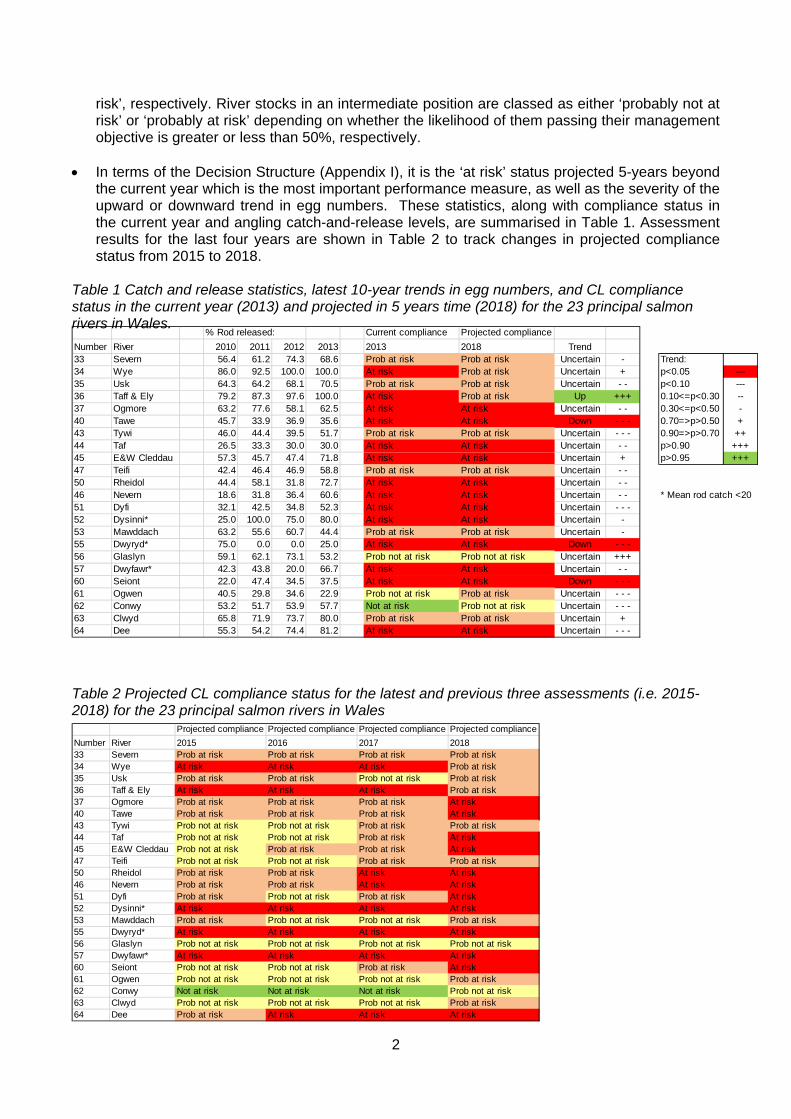
2
risk’, respectively. River stocks in an intermediate position are classed as either ‘probably not at risk’ or ‘probably at risk’ depending on whether the likelihood of them passing their management objective is greater or less than 50%, respectively.
• In terms of the Decision Structure (Appendix I), it is the ‘at risk’ status projected 5-years beyond
the current year which is the most important performance measure, as well as the severity of the upward or downward trend in egg numbers. These statistics, along with compliance status in the current year and angling catch-and-release levels, are summarised in Table 1. Assessment results for the last four years are shown in Table 2 to track changes in projected compliance status from 2015 to 2018.
Table 1 Catch and release statistics, latest 10-year trends in egg numbers, and CL compliance status in the current year (2013) and projected in 5 years time (2018) for the 23 principal salmon rivers in Wales. Table 2 Projected CL compliance status for the latest and previous three assessments (i.e. 2015-2018) for the 23 principal salmon rivers in Wales
Projected compliance Projected compliance Projected compliance Projected complianceNumber River 2015 2016 2017 201833 Severn Prob at risk Prob at risk Prob at risk Prob at risk34 Wye At risk At risk At risk Prob at risk35 Usk Prob at risk Prob at risk Prob not at risk Prob at risk36 Taff & Ely At risk At risk At risk Prob at risk37 Ogmore Prob at risk Prob at risk Prob at risk At risk40 Tawe Prob at risk Prob at risk Prob at risk At risk43 Tywi Prob not at risk Prob not at risk Prob at risk Prob at risk44 Taf Prob not at risk Prob not at risk Prob at risk At risk45 E&W Cleddau Prob not at risk Prob at risk Prob at risk At risk47 Teifi Prob not at risk Prob not at risk Prob at risk Prob at risk50 Rheidol Prob at risk Prob at risk At risk At risk46 Nevern Prob at risk Prob at risk At risk At risk51 Dyfi Prob at risk Prob not at risk Prob at risk At risk52 Dysinni* At risk At risk At risk At risk53 Mawddach Prob at risk Prob not at risk Prob not at risk Prob at risk55 Dwyryd* At risk At risk At risk At risk56 Glaslyn Prob not at risk Prob not at risk Prob not at risk Prob not at risk57 Dwyfawr* At risk At risk At risk At risk60 Seiont Prob not at risk Prob not at risk Prob at risk At risk61 Ogwen Prob not at risk Prob not at risk Prob not at risk Prob at risk62 Conwy Not at risk Not at risk Not at risk Prob not at risk63 Clwyd Prob not at risk Prob not at risk Prob not at risk Prob at risk64 Dee Prob at risk At risk At risk At risk
% Rod released: Current compliance Projected complianceNumber River 2010 2011 2012 2013 2013 2018 Trend
33 Severn 56.4 61.2 74.3 68.6 Prob at risk Prob at risk Uncertain - Trend:34 Wye 86.0 92.5 100.0 100.0 At risk Prob at risk Uncertain + p<0.05 ---35 Usk 64.3 64.2 68.1 70.5 Prob at risk Prob at risk Uncertain - - p<0.10 ---36 Taff & Ely 79.2 87.3 97.6 100.0 At risk Prob at risk Up +++ 0.10<=p<0.30 --37 Ogmore 63.2 77.6 58.1 62.5 At risk At risk Uncertain - - 0.30<=p<0.50 -40 Tawe 45.7 33.9 36.9 35.6 At risk At risk Down - - - 0.70=>p>0.50 +43 Tywi 46.0 44.4 39.5 51.7 Prob at risk Prob at risk Uncertain - - - 0.90=>p>0.70 ++44 Taf 26.5 33.3 30.0 30.0 At risk At risk Uncertain - - p>0.90 +++45 E&W Cleddau 57.3 45.7 47.4 71.8 At risk At risk Uncertain + p>0.95 +++47 Teifi 42.4 46.4 46.9 58.8 Prob at risk Prob at risk Uncertain - -50 Rheidol 44.4 58.1 31.8 72.7 At risk At risk Uncertain - -46 Nevern 18.6 31.8 36.4 60.6 At risk At risk Uncertain - - * Mean rod catch <2051 Dyfi 32.1 42.5 34.8 52.3 At risk At risk Uncertain - - -52 Dysinni* 25.0 100.0 75.0 80.0 At risk At risk Uncertain -53 Mawddach 63.2 55.6 60.7 44.4 Prob at risk Prob at risk Uncertain -55 Dwyryd* 75.0 0.0 0.0 25.0 At risk At risk Down - - -56 Glaslyn 59.1 62.1 73.1 53.2 Prob not at risk Prob not at risk Uncertain +++57 Dwyfawr* 42.3 43.8 20.0 66.7 At risk At risk Uncertain - -60 Seiont 22.0 47.4 34.5 37.5 At risk At risk Down - - -61 Ogwen 40.5 29.8 34.6 22.9 Prob not at risk Prob at risk Uncertain - - -62 Conwy 53.2 51.7 53.9 57.7 Not at risk Prob not at risk Uncertain - - -63 Clwyd 65.8 71.9 73.7 80.0 Prob at risk Prob at risk Uncertain +64 Dee 55.3 54.2 74.4 81.2 At risk At risk Uncertain - - -
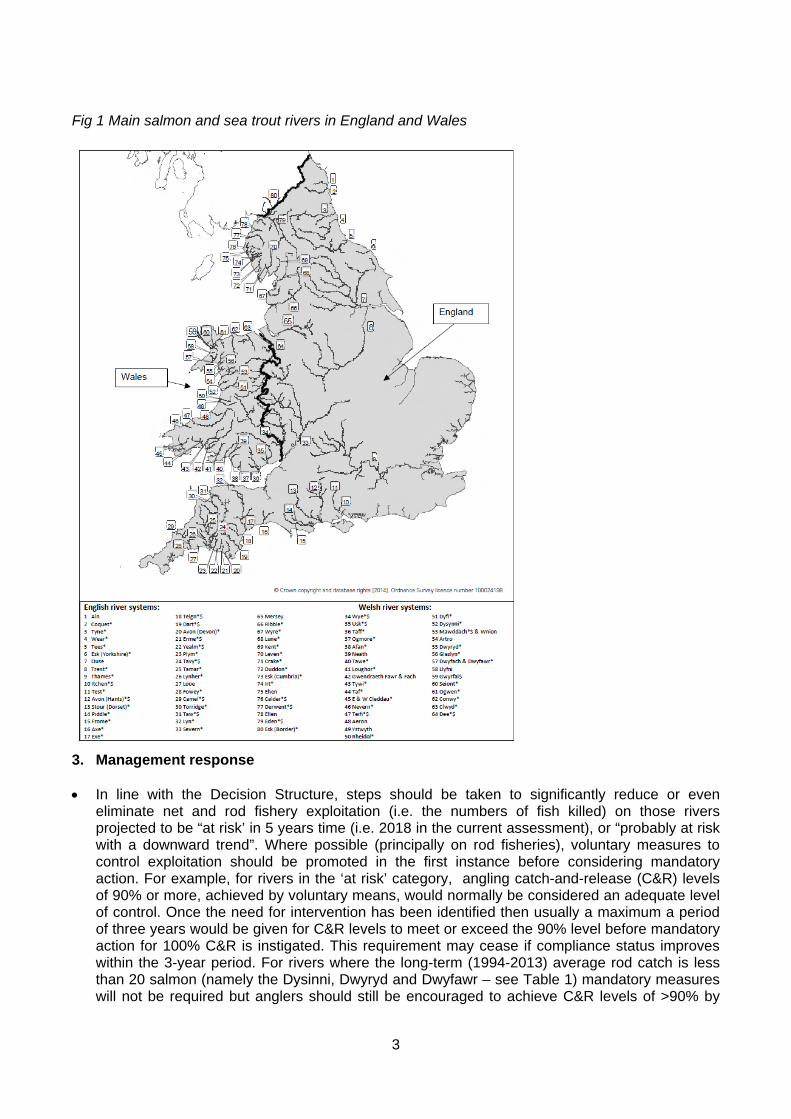
3
Fig 1 Main salmon and sea trout rivers in England and Wales
3. Management response
• In line with the Decision Structure, steps should be taken to significantly reduce or even eliminate net and rod fishery exploitation (i.e. the numbers of fish killed) on those rivers projected to be “at risk’ in 5 years time (i.e. 2018 in the current assessment), or “probably at risk with a downward trend”. Where possible (principally on rod fisheries), voluntary measures to control exploitation should be promoted in the first instance before considering mandatory action. For example, for rivers in the ‘at risk’ category, angling catch-and-release (C&R) levels of 90% or more, achieved by voluntary means, would normally be considered an adequate level of control. Once the need for intervention has been identified then usually a maximum a period of three years would be given for C&R levels to meet or exceed the 90% level before mandatory action for 100% C&R is instigated. This requirement may cease if compliance status improves within the 3-year period. For rivers where the long-term (1994-2013) average rod catch is less than 20 salmon (namely the Dysinni, Dwyryd and Dwyfawr – see Table 1) mandatory measures will not be required but anglers should still be encouraged to achieve C&R levels of >90% by
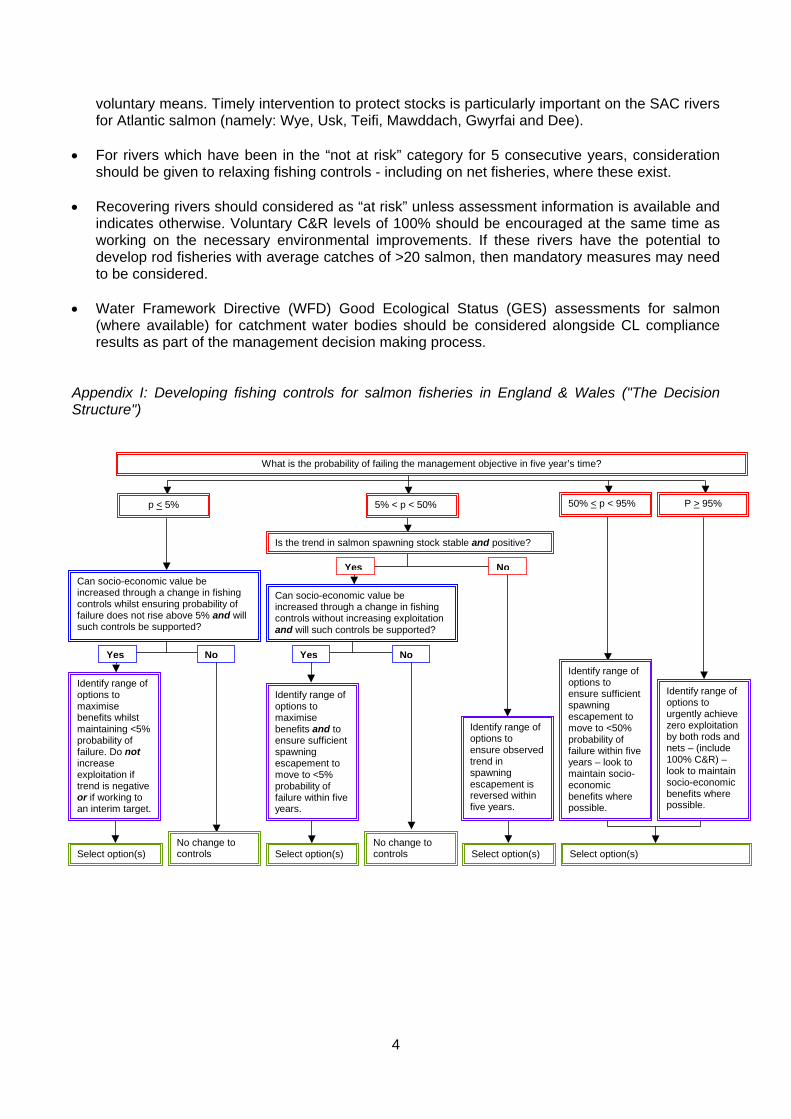
4
voluntary means. Timely intervention to protect stocks is particularly important on the SAC rivers for Atlantic salmon (namely: Wye, Usk, Teifi, Mawddach, Gwyrfai and Dee).
• For rivers which have been in the “not at risk” category for 5 consecutive years, consideration
should be given to relaxing fishing controls - including on net fisheries, where these exist. • Recovering rivers should considered as “at risk” unless assessment information is available and
indicates otherwise. Voluntary C&R levels of 100% should be encouraged at the same time as working on the necessary environmental improvements. If these rivers have the potential to develop rod fisheries with average catches of >20 salmon, then mandatory measures may need to be considered.
• Water Framework Directive (WFD) Good Ecological Status (GES) assessments for salmon
(where available) for catchment water bodies should be considered alongside CL compliance results as part of the management decision making process.
Appendix I: Developing fishing controls for salmon fisheries in England & Wales ("The Decision Structure")
Identify range of options to maximise benefits whilst maintaining <5% probability of failure. Do not increase exploitation if trend is negative or if working to an interim target.
What is the probability of failing the management objective in five year’s time?
p < 5% 5% < p < 50% 50% < p < 95% P > 95%
Is the trend in salmon spawning stock stable and positive?
Can socio-economic value be increased through a change in fishing controls whilst ensuring probability of failure does not rise above 5% and will such controls be supported?
Can socio-economic value be increased through a change in fishing controls without increasing exploitation and will such controls be supported?
Identify range of options to maximise benefits and to ensure sufficient spawning escapement to move to <5% probability of failure within five years.
Identify range of options to ensure observed trend in spawning escapement is reversed within five years.
Select option(s) Select option(s) Select option(s) Select option(s) No change to controls
No change to controls
Identify range of options to ensure sufficient spawning escapement to move to <50% probability of failure within five years – look to maintain socio-economic benefits where possible.
Identify range of options to urgently achieve zero exploitation by both rods and nets – (include 100% C&R) – look to maintain socio-economic benefits where possible.
Yes
Yes
Yes No
No
No
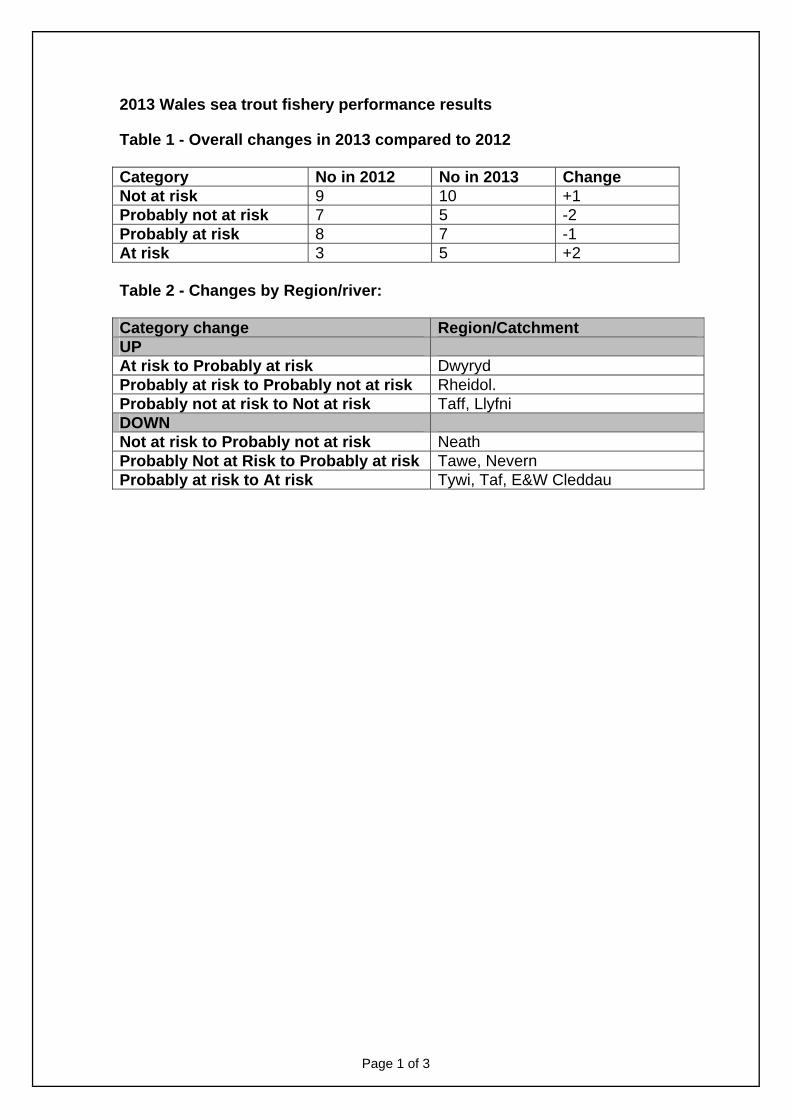
Page 1 of 3
2013 Wales sea trout fishery performance results Table 1 - Overall changes in 2013 compared to 2012 Category No in 2012 No in 2013 Change Not at risk 9 10 +1 Probably not at risk 7 5 -2 Probably at risk 8 7 -1 At risk 3 5 +2 Table 2 - Changes by Region/river: Category change Region/Catchment UP At risk to Probably at risk Dwyryd Probably at risk to Probably not at risk Rheidol. Probably not at risk to Not at risk Taff, Llyfni DOWN Not at risk to Probably not at risk Neath Probably Not at Risk to Probably at risk Tawe, Nevern Probably at risk to At risk Tywi, Taf, E&W Cleddau
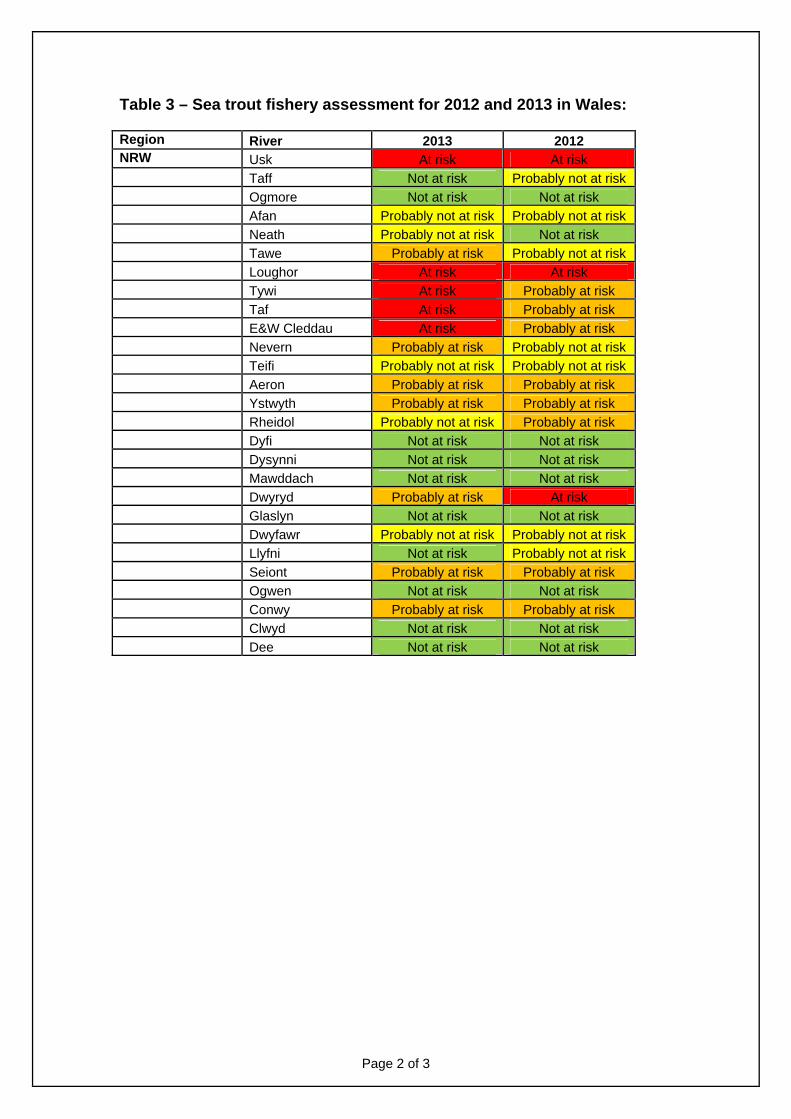
Page 2 of 3
Table 3 – Sea trout fishery assessment for 2012 and 2013 in Wales: Region River 2013 2012 NRW Usk At risk At risk Taff Not at risk Probably not at risk Ogmore Not at risk Not at risk Afan Probably not at risk Probably not at risk Neath Probably not at risk Not at risk Tawe Probably at risk Probably not at risk Loughor At risk At risk Tywi At risk Probably at risk Taf At risk Probably at risk E&W Cleddau At risk Probably at risk Nevern Probably at risk Probably not at risk Teifi Probably not at risk Probably not at risk Aeron Probably at risk Probably at risk Ystwyth Probably at risk Probably at risk Rheidol Probably not at risk Probably at risk Dyfi Not at risk Not at risk Dysynni Not at risk Not at risk Mawddach Not at risk Not at risk Dwyryd Probably at risk At risk Glaslyn Not at risk Not at risk Dwyfawr Probably not at risk Probably not at risk Llyfni Not at risk Probably not at risk Seiont Probably at risk Probably at risk Ogwen Not at risk Not at risk Conwy Probably at risk Probably at risk Clwyd Not at risk Not at risk Dee Not at risk Not at risk
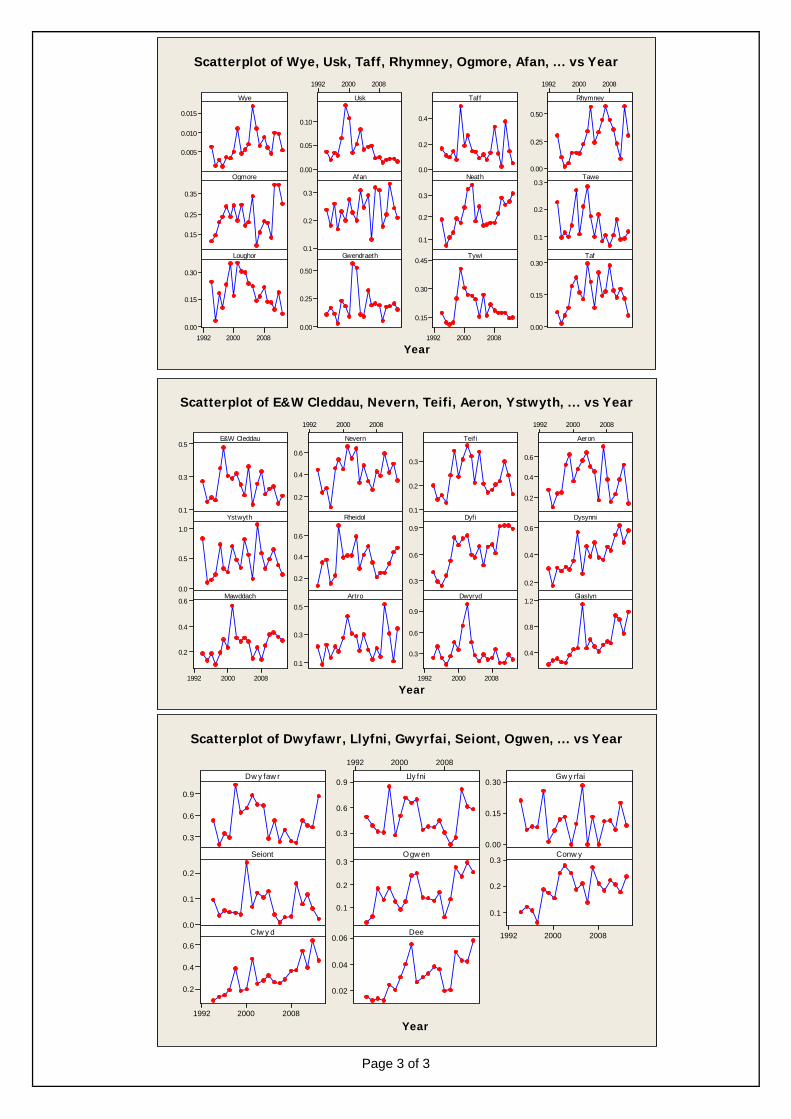
Page 3 of 3
0.015
0.010
0.005
200820001992
0.10
0.05
0.00
0.4
0.2
0.0
200820001992
0.50
0.25
0.00
0.35
0.25
0.15
0.3
0.2
0.1
0.3
0.2
0.1
0.3
0.2
0.1
200820001992
0.30
0.15
0.00
0.50
0.25
0.00200820001992
0.45
0.30
0.15
0.30
0.15
0.00
Wye
Year
Usk Taff Rhymney
Ogmore Afan Neath Tawe
Loughor Gwendraeth Tywi Taf
Scatterplot of Wye, Usk, Taff, Rhymney, Ogmore, Afan, ... vs Year
0.5
0.3
0.1
200820001992
0.6
0.4
0.2
0.3
0.2
0.1
200820001992
0.6
0.4
0.2
1.0
0.5
0.0
0.6
0.4
0.2
0.9
0.6
0.3
0.6
0.4
0.2
200820001992
0.6
0.4
0.2
0.5
0.3
0.1
200820001992
0.9
0.6
0.3
1.2
0.8
0.4
E&W Cleddau
Year
Nevern Teifi Aeron
Ystwyth Rheidol Dyfi Dysynni
Mawddach Artro Dwyryd Glaslyn
Scatterplot of E&W Cleddau, Nevern, Teifi, Aeron, Ystwyth, ... vs Year
0.9
0.6
0.3
200820001992
0.9
0.6
0.3
0.30
0.15
0.00
0.2
0.1
0.0
0.3
0.2
0.1
200820001992
0.3
0.2
0.1
200820001992
0.6
0.4
0.2
0.06
0.04
0.02
Dwy faw r
Year
Lly fni Gwy rfai
Seiont O gwen C onwy
C lwy d Dee
Scatterplot of Dwyfawr, Llyfni, Gwyrfai, Seiont, Ogwen, ... vs Year

Page 1 of 6
EXAMINING AUTHORITY’S FIRST ROUND OF QUESTIONS
No To Question Response / Comments by Pontardawe and Swansea Angling Society Ltd
1.10 Applicant a) Given there is no generation capacity proposed to be stated in the DCO how can the project be said to be a Nationally Significant Infrastructure Project under ss14 and 15 PA2008? b) Does the applicant intend that the DCO will state the generating capacity before it is made?
We refer to this point in our written representation: We aren’t satisfied that the scheme meets the definition of a “nationally significant infrastructure project” for the purposes of the Planning Act 2008:
• Section 15(3) says “A generating station is […a nationally significant infrastructure project…] if— (a) it is an offshore generating station, and (b) its capacity is more than 100 megawatts.”
• “Capacity” is not defined in the Planning Act 2008 or other relevant legislation.
• The Planning Inspectorate (PINS) has said that it believes that “"capacity", as used in the PA2008, probably … means the rated maximum gross output, or 'nameplate capacity', of the station”.
• We believe that in the context of the contribution that a project can make to national renewable energy needs, a station’s maximum achievable annual average production (46 MW in this case) is more relevant than the nominal capacity of the turbines.
• PINS has also said “the Planning Inspectorate, on behalf of the Secretary of State, is only able to decide whether development consent is required for a project, under PA 2008 s.55, once an application has been formally submitted.”
We therefore ask the Examining Authority to make a ruling on this.
7.1 Applicant Paragraph 9.7.4.19 concludes that during the operational phase : … the overall predicted long-term impact on the salmon and sea trout fishery is expected to be of Low magnitude with a significance value of Minor, and a confidence of Probable. The basis for the assessment is summarised in paragraph 9.7.4.18, in the following terms: The impact of the operational phase on salmon and sea trout smolt and adult migration, including entrainment and injury in the turbines, has been assessed as being of Minor significance post
Re Question (b) – Please see our written representation.

Page 2 of 6
No To Question Response / Comments by Pontardawe and Swansea Angling Society Ltd
mitigation. This is due to the low proportion of fish that are predicted to pass through the turbines, the relatively fish-friendly design (small number of blades, slow rotation rate and minimum gap runner) of the turbines and the proposed deployment of fish deterrent systems as a mitigation measure. a) Does the NRW’s “concern over levels of evidence and explanations to support confidence on impacts predicted” expressed in the letter of 11 April 2014 apply to the above assessment? And if so what further analysis is needed to bolster confidence in the assessment made? b) What aspects of this assessment and these conclusions are not accepted by those making representations on behalf of fishing interests?
7.2 Applicant An attachment setting out a fisheries analysis report is referred to within the Relevant Representations from the Usk Fishing Association and from Fish Legal and several other fishing clubs/angling societies. The Panel has not received this attachment and requests that a copy be submitted into the examination.
Attached. This was a review commissioned by Fish Legal, the Angling Trust, Pontardawe & Swansea Angling Society Ltd, Tawe & Tributaries Angling Association Ltd and Afan Valley Angling Club. It was commissioned after receipt of the Draft Environment Statement in November 2013. Fish Legal advised the applicant of this in their letter of 17 December 2013 responding to the ES. The applicant submitted the DCO application on 7 February 2014, before receipt of the review by fisheries interests on 10 February 2014. Fish Legal supplied a copy of the review to the Planning Inspectorate (and to the applicant) with their letter of 3 March. The applicant has been asked by fisheries interests to respond to the points made in the review.
7.3 Interested parties
Does the ES address the requirements for on-going monitoring, review and mitigation of the effects of the Project upon fish populations?
No. Please see our written representation.
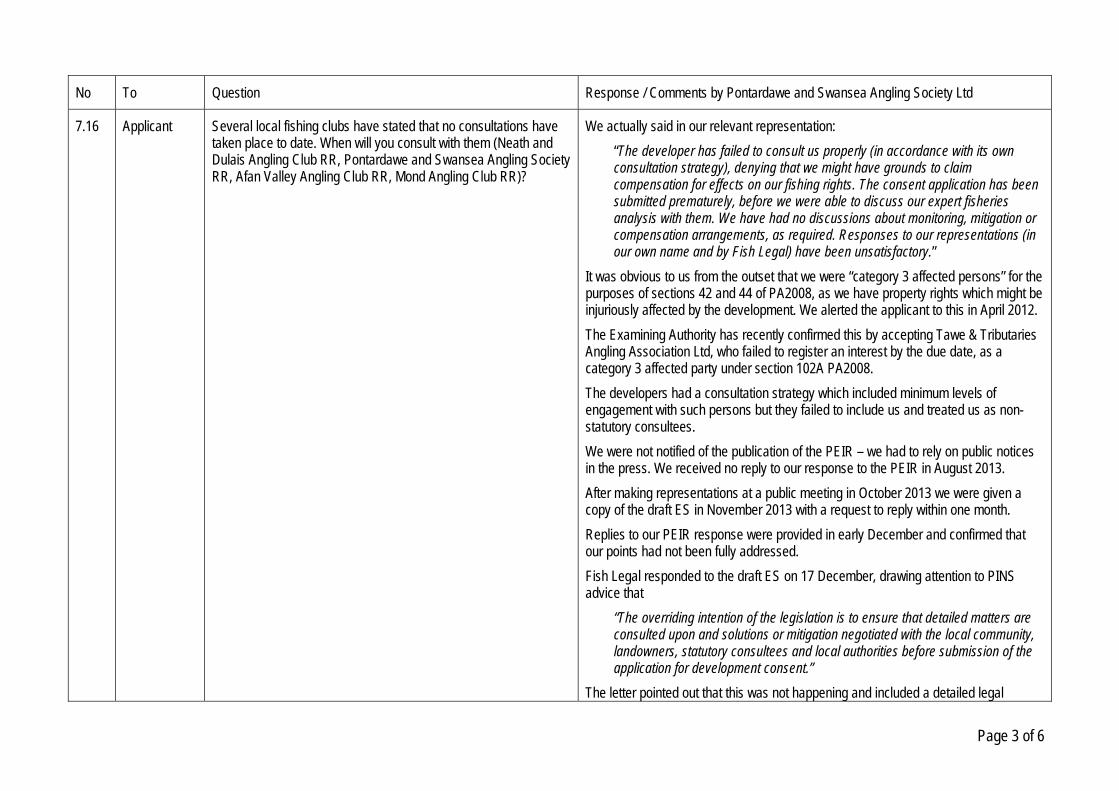
Page 3 of 6
No To Question Response / Comments by Pontardawe and Swansea Angling Society Ltd
7.16 Applicant Several local fishing clubs have stated that no consultations have taken place to date. When will you consult with them (Neath and Dulais Angling Club RR, Pontardawe and Swansea Angling Society RR, Afan Valley Angling Club RR, Mond Angling Club RR)?
We actually said in our relevant representation: “The developer has failed to consult us properly (in accordance with its own consultation strategy), denying that we might have grounds to claim compensation for effects on our fishing rights. The consent application has been submitted prematurely, before we were able to discuss our expert fisheries analysis with them. We have had no discussions about monitoring, mitigation or compensation arrangements, as required. Responses to our representations (in our own name and by Fish Legal) have been unsatisfactory.”
It was obvious to us from the outset that we were “category 3 affected persons” for the purposes of sections 42 and 44 of PA2008, as we have property rights which might be injuriously affected by the development. We alerted the applicant to this in April 2012. The Examining Authority has recently confirmed this by accepting Tawe & Tributaries Angling Association Ltd, who failed to register an interest by the due date, as a category 3 affected party under section 102A PA2008. The developers had a consultation strategy which included minimum levels of engagement with such persons but they failed to include us and treated us as non-statutory consultees. We were not notified of the publication of the PEIR – we had to rely on public notices in the press. We received no reply to our response to the PEIR in August 2013. After making representations at a public meeting in October 2013 we were given a copy of the draft ES in November 2013 with a request to reply within one month. Replies to our PEIR response were provided in early December and confirmed that our points had not been fully addressed. Fish Legal responded to the draft ES on 17 December, drawing attention to PINS advice that
“The overriding intention of the legislation is to ensure that detailed matters are consulted upon and solutions or mitigation negotiated with the local community, landowners, statutory consultees and local authorities before submission of the application for development consent.”
The letter pointed out that this was not happening and included a detailed legal

Page 4 of 6
No To Question Response / Comments by Pontardawe and Swansea Angling Society Ltd
argument that our consultation status was not being correctly recognised. The letter also advised the applicant that we were commissioning an independent expert review (by APEM Ltd) which we would discuss with them in due course. We received no response. Before we received the independent review (10 February 2014) and were able to engage in meaningful discussions, the developers had submitted their application for consent (7 February 2014). Their application included a denial, in Chapter 10 of the Consultation Report, that we were “category 3 affected persons”. Comments in Chapter 10 to the effect that we have in any case been properly consulted are rejected. Fish Legal made a submission to PINS on 3 March 2014 that the applicants had not complied with their consultation obligations and that the application should not be accepted. This argument was not accepted by PINS and the application was accepted on 6 March 2014. The applicants failed to notify us (and other fishery interests) of the acceptance of the application in accordance with section 56 PA2008 but on 12 April 2014 they certified under section 58 PA2008 that they had complied with the requirements of section 56. As we were satisfied that we (and many others like us) were “category 3 affected persons”, and as we believed that the applicants should have known this, their certificate appeared to us to have been false and to have been given knowingly or at least recklessly. We reported this to PINS but they said that offences under section 58 were not a matter for them. We can provide the correspondence, if required. The current position is that, whilst we have been disadvantaged by having to seek out information which should have been provided to us, other fishery owners with property rights like ours (including at least three persons from whom we lease fishing) have been excluded from the process completely and probably know nothing about the application and this examination. We maintain that the applicant has failed to comply with its obligations to “category 3 affected persons” and that it has wrongly certified compliance with section 56.
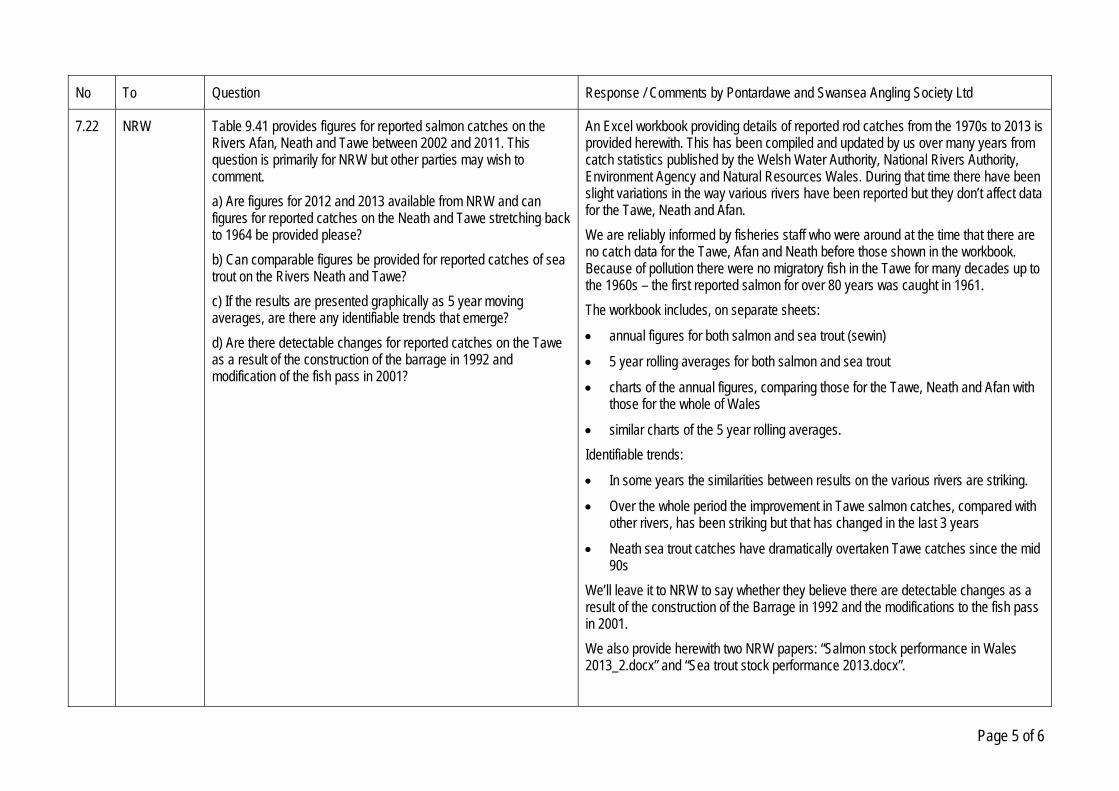
Page 5 of 6
No To Question Response / Comments by Pontardawe and Swansea Angling Society Ltd
7.22 NRW Table 9.41 provides figures for reported salmon catches on the Rivers Afan, Neath and Tawe between 2002 and 2011. This question is primarily for NRW but other parties may wish to comment. a) Are figures for 2012 and 2013 available from NRW and can figures for reported catches on the Neath and Tawe stretching back to 1964 be provided please? b) Can comparable figures be provided for reported catches of sea trout on the Rivers Neath and Tawe? c) If the results are presented graphically as 5 year moving averages, are there any identifiable trends that emerge? d) Are there detectable changes for reported catches on the Tawe as a result of the construction of the barrage in 1992 and modification of the fish pass in 2001?
An Excel workbook providing details of reported rod catches from the 1970s to 2013 is provided herewith. This has been compiled and updated by us over many years from catch statistics published by the Welsh Water Authority, National Rivers Authority, Environment Agency and Natural Resources Wales. During that time there have been slight variations in the way various rivers have been reported but they don’t affect data for the Tawe, Neath and Afan. We are reliably informed by fisheries staff who were around at the time that there are no catch data for the Tawe, Afan and Neath before those shown in the workbook. Because of pollution there were no migratory fish in the Tawe for many decades up to the 1960s – the first reported salmon for over 80 years was caught in 1961. The workbook includes, on separate sheets:
• annual figures for both salmon and sea trout (sewin)
• 5 year rolling averages for both salmon and sea trout
• charts of the annual figures, comparing those for the Tawe, Neath and Afan with those for the whole of Wales
• similar charts of the 5 year rolling averages. Identifiable trends:
• In some years the similarities between results on the various rivers are striking.
• Over the whole period the improvement in Tawe salmon catches, compared with other rivers, has been striking but that has changed in the last 3 years
• Neath sea trout catches have dramatically overtaken Tawe catches since the mid 90s
We’ll leave it to NRW to say whether they believe there are detectable changes as a result of the construction of the Barrage in 1992 and the modifications to the fish pass in 2001. We also provide herewith two NRW papers: “Salmon stock performance in Wales 2013_2.docx” and “Sea trout stock performance 2013.docx”.

Page 6 of 6
No To Question Response / Comments by Pontardawe and Swansea Angling Society Ltd
7.23 Applicant Application of “IBM fish encounter modelling” is described in paragraphs 9.5.3.30-8 of Chapter 9 of the ES: Fish including Recreational and Commercial Fisheries and output from the model (a still-frame example from the adult salmon model video) is illustrated in Figure 15. Para 9.5.3.38 (Doc 6.2.9) states that: The model shows that olfactory trails from the two rivers remain quite distinct with the Lagoon in place and turbines and sluices operating, allowing adult salmon to home to their natal rivers with minimal distraction. Results demonstrated that there is no significant effect on olfactory trails as a result of water being drawn in to the Lagoon and released again. a) What level of confidence should the panel have in the output from this model? b) What would be needed to produce an assessment that would be more firmly based?
The Examining Authority should not give too much credence to the output of the models, nor attach too much importance to olfactory trails, which are but one of the factors influencing salmon and sea trout behaviour close to their home river. Please see our written representation. We do not accept that “olfactory trails from the two rivers remain quite distinct with the Lagoon in place and turbines and sluices operating, allowing adult salmon to home to their natal rivers with minimal distraction” We agree with ES Appendix 9.5 (“Accuracy And Limitations”) where it refers to “a clear distinction between precision and accuracy” and “the potential false impression of accuracy due to precision”.
13.44 Applicant Can the applicant confirm that all affected persons have been consulted with reference to the correct land plans and Book of Reference entries in respect of land in which they have an interest?
As explained in reply to Question 7.16, we maintain that category 3 affected persons have NOT been properly consulted, nor identified in the Book of Reference.


