Embed Size (px)
Citation preview
DTI at long diffusion time improves fiber tracking
Swati Ranea,b, Govind Nairb, and Timothy Q. Duongc,d,e,*a Biomedical Engineering, Georgia Institute of Technology, GA, USAb Emory University, Atlanta, GA, USAc Research Imaging Institute, Departments of Ophthalmology, Radiology, and Physiology,University of Texas Health Science Center, San Antonio, TX, USAd South Texas Veterans Health Care System, San Antonio, TX, USAe Southwest National Primate Research Center, San Antonio, TX, USA
AbstractWhile diffusion-tensor-imaging tractography provides remarkable in vivo anatomical connectivityof the central nervous system, the majority of DTI studies to date are predominantly limited totracking large white-matter fibers. This study investigated DTI tractography using long diffusiontime (tdiff) to improve tracking of thinner fibers in fixed rhesus monkey brains. Stimulated EchoAcquisition Mode (STEAM) sequence on a 3T Siemens TRIO was modified to include a diffusionmodule. DTI was acquired using STEAM with tdiff of 48 and 192 ms with matched signal-to-noiseratios (SNR). Comparisons were also made with the conventional double-spin echo (DSE) at a shorttdiff of 45 ms. Not only did the fractional anisotropy increase significantly with the use of longdiffusion time, but directional entropy measures indicated that there was an increased coherenceamongst neighboring tensors. Further, the magnitude of the major eigenvector was larger at thetdiff = 192 ms as compared to the short tdiff. Probabilistic connectivity maps at long tdiff showed largerareas of connectivity with the use of long diffusion time, which traversed deeper into areas of lowanisotropy. With tractography, it was found that the length of the fibers, increased by almost 10% inthe callosal fibers that branch into the paracentral gyrus, the precentral gyrus and the post centralgyrus. A similar increase of about 20% was observed in the fibers of the internal capsule. Thesefindings offer encouraging data that DTI at long diffusion time could improve tract tracing of smallfibers in areas of low fractional anisotropy (FA), such as at the interfaces of white matter and greymatter.
Keywordsdiffusion tensor imaging; STEAM sequence; rhesus macaques; cross-terms; formalin fixation;fractional anisotropy; white matter tracking
INTRODUCTIONDiffusion tensor imaging (DTI) (1,2) contrast in biological systems arises from watermovement in the presence of barriers (such as cell membranes of axons and oligodendrocytes)that hinder water diffusion more in some orientations than others. DTI has been widely usedto map whole-brain anatomical connectivity in a totally non-invasive fashion (3). This is inmarked contrast to histological tracing techniques (invasive) where radioactive or fluorescent
*Correspondence to: T. Duong, Research Imaging Institute, 8403 Floyd Curl Dr, San Antonio, TX 78229, USA. [email protected].
NIH Public AccessAuthor ManuscriptNMR Biomed. Author manuscript; available in PMC 2010 October 5.
Published in final edited form as:NMR Biomed. 2010 June ; 23(5): 459–465. doi:10.1002/nbm.1482.
NIH
-PA Author Manuscript
NIH
-PA Author Manuscript
NIH
-PA Author Manuscript
tracers are focally injected to track regional connections over a few synapses (limitedcoverage), precluding whole-brain, longitudinal and in vivo studies and human applications.
The majority of DTI tractography studies to date are limited to tracking large white-matterfibers. Novel approaches such as multiple high b-value DTI (4), high angular resolution DTI(HARD) (5) and Q-ball imaging (6) are being actively explored to improve diffusion-basedtractography. A unique feature of many of these approaches is that, in contrast to conventionalDTI tractography, they do not assume Gaussian diffusion (6). Yoshiura et al. measured DTIindices using very high values (500 to 5000 s/mm2) (36) and showed that, as the b-valueincreased, apparent diffusion coefficient (ADC) decreased in both the gray and white matter.They also found that non-monoexponential diffusion signal decay was more prominent in whitematter than in gray matter. Surprisingly, there was no significant change in the relation of theb-value to the FA maps. High b-value appears to have a dissociating effect on gray and whitematter in DWIs. Ronen et al. performed DTI tractography using multi-exponential decays. Bydecomposing into slow and fast diffusion tensors and compared with conventional DTI data(4), they reported that fibers generated on the basis of the slow diffusion component appear tofollow the vertical fibers in gray matter. DTI of the slow component may provide a way forincreasing the sensitivity to anisotropic structures in cortical gray matter. While these novelapproaches are promising, they require very large b-values that are not readily achievable onclinical scanners due to gradient strength limitations. They are also generally more difficult toimplement compared to conventional DTI techniques.
The root-mean-squared (7,8) displacement in diffusion measurement is dependent on diffusiontime (tdiff). For a tdiff of 20 ms, the rms displacement is ≈10 μm in vivo (7,8), on the order ofcell sizes in the brain, and diffusion is largely sensitive to restriction by cell membranes andsubcellular organelles. At tdiff ≈ 200 ms, the rms displacement is ≈ 32 μm, substantially largerthan the average cell sizes, and diffusion is also sensitive to restriction in the extracellularspaces along fiber tracts. Indeed, the ADC of water in vivo has been shown to be dependenton tdiff, with ADC decreasing rapidly for tdiff from 2 to 15 ms and gradually for tdiff greaterthan 20 ms (9–11). ADC in human brains is diffusion-time dependent (12). Fractionalanisotropy (FA) at longer tdiff has been reported to be more sensitive to changes in myelin-deficient mice (13). These findings suggest that DTI at long diffusion time could improvetractography. DTI studies to date employed relatively short tdiff to minimize signal loss due toT2 decay and DTI tractography at long tdiff has not been reported.
The goal of this study was to determine whether DTI at long tdiff improves tracking of thinnerfibers. To overcome T2 signal loss associated with long tdiff measurements, Stimulated-Echo-Acquisition-Mode (STEAM) sequence (14,15) was modified to include a diffusion module tosample 30 diffusion directions on a 3T Siemens TRIO. DTI tractography was performed withshort (48 ms) and long (192 ms) diffusion time on post-mortem fixed monkey brains. Standarddual spin-echo (DSE) (16) DTI data were also acquired on the same monkey brains in the samesetting for comparison in order to ascertain that the improvement was indeed due to theapplication of the longer diffusion time and not due to a different sequence. FA, tensor-fieldplots, connectivity maps based on entropy minimization (17) and deterministic fibertractography using line propagation (3) were compared among the three methods with matchedsignal-to-noise ratio (SNR) and identical statistical thresholds.
METHODSPhantom experiments
Cross-term interactions among diffusion and imaging gradients in STEAM acquisition at longtdiff can be significant (18–20) and can adversely affect DTI measurements. While cross-terminteractions could be calculated to derive the exact b values (19,21), geometric averaging
Rane et al. Page 2
NMR Biomed. Author manuscript; available in PMC 2010 October 5.
NIH
-PA Author Manuscript
NIH
-PA Author Manuscript
NIH
-PA Author Manuscript
approach was used to remove cross-term bias (19,22) without evaluating the exact b-values.This involved acquiring two DTI data sets in which two DWI were acquired in the samediffusion gradients but with opposite gradient polarities. The two images are multiplied on apixel by pixel basis. The square root of the product results in an image with substantiallyreduced cross-term effects. Phantom studies were performed to evaluate and confirm thevalidity of this approach. A phantom, 45 mm in diameter, made of 0.5 M 1H-mannitol dissolvedin dimethlysulfoxide (DMSO), was chosen because the ADC of mannitol in DMSO (as opposedto water phantom) is more similar to water ADC in fixed brain. This allows the use of identicalb-values and imaging protocols for both phantom and brain studies.
Fixed monkey brainsEight measurements were made on four rhesus monkey brains fixed with 4% formalin. Brainswere perfused-fixed and stored in formalin for a maximum of 5 days before MRI. Duringimaging, the sample was submerged in water to minimize susceptibility on the surface of thebrain. The strong bulk water signal along the sharp edges of the container, however, gave riseto Gibbs ringing artifacts. A small amount of MION (0.018 mg/mL) was added to eliminateGibbs ringing. The large MION particles could not enter the interstitial space of the brain tissue,as confirmed by the absence of degradation of echo-planar images and SNRs acquired up to aweek after the MION addition.
MRI methodsMRI studies were performed on a Siemens 3T Trio clinical scanner (Siemens AG, Erlangen,Germany). All samples were scanned at room temperature. T1-weighted images were acquiredusing conventional gradient- echo acquisition, with TR = 4000 ms, flip angle = 25°, TE = 7.7ms, FOV = 70 × 70 mm, matrix size = 128 × 128, and slice thickness = 2 mm.
DTI data were acquired with a 16-shot STEAM (14,15) EPI sequence with TR = 1500 ms, TE= 80 ms, 30 diffusion directions with b = 1700 s/mm2 and a single b = 0 s/mm2 acquisition,FOV = 70 × 70 mm, matrix size = 128 × 128, 3 slices, slice thickness = 2 mm, and δ = 21 ms.Data were acquired at two mixing times (TM) of 25 and 169 ms, which corresponded to tdiffof 48 and 192 ms, respectively. The corresponding numbers of averages were 34 and 70,respectively, chosen so as to match SNR (determined as the ratio of an ROI intensity of theWM in the brain to the standard deviation of ROI intensity outside the brain). These twomethods are hereby referred to as STEAM-48 ms and STEAM-192 ms. The b value of 1700s/mm2 was used instead of the typical 1000 s/mm2 in vivo because fixation decreases ADCvalue. Note that the TE at long tdiff could be substantially shortened (to ~ 63 ms) to achievethe same b value which should reduce number of averaging needed. In this study, the same TEwas employed for both long and short tdiff to avoid potential bias due to different T2 weightingin the WM and GM.
For comparison, DTI was also acquired using the standard double spin-echo (DSE) sequence(16) in the same imaging sessions with similar parameters except that the TE was 104 ms whichwas the minimum achievable value for the experimental parameters. The effective tdiff for DSEwas 45 ms. The number of averages, chosen to match SNR of the STEAM acquisitions, was48. Acquisitions of the three protocols were interleaved and randomized to minimize the effectof potential systematic drifts. The total imaging time for the STEAM-48 ms was 14.16 h. Forthe DSE sequence the time was 20 hours while for the STEAM-192 ms sequence, it was 29.16h.
Rane et al. Page 3
NMR Biomed. Author manuscript; available in PMC 2010 October 5.
NIH
-PA Author Manuscript
NIH
-PA Author Manuscript
NIH
-PA Author Manuscript
Data analysisAnisotropy calculations
All analyses were performed using codes written in MATLAB® (Mathworks, Natick, MA)unless otherwise specified. FA maps were computed (1,23). White matter (WM) and graymatter (GM) pixels were separated using intensity-based segmentation on T1-weighted imagesand the mean WM and GM FA were calculated.
Spherical (CS), planar (CP) and linear (CL) anisotropy measures were calculated and plottedon the barycentric coordinate system (three-phase plot) (24)
(1)
where , and λ1, λ2, and λ3 are the eigen-values of the 3 × 3diffusion tensor matrix, with . x and y are co-ordinates on the three-phase plot whereisotropy is represented at the apex of the triangle and the left and right vertices correspond tolinear and planar anisotropy respectively. The three-phase plot provides a convenient way tostudy the trend in anisotropy with increasing tdiff.
Directional entropyThe tensor-field map was examined for tensor orientations. Long diffusion time couldemphasize the dominant fiber in the voxels that comprise of multiple sparse fiber bundles. Ifthese tensors indeed, represented an underlying fiber tract or a continuation of a fiber branch,then the tensors in the neighboring voxels would have similar orientations, i.e. the principaleigenvectors would be co-linear. Such co-linearity would then increase with increase indiffusion time. In order to measure this increase, directional entropy (DE) (26) was used.
For this purpose, a sphere was broken into many triangular faces. Each face was representedby a vector starting from the origin of the sphere and the centroid of the triangular face. Thus,discrete angular orientations, corresponding to each triangular face, were obtained. Theprincipal eigenvectors obtained using DTI were then binned into these discrete vectors. Thebinning was determined on the basis of the dot product between the principal eigenvector andeach discrete vector. The principal eigenvectors was binned into that angular orientation vectorwhich produced the highest value for the dot product. This provided a distribution of thedifferent orientations along a fiber tract. The probability of a tensor direction was evaluatedfrom this distribution and then entropy for the given region of interest along a probable fibertract was calculated for all three methods and compared. Since only three slices were acquirednear the central sulcus, there were two prominent fiber tracts and their branches that could bedelineated; the corpus callosum (CC) and the internal capsule (IC).
The value of DE depends on the number of triangular faces used to bin the tensor orientations.For this study, 60, 128, 160, 196 and 320 faces were obtained. It was found that the DE didnot change significantly when the number of faces was greater than 160. This study triangulatedthe sphere into 192 faces to ensure as little variance in entropy as possible due to the binningprocess.
DTI tensor-field map and connectivityFront marching algorithm (17) was used to determine the probabilistic connectivity maps inthe imaged brain volume. The rate at which the connectivity front propagates from one voxel
Rane et al. Page 4
NMR Biomed. Author manuscript; available in PMC 2010 October 5.
NIH
-PA Author Manuscript
NIH
-PA Author Manuscript
NIH
-PA Author Manuscript

at location r′ to another voxel at r depends on the co-linearity of the principal eigenvectorε1(r) amongst the neighbors and the direction in which the front continues to evolve. The ratefunction employed in this study (17) was
(2)
where n(r) is the unit vector normal to the front and determines the spread of the front. Forcomparison, identical cut-off thresholds (0.5 of the maximum value of probabilisticconnectivity obtained with equation (2)) were used for all three methods to derive connectivitymaps.
DTI tractographyFiber tracking was performed using DTI Studio v2.4 (27). A FA threshold < 0.1 and a turningangle > 65° were used as termination criteria for fiber prorogation for all three methods. DTIStudio v2.4 was also used to calculate the fiber lengths. Lowering the threshold increases thesensitivity to the random fibers and consequently affects the calculation of the fiber lengths.Nonetheless, the trend of increase in fiber length using STEAM192 was still observed at thelowered threshold.
All values in text and on graphs are reported as mean ± SD. Statistical testing utilized unpairedStudent t-test with p < 0.05 taken as reaching statistical significance.
RESULTSPhantom studies
ADC of the 1H-mannitol phantom measured along the phase-encode direction was (0.39 ±0.01) × 10−3 mm2/s (n = 8). ADC along the phase-encoding direction was used as referencefor the other two principal directions. Before geometric averaging, ADC values among thethree principal axes differed from each other up to 8.1 ± 1.2% for STEAM-48 ms and 16.7 ±1.8% for STEAM-192 ms. After correction, ADC values among the three principal axesdiffered only up to 3.7 ± 1.7% for STEAM-48 ms and 6.6 ± 3.4% for STEAM-192 ms. Asexpected, ADC along the phase-encoding direction were not statistically different betweenbefore and after correction, consistent with the notion that cross-terms were minimal along thephase-encode direction. For DSE, ADC values among the three principal axes differed up to5.4 ± 3.9% and no correction was applied. Smaller cross terms in the DSE is likely due to theuse of two balancing 180° pulses.
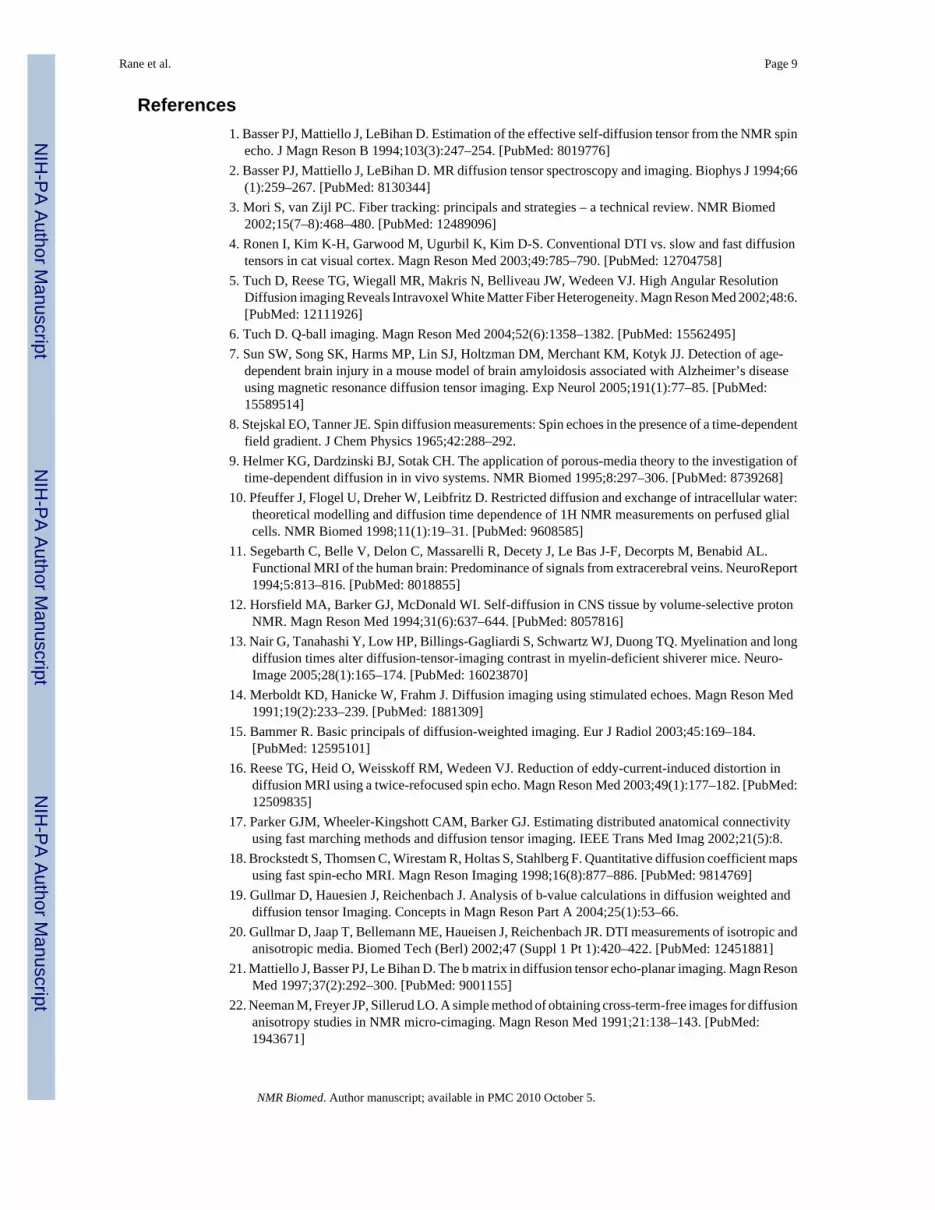
Fractional anisotropyFor all comparisons, SNR among the three methods were matched. Figure 1 shows the FAcomparisons among DSE, STEAM-48 ms and STEAM-192 ms of fixed monkey brains. OnlyWM FA of STEAM-192 ms were statistically different (p < 0.05) from those of STEAM-48ms and DSE. Indeed, WM FA of STEAM-192 ms were larger than that of STEAM-48 ms by11.5 ± 5.0% and of DSE by 11.2 ± 5.0%.
The ADC values by STEAM-48 ms, STEAM-192 ms, and DSE were, respectively, 0.18 ±0.012 × 10⁻³ mm2/s, 0.16 ± 0.012 × 10⁻³ mm2/s and 0.16 ± 0.012 × 10⁻³ mm2/s in WM, and0.26 ± 0.037 × 10⁻³ mm2/s, 0.26 ± 0.031 × 10⁻³ mm2/s and 0.25 ± 0.028 × 10⁻³ mm2/s in GM.The ADC obtained with the DSE sequence at a tdiff value of 45 ms is similar to that obtainedby STEAM-192 ms while the STEAM-48 ms calculates a higher ADC value than STEAM-192
Rane et al. Page 5
NMR Biomed. Author manuscript; available in PMC 2010 October 5.
NIH
-PA Author Manuscript
NIH
-PA Author Manuscript
NIH
-PA Author Manuscript

ms. Parallel and perpendicular diffusivities normalized by the trace ADC values werecalculated and these values are shown in Table 1.
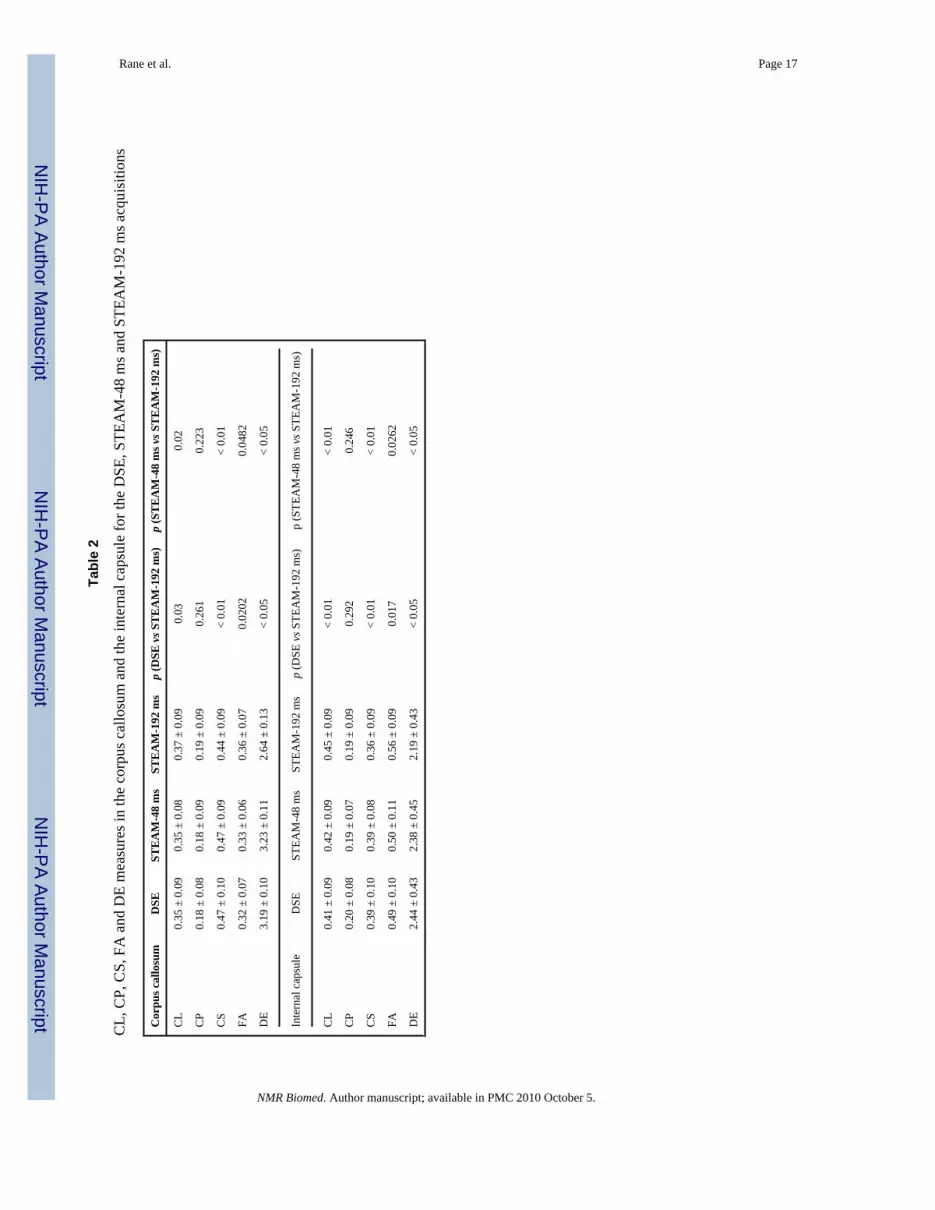
Directional EntropyThe directional entropy was evaluated along the callosal fiber tract and the internal capsule todetermine if the neighboring tensors were more co-linear at long tdiff. The values of DE aredepicted in Table 2. In comparison to STEAM-48 ms, the DE obtained by STEAM192 in theCC and IC was lower by 17.3 ± 6.3% and 10.5 ± 1.2% (p < 0.05) respectively. The decreasein DE with respect to DSE was 18.1 ± 7.2% in the CC and 8.4 ± 1.3% in the IC (p < 0.05). Inaddition Table 2 also shows the values of CL, CP, CS and FA in the same region.
Tensor and tractographyTensor-field maps were calculated for the three methods with matched SNR (DSE SNR: 36.5,STEAM-48 ms SNR: 33.9, STEAM-192 ms SNR: 34.6). STEAM-192 ms showedsubstantially larger magnitudes of the principal eigenvectors (Fig. 2) and improved coherenceamongst adjacent tensors compared to those of STEAM-48 ms and DSE. Diffusion entropyindices were 2.03, 2.10 and 1.96 for DSE, STEAM-48 ms and STEAM-192 ms, respectively,for the region shown in the figure. The decreased entropy indicated that STEAM-192 ms hada higher degree of similarity in tensor orientation among neighboring voxels.
The three-phase plots of spherical, linear and planar anisotropy (Fig. 3) showed STEAM-192ms had the highest linear anisotropy among the three methods with matched SNR. Planardiffusion was similar among the three methods.
Connectivity maps (Fig. 4) were constructed using the fast marching method. With the samecut-off statistical thresholds for all three methods for comparison, STEAM-192 ms revealedmore extensive connectivity in the low FA regions compared to DSE and STEAM-48 ms. Thiswas particularly evident in the regions of the post central gyrus (vertical arrows). DSE, on theother hand, showed less connectivity in this region. All three methods showed connectivity tolarge callosal fibers and the cortico-pontine/cortico-bulbar fibers as expected.
Fiber tracking was performed on multiple selected regions of interest, including the corpuscallosum, internal capsule and external capsule (Fig. 5). The callosal fiber tracts extendedfurther toward the cortical surface with STEAM-192 ms into the post central gyrus. Cortico-striatal and corticospinal fibers in the posterior internal capsule (white arrows) weresignificantly longer in STEAM-192 ms compared to DSE and STEAM-48 ms. Analysis of thegroup-averaged data indicated that the callosal fibers with STEAM-192 ms were 13.9 ± 0.7%longer than DSE and 14.6 ± 0.8% longer than STEAM-48 ms. The tracts in the internal capsulewith STEAM-192 ms were 21.2 ± 1.1% longer than DSE and 24.8 ± 1.3% longer thanSTEAM-48 ms. The number of fibers traced were however not statistically different.
DISCUSSIONThe major findings of this study are: DTI at longer tdiff increases linear anisotropy, yieldingincreased tensor magnitude and tensor coherence amongst adjacent voxels, and DTI at longtdiff improves connectivity and tractography outcome compared to DTI at short tdiff.
Technical considerationsGeometric averaging—Geometric averaging is a simple and effective method to minimizediffusion cross-term interactions (19,22) and, thus, directional bias in DTI data. A drawbackof geometric averaging is that the scan time is doubled but this is not an issue if signal averagingis needed. In principle, noise propagation of geometric averaging is worse than arithmetic
Rane et al. Page 6
NMR Biomed. Author manuscript; available in PMC 2010 October 5.
NIH
-PA Author Manuscript
NIH
-PA Author Manuscript
NIH
-PA Author Manuscript

averaging. The SNR of the geometric averaging in this study was slightly lower (by 5% in thisstudy) than arithmetic averaging. Another method of cross-term correction is to experimentallydetermine a correction factor for each gradient direction for specific protocol parameters suchthat the same effective b-value can be achieved for different diffusion directions on a uniformphantom (13).
SNR—DTI using spin-echo acquisition at long tdiff requires long echo time and is thus notcommonly used due to T2 signal loss. The modified STEAM sequence allows long tdiffmeasurements by placing the magnetization along the Z direction during the TM period wheresignal loss is governed by T1 as opposed to T2 processes. Given that T1 is substantially longerthan T2, signal loss at longer tdiff is less for STEAM acquisition compared to DSE for the sametdiff. The drawback of the STEAM sequence is that only half of the magnetization is retained.Such SNR loss was compensated by a shorter echo time achievable by STEAM. Indeed,STEAM-48 ms and DSE yielded a similar SNR per unit time. STEAM-192 ms had a slightlypoorer SNR than DSE and thus required more averaging. We anticipate that STEAMacquisition will be more favorable in vivo because of the longer in vivo T1 compared to fixedbrain. Note that, TE of the long tdiff protocol herein was not minimized as described in theMethods section. Future studies can utilize minimal TE for long tdiff DTI to improve SNR.
Different spin populations—Comparison between STEAM and DSE DTI data needs tobe made with caution because they could have different T1 and T2 weighting. Each voxel ofthe DSE acquisition has larger contribution of the longer T2 water species, whereas each voxelof the STEAM acquisition at long tdiff has larger contribution from longer T1 water species.Indeed, FA, ADC, λ2 and λ3 were significantly different (p < 0.05) between short (60 ms) andlong (80 ms) TE acquired using STEAM-192 ms. Nonetheless, these effects are unlikely toalter the fiber tracking outcome and the overall conclusions of this study.
Effect of formalin—Fixation prevents tissue degradation allowing studies to be performedover hours to days to improve high spatial resolution and to study multiple protocols in a singlesetting for robust comparison. Fractional anisotropy in fixed brains and in vivo studies arecomparable (28–30). However, FA is affected by fixation and is dependent on the length offixation duration until the tissue is completely fixed (31). Formalin fixation causes proteincross-linking and reduces ADC and T2 (32,33). Over the duration of the DTI measurementsand the relatively short time after fixation that the samples were studied, 4% formalinadequately preserves tissue integrity. Importantly, acquisitions of the three methods wereinterleaved and, thus, minor tissue degradation over the course of measurements, if existed,should not affect our overall conclusions.
DTI at long tdiffDTI at long tdiff generally increases WM FA while FA in the GM is unaltered. FA increaseper se at long tdiff may not necessarily improve contrasts between WM and GM if both wereto increase proportionally. Tensor field maps, probabilistic connectivity and fiber tracking wereanalyzed using the same cut-off thresholds and at similar SNR values. Increased tensormagnitude and increased coherence of the tensor directions amongst the neighboring voxelsin regions of lower anisotropy at long tdiff further support the notion that DTI at long tdiffimproved sensitivity towards thin fibers. Moreover, STEAM-192 ms showed considerableimprovements in tracking smaller fibers and more extensive fiber connectivity with the fastmarching technique. For example, the callosal fiber tracts in STEAM-192 ms extended furtherinto the WM-GM interfaces toward the cortical surface than the other two methods. Fiber lengthmeasurements further corroborated that long tdiff indeed improved tracking of thinner fibers.Our findings are in good agreement with long tdiff DTI measurements in ex vivo calf tongueand heart (34) and in vivo mouse brain (13) although fiber tracking was not performed in those
Rane et al. Page 7
NMR Biomed. Author manuscript; available in PMC 2010 October 5.
NIH
-PA Author Manuscript
NIH
-PA Author Manuscript
NIH
-PA Author Manuscript

studies. A possible explanation that long tdiff improves DTI tractography is that watermolecules improves sampling of the anisotropic media, and thus increases DTI sensitivity inregions of low diffusion anisotropy. The exact mechanism of improved DTI tractography atlong tdiff remains to be investigated. A possible mechanism is that the rms displacement withtdiff of ~200 ms is substantially larger than the average cell sizes and, thus, DTI at long tdiffhas an increased sensitivity to water movement in the extracellular spaces along the fiber tractswhere it is less restricted by cell membranes, compared to DTI at short tdiff. Water exchangecould become significant. However, the mean intracellular water resident time in the brain hasbeen estimated to be on the order of 600 ms (38). Consequently, with tdiff of 200 ms, waterexchange effect will be negligible.
Future perspectiveLong tdiff acquisition can also be combined with other methods (such as multiple high b values)to further improve tractography. Long tdiff DTI can also be combined with fiber trackingmethods, such as advanced fast marching methods (37), which makes use of the CL measureof anisotropy to detect the presence of branching fiber bundles in a given voxel, and thecomplete diffusion tensor information. If indeed the diffusion space is better probed at longtdiff, the resulting eigen analysis would better delineate branching fibers.
The total acquisition times of our fixed brain studies herein were long because of the short T1,T2 and ADC as well as the desire to compare the three protocols in the same subject. In vivoT1, T2 and ADC are substantially larger. This should shorten data acquisition time. The numberEPI segmentations could also be reduced. Moreover, future DTI studies can utilize a singlelong tdiff DTI protocol and with minimal echo time once it is proven favorable. Our preliminaryin vivo data indicate that DTI acquisition time of a single long tdiff is comparable to typicalDTI measurements.
In conclusion, this study provides multiple corroborative evidences that DTI tractography atlong diffusion time improves tracking of smaller fibers in regions of low fractional anisotropy.We predict that in vivo DTI at longer tdiff could improve tractography. If confirmed, thisapproach could have positive impact on DTI tractography studies.
AcknowledgmentsContract/grant sponsor: NIH; contract/grant number: R01NS45879.
Contract/grant sponsor: The Center for Behavioral Neuroscience; contract/grant number: NSF, IBN-9876754.
The authors would like to thank Dr Teijun Zhao for help with the STEAM sequence and Drs Xiaodong Zhang, ShawnMa, Yoji Tanaka, and Chris Edmonds for helpful discussion and assistance. This work was supported by NIH(R01NS45879) and the Center for Behavioral Neuroscience (NSF, IBN-9876754).
Abbreviations used
ADC apparent diffusion coefficient
DTI diffusion tensor imaging
HARD high angular resolution DTI
FA fractional anisotropy
ROI region of interest
STEAM Stimulated-Echo-Acquisition-Mode dual spin-echo (DSE)
SNR signal-to-noise ratio
Rane et al. Page 8
NMR Biomed. Author manuscript; available in PMC 2010 October 5.
NIH
-PA Author Manuscript
NIH
-PA Author Manuscript
NIH
-PA Author Manuscript
References1. Basser PJ, Mattiello J, LeBihan D. Estimation of the effective self-diffusion tensor from the NMR spin
echo. J Magn Reson B 1994;103(3):247–254. [PubMed: 8019776]2. Basser PJ, Mattiello J, LeBihan D. MR diffusion tensor spectroscopy and imaging. Biophys J 1994;66
(1):259–267. [PubMed: 8130344]3. Mori S, van Zijl PC. Fiber tracking: principals and strategies – a technical review. NMR Biomed
2002;15(7–8):468–480. [PubMed: 12489096]4. Ronen I, Kim K-H, Garwood M, Ugurbil K, Kim D-S. Conventional DTI vs. slow and fast diffusion
tensors in cat visual cortex. Magn Reson Med 2003;49:785–790. [PubMed: 12704758]5. Tuch D, Reese TG, Wiegall MR, Makris N, Belliveau JW, Wedeen VJ. High Angular Resolution
Diffusion imaging Reveals Intravoxel White Matter Fiber Heterogeneity. Magn Reson Med 2002;48:6.[PubMed: 12111926]
6. Tuch D. Q-ball imaging. Magn Reson Med 2004;52(6):1358–1382. [PubMed: 15562495]7. Sun SW, Song SK, Harms MP, Lin SJ, Holtzman DM, Merchant KM, Kotyk JJ. Detection of age-
dependent brain injury in a mouse model of brain amyloidosis associated with Alzheimer’s diseaseusing magnetic resonance diffusion tensor imaging. Exp Neurol 2005;191(1):77–85. [PubMed:15589514]
8. Stejskal EO, Tanner JE. Spin diffusion measurements: Spin echoes in the presence of a time-dependentfield gradient. J Chem Physics 1965;42:288–292.
9. Helmer KG, Dardzinski BJ, Sotak CH. The application of porous-media theory to the investigation oftime-dependent diffusion in in vivo systems. NMR Biomed 1995;8:297–306. [PubMed: 8739268]
10. Pfeuffer J, Flogel U, Dreher W, Leibfritz D. Restricted diffusion and exchange of intracellular water:theoretical modelling and diffusion time dependence of 1H NMR measurements on perfused glialcells. NMR Biomed 1998;11(1):19–31. [PubMed: 9608585]
11. Segebarth C, Belle V, Delon C, Massarelli R, Decety J, Le Bas J-F, Decorpts M, Benabid AL.Functional MRI of the human brain: Predominance of signals from extracerebral veins. NeuroReport1994;5:813–816. [PubMed: 8018855]
12. Horsfield MA, Barker GJ, McDonald WI. Self-diffusion in CNS tissue by volume-selective protonNMR. Magn Reson Med 1994;31(6):637–644. [PubMed: 8057816]
13. Nair G, Tanahashi Y, Low HP, Billings-Gagliardi S, Schwartz WJ, Duong TQ. Myelination and longdiffusion times alter diffusion-tensor-imaging contrast in myelin-deficient shiverer mice. Neuro-Image 2005;28(1):165–174. [PubMed: 16023870]
14. Merboldt KD, Hanicke W, Frahm J. Diffusion imaging using stimulated echoes. Magn Reson Med1991;19(2):233–239. [PubMed: 1881309]
15. Bammer R. Basic principals of diffusion-weighted imaging. Eur J Radiol 2003;45:169–184.[PubMed: 12595101]
16. Reese TG, Heid O, Weisskoff RM, Wedeen VJ. Reduction of eddy-current-induced distortion indiffusion MRI using a twice-refocused spin echo. Magn Reson Med 2003;49(1):177–182. [PubMed:12509835]
17. Parker GJM, Wheeler-Kingshott CAM, Barker GJ. Estimating distributed anatomical connectivityusing fast marching methods and diffusion tensor imaging. IEEE Trans Med Imag 2002;21(5):8.
18. Brockstedt S, Thomsen C, Wirestam R, Holtas S, Stahlberg F. Quantitative diffusion coefficient mapsusing fast spin-echo MRI. Magn Reson Imaging 1998;16(8):877–886. [PubMed: 9814769]
19. Gullmar D, Hauesien J, Reichenbach J. Analysis of b-value calculations in diffusion weighted anddiffusion tensor Imaging. Concepts in Magn Reson Part A 2004;25(1):53–66.
20. Gullmar D, Jaap T, Bellemann ME, Haueisen J, Reichenbach JR. DTI measurements of isotropic andanisotropic media. Biomed Tech (Berl) 2002;47 (Suppl 1 Pt 1):420–422. [PubMed: 12451881]
21. Mattiello J, Basser PJ, Le Bihan D. The b matrix in diffusion tensor echo-planar imaging. Magn ResonMed 1997;37(2):292–300. [PubMed: 9001155]
22. Neeman M, Freyer JP, Sillerud LO. A simple method of obtaining cross-term-free images for diffusionanisotropy studies in NMR micro-cimaging. Magn Reson Med 1991;21:138–143. [PubMed:1943671]
Rane et al. Page 9
NMR Biomed. Author manuscript; available in PMC 2010 October 5.
NIH
-PA Author Manuscript
NIH
-PA Author Manuscript
NIH
-PA Author Manuscript
23. Le Bihan D, Mangin JF, Poupon C, Clark CA, Pappata S, Molko N, Chabriat H. Diffusion tensorimaging: concepts and applications. J Magn Reson Imaging 2001;13(4):534–546. [PubMed:11276097]
24. Alexander AL, Hasan K, Kindlmann G, Parker DL, Tsuruda JS. A geometric analysis of diffusiontensor measurements of the human brain. Magn Reson Med 2000;44:283–291. [PubMed: 10918328]
25. Olah L, Wecker S, Hoehn M. Secondary deterioration of apparent diffusion coefficient after 1-hourtransient focal cerebral ischemia in rats. J Cereb Blood Flow Metab 2000;20:1474–1482. [PubMed:11043910]
26. Neuvonen T, Salli E. Characterizing diffusion tensor imaging data with directional entropy.Proceedings of the IEEE Engineering in Medicine and Biology Society. 2005
27. Jiang H, van Zijl PCM, Kim J, Pearlson GD, Mori S. DTIStudio: Resource program for diffusiontensor computation and fiber bundle tracking. Comput Meth Program Biomed 2006;81:106–116.
28. Sun SW, Neil JJ, Song SK. Relative indices of water diffusion anisotropy are equivalent in live andformalin-fixed mouse brains. Magn Reson Med 2003;50(4):743–748. [PubMed: 14523960]
29. Guilfoyle DN, Helpern JA, Lim KO. Diffusion tensor imaging in fixed brain tissue at 7.0 T. NMRBiomed 2003;16(2):77–81. [PubMed: 12730948]
30. D’Arceuil HE, Westmoreland S, de Crespigny AJ. An approach to high resolution diffusion tensorimaging in fixed primate brain. Neuro-Image 2007;35(2):553–565. [PubMed: 17292630]
31. D’Arceuil H, de Crespigny A. The effects of brain tissue decomposition on diffusion tensor imagingand tractography. NeuroImage 2007;36(1):64–68. [PubMed: 17433879]
32. Blamire AM, Rowe JG, Styles P, Mc Donald B. Optimising imaging parameters for post mortem MRimaging of the human brain. Acta Radiologica 1999;40:593–597. [PubMed: 10598845]
33. Pfefferbaum A, Sullivan EV, Adalsteinsson E, Garrick T, Harper C. Postmortem MR imaging offormalin-fixed human brain. NeuroImage 2004;21:1585–1595. [PubMed: 15050582]
34. Kim S, Chi-Fishman G, Barnett AS. C.P. Dependence on diffusion time of apparent diffusion tensorof ex vivo calf tongue and heart. Magn Reson Med 2005;56(6):1387–1386. [PubMed: 16265644]
35. Assaf Y, Basser PJ. Composite hindered and restricted model of diffusion (CHARMED) MR imagingof the human brain. NeuroImage 2005;27(1):48–58. [PubMed: 15979342]
36. Yoshiura T, Wu O, Zaheer A, Reese TG, Sorensen AG. Highly diffusion-sensitized MRI of brain:Dissociation of gray and white matter. Magn Reson Med 2001;45(5):734–740. [PubMed: 11323798]
37. Staempfli P, Jaermann T, Crelier GR, Kollias S, Valavanis A, Boesiger P. Resolving fiber crossingusing advanced fast marching tractography based on diffusion tensor imaging. NeuroImage 2006:30.
38. Quirk JD, Bretthorst GL, Duong TQ, Snyder AZ, Springer CS Jr, Ackerman JJ, Neil JJ. Equilibriumwater exchange between the intra-and extracellular spaces of mammalian brain. Magn Reson Med2003;50:493–499. [PubMed: 12939756]
Rane et al. Page 10
NMR Biomed. Author manuscript; available in PMC 2010 October 5.
NIH
-PA Author Manuscript
NIH
-PA Author Manuscript
NIH
-PA Author Manuscript
Figure 1.Fractional anisotropy (FA) of fixed rhesus monkey brains acquired using double-spin echo(DSE) with diffusion time = 45 ms, STEAM with diffusion time = 48 (STEAM-48 ms) and192 ms (STEAM-192 ms). White matter (WM) and gray matter (GM) were segmented basedon T1-weighted images. Inset A shows GM ROI and Inset B shows the WM mask used in thegenerated the FA plots.
Rane et al. Page 11
NMR Biomed. Author manuscript; available in PMC 2010 October 5.
NIH
-PA Author Manuscript
NIH
-PA Author Manuscript
NIH
-PA Author Manuscript

Figure 2.Tensor-field maps overlaid on the fractional anisotropy (FA) maps a fixed monkey brainobtained using (a) DSE, (b) STEAM-48 ms, and (c) STEAM-192 ms. Inset: FA map showingthe expanded ROI.
Rane et al. Page 12
NMR Biomed. Author manuscript; available in PMC 2010 October 5.
NIH
-PA Author Manuscript
NIH
-PA Author Manuscript
NIH
-PA Author Manuscript
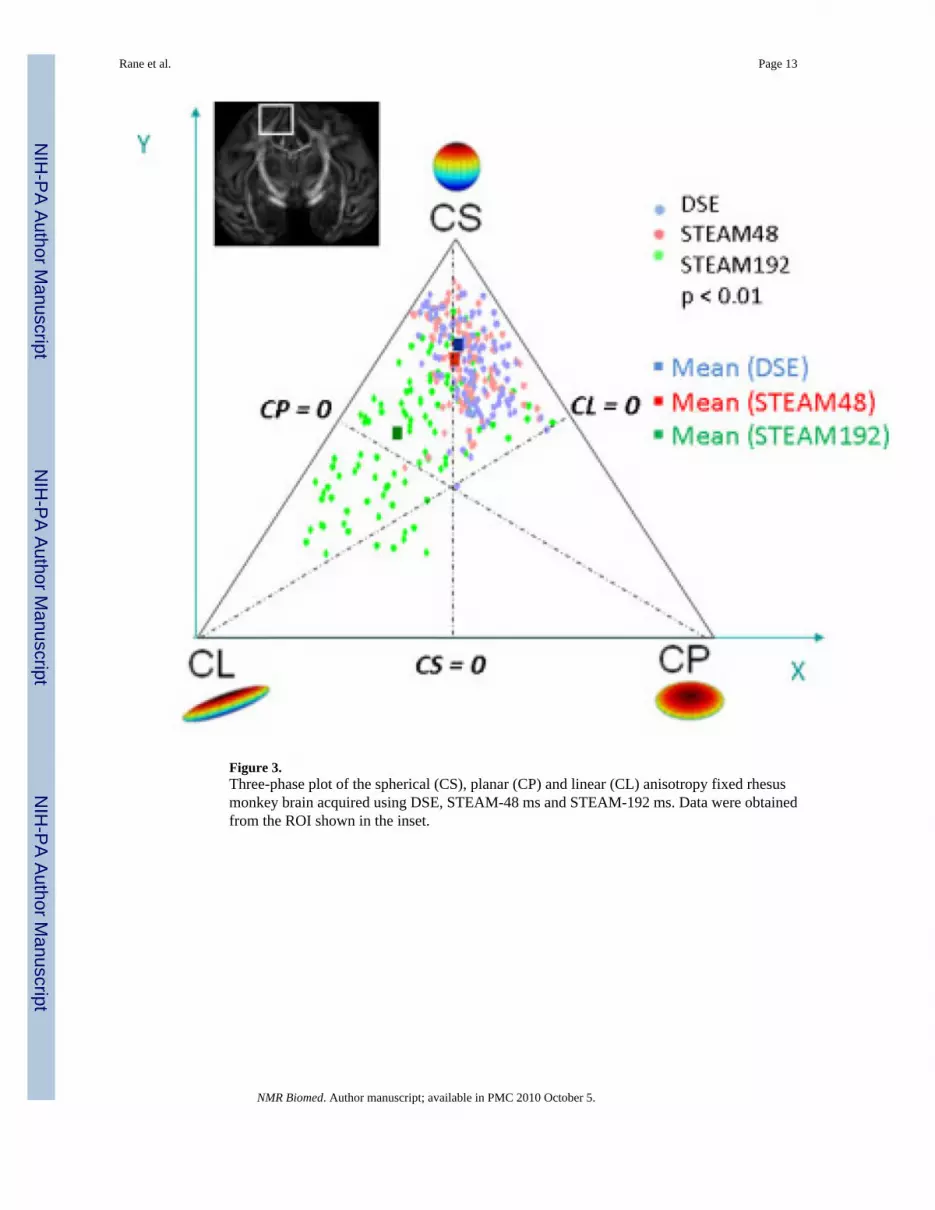
Figure 3.Three-phase plot of the spherical (CS), planar (CP) and linear (CL) anisotropy fixed rhesusmonkey brain acquired using DSE, STEAM-48 ms and STEAM-192 ms. Data were obtainedfrom the ROI shown in the inset.
Rane et al. Page 13
NMR Biomed. Author manuscript; available in PMC 2010 October 5.
NIH
-PA Author Manuscript
NIH
-PA Author Manuscript
NIH
-PA Author Manuscript
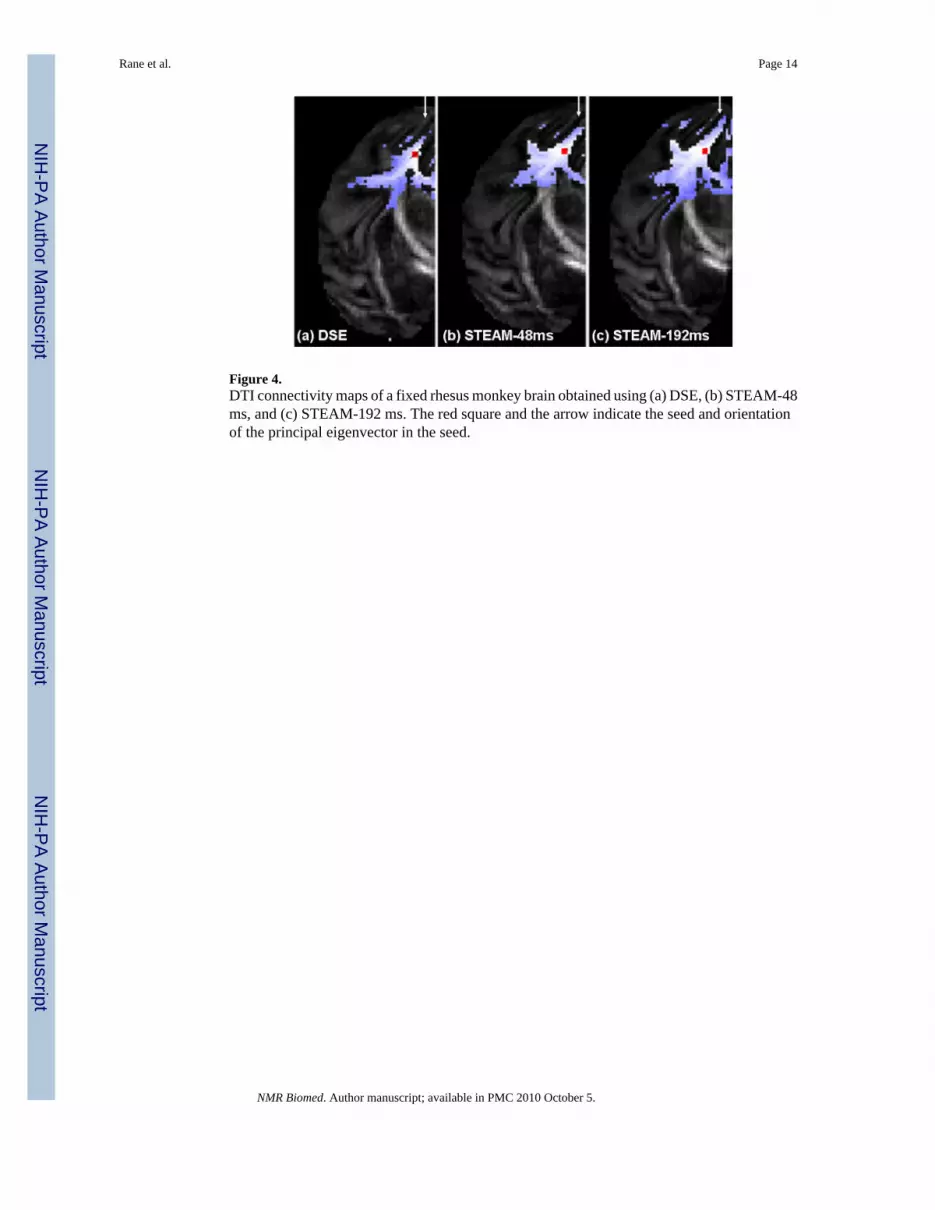
Figure 4.DTI connectivity maps of a fixed rhesus monkey brain obtained using (a) DSE, (b) STEAM-48ms, and (c) STEAM-192 ms. The red square and the arrow indicate the seed and orientationof the principal eigenvector in the seed.
Rane et al. Page 14
NMR Biomed. Author manuscript; available in PMC 2010 October 5.
NIH
-PA Author Manuscript
NIH
-PA Author Manuscript
NIH
-PA Author Manuscript
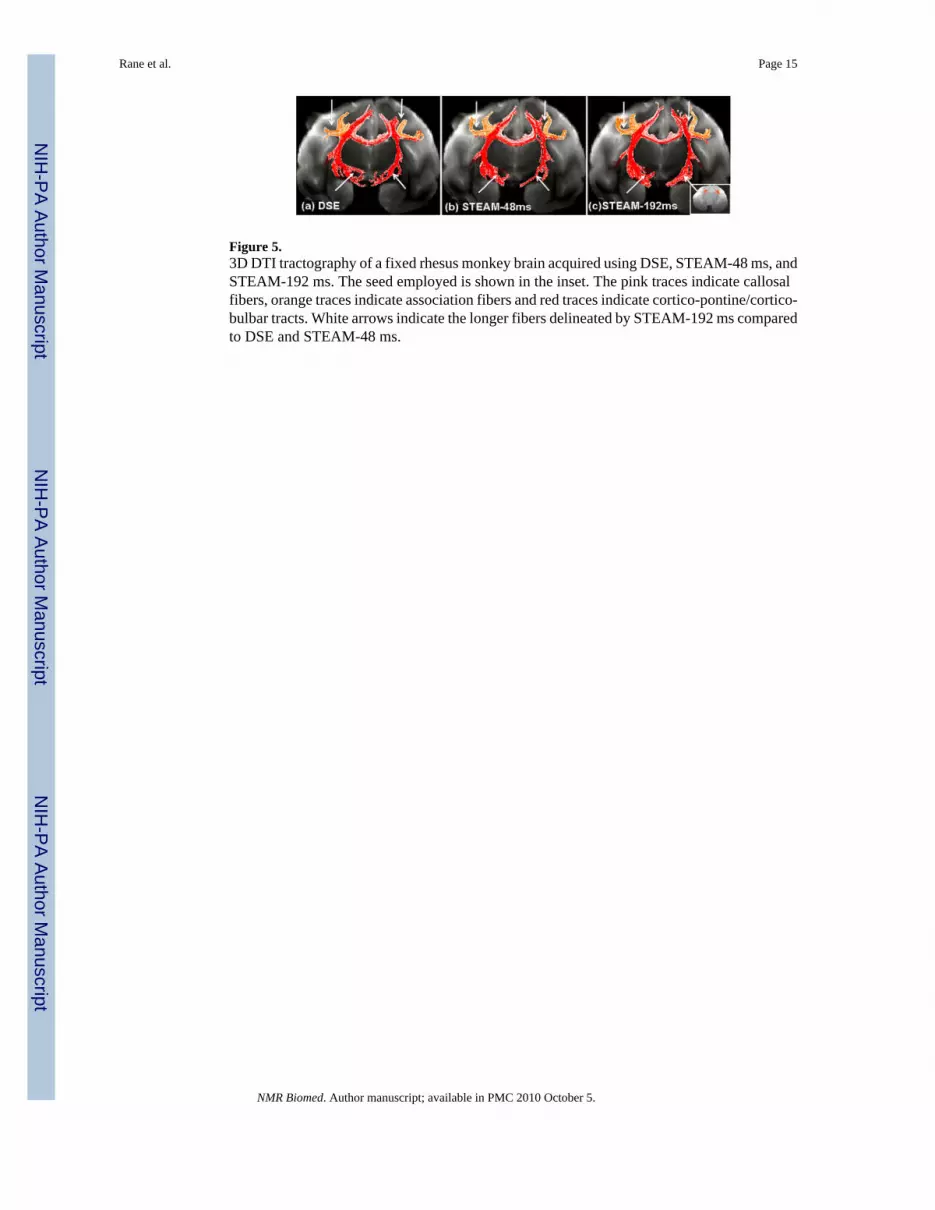
Figure 5.3D DTI tractography of a fixed rhesus monkey brain acquired using DSE, STEAM-48 ms, andSTEAM-192 ms. The seed employed is shown in the inset. The pink traces indicate callosalfibers, orange traces indicate association fibers and red traces indicate cortico-pontine/cortico-bulbar tracts. White arrows indicate the longer fibers delineated by STEAM-192 ms comparedto DSE and STEAM-48 ms.
Rane et al. Page 15
NMR Biomed. Author manuscript; available in PMC 2010 October 5.
NIH
-PA Author Manuscript
NIH
-PA Author Manuscript
NIH
-PA Author Manuscript

NIH
-PA Author Manuscript
NIH
-PA Author Manuscript
NIH
-PA Author Manuscript
Rane et al. Page 16
Table 1
Measures of parallel diffusivity (Dll) and perpendicular diffusivity (D⊥), normalized by the ADC. The ratioDll/D⊥ increased by approximately 5.7% with STEAM-192 ms as compared to DSE and STEAM-48 ms
DSE STEAM-48 ms STEAM-192 ms
Dll 0.432 ± 0.017 0.436 ± 0.019 0.456 ± 0.018
D⊥ 0.283 ± 0.012 0.284 ± 0.019 0.281 ± 0.017
Dll/D⊥ 1.526 ± 0.016 1.535 ± 0.018 1.622 ± 0.016
NMR Biomed. Author manuscript; available in PMC 2010 October 5.
NIH
-PA Author Manuscript
NIH
-PA Author Manuscript
NIH
-PA Author Manuscript
Rane et al. Page 17
Tabl
e 2
CL,
CP,
CS,
FA
and
DE
mea
sure
s in
the
corp
us c
allo
sum
and
the
inte
rnal
cap
sule
for t
he D
SE, S
TEA
M-4
8 m
s and
STE
AM
-192
ms a
cqui
sitio
ns
Cor
pus c
allo
sum
DSE
STE
AM
-48
ms
STE
AM
-192
ms
p (D
SE v
s ST
EA
M-1
92 m
s)p
(ST
EA
M-4
8 m
s vs S
TE
AM
-192
ms)
CL
0.35
± 0
.09
0.35
± 0
.08
0.37
± 0
.09
0.03
0.02
CP
0.18
± 0
.08
0.18
± 0
.09
0.19
± 0
.09
0.26
10.
223
CS
0.47
± 0
.10
0.47
± 0
.09
0.44
± 0
.09
< 0.
01<
0.01
FA0.
32 ±
0.0
70.
33 ±
0.0
60.
36 ±
0.0
70.
0202
0.04
82
DE
3.19
± 0
.10
3.23
± 0
.11
2.64
± 0
.13
< 0.
05<
0.05
Inte
rnal
cap
sule
DSE
STEA
M-4
8 m
sST
EAM
-192
ms
p (D
SE v
s STE
AM
-192
ms)
p (S
TEA
M-4
8 m
s vs S
TEA
M-1
92 m
s)
CL
0.41
± 0
.09
0.42
± 0
.09
0.45
± 0
.09
< 0.
01<
0.01
CP
0.20
± 0
.08
0.19
± 0
.07
0.19
± 0
.09
0.29
20.
246
CS
0.39
± 0
.10
0.39
± 0
.08
0.36
± 0
.09
< 0.
01<
0.01
FA0.
49 ±
0.1
00.
50 ±
0.1
10.
56 ±
0.0
90.
017
0.02
62
DE
2.44
± 0
.43
2.38
± 0
.45
2.19
± 0
.43
< 0.
05<
0.05
NMR Biomed. Author manuscript; available in PMC 2010 October 5.


