Embed Size (px)
Citation preview

Driver Toxicology Testing and the Involvement of
Marijuana in Fatal Crashes, 2010-2014
A Descriptive Report
Darrin T. Grondel Director October 2015 Revised February 2016

Publication and Contact Information
A PDF version of this report is available for download on the Washington Traffic Safety Commission website at: http://wtsc.wa.gov/research-data/traffic-safety-studies/
For technical questions/information, please contact: Staci Hoff, PhD Research Director Washington Traffic Safety Commission PO Box 40944 Olympia, WA 98504-0944 Phone: 360.725.9874 Email: [email protected]
For policy-related questions/information, please contact: Shelly Baldwin Legislative and Media Relations Manager Washington Traffic Safety Commission PO Box 40944 Olympia, WA 98504-0944 Phone: 360.725.9889 Email: [email protected] Chris Madill Deputy Director Washington Traffic Safety Commission PO Box 40944 Olympia, WA 98504-0944 Phone: 360.725.9884 Email: [email protected]
Revision History: February 2016 (impact=low): Table 31 on page 44 had incorrect ‘Marijuana Result’ table labels. The labels have been corrected. This labeling error did not affect numbers or text.

Table of Contents
Report Summary ....................................................................................................................................... - 2 -
Limitations of This Report ......................................................................................................................... - 4 -
Limitations of Descriptive Reports ........................................................................................................ - 4 -
Limitations of Fatal Crash Data ............................................................................................................. - 4 -
Background ............................................................................................................................................... - 5 -
Effects of THC on Motor Vehicle Crash Risk and Human Performance ................................................ - 5 -
Two Systematic Reviews ....................................................................................................................... - 6 -
Psychomotor and Neurocognitive Evidence: How Marijuana Impairs Driving ..................................... - 7 -
Description of Toxicology Testing Among Drivers in Fatal Crashes .......................................................... - 9 -
Drivers in Fatal Crashes Excluded From This Report .......................................................................... - 10 -
Description of Tested Drivers and Non- Tested Drivers ..................................................................... - 12 -
Description of Tested Drivers: Positive and Negative for Drugs or Alcohol ....................................... - 15 -
Categorization of Drivers Testing Positive for Alcohol or Drugs ............................................................. - 18 -
Frequency of Driver Toxicology Outcomes by Year ............................................................................ - 20 -
Comparative Description of Drivers Testing Positive for Cannabinoids ................................................. - 21 -
Driver Demographics .......................................................................................................................... - 23 -
Crash Time .......................................................................................................................................... - 25 -
Crash Characteristics and Location ..................................................................................................... - 29 -
Driver Contributing Circumstances ..................................................................................................... - 37 -
Blood Levels: Alcohol Concentration and Cannabinoids ........................................................................ - 44 -
Fatalities Involving THC-Positive Drivers ................................................................................................. - 47 -
Summary and Conclusions ...................................................................................................................... - 50 -
Appendix A: References .......................................................................................................................... - 51 -
Appendix B: Methodology ...................................................................................................................... - 53 -
Appendix C: Drug Lists ............................................................................................................................ - 55 -

Table of Tables
Table 1: Toxicology Testing of Surviving and Deceased Drivers, 2010-2014...................................................... - 10 -
Table 2: Toxicology Testing of Drivers by Year ................................................................................................... - 10 -
Table 3: Toxicology Testing of Drivers by Gender .............................................................................................. - 12 -
Table 4: Toxicology Testing of Drivers by Age Group ......................................................................................... - 12 -
Table 5: Toxicology Testing of Drivers by Gender and Age Group ..................................................................... - 13 -
Table 6: Toxicology Testing of Drivers by Investigating Jurisdiction .................................................................. - 13 -
Table 7: Toxicology Testing of Drivers by County of Crash ................................................................................ - 14 -
Table 8: Toxicology Outcomes of Drivers by Gender ......................................................................................... - 15 -
Table 9: Toxicology Outcomes of Drivers by Age Group .................................................................................... - 15 -
Table 10: Toxicology Outcomes of Drivers by Gender and Age Group .............................................................. - 16 -
Table 11: Toxicology Outcomes of Drivers by Investigating Jurisdiction ........................................................... - 16 -
Table 12: Toxicology Outcomes of Drivers by County of Crash.......................................................................... - 17 -
Table 13: Categorization of Drivers Testing Positive for Alcohol or Drugs ......................................................... - 18 -
Table 14: Categorization of Drivers Testing Positive for Alcohol or Drugs by Year ............................................ - 20 -
Table 15: Driver Comparison Groups by Year .................................................................................................... - 21 -
Table 16: Driver Comparison Groups by Gender ............................................................................................... - 23 -
Table 17: Driver Comparison Groups by Age ..................................................................................................... - 24 -
Table 18: Driver Comparison Groups by Crash Day of Week ............................................................................. - 25 -
Table 19: Driver Comparison Groups by Crash Month....................................................................................... - 27 -
Table 20: Driver Comparison Groups by Crash Time.......................................................................................... - 28 -
Table 21: Driver Comparison Groups by County of Crash .................................................................................. - 30 -
Table 22: Driver Comparison Groups by Roadway Classification ....................................................................... - 31 -
Table 23: Driver Comparison Groups by Road Type Route Signing.................................................................... - 32 -
Table 24: Driver Comparison Groups by Number of Units Involved .................................................................. - 33 -
Table 25: Driver Comparison Groups by Types of Multiple Unit Crashes .......................................................... - 35 -
Table 26: Driver Comparison Groups by Vehicle Type ....................................................................................... - 36 -
Table 27: Frequency of Driver Contributing Circumstances (CC) ....................................................................... - 37 -
Table 28: Driver Comparison Groups by Frequency of Driver Errors ................................................................. - 39 -
Table 29: Driver Comparison Groups by Frequency of High Risk Driver Behavior ............................................. - 40 -
Table 30: Driver Comparison Groups by Restraint Use ...................................................................................... - 42 -
Table 31: Drivers Positive for Any Cannabinoids ................................................................................................ - 44 -
Table 32: Blood Alcohol Concentration and Cannabinoid Blood Level Ranges .................................................. - 45 -
Table 33: THC >5ng/ml Blood Level Ranges ....................................................................................................... - 46 -
Table 34: THC <5ng/ml Blood Level Ranges ....................................................................................................... - 46 -
Table 35: Total Fatalities Involving Any Alcohol or Any THC .............................................................................. - 47 -
Table 36: Total Fatalities by Involved Driver Comparison Groups ..................................................................... - 48 -
Table 37: Fatal Person Type by Involved Driver Comparison Groups ................................................................ - 49 -
Table of Figures
Figure 1: Proportion of DUI Toxicology Outcomes Positive for THC .................................................................... - 9 -
Figure 2: Drivers in Fatal Crashes by Toxicology Testing Status ......................................................................... - 11 -
Figure 3: Categorization of Driver Positive Alcohol and Drug Results ................................................................ - 19 -
Figure 4: Percent Change in Frequency of Driver Comparison Groups, 2010-2014........................................... - 22 -
Figure 5: Frequency of Drivers Testing Positive for Cannabinoids by Year ........................................................ - 22 -
Figure 6: Driver Comparison Groups by Age ...................................................................................................... - 24 -
Figure 7: Driver Comparison Groups by Weekend/Weekday Crashes ............................................................... - 26 -
Figure 8: Driver Comparison Groups by Day/Night Crashes .............................................................................. - 29 -
Figure 9: Driver Comparison Groups by Rural/Urban Crashes ........................................................................... - 32 -
Figure 10: Driver Comparison Groups by Number of Units Involved ................................................................. - 34 -
Figure 11: Driver Comparison Groups by Number of Other Contributing Circumstances ................................. - 38 -
Figure 12: Other High Risk Behaviors by Driver Comparison Groups ................................................................ - 41 -
Figure 13: Driver Comparison Groups by Improper/Non Restraint Use ............................................................ - 43 -
Figure 14: Total Fatalities Involving Any Alcohol, Any Drugs, and Any THC ....................................................... - 47 -

- 1 -
Glossary
THC – Acronym for Tetrahydrocannabinols. For purposes of this report, the use of THC specifically refers
to delta-9-THC, the psychoactive chemical entering the blood and brain immediately after marijuana
smoking/consumption.
Carboxy-THC – The metabolite of delta-9-THC; this metabolite may be detected for up to 30 days after
consumption.
Cannabinoids – A class of chemical compounds contained in marijuana. For purposes of this report,
cannabinoids are an encompassing term to include any toxicology outcome related to marijuana (THC or
carboxy-THC undistinguished).
Marijuana ng/ml of Blood – The unit of measurement used to describe the level of THC and/or carboxy-
THC contained in a person’s blood.
Other Drugs – Other drugs found in drivers involved in fatal crashes are from discrete drug families
including narcotic analgesics, hallucinogens, depressants, stimulants, inhalants, and PCP. This report
does not include alcohol when referring to other drugs. Detailed THC and carboxy-THC information were
derived from toxicology reports. Descriptions of other drugs in this report relied on existing FARS drug
coding. A complete list of detailed FARS drug information found in drivers reviewed in this report is
included in Appendix C.
Blood Alcohol Concentration (BAC), alcohol greater than/equal to BAC .08 – The unit of measurement
used to describe the level of alcohol contained in a person’s blood; the measurement describes the
percent of a person’s blood that is alcohol. Alcohol greater than/equal to BAC .08 refers to a driver at or
in excess of the per se limit.
Fatality Analysis Reporting System (FARS) – A national database funded by the National Highway Traffic
Safety Administration containing a census of all fatal traffic crashes occurring in the U.S. Washington
State FARS is supplemented with information from toxicology reports, death records, coroner reports,
EMS information, vehicle registration, and driver licensing information.
Units in Fatal Crashes – Fatal crashes involve bodies other than just vehicles. The term unit refers to
other vehicles, vehicles without drivers (i.e. parked vehicles), and non-motorists. A multiple unit fatal
crash would describe a vehicle-vehicle crash, a vehicle-parked car crash, and a vehicle-pedestrian crash.
Non-Motorists – These persons involved in fatal crashes refer to non-vehicle occupants, covering
pedestrians (persons on foot, wheelchairs, skateboards, etc.) and bicyclists.

- 2 -
Report Summary The Fatality Analysis Reporting System (FARS) contains significant limitations in analyzing drug positive
drivers involved in fatal crashes. Most notable to Washington, this data does not offer a cannabinoid
code set that distinguishes between delta-9-THC and the metabolite, carboxy-THC. The levels of drugs
present in blood are also not recorded in the FARS system, although they are provided in toxicology
reports. In response to this limitation, Washington FARS Analysts, in collaboration with the State
Toxicologist, manually abstracted cannabinoid drug results for deceased and surviving drivers involved
in fatal crashes when toxicology analysis was performed.
This report is a description of this newly compiled data. The following is a summary of key observations
gleaned from this more detailed fatal crash information with a focus on cannabinoid-positive drivers:
From 2010-2014 there were 3,027 drivers involved in fatal crashes, of which 1,773 (58.6 percent)
were tested for both alcohol and drugs with known results. Of the 1,773 drivers analyzed 1,061
(59.8 percent) were positive for alcohol and/or drugs.
In 2014, 84.3 percent of drivers positive for cannabinoids were positive for THC, compared to only
44.4 percent of cannabinoid-positive drivers in 2010. In 2014, among the 75 drivers involved in fatal
crashes positive for THC, approximately half (38) exceeded the 5 ng/ml THC per se limit.
The frequency of drivers in fatal crashes that tested positive for THC, alone or in combination with
alcohol or other drugs, was highest in 2014 (75 drivers) compared to the previous four-year average
(36 drivers). The frequency of drivers with alcohol greater than/equal to BAC .08 and no other drugs
was lowest in 2014 (51 drivers) compared to the previous four-year average (98 drivers).
From the 1,061 drivers who tested positive for alcohol and/or drugs, mutually exclusive driver
categories were established. This report focuses on a subset of these driver comparison groups (547
total drivers):
o Only THC (56, 5.3 percent)
o Only carboxy-THC (37, 3.5 percent)
o THC and alcohol greater than/equal to BAC .08 (83, 7.8 percent)
o THC, alcohol greater than/equal to BAC. 08, and drugs (18, 1.7 percent)
o THC and other drugs (39, 3.7 percent)
o Only alcohol greater than/equal to BAC .08 (314, 29.6 percent)
Among drivers in fatal crashes that tested positive for only THC or only carboxy-THC, the largest
proportion are ages 16-25. This age group also had the highest proportion of drivers with alcohol
greater than/equal to BAC .08. Of drivers that tested positive for the combination of THC and
alcohol greater than/equal to BAC 0.08, 39.8 percent were ages 16-25.

- 3 -
Similar to drivers with only alcohol greater than/equal to BAC .08, drivers with the combination of
THC and alcohol greater than/equal to BAC .08 were involved in fatal crashes that occurred most
frequently on the weekends. Drivers with only THC were involved in fatal crashes that occurred
equally between weekends (48.2 percent) and weekdays (51.8 percent).
Drivers with alcohol greater than/equal to BAC .08, alone or in combination with other drugs, were
involved in fatal crashes that occurred most often during the nighttime hours (6 p.m. – 5 a.m.).
Drivers with only THC or only carboxy-THC were involved in fatal crashes that occurred most often
during the daytime hours, similar to drivers with no drugs or alcohol.
Drivers with only alcohol greater than/equal to BAC .08 were involved in fatal crashes that occurred
most frequently on rural roads (58.6 percent), whereas the majority of drivers with only THC were
involved in fatal crashes that occurred most frequently on urban roads (58.9 percent).
Drivers with alcohol greater than/equal to BAC .08, alone or in combination with other drugs, were
most frequently the only unit (no other vehicles or non-motorists) involved in the fatal crash. In
contrast, over 70 percent of drivers with only THC or only carboxy-THC were involved in multiple
unit fatal crashes, similar to the frequency of drivers with no drugs or alcohol.
Drivers involved in fatal crashes with no drugs or alcohol and drivers with only carboxy-THC had the
highest frequency of no reported crash contributing circumstances (approximately 44 percent).
Among drivers with only THC, 28.6 percent had no other crash contributing circumstances reported,
compared to 17.5 percent of drivers with only alcohol greater than/equal to BAC .08.
The most frequently reported driver error among drivers in fatal crashes with only THC was lane
deviation (12.5 percent), followed by overcorrecting (8.9 percent).
More than half of drivers with only alcohol greater than/equal to BAC .08 involved in fatal crashes
were speeding. Over 60 percent of drivers with alcohol greater than/equal to BAC .08 and THC
combined were speeding.
The observations described in this report are insufficient for determining the link between THC and
crash risk. The full limitations of this information as it is presented in this report are detailed in the
following section.

- 4 -
Limitations of This Report
The purpose and scope of this report is to simply describe trends and characteristics of drivers involved
in fatal crashes. The Washington Traffic Safety Commission continuously monitors trends and outcomes,
including drug involvement in fatal crashes. In 2014, the state experienced an increase in the number of
drivers involved in fatal crashes who tested positive for THC. This report provides a look inside that
trend and provides comparisons for consideration and discussion. More information is still needed
before any conclusions can be made relating to the impact of legalized recreational marijuana on traffic
safety in Washington State.
It is not the purpose or within the scope of this report to establish crash risk due to marijuana.
Therefore, the information in this report cannot be used to determine if marijuana is or is not causing
fatal crashes. Washington State crash data does not include the assignment of an ‘at-fault’ driver. The
information in this report was not designed to provide a link between marijuana use and levels of
impairment.
Limitations of Descriptive Reports
Descriptive reports alone cannot determine if characteristic differences or changes observed over time
are significant or simply due to chance. The purpose of a descriptive report, including this report, is to
describe observed characteristics of a population or subject. A descriptive report does not attempt to
explain why characteristics within the population vary, merely that they do. Descriptive reports provide
simple summaries about the population or subject of interest and describe what the data shows, but are
not sufficient for reaching conclusions. However, describing available data is a necessary first step
before inference from the data can be determined.
Limitations of Fatal Crash Data
Fatal crash data is not a population-based dataset, meaning that the observations derived from persons
involved in fatal crashes are not indicative of the population at large. For example, we know from the
annual seat belt observation study that the population-based seat belt use rate is approximately 95
percent; however the seat belt use rate of all vehicle occupants involved in fatal crashes is only 80
percent. Drivers under the influence of drugs and/or alcohol involved in fatal crashes are generally a
group of higher risk drivers who engage in other high risk behaviors not typical of the driving population
at large.
Fatal crash events involve many factors beyond the behavioral characteristics of the drivers involved.
Analysis of any crash data must account for factors present in the culture, environment, engineered
roadways, and enforcement activities. Description of fatal crash data may not describe the general
population, but it does describe a subset of persons at a higher risk for fatal crash involvement due to
specific high risk characteristics and behaviors, such as impaired driving.

- 5 -
Background
Effects of THC on Motor Vehicle Crash Risk and Human Performance
Marijuana is the ‘most commonly used illicit drug’ in the U.S., consumed by 7.5 percent of Americans
ages 12 and older in 2013.(13) Likewise, it is also the most commonly detected non-alcohol drug found in
drivers who died within one hour of a motor vehicle crash in the U.S.(3) As with many other drugs used
for non-medical (i.e., ‘recreational’) purposes, at least part of the allure of marijuana lies in its
stimulation of elevated dopamine levels in the nucleus accumbens (NA), resulting in intense feelings of
‘euphoria ’.(9)
In Washington State, among drivers in fatal crashes that were tested for drugs, cannabinoids were
detected more frequently than any other psychoactive substance, except alcohol. In 2014, the
Washington Young Adult Health Survey, a collaborative effort between the University of Washington
and state agencies, found that 43 percent of 18-25 year-old respondents had ‘used marijuana for
recreational purposes’ within the previous year, and 47 percent of these reported doing so at least once
a month. During the previous 30 days, nearly half of the at least once-a-month users (49 percent) had
driven a motor vehicle within three hours of marijuana use.(4) The Behavioral Risk Factor Surveillance
Survey, a telephone-based weighted sample survey funded by the Centers for Disease Control, found
that 10 percent of Washington adults age 18 and over reported using marijuana in the past 30 days, and
39 percent of these adults reported driving within three hours of consumption.(16) It has become
critically important for public officials to accurately assess all potential threats to health and safety
posed by the apparent increases in marijuana use.
The search for clear and compelling evidence about the nature of marijuana’s impairing effects has been
complicated by a number of factors. Until fairly recently not much was known about the neurobiology of
how cannabinoids affect the human body. The major psychoactive compound in marijuana, delta-9-
tetrahydrocannabinol (delta-9 THC), was not identified and isolated until 1964, and the human
endocannabinoid system was not firmly established until the late 1990s. A potent psychoactive
metabolite of THC, i.e., 11-OH-THC, is oxidized directly to carboxy-THC. This fairly late development of
knowledge about marijuana is likely the result of both political (DEA-related) and technical
(development of more sensitive technologies and techniques) obstacles.(11)
Numerous earlier studies investigating the relationship between marijuana impairment and driving
found no additional crash risk posed by driving under the influence of marijuana (for example, see
Lowenstein and McLain (10)). However, these studies did not distinguish between THC and the inactive
metabolite carboxy-THC therefore recent analysts have observed that these earlier crash-risk estimates
for marijuana were bias. In part this was caused by ‘the difficulty of collecting specimens quickly enough
to capture rapidly decreasing active THC concentrations’ (5,7). In effect, then, many earlier studies
purporting to show motor vehicle crash risk instead demonstrate marijuana use prevalence among crash
involved drivers.

- 6 -
Other problems have also contributed to the ambiguous results of marijuana and driving studies. Erratic
rates of blood THC testing of drivers in crashes have almost certainly introduced selection bias into
studies of associated motor vehicle crash risk, and the failure of some studies to include comparisons
with drug-positive drivers who are not involved in crashes has probably resulted in overstating the role
of drugs alone. Thus, generally inadequate controls for these and other potential confounders (e.g.,
age, gender, seat belt use, alcohol use) have flawed many earlier studies. (5,7)
Two Systematic Reviews
Two recent (2012) meta-studies were able to control more carefully for these confounders. They also
reached remarkably similar conclusions regarding the motor vehicle crash risk posed by THC-positive
drivers. Both studies included two of the same studies in their final study samples.(3,16) Li et al.
systematically winnowed an initial collection of nearly 3,000 studies down to a final sample of nine
(from six different countries) based on their ‘high quality and credibility’. Five of these were case-control
studies, two were cross-sectional surveys, and two were cohort studies. All but one of the studies found
increases in crash risk following driver use of marijuana, and seven of them independently concluded
that THC-positive drivers are more than twice as likely to crash as THC-free drivers. Two of the studies
offered data enabling analysis of a dose-response relationship between THC and crash risk. Using
unadjusted odds-ratios for each study, the authors pooled and weighted the results to obtain an overall
odds ratio of 2.66 (2.07-3.41), meaning that drivers under the influence of THC were 2.66 times more
likely to crash than drivers not under the influence of THC.(8)
In the other meta-analysis, Asbridge et al. followed a systematic review process like that advocated by
the Cochrane Collaboration (6) to reach a final sample of nine studies, also from an initial pool of nearly
3,000 entries. The nine studies included three case-control studies but also six ‘culpability’ studies, a
specific type of case-control design in which driver factors contributing to each crash are analyzed
independently of drug or alcohol results, as a result of which each driver is classified as ‘culpable,’
‘contributory,’ or ‘not culpable.’ A culpability ratio was then calculated for all drivers relative to each
drug result (including alcohol) included in the study. The authors found that a ‘pooled risk of a motor
vehicle collision while driving under the influence of THC was almost twice the risk while driving
uninfluenced (odds ratio 1.92 [95 percent confidence interval 1.35 to 2.73]).’(2)
Asbridge et al. performed further meta-analyses on the study groups, i.e., case-control studies and
culpability studies, and found that the case-control studies estimated a higher crash risk posed by THC
than the culpability studies, which may partly account for the odds-ratio differences between the two
meta-studies. The study by Li et al. differed from that of Asbridge et al. in another important respect as
well: the latter ‘included data only if the presence of the active THC was also confirmed by a blood
sample’ (eight of the nine studies included cases showing minimum ‘cut-off’ levels of 1 or 2 ng/ml),
whereas the former included data from studies that relied either on urine or blood samples confirming
the presence of carboxy-THC alone.

- 7 -
Psychomotor and Neurocognitive Evidence: How Marijuana Impairs Driving
Driving is a complex task requiring smooth interactions among a variety of perceptual, cognitive, and
psychomotor processes. Given that all human beings are subject to limitations of these perceptual,
cognitive, and motor resources at any one time, additional demands placed on them will further
diminish driver performance. Abundant evidence from laboratory and simulator studies has shown that
THC generates a variety of deficits that diminish driving performance and require additional driver effort
to overcome. In addition, after consuming marijuana drivers are aware of their impairment and appear
‘to compensate by driving more slowly and taking fewer risks,’ though recent observers have concluded
that such driver compensation is limited in duration and effectiveness. The effort of compensating also
adds to further cognitive loading and potential distraction.(5)
Simply ‘converting’ the findings from laboratory and simulator studies to on-road driving performance
effects has resulted in unwarranted conclusions. Nonetheless, these studies have given researchers the
chance to understand the effects of both smoking and ingesting marijuana in a careful, dose-related
manner, and also to predict how driving performance is likely to be altered (smoking results in elevated
plasma-THC levels within seconds and maximum values within 15 minutes, whereas ingestion results in
lower maximum values that peak in around 1 hour). The use of critical tracking (CT) tests, for instance
(where the human subject might use a joy-stick or other control to maintain the position of a cursor or
icon on a computer screen), translates fairly well to simulator testing of standard deviation of lateral
position (SDLP) experiments, which in turn is highly similar to on-road tests measuring the lane position
variability among subject drivers. (5,7)
Driving-related human capacities that are diminished by the use of marijuana and include:
Critical Tracking – Degraded between 2 and 25 ng/ml THC for up to 7 hours.
Standard Deviation of Lateral Position (i.e. ‘weaving’) – Increases in dose-dependent fashion as THC level rises, indicating reduced vehicle control.
Steering Wheel Variability – Steering control is degraded by consumption of marijuana.
Concentrated Attention – Serious and prolonged (8-10 hours) degradation by consumption of marijuana.
Divided-Attention Tasks – Strong linear correlation between THC concentration and degraded performance at 5-25 ng/ml.
Reaction Time –Increased both simple and complex reaction time (braking, steering) after marijuana use.
Headway Variability (i.e. variation in distance between vehicles traveling in the same direction) – Increases following marijuana use.
Speed Variability – Increased speed variance following marijuana smoking.
Balance and Coordination – Standing balance and stability impaired by THC in a dose-related fashion; ‘body-sway.’
Memory and Recall – Immediate recall and also short-term and working memory seriously impaired by THC.
Visual Processing – THC degrades visual searching processing speed.
Complex Tasks – Particularly sensitive to THC’s impairing effects.

- 8 -
All of these capabilities are even more strongly compromised by the added presence of alcohol. Even
low doses of THC in combination ‘with a 0.04% BAC produced road-tracking impairment to a degree
similar to BACs of 0.09%.’(5) Likewise, chronic and heavy users of marijuana, who often show reduced
performance deficits owing to drug-tolerance, become seriously degraded after drinking alcohol. In part
this reversal occurs because alcohol erases the ability of even strongly-habituated marijuana users to
compensate for their performance decrements.
A link between THC blood levels and impairment may never be developed comparable to the
relationship that exists for alcohol. Alcohol and marijuana are very distinct in terms of chemical makeup,
body metabolism, and psychomotor impairment and therefore should not be compared. Strategies
implemented to reduce alcohol-impaired driving are not likely to have the same impact on reducing
drugged drivers. More research and information is needed before a definitive link between marijuana
use and increased crash risk can be established. However, significant limitations to this type of research
still exist, including lack of complete and reliable data, differences in toxicological blood testing methods
and sensitivity, and the vast variety of marijuana potency and consumption methods.

- 9 -
Description of Toxicology Testing Among Drivers in Fatal Crashes
Washington State has a centralized toxicology lab. This means that all drivers suspected of driving under
the influence (DUI), either in traffic or as part of a crash investigation where a blood/specimen was
collected, are tested by the Washington State Patrol (WSP) Toxicology Lab. Centralized toxicology
testing also means statewide DUI toxicology outcomes may be regularly monitored. According to
information from the Lab, the proportion of drivers suspected of DUI who tested positive for THC
reached its highest point during the first half of 2015.
Figure 1: Proportion of DUI Toxicology Outcomes Positive for THC
The WSP Toxicology Lab’s reporting thresholds for THC have varied in the past from one to two
nanograms per milliliter of blood (ng/mL). On January 1, 2013, the WSP Toxicology Lab reset the THC
reporting threshold to one ng/mL and began conducting full panel (alcohol and drug) tests on all traffic
crash blood sample submissions. Prior to this date, the Lab tested blood for the presence of alcohol first.
Only if blood alcohol concentrations were under .10, the Lab then conducted drug testing. In addition,
full panel alcohol and drug testing was only performed when a driver was involved in vehicular
homicide/assault and/or underwent a Drug Recognition Expert examination. The Lab change to full
panel testing after 2013 had a minor impact on the data used in this report (drivers with only alcohol
screening were excluded). Table 2 on the following page describes the frequency of full panel testing.

- 10 -
Toxicology Testing of Drivers in Fatal Crashes
Data was abstracted from reports obtained from the Washington State Patrol (WSP) Toxicology Lab,
collected for Fatality Analysis Reporting System (FARS) purposes. A complete description of the method
for abstracting complete toxicology from FARS records is detailed in Appendix B.
Revised Code of Washington 46.52.065 requires that ‘a blood sample be taken from all drivers and all
pedestrians who are killed in any traffic accident where the death occurred within four hours’ for
analysis by the state toxicologist ‘to determine the concentration of alcohol and, where feasible, the
presence of drugs or other toxic substances.’ This statute has led to statewide testing rates for deceased
drivers of almost 90 percent. Failure to test a deceased driver most often results from either a long
time-lag between crash and death or from some other barrier to obtaining a viable sample for testing.
Unfortunately, a similar law does not exist for surviving drivers involved in fatal crashes. Therefore
testing rates among this group are much lower and rely on the reasonable suspicion of impairment by
the investigating law enforcement parties.
Table 1: Toxicology Testing of Surviving and Deceased Drivers, 2010-2014
Drivers in Fatal Crashes Excluded From This Report
In Washington State between 2010 and 2014, a total of 3,027 drivers were involved in fatal crashes.
Overall testing rates of drivers involved in fatal crashes remained stable during this time period. The
table on the following page describes the type and frequency of toxicology tests.
Table 2: Toxicology Testing of Drivers by Year
Alcohol Test
ONLY Drug Test
ONLY Alcohol and
Drug Test Not Tested % Tested Total
2010 22 1 377 219 64.6% 619
2011 36 0 344 226 62.7% 606
2012 21 1 345 224 62.1% 591
2013 7 0 373 212 64.2% 592
20141 5 0 342 272 56.1% 619
Total 91 2 1,781 1,153 61.9% 3,027
1 At the time of this report, data for 2014 is still preliminary. Data remains preliminary until January 1, 2016.
Additional toxicology outcomes may still be received.
2010-2014 Any Toxicology
Testing No Toxicology
Testing % Tested Total
Surviving Drivers 610 1,003 37.8% 1,613
Deceased Drivers 1,264 150 89.4% 1,414
Total Drivers 1,874 1,153 61.9% 3,027

- 11 -
For purposes of this report, the results from the 91 drivers that were tested for only alcohol were
excluded from further analysis. The two drivers tested only for drugs is likely due to FARS not receiving
alcohol information, therefore these two drivers were also excluded from further analysis. Of the 1,781
drivers tested for both alcohol and drugs, eight had either an unknown alcohol or drug type result; these
eight drivers were also excluded from further analysis. The resulting final sample of 1,773 drivers was
tested for both alcohol and drugs with known drug type results.
Figure 2: Drivers in Fatal Crashes by Toxicology Testing Status
Figure 1 displays that of the 1,781 drivers tested for both alcohol and drugs, 1,061 or 59.6 percent
tested positive for drugs and/or alcohol. Eight of these drivers were tested but the results regarding the
alcohol result or type of drug were unknown.

- 12 -
Description of Tested Drivers and Non- Tested Drivers
This section describes the drivers who were tested, regardless of the injury outcome for those drivers.
Table 3: Toxicology Testing of Drivers by Gender
Gender Alcohol and
Drug Test No Test % Tested Total
Male 1,394 765 64.6% 2,159
Female 379 355 51.6% 734
Unknown 0 33 0.0% 33
Total 1,773 1,153 60.6% 2,926
Male drivers are generally involved in fatal crashes more frequently than female drivers. Even so, a
higher proportion of male drivers were tested for alcohol and drugs; 64.6 percent compared to only 51.6
percent of female drivers.
Table 4: Toxicology Testing of Drivers by Age Group
Age Group Alcohol and
Drug Test No Test % Tested Total
Age < 15 5 3 62.5% 8
16-25 457 207 68.8% 664
26-35 329 203 61.8% 532
36-45 277 189 59.4% 466
46-55 271 202 57.3% 473
56-65 226 182 55.4% 408
66-75 115 71 61.8% 186
Age 76+ 92 61 60.1% 153
Unknown 1 35 2.8% 36
Drivers ages 16-25 are generally involved in fatal crashes more frequently than any other age group. This
age group also has the highest proportion of drivers tested for alcohol and drugs at 68.8 percent.

- 13 -
Table 5: Toxicology Testing of Drivers by Gender and Age Group
Gender / Age Group
Alcohol and Drug Test No Test % Tested Total
Male 1,394 765 64.6% 2,159
Age < 15 4 1 80.0% 5
16-25 356 139 71.9% 495
26-35 260 131 66.5% 391
36-45 221 131 62.8% 352
46-55 207 139 59.8% 346
56-65 191 134 58.8% 325
66-75 95 51 65.1% 146
Age 76+ 59 37 61.5% 96
Unknown 1 2 33.3% 3
Female 379 355 51.6% 734
Age < 15 1 2 33.3% 3
16-25 101 68 59.8% 169
26-35 69 72 48.9% 141
36-45 56 58 49.1% 114
46-55 64 63 50.4% 127
56-65 35 48 42.2% 83
66-75 20 20 50.0% 40
Age 76+ 33 24 57.9% 57
Unknown 0 0 0.0% 0
Unknown 0 33 0.0% 33
Males ages 16-25 were the most frequent drivers involved in fatal crashes between 2010 and 2014.
Among this driver group, 71.9 percent were tested for alcohol and drugs. Among females of the same
age group, 59.8 percent were tested for alcohol and drugs.
Table 6: Toxicology Testing of Drivers by Investigating Jurisdiction
Investigating Jurisdiction
Alcohol and Drug Test No Test % Tested Total
State 973 615 61.3% 1,588
City 367 310 54.2% 677
County 419 216 66.0% 635
Other 3 2 60.0% 5
Unknown 11 10 52.4% 21
Among all jurisdiction levels investigating fatal crashes, city jurisdictions showed the lowest testing
proportions, testing only 54.2 percent of drivers involved in fatal crashes. County jurisdictions had the
highest testing proportion at 66 percent.

- 14 -
Table 7: Toxicology Testing of Drivers by County of Crash
County Alcohol and
Drug Test No Test % Tested Total
Adams 20 20 50.0% 40 Asotin 1 2 33.3% 3
Benton 54 31 63.5% 85 Chelan 27 21 56.3% 48 Clallam 26 12 68.4% 38
Clark 98 52 65.3% 150 Columbia 0 0 0.0% 0
Cowlitz 39 18 68.4% 57 Douglas 13 8 61.9% 21
Ferry 3 3 50.0% 6 Franklin 22 12 64.7% 34 Garfield 3 4 42.9% 7
Grant 59 44 57.3% 103 Grays Harbor 24 17 58.5% 41
Island 23 9 71.9% 32 Jefferson 12 8 60.0% 20
King 298 272 52.3% 570 Kitsap 64 26 71.1% 90
Kittitas 29 23 55.8% 52 Klickitat 19 7 73.1% 26
Lewis 24 16 60.0% 40 Lincoln 11 4 73.3% 15 Mason 31 16 66.0% 47
Okanogan 36 19 65.5% 55 Pacific 9 6 60.0% 15
Pend Oreille 12 7 63.2% 19 Pierce 166 123 57.4% 289
San Juan 3 0 100.0% 3 Skagit 33 23 58.9% 56
Skamania 8 11 42.1% 19 Snohomish 148 105 58.5% 253
Spokane 122 69 63.9% 191 Stevens 31 16 66.0% 47
Thurston 75 41 64.7% 116 Wahkiakum 0 2 0.0% 2 Walla Walla 21 17 55.3% 38
Whatcom 60 27 69.0% 87 Whitman 17 11 60.7% 28
Yakima 132 51 72.1% 183
Alcohol and drug testing of drivers involved in fatal crashes varies by county. However, several counties
experience few fatal crash events, contributing to the extreme variability seen between counties.

- 15 -
Description of Tested Drivers: Positive and Negative for Drugs or Alcohol
Table 8: Toxicology Outcomes of Drivers by Gender
Gender Negative Positive % Positive Total
Male 538 856 61.4% 1,394
Female 174 205 54.1% 379
Unknown 0 0 0.0% 0
Total 712 1,061 59.8% 1,773
A higher proportion of male drivers than female drivers involved in fatal crashes are tested for alcohol
and drugs. Of these tested male drivers, 61.4 percent were positive for alcohol and/or drugs, compared
to 54.1 percent of female drivers.
Table 9: Toxicology Outcomes of Drivers by Age Group
Age Group Negative Positive % Positive Total
Age < 15 1 4 80.0% 5
16-25 171 286 62.6% 457
26-35 84 245 74.5% 329
36-45 98 179 64.6% 277
46-55 113 158 58.3% 271
56-65 112 114 50.4% 226
66-75 67 48 41.7% 115
Age 76+ 65 27 29.3% 92
Unknown 1 0 0.0% 1
Drivers aged 16-25 involved in fatal crashes had the highest proportion of alcohol and drug testing, but
this was not the age group with the highest proportion of drivers testing positive. Drivers aged 26-352
had the highest proportion of positive alcohol and drug testing at 74.5 percent, compared to 62.6
percent of drivers aged 16-25.
2 For this comparison, drivers age 15 or younger were excluded due to the small sample size.

- 16 -
Table 10: Toxicology Outcomes of Drivers by Gender and Age Group
Gender / Age Group Negative Positive % Positive Total
Male 538 856 61.4% 1,394
Age < 15 1 3 75.0% 4
16-25 118 238 66.9% 356
26-35 66 194 74.6% 260
36-45 76 145 65.6% 221
46-55 85 122 58.9% 207
56-65 91 100 52.4% 191
66-75 56 39 41.1% 95
Age 76+ 44 15 25.4% 59
Unknown 1 0 0.0% 1
Female 174 205 54.1% 379
Age < 15 0 1 100.0% 1
16-25 53 48 47.5% 101
26-35 18 51 73.9% 69
36-45 22 34 60.7% 56
46-55 28 36 56.3% 64
56-65 21 14 40.0% 35
66-75 11 9 45.0% 20
Age 76+ 21 12 36.4% 33
Unknown 0 0 0.0% 0
Unknown 0 0 0.0% 0
Among drivers ages 26-35, little variation existed between male and female drivers in terms of testing
positive for alcohol and/or drugs. Nearly 75 percent of both male and female drivers in this age group
who were tested for alcohol and drugs tested positive.
Table 11: Toxicology Outcomes of Drivers by Investigating Jurisdiction
Investigating Jurisdiction Negative Positive % Positive Total
State 436 537 55.2% 973
City 144 223 60.8% 367
County 131 288 68.7% 419
Other 1 2 66.7% 3
Unknown 0 11 100% 11
As shown earlier, county jurisdictions had the highest driver testing rates. This jurisdiction also had the
highest proportion of drivers testing positive for alcohol and/or drugs (68.7 percent).

- 17 -
Table 12: Toxicology Outcomes of Drivers by County of Crash
County Negative Positive % Positive Total
Adams 12 8 40.0% 20 Asotin 1 0 0.0% 1
Benton 28 26 48.1% 54 Chelan 13 14 51.9% 27 Clallam 8 18 69.2% 26
Clark 42 56 57.1% 98 Columbia 0 0 0.0% 0
Cowlitz 15 24 61.5% 39 Douglas 3 10 76.9% 13
Ferry 1 2 66.7% 3 Franklin 7 15 68.2% 22 Garfield 3 0 0.0% 3
Grant 30 29 49.2% 59 Grays Harbor 8 16 66.7% 24
Island 13 10 43.5% 23 Jefferson 6 6 50.0% 12
King 113 185 62.1% 298 Kitsap 22 42 65.6% 64
Kittitas 12 17 58.6% 29 Klickitat 9 10 52.6% 19
Lewis 11 13 54.2% 24 Lincoln 5 6 54.5% 11 Mason 13 18 58.1% 31
Okanogan 10 26 72.2% 36 Pacific 2 7 77.8% 9
Pend Oreille 3 9 75.0% 12 Pierce 56 110 66.3% 166
San Juan 0 3 100.0% 3 Skagit 16 17 51.5% 33
Skamania 2 6 75.0% 8 Snohomish 60 88 59.5% 148
Spokane 49 73 59.8% 122 Stevens 12 19 61.3% 31
Thurston 27 48 64.0% 75 Wahkiakum 0 0 0.0% 0 Walla Walla 9 12 57.1% 21
Whatcom 27 33 55.0% 60 Whitman 9 8 47.1% 17
Yakima 55 77 58.3% 132
Testing outcomes of drivers involved in fatal crashes varied by county. However, several counties
experience few fatal crash events, contributing to the extreme variability seen between counties.

- 18 -
Categorization of Drivers Testing Positive for Alcohol or Drugs
Drivers involved in fatal crashes who were tested for alcohol and drugs were assigned into mutually
exclusive categories (represented only once) based on toxicology outcomes.
Table 13: Categorization of Drivers Testing Positive for Alcohol or Drugs
TEST STATUS Driver Category 1 Sample Driver Category 2 Sample Driver Category 3 Sample
Not Tested Not Tested 1,153 Not Tested 1,153 Not Tested 1,153
Tested - Negative No Drugs, No Alcohol
712 No Drugs, No Alcohol 712 No Drugs, No Alcohol 712
Tested – Positive
(1,773)
Excluding Alcohol Test Only (91), Drug Test Only (2), Tested with Unknown Results (8)
Alcohol Only 360 Alcohol Only <.079 46 Alcohol Only <.079 46
Alcohol Only >.08 314 Alcohol Only >.08 314
Cannabinoids Only 93 THC Only 56 THC Only 56
Carboxy-THC Only 37 Carboxy-THC Only 37
Cannabinoids + Alcohol Only
137 THC + Alcohol 96
THC + Alcohol <.079 13
THC + Alcohol >.08 83
Carboxy-THC + Alcohol 41 Carboxy-THC + Alcohol 41
Cannabinoids + Drugs + Alcohol
43
THC + Drugs + Alcohol 24
THC + Drugs + Alcohol <.079
6
THC + Drugs + Alcohol >.08
18
Carboxy-THC + Drugs + Alcohol
19 Carboxy-THC + Drugs + Alcohol
19
Cannabinoids + Drugs Only
69 THC + Drugs 39 THC + Drugs 39
Carboxy-THC + Drugs 30 Carboxy-THC + Drugs 30
Other Drugs Only 258 Other Drugs Only 258 Other Drugs Only 258
Other Drugs + Alcohol Only
101 Other Drugs + Alcohol Only
101 Other Drugs + Alcohol Only
101
Total Driver Sample, 2010-2014 2,926
Some categories could have been separated further but the remainder of this report focuses on
descriptive comparisons of drivers with negative test results, drivers with alcohol greater than/equal to
BAC .08, drivers with only carboxy-THC, and drivers with combinations of THC (THC alone, THC with
alcohol greater than/equal to BAC .08, THC with other drugs, and THC with alcohol greater than/equal to
BAC .08 and drugs). Driver Category One from the table is presented in Figure 3 on the following page.

- 19 -
Figure 3: Categorization of Driver Positive Alcohol and Drug Results
Figure 3 shows the testing results of drivers in fatal crashes that tested for alcohol and drugs 2010
through 2014. Alcohol without other drugs was the most frequent substance found in drivers involved in
fatal crashes. All other drugs combined (excluding any cannabinoids and not in combination with
alcohol) also represented a high proportion of drivers testing positive (for a complete list of ‘other
drugs,’ refer to Appendix C). Compared with singular drug families (such as depressants, stimulants, and
opioids) cannabinoids was the most frequently occurring drug family among drivers in fatal crashes
testing positive for drugs.

- 20 -
Frequency of Driver Toxicology Outcomes by Year
The following table describes the frequency of mutually exclusive driver alcohol/drug categorization.
Table 14: Categorization of Drivers Testing Positive for Alcohol or Drugs by Year3
Driver
Category 3 2010 2011
%Change
2010 - 2011 2012
%Change
2011 - 2012 2013
%Change
2012 - 2013 2014
%Change
2013 - 2014
TOTAL 2010-2014
Percent Change 2010-2014
Not Tested 219 226 3.2% 224 -0.9% 212 -5.4% 272 28.3% 1,153 24.2%
No Drugs, No Alcohol
147 151 2.7% 151 0.0% 147 -2.6% 116 -21.1% 712 -21.1%
Alcohol Only <.079
15 8 -46.7% 6 -25.0% 7 16.7% 10 42.9% 46 -33.3%
Alcohol Only >.08
67 67 0.0% 60 -10.4% 69 15.0% 51 -26.1% 314 -23.9%
THC Only 9 7 -22.2% 13 85.7% 7 -46.2% 20 185.7% 56 122.2%
Carboxy-THC Only
11 10 -9.1% 7 -30.0% 3 -57.1% 6 100.0% 37 -45.5%
THC + Alcohol <.079
3 1 -66.7% 0 -100.0% 3 300.0% 6 100.0% 13 100%
THC + Alcohol >.08
16 16 0.0% 12 -25.0% 16 33.3% 23 37.5% 83 43.8%
Carboxy-THC + Alcohol
12 6 -50.0% 11 83.3% 9 -18.2% 3 -66.7% 41 -75.0%
THC + Drugs + Alcohol <.079
0 0 0.0% 1 100.0% 2 100.0% 3 50.0% 6 300%
THC + Drugs + Alcohol >.08
2 5 150.0% 2 -60.0% 3 50.0% 6 100.0% 18 200%
Carboxy-THC + Drugs + Alcohol
10 2 -80.0% 5 150.0% 2 -60.0% 0 -100.0% 19 -100%
THC + Drugs 6 3 -50.0% 8 166.7% 5 -37.5% 17 240.0% 39 183.3%
Carboxy-THC + Drugs
10 5 -50.0% 3 -40.0% 7 133.3% 5 -28.6% 30 -50.0%
Other Drugs Only
47 42 -10.6% 46 9.5% 71 54.3% 52 -26.8% 258 10.6%
Other Drugs + Alcohol Only
20 18 -10.0% 19 5.6% 20 5.3% 24 20.0% 101 20.0%
Total Drivers 594 567 -4.5% 568 0.2% 583 2.6% 614 5.3% 2,926 3.4%
3 Driver categories displayed in shaded rows were selected for further comparisons and are described throughout
the remainder of this report.

- 21 -
The frequency of drivers that tested positive for THC, alone or combined with any other drug including
alcohol, increased since 2010. The frequency of drivers that tested positive for alcohol, including alcohol
combined with carboxy-THC, declined since 2010. The occurrences of other drugs, alone or in
combination with alcohol, have increased slightly since 2010.
Comparative Description of Drivers Testing Positive for Cannabinoids
The remainder of this report will focus on the comparison of the selected driver groups based on
toxicology outcomes. These selected comparison groups are presented in the table below.
Table 15: Driver Comparison Groups by Year
2010 2011 2012 2013 2014 TOTAL
2010-2014 Percent Change
2010-2014
No Drugs, No Alcohol 147 151 151 147 116 712 -21.1%
Alcohol Only >.08 67 67 60 69 51 314 -23.9%
THC Only 9 7 13 7 20 56 122.2%
Carboxy-THC Only 11 10 7 3 6 37 -45.5%
THC + Alcohol >.08 16 16 12 16 23 83 43.8%
THC + Drugs 6 3 8 5 17 39 183.3%
THC + Drugs + Alcohol >.08 2 5 2 3 6 18 200.0%
Although sample sizes are small, the frequency of drivers in fatal crashes who tested positive for THC,
alone or in combination with other drugs and alcohol, reached its highest point in 2014 compared to the
previous four years. The number of drivers in fatal crashes who were only impaired by alcohol (BAC
greater than/equal to .08) has been steadily declining. Figures 4 and 5 on the following page
demonstrate this trend.

- 22 -
Figure 4: Percent Change in Frequency of Driver Comparison Groups, 2010-2014
Figure 5: Frequency of Drivers Testing Positive for Cannabinoids by Year

- 23 -
The remainder of the report will describe the select driver comparison groups by demographics and
crash characteristics. Due to small sample sizes, the following comparisons are made using the five years
of aggregate data.
Driver Demographics
Demographics of drivers include age and gender. The following tables describe demographic differences
between the driver comparison groups. Due to small sample sizes, gender and age are presented
separately.
Table 16: Driver Comparison Groups by Gender
MALE FEMALE
% of ALL MALE Tested Drivers
(n=1,394)
% of ALL FEMALE Tested Drivers
(n=379)
TOTAL 2010-2014
No Drugs, No Alcohol 538 174 38.6% 45.9% 712
Alcohol Only >.08 276 38 19.8% 10.0% 314
THC Only 49 7 3.5% 1.8% 56
Carboxy-THC Only 31 6 2.2% 1.6% 37
THC + Alcohol >.08 70 13 5.0% 3.4% 83
THC + Drugs 32 7 2.3% 1.8% 39
THC + Drugs + Alcohol >.08 17 1 1.2% 0.3% 18
Table 16 shows the gender of drivers involved in fatal crashes by toxicology outcomes. Of all female
drivers tested, 45.9 percent were negative for alcohol and drugs, compared to only 38.6 percent of
males. Twelve percent of tested male drivers were positive for THC, alone or in combination with other
drugs and/or alcohol, compared to 7.3 percent of tested female drivers. The frequency of drivers with
alcohol greater than/equal to BAC .08 remained highest for both genders at nearly one-fifth of tested
male drivers and one-tenth of tested female drivers.

- 24 -
Table 17: Driver Comparison Groups by Age
0-15 16-25 26-35 36-45 46-55 56-65 66-75 76+ Unk
No Drugs, No Alcohol 1 171 84 98 113 112 67 65 1
0.1% 24.0% 11.8% 13.8% 15.9% 15.7% 9.4% 9.1% 0.1%
Alcohol Only >.08 0 90 71 62 46 32 11 2 0
0.0% 28.7% 22.6% 19.7% 14.6% 10.2% 3.5% 0.6% 0.0%
THC Only 0 21 14 3 9 8 1 0 0
0.0% 37.5% 25.0% 5.4% 16.1% 14.3% 1.8% 0.0% 0.0%
Carboxy-THC Only 3 14 4 4 7 5 0 0 0
8.1% 37.8% 10.8% 10.8% 18.9% 13.5% 0.0% 0.0% 0.0%
THC + Alcohol >.08 0 33 26 15 5 4 0 0 0
0.0% 39.8% 31.3% 18.1% 6.0% 4.8% 0.0% 0.0% 0.0%
THC + Drugs 0 10 9 7 7 3 3 0 0
0.0% 25.6% 23.1% 17.9% 17.9% 7.7% 7.7% 0.0% 0.0%
THC + Drugs + Alcohol >.08 0 4 6 4 2 2 0 0 0
0.0% 22.2% 33.3% 22.2% 11.1% 11.1% 0.0% 0.0% 0.0%
Among drivers in fatal crashes testing positive for THC, the largest proportion of them were ages 16-25.
This age group also had the highest proportion of drivers with alcohol greater than/equal to BAC .08. Of
drivers testing positive for the combination of THC and alcohol greater than/equal to BAC .08, 39.8
percent were ages 16-25.
Figure 6: Driver Comparison Groups by Age
- 25 -
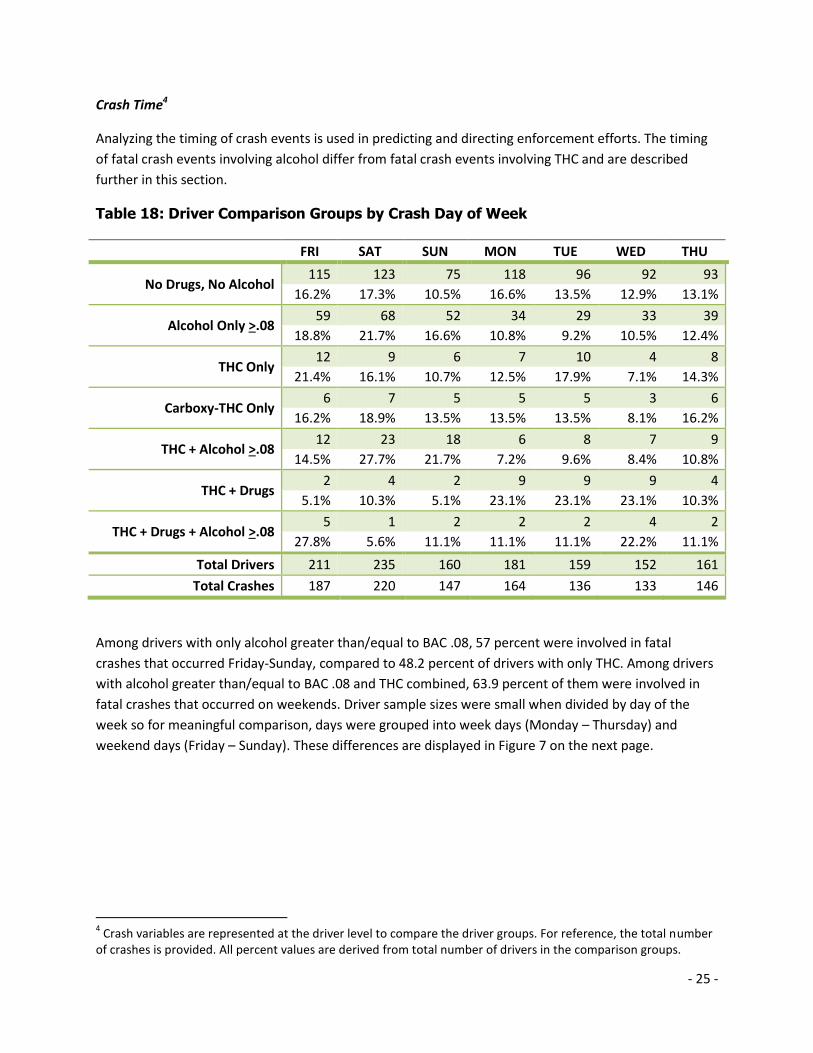
Crash Time4
Analyzing the timing of crash events is used in predicting and directing enforcement efforts. The timing
of fatal crash events involving alcohol differ from fatal crash events involving THC and are described
further in this section.
Table 18: Driver Comparison Groups by Crash Day of Week
FRI SAT SUN MON TUE WED THU
No Drugs, No Alcohol 115 123 75 118 96 92 93
16.2% 17.3% 10.5% 16.6% 13.5% 12.9% 13.1%
Alcohol Only >.08 59 68 52 34 29 33 39
18.8% 21.7% 16.6% 10.8% 9.2% 10.5% 12.4%
THC Only 12 9 6 7 10 4 8
21.4% 16.1% 10.7% 12.5% 17.9% 7.1% 14.3%
Carboxy-THC Only 6 7 5 5 5 3 6
16.2% 18.9% 13.5% 13.5% 13.5% 8.1% 16.2%
THC + Alcohol >.08 12 23 18 6 8 7 9
14.5% 27.7% 21.7% 7.2% 9.6% 8.4% 10.8%
THC + Drugs 2 4 2 9 9 9 4
5.1% 10.3% 5.1% 23.1% 23.1% 23.1% 10.3%
THC + Drugs + Alcohol >.08 5 1 2 2 2 4 2
27.8% 5.6% 11.1% 11.1% 11.1% 22.2% 11.1%
Total Drivers 211 235 160 181 159 152 161
Total Crashes 187 220 147 164 136 133 146
Among drivers with only alcohol greater than/equal to BAC .08, 57 percent were involved in fatal
crashes that occurred Friday-Sunday, compared to 48.2 percent of drivers with only THC. Among drivers
with alcohol greater than/equal to BAC .08 and THC combined, 63.9 percent of them were involved in
fatal crashes that occurred on weekends. Driver sample sizes were small when divided by day of the
week so for meaningful comparison, days were grouped into week days (Monday – Thursday) and
weekend days (Friday – Sunday). These differences are displayed in Figure 7 on the next page.
4 Crash variables are represented at the driver level to compare the driver groups. For reference, the total number
of crashes is provided. All percent values are derived from total number of drivers in the comparison groups.

- 26 -
Figure 7: Driver Comparison Groups by Weekend/Weekday Crashes
Fatal crashes that involved drivers with no alcohol or drugs were more evenly split between weekdays
and weekends than were crashes that involved alcohol. Fatal crashes involving drivers with alcohol
greater than/equal to BAC .08 occurred most frequently on weekend days.

- 27 -
Table 19: Driver Comparison Groups by Crash Month
JAN FEB MAR APR MAY JUN JUL AUG SEP OCT NOV DEC
No Drugs, No Alcohol
41 60 44 45 58 65 65 75 78 68 48 65
5.8% 8.4% 6.2% 6.3% 8.1% 9.1% 9.1% 10.5% 11.0% 9.6% 6.7% 9.1%
Alcohol Only >.08 20 18 22 29 35 30 31 33 27 20 28 21
6.4% 5.7% 7.0% 9.2% 11.1% 9.6% 9.9% 10.5% 8.6% 6.4% 8.9% 6.7%
THC Only 3 2 3 3 7 4 9 6 3 5 4 7
5.4% 3.6% 5.4% 5.4% 12.5% 7.1% 16.1% 10.7% 5.4% 8.9% 7.1% 12.5%
Carboxy-THC Only 2 3 4 0 1 4 7 3 6 1 3 3
5.4% 8.1% 10.8% 0.0% 2.7% 10.8% 18.9% 8.1% 16.2% 2.7% 8.1% 8.1%
THC + Alcohol >.08
8 6 12 6 11 7 2 3 7 7 3 11
9.6% 7.2% 14.5% 7.2% 13.3% 8.4% 2.4% 3.6% 8.4% 8.4% 3.6% 13.3%
THC + Drugs 4 4 5 4 4 4 2 1 2 4 1 4
10.3% 10.3% 12.8% 10.3% 10.3% 10.3% 5.1% 2.6% 5.1% 10.3% 2.6% 10.3%
THC + Drugs + Alcohol >.08
0 0 3 1 4 0 1 4 2 0 3 0
0.0% 0.0% 16.7% 5.6% 22.2% 0.0% 5.6% 22.2% 11.1% 0.0% 16.7% 0.0%
Total Drivers 78 93 93 88 120 114 117 125 125 105 90 111
Total Crashes 73 80 83 79 111 103 102 117 112 93 79 101
Similar to day of week, driver sample sizes were small when divided by month. No clear descriptive
patterns by month were observed.

- 28 -
Table 20: Driver Comparison Groups by Crash Time
Day:
5:01am – 6:00pm Night:
6:01pm – 5:00am Unknown Crash
Time
No Drugs, No Alcohol 483 227 2
68.0% 32.0% 0.3%
Alcohol Only >.08 82 222 10
27.0% 73.0% 3.3%
THC Only 34 22 0
60.7% 39.3% 0.0%
Carboxy-THC Only 25 11 1
69.4% 30.6% 2.8%
THC + Alcohol >.08 19 64 0
22.9% 77.1% 0.0%
THC + Drugs 20 18 1
52.6% 47.4% 2.6%
THC + Drugs + Alcohol >.08 6 12 0
33.3% 66.7% 0.0%
Total Drivers 668 576 14
Total Crashes 579 540 14
The times of day for fatal crashes that involved a driver with the combination of THC and alcohol are
similar to crashes involving a driver impaired by only alcohol. The majority of these crashes occurred in
the nighttime hours between 6 p.m. and 5 a.m. The majority of fatal crashes involving a driver with only
THC, or even THC combined with other drugs, occurred during the daytime hours. Figure 8 on the
following page displays these differences.

- 29 -
Figure 8: Driver Comparison Groups by Day/Night Crashes
The majority of fatal crashes that involved a driver with alcohol greater than/equal to BAC .08, alone or
in combination with any other drugs, occurred in the nighttime hours. The majority of fatal crashes
involving drivers with THC, alone or in combination with other drugs, occurred during the daytime
hours.
Crash Characteristics and Location5
This section describes the location and characteristics of fatal crashes. Crash characteristics include the
number and type of units involved in the crash.
5 Crash variables are represented at the driver level to compare the driver groups. For reference, the total number
of crashes is provided. All percent values are derived from total number of drivers in the comparison groups.

- 30 -
Table 21: Driver Comparison Groups by County of Crash
County No Drugs,
No Alcohol Alcohol
Only >.08 THC Only Carboxy-THC Only
THC + Alcohol
>.08 THC + Drugs
THC + Drugs + Alcohol
>.08
Adams 12 2 2 0 0 0 0 Asotin 1 0 0 0 0 0 0
Benton 28 6 3 1 3 0 0 Chelan 13 2 1 1 0 2 0 Clallam 8 7 2 1 2 0 0
Clark 42 16 3 1 5 3 1 Columbia 0 0 0 0 0 0 0
Cowlitz 15 6 2 1 1 1 0 Douglas 3 3 0 0 0 0 0
Ferry 1 1 0 0 0 1 0 Franklin 7 2 3 1 0 0 0 Garfield 3 0 0 0 0 0 0
Grant 30 8 1 2 0 1 0 Grays Harbor 8 5 0 0 2 1 0
Island 13 2 1 0 0 0 0 Jefferson 6 1 0 0 1 0 0
King 113 55 5 9 16 8 2 Kitsap 22 10 3 2 4 2 2
Kittitas 12 3 0 2 1 2 0 Klickitat 9 1 0 0 1 0 0
Lewis 11 8 1 0 0 1 1 Lincoln 5 3 1 0 0 0 0 Mason 13 6 1 0 0 0 0
Okanogan 10 10 0 1 1 0 1 Pacific 2 2 0 0 0 1 0
Pend Oreille 3 2 0 0 2 0 0 Pierce 56 39 7 4 12 4 4
San Juan 0 2 0 0 0 0 0 Skagit 16 3 1 1 0 1 1
Skamania 2 1 0 1 0 1 0 Snohomish 60 21 5 4 6 1 0
Spokane 49 26 5 1 6 2 3 Stevens 12 5 1 0 3 2 0
Thurston 27 12 1 1 3 4 1 Wahkiakum 0 0 0 0 0 0 0 Walla Walla 9 3 0 2 0 0 0
Whatcom 27 8 4 0 4 1 0 Whitman 9 2 1 0 0 0 0
Yakima 55 31 2 1 10 0 2
The frequency of drivers involved in fatal crashes varies by county. However, several counties
experience few fatal crash events, contributing to the extreme variability seen between counties.

- 31 -
Table 22: Driver Comparison Groups by Roadway Classification
Rural Urban Unknown
No Drugs, No Alcohol 427 284 1
60.0% 39.9% 0.1%
Alcohol Only >.08 184 129 1
58.6% 41.1% 0.3%
THC Only 23 33 0
41.1% 58.9% 0.0%
Carboxy-THC Only 19 17 1
51.4% 45.9% 2.7%
THC + Alcohol >.08 38 44 1
45.8% 53.0% 1.2%
THC + Drugs 25 14 0
64.1% 35.9% 0.0%
THC + Drugs + Alcohol >.08 10 8 0
55.6% 44.4% 0.0%
Total Drivers 726 528 4
Total Crashes 642 487 4
Nearly 60 percent of drivers with only alcohol greater than/equal to BAC .08 crashed on rural roadways,
whereas nearly 60 percent of drivers with THC only crashed on urban roadways. Drivers with THC
combined with alcohol greater than/equal to BAC .08 crashed most frequently on urban roadways (53
percent); however, drivers with THC and other drugs combined crashed most frequently on rural
roadways (64.1 percent). Figure 9 on the following page displays these differences.

- 32 -
Figure 9: Driver Comparison Groups by Rural/Urban Crashes
Table 23: Driver Comparison Groups by Road Type Route Signing
Interstate US
Highway State Route
City Street
County Road
Other / Unknown
No Drugs, No Alcohol 82 96 226 128 174 6
11.5% 13.5% 31.7% 18.0% 24.4% 0.8%
Alcohol Only >.08 30 17 71 62 129 5
9.6% 5.4% 22.6% 19.7% 41.1% 1.6%
THC Only 6 3 15 18 14 0
10.7% 5.4% 26.8% 32.1% 25.0% 0.0%
Carboxy-THC Only 6 2 8 7 12 2
16.2% 5.4% 21.6% 18.9% 32.4% 5.4%
THC + Alcohol >.08 5 6 17 23 31 1
6.0% 7.2% 20.5% 27.7% 37.3% 1.2%
THC + Drugs 3 2 12 7 14 1
7.7% 5.1% 30.8% 17.9% 35.9% 2.6%
THC + Drugs + Alcohol >.08 1 1 5 4 7 0
5.6% 5.6% 27.8% 22.2% 38.9% 0.0%
Total Drivers 133 127 354 249 381 15
Total Crashes 117 109 309 229 355 14

- 33 -
Generally, the majority of fatal crash events occur on state routes and county roads. However, drivers
with only THC were most frequently involved in fatal crashes that occurred on city streets.
Table 24: Driver Comparison Groups by Number of Units Involved
Single Unit Multiple Units6
No Drugs, No Alcohol 156 556
21.9% 78.1%
Alcohol Only >.08 218 96
69.4% 30.6%
THC Only 13 43
23.2% 76.8%
Carboxy-THC Only 10 27
27.0% 73.0%
THC + Alcohol >.08 50 33
60.2% 39.8%
THC + Drugs 21 18
53.8% 46.2%
THC + Drugs + Alcohol >.08 14 4
77.8% 22.2%
Total Drivers 482 777
Total Crashes 482 651
Drivers with alcohol greater than/equal to BAC .08, alone or in combination with other drugs, are most
frequently the only unit involved in fatal crashes. In comparison, over 70 percent of drivers with only
THC or only carboxy-THC were involved in multiple unit fatal crashes, similar to the frequency of drivers
with no drugs or alcohol. Figure 10 on the following page displays these differences.
6 In addition to other vehicles, non-motorists and driverless vehicles are considered units.

- 34 -
Figure 10: Driver Comparison Groups by Number of Units Involved
Units include other vehicles, parked (or driverless) vehicles, and non-motorists including pedestrians and
bicyclists. A driver with any combination of alcohol greater than/equal to BAC .08 was most often the
only unit involved in the crash. Drivers with no drugs or alcohol, only THC, or only carboxy-THC appeared
similar in terms of being most frequently involved in multiple unit crashes.

- 35 -
Table 25: Driver Comparison Groups by Types of Multiple Unit Crashes
Single Vehicle + Non-
Motorist(s)
Multiple Vehicles7 + Non-
Motorist(s) Vehicle-Vehicle7
Three or More Vehicles7
No Drugs, No Alcohol 81 10 376 89
14.6% 1.8% 67.6% 16.0%
Alcohol Only >.08 11 2 73 10
11.5% 2.1% 76.0% 10.4%
THC Only 8 2 26 7
18.6% 4.7% 60.5% 16.3%
Carboxy-THC Only 3 1 18 5
11.1% 3.7% 66.7% 18.5%
THC + Alcohol >.08 2 0 25 6
6.1% 0.0% 75.8% 18.2%
THC + Drugs 2 0 12 4
11.1% 0.0% 66.7% 22.2%
THC + Drugs + Alcohol >.08 1 0 3 0
25.0% 0.0% 75.0% 0.0%
Total Drivers 108 15 533 121
Total Crashes 108 13 433 97
Multiple vehicles are the most common type of multiple unit fatal crashes. In non-motorist fatal crashes,
a higher proportion of drivers with THC only (23.3 percent) were involved compared to the proportion
of drivers with alcohol greater than/equal to BAC .08 only (13.6 percent).
7 Includes driverless vehicles.

- 36 -
Table 26: Driver Comparison Groups by Vehicle Type
Passenger Vehicles Motorcycles
Medium/Heavy Trucks
Other Vehicle Type
No Drugs, No Alcohol 504 129 68 11
70.8% 18.1% 9.6% 1.5%
Alcohol Only >.08 245 63 1 5
78.0% 20.1% 0.3% 1.6%
THC Only 43 12 1 0
76.8% 21.4% 1.8% 0.0%
Carboxy-THC Only 27 6 3 1
73.0% 16.2% 8.1% 2.7%
THC + Alcohol >.08 72 8 0 3
86.7% 9.6% 0.0% 3.6%
THC + Drugs 33 6 0 0
84.6% 15.4% 0.0% 0.0%
THC + Drugs + Alcohol >.08 15 3 0 0
83.3% 16.7% 0.0% 0.0%
Passenger vehicles are the most common type of vehicle involved in fatal crashes. Among the driver
comparison groups, a slightly higher proportion of drivers with only alcohol greater than/equal to BAC
.08 or drivers with only THC were motorcyclists. However, motorcyclists made up the smallest
proportion of drivers that had combined alcohol greater than/equal to BAC .08 and THC.

- 37 -
Driver Contributing Circumstances8
Driving under the influence of any alcohol or drugs is high-risk behavior. This high risk behavior is often
also accompanied by other high risk behaviors, especially when the outcome is a fatal crash. This section
describes the frequency of crash contributing circumstances and other co-occurring high risk behaviors.
Table 27: Frequency of Driver Contributing Circumstances (CC)
No Other CC
Reported9 One CC Two CC Three or More
CC
No Drugs, No Alcohol 313 240 123 36
44.0% 33.7% 17.3% 5.1%
Alcohol Only >.08 55 166 72 21
17.5% 52.9% 22.9% 6.7%
THC Only 16 21 17 2
28.6% 37.5% 30.4% 3.6%
Carboxy-THC Only 16 12 5 4
43.2% 32.4% 13.5% 10.8%
THC + Alcohol >.08 13 44 20 6
15.7% 53.0% 24.1% 7.2%
THC + Drugs 8 22 6 3
20.5% 56.4% 15.4% 7.7%
THC + Drugs + Alcohol >.08 2 8 7 1
11.1% 44.4% 38.9% 5.6%
Drivers with no alcohol or drugs, followed closely by drivers with only carboxy-THC, were most
frequently reported by investigating officers as having no crash contributing circumstances. Drivers with
alcohol greater than/equal to BAC .08 and THC combined had the highest frequency of crash
contributing circumstances. Figure 11 on the following page displays these differences.
8 The Fatality Analysis Reporting System allows for coding of up to six driver related factors, with separate coding
for select contributing circumstances such as speeding and distraction. As such, each driver may have several contributing circumstances and may be represented in multiple categories. 9 Besides the noted alcohol or drug involvement, no other driver contributing circumstances were reported.

- 38 -
Figure 11: Driver Comparison Groups by Number of Other Contributing Circumstances
Drivers involved in fatal crashes with no drugs or alcohol and drivers with only carboxy-THC had the
highest proportion of no reported driver errors. Drivers with only THC and drivers with the combination
of THC, alcohol greater than/equal to BAC .08, and drugs had the highest proportion of having two or
more reported driver contributing circumstances.

- 39 -
Table 28: Driver Comparison Groups by Frequency of Driver Errors
Fail to Obey
Signs/Signals Fail to Yield
Over-correcting
Lane Deviation
Driving on Wrong Side of Road
Improper Passing
No Drugs, No Alcohol
27 67 18 58 16 11
3.8% 9.4% 2.5% 8.1% 2.2% 1.5%
Alcohol Only >.08 12 15 17 17 15 6
3.8% 4.8% 5.4% 5.4% 4.8% 1.9%
THC Only 2 4 5 7 3 2
3.6% 7.1% 8.9% 12.5% 5.4% 3.6%
Carboxy-THC Only 2 0 1 4 0 1
5.4% 0.0% 2.7% 10.8% 0.0% 2.7%
THC + Alcohol >.08 3 1 7 8 5 2
3.6% 1.2% 8.4% 9.6% 6.0% 2.4%
THC + Drugs 0 2 1 2 1 2
0.0% 5.1% 2.6% 5.1% 2.6% 5.1%
THC + Drugs + Alcohol >.08
1 0 2 0 1 0
5.6% 0.0% 11.1% 0.0% 5.6% 0.0%
The most frequently reported fatal crash error among drivers with only THC was lane deviation (12.5
percent), followed by overcorrecting (8.9 percent). Lane deviation and overcorrecting were also the
most frequently reported driver errors for drivers with alcohol greater than/equal to BAC .08 and drivers
with alcohol greater than/equal to BAC .08 and THC combined. However, the proportion of drivers that
committed these errors in the latter two groups was slightly lower than drivers with only THC.

- 40 -
Table 29: Driver Comparison Groups by Frequency of High Risk Driver Behavior
Distracted Unlicensed Speeding
No Drugs, No Alcohol 151 33 151
21.2% 4.6% 21.2%
Alcohol Only >.08 75 68 175
23.9% 21.7% 55.7%
THC Only 13 10 17
23.2% 17.9% 30.4%
Carboxy-THC Only 7 7 13
18.9% 18.9% 35.1%
THC + Alcohol >.08 12 33 52
14.5% 39.8% 62.7%
THC + Drugs 8 12 15
20.5% 30.8% 38.5%
THC + Drugs + Alcohol >.08 7 8 11
38.9% 44.4% 61.1%
The majority of drivers with alcohol greater than/equal to BAC .08, alone or in combination with THC or
other drugs, were speeding. All driver comparison groups with any alcohol or drugs had higher
frequencies of being unlicensed when compared to drivers with no alcohol or drugs. No clear patterns
emerged for distraction between driver comparisons groups. Drivers with alcohol greater than/equal to
BAC .08 and THC combined had the lowest frequency of reported distraction while drivers with THC,
alcohol, and other drugs had the highest frequency of distraction, but the numbers are small. Figure 12
on the following page displays these differences.

- 41 -
Figure 12: Other High Risk Behaviors by Driver Comparison Groups
More than half of drivers involved in fatal crashes with only alcohol greater than/equal to BAC .08 were
speeding. Over 60 percent of drivers with alcohol greater than/equal to BAC .08 and THC combined
were speeding. The proportions of speeding drivers are much greater in drivers with alcohol greater
than/equal to BAC .08, with or without other drug combinations, than the other driver comparison
groups. Drivers involved in fatal crashes with alcohol greater than/equal to .08 and THC combined, with
or without other drugs, had the highest proportion of being unlicensed. The proportion of drivers
involved in fatal crashes who were distracted was similar for drivers with only alcohol greater
than/equal to BAC .08 and drivers with only THC, approximately 23 percent, which is also similar to
drivers with no alcohol or drugs at 21.2 percent.

- 42 -
Table 30: Driver Comparison Groups by Restraint Use
Seat Belt
Used
Seat Belt Not Used/Improper
Use Unknown Seat
Belt Use Not Applicable10
No Drugs, No Alcohol 468 71 41 132
80.7% 12.2% 7.1%
Alcohol Only >.08 120 98 30 66
48.4% 39.5% 12.1%
THC Only 33 5 7 11
73.3% 11.1% 15.6%
Carboxy-THC Only 24 5 1 7
80.0% 16.7% 3.3%
THC + Alcohol >.08 30 33 10 10
41.1% 45.2% 13.7%
THC + Drugs 17 10 6 6
51.5% 30.3% 18.2%
THC + Drugs + Alcohol >.08 8 3 4 3
53.3% 20.0% 26.7%
Drivers with alcohol greater than/equal to BAC .08 and THC combined involved in fatal crashes had the
lowest level of restraint use; 45.2 percent of these drivers were unrestrained at the time of the crash.
Drivers with only THC involved in fatal crashes had the highest frequency of restraint use, even higher
than drivers with no alcohol or drugs. Figure 13 on the following page displays these differences.
10
Belt Use is not applicable to vehicles not equipped with restraint systems, such as motorcycles.
- 43 -
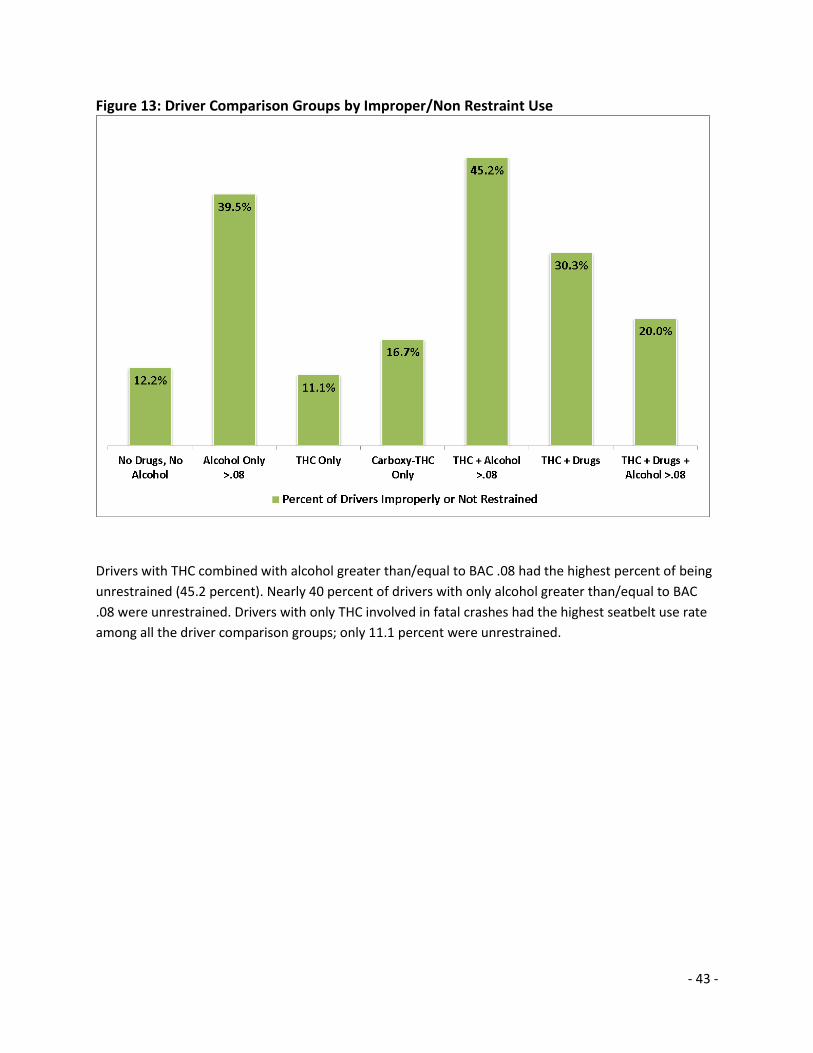
Figure 13: Driver Comparison Groups by Improper/Non Restraint Use
Drivers with THC combined with alcohol greater than/equal to BAC .08 had the highest percent of being
unrestrained (45.2 percent). Nearly 40 percent of drivers with only alcohol greater than/equal to BAC
.08 were unrestrained. Drivers with only THC involved in fatal crashes had the highest seatbelt use rate
among all the driver comparison groups; only 11.1 percent were unrestrained.

- 44 -
Blood Levels: Alcohol Concentration and Cannabinoids
Table 31: Drivers Positive for Any Cannabinoids Marijuana Result 2010 2011 2012 2013 2014 Total
Any Cannabinoids 81 56 63 59 89 348
Carboxy-THC 45 24 27 21 14 131
55.6% 42.9% 42.9% 35.6% 15.7% 37.6%
Any THC 36 32 36 38 75 217
44.4% 57.1% 57.1% 64.4% 84.3% 62.4%
THC >5 ng/ml 24 19 23 19 38 123
66.7% 59.4% 63.9% 50.0% 50.7% 56.7%
THC <5 ng/ml 12 13 12 18 37 92
33.3% 40.6% 33.3% 47.4% 49.3% 42.4%
THC Result Unk 0 0 1 1 0 2
The number of drivers testing positive for any cannabinoids (THC or carboxy-THC) increased to 89 in
2014, a 37 percent increase over the previous four-year (2010-2013) average. The percentage of these
drivers who tested positive for any level of THC, alone or in combination with alcohol or other drugs,
also increased from 44.4 percent in 2010 to 84.3 percent in 2014. The following tables describe the
blood levels of THC and alcohol within the driver comparison groups.

- 45 -
Table 32: Blood Alcohol Concentration and Cannabinoid Blood Level Ranges
Total
Drivers Variable Total
Results11 Mean Median Min Max
ALC<.079 ONLY 46 Alcohol BAC 46 0.04 0.05 0.01 0.07
ALC>.080 ONLY 314 Alcohol BAC 314 0.19 0.18 0.08 0.42
C-THC+ALC ONLY 41 Alcohol BAC 41 0.17 0.18 0.02 0.29
C-THC+DRUGS+ALC 19 Alcohol BAC 19 0.18 0.2 0.03 0.26
OTH DRUGS+ALCOHOL 101 Alcohol BAC 101 0.16 0.16 0.02 0.37
THC+ALC<.079 13 Alcohol BAC 13 0.06 0.07 0.01 0.07
THC+ALC>.080 83 Alcohol BAC 83 0.18 0.19 0.08 0.39
THC+DRUGS+ALC<.079 6 Alcohol BAC 6 0.04 0.04 0.03 0.06
THC+DRUGS+ALC>.080 18 Alcohol BAC 18 0.15 0.15 0.08 0.23
THC ONLY 56 THC ng/ml 56 8.96 6.85 1.1 27
THC+ALC<.079 13 THC ng/ml 13 5.55 4.1 1.2 14
THC+ALC>.080 83 THC ng/ml 82 9.72 5.95 1.2 65
THC+DRUGS ONLY 39 THC ng/ml 39 14 5.7 1 70
THC+DRUGS+ALC<.079 6 THC ng/ml 6 3.83 2.25 1 11
THC+DRUGS+ALC>.080 18 THC ng/ml 18 7.49 7.25 1.4 23
C-THC ONLY 37 Carboxy-THC 31 14.15 11 5 57
C-THC+ALC ONLY 41 Carboxy-THC 32 22.01 17.55 5.5 86
C-THC+DRUGS ONLY 30 Carboxy-THC 25 44 19 5.5 475
C-THC+DRUGS+ALC 19 Carboxy-THC 16 22.37 17.5 5 91
THC ONLY 56 Carboxy-THC 54 66.28 52.5 9.2 220
THC+ALC<.079 13 Carboxy-THC 12 36.73 29.6 5.8 100
THC+ALC>.080 83 Carboxy-THC 74 64.54 36.55 5 234
THC+DRUGS ONLY 39 Carboxy-THC 39 88.52 70.7 5.3 400
THC+DRUGS+ALC<.079 6 Carboxy-THC 6 51.18 26.5 8.1 200
THC+DRUGS+ALC>.080 18 Carboxy-THC 18 63.44 39.5 10 169.8
Drivers with alcohol greater than/equal to BAC .08 had the highest average level of THC. However,
drivers with only THC had a median level (the point at which half of drivers are above and below) of 6.85
ng/ml, second only to drivers with a combination of THC, alcohol greater than/equal to BAC .08, and
other drugs. The high mean and median THC levels for drivers with the combination of THC, alcohol
greater than/equal to BAC .08, and other drugs may be indicative of excessive or binge drug use.

- 46 -
Table 33: THC >5ng/ml Blood Level Ranges
Total Drivers Variable
Total Results11 Mean Median Min Max
THC ONLY 33 THC ng/ml 33 13.2 11 5.1 27
THC+ALC<.079 5 THC ng/ml 5 10.12 8.7 6.7 14
THC+ALC>.080 48 THC ng/ml 48 14.54 9.55 5.2 65
THC+DRUGS ONLY 23 THC ng/ml 23 22.13 11 5.1 70
THC+DRUGS+ALC<.079 2 THC ng/ml 2 8.15 8.15 5.3 11
THC+DRUGS+ALC>.080 12 THC ng/ml 12 10.07 8.4 5.1 23
THC ONLY 33 Carboxy-THC 31 73.58 70 9.2 220
THC+ALC<.079 5 Carboxy-THC 4 38.25 35 18 65
THC+ALC>.080 48 Carboxy-THC 43 80.8 65.3 5 234
THC+DRUGS ONLY 23 Carboxy-THC 23 127.47 110 8.3 400
THC+DRUGS+ALC<.079 2 Carboxy-THC 2 116 116 32 200
THC+DRUGS+ALC>.080 12 Carboxy-THC 12 83.82 64 18.6 169.8
Among drivers exceeding the THC per se limit of 5 ng/ml, the mean and median values for THC alone or
in combination with other drugs were more than double the per se limit. The highest THC level was 70
ng/ml for a driver who also tested positive for other drugs, followed by a level of 65 ng/ml for a driver
who also had alcohol greater than/equal to BAC .08. The maximum THC level among drivers with THC
only was 27 ng/ml.
Table 34: THC <5ng/ml Blood Level Ranges
Total Drivers Variable
Total Results11 Mean Median Min Max
THC ONLY 23 THC ng/ml 23 2.87 2.9 1.1 4.7
THC+ALC<.079 8 THC ng/ml 8 2.69 2.4 1.2 4.7
THC+ALC>.080 34 THC ng/ml 34 2.91 2.9 1.2 4.7
THC+DRUGS ONLY 16 THC ng/ml 16 2.3 2.45 1 4.3
THC+DRUGS+ALC<.079 4 THC ng/ml 4 1.68 1.5 1 2.7
THC+DRUGS+ALC>.080 6 THC ng/ml 6 2.35 2.05 1.4 4
THC ONLY 23 Carboxy-THC 23 56.44 27.1 12 200
THC+ALC<.079 8 Carboxy-THC 8 35.96 29.6 5.8 100
THC+ALC>.080 34 Carboxy-THC 30 42.33 26.55 5.8 200
THC+DRUGS ONLY 16 Carboxy-THC 16 32.53 17.95 5.3 110
THC+DRUGS+ALC<.079 4 Carboxy-THC 4 18.78 19.5 8.1 28
THC+DRUGS+ALC>.080 6 Carboxy-THC 6 22.68 16.45 10 49

- 47 -
Due to the high rate of metabolism of THC in the blood and the amount of time lapse between crash
incident and blood draw, drivers not dead at the scene confirmed to be under the THC 5 ng/ml per se
limit may have been over the limit at the time of the crash.
Fatalities Involving THC-Positive Drivers
Table 35: Total Fatalities Involving Any Alcohol or Any THC
Year Total
Fatalities
Fatalities Involving a Driver with Any Alcohol
Proportion of All
Fatalities
Fatalities Involving a Driver
with Any THC
Proportion of All
Fatalities
2010 460 189 41.1% 38 8.3% 2011 454 180 39.6% 33 7.3% 2012 438 158 36.1% 38 8.7% 2013 436 161 36.9% 33 7.6% 2014 462 159 34.4% 76 16.5%
TOTAL 2,250 847 37.6% 218 9.7%
Figure 14: Total Fatalities Involving Any Alcohol, Any Drugs, and Any THC

- 48 -
The proportion of fatalities that involved a driver positive for any THC, alone or in combination with
alcohol or other drugs, more than doubled in 2014, from 7.6 percent of fatalities in 2013 to 16.5 percent
of fatalities in 2014. Fatalities involving a driver with any alcohol remained stable from 2012 through
2014. However, fatalities involving a driver with any drugs have been steadily rising since 2011. Fatalities
increased 6 percent in 2014 from the previous year.
Table 36: Total Fatalities by Involved Driver Comparison Groups
2010 2011 2012 2013 2014
Other Fatalities 337 335 330 325 328
Alcohol Only >.08 71 76 62 75 52
THC Only 9 7 12 6 25
Carboxy-THC Only 11 10 8 3 5
THC + Alcohol >.08 19 17 13 16 25
THC + Drugs 6 3 10 6 18
THC + Drugs + Alcohol >.08 4 6 2 3 8
Alcohol >.08 Driver AND Carboxy-THC Driver
3 0 0 0 1
Alcohol >.08 Driver AND
THC Driver 0 0 1 2 0
Fatalities that involved a driver with only alcohol greater than/equal to BAC .08 dropped 36.5 percent in
2014 compared to the previous four-year average. In 2014 there were notable increases in fatalities
involving a driver positive for THC, alone or in combination with alcohol or other drugs. The highest
increase was among fatalities involving a driver positive for only THC (an increase of 194 percent over
the previous four-year average); followed by fatalities involving a driver positive for THC and other drugs
(an increase of 188 percent).

- 49 -
Table 37: Fatal Person Type by Involved Driver Comparison Groups
This
Driver Other Driver
Occupants with This
Driver
Occupants with Other
Driver Pedestrians Bicyclists
Unk/Oth Person Type
Alcohol Only >.08 257 13 5 1 13 1 0
THC Only 33 9 5 2 9 1 0
Carboxy-THC Only 19 5 11 5 2 2 0
THC + Alcohol >.08 64 7 8 1 1 1 1
THC + Drugs 31 4 5 2 2 0 0
THC + Drugs + Alcohol >.08
14 1 45 7 1 0 0
Alcohol >.08 Driver AND Carboxy-THC
Driver11 2 2 0 0 0
Alcohol >.08 Driver AND THC Driver12
2 1 0 0 0
Across all driver comparison groups, the person who died was most commonly the driver positive for
alcohol or drugs and/or occupants in the vehicle with that driver. Although the number of fatalities that
involved a driver with only alcohol greater than/equal to BAC .08 was much higher than the number of
fatalities that involved a driver positive for only THC, the number of pedestrian deaths are comparatively
high in the only THC driver comparison group. From 2010-2014, nine pedestrians deaths involved a
driver positive for only THC, compared to 13 pedestrian deaths involving a driver with only alcohol
greater than/equal to BAC .08. Drivers positive for the combination of THC, alcohol greater than/equal
to BAC .08, and other drugs had a much higher proportion of same vehicle occupant deaths (persons in
the same vehicle as the impaired driver) than any other driver comparison group.
11
Two crashes involved both a driver with alcohol>.08 and a driver with carboxy-THC. In one crash the alcohol driver died, in the other crash the carboxy-THC driver died. 12
Two crashes involved both a driver with alcohol>.08 and a driver with THC. In both crashes the THC drivers died.
- 50 -
Summary and Conclusions
The information compiled in this report is a necessary first step toward gaining a better understanding
of the role marijuana plays in fatal crash events occurring in Washington State. Second to alcohol,
marijuana has persisted as the dominant drug involved in fatal crashes for over a decade. In 2014, the
proportion of drivers involved in fatal crashes testing positive for THC increased, and therefore the
number of fatalities involving THC also increased. While this report explains that trend and the
characteristics of these drivers, this information is not sufficient to determine if marijuana directly
contributed to the cause of these crashes.
The existing literature on crash risk associated with marijuana use is mixed. However, two recent and
robust metastudies both independently concluded that marijuana influence doubles an individual
driver’s crash risk. All factors or behaviors that result in an increased crash risk must be addressed if
Washington is to realize its vision of zero traffic fatalities and serious injuries by 2030.
The information in this report does lend itself to some significant observations. In terms of fatal crash
factors and outcomes, the impairing influence of THC is very different than the impairing influence of
alcohol. While users of alcohol and THC who drive and are involved in fatal crashes have some
demographic similarities, the co-occurrence of other high risk behaviors, such as speeding and not using
a seatbelt, are very different. Of specific concern is the combination of alcohol and THC as these drivers
emerged as the most high risk group of drivers involved in fatal crashes.
The Washington Traffic Safety Commission continues to compile this information. While data available
now is insufficient for performing robust inference analysis, we continue to explore methods and
approaches for future reports. This report is merely a beginning to establishing a better understanding
of the impact of legalized recreational marijuana on traffic safety.
One of the biggest challenges we face in addressing the issue of drugged driving, not only in our state
but nationally, is the lack of good, complete data. Fatal crash data is a limiting source of information for
describing the population as a whole, but having ongoing linked toxicology outcomes to drivers involved
in fatal crashes is a significant step forward. In the absence of databases, such as FARS, that record true
toxicology outcomes, states must find creative and innovative ways to repurpose and link existing data.
Washington continues to explore these options in all facets of traffic safety to better support data-
driven decision making.
For Washington State, an important step forward in acquiring better data would be the development of
an electronic system for creating, filing, and adjudicating driving under the influence (DUI) charges.
Electronic data is critical for efficient and accurate criminal and administrative processing of these
offenses. The Statewide Electronic Collision and Ticket Online Records (SECTOR) application already
provides the infrastructure and law enforcement user-base to make this functionality possible. Adding
the DUI arrest forms and supporting processes to SECTOR would not only create efficiencies in the arrest
and adjudication process, but also enhance data quality and timeliness for future analysis.

- 51 -
Appendix A: References
1. Anderson, D. M., Hansen, B., and Rees, D.I. (2013). Medical marijuana laws, traffic fatalities, and
alcohol consumption. Journal of Law and Economics, 56: 333-369. Abstract available at
http://www.econstor.eu/bitstream/10419/58536/1/690072864.pdf
2. Asbridge, M., Hayden, J.A., and Cartwright, J.L. (2012). Acute cannabis consumption and motor
vehicle collision risk: systematic review of observational studies and meta-analysis. British Medical
Journal, 344: e536. http://www.bmj.com/content/344/bmj.e536.full.pdf+html
3. Brady, J.E. and Li, G. (2014). Trends in alcohol and other drugs detected in fatally injured drivers in
the United States, 1999-2010. American Journal of Epidemiology. 179: 692-699.
http://aje.oxfordjournals.org/content/179/6/692.full
4. Center for the Study of Health and Risk Behaviors, University of Washington (2015). Young Adult
Health Survey/Marijuana. Seattle, WA.
http://learnaboutmarijuanawa.org/factsheets/YAHS%20Marijuana.pdf
5. Hartman, R.L. and Huestis, M.A. (2013). Cannabis effects on driving skills. Clinical Chemistry, 59: 478-
492. http://www.clinchem.org/content/59/3/478.full.pdf+html
6. Higgins J.P.T. and Green S. (editors). Cochrane Handbook for Systematic Reviews of
Interventions Version 5.1.0 [updated March 2011]. The Cochrane Collaboration, 2011
http://community.cochrane.org/handbook
7. Huestis, M.A. (2002). Cannabis (Marijuana) – effects on human behavior and performance. Forensic
Science Review, 14: 15-60.
http://www.flugmedizin.at/Infos/Cannabis_Effects_on_behavior_and_performance.pdf
8. Li, M., Brady, J.E., DiMaggio, C.J., Lusardi, A.R., Tzong, K.Y., Li, G. (2012). Marijuana use and motor
vehicle crashes. Epidemiologic Reviews, 34:65-72.
http://epirev.oxfordjournals.org/content/34/1/65.full.pdf+html
9. Linden, D.J. (2012). The compass of pleasure: how our brains make fatty foods, orgasm, exercise,
marijuana, generosity, vodka, learning and gambling feel so good. London: Penguin Books.
10. Lowenstein, S.R. and Koziol-McLain, J. (2001). Drugs and traffic crash responsibility: a study of
injured motorists in Colorado. Journal of Trauma – Injury, Infection, and Critical Care, 50: 313-320.
http://www.cannabistherapyinstitute.com/bills/dui/colorado.drug.traffic.sturdy.pdf
11. Lowenstein, S.R. (1998). Personal communication. 1998 Traffic Records Forum, July 1998.
12. Sewell, R.A., Poling, P., and Sofuoglu, M. (2009). The effect of cannabis compared with alcohol on
driving. American Journal on Addictions, 18: 185-193.
http://www.ncbi.nlm.nih.gov/pmc/articles/PMC2722956/

- 52 -
13. Substance Abuse and Mental health Services Administration (2014). Results from the 2013 National
Survey on Drug Use and Health: Summary of National Findings, NSDUH Series H-48, HHS Publication
No. (SMA) 14-4863. Rockville, MD: Substance Abuse and Mental Health Services Administration.
file:///T:/Research%20Issues%20&%20Reports/Alcohol%20&%20Drugs/Drugs/NSDUHresults2013.p
df
14. Washington State Patrol (2008). Impaired Driving Section – Overview. Accessed October 2, 2015 at
http://www.wsp.wa.gov/forensics/impdriving.htm
15. Beirness, D., LeCavalier, J. and Singhal, D. (2007). Evaluation of the Drug Evaluation and
Classification Program: A Critical Review of the Evidence. Traffic Injury Prevention, 8 (4): 368-376.
Abstract available at http://www.ncbi.nlm.nih.gov/pubmed/17994490
16. Washington State Department of Health, Center for Health Statistics, 2014 Behavioral Risk Factor
Surveillance System, supported in part by Centers for Disease Control and Prevention, Cooperative
Agreement U58/SO000047-4 and SO14-1401.

- 53 -
Appendix B: Methodology
The Washington State Fatality Analysis Reporting System (FARS) unit maintains paper fatal crash case
files, including copies of toxicology reports, according to federal and state retention requirements.
Before and after the passage of Initiative 502 (marijuana reform), the FARS unit received several data
requests for marijuana involvement in fatal crashes that could not be fulfilled due to the limitations of
how drug information is recorded in the FARS database. In response to the increase in data requests, a
project was formed to manually abstract the complete toxicology information into an electronic format
that could be later merged with the original FARS record for meaningful analysis.
The retained FARS case files have a copy of the original toxicology report for deceased persons. The
FARS Analysts reviewed every toxicology report from these case files and manually abstracted the
complete toxicology information to an excel spreadsheet. The following guidelines were provided to the
FARS analysts for the abstraction process:
Always verify and record the case number, vehicle number, and person number (as assigned by FARS). The accuracy of these fields is vital to successful linkage of the files for analysis.
Use CAPS or lower-case consistently in data entry
Date fields are pre-formatted in the spreadsheet
List ALL drugs on the report – even if they were already entered in MDE.
For DRUG1, DRUG2, etc. – enter the entire drug name as reported on the toxicology report, consistently use either CAPS or lower-case
For RES1, RES2, etc. – enter the VALUE of the result (ex: <0.13, 2.5, 0.6) exactly as it appears on the toxicology report
For UNITS1, UNITS2, etc. – enter the measurement unit (ex: ng/ML, mg/L)
For duplicate results (verified by both blood/urine), record the more conclusive result (blood).
For results verified by urine only (no blood test), and there is no result (only POS), record the drug name in the DRUG field, put 888 in the RES field, and leave the UNITS field blank.
For results that were verified by urine, but not blood and both tests were performed, record the urine results in addition to the blood results (but not duplicates) same as the above bullet. For example, Cannabinoids in urine (POS), diazepam in blood but no cannabinoids – record BOTH the cannabinoid (888, blank) AND the diazepam (0.01, mg/L).
For the original FARS case files, surviving driver toxicology information was provided by the WSP
Toxicology Lab in a minimal format as required to code the FARS case. In order to receive the detailed

- 54 -
toxicology outcomes, the surviving drivers had to be compiled for all years (2008-2014) and resent to
the WSP Toxicology Lab for abstraction. The team at the Lab manually abstracted the detailed toxicology
information in the same format and fashion as described above for the deceased driver file abstraction.
Once all information was abstracted, data validation was performed. Quality assurance checks and
verification using chart review were conducted to ensure the highest level of abstraction accuracy. The
toxicology information was merged back to the original FARS records for the detailed analysis contained
in this report. Washington State FARS Analysts now abstract complete toxicology information to a
spreadsheet as it is received. The Research and Data Division is currently exploring ways to automate
the linkage between toxicology and fatal crash records.
Manual data abstraction is a resource intensive effort and is subject to error at a much higher rate than
automated processes. In order to address the higher error rate, data validation approaches must be
thorough and well considered. While manual approaches to data abstraction are not ideal, the
Washington Traffic Safety Commission continues to support this effort in lieu of not having the right
data to accurately monitor the impact of legalized recreational marijuana on traffic safety. Other state
FARS units that have access to toxicology reports have a similar opportunity. The Washington Traffic
Safety Commission encourages states facing legalized recreational marijuana to consider limitations to
existing data and approaches to addresses those limitations.

- 55 -
Appendix C: Drug Lists
In accordance with the Fatality Analysis Reporting System (FARS) Coding Manual, drugs that have been
determined by a chemical test by the coroner, medical examiner or state toxicology lab will be coded
using the FARS translation table to assign the three-digit FARS code. If the drug is not on the list, FARS
analysts are directed to use 996 (Other Drug). This element excludes caffeine, nicotine, and
aspirin/acetaminophen. Further, guidance states the FARS Analyst will ‘exclude drugs explicitly
indicated to have been administered after the crash.’ If documentation is not provided confirming the
administration of drugs post-crash, then those drugs are coded according to the hierarchy described
below.
In Washington, the FARS unit receives official drugs results from the WSP Toxicology Lab. FARS Analysts
then record the results, up to three separate drug test results, and the test type (blood, urine, or both)
using the FARS guidance. If there are more than three drugs chemically determined in the toxicology
test, then we use the categories as a hierarchy (i.e. narcotics over depressants over stimulants, etc.) to
determine the three drugs for coding. Cannabinoids are fifth in the hierarchy of eight drug families. The
following tables describe the frequency of other drugs (excluding cannabinoids) as coded in the
Washington FARS data 2010-2014.
FARS Code Drug Family Drug Name
Number of Drivers
417 Stimulants Methamphetamine 108
401 Stimulants Amphetamine 97
395 Depressants Depressants type Unk 84
996 Other Other drug not listed 70
177 Narcotics Morphine 54
348 Depressants Midazolam 39
189 Narcotics Oxycodone 37
304 Depressants Benzodiazepines 35
321 Depressants Diazepam 34
407 Stimulants Cocaine 30
402 Stimulants Benzoylecgonine 28
155 Narcotics Hydrocodone 26
167 Narcotics Methadone 24
157 Narcotics Hydromorphone 15
351 Depressants Nordiazepam 14
300 Depressants Alprazolam 11

- 56 -
Drugs occurring in ten or fewer drivers:
FARS Code Drug Family Drug Name
Number of Drivers
295 Narcotics Narcotics type Unk 9
128 Narcotics Codeine 8
337 Depressants Lorazepam 7
316 Depressants Clonazepam 6
522 Hallucinogens Ketamine 6
151 Narcotics Fentanyl 3
187 Narcotics Opium 3
303 Depressants Barbiturates 3
367 Depressants Temazepam 3
387 Depressants Zolpidem 3
495 Stimulants Stimulants type Unk 3
513 Hallucinogens Methylenedioxymethamphetamine (MDMA) 3
995 Inhalants Inhalants type Unk 3
313 Depressants Chlordiazepoxide 2
343 Depressants Meprobamate 2
358 Depressants Phenobarbital 2
423 Stimulants Phentermine 2
702 PCP Phencyclidine 2
101 Narcotics Acetorphine 1
129 Narcotics Cyprenorphine 1
161 Narcotics Levomoramide 1
165 Narcotics Meperidine (Pethidine) 1
188 Narcotics Oxymorphone 1
208 Narcotics Propoxyphene 1
308 Depressants Butalbital 1
309 Depressants Camazepam 1
400 Stimulants Amphetamine Sulfate 1
418 Stimulants Methylphenidate 1
595 Hallucinogens Hallucinogens type Unk 1