Embed Size (px)
Citation preview

w a t e r r e s e a r c h 4 4 ( 2 0 1 0 ) 1 8 0 9 – 1 8 1 8
Avai lab le a t www.sc iencedi rec t .com
journa l homepage : www.e lsev ie r . com/ loca te /wat res
Drinking water treatment of priority pesticides using lowpressure UV photolysis and advanced oxidation processes
Sandra Sanches a, Maria T. Barreto Crespo a,b, Vanessa J. Pereira a,b,*a Instituto de Biologia Experimental e Tecnologica, Apartado 12, 2781-901 Oeiras, Portugalb Instituto de Tecnologia Quımica e Biologica, Universidade Nova de Lisboa, Av. da Republica, 2780-157 Oeiras, Portugal
a r t i c l e i n f o
Article history:
Received 14 August 2009
Received in revised form
29 October 2009
Accepted 2 December 2009
Available online 4 January 2010
Keywords:
LP/UV
Hydrogen peroxide
Titanium dioxide
Real water matrices
Pesticides
Mixtures
* Corresponding author at: Instituto de BioloTel.: þ351 21 4469568; fax: þ351 21 4421161.
E-mail address: [email protected] (V.0043-1354/$ – see front matter ª 2009 Elsevidoi:10.1016/j.watres.2009.12.001
a b s t r a c t
This study reports the efficiency of low pressure UV photolysis for the degradation of
pesticides identified as priority pollutants by the European Water Framework Directive
2000/60/EC. Direct low pressure UV photolysis and advanced oxidation processes (using
hydrogen peroxide and titanium dioxide) experiments were conducted in laboratory grade
water, surface water, and groundwater.
LP direct photolysis using a high UV fluence (1500 mJ/cm2) was found to be extremely
efficient to accomplish the degradation of all pesticides except isoproturon, whereas
photolysis using hydrogen peroxide and titanium dioxide did not significantly enhance
their removal. In all matrices tested the experimental photolysis of the pesticides followed
the same trend: isoproturon degradation was negligible, alachlor, pentachlorophenol, and
atrazine showed similar degradation rate constants, whereas diuron and chlorfenvinphos
were highly removed. The degradation trend observed for the selected compounds fol-
lowed the decadic molar absorption coefficients order with exception of isoproturon
probably due to its extremely low quantum yield.
Similar direct photolysis rate constants were obtained for each pesticide in the different
matrices tested, showing that the water components did not significantly impact degra-
dation. Extremely similar photolysis rate constants were also obtained in surface water for
individual compounds when compared to mixtures. The model fluence and time-based
rate constants reported were very similar to the direct photolysis experimental results
obtained, while overestimating the advanced oxidation results. This model was used to
predict how degradation of isoproturon, the most resilient compound, could be improved.
ª 2009 Elsevier Ltd. All rights reserved.
1. Introduction high environmental persistence, and bioaccumulation
In recent years, a large group of organic compounds have been
labelled as water emerging contaminants by the Environ-
mental Protection Agency (U.S.A.) and the European Union.
The European Water Framework Directive 2000/60/EC
identifies 33 priority substances that present high toxicity,
gia Experimental e Tecno
J. Pereira).er Ltd. All rights reserved
potential. This directive includes pesticides such as atrazine,
diuron, isoproturon, alachlor, pentachlorophenol, and chlor-
fenvinphos, which are of special interest due to their easy
transport in the environment as well as potential for seriously
threatening the aquatic environment and human health
(Hincapie et al., 2005). The adverse health effects of these
logica, Apartado 12, 2781-901 Oeiras, Portugal.
.

w a t e r r e s e a r c h 4 4 ( 2 0 1 0 ) 1 8 0 9 – 1 8 1 81810
compounds include increased cancer risk as well as anemia,
eye, liver, kidney, spleen cardiovascular system, and repro-
ductive problems (EPA, 2003). Among these pesticides,
alachlor, atrazine, and pentachlorophenol are also known to
have endocrine disrupting capabilities.
These xenobiotics have been detected in drinking water
sources such as surface water and groundwater at levels in
the range of 2–13 000 ng/L (Planas et al., 2006; Field et al., 2003).
Low pressure (LP) ultraviolet (UV) radiation, that emits
primarily monochromatic light at 254 nm, is widely used for
drinking water disinfection due to its effectiveness against
a wide range of waterborne pathogens (Linden et al., 2002).
The use of high UV fluences (1000–2000 mJ/cm2) can also
promote the degradation of photolabile organic compounds
by direct photolysis due to their potential to absorb light
(Sharpless and Linden, 2003; Pereira et al., 2007a,b). However,
some molecules do not strongly absorb the LP/UV radiation.
For these stable micropollutants, advanced oxidation
processes (AOPs), using hydrogen peroxide (H2O2) and tita-
nium dioxide (TiO2), may be used to remove them from
drinking water, due to the production of highly reactive,
unselective, and short-lived hydroxyl (OH) radicals (Pereira
et al., 2007b). H2O2 has been widely described for water
disinfection and degradation of pollutants (Sharpless and
Linden, 2003; Schwarzenbach et al., 1993; von Gunten, 2003).
TiO2 recently emerged as a promising material to efficiently
degrade pesticides in water. It presents several advantages
related to its chemical and biological inertness, photostability,
absence of toxicity, and low cost. To be catalytically active,
TiO2 requires irradiation with a wavelength lower than
380 nm, which induces the photoexcitation of an electron
since it has an energy band gap of about 3.2 eV. Therefore,
light sources such as low and medium pressure ultraviolet
lamps as well as solar radiation are suitable to induce TiO2
activity (Balasubramanian et al., 2004).
Several authors reported the degradation of the selected
pesticides (atrazine, diuron, isoproturon, alachlor, penta-
chlorophenol, and chlorfenvinphos) by UV photolysis and
AOPs (such as UV/H2O2 and UV/TiO2), using solar (Hincapie
et al., 2005; Malato et al., 2003; Haque and Muneer, 2003) and
UV–Vis radiation (Haque and Muneer, 2003; Wong and Chu,
2003a). Both direct photolysis and AOPs photolysis have
proven to be very efficient although AOPs were usually more
efficient (Haque and Muneer, 2003; Wong and Chu, 2003a).
LP lamps are the most commonly used lamps in drinking
water facilities due to their extremely effective disinfection
potential. To date, few studies have been conducted
addressing the efficiency of LP lamps for the removal of the
priority pesticides mentioned above and therefore further
research is needed to address their degradation potential. LP/
UV lamps have been reported to promote high degradation
levels of some of the selected pesticides: atrazine by direct
photolysis, UV/TiO2, and UV/H2O2 (e.g. Bianchi et al., 2006);
pentachlorophenol by direct photolysis (Vollmuth et al., 1994);
diuron by direct and Photo-Fenton photolysis (Djebbar et al.,
2008); and chlorfenvinphos by direct and UV/H2O2 (Acero
et al., 2008).
Authors often describe the degradation of xenobiotics only
as a function of time. These results provide insight on the
efficiency of different systems to degrade the compounds, but
cannot be compared directly with results obtained under
different experimental setups. Reporting degradation in terms
of UV fluence permits a standardization of bench-scale UV
testing providing increased confidence in the data generated
and the ability to compare results with other authors that
report their results using the same method (Bolton and
Linden, 2003). The photolysis of xenobiotics is often studied
for individual compounds and few studies compared these
results to those obtained with mixtures where a competition
effect could probably decrease the rate of degradation. In
addition, studies addressing AOPs potential for the removal of
the selected pesticides from water have been conducted
mainly in laboratory grade water and synthetic water
matrices spiked with natural organic matter (NOM). Few
studies concerning the removal of the selected micro-
pollutants using real water matrices such as surface water
and groundwater have been conducted to date (e.g. Acero
et al., 2008; Rosenfeldt et al., 2006; Song et al., 2008). More
studies using real source waters with different characteristics
should therefore be conducted to address the potential of
direct photolysis and AOPs to degrade organic compounds
that may be present in those waters.
This study reports the effectiveness of LP/UV direct
photolysis and AOPs (using H2O2 and TiO2) for the degradation
of the selected pesticides (isoproturon, alachlor, atrazine,
pentachlorophenol, diuron, and chlorfenvinphos) identified as
priority pollutants by the European Water Framework Direc-
tive 2000/60/EC. The degradation of these compounds was
studied in laboratory grade water, surface water, and
groundwater. The pesticides were spiked individually in the
different matrices and as mixtures in surface water to address
if in real water systems, where a wide combination of
compounds is expected to be present, different degradation
trends could be expected. Several kinetic photolysis parame-
ters were determined and used to model the photolysis results.
2. Materials and methods
2.1. Reagents
All pesticides and para-chlorobenzoic acid (pCBA) were
purchased as solutions or solids of the highest grade
commercially available (Sigma Aldrich, Germany). Aqueous
suspension of bovine liver catalase with 40 000–60 000 units/
mg protein was also obtained from Sigma Aldrich (1 unit
decomposed 1 mmol of H2O2). Hydrogen peroxide (30% w/w)
was obtained from Panreac (Spain). Titanium dioxide
Degussa P25, a mixture of 70% anatase and 30% rutile, with
an average particle size of 20 nm and a reactive surface area
of 35–65 m2 g�1 from Evonik Degussa, Germany, was kindly
supplied by Dr. Paula Passarinho (LNEG, Portugal). HPLC
grade acetonitrile and methanol from Lab Scan Analytical
Sciences (Poland) were used for the chromatographic anal-
ysis and preparation of stock solutions. Laboratory grade
water was produced by a Milli-Q water system (Millipore,
CA, USA) and the real water samples were collected in
brown glass bottles, filtered through 0.45 mm mixed esters
of cellulose filters (Millipore, CA, USA) and stored at 4 �C
until used.

w a t e r r e s e a r c h 4 4 ( 2 0 1 0 ) 1 8 0 9 – 1 8 1 8 1811
2.2. Experimental setup
2.2.1. UV photolysis experimentsUV photolysis experiments were conducted in a collimated
beam bench-scale reactor (Trojan Technologies Inc., Canada)
using a low pressure Hg lamp that emits mainly mono-
chromatic light at 254 nm.
100 mL of laboratory grade water and two natural water
matrices – surface water and groundwater – were spiked with
the appropriate volume of the pesticides stock solutions to
achieve concentrations of 1 mg/L. This concentration was set
in order to follow the degradation of the compounds, spiked
individually (in laboratory grade water, surface water, and
groundwater) and as mixtures (in surface water), by direct
injection using high pressure liquid chromatography (HPLC).
50 mL of sample were placed in a Petri dish and continuously
stirred beneath the LP/UV source. The remaining 50 mL were
used as control and kept in the dark under identical experi-
mental conditions in order to determine possible pesticide
losses due to evaporation or adsorption to the Petri dish walls.
All experiments were conducted at room temperature
(21 � 2 �C).
The lamp irradiance was measured using a calibrated
radiometer (IL1700, International Light, Newburyport, MA)
which was placed at the same height of the water level in the
Petri dish and the solution transmittance was measured by
a UV photometer (P254C, Trojan Technologies Inc.). UV
fluences of approximately 0, 40, 100, 500, 750, 1000, and
1500 mJ/cm2 were selected, taking into account the radiom-
eter meter reading as well as Petri, reflection, water, and
divergence factors (Bolton and Linden, 2003), to establish the
corresponding exposure times at which 200 mL of sample were
taken to quantify the concentration of the compounds by
HPLC analysis.
2.2.2. UV/H2O2 photolysis experimentsUV/H2O2 photolysis experiments were conducted similarly to
direct photolysis experiments with the addition of 40 mg/L
H2O2 and 500 mg/L pCBA to laboratory grade water and surface
water spiked with the individual pesticides and mixtures.
pCBA was added to the solution in order to determine
indirectly, by competition kinetics, the second-order rate
constants between the selected pesticides and the hydroxyl
radicals (Elovitz and von Gunten, 1999). At determined expo-
sure times, 200 mL of sample were taken to vials containing
catalase to quench the residual hydrogen peroxide. The
residual H2O2 was determined at the beginning and end of
each experiment using the I3� method described by Klassen
et al. (1994).
2.2.3. UV/TiO2 photolysis experimentsUV/TiO2 photolysis experiments were conducted similarly to
direct photolysis experiments with the addition of 2.5 mg/L
TiO2 and 500 mg/L pCBA to laboratory grade water spiked with
the individual pesticides and surface water spiked with
a mixture of the pesticides. During the degradation, samples
(200 mL) were taken at each defined exposure time and filtered
using 0.2 mm filters made of regenerated cellulose (Whatman,
USA) to remove TiO2 particles.
Even though different types of TiO2 particles are available,
Degussa P25 TiO2 (Evonik Degussa, Germany) was selected
because it has been referred by many authors as being the
most efficient type of TiO2 due to the presence of the more
reactive anatase form (70%), surface area, and average particle
size (Haque and Muneer, 2003; Wong and Chu, 2003b).
The UV/TiO2 photocatalysis experiments in surface water
were only conducted using a mixture of the pesticides
isoproturon, alachlor, atrazine, diuron, and chlorfenvinphos.
Pentachlorophenol was not added to the samples containing
the mixture of pesticides due to analytical constrains and was
not analyzed individually because it was found to be signifi-
cantly retained in the filters used to remove the TiO2 particles
from the solutions.
2.2.4. Analytical methodsThe selected pesticides and pCBA were analyzed by reverse-
phase high performance liquid chromatography (HPLC) using
a Waters system equipped with an ultraviolet absorbance
detector (Waters Chromatography, Milford, MA, USA).
The individual compounds, mixtures of each pesticide
with pCBA, as well as mixtures containing all the selected
pesticides were analyzed using a Luna 5m C18(2) 100A
(150� 3.0 mm) column (Phenomenex Inc., Torrance, CA, USA),
different mobile phase compositions, and monitored at
compromise maximum absorbance wavelengths (detailed in
the Supplementary Material Section SM Table 2). Pentachlo-
rophenol was not added to the mixture samples because it
could not be detected using the chromatography conditions
used for the detection of the other pesticides. The Tempera-
ture Control Module was set at 34 �C for all analysis except the
pesticide mixture samples that need to be analyzed at room
temperature to ensure appropriate separation of atrazine,
diuron, and isoproturon.
3. Results and discussion
3.1. Direct photolysis
LP direct photolysis experiments were conducted to evaluate
the degradation potential of pesticides with very different
structures (described in the Supplementary Material Section
SM Table 1), considered as priority pollutants.
Fig. 1 and Table 1 present the experimental and model
direct photolysis results obtained using two real water
matrices with very different compositions: surface water
(Fig. 1a) and groundwater (Fig. 1b). The characterization of the
water matrices used was described elsewhere (Pereira et al.,
2009). In summary, the surface water matrix showed higher
levels of total organic carbon and turbidity, whereas the
groundwater samples presented higher alkalinity and total
hardness.
Different matrix compositions were taken into account in
the fluence calculations. For the same UV fluence, different
matrices were therefore subjected to different exposure times
calculated taking into account the absorbance of each matrix
used. The direct photolysis fluence and time-based rate
constants obtained in LGW, surface water, and groundwater
LP/UV Direct Photolysis - Surface Water
-3
-2
-1
00 200 400 600 800 1000 1200 1400 1600
UV Fluence (mJ/cm2
)
C/
C(
nL
0)
DIU_exp DIU_modelISO_exp ISO_modelALA_exp ALA_modelATR_exp ATR_modelPCP_exp PCP_modelCFVP_exp CFVP_model
LP/UV Direct Photolysis - Groundwater
-4
-3
-2
-1
00 200 400 600 800 1000 1200 1400 1600
UV Fluence (mJ/cm2
)
C/
C(
nL
0)
DIU_exp DIU_modelISO_exp ISO_modelALA_exp ALA_modelATR_exp ATR_modelPCP_exp PCP_modelCFVP_exp CFVP_model
a
b
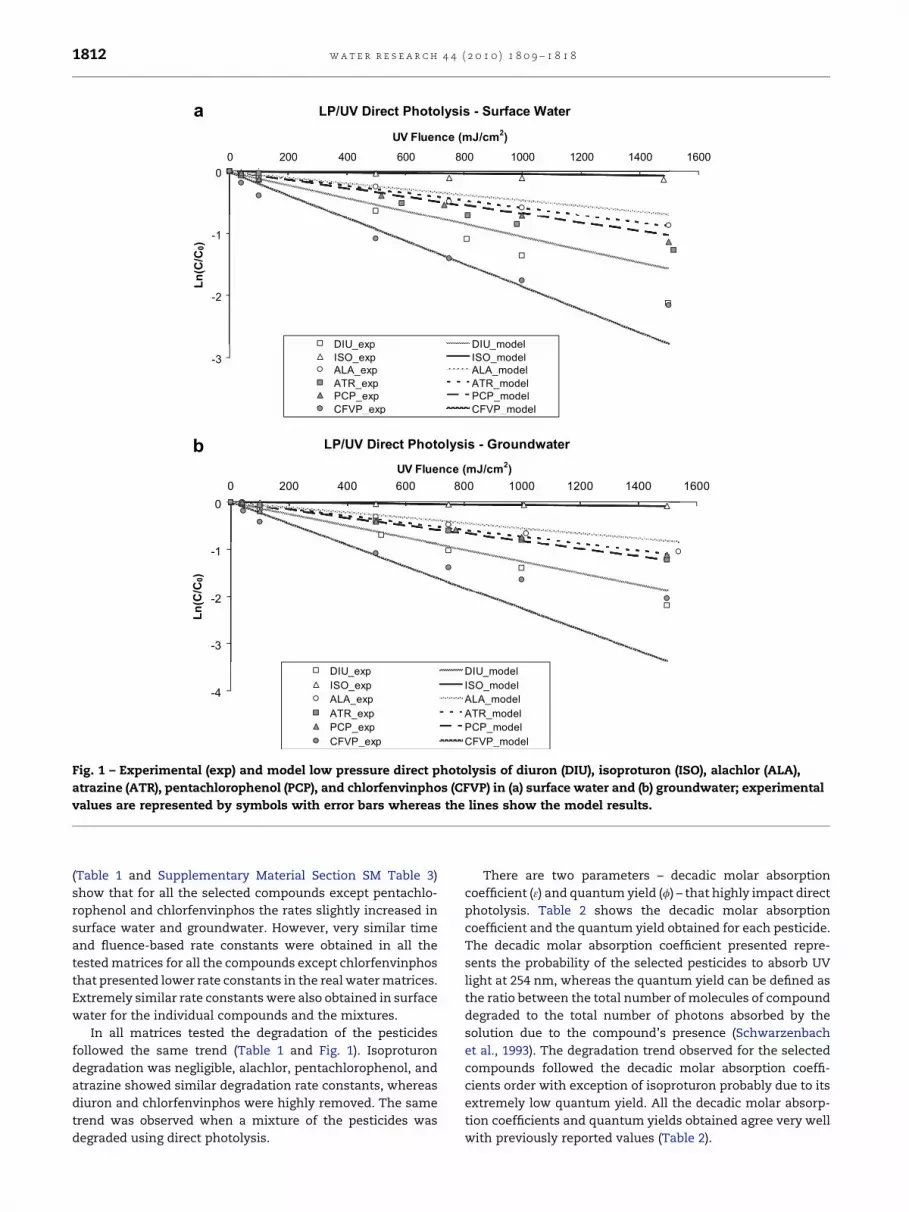
Fig. 1 – Experimental (exp) and model low pressure direct photolysis of diuron (DIU), isoproturon (ISO), alachlor (ALA),
atrazine (ATR), pentachlorophenol (PCP), and chlorfenvinphos (CFVP) in (a) surface water and (b) groundwater; experimental
values are represented by symbols with error bars whereas the lines show the model results.
w a t e r r e s e a r c h 4 4 ( 2 0 1 0 ) 1 8 0 9 – 1 8 1 81812
(Table 1 and Supplementary Material Section SM Table 3)
show that for all the selected compounds except pentachlo-
rophenol and chlorfenvinphos the rates slightly increased in
surface water and groundwater. However, very similar time
and fluence-based rate constants were obtained in all the
tested matrices for all the compounds except chlorfenvinphos
that presented lower rate constants in the real water matrices.
Extremely similar rate constants were also obtained in surface
water for the individual compounds and the mixtures.
In all matrices tested the degradation of the pesticides
followed the same trend (Table 1 and Fig. 1). Isoproturon
degradation was negligible, alachlor, pentachlorophenol, and
atrazine showed similar degradation rate constants, whereas
diuron and chlorfenvinphos were highly removed. The same
trend was observed when a mixture of the pesticides was
degraded using direct photolysis.
There are two parameters – decadic molar absorption
coefficient (3) and quantum yield (f) – that highly impact direct
photolysis. Table 2 shows the decadic molar absorption
coefficient and the quantum yield obtained for each pesticide.
The decadic molar absorption coefficient presented repre-
sents the probability of the selected pesticides to absorb UV
light at 254 nm, whereas the quantum yield can be defined as
the ratio between the total number of molecules of compound
degraded to the total number of photons absorbed by the
solution due to the compound’s presence (Schwarzenbach
et al., 1993). The degradation trend observed for the selected
compounds followed the decadic molar absorption coeffi-
cients order with exception of isoproturon probably due to its
extremely low quantum yield. All the decadic molar absorp-
tion coefficients and quantum yields obtained agree very well
with previously reported values (Table 2).

Ta
ble
1–
Flu
en
ce-b
ase
dd
irect
ph
oto
lysi
s(L
P/U
V)a
nd
AO
Ps
(LP
/UV
/H2O
2a
nd
LP
/UV
/TiO
2)ra
teco
nst
an
tso
bta
ined
for
the
sele
cted
pest
icid
es
ind
iffe
ren
tw
ate
rm
atr
ices:
lab
ora
tory
gra
de
wa
ter
(LG
W),
surf
ace
wa
ter
(SW
),a
nd
gro
un
dw
ate
r(G
W)
as
ind
ivid
ua
lco
mp
ou
nd
s(i
nd
)a
nd
mix
ture
s(m
ix);
sta
nd
ard
err
ors
giv
en
inp
are
nth
esi
sa
nd
mo
dele
dre
sult
sg
iven
insq
ua
reb
rack
ets
.
Co
mp
ou
nd
k f�
10
4(c
m2/m
J)
LP
/UV
LP
/UV
/H2O
2–
40
mg/L
LP
/UV
/TiO
2–
2.5
mg/
L
LG
Win
dG
Win
dS
Win
dS
Wm
ixLG
Win
dS
Win
dS
Wm
ixLG
Win
dS
Wm
ix
Atr
azi
ne
7.5
6(0
.08)
R2¼
0.9
99
8.2
1(0
.03)
R2¼
0.9
99
[7.4
0]
8.5
1(0
.16)
R2¼
0.9
96
[5.9
4]
5.8
5(0
.04)
R2¼
0.9
99
7.4
3(0
.11)
R2¼
0.9
97
[59.4
]
8.6
4(0
.06)
R2¼
0.9
99
[48.8
]
6.1
6(0
.09)
R2¼
0.9
97
9.1
5(0
.06)
R2¼
0.9
99
[22.2
]
10.1
7(0
.11)
R2¼
0.9
99
[17.3
]
Iso
pro
turo
n0.5
6(0
.07)
R2¼
0.8
50
0.5
3(0
.02)
R2¼
0.9
83
[0.5
5]
1.0
6(0
.17)
R2¼
0.7
69
[0.4
5]
0.1
2(0
.02)
R2¼
0.9
63
1.2
3(0
.04)
R2¼
0.9
87
[6.0
5]
0.1
6(0
.02)
R2¼
0.8
80
[4.9
5]
0.1
2(0
.03)
R2¼
0.8
43
0.4
7(0
.07)
R2¼
0.7
80
[1.7
3]
0.2
5(0
.05)
R2¼
0.9
20
[1.4
1]
Diu
ron
13.0
5(0
.20)
R2¼
0.9
9
14.4
9(0
.15)
R2¼
0.9
99
[12.4
6]
14.0
4(0
.15)
R2¼
0.9
99
[10.4
7]
12.1
5(0
.09)
R2¼
0.9
99
13.5
2(0
.13)
R2¼
0.9
99
[91.6
]
16.2
1(0
.10)
R2¼
0.9
99
[75.0
]
12.9
6(0
.13)
R2¼
0.9
99
18.1
4(0
.29)
R2¼
0.9
97
[43.6
]
14.5
9(0
.16)
R2¼
0.9
99
[33.0
]
Ala
chlo
r5.4
2(0
.16)
R2¼
0.9
91
6.8
0(0
.08)
R2¼
0.9
98
[5.4
7]
5.7
6(0
.18)
R2¼
0.9
88
[4.5
7]
6.7
1(0
.08)
R2¼
0.9
98
6.0
8(0
.11)
R2¼
0.9
96
[43.9
]
6.2
0(0
.06)
R2¼
0.9
99
[36.9
]
5.2
3(0
.07)
R2¼
0.9
98
7.0
3(0
.17)
R2¼
0.9
93
[8.6
3]
7.3
0(0
.18)
R2¼
0.9
93
[9.3
6]
Pen
tach
loro
ph
en
ol
8.3
8(0
.07)
R2¼
0.9
99
7.2
6(0
.22)
R2¼
0.9
89
[8.2
9]
7.3
4(0
.14)
R2¼
0.9
96
[6.8
6]
nd
9.5
7(0
.21)
R2¼
0.9
94
[69.9
]
8.6
0(0
.33)
R2¼
0.9
83
[56.8
]
nd
nd
nd
Ch
lorf
en
vin
ph
os
22.5
2(0
.61)
R2¼
0.9
93
13.5
1(0
.85)
R2¼
0.9
55
[22.5
1]
14.4
4(0
.81)
R2¼
0.9
64
[18.5
0]
16.3
0(0
.47)
R2¼
0.9
90,
–
20.1
6(0
.79)
R2¼
0.9
85
[152]
15.8
1(0
.67)
R2¼
0.9
79
[125]
16.9
6(0
.45)
R2¼
0.9
92
15.1
7(0
.56)
R2¼
0.9
84
[70.2
]
18.5
4(0
.36)
R2¼
0.9
96
[56.7
]
nd
–N
ot
dete
rmin
ed
.
w a t e r r e s e a r c h 4 4 ( 2 0 1 0 ) 1 8 0 9 – 1 8 1 8 1813
The experimental results obtained in Fig. 1 were modeled
using equations (1)–(4) detailed in the Supplementary Material
Section (Sharpless and Linden, 2003; Schwarzenbach et al.,
1993). The model used predicted extremely well the results
obtained in groundwater for all the pesticides except chlor-
fenvinphos. In the surface water degradation experiments,
the model slightly underestimated the experimental results
for alachlor, atrazine, and diuron. However, as can be seen in
Table 1 the modeled direct photolysis fluence-based rate
constants were similar to the experimental rate constants
obtained.
3.2. Advanced oxidation processes
Experimental and model AOPs photolysis of the selected
pesticides was also tested using hydrogen peroxide and tita-
nium dioxide (Table 1 and Fig. 2). The experimental results
represent, in these experiments, a combination of direct
photolysis and AOP results, and were modeled using equa-
tions (1)–(11) presented in the Supplementary Material Section
(Sharpless and Linden, 2003; Schwarzenbach et al., 1993;
Klassen et al., 1994; Buxton et al., 1988; Huber et al., 2003; Neta
and Dorfman, 1968; Larson and Zepp, 1988).
The LP/UV/H2O2 photolysis fluence-based rate constants
obtained for atrazine, diuron, and alachlor slightly
increased in surface water compared to laboratory grade
water similarly to what was observed in the LP/UV experi-
ments (Table 1). Likewise, very similar time (Supplementary
Material Section SM Table 3) and fluence-based rate
constants were obtained in both tested matrices for all the
compounds except chlorfenvinphos that presented lower
photolysis rate constants in the real water matrix. In the LP/
UV/TiO2 photolysis experiments similar time and fluence-
based rate constants were obtained for all compounds in
LGW and surface water. In addition, the exact same degra-
dation trend was observed for the mixtures in the surface
water matrix when comparing the LP/UV, the LP/UV/H2O2,
and the LP/UV/TiO2 results. The following order of degra-
dation was observed: isoproturon, alachlor, atrazine,
pentachlorophenol, diuron, and chlorfenvinphos. The
results obtained when a mixture of the pesticides was sub-
jected to AOPs were again in agreement with the results
obtained for the individual compounds.
Different concentrations of hydrogen peroxide (20, 60, 80,
and 120 mg/L) and titanium dioxide (0.5, 5 and 10 mg/L) were
tested but the results obtained showed no significant
improvement in the photolysis rates obtained relatively to
40 mg/L H2O2 and 2.5 mg/L TiO2.
The second-order rate constants for reaction of the pesti-
cides with OH radicals, kOH,P (Table 2) were determined by
competition kinetics using pCBA as a reference compound
(Elovitz and von Gunten, 1999) according to equations (10) and
(11) detailed in the Supplementary Material Section and are
similar to reported literature values.
The modeled results overestimated the AOP experimental
values (Fig. 2a and b and Table 1) especially when hydrogen
peroxide was used to produce the OH radicals.
The model tested was also used to predict the degrada-
tion behaviour of the selected pesticides under different
experimental conditions. The change in the direct photolysis

Table 2 – Decadic molar absorption coefficient (3), quantum yield (f), and second-order rate constants for reaction of thepesticides with OH radicals, (kOH,P) for the selected pesticides; literature values given in square brackets (Acero et al., 2008;Song et al., 2008; Wong and Chu, 2003b; Benitez et al., 2003,2006; De Laat et al., 1999; Beltran et al., 1993; Haag and Yao, 1992).
Compound 3 (M�1 cm�1) f (mol einstein�1) kOH,P (�109 M�1 s�1)
LP/UV/H2O2 LP/UV/TiO2
Atrazine 2647
[2847–3860]
0.060
[0.041–0.05]
7.3
[18]
35.0
Isoproturon 5944
[6068]
0.002
[0.0037]
0.8
[5.2]
3.3
Diuron 16 162
[15 699]
0.019
[0.0115]
12.7
[4.6]
87.0
Alachlor 543
[428–467]
0.210
[0.095––0.140]
5.4
[7.0]
6.1
Pentachlorophenol 7400
[8500]
0.025
[0.0525]
9.0
[4.0]
nd
Chlorfenvinphos 8656
[7287]
0.056
[0.089]
18.5
[3.2]
132.5
nd – Not determined.
LP/UV/H2O
2 - 40mg/L
-20
-15
-10
-5
00 200 400 600 800 1000 1200 1400 1600 1800
UV Fluence (mJ/cm2
)
C/
C(
nL
0)
DIU_exp DIU_modelISO_exp ISO_modelALA_exp ALA_modelATR_exp ATR_model PCP_exp PCP_model CFVP_exp CFVP_model
LP/UV/TiO2 - 2.5mg/L
-12
-10
-8
-6
-4
-2
00 200 400 600 800 1000 1200 1400 1600 1800
UV Fluence (mJ/cm2
)
C/
C(
nL
0)
DIU_exp DIU_modelISO_exp ISO_modelALA_exp ALA_modelATR_exp ATR_modelCFVP_exp CFVP_model
a
b
Fig. 2 – Experimental (exp) and model low pressure photolysis of diuron (DIU), isoproturon (ISO), alachlor (ALA), atrazine
(ATR), pentachlorophenol (PCP), and chlorfenvinphos (CFVP) in surface water using (a) hydrogen peroxide (H2O2) and (b)
titanium dioxide (TiO2); experimental values are represented by symbols with error bars whereas the lines show the model
results.
w a t e r r e s e a r c h 4 4 ( 2 0 1 0 ) 1 8 0 9 – 1 8 1 81814

z (cm)
0,0E+00
5,0E-05
1,0E-04
1,5E-04
2,0E-04
2,5E-04
3,0E-04
0 10 20 30 40 50
kds(
1-)
atrazine isoproturon diuron alachlor pentachlorophenol chlorfenvinphos
Fig. 3 – Modeled time-based direct photolysis rate constants.
w a t e r r e s e a r c h 4 4 ( 2 0 1 0 ) 1 8 0 9 – 1 8 1 8 1815
time-based rate constants was therefore predicted at
different distances from the UV source (Fig. 3). As expected,
the distance to the UV source highly affects the degradation
of the compounds at shorter pathlengths (up to approxi-
mately 20 cm), remaining almost constant at higher
distances.
Fig. 4 shows the AOPs time-based rate constants predicted
for isoproturon, the most resilient compound, in surface
water as a function of changes in the distance to the UV source
and the hydrogen peroxide (Fig. 4a) and titanium dioxide
(Fig. 4b) concentrations. At the distance to the source used in
our collimated beam reactor (29 cm), the overall AOPs rate
constants predicted were found to be fairly independent of the
H2O2 and TiO2 concentrations. However, under different
experimental setups, the overall degradations rate constants
obtained are likely to be more efficient using higher hydrogen
peroxide and titanium dioxide concentrations at lower
pathlengths.
Fig. 5 presents a final comparison of the results obtained in
the surface water matrix at a UV fluence of 1500 mJ/cm2 that
was achieved after approximately 4–5 h of degradation.
Fig. 4 – Modeled time-based direct photolysis and
All the pesticides except isoproturon are expected to
degrade significantly using LP/UV. Due to its extremely low
quantum yield at 254 nm, isoproturon degradation using LP
lamps will probably be very low even at higher UV fluences.
Medium pressure lamps, that emit light at a broader range of
wavelengths, have also proven to be inefficient for the
degradation of isoproturon (Haque and Muneer, 2003). To
achieve isoproturon degradation, much higher H2O2 or TiO2
concentrations would probably need to be used with
a different reactor configuration that would allow shorter
distances to the lamp (Fig. 4).
The photolysis results obtained when mixtures of pesti-
cides were degraded in surface water were extremely similar
to the results obtained for the LP direct photolysis and AOPs
using H2O2 of the individual compounds. The slight decrease
in degradation of the pesticides in most of the mixture
samples may be due to competition between compounds for
the UV light and the OH radicals produced. For all the
selected pesticides, AOPs did not seem to enhance signifi-
cantly their degradation using LP lamps. This tendency was
already observed by other authors whenever direct
AOPs rate constants obtained for isoproturon.

0
20
40
60
80
100
ATR ISO DIU ALA CFVP PCP
no
it
ad
ar
ge
D%
LP/UV LP/UV Mix LP/UV/H2O2 LP/UV/H2O2 Mix LP/UV/TiO2 Mix
Fig. 5 – LP/UV, LP/UV/H2O2, and LP/UV/TiO2 percent degradation of atrazine (ATR), isoproturon (ISO), diuron (DIU), alachlor
(ALA), chlorfenvinphos (CFVP), and pentachlorophenol (PCP) spiked in surface water as individual compounds and mixtures
(Mix) using a UV fluence of 1500 mJ/cm2.
w a t e r r e s e a r c h 4 4 ( 2 0 1 0 ) 1 8 0 9 – 1 8 1 81816
photolysis efficiently degraded compounds such as alachlor
(Wong and Chu, 2003b), N-nitrosodimethylamine (Sharpless
and Linden, 2003), clofibric acid and iohexol (Pereira et al.,
2007b). Even though no significant enhancement of pesti-
cides degradation was observed using AOPs, the two
processes should be compared in terms of the levels of
mineralization achieved. Therefore, future studies should
address if the LP photolysis of these priority pollutants
accomplishes the mineralization of pesticides or if by-prod-
ucts may form as described by other authors for different
light sources (Malato et al., 2003; Wong and Chu, 2003a;
0
100000
200000
300000
400000
500000
0 400
UV Fluenc
aerA
By-Produc
Fig. 6 – Alachlor by-produ
Bianchi et al., 2006; Mills and Hoffmann, 1993). The identified
compounds may be different according to the UV systems
used. The HPLC results obtained showed that as the UV
fluence increased, the alachlor peak area decreased and
a by-product peak was formed (Fig. 6).
This compound is probably similar in structure to
alachlor since it was detected using the same HPLC chro-
matographic method. Even though this was the only
by-product detected in our results, many other by-products
may have been formed and could be identified using mass
spectrometry analysis.
800 1200 1600
e (mJ/cm2)
t Alachlor
ct detected by HPLC.

w a t e r r e s e a r c h 4 4 ( 2 0 1 0 ) 1 8 0 9 – 1 8 1 8 1817
4. Conclusions
LP/UV was found to be extremely efficient to degrade the
pesticides atrazine, diuron, alachlor, pentachlorophenol, and
chlorfenvinphos. Besides being known as an extremely effi-
cient process to inactivate microorganisms, the results of this
work show that LP direct photolysis using high UV fluences
may also prove to be very effective to ensure the degradation
of several priority substances with different structures and it
is therefore a promising technology for drinking water
treatment.
Acknowledgments
We thank Cristina Leitao and Joana Ricardo for their tech-
nical assistance. This work was financed by Fundacao para
a Ciencia e a Tecnologia (PTDC/AMB/66024/2006) and the
European Economic Area Financial Mechanism, Empresa
Portuguesa de Aguas Livres, Municıpio de Almada, and
Instituto de Biologia Experimental e Tecnologica (through
project PT0012). Vanessa J. Pereira acknowledges the finan-
cial support provided from Fundacao para a Ciencia e
a Tecnologia through the grant SFRH/BPD/26990/2006.
Empresa Portuguesa de Aguas Livres is acknowledged for
providing the real water matrices. We thank Dr. Paula Pas-
sarinho (LNEG, Portugal) for supplying the titanium dioxide
catalyst.
Appendix.Supplementary material
Additional information provided in the supplementary Mate-
rial section includes a description of the selected pesticides,
details concerning the HPLC methods used, the time-based
photolysis rate constants obtained in different water
matrices, and the direct photolysis and AOP modeling equa-
tions used.
Note: Supplementary data associated with this article can be
found in the online version at doi:10.1016/j.waters.2009.12.001.
r e f e r e n c e s
Acero, J.L., Real, F.J., Benitez, E.J., Gonzalez, A., 2008. Oxidation ofchlorfenvinphos in ultrapure and natural waters by ozonationand photochemical processes. Water Research 42 (12),3198–3206.
Balasubramanian, G., Dionysiou, D.D., Suidan, M.T., Baudin, I.,Audin, B., Laine, J.M., 2004. Evaluating the activities ofimmobilized TiO2 powder films for the photocatalyticdegradation of organic contaminants in water. AppliedCatalysis B – Environmental 47 (2), 73–84.
Beltran, F.J., Ovejero, G., Acedo, B., 1993. Oxidation of atrazine inwater by ultraviolet-radiation combined with hydrogen-peroxide. Water Research 27 (6), 1013–1021.
Benitez, F.J., Acero, J.L., Real, F.J., Garcia, J., 2003. Kinetics ofphotodegradation and ozonation of pentachlorophenol.Chemosphere 51 (8), 651–662.
Benitez, F.J., Real, F.J., Acero, J.L., Garcia, C., 2006. Photochemicaloxidation processes for the elimination of phenyl-ureaherbicidesin waters. Journal of Hazardous Materials 138 (2), 278–287.
Bianchi, C.L., Pirola, C., Ragaini, V., Selli, E., 2006. Mechanism andefficiency of atrazine degradation under combined oxidationprocesses. Applied Catalysis B – Environmental 64 (1–2),131–138.
Bolton, J., Linden, K., 2003. Standardization of methods forfluence (UV dose) determination in bench-scale UVexperiments. Journal of Environmental Engineering – ASCE129 (3), 209–215.
Buxton, G.V., Greenstock, C.L., Helman, W.P., Ross, A.B., 1988.Critical-review of rate constants for reactions of hydratedelectrons, hydrogen-atoms and hydroxyl radicals (�OH/�O�) inaqueous-solution. Journal of Physical and Chemical ReferenceData 17 (2), 513–886.
De Laat, J., Gallard, H., Ancelin, S., Legube, B., 1999. Comparativestudy of the oxidation of atrazine and acetone by H2O2/UV,Fe(III)/UV, Fe(III)/H2O2/UV and Fe(II) or Fe(III)/H2O2.Chemosphere 39 (15), 2693–2706.
Djebbar, K.E., Zertal, A., Debbache, N., Sehili, T., 2008.Comparison of diuron degradation by direct UV photolysis andadvanced oxidation processes. Journal of EnvironmentalManagement 88 (4), 1505–1512.
Elovitz, M.S., von Gunten, U., 1999. Hydroxyl radical/ozone ratiosduring ozonation processes. I. The Rct concept. Ozone:Science & Engineering 21 (3), 239–260.
EPA, 2003. List of Drinking Water Contaminants & TheirMaximum Contaminant Levels (MCLs). EnvironmentalProtection Agency – Office of Water. http://www.epa.gov/safewater/contaminants.
Field, J.A., Reed, R.L., Sawyer, T.E., Griffith, S.M., Wigington, P.J.,2003. Diuron occurrence and distribution in soil and surfaceand ground water associated with grass seed production.Journal of Environmental Quality 32 (1), 171–179.
von Gunten, U., 2003. Ozonation of drinking water: part I.Oxidation kinetics and product formation. Water Research 37(7), 1443–1467.
Haag, W., Yao, C., 1992. Rate constants for reaction of hydroxylradicals with several drinking-water contaminants.Environmental Science & Technology 26 (5), 1005–1013.
Haque, M.M., Muneer, M., 2003. Heterogeneous photocatalyseddegradation of a herbicide derivative, isoproturon in aqueoussuspension of titanium dioxide. Journal of EnvironmentalManagement 69 (2), 169–176.
Hincapie, M., Maldonado, M., Oller, I., Gernjak, W., Sanchez-Perez, J., Ballesteros, M., Malato, S., 2005. Solar photocatalyticdegradation and detoxification of EU priority substances.Catalysis Today 101 (3–4), 203–210.
Huber, M.M., Canonica, S., Park, G.Y., Von Gunten, U., 2003.Oxidation of pharmaceuticals during ozonation and advancedoxidation processes. Environmental Science & Technology 37(5), 1016–1024.
Klassen, N.V., Marchington, D., McGowan, H.C.E., 1994. H2O2
determination by the I3� method and by KMnO4 titration.
Analytical Chemistry 66 (18), 2921–2925.Larson, R.A., Zepp, R.G., 1988. Reactivity of the carbonate radical
with aniline derivatives. Environmental Toxicology andChemistry 7 (4), 265–274.
Linden, K., Shin, G., Faubert, G., Cairns, W., Sobsey, M., 2002. UVdisinfection of Giardia lamblia cysts in water. EnvironmentalScience & Technology 36 (11), 2519–2522.
Malato, S., Caceres, J., Fernandez-Alba, A., Piedra, L.,Hernando, M., Aguera, A., Vial, J., 2003. Photocatalytictreatment of diuron by solar photocatalysis: evaluation of
w a t e r r e s e a r c h 4 4 ( 2 0 1 0 ) 1 8 0 9 – 1 8 1 81818
main intermediates and toxicity. Environmental Science &Technology 37 (11), 2516–2524.
Mills, G., Hoffmann, M., 1993. Photocatalytic degradation ofpentachlorophenol on TiO2 particles – identification ofintermediates and mechanism of reaction. EnvironmentalScience & Technology 27 (8), 1681–1689.
Neta, P., Dorfman, L.M., 1968. Pulse radiolysis studies. XIII. Rateconstants for reaction of hydroxyl radicals with aromaticcompounds in aqueous solutions. Advances in ChemistrySeries 81, 222–230.
Pereira, V.J., Basılio, M.C., Fernandes, D., Domingues, M., Paiva, J.M., Benoliel, M.J., Crespo, M.T., San Romao, M.V., 2009.Occurrence of filamentous fungi and yeasts in three differentdrinking water sources. Water Research 43 (15), 3813–3819.
Pereira, V.J., Linden, K.G., Weinberg, H.S., 2007a. Evaluation of UVirradiation for photolytic and oxidative degradation ofpharmaceutical compounds in water. Water Research 41,4413–4423.
Pereira, V.J., Weinberg, H.S., Linden, K.G., Singer, P.C., 2007b. UVdegradation kinetics and modeling of pharmaceuticalcompounds in laboratory grade and surface water via directand indirect photolysis at 254 nm. Environmental Science &Technology 41 (5), 1682–1688.
Planas, C., Puig, A., Rivera, J., Caixach, J., 2006. Analysis ofpesticides and metabolites in Spanish surface waters byisotope dilution gas chromatography/mass spectrometry withprevious automated solid-phase extraction – estimation of theuncertainty of the analytical results. Journal ofChromatography A 1131 (1–2), 242–252.
Rosenfeldt, E.J., Linden, K.G., Canonica, S., von Gunten, U., 2006.Comparison of the efficiency of center dot OH radicalformation during ozonation and the advanced oxidationprocesses O3
�/H2O2 and UV/H2O2. Water Research 40 (20),3695–3704.
Schwarzenbach, R.P., Gschwend, P.M., Imboden, D.M., 1993.Environmental Organic Chemistry. John Wiley & Sons, Inc.,New York.
Sharpless, C., Linden, K., 2003. Experimental and modelcomparisons of low- and medium-pressure Hg lamps for thedirect and H2O2 assisted UV photodegradation of N-nitrosodimethylamine in simulated drinking water.Environmental Science & Technology 37 (9), 1933–1940.
Song, W., Ravindran, V., Pirbazari, M., 2008. Process optimizationusing a kinetic model for the ultraviolet radiation–hydrogenperoxide decomposition of natural and synthetic organiccompounds in groundwater. Chemical Engineering Science 63(12), 3249–3270.
Vollmuth, S., Zajc, A., Niessner, R., 1994. Formation ofpolychlorinated dibenzo-P-dioxins and polychlorinateddibenzofurans during the photolysis of pentachlorophenol-containing water. Environmental Science & Technology 28 (6),1145–1149.
Wong, C., Chu, W., 2003a. The hydrogen peroxide-assistedphotocatalytic degradation of alachlor in TiO2 suspensions.Environmental Science & Technology 37 (10), 2310–2316.
Wong, C., Chu, W., 2003b. The direct photolysis andphotocatalytic degradation of alachlor at different TiO2 andUV sources. Chemosphere 50 (8), 981–987.