Embed Size (px)
Citation preview
4th
International Conference on Water & Flood Management (ICWFM-2013)
337
DRASTIC-BASED VULNERABILITY ASSESSMENT OF BARIND
TRACT AQUIFER IN NORTHWESTERN BANGLADESH
Sajal K Adhikary1*
, A.B.M. Irad Hossain1, Mukand S Babel
2 and Ashim Das Gupta
2
1 Department of Civil Engineering, Khulna University of Engineering & Technology,
Khulna-9203, Bangladesh, e-mail: [email protected], [email protected]
2 Water Engineering and Management Division, Asian Institute of Technology (AIT),
Pathumthani-12120, Thailand, e-mail: [email protected], [email protected]
ABSTRACT
Barind Tract, largest Pleistocene physiographic unit of the Bengal Basin, recognized as a unit of
Old Alluvium, which differs from the surrounding floodplains. The aquifer is the main source of
water supply in the vicinity and is showing signs of contamination due to the existence of pollution
sources and the treatment of aquifer is quite impossible and impractical. Regional assessment of
groundwater (GW) pollution risk is a useful tool for successful management of GW resource and
its protection. In this study, the index-based DRASTIC method is adopted to evaluate aquifer
vulnerability to potential pollution, including seven parameters such as water table Depth,
Recharge, Aquifer media, Soil media, Topography, Impact of the vadose zone and hydraulic
Conductivity. Determination of the DRASTIC index involves multiplying each parameter weight
by its site rating and summing up the total. The Barind Tract aquifer located in three northwestern
districts (Rajshahi, Naogaon, Chapai Nawabganj) of Bangladesh have been considered in this
study. Necessary data related to each parameters of DRASTIC are collected. Based on estimated
DRASTIC index values, a GW vulnerability map is established in the framework of ArcGIS
platform. The higher index values symbolize greater potential for GW pollution, or greater aquifer
vulnerability. The results provide valuable information and the pollution risk map can be useful to
local authorities and decision makers for successful GW resource management and protection
zoning. The result demonstrates that 63% of the total study area (4700 sq. km.) is highly
vulnerable and only 8% of the study area (579 sq. km.) is located within the low vulnerable
domain. The study conclusively proves that the Barind Tract aquifer in the northwest region of
Bangladesh is highly vulnerable to potential GW pollution due to unplanned activities practiced in
the study area.
Keywords: Aquifer, ArcGIS, Barind tract, DRASTIC, groundwater pollution, vulnerability
1. INTRODUCTION
Growing trend of anthropogenic stresses on groundwater (GW) resource, especially impacts of
extensive land use leads to increase in the GW pollution and contamination. Therefore,
improvement of tools and techniques are essential for identifying and preventing the potential
contamination of GW resources in order to use GW safely without threats of depletion and
pollution. In such case, vulnerability assessment of GW resources can be useful because it can
provide preliminary information and criteria for decision-making (Ranjan et al., 2007). In
Bangladesh, contamination of GW due to increased use of fertilizers and pesticides along with
various anthropogenic activities is an ever-increasing problem. Therefore, more attention should
be paid to the probable impacts of irrigated agriculture and other human interventions on GW
quality. The Barind area in the northwestern Bangladesh is one of the most important agricultural
4th
International Conference on Water & Flood Management (ICWFM-2013)
338
areas in the country. The coverage of irrigated area has been increased significantly since early
1960s, especially with the introduction of high yielding variety of rice. It promotes growing use of
fertilizers for maximum production and increased use of pesticides as it has low resistance against
pesticides. As a consequence, use of chemical fertilizers and pesticides increased tremendously
during the last three decades (Bari and Anwar, 2000). One of the major effects is the increased
susceptibility of GW to pollution due to such agricultural practice. However, most people in this
area depend on GW resources from shallow aquifers to meet their water demands. For this reason,
GW contamination may cause severe health hazard and environmental problems in this region
(Shahid and Hazarika, 2007). Therefore, measures should be taken before the GW in the area to be
contaminated. In this study, an effort has been made for identifying the vulnerable aquifer areas
susceptible to possible contamination due to both agricultural and other general municipal and
industrial pollutants. GW vulnerability is a function of the geologic setting of an area, as this
largely controls the amount of time, i.e. the residence time of the GW that has passed since the
waterfall as rain, infiltrated through the soil, reached the GW table and began flowing to its
present location (Prior et al., 2003). In any given area, GW within an aquifer, or GW produced by
a well, has some vulnerability to contamination from human activities. Vulnerability is distinct
from pollution risk. However, pollution risk depends not only on vulnerability but also on the
existence of significant pollutant loading entering the sub-surface environment (Margane, 2003).
A vulnerability assessment delineates the presence of potential contaminant sources and the risk to
an aquifer based on the physical characteristics of the vadose zone and aquifer. Regional
assessment of GW vulnerability is a useful tool for GW resources management. The
implementation of land-use planning or zoning overlays based on aquifer vulnerability can prevent
aquifer contamination by carefully locating potential contaminant sources in areas of very low
aquifer sensitivity. It is possible to have high aquifer vulnerability but no risk of pollution, if there
is no significant pollutant loading; and to have high pollution risk in spite of low vulnerability, if
the pollutant loading is exceptional (Prior et al., 2003; Hossain, 2012). Vulnerability maps inform
about the need of groundwater protection and pollution prevention. The maps help to determine
which areas may have GW vulnerability problems and what types of site-specific data or studies
may be needed. This work deals with the GW pollution risk in the Barind Tract Aquifer in
northwestern Bangladesh. Literatures suggest that there are many methods for the assessment of
degree of vulnerability for the stored water in an aquifer. These include SIM (soil-waste
interaction matrix) method (Phillips et al., 1977), SIA (surface impoundment assessment) method
(Silka and Swearingen, 1978), SEEPAGE (system for early evaluation of the pollution potential of
agricultural groundwater environments) method (Richert et al., 1992), DRASTIC (Aller et al.,
1985), etc. Among these methods, the DRASTIC is the most widely used technique toward GW
vulnerability assessment because it is easy and straightforward method and the necessary data is
usually available or can be estimated. The DRASTIC method assigns the numerical ratings to each
of the several hydrogeologic characteristics in a scale between one and ten. These ratings are then
multiplied by a set of weighting factors and summed up to obtain an index (Shahid and Hazarika,
2007). In this study, the hydrogeological information has been integrated in the GIS platform
following DRASTIC methods to delineate the GW vulnerability map of the Barind Tract Aquifer
in northwestern Bangladesh.
2. DESCRIPTION OF THE STUDY AREA
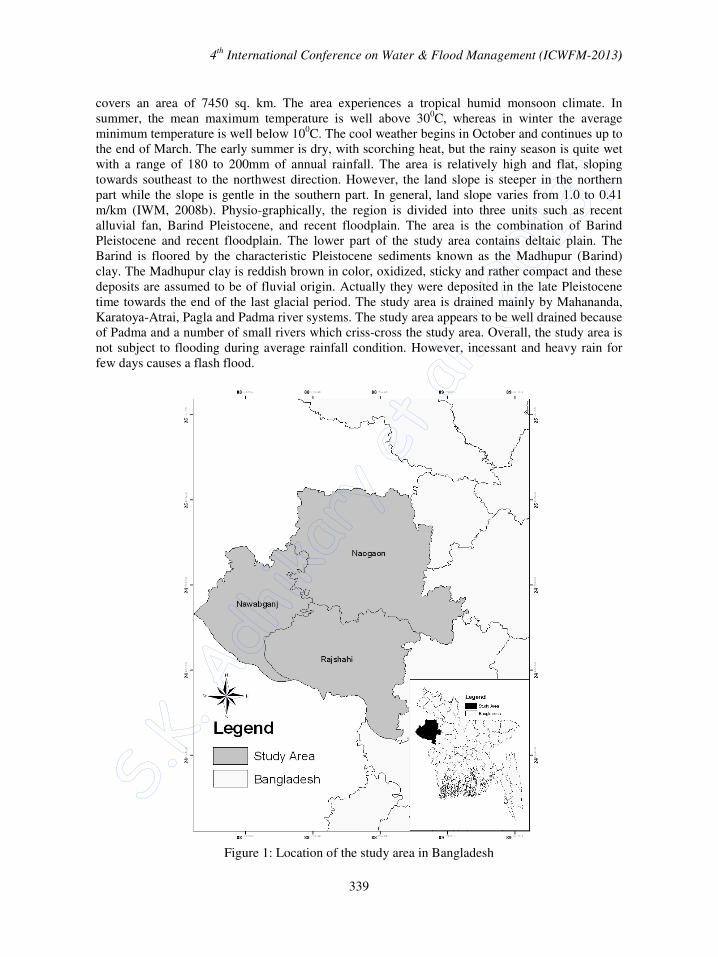
The project area is located in 25 Upazillas (sub-district) of Rajshahi, Noagaon and Chapai-
Nawabganj district (Figure 1) in the northwestern region of Bangladesh. Geographical location of
the study area is 88° 10′ 0.12″ E to 88° 58′ 30″ E and 24° 11′ 30.12″ N to 25° 8′ 39.84″ N. It
4th
International Conference on Water & Flood Management (ICWFM-2013)
339
covers an area of 7450 sq. km. The area experiences a tropical humid monsoon climate. In
summer, the mean maximum temperature is well above 300C, whereas in winter the average
minimum temperature is well below 100C. The cool weather begins in October and continues up to
the end of March. The early summer is dry, with scorching heat, but the rainy season is quite wet
with a range of 180 to 200mm of annual rainfall. The area is relatively high and flat, sloping
towards southeast to the northwest direction. However, the land slope is steeper in the northern
part while the slope is gentle in the southern part. In general, land slope varies from 1.0 to 0.41
m/km (IWM, 2008b). Physio-graphically, the region is divided into three units such as recent
alluvial fan, Barind Pleistocene, and recent floodplain. The area is the combination of Barind
Pleistocene and recent floodplain. The lower part of the study area contains deltaic plain. The
Barind is floored by the characteristic Pleistocene sediments known as the Madhupur (Barind)
clay. The Madhupur clay is reddish brown in color, oxidized, sticky and rather compact and these
deposits are assumed to be of fluvial origin. Actually they were deposited in the late Pleistocene
time towards the end of the last glacial period. The study area is drained mainly by Mahananda,
Karatoya-Atrai, Pagla and Padma river systems. The study area appears to be well drained because
of Padma and a number of small rivers which criss-cross the study area. Overall, the study area is
not subject to flooding during average rainfall condition. However, incessant and heavy rain for
few days causes a flash flood.
Figure 1: Location of the study area in Bangladesh
4th
International Conference on Water & Flood Management (ICWFM-2013)
340
3. METHODOLOGY
3.1 Overview of DRASTIC Index
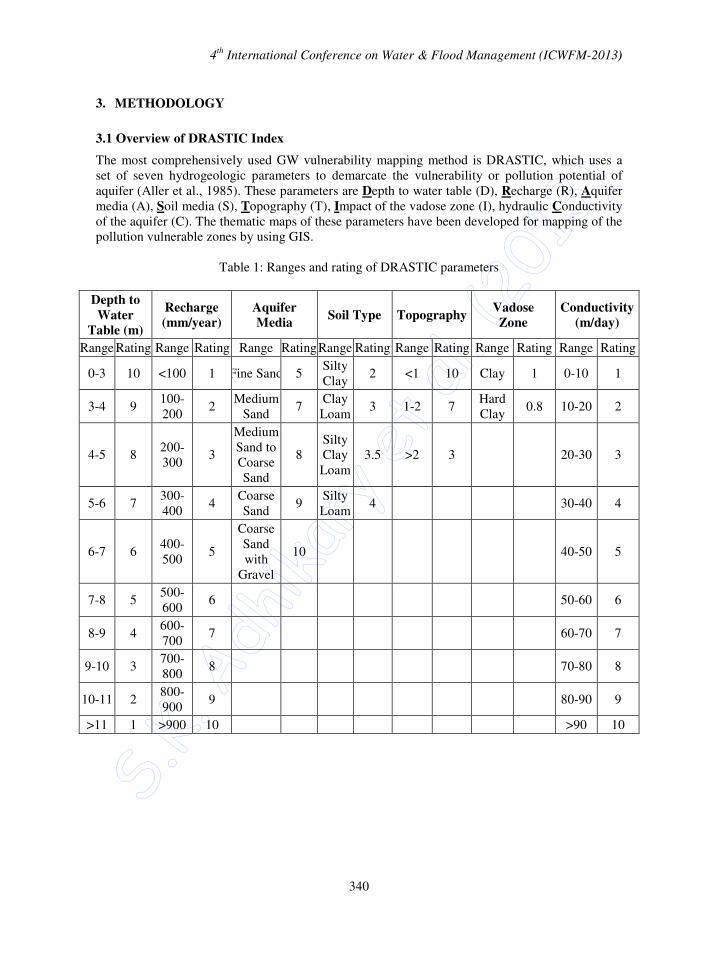
The most comprehensively used GW vulnerability mapping method is DRASTIC, which uses a
set of seven hydrogeologic parameters to demarcate the vulnerability or pollution potential of
aquifer (Aller et al., 1985). These parameters are Depth to water table (D), Recharge (R), Aquifer
media (A), Soil media (S), Topography (T), Impact of the vadose zone (I), hydraulic Conductivity
of the aquifer (C). The thematic maps of these parameters have been developed for mapping of the
pollution vulnerable zones by using GIS.
Table 1: Ranges and rating of DRASTIC parameters
Depth to
Water
Table (m)
Recharge
(mm/year)
Aquifer
Media Soil Type Topography
Vadose
Zone
Conductivity
(m/day)
Range Rating Range Rating Range RatingRange Rating Range Rating Range Rating Range Rating
0-3 10 <100 1 Fine Sand 5 Silty
Clay 2 <1 10 Clay 1 0-10 1
3-4 9 100-
200 2
Medium
Sand 7
Clay
Loam 3 1-2 7
Hard
Clay 0.8 10-20 2
4-5 8 200-
300 3
Medium
Sand to
Coarse
Sand
8
Silty
Clay
Loam
3.5 >2 3 20-30 3
5-6 7 300-
400 4
Coarse
Sand 9
Silty
Loam 4 30-40 4
6-7 6 400-
500 5
Coarse
Sand
with
Gravel
10 40-50 5
7-8 5 500-
600 6 50-60 6
8-9 4 600-
700 7 60-70 7
9-10 3 700-
800 8 70-80 8
10-11 2 800-
900 9 80-90 9
>11 1 >900 10 >90 10
4th
International Conference on Water & Flood Management (ICWFM-2013)
341
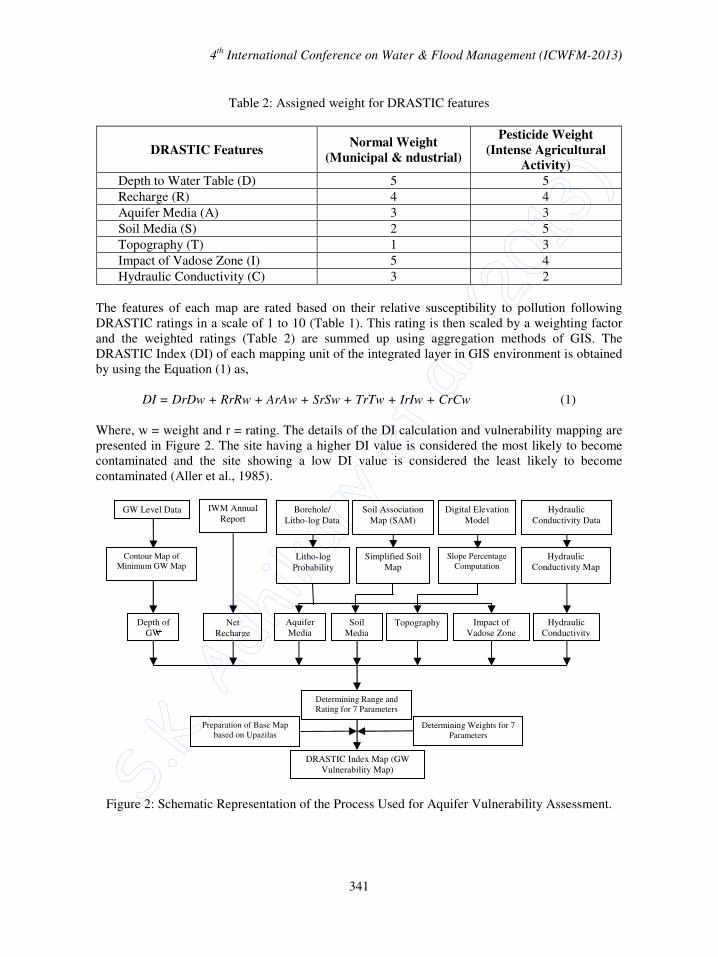
Table 2: Assigned weight for DRASTIC features
DRASTIC Features Normal Weight
(Municipal & ndustrial)
Pesticide Weight
(Intense Agricultural
Activity)
Depth to Water Table (D) 5 5
Recharge (R) 4 4
Aquifer Media (A) 3 3
Soil Media (S) 2 5
Topography (T) 1 3
Impact of Vadose Zone (I) 5 4
Hydraulic Conductivity (C) 3 2
The features of each map are rated based on their relative susceptibility to pollution following
DRASTIC ratings in a scale of 1 to 10 (Table 1). This rating is then scaled by a weighting factor
and the weighted ratings (Table 2) are summed up using aggregation methods of GIS. The
DRASTIC Index (DI) of each mapping unit of the integrated layer in GIS environment is obtained
by using the Equation (1) as,
DI = DrDw + RrRw + ArAw + SrSw + TrTw + IrIw + CrCw (1)
Where, w = weight and r = rating. The details of the DI calculation and vulnerability mapping are
presented in Figure 2. The site having a higher DI value is considered the most likely to become
contaminated and the site showing a low DI value is considered the least likely to become
contaminated (Aller et al., 1985).
Figure 2: Schematic Representation of the Process Used for Aquifer Vulnerability Assessment.
GW Level Data Borehole/
Litho-log Data
Soil Association
Map (SAM)
Digital Elevation
Model
Hydraulic
Conductivity Data
Contour Map of
Minimum GW Map Litho-log
Probability
Simplified Soil
Map
Slope Percentage
Computation Hydraulic
Conductivity Map
Depth of
GW
Net
Recharge
Aquifer
Media
Soil
Media Topography Impact of
Vadose Zone
Hydraulic
Conductivity
Determining Range and
Rating for 7 Parameters
Determining Weights for 7
Parameters
Preparation of Base Map
based on Upazilas
DRASTIC Index Map (GW
Vulnerability Map)
IWM Annual
Report
4th
International Conference on Water & Flood Management (ICWFM-2013)
342
3.2 Mapping of Parameters for DRASTIC Index
The seven parameters of DRASTIC index are derived from different hydrogeological and
elevation maps, GW level fluctuation and borehole lithology data available in the study area. All
the thematic maps are prepared in GIS platform.
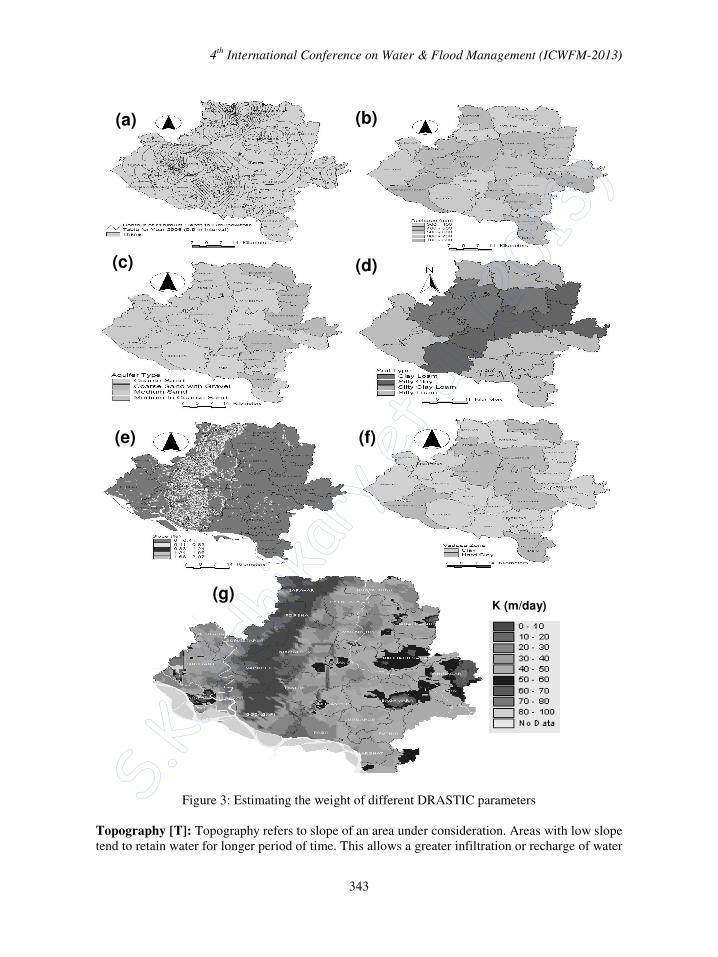
Depth to water table [D]: In general, the aquifer potential protection increases with depth to
water. The GW depth contour map is prepared using GW data collected from IWM by ArcGIS
and shown in Figure 3(a). The GW depth in the study area fluctuates seasonally and it ranges from
1.7 to 15.98m. Average depth of GW level is used to develop the depth to water table map of the
study area. Krigging method is used to estimate the spatial variation of GW depth from point data.
This study shows that depth of water table for the study area is approximately near the surface.
About 15.76% (1174 sq. km.) of the area possess the depth of GW below 3m from the land
surface, 37.57% (2799 sq. km.) below 4m and 48% (3538 sq. km.) below 5m. Therefore, the study
area is highly vulnerable with respect to depth to water table.
Recharge [R]: Recharge water is a significant vehicle for percolating and transporting
contaminants within the vadose zone to the saturated zone. It carries the solid and liquid
contaminants to the GWT and increases the GWT. In general, the greater the recharge, the greater
is the potential for GW pollution. GW recharge map is prepared based on the collected recharge
data in the study area and is shown in Figure 3(b). Higher the recharge rate, the rating is higher.
The recharge value ranges between 357 to 725mm. The analysis shows that the minimum value of
net recharge lies in Tanore. It also indicates that 21.5% (1602 sq. km.) of the total study area
possess the net recharge above 600 mm/year and can be noted that net recharge is moderately
responsive to aquifer vulnerability.
Aquifer media [A]: In general, larger the grain-size and the more fractures or openings within the
aquifers, the higher the permeability and lower the attenuation capacity and consequently the
greater is the pollution potential. Aquifer media has been identified based on the collected
lithological borelog data and corresponding aquifer media map for the study area is shown in
Figure 3(c). Coarser the aquifer media, the rating is higher. The analysis shows that 46.85% (3489
sq. km.) of the study area possess medium sand, 29.37% (2188 sq. km.) possess coarse sand and
21.17% (1577 sq. km.) possess coarse sand with gravel as aquifer media. Therefore, the fact is
that, with respect to aquifer media rating, the whole aquifer media of the study area is lying under
threat.
Soil media [S]: Soil covers characteristics influence the surface and downward movement of
contaminants. Soil media map for the study area is presented in Figure 3(d). Soil association map
(SAM) from the Soil Resource Development Institute (SRDI) is used to define soil types in this
study. The map is geo-referenced and digitized with ArcView 3.2 software. Soil types of the study
area are simplified in four categories like clay loam, silty loam, silty clay loam and silty clay.
From this study, it is obtained that 40% (2926 sq. km.) of the study area hold silty loam as soil
media, 25% (1891 sq. km.), 23% (1701 sq. km.) and 12% (928 sq. km.) of the area have silty clay,
clay loam and silty clay loam as soil media, respectively. However, with respect to soil media, the
study area is less vulnerable to pollution.
4th
International Conference on Water & Flood Management (ICWFM-2013)
343
Figure 3: Estimating the weight of different DRASTIC parameters
Topography [T]: Topography refers to slope of an area under consideration. Areas with low slope
tend to retain water for longer period of time. This allows a greater infiltration or recharge of water
(e) (f)
(a) (b)
(c) (d)
K (m/day) (g)
4th
International Conference on Water & Flood Management (ICWFM-2013)
344
and a greater potential for contaminant migration. Topography of the study area is shown in
Figure 3(e). The slope has been derived from digital elevation model (DEM) of the study area.
From the study, it is seen that the slope of the most portion in the study area is less than 1.0%.
Hence, there is a high possibility of water to store over the surface and infiltrate down into the
aquifer. For slope, less than 1% is rated as 10. In that case, the study area is highly vulnerable with
respect to topographic characteristics.
Impact of the vadose zone material [I]: The impact of vadose zone is a complex phenomenon,
combining aquifer media and topographic characteristics. Analysis of lithologs reveal that the
vadose zone is composed mostly clay and hard clay. Borehole lithologs data is used for preparing
this map and is shown in Figure 3(f). The vadose zone of the study area contains clay and hard
clay. These two elements have very low permeability characteristic and that is why they are rated
as 1.0 and 0.8, respectively. It is observed that 61% (4527 sq. km.) and 39% (2923 sq. km.) of the
vadose zone is possessed by clay and hard clay, respectively. However, the whole study area is
less vulnerable with respect to this parameter.
Hydraulic conductivity of the aquifer [C]: The hydraulic conductivity (C) refers to the aquifer
ability to transmit water, and therefore, controls the contaminant migration and dispersion from
the injection point within the saturated zone and, consequently the plume concentration in the
aquifer. Hydraulic conductivity values are collected and relevant conductivity map for the study
area is prepared and presented in Figure 3(g). The analysis indicates that the lower Barind area has
higher hydraulic conductivity value than that in the higher Barind region.
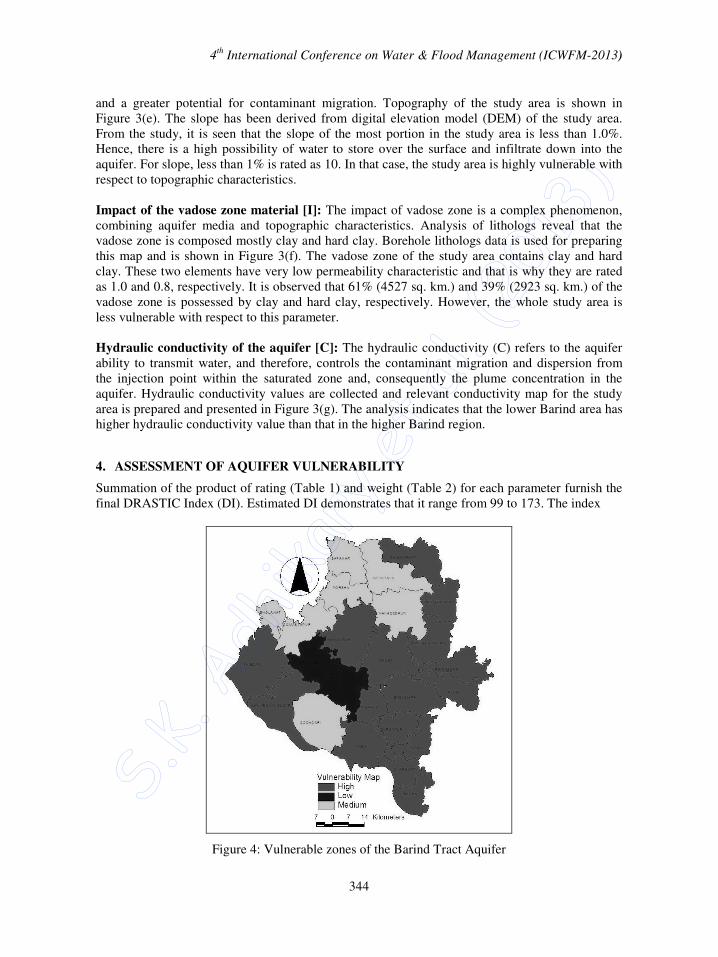
4. ASSESSMENT OF AQUIFER VULNERABILITY
Summation of the product of rating (Table 1) and weight (Table 2) for each parameter furnish the
final DRASTIC Index (DI). Estimated DI demonstrates that it range from 99 to 173. The index
Figure 4: Vulnerable zones of the Barind Tract Aquifer
4th
International Conference on Water & Flood Management (ICWFM-2013)
345
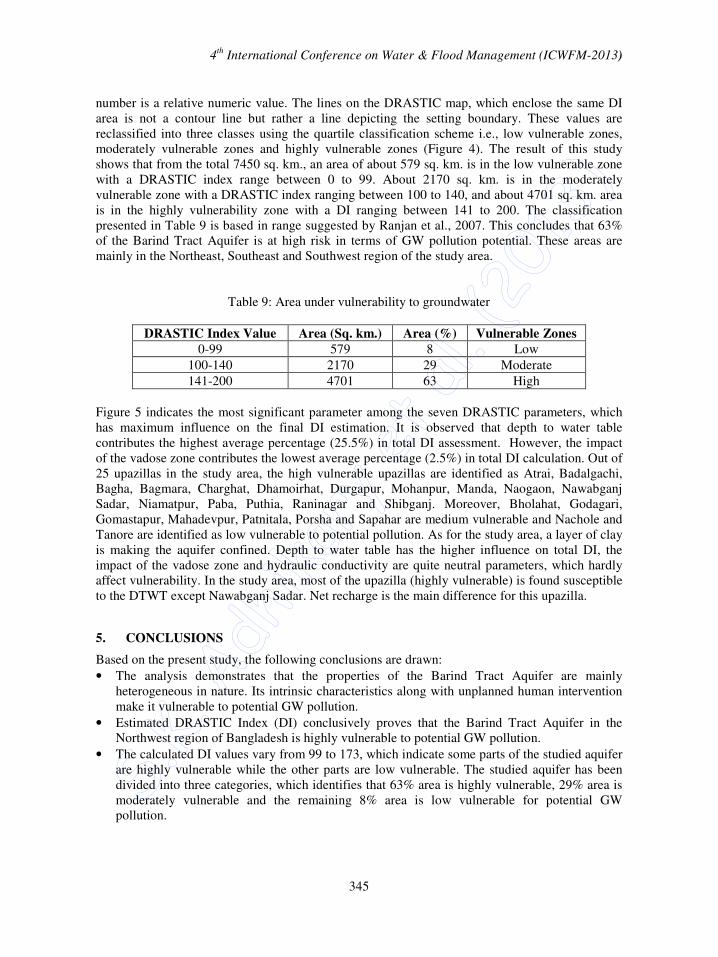
number is a relative numeric value. The lines on the DRASTIC map, which enclose the same DI
area is not a contour line but rather a line depicting the setting boundary. These values are
reclassified into three classes using the quartile classification scheme i.e., low vulnerable zones,
moderately vulnerable zones and highly vulnerable zones (Figure 4). The result of this study
shows that from the total 7450 sq. km., an area of about 579 sq. km. is in the low vulnerable zone
with a DRASTIC index range between 0 to 99. About 2170 sq. km. is in the moderately
vulnerable zone with a DRASTIC index ranging between 100 to 140, and about 4701 sq. km. area
is in the highly vulnerability zone with a DI ranging between 141 to 200. The classification
presented in Table 9 is based in range suggested by Ranjan et al., 2007. This concludes that 63%
of the Barind Tract Aquifer is at high risk in terms of GW pollution potential. These areas are
mainly in the Northeast, Southeast and Southwest region of the study area.
Table 9: Area under vulnerability to groundwater
DRASTIC Index Value Area (Sq. km.) Area (%) Vulnerable Zones
0-99 579 8 Low
100-140 2170 29 Moderate
141-200 4701 63 High
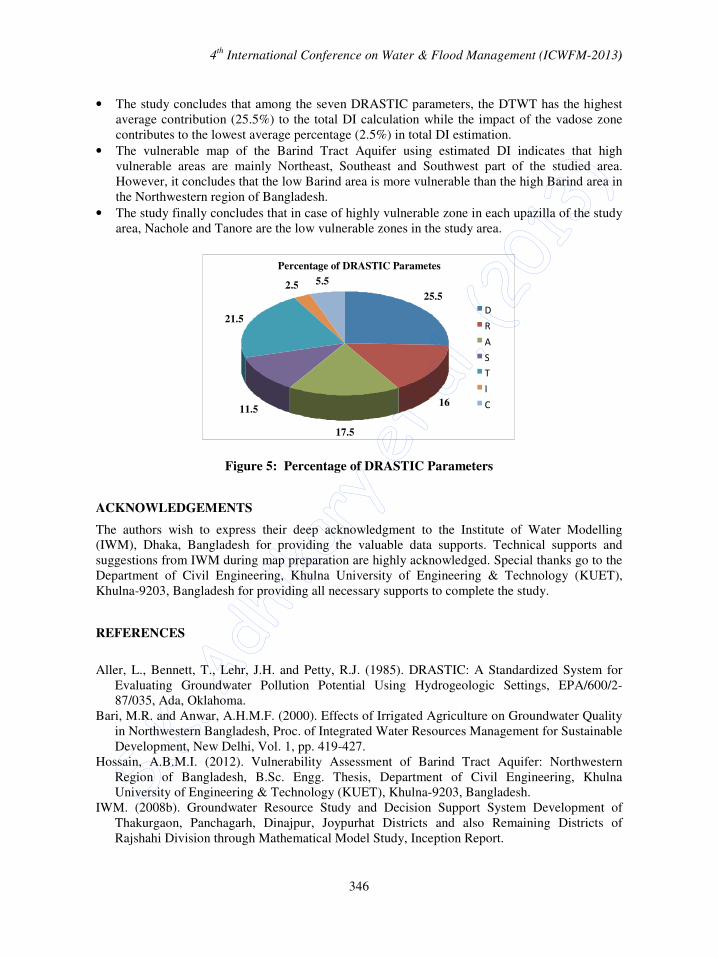
Figure 5 indicates the most significant parameter among the seven DRASTIC parameters, which
has maximum influence on the final DI estimation. It is observed that depth to water table
contributes the highest average percentage (25.5%) in total DI assessment. However, the impact
of the vadose zone contributes the lowest average percentage (2.5%) in total DI calculation. Out of
25 upazillas in the study area, the high vulnerable upazillas are identified as Atrai, Badalgachi,
Bagha, Bagmara, Charghat, Dhamoirhat, Durgapur, Mohanpur, Manda, Naogaon, Nawabganj
Sadar, Niamatpur, Paba, Puthia, Raninagar and Shibganj. Moreover, Bholahat, Godagari,
Gomastapur, Mahadevpur, Patnitala, Porsha and Sapahar are medium vulnerable and Nachole and
Tanore are identified as low vulnerable to potential pollution. As for the study area, a layer of clay
is making the aquifer confined. Depth to water table has the higher influence on total DI, the
impact of the vadose zone and hydraulic conductivity are quite neutral parameters, which hardly
affect vulnerability. In the study area, most of the upazilla (highly vulnerable) is found susceptible
to the DTWT except Nawabganj Sadar. Net recharge is the main difference for this upazilla.
5. CONCLUSIONS
Based on the present study, the following conclusions are drawn:
• The analysis demonstrates that the properties of the Barind Tract Aquifer are mainly
heterogeneous in nature. Its intrinsic characteristics along with unplanned human intervention
make it vulnerable to potential GW pollution.
• Estimated DRASTIC Index (DI) conclusively proves that the Barind Tract Aquifer in the
Northwest region of Bangladesh is highly vulnerable to potential GW pollution.
• The calculated DI values vary from 99 to 173, which indicate some parts of the studied aquifer
are highly vulnerable while the other parts are low vulnerable. The studied aquifer has been
divided into three categories, which identifies that 63% area is highly vulnerable, 29% area is
moderately vulnerable and the remaining 8% area is low vulnerable for potential GW
pollution.
4th
International Conference on Water & Flood Management (ICWFM-2013)
346
• The study concludes that among the seven DRASTIC parameters, the DTWT has the highest
average contribution (25.5%) to the total DI calculation while the impact of the vadose zone
contributes to the lowest average percentage (2.5%) in total DI estimation.
• The vulnerable map of the Barind Tract Aquifer using estimated DI indicates that high
vulnerable areas are mainly Northeast, Southeast and Southwest part of the studied area.
However, it concludes that the low Barind area is more vulnerable than the high Barind area in
the Northwestern region of Bangladesh.
• The study finally concludes that in case of highly vulnerable zone in each upazilla of the study
area, Nachole and Tanore are the low vulnerable zones in the study area.
Figure 5: Percentage of DRASTIC Parameters
ACKNOWLEDGEMENTS
The authors wish to express their deep acknowledgment to the Institute of Water Modelling
(IWM), Dhaka, Bangladesh for providing the valuable data supports. Technical supports and
suggestions from IWM during map preparation are highly acknowledged. Special thanks go to the
Department of Civil Engineering, Khulna University of Engineering & Technology (KUET),
Khulna-9203, Bangladesh for providing all necessary supports to complete the study.
REFERENCES
Aller, L., Bennett, T., Lehr, J.H. and Petty, R.J. (1985). DRASTIC: A Standardized System for
Evaluating Groundwater Pollution Potential Using Hydrogeologic Settings, EPA/600/2-
87/035, Ada, Oklahoma.
Bari, M.R. and Anwar, A.H.M.F. (2000). Effects of Irrigated Agriculture on Groundwater Quality
in Northwestern Bangladesh, Proc. of Integrated Water Resources Management for Sustainable
Development, New Delhi, Vol. 1, pp. 419-427.
Hossain, A.B.M.I. (2012). Vulnerability Assessment of Barind Tract Aquifer: Northwestern
Region of Bangladesh, B.Sc. Engg. Thesis, Department of Civil Engineering, Khulna
University of Engineering & Technology (KUET), Khulna-9203, Bangladesh.
IWM. (2008b). Groundwater Resource Study and Decision Support System Development of
Thakurgaon, Panchagarh, Dinajpur, Joypurhat Districts and also Remaining Districts of
Rajshahi Division through Mathematical Model Study, Inception Report.
Percentage of DRASTIC Parametes
25.5
16
17.5
11.5
21.5
2.5 5.5
D
R
A
S
T
I
C
4th
International Conference on Water & Flood Management (ICWFM-2013)
347
Margane, A. (2003). Management and Protection and Sustainable Use of Groundwater and Soil
Resources in the Arab Region, Guideline for Groundwater Vulnerability Mapping and Risk
Assessment for Susceptibility of Groundwater Resources to Contamination. Vol. 4. Project no.
1996.2189.7.
Phillips, C.R., Nathwani, J.S. and Mooij, H. (1977). Development of a Soil-waste Interaction
Matrix for Assessing Land Disposal of Industrial Wastes, Water Research, Vol. 11, pp 859-
868.
Prior, J. C., Boekhoff, J. L., Howes, M. R., Libra, R. D., and VanDorpe, P. E. (2003). Iowa’s
Groundwater Basics: A Geological Guide to the Occurrence, Use, and Vulnerability of Iowa’s
Aquifers. In Iowa Geological Survey Educational Series: Vol. 6, Iowa: Iowa Department of
Natural Resource Press. Available at:
‹http://www.igsb.uiowa.edu/Pubs/GWBASICS/default.htm (Accessed on May 20, 2012)
Ranjan, P., Das Gupta, A., Kazama, S. and Sawamoto, M. (2007). Assessment of Aquifer-Land
Use Composite Vulnerability in Walawe River Basin, Sri Lanka, Asian Journal of Water,
Environment and Pollution, Vol. 4(2), pp. 1-10.
Richert, S.E., Young, S.E. and Johnson, C. (1992). SEEPAGE: A GIS model for Groundwater
Pollution Potential, Paper No. 922592ASAE 1992 International Winter Meeting, Nashville,
Tennessee, pp 15-18.
Shahid, S. and Hazarika, M.K. (2007). Geographic Information System for the Evaluation of
Groundwater Pollution Vulnerability of the Northwestern Barind Tract of Bangladesh,
Environmental Research Journal, Vol. 1(1-4), pp. 27-34.
Silka, L.R. and Swearingen, T.L. (1978). A Manual for Evaluating Contaminant Potential of
Surface Impoundments, US Environmental Protection Agency, Office of Drinking Water,
Washington DC, EPA 570/9-78-003.