Embed Size (px)
Citation preview
R. Srinivasan
Who Gains from Abolishing the Common Entrance Test (CET) in Tamil Nadu
Reservation in Educational Institutions
No 3
Policy Watch
© The Hindu Centre for Politics & Public Policy, 2016
The Hindu Centre for Politics and Public Policy is an
independent platform for an exploration of ideas and
public policies. Our goal is to increase understanding
of the various aspects of the challenges today. As a
public policy resource, our aim is to help the public
increase its awareness of its political, social and
moral choices. The Hindu Centre believes that
informed citizens can exercise their democratic rights
better.
In accordance with this mission, The Hindu Centre’s
publications are intended to explain and highlight
issues and themes that are the subject of public
debate, and aid the public in making informed
judgments on issues of public importance.
All rights reserved.
without the written permission of the publisher.
Reservation in Educational Institutions:
Who Gains from Abolishing the Common Entrance Test (CET)
in Tamil Nadu
R. Srinivasan
Associate Professor of Econometrics University of Madras
ABSTRACT
t a time when the need for and the effectiveness of a Common Entrance Test
(CET) to professional colleges is debated across the country, The Hindu
Centre for Politics and Public Policy’s third Policy Watch looks at the working
of the professional college admissions system.
It studies the efficiency of the implementation of affirmative action policies in Tamil
Nadu’s professional education institutions to meet the underlying social justice
objectives by looking at the mechanism used to determine admissions to these courses.
This analysis points out that the abolition of the CET in Tamil Nadu has benefitted
students from the Other Communities and the Backward Classes more than those from
other socially deprived classes, such as the Most Backward Classes, and the Scheduled
Castes and Scheduled Tribes.
The solution to work out an efficient affirmative action policy, according to the author,
lies in reorienting both the school education system and the CET mechanism.
A
RESERVATION IN EDUCATIONAL INSTITUTIONS:
WHO GAINS FROM ABOLISHING THE COMMON ENTRANCE TEST (CET) IN TAMIL NADU
1
I. INTRODUCTION
amil Nadu has a history of communal reservation in higher education dating back to 1920s.
In addition to Scheduled Castes (SC) and Scheduled Tribes (ST), reservations are provided
for Most Backward Classes (MBC) and Backward Classes (BC). At present 69 per cent of
seats in higher education is reserved for these communities in Tamil Nadu. The remaining 31 per cent
of seats is called ‘Open Category’, for which students from the reserved communities can also
compete.
Apart from providing reservation of seats for students from the educationally and socially
backward/oppressed communities, the Tamil Nadu government has created community-specific
departments to implement schemes for promoting education in such communities. Such schemes
include exclusive schools for SCs, STs and Kallars (a subgroup of MBCs), and religious minorities like
Muslims. These departments also extend liberal scholarships and run hostels for the school and college
students.
In addition to these activities, in 2007 the Tamil Nadu government removed the CET for admission
in professional courses, the important reason being that students from the backward communities
could not spend on coaching classes that were essential to prepare for the CET. Removal of the CET
was largely seen as a step toward achieving social justice without compromising on quality of students
admitted in professional courses.
Changes in the admission procedures were seen as a discrimination against students of Higher
Secondary (H.Sc.) Boards other than the Tamil Nadu H.Sc. Board Schools affiliated to other H.Sc.
boards like Central Board of Secondary Examination (CBSE), Council for Indian School Certificate
Examination (CISCE) have students mainly from the non-backward classes and linguistic minorities
in the Tamil Nadu.
This Policy Watch report scrutinises the impact of the removal of the CET for admission in
professional courses on the enrolment and learning outcomes measured in terms of marks of students
in Science streams in Higher Secondary Schools affiliated to the Tamil Nadu H.Sc. Board. It examines
how social backwardness represented by the four categories of communities (BC, MBC, and SC and
ST) interacted with the types of schools and resulted in differing probabilities of the success of each
of these groups in getting admission in professional courses.
T
POLICY WATCH NO.3
II. CHANGES IN PROCEDURES FOR ADMISSION
IN PROFESSIONAL COURSES
ntil 1983-84, admission to professional courses was based on the H.Sc. marks and an
interview. The discretion of the interview board was eliminated with the introduction of a
CET since 1984-85. Those who applied for engineering courses had to take the CET in
Mathematics and Physical Sciences (Physics and Chemistry) and those who applied for medical and
other professional courses had to take the CET in Biology and Physical Sciences. The qualifying marks
for the admission were calculated as follows:
• For Engineering courses, the aggregate of Board exam marks in Mathematics, Physics and
Chemistry was reduced to a proportion of 200, and the CET marks was reduced to a proportion of
100. The sum of these two marks as a proportion of 300 marks was the final mark which was
considered for admission.
• For Medical and other Science-related professional courses, the aggregate of Board exam
marks of Biology, Physics and Chemistry was reduced to a proportion of 200 and the CET marks was
reduced to a proportion of 100 and the final marks was obtained as a summation of these two marks
as a proportion of 300 marks. For instance, if a student scored 175, 185, 190 marks in Biology, Physics
and Chemistry respectively in the H.Sc. examination and 75 marks out of 100 in the CET. The
aggregate of 550 out of 600 in the H.Sc. examination was reduced to 183.33 out of 200. 75 out of 100
in the CET was added with 183.33 out of 200 in the H.Sc. to get 258.33 out of 300 as the qualifying
marks for admission purpose.
Thus, two-third of the qualifying marks was based on the H.Sc. marks and one-third on CET mark.
Generally, students take the H.Sc. examination in the month of March and the CET in April. This
doubled the academic pressure on the students. Moreover, the CET was based on multiple-choice
questions and the H.Sc. examination was based on descriptive type questions. This gave rise to
proliferation of coaching centres in urban areas in Tamil Nadu. Many college teachers and H.Sc.
School teachers in Mathematics, Physical Sciences and Biology were running such coaching centres.
Schools concentrated on preparing the students for the H.Sc. examination and coaching centres
prepared them for the CET.
The difference in the examination patterns of these two exams was also debated from 1980s to early
2000sand the Government of Tamil Nadu tried to introduce multiple-choice questions in the H.Sc.
examination in 2004, but withdrew due to stiff opposition from political parties, which described the
move as pro-rich and pro-urban. The CET was also criticised as pro-rich and pro-urban by many
political parties, thus against the principle of social justice and rural students.
U
RESERVATION IN EDUCATIONAL INSTITUTIONS:
WHO GAINS FROM ABOLISHING THE COMMON ENTRANCE TEST (CET) IN TAMIL NADU
3
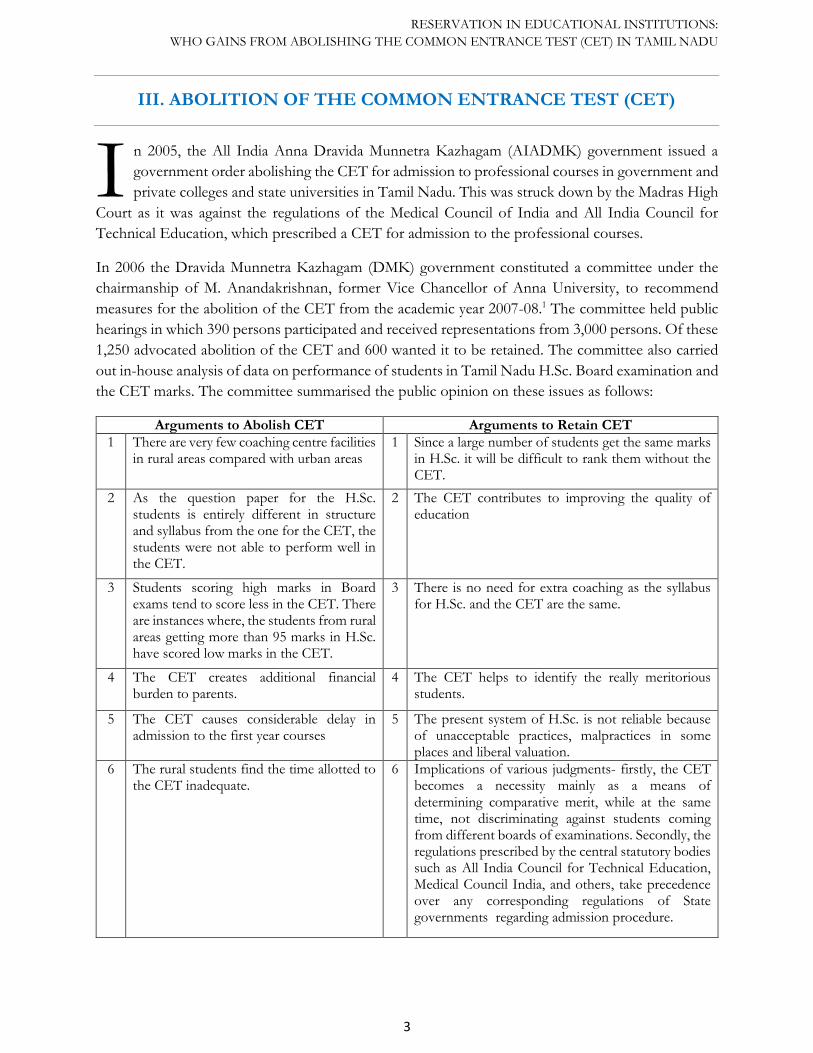
III. ABOLITION OF THE COMMON ENTRANCE TEST (CET)
n 2005, the All India Anna Dravida Munnetra Kazhagam (AIADMK) government issued a
government order abolishing the CET for admission to professional courses in government and
private colleges and state universities in Tamil Nadu. This was struck down by the Madras High
Court as it was against the regulations of the Medical Council of India and All India Council for
Technical Education, which prescribed a CET for admission to the professional courses.
In 2006 the Dravida Munnetra Kazhagam (DMK) government constituted a committee under the
chairmanship of M. Anandakrishnan, former Vice Chancellor of Anna University, to recommend
measures for the abolition of the CET from the academic year 2007-08.1 The committee held public
hearings in which 390 persons participated and received representations from 3,000 persons. Of these
1,250 advocated abolition of the CET and 600 wanted it to be retained. The committee also carried
out in-house analysis of data on performance of students in Tamil Nadu H.Sc. Board examination and
the CET marks. The committee summarised the public opinion on these issues as follows:
Arguments to Abolish CET Arguments to Retain CET
1 There are very few coaching centre facilities in rural areas compared with urban areas
1 Since a large number of students get the same marks in H.Sc. it will be difficult to rank them without the CET.
2 As the question paper for the H.Sc. students is entirely different in structure and syllabus from the one for the CET, the students were not able to perform well in the CET.
2 The CET contributes to improving the quality of education
3 Students scoring high marks in Board exams tend to score less in the CET. There are instances where, the students from rural areas getting more than 95 marks in H.Sc. have scored low marks in the CET.
3 There is no need for extra coaching as the syllabus for H.Sc. and the CET are the same.
4 The CET creates additional financial burden to parents.
4 The CET helps to identify the really meritorious students.
5 The CET causes considerable delay in admission to the first year courses
5 The present system of H.Sc. is not reliable because of unacceptable practices, malpractices in some places and liberal valuation.
6 The rural students find the time allotted to the CET inadequate.
6 Implications of various judgments- firstly, the CET becomes a necessity mainly as a means of determining comparative merit, while at the same time, not discriminating against students coming from different boards of examinations. Secondly, the regulations prescribed by the central statutory bodies such as All India Council for Technical Education, Medical Council India, and others, take precedence over any corresponding regulations of State governments regarding admission procedure.
I
POLICY WATCH NO.3
The Anandakrishnan Committee while accepting the arguments of those who supported the abolition
of the CET, also tried to address one of the issues raised by those who wanted it to be retained. It
accepted the argument that marks of students from different H.Sc. Boards were not comparable and,
hence, could not be ranked as such. To overcome this problem, the Anandakrishnan Committee
recommended a proposal to provide for ‘normalisation’ to bring the marks of students from various
boards on a comparable metric system, it passively rejected all other arguments favouring the retention
of CET.
Prima facie, the Anandakrishnan Committee did not offer evidence to prove the claim that the CET
bears an urban-rich bias. However, in a document that the Committee’s chairman, Anandakrishnan,
submitted to the ‘oversight committee on the implementation of reservation policy in higher
educational institutions’ in 2006,2 he argued that the CET in Tamil Nadu was biased against the poor,
rural and educationally depressed communities like BC, MBC and SC&ST.
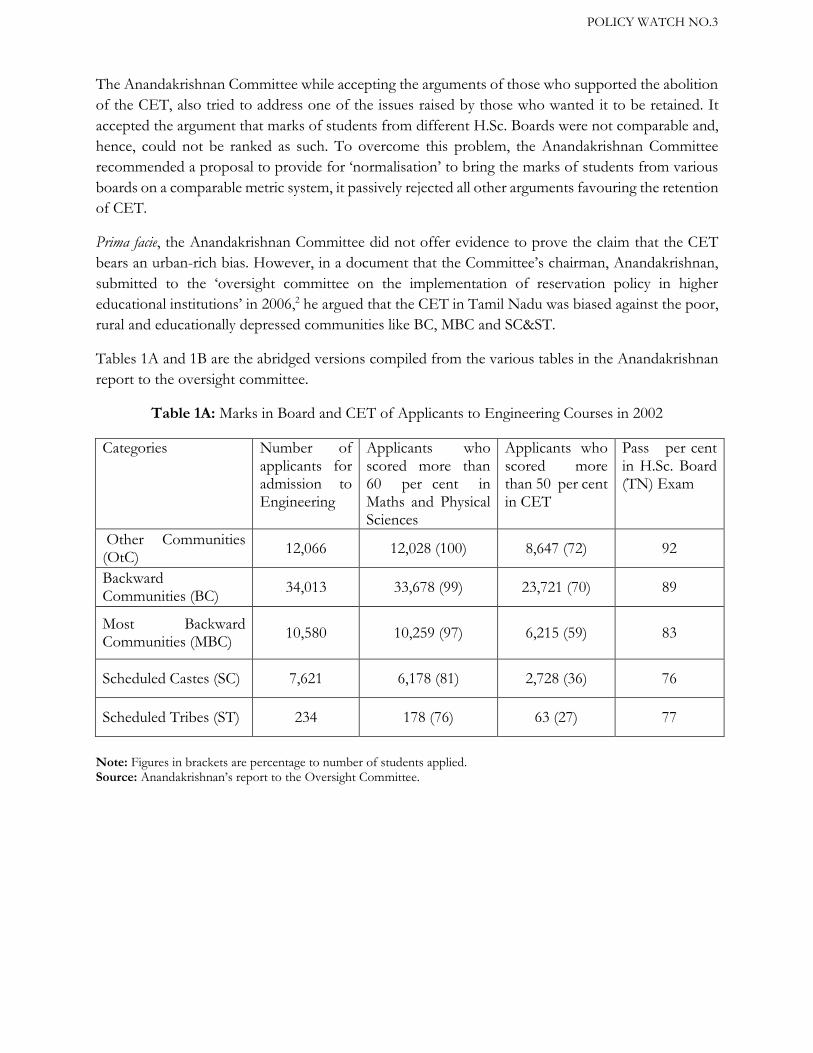
Tables 1A and 1B are the abridged versions compiled from the various tables in the Anandakrishnan
report to the oversight committee.
Table 1A: Marks in Board and CET of Applicants to Engineering Courses in 2002
Note: Figures in brackets are percentage to number of students applied. Source: Anandakrishnan’s report to the Oversight Committee.
Categories Number of applicants for admission to Engineering
Applicants who scored more than 60 per cent in Maths and Physical Sciences
Applicants who scored more than 50 per cent in CET
Pass per cent in H.Sc. Board (TN) Exam
Other Communities (OtC)
12,066 12,028 (100) 8,647 (72) 92
Backward Communities (BC)
34,013 33,678 (99) 23,721 (70) 89
Most Backward Communities (MBC)
10,580 10,259 (97) 6,215 (59) 83
Scheduled Castes (SC) 7,621 6,178 (81) 2,728 (36) 76
Scheduled Tribes (ST) 234 178 (76) 63 (27) 77
RESERVATION IN EDUCATIONAL INSTITUTIONS:
WHO GAINS FROM ABOLISHING THE COMMON ENTRANCE TEST (CET) IN TAMIL NADU
5
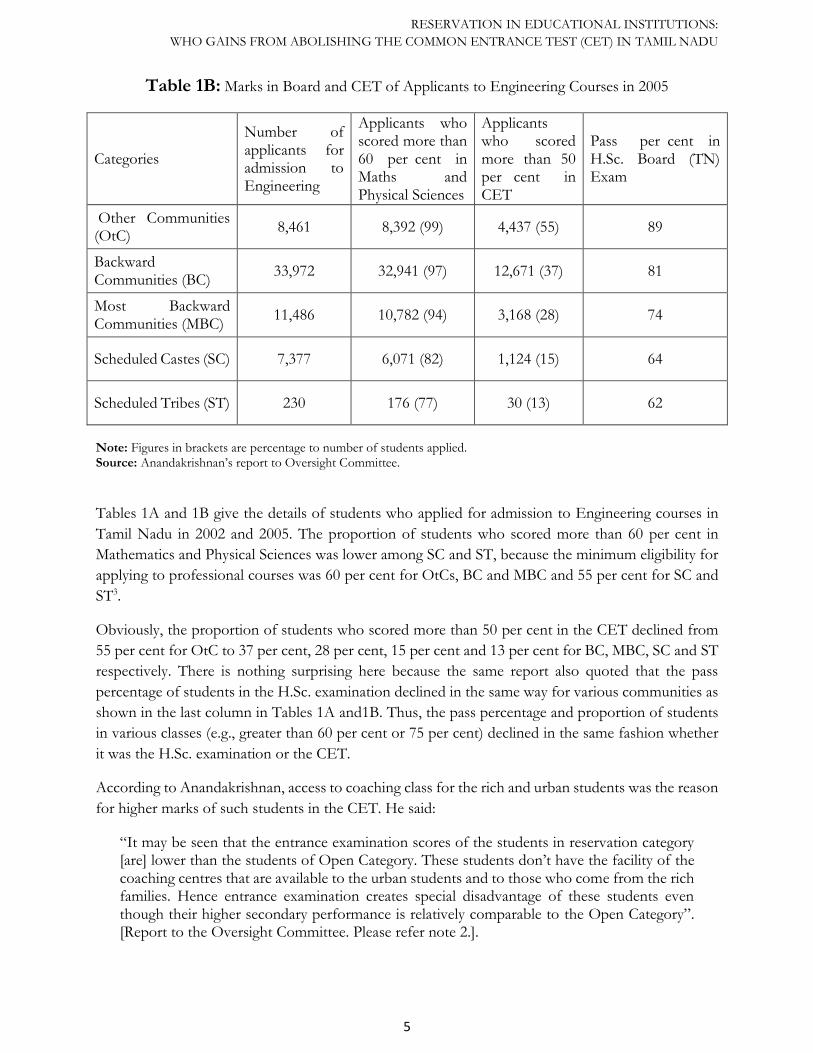
Table 1B: Marks in Board and CET of Applicants to Engineering Courses in 2005
Categories
Number of applicants for admission to Engineering
Applicants who scored more than 60 per cent in Maths and Physical Sciences
Applicants who scored more than 50 per cent in CET
Pass per cent in H.Sc. Board (TN) Exam
Other Communities (OtC)
8,461 8,392 (99) 4,437 (55) 89
Backward Communities (BC)
33,972 32,941 (97) 12,671 (37) 81
Most Backward Communities (MBC)
11,486 10,782 (94) 3,168 (28) 74
Scheduled Castes (SC) 7,377 6,071 (82) 1,124 (15) 64
Scheduled Tribes (ST) 230 176 (77) 30 (13) 62
Note: Figures in brackets are percentage to number of students applied. Source: Anandakrishnan’s report to Oversight Committee.
Tables 1A and 1B give the details of students who applied for admission to Engineering courses in
Tamil Nadu in 2002 and 2005. The proportion of students who scored more than 60 per cent in
Mathematics and Physical Sciences was lower among SC and ST, because the minimum eligibility for
applying to professional courses was 60 per cent for OtCs, BC and MBC and 55 per cent for SC and
ST3.
Obviously, the proportion of students who scored more than 50 per cent in the CET declined from
55 per cent for OtC to 37 per cent, 28 per cent, 15 per cent and 13 per cent for BC, MBC, SC and ST
respectively. There is nothing surprising here because the same report also quoted that the pass
percentage of students in the H.Sc. examination declined in the same way for various communities as
shown in the last column in Tables 1A and1B. Thus, the pass percentage and proportion of students
in various classes (e.g., greater than 60 per cent or 75 per cent) declined in the same fashion whether
it was the H.Sc. examination or the CET.
According to Anandakrishnan, access to coaching class for the rich and urban students was the reason
for higher marks of such students in the CET. He said:
“It may be seen that the entrance examination scores of the students in reservation category [are] lower than the students of Open Category. These students don’t have the facility of the coaching centres that are available to the urban students and to those who come from the rich families. Hence entrance examination creates special disadvantage of these students even though their higher secondary performance is relatively comparable to the Open Category”. [Report to the Oversight Committee. Please refer note 2.].
POLICY WATCH NO.3
This opinion would have probably formed the basis for his recommendation to remove the CET as a
criterion for admission to professional courses in Tamil Nadu.
Anandakrishnan made two assertions in this section – one, the coaching classes were accessible to the
urban and rich students and two, the students from the reserved categories did not have access to
such coaching classes. He implied thereby, that the majority of the students of BC, MBC, SC and ST
communities ought to be either poor and/or from rural areas. This point would have been proven
had there been statistical evidence presented to show that the rural students’ performance in the H.Sc.
examination was on a par with those of the urban students and only the CET marks made all the
difference in the entrance for professional courses. It was, however, only backed by an unsubstantiated
claim that coaching classes were accessible only to the students of urban-rich class.
The Anandakrishnan Committee observed:
“[The] CET is being adopted as the only [emphasis original] method for bringing the students of State Board and other boards, following syllabus and different examinations into a comparable score. The CET however is not necessarily a fool-proof method of ensuring a complete parity of standards. If the CET is closer to following a particular board syllabus, the other board students are likely to be at a disadvantage. Moreover, the CET as such causes substantial disadvantage to the rural, Tamil medium and under-privileged students, while the urban, English medium and socially forward sections of students stand to benefit.”
The fact was, for admission in professional courses, only one-third of the qualifying marks was derived
from the CET and the H.Sc. marks decided the remaining two-thirds of the qualifying marks.
Therefore, the H.Sc. marks, in spite of differences in syllabi and methods of evaluation between H.Sc.
Boards, have directly influenced two-thirds of the qualifying marks. In such a situation the CET was
essential to offset such biases, as it was designed to treat everyone equally.
Further, access to coaching classes is similar to access to quality school education. Time and again,
marks in the H.Sc. examinations in different States, including Tamil Nadu, show significant differences
in terms of social groups and type of school even within a H.Sc. Board.
For example, students from economically and socially advanced families who study in urban-private
schools have generally secured more marks compared with other students from the same H.Sc. Board.
Therefore, access to quality education has been a problem for the socially and educationally depressed
communities that adversely affected their performances in both the H.Sc. examination and the CET.
Therefore, removing the CET in no way will correct the social, educational and economic bias in
favour of the rich and urban students, as they would continue to get the access to quality education
for success in the H.Sc. examinations.
Another reason against the use of the CET was the difference in the syllabi and examination patterns
between the H.Sc. examination and the CET. The Anandakrishnan Committee should have probed
this issue further. The syllabi and the types of questions that measure different scholastic abilities of
students should be subjected to thorough scrutiny by educationists. Merely removing the CET and
RESERVATION IN EDUCATIONAL INSTITUTIONS:
WHO GAINS FROM ABOLISHING THE COMMON ENTRANCE TEST (CET) IN TAMIL NADU
7
unqualified acceptance of the H.Sc. marks are totally unscientific recommendations. However, the
Anandakrishnan Committee recommended a normalisation process for comparing marks of students
from different Boards.
POLICY WATCH NO.3
IV. NORMALISATION OF MARKS FROM DIFFERENT H.Sc. BOARDS
he Anandakrishnan Committee considered the normalisation process used in Graduate
Aptitude Test in Engineering (GATE) and rejected it. The normalisation process used by
GATE required average marks, qualifying marks, average of top 0.1 per cent of students and
standard deviation of marks in every subject. As the database of marks in all the subjects in every H.Sc.
Board might not be available on time, the committee rejected this normalisation process, and
recommended another method which was accepted by the Government of Tamil Nadu.
Under the new method, the highest marks obtained in every subject in every H.Sc. Board is equated
to the highest marks in Tamil Nadu H.Sc. Board, and the ratio of these two marks will be multiplied
by the individual student’s marks to obtain the normalised marks. The illustration in the report is given
below:
If the highest marks secured by the topper of the Tamil Nadu H.Sc. Board in Physics is 100 and the highest marks secured by the topper of the CBSE Board in the same subject is 90, both the highest marks will be considered to be equal to 100. If a student of the CBSE Board secures 60 marks in Physics, the 60 marks will be considered to be equal to 66.66 marks, that is, (100/90)X60=66.66.
This normalisation process assumes that the differences in syllabi, examination pattern, and evaluation
standards are all reflected only in the highest marks in the H.Sc.. Board examination. However, it is
too simplistic to assume that the difference between the highest marks in a subject in two Boards will
capture all the differences in the syllabi, standards of examination and evaluation. It is the norm that
the topper in any class is an exception (a statistical outlier). Rather, the better way to capture the
differences in the academic standards between Boards is through using average and the pattern of
distribution of marks as is done in GATE, which is an established entrance test for admission in post-
graduate courses in engineering across the country. This could have been a better method than an ad
hoc and unscientific metric system to offset the non-availability of required data.
Moreover, one is not certain about the non-availability of such statistics from all the Boards.
Nowadays, every Board issues computerised mark-sheets to the thousands of students who appear
for the H.Sc.. examinations. Moreover, the selection committee for selecting students for admission
in professional courses in Tamil Nadu obtains the highest mark in each subject from every other
Board to normalise the school marks in each subject from the competent authorities. Obtaining
comparative statistics is only a click away. Therefore, the GATE formula for normalisation should
have been considered as a realistic option compared with the current one.
T
RESERVATION IN EDUCATIONAL INSTITUTIONS:
WHO GAINS FROM ABOLISHING THE COMMON ENTRANCE TEST (CET) IN TAMIL NADU
9
V. IMPLICATIONS FOR EDUCATION AND SOCIAL JUSTICE
he removal of the CET as one of the qualifying exams for admission to professional courses
in Tamil Nadu through the promulgation of Tamil Nadu Admission in Professional
Educational Institution Act, 2006, has left the H.Sc. examination marks as the only criterion
for such admission.
If the poor and rural students do not have access to coaching classes for the preparation of the CET,
they (who are mainly from MBC, SC and ST communities) would also be similarly disadvantaged in
respect of access to good schooling. But the fallout of the recommendation to do away with the CET,
and its institutionalisation, has led to undesirable consequences in the course of time over the last
eight to nine years. The major among such outcomes is the introduction of examination reforms that
was biased against proper teaching and learning and its substitution with rote memorisation and
coaching to answer questions in well-defined patterns. This means that students and teachers spend
little time on the teaching and learning processes and concentrate exclusively on memorising the
textbooks.
The introduction of a blueprint and a key for evaluation of answer scripts in H.Sc. by the Tamil Nadu
H.Sc. Board are measures towards evaluating the memory of students rather than testing the
understanding and interpretative abilities of students. The blueprint gives the distribution of questions
across chapters, which helps students prepare different types of questions through a process of
permutation and combination and make reasonable guesses of likely questions from each chapter for
the examination.
Moreover, every year the Tamil Nadu H.Sc. Board prepares the key for each question paper, that is,
the exact answers expected from students for each question. A collection of question papers and keys
over a period of time will aid a well-informed guess of the question paper. This has gradually reduced
the H.Sc. Board examination in Tamil Nadu to a system of measuring the ability of students to
memorise text books.
Consequently, students, schools and teachers have been concentrating on improving the scores in the
H.Sc. examinations. As described earlier, the use of blue-print and keys has helped this effort. A
comparison of marks of students who appeared for the Tamil Nadu H.Sc.. Board examinations in
2007and 2014 clearly illustrates this trend.
Marks of students who appeared in Science and Mathematics streams that make them eligible for
admission to professional courses have been taken for this analysis. The analysis considered only the
marks from 3 or 4 subjects in Mathematics and sciences that are considered for admission in
professional courses, excluding the marks obtained in English and Languages.
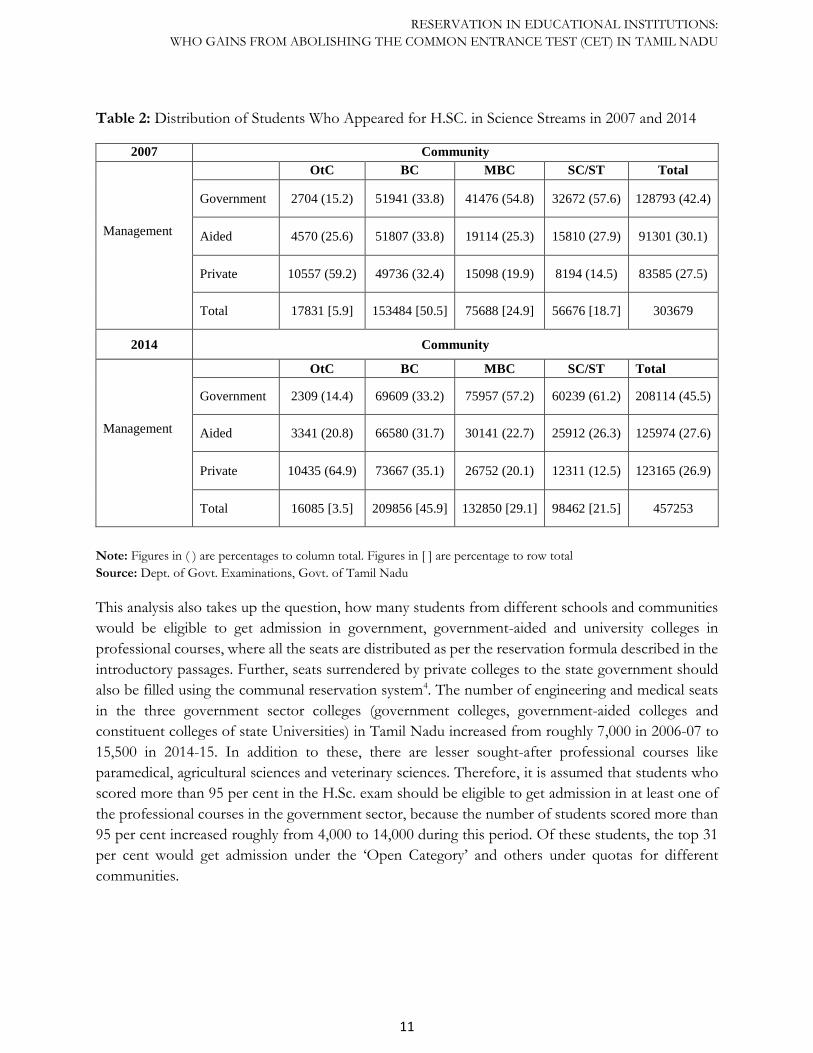
Table 2 gives the distribution of students in science and Mathematics streams in 2007 and 2014. The
total number of students increased nearly 50 per cent from 3.04 lakh in 2007 to 4.57 lakh in 2014. The
distribution of students by type of management of schools shows that the increase in students in
T
POLICY WATCH NO.3
government schools was the highest at 62 per cent and followed by 47 per cent and 38 per cent in
private and aided schools, respectively. In the last 10 years, the government has been upgrading most
of the schools to higher levels, subject to higher enrolment in the lower classes. It is also a fact that
the drop-out ratios have declined, facilitating higher enrolment in high school and higher secondary
school.
The absolute number of students in BC, MBC, and SC and ST communities increased and on the
contrary the number of students from OtC declined, resulting in the proportion of OtC students
declining from 5.9 per cent in 2007 to 3.5 per cent in 2014. Though the number of students from the
BC category increased by nearly 56,000, their proportion declined from 50.5 per cent to 45.9 per cent.
The proportion of students from MBC, and SC and ST increased from 24.9 per cent to 29.1 per cent
and 18.7 per cent to 21.5 per cent respectively.
The decline in the proportions of students from OtC and BC categories show that the students form
these categories are increasingly moving to other boards such as CBSC, ICSE and international boards.
Within each community, the proportion of students in private schools has increased except for SC
and ST. The increase in the proportion of private school students was the highest for OtC, followed
BC, MBC, and SC and ST. More than 2/3rd of OtC students and 1/3rd of the BC students are in private
schools compared with only 1/5th of MBC and 1/12th of SC and ST students in private schools. This
increases the probability of OtC and BC students getting admission in the ‘Open Category’ compared
with other categories because generally the students from private schools score more than the students
from government-aided and government schools.
On the whole, the likelihood of BC students getting a disproportionately larger share of the seats in
professional courses is high. This trend calls into question the working of the reservation system and
the functioning of the schools system.
Under an ideal system of reservation, students from BC, MBC, SC and ST ought to get their shares in
the respective quotas, with or without the CET. However, the removal of the CET has increased the
chances of students from BCs to get a larger share in the Open Category, though the same is not the
case for students from MBCs, and SCs, and STs.
RESERVATION IN EDUCATIONAL INSTITUTIONS:
WHO GAINS FROM ABOLISHING THE COMMON ENTRANCE TEST (CET) IN TAMIL NADU
11
Table 2: Distribution of Students Who Appeared for H.SC. in Science Streams in 2007 and 2014
2007 Community
Management
OtC BC MBC SC/ST Total
Government 2704 (15.2) 51941 (33.8) 41476 (54.8) 32672 (57.6) 128793 (42.4)
Aided 4570 (25.6) 51807 (33.8) 19114 (25.3) 15810 (27.9) 91301 (30.1)
Private 10557 (59.2) 49736 (32.4) 15098 (19.9) 8194 (14.5) 83585 (27.5)
Total 17831 [5.9] 153484 [50.5] 75688 [24.9] 56676 [18.7] 303679
2014 Community
Management
OtC BC MBC SC/ST Total
Government 2309 (14.4) 69609 (33.2) 75957 (57.2) 60239 (61.2) 208114 (45.5)
Aided 3341 (20.8) 66580 (31.7) 30141 (22.7) 25912 (26.3) 125974 (27.6)
Private 10435 (64.9) 73667 (35.1) 26752 (20.1) 12311 (12.5) 123165 (26.9)
Total 16085 [3.5] 209856 [45.9] 132850 [29.1] 98462 [21.5] 457253
Note: Figures in ( ) are percentages to column total. Figures in [ ] are percentage to row total
Source: Dept. of Govt. Examinations, Govt. of Tamil Nadu
This analysis also takes up the question, how many students from different schools and communities
would be eligible to get admission in government, government-aided and university colleges in
professional courses, where all the seats are distributed as per the reservation formula described in the
introductory passages. Further, seats surrendered by private colleges to the state government should
also be filled using the communal reservation system4. The number of engineering and medical seats
in the three government sector colleges (government colleges, government-aided colleges and
constituent colleges of state Universities) in Tamil Nadu increased from roughly 7,000 in 2006-07 to
15,500 in 2014-15. In addition to these, there are lesser sought-after professional courses like
paramedical, agricultural sciences and veterinary sciences. Therefore, it is assumed that students who
scored more than 95 per cent in the H.Sc. exam should be eligible to get admission in at least one of
the professional courses in the government sector, because the number of students scored more than
95 per cent increased roughly from 4,000 to 14,000 during this period. Of these students, the top 31
per cent would get admission under the ‘Open Category’ and others under quotas for different
communities.
POLICY WATCH NO.3
Table 3: Distribution of Students in H.Sc. in Science Streams in 2007 and 2014
Particulars
2007 2014
Total Appeared
Total Passed
“>95 per cent”
“Top 31 per cent”
Total Appeared
Total Passed
“>95 per cent”
“Top 31 per cent”
OtC
Total 17,831 16,095 820 259 16,085 15,630 1,631 597
Increase over 2007 -1746 -465 811 338
Proportion to total increase
-1.1 -0.3 8.2 11.1
BC
Total 1,53,484 1,32,011 2,496 779 2,09,856 2,01,127 9,225 2,928
Increase over 2007 56,372 69,116 6,729 2,149
Proportion to total increase
36.7 38.3 68.2 70.3
MB
C
Total 75,688 59,279 496 146 1,32,850 1,23,464 2,337 614
Increase over 2007 57,162 64,185 1,841 468
Proportion to total increase
37.2 35.6 18.7 15.3
SC
and
ST
Total 56,676 39,158 137 40 98,462 86,812 624 144
Increase over 2007 41,786 47,674 487 104
Proportion to total increase
27.2 26.4 4.9 3.4
Go
vt.
Sch
oo
ls
Total 1,28,793 89,672 145 38 2,08,114 1,85,493 893 128
Increase over 2007 79,321 95,821 748 90
Proportion to total increase
51.7 53.0 7.6 2.9
Aid
ed
Sch
oo
ls
Total 91,301 80,187 687 172 1,25,974 1,21,080 2,659 614
Increase over 2007 34,673 40,893 1,972 442
Proportion to total increase
22.6 22.7 20.0 14.5
Pri
vat
e
Sch
oo
ls Total 83,585 76,684 3,117 1,014 1,23,165 1,20,460 10,265 3,541
Increase over 2007 39,580 43,776 7,148 2,527 Proportion to total increase
25.8 24.3 72.4 82.6
Gra
nd
To
tal
Total 3,03,679 2,46,543 3,949 1,224 4,57,253 4,27,033 13,817 4,283
Increase over 2007 1,53,574 1,80,490 9868 3059
Proportion to total increase
100 100 100 100
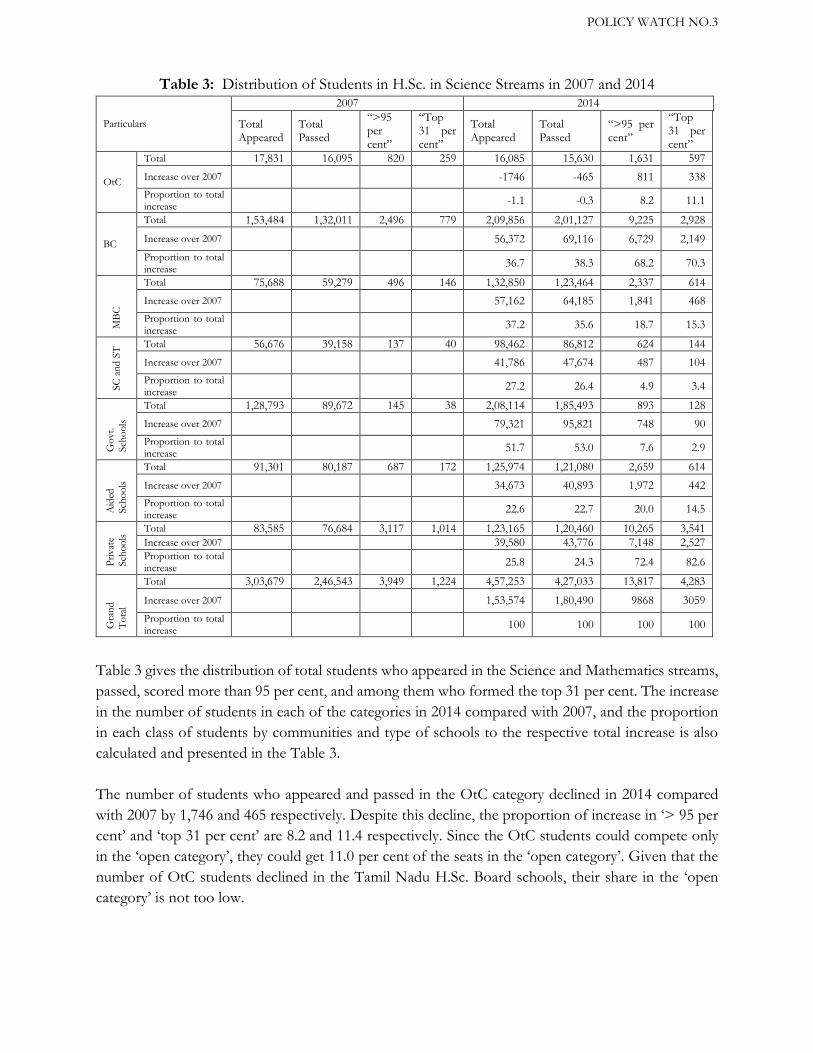
Table 3 gives the distribution of total students who appeared in the Science and Mathematics streams,
passed, scored more than 95 per cent, and among them who formed the top 31 per cent. The increase
in the number of students in each of the categories in 2014 compared with 2007, and the proportion
in each class of students by communities and type of schools to the respective total increase is also
calculated and presented in the Table 3.
The number of students who appeared and passed in the OtC category declined in 2014 compared
with 2007 by 1,746 and 465 respectively. Despite this decline, the proportion of increase in ‘> 95 per
cent’ and ‘top 31 per cent’ are 8.2 and 11.4 respectively. Since the OtC students could compete only
in the ‘open category’, they could get 11.0 per cent of the seats in the ‘open category’. Given that the
number of OtC students declined in the Tamil Nadu H.Sc. Board schools, their share in the ‘open
category’ is not too low.
RESERVATION IN EDUCATIONAL INSTITUTIONS:
WHO GAINS FROM ABOLISHING THE COMMON ENTRANCE TEST (CET) IN TAMIL NADU
13
For the BC category, compared with 2007, the number students in 2014 increased by 56,372 that is
36.7 per cent of the total increase of 1,53,574. A similar 38.3 per cent increase was found for the BC
students in the ‘pass’ category. In the ‘>95 per cent’ category, the share of BC students in the total
increase was 68.2 per cent and in the ‘top 31 per cent’ their share was 70.3 per cent. This means that
nearly 70.3 per cent of the seats in the ‘open category’ would go to BC students. This is in addition to
30 per cent quota for the BC students. Thus, the removal of the CET has clearly benefited the BC
students. The combined share of OtC and BC students in the ‘top 31 per cent’ was 81.4 per cent
leaving only 18.6 per cent for the MBC, SC and ST students in the open category. Between MBC, and
SC and ST, the increase in ‘top 31 per cent’ was divided into 15.3 per cent and 3.4 per cent respectively.
This further reiterates the relative educational backwardness of SC and ST compared with all others.
This clearly exhibits the educational backwardness of the students from MBC, SC and ST communities
and their inability to compete in the open competition. However, one cannot make such a categorical
statement about the BC students.
Earlier, it was shown that higher proportions of students in the OtC and BC communities were
enrolled in private schools compared to the students in other educationally and socially depressed
communities. If a comparison of schools by type of management, then the private schools have larger
proportion of students in both ‘> 95 per cent’ and ‘top 31 per cent’ categories. Though the private
schools accounted for 25.8 per cent of the increase in total students who appeared in 2014 compared
with 2007, their shares in the two categories were 72.6 per cent and 82.6 per cent, respectively. Thus,
the community and type of school combine determined the relatively larger presence of the students
from the OtC and BC in both ‘> 95 per cent’ and ‘top 31 per cent’ categories. The removal of the
CET has not enhanced the chances of the students from MBC, SC and ST communities to get a larger
share in the ‘open category’. They would nevertheless get their share in their respective communities’
quotas with or without the CET. Thus the removal CET has not served the perceived social justice
objective of enlarging choice of the students from the most socially and educationally depressed
communities.
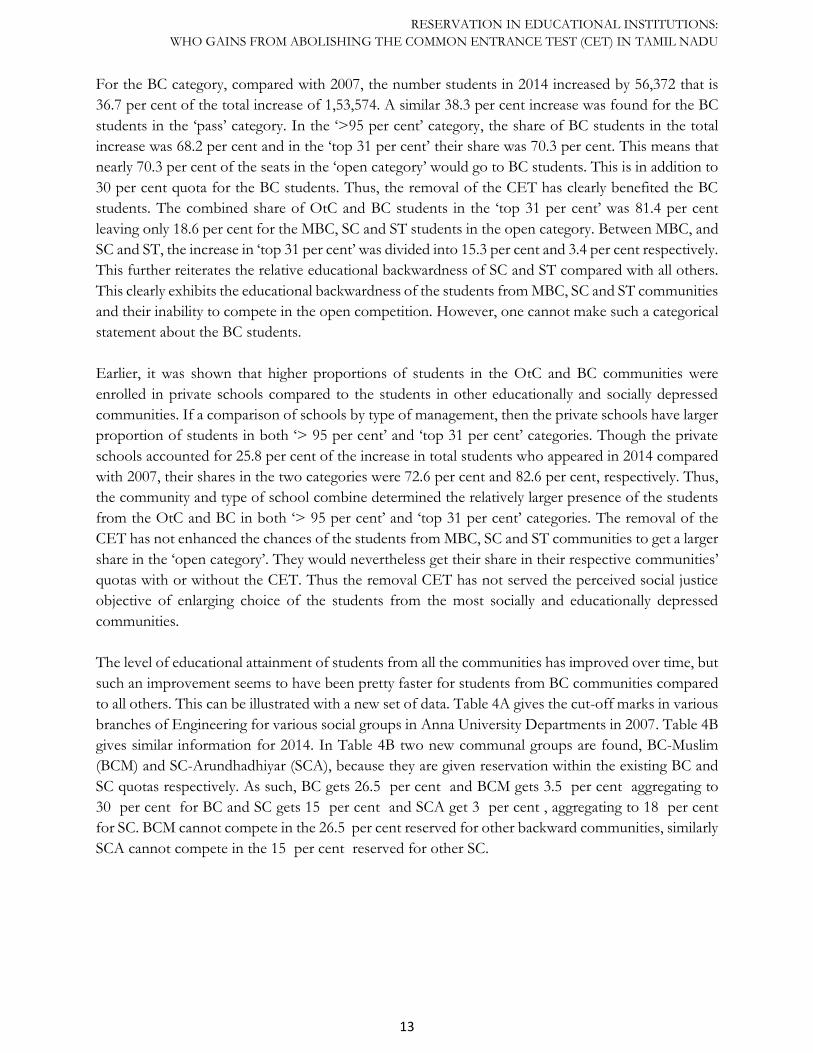
The level of educational attainment of students from all the communities has improved over time, but
such an improvement seems to have been pretty faster for students from BC communities compared
to all others. This can be illustrated with a new set of data. Table 4A gives the cut-off marks in various
branches of Engineering for various social groups in Anna University Departments in 2007. Table 4B
gives similar information for 2014. In Table 4B two new communal groups are found, BC-Muslim
(BCM) and SC-Arundhadhiyar (SCA), because they are given reservation within the existing BC and
SC quotas respectively. As such, BC gets 26.5 per cent and BCM gets 3.5 per cent aggregating to
30 per cent for BC and SC gets 15 per cent and SCA get 3 per cent , aggregating to 18 per cent
for SC. BCM cannot compete in the 26.5 per cent reserved for other backward communities, similarly
SCA cannot compete in the 15 per cent reserved for other SC.
POLICY WATCH NO.3
Table4A: Cut-off Marks for Courses in Anna University Departments-2007
Branch Open cat BC MBC SC ST
Agriculture & Irrigation Engineering 184.25 182.25 177.5 166.25 0
Bio Medical Engineering
Civil Engineering 196 195.25 192.75 184 173.75
Computer Science & Engineering (CSE) 199.5 199 198 194.5 189
Computer Science & Engineering (CSE, self-supporting) 199 198.75 197.5 189.5 0
Electrical & Electronics Engineering 198.25 197.75 195.75 190 188.75
Electronics & Communication Engineering 199.75 199.5 198.5 195.25 0
Electronics & Communication Engineering (self-supporting) 199.25 199.25 197.75 192.25 191
Geoinformatics 195 194 190 179 0
Industrial Engineering 195 194 189 181.75 170.5
Information Technology 198.5 198 196 189 184
Manufacturing Engineering 195.5 194.25 190 180.5 174.5
Materials Science & Engineering 193.5 192.5 186 172 0
Mechanical Engineering 197.5 196.75 194.5 187.75 176.25
Mining Engineering 189.75 187.5 187.25 175 0
Printing Technology 192.25 190.25 187 174.5 0
Source: Colleges in Tamil Nadu Last accessed: April 26, 2016
Table 4B: Cut-off Marks for Courses in Anna University Departments – 2014
Branch Open
cat BC BCM MBC SC ST SCA
Agriculture & Irrigation Engineering 196.5 195.75 194 194 187 176.75 175.25
Bio Medical Engineering 198.25 197.75 197.5 195.75 190.75 184.25 186.5
Civil Engineering 199.5 199.25 199 198.5 196.75 188.25 195.75
Computer Science & Engineering (CSE) 200 199.75 199.5 199.25 196 186.25 194.33
Computer Science & Engineering (CSE, self-supporting) 199.5 199.25 199 197.75 192.5 185.25 191
Electrical & Electronics Engineering 199.75 199.5 199.25 199 196.75 197.75 194.25
Electronics & Communication Engineering 200 199.75 199.25 199.25 197.75 193.75 197
Electronics & Communication Engineering (self-supporting)
199.5 199.25 199 198.5 195.25 186.25 191.5
Geoinformatics 197.75 197.25 195.5 195.5 190.5 0 178.75
Industrial Engineering 197.5 197.25 196.25 195.25 187.5 0 174.25
Information Technology 199 198.75 198 196.75 189.5 181.5 180.25
Manufacturing Engineering 198.25 197.5 198.25 196 189.5 0 181.5
Materials Science & Engineering 197 196.75 195.25 194.75 183.5 0 169.75
Mechanical Engineering 199.75 199.75 199.5 199.25 198 187.25 197.5
Mining Engineering 198 197.5 195.25 195.5 189 0 189.75
Printing Technology 195.5 194.75 193.75 193 184.75 156 179
Source: Colleges in Tamil Nadu Last accessed: April 26, 2016
RESERVATION IN EDUCATIONAL INSTITUTIONS:
WHO GAINS FROM ABOLISHING THE COMMON ENTRANCE TEST (CET) IN TAMIL NADU
15
It is evident from Tables 4A and 4B that not only have the cut-off marks for various courses increased
over the seven-year period, but also the difference in cut-off marks between communities have
declined sharply. The CSE can be considered as an illustration. The cut-off for open category increased
from 199.5 to 200, that is, 31 per cent of the seats in this branch of engineering was filled with students
who scored centum in all the Science and Mathematics papers in 2014. The difference in cut-off marks
between open category and BC was 0.5 in 2007 and 0.25 in 2014. Similarly, such differences between
BC and MBC in the two years were 1.0 and 0.5 respectively. However, the differences were higher
between MBC and SC – 3.5 in 2007 and 3.25 in 2014.
POLICY WATCH NO.3
VI. TIME FOR REVIEW
he substantial differences in cut-off marks between the BC, MBC, and SC and ST show the
economic and educational differences between these communities, and that the differences
are declining, implying the narrowing educational gap. The small gap of 0.25 in the cut-off
marks between OtC and BC may be wiped out in the near future. Such narrowing gaps in the cut-off
marks for various streams of professional courses and institutions between BC and OtC underline the
need for a relook at the reservation for BC as a whole.
If BC is not a heterogeneous group, then it is quite likely that a few of the sub-castes in BC is getting
the benefits of reservation. If one were to assume that the BCs constitute a homogenous group then,
given the narrowing gap with OtC, it may not need reservation in future. Either way, we need to revisit
the reservation for BC so also for other communal groups with greater attention to intra-group
differences in terms of social and educational backwardness.
The following major points that emerge from this analysis:
A. The rationale to remove the CET is flawed and the system of normalisation of marks between
different Boards of H.Sc. exams is unscientific. The CET does not have a social justice objective.
It is a system to create a level-playing field for students from different boards to compete for
admission in professional courses. The onus of creating social justice should rest on the school
system by reorienting it to remove the relative educational backwardness of certain communities.
B. When nearly 14,000 students are within the top 5 per cent of marks in the Tamil Nadu Board of
H.Sc. examination, it could be concluded that either the educational standards have increased
uniformly across such schools and that thousands of students could earn the same marks, or that
the educational system has failed to differentiate the high achievers from the rest.
C. In the absence of the CET and using only the H.Sc. exam marks, the increasing cut-off marks for
all the courses show that it is easier for most of the students in successive years to skilfully increase
the score through the use of blue-print and keys as already explained in this analysis.
D. The narrowing difference in cut-off marks shows that the educational distance between the various
groups is declining, which could be perhaps interpreted as the need to revisit the reservation
system and possibly to remove some sub-castes from each group.
E. Alternatively, the narrowing difference in cut-off marks exposes the inadequacy of the existing
examination pattern to bring out the real differences in the educational attainment of students
from different communities.
F. The reservation system in any form will discriminate against the students of ‘Other Communities’
and hence their numbers in the State government’s educational system will decline over time. In
addition to reservation system that is in practice, the removal of the CET, combined with the ‘blue
print aided and key based’ evaluation system of the Tamil Nadu H.Sc. Board Exam, have hastened
this process further, which needs some deep thinking.
T
RESERVATION IN EDUCATIONAL INSTITUTIONS:
WHO GAINS FROM ABOLISHING THE COMMON ENTRANCE TEST (CET) IN TAMIL NADU
17
Notes:
1Dr. M. Anandakrishnan’s report was not made public. What follows is based on the gist of the report provided in the judgement of Madras High Court in S. Aswin Kumar vs. State of Tamil Nadu (2007) challenging the law that removed CET for admission in professional courses. 2Dr. M. Anandakrishnan submitted a report to this committee, and that was reproduced as Appendix X in its Interim report in 2006. In May 2006, the Government of India instituted Oversight Committee to monitor implementation of reservation of seats for students from Other Backward Classes (OBCs) in higher educational institutions. It submitted an interim report in July 2006. 3There is a fixed quantum of seats for students from each of the BC, MBC, SC and ST Communities. Students from communities other than those listed are called as ‘Other Communities’ (OtC) and such students can compete only for the open category seats. But students of BC, MBC, SC and ST can also compete for the ‘open category’ seats, because such seats are not reserved for any particular communities, hence the name Open Category. 4Normally, every private engineering/medical college should surrender 50 per cent of seats for single window admission system of the state government. Students admitted through this system pay the government determined tuition fees. Students for the remaining 50 per cent of the seats, called management quota, shall be admitted by the management and that gives scope for collecting higher tuition and other fees. However, some of the private engineering colleges surrender more than 50 per cent of the seats, because they could not get students for all the seats in the management quota.

Web: www.thehinducentre.comPhone: +91-44-28576300
Email: [email protected]
Published by :The Hindu Centre for Politics and Public PolicyKasturi Buildings, 859 & 860, Anna Salai,Chennai - 600002. Tamil Nadu, India.


