Embed Size (px)
Citation preview
LWW/IYC IYC200068 March 2, 2011 5:23 Char Count= 0
Infants & Young ChildrenVol. 24, No. 2, pp. 117–132Copyright c© 2011 Wolters Kluwer Health | Lippincott Williams & Wilkins
“Dosage” Effects on DevelopmentalProgress During Early ChildhoodInterventionAccessible Metrics for Real-Life Researchand Advocacy
Stephen J. Bagnato, EdD; Hoi K. Suen, EdD;Antonio V. Fevola, PhD
The accountability movement in education, in general, and early childhood intervention (ECI),
specifically, have fueled the debate about the quality, benefits, and limitations of various types of
publicly funded ECI and human service programs (PEW Charitable Trusts, 2008; National Research
Council/National Academy of Sciences, 2009) not only in the United States but also internation-
ally. However, policymakers, government regulatory bodies, and philanthropies are confused often
by the complexity of our research methods and have proposed the concept of “dosage” (time-in-
program) as a simpler way to depict child progress during program participation as an account-
ability model. Despite its technical and programmatic limitations, the dosage concept can be made
uniform and rigorous to inform and to advocate. We have proposed and field-validated an “ECI
minimum dosage” methodology that uses performance (ie, effect size) criteria from national ECI
studies and regression metrics to establish a minimum comparative standard for state and national
accountability and real-life program evaluation research efforts and advocacy in ECI for children
at developmental risk. Practitioners and researchers can access a Web site to employ an excel
program to input and analyze their data. In this article, we present dosage and progress data on
n = 1350 children in a high-profile ECI initiative in the Pennsylvania to demonstrate the effective-
ness of the proposed minimum-dosage metrics. Implications and lessons learned for practitioners,
researchers, and policymakers are presented. Guide points to help programs to conduct applied
research in real-life community settings to show “how good they are at what they do”are offered.
With more accessible metrics, we can be more persuasive to advocate and influence public policy
in ECI in desired directions for the benefits of all children, families, and programs—especially our
most vulnerable ones. Key words: accountability, applied community research, dosage effects,dosage metrics, early childhood intervention, time-in-program
PROGRAM IMPACT, OUTCOMES, ANDACCOUNTABILITY
Policymakers and practitioners are inter-
ested increasingly in accounting for the stated
Author Affiliations: Schools of Medicine andEducation, Pediatrics & Applied DevelopmentalPsychology and Office of Child Development (DrBagnato), School of Education, EducationalPsychology, Penn State (Dr Suen), and School ofMedicine, Psychiatry, University of PittsburghMedical Center (Dr Fevola).
Correspondence: Stephen J. Bagnato, EdD, Early Child-hood Partnerships (ECP), Office of Child Develop-
benefits of diverse types of educational and
psychosocial programs for all individuals, but
particularly, individuals who are at develop-
mental risk or who have delays, disabilities, or
disorders. In the United States, No Child Left
Behind (US Department of Education 2001) is
perhaps the most widely known educational
accountability effort to demonstrate the profi-
ciency of students in school-based programs.
ment, 400 N. Lexington Avenue, Pittsburgh, PA 15208([email protected]).
DOI: 10.1097/IYC.0b013e3182104896
Copyright © 2011 Lippincott Williams & Wilkins. Unauthorized reproduction of this article is prohibited.
117
LWW/IYC IYC200068 March 2, 2011 5:23 Char Count= 0
118 INFANTS & YOUNG CHILDREN/APRIL-JUNE 2011
Within early intervention, the Office of Spe-
cial Education Programs (2006) of the US De-
partment of Education has mandated the col-
lection of entry and exit data on the progress
of children with developmental disabilities
during participation in diverse types of early
childhood intervention (ECI) programs and
related services. In recent years, the National
Reporting System (Head Start Bureau 2002)
was employed as a uniform measurement
method to gather status and progress data on
children in Head Start programs. Increasing
numbers of states such as Colorado, Califor-
nia, Pennsylvania, and Kentucky, themselves,
have begun to mandate the collection of on-
going child progress data linked to their early
learning standards to document the benefits
of preschool and prekindergarten programs
for children with typical abilities, and for
those at developmental risk of “kindergarten
failure” due to poverty. Clearly, the account-
ability movement in education, in general, and
ECI, specifically, have fueled the debate about
the quality, benefits, and limitations of vari-
ous types of publicly funded programs (Na-
tional Research Council/National Academy of
Sciences, 2009; PEW Charitable Trusts, 2008).
EFFECTIVENESS OF ECI: EFFECT SIZE
The designation of “early childhood inter-
vention” or ECI has been proposed and jus-
tified by Shonkoff and Meisels (2000) as the
generic reference to connote any type of early
learning intervention or service program that
encompasses young children birth to 8 years
of age and their families, including early care
and education, Head Start, and early interven-
tion. Thus, ECI refers both to children at de-
velopmental risk due to experiencing the neg-
ative effects of poverty and to children with
developmental delays/disabilities. In this arti-
cle, we use the term ECI in similar fashion
but primarily apply the dosage concept to
young children at developmental risk and/or
with mild developmental delays (ie, early liter-
acy and learning, speech/language, and social-
behavioral difficulties). The dosage method-
ology for children with significant disabilities
would not likely capture the essence, impact,
and outcomes of individualized intervention
programs and would require more multivari-
ate methods and individualized methods. In
fact, our sample research study to demon-
strate the dosage concept did not include chil-
dren with significant disabilities. Our review
of the effect size literature, however, cast a
wide net by including studies with children
at risk and with mild delays or disabilities to
derive a more representative effect size and
dosage metric. With this logic and for pur-
poses of brevity, we refer to early childhood
intervention as ECI for the remainder of this
article.
Regarding the efficacy of ECI programs,
Guralnick (1991) wrote eloquently about the
need to devote the next decade to more rigor-
ously designed and executed research to high-
light the various child, family, age-time, and
intervention factors that are associated with
positive and enduring child outcomes. Since
that time, researchers have conducted innova-
tive studies to form this evidence base (Gural-
nick, 1997; Shonkoff & Meisels, 2000). More-
over, since experimental-control group de-
signs are not always possible or even recom-
mended in such research into the impact of
community-based “natural experiments”(Bag-
nato, Grom, & Haynes, 2004), alternative de-
signs and statistical methodologies are neces-
sary to isolate program impact and outcomes
(Bagnato, Suen, Brickley, Smith-Jones, & Det-
tore, 2002; McCall, 2004; McCall & Green,
1999; Yoshikawa, 2004). Guralnick (1991)
proposed that in such ECI programs, effect
size “is an especially useful metric to eval-
uate effectiveness because it allows data to
be aggregated across diverse studies.”(p.21) Ef-
fect size refers to the estimated magnitude of
the impact of the treatment or intervention
expressed in standard score units; effect size
also serves as a useful summary measure of
effectiveness for individual research studies.
Our own analysis of the myriad of published
effective ECI outcomes research (to be dis-
cussed in step 1) concludes that an effect size
range of between 0.41 and 0.75 of a standard
Copyright © 2011 Lippincott Williams & Wilkins. Unauthorized reproduction of this article is prohibited.
LWW/IYC IYC200068 March 2, 2011 5:23 Char Count= 0
Dosage Effects Metrics for ECI Research 119
deviation (6-12 standard score points) under-
pins “effective intervention.”
THE DOSAGE QUESTION AND EFFECTSIZE IN ECI
Researchers and practitioners in the fields
of ECI understand clearly that the impact of
a program or service on a child’s develop-
mental progress involves a myriad of com-
plex factors including parent engagement, age
at entry, length of participation, intervention
match, intensity of related services, treatment
fidelity; program quality, teacher’s instruc-
tional behaviors, and type of delay/disability.
In our experience, despite this admonition
about complexity, unfortunately, policymak-
ers and funders, especially private founda-
tions and businesses (Bagnato, 2002), have ad-
vocated for simpler and more functional and
accessible markers of accountability and have
embraced the concept of dosage to under-
score both evidence-based models and those
with promising features in the absence of
clear outcomes.
This conceptual reference to dosage, as
has been expressed by policymakers and fun-
ders, is ill-defined. It is based on a nebulous
metaphor drawn from the medical field, in
general, and from pharmacology in specific.
The general concept is one of the “amount of
treatment.” In medicine, the amount of treat-
ment, or dosage, is calibrated via such mea-
surement units as the number of tablets, the
number of teaspoons, weight in milligrams,
volumes in cubic centimeters, or number of
cups. These metrics are sensible measures for
medicine because the content and chemical
structure of the medicine are known, fixed,
and standardized; and the drugs are tangi-
ble physical objects that can be measured in
weight, volume, or number of pills or tablets
of fixed sizes.
Unfortunately, while the generalized con-
cept of dosage, or amount of treatment, might
be loosely borrowed from medicine, the mea-
surement metrics and methods of calibration
used in medical dosages cannot be trans-
ferred to ECI to serve accountability. This is
because, unlike medicine, ECI “treatments”
are dynamic, flexible, interactive, situational,
individualized, and often relatively unstruc-
tured; ECI treatments are not tangible objects
that can be weighed or counted in the same
manner as medicines.
The closest parallel situation to ECI that
might offer some feasible guidance for a prac-
tical operationalization of dosage is perhaps
found in the psychotherapy literature. A num-
ber of studies in psychotherapy have defined
and employed a concept of “dose-effect anal-
ysis” (Barkham et al., 1996; Howard, Kopta,
Krause, & Orlinsky, 1986; Kadera, Lambert,
& Andrews, 1996). Treatments in psychother-
apy are also dynamic, flexible, and interactive,
and cannot be weighed or counted. For the
determination of dose-effect analysis, these
studies have typically operationalized dose as
the “number of therapy sessions.” In other
words, the concept of dosage has been cali-
brated through the concept of time or dura-
tion of treatment; rather than amount or inten-
sity of treatment. A similar operationalization
can be employed in ECI by measuring dosage
in terms of number of days engaged or par-
ticipating in a particular program.
The operationalization and calibration of
dosage through the metric of “number of
days” are by itself necessary but insufficient
to serve the purpose of accountability. It only
provides a standardized unit to measure treat-
ment or cost. It does not by itself provide use-
ful information for policymakers or funders,
who are more interested in such interrelated
measures as cost per dose, dose-effect, mini-
mum dosage needed, or minimum cost. These
interrelated measures can be directly or indi-
rectly expressed through a benchmark con-
cept of ECI minimum dosage, which we have
defined as the minimum amount of time that
an individual child must engage and partici-
pate in an ECI program or service to show
measurable functional progress (eg, by ei-
ther meeting a minimum progress standard
of 6.8 standard score units derived from na-
tional ECI research or demonstrating progress
that approaches age-expected performance—
standard score range of 90-110).
Copyright © 2011 Lippincott Williams & Wilkins. Unauthorized reproduction of this article is prohibited.
LWW/IYC IYC200068 March 2, 2011 5:23 Char Count= 0
120 INFANTS & YOUNG CHILDREN/APRIL-JUNE 2011
The empirical benchmarks such as mini-
mum dosage are showing an increasing use
in applied developmental psychology as a
method for interpreting effect sizes and treat-
ment effects (Hill, Bloom, Black, & Lipsey,
2008). Recent dosage studies using this con-
cept in ECI have been conducted to exam-
ine the effects of multisession prevention
programs for young boys with aggressive be-
haviors (Charelebois, Brenden, Vitaro, Nor-
mandeau, & Boudreau, 2004); the extent to
which time in a child care program predicts
socioemotional adjustment during kinder-
garten transition (National Institute of Child
Health and Human Development Early Child
Care Research Network, 2003); attendance in
Head Start programs related to cognitive and
social gains and family risk status (Tait et al.,
2002); and the impact of time-in-program
on the early learning and social-behavioral
progress of young children at developmental
risk due to poverty in diverse early care and
education and prekindergarten settings (Bag-
nato, 2002; Bagnato et al., 2002; Bagnato, Sal-
away, & Suen, 2009; Reynolds, 1995).
Despite the initial array of dosage studies, it
is clear that researchers and policymakers can
benefit by using some uniform methods and
standards to determine minimum ECI dosage
needed in state and national accountability ef-
forts so that government regulators and fun-
ders can have assurances about the rigorous
and precise nature of the methodology em-
ployed and the promising nature of the in-
tervention model. Thus, we regard the au-
dience for our dosage method to be broad
encompassing not only researchers but also
policy makers, government representatives,
business leaders, and program directors.
We propose a 2-step process to determine
minimum functional dosage: First, determine
what is the minimum expected progress; and
then find the relationship between progress
and number of days of program engagement
to determine the minimum number of days
needed to attain the minimum progress. Also,
by using this methodology, practitioners and
researchers can immediately employ these
metrics by accessing an indicated Web site
and excel program to input and analyze their
data.
A PROPOSED UNIFORM METHODOLOGYFOR ECI DOSAGE RESEARCH
This article describes the proposed 2-step
process for calculating ECI minimum dosage;in the following sections, we will describe
these dosage procedures and metrics; iden-
tify a Web site to analyze data; and, then, il-
lustrate the application of the dosage met-
rics within the database and results of a large-
scale, longitudinal ECI study in Pennsylva-
nia. Implications of using the ECI minimum
dosage methodology will be discussed in the
form of “lessons learned.”
METHODOLOGY
Establish evidence-based minimumprogress target standards: Step 1
A thorough examination was conducted of
the research literature across the fields of
ECI pertaining specifically to the impact, out-
comes, and efficacy studies for children who
were at risk or with mild delays/disabilities.
It is beyond the intent or scope of this re-
search to present an exhaustive profile of each
intervention, but rather to justify the dosage
benchmark derived (interested readers are re-
ferred to the study citations to review the
research details). However, our search em-
phasized those effective interventions involv-
ing randomized trials, quasi-experimental de-
signs, and longitudinal, multivariate program
evaluation research studies that focused pri-
marily on successful models for children at de-
velopmental risk; many studies did not iden-
tify type of research design. In addition, few
studies explicitly documented their fidelity
of intervention, which should be a focus in
additional comparative studies in this area
since the confidence to be placed in the re-
sults can be affected significantly. Again, we
regard our ECI minimum dosage metric to
be most applicable for high-risk children and
those with mild delays/disabilities who may
be the most responsive to intervention. Thus,
Copyright © 2011 Lippincott Williams & Wilkins. Unauthorized reproduction of this article is prohibited.
LWW/IYC IYC200068 March 2, 2011 5:23 Char Count= 0
Dosage Effects Metrics for ECI Research 121
our exploration of the literature included only
those meta-analyses and individual studies of
children between birth and 6 years of age;
these studies were deemed representative of
that literature and excluded those studies
that focused primarily on children with sig-
nificant disabilities such as autism spectrum
disorder and other neurodevelopmental dis-
abilities. The cited studies involved a wide
array of types of ECI interventions includ-
ing home-based, center-based, parent train-
ing, and small-group models in mostly inclu-
sive but also some segregated settings. For
the most part, the studies reflect full-day (eg,
6 hour) models. Methods for measuring treat-
ment fidelity were inconsistently presented or
used in the studies.
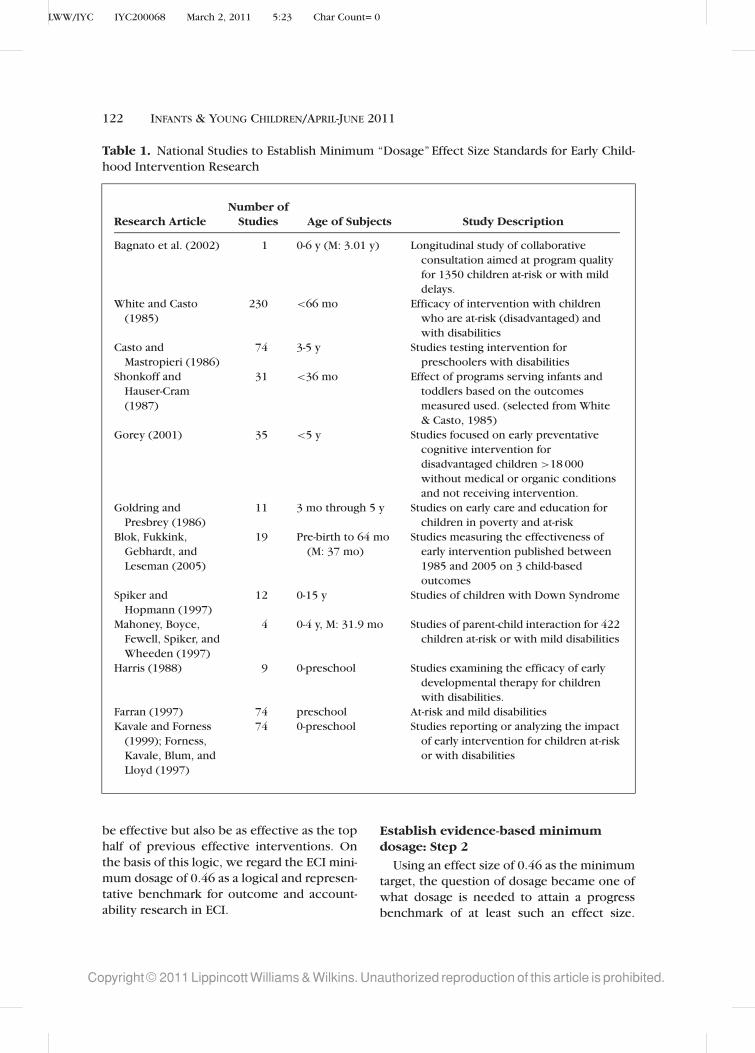
Table 1 summarizes the review of this ev-
idence base involving mostly meta-analytic
studies over the past 25 years. The meta-
analytic studies reported effect size statistics
regarding mostly programmatic effects (ie,
intensity, duration) on child developmental
progress. Not all studies consistently reported
the standard deviation for their effect sizes.
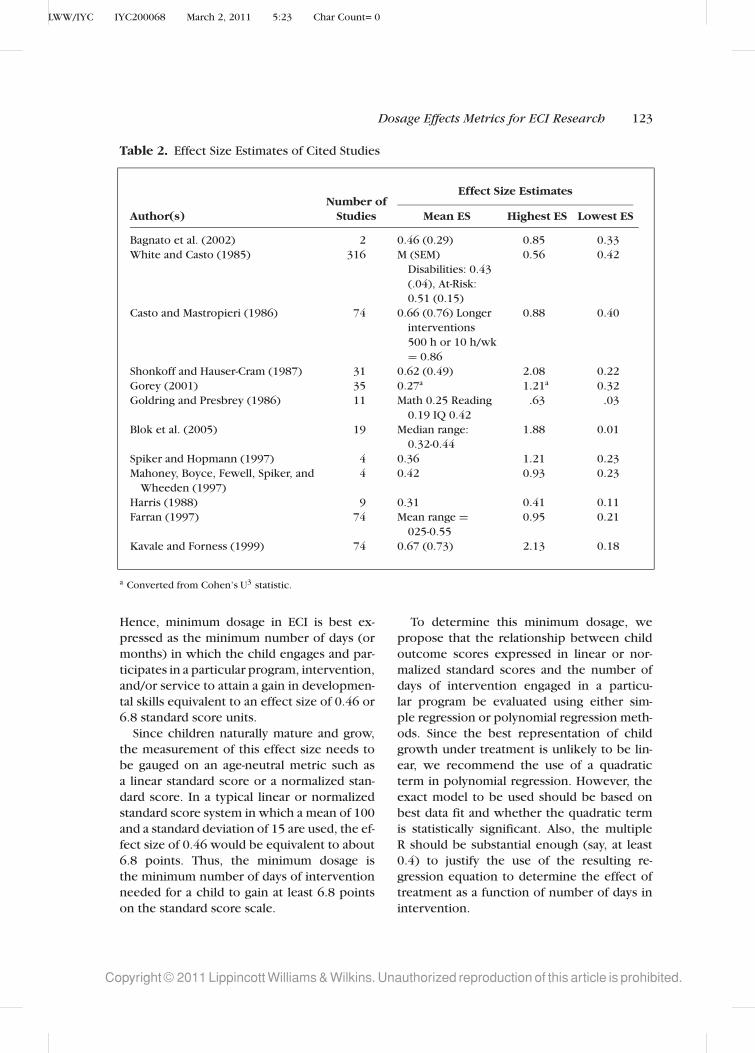
Table 2 profiles the highest to lowest effect
sizes to generate an effect size range as a proxy
confidence interval for the general lack of
standard deviations.
The first step to determine minimum
dosage is to determine the typical minimum
progress. This is done by determining the
most representative effect size for ECI out-
comes research. On the basis of the review
of the studies in Table 1, we judged the
average effect size to be 0.46. This would
serve as a reasonable indicator of expected
progress and was therefore chosen as the tar-
get/standard or benchmark for minimum ex-
pected progress in ECI. An effect size of 0.46
translates into a progress metric of 6.8 stan-
dard score units (eg, 15 standard score points
is the common standard deviation of most out-
come measures). It is instructive, however,
that the standard error of most measures is
6 standard score points and that this is the
effect size of some of the most well-known
and respected ECI studies. This minimum ef-
fect size chosen on the basis of the litera-
ture also coincidentally corresponds approxi-
mately to Cohen’s (1988) criterion of a “mod-
erate” effect size value (ie, 0.5). Next, we de-
cided to establish a more challenging and rig-
orous target/standard to document the impact
of program engagement or dosage. Using our
research database, we posed the question of
whether children who participated in our
Heinz ECI longitudinal research study demon-
strated sufficient skill gains so that they even-
tually attained a typical level of functioning
(eg, a standard score of 100) irrespective of
whether they experienced documented de-
velopmental delays based on PA state criteria
at program entry or not.
The fact that the value of 0.46 as a bench-
mark is close to the value described as
“medium” by Cohen (1988) is coincidental
but arguably valid. Cohen exhorted that the
context of the intervention influences the va-
lidity of the classification of the magnitude of
the treatment effect. In this regard, Table 1
provides this context and supports its valid-
ity since 0.46 is the derived average effect
size among the applied research studies re-
viewed. Moreover, the choice of this average
effect size as a benchmark is reasonable for
2 reasons. First, since this minimum bench-
mark is recommended for use for all interven-
tions, it would be an oxymoron to demand
every program to perform “minimally above
average.”Second, and more important, this av-
erage is derived from applied empirical stud-
ies within meta-analyses of peer-reviewed and
published research reports. Given the well-
known file-drawer or publication bias prob-
lem inherent in meta-analyses, the results can
be expected to be based on a biased sample
of almost exclusively effective interventions.
Therefore, the benchmark of 0.46 actually
represents the average of primarily effectiveinterventions—with ineffectual interventions
excluded (ie, it is the expected size of effect
when an intervention is effective). As such,
it is actually rather stringent as a “minimum”
dosage. This ECI minimum dosage benchmark
demands that an intervention must not only
Copyright © 2011 Lippincott Williams & Wilkins. Unauthorized reproduction of this article is prohibited.
LWW/IYC IYC200068 March 2, 2011 5:23 Char Count= 0
122 INFANTS & YOUNG CHILDREN/APRIL-JUNE 2011
Table 1. National Studies to Establish Minimum “Dosage” Effect Size Standards for Early Child-
hood Intervention Research
Number ofResearch Article Studies Age of Subjects Study Description
Bagnato et al. (2002) 1 0-6 y (M: 3.01 y) Longitudinal study of collaborative
consultation aimed at program quality
for 1350 children at-risk or with mild
delays.
White and Casto
(1985)
230 <66 mo Efficacy of intervention with children
who are at-risk (disadvantaged) and
with disabilities
Casto and
Mastropieri (1986)
74 3-5 y Studies testing intervention for
preschoolers with disabilities
Shonkoff and
Hauser-Cram
(1987)
31 <36 mo Effect of programs serving infants and
toddlers based on the outcomes
measured used. (selected from White
& Casto, 1985)
Gorey (2001) 35 <5 y Studies focused on early preventative
cognitive intervention for
disadvantaged children >18 000
without medical or organic conditions
and not receiving intervention.
Goldring and
Presbrey (1986)
11 3 mo through 5 y Studies on early care and education for
children in poverty and at-risk
Blok, Fukkink,
Gebhardt, and
Leseman (2005)
19 Pre-birth to 64 mo
(M: 37 mo)
Studies measuring the effectiveness of
early intervention published between
1985 and 2005 on 3 child-based
outcomes
Spiker and
Hopmann (1997)
12 0-15 y Studies of children with Down Syndrome
Mahoney, Boyce,
Fewell, Spiker, and
Wheeden (1997)
4 0-4 y, M: 31.9 mo Studies of parent-child interaction for 422
children at-risk or with mild disabilities
Harris (1988) 9 0-preschool Studies examining the efficacy of early
developmental therapy for children
with disabilities.
Farran (1997) 74 preschool At-risk and mild disabilities
Kavale and Forness
(1999); Forness,
Kavale, Blum, and
Lloyd (1997)
74 0-preschool Studies reporting or analyzing the impact
of early intervention for children at-risk
or with disabilities
be effective but also be as effective as the top
half of previous effective interventions. On
the basis of this logic, we regard the ECI mini-
mum dosage of 0.46 as a logical and represen-
tative benchmark for outcome and account-
ability research in ECI.
Establish evidence-based minimumdosage: Step 2
Using an effect size of 0.46 as the minimum
target, the question of dosage became one of
what dosage is needed to attain a progress
benchmark of at least such an effect size.
Copyright © 2011 Lippincott Williams & Wilkins. Unauthorized reproduction of this article is prohibited.
LWW/IYC IYC200068 March 2, 2011 5:23 Char Count= 0
Dosage Effects Metrics for ECI Research 123
Table 2. Effect Size Estimates of Cited Studies
Effect Size EstimatesNumber of
Author(s) Studies Mean ES Highest ES Lowest ES
Bagnato et al. (2002) 2 0.46 (0.29) 0.85 0.33
White and Casto (1985) 316 M (SEM)
Disabilities: 0.43
(.04), At-Risk:
0.51 (0.15)
0.56 0.42
Casto and Mastropieri (1986) 74 0.66 (0.76) Longer
interventions
500 h or 10 h/wk
= 0.86
0.88 0.40
Shonkoff and Hauser-Cram (1987) 31 0.62 (0.49) 2.08 0.22
Gorey (2001) 35 0.27a 1.21a 0.32
Goldring and Presbrey (1986) 11 Math 0.25 Reading
0.19 IQ 0.42
.63 .03
Blok et al. (2005) 19 Median range:
0.32-0.44
1.88 0.01
Spiker and Hopmann (1997) 4 0.36 1.21 0.23
Mahoney, Boyce, Fewell, Spiker, and
Wheeden (1997)
4 0.42 0.93 0.23
Harris (1988) 9 0.31 0.41 0.11
Farran (1997) 74 Mean range =025-0.55
0.95 0.21
Kavale and Forness (1999) 74 0.67 (0.73) 2.13 0.18
a Converted from Cohen’s U3 statistic.
Hence, minimum dosage in ECI is best ex-
pressed as the minimum number of days (or
months) in which the child engages and par-
ticipates in a particular program, intervention,
and/or service to attain a gain in developmen-
tal skills equivalent to an effect size of 0.46 or
6.8 standard score units.
Since children naturally mature and grow,
the measurement of this effect size needs to
be gauged on an age-neutral metric such as
a linear standard score or a normalized stan-
dard score. In a typical linear or normalized
standard score system in which a mean of 100
and a standard deviation of 15 are used, the ef-
fect size of 0.46 would be equivalent to about
6.8 points. Thus, the minimum dosage is
the minimum number of days of intervention
needed for a child to gain at least 6.8 points
on the standard score scale.
To determine this minimum dosage, we
propose that the relationship between child
outcome scores expressed in linear or nor-
malized standard scores and the number of
days of intervention engaged in a particu-
lar program be evaluated using either sim-
ple regression or polynomial regression meth-
ods. Since the best representation of child
growth under treatment is unlikely to be lin-
ear, we recommend the use of a quadratic
term in polynomial regression. However, the
exact model to be used should be based on
best data fit and whether the quadratic term
is statistically significant. Also, the multiple
R should be substantial enough (say, at least
0.4) to justify the use of the resulting re-
gression equation to determine the effect of
treatment as a function of number of days in
intervention.
Copyright © 2011 Lippincott Williams & Wilkins. Unauthorized reproduction of this article is prohibited.
LWW/IYC IYC200068 March 2, 2011 5:23 Char Count= 0
124 INFANTS & YOUNG CHILDREN/APRIL-JUNE 2011
This polynomial regression equation can
then be used in either 1 of 2 ways to deter-
mine the minimum dosage and the dosages
needed to attain minimum or optimal per-
formance. One way to determine dosage is
to do so algebraically. After estimating the
beta values (ie, the regression coefficients) in
the polynomial regression function, use these
beta values to solve algebraically for the age
difference that correspond to a gain of 6.8 in
the child outcome standard scores. This age
difference is the minimum dosage expressed
in the number of days needed to attain an in-
crease of 6.8 standard score units, or 0.46 in
the effect size metric.
This minimum number of days can be
estimated by the minimum number of days
=√
β2
1 + 27.2β2 − β1
2β2
(1)
where β1 is the regression weight for the first
term (ie, number of days) in the quadratic
equation, β2 is that for the second term (ie,
squared number of days) in the equation, and
27.2 is a constant value that is derived in the
process of solving the underlying quadratic
equations.
Next, to derive the dosage required for
a child with a mild developmental delay to
reach the typical level of functioning (ie, a
standard score of 100 points), we first subtract
the standard score of the child at the point of
program entry, x1, from 100. The result is the
target standard score units to be gained by this
child to be at the typical level of functioning.
Again, with the beta weights from the polyno-
mial equation, we can derive the value of this
dosage as follows:
Number of days needed to attain typical
functioning =√
β2
1 + 4(100 − x1)β2 − β1
2β2
(2)
The values 4 and 100 are constant values
derived by solving the underlying quadratic
equations.
If the beta weight for the quadratic (ie, 2nd)
term of the polynomial equation is not statis-
tically significant, the regression equation re-
duces to a simple linear equation. In that case,
the minimum dosage in the number of days
of treatment would be calculated through the
following equation:
6.8
β1
(3)
Instead of equation (1) and, instead of equa-
tion (2), the dosage needed to bring a child to
the typical level of functioning of other chil-
dren in the norm group is as follows:
100 − x1
β1
(4)
To ease the application of equations (1)
through (4), we have prepared an Excel
macro routine for program administrators and
researchers to use to estimate dosages, based
on input of regression weights. The spread-
sheet macro can be downloaded from http://
suen.educ.psu.edu/∼hsuen/dosage.xls.
When calculating dosages via any of the
above equations, potential regression error or
the standard error of estimate is purposely
ignored. This is because the goal of calcu-
lating these values is to derive a metric to
describe needed dosages for the overall pro-
gram. The goal is not to evaluate how many
days are needed for a given child. At the in-
dividual child level, the number of days of
intervention needed will vary from child to
child.
A complementary strategy is to determine
these dosages graphically. We can plot the
graph representing the polynomial or lin-
ear relationship as appropriate between the
number of days of intervention and standard
scores. From this graph, we can find the value
of the number of days corresponding to an in-
crease of 6.8 standard score units. This value
is the minimum dosage needed. We can also
find the value of the number of days that cor-
respond to the standard score of 100. This
is the dosage associated with children at risk
or children who demonstrated measurable
preintervention developmental delays who
Copyright © 2011 Lippincott Williams & Wilkins. Unauthorized reproduction of this article is prohibited.
LWW/IYC IYC200068 March 2, 2011 5:23 Char Count= 0
Dosage Effects Metrics for ECI Research 125
demonstrate progress toward a typical level of
functioning after a period of intervention.
DESCRIPTION OF THE HEINZPENNSYLVANIA EARLY CHILDHOODINITIATIVE (USA)
To apply and illustrate the ECI minimum
dosage method “in action,” we use longitudi-
nal outcome data from the Heinz Pennsylvania
Early Childhood Initiatives. A detailed analysis
of ECI and its 3-year research outcomes can be
found in Bagnato (2002) and also download-
able at www.earlychildhoodpartnerships.org
under Scaling Progress in Early Childhood Set-
tings core program.
In 1994, the Heinz Endowments, a na-
tionally renowned philanthropy in Pittsburgh,
Pennsylvania, organized the business, cor-
porate, agency, and foundation sectors in
an ambitious effort to expand quality early
care and education programs and options for
nearly 2000 unserved children in 25 high-
risk neighborhoods. The overarching mission
of the Heinz ECI model has been to foster
preschool and early school success for chil-
dren of poverty in communities and school
districts whose typical grade retention and
special education placement rates in kinder-
garten have ranged between 18% and 40% in
Pittsburgh.
The Heinz Early Childhood Initiative has
been a unique, collaboratively designed and
privately funded joint venture with vari-
ous Pittsburgh urban neighborhoods to nur-
ture the development of diverse early care
and education options for young children.
The design features, logic model, and im-
plementation of the Heinz model plan were
based on various core features of effec-
tive ECI programs summarized in previous
meta-analytic efficacy research conducted by
Ramey and Ramey (1998): on-site consulta-
tion and mentoring to promote National As-
sociation for the Education of Young Children
program quality standards, curriculum, and
standards alignment focused on early school
success competencies: parent involvement,
community-based decision-making, linkages
to schools and other community resources,
child-centered programming, and involve-
ment in an ongoing program evaluation pro-
cess to improve quality.
The Heinz ECI model was conceived as
a local “natural experiment” whose ultimate
objective is to enroll all unserved children
in high-risk urban neighborhoods into high-
quality early care and education programs that
reflected diverse options. Thus, the Heinz ECI
research is a type of population study in which
all children are included in the evaluation
and no unserved or “untreated”group was al-
lowed; each child and program were its own
control.
Children, families, and programs
In the current descriptive and statistical
study, developmental outcome data on urban
preschool children and families who partic-
ipated in the Heinz Early Childhood Initia-
tive for the longest periods of time were an-
alyzed. The detailed regression analysis was
conducted on n = 1350 children and fami-
lies with complete data sets on all dependent
outcome measures; preinvention assessments
were conducted in September of their entry
into the Heinz ECI and then after 3 years of
intervention with the final postintervention
evaluation in May. Average length of interven-
tion was 31.3 months (SD = 9.7; range =7.4-37.8 months). Approximately 86% of the
children enrolled in ECI programs were clas-
sified as “at-risk”using Annie E. Casey Founda-
tion (1994) guidelines for distressed commu-
nities. In the Heinz ECI sample, at-risk was
defined as a standard score range of 86 to
89. Mild developmental delays were identi-
fied in 14% of the ECI children on the basis
of the Commonwealth of Pennsylvania Early
Intervention and Special Education Standards
(1991) (eg, 1.0 SD below average in 1 or more
domains) and using preintervention develop-
mental rates on the Developmental Observa-
tion Checklist System (DOCS). It should be
noted that these children in the Heinz mod-
els were for the most part educated in inclu-
sive classroom and family child care settings
Copyright © 2011 Lippincott Williams & Wilkins. Unauthorized reproduction of this article is prohibited.
LWW/IYC IYC200068 March 2, 2011 5:23 Char Count= 0
126 INFANTS & YOUNG CHILDREN/APRIL-JUNE 2011
in early care and education programs in
their home communities and based on par-
ent choice were not enrolled in early inter-
vention services. National incidence rates of
developmental delay related to poverty range
from 3% to 18% (Fujiura & Yamaki, 2000).
Average chronological age of the boys (53%)
and girls (47%) enrolled in the Heinz ECI for
this analysis is 3.01 years (SD = .82 years,
range = 0.59-5.30 years). Ethnic mix of chil-
dren in the urban ECI communities included
African American (73.4%), white (24.3%), and
Asian and Hispanic (2.3%) representation. Me-
dian yearly family income for the ECI chil-
dren is $13 024. Reviews of school district
Web data within the urban Heinz ECI com-
munities show the following averages: low
income (61%); free or reduced-price lunches
(68%); and limited English proficiency (66%).
Overall, all Heinz ECI programs incorporated
a developmental curriculum aligned with the
Pennsylvania Early Learning Standards and
used a developmentally appropriate practices
model that matched the standards of the
National Association for the Education of
Young Children (2008). Each of the 25 Heinz
program sites adhered to the core effective
program features outlined previously but em-
phasized small group and some individual-
ized programming for children focused on
fostering the acquisition of early literacy and
social-behavioral competencies as prerequi-
sites for early school success in the transition
to kindergarten. For the most part, children in
the Heinz ECI programs were engaged in full-
day programs (eg, 5 days per week; 6 hours
per day). Uniformly, each program included 1
leader teacher and 1 teacher’s aide.
Developmental outcome measure
The DOCS (Hresko, Miguel, Sherbenou, &
Burton, 1994) is the uniform child devel-
opmental observation assessment instrument
used in the Heinz ECI dosage study. DOCS is a
unique norm-based measure whose 475 devel-
opmental competencies are naturally occur-
ring child skills in everyday routines (eg, rec-
ognizes the McDonald’s sign; finds the correct
toy at the bottom of the toy box; can read sim-
ple signs) that are teachable curricular com-
petencies and predictive of school success
and sensitive to the effects of intervention.
Thus, the DOCS is one of the best national
consumer-rated examples of an “authentic as-
sessment” instrument with norms (Bagnato,
Neisworth, & Pretti-Frontczak, 2010). DOCS
samples child skills in the following domains:
cognitive, language, social, motor, and over-
all. DOCS was nationally (33 states) normed
on nearly 1100 children from birth to 6 years
of age. Concurrent, criterion, and predic-
tive validity data are strong (0.78–0.94) as
well as interobserver (parent-teacher = 0.81)
and rating-rerating reliability (0.95). Only the
DOCS total standard scores over six progress
evaluation time-points was used in the current
analysis of minimum dosages.
RESULTS
To apply the proposed ECI minimum
dosage method, the children in the Heinz ECI
program were divided into 4 groups on the ba-
sis of their initial, preintervention DOCS stan-
dard scores. Graphed in Figure 1, the 4 groups
were as follows:
1. Above average group: initial DOCS stan-
dard scores above 110;
2. Average group: initial DOCS standard
scores between 90 and 110;
3. Below-average group: initial DOCS stan-
dard scores between 85 and 89; and
4. Delayed group: initial DOCS standard
scores less than 85.
It was determined that no particular min-
imum dosage should be set for the above-
average group as the objective for this group
is, at least, maintenance of progress. For the
remaining 3 groups, a separate polynomial re-
gression analysis was performed to identify
the best model to describe the relationship
between the number of days of treatment
and DOCS standard scores. For the average
group, which consisted of 1110 children, the
quadratic term in the polynomial analysis was
found to be not statistically significant. The
best fitting model was the following linear
Copyright © 2011 Lippincott Williams & Wilkins. Unauthorized reproduction of this article is prohibited.
LWW/IYC IYC200068 March 2, 2011 5:23 Char Count= 0
Dosage Effects Metrics for ECI Research 127
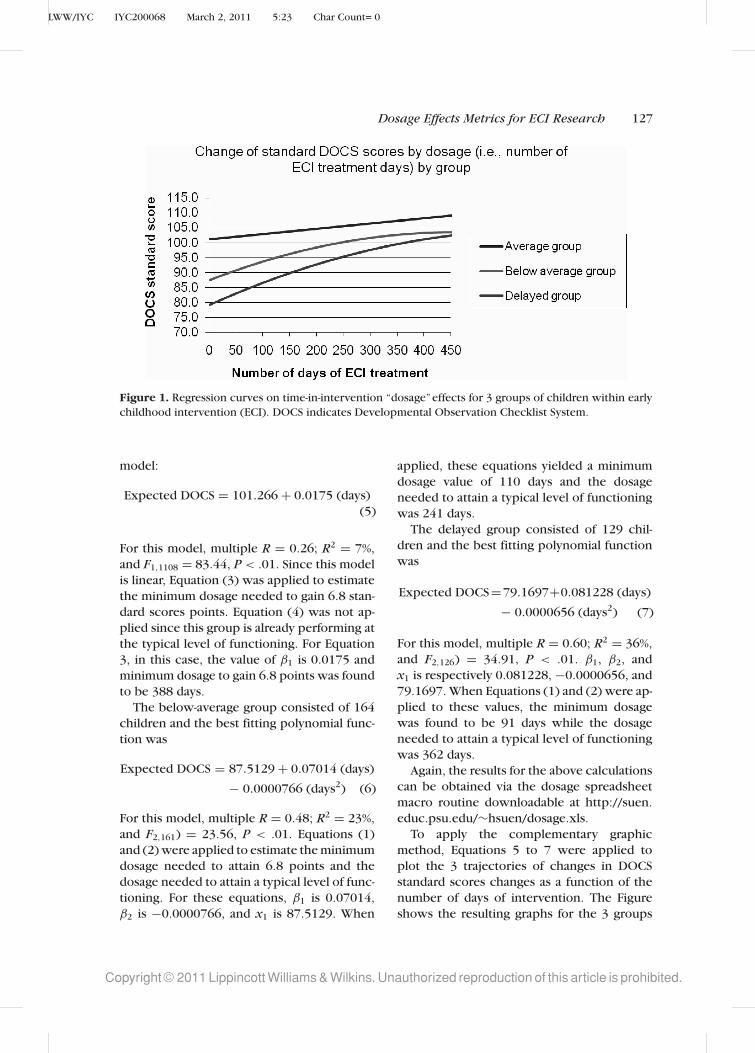
Figure 1. Regression curves on time-in-intervention “dosage”effects for 3 groups of children within early
childhood intervention (ECI). DOCS indicates Developmental Observation Checklist System.
model:
Expected DOCS = 101.266 + 0.0175 (days)
(5)
For this model, multiple R = 0.26; R2 = 7%,
and F1,1108 = 83.44, P < .01. Since this model
is linear, Equation (3) was applied to estimate
the minimum dosage needed to gain 6.8 stan-
dard scores points. Equation (4) was not ap-
plied since this group is already performing at
the typical level of functioning. For Equation
3, in this case, the value of β1 is 0.0175 and
minimum dosage to gain 6.8 points was found
to be 388 days.
The below-average group consisted of 164
children and the best fitting polynomial func-
tion was
Expected DOCS = 87.5129 + 0.07014 (days)
− 0.0000766 (days2) (6)
For this model, multiple R = 0.48; R2 = 23%,
and F2,161) = 23.56, P < .01. Equations (1)
and (2) were applied to estimate the minimum
dosage needed to attain 6.8 points and the
dosage needed to attain a typical level of func-
tioning. For these equations, β1 is 0.07014,
β2 is −0.0000766, and x1 is 87.5129. When
applied, these equations yielded a minimum
dosage value of 110 days and the dosage
needed to attain a typical level of functioning
was 241 days.
The delayed group consisted of 129 chil-
dren and the best fitting polynomial function
was
Expected DOCS=79.1697+0.081228 (days)
− 0.0000656 (days2) (7)
For this model, multiple R = 0.60; R2 = 36%,
and F2,126) = 34.91, P < .01. β1, β2, and
x1 is respectively 0.081228, −0.0000656, and
79.1697. When Equations (1) and (2) were ap-
plied to these values, the minimum dosage
was found to be 91 days while the dosage
needed to attain a typical level of functioning
was 362 days.
Again, the results for the above calculations
can be obtained via the dosage spreadsheet
macro routine downloadable at http://suen.
educ.psu.edu/∼hsuen/dosage.xls.
To apply the complementary graphic
method, Equations 5 to 7 were applied to
plot the 3 trajectories of changes in DOCS
standard scores changes as a function of the
number of days of intervention. The Figure
shows the resulting graphs for the 3 groups
Copyright © 2011 Lippincott Williams & Wilkins. Unauthorized reproduction of this article is prohibited.
LWW/IYC IYC200068 March 2, 2011 5:23 Char Count= 0
128 INFANTS & YOUNG CHILDREN/APRIL-JUNE 2011
respectively. For the delayed group, improv-
ing 6.8 standard score points corresponds
to a standard score of 86. As can be seen in
the graph for the delayed group that a DOCS
score of 86 corresponds approximately
around 90 days, which is the approximate
minimum dosage. This same graph intersects
with the score of 100 around 360 days.
Therefore, this is the dosage needed to attain
a typical level of performance. Using the
same visual examination of the graph for
the below-average group, we can determine
that the minimum dosage is approximately
110 days, which corresponds to the target
standard score of about 94. The graph crosses
a score of 100 at approximately 240 days,
which is therefore the dosage needed to
attain a typical level of performance. For
the average group, the target standard score
for a gain of 6.8 points is around 108. This
corresponds approximately to 390 days,
which would then be the minimum dosage
for this group. The precision of results of the
graphic method can be improved by using
more detailed tick marks on the graph.
LESSONS LEARNED OF THE ECIMINIMUM DOSAGE METHODOLOGYFOR APPLIED RESEARCHAND ADVOCACY
Technical considerations with the ECIminimum dosage methodology
It must be made clear that the ECI minimum
dosage methodology is most relevant to group
interventions (ie, curricular approaches based
on developmentally appropriate practices)
because it requires the modeling of trends
based on group data. Users are cautioned
against the use of the dosage methodology
for individual children; single-subject analyses
provide the only justifiable methodology to
monitor the impact and outcomes of inter-
ventions with individual children who display
widely varying functional capabilities and ser-
vices needs.
Similarly, as stated earlier, the issue of con-
text is important involving the external valid-
ity and generalization of outcome data based
upon both the congruence between the chil-
dren and programs referenced in the national
studies and also the Heinz ECI data. For this
very reason, we identified national outcomes
studies for our dosage benchmark that in-
volved the type of program models that are
most often used in the United States for chil-
dren at developmental risk. Thus, we be-
lieve that the strength of our model resides
in the fact that it balances logic, rigor, and
practicality.
Determining a minimum dosage is like de-
ciding on the “passing score” of a certifica-
tion examination. As one would not provide
a range as a passing score, one should not
provide a range or a confidence interval as
the “minimum dosage.”As for determining the
confidence interval for the number of days
for an individual, we have difficulty seeing
the actual purpose of such a confidence inter-
val. It would appear that such a confidence
interval would only encourage programs to
shorten the length of intervention when a pro-
gram can make, for instance, such nonsensical
statements as “well, we have not provided the
minimum number of days of intervention, but
we are well within 2 standard errors of that
minimum—so we are 95% confident that we
have provided statistically the same number
of days as the minimum.”
Users are cautioned to use the ECI min-
imum dosage method and macro in good
faith to fairly represent and portray their pro-
gram’s child outcome data to various stake-
holders such as parents, funders, and govern-
ment agencies. The quality of the data is in-
fluenced strongly by the quality of the pro-
gram itself. Important factors include using
developmentally appropriate practices sanc-
tioned by the national professional organiza-
tions, implementing a strong authentic assess-
ment measure over several time points to doc-
ument child progress, and ensuring the qual-
ity of the program through ongoing monitor-
ing and mentoring of teacher’s instructional
and management behaviors and also program
administrative procedures. Perhaps, most
importantly, policymakers and government
Copyright © 2011 Lippincott Williams & Wilkins. Unauthorized reproduction of this article is prohibited.
LWW/IYC IYC200068 March 2, 2011 5:23 Char Count= 0
Dosage Effects Metrics for ECI Research 129
representatives are cautioned strongly against
using this dosage method to “pan” programs
that do not meet the minimum dosage stan-
dard. Rather, any research should be used
for program improvement by engaging the
program leaders and to examine all of the
earlier factors such as the use of evidence-
based and developmentally appropriate prac-
tices and to continue to support and monitor
the expected improvements in program prac-
tices and outcomes when programs are men-
tored to higher quality.
Implications in applying the ECIminimum dosage method
The notion of “dosage” effects for ECI out-
comes research appears at odds with the phi-
losophy and recommended practices in the
early childhood education fields. As develop-
mentalists and behaviorists, we understand
that the impact of a program and its interven-
tions and supports is a complex matter be-
yond the mere concept of the amount of time
that a child spends in the program.
Nevertheless, policymakers, government
regulatory bodies, and philanthropies are con-
fused by this complexity; in response, they
often propose simple and questionable meth-
ods that are often inappropriate and mislead-
ing, particularly for children with develop-
mental differences. The ongoing debate about
the best methods to document accountabil-
ity in ECI is most germane in this regard (Na-
tional Research Council/National Academy of
Sciences, 2009).
We have proposed a methodology that
uses performance or success (ie, effect size)
criteria from national ECI studies to estab-
lish a comparative standard for state and
national accountability efforts. Similarly, our
model poses that recommended statistical
techniques using regression formulae can en-
able evaluators to conduct their account-
ability studies in a uniform manner. Thus,
some basic cross-program comparisons can
be made. In this article, we presented mini-
mum dosage and progress data on n = 1350
children to demonstrate the effectiveness of
the proposed dosage metrics.
As applied developmentalists, we need to
be able to portray and explain our research
outcomes in less esoteric terms that are more
communicable to the public, particularly our
public and private funders, and the business
sector. With more communicable and sensi-
ble metrics, we can be more persuasive and
influence public policy in ECI in desired di-
rections for the benefits of children, families,
and programs.
In the process of developing and applying
the ECI minimum dosage methodology with
associated alternative strategies (ie, hierarchi-
cal linear modeling; growth curve analyses)
in the evaluation of the Heinz Pennsylvania
Early Childhood Initiative, we have learned
several important lessons that have important
implications for applied program evaluation
research and government policy, practices,
and advocacy.
1. In our work with the foundation and
business sectors, “dosage” has be-
come a ubiquitous, catchy, and simple
marker for nonresearchers such as
philanthropies, the business sectors,
and the general public to understand
the effectiveness of human service
programs. Obviously, understandable
metrics often hide the complexities
of documenting program impact and
outcomes. Researchers recognize that
time-in-program is only the most basic
feature of potential effectiveness. An
analysis of the impact and outcomes
of interventions depends upon such
factors as parent engagement, inter-
vention match, intensity of related
services, treatment fidelity; program
quality, teacher’s instructional behav-
iors, and type and severity of disability.
Nevertheless, we have found that the
dosage metric, while simplistic, enables
researchers to gain the attention and
understanding of the public, particu-
larly the business community, and to
increase their receptivity to other ways
of portraying effectiveness data.
2. The concept of dosage, while simplis-
tic on its face, since it does not include
Copyright © 2011 Lippincott Williams & Wilkins. Unauthorized reproduction of this article is prohibited.
LWW/IYC IYC200068 March 2, 2011 5:23 Char Count= 0
130 INFANTS & YOUNG CHILDREN/APRIL-JUNE 2011
other specific programmatic variables in
its formulation, adds the critical marker
of a programmatic element to the over-
all discussion of child progress and pro-
gram outcomes in both state and federal
accountability efforts. Unfortunately, our
government mandates too often over-
look the mediating program variables
in their short-sighted focus on ultimate
child progress. Children do not progress
in the absence of effective teaching and
high-quality programs. The dosage con-
cept and methodology, at least, ensure
that length of program engagement be-
comes an essential explanatory variable
in the interpretation of children’s de-
velopmental and early learning progress
within ECI programs.
3. Applied researchers must develop new
methodologies that estimate such com-
plex programmatic variables as interven-
tion intensity, parent engagement, and
the match between the intervention and
the child’s needs to build upon the
dosage concept and metric. Such multi-
variate metrics can then be used in com-
bination to display the value-added effect
of community-based interventions.
4. Cautions are very important in using the
dosage methodology. We want to make
clear that that minimum dosage metric
is a simple, yet powerful way of mak-
ing a comparative statement about the
relative effectiveness of an intervention.
However, the dosage metric should be
used for research and program evalua-
tion purposes and not individual child
progress studies. Moreover, we admon-
ish policymakers against the tendency
to use the dosage metric to compare
programs negatively and to “pan” them
for not apparently fostering minimum
progress in children. Like any metric, the
most productive use resides in using the
tool to help programs make collabora-
tive decisions with supportive mentors
to identify strong and weak features of
their programs and to reach consensus
about how to improve their practices;
then, the dosage metric can then be used
to document program improvement, im-
pact, and outcomes.
5. Applied researchers must become more
skilled at public presentations of their
research results to various sectors. The
Heinz ECI involved the heavy engage-
ment of the corporate, business, and
philanthropic sectors of the community.
Our use of the ECI minimum dosage met-
ric showed a systematic way to enable
the public sector to understand the value
of increased time and participation in
ECI programs for young children at de-
velopmental risk that influenced the ad-
vocacy process for our programs.
6. We have found that the lay public regard-
ing psychosocial concepts and research
understandably tends to reduce uncer-
tainty in their decision-making processes
by ignoring it or simplifying it. The
dosage concept and minimum dosage
metric helped to reduce this uncertainty
and increase their receptivity for more
complex variables such as task engage-
ment. Our series of community presen-
tations to the business community, gov-
ernment representatives, and commu-
nity stakeholders helped to build pub-
lic support for tax increases to fund in-
clusive ECI programs and networks; as
a result of these community stakehold-
ers’ meetings that presented the Heinz
ECI research outcomes, the legislature
in the Commonwealth of Pennsylvania
created a more universal funding stream
for young children in the very success-
ful Pre-K Counts program (see Bagnato
et al. 2009).
The dosage concept and methodology have
proven to be both simple and powerful, but
grounded in comparative “functional” bench-
marks, sound statistical methods, and applied
research brought to scale in real-life commu-
nity settings. This has provided the effective
advocacy base to demonstrate clearly that ECI
works!
Copyright © 2011 Lippincott Williams & Wilkins. Unauthorized reproduction of this article is prohibited.

LWW/IYC IYC200068 March 2, 2011 5:23 Char Count= 0
Dosage Effects Metrics for ECI Research 131
REFERENCES
Annie E. Casey Foundation. (1994). U.S. youth at risk.
The Futurist, 28(6), 60.
Bagnato, S. J. (2002). Quality early learning: Key toschool success—A first phase 3-year evaluation re-search report for Pittsburgh’s Early Childhood Ini-tiative (ECI). Pittsburgh, PA: Early Childhood Part-
nerships, Children’s Hospital/University of Pitts-
burgh and Heinz Endowments.
Bagnato, S. J., Neisworth, J. T., & Pretti-Frontczak, K.
(2010). LINKing authentic assessment and earlychildhood intervention: Best measures for bestpractices. (4th ed.). Baltimore, MD: Paul Brookes
Publishing, Inc.
Bagnato, S. J., Salaway, J., & Suen, H. K. (2009). Pre-K counts in Pennsylvania for youngsters’ earlyschool success: Authentic outcomes for an inno-vative prevention and promotion initiative. Pitts-
burgh, PA: Early Childhood Partnerships, Heinz En-
dowments.
Bagnato, S. J., Suen, H., Brantley, K., Smith-Jones, J.,
& Dettore, E. (2002). Child developmental impact
of Pittsburgh’s Early Childhood Initiative (ECI) in
high-risk communities: First-phase authentic eval-
uation research. Early Childhood Research Quar-terly, 17(4), 559–580.
Barkham, M., Rees, A., Stiles, W. B., Shapiro, D. A., Hardy,
G. E., & Reynolds, S. (1996). Dose-effect relations in
time-limited psychotherapy for depression. Journalof Consulting and Clinical Psychology, 64(5), 927–
935.
Blok, H., Fukkink R. G., Gebhardt, E. C., & Leseman,
P. M. (2005). The relevance of delivery mode and
other programme characteristics for the effective-
ness of early childhood intervention. InternationalJournal of Behavior Development, 29(1), 35–47.
Casto, G., & Mastropieri, M. A. (1986). The efficacy of
early intervention programs: A meta analysis. Excep-tional Children, 52(5), 417–424.
Charelebois, P., Brenden, M., Vitaro, F., Normandeau,
S., & Boudreau, J. F. (2004). Examining dosage
effects on prevention outcomes: Results from a
multi-modal longitudinal preventive intervention
for young disruptive boys. Journal of School Psy-chology, 42(4): 201–220.
Cohen, J. (1988). Statistical power analysis for the be-havioral sciences (2nd ed.). Hillsdale, NJ: Lawrence
Erlbaum Associates.
Farran, D. (1997). Effects of intervention with disadvan-
taged and disabled children. In M. Guralnick (Ed.),
The effectiveness of early intervention (pp.501–
539). Baltimore, MD. Paul Brookes Publishing.
Forness, S. R., Kavale, K. A., Blum, I. M., & Lloyd J. W.
(1997). Mega-analysis of meta analyses: What works
in special education and related services. TeachingExceptional Children, 29(6), 4–9.
Fujiura, G. T., & Yamaki, K. (2000). Trends in demog-
raphy of childhood poverty and disability. Excep-tional Children, 66(22), 187–199.
Goldring, E. B., & Presbrey, L. S. (1986). Evaluation of
preschool programs: A meta-analytic approach. Ed-ucational Evaluation and Policy Analysis, 8(2),
179–188.
Gorey, K. M. (2001). Early childhood education: A meta-
analytic affirmation of the short- and long-term ben-
efits of educational opportunity. School PsychologyQuarterly, 16(1), 9–30.
Guralnick, M. J. (1991). The next decade of research on
the effectiveness of early intervention. ExceptionalChildren, 58(2), 174–178.
Harris, S. R. (1988). Early Intervention: Does develop-
mental therapy make a difference? Topics in EarlyChildhood Special Education, 7(4), 20–32.
Head Start Bureau (2002). Overview of the National Re-porting System. Washington, DC: US Department of
Health and Human Services, Administration on Chil-
dren and Families.
Hill, C. J., Bloom, H. S., Black, A. R., & Lipsey, M. W.
(2008). Empirical benchmarks for interpreting ef-
fects sizes in research. Child Development Perspec-tives, 2(3), 172–177.
Howard, K. I., Kopta, S. M., Krause, M. S., Orlinsky, D. E.
(1986). The dose-effect relationship in psychother-
apy. American Psychologist, 41(2), 159–164.
Hresko, W. P., Miguel, S. A., Sherbenou, R. J., & Burton,
S. D. (1994). Developmental observation check-list system: A systems approach to assessing veryyoung children. Austin, TX: Pro-Ed.
Kadera, S. W., Lambert, M. J., & Andrews, A. A. (1996).
How much therapy is enough? A session-by session
analysis of the psychotherapy dose-effect relation-
ship. The Journal of Psychotherapy Practice andResearch, 5, 132–151.
Kavale, K. A., & Forness, S. R. (1999). The handbookof school psychology: Effectiveness of special edu-cation. Washington, DC: American Association on
Mental Retardation.
McCall, R. B., C. S., & Green, B. L. (1999). Some
non-randomized constructed comparison groups
for evaluating age-related outcomes of intervention
programs. American Journal of Evaluation, 2(20),
213-226.
Mahoney, G., Boyce, G., Fewell, R., Spiker, D., & Whee-
den, C. A. (1997). The relationship of parent-child
interaction to the effectiveness of early intervention
services for at-risk children with disabilities. Topicsin Early Childhood Special Education, 18(1), 5–
17.
McCall, R. (2004). Beyond the methodological gold stan-
dards of behavioral research: Considerations for
practice and policy. Society for Research in ChildDevelopment: Social Policy Report, 18(2).
National Association for the Education of Young
Copyright © 2011 Lippincott Williams & Wilkins. Unauthorized reproduction of this article is prohibited.
LWW/IYC IYC200068 March 2, 2011 5:23 Char Count= 0
132 INFANTS & YOUNG CHILDREN/APRIL-JUNE 2011
Children (2008). Early childhood curriculum, as-sessment, and program evaluation: building aneffective, accountable system in programs for chil-dren birth through age 8. Washington, DC: NAEYC.
National Research Council/National Academy of
Sciences (2009). Early childhood assessment:Why, what, and how? Washington, DC: National
Academies Press.
NICHD Early Child Care Research Network (2003).
Does amount of time spent in child care predict
socio-emotional adjustment during the transition
to kindergarten? Child Development, 74(4), 976–
1005.
Office of Special Education Programs (2006). Report-ing OSEP outcome indicators for early interven-tion programs. Washington, DC: US Department of
Education.
PEW Charitable Trusts. (2008). Taking stock: Assessing
and improving early childhood learning and pro-
gram quality—Report of the national early child-
hood accountability task force. Chicago, IL: PEW
Charitable Trusts.
Ramey, C., & Ramey, S. (1998). Early education and early
experience. American Psychologist, 53(2), 4–20.
Reynolds, R. J. (1995). One year in preschool interven-
tion or two? Does it matter? Early Childhood Re-search Quarterly, 10(1), 1–31.
Shonkoff, J. P., & Hauser-Cram, P. (1987). Early interven-
tion for disabled infants and their families: A quan-
titative analysis. Pediatrics, 80(5), 650–658.
Shonkoff, J. P., Meisels, S. M. (2000). Handbook of
early childhood intervention. New York, NY: Ox-
ford Press.
Spiker, D., & Hopmann, M. (1997). The effectiveness
of early intervention for children with down syn-
drome. In M. Guralnick (Ed.), The Effectiveness ofEarly Intervention (chap. 13). Baltimore, MD: Paul
Brookes Publishing.
Tait, L. H., McDonald-Culp, A., Huey, E., Culp, R., Starost,
H. J., & Hare, C. (2002). Relation of Head Start
attendance to children’s cognitive and social out-
comes: Moderation by family risk. Early ChildhoodResearch Quarterly, 17(2), 539–558.
US Department of Education (2001). No Child Left Be-hind (NCLB). Washington, DC: Author.
White, K., & Casto, G., (1985). An integrative review of
early intervention efficacy studies with at-risk chil-
dren: Implications for the handicapped. Analysisand Intervention in Developmental Disabilities, 5,7–31
Copyright © 2011 Lippincott Williams & Wilkins. Unauthorized reproduction of this article is prohibited.