Embed Size (px)
Citation preview
Dominance and Submission:
Social Status Biases Economic Sanctions
Emma von Essen
Stockholm University
Eva Ranehill
Stockholm School of Economics
SSE/EFI Working Paper Series in Economics and Finance
No 732
First version: 2011-01
This version: 2011-04
Abstract
Social hierarchy is persistent in all almost all societies. Social norms and their enforcement
are part of sustaining hierarchical systems. This paper combines social status and norm
enforcement, by introducing status in a dictator game with third party punishment. Status is
conveyed by surname; half of the third parties face a dictator with a noble name and half face
a dictator with a common name. Receivers all have common names. We find that low status
men are punished to a greater extent than low status women, high status men, or high status
women. Interestingly, discrimination occurs only in male to male interaction. For offers below
half, or close to half of the allocated resource, male third parties punish male dictators with
common names almost twice as much as their noble counterparts. We find no support for
female discrimination. This result suggests that social status has important implications for
men’s decisions to use economic punishment, and that this holds true in situations where
reputation or strategic concerns have no importance.
Key words: Status, punishment, discrimination, experiment
JEL-Code: C91, D03
We are grateful for comments from Konstanze Albrecht, Johan Almenberg, Anne Boschini, Anna Dreber, Tore
Ellingsen, Armin Falk, Hannah Schildberg-Hörisch, Magnus Johannesson, Astri Muren and Mats Persson and
seminar participants at Zürich University and CEE Copenhagen 2008. Financial support from the Jan Wallander
and Tom Hedelius Foundation, as well as the Carl Silfvén Foundation (E.Ranehill) and Swedish council for
working life and social research (FAS) is gratefully acknowledged (E. von Essen).
2
1. Introduction
In all societies, normative standards of behavior are enforced by formal and informal
sanctions, and the importance of sanctioning possibilities for human economic interaction has
been shown extensively (Ostrom, 2000, Fehr and Gächter, 2000, Carpenter and Matthews,
2005). However, despite the growing literature on sanctioning behavior, most studies are
performed in anonymous settings without social context. We thus still know little about how
punishment is affected by social cues.
This study investigates how relative social status influences sanctioning behavior in a dictator
game with third party punishment. The third party punishment game has been constructed and
used to investigate norm enforcement (Fehr and Fischbacher, 2004). The status manipulation
in this game pertains only to dictators. All participating third parties play against one of four
confederates who participate as dictators in every session. The group of dictators consists of
two men and two women. One of each gender has a noble name indicating high social status;
the other has a common name indicating low status. We can then compare the level and
frequency of punishment among third parties facing dictators of different social status.
In society, sanctions are often imposed by third parties, and the important role of people’s
actions as members of juries, committees and arbitrators has long been recognized. However,
instead of sanctions being applied impartially, previous research finds that third party
punishment is likely to be shaped by social context such as parochialism or the punishers’
relation to the victim (Bernhard et al., 2006; Goette et al., 2006; Lieberman and Linke, 2007).
With respect to the topic dealt with in this study, social status has been shown to affect the
outcome of court proceedings in favour of higher status individuals (e.g. status of defendants
see Sarnecki et al., 2006; Abrams et al., forthcoming, for status of the victim see Phillips
2009).
3
Status is often defined as the honor or prestige attached to one's position in society. General
for many definitions of social status is that, apart from being a commonly recognized ranking
of individuals in a given society, it also implies favourable treatment and increased access to
resources when high (Weiss and Ferschtman, 1998; Ball et al., 2001, Fershtman and Gneezy,
2001). In psychology and sociology, status hierarchies are analysed as a basis on which we
construct our beliefs and behavior.1 Social asymmetries thereby define perceptions of
deservingness, implicit performance expectations and shape appropriate behavior (Weber,
1924; Cummins, 2000; Oxby, 2002). According to this literature, knowledge of relevant status
relations is thus crucial to act successfully in social situations and relative status is likely to
have a fundamental impact on human decision making.2
In this study we use noble names as a marker of high status; an indicator of possessing
ascribed status through membership of the nobility. Using name as a status characteristic has
many advantages. Most importantly, it is exogenous to the experimental setting and can be
introduced without drawing any attention to the status manipulation in itself. Participants thus
remain ignorant about the true aim of the study. Nobility has also been shown to have
behavioral implications in the Swedish marriage market. Almenberg and Dreber (2009) find
that noble individuals are more likely than commoners to find a partner from a higher wealth
bracket than themselves. Further, possessing a noble name has no institutional meaning; the
1 For similar thoughts in economics see Akerlof and Kranton (2000) who discuss the impact of identity and
social category on economic behavior. 2 See for example the literature on Status Characteristics Theory, originally developed in Berger et al. (1966). It
suggests that power and prestige rankings arise in interactional settings based on individual characteristics.
Individuals possessing high status characteristics (such as being white, adult, male or tall) are judged as more
able and better performing, as well as more deserving, independent of their actual performance (Hong and
Bohnet, 2006). Status Characteristics Theory thus predicts subordination and superordination due to a voluntary
and partly unconscious process (Webster and Driskell, 1978). Though SCT has also been criticized, a large
literature of empirical studies confirm that status characteristics have powerful and predictable effects on how we
judge other individuals, and what we expect from them (Kalkhoff and Barnum, 2000; Ridgeway et al, 1998;
Hong and Bohnet, 2006; Simpson and Walker, 2002).
4
Swedish nobility lost its last formal privileges in the 19th
century. However, the surnames
remain as explicit hereditary status markers.3
Previous literature in economics indicates that social status does affect economic behavior. In
laboratory studies, high social status seems to imply larger economic gains. Ball and Eckel
(1996 and 1998) and Ball et al. (2001) investigate the economic benefit of experimentally
manipulated status in an ultimatum game and a double oral auction with multiple equilibria.
Participants in the high status group receive better offers in both games, and this effect is
persistent even in a treatment where allocation to the high status group is obviously random.4
In addition the authors test for the possibility of a status induced change in bidding behavior
by rewarding status in private. In this treatment, where low status individuals are unaware of
the status rewarded, the effect of status disappears. High social status thus appears to induce
favourable treatment partly due to deference on behalf of lower status individuals. Preferential
treatment of high status participants is also found by Glaeser et al., (2000) and Harbaugh et al.
(2001) in the trust game. In both studies, participants with high status are found to elicit more
trustworthy behavior on behalf of the trustees.5 However, the studies by Ball and Eckel (1996,
1998), Ball et al. (2001) and Glaeser et al. (2000) investigate the impact of social status in a
non-anonymous setting, and hence cannot distinguish between the effect of reputational or
strategic concerns versus deference.
This study extends previous research in a number of ways. First, the setting is semi-
anonymous. Semi-anonymity is achieved by revealing the names of the players participating
3 The last occasion a person was raised to the nobility in Sweden was in 1902, and the Swedish monarch has
since then lost the right to ennoble. Surnames pertaining to a specific family benefit from stronger protection in
the Swedish name law than more frequently occurring names. 4. The experiment includes two treatments, and group allocation is random in both. However, whereas one of the
allocation mechanisms is based on a public lottery, the other treatment divides subjects based on a trivia quiz. 5 Glaeser et al., 2000 investigate behavior in a sample of Harvard undergraduates. The participants meet their
counterpart before they are separated again and play the trust game. As status variables the authors consider for
example hours worked for pay, hours spent volunteering, father’s education, number of close friends and proxies
for popularity. Harbaugh et al., 2001 study the behavior of children aged 8, 11, 14 and 17. Age is here seen as a
status marker.
5
in the dictator game to the third party, but at the same time keeping the identity of the third
party unknown to all other players. This allows us to examine whether social status influence
punishment in a transparent way, absent effects of potential future interactions. Second, by
using the third party punishment game (Fehr and Fischbacher, 2004), we examine the effect
of status through the sanction choices of individuals whose payoff is independent of the
decisions previously taken. Third, earlier literature within economics has investigated
preferential treatment in the reward domain. We here investigate whether social status also
moderates sanctioning behavior.6 The inclusion of one participant of each gender in each
status category also allows us to investigate gender and status interactions. Gender itself is
highly connected to social status and previous research indicates that men are more sensitive
to social hierarchies (Campbell, 2002). For example, male groups develop steeper hierarchies
and behave more competitively than female and mixed groups (Colarelli et al., 2006). In a
laboratory experiment, Huberman et al., 2004 find that male participants sacrifice more
resources to obtain social status than female. Fershtman and Gneezy (2001) also find an inter-
male discrimination only when they study discrimination in the trust game among Jews of
different ethnicity. No discrimination is found on behalf of female participants.
Our results indicate that low status men are punished to a greater extent than low status
women, high status men, or high status women. Interestingly, discrimination occurs only in
male to male interaction. For offers below half, or almost half of the allocated resource, male
third parties punish male dictators with common names almost twice as much as their noble
counterparts. We find no support for female discrimination.
Differential treatment in the third party punishment game can arise due to different reasons.
Therefore, having performed the third party punishment game, we also ran a dictator game.
6 Ball and Eckel 1996 perform ultimatum games with status manipulations, but they report no results regarding
the responder behavior.
6
The confederates, who in the first game acted as dictators, are here featured as recipients. If
punishment evolved as a norm enforcing mechanism within relatively stable groups of
individuals, altruistic behavior including altruistic punishment, should primarily pertain to in-
group members. If noble individuals are considered as out-group and commoners as in-group
we would then observe higher punishment of norm violations committed by low status
dictators in the third party punishment game and higher transfers to low status recipients in
the dictator game. If discrimination arises due to liking of a particular status group, this group
would experience lower punishment in the third party punishment game and receive higher
giving in the dictator game to this group.
The dictator game indicates no discrimination in transfers. We therefore find support neither
for an in-group bias nor a difference in liking. We can therefore only speculate why
discrimination arise in the punishment domain.
The rest of the paper is organized as follows. The subsequent section describes the experiment
design of our study. In section three we present our results, before we conclude in section four
where we discuss the possible explanations for our findings as well as future research.
2. Experimental design
The study consists of two separate economic games, a third party punishment game and a
dictator game, each with the same status manipulation. Social status is differentiated via the
participants’ surname, as explained below. All participants in the third party punishment game
received a show up fee of 50 SEK7.
The third party punishment game has three participants, a dictator, a recipient and a third
party. The implementation of the third party punishment game is similar to that of Fehr and
Fischbacher (2004), where the dictator is endowed with twice the amount of the third party. In
7 At the time of the experiment 1 USD corresponded to about 6 SEK, i.e. 100 SEK was about 15 USD.
7
our setting the dictator received 100 SEK and the third party 50 SEK. The recipient gets no
money and has no decision to make. The dictator can transfer money to the recipient in
multiples of 10 SEK, with a maximum of 50 SEK. Thereafter the third party decides,
according to the strategy method, on potential punishment of the dictator’s payoff.8 For each
SEK that the third party chooses to punish the dictator’s payoff is reduced by three. The
payoffs (Wi) of the third party punishment game are thus:
Dictator: Wd(x,p)=100-x-3*p
Third party: Wtp(p)=50-p
Recipient: Wr(x)=x
where x={10, 20, 30, 40, 50} is the sum the dictator transfers to the recipient and
p={0,1,2,...,50} is the punishment imposed by the third party.
Subjects were randomly allocated to the roles of recipients and third parties. For the position
of dictator we recruited a group of four people; a woman and a man with the noble name von
Essen, and a woman and a man with the common name Andersson.9 This group participated
as dictators in every session. Written instructions were distributed and read before making the
decisions, and all third parties answered a set of control questions to ensure that they
understood the consequences of their decisions. The recipients were asked to state their
expectation concerning the third party punishment, also using the strategy method.
8 The strategy method is elicitation of contingent responses. The third party made a sanctioning decision
contingent on each possible transfer level before being informed of the dictator’s decision. It is possible that this
elicitation method induces different behaviors compared to a situation where the third party knows the dictators
transfer decision (called the “specific response method”). Evidence from Cason and Mui (1998) and Brandts and
Charness (2000) do not indicate that this is the case. 9 These names are used as they are very strong indicators of nobility and vice versa. Von is a well known
indicator of Swedish nobility and names ending with –sson are the most common names in Sweden. Andersson
is the second most frequent surname. Swedish law awards intellectual property rights to surnames depending on
how distinct they are. Names with the prefix von and other noble surnames are protected such that that a
common person cannot add von to his or her surname (Statistics Sweden
http://www.scb.se/Grupp/allmant/BE0801_2005K04_TI_10_A05ST0504.pdf, Access 090122). Andersson was
chosen since we had easy access to people with that name who could participate in the study. The noble name of
one of the authors was never revealed to the participants. Due to Swedish tax regulations we had to collect the
name and address of all participants after they had completed the experiment. We were therefore able to control
for whether the third parties where noble or not. In the sample of third parties there were none with a noble
name.
8
The status manipulation is apparent only to the third party, who sees the names of the two
dictator game participants on top of the decision sheet. The experiment is thus semi-
anonymous such that the third party knows the name of the dictator he or she punishes. In
other aspects the game is anonymous and the third parties and recipients are aware of this.
Apart from the names on the decision sheet, no reference was made to status or gender, and
no subject indicated any interest in the names, nor in any aspect of status or gender. Each
subject also answered a number of survey questions about age, gender, income, motives and
beliefs about other player’s income and wealth. This gives us an indication about the
mechanisms behind the observed result.
Based on the results from the third party punishment game only two of our confederates in the
third party punishment game, the common and the noble man, were used as recipients in the
dictator game. The dictator was endowed with 100 SEK and the recipient with was endowed
with no money. Money could be transferred from the dictator to the recipient in multiples of
10 SEK, with a maximum of 50 SEK. The recipient had no decision to make.
The dictator game was run on a separate sample consisting only of male students. The status
manipulation was semi-anonymous and implemented in the same way as in the third party
punishment game. Each dictator saw the name of the recipient on top of his decision sheet.
Apart from this, no reference was made to the other player or to status. In both games subjects
were placed at separate locations and each session took approximately 20 minutes.
3. Results: Does sanction behavior vary with social status?
In this section, we start by presenting the general results regarding third party behavior.
Thereafter we address the effect of the dictator’s status category and gender on third parties
decisions. Throughout the analysis we explore the proportion of punishment, i.e. the
percentage of those who punished, as well as the level of punishment. To calculate the
9
proportion of punishment we define the binary variable punishment, defined as a positive
payment on behalf of the third party at any transfer level. Punishment level is simply the
average punishment across the third party sample at a specific transfer level. We end by
discussing the underlying mechanisms behind the results, by studying the behavior in a
dictator game as well as the effect of third party beliefs regarding dictator wealth and
income.10
3.1 General results
In total, our sample consists of 132 observations of third party behavior, 63 male and 69
female.11
14 of these observations were removed from the sample. In a majority of the cases
this was due to subjects indicating that they knew another participant, or incapacity to
understand the experimental setup.12
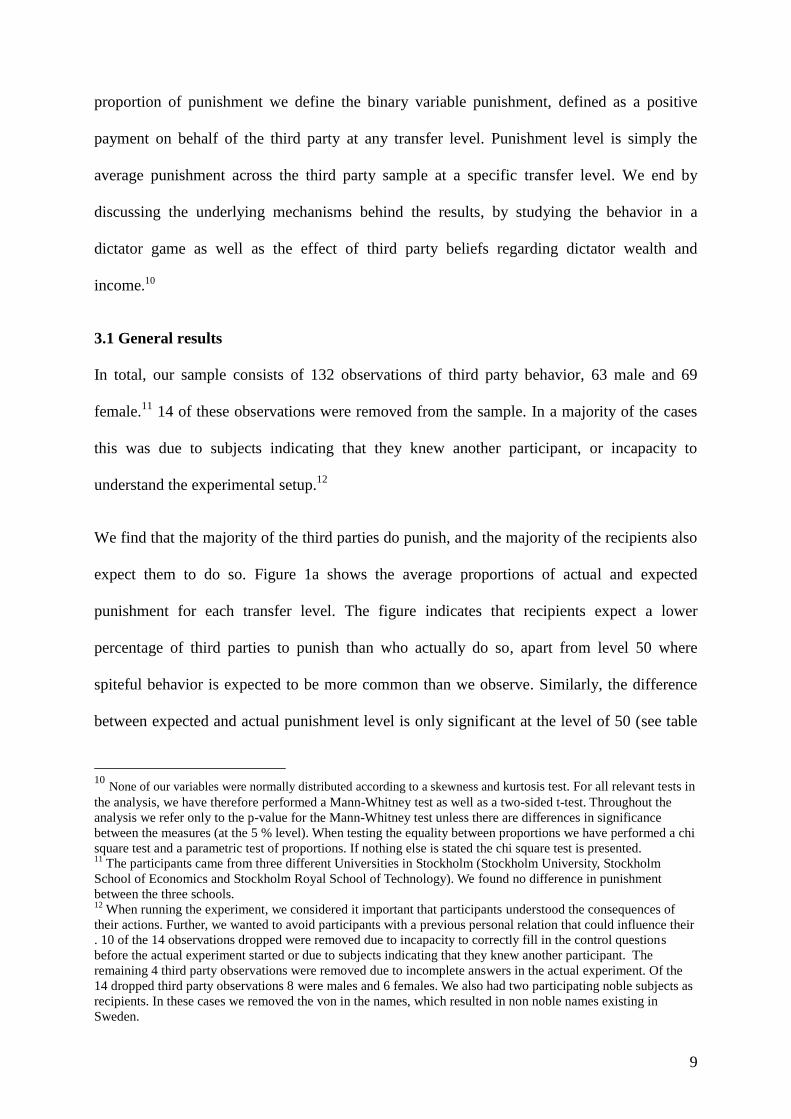
We find that the majority of the third parties do punish, and the majority of the recipients also
expect them to do so. Figure 1a shows the average proportions of actual and expected
punishment for each transfer level. The figure indicates that recipients expect a lower
percentage of third parties to punish than who actually do so, apart from level 50 where
spiteful behavior is expected to be more common than we observe. Similarly, the difference
between expected and actual punishment level is only significant at the level of 50 (see table
10
None of our variables were normally distributed according to a skewness and kurtosis test. For all relevant tests in
the analysis, we have therefore performed a Mann-Whitney test as well as a two-sided t-test. Throughout the
analysis we refer only to the p-value for the Mann-Whitney test unless there are differences in significance
between the measures (at the 5 % level). When testing the equality between proportions we have performed a chi
square test and a parametric test of proportions. If nothing else is stated the chi square test is presented. 11
The participants came from three different Universities in Stockholm (Stockholm University, Stockholm
School of Economics and Stockholm Royal School of Technology). We found no difference in punishment
between the three schools. 12
When running the experiment, we considered it important that participants understood the consequences of
their actions. Further, we wanted to avoid participants with a previous personal relation that could influence their
. 10 of the 14 observations dropped were removed due to incapacity to correctly fill in the control questions
before the actual experiment started or due to subjects indicating that they knew another participant. The
remaining 4 third party observations were removed due to incomplete answers in the actual experiment. Of the
14 dropped third party observations 8 were males and 6 females. We also had two participating noble subjects as
recipients. In these cases we removed the von in the names, which resulted in non noble names existing in
Sweden.
10
1d in appendix). The effect however, is reversed. The proportion of punishers and the level of
punishment we observe in our sample are in accordance with earlier studies (see for example
Fehr and Fishbacher, 2004; Leibrandt and Lopéz-Peréz, 2008).13
Figure 1a. Proportion of actual and expected punishment.
For each 10 SEK reduction of transfer from the dictator, the third party imposes an average
punishment of slightly more than 3 SEK, or a deduction of about 10 SEK. Thus, in
expectance, the dictator is left with 50 SEK no matter what he or she chooses to do. The
average punishment for a dictator who keeps the whole endowment was 17 SEK, deducing
the dictator’s income with 51 SEK.
In the next section we focus on the distribution of punishment based on two dictator
characteristics; gender and nobility. All our third parties have a non noble name, implying that
we compare the punishment decision of a common third party facing either a noble or a
common dictator.
3.2 Punishment based on dictator nobility and gender
13
We find close to significant gender differences in proportion of punishment and punishment expectations.
65% of the men and 79% of the women choose to punish (p=0,09). The corresponding numbers for expected
punishment among male and female recipients is 60% and 76% (p=0.06). The level of punishment among third
parties and the expected level of punishment among recipients do not vary by gender at any level of punishment.
11
Variation in social status and gender entails four dictator categories in our experiment; noble
women (NW), common women (CW), noble men (NM), and common men (CM). Among the
common male dictators, 90% are punished at least at any level. The proportion of punishment
in the other three categories lies between 60-70%. Testing for equality of punishment
proportions between common men and the other groups we find a significant difference
compared to noble and common women, and a close to significant difference in relation to the
group noble men (p-values 0.05, 0.01, and 0.09 respectively, see table 1c in appendix). This is
an indication that both gender and social status play a role for sanctioning behavior.
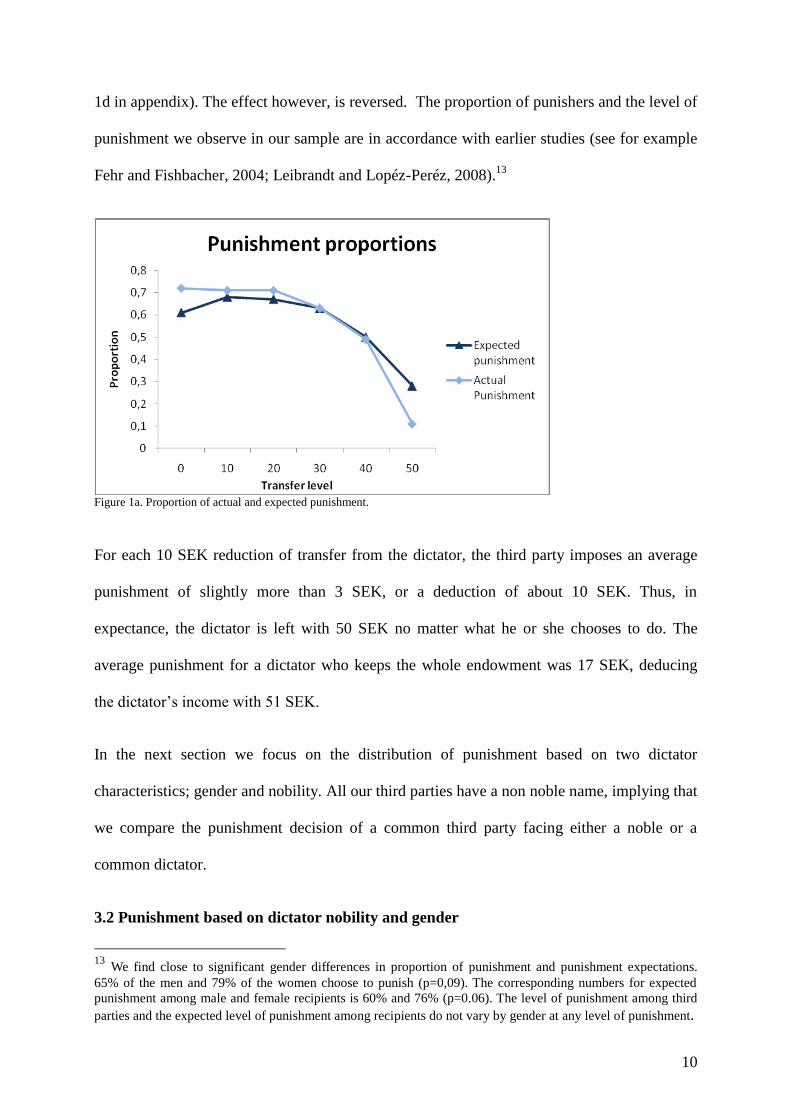
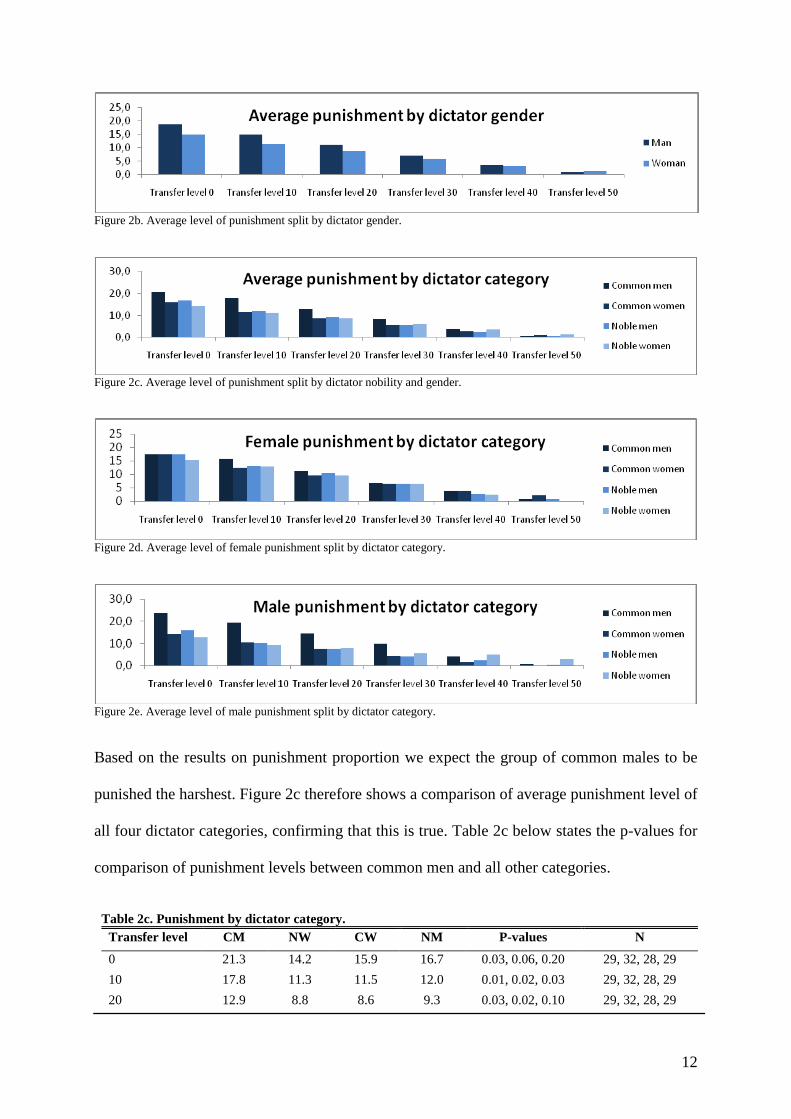
Figures 2a-e below illustrate the average level of punishment at each transfer level, separated
by the two dimensions; gender and nobility.14
Figure 2a shows the average level of
punishment of noble versus common dictators. The difference between the two categories is
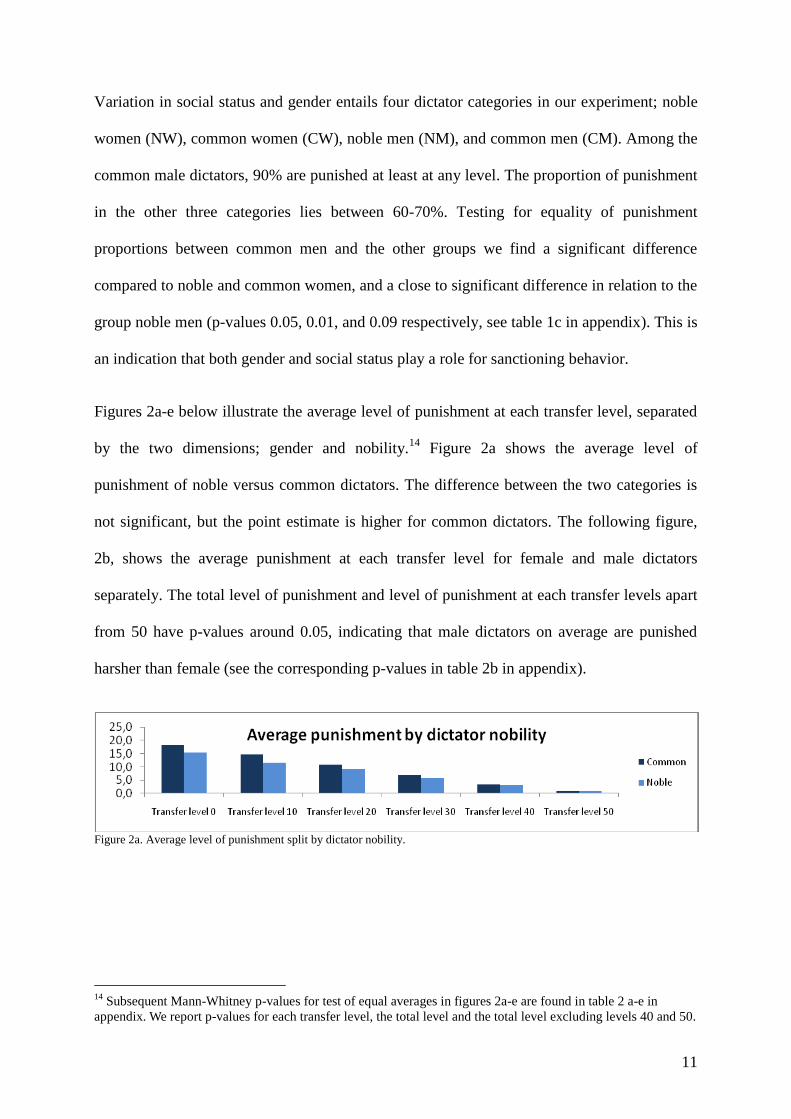
not significant, but the point estimate is higher for common dictators. The following figure,
2b, shows the average punishment at each transfer level for female and male dictators
separately. The total level of punishment and level of punishment at each transfer levels apart
from 50 have p-values around 0.05, indicating that male dictators on average are punished
harsher than female (see the corresponding p-values in table 2b in appendix).
Figure 2a. Average level of punishment split by dictator nobility.
14
Subsequent Mann-Whitney p-values for test of equal averages in figures 2a-e are found in table 2 a-e in
appendix. We report p-values for each transfer level, the total level and the total level excluding levels 40 and 50.
12
Figure 2b. Average level of punishment split by dictator gender.
Figure 2c. Average level of punishment split by dictator nobility and gender.
Figure 2d. Average level of female punishment split by dictator category.
Figure 2e. Average level of male punishment split by dictator category.
Based on the results on punishment proportion we expect the group of common males to be
punished the harshest. Figure 2c therefore shows a comparison of average punishment level of
all four dictator categories, confirming that this is true. Table 2c below states the p-values for
comparison of punishment levels between common men and all other categories.
Table 2c. Punishment by dictator category.
Transfer level CM NW CW NM P-values N
0 21.3 14.2 15.9 16.7 0.03, 0.06, 0.20 29, 32, 28, 29
10 17.8 11.3 11.5 12.0 0.01, 0.02, 0.03 29, 32, 28, 29
20 12.9 8.8 8.6 9.3 0.03, 0.02, 0.10 29, 32, 28, 29
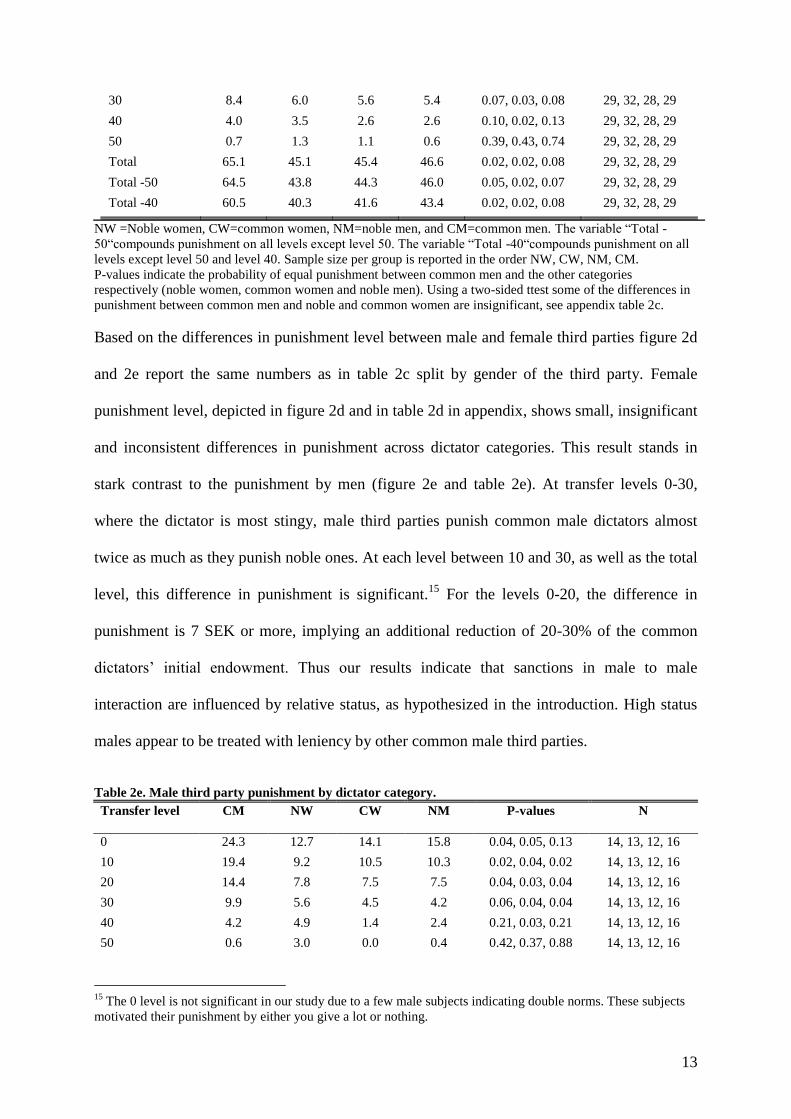
13
30 8.4 6.0 5.6 5.4 0.07, 0.03, 0.08 29, 32, 28, 29
40 4.0 3.5 2.6 2.6 0.10, 0.02, 0.13 29, 32, 28, 29
50 0.7 1.3 1.1 0.6 0.39, 0.43, 0.74 29, 32, 28, 29
Total 65.1 45.1 45.4 46.6 0.02, 0.02, 0.08 29, 32, 28, 29
Total -50 64.5 43.8 44.3 46.0 0.05, 0.02, 0.07 29, 32, 28, 29
Total -40 60.5 40.3 41.6 43.4 0.02, 0.02, 0.08 29, 32, 28, 29
NW =Noble women, CW=common women, NM=noble men, and CM=common men. The variable “Total -
50“compounds punishment on all levels except level 50. The variable “Total -40“compounds punishment on all
levels except level 50 and level 40. Sample size per group is reported in the order NW, CW, NM, CM.
P-values indicate the probability of equal punishment between common men and the other categories
respectively (noble women, common women and noble men). Using a two-sided ttest some of the differences in
punishment between common men and noble and common women are insignificant, see appendix table 2c.
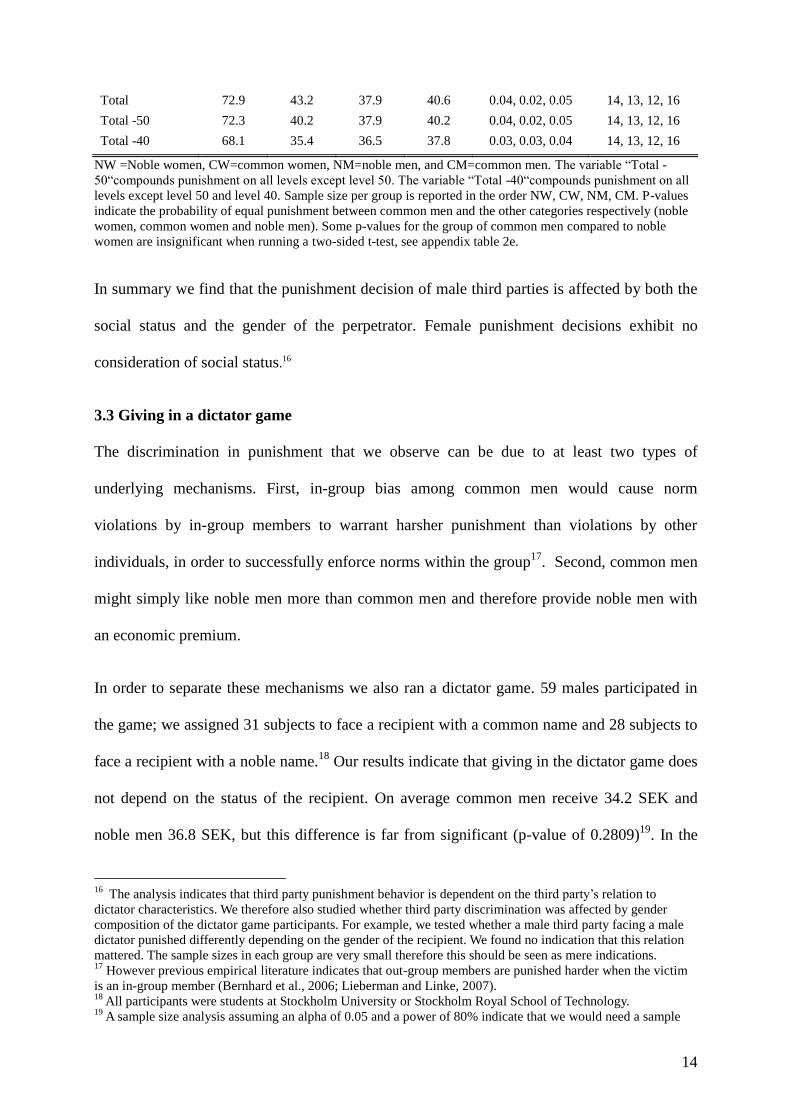
Based on the differences in punishment level between male and female third parties figure 2d
and 2e report the same numbers as in table 2c split by gender of the third party. Female
punishment level, depicted in figure 2d and in table 2d in appendix, shows small, insignificant
and inconsistent differences in punishment across dictator categories. This result stands in
stark contrast to the punishment by men (figure 2e and table 2e). At transfer levels 0-30,
where the dictator is most stingy, male third parties punish common male dictators almost
twice as much as they punish noble ones. At each level between 10 and 30, as well as the total
level, this difference in punishment is significant.15
For the levels 0-20, the difference in
punishment is 7 SEK or more, implying an additional reduction of 20-30% of the common
dictators’ initial endowment. Thus our results indicate that sanctions in male to male
interaction are influenced by relative status, as hypothesized in the introduction. High status
males appear to be treated with leniency by other common male third parties.
Table 2e. Male third party punishment by dictator category.
Transfer level CM NW CW NM P-values
N
0 24.3 12.7 14.1 15.8 0.04, 0.05, 0.13 14, 13, 12, 16
10 19.4 9.2 10.5 10.3 0.02, 0.04, 0.02 14, 13, 12, 16
20 14.4 7.8 7.5 7.5 0.04, 0.03, 0.04 14, 13, 12, 16
30 9.9 5.6 4.5 4.2 0.06, 0.04, 0.04 14, 13, 12, 16
40 4.2 4.9 1.4 2.4 0.21, 0.03, 0.21 14, 13, 12, 16
50 0.6 3.0 0.0 0.4 0.42, 0.37, 0.88 14, 13, 12, 16
15
The 0 level is not significant in our study due to a few male subjects indicating double norms. These subjects
motivated their punishment by either you give a lot or nothing.
14
Total 72.9 43.2 37.9 40.6 0.04, 0.02, 0.05 14, 13, 12, 16
Total -50 72.3 40.2 37.9 40.2 0.04, 0.02, 0.05 14, 13, 12, 16
Total -40 68.1 35.4 36.5 37.8 0.03, 0.03, 0.04 14, 13, 12, 16
NW =Noble women, CW=common women, NM=noble men, and CM=common men. The variable “Total -
50“compounds punishment on all levels except level 50. The variable “Total -40“compounds punishment on all
levels except level 50 and level 40. Sample size per group is reported in the order NW, CW, NM, CM. P-values
indicate the probability of equal punishment between common men and the other categories respectively (noble
women, common women and noble men). Some p-values for the group of common men compared to noble
women are insignificant when running a two-sided t-test, see appendix table 2e.
In summary we find that the punishment decision of male third parties is affected by both the
social status and the gender of the perpetrator. Female punishment decisions exhibit no
consideration of social status.16
3.3 Giving in a dictator game
The discrimination in punishment that we observe can be due to at least two types of
underlying mechanisms. First, in-group bias among common men would cause norm
violations by in-group members to warrant harsher punishment than violations by other
individuals, in order to successfully enforce norms within the group17
. Second, common men
might simply like noble men more than common men and therefore provide noble men with
an economic premium.
In order to separate these mechanisms we also ran a dictator game. 59 males participated in
the game; we assigned 31 subjects to face a recipient with a common name and 28 subjects to
face a recipient with a noble name.18
Our results indicate that giving in the dictator game does
not depend on the status of the recipient. On average common men receive 34.2 SEK and
noble men 36.8 SEK, but this difference is far from significant (p-value of 0.2809)19
. In the
16
The analysis indicates that third party punishment behavior is dependent on the third party’s relation to
dictator characteristics. We therefore also studied whether third party discrimination was affected by gender
composition of the dictator game participants. For example, we tested whether a male third party facing a male
dictator punished differently depending on the gender of the recipient. We found no indication that this relation
mattered. The sample sizes in each group are very small therefore this should be seen as mere indications. 17
However previous empirical literature indicates that out-group members are punished harder when the victim
is an in-group member (Bernhard et al., 2006; Lieberman and Linke, 2007). 18
All participants were students at Stockholm University or Stockholm Royal School of Technology. 19
A sample size analysis assuming an alpha of 0.05 and a power of 80% indicate that we would need a sample
15
study by Fershtman and Gneezy (2001) a difference is found in trust behavior depending on
social category. However, in line with our results, no differentiation based on social category
is found in a dictator game. Our results do thus neither support the explanation of in-group
bias nor that of liking. They point out that discrimination depending on status pertains only to
the punishment domain, and not to giving.
3.4 Further analysis
The discrimination based on social category that we observe might also be due not to social
status per se but to variables correlated, or perceived to be correlated, with nobility. Nobility
may for example influence beliefs about dictator wealth, income or education. We identify
two potential sources of bias. First, if variables believed to be correlated with nobility have
status implications in their own right, this leads us to overestimate the effect of nobility.
Second, beliefs of high wealth or income may also reinforce mechanisms not directly linked
to status such as inequality aversion (Bolton and Ockenfels, 2000; Croson and Gneezy, 2009;
Fehr and Schmidt, 1999). If participants believe that nobility is positively correlated with
wealth, inequality aversion would cause us to underestimate the effect of social status
(nobility). As shown in Almenberg and Dreber, 2009 the Swedish nobility has a higher wealth
than the common population. The fact that women are found to be more inequality averse
than men could be a contributing factor to the gender differences in discrimination we find
(Andreoni and Vesterlund 2001, Dickinson and Tiefenthaler 2002, Selten and Ockenfels
1998).
All third parties in the third party punishment game were asked to state their beliefs regarding
dictator wealth and income in relation to the average student and all dictators in the dictator
game were asked to do the same with respect to the recipient. The number of third parties who
size of 2096 subjects in order to get significant results. Se appendix table 3a for descriptive statistics.
16
indicated that they believed the dictator to have a higher wealth and income than the average
student are roughly equal irrespective of whether they faced a noble or a non-noble dictator.20
Further, what subject’s rate as being fair is not influenced by the status of the recipient in any
of the two games. Further, 82 percent of participants consider an equal split as fair behavior.
This corroborates the findings of Lieberman and Linke (2004), who find that even though
third party punishment varies with social category, the third parties’ moral judgement
pertaining to the norm violation does not. It thus appears as if it is the scale of punishment that
differs across status categories, not the judgement of the norm in itself. These results indicate
that social status, also when controlling for beliefs of relative income and wealth, has an
impact on costly punishment behavior in male to male interactions when distribution norms
are violated. We also performed regression analysis which confirm our main results and
indicate that third party beliefs concerning the wealth and income of the dictator as well as
fairness have no significant effect on punishment.21
4. Discussion
Previous research in economics indicates that high social status conveys an economic
premium (Ball and Eckel, 1996, 1998; Ball et al., 2001; Glaeser et al., 2000; Almenberg and
Dreber, 2009). Our results illustrate that high social status induces lower punishment in a third
20
Of those third parties facing a noble dictator, 17 (12) subjects thought their counterpart to had a higher wealth
(income) than the average student. Among those facing a non-noble dictator, the corresponding number was 16
(14). These numbers are evenly distributed among men and women. Male noble dictators playing a third party
who assumed him to have a wealth above average, are punished the least of all groups. Non-noble dictators,
whose third party assumed him to have a high wealth are punished the harshest. In the male-to-male punishment
of commoners the effect of wealth beliefs goes in the opposite direction. However, the sample sizes are too small
for a relevant analysis. 21
The OLS regression analysis is based on parametric assumptions that may not be fulfilled. The same set of
control variables was included in the regression for each punishment level; beliefs about income, wealth and
fairness, gender of all players, university and age of third party. The variables for beliefs regarding wealth and
income were coded as 1, if third parties who believed the dictator to have a wealth (income) above the average
student and 0 otherwise. The variable for fairness was coded to take the value 1 if subjects indicated an equal
split of the initial dictator endowment as fair and 0 otherwise. We also pooled the data over all six decisions
elicited by the strategy method for each third party, clustering on individual third parties. In all regressions male
to male discrimination is significant (p-value 0.033), and beliefs of wealth and income remain insignificant. The
results from the regression analysis are available upon request.
17
party punishment game, though only in male to male interactions. Male third parties punish
common male dictators almost twice as much as their noble counterparts, but no effect is
found in female to female or mixed interactions. We do not find a discriminatory effect of
social status on altruistic behavior in a dictator game; male participants are not more generous
to high status individuals.
For several reasons, the effect of social status in the third party punishment game is
surprisingly large. The Swedish nobility lost all its formal economic and political privileges in
the 19th
century. The status variable thus has no relation to the experimental context or to
merit, and no references were made to name, nobility or social status during the experiment.
The semi-anonymous design also diminishes reputation and strategic concerns. Despite this,
the average punishment is significantly different between male status categories, and this
difference represents 20-30 percent of the dictators’ initial endowments. The effect remains
stable when controlling for beliefs of wealth and income, and does not rely on fairness
considerations being status dependent.
Our results corroborate previous research implying that men are more sensitive to social status
in economic decision making tasks (Fershtman and Gneezy, 2001; Huberman et al, 2004).
Many hierarchies in western society have throughout history been exclusive for men or male
dominated. Nobility in Sweden, for example, is only hereditary on the male side; thus
historically implying a larger value for men. If men were and are more likely to benefit from
status, such as nobility, this explains the higher level of investment in status observed by men
in comparison to women (Campbell, 2002; Huberman et al., 2004; Pawlowski et al., 2000).
Men are also often found to be more competitive compared to women (see review by Croson
and Gneezy, 2009). Since noble names are impossible to acquire, competition for status in the
context of the present study is relevant only within the group of non noble names. An
additional reason for the discrepancy in male and female behavior could be gender differences
18
in inequality aversion. Previous literature has found women to be more inequality averse
compared to men (Andreoni and Vesterlund, 2001; Dickinson and Teifenhaler, 2002; Selten
and Ockenfels, 1998). If high social status is associated with other benefits, females should
punish high status individuals more.
A few studies have explored in-group bias settings with third party punishment (Bernhard et
al. 2008 and Götte et al. 2006). Contrary to what is found in this study, Bernhard et al. (2006)
find that dictators from another group than the third party are punished harsher when facing a
recipient from the same group as the third party. Lieberman and Linke (2004) found similar
results in a hypothetical setting. This is the opposite of what in-group bias in a third party
punishment game would predict if punishment serves as a norm enforcing device. All our
third parties and recipients are from the same status group, individuals with non noble names.
The divergence of our results in relation to the other studies may partly be explained by the
fact that individuals with a common name can be considered a large and not well defined
social group, or that status considerations override group belonging. Our results also differ
from what Fehr et al. (2008) find in a trust game with third party punishment in India. They
find that low caste participants punish less than high caste participants, but punishment in
both groups is independent of the caste belonging of the norm violator. Several potential
mechanisms might explain this variation in results. Norm enforcement could, for example,
differ between cooperative and distribution norms. Fehr et al. (2010) propose that historically
repressed groups have a lesser willingness to punish violators in general. Culture might create
differences between the studies; India’s cast system induces a more pronounced status
hierarchy and may therefore repress the decision to punish by low status individuals more
than the historical division between nobility and commoners in Sweden. Even though the
Swedish nobility lost its privileges more than a decade ago one could speculate that the
punishment specific discrimination is due to historic power inequalities. The decision to
19
punish an individual of higher status may entail a larger risk of retaliation than the decision
not to give. Speculating further, this fear of retaliation may have been internalized as
differences in the penalty scale for a specific norm violation depending on social status. The
result in Lieberman and Linke (2004) as well as the fairness judgements in our study supports
the suggestion that the moral judgment of a norm transgression is stable across social
categories. Further Fehr et al. (2010) do not differentiate between men and women, which
diminishes the comparability between the two studies.
Our study shows a surprisingly large effect of social status on punishment behavior,
underlining the importance of social status as a modulator of behavior in male interactions. By
guiding appropriate behavior, knowledge of status relations is an important key to
successfully navigate in human societies. Future research is needed concerning various types
of social status and its implications for economic decision making in different situations.
20
Experiment instructions
Instructions for participant A.
Welcome to this study in economics!
Please read the following instructions carefully. Depending on how you and your counterparts
decide, you can earn money in addition to the 50 SEK you earn by participating. Therefore, it
is important that you read and follow the instructions.
Please do not talk during the study. If you have any questions, raise your hand and we will
come to answer your question.
Throughout this study you will use Swedish crowns. The study comprises three types of
participants: Participants A, participants B and participants C. You are a participant A.
During the study, you will interact with one randomly assigned participant B and one
randomly assigned participant C.
Specific Instructions for the Experiment Procedure
Stage one
In the first stage, participants A are the sole decision-makers. As a participant A you have got
an endowment of 100 SEK. Participant C gets 50 SEK, and participant B gets no endowment.
We ask you to decide how many of the 100 SEK that you wish to assign to participant B. You
can give participant B a number of SEK between 0 and 50 in a multiple of tens, i.e. 0, 10, 20,
30, 40, or 50 SEK. If, for example, you grant participant B 40 SEK, your income at the end of
stage one will amount to 60 SEK, and participant B’s income will amount to 40 SEK. If you
accord her/him 10 SEK, your income will be 90 SEK, and the income of participant B will be
10 SEK at the end of stage one. If you grant B 0 SEK, your income at the end of stage one
will amount to 100 SEK while participant B’s equals 0 SEK.
Stage two
In stage two, only participants C have a decision to make. Participant C can pay to deduct
money from your payoff. Each SEK charged to you as participant A diminishes your income
by 3 SEK, and participant C’s income is reduced by 1 SEK. Participant C can deduct a
number of SEK between 0 and 50. Suppose participant C deducts 2 SEK: your income will
then be reduced by 6 SEK while participant C’s income will be reduced by 2 SEK. If
participant C deducts 19 SEK to you, your income diminishes by 57 SEK and participant C’s
income is reduced by 19 SEK. Participant C takes her or his decision before knowing your
decision, and hence answers how they would like to allocate their money for every possible
decision you can make.
21
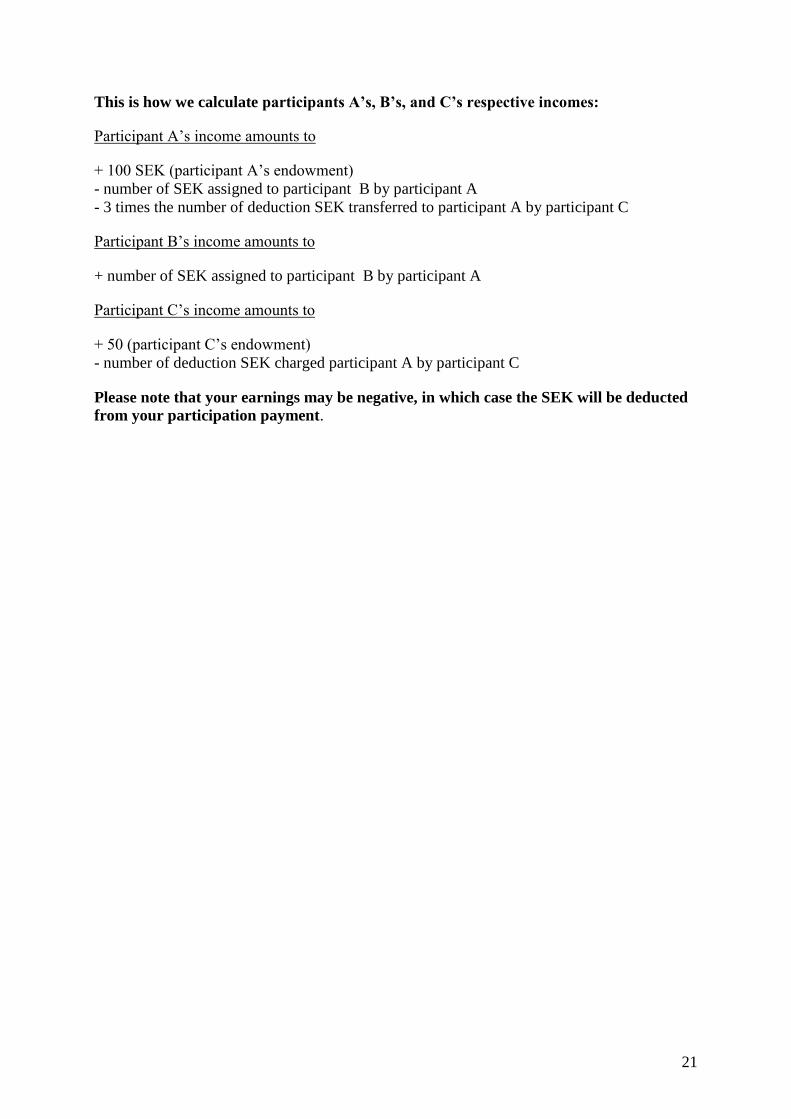
This is how we calculate participants A’s, B’s, and C’s respective incomes:
Participant A’s income amounts to
+ 100 SEK (participant A’s endowment)
- number of SEK assigned to participant B by participant A
- 3 times the number of deduction SEK transferred to participant A by participant C
Participant B’s income amounts to
+ number of SEK assigned to participant B by participant A
Participant C’s income amounts to
+ 50 (participant C’s endowment)
- number of deduction SEK charged participant A by participant C
Please note that your earnings may be negative, in which case the SEK will be deducted
from your participation payment.
22
Control Questions
It is important that all participants have understood the rules of the game. Therefore we ask
you to answer the following control questions. When you have finished, signal to us by
raising your hand.
A. Participant A assigns 0 SEK to participant B.
a) Participant C charges participant with 0 SEK deduction.
What is participant A’s income? ______________
What is participant B’s income? ______________
What is participant C’s income? ______________
b) Participant C charges participant A with 30 SEK deduction.
What is participant A’s income? ______________
What is participant B’s income? ______________
What is participant C’s income? ______________
2. Participant A assigns 40 SEK to participant B.
a) Participant C charges participant A with 0 SEK deduction.
What is participant A’s income? ______________
What is participant B’s income? ______________
What is participant C’s income? ______________
b) Participant C charges participant A with15 SEK deduction.
What is participant A’s income? ______________
What is participant B’s income? ______________
What is participant C’s income? ______________
23
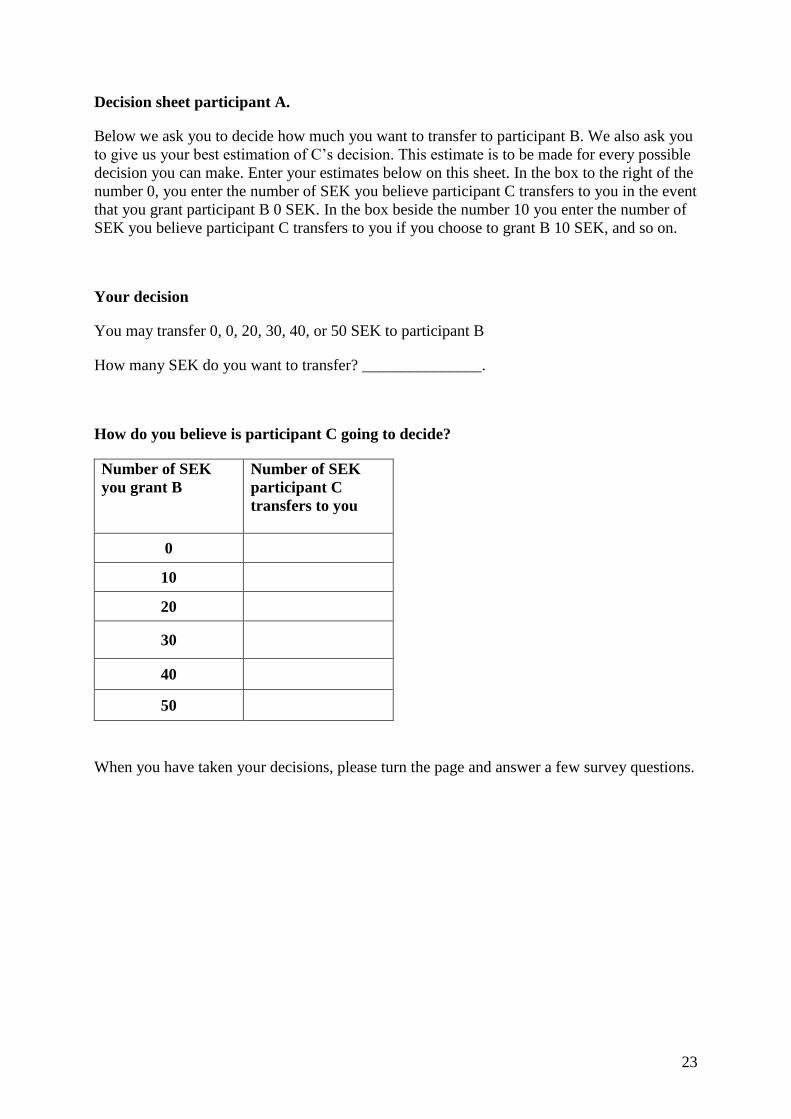
Decision sheet participant A.
Below we ask you to decide how much you want to transfer to participant B. We also ask you
to give us your best estimation of C’s decision. This estimate is to be made for every possible
decision you can make. Enter your estimates below on this sheet. In the box to the right of the
number 0, you enter the number of SEK you believe participant C transfers to you in the event
that you grant participant B 0 SEK. In the box beside the number 10 you enter the number of
SEK you believe participant C transfers to you if you choose to grant B 10 SEK, and so on.
Your decision
You may transfer 0, 0, 20, 30, 40, or 50 SEK to participant B
How many SEK do you want to transfer? _______________.
How do you believe is participant C going to decide?
Number of SEK
you grant B
Number of SEK
participant C
transfers to you
0
10
20
30
40
50
When you have taken your decisions, please turn the page and answer a few survey questions.
24
Survey questions for participant A
1. What are you studying? _______________________________
2. I am a woman man
3. I am _________ years old.
4. What do you think is a fair allocation of the 100 SEK?
5. What is the reason behind the decision you made?
25
Instructions for participant B.
Welcome to this study in economics!
Please read the following instructions carefully. Depending on how you and your counterparts
decide, you can earn money in addition to the 50 SEK you earn by participating. Therefore, it
is important that you read and follow the instructions.
Please do not talk during the study. If you have any questions, raise your hand and we will
come to answer your question.
Throughout this study you will use Swedish crowns. The study comprises three types of
participants: Participants A, participants B and participants C. You are a participant B.
During the study, you will interact with one randomly assigned participant A and one
randomly assigned participant C.
Description of the two parts of the study
Stage one
In the first stage, participants A are the sole decision-makers. At the beginning of stage one,
participants A get an endowment of 100 SEK. Participants C get an endowment of 50 SEK,
whereas you as a participant B get no endowment. Participant A must decide how many of
her/his 100 SEK s/he wishes to assign to you. S/he can transfer to you a number of SEK
between 0 and 50 in a multiple of tens, i.e. 0, 10, 20, 30, 40, or 50 SEK. If, for example,
participant A grants you 40 SEK, her/his income at the end of stage one will amount to 60
SEK, and your income will amount to 40 SEK. If s/he accords you 10 SEK, her/his income
will be 90 SEK, and your own income will be 10 SEK. If s/he grants you 0 SEK, her/his
income, at the end of stage one will result in 100 SEK, and your own income will result in 0
SEK.
Stage two
In stage two, only the participants C have a decision to make. Participant C can pay to deduct
money from A. Each SEK charged to participant A diminishes A’s income by 3 SEK, and
participant C’s income is reduced by 1 SEK. Participant C can deduct a number of SEK
between 0 and 50. Suppose participant C charges 2 SEK: A’s income will then be reduced by
6 SEK while participant C’s income will be reduced by 2 SEK. If participant C deducts 19
SEK to A, A’s income diminishes by 57 SEK and participant C’s income is reduced by 19
SEK. Participant C takes her or his decision before knowing A’s decision, and hence answers
how they would like to allocate their money for every possible decision A can make.
26
This is how we calculate participants A’s, B’s, and C’s respective incomes:
Participant A’s income amounts to
+ 100 SEK (participant A’s endowment)
- number of SEK assigned to participant B by participant A
- 3 times the number of deduction SEK transferred to participant A by participant C
Participant B’s income amounts to
+ number of SEK assigned to participant B by participant A
Participant C’s income amounts to
+ 50 (participant C’s endowment)
- number of deduction SEK charged participant A by participant C

27
Control Questions
It is important that all participants have understood the rules of the game. Therefore we ask
you to answer the following control questions. When you have finished, signal to us by
raising your hand.
A. Participant A assigns 0 SEK to participant B.
a) Participant C charges participant with 0 SEK deduction.
What is participant A’s income? ______________
What is participant B’s income? ______________
What is participant C’s income? ______________
b) Participant C charges participant A with 30 SEK deduction.
What is participant A’s income? ______________
What is participant B’s income? ______________
What is participant C’s income? ______________
2. Participant A assigns 40 SEK to participant B.
a) Participant C charges participant A with 0 SEK deduction.
What is participant A’s income? ______________
What is participant B’s income? ______________
What is participant C’s income? ______________
b) Participant C charges participant A with 15 SEK deduction.
What is participant A’s income? ______________
What is participant B’s income? ______________
What is participant C’s income? ______________
28
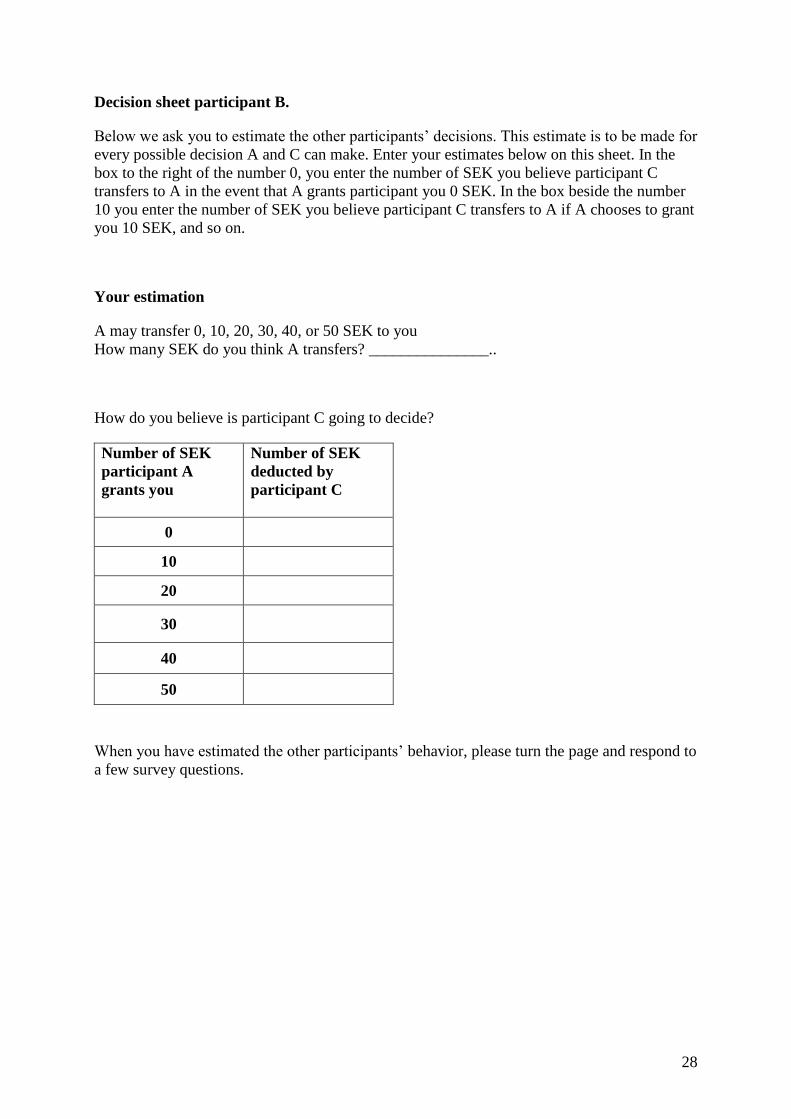
Decision sheet participant B.
Below we ask you to estimate the other participants’ decisions. This estimate is to be made for
every possible decision A and C can make. Enter your estimates below on this sheet. In the
box to the right of the number 0, you enter the number of SEK you believe participant C
transfers to A in the event that A grants participant you 0 SEK. In the box beside the number
10 you enter the number of SEK you believe participant C transfers to A if A chooses to grant
you 10 SEK, and so on.
Your estimation
A may transfer 0, 10, 20, 30, 40, or 50 SEK to you
How many SEK do you think A transfers? _______________..
How do you believe is participant C going to decide?
Number of SEK
participant A
grants you
Number of SEK
deducted by
participant C
0
10
20
30
40
50
When you have estimated the other participants’ behavior, please turn the page and respond to
a few survey questions.
29
Survey questions
1. What are you studying? _______________________________
2. I am a woman man
3. I am _________ years old.
4. How do you think that your average monthly income relates to the average student?
_ Below the average _ Close to average _ Above the average _ Don’t know
4. How do you think that your wealth relates to the average student?
_ Below the average _ Close to average _ Above the average _ Don’t know
5. What do you think is a fair allocation of the 100 SEK?
30
Instructions for Participants C
Welcome to this study in economics!
Please read the following instructions carefully. Depending on how you and your counterparts
decide, you can earn money in addition to the 50 SEK you earn by participating. Therefore, it
is important that you read and follow the instructions.
Please do not talk during the study. If you have any questions, raise your hand and we will
come to answer your question.
Throughout this study you will use Swedish crowns. The study comprises three types of
participants: Participants A, participants B and participants C. You are a participant C.
During the study, you will interact with one randomly assigned participant B and one
randomly assigned participant C.
Description of the two parts of the study
Stage one
In the first stage, participants A are the sole decision-makers. At the beginning of the stage,
participant A gets an endowment of 100 SEK. You as a participant C get an endowment of 50
SEK. Participant B gets no endowment. Participant A must decide how many of her/his 100
SEK s/he wishes to assign to participant B. S/he can transfer to participant B a number of
SEK between 0 and 50 in a multiple of tens, i.e. 0, 10, 20, 30, 40, or 50 SEK. If, for example,
participant A grants participant B 40 SEK, her/his income at the end of stage one will amount
to 60 SEK, and participant B's income will amount to 40 SEK. If s/he grants participant B 10
SEK, her/his income will be 90 SEK, and participant B’s income will be 10 SEK at the end of
stage one. If s/he grants participant B 0 SEK, her/his income, at the end of stage one, will
result in 100 SEK, and participant B’s own income will result in 0 SEK.
Stage two
In stage two, you, as participant C, are the only one to make a decision. You can pay to deduct
SEK from participant A. Each SEK you deduct from participant A diminishes your income by
1 SEK and participant A’s income by 3 SEK. You can assign any number of SEK between 0
and 50. Suppose you deduct 2 SEK to participant A, your income will be reduced by 2 SEK,
and participant A’s income will be reduced by 6 SEK. If you assign 19 SEK to participant A,
your income is diminished by 19 SEK and participant A’s income is reduced by 57 SEK.

31
This is how we calculate participants A’s, B’s, and C’s respective incomes:
Participant A’s income amounts to
+ 100 SEK (participant A’s endowment)
- number of SEK assigned to participant B by participant A
- 3 times the number of deduction SEK transferred to participant A by participant C
Participant B’s income amounts to
+ number of SEK assigned to participant B by participant A
Participant C’s income amounts to
+ 50 (participant C’s endowment)
- number of deduction SEK charged participant A by participant C

32
Control Questions
It is important that all participants have understood the rules of the game. Therefore we ask
you to answer the following control questions. When you have finished, signal to us by
raising your hand.
A. Participant A assigns 0 SEK to participant B.
a) Participant C charges participant with 0 SEK deduction.
What is participant A’s income? ______________
What is participant B’s income? ______________
What is participant C’s income? ______________
b) Participant C charges participant A with 30 SEK deduction.
What is participant A’s income? ______________
What is participant B’s income? ______________
What is participant C’s income? ______________
2. Participant A assigns 40 SEK to participant B.
a) Participant C charges participant A with 0 SEK deduction.
What is participant A’s income? ______________
What is participant B’s income? ______________
What is participant C’s income? ______________
b) Participant C charges participant A with15 SEK deduction.
What is participant A’s income? ______________
What is participant B’s income? ______________
What is participant C’s income? ______________
33
A: ___________________________________
B: ___________________________________
Decision sheet participant C.
In the first part participant A decides how many SEK to give to B. In the second part you
decide how many SEK to deduct. We ask you to state your decision for every possible
decision that A may make. In the box to the right of the number 0, you enter the number of
SEK you want to transfer to participant A in the event that A grant participant B 0 SEK. In the
box beside the number 10 you enter the number of SEK you want to transfer to Participant A
in case s/he chooses to transfer 10 SEK to B, and so on.
Please determine the number of SEK to deduce, if any, you transfer to participant A.
Number of SEK
participant A
grants participant
B
Number of SEK
you transfer to
participant A
0
10
20
30
40
50
When you have taken your decision, please turn the page and respond to a few survey
questions.
34
Survey questions
1. What are you studying? _______________________________
2. I am a woman man
3. I am _________ years old.
4. How do you think that participant A’s income relates to the average student?
_ Below the average _ Close to average _ Above the average _ Don’t know
5. How do you think that participant A’s wealth relates to the average student?
_ Below the average _ Close to average _ Above the average _ Don’t know
6. How do you think that your average monthly income relates to the average student?
_ Below the average _ Close to average _ Above the average _ Don’t know
7. How do you think that your wealth relates to the average student?
_ Below the average _ Close to average _ Above the average _ Don’t know
8. What do you think is a fair allocation of the 100 SEK?
9. What is the reason behind the decision you made?
35
Appendix
Descriptive statistics
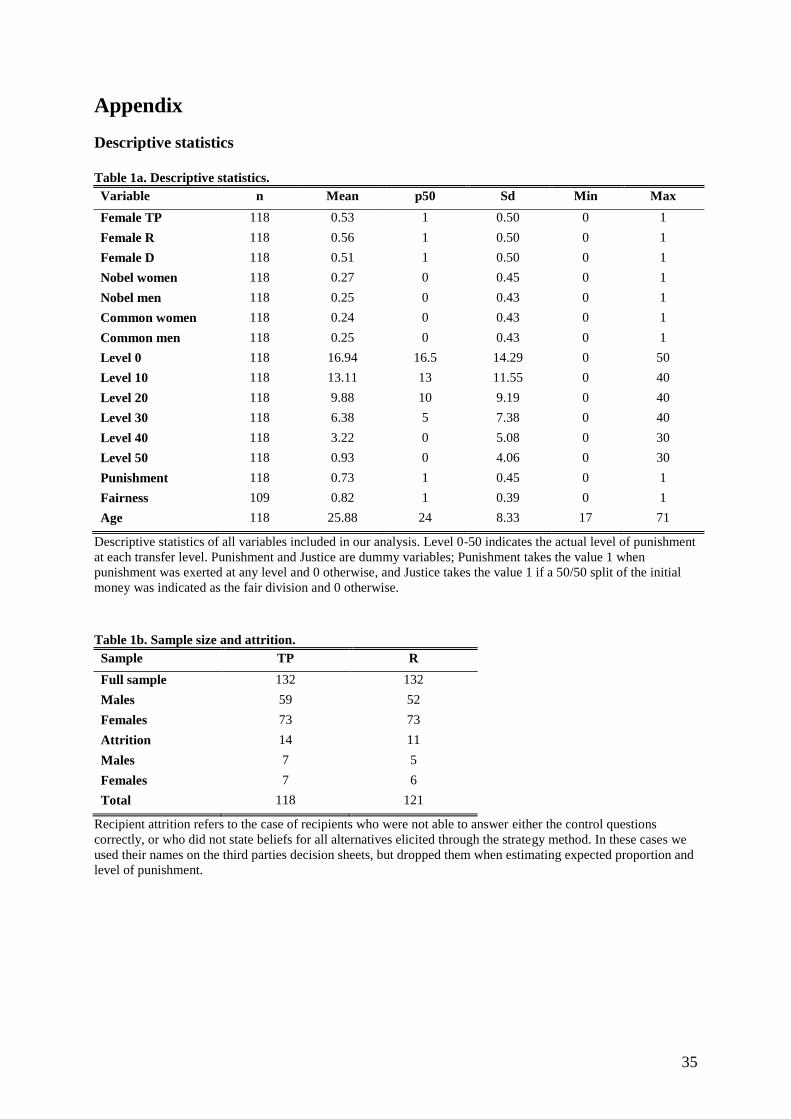
Table 1a. Descriptive statistics.
Variable n Mean p50 Sd Min Max
Female TP 118 0.53 1 0.50 0 1
Female R 118 0.56 1 0.50 0 1
Female D 118 0.51 1 0.50 0 1
Nobel women 118 0.27 0 0.45 0 1
Nobel men 118 0.25 0 0.43 0 1
Common women 118 0.24 0 0.43 0 1
Common men 118 0.25 0 0.43 0 1
Level 0 118 16.94 16.5 14.29 0 50
Level 10 118 13.11 13 11.55 0 40
Level 20 118 9.88 10 9.19 0 40
Level 30 118 6.38 5 7.38 0 40
Level 40 118 3.22 0 5.08 0 30
Level 50 118 0.93 0 4.06 0 30
Punishment 118 0.73 1 0.45 0 1
Fairness 109 0.82 1 0.39 0 1
Age 118 25.88 24 8.33 17 71
Descriptive statistics of all variables included in our analysis. Level 0-50 indicates the actual level of punishment
at each transfer level. Punishment and Justice are dummy variables; Punishment takes the value 1 when
punishment was exerted at any level and 0 otherwise, and Justice takes the value 1 if a 50/50 split of the initial
money was indicated as the fair division and 0 otherwise.
Table 1b. Sample size and attrition.
Sample TP R
Full sample 132 132
Males 59 52
Females 73 73
Attrition 14 11
Males 7 5
Females 7 6
Total 118 121
Recipient attrition refers to the case of recipients who were not able to answer either the control questions
correctly, or who did not state beliefs for all alternatives elicited through the strategy method. In these cases we
used their names on the third parties decision sheets, but dropped them when estimating expected proportion and
level of punishment.
36
Proportion of punishment
Table 1c. Proportion of punishment.
Punishment
proportions
All Men Women
Nw 0.69 0.57 0.78
Cw 0.61 0.54 0.67
Nm 0.72 0.58 0.82
Cm 0.90 0.88 0.92
Punishment
proportions
P-value
non parametric
(ch2)
P-value
parametric
(prtest)
Cm vs Nw 0.05 0.05
Cm vs Cw 0.01 0.01
Cm vs Nm 0.09 0.09
Proportion of actual punishment by dictator characteristics and third party gender. NW=noble female dictators,
CW=common male dictators, NM=noble male dictators and CM=common male dictators.
Table 1d. Expected vs. actual punishment (proportion and level)
Punishment
proportions
Expected Actual P-value
non-parametric
(ch2)
P-value
parametric
(prtest)
0 0.61 0.72 0.10 0.07
10 0.68 0.71 0.58 0.57
20 0.67 0.71 0.49 0.48
30 0.63 0.63 1.00 0.99
40 0.50 0.49 1.00 0.95
50 0.28 0.11 <0.01 <0.01
Punishment
Level
Expected Actual P-value
non-parametric
(MW)
P-value
parametric
(ttest)
0 14.8 16.9 0.19 0.27
10 13.3 13.1 0.93 0.89
20 11.2 9.9 0.70 0.32
30 9.3 6.4 0.13 0.02
40 6.9 3.2 0.94 <0.01
50 5.2 0.9 <0.01 <0.01
Table 2a. Punishment level of noble and common dictators.
Transfer
level
Av. Noble Av. common Difference P-value non-
parametric
(MW)
P-value
parametric
(ttest)
N
0 15.4 18.6 3.3 0.23 0.22 61, 57
10 11.6 14.7 3.1 0.15 0.14 61, 57
20 9.0 10.8 1.8 0.26 0.29 61, 57
30 5.8 7.0 1.3 0.36 0.35 61, 57
40 3.1 3.4 0.3 0.65 0.76 61, 57
50 1.0 0.9 -0.1 0.85 0.89 61, 57
Total 45.8 55.4 9.6 0.24 0.26 61, 57
Total -50 44.8 54.5 9.7 0.24 0.24 61, 57
total -40 41.8 51.2 9.4 0.22 0.21 61, 57
37
Table 2b. Punishment level of female and male dictators.
Transfer
level
Av. Women Av. Men Difference P-value non-
parametric
(MW)
P-value
parametric
(ttest)
N
0 15.0 19.0 4.0 0.04 0.13 60,58
10 11.4 14.9 3.5 0.03 0.10 60,58
20 8.7 11.1 2.4 0.03 0.15 60,58
30 5.8 6.9 1.1 0.05 0.41 60,58
40 3.1 3.3 0.2 0.04 0.85 60,58
50 1.2 0.6 -0.6 0.15 0.44 60,58
Total 45.2 55.9 10.7 0.03 0.21 60,58
Total -50 44.0 55.2 11.2 0.03 0.17 60,58
Total -40 40.9 51.9 11.1 0.03 0.14 60,58
Table 2c. Punishment by dictator category.
Transfer
level
CM NW CW NM P-value non-
parametric
(MW)
P-value
parametric
(ttest)
N
0 21.3 14.2 15.9 16.7 0.03, 0.06, 0.20 0.05, 0.16, 0.18 29, 32, 28, 29
10 17.8 11.3 11.5 12.0 0.01, 0.02, 0.03 0.03, 0.04, 0.03 29, 32, 28, 29
20 12.9 8.8 8.6 9.3 0.03, 0.02, 0.10 0.08, 0.08, 0.09 29, 32, 28, 29
30 8.4 6.0 5.6 5.4 0.07, 0.03, 0.08 0.22, 0.17, 0.06 29, 32, 28, 29
40 4.0 3.5 2.6 2.6 0.10, 0.02, 0.13 0.71, 0.32, 0.12 29, 32, 28, 29
50 0.7 1.3 1.1 0.6 0.39, 0.43, 0.74 0.53, 0.69, 0.94 29, 32, 28, 29
Total 65.1 45.1 45.4 46.6 0.02, 0.02, 0.08 0.02, 0.12, 0.07 29, 32, 28, 29
Total -50 64.5 43.8 44.3 46.0 0.05, 0.02, 0.07 0.02, 0.10, 0.07 29, 32, 28, 29
Total -40 60.5 40.3 41.6 43.4 0.02, 0.02, 0.08 0.02, 0.09, 0.07 29, 32, 28, 29
NW =Noble women, CW=common women, NM=noble men, and CM=common men. The variable “Total -
50“compounds punishment on all levels except level 50. The variable “Total -40“compounds punishment on all
levels except level 50 and level 40. Sample size per group is reported in the order NW, CW, NM, CM.
P-values indicate the probability of equal punishment between common men and the other categories
respectively (noble women, common women and noble men).
Table 2d. Female third party punishment by dictator category.
Transfer
level
CM NW CW NM P-value non-
parametric
(MW)
P-value
parametric
(ttest)
N
0 17.5 15.3 17.5 17.3 all >0.2 all >0.2 18, 15, 17, 13
10 15.8 12.9 12.3 13.2 all >0.2 all >0.2 18, 15, 17, 13
20 11.2 9.5 9.6 10.6 all >0.2 all >0.2 18, 15, 17, 13
30 6.6 6.4 6.5 6.4 all >0.2 all >0.2 18, 15, 17, 13
40 3.8 2.5 3.8 2.7 all >0.2 all >0.2 18, 15, 17, 13
50 0.7 0 2.1 0.8 all >0.2* all >0.2* 18, 15, 17, 13
Total 55.6 46.6 51.8 50.9 all >0.2 all >0.2 18, 15, 17, 13
Total -50 54.9 46.6 49.7 50.1 all >0.2 all >0.2 18, 15, 17, 13
Total -40 51.1 44.1 45.9 47.4 all >0.2 all >0.2 18, 15, 17, 13
38
*The difference between the punishment of common men and noble women is significant at the level of 50
(MW: p=0.04, ttest: p=0.07). However, given the number of tests ran, we would expect some false positives to
occur. NW=noble female dictators, CW=common male dictators, NM=noble male dictators and CM=common
male dictators. Sample size per group is reported in the order NW, CW, NM, CM. P-values indicate the
probability of equal punishment between common men and the other categories respectively (noble women,
common women and noble men).
Table 2e. Male third party punishment by dictator category.
Transfer
level
CM NW CW NM P-value non-
parametric
(MW)
P-value
parametric
(ttest)
N
0 24.3 12.7 14.1 15.8 0.04, 0.05, 0.13 0.02, 0.06, 0.10 14, 13, 12, 16
10 19.4 9.2 10.5 10.3 0.02, 0.04, 0.02 0.02, 0.05, 0.03 14, 13, 12, 16
20 14.4 7.8 7.5 7.5 0.04, 0.03, 0.04 0.06, 0.04, 0.03 14, 13, 12, 16
30 9.9 5.6 4.5 4.2 0.06, 0.04, 0.04 0.19, 0.04, 0.02 14, 13, 12, 16
40 4.2 4.9 1.4 2.4 0.21, 0.03, 0.21 0.79, 0.04, 0.19 14, 13, 12, 16
50 0.6 3.0 0.0 0.4 0.42, 0.37, 0.88 0.26, 0.38, 0.80 14, 13, 12, 16
Total 72.9 43.2 37.9 40.6 0.04, 0.02, 0.05 0.11, 0.04, 0.04 14, 13, 12, 16
Total -50 72.3 40.2 37.9 40.2 0.04, 0.02, 0.05 0.06, 0.04, 0.03 14, 13, 12, 16
Total -40 68.1 35.4 36.5 37.8 0.03, 0.03, 0.04 0.03, 0.04, 0.03 14, 13, 12, 16
NW =Noble women, CW=common women, NM=noble men, and CM=common men. The variable “Total -
50“compounds punishment on all levels except level 50. The variable “Total -40“compounds punishment on all
levels except level 50 and level 40. Sample size per group is reported in the order NW, CW, NM, CM. P-values
indicate the probability of equal punishment between common men and the other categories respectively (noble
women, common women and noble men).
Dictator game - descriptive statistics
Table 3a. Descriptive statistics dictator game.
Variable N Mean Median Sd Min Max
Common name 31 65.8 50 20.6 50 100
Noble name 28 63.2 50 21.6 50 100
Total 59 64.6 50 21.0 50 100
Table 3b. Giving by recipient category.
Av. Noble Av. common P-value non-
parametric
(MW)
P-value
parametric
(ttest)
N
Level of giving 63.2 65.8 0.28 0.64 28,31
Proportion of giving .77 .78 0.58 0.92 28,31
39
References
Abrams D., Bertrand M., Mullainathan S., 2008, “Do Judges Vary in their Treatment of
Race?”, Forthcoming in the Journal of Legal Studies.
Akerlof G. A., Kranton R. E., 2000, “Economics And Identity”, The Quarterly Journal of
Economics, MIT Press, vol. 115:3, 715-753.
Almenberg J., Dreber A., 2009, "The Lady and the Trump: Status and Wealth in the Marrige
Market", Kyklos, 62:2, 161-181.
Andreoni J. Vesterlund L., 2001, "Which Is the Fair Sex? Gender Differences in Altruism",
The Quarterly Journal of Economics, 116, 293-312.
Ball S., Eckel C., 1996, "Buying Status: Experimental evidence on status in negotiation",
Psychology and Marketing, 13, 381-405.
Ball S. Eckel C., 1998, "Stars Upon Thars", Working Paper. The University of Texas at
Dallas.
Ball S., Eckel C., Grossman P. Zame W., 2001, "Status In Markets", The Quarterly Journal of
Economics, 116:1, 161-188.
Berger J., Cohen B. P. Zelditch M. (Eds.), 1966, Status Characteristics and expectation states.
Sociological Theorie in Progress, 1. Houghton Mifflin. Boston.
Bernhard H., Fischbacher U. Fehr E., 2006, "Parochial Altruism in Humans", Nature
442:7105, 912-915.
Bernhard H., Fehr E., Rockenbach B., 2006, "Egalitarianism in young children", Nature
454:28, 1079-1084.
Bolton G. Ockenfels A., 2000, "ERC: A Theory of Equity, Reciprocity and Competition",
American Economic Review, 90, 166-193.
Brandts J., Charness G., 2000, "Hot vs. Cold: Sequential Responses and Preference Stability
in Experimental Games", Experimental Economics, 2:3, 227-238.
Campbell A., 2002, A Mind of Her Own. Oxford University Press, Oxford.
Carpenter J., Matthews P.H., 2005, "Norm Enforcement: Anger, Indignation or
Reciprocity?", Middlebury College Working Paper Series 0503, Middlebury College,
Department of Economics.
Cason T., Mui V.L., 1998, "Social Influence in the Sequential Dictator Game", Journal of
Mathematical Psychology, 42, 248-265.
Colarelli S. M., Spranger J. L., Hechanova, M. R., 2006, "Women, power, and sex
composition in small groups: An evolutionary perspective", Journal of Organizational
Behavior, 27, 163–184.
40
Croson R., Gneezy U., 2009 "Gender Differences in Preferences", Journal of Economic
Literature, 47:2, 448–74.
Cummins, D., 2005, "Dominance, status, and social hierarchies", In D. M. Buss (Ed.), The
Handbook of evolutionary psychology, 676–697. Hoboken, NJ: John Wiley and Sons.
Dickinson D., Teifenhaler J., 2002, "What Is Fair?" Experimental Evidence. Southern
Economic Journal, 69, 414-428.
Fehr E., Hoff K., Kshetramade M., 2008, "Spite and Development", American Economic
Review Papers and Proceedings, 98:2, 494–99.
Fehr E., Fischbacher U., 2004, "Third-party punishment and social norms", Evolution and
Human Behavior, 25, 63-87.
Fehr E., Gächter S., 2000, "Cooperation and Punishment in Public Goods Experiments",
American Economic Review, 90:4, 980-994.
Fehr E., Schmidt K., 1999, "A Theory of Fairness, Competition And Cooperation", The
Quarterly Journal of Economics, 114:3, 817-868.
Fershtman C., Gneezy U., 2001, "Discrimination in a Segmented Society: An Experimental
Approach", The Quarterly Journal of Economics, 116:1, 3511-3377.
Glaeser E.L., Laibson D.I., Scheinkman J.A., Soutter C.L., 2000, "Measuring trust", The
Quarterly Journal of Economics, 115, 811-846.
Goette L., Huffman D., Stephan M., 2006, "The impact of group membership on cooperation
and norm enforcement: Evidence using random assignment to real social groups", Institute for
the Study of Labor, IZA Discussion paper, 2020.
Harbaugh W.T., Krause K., Liday S., Vesterlund Lise. 2001, "Trust in Children", University
of Oregon Economics Department Working Papers 2002-10, University of Oregon Economics
Department, revised 25.
Hong K., Bohnet I., 2006, "Status and distrust: The relevance of inequality and betrayal
aversion", The Journal of Economic Psychology, 28, 197-213.
Huberman B., Loch C., Öncüler A., 2004, "Status as a Valued Resource", Social Psychology
Quarterly, 67:1, 103-114.
Kalkhoff W., Barnum C., 2000, "The Effects of Status-Organizing and Social Identity
Processes on Patterns of Social Influence", Social Psychology Quarterly 63, 95-115.
Leibrandt A., Lopéz-Peréz R., 2008, "The Envious Punisher: Understanding Third and Second
Party Punishment with Simple Games", Institute for Empirical Research in Economics,
University of Zurich, Working Paper Series, Working Paper No. 373.
Lieberman D., Linke L., 2007, "The effect of social category on third party punishment",
Evolutionary Psychology, 5, 289-305.
41
Ostrom E., 2000, "Collective Action and the Evolution of Social Norms", Journal of
Economic Perspectives, 14(3), 137-58.
Phillips S., 2009, "Status Disparities in the Capital of Capital Punishment", Law and Society
Review, 43:4.
Ridgeway C., Boyle E., Kuipers K., Robinson R., 1998, "How Do Status Beliefs Develop?
The Role of Resources and Interaction", American Sociological Review, 63, 331-350.
Sarnecki J., 2006, "Är rättvisan rättvis? Tio perspektiv på diskriminering av etniska och
religiösa minoriteter inom rättssystemet", SOU 2006:30.
Selten R. Ockenfels A., 1998, "An Experimental Solidarity Game", Journal of Economic
Behavior Organization, 34, 517-539.
Simpson B. Walker H.A., 2002, "Status characteristics and performance expectations: a
reformulation", Sociological Theory, 20, 24-39.
Weber M., 1924, in From Max Weber: essays in sociology. (trans, eds) Gerth H. H., Wright
Mills C., London, Routledge and K. Paul, 1970.
Webster M., Driskell J.E., 1978, "Status Generalization: A Review and Some New Data", American Sociological Review 43, 220 - 36.
Weiss Y., Ferschtman C., 1998, "Social Status and Economic Performance: a Survey",
European Economic Review, 42, 801-820.


