Embed Size (px)
Citation preview

30th Annual AHS Student Design Competition
“The HealCopter”
i
GRIFFIN

2012 Penn State Tilt-rotor Design Team
Arnab RoyUndergraduate
David R. CyconUndergraduate
J. Javier BustamanteUndergraduate
Thuan M. NguyenUndergraduate
Trevor D. SteinerUndergraduate
Chengzhi Qi Undergraduate
Dr. Robert C. BillFaculty
Dr. Joseph F. HornFaculty
Dr. Edward C. SmithFaculty
______________________
______________________
______________________
______________________
______________________
______________________
______________________
______________________
______________________
Students involved in this competition received 5 total credits for AERSP 402A and AERSP 402B: Helicopter Design
Permission to Post
We, the AERSP 402 Undergraduate Helicopter Design Team, representing The Pennsylvania State University in the 30th Annual AHS Student Design Competition, hereby grant permission to have our final proposal posted and accessible on the AHS website.
ii

Table of Contents
1. Introduction………………………………………………………………………………………………..11.1. Mission Requirements…………………………………………………………………...……………...11.2. Configuration Selection………………………………………………………………...……………….2
2. Aircraft Dimensions………………………………………………………………………………………..42.1. List of Dimensions…………………………………...…………………………………………………..42.2. Overall CAD Drawings…………………………...…………………………………………………….4
3. Vehicle Sizing………………………………………………………………………………………………53.1. Cabin Sizing……………………………………….….…………………………………………………53.2. Rotor Sizing……………………………………….…..…………………………………………………53.3. Wing Sizing……………………………………….…..………………………………………………….53.4. Empennage Sizing……………………………….……………………..………………………………..5
4. Aerodynamic Design……………………………………………………………………………………….54.1. Prop-Rotor Design……………………………….……………………..……………………………….54.2. Wing Design……………………………………….…………………….……………………………....7
5. Forward Flight Analysis…………………………………………………………………………………...125.1. Drag Build Up…………………………………………………………….……………………………125.2. Calculation of Power Required………………………………………….……………………………135.3. Stall, Speed, Best Endurance and Best Range………………………….……………………………14
6. Transition and Hover Analysis……………………………………………………………………………156.1. Transition Analysis……………………………………………………….………….………………...156.2. Flap Design……………………………………………………………….…………………………….176.3. Hover Analysis…………………………………………………………….…………………………...186.4. Wing Download …………...……………………………………………….…………………………..216.5. General Performance …………………………………………………………………………………23
7. Propulsion System Design………………………………………………………………………………....247.1. Engine Growth and Scaling…………………………………………………………………………...247.2. Transmission…………………………………………………………………………………………...25
8. Stability and Control………………………………………………………………………………………268.1. Empennage Sizing …………………………………………………………………………………….268.2. Wing Location Determination………………………………………………………………………...278.3. Empennage Location…………………………………………………………………………………..288.4. Empennage Airfoil Selection …………………………………………………………………………288.5. Control Surface Area..………………………………………………………………………………...29
9. Aircraft Systems……………………………………………………………………………………………339.1. Mission Equipment………………………………………………………………..…………………...339.2. Fuel Storage……………………………………………………………………….…………………...349.3. Landing Gear……………………………………………………………………..……………………34
3

9.4. Cabin Pressurization………………………………………………………………………………….3610. Mission Analysis…………………………………………………………………………………………….36
10.1. Cabin Layout…………………………………………………………………………………………3611. Vehicle Weight Analysis…………………………………………………………………………………....40
11.1. Component Weight Breakdown……………………………………………………………………4011.2. Center of Gravity Analysis…………………………………………………………………………..41
12. Cost………………………………………………………………………………………………………….4313. Performance Index Calculation and Optimization.………………………………………………………4714. Conclusion…………………………………………………………………………………………………..48
4

List of Tables
Table1.11.21.31.44.14.24.34.45.16.16.27.17.27.311.111.211.312.112.212.312.4
Title
Breakdown of the Three RFP Specified MissionsNon-Weighted Configuration Matrix
Weighted CategoriesWeighted Configuration Matrix
Maximum RPM without Compressibility Effect for Rotor BladeHistorical Trend for Dihedral Angle of Wings
Airfoil Results Using XFLR5 Weighted Evaluation of Performance
Flat-Plate Area Distribution of The Main Components of the AircraftFlap Comparison
Summary of Wing Download ReductionsDrivetrain Dimensions and Data
Coefficients for Rated Bending Stress and Allowable Bending StressCoefficients for Rated Contact Stress and Allowable Contact Stress
Weight Estimation Equations and WeightsWeight Validation for key components
Location of Aircraft ComponentsPower Law Coefficient and Exponents
Initial Aircraft Cost TableExpected DOX and DMC for the griffin and Blackhawk
Performance index for DOC and DMC
Page12336899
13172225262640414244444646
5

List of Figures
Figure4.14.24.34.44.54.65.15.25.36.16.26.36.46.56.66.76.86.96.106.116.126.136.148.1 8.28.38.48.58.69.19.29.39.411.111.212.112.213.1
TitleEfficiency Vs. RPM for 3 bladed and 4 bladed rotor
Power vs. C lcruise for Different Aspect Ratios
C lcruise calculation at Aspect Ratio of 8Wing Geometry of GriffinOutboard Section of Wing
Wing Flap Design for GriffinExcess Power CalculationStall Speed vs. Altitude
Best Endurance and Best Range at 6000 (19685 ft)Force Balance for GriffinNacelle Angle Indicator
Nacelle Angle of Transition FlightGwinn Flap Model & Blackburn Slotted Flap Model
Flap Power RequirementHover Ceiling with 11050 HP Max Continuous Power
Hover Ceiling in Engine Out ProcedureFlap Deflection to Reduce Wing Download
Flow Visualization of System with and without Active Flow ControlActive Flow Control ActuatorActuator Positioning on Flap
Power Requirement for different speeds at 2000 m (6561 ft)Nacelle Angle setting for different speed at 2000 m (6561 ft)
Maximum velocity vs AltitudeVertical Tail Volume Ratio vs Fuselage Volume Ratio
Static margin vs lt(ft) for different mission. Elevator deflection vs. speedRudder Deflection vs Speed
Velocity vs roll rateWing angle of attack vs. roll rate
Forward and Aft Sponson Fuel TanksInternal Auxiliary Fuel Tank (optional)
Wheel Load GeometryNose Landing Gear Stowed
Griffin Component BreakdownCenter of Gravity Envelope for Wingman-22
Actual vs. Predicted (DOC)Actual vs Predicted (DMC)
Fuel Weight design based on performance index
Page
710101112121414141516161718212122222222232323272830313232343435354143454547
6

List of Foldouts
Foldout1234
TitleAircraft Dimensions
Mission AnalysisFuel Break Down
Center of Gravity Sensitivity Analysis
Page
4373839
vii

Nomenclature
SymbolAA
a@p
at
awb
altARbc
Cdo
Cd parasite
Cd
Cf
cf
Cl
Cmop
Cp
Crotor
Ct
cw
cD
Dave
Di
Doutboard
Dragflap
eo
fFx
Fy
gGWHHd
hf
hH
hn
hnwb
it
JKA
kconf H
kconf V
DescriptionAreaLift curve slope of the whole aircraftSpeed of sound at densityLift curve slope of the tailLift curve slope of the wingAltitudeAspect RatioWing spanWing ChordCoefficient of profile dragParasitic drag coefficientCoefficient of dragCoefficient of friction Fuselage weight constantCoefficient of liftCoefficient of PropulsionCoefficient of powerChord of rotor blade coefficient of thrustWing weight coefficientMean aerodynamic chord of the wingDragAverage diameter of fuselageInduced dragDrag created by outboard section of wingDrag created by flapOswalds efficiencyFlat plate areaForce in vertical direction with respect to aircraft orientationForce in horizontal direction with respect to aircraft orientationAcceleration due to gravityGross WeightCenter of gravity as a fraction of mean chordRotor hub diameterFuselage heightHeight distance between MAC and tail MACNeutral point location of aircraft as fraction of mean chordNeutral point location of the wing as fraction of mean chordIncident anglePolar moment of inertia
Wing aspect ratio factorHorizontal tail configuration weight coefficientVertical tail configuration weight coefficient
Unitsft2
radft/sradradftNon-dimensional ftftNon-dimensional Non-dimensional Non-dimensional Non-dimensional Non-dimensional Non-dimensional Non-dimensionalNon-dimensionalftNon-dimensional Non-dimensional ftlbsmeterlbslbslbsNon-dimensional ft2
lbslbsft/s2
lbsNon-dimensional ft
viii

ftftNon-dimensional Non-dimensional rad ft4
Non-dimensional Non-dimensional Non-dimensional
kdoor
kH
kρ
kre
ksl
ksp
kuc
kwl
kλ
LLf
Lflap
lh
lt
lt
Lwing
L/DMtip
MACMTOMMTOW
Nb
nult
PPavailable
Pi
Pinternal
Pinstalled
Prequired
PbPo
RRfus
ReRoC
SSv
Swetted
SFCTTt/cVVd
VH
V H
Vmax
Cargo Door Weight CoefficientEngine weight coefficientPressurization Weight CoefficientWing Spoiler Weight CoefficientUndercarriage Weight CoefficientWinglet Weight CoefficientUndercarriage Weight CoefficientWinglet Weight CoefficientWing taper ratio factorLiftFuselage lengthLift supplied by flapsLength between horizontal center of gravity and tail MACLength between tail MAC and center of gravityLength between tail MAC and wing MACLift supplied by wing only (no contribution from flaps)Slenderness ratioMach number at tip of bladeMean aerodynamic chordMaximum takeoff massMaximum takeoff weightNumber of BladesUltimate Load FactorPowerPower AvailableInduced PowerInternal Cabin PressurePower InstalledPower requiredPower to hoverExterior cabin pressureRadius of rotorRadius of fuselage
Reynolds numberRate of climbWing areaSurface area of the vertical tailWetted areaSpecific fuel consumptionThrustThicknessThickness to chord ratioVelocityDive speedHorizontal tail volume ratio in terms of the center of gravityHorizontal tail volume ratio in term of empennage MAC to wing MAC Maximum velocity
ix
Non-dimensional Non-dimensional Non-dimensional Non-dimensional Non-dimensional Non-dimensional Non-dimensional Non-dimensional Non-dimensional lbs m lbsftftftlbsNon-dimensional Non-dimensional Non-dimensional kg lbsNon-dimensional Non-dimensional lbslbslbspsilbslbslbspsiftft
Non-dimensional ft/sft2
ft2
ft2
ft2
lbsinNon-dimensional ft/sft/sft/sft/sft/s
Vstall
Vtip
VV
V V
WWb
Wemp
Wengine
Wf
Wh
WH
WHT
WPA
WVT
WW
ααp
βtwist
δε/δαη
ΛC/4
ΛλμρσσH
ω
Stall speedTip speed of rotor bladesVertical tail volume ratio in terms of the center of gravityVertical tail volume ratio in term of empennage MAC to wing MACWeightWeight of BladesWeight of empennageWeight of engineWeight of fuselageWeight of rotor hubWeight of hydraulicsWeight of horizontal tailWeight of engine equipmentWeight of vertical tailWeight of wingAngle of attackNacelle angleBlade twistDownwashEfficiencySweep angle at Quarter Chord of wingSweep of wingTaper ratioAdvance ratioDensitySolidityHoop StressAngular Velocity of Rotor
x

ft/s
ft/sft/sNon-dimensional bslbslbslbslbslbslbslbslbslbslbsdegdegdeglbsnon-dimensiondegdegnon-dimensionalnon-dimensionalslug/ft3
non-dimensionalpsideg/s
xi

1.0 Introduction An aircraft is considered to be highly valued if it has the ability to be used for multiple mission requirements without a drastic change in configuration and still maintaining a very high performance efficiency. Considering the need for an aircraft capable of high speed medical rescue with the ability to participate in a low-speed cargo drop, the team recognized that a variable configuration aircraft needed to be designed to perform the missions with ease and efficiency. Such issues encouraged research into a tilt-rotor configuration, because the design was acknowledged to deliver the best quality product possible. The proposed Griffin tilt rotor is designed with a variable rpm rotor system that gives the aircraft a hover performance comparable to the conventional helicopter, yet still is still capable of flying at higher speeds that can only be reached by fixed wing aircraft. The Griffin has the ability to fly in a transition mode with the nacelles tilted at an angle to reduce power, making this aircraft a truly remarkable flying machine. The current design tackles many of the previous trade-offs that older tilt- rotors have had to make, while incorporating new technologies that are just being introduced to the aviation world. This makes the Griffin a very efficient and versatile aircraft capable of fulfilling the requirements of multiple missions and moves the VTOL technology to the next generation.
1.1 Mission RequirementsThe submitted rotorcraft design must be able to perform three different missions. The first mission is fast deployment and
rescue coordination. This mission requires fast deployment to a disaster area and reconnaissance in order coordinate with other craft in the area. The second mission is to distribute aid. In order to complete the mission, the aircraft will need to provide first aid supplies, food, water, and other required items to the victims still in the area where the disaster occurred. The final mission is an evacuation of casualties, the key to this mission is to evacuate the most seriously injured victims to the closes hospital with up to six at a time.
Table 1.1 Breakdown of the three RFP specified missions
In order to facilitate the various missions, the team decided on using a cabin that can be configured for each type of mission. To accomplish this, the group looked at the Aeromedical Pallet System [1] from ARINC. These pallets can easily and quickly be removed and replaced with a number of configurations already in existence, with more in development. Using these pallets, the cabin could be changed from an air drop configuration to a medical station in a short amount of time. The following figures show how the team plans on using the pallet system for each different mission. Each pallet can be pulled into the cabin by a winch allowing for easy installation of the heavier pallets.
1

1.2 Configuration SelectionChoosing a configuration was one of the first tasks the group took on. The group had to come up with a number of possible
configurations which could do the job. It was plain to see that the RFP requirements for speed, range and altitude made a conventional helicopter an invalid choice. This required focusing on compound designs, but a conventional design was still involved in configuration matrix as control to weight everything against.
The first configuration considered was a coaxial design with a pusher propeller, a design similar to the Sikorsky X-2. The idea was that the rear propeller would be able to provide the forward thrust needed for higher speeds.
The next idea was a tandem configuration with auxiliary thrust and lifting. This could have been accomplished by adding turbofan engines on the fuselage with stub wings. Here, the idea was derived from Boeing’s 360, a high speed configuration for the Chinook.
Third design consisted of a ducted tilt rotor; this would have required structure around the rotor discs which could have helped direct the flow, but added extra weight and complexity to the design.
Another concept the group looked at was the quad tilt rotor. This design could have provided heavy lifting capabilities and be capable to meeting each of the hard requirements, however the complexity and costs would be very high.
The fifth configuration was a tilt rotor, this configuration had the most promise as it had excellent forward flight capabilities, would easily be able to manage the range and altitude as well when flying in its airplane mode. Since the RFP had no mission outline for hovering, having the high disk loading a tilt rotor typically has didn’t seem to be much of a problem.
The last configuration was a tilt wing aircraft. This would be very similar to a tilt rotor, however instead of the engine nacelles rotating, the engines would be fixed with the wing, and the wings would then rotate. Here the downwash on the wings from the rotors would be reduced, but this design had the drawback of adding complexity to wing fuel storage.
To choose the design, the team put each of the above configurations into a selection matrix and scored them on a scale of 1 to 5, where a score of one meant the configuration would not be able to meet the requirements, and a score of 5 meant it could easily meet the requirements. The configurations were scored in Range, Hover capability, Cruising speed, Altitude, Cost, and Complexity of design. In table 1.2, the non-weighted scores are displayed; the coaxial with pusher prop came out behind even the conventional design. This showed the group that they would need to weight the individual categories in order to determine the best possible configuration. Table 1.3 shows the various categories as they have been weighted by the group. The last table, table 1.4 shows the final weighted selection matrix.
Table 1.2: Non-Weighted Configuration Matrix.
2

Table 1.3: Weighted Categories.
Table 1.4: Weighted Configuration Matrix.
As observed above in the weighted configuration matrix, a quad tilt rotor, a conventional tilt rotor, and the tilt wing configurations all scored very high. To narrow down the selection to one type, the group looked at how complex and costly the three top scoring configurations could be. First, looking at complexity, the quad tilt rotor is very high; adding two more rotors not only adds complications for maintenance, but also for production. The same fact also increases the costs significantly. After removing the quad tilt rotor from play, the group looked at the differences between a tilt wing and a tilt rotor. One of the main constraints is that the team wished to store fuel inside of the wing, while it would be possible for a tilt wing to do this, it wouldn’t be easy. It was decided that this fact outweighed the potential down loading benefits of a tilt wing.
3
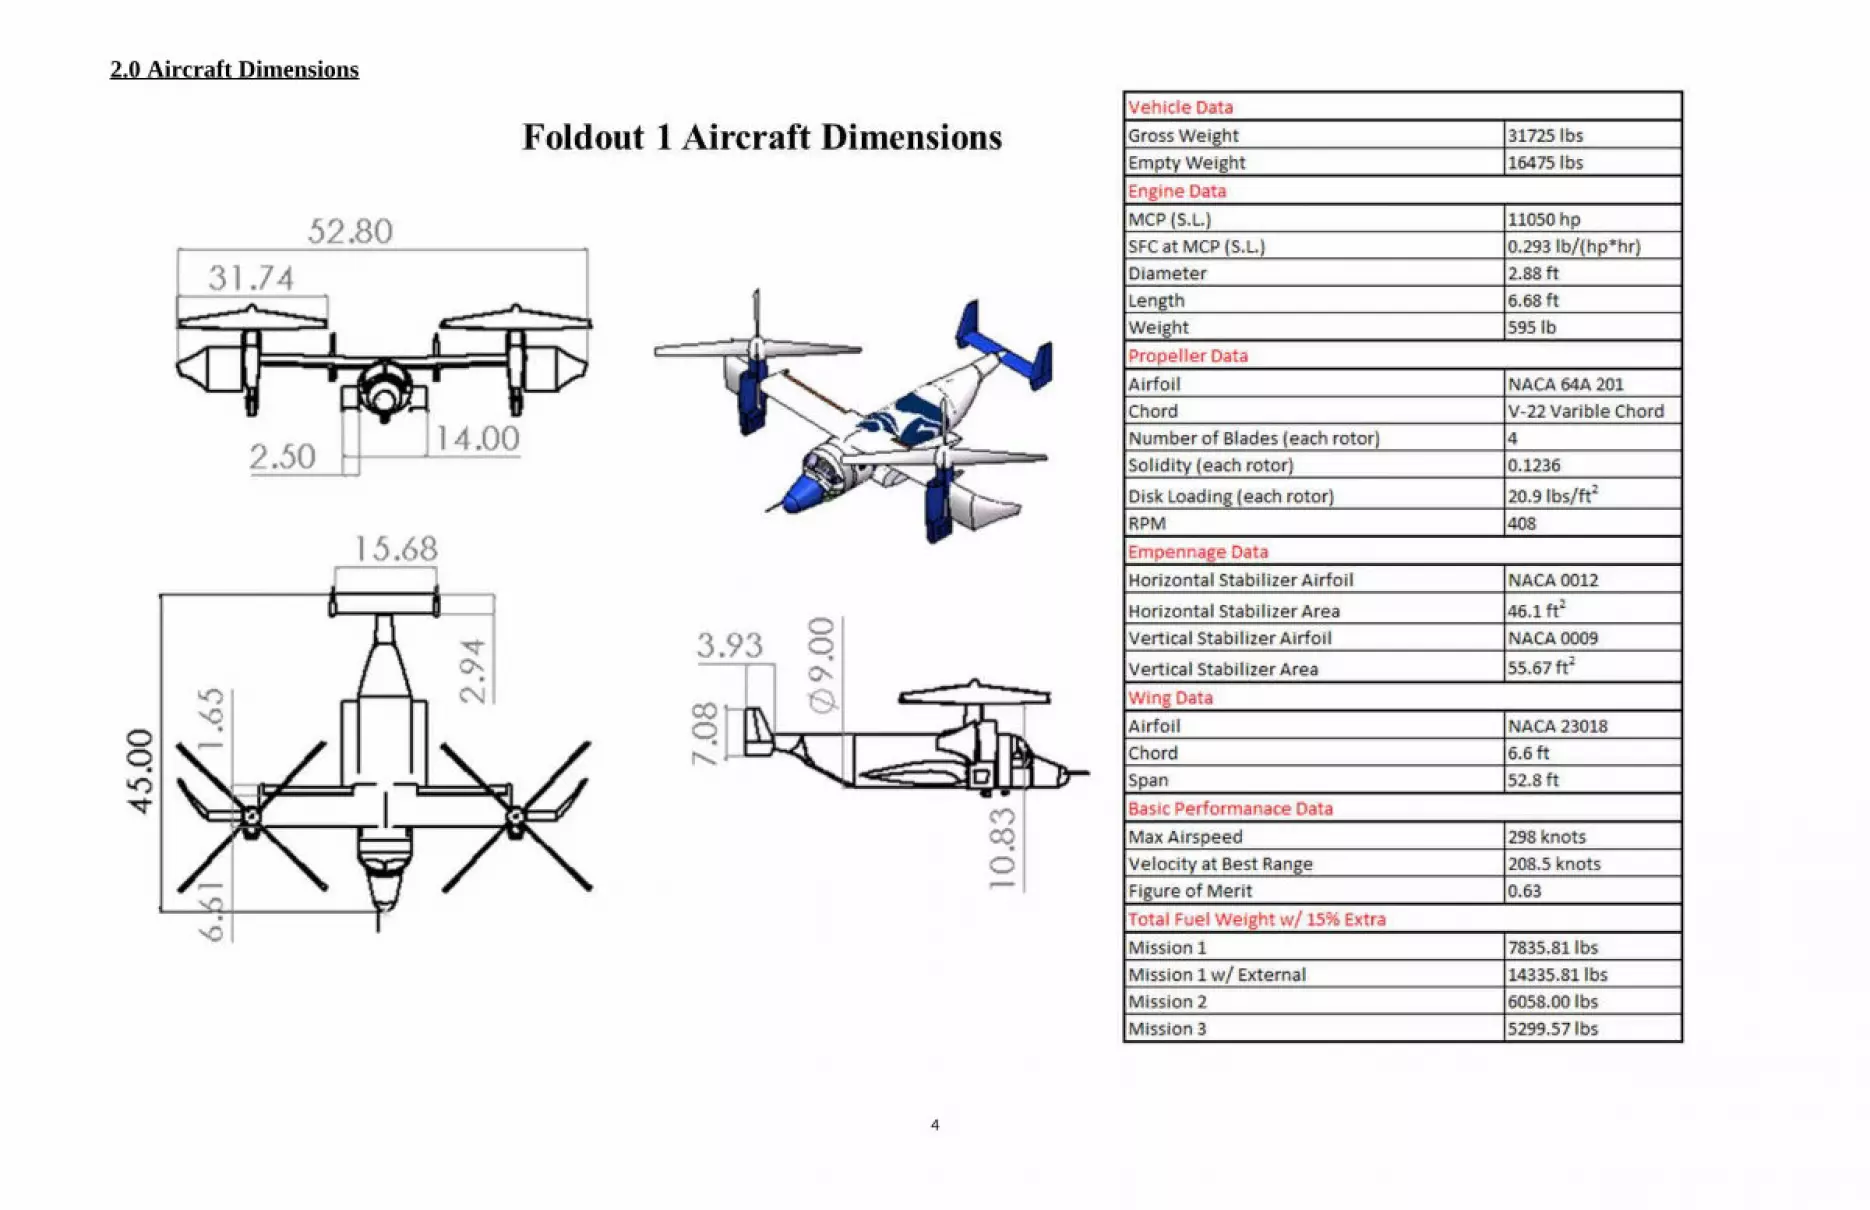
2.0 Aircraft Dimensions
4

3.0 Vehicle Sizing
3.1 Cabin Sizing
The cabin was sized based up the necessary mission requirements for mission 3, which required transport of up to six wounded personal. For this mission it was required to have two triple litter stacks which would measure 7 feet in length each. Additionally it was determined to need additional 2-4 feet of room near the side door for the crew members to move sit. Using this information we decided on a total cabin length from cockpit to rear cargo door is 18 feet
3.2 Rotor Sizing
In order to size the rotor, a disk loading of 20.9 lbs/ft2 was chosen to optimize power and weight. After this value was chosen, the rotor area was calculated using the RFP specified max takeoff weight of 15 metric tons. This resulted in a rotor area of 749 ft2 which corresponded to a rotor blade length of 15 ft.
3.3 Wing Sizing
The main driving forces for the sizing of the wing was finding an optimum value between increasing aspect ratio and wing weight. The initial span of the aircraft was set using the rotor radius and served as the minimum value we could have without hitting the body of the aircraft. Eventual a wing area of 3402 was shown optimal with a wing span of 8. A more advance analysis is shown in section 4.2
3.4 Empennage Sizing
The sizing of the empennage was based the types of the rotorcraft. Unlike the conventional helicopter design, the tiltrotor aircraft take advantage of its wing while perform its missions. The sizing of both the vertical and horizontal stabilizer was determined by the wing to empennage ratio. The H-tail configuration was chosen due to the area of the vertical and horizontal stabilizer. The areas for both stabilizers are 4.28 m2 (46.1 ft2) and 5.17m2 (55.6 ft2). Detail calculation is show in section 8.
4.0 Aerodynamic Design
4.1 Prop-Rotor Design
The majority of the missions require Griffin to be in cruise configuration rather than hover or transition for the vast majority of flight. Such necessities lead the way to more emphasis on producing rotor blades that give high propeller efficiency (η). To achieve this, first, the smallest diameter of the rotor blades (Drotor) was calculated to achieve maximum efficiency in forward flight for a disk loading that allows the aircraft to hover with the gross weight of the aircraft. Rotor to fuselage interaction was considered to be a limiting factor during this analysis.
4.1.1 Prop-Rotor Blade Airfoil Selection
Three airfoils were chosen and compared to find the most suitable prop-rotor that will satisfy the mission requirements. Each airfoil has its own unique characteristics as a candidate:
Clark-Y: A commonly used airfoil with adequate research data and application. Clark-Y airfoil gives advantage to compare the results and provide confidence in the procedure for prop-rotor analysis.
E423: This is a high lift airfoil which can give Griffin better performance during transition and hover.
5

NACA 64A210: Bell’s XV-15 tilt rotor uses the NACA 64A015 airfoil for the rotor blades. To have similar characteristics of the XV-15, NACA 64A210 was chosen because it is in the same series with a higher lift capability.
Each one of these airfoils was researched and the characteristics were noted for more accurate analysis for the Griffin blades.
A propeller analysis code developed at Penn State [2] was used to optimize the blade geometry for best propeller efficiency. The code uses propeller blade element vortex (BEVT) theory to analyze sections of the blade and provide values of stall restrictions, power, thrust, drag, η for a given pitch and forward velocity for the Clark-Y airfoil. Modification of the code was done to account for the different characteristics of E423 and NACA 64A210 airfoils. The following values were identified as the targeted results for Griffin propeller geometry. The targeted values for the Griffin propeller geometry are, η =.8, VCruise = 123.47m/s (240 knots), Thrust 22,241.11 N (5000 lbs), stay under stall boundary and tip mach number below critical mach number of corresponding airfoil.
Concentrating heavily on forward flight and to reduce complexity in the gearbox system, Griffin uses a single RPM thorough-out all flight conditions. At the cruise altitude of 6,000 meters (19,685ft) with speed of sound (a) of 316.38 m/s (1038 ft/s), the maximum value of RPM of each airfoil was found using equation 4.1. This helped avoid compressibility affect on the prop-rotor.
M tip=√Vtip2+(ωR )2
a@ρ (4.1)
Table 4.1 shows the maximum RPM and critical Mach number of each of the airfoils.
Airfoil Critical Mach Number ωcruise max (RPM)Clark -Y .75 449.4E423 .69 411.67NACA 64A210 .81 487.07
Table 4.1: Maximum RPM without compressibility effect for rotor bladeThe following base geometry parameters were the inputs for optimizing the blade geometry, number of blades and RPM
selection.
a) Rotor Diameter Drotor = 9.55 m (31.32 ft) (hover Requirement)b) Variable Chord Crotor (V-22 rotor blade geometry)c) Airfoil Selection Clark –Y, E423, NACA 64A210d) Number of Blades Nb = 3,4e) RPM 360 to 460 (Clark-y), 320 to 420 (E423), 390-490
(NACA 64A210)f) Blade Twist βtw(V-22 rotor blade geometry)g) Thickness t/c (V-22 rotor blade geometry)h) Altitude h = 6,000 meters (19,685 feet)i) Rotor hub diameter Hd = 30% of Diameter (Rotord= 2.86 m (9.34 ft))
The prop-rotor solidity (σ .1236) was kept constant as the number of blades was increased while running the code. Appendix A shows the process of how the pitch, power, efficiency and stall for each blade was measured. The analysis showed that the NACA 64A210 airfoil is the best airfoil to use out of the 3 airfoils tested for the geometry of the blades stated above. Figure 4.1 shows the efficiency curve of the airfoil with a range of RPM for 3 bladed and 4 bladed rotors.
Also, this analysis showed that the best η of .728 is achieved at 408 RPM with a configuration of 4 bladed rotors. Compressibility effect is avoided as this RPM is conveniently smaller than the maximum RPM of this airfoil. As this configuration gives the highest η value, it implies that it also uses the minimum power of 3825.33 kW (5129.85 hp) .
6

390400
410420
430440
450460
470480
4900.550.570.590.610.63
0.6500000000000010.6700000000000010.6900000000000010.7100000000000010.7300000000000010.7500000000000010.7700000000000010.790000000000001
NACA 64A 210 (Cruise flight condition)
3 Bladed4 BladedPolynomial (4 Bladed)
RPM
Effici
ency
Max RPM =487.07
Critical Mach =.81
Best Efficiency at 408 RPM
Figure 4.1: Efficiency Vs. RPM for 3 bladed and 4 bladed rotor
It is not safe to assume that, if Griffin gets equipped with higher number of blades than 4 it will have a better performance. The reason is because, as the number of blades increase the complexity of the hub will also increase and historically there are no aircraft with 5 prop rotor blades. This increase can add weight, decrease stability margin and also maintenance and manufacturing cost will also increase.
4.2 Wing Design
The unique dimensions and functionalities of the Griffin wing defines the aircraft and makes it separate from conventional tilt-rotors. One of the biggest factors considered during the sizing of the wing for this tilt-rotor is whirl flutter. Research done on whirl flutter by NASA, Army and Bell Helicopter are referenced later in this chapter to increase the stability of Griffin by accounting for this issue.
4.2.1 Number of Wings and Wing Vertical Location
According to the requirements given by AHS, there is no restriction on the span of the wing. This allows Griffin to have a long span that gives the aircraft the ability to perform the missions required more effectively. Also, to reduce drag, avoid complexity of calculation and design, a single wing design was chosen.
A high wing configuration gives Griffin enough range to avoid rotor blade and ground interactions. Besides, this design allows increase in dihedral effect, makes the aircraft laterally more stable and it eases and facilitates maintenance [3].
4.2.2 Sweep, Taper, Twist and Dihedral Angles
Manufacturing cost has a huge impact on the wing design when considering twist, sweep and taper. The aircraft is meant for medevac missions, which will be done in low subsonic condition with low maneuvers. The complexity of manufacturing different sizes of spars, ribs, stringer and other components of the wing to account for different span-wise dimensions (wing taper) is considered to be higher than the small performance gain.
7

Wing sweep is primarily used to reduce the adverse effects of transonic and supersonic flow. Griffin on the other hand is a subsonic aircraft flying only at a cruise speed of 123.46 m/s (240 knots) at 6000 meters (19,685ft), or at Mach number of .4. So no sweep is necessary as Griffin does not fly near any compressible flow region during any flight condition [4].
Taper ratio of the wing is an important decision because, “an untwisted rectangular wing has about 7% more drag due to lift than an elliptical wing of the same aspect ratio”[5]. A more realistic calculation for the Griffin for a reasonable reduction in drag with taper is considered to be 4% which gives, a reduction of approximately 925.18 N (208 lbs) less drag during cruise flight. The nacelle positioned very close to the tip requires the root of the wing to be stronger than conventional aircrafts. The increased cost and “the weight increased caused by the lack of wing thickness at the root when compared to a conventional, tapered wing” [6] will cause Griffin to be more expensive than a usual design.
The twist of the wing is usually optimized to only one flight mode (most flown configuration) and therefore at a certain wing Cl. Griffin is required to fly at multiple flight conditions with different Cl values. Because, “large computerized solution is employed at large companies” [7] to find the optimum twist for aircraft wing, again to reduce cost and complexity Griffin wings do not have any twist. Also, based on the data collected from reference [5], Table 4.2, shows an estimation of dihedral angles based on historical data. To give the highest margin of space between nacelle exhaust and the ground, the maximum value of 2 degrees was chosen for the dihedral angle of the wing.
Wing PositionLow [rad (deg)] Mid [rad (deg)] High [rad (deg)]
Unwept (Civil) 0.087 to 0.122 (5 to 7) 0.035 to 0.07 (2 to 4) 0 to 0.035 (0 to 2)Subsonic Swept Wing 0.052 to 0.122 (3 to 7) -0.035 to 0.035 (-2 to 2) -0.087 to -0.035 (-5 to -2)
Supersonic Swept Wing 0 to 0.087 (0 to 5) -0.087 to 0.(-5 to 0) -0.087 to 0 (-5 to 0)Table 4.2: Historical trend for dihedral angel of wings
4.2.3 Airfoil Selection
The team looked back at the requirements of the mission when picking the airfoil that is suitable for Griffin. This wing airfoil affects everything from cruise speed, stall speed, handling quality and overall aerodynamic efficiency during flight. Based on criteria in Table 4.3 and aircrafts already in production with similar characteristics of Griffin, 4 airfoils were selected as possible candidate for Griffin wing. They are:
NACA 23018High lift airfoil, available
research data on flaps
SM 701High lift airfoil
NACA 64(4) 421 Fokker F-27
NACA 65(3) 218Airtech Cn-235
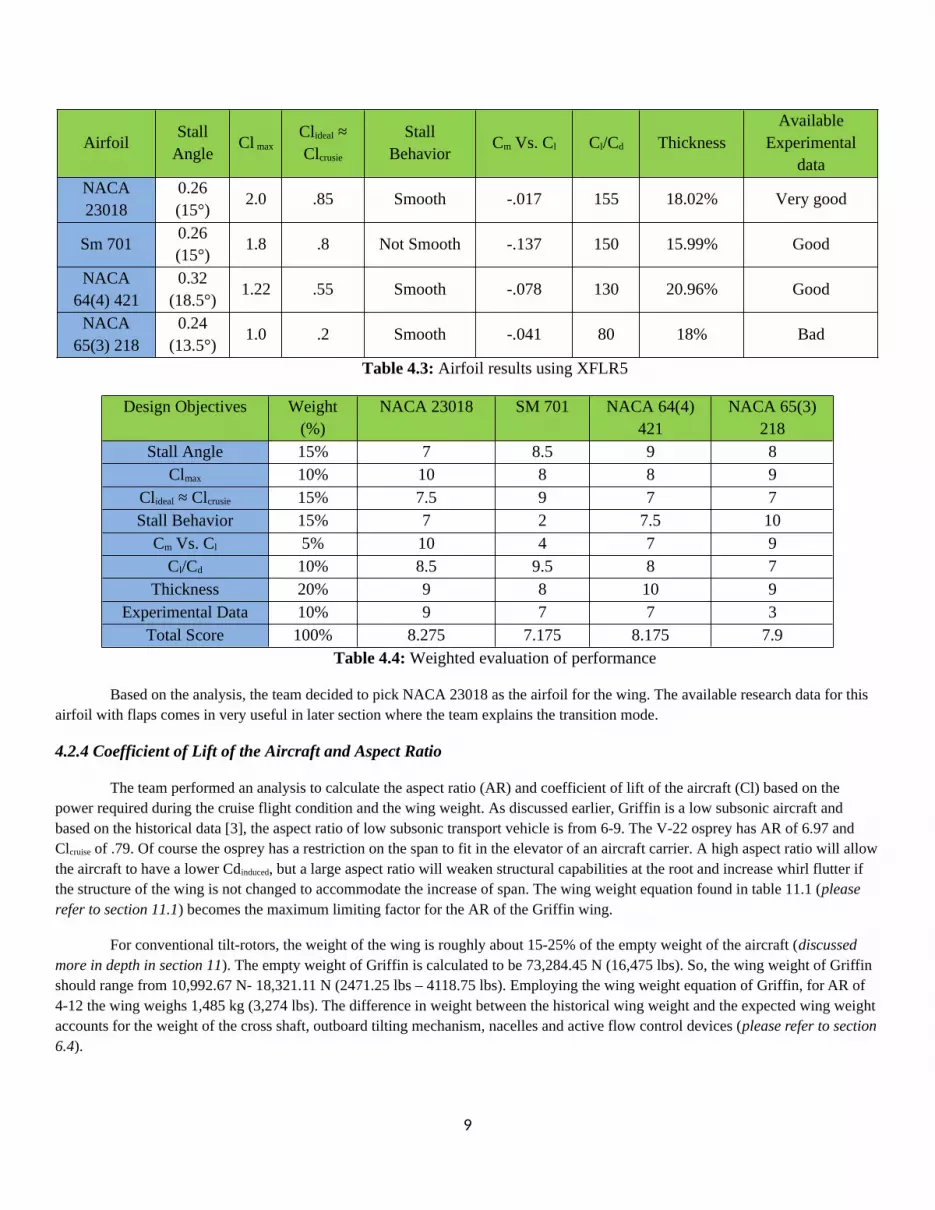
Using XFLR5, a basic analysis on each of these airfoils was computed. Based on the analysis the results are listed in Table 4.3 and a weighted scale was made to score each of the airfoils. The breakdown of the points from 1-10 for the airfoils is shown in Table 4.4.
8
AirfoilStall
AngleCl max
Clideal ≈ Clcrusie
Stall Behavior
Cm Vs. Cl Cl/Cd ThicknessAvailable
Experimental data
NACA 23018
0.26 (15°)
2.0 .85 Smooth -.017 155 18.02% Very good
Sm 7010.26 (15°)
1.8 .8 Not Smooth -.137 150 15.99% Good
NACA 64(4) 421
0.32 (18.5°)
1.22 .55 Smooth -.078 130 20.96% Good
NACA 65(3) 218
0.24 (13.5°)
1.0 .2 Smooth -.041 80 18% Bad
Table 4.3: Airfoil results using XFLR5
Design Objectives Weight (%)
NACA 23018 SM 701 NACA 64(4) 421
NACA 65(3) 218
Stall Angle 15% 7 8.5 9 8Clmax 10% 10 8 8 9
Clideal ≈ Clcrusie 15% 7.5 9 7 7Stall Behavior 15% 7 2 7.5 10
Cm Vs. Cl 5% 10 4 7 9Cl/Cd 10% 8.5 9.5 8 7
Thickness 20% 9 8 10 9Experimental Data 10% 9 7 7 3
Total Score 100% 8.275 7.175 8.175 7.9Table 4.4: Weighted evaluation of performance
Based on the analysis, the team decided to pick NACA 23018 as the airfoil for the wing. The available research data for this airfoil with flaps comes in very useful in later section where the team explains the transition mode.
4.2.4 Coefficient of Lift of the Aircraft and Aspect Ratio
The team performed an analysis to calculate the aspect ratio (AR) and coefficient of lift of the aircraft (Cl) based on the power required during the cruise flight condition and the wing weight. As discussed earlier, Griffin is a low subsonic aircraft and based on the historical data [3], the aspect ratio of low subsonic transport vehicle is from 6-9. The V-22 osprey has AR of 6.97 and Clcruise of .79. Of course the osprey has a restriction on the span to fit in the elevator of an aircraft carrier. A high aspect ratio will allow the aircraft to have a lower Cdinduced, but a large aspect ratio will weaken structural capabilities at the root and increase whirl flutter if the structure of the wing is not changed to accommodate the increase of span. The wing weight equation found in table 11.1 (please refer to section 11.1) becomes the maximum limiting factor for the AR of the Griffin wing.
For conventional tilt-rotors, the weight of the wing is roughly about 15-25% of the empty weight of the aircraft (discussed more in depth in section 11). The empty weight of Griffin is calculated to be 73,284.45 N (16,475 lbs). So, the wing weight of Griffin should range from 10,992.67 N- 18,321.11 N (2471.25 lbs – 4118.75 lbs). Employing the wing weight equation of Griffin, for AR of 4-12 the wing weighs 1,485 kg (3,274 lbs). The difference in weight between the historical wing weight and the expected wing weight accounts for the weight of the cross shaft, outboard tilting mechanism, nacelles and active flow control devices (please refer to section 6.4).
9
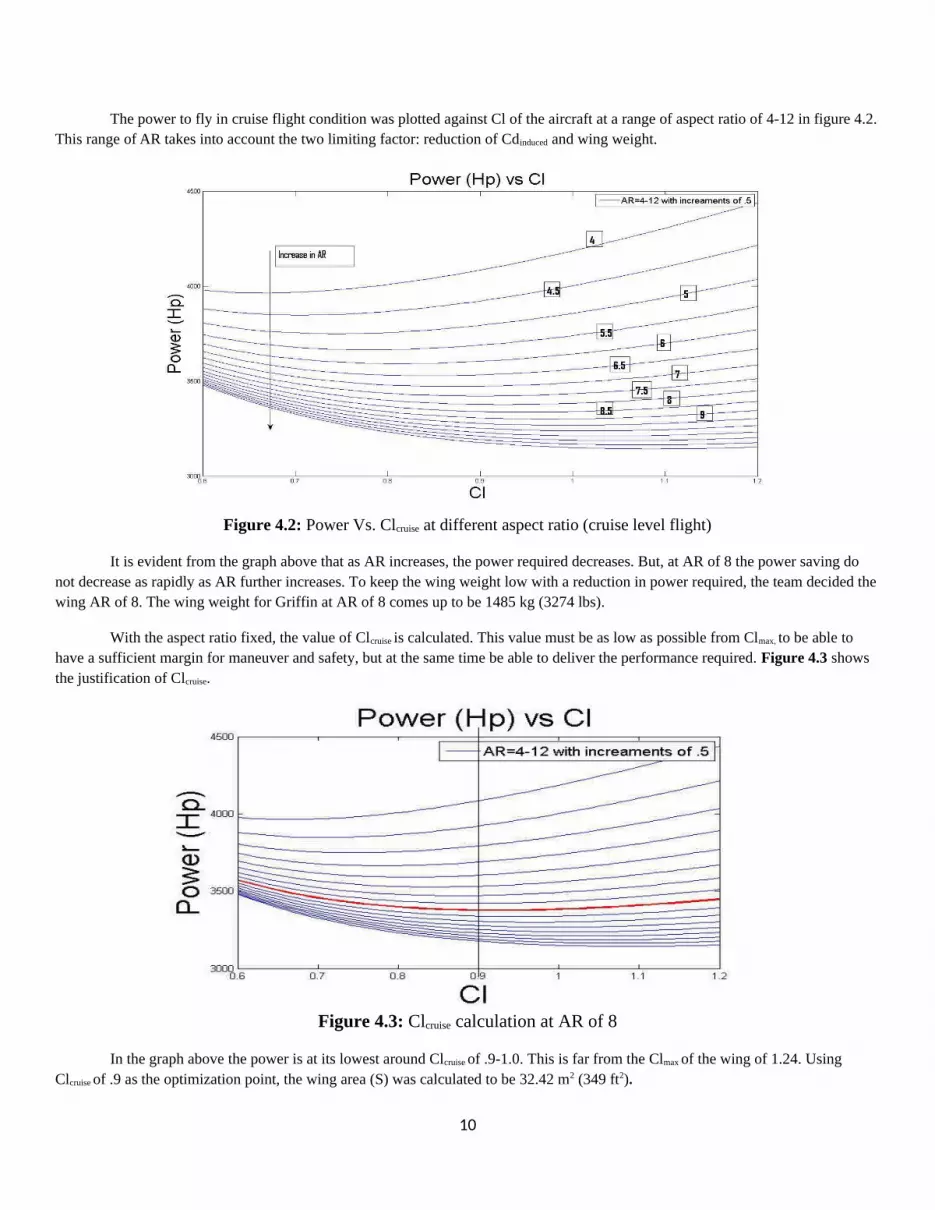
The power to fly in cruise flight condition was plotted against Cl of the aircraft at a range of aspect ratio of 4-12 in figure 4.2. This range of AR takes into account the two limiting factor: reduction of Cdinduced and wing weight.
Figure 4.2: Power Vs. Clcruise at different aspect ratio (cruise level flight)
It is evident from the graph above that as AR increases, the power required decreases. But, at AR of 8 the power saving do not decrease as rapidly as AR further increases. To keep the wing weight low with a reduction in power required, the team decided the wing AR of 8. The wing weight for Griffin at AR of 8 comes up to be 1485 kg (3274 lbs).
With the aspect ratio fixed, the value of Clcruise is calculated. This value must be as low as possible from Clmax, to be able to have a sufficient margin for maneuver and safety, but at the same time be able to deliver the performance required. Figure 4.3 shows the justification of Clcruise.
Figure 4.3: Clcruise calculation at AR of 8
In the graph above the power is at its lowest around Clcruise of .9-1.0. This is far from the Clmax of the wing of 1.24. Using Clcruise of .9 as the optimization point, the wing area (S) was calculated to be 32.42 m2 (349 ft2).
10

4.2.5 Whirl Flutter
Improving prop rotor whirl-mode stability margins is an ongoing research activity for NASA (LCTR: Large Civil Tilt Rotor), Army, Bell Helicopter and other companies. Flutter can be analyzed, so it could also be prevented before an aircraft is built. The Griffin aircraft is prepared with the recommendations made from new research done to increase the stability boundary. One method is to, “uncouple the torsion and bending motion by modifying the mass distribution to move the center of gravity closer to the center of twist” [7]. The stiffness to mass ratio of the rotor blades should also be increased, as C.W. Acree found that, “stiffening was required to achieve an adequate whirl-flutter margin” [8]. A flexure hub is used for the rotor configuration of Griffin as “detrimental effect of control system stiffness on blade pitch-lap coupling and whirl-flutter stability is greatly reduced by the presence of a flexure hub” [9]. Compared to a rigid hub, the flexure hub tends to reduce the effective pitch flap coupling according to the investigation.
4.2.6 Composite Lay-up of Wing
The V-22 osprey has a wing thickness to chord ratio (t/c) of 23%. As previously stated, Griffin has a (t/c) of 18.02%. This is possible based on the research done on advanced composite materials, lay-up process and advance configuration. For example, the lay-up of composite of the wing-box design for Griffin is based on the ‘Case 2’ characteristic of research done by Dr. Rohani and Clements [8]. The wing itself is comprised of five stringers span-wise with carbon-epoxy roving. According to research done by David Popelka and his colleagues, their research on composite tailoring of wing, “can improve stability boundaries and permit reduced wing thickness for higher cruise speeds, increased performance and improved productivity for tilt rotors”[8]. Unfortunately, because of lack of expertise and time, the increase in performance for using composite material was not analysed. (Please refer to Appendix B for the diagrams of the composite lay-up).
4.2.7 Outboard Section Analysis
The span (b) of Griffin is calculated to be 16.1 meters (52.84 ft) and the rotor radius (Rrotor) is 4.84 meters (15.87 ft). The team decided to put the nacelle slightly inboard to adapt some of the benefit of having the outboard section. With a clearance of 0.76 meters (2.5 ft) for fuselage to rotor interaction for noise and vibration control and accounting for the nacelle diameter of 0.40 (1.3 ft), Griffin is left with an outboard section of 1.04 (3.4 ft), Figure 4.4.
Figure 4.4: Wing geometry of GriffinThere are couples of advantages of having the outboard section. Because the nacelles are not at the very tips of the aircraft,
the root stress of the wing is not as high as the configuration with the nacelles at the tips of the wing. This reduces the cost, weight and increases structural capability of the wing. By independently controlling this outboard section, the pilot of Griffin can have higher authority of roll control. The moment arm for the outboard section relative to the center of gravity (C.G.) location is longer than the flaps in the inboard section. So the small area of the outboard section is more effective than using the flaps. Considering such advantage of the outboard section the team decided to use flaps that are low in drag, but the deployment is slower. A faster deployment speed of flaps is not necessary for Griffin because they are not used as flaperons (same surface used as flaps and ailerons),
11
Span (b) = 52.8 ft
Inboard = 44.6 ftOutboard = 3.4 ft Nacelle Diameter=1.3 ft
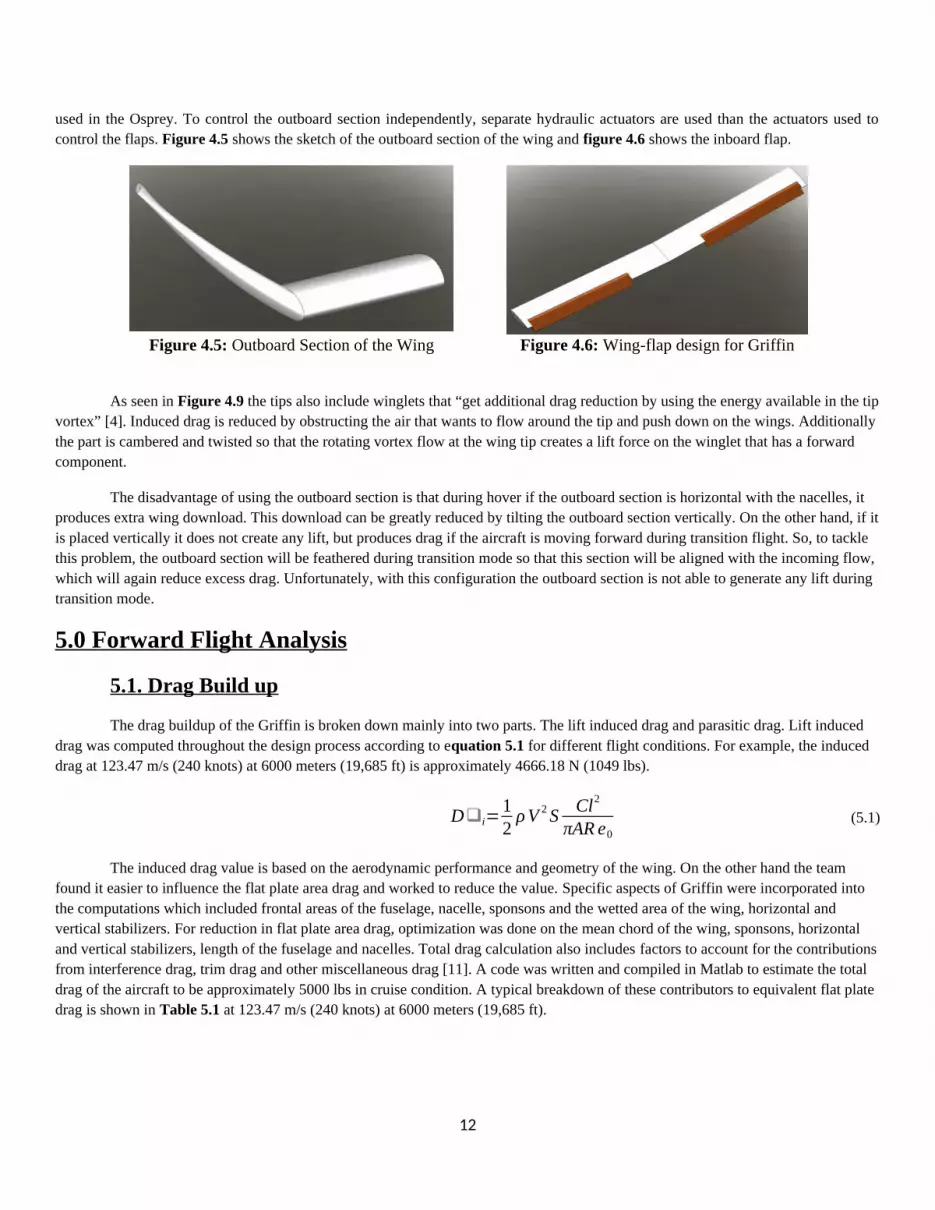
used in the Osprey. To control the outboard section independently, separate hydraulic actuators are used than the actuators used to control the flaps. Figure 4.5 shows the sketch of the outboard section of the wing and figure 4.6 shows the inboard flap.
Figure 4.5: Outboard Section of the Wing Figure 4.6: Wing-flap design for Griffin
As seen in Figure 4.9 the tips also include winglets that “get additional drag reduction by using the energy available in the tip vortex” [4]. Induced drag is reduced by obstructing the air that wants to flow around the tip and push down on the wings. Additionally the part is cambered and twisted so that the rotating vortex flow at the wing tip creates a lift force on the winglet that has a forward component.
The disadvantage of using the outboard section is that during hover if the outboard section is horizontal with the nacelles, it produces extra wing download. This download can be greatly reduced by tilting the outboard section vertically. On the other hand, if it is placed vertically it does not create any lift, but produces drag if the aircraft is moving forward during transition flight. So, to tackle this problem, the outboard section will be feathered during transition mode so that this section will be aligned with the incoming flow, which will again reduce excess drag. Unfortunately, with this configuration the outboard section is not able to generate any lift during transition mode.
5.0 Forward Flight Analysis
5.1. Drag Build up
The drag buildup of the Griffin is broken down mainly into two parts. The lift induced drag and parasitic drag. Lift induced drag was computed throughout the design process according to equation 5.1 for different flight conditions. For example, the induced drag at 123.47 m/s (240 knots) at 6000 meters (19,685 ft) is approximately 4666.18 N (1049 lbs).
D❑i=12
ρ V 2 S Cl2
πAR e0 (5.1)
The induced drag value is based on the aerodynamic performance and geometry of the wing. On the other hand the team found it easier to influence the flat plate area drag and worked to reduce the value. Specific aspects of Griffin were incorporated into the computations which included frontal areas of the fuselage, nacelle, sponsons and the wetted area of the wing, horizontal and vertical stabilizers. For reduction in flat plate area drag, optimization was done on the mean chord of the wing, sponsons, horizontal and vertical stabilizers, length of the fuselage and nacelles. Total drag calculation also includes factors to account for the contributions from interference drag, trim drag and other miscellaneous drag [11]. A code was written and compiled in Matlab to estimate the total drag of the aircraft to be approximately 5000 lbs in cruise condition. A typical breakdown of these contributors to equivalent flat plate drag is shown in Table 5.1 at 123.47 m/s (240 knots) at 6000 meters (19,685 ft).
12

Components of the aircraft Contribution to Flat plate Area DragFuselage 16.27%Wing 49.71%Horizontal Stabilizer 5.69%Vertical Stabilizer 9.33%Spnsons 8.36%Nacelles 1.41%Interference Drag 4.5%Trim Drag 1.48%Miscellaneous 4.2%
Figure 5.1: Flat-plate area distribution of the main components of the aircraft
As seen in this chart, the wing accounts for about half the flat plate area drag. Hence, it justifies the team’s close attention to optimize the wing geometry.
5.2 Power Calculation
The basis to calculate power required for cruise was referenced back to the drag gained during this condition. At trim condition the summation of the longitudinal forces are equal. This implies that the thrust of the aircraft is equal to the drag of the aircraft. Equation 5.2 shows the power required at trim condition. The total power required for Griffin calculates up to be 3918.65 kW (5255 hp W).
Pcruise = DcruiseVcruise (5.2)
Climb rate was one of the governing factors when it came to compute the power installed for the aircraft. According to the requirements the Griffin must climb at 609.6 m/min (2000ft/min) average climb rate (R/C) all the way up to 6000 m (19,685 ft). The climb rate is directly related to the excess power available in the aircraft. This relationship is given by equation 5.3.
R/C = ( P❑available−P❑required)Weigh t of t heaircarft
(5.3)
The rate of climb stays constant and the power required decreases at the speed of 108.03 m/s (210 knots) as the altitude starts to increase. But after a certain altitude the induced drag starts to increase and the power required starts to increase. On the other hand power available decreases as altitude increases. The decrease is a factor of the pressure ratio of the atmosphere pressure flown and the atmosphere pressure at sea level shown in equation 5.4.
Pavailable @alt=Pressure@altitude
Pressure@sealevelPinstalled @sea level (5.4)
The constant climb rate is used to measure the power installed in the aircraft and compared with the hover power requirements (please refer to section 6.3 for the requirements). Figure 5.1 shows the power needed to install in the vehicle to generate 609.6 m/min (2000 ft/min).
13

Figure 5.1: Excess Power CalculationThroughout the calculation power required by the aircraft accounts for the propeller efficiency, while power available
accounts for the engine’s max continuous power (85% of the max rated power). This analysis along with the hover power required led the team to select 13000 hp (9,694.10 kW) as Griffin’s max installed power. Engine selection along with hover performance is discussed in the later section where hover power is calculated.
5.3 Stall Speed, Best Endurance and Best Range
Based on the dimensions of the Griffin, the stall speeds at different altitudes were calculated. This was useful because it was a guideline to make sure that the aircraft does not reach a velocity close to the stall speed at its corresponding altitude. Figure 5.2 shows the change in stall speed as Griffin fly at a higher speed. To reduce the amount of fuel burn for certain missions, the best range speed of Griffin was measured: Figure 5.3 shows power vs. velocity of Griffin at 6000 m (19,685 ft).
Figure 5.2: Stall speed Vs. Altitude Figure 5.3: Best endurance and best range 6000 m (19,685 ft)
According to the graph at 6000 m (19,685 ft), best range for the aircraft is at 107.26 m/s (208.5 knots). This value is very beneficial for the team. For example, the team chose to use fly Griffin at velocity of 108.03 m/s (210 knots) during climb and during the use of excess fuel, which maximizes Griffin’s range to gain more points in the performance index section. 108.03 m/s (210 knots) is above stall speed of 104.39 m/s (203.5 knots) to account for disturbances and maneuvers during flight and is very close to 107.26 m/s (208.5 knots) to use minimum fuel burn with maximum distance by Griffin.
14

6.0 Transition and Hover Analysis
6.1 Transition Analysis
Griffin is capable of performing missions at low speeds of 61.73 m/s (120 knots) and even 41.16 m/s (80 knots) because of the aircraft’s ability to fly in transition mode. The basic analysis of the transition mode comes from the force balance of the aircraft in a low speed flight condition with the nacelles rotated to a certain angle (from vertical to horizontal direction, 1.57 rad (90°)). The forces involved in this analysis includes: aircraft weight, wind lift with flap, drag of the aircraft with flaps and thrust created by the rotors (shown in figure 6.1). As stated earlier, during transition mode the outboard section is feathered. So, it was important to include the contribution of the outboard section in the calculation of the lift (unable to create lift) and drag (adding parasitic drag).
Figure.6.1: Force Balance for Griffin in transition mode
The calculation starts with summing the horizontal forces, excluding the thrust, equation 6.1 and the vertical forces, equation 6.2. Compared to a forward flight configuration, the thrust must produce lift and forward force in transition mode. So, the thrust is a vector sum of both horizontal and vertical forces, equation 6.3.
F x=Di+D parasite+Dflap+D outboard (6.1)
F y=W −Lwing(with flap) (6.2)
T=F x2+F y
2 =((W −Lwing−L flap )2+(Dinduced+Dparasite+Dflap+Doutboard)2)
12 (6.3)
In low speeds such as 41.16 m/s (80 knots) the wing of Griffin is unable to create adequate lift for the aircraft. At 61.73 m/s (120 knots) and 41.16 m/s (80 knots) the wing only supports 76.3% and 36.5% of Griffin’s weight respectively during rescue coordination and aid distribution mission. The rotors are then used to create the additional lift required. This value is controlled by tilting the nacelle angles that determines the thrust direction (given in figure 6.2).
According to the figure, the nacelle angle is set at 1.57 rad (90°) for forward flight mode. Therefore, the nacelle angle is the set to be the same as thrust direction which is given in equation 6.4:
α p=arctan (F y
Fx)=arctan (
Dinduced+ D parasite+D flap+Doutboard
W −Lwing (with flap )
) (6.4)
15

Figure 6.2: Nacelle angle relative to the horizon
Nacelle angle during transition flight is provided in figure 6.3 for 41.16 m/s (80 knots) and 61.73 m/s (120knots) at 2000 m (6561.68 ft) of 0.17 rad (9.7°) and 0.78 rad (44.6°) respectively. The angles are plotted against the Cl value of the wing with flaps deployed.
Figure 6.3: Nacelle angle of transition flight
The power required during the transition mode is similar to the calculation of the power required for Griffin’s helicopter flight configuration. The calculation starts with the aerodynamics operation calculation [11], so the power requirement is given by equation 6.6, where C p (power coefficient) of forward flight is given by equation 6.7.
P=C p ρA Ω3 R3 (6.6)
16
Is this the Cl transition of the wing

C p=κ C t
2
2√ μ2+ν2+
σ Cd 0
8(1+K μ2 ) (6.7)
In the equation above, the first term is the coefficient of induced power required and second term is the coefficient of reverse
flow power required. It is important to note that in the case advanced ratio (μ=v∗cos (α p)
Ω∗r) is higher than 0.1, estimation from can
be used:[11]
C p=κ C t
2
2 μ+
σ Cd 0
8(1+K μ2) (6.8)
(κ=1.15; σ=0.1236; Cd0=0.018; K=4.65)
After the calculation,μ is found to be always higher than 0.2 for lift coefficient less than 2.5 for both 41.2 and 61.7 m/s (80 and 120 knots), at 2000 m (6562 ft), this shows that the estimation of Cp is valid. The total power required result is provided later in flap design section.
6.2 Flap Design
High left device is designed to reduce the power required in transition flight: as increased lift is supported by the wing, so that minimum power can achieve. Based on the geometry and mission requirements of Griffin the team did research on two flap configurations: Blackburn slotted flap and Gwinn flap, figure 6.4. The characteristics and performance of the flaps are compared against a wing with no flaps as shown in table 6.1. (reference?)
Figure 6.4: Gwinn flap model & Blackburn slotted flap model
Flap Type(cruise at 6000m (19685 ft ), at 108 m/s (210
knots))
Angle of Attack of The Wing [rad(Deg)]
Flap Chords (Cf/C)
Flap Angle (Deg)
Extend Chord (C'/C)
Cl Cd
No Flap ~0.19 (11) 0 0 1 ~0.9 ~0.07Gwinn 0.17 (10) 0.25 45 1 1.8 0.3
Blackburn Slotted (30% Chord) 0.17 (10) 0.3 50 1.13 2.1 0.142Blackburn Slotted (50% Chord) 0.17 (10) 0.5 50 1.17 2.42 0.221
Table 6.1 Flap comparison [12]
From the table above it is evident that, although the 0.25c Gwinn flap was 5% smaller than 0.3 Blackburn Slotted flap, the Gwinn Flap creates twice the drag than the Blackburn Slotted Flap creates. So the Blackburn Slotted Flap proved itself to be a better candidate over the Gwinn Flap. To optimize the flap performance 0.3c and 0.5c Blackburn Slotted Flap was compared. The 0.5c Blackburn Slotted flap was the best selection because it reduced the total power required. Even though the higher area increased drag, this increase was acceptable. During transition mode to hover mode, these flaps with the larger chord turned from 50 degrees to 75
17

degrees in order to reduce the downwash coming from the rotors. To further support the team’s choice of .5c Blackburn Slotted flaps, figure 6.5 shows an optimization selection of the flaps based on power requirement.
Figure 6.5: Power required for 0.25c Gwinn, 0.3c & 0.5c Blackburn Slotted flaps
According to the figure above 0.5c Blackburn Slotted flaps produced the minimum amount of power required, while providing a higher C l for the wings in transition mode. This higher C l is necessary for low speed transition flight of 41.16 m/s (80
knots). But, when C l is higher than 2.4, the induce drag (proportional to C l2) increases, which also increases the power required during
61.73 m/s (120 knots) flight. The team focused on optimizing at this speed because Griffin is required to travelled more time in 61.73 m/s (120 knots) during transition mode performing rescue coordination than 41.2m/s (80 knots) of aid distribution (shown in Mission Analysis). Analyzing figure 1, which shows power requirement for different speeds at 2000 m (6561 ft), it is evident that Griffin is optimized to fly at the lowest power required during 61.73 m/s (120 knots).
The Blackburn Slotted flap chosen by the team so that Griffin can perform its mission with the lowest power required. But, the deployment of this flap would probably be relatively slow due to the slop structure. This implies that this flap cannot be used as flaperons for roll control, because there would be a lag of pilot’s input and roll moment of the aircraft. So, the flaps are only used for increasing the C l of the wing. As stated above the roll control is supported by the independent control of the outboard section. The team worked to reduce the complexity involved with the flap and outboard section development. The roll moment is controlled separately by the outboard section during transition flight condition, which adds less complexity than the flaperons for which the nacelle angle needs to be adjusted simultaneously for the C l changes associates with the flaperons at transition flight condition.
6.3 Hover
The Griffin is a tilt rotor design that is capable of hovering, while having higher forward speeds compared to a helicopter. The ability to hover is a unique capability a rotorcraft aircraft has compared to a fixed wing aircraft. Hover is an important flight condition that played a vital role in the preliminary design of the Griffin. In the beginning of the design, a list of configurations was looked at. The hovering capability quickly disqualified all fixed wing aircraft. It is a flight condition that has many benefits. For example, the ability to land and take off without the need of a runway are some of these benefits. There are also sacrifices on the
18

vehicle design; it limits the forward speed due to the need of prop rotors. The design team has decided that hovering is a critical flight condition that a HealCopter must have. This section explains how hover and power requirements have been analyzed.
Hover is a flight condition that demands a high power required on the aircraft. For the preliminary design of the Griffin, hover was used to calculate the installed power the aircraft would need, as well as the preliminary design of the vehicle, wings and prop rotors. When analyzing hover, the prop rotors were designed to keep the disk loading in the higher figures in order to keep the prop rotors smaller in size. Keeping the prop rotors smaller, helped the efficiency of the prop rotors in forward flight. The prop rotors helped size the wings of the aircraft because of the simple limitation that the prop rotors must clear the fuselage.
The customer gave some hard limitations. One of those was the weight of the vehicle, fifteen metric tons. It was assumed that in hover the main rotor thrust, T and the weight W are equal shown in equation 6.10. This is a good approximation in hover flight. Making this assumption and picking a rotors disk loading, the rotor area A was found using equation 6.11
W =T 6.10
A= WDL 6.11
The disk loading of the aircraft was picked to be 1,001 N/m2 (20.9 lbs./ft2), this showed to optimize the power and size of the rotors. The reason this disk loading was chosen was because the primary flight condition for this aircraft is forward flight; the rotors in propeller mode are desired to be small compared to hover for efficiency. Therefore, this disk loading was picked finding a balance between propeller efficiency and the required power to hover, which is directly related with disk loading. With these numbers, the rotor area came out to be 73.5 m2 (791.13 ft2) for each rotor. Using equation 2.3 the diameter D of the rotors was found.
D=√4(Aπ
) 6.12
Using the rotor area of 73.5 m2 (791.13 ft2) the rotor diameter is 9.67 m (31.738 ft). The radius of the rotors is 4.83 m (15.869 ft). The blade’s rotational speed (Ω) was picked to be 42.73 radians per second. In equation 6.13, the blade tip velocity is calculated. The solidity of the prop rotor was found in the prop rotor analyses and it is.1236.
V Tip=R∗Ω 6.13
These are the main sizing aspects of the rotor. Now that the rotor has been sized, the power required for this aircraft can be evaluated. To begin the calculation, the ideal power for the Griffin was calculated. To find power, Principles of Helicopter Aerodynamics [14] was used. To be able to calculate the ideal power, the thrust coefficient must be calculated first. Equation 6.14 shows the thrust coefficient equation, which varies with density. This was found at different altitudes to understand how the power varied with density. To calculate the Ct the weight was assumed to equal the thrust shown in equation 6.10. Equation 6.15 shows the power ideal for a conventional helicopter. This assumption is valid when the aircraft is at hover, because even though it is a tilt rotor, in hover it acts like a conventional configuration. Since the Ct varied with density, Cp also varied with density.
C t=T
ρA V tip6.14
C p=Ct
32
√26.15
19

The measured power is a similar calculation. There were assumptions made to be able to predict the measured power. The one assumption that was made is that blades had a fifteen percent loss due to non-ideal effects, like tip loss. The Cd0 for the blades of this aircraft is .018. With these things in mind equation 6.16 shows the measured power, also varying with density.
C p=1.15C t
32
√2+
σ Cd 0
8 6.16
Using the measured power coefficient, the power required for the Griffin can be calculated using equation 6.17. The power required was multiplied by a correction factor to account for wing downloading and the fountain effect.
PRequired=Cp ρA V tip
3
550(1.09 ) 6.17
Power available is also an important calculation that would allow the team to be able to find the hover ceiling. The power available of a turbine engine is shown in equation 6.18. The installed power is the max continuous power of the engine approximately eighty five percent of the max rated power.
PAvailable=PP0
(P Installed) 6.18
To be able to find a relation between density ratio and pressure ratio, equations 6.19 and 6.20 were used. The final equation used is 6.21. The Power available was done using equation 6.22 where the power installed was chosen to be 8127.26 kW (11050 horsepower). This is the engine’s max continuous power, which is eighty five percent of 9561.48 kW (13000 horsepower), the engines max rated power.
ρρ0
¿(1−6.876e-6∗h)4.2656.19
PP0
¿(1−6.876e-6∗h)5.2656.20
PP0
= ρρ0
5.2654.265 6.21
Pavailable=PP0
∗P Installed 6.22
Now that both the ideal power and the measured power have been found, the figure of merit of the aircraft was calculated using equation 6.23. The figure of merit of the aircraft came out to be .63. This is a reasonable number for a tilt rotor design because the non-ideal effects of wing download and the fountain effect. The correction factor again is to account for this penalty.
20

FM=
C t
32
√2
1.09 (1.15 C t
32
√2+
σ Cd 0
8 )6.23
Making the power available equal the power required the hover ceiling was found. This can be seen in figure 6.6 below.
In case of an engine failure, the Griffin was analyzed for hover performance at ninety five percent of the engine’s max rated power. The aircraft would be able to fly for thirty minutes safely. Figure 6.7 shows that the Griffin would be able to hover with a single engine at a hover ceiling of 102.2 m (335.3 ft).
Figure 6.6: Hover Ceiling with 8127 kW (11050 HP) Max Continuous Power
Figure 6.7: Hover Ceiling in Engine Out Procedure.
6.4 Wing Download
Wing download is the downwash of the rotor hitting the wing causing a force down, acting like extra weight on the aircraft, and one of the biggest disadvantages that tilt rotor aircraft have. A simple calculation using equation 6.24 was done. Knowing all other factors the induced velocity was solved for. Using equation 6.25 the wing download was found. This calculation showed that the wind download on the Griffin was about nine percent. Another factor that must be taken into consideration is the fountain effect. The fountain effect is a span-wise flow on the wing, which was turned in a direction opposite that of the rotor downwash by the image plane. According to NASA Ames Research Center in Rotor/Wing Aerodynamic Interactions in Hover [15], the fountain effect can have an affect up to five percent of the rotor thrust. They also mention that the overall wing download can range from twelve to fifteen percent of the main rotor thrust. This verified our calculation but to make sure the analysis is not under estimated, the design team decided to add a fifteen percent wing download penalty to begin..
.5T=2 ρA V i2=.5GW +.5 RCρCd (1.35V i )
2 6.24
21
DL=.5 RCρ C d (1.35 V i )2 6.25
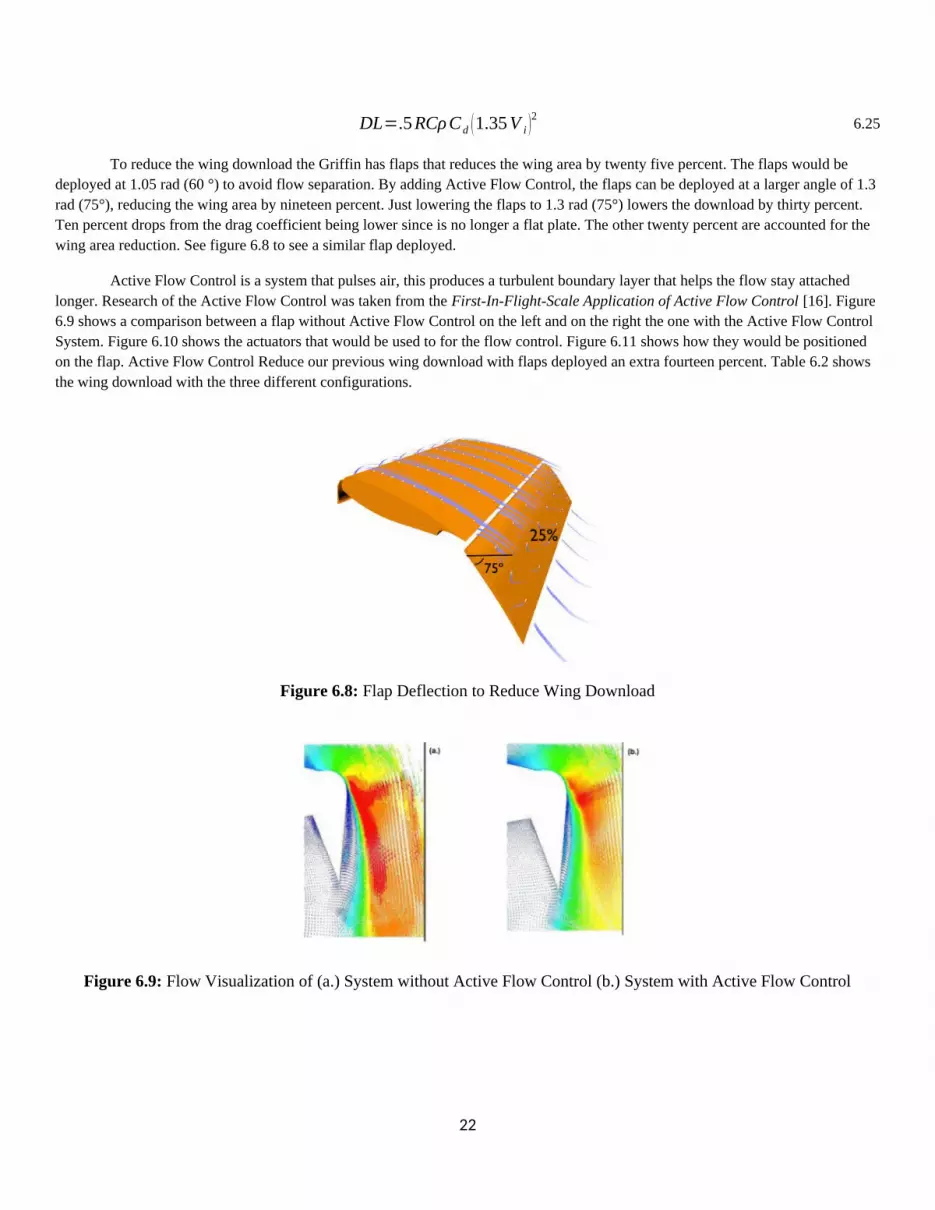
To reduce the wing download the Griffin has flaps that reduces the wing area by twenty five percent. The flaps would be deployed at 1.05 rad (60 °) to avoid flow separation. By adding Active Flow Control, the flaps can be deployed at a larger angle of 1.3 rad (75°), reducing the wing area by nineteen percent. Just lowering the flaps to 1.3 rad (75°) lowers the download by thirty percent. Ten percent drops from the drag coefficient being lower since is no longer a flat plate. The other twenty percent are accounted for the wing area reduction. See figure 6.8 to see a similar flap deployed.
Active Flow Control is a system that pulses air, this produces a turbulent boundary layer that helps the flow stay attached longer. Research of the Active Flow Control was taken from the First-In-Flight-Scale Application of Active Flow Control [16]. Figure 6.9 shows a comparison between a flap without Active Flow Control on the left and on the right the one with the Active Flow Control System. Figure 6.10 shows the actuators that would be used to for the flow control. Figure 6.11 shows how they would be positioned on the flap. Active Flow Control Reduce our previous wing download with flaps deployed an extra fourteen percent. Table 6.2 shows the wing download with the three different configurations.
Figure 6.8: Flap Deflection to Reduce Wing Download
Figure 6.9: Flow Visualization of (a.) System without Active Flow Control (b.) System with Active Flow Control
22
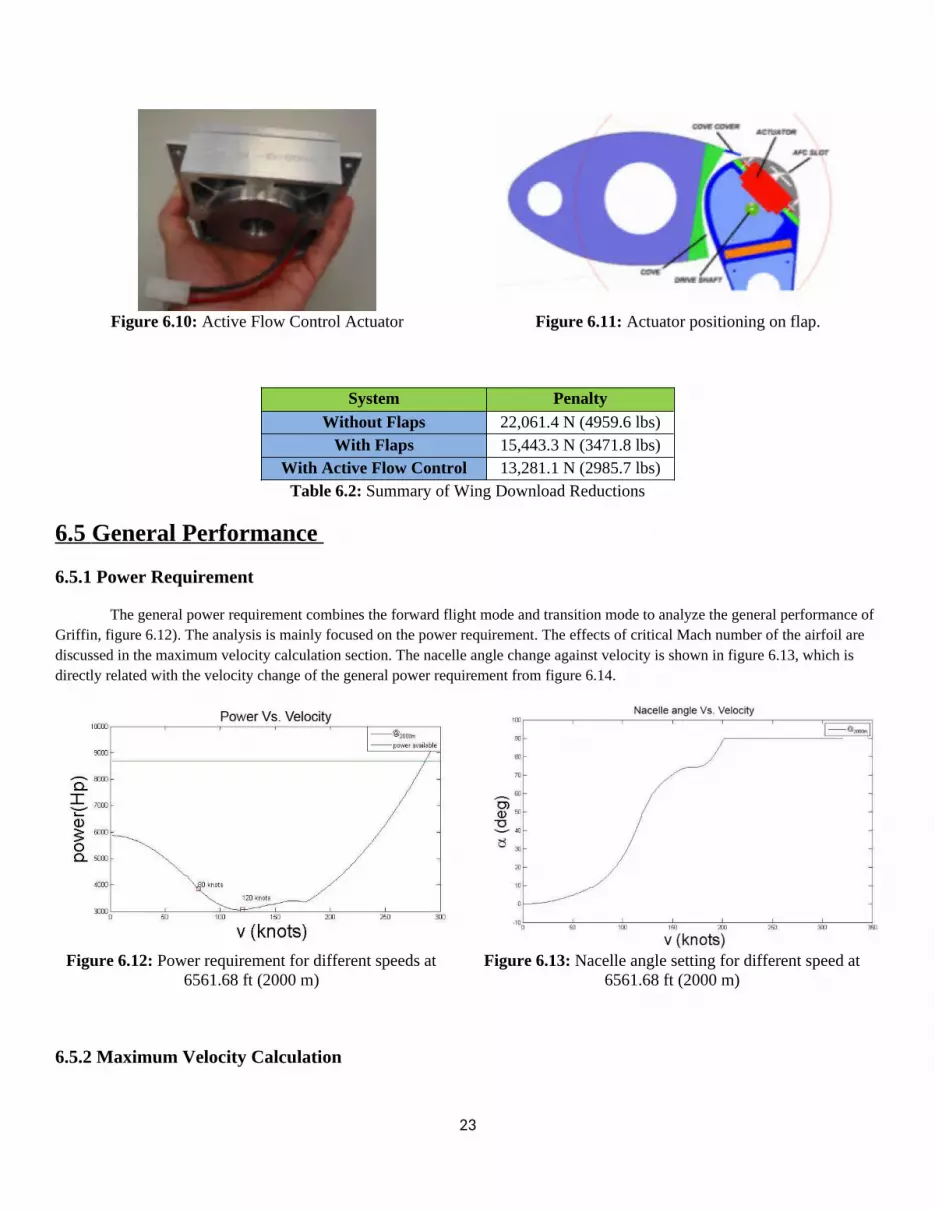
Figure 6.10: Active Flow Control Actuator Figure 6.11: Actuator positioning on flap.
System PenaltyWithout Flaps 22,061.4 N (4959.6 lbs)
With Flaps 15,443.3 N (3471.8 lbs)With Active Flow Control 13,281.1 N (2985.7 lbs)
Table 6.2: Summary of Wing Download Reductions
6.5 General Performance
6.5.1 Power Requirement
The general power requirement combines the forward flight mode and transition mode to analyze the general performance of Griffin, figure 6.12). The analysis is mainly focused on the power requirement. The effects of critical Mach number of the airfoil are discussed in the maximum velocity calculation section. The nacelle angle change against velocity is shown in figure 6.13, which is directly related with the velocity change of the general power requirement from figure 6.14.
Figure 6.12: Power requirement for different speeds at 6561.68 ft (2000 m)
Figure 6.13: Nacelle angle setting for different speed at 6561.68 ft (2000 m)
6.5.2 Maximum Velocity Calculation
23

The team also focused on the maximum velocity calculation because it is part of the permanence index. This value is optimized mainly based on three aspects: maximizing engine power, critical Mach number of the wing, and minimizing drag. The maximum speed from power available and maximum allowable speed from critical mach number of the wing of the aircraft was plotted against altitude ranging from 0-6000 meters (0-19,685 ft) in figure 6.14.
Figure. 6.14: Maximum velocity vs. Altitude
As the altitude increases, the turbo shaft engine output is decreases. This allows Griffin to have a maximum speed of 153.3 m/s (298 knots) and 138.9 m/s (270 knots) at 0 and 6000 meters (0 &19,685 ft) respectively. The empty weight of Griffin was around 7,484 kg (16,500 lbs), while the maximum allowable take-off weight is 14,377 kg (31,697 lbs). But, maximum distance travelled by the aircraft is also a component of the performance index. So, the team decided to include around 1134 kg (2500 lbs) of more fuel in the aircraft, so is able to fly another extra 700 km (435 miles). The benefit of increase in maximum distance outweighs the weight increase by the extra fuel (shown in section 13). So, with this addition of fuel weight, the maximum speed with maximum take-off weight is also calculated as 150 m/s (291 knots).
7.0 Propulsion System Design
7.1 Engine System Design
To begin the engine selection process, the team analyzed which flight configurations required the largest amount of power. It was found that even though hover and the 609.6 m/min (2000 ft/min) rate of climb require large amounts of power, 123.47 m/s (240 knots) at 6000 m (19,685 ft) required the most amount of power. Therefore, using this, the design team found that the aircraft needed 9561.48 kW (13000 HP) installed power. Even though the aircraft has a high power to weight ratio, it helped to optimize the performance index in many areas.
For the Griffin, the design team looked for the future generation turbo shaft engines. The engine was sized from the new generation GE-3000 engine. The GE-3000 engine is a smaller (2206.5 kW) (3000 HP) engine that was design to replace the legendary GE-T700, a reliable engine that was used in numerous helicopters for decades. GE is expecting gains from their new engine, including a twenty five percent decrease in weight and specific fuel consumption. The engine of the Griffin was designed with this in mind.
24

Now that the power required has been sized weight, dimensions, and specific fuel consumption were analyzed. The weight, dimensions, and specific fuel consumption were analyzed using modified equations from the 29th Annual AHS International Student Design Competition Request for Proposal [17]. Equation 7.1shows how the engine weight was calculated. One assumption was that the max continues power (MCP) was eighty five percent of the max rated power of the engine, each engine having 5516 kW (7500 HP). The weight of each engine was found to be 360 kg (793 lbs).
W Engine=
N Eng [.1054 ( MCPN Eng )
2
+358( MCPNEng )+27570]
( MCPN Eng )+1180
7.1
Mentioned before, was that because of innovation and looking ahead to the next generation of engines, the design team expects a twenty five percent decrease in the predicted engine weight. This decreased our weight per engine to be 269.9 kg (595 lbs). Even though the weight equation was not modified, the diameter and length equation seen below were modified and verified to predict the most accurate values. The way these equations were adjusted was by taking existing turbo shaft engines and adjusting the multiplier until the equations were predicting the most accurate values. Equations 7.2 and 7.3 show the final results. The diameter of the Griffin engine is .088 m (2.88 ft) and the length is 2.04 m (6.68 ft).
DEngine Diameter=1.015 ( MCP ).3704 7.2
LEngineLength=1.652 ( MCP ).4148 7.3
The weight and the dimensions of the engines were a large concern for the design team, but fuel is a large percentage of the weight on an aircraft, so low specific fuel consumption was critical. To begin sizing the SFC, baseline engine was picked. The GE-T700 was chosen to be the baseline engine to size the SFC. The reason for this is because data is widely available for this engine and because GE is expecting a 25 percent reduction in SFC from this engine to their new GE-3000. Equation 7.4 shows the ratio of max rated power between the baseline engine and the scaled engine. Equation 7.4 will be an input to equation 7.5, which is the SFC correction factor. Multiplying the SFC correction factor to the GE-T700 engine SFC of .433 lbs hp*hr, the scaled engine SFC was found to be .391. As mentioned before, the expectation is that the SFC would decrease by twenty five percent. This gave the Griffin an SFC of .293.
γ=MRPSLScaled
MRPSLBaseline
7.4
SFCCorr=−.00932 γ 2+.865 γ+.445
γ+ .3017.5
7.2 Transmission
To be able to use the power from the engines, the transmission plays a vital roll. The engine is spinning at about 17000 rpm, while the prop rotors are only spinning at 408 rpm. The task of the transmission is to slow down the rotational speeds to the design rotational speed of the prop rotors. To begin to size the transmission, the first thing necessary was to find the reduction ratio that would be necessary. This was found to be about 42.1 to 1. The transmission analysis equations and data were taken from the Analysis and Synthesis of Intermeshing Rotor Transmission System by Zihni Burcay Saribay [16]. The design team chose to use a planetary final output that gave a 4 to 1 reduction ratio; it would have 4 planets and a sun gear. Table 7.1 below shows all the values for the transmission. To find the face width of the planetary transmission necessary to take both the contact stress and bending stress, the torque created by the rotors was calculated. First, the tangential force was calculated using equation 7.9. Dimensions of r1 and r2 were
25

approximated using the rotor hub size. Equation 7.7 and 7.8 are used to calculate both the bending and contact stresses. Look at Table 7.1 and 7.2 for the constant values. It is important to note that the factors in Table 7.1 and Table 2 are mostly material properties and not helicopter coefficients like one may be used to.
W t=.5( Qn (r1+r2 ) ) 7.6
Sc=C p √ W t Cσ C s Cm C f
Cv FDp I7.7
Sτ=W t K0 Pd K s Km
J K v F7.8
The transmission will still need more reductions that will be achieved with spur gearing. The transmission will have three spur gears and a spiral bevel gear to connect both rotors with a cross shaft.
Component Design DimensionRotor Hub 1.1 m (3.61 ft)Sun Gear .11 m (4.32 in)
Planet Geat .11 m (4.32 in)Face Width .088 m (3.46 in)
Number of Planets 4Engine Rotational Speed 17000 RPM
Cross Shaft Rotational Speed 3400 RPMRotor Rotational Speed 408 RPM
Table 7.1: Drivetrain Dimensions and Data
26

Table 7.2: Coefficients for rated contact stress and allowable contact stress
Table 7.3: Coefficients for rated bending stress and allowable bending stress
8.0 Stability and Control
8.1 Empennage Sizing
The empennage for a tilt rotorcraft is more complex to design than convention rotorcraft. In order to accomplish the design, the empennage sizing was divided into two tasks: vertical and horizontal stabilizer. The surfaces area of these tails will provide directional control for pitch and yaw. The sizing of the empennage was determined through analysis of past fixed wing platforms by plotting the fuselage volume ratio vs. the empennage volume ratio. Additionally, the sizing of the empennage was used to determine the wing location on the Griffin. The initial step to determine empennage size was calculating both vertical and horizontal volume ratios with respect to the wing.
V v=Sv lt
Sb(8.1)
V H=Shlt
Sc (8.2)
The vertical stabilizer volume ratio was .8 as marked in figure 8.1 shows the relationship between the Griffin and other fixed wing platforms. The vertical stabilizer area of 5.17 m2
(55.6 ft2) was calculated by taking the volume ratio by multiplying the wing area and wingspan, then dividing by the length from the stabilizer to the wing.
Figure 8.1: Vertical Tail Volume Ratio vs. Fuselage Volume Ratio
Unlike the vertical stabilizer ratio, the horizontal stabilizer ratio was further away from the trend line. This could be the result of the different empennages configuration for each aircraft. Some of the aircraft had conventional tails, T tails, and cruciform tails. The
27

horizontal stabilizer ratio was 0.53; this was determined by taking the average of the similar empennages shapes XV-15 and V-22. The ratio was calculated by multiplying wing area and wing mean chord, and then by dividing by the length from the stabilizer to the wing. The area of horizontal stabilizer was 4.28 m2 (46.1 ft2).
8.2 Wing Location Determination
The empennage ratio was selected and the wing dimensions were defined, static margin was used to determine the wing location.
SM=hn−h (8.3)
The length of the fuselage was determined by mission requirements. The empennage was placed at the end of the Griffin. The wing location of the Griffin was varied to estimate a static margin.
Figure 8.2 shows static margin vs. lt for 3 different missions as well as when the Griffin is empty. Since static margin and lt are both dependent on the CG location of the Griffin, figure 8.4 was developed using the weight equations listed in section 11.1. Since the A.C. and C.G were measured from the leading edge of the wing, the wing location was optimizing to get a acceptable static margin. From figure 8.2, the lt with an acceptable static margin was at 8.07 m (26.5 feet).
Figure 8.2: Static margin vs. lt(ft) for different mission.
8.3 Empennage Location
Since the wing of the Griffin was larger in comparison to similar tiltrotor aircraft, the empennage needed to be larger to balance the volume ration. It was necessary to divide the area of the vertical tail into two parts to avoid issues of structural integrity: resulting in an H tail configuration. Two rotor props powered the tilt rotor; an H-tail will put the two vertical tails behind the prop-wash region, which result in a higher level of performance. Detailed calculations for static margin started with determining the value for the average low speed downwash gradient. The downwash changes accordingly to pitch. As the angle of attack of the Griffin changed so will the downwash, which the deflection of the flow at the empennage caused by the wing.
28
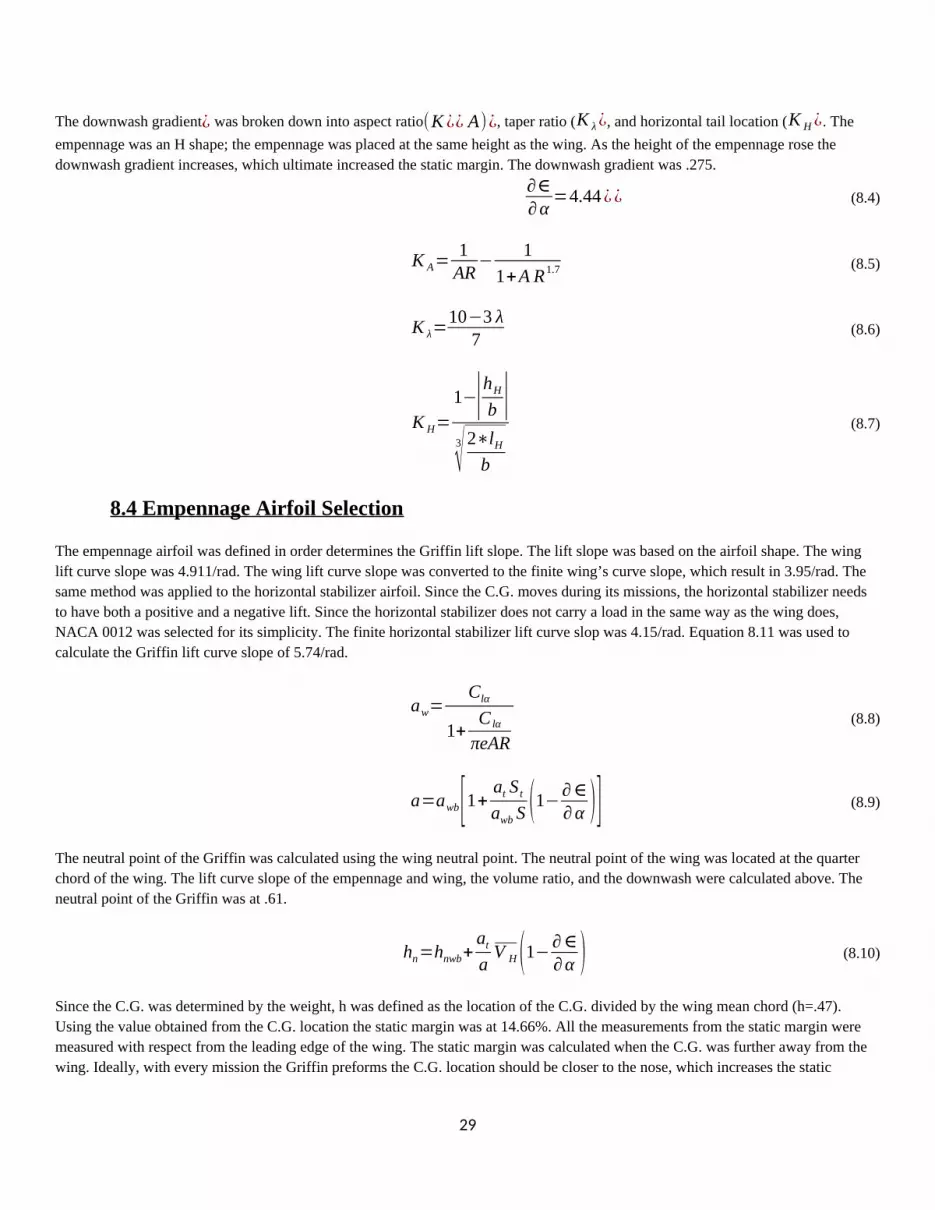
The downwash gradient¿ was broken down into aspect ratio(K ¿¿ A)¿, taper ratio (K λ¿, and horizontal tail location (K H ¿. The empennage was an H shape; the empennage was placed at the same height as the wing. As the height of the empennage rose the downwash gradient increases, which ultimate increased the static margin. The downwash gradient was .275.
∂∈∂ α
=4.44¿¿ (8.4)
K A=1
AR− 1
1+A R1.7 (8.5)
K λ=10−3 λ
7 (8.6)
K H=1−|hH
b |3√ 2∗lH
b
(8.7)
8.4 Empennage Airfoil Selection
The empennage airfoil was defined in order determines the Griffin lift slope. The lift slope was based on the airfoil shape. The wing lift curve slope was 4.911/rad. The wing lift curve slope was converted to the finite wing’s curve slope, which result in 3.95/rad. The same method was applied to the horizontal stabilizer airfoil. Since the C.G. moves during its missions, the horizontal stabilizer needs to have both a positive and a negative lift. Since the horizontal stabilizer does not carry a load in the same way as the wing does, NACA 0012 was selected for its simplicity. The finite horizontal stabilizer lift curve slop was 4.15/rad. Equation 8.11 was used to calculate the Griffin lift curve slope of 5.74/rad.
aw=Clα
1+C lα
πeAR (8.8)
a=awb[1+at S t
awb S (1−∂∈∂ α )] (8.9)
The neutral point of the Griffin was calculated using the wing neutral point. The neutral point of the wing was located at the quarter chord of the wing. The lift curve slope of the empennage and wing, the volume ratio, and the downwash were calculated above. The neutral point of the Griffin was at .61.
hn=hnwb+at
aV H (1−∂∈
∂ α ) (8.10)
Since the C.G. was determined by the weight, h was defined as the location of the C.G. divided by the wing mean chord (h=.47). Using the value obtained from the C.G. location the static margin was at 14.66%. All the measurements from the static margin were measured with respect from the leading edge of the wing. The static margin was calculated when the C.G. was further away from the wing. Ideally, with every mission the Griffin preforms the C.G. location should be closer to the nose, which increases the static
29

margin.
SM=hn−h=14.66% (8.11)
8.5 Control Surface Area
8.5.1 Elevator Sizing
The primary function of the elevator was control the pitch rate. The Griffin performs most of its missions at 6000 m (19,685 ft) and cruising at 123.5 m/s (240 knots). The elevator was designed to have 0 deflections under the most common flight conditions.
δ etrim=Cmo+(h−hn ) CLtrim
aeS t
S ( lt
c+hnwb−hn) (8.12)
After setting the trim deflection to 0, pitch moment coefficient was calculated to find the best incident angle to set the empennage under the most common flight conditions.
Cmo=(hn−h ) CLtrim (8.13)
The incident was calculated using the pitch moment coefficient. Cmacwb was .25. For simplicity thrust was be set equal to drag, which
set Cmop to -0.044. ε0 was 0. The incident angle was set at 0.043 rad (2.46 degree).
Cmo=Cmacwb+Cmop+at V H (it+ε0 )(1−at S t
aS (1− ∂∈∂ α )) (8.14)Cmop=CT
z p
c(8.15)
Figure 8.3: Elevator deflection vs. Speed.
30

After the incident angle of the empennage was set, figure 8.3 show a simulation of the Griffin elevator performance with traveling forward mode. After optimization, the best elevator area was 1.08 m2 (11.63 ft2).
8.5.2 Rudder Sizing
The primary function of the rudder is control the yaw rate and counter sideslips. While the Griffin performed its mission, the Griffin should be symmetrical and in trim. The Rudder was designed to control yaw rate without flaperons.
Cnββ+Cnδa
δ a+Cnδr
δr=0 (8.16)Cnββ+C nδr
δr=0 (8.17)
One key advantage that the Griffin has over the other platforms was the ability to perform its mission even with one engine out. The most common cause for sideslip is crosswind. The rudder was designed to be 30% of the chord and the span will be determined depending on the max yaw rate.
Similar to horizontal stabilizer, vertical stabilizer needs to have both a positive and a negative lift. NACA 0012 was selected due to its symmetrical geometrical properties. One of the main functions of rudder is beings able to counter sideslip. Equation 8.18 was account for the yaw moment due to sideslip. As mention above aF was 4.15/rad, vertical tail volume ratio was .08. The DATCOM section 5.4 was used to determine the dynamic pressure and sideslip. The yaw moment due to sideslip was .38
Cnβ=aF V V (V F
V )2
(1− ∂ σ∂ β ) (8.18)
(1+ ∂ σ∂ β ) qV
q∞=0.724+3.06
SV
SW
1+cos ( Λ¿¿c4 w)+.4
zW
d +0.009 AW ¿(8.19)
The rudder deflection angle increased as the Griffin was requires countering higher crosswinds. As the rudder chord increased so did the ruder area effectiveness. Equation 8.21 was applied to find the effectiveness of the rudder chord. The rudder was placed at the top of the vertical stabilizer to avoid any interference from the incoming flow; the dynamic pressure ratio was 1. After considering the rudder chord effectiveness, the lift slope of the vertical stabilizer was 2.74, which result the yaw moment of -.22.
Cnδr
=−ar V V (V F
V )2
(8.20)ar=τ aF
(8.21)
τ=1−θf −sin θ f
π (8.22)θ f=cos−1( 2 c f
c−1)
(8.23) δ r=−Cnβ
βCn δr
(8.24)
31
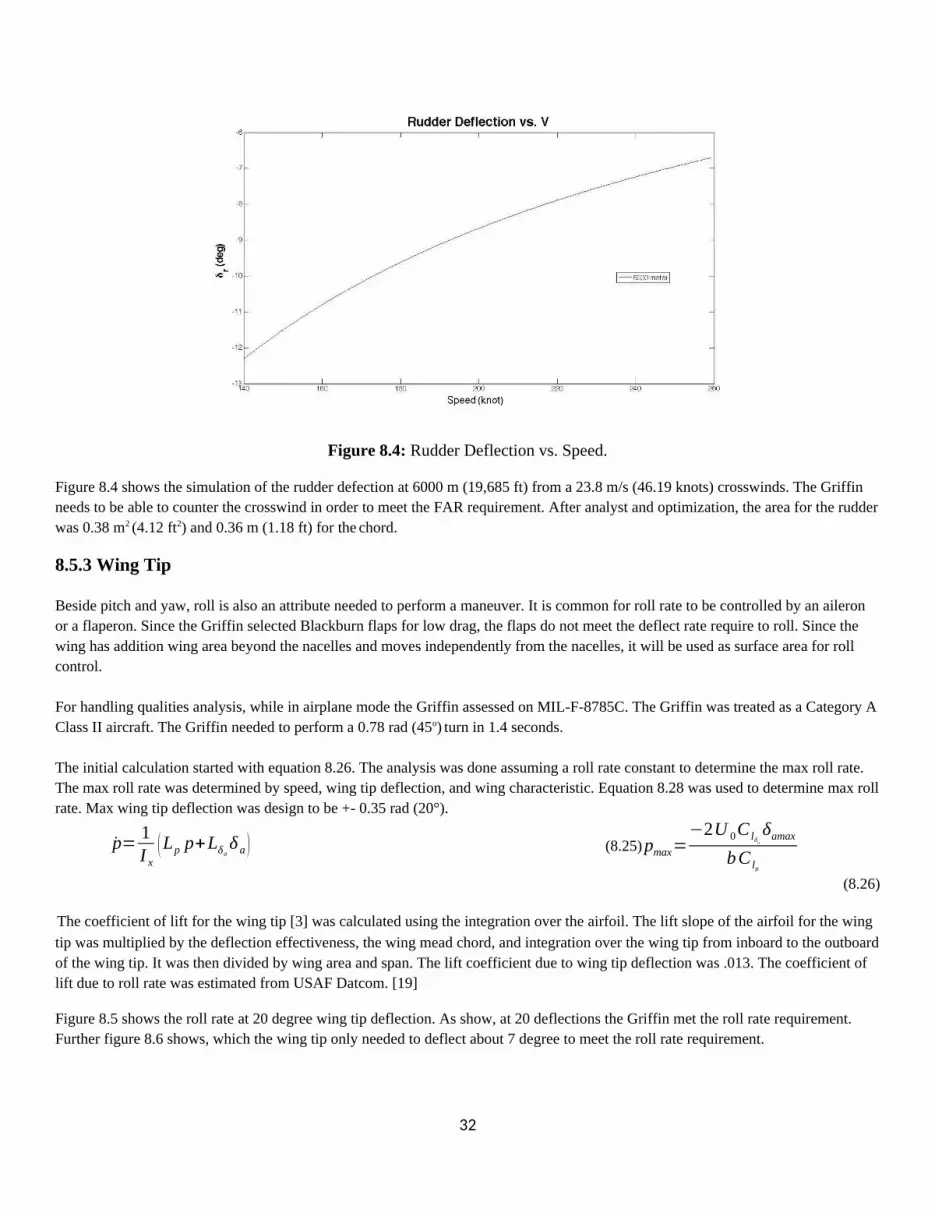
Figure 8.4: Rudder Deflection vs. Speed.
Figure 8.4 shows the simulation of the rudder defection at 6000 m (19,685 ft) from a 23.8 m/s (46.19 knots) crosswinds. The Griffin needs to be able to counter the crosswind in order to meet the FAR requirement. After analyst and optimization, the area for the rudder was 0.38 m2 (4.12 ft2) and 0.36 m (1.18 ft) for the chord.
8.5.3 Wing Tip
Beside pitch and yaw, roll is also an attribute needed to perform a maneuver. It is common for roll rate to be controlled by an aileron or a flaperon. Since the Griffin selected Blackburn flaps for low drag, the flaps do not meet the deflect rate require to roll. Since the wing has addition wing area beyond the nacelles and moves independently from the nacelles, it will be used as surface area for roll control.
For handling qualities analysis, while in airplane mode the Griffin assessed on MIL-F-8785C. The Griffin was treated as a Category A Class II aircraft. The Griffin needed to perform a 0.78 rad (45o) turn in 1.4 seconds.
The initial calculation started with equation 8.26. The analysis was done assuming a roll rate constant to determine the max roll rate. The max roll rate was determined by speed, wing tip deflection, and wing characteristic. Equation 8.28 was used to determine max roll rate. Max wing tip deflection was design to be +- 0.35 rad (20°).
p= 1I x
(Lp p+Lδaδ a ) (8.25) pmax=
−2U 0C lδa
δamax
bC lp
(8.26)
The coefficient of lift for the wing tip [3] was calculated using the integration over the airfoil. The lift slope of the airfoil for the wing tip was multiplied by the deflection effectiveness, the wing mead chord, and integration over the wing tip from inboard to the outboard of the wing tip. It was then divided by wing area and span. The lift coefficient due to wing tip deflection was .013. The coefficient of lift due to roll rate was estimated from USAF Datcom. [19]
Figure 8.5 shows the roll rate at 20 degree wing tip deflection. As show, at 20 deflections the Griffin met the roll rate requirement. Further figure 8.6 shows, which the wing tip only needed to deflect about 7 degree to meet the roll rate requirement.
32

Figure 8.5: Velocity vs. Roll Rate
Figure 8.6: wing angle of attack vs. roll rate
9.0 Aircraft Systems
One Display for a Cockpit Interactive Solution (ODSCI)
Large singular touchscreen display replaces multi-functional displays.
Provides and easy to use display system that will contribute to reducing pilot work load.
Provides significantly more surface area for display of navigation information.
Planned production by 2020
33
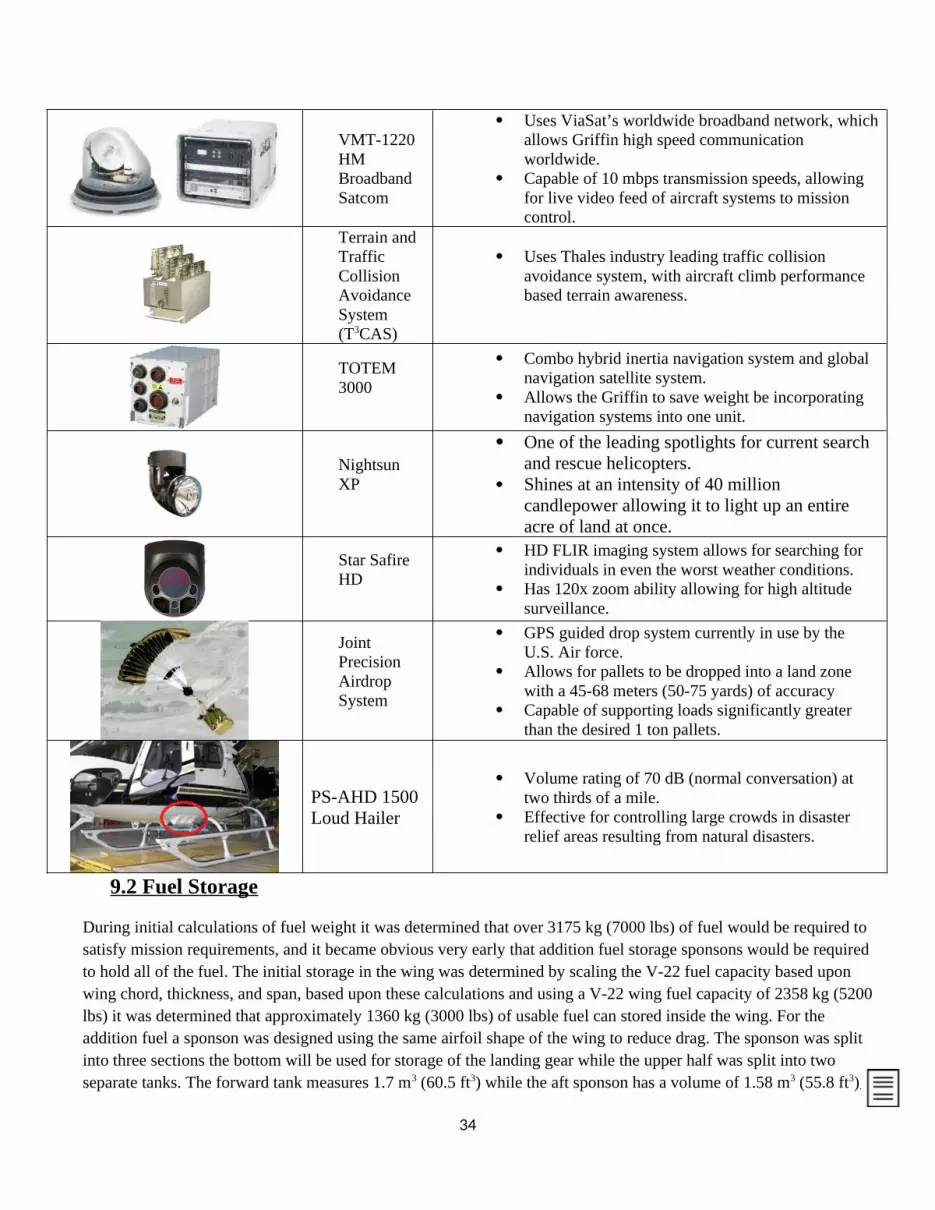
VMT-1220 HM Broadband Satcom
Uses ViaSat’s worldwide broadband network, which allows Griffin high speed communication worldwide.
Capable of 10 mbps transmission speeds, allowing for live video feed of aircraft systems to mission control.
Terrain and Traffic Collision Avoidance System(T3CAS)
Uses Thales industry leading traffic collision avoidance system, with aircraft climb performance based terrain awareness.
TOTEM 3000
Combo hybrid inertia navigation system and global navigation satellite system.
Allows the Griffin to save weight be incorporating navigation systems into one unit.
Nightsun XP
One of the leading spotlights for current search and rescue helicopters.
Shines at an intensity of 40 million candlepower allowing it to light up an entire acre of land at once.
Star Safire HD
HD FLIR imaging system allows for searching for individuals in even the worst weather conditions.
Has 120x zoom ability allowing for high altitude surveillance.
Joint Precision Airdrop System
GPS guided drop system currently in use by the U.S. Air force.
Allows for pallets to be dropped into a land zone with a 45-68 meters (50-75 yards) of accuracy
Capable of supporting loads significantly greater than the desired 1 ton pallets.
PS-AHD 1500 Loud Hailer
Volume rating of 70 dB (normal conversation) at two thirds of a mile.
Effective for controlling large crowds in disaster relief areas resulting from natural disasters.
9.2 Fuel Storage
During initial calculations of fuel weight it was determined that over 3175 kg (7000 lbs) of fuel would be required to satisfy mission requirements, and it became obvious very early that addition fuel storage sponsons would be required to hold all of the fuel. The initial storage in the wing was determined by scaling the V-22 fuel capacity based upon wing chord, thickness, and span, based upon these calculations and using a V-22 wing fuel capacity of 2358 kg (5200 lbs) it was determined that approximately 1360 kg (3000 lbs) of usable fuel can stored inside the wing. For the addition fuel a sponson was designed using the same airfoil shape of the wing to reduce drag. The sponson was split into three sections the bottom will be used for storage of the landing gear while the upper half was split into two separate tanks. The forward tank measures 1.7 m3 (60.5 ft3) while the aft sponson has a volume of 1.58 m3 (55.8 ft3).
34

Figure 9.1 Forward and Aft Sponson Fuel Tanks Figure 9.2 Internal Auxiliary Fuel Tank (optional)
In addition to the wing fuel tanks and sponson tanks, an additional auxiliary tank can be added to the internal cabin for the mission 1. The auxiliary tank holds a maximum fuel load of 2948 kg (6500 lbs) and provides a 48% increase in fuel for mission 1.
9. Landing Gear
For ground handling the team had to design the landing gear of the aircraft. The landing gear was also important to design due to the engine exhaust when the nacelles are set for a vertical take-off. However, due to time constraints, a full analysis could not be performed on the landing gear, instead the team focused on the location and loading the landing gears would experience and not the structural design of the struts and wheel assembly.
First step was to choose the type of landing gear configuration that would be used. This was a rather simple task, having a number of previous tilt rotor aircraft already in existence, the team went with the common tricycle configuration of one set of gears in the front, the nose gears, and two sets further back near the end of the cabin. Noting the speed, the landing gear had to be retractable, this would be a constraint on sizing so that each gear can be stowed away.
The next step was to determine the loadings that the wheels would experience, this was done by using force and moment balance equations coupled with the maximum weight of the aircraft. Equations 9.1 and 9.2 show how the loading on the nose gear, FN
and the loading on the main gears FM were determined by taking the moment about the main gears to be zero. Figure 9.11 shows an example of the landing gear loading and what the values of B, and Bm represent.
FN + FM = W (9.1)
0 = WBm - FNB (9.2)
35

Figure 9.3: Wheel Load Geometry.
Using the RFP maximum take-off weight of 15 metric tons (33,069) lbs., the loading on each gear was determine to be 52,46.95 kg (11,567.54 lbs). for the nose gear, and 4876.4 kg (10750.73 lbs) for each of the two main gears. Realizing that the loading on each gear is high, it was decided that each set landing gear would have two tires.
Choosing the tires was the last step, it would be crucial to determine the sizing for stowage and to determine that each gear would not be bottoming out the tire. Using aircraft tire data provided by Michelin Aircraft, the group settled on using a Type III tire with a maximum rated load of 3016.4 kg (6650 lbs), a bottoming tire load of 8144.3 kg (17,955 lbs.), and an un-deflected tire diameter and width of 0.53 m (20.85 in) and 0.19 m (7.30 in) respectively. The tires would be pressurized to 125 psi each. The following figure shows an example of the nose gear while it is stowed away.
Figure 9.4: Nose Landing Gear stowed.
9.6 Cabin Pressurization
Cabin pressurization was a feature the group decided to utilize due to the third mission where the Griffin would be ferrying wounded victims where medical aid may need to be administered. Due to the crewmen needing to move about the cabin for up to six different victims, having an oxygen mask and tank would add additional complications. Having a pressurized fuselage would allow the crew to move about freely to administer the first aid more readily, and allow for the less wounded victims who don’t need help breathing more comfort during the journey back to base.
36

10.0 Mission Analysis
10.1 Cabin Layout
Layout 2 each mission analysis including our flying conditions during the mission, as well to the cabin layout for each mission.
For mission 1 the cabin will be configured with an optional large tank inside of the cabin serving as an auxiliary fuel tank. It can hold up to 6500 lbs. of additional fuel, greatly extending the range of the aircraft. This extra fuel will allow the second part of the mission, the reconnaissance phase; to have a much large search area which could mean life or death for any wounded victims that may be missed if the Griffin is forced to pull back due to less fuel.
The cabin for mission 2 uses two of the pallets, each loaded with the medical supplies, food, and water that is to be dropped to the victims. The crates are secured to the pallets before take-off, and upon arriving at the desired drop zone the pallets are then set to be dropped along with the crates. With each crate weighing near 1 ton, the winch is vital to loading the aircraft quickly.
The Mission 3 cabin configuration is the most important and one of the intended uses of the existing Aeromedical Pallet System[1]. There will be two pallets, with each pallet containing a stack of 3 medical litters that causalities can be strapped into. There is also to be medical equipment on board to help the crew keep the wounded victims alive until they arrive at a medical center.
Layout 2 contains a breakdown of fuel burn over the course of each mission. Along with the benefits of range givin by starting each mission with the maximum allowable fuel load. For the sizing of the fuel tank we used the total fuel requried for Misson 1, which had the highest fuel burn, and adding room for 15% extra fuel as a safety precaution. All three missions were calculated using each missions’ starting weight and accounts for the weight loss due to the fuel burnt during the mission. Layout 3 shows a sensitivity analysis of the center of gravity for each mission. Especially with regards to mission 2, we wanted to ensure that at no time would the Griffin be at risk of becoming uncountrollable. As shown in each mission analysis, that during each mission the CG fluctuares around in the central stability region and never becomes at a major risk for becoming unstable.
37

38

39
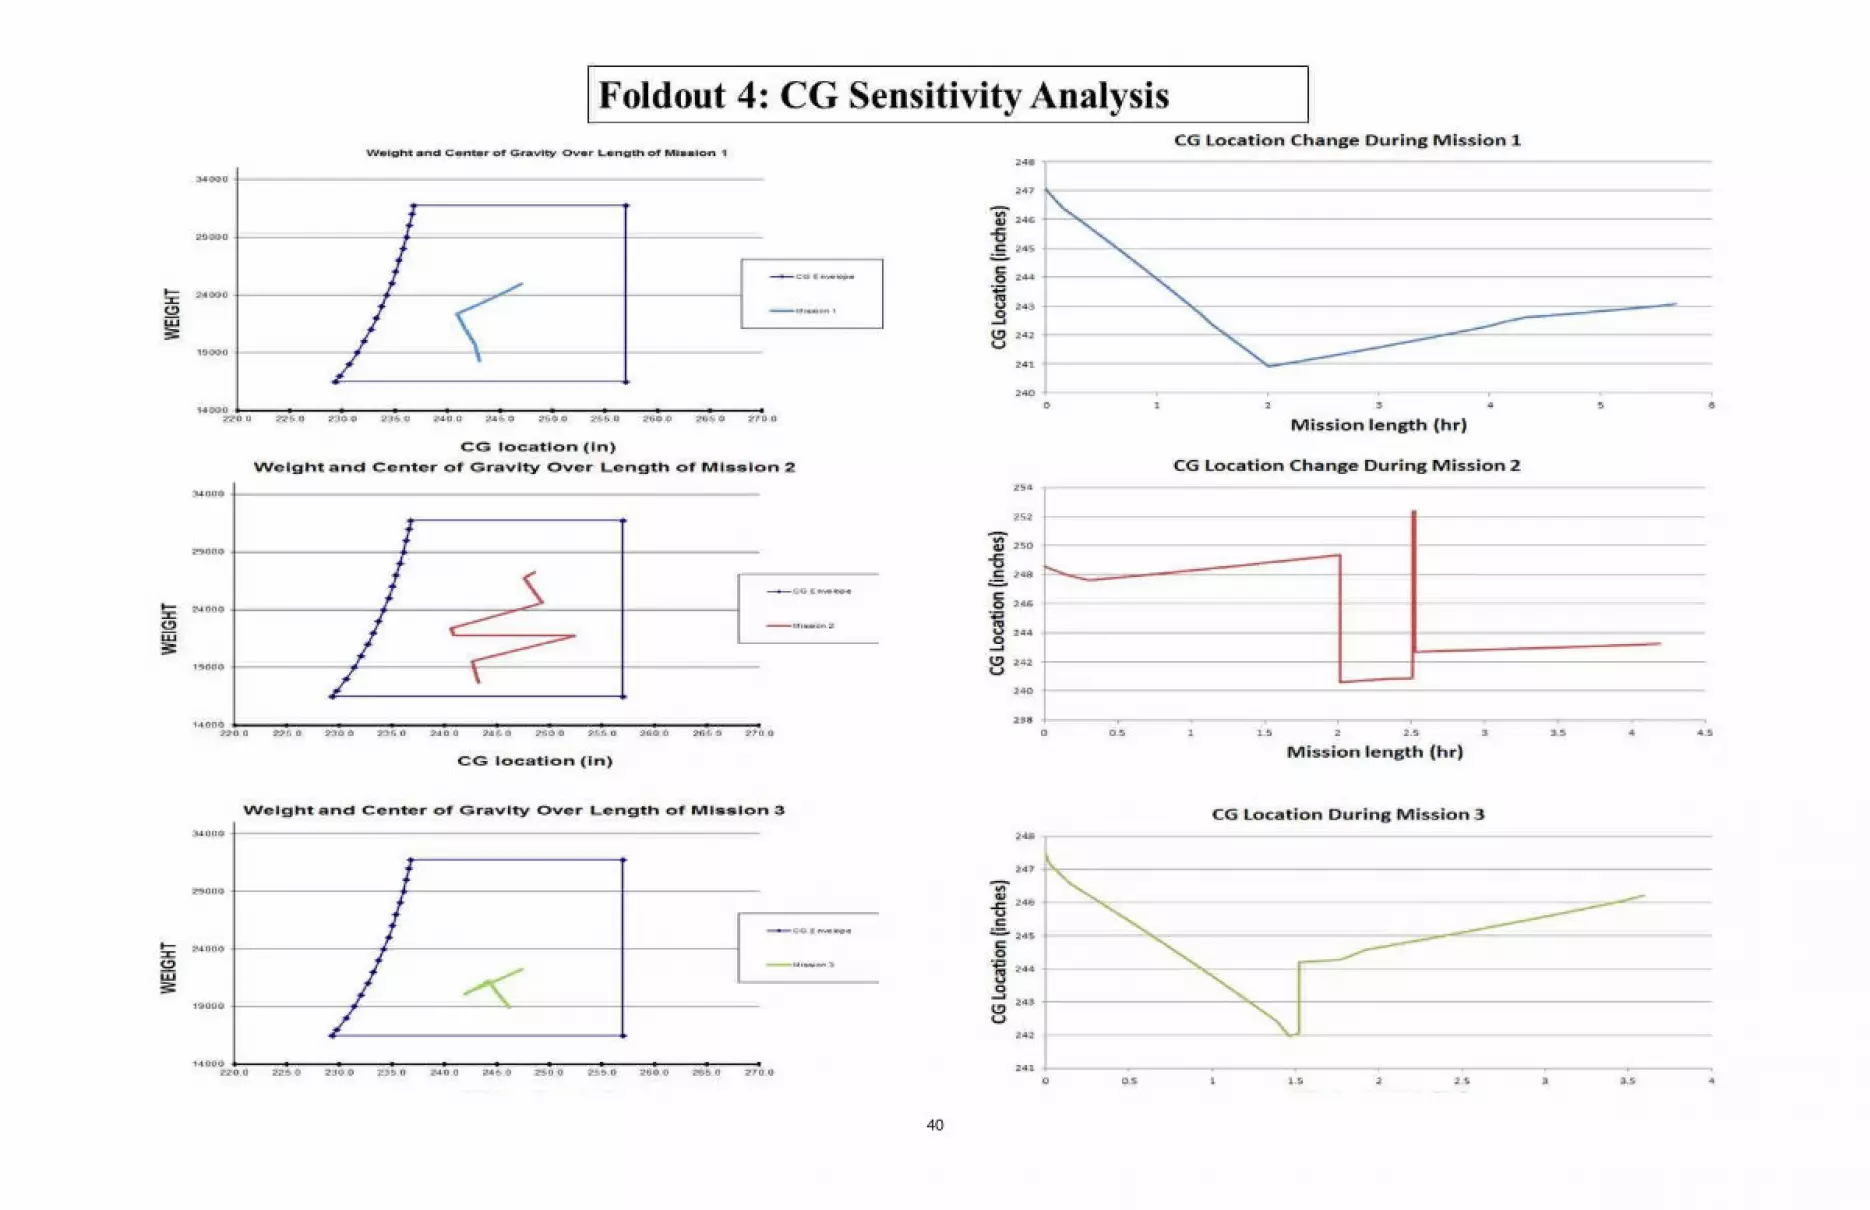
40
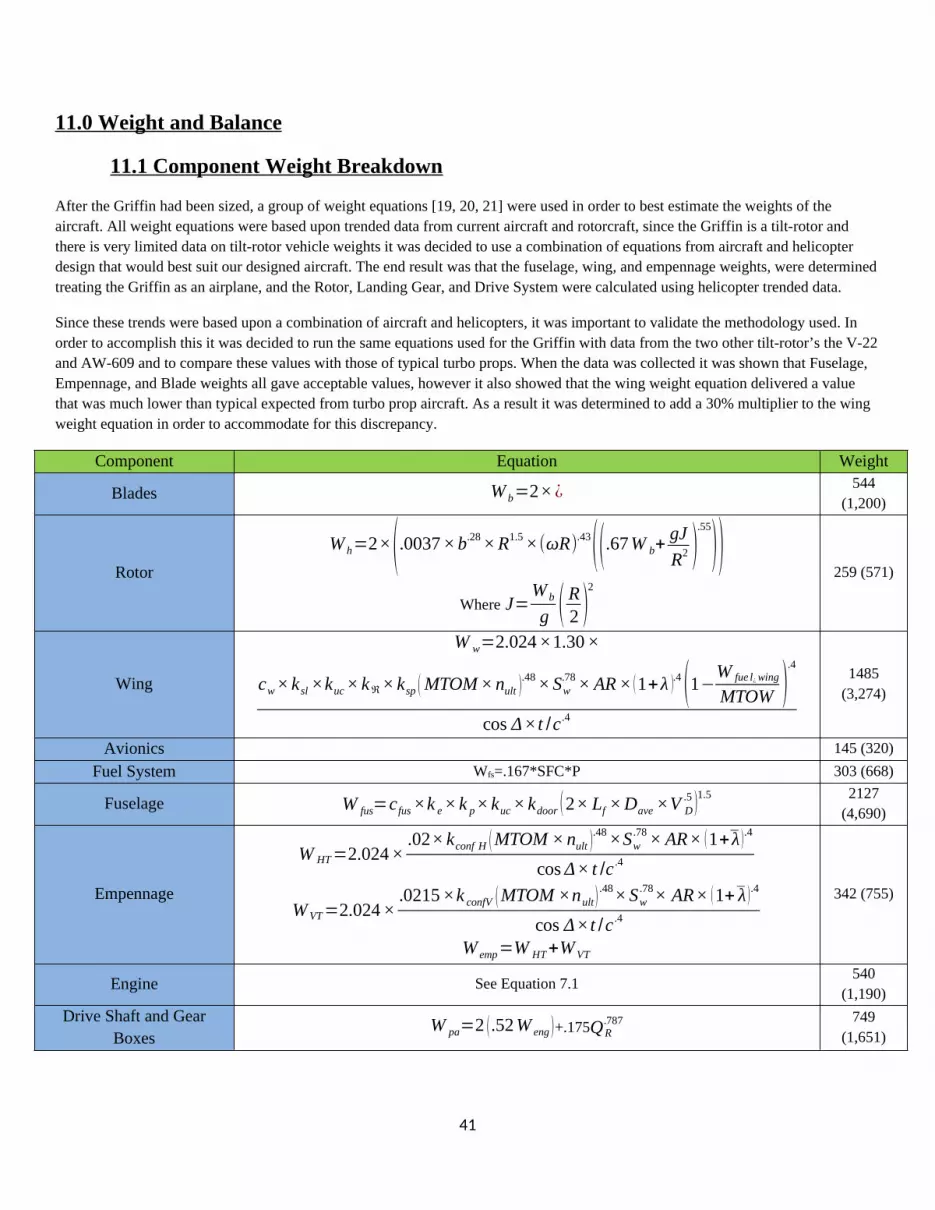
11.0 Weight and Balance
11.1 Component Weight Breakdown
After the Griffin had been sized, a group of weight equations [19, 20, 21] were used in order to best estimate the weights of the aircraft. All weight equations were based upon trended data from current aircraft and rotorcraft, since the Griffin is a tilt-rotor and there is very limited data on tilt-rotor vehicle weights it was decided to use a combination of equations from aircraft and helicopter design that would best suit our designed aircraft. The end result was that the fuselage, wing, and empennage weights, were determined treating the Griffin as an airplane, and the Rotor, Landing Gear, and Drive System were calculated using helicopter trended data.
Since these trends were based upon a combination of aircraft and helicopters, it was important to validate the methodology used. In order to accomplish this it was decided to run the same equations used for the Griffin with data from the two other tilt-rotor’s the V-22 and AW-609 and to compare these values with those of typical turbo props. When the data was collected it was shown that Fuselage, Empennage, and Blade weights all gave acceptable values, however it also showed that the wing weight equation delivered a value that was much lower than typical expected from turbo prop aircraft. As a result it was determined to add a 30% multiplier to the wing weight equation in order to accommodate for this discrepancy.
Component Equation Weight
Blades W b=2× ¿ 544 (1,200)
Rotor
W h=2×(.0037 × b.28 × R1.5 ×(ωR).43((.67 W b+gJR2 )
.55
))Where J=
W b
g ( R2 )
2259 (571)
Wing
W w=2.024 ×1.30 ×
cw× ksl ×kuc × k ℜ× ksp ( MTOM × nult ).48 × Sw
.78 × AR × (1+λ ).4 (1−W fue l¿ wing
MTOW ).4
cos Δ×t /c .4
1485 (3,274)
Avionics 145 (320)Fuel System Wfs=.167*SFC*P 303 (668)
Fuselage W fus=cfus ×k e × k p× kuc × kdoor (2× Lf × Dave ×V D.5 )1.5 2127
(4,690)
Empennage
W HT=2.024 ×.02× kconf H ( MTOM × nult )
.48 ×Sw.78 × AR× (1+λ ).4
cos Δ× t /c .4
W VT=2.024 ×.0215 ×k confV ( MTOM ×nult)
.48× Sw.78× AR× (1+ λ ).4
cos Δ×t /c .4
W emp=W HT+W VT
342 (755)
Engine See Equation 7.1540
(1,190)Drive Shaft and Gear
BoxesW pa=2 (.52 W eng )+.175QR
.787 749 (1,651)
41

landing gear 3.6 ( GW1000 )
.8
321 (708)
Hydraulics W H=5×10⁻⁴ GW1.28 154 (340)
Table 11.1 Weight Estimation Equations
V-22 Griffin AW-609 Acceptable RangeEmpty Weight 28,106 16,475 9,800
Wing 5753(17%) 2339(12%) 1508(14%) 15%-25%Wing (After 30% Correction) 6543(23%) 3274 (20%) 2111(21%) 15%-25%
Fuselage 7509(27%) 4,690(27%) 2405(25%) 20%-30%Empennage 1,144(0.035) 755 (4%) 1393(3.6%) 3%-5%
Blades 9.16 10 9.4 10 lb per footTable 11.2 Weight Validation for Key Weight Contributors
11.2 C.G. Breakdown
Figure 11.1 Griffin Component Breakdowns
The center of gravity was calculated using the weights, and station location of each component of the aircraft as shown in figure table 11.3. Each major components position on the aircraft was estimated, and the CG was found using simple moment arm
42
Aux Fuel Tank
Center of GravityCargo Pallet
Medical Liter Stack
Drive Shaft
Avionics
Aft Landing Gear Engine
Transmission
Nose Landing Gear
Night Sun FLIR
Rotor & Hub
Empennage
Wing
Aircraft Property
Mission 1
Mission 2
Mission 3
C.G.

calculation using the tip of the nose as the reference datum.. The center of gravity was calculated in consideration of an empty aircraft, and the three different missions specified in the RFP.
43

ComponentWeightkg (lbs)
STA forward Flight meters (in)
STA Hover meters (in)
Blades 544 (1,200) 5.03 (198) 6.10 (240)Rotor 259 (571) 4.72 (186) 6.10 (240)
Anti-icing 181 (400) 4.83 (190) 6.10 (240)Wing 1,485 (3,274) 6.10 (240)
Avionics 454 (1,000) 3.66 (144)Fuel System 303 (668) 6.10 (240)
Fuselage 2127 (4,690) 6.6 (260)Empennage 342 (755) 13.72 (540)
Engine 540 (1,190) 6.10 (240)Drive Shaft and Gear Boxes 749 (1,651) 6.10 (240)
Nose Landing Gear 107 (236) 1.10 (43.2)Rear Landing Gear 214 (472) 8.53 (336)
Hydraulics 154 (340) 5.59 (220)Stretcher fwd 68 (150) 5.79 (228)Stretcher aft 68 (150) 8.43 (332)
Pilots 181 (400) 2.62 (103.2)Crew 90.7 (200) 8.02 (315.6)
Wounded fwd 272 (600) 5.80 (228)Wounded aft 272 (600) 8.43 (332)
Airdrop Crate #1 998 (2,200) 5.72 (225)Airdrop Crate #2 998 (2,200) 8.60 (338.5)
Fuel Wing Mission 1 1,361 (3,000) 6.02 (237)Fuel FWD Sponson 1 1,180 (2,600) 4.88 (192)Fuel AFT Sponson 1 1,180 (2,600) 7.62 (300)
Fuel Aux Tank 2,926 (6,450) 5.79 (228)Table 11.3 Location of Components of Aircraft
Figure 11.2 shows the CG location in the varying configurations, and the region of acceptable values which result in a stable aircraft. It is important to note that while the CG of the empty aircraft is extremely close to the aft limit, a significant amount of fuel, and passengers are both stored forward of this CG location, resulting in a CG value with a more acceptable margin of safety. This can clearly be seen in how the CG location in each mission profile is located approximately in the middle of the envelope resulting in a high safety margin. The forward limit for CG location was taken calculed using the maximum elevator deflection at differreing weight values. This is reflected in equation 9.1
hmin=hn−∆
α CLmax
[ CmoLCLα
∆ ]−|δe|max up (9.1)
44
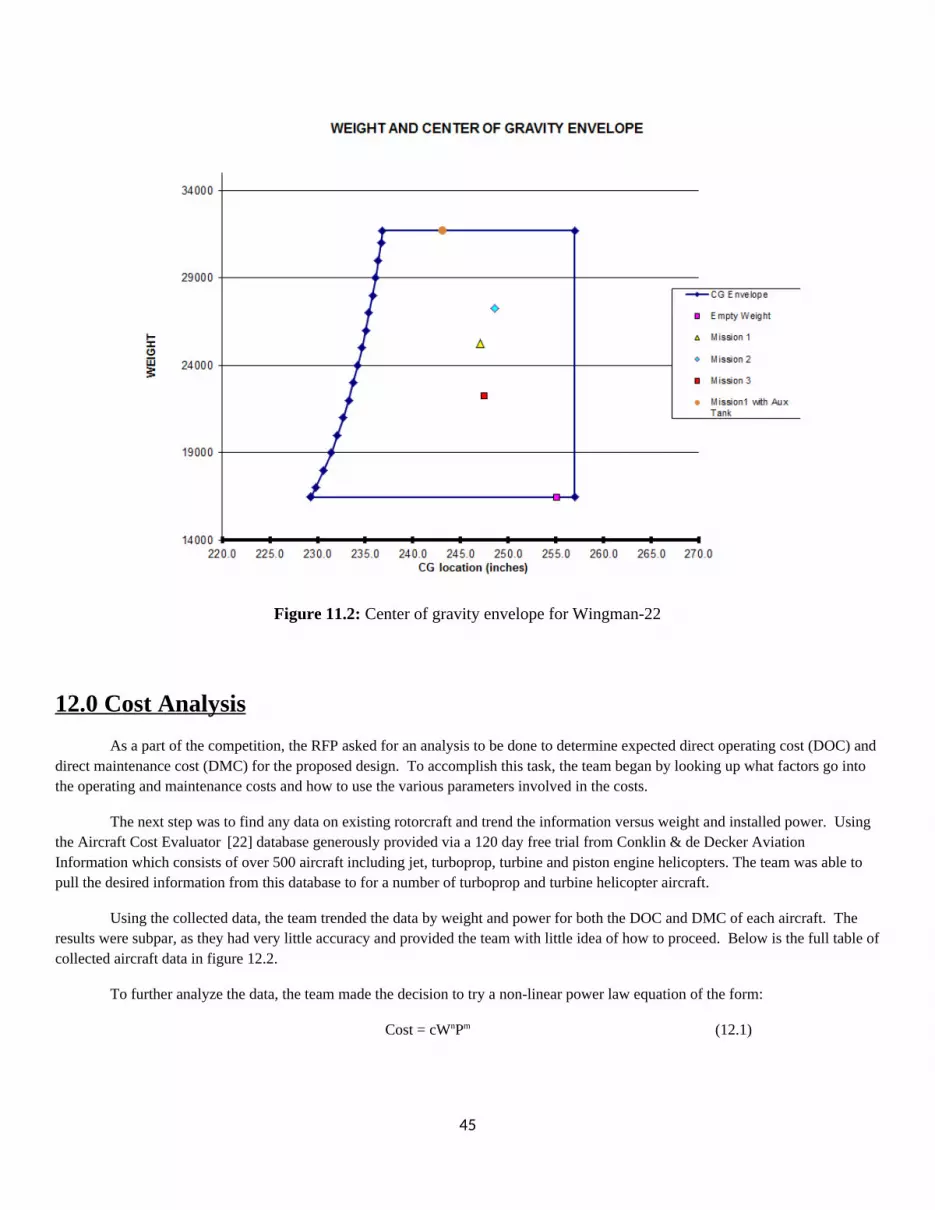
Figure 11.2: Center of gravity envelope for Wingman-22
12.0 Cost AnalysisAs a part of the competition, the RFP asked for an analysis to be done to determine expected direct operating cost (DOC) and
direct maintenance cost (DMC) for the proposed design. To accomplish this task, the team began by looking up what factors go into the operating and maintenance costs and how to use the various parameters involved in the costs.
The next step was to find any data on existing rotorcraft and trend the information versus weight and installed power. Using the Aircraft Cost Evaluator [22] database generously provided via a 120 day free trial from Conklin & de Decker Aviation Information which consists of over 500 aircraft including jet, turboprop, turbine and piston engine helicopters. The team was able to pull the desired information from this database to for a number of turboprop and turbine helicopter aircraft.
Using the collected data, the team trended the data by weight and power for both the DOC and DMC of each aircraft. The results were subpar, as they had very little accuracy and provided the team with little idea of how to proceed. Below is the full table of collected aircraft data in figure 12.2.
To further analyze the data, the team made the decision to try a non-linear power law equation of the form:
Cost = cWnPm (12.1)
45

To accomplish this, they made use of MatLab’s lsqnonlin function, a function for least sum of squares for non-linear data sets. The function took a matrix input that had either the DOC or DMC of the turboprop or helicopter data, the respective maximum take-off weights, and maximum installed engine power. The function was to minimize the error by adjusting the values of c, n, and m and outputting the final values.
After running the code through four times, one time each for the DOC and DMC of each type of aircraft, a set of equations was established. The generated equations were compared to the actual results from Conklin & de Decker’s [22] database to determine the percent error for each aircraft. The table below shows the results for the varying values of c, n, and m. To validate using the equations, it was noted that the majority of projected costs were within 15% of the actual costs.
Figure 12.1: Power Law Coefficient and Exponents.
Table 12.2: Initial Aircraft Cost Table.
It can be observed that the power law fit is not perfect; however the error has been minimized such that it can be reliable for the purposes of determining the DOC and DMC of the Griffin aircraft. By plotting all of the predicted costs against the actual costs, overall accuracy of the data can be determined by the slope of a linear trend line. Figures 12.3 and 12.4 show the actual costs versus the predicted costs for both DOC and DMC respectively. As can be seen, the two slopes of the trend lines are very close to a value of one, where the maximum deviation is only by a value of 0.0065.
46

Figure 12.1: Actual vs. Predicted (DOC)
Figure 12.2: Actual vs. Predicted (DMC)
47

To better analyze the costs associated with a tilt rotor aircraft, that functions in both a helicopter mode, and a turboprop mode, a relation was determined that based upon the mission, the aircraft spends more, or less time in one of those two modes. For purposes of simplification, the team considered any transition mode to work as a helicopter for the intent of the cost analysis.
Using mission 1 as an example, Griffin will spend roughly have of the mission time in each mode throughout the duration of the mission. Taking the DOC for the turboprop, and multiplying by a factor of 0.5, and then adding that the helicopter equation, again multiplied by a factor of 0.5 for the Griffin’s MTOW and max installed power, the DOC can be determined for the Griffin. Using the same method, the expected DMC was also found for the aircraft. Below is a table displaying the expected mission 1 DOC and DMC, as well as the UH-60 Black Hawk’s DOC and DMC values scaled up by the 25% factor for the performance index. The Black Hawk’s costs were obtained by using the helicopter power law equations for its MTOW and installed power.
Table 12.3: Expected DOC and DMC for the Griffin and Blackhawk.
The above data represents a mission time split between the two modes of 50/50, taking this data and the data found by using a 70/30 and 60/40 time split between turboprop and helicopter mode, the expected performance index values are shown below.
Table 12.4: Performance Index for DOC and DMC
As seen above, the higher the ratio of turboprop to helicopter/transition mode time correlates to decreased operational and maintenance costs, and a higher performance index. To optimize the costs, it is recommended to spend as much of the time of each mission in turboprop configuration as possible.
To add further analysis to the cost, the cost of fuel burned for each mission was found. In the Mission analysis section of this report the weight of fuel burned for each of the three proposed missions is shown along with the mission time. By taking the weight of fuel plus the extra 15% and converting to volume in gallons, followed by multiplying by the cost per gallon of Jet A fuel, lastly, dividing the total cost of fuel for each mission by the respective mission times. Equation 12.2 below represents the equation used for conversion from fuel in weight to cost per hour.
FuelCost per Hour=
Weight of Fuel Burned6.8 lbs / gal
∗6.86 US Dollarsgal
MissionTime (hrs )(12.2)
For mission 1, the fuel burned plus the extra 15% is 3553 kg (7833 lbs), that correlates to 1400.69 US Dollars/hr in fuel cost for that mission. Missions 2 and 3 have fuel costs of 1444.79 US Dollars /hr and 1600.69 US Dollars /hr respectively. Mission 3 has the highest fuel cost because the return trip isn’t done at best range, but at highest speed in order to get wounded victims to a medical facility faster. By studying the fuel costs and comparing them to the overall direct operating costs, it is seen that it makes up roughly half of the total cost per hour of operation. It should be noted that the fuel costs do not include the 3-4% extra for oil and lubrication.
13.0 Performance Index Calculation and Optimization
48
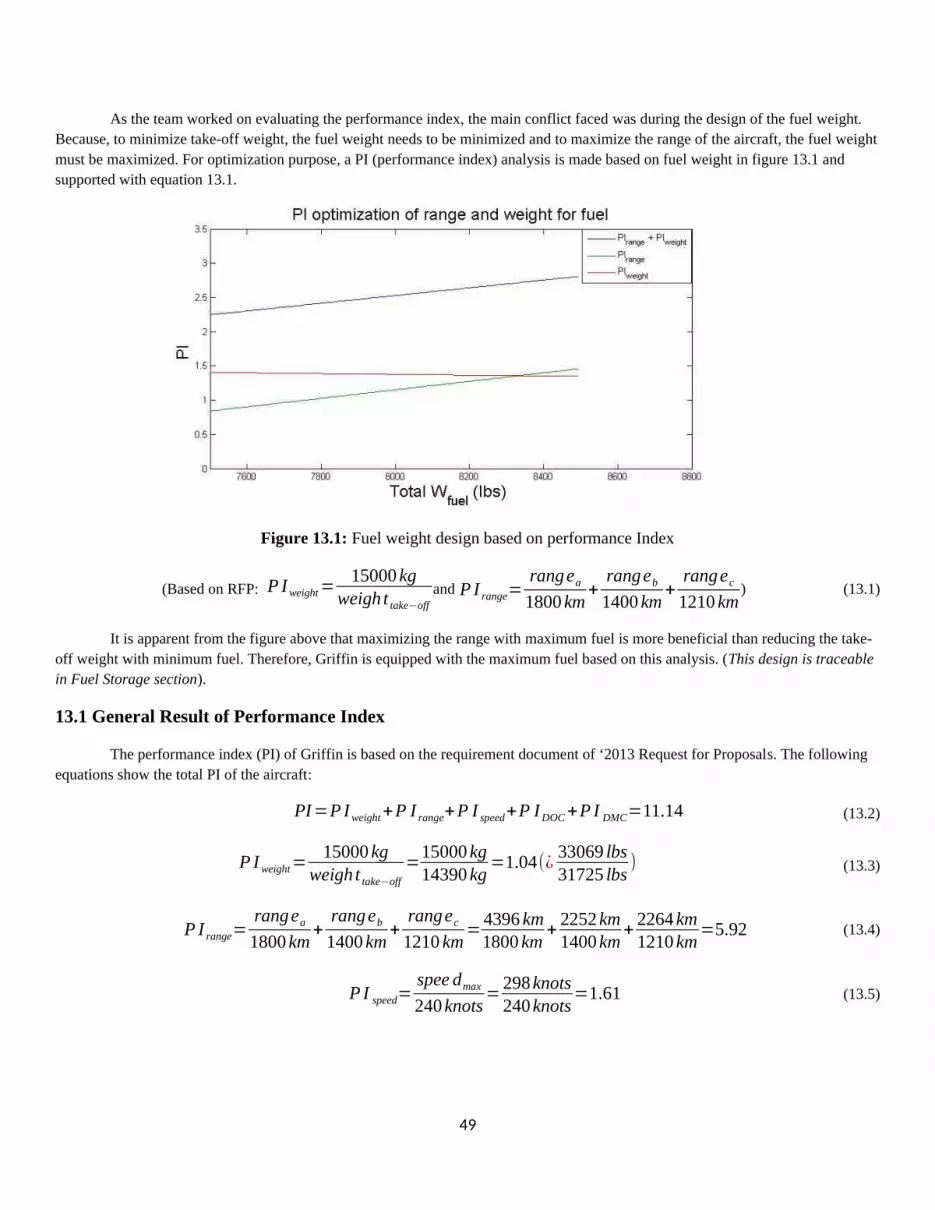
As the team worked on evaluating the performance index, the main conflict faced was during the design of the fuel weight. Because, to minimize take-off weight, the fuel weight needs to be minimized and to maximize the range of the aircraft, the fuel weight must be maximized. For optimization purpose, a PI (performance index) analysis is made based on fuel weight in figure 13.1 and supported with equation 13.1.
Figure 13.1: Fuel weight design based on performance Index
(Based on RFP: P Iweight=15000 kg
weigh t take−offand P I range=
rangea
1800 km+
rangeb
1400 km+
rangec
1210 km) (13.1)
It is apparent from the figure above that maximizing the range with maximum fuel is more beneficial than reducing the take-off weight with minimum fuel. Therefore, Griffin is equipped with the maximum fuel based on this analysis. (This design is traceable in Fuel Storage section).
13.1 General Result of Performance Index
The performance index (PI) of Griffin is based on the requirement document of ‘2013 Request for Proposals. The following equations show the total PI of the aircraft:
PI=P Iweight+P I range+P I speed+P I DOC+P I DMC=11.14 (13.2)
P Iweight=15000 kg
weigh t take−off=15000 kg
14390 kg=1.04(¿ 33069 lbs
31725 lbs) (13.3)
P I range=rangea
1800 km+
rangeb
1400 km+
rangec
1210 km=4396 km
1800 km+ 2252 km
1400 km+ 2264 km
1210 km=5.92 (13.4)
P I speed=spee dmax
240 knots=298knots
240knots=1.61 (13.5)
49

P I DOC=1.25 DOCBlack Hawk
DOCGriffin=
5739.28 dollarhr
4143.87 dollarhr
=1.39 (13.6)
P I DMC=1.25 DM CBlack Hawk
DM CGriffin=
3496.27 dollarhr
2253.06 dollarhr
=1.55 (13.7)
The final result of PI for Griffin is 11.14. When compared to the standard PI of 7, Griffin succeeds with 4.4 extra points.
14.0 ConclusionThe Griffin is a rotorcraft designed to truly blend together the range and speed of a fixed wing aircraft with the hover capabilities of a conventional helicopter in a manner that is currently achieved by few others. The tilt-rotor concept behind the Griffin, allows for the aircraft to travel faster, farther, and higher than any of its competitors. Couple this performance with the Griffin’s ability to act as the primary tool for Search and Rescue, Medevac, and Vertical
Replenishment missions (possibly even all three at once), and you have a vehicle that is truly at the top of its class in the most import criteria of all, the ability to save lives. The Griffin is capable of traveling in excess of 240 knots, even at altitudes over 6,000 meters, and thanks to the use of a variable speed transmission has a higher efficiency in both forward flight and hover than other tilt-rotor’s being brought to market. Over the course of the last 16 weeks
the aircraft was designed by 5 students who worked together to create a preliminary design that will be further matured of the course of the Spring semester. The students worked together using an iterative process to analyze the required performance, size the aircraft, model the weight and costs, as well as construct a computer model of the aircraft.
The path forward is to continue the design by first analyzing the second and third mission, analysis of the aircraft in transition mode, design of the interior cabin, cockpit, and fuselage, engine improvements and transmission design, refinements of stability and control analysis, airfoil selection and structural analysis. Additional characteristics will be required as the team moves forward to make a competitive design, capable of performing at the highest level.
50
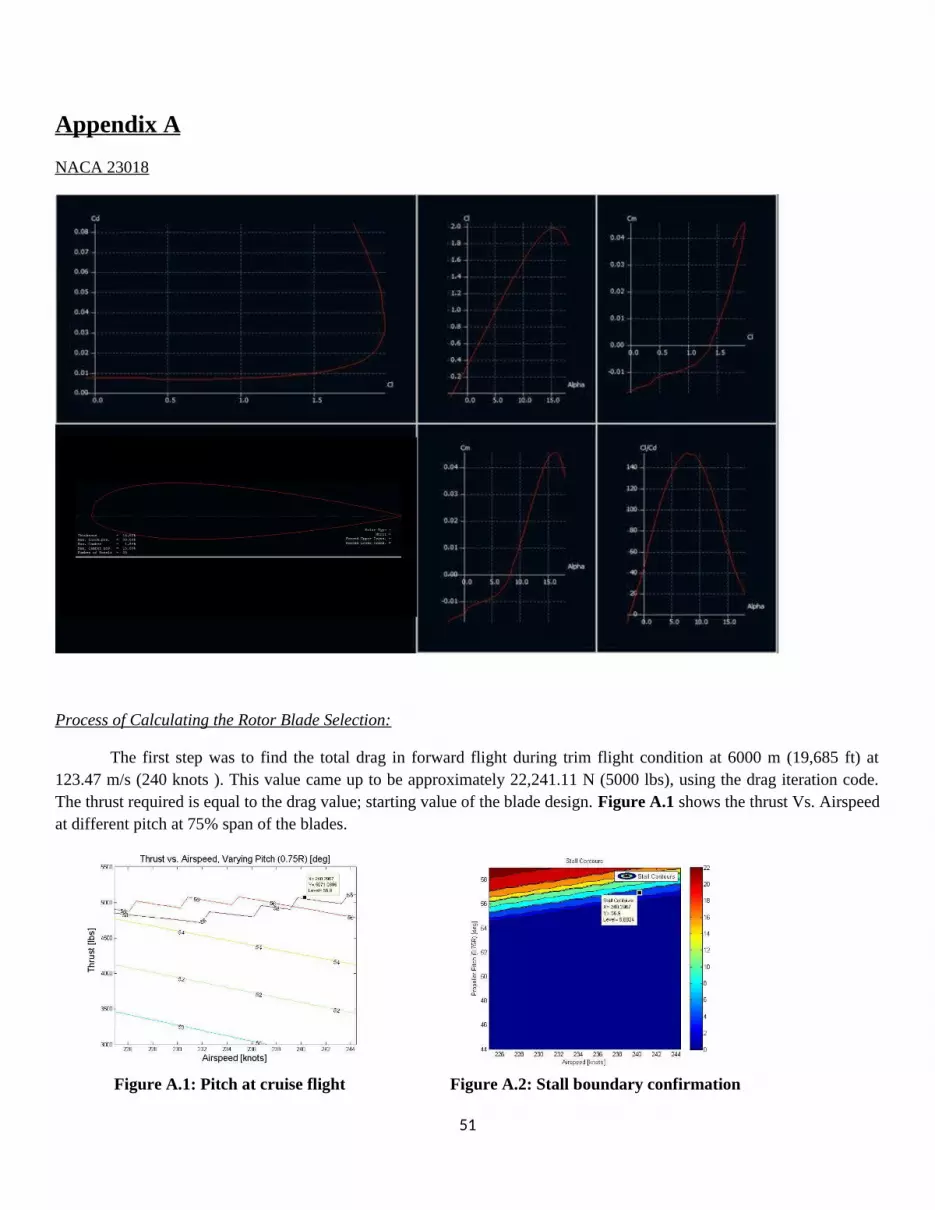
Appendix A
NACA 23018
Process of Calculating the Rotor Blade Selection:
The first step was to find the total drag in forward flight during trim flight condition at 6000 m (19,685 ft) at 123.47 m/s (240 knots ). This value came up to be approximately 22,241.11 N (5000 lbs), using the drag iteration code. The thrust required is equal to the drag value; starting value of the blade design. Figure A.1 shows the thrust Vs. Airspeed at different pitch at 75% span of the blades.
Figure A.1: Pitch at cruise flight Figure A.2: Stall boundary confirmation
51

Now that the pitch of the blade is known at this configuration (56.9 deg), it is possible to narrow down on the power (Pcruise), η, and stall boundary confirmation in figures A.2-A.4.
Figure A.3: Power required for trim flight condition
Figure A.4: Propeller efficiency for trim flight condition
Appendix B:
Composite Lay-up of the Wing
[Clements, Timothy, and MasoudRohani] [Corso, Lawrence, David Popelka]
52
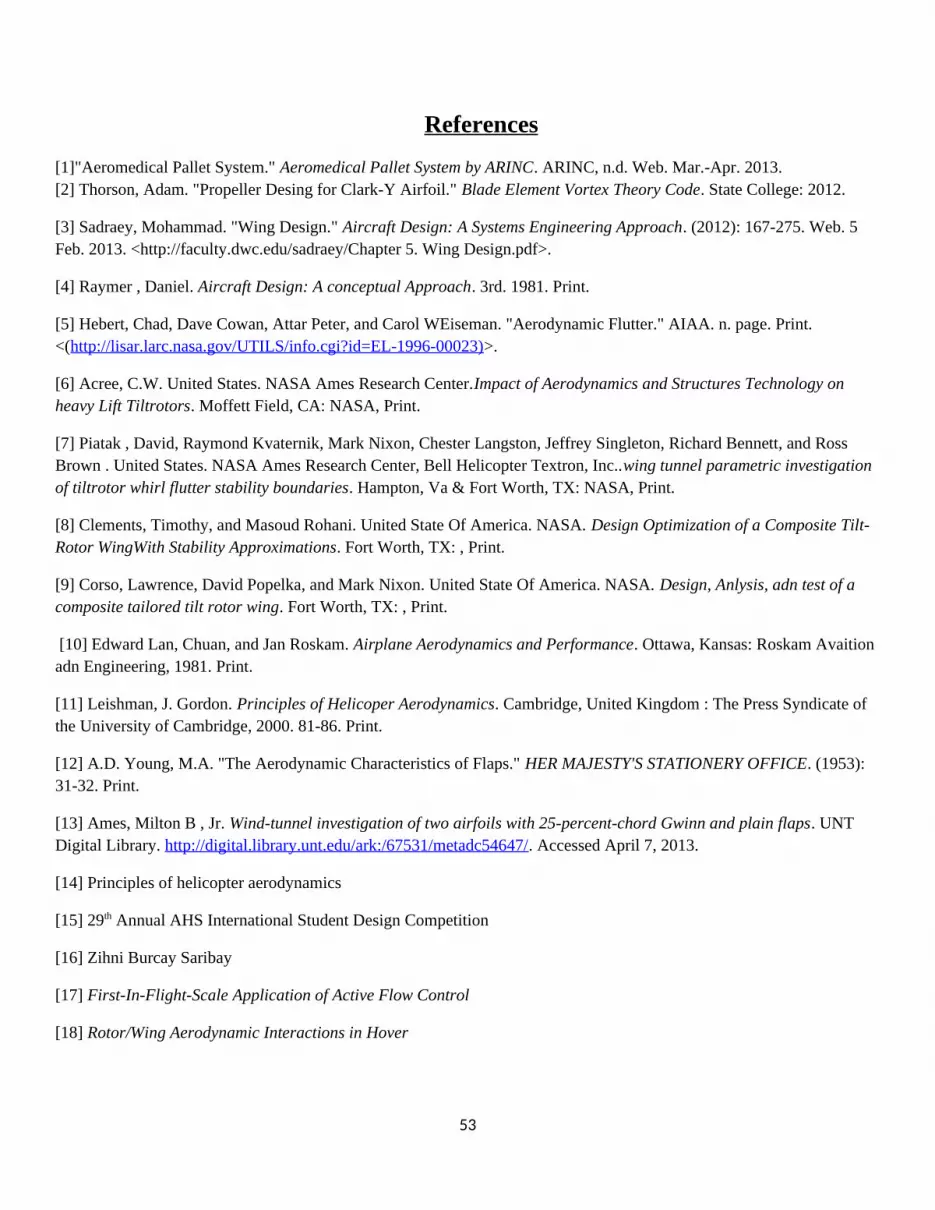
References
[1]"Aeromedical Pallet System." Aeromedical Pallet System by ARINC. ARINC, n.d. Web. Mar.-Apr. 2013.[2] Thorson, Adam. "Propeller Desing for Clark-Y Airfoil." Blade Element Vortex Theory Code. State College: 2012.
[3] Sadraey, Mohammad. "Wing Design." Aircraft Design: A Systems Engineering Approach. (2012): 167-275. Web. 5 Feb. 2013. <http://faculty.dwc.edu/sadraey/Chapter 5. Wing Design.pdf>.
[4] Raymer , Daniel. Aircraft Design: A conceptual Approach. 3rd. 1981. Print.
[5] Hebert, Chad, Dave Cowan, Attar Peter, and Carol WEiseman. "Aerodynamic Flutter." AIAA. n. page. Print. <(http://lisar.larc.nasa.gov/UTILS/info.cgi?id=EL-1996-00023)>.
[6] Acree, C.W. United States. NASA Ames Research Center.Impact of Aerodynamics and Structures Technology on heavy Lift Tiltrotors. Moffett Field, CA: NASA, Print.
[7] Piatak , David, Raymond Kvaternik, Mark Nixon, Chester Langston, Jeffrey Singleton, Richard Bennett, and Ross Brown . United States. NASA Ames Research Center, Bell Helicopter Textron, Inc..wing tunnel parametric investigation of tiltrotor whirl flutter stability boundaries. Hampton, Va & Fort Worth, TX: NASA, Print.
[8] Clements, Timothy, and Masoud Rohani. United State Of America. NASA. Design Optimization of a Composite Tilt-Rotor WingWith Stability Approximations. Fort Worth, TX: , Print.
[9] Corso, Lawrence, David Popelka, and Mark Nixon. United State Of America. NASA. Design, Anlysis, adn test of a composite tailored tilt rotor wing. Fort Worth, TX: , Print.
[10] Edward Lan, Chuan, and Jan Roskam. Airplane Aerodynamics and Performance. Ottawa, Kansas: Roskam Avaition adn Engineering, 1981. Print.
[11] Leishman, J. Gordon. Principles of Helicoper Aerodynamics. Cambridge, United Kingdom : The Press Syndicate of the University of Cambridge, 2000. 81-86. Print.
[12] A.D. Young, M.A. "The Aerodynamic Characteristics of Flaps." HER MAJESTY'S STATIONERY OFFICE. (1953): 31-32. Print.
[13] Ames, Milton B , Jr. Wind-tunnel investigation of two airfoils with 25-percent-chord Gwinn and plain flaps. UNT Digital Library. http://digital.library.unt.edu/ark:/67531/metadc54647/. Accessed April 7, 2013.
[14] Principles of helicopter aerodynamics
[15] 29th Annual AHS International Student Design Competition
[16] Zihni Burcay Saribay
[17] First-In-Flight-Scale Application of Active Flow Control
[18] Rotor/Wing Aerodynamic Interactions in Hover
53

[19] (Etkin, Bernard, and Lloyd D. Reid. Preface. Dynamics of Flight: Stability and Control. New York: Wiley, 1996. N. pag. Print. Appendix B.10
[20] Kundu, Ajoy Kumar. Aircraft Design. Cambridge: Cambridge UP, 2010
[21] Prouty, Raymond W. Helicopter Performance, Stability, and Control. Malabar, FL: Kriege Pub., 2005.
[22] Aircraft Operating Costs & Aviation Services. Computer software. Aircraft Operating Costs & Aviation Services. Conklin and De Decker, n.d. Web. 12 Jan. 2013. <https://www.conklindd.com/Default.aspx>.
54


