Embed Size (px)
Citation preview
Does Virtual Advising Increase College Enrollment? Evidence from a Random Assignment College Access Field Experiment
Meredith Phillips and Sarah Reber*
Abstract
Although in-person college access programs can be effective, less is known about whether low-
cost and scalable virtual interventions can achieve the same benefits. We evaluate two variants of
a virtual college counseling program. Students randomly assigned to the program felt more
supported applying to college and applied more broadly to four-year colleges, but were not more
likely to be accepted or enroll. We analyze rich and extensive survey data to explore mechanisms
and why the program did not improve college enrollment. We conclude that low-intensity
programs may work for some students, but many probably need in-person and intensive help.
* Phillips: UCLA Luskin School of Public Affairs (email: [email protected]); Reber: UCLA Luskin
School of Public Affairs and NBER (email: [email protected]). This was a collaborative project and authorship is
equal. This research was supported by the Institute of Education Sciences, US Department of Education, through
Grant R305A110809. The project also made use of resources at the California Center for Population Research, UCLA,
which is supported by infrastructure grant R24HD041022 from the Eunice Kennedy Shriver National Institute of Child
Health and Human Development. The opinions expressed are those of the authors and do not represent views of the
Institutes or the US Department of Education. Phillips discloses that she co-founded EdBoost, the nonprofit
organization that developed and implemented the V-SOURCE intervention evaluated in this paper, and served on its
board until 2011. We did not register a pre-analysis plan; we registered this study after the analysis was complete to
comply with this journal’s submission policy (AEARCTR-0005530).
We thank Tiffani Chin, EdBoost’s Executive Director, for her collaboration on all aspects of this project and
Benjamin Denckla for donating his time and expertise to developing technologies for administering aspects of the
program. We are grateful to Niña Abonal and Sara Mousavi for managing participant recruitment and program
delivery, and for advising students; Cinthia Loera and Alexandra Mendoza for supervising survey recruitment; Sarah
Burtner, Patrick Cremin, Matthew Curry, Kara Fung, Takako Kobayashi, Rebecca Lowry, Daniel Mather, and María
Lucía Yanguas for research assistance; all of the advisors, survey callers, and recruiters; the districts and schools that
agreed to participate; the California Student Aid Commission for sharing data with us; and all of the students who
participated in this study. We also thank conference participants at the American Economic Association, American
Educational Research Association, American Sociological Association, Association of Education Finance and Policy,
Association for Public Policy Analysis and Management, Society for Research on Educational Effectiveness, and

National Bureau of Economic Research, and seminar participants at Teachers College, RAND, UC Davis, UC Irvine,
UCLA, UC Riverside, USC, and the University of Virginia for helpful feedback. We are grateful to Jeffrey Smith for
his insightful comments as a discussant on an early draft, and to Chris Avery, Darin Christensen, Pascaline Dupas,
Sara Goldrick-Rab, Tom Kane, Bridget Long, Phil Oreopoulos, Lindsay Page, and Bruce Sacerdote for helpful
conversations.
2
Despite well-documented and growing benefits of a college education, youth from
socioeconomically disadvantaged families are far less likely to attend college than their more
advantaged peers (Bozick and Lauff 2007; Baum, Ma, and Payea 2013).1 A number of programs
have attempted to reduce this disparity by providing low-income students with more of the college-
related information and support for applying to college that middle- and higher-income students
tend to receive from their schools and families. Some intensive or particularly well-targeted in-
person interventions have increased four-year college enrollment (Bos et al. 2012; Carrell and
Sacerdote 2017; Barr and Castleman 2018). Less intensive interventions providing college-related
information by mail or electronically have been ineffective (Bird et al. 2019; Gurantz et al. 2019a;
Hyman 2020) or effective only for very high achieving students (Hoxby and Turner 2013;
Dynarski et al. 2018). The intensive, in-person interventions that have been effective can be
expensive and difficult to scale geographically. But if such interventions could be delivered
virtually, they could reach more students at lower cost.
In this paper, we investigate whether a virtual college-advising program increased four-year
college enrollment among students for whom additional college information and support might be
particularly helpful—students attending low-income, predominantly Black/African American and
Hispanic high schools who were largely first-generation college-going students and/or children of
immigrants. We also compare two variants of the program to learn whether students simply need
college-related information or whether they need more personalized support and the
encouragement of a (virtual) advisor. In contrast to other studies, we administered extensive
surveys, with high response rates, both at baseline and at the end of high school. These survey data
allow us to examine how the program affected intermediate steps in the college-going process,
such as college application and admissions patterns, as well as whether the program was
particularly effective for students who were most likely to need additional support (for example,
students with less access to family- or school-based college access support or those most prone to
procrastination).
EdBoost Education, a Los Angeles-based nonprofit, developed this virtual college advising
program, Virtual Student Outreach for College Enrollment (V-SOURCE), by updating and
expanding a prior program, SOURCE, which EdBoost previously implemented as an in-person
1. For reviews of the literatures on the returns to education, including the extent to which returns vary across students, see Card (2001), Hout
(2012), Oreopoulos and Petronijevic (2013), and Barrow and Malumud (2015).
3
advising intervention. About half of the more than 6,500 students who participated in our study
came from Hispanic, Spanish-speaking homes, and nearly 40 percent had parents who had not
completed high school.
We randomly assigned participants to a “business as usual” control group or to one of two nested
variants of a 15-month college counseling intervention. Students assigned to the Milestones variant
received access to a comprehensive website; emails and text messages sent several times a month
with information tailored to the timing of particular college access activities and reminders about
important deadlines, as well as links to relevant content on the website; and $20 electronic gift
card rewards for completing four key milestones in the college application process. Students
assigned to the Complete variant received everything in the Milestones variant plus access to a
personal advisor who communicated with the students through emails, text messages, phone calls,
and on social media.
Students assigned to both variants of the V-SOURCE program reported that they felt more
informed and supported during the college and financial aid application process than students
assigned to the control group, and these point estimates were largest for students assigned to the
Complete program (the variant with the personal advisor). The intervention had small impacts on
SAT-taking and Free Application for Federal Student Aid (FAFSA) completion, and broadened
students’ application portfolios. Students assigned to both variants were more likely to apply to a
four-year college, and those assigned to the Complete program were more likely to apply to a
selective college.
Although V-SOURCE increased students’ completion of important milestones in the college
application process, those improvements were modest and did not translate into higher four-year
college admissions rates or enrollment rates in the full sample. The results suggest, however, that
V-SOURCE was effective for Hispanic students from Spanish-speaking families, a key subgroup
targeted by the study based on prior research.
After presenting the main impact analyses, we try to understand why the program did not have
the intended effects on four-year college enrollment. We conclude from these analyses that the
program operated largely as we had expected. The program increased students’ applications to
four-year and selective colleges, especially among the types of students it was designed to help:
those whose parents could not help them with their applications (see also Carrell and Sacerdote
2017) and those who tended to be disorganized and procrastinate. The pattern of effects for college
4
applications by baseline grade point average (GPA) also suggests that the program broadened
students’ application portfolios in ways that were consistent with their academic achievement. But
these effects on college applications were not large enough to increase enrollment. We speculate
that, because of its virtual nature, V-SOURCE lacked key components that make in-person
interventions more effective.
The results also indicate that positive selection into the study and the availability of alternative
programs and sources of information and support may have reduced the scope for V-SOURCE to
improve outcomes. Nevertheless, about half of the control students, many of whom appear to have
been academically prepared for a four-year college, did not enroll in a four-year college, so there
was scope for improvement.
Together with the literature, our findings suggest that navigating the complex process of
transitioning from high school to college is too difficult for many adolescents to accomplish
without significant support. While inexpensive interventions focused primarily on the college
application process have helped some students enroll in college, such programs can be difficult to
target, and the availability of alternative sources of information and help may limit the measured
impact of any one program. Ultimately, many low-income students will likely need more hands-
on help with the application process or more intensive and expensive interventions addressing
fundamental academic, financial, and institutional barriers to successfully enroll in and complete
college.
This paper proceeds as follows. Section 2 motivates the study and reviews relevant literature.
Section 3 describes the intervention and the extent to which students used it. Section 4 describes
our sample, measures, and analytic approach. Sections 5 and 6 report our results, on average and
for particular subgroups, respectively. Section 7 explores explanations for our findings and Section
8 concludes.
I. Background
A. Socioeconomic Disparities in College Access
Large and persistent social class disparities in college attendance among students with similar
academic preparation suggest that low-income students face more barriers to college attendance
than their higher-income peers (Ellwood and Kane 2000; Bailey and Dynarski 2011; Phillips 2011;
Klasik 2012). Theoretical perspectives from economics, sociology, and psychology provide a
5
number of plausible explanations for disparities in college enrollment (see Perna 2006, for a
review). Economic perspectives suggest that socioeconomic disparities in college-going could
arise if the actual or perceived costs and benefits of college attendance differ by socioeconomic
status. Although students and parents from all backgrounds tend to overestimate the cost of college
(Avery and Kane, 2004; Grodsky and Jones 2007), it may be more difficult now than in the past
for low-income families to know how much college will cost them because posted tuitions and net
costs increasingly diverge for low-income students (Dynarski and Scott-Clayton 2013). Moreover,
although student loans are available and the returns to college likely justify their use, credit
constraints and debt aversion may also contribute to social class disparities in college-going (Olson
and Rosenfeld 1984; Perna 2008).
Sociological perspectives emphasize social class disparities in how parents, peers, and schools
shape students’ sense of likely educational paths (Bourdieu and Passeron 1977; Coleman 1988;
Grodsky and Riegle-Crumb 2010), and the extent to which they provide personalized information
about college and financial aid options (e.g., Plank and Jordan 2001; McDonough 2004; Roderick,
Coca, and Nagaoka 2011; Stephan and Rosenbaum 2013; Robinson and Roksa 2016). Perspectives
from psychology and behavioral economics suggest that parental or institutional support for the
college application process may be especially important because adolescents tend to be more
myopic and have less self-control than adults (Steinberg et al. 2009), and even adults avoid
unpleasant tasks that are in their long-term best interest (Laibson 1997; Madrian and Shea 2001;
Beshears et al. 2008).
B. Effects of College Access Interventions
Prior studies show that some relatively inexpensive college access programs can increase four-
year college enrollment among disadvantaged students.2 We summarize these studies in Appendix
A.3 For example, interventions where tax preparers completed the FAFSA (Bettinger et al. 2012)
or where near-peers helped students complete college applications (Carrell and Sacerdote 2017)
increased four-year college enrollment substantially. Other low-cost interventions that provided
2. See Page and Scott-Clayton (2016) and French and Oreopoulos (2017) for more detailed reviews of this literature. 3. Appendix A includes experimental studies of programs that mainly provided assistance in applying to college and/or for financial aid (loosely,
“college counseling” programs). Appendix A excludes studies of college-access programs focused solely on academic remediation or providing financial aid (rather than help applying for financial aid) and studies of policy changes related to college access (such as financial aid or test-taking policies).
6
information, particularly about the likely cost of attendance, induced high-achieving, low-income
students to enroll in more selective colleges (Hoxby and Turner 2013; Dynarski et al. 2018).
Interventions that provided information, reminders, and support during the summer before college
helped students follow through on their college enrollment plans—reducing the extent to which
students who were admitted to college failed to enroll (“summer melt”) (Castleman and Page 2014;
Castleman, Page, and Schooley 2014).
Other relatively inexpensive college access interventions have not improved four-year college
enrollment, however. For example, a state-wide Michigan program successfully encouraged
students to seek college application information online but did not affect enrollment (Hyman
2020), and a large-scale FAFSA intervention—which included an arm in which students had
access to one-on-one FAFSA advising—did not affect enrollment (Bird et al. 2019). A school-
wide intervention leveraging text messaging to encourage students to get help from their college
counselor increased SAT-taking, FAFSA submission, and college application rates but not college
enrollment, while a text-message advising intervention decreased college enrollment slightly
(Avery et al. 2020). Several recent evaluations of interventions targeting primarily high-achieving,
low-income students, similar to the population in Hoxby and Turner (2013), found little or no
effect on college enrollment, though they found small effects on the type of college where students
enrolled (Gurantz et al. 2019b; Sullivan, Castleman, and Bettinger 2019). Evaluations of low-cost,
school-wide, in-school, near-peer advising interventions found small or no effects on two-year
enrollment and no effects on four-year enrollment (Cunha, Miller, and Weisburst 2018; Bettinger
and Evans 2019). Similarly, the evaluation of a low-cost, school-wide intervention that provided
in-class workshops, with in-person support to complete applications, found effects on two-year
enrollment but not four-year enrollment (Oreopoulos and Ford 2019). In contrast, studies of more
expensive, in-person college access interventions found larger effects on four-year enrollment
(Avery 2013; Carrell and Sacerdote 2017; Barr and Castleman 2018).
Most relevant to this study is the Student Outreach for College Enrollment (SOURCE) program.
EdBoost—the organization that implemented V-SOURCE—developed and implemented
SOURCE in the Los Angeles Unified School District (LAUSD) in 2006–07.4 SOURCE provided
students who were on track to be eligible for admission to a four-year public university with a
4. SOURCE was based conceptually on the Boston College Opportunity and Career Help (COACH) program (Avery and Kane 2004).
7
near-peer advisor, with the goal of increasing four-year college enrollment. SOURCE increased
enrollment at four-year colleges by 3.5 percentage points overall (significant at the 10 percent
level), with larger, statistically significant effects for students who spoke Spanish at home (10.6
percentage points) and students whose parents did not attend college (6 percentage points) (Bos et
al. 2012). SOURCE cost about $1,000 per student in 2006. We hypothesized that a less expensive,
completely virtual version of SOURCE might also boost four-year college enrollment. Because it
would not require near-peer advisors to be proximate to students, such a program could be more
easily and cheaply scaled. 5
II. The Intervention
A. Program Design
We collaborated with EdBoost to revise the SOURCE program to add additional components—
including a new SAT study curriculum—and to make the content available online and through
emails and text messages, making the program less expensive, easier to scale, and possible to offer
in outlying areas. Given limited sample size and resources, we chose to test two coherent
interventions rather than have many treatment arms designed to test specific theories about barriers
to college-going. We nested the two treatments so that the evaluation could distinguish the impact
of having access to a personal (virtual) advisor (V-SOURCE Complete) from the impact of a less
expensive, fully-automated variant (V-SOURCE Milestones). The interventions lasted from
March of students’ junior year in high school through the summer following their senior year,
providing information and support for all aspects of the college and financial aid application
process.6
Table 1 describes the components of each variant of V-SOURCE; see Phillips and Reber (2019)
for more detail on V-SOURCE program components and program implementation. Students
5. A growing literature examines the effects of relatively “low-touch” interventions at all levels of education, intervening with both parents and
students, with mixed results. Although a full review of these studies is beyond the scope of this paper, we note a few general patterns. Programs that provide information to parents, often by text message—about their children’s attendance or performance in school (e.g., Kraft and Dougherty 2013; Robinson et al. 2018; Rogers and Feller 2018; Bergman and Chan 2021) or encouraging literacy activities (Cabell et al. 2019; Mayer et al. 2019; York, Loeb, and Doss 2019)—have been successful at low cost. Interventions designed to improve study habits or effort by providing information or automated/virtual substitutes for traditional student support programs in secondary schools (Fryer 2016) and college (e.g., Oreopoulos and Petronijevic 2018) have had more limited success. Providing information about loans for community college increased borrowing and improved college outcomes substantially (Marx and Turner 2019), whereas providing information about substantial tax benefits of college attendance did not (Bergman, Denning, and Manoli 2019).
6. For one-third of students, the program concluded in June after high school graduation; another third received automated messages about tasks they needed to complete during the summer; and the final third received all of the information contained in the summer messages in a single email at the start of the summer. All students continued to have access to the V-SOURCE website during the summer.
8
assigned to both variants received: (1) access to the V-SOURCE website, which included
information on all aspects of the college and financial aid application process; (2) access to the
online Ready, SAT, Go! curriculum, which was targeted toward lower-scoring students compared
to existing SAT study programs; (3) information and reminders sent weekly via email and text
message, with changing content tailored to the specific phase of the college and financial aid
application process; and (4) Milestone Rewards ($20 electronic gift cards) for completing four key
milestones in the process—registering for the SAT or ACT, taking the SAT or ACT, submitting
two college applications to different systems, and submitting the FAFSA (or DREAM Act
Application) on time. These gift card rewards were designed to signal the importance of
completing each of these steps and to reduce procrastination.
In addition to all of these automated components, students in the Complete program received an
advisor who was available to help them personally (via phone, email, text, social media) with all
aspects of the college and financial aid application process. V-SOURCE recruited advisors who
were interested in providing college access assistance to students (typically because the advisors
aspired to become educators and wanted experience in the field or they had been students like
those served by V-SOURCE). Advisors attended six in-person training sessions covering the V-
SOURCE advising curriculum and instruction in recording their interactions with students.
Advisors had a caseload of 26 students and were supervised by two Program Coordinators who
were available for questions and monitored advisors’ reported interactions with students. We
randomly assigned students to advisors.7
We estimate that the program cost about $84 and $529 per participant for the Milestones and
Complete variants, respectively. This includes some fixed costs that were shared across the two
programs, so average costs would be lower, especially for Milestones, at a larger scale. For
Complete, almost 80 percent of the cost was for wages (about two-thirds of which was for advisors
and one-third was for coordinators, supervisors, and administrators). For Milestones, the single
biggest cost was for the Milestone Reward payments (37 percent); wages of coordinators,
supervisors, and administrators account for another 33 percent of costs (Phillips and Reber 2019).
7. See Phillips and Reber (2019) for more information about advisors. We collected data on advisor characteristics and advising quality, and
plan to explore the sources of variation in advisor effectiveness in a subsequent paper.
9
B. Take-Up and Program Use
All students assigned to the intervention groups had access to the program components
summarized in Table 1, but this does not mean they used the program. We collected administrative
data on program use and surveyed students in the late spring of their senior year about program
use. We summarize those findings here to give the reader an idea of the bundle of services—the
“dose”—that the typical student assigned to the intervention received.
Students did not have to actively enroll in the program to receive services, so we do not have a
traditional measure of program enrollment. Instead, we construct a measure of program take-up
based on the administrative program use data, which shows that nearly all students offered the
intervention knew they had access to, and had at least some contact with, the program. Table 2
shows that 92 percent of the students assigned to Milestones and 99 percent of those assigned to
Complete had at least one confirmed contact with V-SOURCE,8 and nearly all (96 percent) of the
students assigned to Complete had at least one interaction with their advisor after the program’s
introductory period.
Table 2 also shows the average amount of services that students received and how helpful they
perceived the program to be. V-SOURCE sent students an average of four automated emails and
three to four automated text messages per month. The typical participant did not visit the website
a lot, despite texts and emails that included links directing students to relevant webpages. Students
assigned to Complete visited the website on 8.3 distinct days, compared to 5.6 distinct days for
Milestones. Students in Milestones and Complete claimed 1.4 and 1.8 Milestone Rewards ($20
electronic gift cards for completing key steps in the college application process), respectively. The
data suggest that about 10 to 20 percent of students used the SAT study materials at least a
moderate amount.9
On average, students assigned to the Complete program texted or emailed back-and-forth with
their advisor an average of nine times during the 15 months of the program, talked to their advisor
by phone nearly twice, and received about 50 group emails sent by their advisor and another eight
emails sent to them personally. The data suggest that students in Complete used the automated
8. This variable indicates whether students actively interacted with the program at any point or whether they confirmed they knew they had
access to the program. 9. For example, about 8.5 percent of Milestones and 11.3 percent of Complete students received a “Bronze Medal” for completing at least ten
quizzes with at least 80 percent correct; and about 17.7 of Milestones and 24.8 percent of Complete students visited SAT study materials on more than 5 separate days (Phillips and Reber 2019).
10
components of the program (the website, SAT materials, and Milestone Rewards) more than
students in Milestones, most likely because the advisors encouraged students to use other
components of the program.
The self-reported data on program use are broadly consistent with the administrative data, but
students appear to over-report their use somewhat. Overall, students found most components of
the program helpful; more than 75 percent of participants in both Milestones and Complete found
the V-SOURCE website and emails “helpful” or “very helpful,” and more than 85 percent of those
in Complete found their advisor “helpful” or “very helpful” (Table 2).
To summarize, nearly all students assigned to treatment knew they were in the program and used
at least some services, and some students received substantial services; the average student
received a moderate dose of services. Students assigned to Complete typically had multiple
personalized electronic communications with their advisors and a couple of phone calls, and some
had much more intensive help from their advisors. For some students, particularly those enrolled
in Milestones, the treatment mostly consisted of the automated emails and text messages, and the
offer of Milestones Rewards.
III. Data and Methods
A. Participant Recruitment and Sample
V-SOURCE was designed to help students complete the steps required to successfully apply to
and enroll in a four-year college; we expected that the program would induce students who
otherwise would have started college at a two-year campus, with a plan to transfer to a four-year
college, to instead begin college at a four-year campus. We therefore targeted students who were
likely to be eligible for admission to public four-year colleges in California based on their prior
grades and course-taking.
To recruit students to the study, we develop a list of relatively large, comprehensive high schools
in six southern and central California counties that predominantly served low-income students of
color.10 Some eligible schools did not respond to calls or declined to participate, but the recruited
10 We targeted comprehensive high schools where at least 60 percent of the students were African American and/or Hispanic/Latino (AA/HL)
and where at least 60 percent qualified for free or reduced-price meals (FRPM). We prioritized schools with more than 200 juniors, and recruiting staff attempted to contact all schools that met these three criteria. Recruiting staff also contacted additional schools meeting slightly relaxed criteria at their discretion if recruiting there made logistical sense; the vast majority of research participants were enrolled in schools satisfying the first set of criteria.
11
schools were similar to the eligible pool on most key variables (Table C.1). In the fall of the 2011–
12 and 2012–13 school years, EdBoost worked with participating schools to distribute applications
to participate in the research and encourage high school juniors to apply. Typically, EdBoost staff
visited 11th grade English classes, where they told students about the research and the program,
including the eligibility requirements, and encouraged them to complete the application. The
application requested information on students’ backgrounds, course-taking, and grades, so that we
could determine their academic eligibility for the program. EdBoost considered students eligible
for the program if it was possible for them to meet the minimum eligibility criteria for a four-year
public college in California based on their course-taking and grades as of the fall of 11th grade.
However, not all students completed the remaining requirements by the time they applied to
college in 12th grade.11
Table 3 shows that, as intended, the program attracted students who were socioeconomically
disadvantaged. Approximately 60 percent of students had parents who had not attended college at
all. Just over half of the students reported “using lunch tickets,” which is likely an underestimate
of actual subsidized meal eligibility because some schools have school-wide meal programs (so
students don’t use lunch tickets), students may choose not to report their lunch ticket use, and some
who receive tickets do not use them. The program attracted more girls than boys (68 percent),
consistent with girls’ significantly higher college-going rates, more Hispanic students than any
other ethnic group (approximately 75 percent of participants, and approximately 70 percent of
whom reported speaking Spanish with their parents), and mostly US-born students whose parents
were foreign-born. Participants had relatively high grade point averages (about 75 percent reported
B-averages or above) and very high educational aspirations (nearly 80 percent aspired to a graduate
degree).
Table 4 shows that at the time students applied to the program, they were relatively active users
of the internet, email, and text messaging—the three key technologies used to deliver the program.
Eighty-one percent reported using the internet at least a few times a week on their own computer,
and 97 percent reported using the internet that often by any method. Eighty-one percent reported
11. We do not have administrative data on eligibility for admission to a four-year college (known as A-G eligibility). However, on the Follow-
up Survey, just under half of respondents reported that they received a D or F in at least one core course required for A-G eligibility between 9th and 11th grade; three-quarters of those students reported they made up or validated all of their Ds and Fs (suggesting they could have been A-G eligible). Thus, about 12 percent of respondents probably did not complete the coursework required for A-G eligibility. This is likely an underestimate if survey non-respondents were more likely to be ineligible, or students underreport their low grades or misunderstand the policies about making up or validating grades.
12
checking their email a few times a week, and 96 percent reported checking it at least a few times
a month. Eighty-three percent reported text messaging at least a few times a week. Although
technology use was slightly higher among students with more highly-educated parents, the vast
majority of students who participated in the study had access to the technologies they needed to
use the V-SOURCE program.
B. Survey Data
A key advantage of our study is that we have not only administrative data on college enrollment
and financial aid application, but also extensive survey data on baseline characteristics,
intermediate outcomes, and students’ self-reported experiences applying to college. We surveyed
participants three times during the study. As part of students’ application to the program, we
administered a short, paper survey that asked about students’ course-taking and grades (to
determine their eligibility), demographic and family background, technology use, and self-
perceptions. Prior to random assignment, we invited applicants to participate in a longer, online
Baseline Survey that covered a wide range of topics, including demographic and family
background, self-perceptions, and college knowledge and plans. In late spring/early summer of
their senior year, we invited participants to take an online Follow-up Survey asking about their
college preparation, college and financial aid applications, future plans, and, for students assigned
to the program, their experiences with the program. Response rates varied across the cohorts and
surveys but were generally high. The Application Survey had a small number of items but a nearly
100 percent response on most items. Defined as answering at least 80 percent of items, we obtained
response rates to the Baseline Survey of 77 and 94 percent for cohorts 1 and 2, respectively (87
percent overall), and to the Follow-up Survey of 87 and 88 percent, respectively.12
C. College Enrollment and Financial Aid Administrative Data
Our key outcomes of interest are whether and where students enrolled in college in the fall after
expected high school graduation, and whether they persisted to the second fall. We use
administrative data from the National Student Clearinghouse (NSC) to construct these variables.
12. Students received a $20 electronic gift card for completing the baseline survey and a $30 electronic gift card for completing the Follow-up
survey. We initially invited students to the surveys over email and text message, sent reminders via email and text message, and called non-respondents multiple times to verify that they had received the survey link and to remind them to participate. Phillips and Reber (2019) describes in more detail how we administered the surveys and includes the surveys in an appendix.
13
The NSC is a nonprofit organization that provides enrollment and degree-verification services.
Participating colleges and universities report their students’ enrollment to the NSC, and the NSC
makes these data available to researchers (see Dynarski, Hemelt, and Hyman 2013 for more details
on the NSC data). The NSC matches students to their college enrollment records based on name
and date of birth.13 The match is imperfect, but because we constructed the data we provided to
the NSC for the match without regard to treatment status, using only data collected prior to random
assignment, matching imperfections should affect treatment and control groups similarly and
should not bias our results.14 We linked the colleges in which students enrolled to data from the
Integrated Postsecondary Education Data System (IPEDS) and constructed indicators for attending
and persisting in different types of colleges.
We also obtained data related to financial aid application and receipt from the California Student
Aid Commission (CSAC). CSAC used a matching procedure similar to that used by the NSC to
find study participants in their database. In addition to information about whether and when
students completed their financial aid paperwork, CSAC provides information on where students
attended college if they used CalGrant funding at that college. We found that when both the NSC
and CSAC matched a student to a college, the data were consistent in the vast majority of cases.15
For 9.7 percent of the sample, however, CSAC reported disbursing financial aid to a college for a
student, even though the NSC did not find a match to a college for that student. These CSAC-
reported enrollments appear to be largely valid enrollments that the NSC missed, so we created a
second set of “CSAC-augmented” college enrollment outcome variables.16 The CSAC-augmented
13. The NSC can, in some circumstances, match on students’ social security number (SSN). We did not collect SSNs for fear of deterring
potential applicants and because we expected students’ reports of their SSNs to be inaccurate. 14. Imperfect matches can arise because (1) participants with common names may match to multiple records, in which case the NSC does not
return a match; (2) participants may report a different name to us than they use to register for college; (3) colleges sometimes do not report undocumented students to the NSC; and (4) some institutions do not participate in the NSC, so participants attending those institutions will not return a match (see National Student Clearinghouse Research Center 2014). In some research using the NSC data, NSC does not return a match for students who have opted to block disclosure of their directory information or for institutions that have blocked all of their students’ directory information. This is not a limitation in our study because participants consented to having their data matched, so the NSC provided a consent-based match.
15. In 98.2 percent of cases where CSAC and NSC both report college attendance for a student, the two datasets agree. For many cases, NSC reports college enrollment, but CSAC does not; this is expected because CSAC reports a college only if the student receives CalGrant aid there, and students may attend without CalGrant aid.
16. Students might not appear in the NSC data for a variety of reasons. NSC searches a national database and does not return a match if the student matches to more than one observation in their database. The CSAC match was limited to the state of California and used the high school attended prior to random assignment to disambiguate matches. Our analysis also suggests that undocumented students are overrepresented in the group that attends college according to CSAC but does not attend college according to the NSC, suggesting the NSC disproportionately misses these students (see also National Student Clearinghouse Research Center 2014). The NSC appears to miss a large share of enrollment among undocumented students, but undocumented students are a small share of our sample. We did not ask students if they were undocumented, but 84 percent of the sample is US-born, and the information we have suggests undocumented students are probably less than 10 percent of the full sample. Among the 16 percent of the sample that is foreign-born, 48 percent completed a FAFSA, indicating they have legal status; 34 percent completed a California DREAM Act application, indicating they are undocumented; and the remaining 18 percent did not fill out either form, so we do not know their status.
14
enrollment variables provide a more complete picture of college enrollment; however, CSAC
reports college enrollment conditional on receiving financial aid, which could be affected by the
treatment. We therefore report results based on the NSC data only and present the CSAC-
augmented results in the Online Appendix.
D. Random Assignment
The V-SOURCE Milestones treatment was less expensive compared to V-SOURCE Complete,
so Milestones would be cost effective with smaller treatment effects. Thus, to improve power to
detect small treatment effects in the Milestones treatment and stay within our budget, we chose to
assign fewer students to V-SOURCE Complete than to the other two treatment arms. We planned
to assign students to Complete, Milestones, and Control in a 2:3:3 ratio. However, we over-
recruited slightly in cohort 2 and divided the extra students evenly between Milestones and
Control.17
Because earlier randomized studies of college access programs found heterogeneous effects by
gender, parental education, and/or race/ethnicity and home language, we randomly assigned
students to each treatment within blocks created by fully interacting gender (two categories: male
and female), parental education (two categories: at least one parent attended college, excluding
vocational; and no parent attended college), and a race/ethnicity-home language composite (three
categories: Hispanic and speaks Spanish at home, Hispanic and does not speak Spanish at home,
and all other students). The interaction of these categorical variables generated 12 blocks; we put
students who had missing data on any of these variables in a separate block.
We randomly assigned students rather than schools, despite concerns about within-school
treatment diffusion or control group demoralization, because school-level assignment would have
required an extremely large sample of schools to yield sufficient power. The average student in
the control group was in a school where 12 percent of 11th graders were in one of the treatment
groups.18 The information components of the program would be most subject to diffusion, whereas
17. We excluded 59 students from the research prior to random assignment because they had poor contact information, so we had no way to
reach them. To avoid problems in administering the program, we non-randomly assigned some students in the second cohort who were in the same household with another participant (typically twins) to the same treatment arm as their household-mate. For simplicity and because there were few such students (90), we exclude the non-randomly assigned member of the household from the analysis rather than adjust the standard errors for clustering. For the first cohort, we did not identify the household-mates until after random assignment, so we drop all of them from the analysis (52 students).
18. The share treated was 5 and 9 percent at the 25th and 75th percentiles, respectively. To estimate the share treated, we divide the number treated by the number of 11th graders in the Common Core of Data; unfortunately, we do not have data on the number of likely four-year-college-
15
some program components—notably the advisors’ personalized assistance and the Milestone
Reward payments—could not diffuse at all. The Follow-up Survey included questions about the
extent of diffusion and demoralization. Those data indeed suggest that the information components
of the treatment spilled over to the control group somewhat, though we do not think it affected the
control group very much overall; we discuss this further below. We do not find evidence that
demoralization was a problem (Phillips and Reber 2019).
Students were allowed to leave the research at any time, and 70 students (1.1 percent) did so
after random assignment. The students who left the research were all in the control group and did
so during survey administration periods, presumably because they did not want to be bothered with
reminders to take the survey. We excluded these students from the analysis and did not include
them in the requests for administrative data. Table C.2 shows that participant characteristics
measured prior to random assignment are balanced across the treatment and control groups in the
analysis sample. 19 Although we achieved high response rates on the Follow-up Survey (87
percent), the response rate in the control group was about 3 percentage points higher than in the
two treatment groups.20 Table C.3 restricts the sample to those who answered the Follow-up
Survey and shows similar balance to Table C.2.21
E. Estimation
We estimate intent-to-treat (ITT) effects of assignment to V-SOURCE Complete or V-SOURCE
Milestones, relative to the control group.
We estimate equations of the following form:
(1) 𝑌𝑌𝑖𝑖𝑖𝑖 = 𝛽𝛽0 + 𝛽𝛽1𝑀𝑀𝑀𝑀𝑀𝑀𝑀𝑀𝑀𝑀𝑀𝑀𝑀𝑀𝑀𝑀𝑀𝑀𝑀𝑀𝑖𝑖𝑖𝑖 + 𝛽𝛽2𝐶𝐶𝑀𝑀𝑀𝑀𝐶𝐶𝑀𝑀𝑀𝑀𝑀𝑀𝑀𝑀𝑖𝑖𝑖𝑖 + 𝑋𝑋𝑖𝑖𝑖𝑖𝛽𝛽3 + 𝜂𝜂𝑖𝑖 + 𝜀𝜀𝑖𝑖
eligible students in each school. To the extent that the likely four-year-college-eligible students targeted by our study were more likely to take classes and interact in other ways with each other than with the average student, these percentages may understate the scope for diffusion.
19. We find statistically significant differences for whether students were US-born (or US-born was missing), checking email a few times a week, and text message frequency missing. Those differences are substantively small.
20. Differential response rates were larger earlier in the survey administration window and converged as we contacted the intervention groups more by email, text message, and eventually phone, to remind them to take the survey. We speculate that the intervention students were slower to respond because they had received a lot of communication from the V-SOURCE program during the prior 15 months, so were likely less attentive to an individual message from V-SOURCE (even through it came from a different email address or phone number), particularly if they perceived the college application process to be over. Comparison of administrative and survey-reported outcomes suggests that there may have been small, positive differential selection into survey-taking in the intervention groups, so the effects on self-reported outcomes may be biased upward slightly.
21. The statistically significant differences in Table C.3 are related to missing data for variables collected on the Baseline Survey and are substantively small. Among those who responded to the Follow-up Survey, students in the control group were more likely to have clicked on and responded to the Baseline Survey, suggesting the marginal Follow-up Survey respondents had low propensities to complete surveys.
16
where Yib is an outcome measure for student i in block b and MILESTONES and COMPLETE are
mutually exclusive treatment group indicators; the omitted category is the control group. The
parameters of interest are 𝛽𝛽1 and 𝛽𝛽2, indicating the effects of each treatment relative to the control
group. ηb is a set of block-group indicators (excluding one) to account for blocking during random
assignment; note that these implicitly control for key demographic predictors of college-going
outcomes and cohort. To further address potential imbalances due to chance or differential survey
response (for the self-reported outcomes) and to improve power, we include controls (X) for a
flexible function (cubic) of each of two measures of GPA collected on the Application Survey.22
As expected, considering the random assignment and large sample, the results are largely
unaffected by the inclusion or functional form of the GPA controls or controlling for a large set of
additional baseline covariates; we report alternative specifications in Phillips and Reber (2019).23
Finally, εi is an individual-specific error term.
We also present estimates of heterogeneous treatment effects for the key demographic groups
used to create the blocking groups and for some additional baseline characteristics of theoretical
interest. We interact the Complete and Milestones treatment indicators with an exhaustive set of
indicators for each category of the characteristic of interest. For example, the estimating equation
for the analysis of treatment effects by gender is:
(2) 𝑌𝑌𝑖𝑖𝑖𝑖 = 𝛾𝛾0 + 𝛾𝛾1𝑓𝑓𝑀𝑀𝑀𝑀𝑀𝑀𝑀𝑀𝑀𝑀𝑀𝑀𝑀𝑀𝑀𝑀𝑀𝑀𝑀𝑀𝑖𝑖𝑖𝑖 × 𝐹𝐹𝑀𝑀𝑀𝑀𝐹𝐹𝑀𝑀𝑀𝑀𝑖𝑖𝑖𝑖 + 𝛾𝛾2𝑓𝑓𝐶𝐶𝑀𝑀𝑀𝑀𝐶𝐶𝑀𝑀𝑀𝑀𝑀𝑀𝑀𝑀𝑖𝑖𝑖𝑖 × 𝐹𝐹𝑀𝑀𝑀𝑀𝐹𝐹𝑀𝑀𝑀𝑀𝑖𝑖𝑖𝑖
+ 𝛾𝛾1𝑚𝑚𝑀𝑀𝑀𝑀𝑀𝑀𝑀𝑀𝑀𝑀𝑀𝑀𝑀𝑀𝑀𝑀𝑀𝑀𝑀𝑀𝑖𝑖𝑖𝑖 × 𝑀𝑀𝐹𝐹𝑀𝑀𝑀𝑀𝑖𝑖𝑖𝑖 + 𝛾𝛾2𝑚𝑚𝐶𝐶𝑀𝑀𝑀𝑀𝐶𝐶𝑀𝑀𝑀𝑀𝑀𝑀𝑀𝑀𝑖𝑖𝑖𝑖 × 𝑀𝑀𝐹𝐹𝑀𝑀𝑀𝑀𝑖𝑖𝑖𝑖
+ X𝑖𝑖𝑖𝑖𝛾𝛾3 + 𝜂𝜂𝑖𝑖 + 𝜀𝜀𝑖𝑖
where 𝛾𝛾1𝑓𝑓 is the treatment effect of Milestones for females, 𝛾𝛾1𝑚𝑚 is the treatment effect of
Milestones for males, 𝛾𝛾2𝑓𝑓 is the treatment effect of Complete for females, and 𝛾𝛾2𝑚𝑚 is the treatment
22. The Application Survey asked students to self-report their GPA. The survey also asked students to report their grades in several courses and
we constructed a GPA measure based on those grades. We include a cubic function of both the self-reported GPA and the constructed GPA as controls.
23. See Phillips and Reber (2019) for alternative results that (1) exclude controls for GPA and (2) include controls for a more extensive set of baseline characteristics measured prior to random assignment (locus of control index, hard worker index, procrastinator/disorganized index, four-year college confidence index, close family support for applying to college index, school support for applying to college index, college access program participation, parents’ educational expectations, financial worries about college index). We list the specific items in each index and describe how we construct the indexes in Phillips and Reber (2019). We enter the controls flexibly (quintiles for index variables) and include a dummy variable for missing data.
17
effect of Complete for males. Note that the main effect (e.g., FEMALE indicator) is subsumed in
the blocking group indicators; for groups where this is not the case, we explicitly include the main
effects as controls.
F. Inference
We cluster the standard errors at the high school level to account for the clustering of students
within schools. 24 We use stars to indicate statistical significance at conventional levels for
individual coefficients. Because we test many comparisons, considering each test separately will
lead us to reject the null hypothesis too frequently, conditional on the chosen significance
threshold.25 Following Kling, Liebman, and Katz (2007), we construct indices of related outcomes
to reduce the number of outcomes we are examining, particularly for the outcomes related to
students’ self-reported levels of information and support for applying to college, which are based
on a large number of survey questions. However, many of our key outcomes have an intuitive scale
(for example, SAT-taking, college application, and college enrollment), and we want to examine
the effects of the program on different margins, so we do not combine these in an index.
We differentiate between confirmatory and exploratory analyses (see, e.g., Schochet 2008;
Bloom and Michalopoulos 2010). We treat analyses of average effects and analyses of
heterogeneous effects on the characteristics we blocked on as confirmatory, and analyses of
heterogeneity by other characteristics as exploratory. For the confirmatory analyses, we use the
Benjamini–Hochberg (1995) method to control the false discovery rate within each domain of
particular types of outcomes.26 We apply the adjustment separately within each domain for the
average treatment effects and separately within each domain across all the subgroups when we
analyze heterogeneous treatment effects. For example, the “Application Experiences” domain has
24. Alternatively, we can include high school fixed effects. Abadie et al. (2017) argued that clustering on high school may not be appropriate in
this case because random assignment was at the individual level. In practice, all of these approaches produce very similar standard errors. 25. Specifying outcomes and subgroups as part of a pre-analysis plan is common in medicine and increasingly common in economics. We began
this work in 2011 and did not register a pre-analysis plan. We registered this study (AEARCTR-0005530) after the analysis was complete to comply with this journal’s submission policy. The outcomes and subgroups we consider for our confirmatory analyses are the ones we “pre-specified” as of interest in our choice of blocking variables and largely what we identified in our grant application: “To examine whether the treatment is more effective for particular subgroups, we will also interact the treatment variables with the moderating variables described above, including gender, parental education, parental language, and time preferences, although power considerations will limit our ability to divide the sample too finely.” After writing the grant application but before conducting the analysis, we decided to focus on demographic subgroups only in the confirmatory subgroup analysis and use the baseline data we collected on academic achievement and a range of self-perception constructs to explore mechanisms.
26. We classify the outcomes within the following domains corresponding to Tables 5 through 10: Application Experiences (three outcomes), Milestone Completion (four outcomes), College Application Portfolio (four outcomes), College Admissions (four outcomes), College Enrollment (five outcomes), and College Persistence (five outcomes). If instead we use the method of Westfall and Young (1993), implemented using the wyoung command in Stata (Jones, Molitar, and Reif 2020), all but one coefficient considered significant according to the B-H approach is also significant using the W-Y approach (the adjusted p-value for that coefficient using the W-Y approach is 0.069).
18
three outcomes. For the analysis of average treatment effects in this domain, we adjust for six
comparisons (two treatments by three outcomes); in the confirmatory subgroup analyses
(Appendix D), we adjust for 42 comparisons (two treatments, three outcomes, seven subgroups).
In the tables, we denote with a dagger coefficients that are significant at the 5 percent level after
applying the adjustment for multiple comparisons. For supplementary outcomes (Appendix C) and
exploratory subgroup analyses (Appendix E), we do not apply the adjustment for multiple
comparisons.
IV. Program Impacts: Average Effects
We hypothesize that any reduced-form effect of assignment to V-SOURCE on college
enrollment would operate by affecting how informed and supported students were during the
college and financial aid application process, which would, in turn, impact key intermediate
outcomes, such as SAT/ACT-taking, college applications and admissions, and on-time FAFSA
completion, which would then change whether and where students enrolled and persisted in
college. We present estimates of ITT effects for each of these outcomes for the whole sample and
then turn to subgroup analyses.
A. Information and Support for College Application
We included a number of questions on the Follow-up Survey to assess how much V-SOURCE
increased the overall amount of information and support students had during the college and
financial aid application process. These questions were purposefully not aligned with the V-
SOURCE program content and were intended to capture the extent to which students sought out
information about the college application process, felt informed about various aspects of the
process, and felt supported during the process. We combined these items into three indices
measuring each of these constructs—“Sought Information,” “Had Information,” and “Had
Support”—and used the indices, rather than separate items, as measures of students’ experiences
of the college application process.27 Response rates varied slightly across survey questions, which
explains why sample sizes differ slightly across these outcomes.
27. See Appendix B for the survey items. Before constructing these indices, we conducted exploratory factor analyses of the items. Those
analyses provided support for a two-factor solution (in which “Had Information” and “Had Support” items could be combined) and a three-factor solution in which they remained distinct. We opted for the three-factor solution based on the content of the questions (face validity) and hypotheses about different effects for V-SOURCE Milestones and Complete.
19
Table 5 reports the effects of being assigned to V-SOURCE Milestones or Complete on these
indices. V-SOURCE did not affect—in either direction—the extent to which students sought
information about applying to college or for financial aid. These estimates are reasonably precise:
the 95 percent confidence interval rules out effects as large as 0.08 student-level standard
deviations. V-SOURCE did, however, increase the extent to which students felt informed and
supported, by 0.086 and 0.080 standard deviations, respectively, for Milestones and by 0.109 and
0.152 standard deviations, respectively, for Complete.
These results suggest that the Milestones components—the website and automated messages—
made students in both treatment groups feel more informed and supported. The point estimate on
feeling supported was almost twice as large for students assigned to the Complete program (0.152
standard deviations) as for those assigned to Milestones (.080 standard deviations), whereas the
point estimates for feeling informed were similar in both treatment arms. These results are
consistent with the emphasis of the Milestones components on providing information and the
advisor (available to students in Complete) providing support. It is perhaps surprising that
Milestones had any positive effect on the “Had Support” construct, given that the questions
underlying that measure asked whether the student had someone who would help them with
various tasks, and students in the Milestones program did not have an advisor. This positive effect
suggests that students interpreted the automated messages and website content as written by
humans who intended to be supportive.
Both crowd-out (whereby students substitute V-SOURCE services for services they otherwise
would have received from another source) and diffusion (whereby some treatment components
diffuse to the control group such that they are partially treated) may have reduced the measured
effects of being assigned to the intervention on the outcomes reported in Table 5, and by extension
the college enrollment outcomes. Our analysis of data from the Follow-up Survey shows minimal
evidence of crowd-out. For example, treated students were no less likely to be enrolled in other
college access programs. However, it is still possible that V-SOURCE participants used alternative
programs and services less intensively than they otherwise would have, in ways we cannot observe.
We do find some evidence of diffusion of the information components of the program to the
control group. For example, about a quarter of students reported that a treatment student told them
what they were learning from V-SOURCE, and a similar share reported receiving forwarded
20
emails from a V-SOURCE participant (and about a third reported at least one of those).28 However,
we do not think that diffusion had a large impact on the control group overall. The survey asked
control students how much they learned from the V-SOURCE website, emails, text messages, and
other students in the program in separate items. Half the students reported learning “little” or
“nothing” in all of the categories, and less than 8 percent reported learning “a lot of things” for any
of those items. Note too that these questions only apply to the information components of the
treatment. Information was a larger part of the Milestones program, compared to Complete, where
the personalized help of the advisor could not diffuse.
Overall, the estimates in Table 5 provide evidence that treated students felt more informed and
supported in the process of applying to college, despite the potential for crowd-out and diffusion.
However, the treatment-control differences were modest in size. (We are not aware of other studies
of college access programs that measure these outcomes, so we cannot compare these estimates to
the literature.)
B. Intermediate Outcomes
Table 6 shows the effects of assignment to V-SOURCE on the four milestones for which students
could receive Milestone Rewards: registering for the SAT or ACT, taking the SAT or ACT,
submitting college applications, and submitting the FAFSA (or DREAM Act Application) by the
CalGrant deadline. The SAT, ACT, and college application measures come from the Follow-up
Survey, and on-time FAFSA completion comes from administrative data. The effects are largely
positive but small. The only effect that is statistically significant at the 5 percent level after
adjusting for multiple comparisons is in Column (3): students assigned to the Complete program
were about 5 percentage points more likely than the control group to apply to at least two four-
year college systems (of the three systems: University of California (UC), California State
University (CSU), private).
The effects found for the self-reported measures could be biased upward if treated students
inflated their reports of feeling informed and supported, or of having completed certain milestones,
to please the research team (either consciously or unconsciously)—what researchers call “demand
28. To limit diffusion to the control group, EdBoost altered how the program was implemented in some ways, relative to how it would have
been implemented outside the context of a random-assignment study (e.g., by requiring a login for the website so that only treatment students could access it and by keeping Facebook groups closed). These attempts to minimize diffusion may have reduced the effectiveness of the intervention somewhat.
21
effects” (Orne 1962; Zizzo 2010) or “reactivity” (Webb et al. 1966). Although we attempted to
distinguish between the research and the intervention, participants in the intervention group may
not have noticed the distinction, and the survey was “V-SOURCE branded” due to survey
administration logistics and IRB protocols. Fortunately, having both survey and administrative
data on FAFSA completion reduces concerns about demand effects somewhat. Among students
who had data for both self-reported and administrative measures, students’ reported FAFSA
completion rates were only slightly higher on the survey (86 percent) than in the administrative
data (85 percent), and the point estimates on FAFSA completion were similar, regardless of the
measure used (Table C.4).
Note that the control means in Table 6 are relatively high. For example, 83 percent of the control
group reported taking the SAT or ACT (without which they were ineligible for admission to the
UC system and faced diminished opportunities in the CSU system), and 79 percent submitted the
FAFSA on time according to the administrative data.29 These high control means, especially for
the administratively measured FAFSA completion rate, suggest that a large fraction of participants
did not face these important barriers to college eligibility and affordability, a point to which we
return in the discussion.
Table 7 reports effects of assignment to V-SOURCE on where students applied to college.
Students reported on the Follow-up Survey which colleges they had applied to, and we coded these
into categories using IPEDs and Barron’s. Each outcome is an indicator for having reported
applying to at least one: (1) four-year college; (2) selective four-year college, which we define as
having a 2013 Barron’s classification of “very competitive plus” to “most competitive”; (3) college
in the CSU system; and (4) college in the UC system. The program encouraged students to apply
broadly to four-year colleges and to include selective colleges if appropriate given their academic
record. Most of the coefficients in Table 7 are positive and statistically significant (even after
adjusting for multiple comparisons), indicating that V-SOURCE increased the number and breadth
of applications participants submitted. These effects are relatively small, however, with the largest
point estimate implying that V-SOURCE Complete increased students’ applications to at least one
UC by 4.4 percentage points.
29. FAFSA verification—where students must submit additional documentation to verify information on their FAFSA after it has been
submitted—can be an additional barrier to enrollment for some students (Wiederspan 2019; Page, Castleman, and Meyer 2020). The indicator for on-time FAFSA completion means that the student was eligible to receive a CalGrant, financial aid from the main state financial aid program. We do not have information about whether a FAFSA was selected for verification by the US Department of Education.
22
Overall, these analyses suggest that the Complete program had larger effects than the Milestones
program on the application portfolio. It is not surprising that the college application process would
benefit from the more personalized advice that an advisor could provide by taking into account
students’ academic profiles and goals.
Table 8 shows that students’ increased applications to four-year colleges did not translate,
however, into a statistically significant impact on admissions. The point estimates imply that
students who were induced by the Complete program to apply to at least one CSU or at least one
UC were accepted at rates that are reasonable for each of those systems taken as a whole,30 but the
effects on college application outcomes were not large enough to yield notable effects on college
admissions.
C. College Enrollment and Persistence
The ultimate goal of the V-SOURCE program was to increase enrollment and persistence in
four-year colleges. Table 9 shows that the effects on enrollment were small and statistically
insignificant, which is unsurprising in light of the small effects on college application and
statistically insignificant effects on admissions.31 The estimated effect of Milestones on enrolling
in a UC is 1.6 percentage points and statistically significant at the 5 percent level, but it is not
significant after adjusting for multiple comparisons. The Milestones point estimates suggest a shift
from CSU to UC, though the change in CSU enrollment is not statistically significant. Table C.5
shows that estimates based on the CSAC-augmented measure of college enrollment are
substantively the same, though the somewhat higher control means for the CSAC-augmented
measures (e.g., 52 percent vs. 43 percent for four-year enrollment) are probably a more accurate
portrayal of counterfactual enrollments.
Although in theory V-SOURCE could have helped students make a better college match and
thus persist at a higher rate even without increasing first-fall enrollment, the effects on persistence
(Table 10) are also small and statistically insignificant after adjusting for multiple comparisons.
30. Admissions rates vary across campuses within each system, and between the systems. Although UCs are, on the whole, more selective than
CSUs, a few CSUs are more selective than the least selective UCs. The point estimates suggest that the marginal application converted to at least one admission 63 percent of the time for CSU (0.026/0.041) and 30 percent of the time for UC (0.013/0.044). These admissions rates are in the range of what one might expect based on admissions rates in each system (see Phillips and Reber 2019).
31. We use the NSC matches to construct indicators for the enrollment outcomes for the same categories as applications and admissions: (1) any four-year college, (2) any selective four-year college, (3) any CSU, and (4) any UC. The enrollment measure is equal to one if a student enrolled in the specified category in the first fall after expected on-time graduation from high school. The measures of persistence are equal to one if a student met the criteria in both the first and second falls after expected on-time high school graduation.
23
Although we have enough statistical power to rule out effects on four-year college enrollment
that are larger than about 2.7 and 3.2 percentage points for Milestones and Complete, respectively,
effects that are smaller than these may be meaningful, especially for Milestones, given its low cost.
For example, if Milestones caused a shift away from the CSUs to the UCs, and if our point estimate
of 1.6 percentage points indicates the true magnitude of the effect, Milestones would be cost-
effective given the substantial degree-attainment and earnings benefits of attending a UC (see
Bleemer 2020).
V. Heterogeneous Effects
A. Heterogeneous Effects by Demographic Group
Based on the results from the SOURCE evaluation, we anticipated that students from Hispanic,
Spanish-speaking households and first-generation college-going students would benefit most from
V-SOURCE. Prior work by Carrell and Sacerdote (2017) also suggested effects might vary by
gender. We targeted recruitment to schools with large populations of students we thought could
benefit most, but the study did not enroll such students exclusively. We therefore blocked on these
variables in the random assignment and estimate heterogeneous treatment effects by these
characteristics. For completeness, we report estimates for all the outcomes presented in Section 5
in Appendix D for each of the three blocking variables; we adjust for multiple hypotheses as
described above. The estimates for these subgroup analyses are generally not precise enough to
detect statistically significant differences between the treatment effects for different groups, so we
discuss the patterns of point estimates across the outcomes and subgroups with that in mind.
We do not find consistent evidence that women or men benefited more from the program (Tables
D.1b to D.1g). Nor do we find consistent evidence that students whose parents did not attend
college benefited more from the program, though the estimated effects of the Complete program
on college applications are somewhat larger for those students (Tables D.3b to D.3g).
We do find suggestive evidence, however, that the program was more effective for Hispanic
students from Spanish-speaking families, the same group for which the predecessor SOURCE
program had the largest effects and one of the key groups targeted by our strategy for recruiting
students. Note, however, that these effects tend to be statistically indistinguishable from the
estimates for the other race/language groups. The point estimates suggest that students assigned to
the Complete program applied more broadly to colleges (Table D.2d) and were more likely to be
24
accepted to a broader range of colleges, particularly to at least one UC (Table D.2e). Students
assigned to both variants were also more likely to enroll and persist at a UC campus (Tables D.2f
and D.2g), though these effects are not significant after adjusting for multiple hypotheses. The
point estimates for two-year persistence of about 3.5 percentage points are modest in absolute
terms but large relative to the control mean of 9 percent.
B. Additional Exploratory Heterogeneity Analyses
We conducted additional subgroup analyses to provide insight into the mechanisms by which
the program operated. We examined: (1) the extent to which the effects aligned with expectations
based on students’ academic qualifications; (2) whether the program was more effective for
students who had fewer alternative sources of support in their families or at school; and (3) whether
the program was more effective for students who reported being disorganized or prone to
procrastination. We consider these analyses exploratory and generally do not have sufficient power
to draw strong conclusions, so do not adjust for multiple comparisons. We describe how we
measured these constructs and report estimates for applications, admissions, and fall enrollment in
Appendix E. We focus this discussion mostly on the college application portfolio, the key
intermediate outcome the program was designed to influence, keeping in mind that changes in
applications typically did not translate to changes in college enrollment.
The estimates of heterogeneous treatment effects by pre-program GPA suggest that the
Complete program induced additional applications on the appropriate margins given students’
academic preparation (Table E.1b); lower-GPA students were more likely to submit a CSU
application, moderate-GPA students were more likely to submit a UC application, and high-GPA
students were somewhat more likely to do both. The estimates for Milestones follow a similar
pattern but are smaller in magnitude (and statistically insignificant). These results suggest that the
program had some success targeting advice based on academic background and that having an
advisor, rather than just automated information, may be important for increasing applications.
A key goal of V-SOURCE was to provide assistance with the college access process to students
who would otherwise get little support from their parents or at school, so we estimated
heterogeneous treatment effects by several baseline measures of expected family and school
support for applying to college. The results suggest that V-SOURCE was more helpful to students
who did not have other sources of support. Consistent with Carrell and Sacerdote (2017), we found
25
larger effects on college applications among students who reported at baseline that their parents
would not help them with college applications if they asked (Table E.2b).32 Students who reported
that their parents would not help with college applications were quite similar to students who
reported that their parents would help them with applications on a broad range of measures—GPA,
educational aspirations, parents’ and teachers’ educational expectations for them, and being US-
born—but, not surprisingly, students who reported that their parents would not help them with
their applications were more likely to speak Spanish at home and to have parents who were foreign-
born and had little education (Table E.2a).
Effects on applications were also larger for students who did not report that a teacher and/or
counselor would help them with their applications if they asked (Table E.4b). Almost 80 percent
of students reported that a teacher and/or counselor would help with applications if they asked; the
20 percent who did not were slightly more likely to describe themselves as procrastinators and less
hardworking, and reported somewhat lower grades, on average, but not exclusively so (e.g., 36
percent had a GPA of 3.5 or higher; Table E.4a). These results suggest that the larger effects for
lower-GPA students reported above could be related to lower levels of alternative support for those
students, though we could not experimentally vary GPA or the availability of other help, so cannot
say for sure. The effects do not differ systematically based on another measure of school support—
whether a student had participated in a college access program at baseline (Table E.5b).
Although we caution that differences across subgroups are generally not statistically significant,
and in most cases increased applications did not translate to more enrollments, taken as a whole,
the estimates suggest that V-SOURCE Complete helped meet the need of students who did not
have other people, particularly parents, who could help them with their college applications.
Students from Spanish-speaking backgrounds were more likely to report that their parents would
not help them with their applications, compared to other groups (Table D.2a). Less availability of
parental help among this group is probably part of the explanation for the larger effects of V-
SOURCE for Hispanic students from Spanish-speaking households. Note, however, that students
from Spanish-speaking families look similar to other groups on a broad range of other measures
32. The question asked, “Thinking of the people in your life, which of the following people…will help you with college applications if you
ask?” Response options were not mutually exclusive: parent, sister/brother, other relative, family friend, friend, teacher, school counselor, mentor (from a program). We also examined whether effectiveness varied by whether a sibling could help with college applications (Table E.3b). Carrell and Sacerdote’s (2017) question asked whether a parent had helped with college applications. We asked the question prior to random assignment, whereas the Carrell and Sacerdote (2017) asked the question after random assignment. Their post-treatment measure could reflect crowd-out—substitution of the program for help parents would have otherwise provided—but they argue this was not the case.

26
related to educational aspirations and school and family support for education (Table D.2a). These
other measures indicate that while these students’ parents support their educational endeavors
(over 80 percent expect their child to complete at least a BA, and 60 percent will make sure they
turn in their applications), they are less able to help fill out college applications specifically.
Finally, several components of the program—for example, the reminders and Milestone
Rewards—were designed specifically to address students’ lack of organization and tendency to
procrastinate, so we expected the treatment to be more helpful for students who were disorganized
or prone to procrastination. Indeed, we found larger treatment effects on the application portfolio
for students who scored in the highest third on an index of procrastination and disorganization at
baseline (Table E.6b).33 Note that the differential effects for students who were disorganized or
prone to procrastination were similar in Milestones and Complete, whereas, for most other
heterogeneity analyses, the effects of Complete tended to be larger. These results suggest that
students who were more disorganized and likely to procrastinate may have particularly benefited
from the reminders and rewards for completing the key college application milestones, whereas
the advisor was more important for other subgroups.
Altogether, the exploratory analyses suggest that the program operated as designed—
encouraging applications on academically relevant margins, providing help where parents and
schools could not, and encouraging disorganized students to complete key application tasks on
time. However, these effects were generally not large enough to translate to increased college
enrollments, or students faced additional barriers to enrollment.
VI. Discussion: Understanding the Null Enrollment Effects
Although theory and past research suggest that providing additional information and support to
disadvantaged students during the college and financial aid application process might improve
students’ college enrollment outcomes, our randomized evaluation found that a program designed
to provide such information and support virtually did not increase students’ likelihood of enrolling
or persisting in a four-year college for the average student who participated in the study. The
average effects of the program on intermediate outcomes, such as students’ perceptions of support
33. We also expected individuals with present-biased preferences to procrastinate (Laibson 1997). We attempted to measure present bias using
standard questions eliciting discount rates now and in the future, but more than half of students gave answers consistent with future-biased preferences, and many responses were internally inconsistent or implied extremely high discount rates. The data suggest that the students did not interpret the questions as expected, and the responses did not measure present bias, so we focus on the items asking about procrastination here.
27
during the college application process and applications to at least one four-year college, indicate
that the program affected the mechanisms we thought would lead to improvements in four-year
college enrollment. The heterogeneity results also provide support for key hypothesized
mechanisms: the program (especially Complete) induced applications on the relevant margins
depending on student GPA, had larger effects for students whose families were less able to help
with the college application process, and had larger effects for students who were disorganized or
prone to procrastinate.
In this section, we discuss potential explanations for the null finding on college enrollment and
compare our findings to other studies of college access programs, which we summarize in more
detail in Appendix A.
A. Selection into the Study and Counterfactual Condition
The characteristics of our sample and the conditions experienced by the control group may help
explain the small effects we found and differences between our results and those of past studies.
Students had to choose to enroll in the study and probably did not apply for V-SOURCE unless
they had some sense that they wanted to go to college. Students also had to complete the short
application, get a parent’s signature, and return it in a pre-addressed stamped envelope (or to
school) by a deadline to enroll in the study.34 Students who were able to complete these tasks on
time may have been less in need of the V-SOURCE program, particularly the reminders. Prior
studies have found that those who volunteer to participate in a program may not be the ones who
benefit most; in fact, the reverse may be true (see, e.g., Nathan 2013; Kline and Walters 2016;
Chyn 2018).
We cannot measure selection into the study directly, but we can compare some outcomes in our
sample to benchmark populations. Given that the program was targeted to students who were on
track to apply to public four-year colleges, it is not surprising that the four-year- college enrollment
rate among Los Angeles Unified students in the V-SOURCE control group (43 percent) was higher
than for graduates in the same cohorts for the whole district (25 and 27 percent for 2013 and 2014,
34. We do not have data on students who were eligible but did not enroll in our study, but we estimate that the average student in the study was
in a school where about 11 percent of juniors enrolled; 8 and 15 percent at the 25th and 75th percentile, respectively (we do this by taking the ratio of participants in the study to number of juniors reported in the NCES Common Core of Data). Our sense from reports from the recruiters is that a lot of the variation in take-up across schools related to logistical factors such as how many classes they were able to visit, whether they were able to reach teachers and counselors to follow up, and how much teachers encouraged students to return the applications, but we do not have systematic data on this.
28
respectively) (Phillips, Yamashiro, and Jacobson 2017). Similarly, 78 percent of the V-SOURCE
control group overall and 82 percent of LAUSD students in the control group reported applying to
at least one four-year college, compared to 63 percent of a national sample of public high school
graduates in 2013 and 64 percent of LAUSD 12th graders in 2017 (Miller, Phillips, and Yamashiro
2018). We expected the reminder components of the program to be particularly effective for
students who tend to procrastinate or be disorganized, conditional on academic achievement.
Although we cannot determine whether our sample was positively selected on these “non-
cognitive” skills, the fact that effects on the application portfolio were larger for students who are
more prone to disorganization and procrastination (Table E.6b) suggests such students could
particularly benefit from this type of intervention.
Outcomes for the control group provide some insight into how much scope there was for V-
SOURCE to improve outcomes. While according to the CSAC-augmented enrollment measures,
81 percent of the control group enrolled in some type of college in the first fall after expected high
school graduation, only 52 percent enrolled in a four-year college, leaving 19 percent of students
who could have been induced into any college and 29 percent who could have been shifted from
two- to four-year colleges (the margin on which the intervention was designed to operate). While
control students who did not enroll in a four-year college had lower GPAs on average, over 60
percent of this group (35 percent of the whole sample) had a self-reported GPA of 3.0 or better,
suggesting they could have been admitted to some CSU or even UC campuses. The control mean
for four-year college enrollment is lower in V-SOURCE compared to SOURCE (Bos et al. 2012),
suggesting that the V-SOURCE sample is, if anything, less positively selected on counterfactual
outcomes.35
A major goal of the intervention was to increase the extent to which students completed key
steps in the college application process so that they would have four-year college options and not
default to enrollment in a two-year college. Students in the control group completed key milestones
targeted by the program at high rates—83 percent reported that they took the ACT or SAT, 79
percent completed a FAFSA on time, and 78 percent reported they applied to at least one four-year
college. The high rate of on-time FAFSA completion in the control group is perhaps surprising in
35. Using comparable measures of four-year enrollment, the four-year enrollment rate in V-SOURCE is about 10 percentage points lower than
in SOURCE, though the CSAC-augmented four-year enrollment rate in V-SOURCE matches the SOURCE four-year enrollment almost exactly. We do not know whether the under-matching in NSC data was similar when the SOURCE study was conducted. In any case, it seems the SOURCE and V-SOURCE counterfactual enrollments are at least similar.
29
light of recent emphasis on the FAFSA as a barrier to college enrollment (e.g., Dynarski and Scott-
Clayton 2006; Bettinger et al. 2012). The high rates in this sample could be due to the significant
simplification of the FAFSA for low-income students, increased emphasis on and support for
FAFSA completion in the community, and/or selection into the study. But the control means for
SAT-taking and FAFSA completion are in a similar range to the control means in SOURCE (Bos
et al. 2012).
Students in the control group reported reasonably high levels of support, but again, there was
room for improvement. On the Follow-up Survey, 59 percent of the control group said they felt
“well-informed” or “very well-informed” throughout the college and financial aid application
process, and just 43 percent participated in at least one non-V-SOURCE college access program.
Overall, the experience of the control group suggests that a large share of the sample had access
to other sources of information and support for college application and completed the key
application milestones; about half ultimately enrolled in a four-year college. Still, the outcomes in
the counterfactual condition leave scope for an intervention to produce modest improvements.
Recall that the intervention was not intensive, and we did not expect large effects on four-year
enrollment. We powered the study to detect effects as small as about 4 percentage points for
Milestones, and indeed our estimates are sufficiently precise to reject effects in this range.
B. Program Design
V-SOURCE was designed explicitly to test whether an entirely virtual—and therefore
scalable—information and advising program could improve college enrollment. We speculate that
the virtual nature of V-SOURCE limited its effectiveness. Prior studies in other contexts have
shown that in-person advising interventions can be effective,36 and the in-person predecessor to
V-SOURCE, SOURCE, produced larger effects (Bos et al. 2012) than we find here. Despite some
differences in geographic scope (SOURCE was limited to LAUSD) and timing (the SOURCE
study took place in 2006–07), SOURCE and V-SOURCE participants were broadly similar (Table
C.6). Consistent with the recruitment strategy for the current study, V-SOURCE students were
more likely than SOURCE students to report Spanish as their home language and less likely to
36. See, for example, Avery (2013), Bettinger et al. (2013), Carrell and Sacerdote (2017), Barr and Castleman (2018), Bettinger and Evans
(2019), and Oreopoulos and Ford (2019). Some of these interventions are not only in-person but also more intensive and expensive than V-SOURCE. Note, too, that the text message intervention in Avery et al. (2020) that improved intermediate outcomes (though not enrollment) provided the opportunity for students to meet in person with their counselors.
30
have at least one parent who attended college; if anything, these differences should have led us to
find larger effects in V-SOURCE because those were the groups that most benefited from
SOURCE.37 But it is possible that more personalized contact, in the form of in-person visits and
more frequent contact by phone, helps explain differences in the interventions’ effectiveness.
Although take-up in SOURCE was, if anything, lower than in V-SOURCE, SOURCE participants
met with their advisors in person about four times, on average, and talked on the phone with them
over 11 times on average (Bos et al. 2012). In contrast, V-SOURCE participants never met with
their advisors in person, had fewer than two phone calls with them, on average, and instead
communicated largely by text message and email.
Prior studies that have found effects for low-cost, mail-based interventions targeting high-
achieving students who were very likely to be eligible for admission to selective colleges and for
whom information, rather than academic preparation, was presumably the key barrier to
enrollment.38 Our results, considered in the context of prior studies, are broadly consistent with
the idea that high-achieving students may benefit from information interventions in some
circumstances, whereas moderate- and lower-achieving students probably need more-intensive or
in-person assistance, or more fundamental assistance with improving their academic eligibility.
Moreover, although V-SOURCE provided information about college costs and how to apply for
financial aid, it did not provide any actual financial assistance such as guaranteed tuition coverage
or scholarships. California’s CalGrant program is relatively generous, covering full tuition for low-
and moderate-income students, but it is not guaranteed and can be difficult to understand. Research
suggests that up-front tuition guarantees increase four-year college enrollment and completion
(Bartik, Hershbein, and Lachowska 2021) and that scholarships (perhaps in combination with
advising during the college years) improve four-year college persistence and completion (Page et
al. 2019).
37. V-SOURCE recruited juniors from predominantly low-income, predominantly Hispanic and/or African American high schools from school
districts in Southern and Central California whose coursework and grades suggested that they were on track to be eligible for admission to a public four-year university. SOURCE recruited juniors from all LAUSD high schools who were on track to be eligible for admission to a public four-year university and had at least a 2.5 GPA. V-SOURCE students had somewhat higher GPAs and somewhat lower educational expectations than SOURCE students, but these differences are not that large and may be attributable to differences in the data sources across the studies.
38. See Hoxby and Turner (2013), Gurantz, Hurwitz, and Smith (2017), and Dynarski et al. (2018), though Gurantz et al. (2019a) did not find significant effects for an intervention similar to Hoxby and Turner’s (2013) ECO.
31
C. Context and Targeting
Some features of the California context may also have limited the program’s effectiveness,
particularly when compared to New Hampshire (Carrell and Sacerdote 2017).39 For example,
Carrell and Sacerdote (2017) targeted students identified by school counselors as college-ready
but who had not taken steps to apply by January of their senior year; this approach would not be
possible in California because California’s public four-year universities would no longer be
accepting students. California’s application deadlines are early, and there are no late or open
admissions four-year colleges in the state. By contrast, New Hampshire (the site of Carrell and
Sacerdote’s study) and Ohio (the site of the H&R Block FAFSA study) both have at least one
selective four-year college that admits students in the spring. On the other hand, the SOURCE
program was more effective in a similar institutional environment, pointing to the virtual nature of
V-SOURCE or the increased availability of alternative sources of information and support as
explanations for the null effects of V-SOURCE on college enrollment.
Ultimately, we cannot say conclusively why our findings differ from studies of related programs,
but our analysis suggests that the context and details of college access interventions influence their
effectiveness and that many socioeconomically disadvantaged students face barriers to college
enrollment that are not easily addressed with a low-cost, fully virtual intervention focused on the
college and financial aid application process alone. Nonetheless, questions remain about the design
of fully virtual interventions or how best to combine virtual and in-person components. For
example, although text-messaging interventions involving parents of younger students have been
successful (see footnote 5), low-cost college access interventions, including V-SOURCE, have not
involved parents. And most virtual programs start fairly late in students’ high school careers.
Perhaps pushing virtual information to students and their parents earlier in students’ academic
careers about college eligibility, college planning, and financial aid availability might have larger
effects than V-SOURCE, which began in the spring of students’ junior year and pushed
information only to students. Likewise, coordinating pushed information and reminders with
school counselors’ ongoing work with students in schools or with in-person classroom sessions
39. See Phillips and Reber (2019) for a description of the process of applying to college in California compared to other states, including New
Hampshire.
32
focused on college planning, test preparation, and college application might be more effective than
a completely virtual intervention like V-SOURCE.40
VII. Conclusion
This paper reports the results from a random assignment field experiment of two virtual college
access interventions targeted to students who were on track to be academically eligible for
admission to a public four-year college in California. The interventions were designed to provide
information and support during the college and financial aid application process and to help
students avoid procrastinating about key deadlines. We use a range of data sources—both
administrative and self-reported—to show that the program increased the extent to which students
felt they were supported and had access to information when applying to college, and that program
participation moderately increased the completion of key milestones in the application process.
However, increased college applications did not translate to more college admissions, and the
program did not increase college enrollment or persistence on average. We find suggestive
evidence that the program was effective at increasing enrollment and persistence at UC campuses
for Hispanic students from Spanish-speaking families, the same group that benefited most from
the predecessor SOURCE program. However, these estimates are modest and not statistically
significant after adjusting for multiple comparisons.
While previous studies have suggested that relatively low intensity interventions focused on the
college application process can yield large increases in college enrollment, this study suggests that
the details of the intervention, context, and population served are important. Socioeconomically
disadvantaged students almost universally aspire to complete a BA but enroll in four-year colleges
at much lower rates than their socioeconomically advantaged peers. This gap between aspirations
and outcomes suggests that there is scope for some intervention to improve four-year enrollment
among such students, but the virtual V-SOURCE intervention did not help students overcome
these barriers on average, and more intensive interventions will likely be required.
40. It is also possible that a different frequency of messaging would have been more effective if, for example, students started to tune out the
messages. The reminders associated with the Milestone Rewards were less frequent and differentiated by the offer of a $20 gift card for completing the key steps. In the Follow-up Survey, students reported that they paid attention to the reminders and found them helpful—and that they would have missed more deadlines without them—but we did not have a large enough sample to vary the frequency of messaging experimentally, so we do not know whether less frequent messages would have been more effective.
33
References
Abadie, Alberto, Susan Athey, Guido W. Imbens, and Jeffrey Wooldridge. 2017. “When Should
You Adjust Standard Errors for Clustering?” NBER Working Paper 24003.
Avery, Christopher. 2013. “Evaluation of the College Possible Program: Results from a
Randomized Controlled Trial.” NBER Working Paper 19562.
Avery, Christopher, and Thomas Kane. 2004. “Student Perceptions of College Opportunities: The
Boston COACH program.” Pp. 355–94 in College Choices: The Economics of Where to Go,
When to Go, and How to Pay for It, edited by Caroline Hoxby. Chicago, IL: University of
Chicago Press.
Avery, Christopher, Benjamin L. Castleman, Michael Hurwitz, Bridget T. Long, and Lindsay C.
Page. 2020. “Digital Messaging to Improve College Enrollment and Success.” NBER Working
Paper 27897.
Bailey, Martha and Susan Dynarski. 2011. “Inequality in Postsecondary Attainment.” Pp. 117–32
in Whither Opportunity: Rising inequality, Schools, and Children's Life Chances, edited by G.
Duncan and R. Murnane. New York, NY: Russell Sage Foundation.
Barr, Andrew, and Benjamin Castleman. 2018. “An Engine of Economic Opportunity: Intensive
Advising, College Success, and Social Mobility.”
(http://people.tamu.edu/~abarr/BL_shell_6_6_2018.pdf)
Barrow, Lisa, and Ofer Malamud. 2015. “Is College a Worthwhile Investment?” Annual Review
of Economics 7:519–55.
Bartik, Timothy J., Brad Hershbein, and Marta Lachowska. 2021. “The Effects of the Kalamazoo
Promise Scholarship on College Enrollment and Completion.” The Journal of Human Resources
56 (1): 269–310.
34
Baum, Sandy, Jennifer Ma, and Kathleen Payea. 2013. The Benefits of Higher Education for
Individuals and Society. New York, NY: The College Board.
Benjamini, Yoav, and Yosef Hochberg. 1995. “Controlling the False Discovery Rate: A Practical
and Powerful Approach to Multiple Testing.” Journal of the Royal Statistical Society Series B
Methodological, 57 (1): 289–300.
Bergman, Peter, and Eric W. Chan. 2021. “Leveraging Parents through Low-Cost Technology:
The Impact of High-Frequency Information on Student Achievement.” Journal of Human
Resources 56 (1): 125–58.
Bergman, Peter, Jeffrey T. Denning, and Dayanand Manoli. 2019. “Is Information Enough? The
Effect of Information about Education Tax Benefits on Student Outcomes.” Journal of Policy
Analysis and Management 38 (3): 706–31.
Beshears, John, James J. Choi, David Laibson, and Brigitte C. Madrian. 2008. “The Importance
of Default Options for Retirement Saving Outcomes: Evidence from the United States.” Pp. 59–
87 in Lessons from Pension Reform in the Americas, edited by S. J. Kay and T. Sinha. Oxford:
Oxford University Press.
Bettinger, Eric P., and Brent J. Evans. 2019. “College Guidance for All: A Randomized
Experiment in Pre-College Advising.” Journal of Policy Analysis and Management 38 (3): 579–
99.
Bettinger, Eric, Bridgette Terry Long, Philip Oreopoulos, and Lisa Sanbonmatsu. 2012. “The Role
of Application Assistance and Information in College Decisions: Results from the H&R Block
FAFSA Experiment.” The Quarterly Journal of Economics 127 (3):1205–42.
Bird, Kelli A., Benjamin L. Castleman, Jeffrey T. Denning, Joshua Goodman, Cait Lamberton,
and Kelly Ochs Rosinger. 2019. “Nudging at Scale: Experimental Evidence from FAFSA
Completion Campaigns.” Annenberg Institute at Brown University Working Paper.
35
Bleemer, Zachary. 2020. “Top Percent Policies and the Return to Postsecondary Selectivity.”
Working Paper.
Bloom, Howard S., and Charles Michalopoulos. 2010. “When is the Story in the Subgroups?
Strategies for Interpreting and Reporting Intervention Effects for Subgroups.” MDRC Working
Paper.
Bourdieu, Pierre, and Jean-Claude Passeron. 1977. Reproduction in Education, Society, and
Culture. Beverly Hills, CA: Sage.
Bos, Johannes M., Jacqueline Berman, Thomas J. Kane, and Fannie M. Tseng. 2012. “The Impacts
of SOURCE: A Program to Support College Enrollment through Near-Peer, Low-Cost Student
Advising.” Draft paper presented at the Association for Public Policy and Management annual
meeting.
Bozick, Robert and Erich Lauff. 2007. Education Longitudinal Study of 2002 (ELS:2002): A First
Look at the Initial Postsecondary Experiences of the Sophomore Class of 2002 (NCES 2008-
308). National Center for Education Statistics, Institute of Education Sciences, US Department
of Education. Washington, DC.
Cabell, Sonia Q., Tricia A. Zucker, Jamie DeCoster, Stefanie B. Copp, and Susan Landry. 2019.
“Impact of a Parent Text Messaging Program on Pre-Kindergarteners’ Literacy Development.”
AERA Open 5 (1): 233285841983333.
Card, David. 2001. “Estimating the Return to Schooling: Progress on Some Persistent Econometric
Problems.” Econometrica 69 (5): 1127–60.
Carrell, Scott, and Bruce Sacerdote. 2017. “Why do College-Going Interventions Work?”
American Economic Journal: Applied Economics 9 (3): 124–51.
36
Castleman, Benjamin L., and Lindsay C. Page. 2014. Summer Melt: Supporting Low-Income
Students Through the Transition to College. Cambridge, MA: Harvard Education Press.
Castleman, Benjamin L., Lindsay C. Page, and Korynn Schooley. 2014. “The Forgotten Summer:
Does the Offer of College Counseling After High School Mitigate Summer Melt among College-
Intending, Low-Income High School Graduates?” Journal of Policy Analysis and Management
33 (2): 320–44.
Chyn, Eric. 2018. “Moved to Opportunity: The Long-Run Effects of Public Housing Demolition
on Children.” American Economic Review 108 (10): 3028–56.
Coleman, James S. 1988. “Social Capital in the Creation of Human Capital.” American Journal of
Sociology 9 (4): 95–120.
Cunha, Jesse M., Trey Miller, and Emily Weisburst. 2018. “Information and College Decisions:
Evidence from the Texas Go Center Project.” Educational Evaluation and Policy Analysis 40
(1): 151–70.
Dynarski, Susan M., and Judith Scott-Clayton. 2006. “The Cost of Complexity in Student
Financial Aid: Lessons from Optimal Tax Theory and Behavioral Economics.” National Tax
Journal 59 (2): 319–56.
Dynarski, Susan M., and Judith Scott-Clayton. Spring 2013. “Financial Aid Policy: Lessons from
Research.” Future of Children 23 (1): 67–91.
Dynarski, Susan M., Steven W. Hemelt, and Joshua M. Hyman. 2013. “The Missing Manual:
Using National Student Clearinghouse Data to Track Postsecondary Outcomes.” NBER
Working Paper 19552.
Dynarski, Susan, C. J. Libassi, Katherine Michelmore, and Stephanie Owen. 2018. “Closing the
Gap: The Effect of a Targeted, Tuition-Free Promise on College Choices of High-Achieving,
37
Low-Income Students.” NBER Working Paper 25349.
Ellwood, David, and Thomas Kane. 2000. “Who is Getting a College Education? Family
Background and the Growing Gaps in Enrollment.” Pp. 283–324 in Securing the Future, edited
by S. Danziger and J. Waldfogel. New York, NY: Russell Sage Foundation.
French, Robert, and Philip Oreopoulos. 2017. “Applying Behavioural Economics to Public Policy
in Canada.” Canadian Journal of Economics 50 (3): 599–635.
Fryer Jr., Roland G., 2016. “Information, Non-Financial Incentives, and Student Achievement:
Evidence from a Text Messaging Experiment.” Journal of Public Economics 144:109–21.
Grodsky, Eric, and Catherine Riegle-Crumb. 2010. “Those Who Choose and Those Who Don’t.
Social Background and College Orientation.” Annals of the American Academy of Political and
Social Science 627:14–35.
Grodsky, Eric, and Melanie T. Jones. 2007. “Real and Imagined Barriers to College Entry:
Perceptions of Cost.” Social Science Research 36:745–66.
Gurantz, Oded, Michael Hurwitz, and Jonathan Smith. 2017. “College Enrollment and Completion
among National Recognized High-Achieving Hispanic Students.” Journal of Policy Analysis
and Management 36 (1): 126–53.
Gurantz, Oded, Jessica Howell, Mike Hurwitz, Cassandra Larson, Matea Pender, and Brooke
White. 2019a. “Realizing Your College Potential? Impacts of College Board’s RYCP Campaign
on Postsecondary Enrollment.” Annenberg Institute at Brown University Working Paper.
Gurantz, Oded, Matea Pender, Zachary Mabel, Cassandra Larson, and Eric Bettinger. 2019b.
“Virtual Advising for High-Achieving High School Students.” Annenberg Institute at Brown
University Working Paper.
38
Hout, Michael. 2012. “Social and Economic Returns to College Education in the United States.”
Annual Review of Sociology 38: 379–400.
Hoxby, Caroline, and Sarah Turner. 2013. “Expanding College Opportunities for High-Achieving,
Low Income Students.” Stanford Institute for Economic Policy Research Discussion Paper 12-
014.
Hyman, Joshua. 2020. “Can Light-Touch College-Going Interventions Make a Difference?
Evidence from a Statewide Experiment in Michigan.” Journal of Policy Analysis and
Management 39 (1): 159–90.
Jones, Damon, David Molitor, and Julian Reif. 2020. “What Do Workplace Wellness Programs
Do? Evidence from the Illinois Workplace Wellness Study.” Quarterly Journal of Economics,
134: 1747–91.
Klasik, Daniel. 2012. “The College Application Gauntlet: A Systematic Analysis of the Steps to
Four-Year College Enrollment.” Research in Higher Education 53: 506–49.
Kline, Patrick, and Christopher R. Walters. 2016. “Evaluating Public Programs with Close
Substitutes: The Case of Head Start” The Quarterly Journal of Economics 131 (4): 1795–1848.
Kling, Jeffrey R., Jeffrey B. Liebman, and Lawrence F. Katz. 2007. “Experimental Analysis of
Neighborhood Effects.” Econometrica 75 (1): 83–119.
Kraft, Matthew A., and Shaun M. Dougherty. 2013. “The Effect of Teacher–Family
Communication on Student Engagement: Evidence from a Randomized Field Experiment.”
Journal of Research on Educational Effectiveness 6 (3): 199–222.
Laibson, David. 1997. “Golden Eggs and Hyperbolic Discounting.” Quarterly Journal of
Economics 112 (2): 443–77.
39
Madrian, Brigitte, and Dennis F. Shea. 2001. “The Power of Suggestion: Inertia in 401(k)
Participation and Savings Behavior.” Quarterly Journal of Economics 116 (4): 1149–87.
Marx, Benjamin M., and Lesley J. Turner. 2019. “Student Loan Nudges: Experimental Evidence
on Borrowing and Educational Attainment.” American Economic Journal: Economic Policy 11
(2): 108–41.
Mayer, Susan E., Ariel Kalil, Philip Oreopoulos, and Sebastian Gallegos. 2019. “Using Behavioral
Insights to Increase Parental Engagement: The Parents and Children Together Intervention.”
Journal of Human Resources 54 (4): 900–25.
McDonough, Patricia M. 2004. “Counseling Matters: Knowledge, Assistance, and Organizational
Commitment in College Preparation.” Pp. 69–87 in Preparing for College: Nine Elements of
Effective Outreach, edited by W.G. Tierney, Z.B. Corwin, and J.E. Colyar. Albany, NY: SUNY
Press.
Miller, Carrie E., Meredith Phillips, and Kyo Yamashiro. 2018. L.A. Unified Students’ Pathways
to College: Four-Year College Application Patterns. Research Brief. Los Angeles Education
Research Institute.
Nathan, Alan. 2013. Does Upward Bound Have an Effect on Student Educational Outcomes? A
Reanalysis of the Horizons Randomized Controlled Trial Study. Dissertation, University of
Wisconsin, Madison.
National Student Clearinghouse Research Center. 2014. Using NSC StudentTracker for High
School Reports: Considerations for Measuring the College Enrollment Rates of High School
Graduates. Herndon, VA. https://nscresearchcenter.org/wp-content/uploads/Considerations-in-
Using-NSC-STHS-Reports.pdf.
Olson, Lorayn, and Rachel A. Rosenfeld. 1984. “Parents and the Process of Gaining Access to
Student Financial Aid.” The Journal of Higher Education 55 (4): 455–80.
40
Oreopoulos, Philip and Reuben Ford. 2019. “Keeping College Options Open: A Field Experiment
to Help All High School Seniors through the College Application Process: Keeping College
Options Open.” Journal of Policy Analysis and Management 38 (2): 426–54.
Oreopoulos, Philip, and Uros Petronijevic. 2013. “Making College Worth It: A Review of the
Returns to Higher Education.” The Future of Children 23 (1): 41–65.
Oreopoulos, Philip, and Uros Petronijevic. 2018. “Student Coaching: How Far Can Technology
Go?” Journal of Human Resource 53 (2): 299–329.
Orne, Martin T. 1962. “On the Social Psychology of the Psychological Experiment: With
Particular Reference to Demand Characteristics and Their Implications.” American
Psychologist 17 (11): 776–83.
Page, Lindsay C., and Judith Scott-Clayton. 2016. “Improving College Access in the United States:
Barriers and Policy Responses.” Economics of Education Review 51:4–22.
Page, Lindsay C., Benjamin L. Castleman, and Katharine Mayer. 2020. “Customized Nudging to
Improve FAFSA Completion and Income Verification.” Educational Evaluation and Policy
Analysis 42: 3–21.
Page, Lindsay C., Stacey S. Kehoe, Benjamin L. Castleman, and Gumilang Aryo Sahadewo. 2019.
“More than Dollars for Scholars: The Impact of the Dell Scholars Program on College Access,
Persistence, and Degree Attainment.” Journal of Human Resources 54 (3): 683–725.
Perna, Laura W. 2006. “Studying College Access and Choice: A Proposed Conceptual Model.”
Pp. 99–157 in Higher Education: Handbook of theory and Research, edited by J. Smart and M.
Paulsen. Memphis, TN: Springer.
Perna, Laura W. 2008. “Understanding High School Students’ Willingness to Borrow to Pay
41
College Prices.” Research in Higher Education 49:589–606.
Phillips, Meredith. 2011. “Ethnic and Social Class Disparities in Academic Skills: Their Origins
and Consequences.” Pp. 7–24 in Diversity in American Higher Education: Toward a More
Comprehensive Approach, edited by L.M. Stulberg, and S.L. Weinberg. New York, NY:
Routledge.
Phillips, Meredith, and Sarah Reber. 2019. Report on the Implementation and Impacts of the V-
SOURCE College Access Program. https://www.sarahreber.com/vsource.
Phillips, Meredith, Kyo Yamashiro, and Thomas A. Jacobson. 2017. College Going in LAUSD:
An Analysis of College Enrollment, Persistence, and Completion Patterns. Research Report. Los
Angeles Education Research Institute.
Plank, Stephen B., and Will J. Jordan. 2001. “Effects of Information, Guidance, and Actions on
Postsecondary Destinations: A Study of Talent Loss.” American Educational Research Journal
38 (4): 947–79.
Robinson, Carly D., Monica G. Lee, Eric Dearing, and Todd Rogers. 2018. “Reducing Student
Absenteeism in the Early Grades by Targeting Parental Beliefs.” American Educational
Research Journal 55 (6): 1163–92.
Robinson, Karen Jeong, and Josipa Roksa. 2016. “Counselors, Information, and High School
College-Going Culture: Inequalities in the College Application Process.” Research in Higher
Education 57:845–68.
Roderick, Melissa, Vanessa Coca, and Jenny Nagaoka. 2011. “Potholes on the Road to College:
High School Effects in Shaping Urban Students’ Participation in College Application, Four-year
College Enrollment, and College Match.” Sociology of Education 84 (3): 178–211.
Rogers, Todd, and Avi Feller. 2018. “Reducing Student Absences at Scale by Targeting Parents’
42
Misbeliefs.” Nature Human Behaviour 2 (5): 335–42.
Schochet, Peter Z. 2008. Technical Methods Report: Guidelines for Multiple Testing in Impact
Evaluations. National Center for Education Evaluation and Regional Assistance, Institute of
Education Sciences.
Steinberg, Laurence, Sandra Graham, Lia O’Brien, Jennifer Woolard, Elizabeth Cauffman, and
Marie Banich. 2009. “Age Differences in Future Orientation and Delay Discounting.” Child
Development 80 (1): 28–44.
Stephan, Jennifer, and James E. Rosenbaum. 2013. “Can High Schools Reduce College Enrollment
Gaps With a New Counseling Model?” Educational Evaluation and Policy Analysis 35 (2): 200–
19.
Sullivan, Zach, Benjamin L. Castleman, and Eric Bettinger. 2019. “College Advising at a National
Scale: Experimental Evidence from the CollegePoint Initiative.” Annenberg Institute at Brown
University Working Paper.
Webb, Eugene J., Donald T. Campbell, Richard D. Schwartz, and Lee Sechrest. 1966. Unobtrusive
Measures. Chicago, IL: Rand McNally.
Westfall, Peter H., and S. Stanley Young. 1993. Resampling-Based Multiple Testing: Examples
and Methods for p-Value Adjustment. Hoboken, NJ: John Wiley & Sons.
Wiederspan, Mark. 2019. “Impact of Verification on Iowa FAFSA Filers.” Iowa College Aid
Policy Brief No. 19-01.
York, Benjamin N., Susanna Loeb, and Christopher Doss. 2019. “One Step at a Time: The Effects
of an Early Literacy Text-Messaging Program for Parents of Preschoolers.” Journal of Human
Resources 54 (3): 537–66.
43
Zizzo, Daniel John. 2010. “Experimenter Demand Effects in Economic
Experiments.” Experimental Economics 13 (1): 75–98.
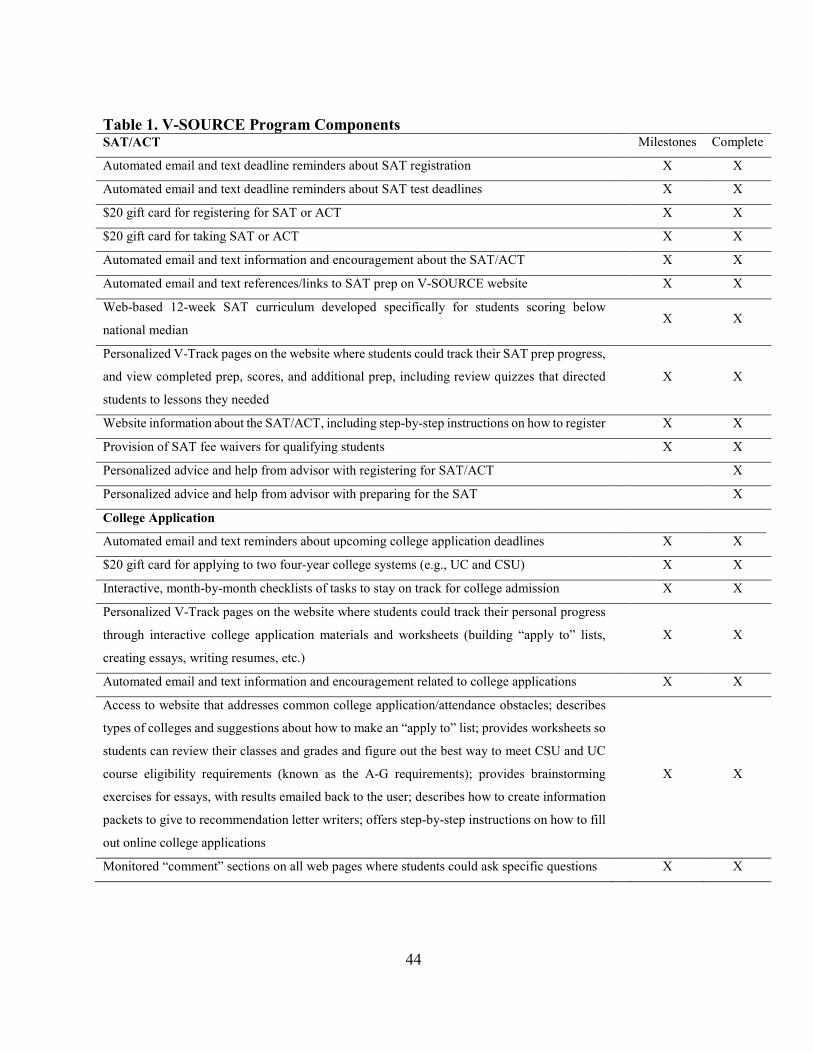
44
Table 1. V-SOURCE Program Components SAT/ACT Milestones Complete
Automated email and text deadline reminders about SAT registration X X
Automated email and text deadline reminders about SAT test deadlines X X
$20 gift card for registering for SAT or ACT X X
$20 gift card for taking SAT or ACT X X
Automated email and text information and encouragement about the SAT/ACT X X
Automated email and text references/links to SAT prep on V-SOURCE website X X
Web-based 12-week SAT curriculum developed specifically for students scoring below
national median X X
Personalized V-Track pages on the website where students could track their SAT prep progress,
and view completed prep, scores, and additional prep, including review quizzes that directed
students to lessons they needed
X X
Website information about the SAT/ACT, including step-by-step instructions on how to register X X
Provision of SAT fee waivers for qualifying students X X
Personalized advice and help from advisor with registering for SAT/ACT X
Personalized advice and help from advisor with preparing for the SAT X
College Application
Automated email and text reminders about upcoming college application deadlines X X
$20 gift card for applying to two four-year college systems (e.g., UC and CSU) X X
Interactive, month-by-month checklists of tasks to stay on track for college admission X X
Personalized V-Track pages on the website where students could track their personal progress
through interactive college application materials and worksheets (building “apply to” lists,
creating essays, writing resumes, etc.)
X X
Automated email and text information and encouragement related to college applications X X
Access to website that addresses common college application/attendance obstacles; describes
types of colleges and suggestions about how to make an “apply to” list; provides worksheets so
students can review their classes and grades and figure out the best way to meet CSU and UC
course eligibility requirements (known as the A-G requirements); provides brainstorming
exercises for essays, with results emailed back to the user; describes how to create information
packets to give to recommendation letter writers; offers step-by-step instructions on how to fill
out online college applications
X X
Monitored “comment” sections on all web pages where students could ask specific questions X X
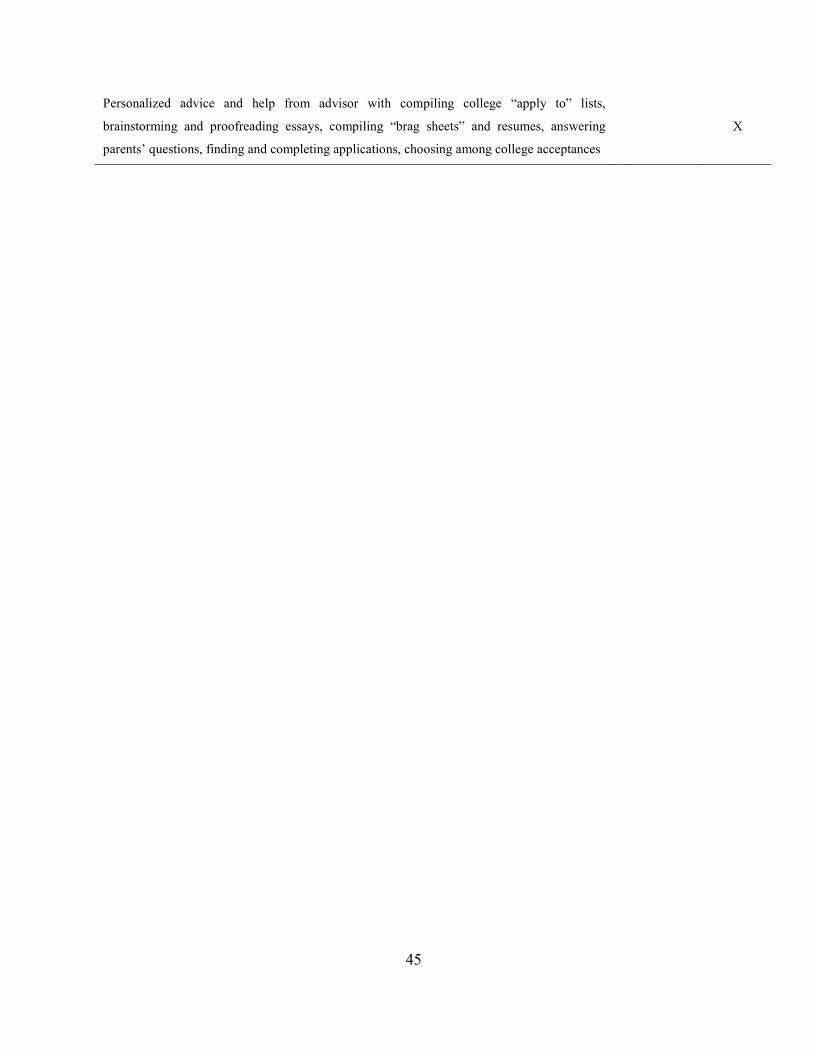
45
Personalized advice and help from advisor with compiling college “apply to” lists,
brainstorming and proofreading essays, compiling “brag sheets” and resumes, answering
parents’ questions, finding and completing applications, choosing among college acceptances
X
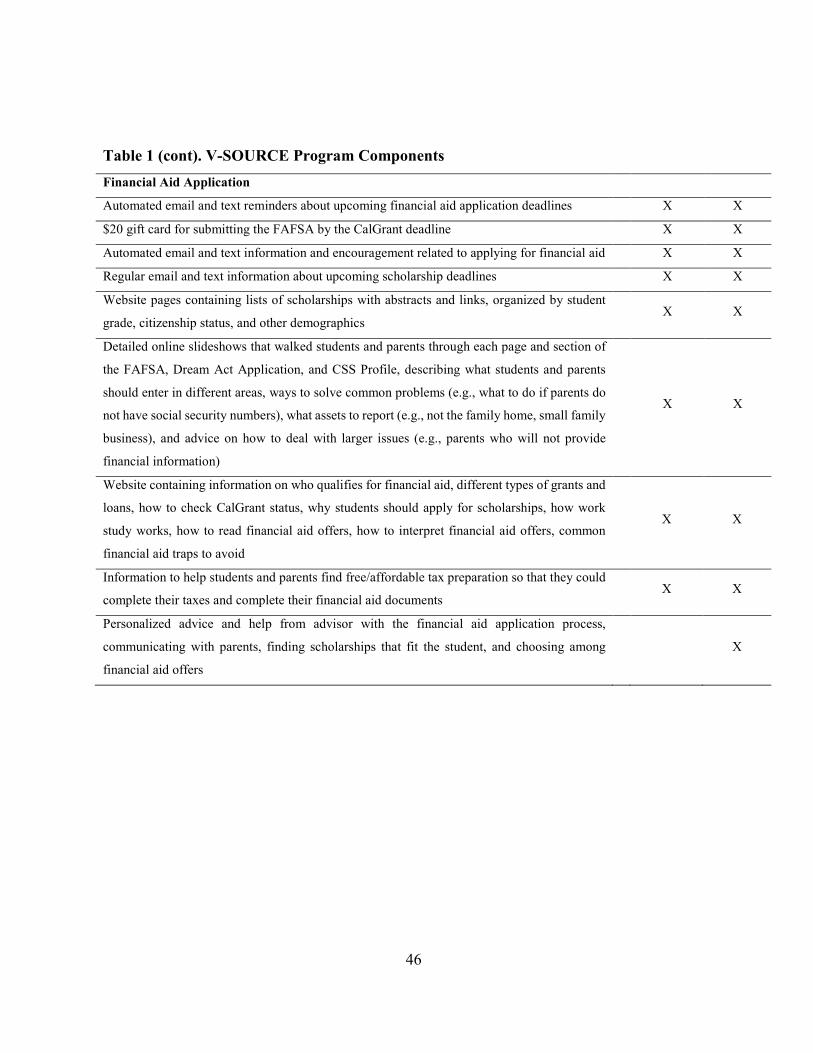
46
Table 1 (cont). V-SOURCE Program Components
Financial Aid Application
Automated email and text reminders about upcoming financial aid application deadlines X X
$20 gift card for submitting the FAFSA by the CalGrant deadline X X
Automated email and text information and encouragement related to applying for financial aid X X
Regular email and text information about upcoming scholarship deadlines X X
Website pages containing lists of scholarships with abstracts and links, organized by student
grade, citizenship status, and other demographics X X
Detailed online slideshows that walked students and parents through each page and section of
the FAFSA, Dream Act Application, and CSS Profile, describing what students and parents
should enter in different areas, ways to solve common problems (e.g., what to do if parents do
not have social security numbers), what assets to report (e.g., not the family home, small family
business), and advice on how to deal with larger issues (e.g., parents who will not provide
financial information)
X X
Website containing information on who qualifies for financial aid, different types of grants and
loans, how to check CalGrant status, why students should apply for scholarships, how work
study works, how to read financial aid offers, how to interpret financial aid offers, common
financial aid traps to avoid
X X
Information to help students and parents find free/affordable tax preparation so that they could
complete their taxes and complete their financial aid documents X X
Personalized advice and help from advisor with the financial aid application process,
communicating with parents, finding scholarships that fit the student, and choosing among
financial aid offers
X
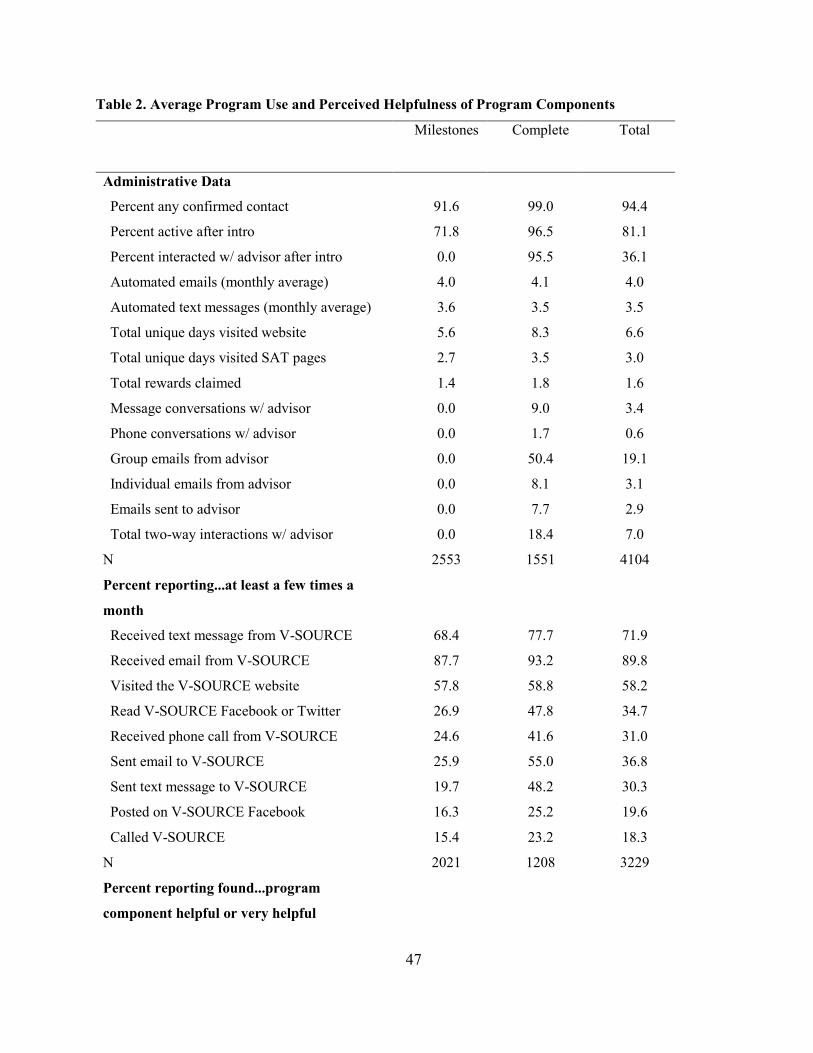
47
Table 2. Average Program Use and Perceived Helpfulness of Program Components
Milestones Complete Total
Administrative Data
Percent any confirmed contact 91.6 99.0 94.4
Percent active after intro 71.8 96.5 81.1
Percent interacted w/ advisor after intro 0.0 95.5 36.1
Automated emails (monthly average) 4.0 4.1 4.0
Automated text messages (monthly average) 3.6 3.5 3.5
Total unique days visited website 5.6 8.3 6.6
Total unique days visited SAT pages 2.7 3.5 3.0
Total rewards claimed 1.4 1.8 1.6
Message conversations w/ advisor 0.0 9.0 3.4
Phone conversations w/ advisor 0.0 1.7 0.6
Group emails from advisor 0.0 50.4 19.1
Individual emails from advisor 0.0 8.1 3.1
Emails sent to advisor 0.0 7.7 2.9
Total two-way interactions w/ advisor 0.0 18.4 7.0
N 2553 1551 4104
Percent reporting...at least a few times a
month
Received text message from V-SOURCE 68.4 77.7 71.9
Received email from V-SOURCE 87.7 93.2 89.8
Visited the V-SOURCE website 57.8 58.8 58.2
Read V-SOURCE Facebook or Twitter 26.9 47.8 34.7
Received phone call from V-SOURCE 24.6 41.6 31.0
Sent email to V-SOURCE 25.9 55.0 36.8
Sent text message to V-SOURCE 19.7 48.2 30.3
Posted on V-SOURCE Facebook 16.3 25.2 19.6
Called V-SOURCE 15.4 23.2 18.3
N 2021 1208 3229
Percent reporting found...program
component helpful or very helpful
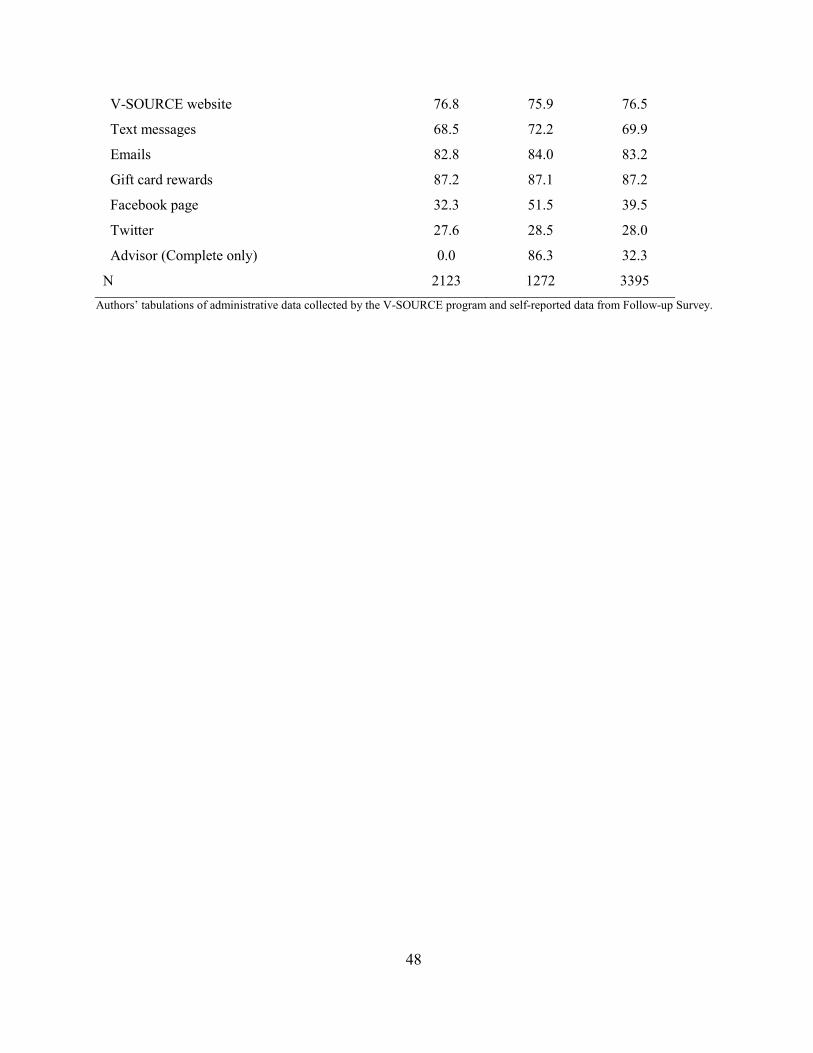
48
V-SOURCE website 76.8 75.9 76.5
Text messages 68.5 72.2 69.9
Emails 82.8 84.0 83.2
Gift card rewards 87.2 87.1 87.2
Facebook page 32.3 51.5 39.5
Twitter 27.6 28.5 28.0
Advisor (Complete only) 0.0 86.3 32.3
N 2123 1272 3395 Authors’ tabulations of administrative data collected by the V-SOURCE program and self-reported data from Follow-up Survey.
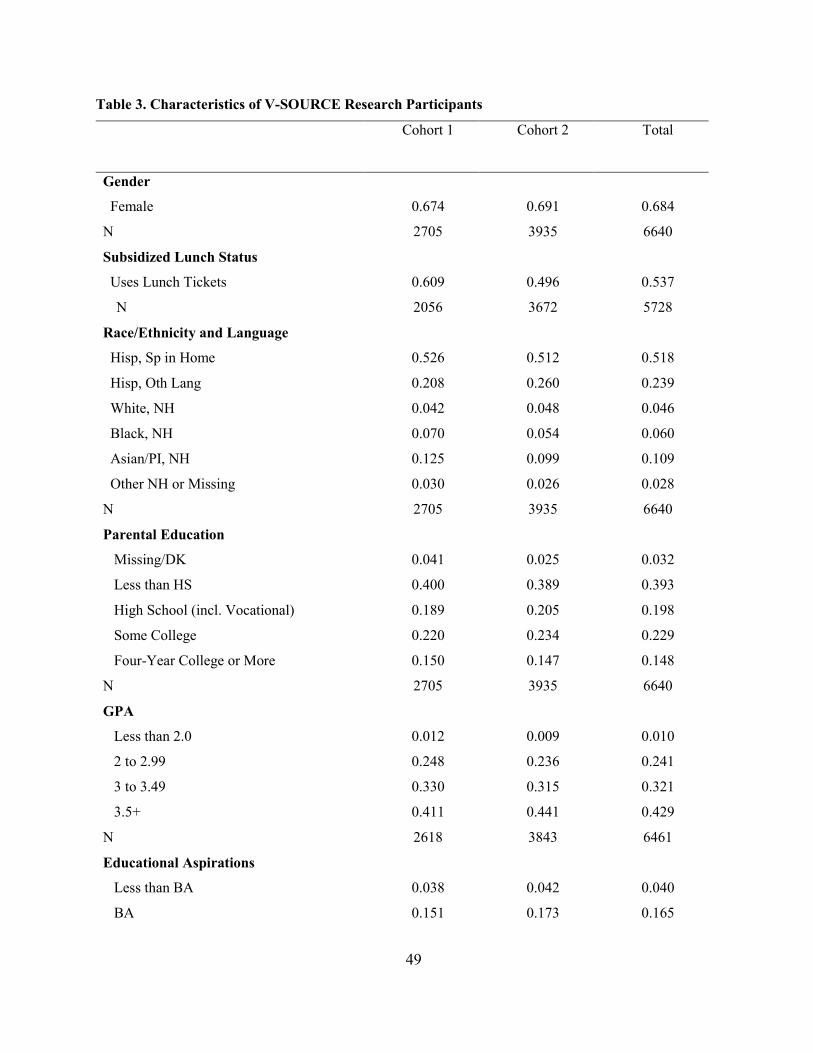
49
Table 3. Characteristics of V-SOURCE Research Participants
Cohort 1 Cohort 2 Total
Gender
Female 0.674 0.691 0.684
N 2705 3935 6640
Subsidized Lunch Status
Uses Lunch Tickets 0.609 0.496 0.537
N 2056 3672 5728
Race/Ethnicity and Language
Hisp, Sp in Home 0.526 0.512 0.518
Hisp, Oth Lang 0.208 0.260 0.239
White, NH 0.042 0.048 0.046
Black, NH 0.070 0.054 0.060
Asian/PI, NH 0.125 0.099 0.109
Other NH or Missing 0.030 0.026 0.028
N 2705 3935 6640
Parental Education
Missing/DK 0.041 0.025 0.032
Less than HS 0.400 0.389 0.393
High School (incl. Vocational) 0.189 0.205 0.198
Some College 0.220 0.234 0.229
Four-Year College or More 0.150 0.147 0.148
N 2705 3935 6640
GPA
Less than 2.0 0.012 0.009 0.010
2 to 2.99 0.248 0.236 0.241
3 to 3.49 0.330 0.315 0.321
3.5+ 0.411 0.441 0.429
N 2618 3843 6461
Educational Aspirations
Less than BA 0.038 0.042 0.040
BA 0.151 0.173 0.165
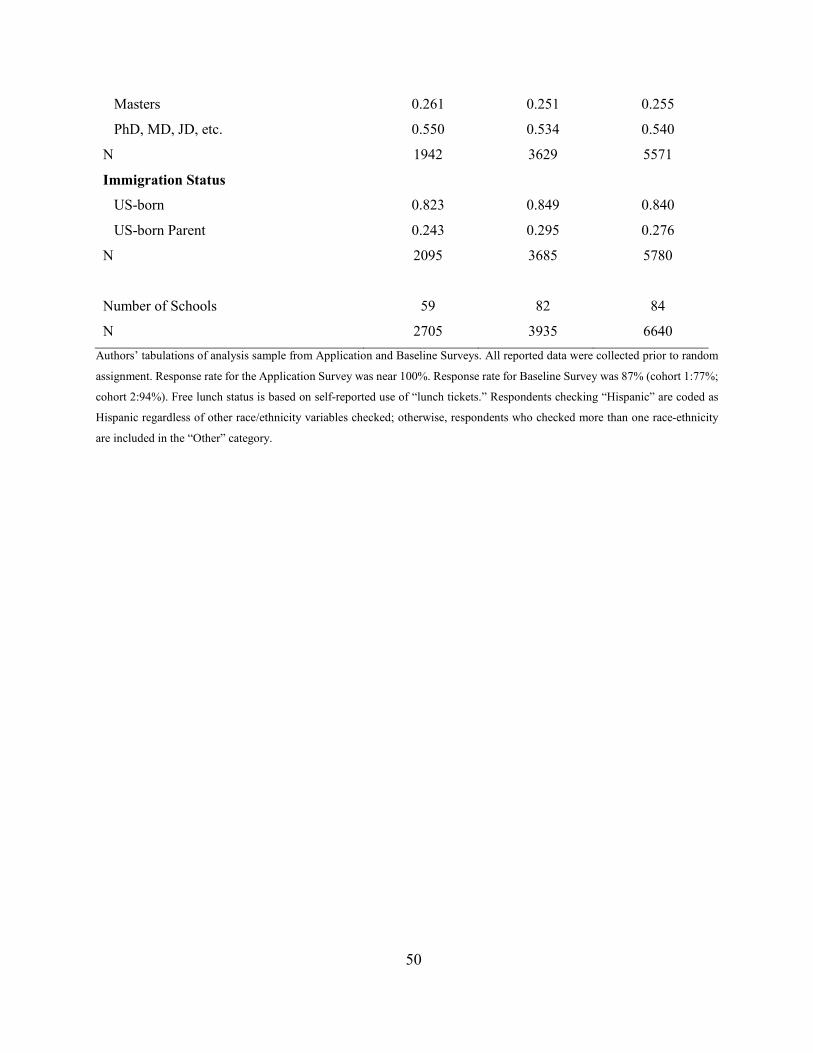
50
Masters 0.261 0.251 0.255
PhD, MD, JD, etc. 0.550 0.534 0.540
N 1942 3629 5571
Immigration Status
US-born 0.823 0.849 0.840
US-born Parent 0.243 0.295 0.276
N 2095 3685 5780
Number of Schools 59 82 84
N 2705 3935 6640 Authors’ tabulations of analysis sample from Application and Baseline Surveys. All reported data were collected prior to random
assignment. Response rate for the Application Survey was near 100%. Response rate for Baseline Survey was 87% (cohort 1:77%;
cohort 2:94%). Free lunch status is based on self-reported use of “lunch tickets.” Respondents checking “Hispanic” are coded as
Hispanic regardless of other race/ethnicity variables checked; otherwise, respondents who checked more than one race-ethnicity
are included in the “Other” category.
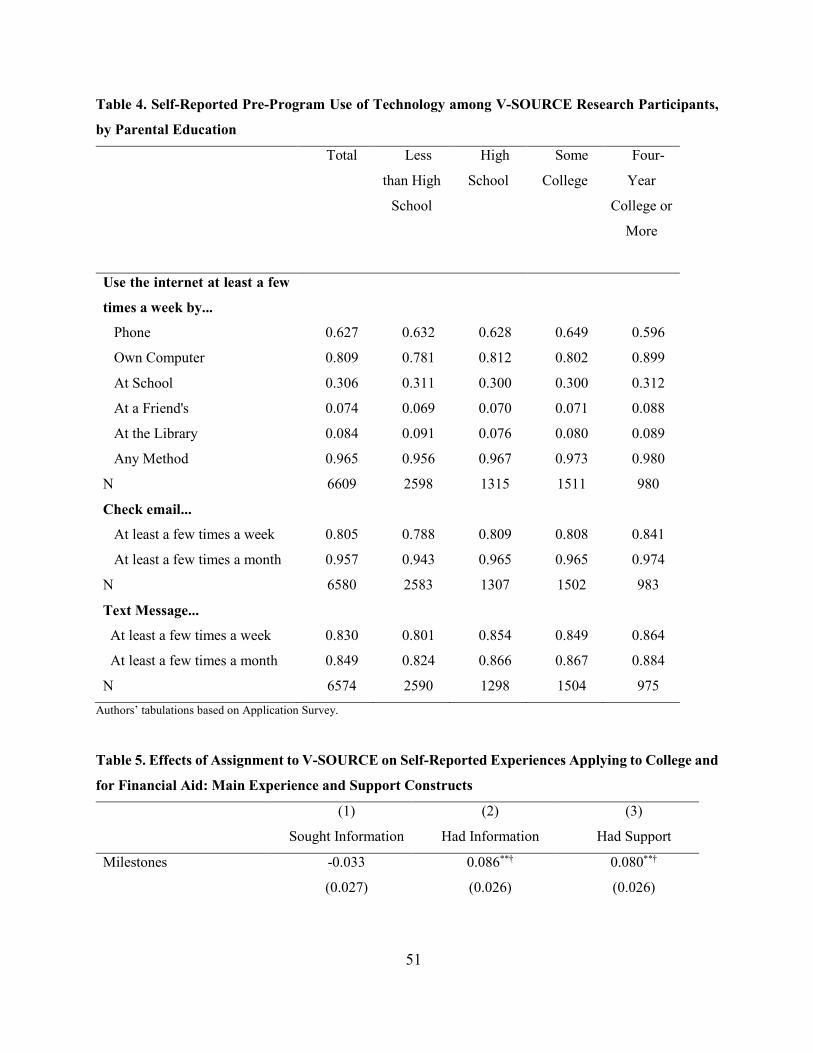
51
Table 4. Self-Reported Pre-Program Use of Technology among V-SOURCE Research Participants,
by Parental Education
Total Less
than High
School
High
School
Some
College
Four-
Year
College or
More
Use the internet at least a few
times a week by...
Phone 0.627 0.632 0.628 0.649 0.596
Own Computer 0.809 0.781 0.812 0.802 0.899
At School 0.306 0.311 0.300 0.300 0.312
At a Friend's 0.074 0.069 0.070 0.071 0.088
At the Library 0.084 0.091 0.076 0.080 0.089
Any Method 0.965 0.956 0.967 0.973 0.980
N 6609 2598 1315 1511 980
Check email...
At least a few times a week 0.805 0.788 0.809 0.808 0.841
At least a few times a month 0.957 0.943 0.965 0.965 0.974
N 6580 2583 1307 1502 983
Text Message...
At least a few times a week 0.830 0.801 0.854 0.849 0.864
At least a few times a month 0.849 0.824 0.866 0.867 0.884
N 6574 2590 1298 1504 975 Authors’ tabulations based on Application Survey.
Table 5. Effects of Assignment to V-SOURCE on Self-Reported Experiences Applying to College and
for Financial Aid: Main Experience and Support Constructs
(1) (2) (3)
Sought Information Had Information Had Support
Milestones -0.033 0.086**† 0.080**†
(0.027) (0.026) (0.026)
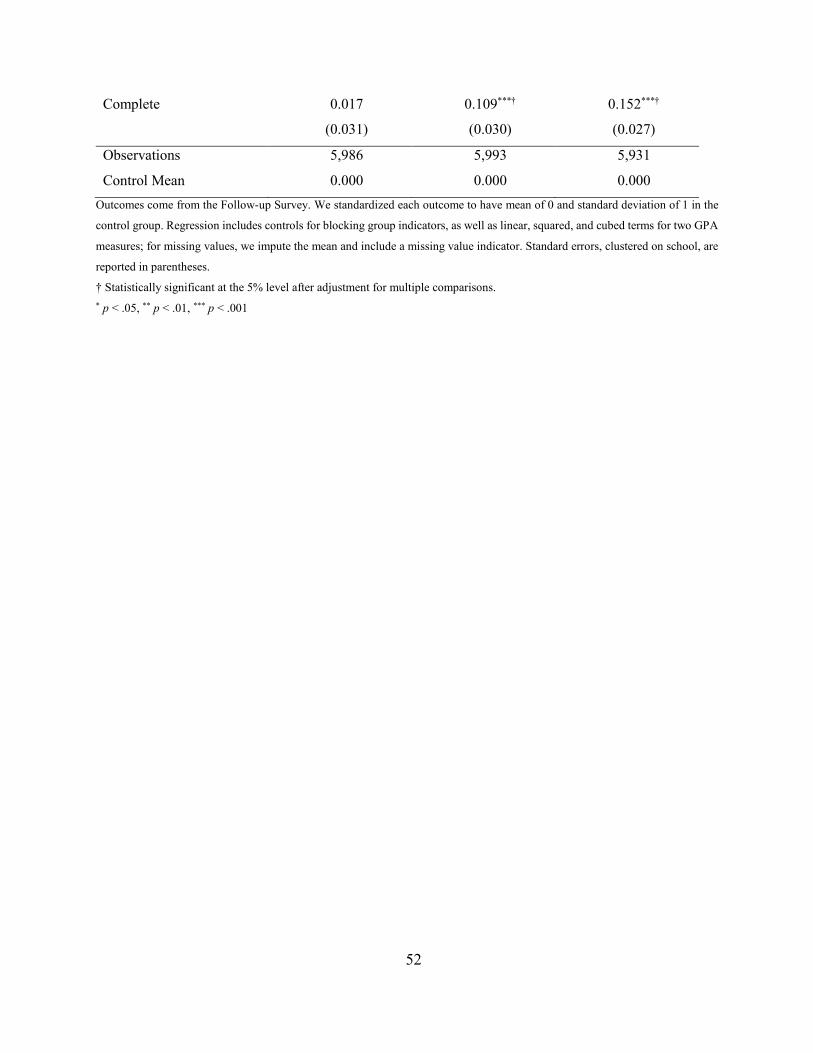
52
Complete 0.017 0.109***† 0.152***†
(0.031) (0.030) (0.027)
Observations 5,986 5,993 5,931
Control Mean 0.000 0.000 0.000 Outcomes come from the Follow-up Survey. We standardized each outcome to have mean of 0 and standard deviation of 1 in the
control group. Regression includes controls for blocking group indicators, as well as linear, squared, and cubed terms for two GPA
measures; for missing values, we impute the mean and include a missing value indicator. Standard errors, clustered on school, are
reported in parentheses.
† Statistically significant at the 5% level after adjustment for multiple comparisons. * p < .05, ** p < .01, *** p < .001
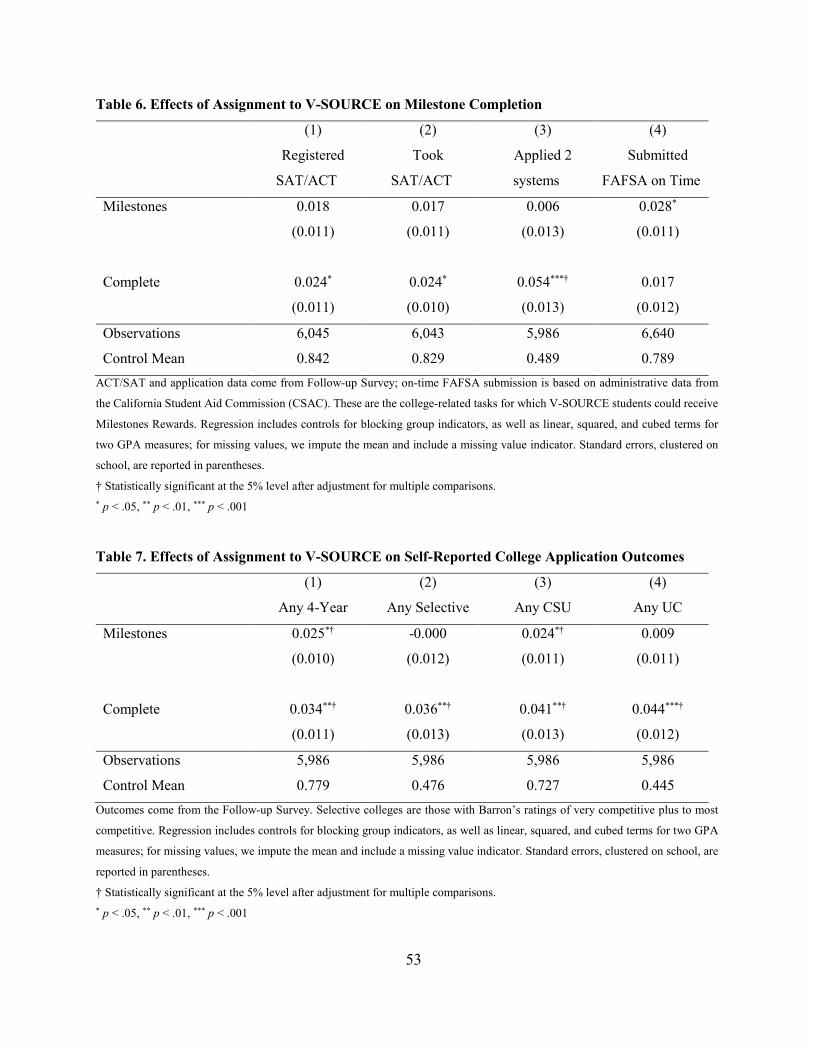
53
Table 6. Effects of Assignment to V-SOURCE on Milestone Completion
(1) (2) (3) (4)
Registered
SAT/ACT
Took
SAT/ACT
Applied 2
systems
Submitted
FAFSA on Time
Milestones 0.018 0.017 0.006 0.028*
(0.011) (0.011) (0.013) (0.011)
Complete 0.024* 0.024* 0.054***† 0.017
(0.011) (0.010) (0.013) (0.012)
Observations 6,045 6,043 5,986 6,640
Control Mean 0.842 0.829 0.489 0.789 ACT/SAT and application data come from Follow-up Survey; on-time FAFSA submission is based on administrative data from
the California Student Aid Commission (CSAC). These are the college-related tasks for which V-SOURCE students could receive
Milestones Rewards. Regression includes controls for blocking group indicators, as well as linear, squared, and cubed terms for
two GPA measures; for missing values, we impute the mean and include a missing value indicator. Standard errors, clustered on
school, are reported in parentheses.
† Statistically significant at the 5% level after adjustment for multiple comparisons. * p < .05, ** p < .01, *** p < .001
Table 7. Effects of Assignment to V-SOURCE on Self-Reported College Application Outcomes
(1) (2) (3) (4)
Any 4-Year Any Selective Any CSU Any UC
Milestones 0.025*† -0.000 0.024*† 0.009
(0.010) (0.012) (0.011) (0.011)
Complete 0.034**† 0.036**† 0.041**† 0.044***†
(0.011) (0.013) (0.013) (0.012)
Observations 5,986 5,986 5,986 5,986
Control Mean 0.779 0.476 0.727 0.445 Outcomes come from the Follow-up Survey. Selective colleges are those with Barron’s ratings of very competitive plus to most
competitive. Regression includes controls for blocking group indicators, as well as linear, squared, and cubed terms for two GPA
measures; for missing values, we impute the mean and include a missing value indicator. Standard errors, clustered on school, are
reported in parentheses.
† Statistically significant at the 5% level after adjustment for multiple comparisons. * p < .05, ** p < .01, *** p < .001
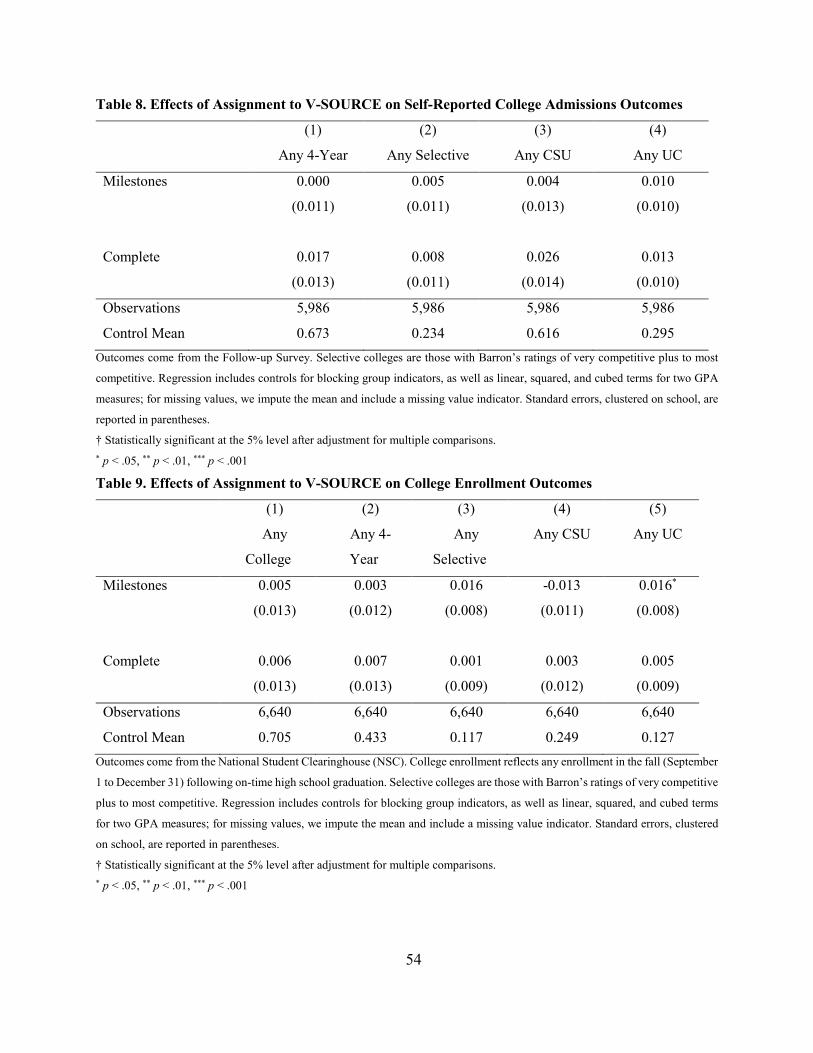
54
Table 8. Effects of Assignment to V-SOURCE on Self-Reported College Admissions Outcomes
(1) (2) (3) (4)
Any 4-Year Any Selective Any CSU Any UC
Milestones 0.000 0.005 0.004 0.010
(0.011) (0.011) (0.013) (0.010)
Complete 0.017 0.008 0.026 0.013
(0.013) (0.011) (0.014) (0.010)
Observations 5,986 5,986 5,986 5,986
Control Mean 0.673 0.234 0.616 0.295 Outcomes come from the Follow-up Survey. Selective colleges are those with Barron’s ratings of very competitive plus to most
competitive. Regression includes controls for blocking group indicators, as well as linear, squared, and cubed terms for two GPA
measures; for missing values, we impute the mean and include a missing value indicator. Standard errors, clustered on school, are
reported in parentheses.
† Statistically significant at the 5% level after adjustment for multiple comparisons. * p < .05, ** p < .01, *** p < .001
Table 9. Effects of Assignment to V-SOURCE on College Enrollment Outcomes
(1) (2) (3) (4) (5)
Any
College
Any 4-
Year
Any
Selective
Any CSU Any UC
Milestones 0.005 0.003 0.016 -0.013 0.016*
(0.013) (0.012) (0.008) (0.011) (0.008)
Complete 0.006 0.007 0.001 0.003 0.005
(0.013) (0.013) (0.009) (0.012) (0.009)
Observations 6,640 6,640 6,640 6,640 6,640
Control Mean 0.705 0.433 0.117 0.249 0.127 Outcomes come from the National Student Clearinghouse (NSC). College enrollment reflects any enrollment in the fall (September
1 to December 31) following on-time high school graduation. Selective colleges are those with Barron’s ratings of very competitive
plus to most competitive. Regression includes controls for blocking group indicators, as well as linear, squared, and cubed terms
for two GPA measures; for missing values, we impute the mean and include a missing value indicator. Standard errors, clustered
on school, are reported in parentheses.
† Statistically significant at the 5% level after adjustment for multiple comparisons. * p < .05, ** p < .01, *** p < .001
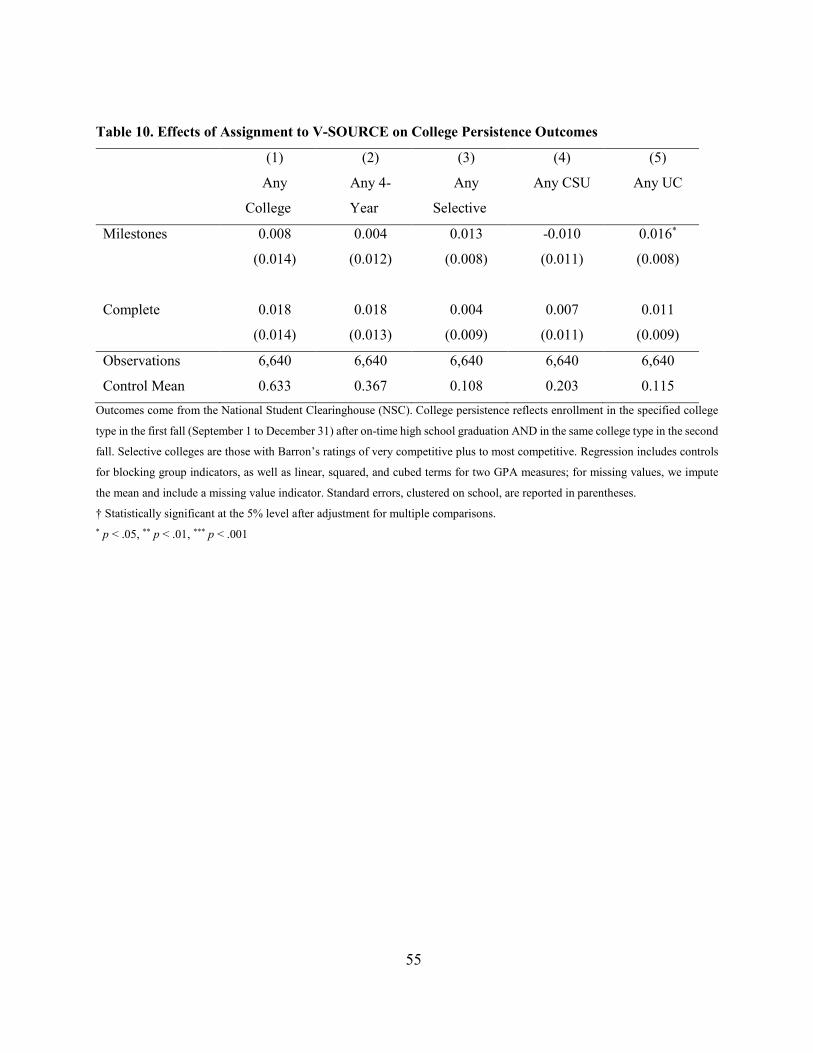
55
Table 10. Effects of Assignment to V-SOURCE on College Persistence Outcomes
(1) (2) (3) (4) (5)
Any
College
Any 4-
Year
Any
Selective
Any CSU Any UC
Milestones 0.008 0.004 0.013 -0.010 0.016*
(0.014) (0.012) (0.008) (0.011) (0.008)
Complete 0.018 0.018 0.004 0.007 0.011
(0.014) (0.013) (0.009) (0.011) (0.009)
Observations 6,640 6,640 6,640 6,640 6,640
Control Mean 0.633 0.367 0.108 0.203 0.115 Outcomes come from the National Student Clearinghouse (NSC). College persistence reflects enrollment in the specified college
type in the first fall (September 1 to December 31) after on-time high school graduation AND in the same college type in the second
fall. Selective colleges are those with Barron’s ratings of very competitive plus to most competitive. Regression includes controls
for blocking group indicators, as well as linear, squared, and cubed terms for two GPA measures; for missing values, we impute
the mean and include a missing value indicator. Standard errors, clustered on school, are reported in parentheses.
† Statistically significant at the 5% level after adjustment for multiple comparisons. * p < .05, ** p < .01, *** p < .001


