Embed Size (px)
Citation preview
ORIGINAL PAPER
Does the risk of encountering lions influence Africanherbivore behaviour at waterholes?
Marion Valeix & Hervé Fritz & Andrew J. Loveridge &
Zeke Davidson & Jane E. Hunt & Felix Murindagomo &
David W. Macdonald
Received: 24 November 2008 /Revised: 18 February 2009 /Accepted: 12 March 2009 /Published online: 31 March 2009# Springer-Verlag 2009
Abstract A central question in the study of predator–preyrelationships is to what extent prey behaviour is determinedby avoidance of predators. Here, we test whether the long-term risk of encountering lions and the presence of lions inthe vicinity influence the behaviour of large Africanherbivores at waterholes through avoidance of high-riskareas, increases in group size, changes in temporal niche orchanges in the time spent in waterhole areas. In HwangeNational Park, Zimbabwe, we monitored waterholes tostudy the behaviour of nine herbivore species underdifferent risks of encountering lions. We radio-collared 26lions in the study area which provided the opportunity tomonitor whether lions were present during observationsessions and to map longer-term seasonal landscapes of riskof encountering lions. Our results show that the preferred
prey species for lions (buffalo, kudu and giraffe) avoidedrisky waterholes. Group size increased as encounter riskincreased for only two species (wildebeest and zebra), butthis effect was not strong. Interestingly, buffalo avoided thehours of the day which are dangerous when the long-termand short-term risks of encountering lions were high, andall species showed avoidance of waterhole use at nighttimes when lions were in the vicinity. This illustrates wellhow prey can make temporal adjustments to avoiddangerous periods coinciding with predator hunting. Addi-tionally, many herbivores spent more time accessing waterto drink when the long- and short-term risks of encounter-ing lions were high, and they showed longer potentialdrinking time when the long-term risk of encountering lionswas high, suggesting higher levels of vigilance. This studyillustrates the diversity of behavioural adjustments to therisk of encountering a predator and how prey responddifferently to temporal variations in this risk.
Keywords Buffalo . Hwange National Park .
Landscape of risk . Predation risk .
Predator–prey relationships . Temporal niche
Introduction
To reduce the risk of predation, prey make behaviouraldecisions to decrease the probabilities of encounter, attackand capture, and the time spent vulnerable to predation(Lima and Dill 1990). The two major and most studiedbehavioural adjustments are group formation and vigilance(Lima 1995; Roberts 1996). Indeed, compared to solitaryanimals, individuals within a group benefit from not onlythe greater number of individuals available to scan thesurroundings and thus to detect an approaching predator
Behav Ecol Sociobiol (2009) 63:1483–1494DOI 10.1007/s00265-009-0760-3
Communicated by M. Festa-Bianchet
M. Valeix :A. J. Loveridge : Z. Davidson : J. E. Hunt :D. W. MacdonaldWildlife Conservation Research Unit,Zoology Department, Oxford University,Tubney House,Abingdon OX13 5QL, UK
F. MurindagomoZimbabwe Parks and Wildlife Management Authority,P.O. Box CY140, Causeway,Harare, Zimbabwe
M. Valeix (*) :H. FritzUniversité de Lyon, CNRS Université ClaudeBernard Lyon 1 UMR 5558,Laboratoire Biométrie et Biologie Evolutive,Bât Gregor Mendel 43 Bd du 11 novembre 1918,69622 Villeurbanne cedex, Francee-mail: [email protected]
(the “many eyes effect”—Pulliam 1973) but also a lowerrisk of being preyed upon because of a “dilution effect”(Hamilton 1971; Dehn 1990). Additionally, increasedvigilance allows earlier detection of an approachingpredator and is a common and important response topredation risk (Underwood 1982; Hunter and Skinner1998; Liley and Creel 2008). However, behaviouralresponses to predation are many and diverse. For example,they include avoidance of risky environments and spatialredistribution of animals (Ripple and Beschta 2004; Valeixet al. 2009), and selection of specific habitat types andfeatures (Creel et al. 2005). Additionally, prey may maketemporal adjustments to avoid dangerous periods coincid-ing with predator hunting (Fenn and Macdonald 1995; Rothand Lima 2007).
All these behavioural adjustments to predation may beparticularly prevalent around scarce and patchily distributedresources, around which prey have no option but toaggregate, and consequently by which predators are likelyto be attracted. In arid and semi-arid savannas, surface-water resources become depleted as the dry seasonprogresses, resulting in scarcity and consequently in highlevels of animal aggregation (Thrash et al. 1995). In suchecosystems, the distribution of herbivores in the landscapeis largely influenced by the distribution of surface water inthe dry season (Valeix et al. 2009), and predators, such asthe African lion (Panthera leo), thus have a greater chanceof encountering potential prey at these water sources.Indeed, lions are known to ambush their prey in thevegetation surrounding water sources (Schaller 1972;Hopcraft et al. 2005). Consequently, it would be expectedthat herbivores should be particularly alert in such areas,and employ behavioural adjustments to minimise the risksof predation.
It seems likely that it would be adaptive for prey to varytheir behaviour in accordance with perceptions of risk atmultiple temporal scales. Recently, elk (Cervus elaphus)herd size was found to increase as distance to protectivecover increased (as expected from the “many eyes” and“dilution” effects). However, this only occurred on dayswhen wolves (Canis lupus) were absent. Interestingly,when wolves were present, herd size remained small at alldistances from cover (Creel and Winnie 2005). Thesefindings strongly suggest that prey respond differently totemporal variations in the risk of predation.
Whereas the present study focuses on the responses ofprey to the risk of encountering a predator, predators alsorespond to prey distribution and behaviour. Large mamma-lian prey and predators thus respond to one another inbehaviourally sophisticated ways since the predatorattempts to maximise its success rate on prey that activelyavoid predation (e.g. van Balaan and Sabelis 1993). Owingto the reciprocal evolutionary effects that predators and
prey have on one other, predator–prey relationships areextremely complex and often considered in the context ofgame theory (Brown et al. 1999).
Here, we studied the influence of long-term and short-term risks of encountering lions on the behaviour of severallarge African herbivore species at waterholes in HwangeNational Park, Zimbabwe. We used GPS radio collars thatrecorded the location of lions to map a long-term landscapeof encounter risk, which can be compared to a cumulativeunderstanding of encounter risk, and to test whetherherbivore behaviour at a waterhole was influenced by thelong-term probability of encountering lions. We also usedGPS radio-collar data to test whether herbivore behaviourchanged on days when lions were locally present or absent.We tested four hypotheses: (1) that herbivores avoid thewaterholes located in risky areas or where lions are present;(2) because lions are largely nocturnal (Schaller 1972),high-risk hours encompass night as well as dawn and duskfor herbivores. Herbivores should thus avoid use of water-holes during such dangerous hours when the probability ofencountering lions is high or when lions are in the vicinity;(3) groups are larger in riskier areas or when lions are in thevicinity; and (4) herbivores are more vigilant under highencounter risk and consequently are expected to spendlonger time approaching water in riskier areas or when lionsare in the vicinity.
Our study was carried out during 2 years of contrastedrainfall (a normal rainy season and a drought), whichprovided an opportunity to investigate the trade-off betweenexposure to risk of predation by lions and necessity toaccess water. In Hwange National Park, African buffalo(Syncerus caffer) is the most frequently taken prey species(making up 30–35% of lion kills, whereas it represents only2% of herbivore groups and 13% of individuals encoun-tered), followed by greater kudu (Tragelaphus strepsiceros)(11–24% of lions kills, whereas it represents only 10% ofherbivore groups and 8% of individuals encountered), andgiraffe (Giraffa camelopardalis) (8–10% of lion kills,which is in proportion with its availability) (Loveridgeet al. 2007a). We therefore investigated whether thesepreferred prey species adjusted their behaviour more thanothers to the risk of encountering lions, or whether lionsselect these prey species specifically because they do notadjust their behaviour as much as other prey.
Materials and methods
Study site
Hwange National Park (HNP) covers c. 15,000 km2 ofsemi-arid dystrophic savanna in north-western Zimbabwe
1484 Behav Ecol Sociobiol (2009) 63:1483–1494
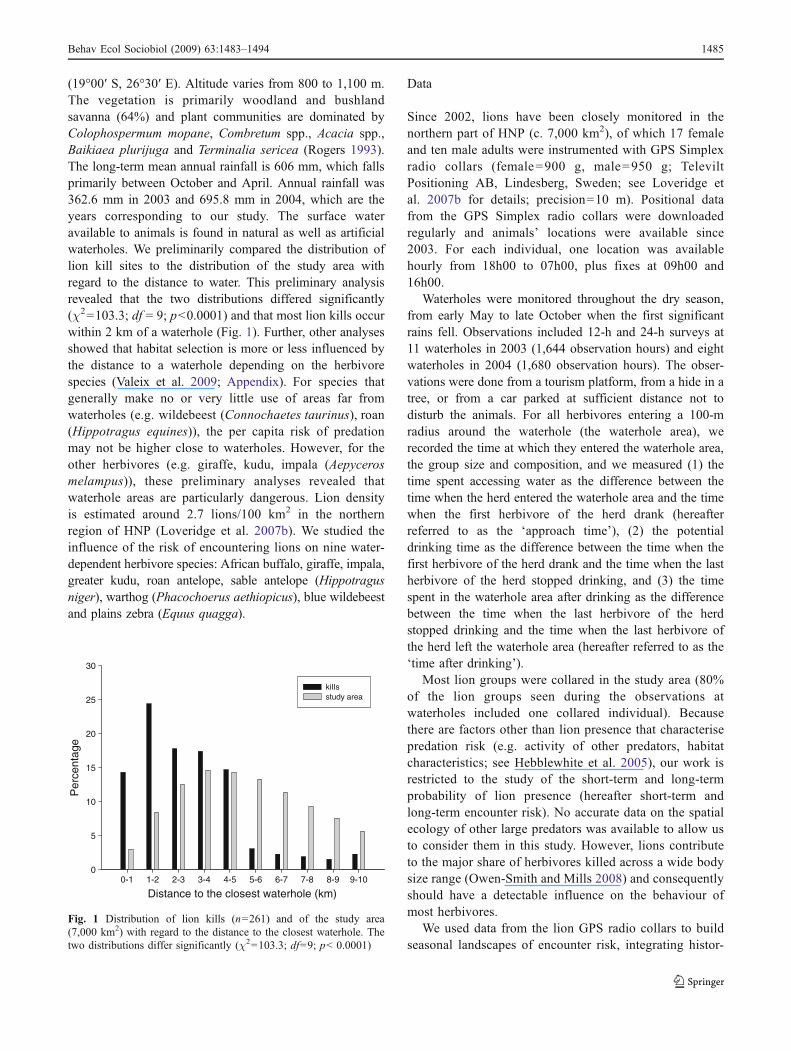
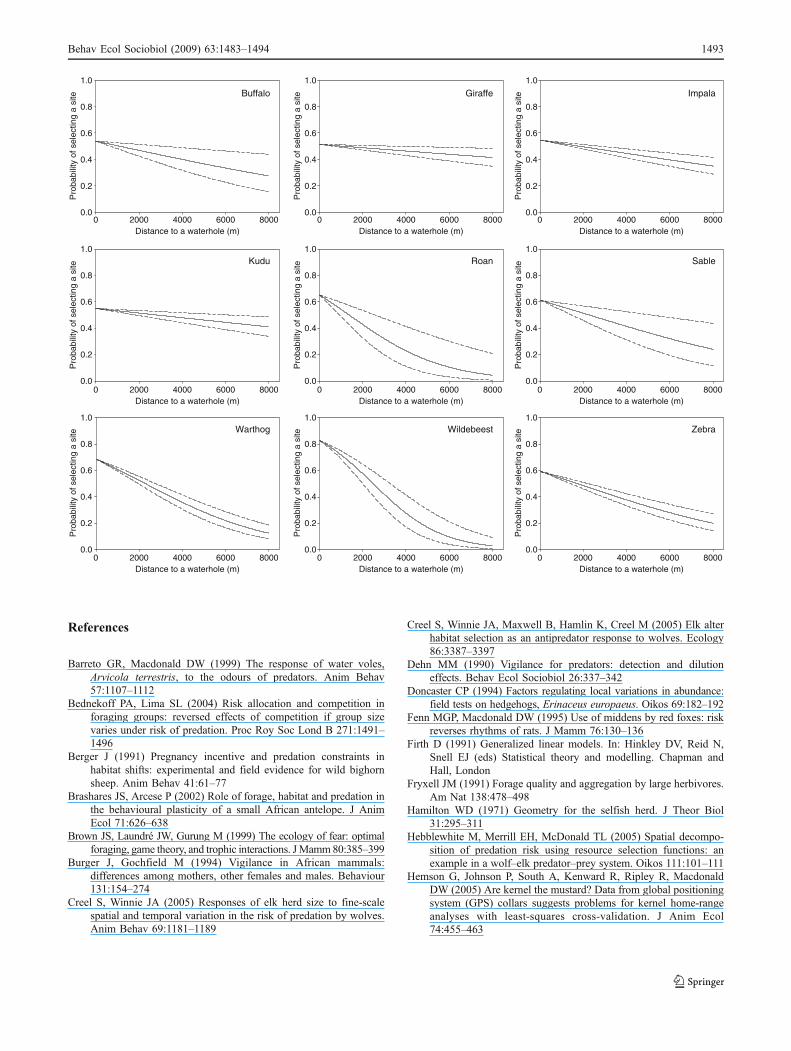
(19°00′ S, 26°30′ E). Altitude varies from 800 to 1,100 m.The vegetation is primarily woodland and bushlandsavanna (64%) and plant communities are dominated byColophospermum mopane, Combretum spp., Acacia spp.,Baikiaea plurijuga and Terminalia sericea (Rogers 1993).The long-term mean annual rainfall is 606 mm, which fallsprimarily between October and April. Annual rainfall was362.6 mm in 2003 and 695.8 mm in 2004, which are theyears corresponding to our study. The surface wateravailable to animals is found in natural as well as artificialwaterholes. We preliminarily compared the distribution oflion kill sites to the distribution of the study area withregard to the distance to water. This preliminary analysisrevealed that the two distributions differed significantly(χ2=103.3; df = 9; p<0.0001) and that most lion kills occurwithin 2 km of a waterhole (Fig. 1). Further, other analysesshowed that habitat selection is more or less influenced bythe distance to a waterhole depending on the herbivorespecies (Valeix et al. 2009; Appendix). For species thatgenerally make no or very little use of areas far fromwaterholes (e.g. wildebeest (Connochaetes taurinus), roan(Hippotragus equines)), the per capita risk of predationmay not be higher close to waterholes. However, for theother herbivores (e.g. giraffe, kudu, impala (Aepycerosmelampus)), these preliminary analyses revealed thatwaterhole areas are particularly dangerous. Lion densityis estimated around 2.7 lions/100 km2 in the northernregion of HNP (Loveridge et al. 2007b). We studied theinfluence of the risk of encountering lions on nine water-dependent herbivore species: African buffalo, giraffe, impala,greater kudu, roan antelope, sable antelope (Hippotragusniger), warthog (Phacochoerus aethiopicus), blue wildebeestand plains zebra (Equus quagga).
Data
Since 2002, lions have been closely monitored in thenorthern part of HNP (c. 7,000 km2), of which 17 femaleand ten male adults were instrumented with GPS Simplexradio collars (female=900 g, male=950 g; TeleviltPositioning AB, Lindesberg, Sweden; see Loveridge etal. 2007b for details; precision=10 m). Positional datafrom the GPS Simplex radio collars were downloadedregularly and animals’ locations were available since2003. For each individual, one location was availablehourly from 18h00 to 07h00, plus fixes at 09h00 and16h00.
Waterholes were monitored throughout the dry season,from early May to late October when the first significantrains fell. Observations included 12-h and 24-h surveys at11 waterholes in 2003 (1,644 observation hours) and eightwaterholes in 2004 (1,680 observation hours). The obser-vations were done from a tourism platform, from a hide in atree, or from a car parked at sufficient distance not todisturb the animals. For all herbivores entering a 100-mradius around the waterhole (the waterhole area), werecorded the time at which they entered the waterhole area,the group size and composition, and we measured (1) thetime spent accessing water as the difference between thetime when the herd entered the waterhole area and the timewhen the first herbivore of the herd drank (hereafterreferred to as the ‘approach time’), (2) the potentialdrinking time as the difference between the time when thefirst herbivore of the herd drank and the time when the lastherbivore of the herd stopped drinking, and (3) the timespent in the waterhole area after drinking as the differencebetween the time when the last herbivore of the herdstopped drinking and the time when the last herbivore ofthe herd left the waterhole area (hereafter referred to as the‘time after drinking’).
Most lion groups were collared in the study area (80%of the lion groups seen during the observations atwaterholes included one collared individual). Becausethere are factors other than lion presence that characterisepredation risk (e.g. activity of other predators, habitatcharacteristics; see Hebblewhite et al. 2005), our work isrestricted to the study of the short-term and long-termprobability of lion presence (hereafter short-term andlong-term encounter risk). No accurate data on the spatialecology of other large predators was available to allow usto consider them in this study. However, lions contributeto the major share of herbivores killed across a wide bodysize range (Owen-Smith and Mills 2008) and consequentlyshould have a detectable influence on the behaviour ofmost herbivores.
We used data from the lion GPS radio collars to buildseasonal landscapes of encounter risk, integrating histor-
Distance to the closest waterhole (km)0-1 1-2 2-3 3-4 4-5 5-6 6-7 7-8 8-9 9-10
Per
cent
age
0
5
10
15
20
25
30
kills study area
Fig. 1 Distribution of lion kills (n=261) and of the study area(7,000 km2) with regard to the distance to the closest waterhole. Thetwo distributions differ significantly (χ2=103.3; df=9; p< 0.0001)
Behav Ecol Sociobiol (2009) 63:1483–1494 1485
ical information on lion presence calculated over the past4 months. To build such landscape, we calculated theconsecutive 10% isopleths kernel, using the referencesmoothing factor href as recommended by Hemson et al.(2005), for each individual lion using Ranges 7 (version0.811, South and Kenward 2006). Where gaps in the dataset occurred, owing to poor satellite detection, we usedaveraged isopleths kernels over all the locations availablefor individuals who were confirmed to be alive andpresent in the area during the specified period (19% ofseasonal home ranges). We then approximated the prob-ability of a lion presence by 0.10/(Ai−Ai−1); with Ai thearea of the surface of isopleths i and 0.10 because 10% ofall locations are located between two consecutive iso-pleths. For each waterhole, the value derived from theseasonal landscape of encounter risk was used as a proxyfor long-term risk of encountering lions (see also Valeix etal. 2009).
Short-term encounter risk was quantified by presence oflions within 2 km of the study waterhole (herbivores arelikely to react to lion presence in such radius; Valeix et al.2009) in the preceding 24 h, as revealed by fine-scalespatio-temporal data collected by the lion GPS radio collarsand by direct observations during the waterhole monitoring.We contrasted observation sessions characterised by ‘lionpresence’ and ‘lion not detected’, a conservative approachinsofar as the effects of any undetected lions will workagainst our hypotheses. The number of herbivore groups/individuals observed for each situation is provided inTable 1. Preliminary analyses revealed that group size andabundance of herbivores were significantly correlated forall study species (all p< 0.05).
Analyses
Use of waterholes: visit rate and group size
We first tested whether herbivores avoided visiting water-holes located in areas of high long-term encounter risk, byusing mixed models. For each species, we performed acovariance analysis on the number of groups and the numberof individuals counted per hour at a waterhole, withwaterhole identity as a random effect and with the long-term encounter risk as the fixed effect. Because the averagelong-term encounter risk was significantly higher in 2003than in 2004 (F1,171=16.13; p< 0.0001), the analyses wererun separately for each year to avoid any confounding effect.We also tested whether herbivores avoided waterholes whenlions were in the vicinity in the preceding 24 h by comparingthe number of groups and the number of individuals countedper hour at a waterhole depending on whether or not lionswere known to be present. We preliminarily tested forequality of variance between the two groups (lion presentand lion absent) and we used the pooled t statistics whenthere was equality of variance, and the Satterthwaite tstatistics when there was inequality of variance.
We finally tested whether group size changed as afunction of year, long-term encounter risk and the interac-tion between the presence of young and long-termencounter risk. We included the latter interaction becausethe vulnerability of young can influence the behaviour ofadults in their group (Berger 1991; Burger and Gochfield1994). All species group size data followed a Poissondistribution whereas zebra group size data followed askewed normal distribution. Consequently, for all speciesexcept zebra, we used generalised mixed models withwaterhole identity as a random effect, and for zebra weused linear mixed models (group sizes were log-transformed to meet normality requirements) with water-hole identity as a random factor. Statistical analyses wereperformed with SAS software (version 8.2), using MIXEDprocedure only for zebra and MIXED procedure with theGLIMMIX macro for Poisson distributed data, using a loglink function and correcting the models for over-dispersionby a scaling function: deviance−1 (Firth 1991) for all otherspecies. Backward step-wise selection procedure was usedwith successive removal of non-significant variables. Wealso tested whether the presence of lion had an effect ongroup size. Warthog was excluded from group size analysessince they form family groups whose size was not expectedto fluctuate much.
Temporal niche
Temporal niche at waterholes was approximated by thearrival time of animals at waterholes. To evaluate whether
Table 1 Number of herbivore groups and individuals recorded atwaterholes
Species Totalnumber ofgroups/individuals
Number of groups/individuals whenlions were absent
Number of groups/individuals whenlions were present
Buffalo 268/11,235 224/9,467 44/1,768
Giraffe 708/1,643 618/1,450 90/193
Impala 474/5,893 323/3,984 151/1,909
Kudu 543/2,255 441/1,849 102/406
Roan 121/310 95/236 26/74
Sable 243/971 189/774 54/197
Warthog 321/890 221/594 100/296
Wildebeest 146/2,647 118/1,934 28/713
Zebra 879/5,988 708/4,679 171/1,309
Data recorded during 32 waterhole monitoring sessions with lions and32 waterhole monitoring sessions without lions
1486 Behav Ecol Sociobiol (2009) 63:1483–1494
herbivores avoided using waterholes during the dangeroushours (night, early morning and late afternoon), we plotteda frequency distribution of herbivore group observations atwaterholes by hour using Oriana 2.0 software for circulardata. We compared temporal use between waterholescharacterised, from the landscape of risk, by high and lowchances of encountering lion. The latter were defined as thesites characterised by a long-term encounter risk among thehighest quartile, and the former as the sites among thelowest quartile. We carried out the same approach betweenwaterholes where lions were known to be present in thepreceding 24 h and waterholes where lions were known tobe absent.
Time spent at waterholes
We tested whether the risk of encountering lions influencedthe approach time, the potential drinking time and the timeafter drinking by regressing these times against the long-term encounter risk and the short-term encounter riskseparately. We used generalised mixed models with water-hole identity as the random variable. Statistical analyseswere performed with SAS software (version 8.2), usingMIXED procedure with GLIMMIX macro for Poissondistributed data, then correcting the models for over-dispersion by a scaling function: deviance−1 (Firth 1991).
Results
Use of waterholes: visit rate and group size
In 2003, the number of groups and of individualscounted per hour at a waterhole was independent of thelong-term encounter risk (all p>0.05). However, in 2004,there was a significant influence for five species. Thenumber of buffalo groups counted per hour at a waterholedecreased as the long-term encounter risk increased(estimate ± SE=−5.22±2.49; F1,68=4.44; p= 0.03; r2=0.27; waterhole identity accounted for 18% of the totalvariance (p=0.09)), but surprisingly the number of buffaloindividuals did not change significantly with the long-termencounter risk. For roan, sable, wildebeest and zebra, thenumber of groups and individuals counted per hour at awaterhole increased as the long-term encounter riskincreased.
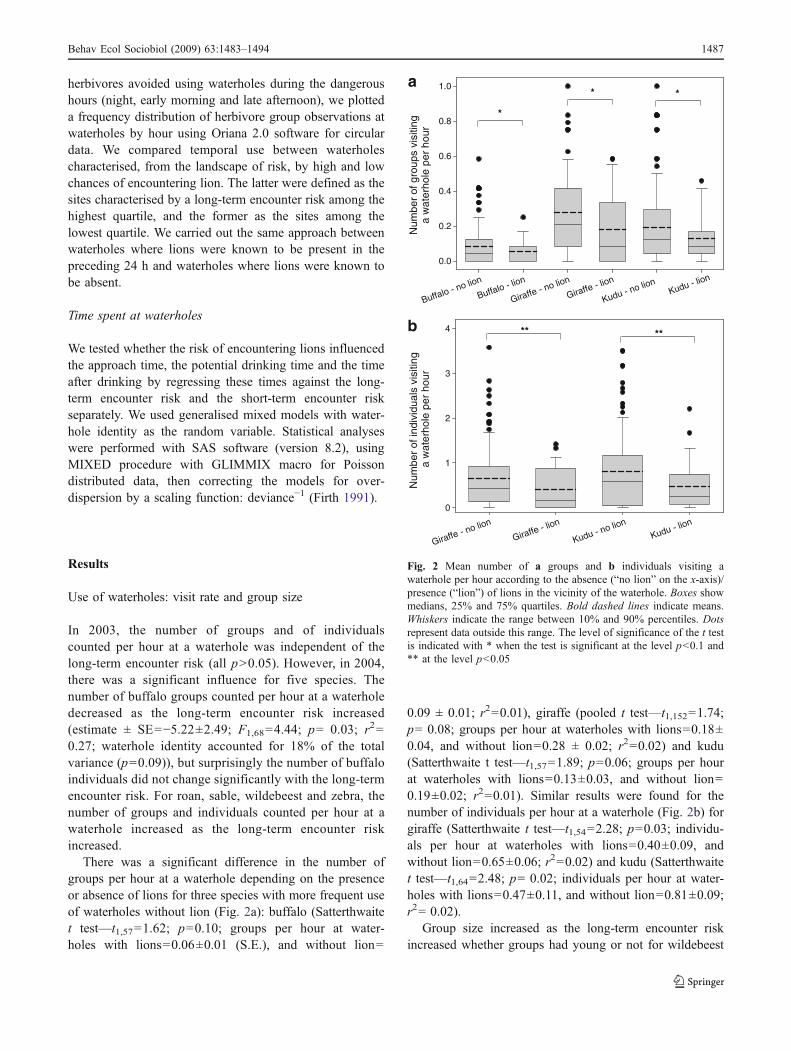
There was a significant difference in the number ofgroups per hour at a waterhole depending on the presenceor absence of lions for three species with more frequent useof waterholes without lion (Fig. 2a): buffalo (Satterthwaitet test—t1,57=1.62; p=0.10; groups per hour at water-holes with lions=0.06±0.01 (S.E.), and without lion=
0.09 ± 0.01; r2=0.01), giraffe (pooled t test—t1,152=1.74;p= 0.08; groups per hour at waterholes with lions=0.18±0.04, and without lion=0.28 ± 0.02; r2=0.02) and kudu(Satterthwaite t test—t1,57=1.89; p=0.06; groups per hourat waterholes with lions=0.13±0.03, and without lion=0.19±0.02; r2=0.01). Similar results were found for thenumber of individuals per hour at a waterhole (Fig. 2b) forgiraffe (Satterthwaite t test—t1,54=2.28; p=0.03; individu-als per hour at waterholes with lions=0.40±0.09, andwithout lion=0.65±0.06; r2=0.02) and kudu (Satterthwaitet test—t1,64=2.48; p= 0.02; individuals per hour at water-holes with lions=0.47±0.11, and without lion=0.81±0.09;r2= 0.02).
Group size increased as the long-term encounter riskincreased whether groups had young or not for wildebeest
Num
ber
of g
roup
s vi
sitin
ga
wat
erho
le p
er h
our
0.0
0.2
0.4
0.6
0.8
1.0
Buffalo - no lion
Buffalo - lion
Giraffe - no lion
Giraffe - lion
Kudu - no lionKudu - lio
n
*
* *
Num
ber
of in
divi
dual
s vi
sitin
g a
wat
erho
le p
er h
our
0
1
2
3
4
Giraffe - no lion
Giraffe - lion
Kudu - no lionKudu - lio
n
** **
a
b
Fig. 2 Mean number of a groups and b individuals visiting awaterhole per hour according to the absence (“no lion” on the x-axis)/presence (“lion”) of lions in the vicinity of the waterhole. Boxes showmedians, 25% and 75% quartiles. Bold dashed lines indicate means.Whiskers indicate the range between 10% and 90% percentiles. Dotsrepresent data outside this range. The level of significance of the t testis indicated with * when the test is significant at the level p<0.1 and** at the level p<0.05
Behav Ecol Sociobiol (2009) 63:1483–1494 1487
(estimate ± SE=20.87±8.49; F1,138=6.04; p=0.0152; r2=
0.10; waterhole identity accounted for 1% of the totalvariance (p=0.18)) and zebra (estimate ± SE=6.81±2.10;F1,865=10.47; p=0.0013; r2=0.03; waterhole identityaccounted for 2% of the total variance (p=0.10)). Addi-tionally, there was a significant effect of year with groupsbeing smaller in 2003 than in 2004 for three species(buffalo, giraffe and kudu). There was no significant effectof lion presence on group size for all species (all p>0.05)except wildebeest, which came in larger groups when therewere lions in the vicinity of the waterhole (F1,138=5.05;p=0.0263).
Temporal niche
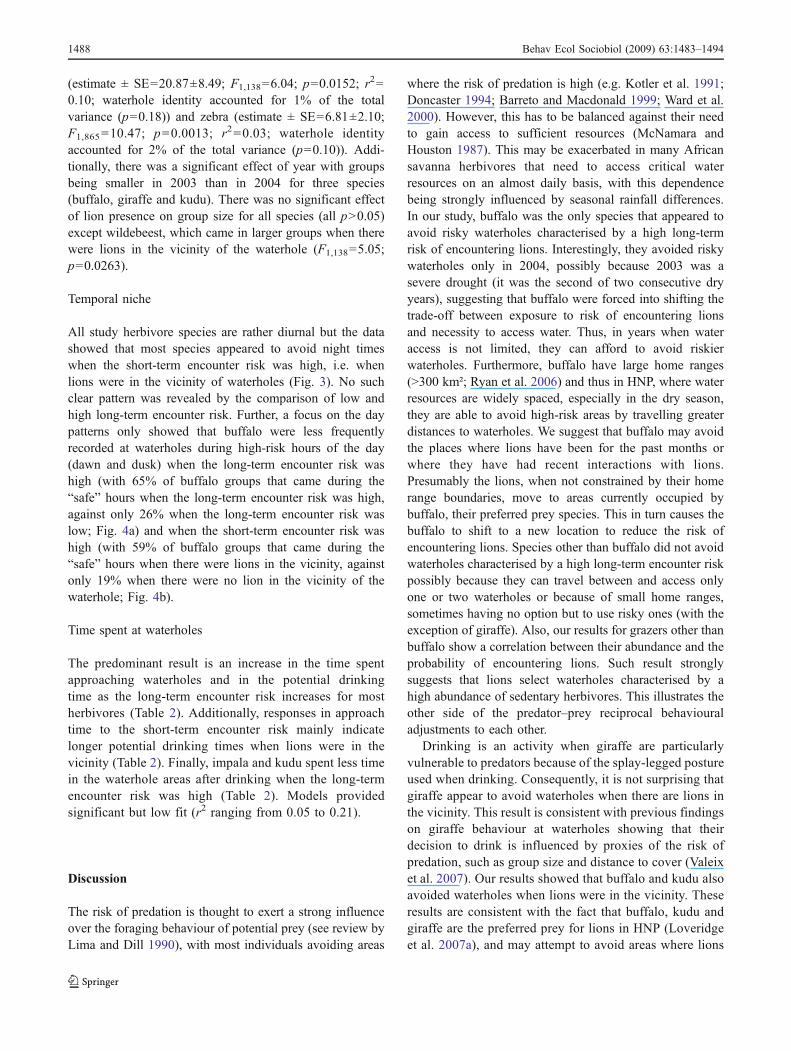
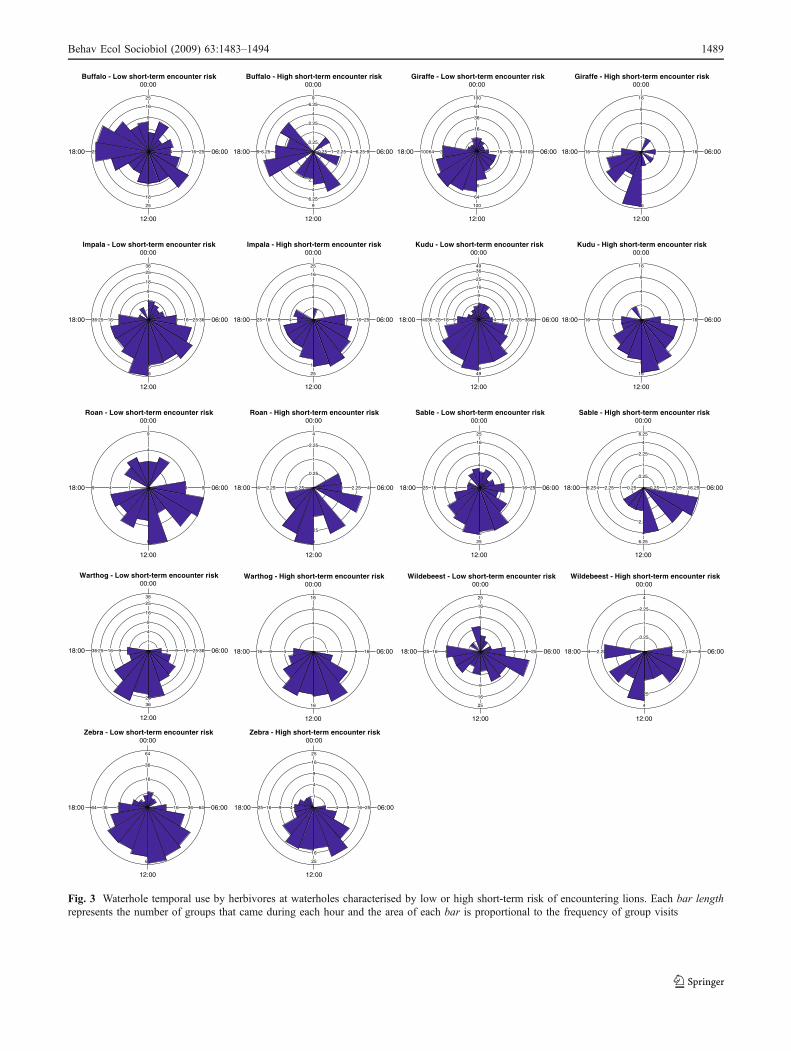
All study herbivore species are rather diurnal but the datashowed that most species appeared to avoid night timeswhen the short-term encounter risk was high, i.e. whenlions were in the vicinity of waterholes (Fig. 3). No suchclear pattern was revealed by the comparison of low andhigh long-term encounter risk. Further, a focus on the daypatterns only showed that buffalo were less frequentlyrecorded at waterholes during high-risk hours of the day(dawn and dusk) when the long-term encounter risk washigh (with 65% of buffalo groups that came during the“safe” hours when the long-term encounter risk was high,against only 26% when the long-term encounter risk waslow; Fig. 4a) and when the short-term encounter risk washigh (with 59% of buffalo groups that came during the“safe” hours when there were lions in the vicinity, againstonly 19% when there were no lion in the vicinity of thewaterhole; Fig. 4b).
Time spent at waterholes
The predominant result is an increase in the time spentapproaching waterholes and in the potential drinkingtime as the long-term encounter risk increases for mostherbivores (Table 2). Additionally, responses in approachtime to the short-term encounter risk mainly indicatelonger potential drinking times when lions were in thevicinity (Table 2). Finally, impala and kudu spent less timein the waterhole areas after drinking when the long-termencounter risk was high (Table 2). Models providedsignificant but low fit (r2 ranging from 0.05 to 0.21).
Discussion
The risk of predation is thought to exert a strong influenceover the foraging behaviour of potential prey (see review byLima and Dill 1990), with most individuals avoiding areas
where the risk of predation is high (e.g. Kotler et al. 1991;Doncaster 1994; Barreto and Macdonald 1999; Ward et al.2000). However, this has to be balanced against their needto gain access to sufficient resources (McNamara andHouston 1987). This may be exacerbated in many Africansavanna herbivores that need to access critical waterresources on an almost daily basis, with this dependencebeing strongly influenced by seasonal rainfall differences.In our study, buffalo was the only species that appeared toavoid risky waterholes characterised by a high long-termrisk of encountering lions. Interestingly, they avoided riskywaterholes only in 2004, possibly because 2003 was asevere drought (it was the second of two consecutive dryyears), suggesting that buffalo were forced into shifting thetrade-off between exposure to risk of encountering lionsand necessity to access water. Thus, in years when wateraccess is not limited, they can afford to avoid riskierwaterholes. Furthermore, buffalo have large home ranges(>300 km²; Ryan et al. 2006) and thus in HNP, where waterresources are widely spaced, especially in the dry season,they are able to avoid high-risk areas by travelling greaterdistances to waterholes. We suggest that buffalo may avoidthe places where lions have been for the past months orwhere they have had recent interactions with lions.Presumably the lions, when not constrained by their homerange boundaries, move to areas currently occupied bybuffalo, their preferred prey species. This in turn causes thebuffalo to shift to a new location to reduce the risk ofencountering lions. Species other than buffalo did not avoidwaterholes characterised by a high long-term encounter riskpossibly because they can travel between and access onlyone or two waterholes or because of small home ranges,sometimes having no option but to use risky ones (with theexception of giraffe). Also, our results for grazers other thanbuffalo show a correlation between their abundance and theprobability of encountering lions. Such result stronglysuggests that lions select waterholes characterised by ahigh abundance of sedentary herbivores. This illustrates theother side of the predator–prey reciprocal behaviouraladjustments to each other.
Drinking is an activity when giraffe are particularlyvulnerable to predators because of the splay-legged postureused when drinking. Consequently, it is not surprising thatgiraffe appear to avoid waterholes when there are lions inthe vicinity. This result is consistent with previous findingson giraffe behaviour at waterholes showing that theirdecision to drink is influenced by proxies of the risk ofpredation, such as group size and distance to cover (Valeixet al. 2007). Our results showed that buffalo and kudu alsoavoided waterholes when lions were in the vicinity. Theseresults are consistent with the fact that buffalo, kudu andgiraffe are the preferred prey for lions in HNP (Loveridgeet al. 2007a), and may attempt to avoid areas where lions
1488 Behav Ecol Sociobiol (2009) 63:1483–1494
26
Buffalo - Low short-term encounter risk
25 25
25
25
16 16
16
16
9 9
9
9
4 4
4
4
1 1
1
1
00:00
06:00
12:00
18:00
Buffalo - High short-term encounter risk
9 9
9
9
6.25 6.25
6.25
6.25
4 4
4
4
2.25 2.25
2.25
2.25
1 1
1
1
0.25 0.25
0.25
0.25
00:00
06:00
12:00
18:00
Giraffe - Low short-term encounter risk
100 100
100
100
64 64
64
64
36 36
36
36
16 16
16
16
4 4
4
4
00:00
06:00
12:00
18:00
Giraffe - High short-term encounter risk
16 16
16
16
9 9
9
9
4 4
4
4
1 1
1
1
00:00
06:00
12:00
18:00
Impala - Low short-term encounter risk
36 36
36
36
25 25
25
25
16 16
16
16
9 9
9
9
4 4
4
4
1 1
1
1
00:00
06:00
12:00
18:00
Impala - High short-term encounter risk
25 25
25
25
16 16
16
16
9 9
9
9
4 4
4
4
1 1
1
1
00:00
06:00
12:00
18:00
Kudu - Low short-term encounter risk
49 49
49
49
36 36
36
36
25 25
25
25
16 16
16
16
9 9
9
9
4 4
4
4
1 1
1
1
00:00
06:00
12:00
18:00
Kudu - High short-term encounter risk
16 16
16
16
9 9
9
9
4 4
4
4
1 1
1
1
00:00
06:00
12:00
18:00
Roan - Low short-term encounter risk
9 9
9
9
4 4
4
4
1 1
1
1
00:00
06:00
12:00
18:00
Roan - High short-term encounter risk
4 4
4
4
2.25 2.25
2.25
2.25
1 1
1
1
0.25 0.25
0.25
0.25
00:00
06:00
12:00
18:00
Sable - Low short-term encounter risk
25 25
25
25
16 16
16
16
9 9
9
9
4 4
4
4
1 1
1
1
00:00
06:00
12:00
18:00
Sable - High short-term encounter risk
6.25 6.25
6.25
6.25
4 4
4
4
2.25 2.25
2.25
2.25
1 1
1
1
0.25 0.25
0.25
0.25
00:00
06:00
12:00
18:00
Warthog - Low short-term encounter risk
36 36
36
36
25 25
25
25
16 16
16
16
9 9
9
9
4 4
4
4
1 1
1
1
00:00
06:00
12:00
18:00
Warthog - High short-term encounter risk
16 16
16
16
9 9
9
9
4 4
4
4
1 1
1
1
00:00
06:00
12:00
18:00
Wildebeest - Low short-term encounter risk
25 25
25
25
16 16
16
16
9 9
9
9
4 4
4
4
1 1
1
1
00:00
06:00
12:00
18:00
Wildebeest - High short-term encounter risk
4 4
4
4
2.25 2.25
2.25
2.25
1 1
1
1
0.25 0.25
0.25
0.25
00:00
06:00
12:00
18:00
Zebra - Low short-term encounter risk
64 64
64
64
36 36
36
36
16 16
16
16
4 4
4
4
00:00
06:00
12:00
18:00
Zebra - High short-term encounter risk
25 25
25
25
16 16
16
16
9 9
9
9
4 4
4
4
1 1
1
1
00:00
06:00
12:00
18:00
Fig. 3 Waterhole temporal use by herbivores at waterholes characterised by low or high short-term risk of encountering lions. Each bar lengthrepresents the number of groups that came during each hour and the area of each bar is proportional to the frequency of group visits
Behav Ecol Sociobiol (2009) 63:1483–1494 1489
have been recently or are presently more than other preyspecies. Whilst the risk of encountering lions had asignificant influence on the visit rates of buffalo, giraffeand kudu, the effect size was generally small (r2≤0.27),possibly because visit rates at a given waterhole resultfrom several other factors (e.g. proximity of other watersources, quality of the water, presence of other predators,presence of conspecifics).
In addition to avoidance of risky areas, prey may limittheir temporal overlap with predators and may exploit sub-optimal activity periods to reduce vulnerability to predation(e.g. Kotler et al. 2004; Fenn and Macdonald 1995; Rothand Lima 2007). Indeed, time can be considered as a nichedimension over which animals can minimise the risk ofpredation. Lion activity peaks are after 17h00 and before08h00 (Schaller 1972). Periods between 17h00 and 08h00are consequently more dangerous for herbivores. In our
study, when the long-term or short-term encounter risk waslow, the activity peaks of buffalo at waterholes were before8h00 and after 17h00 with nearly no use in the middle ofthe day. In contrast, buffalo used waterholes mainly duringthe middle of the day when the long-term or short-termencounter risk was high. This result strongly suggests thatbuffalo avoid the hours of the day which are dangerouswhen the risk of encountering lions is high. It corroboratesa previous finding showing that the percentage of buffalothat are standing and vigilant at night is greater than duringthe day (Prins and Iason 1989). In our study, the avoidanceof waterhole use at night times by most herbivores whenlions are the vicinity of the waterhole illustrates well thetemporal niche shift to reduce the risk of predation.
The general understanding is that prey group sizeincreases with heightened risk of predation, because anindividual’s risk of predation decreases as a result of thecombination of collective vigilance and a dilution effect(Lima 1995; Roberts 1996). Lions prefer to hunt prey thatare in small groups (Scheel 1993), so prey forming largergroups in riskier environments appears to be an adaptiveanti-predator response. However, our results did not showa strong effect of both long-term and short-term encounterrisks on group size. This may be explained by the diversityof other factors that affect group size in herbivores such asforage abundance and quality (Fryxell 1991; Brasharesand Arcese 2002), social organisation (Jarman 1974),competition (Bednekoff and Lima 2004) and type ofhabitat (Creel and Winnie 2005). Even if not strong, ourresults suggest that the long-term encounter risk may havesome effect on wildebeest and zebra group size. Thesespecies are open grassland grazers and open grasslandareas are scarce and often associated with waterhole areas(Rogers 1993). Consequently, wildebeest and zebra tend toremain in waterhole areas most of the time and thereforetheir movement is generally within these areas. Oneexplanation to the pattern revealed could be that theyform larger groups before approaching the waterhole todrink. However, the weakness of the relationships betweenencounter risk and group size revealed in this studystrongly suggests that other anti-predator strategies maybe more important.
It has been previously suggested that the time spentaround waterholes is influenced by the perceived risk ofvulnerability to predation (group size, distance to cover,presence of young) as well as by thermoregulatoryconstraints (Valeix et al. 2007). This study goes one stepfurther in the investigation of the role of predation bytaking lion presence into account, and confirms that the riskof encountering a predator influences the time spent byherbivores in their approach to water, potential drinkingtime or to a lesser extent leaving the waterhole area. Ourresults revealed some significant effect of the risk of
Time of the day4 6 8 10 12 14 16 18 20
Per
cent
age
of b
uffa
lo g
roup
obs
erva
tions
0
5
10
15
20
25
30
Low encounter riskHigh encounter risk
Time of the day4 6 8 10 12 14 16 18 20
Per
cent
age
of b
uffa
lo g
roup
obs
erva
tions
0
5
10
15
20
25
no lionlion present
a
b
Fig. 4 Waterhole temporal use by buffalo during the day time onlyat waterholes characterised by a low and high long-term risk ofencountering lions, and b low and high short-term risk ofencountering lions
1490 Behav Ecol Sociobiol (2009) 63:1483–1494
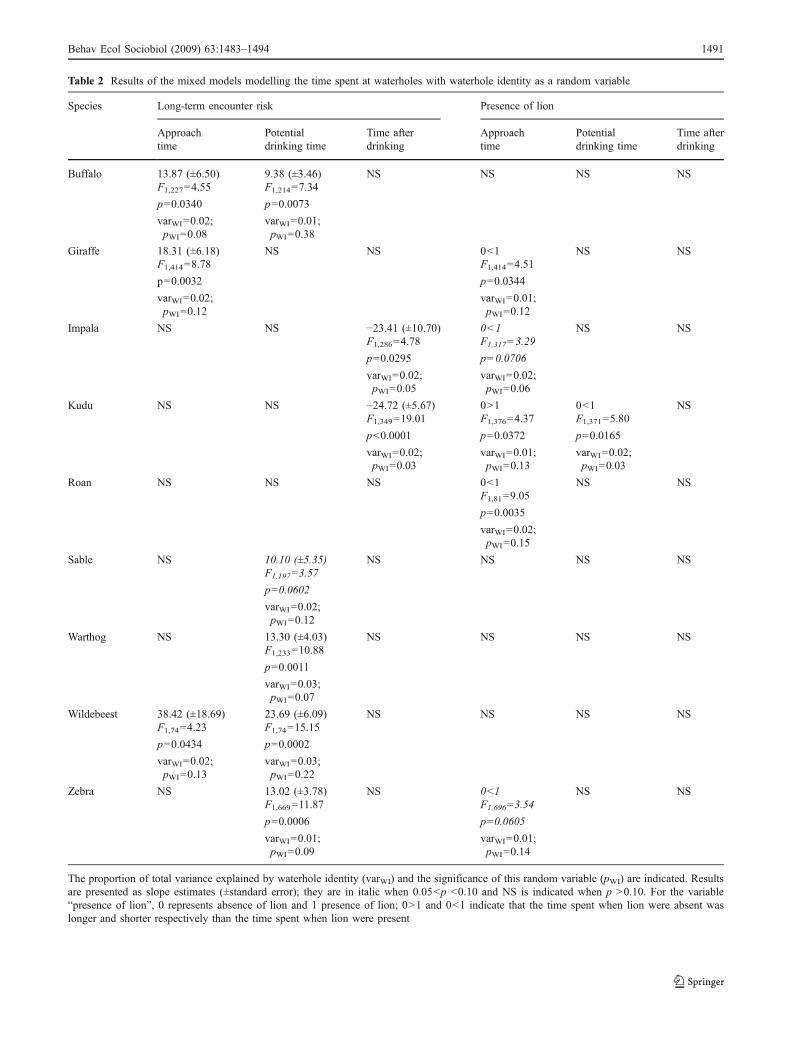
Table 2 Results of the mixed models modelling the time spent at waterholes with waterhole identity as a random variable
Species Long-term encounter risk Presence of lion
Approachtime
Potentialdrinking time
Time afterdrinking
Approachtime
Potentialdrinking time
Time afterdrinking
Buffalo 13.87 (±6.50) 9.38 (±3.46) NS NS NS NSF1,227=4.55 F1,214=7.34
p=0.0340 p=0.0073
varWI=0.02;pWI=0.08
varWI=0.01;pWI=0.38
Giraffe 18.31 (±6.18) NS NS 0<1 NS NSF1,414=8.78 F1,414=4.51
p=0.0032 p=0.0344
varWI=0.02;pWI=0.12
varWI=0.01;pWI=0.12
Impala NS NS −23.41 (±10.70) 0<1 NS NSF1,286=4.78 F1,317=3.29
p=0.0295 p=0.0706
varWI=0.02;pWI=0.05
varWI=0.02;pWI=0.06
Kudu NS NS −24.72 (±5.67) 0>1 0<1 NSF1,349=19.01 F1,376=4.37 F1,371=5.80
p<0.0001 p=0.0372 p=0.0165
varWI=0.02;pWI=0.03
varWI=0.01;pWI=0.13
varWI=0.02;pWI=0.03
Roan NS NS NS 0<1 NS NSF1,81=9.05
p=0.0035
varWI=0.02;pWI=0.15
Sable NS 10.10 (±5.35) NS NS NS NSF1,197=3.57
p=0.0602
varWI=0.02;pWI=0.12
Warthog NS 13.30 (±4.03) NS NS NS NSF1,233=10.88
p=0.0011
varWI=0.03;pWI=0.07
Wildebeest 38.42 (±18.69) 23.69 (±6.09) NS NS NS NSF1,74=4.23 F1,74=15.15
p=0.0434 p=0.0002
varWI=0.02;pWI=0.13
varWI=0.03;pWI=0.22
Zebra NS 13.02 (±3.78) NS 0<1 NS NSF1,669=11.87 F1,696=3.54
p=0.0006 p=0.0605
varWI=0.01;pWI=0.09
varWI=0.01;pWI=0.14
The proportion of total variance explained by waterhole identity (varWI) and the significance of this random variable (pWI) are indicated. Resultsare presented as slope estimates (±standard error); they are in italic when 0.05<p <0.10 and NS is indicated when p >0.10. For the variable“presence of lion”, 0 represents absence of lion and 1 presence of lion; 0>1 and 0<1 indicate that the time spent when lion were absent waslonger and shorter respectively than the time spent when lion were present
Behav Ecol Sociobiol (2009) 63:1483–1494 1491
encountering lions on the time spent around waterholes.These effects were not very strong (r2 ranging from 0.05 to0.21) showing that many other factors come into play in thebehaviour of herbivores at waterholes (e.g. intra- andinterspecific competition/facilitation, social interactions,grazing quality in the waterhole area, thermoregulationconstraints). Still, the significant results showed consistenttrends revealing that many herbivores spent longer timeapproaching the water and showed longer potential drink-ing time when the long-term encounter risk increased,strongly suggesting an increased level of vigilance to detectpotential predators in waterhole areas that have beencharacterised by frequent lion presence in the past 4 months.Similarly, some species showed longer approaching timewhen the short-term encounter risk was high. However, ifmost herbivores spent longer time to approach the water-hole when lions were in the vicinity (giraffe, impala, roanand zebra), which is consistent with higher level ofvigilance, kudu approached the waterhole more rapidly.Some herbivores may have detected the location of lionswhile entering the waterhole area, thus do not need tofrequently scan the surroundings and may ultimately tend tominimise exposure to predation risk. However, our con-clusions are limited by the lack of data on vigilance per seat waterholes, which will need to be collected in the futureto reach a fine understanding of the vigilance response ofprey to different temporal scales of perception of predationrisk. For example, it is well documented that herbivores inlarger group allocate less time to vigilance activities sincethey can rely on collective vigilance (Lima 1995). Further,theory predicts that individuals at the periphery of a groupshould be at higher risk than their more central conspecificssince they would be the first to be encountered by anapproaching predator, hence the position of an individualwithin the group is also expected to strongly influencevigilance (Krause 1994). Finally, other activities thandrinking and vigilance may play a role, and herbivoresmay sometimes spend more time in a waterhole area forother activities (e.g. social display may be more efficient inopen areas). Consequently, the lack of data on individualpatterns of vigilance limits the strength of our conclusionson suggested higher level of vigilance when the risk ofencountering a predator is high.
Buffalo are the prey species most frequently killed bylions in HNP, making up 30–35% of all kills recorded(Loveridge et al. 2007a). Interestingly, this study providesevidence that buffalo shows many behavioural adjustmentsto high risk of encountering lions. First, buffalo avoidwaterholes where (1) lions have been most active over thepast 4 months or (2) lions have been active in the past 24 h.Second, they shift their use of waterholes towards themiddle of the day when they use waterholes characterised
by a high long-term or short-term risk of encounteringlions, and they avoid use of waterholes at night if lions havebeen in the vicinity recently. Third, they appear to be morevigilant when approaching and then drinking at waterholescharacterised by high long-term encounter risk. All thesefindings reveal the diversity of anti-predator responses thatbuffalo employ at essential sites such as waterholes in semi-arid savannas. Other species showed a less complete arrayof behavioural adjustments. It is noteworthy that, unlikelarger herbivores, smaller herbivores can be preyed upon bycarnivores from across the spectrum of body sizes (Owen-Smith and Mills 2008), and the risk of being predated uponby other predators may therefore have confounding effectson the behaviour of smaller herbivore species.
Our results illustrate that the risk of encountering apredator is a significant factor affecting behaviour patternsof prey species. They reinforce the idea that prey responddifferently to different temporal variations in the risk ofpredation (Creel and Winnie 2005), by strongly suggestingthat prey are responding to predation at least at two levels.The first is a cumulative understanding of the risk ofencountering a predator with its concomitant responses, andthe second is the more immediate predation risk where theyrespond to the specific situation that confronts them.
Acknowledgements The Director General of the Zimbabwe Parksand Wildlife Management Authority is acknowledged for providingthe opportunity to carry out this research and for permission to publishthis manuscript. We are indebted to CIRAD as herbivore data werecollected in the frame of a CIRAD–CNRS project, the HERD project(Hwange Environmental Research Development), funded by theFrench “Ministère des Affaires Etrangères”, the “Ambassade deFrance au Zimbabwe”, the CIRAD, the CNRS and the ANRBiodiversité “BioFun project” ANR-05-BDIV-013-01. This workwas made possible with grants from The Darwin Initiative forBiodiversity Grant 162/09/015, The Eppley Foundation, DisneyFoundation, Marwell Preservation Trust, Regina B. FrankenburgFoundation, Panthera Foundation and the generosity of Joan and RivWinant. We thank all the people that participated in the fieldwork,particularly Simon Chamaillé-Jammes and the rangers and ecologicalstaff of HNP. We thank Paul Funston and two anonymous reviewersfor their fruitful comments on a previous draft of this manuscript.Relevant animal care protocols were followed and approval receivedfrom the appropriate agencies.
Appendix
Relationship between the distance to the closest waterholeand the probability of selecting a site for the studyherbivores. These plots are mainly based on resultspublished in Valeix et al. (2009). Plain lines represent theestimate of the resource selection function model anddotted lines the estimate ± standard error.
1492 Behav Ecol Sociobiol (2009) 63:1483–1494
References
Barreto GR, Macdonald DW (1999) The response of water voles,Arvicola terrestris, to the odours of predators. Anim Behav57:1107–1112
Bednekoff PA, Lima SL (2004) Risk allocation and competition inforaging groups: reversed effects of competition if group sizevaries under risk of predation. Proc Roy Soc Lond B 271:1491–1496
Berger J (1991) Pregnancy incentive and predation constraints inhabitat shifts: experimental and field evidence for wild bighornsheep. Anim Behav 41:61–77
Brashares JS, Arcese P (2002) Role of forage, habitat and predation inthe behavioural plasticity of a small African antelope. J AnimEcol 71:626–638
Brown JS, Laundré JW, Gurung M (1999) The ecology of fear: optimalforaging, game theory, and trophic interactions. JMamm80:385–399
Burger J, Gochfield M (1994) Vigilance in African mammals:differences among mothers, other females and males. Behaviour131:154–274
Creel S, Winnie JA (2005) Responses of elk herd size to fine-scalespatial and temporal variation in the risk of predation by wolves.Anim Behav 69:1181–1189
Creel S, Winnie JA, Maxwell B, Hamlin K, Creel M (2005) Elk alterhabitat selection as an antipredator response to wolves. Ecology86:3387–3397
Dehn MM (1990) Vigilance for predators: detection and dilutioneffects. Behav Ecol Sociobiol 26:337–342
Doncaster CP (1994) Factors regulating local variations in abundance:field tests on hedgehogs, Erinaceus europaeus. Oikos 69:182–192
Fenn MGP, Macdonald DW (1995) Use of middens by red foxes: riskreverses rhythms of rats. J Mamm 76:130–136
Firth D (1991) Generalized linear models. In: Hinkley DV, Reid N,Snell EJ (eds) Statistical theory and modelling. Chapman andHall, London
Fryxell JM (1991) Forage quality and aggregation by large herbivores.Am Nat 138:478–498
Hamilton WD (1971) Geometry for the selfish herd. J Theor Biol31:295–311
Hebblewhite M, Merrill EH, McDonald TL (2005) Spatial decompo-sition of predation risk using resource selection functions: anexample in a wolf–elk predator–prey system. Oikos 111:101–111
Hemson G, Johnson P, South A, Kenward R, Ripley R, MacdonaldDW (2005) Are kernel the mustard? Data from global positioningsystem (GPS) collars suggests problems for kernel home-rangeanalyses with least-squares cross-validation. J Anim Ecol74:455–463
Buffalo
Distance to a waterhole (m)0 2000 4000 6000 8000
Distance to a waterhole (m)0 2000 4000 6000 8000
Distance to a waterhole (m)0 2000 4000 6000 8000
Distance to a waterhole (m)0 2000 4000 6000 8000
Distance to a waterhole (m)0 2000 4000 6000 8000
Distance to a waterhole (m)0 2000 4000 6000 8000
Distance to a waterhole (m)0 2000 4000 6000 8000
Distance to a waterhole (m)0 2000 4000 6000 8000
Distance to a waterhole (m)0 2000 4000 6000 8000
Pro
babi
lity
of s
elec
ting
a si
teP
roba
bilit
y of
sel
ectin
g a
site
Pro
babi
lity
of s
elec
ting
a si
te
0.0
0.2
0.4
0.6
0.8
1.0
0.0
0.2
0.4
0.6
0.8
1.0
0.0
0.2
0.4
0.6
0.8
1.0
Pro
babi
lity
of s
elec
ting
a si
teP
roba
bilit
y of
sel
ectin
g a
site
Pro
babi
lity
of s
elec
ting
a si
te
0.0
0.2
0.4
0.6
0.8
1.0
0.0
0.2
0.4
0.6
0.8
1.0
0.0
0.2
0.4
0.6
0.8
1.0
Pro
babi
lity
of s
elec
ting
a si
teP
roba
bilit
y of
sel
ectin
g a
site
Pro
babi
lity
of s
elec
ting
a si
te
0.0
0.2
0.4
0.6
0.8
1.0
0.0
0.2
0.4
0.6
0.8
1.0
0.0
0.2
0.4
0.6
0.8
1.0
Giraffe Impala
Kudu Roan Sable
Wildebeest ZebraWarthog
Behav Ecol Sociobiol (2009) 63:1483–1494 1493
Hopcraft GJC, Sinclair ARE, Packer C (2005) Planning for success:Serengeti lions seek prey accessibility rather than abundance.J Anim Ecol 75:559–566
Hunter LTB, Skinner JD (1998) Vigilance behaviour in Africanungulates: the role of predation pressure. Behaviour 135:195–211
Jarman PJ (1974) The social organisation of antelope in relation totheir ecology. Behaviour 48:215–267
Kotler BP, Brown JS, Hasson O (1991) Factors affecting gerbil foragingbehaviour and rates of owl predation. Ecology 72:2249–2260
Kotler BP, Brown JS, Bouskila A (2004) Apprehension and timeallocation in gerbils: the effects of predatory risk and energeticstate. Ecology 85:917–922
Krause J (1994) Differential fitness returns in relation to spatialposition in groups. Biol Rev 69:187–206
Liley S, Creel S (2008)What best explains vigilance in elk: characteristicsof prey, predators, or the environment? Behav Ecol 19:245–254
Lima SL (1995) Back to the basics of anti-predatory vigilance: thegroup size effect. Anim Behav 49:11–20
Lima SL, Dill LM (1990) Behavioural decisions made under the riskof predation: a review and synthesis. Can J Zool 68:619–640
Loveridge AJ, Davidson Z, Hunt JE, Valeix M, Elliot N, Stapelkamp B(2007a) Hwange Lion Project Annual Report 2007. ZimbabweParks and Wildlife Management Authority, Zimbabwe
Loveridge AJ, Searle AW, Murindagomo F, Macdonald DW (2007b)The impact of sport-hunting on the lion population in a protectedarea. Biol Conserv 134:548–558
McNamara JM, Houston AI (1987) Starvation and predation as factorslimiting population size. Ecology 68:1515–1519
Owen-Smith N, Mills MGL (2008) Predator–prey size relationships inan African large-mammal food web. J Anim Ecol 77:173–183
Prins HHT, Iason GR (1989) Dangerous lions and nonchalant buffalo.Behaviour 108:262–293
Pulliam HR (1973) On the advantages of flocking. J Theor Biol38:419–422
Ripple WJ, Beschta RL (2004) Wolves and the ecology of fear: canpredation risk structure ecosystems? BioScience 54:755–766
Roberts G (1996) Why individual vigilance declines as group sizeincreases. Anim Behav 51:1077–1086
Rogers CML (1993) A woody vegetation survey of Hwange NationalPark. Department of National Parks and Wildlife Management,Zimbabwe
Roth TC, Lima SL (2007) The predatory behavior of winteringAccipiter hawks: temporal patterns in activity of predators andprey. Oecologia 152:169–178
Ryan SJ, Knechtel CU, Getz WM (2006) Range and habitat selectionof African buffalo in South Africa. J Wildl Manage 70:764–776
Schaller GB (1972) The Serengeti lion: a study of predator preyrelations. Chicago University Press, Chicago
Scheel D (1993) Profitability, encounter rates, and prey choice ofAfrican lions. Behav Ecol 4:90–97
South AB, Kenward RE (2006) Ranges7 v1.0: for the analysis oftracking and location data. Anatrack, Wareham
Thrash I, Theron GK, Bothma JP (1995) Dry season herbivoredensities around drinking troughs in the Kruger National Park.J Arid Environ 29:213–219
Underwood R (1982) Vigilance behaviour in grazing Africanantelopes. Behaviour 79:81–107
Valeix M, Fritz H, Matsika R, Matsvimbo F, Madzikanda H (2007)The role of water abundance, thermoregulation, perceivedpredation risk and interference competition in water access byAfrican herbivores. Afr J Ecol 46:402–410
Valeix M, Loveridge AJ, Chamaillé-Jammes S, Davidson Z,Murindagomo F, Fritz H, Macdonald DW (2009) Behavioraladjustments of African herbivores to predation risk by lions:spatiotemporal variations influence habitat use. Ecology90:23–30
Van Balaan M, Sabelis MV (1993) Coevolution of patch strategies ofpredator and prey and the consequences for ecological stability.Am Nat 142:646–670
Ward JF, Austin RM, Macdonald DW (2000) A simulation model offoraging behaviour and the effect of predation risk. J Anim Ecol69:16–30
1494 Behav Ecol Sociobiol (2009) 63:1483–1494


