Embed Size (px)
Citation preview
Seediscussions,stats,andauthorprofilesforthispublicationat:https://www.researchgate.net/publication/280538843
Doesopennessleadtosustainedeconomicgrowth?Exportgrowthversusothervariablesasdeterminantsofeconomicgrowth
ARTICLEinJOURNALOFTHEASIAPACIFICECONOMY·JULY2015
ImpactFactor:0.64·DOI:10.1080/13547860.2015.1054164
READS
63
2AUTHORS:
SanikaSulochaniRamanayake
SeoulNationalUniversity
2PUBLICATIONS0CITATIONS
SEEPROFILE
KeunLee
SeoulNationalUniversity
129PUBLICATIONS1,465CITATIONS
SEEPROFILE
Allin-textreferencesunderlinedinbluearelinkedtopublicationsonResearchGate,
lettingyouaccessandreadthemimmediately.
Availablefrom:KeunLee
Retrievedon:07January2016

1
Forthcoming in Journal of the Asia-Pacific Economy (august 2015)
Does openness lead to sustained economic growth?
Export growth versus other variables as determinants of economic growth
Sanika Sulochani Ramanayake* and Keun Lee**
*Ph.D. Researcher, Inha University and Seoul National University, Department of Economics, Seoul, Korea
** Corresponding author; Professor, Department of Economics, Seoul National University, Seoul, Korea
(Received February 2015 1; accepted 9th April 2015)
Different versions of this paper were presented in several places, including the 2014
Globelics Conferences held in Ethiopia. The authors acknowledge the support from the Korean
government through the National Research Foundation of Korea (NRF-2013S1A3A2053312).
*Postal Address: Seoul National University, BK International House, 946A-102, 1 Gwank-ro, Gwank-gu, Seoul,
151-150, Korea (E-mail- [email protected], H. Phone:+82-10-51322144)
**Postal Address: Department of Economics, Seoul National University, Shillim Dong, Seoul
151 746 KOREA (E-mail: [email protected], Tel. Phone: +822 880 636)

2
Abstract
This research revisits the issue of economic growth determinants in developing countries with a
focus on international integration variables. Four alternative variables are tested, namely, export
growth, trade openness, export diversification, and foreign direct investment (FDI), in a single
framework. This study finds that export growth is the most robust, in addition to export specialization,
and that traditional variables of trade openness and FDI are not robust. This result is based on the
econometric estimations that use not only cross-section and fixed-effect panel estimations but also
system-GMM estimations. The findings warn against the traditional emphasis on simple trade
openness and FDI as policy prescriptions for developing countries. In other words, simply opening an
economy for international integration does not guarantee sustained economic growth unless these
actions lead to export growth, which requires capability building in indigenous firms and investments
in innovations. This observation is consistent with the experiences of successful economies in Asia,
such as Korea, Taiwan, and China.
Key words: export growth, trade openness, export diversification, foreign direct investment,
economic growth, developing and developed countries

3
1. Introduction
The determinants of economic growth still remain an important issue in economics. The literature
has identified several factors for economic growth, such as policies, institutions, and geography (Lee
and Kim, 2009). Among these factors, policies are often represented by policies for economic
integration and openness, with the so-called Washington Consensus as the prime example
(Williamson, 1994; 1996; 1997). The importance of institutions has been identified due to the fact that
good policy prescriptions are argued to fail because of poor institutional conditions, such as insecure
property rights and a weak rule of law (Knack and Keefer 1995; Acemoglu et al. 2001; 2002; Rodrik
et al. 2004). Specifically, Easterly (2001) argued that none of the traditional factors would affect
economic performance if a stable and trustworthy institutional environment was not present to sustain
the economy. Questioning the robustness of institution variable, Glaeser et al. (2004) argued that
institutions do not cause growth but rather economic growth brings in good institutions, such as
democracy, as in the case of formerly authoritarian states like South Korea. Lee and Kim (2009)
found that (political) institutions are significant only in low- and lower-middle-income countries,
whereas innovation and higher education are significant in upper-middle and higher-income countries.
Another stream of research focuses on the phenomenon of ‘growth spurts and collapse’ in short
periods of time that occurs in many countries in the South. For instance, Jones and Olken (2005),
Hausman et al. (2005), and Rodrick (2006) noted that many developing countries could show growth
spurts for a certain period of time (usually less than a decade) but were unable to sustain this growth
over a longer period. These studies underscore the importance of sustaining growth instead of only
initiating growth.1 A related phenomenon is the middle-income trap, which indicates the problem of
the growth slowdown in middle-income countries, as Eichengreen et al. (2012; 2013), Lee (2013), and
the World Bank (2010) noted.
The recent surge of interest in sustained economic growth motivated this study to revisit the
importance of international economic integration with a new variable other than trade openness,
export diversification, or foreign direct investment (FDI). This study proposes export growth as a new
binding constraint for economic growth in the South instead of the aforementioned factors.
Although the benefits of economic integration and openness have been recognized in the vast
literature (Dollar 1992; Ben-David 1993; Sachs and Warner 1995; Edwards 1998; Vamvakidis 1999;
Harrison 1996), the actual effects of openness and the variables that would represent the best
international integration are still under debate. For instance, whereas some studies find a positive
correlation between economic growth and trade openness (Frankel and Romer 1999; Rodriguez and
1 They have investigated the causes for this phenomenon and suggested that political leadership and investment
sustainability are the suspected factors.

4
Rodrik 2001; Yanikkaya 2003), others find that trade openness is not robust as a factor for economic
growth (Rodriguez and Rodrik 2001; Vamvakidis 2002; Lee and Kim 2009). Similar controversies
exist over the FDI variable as scholars are divided between pro-FDI (Balcao Reis 2001; Hermes and
Lensink 2003; Alfaro et al. 2004; Balasubramanyam et al. 1996; Durham 2004; Doych and Uctum
2011; Borensztein et al. 1998; Hsiao and Shen 2003; Makki and Somwaru 2004) and skeptical-FDI
groups (Carkovic and Levine 2002; Adams 2009). Export diversification is another variable that is
subject to debate because some find this concept significant for economic growth in the South (Hasse,
2009; Amurgo-Pacheco and Pierola, 2008; Dennis and Shephrd, 2007), whereas others find export
specialization to have significant effects on growth (Pliimper and Graff 2001; Dalum et al.1999;
Greenaway et al. 1999; Fosu 1990).
In place of these three variables of trade openness, FDI, and export diversification, this research
introduces export growth as an alternative variable to represent economic integration and openness.
Considering exports as an important factor for economic growth is not new. In particular, economic
growth in many emerging countries has been characterized as export-led growth (Little et al. 1970;
Krueger 1978; Arthur Lewis 1980; Tyler 1981; Cline 1982; Balassa 1985). However, emerging
literature argues that not starting but sustaining exports is critical for economic growth. The research
focuses on the issue of export survival and discusses various variables, such as the comparative
advantage of products, competitiveness of exports, export diversification, learning through exporting,
and export composition (Brenton et al. 2010; Besedes and Prusa 2006b; Nitsch 2009; Fugazza and
Molina 2009; Gorge et al. 2007; Volpe and Carballo 2008; Cadot et al. 2009; Hausman et al. 2007).
This study hypothesizes that export growth (sustaining exports) is one of the most binding factors for
economic growth in the South, based on the reasoning that developing countries must earn hard
currencies through exporting to pay for the imported capital goods that are required investments for
sustaining economic growth. In other words, export growth promotes economic growth by generating
the foreign exchange that enables the importation of machinery and intermediate goods, which are
needed for investment.
Although some empirical research focuses on export as a determinant of economic growth, most of
them are limited in other aspects. First, the research surveyed in Appendix Table 1 tends to use gross
domestic product (GDP) growth but not per capita GDP growth as in typical growth literature. The
only study that uses per capita income growth is that of Michaley (1977), which does not conduct
regressions but only considers correlations. The other research surveyed in Appendix Table 2 uses the
generalized method of moments (GMM) method to control endogeneity but does not use export
growth. Instead, it uses other variables, such as export GDP ratio, and export composition (share of
high tech export). Moreover, many of these studies do not divide samples into separate income groups,
such as developing and developed countries.
5
This study is one of the first to consider and compare the variable of export growth in the same
regression models with other integration variables, such as trade openness, export diversification, and
FDI variables. It also divides countries into two groups, developing and developed, and conducts not
only panel estimations but also the system–GMM estimations to control endogeneity. This study uses
long and recent data periods for both five-year- and fifteen-year-based growth rates.
This paper is organized as follows: Section 2 provides the literature review and hypotheses. Section
3 discusses the empirical methodology, data, and results. Finally, Section 4 presents the summary and
concluding remarks.
2. The Four Variables Representing International Integration: Hypotheses
In this study, we consider four variables to represent international integration: trade openness,
export diversification, FDI, and export growth rate.
Trade Openness
Openness is a typical variable that represents international integration. Dollar (1992) and Sachs and
Warner (1995) found a positive effect of openness on growth and tested the corresponding robustness
using a wide range of openness measures, including subjective indicators. Simultaneously, Sachs and
Warner (1995) stated that open economies successfully avoid balance-of-payments crises, whereas
many closed economies eventually succumb to such crises.2 Using panel data estimation, Vamvakidis
(1999) and Harrison (1996) found that openness has a positive and statistically significant correlation
with growth and investment. Frankel and Romer (1999) confirmed that trade has a large and robust
effect on growth. Yanikkaya (2003) explained that trade openness and growth have a positive and
significant association.
By contrast, others find that trade openness is not robust as a determinant of economic growth.
Rodriguez and Rodrik (2001) considered the indicators of openness that researchers use as measures
of trade barriers to be problematic and often highly correlated with other sources of poor economic
performance. Using cross-country regression, Vamvakidis (2002) showed that long-term trade
openness and growth are not always positively correlated.3 Lee and Kim (2009) also determined that
trade openness is not robust.
FDI
FDI is identified as another integration variable and as a determinant of economic growth. Growth-
oriented governments of emerging economies and developing countries have been competing to entice
2 Sachs and Warner (1995), used a different variable of openness, that is, a dummy variable between 0 and 1, and the sample
consisted of 135 countries. In this research, we consider ‘trade openness’ as the total trade share of GDP and ‘openness’ as
the openness dummy variable.
3 He used data from 1870 to 1970. Even during war periods, the correlation between trade openness and growth was
negative.
6
foreign capital with various attractive schemes. Now, FDI stands as one of the most important foreign
financing sources in these economies. FDI has also long been recognized as a major source of
technology and know-how to developing countries. Some research shows that FDI has positive effects
on growth, whereas others indicate that FDI has negative effects on growth. Borensztein et al. (1998)
found that the FDI effect on growth is conditional upon the level of absorptive capacity. Regarding the
developing countries, Balasubramanyam et al. (1996) found that FDI has a positive effect on
economic growth. Hsiao and Shen (2003) found that institutional strength and high levels of
urbanization are the pre-conditions for positive effects of FDI on growth in developing countries.
By contrast, some studies do not find any relationship between FDI and growth. Carkovic and
Levine (2002) showed that FDI inflows do not exert an independent robust positive influence on
economic growth.4 Adams (2009) analyzed the effect of FDI and domestic investment on economic
growth in sub-Saharan Africa over the period of 1990 to 2003. The result indicates that FDI is positive
and significant only in the ordinary least square (OLS) estimation but is insignificant in the fixed
effect estimation.
Export diversification or specialization
The growth effects of export specialization or diversification have two different views.
On the one hand, many empirical analyses show a positive relationship between export
diversification and growth. Recent studies on product-level export data demonstrate that an economy
with an export-mix that is diverse and sophisticated tends to experience a fast growth. Agosin (2007),
Cadot et al. (2009), and Hausman et al. (2007) also indicated that export diversification and
comparative advantage are the key factors to economic growth. Al-Marhub (2000) provided empirical
evidence that shows that export diversification associated with a high investment rate is a key factor
for the growth of developing countries. Al-Marhubi (2000) and Ferranti et al. (2002) also found
evidence in favor of diversification-led economic growth. A number of trade models also imply a link
between export diversification and growth. Pineres and Ferrantino (1997) argued that general growth,
export growth, and export diversification are all linked. Pineres and Ferrantino (2000) claimed that
export diversification affects long-run growth as suggested by endogenous growth theory, which
emphasizes the role of increasing returns to scale and dynamic spillover effects. Felipe et al. (2012)
found that countries that belonged to the upper-middle-income group simultaneously had a diversified,
sophisticated, and non-standard export basket, and that they were about to jump from the lower-
income level to the middle-income level. Balaguer and Cantavella-Jorda (2004) also established a
positive relationship between diversification and growth using co-integration and causality tests.
On the other hand, a large volume of literature discusses the linkage between export specialization
and growth. Pliimper and Graff (2001) found that export specialization in certain goods has a
4 Carkovic and Levin (2002) used GMM panel estimator using World Bank and IMF datasets over the period of 1960-1995.

7
significant effect on economic growth.5 Greenaway et al. (1999) found that export specialization is
positively related to growth in developing countries over the period of 1980 to 1990.6 Worz (2005)
presented further evidence that the selected specialization of exports in the high-tech sectors matters
for growth. Plumper and Graff (2001) established that export specialization is important for growth.
Fosu (1990) showed that developing countries specializing in manufacturing achieved higher
economic growth than those specializing in primary sector exports.7 Naude et al. (2010) suggested
that export specialization rather than export diversification is associated with the local economic
growth of a country.
Given the diverse results with the regard to the effect of export structure, adding this dimension to
the framework of the present research is important to determine the effect of export diversification or
specialization on growth. In this study, we investigate the role of export diversification together with
other international integration variables using the HH-based export diversification index.
Export growth
Exports and export growth are widely discussed topics in economic literature. Many scholars have
been discussing these issues, especially after the rise of East Asia with export-led growth. Recent
studies also recognize the importance of exports and export survival, but they tend to raise more
questions about the sustenance of exports rather than the effect of exports on economic growth. For
instance, Brenton et al. (2010) found that the initial size of export flow is among the important
determinants of its survival, and Hausman et al. (2007) found that export goods associated with high
productivity levels grow rapidly. Eaton et al. (2008), Besedes and Prusa (2007), Brenton and
Newfarmer (2007), Helpman et al. (2008), and Felbermayr and Kohler (2006) indicated that the
length of trade relationships matters for the survival of export growth. Besedes and Prusa (2006a) and
Nitsch (2009) asserted that the duration of trade flow is important in the survival of export growth.
Gorg et al. (2007) and Cadot et al. (2009) found that the long survival of a product is a comparative
advantage for the country.
By contrast, our interest leans toward explaining the value of export growth in the economic growth
of developing countries. Our straightforward answer is that exports are important because they are a
hard (foreign) currency gainer for developing countries. For growth, developing countries need to
invest especially in capital goods. To engage in capital investment, these countries should also have
hard currencies (dollars) to import capital goods from foreign countries. In other words, export growth
5 Their analysis used 90 countries and the data from 1980 to 1990. POLS, FE, and LSDV methods were used for the
estimation. 6 They used GMM estimation for 69 LDCs and OECD countries, and the selected data period was from 1975 to 1993.
7 Fosu (1990) uses cross-Sectional OLS estimations that were used for 64 developing countries over the period of 1960-
1980.

8
promotes economic growth by generating the foreign exchange that enables the import of machinery
and intermediate goods needed for investment. In a similar vein, Kóny (2006: p.979) observed that
‘increased exports may permit the imports of high quality products and technologies, which in turn
may have a positive effect on technological change, labor productivity, capital efficiency, and
eventually, on national production’. In other words, export is important not only for its power to
generate hard currencies but also for its productivity-enhancing effects through learning-by-exporting,
which has been confirmed in many studies (Reinhardt 2000; Jung and Lee 2010). Furthermore, most
of the developing countries or latecomer countries have market sizes that are not sufficient for their
extended production and products, and thus they need large market sizes; the only way to extend the
market size is through exporting (Hasse, 2009; Konya, 2006). Therefore, we can hypothesize that high
export performance and high export growth are important (especially in developing countries) to
achieve long-sustaining economic growth.
A country story that is consistent with this hypothesis is that of Mauritius. In an earlier study,
Subramanian and Roy (2001) explained the ‘Mauritian Miracle’ in terms of strong participatory
institutions, geography (the location of Mauritius), and ethnic diversity. By contrast, Ramanayake and
Lee (2014) argued that Mauritius faced the middle-income trap situation and explained the recent
growth slowdown in Mauritius in terms of the export slowdown associated with increasing domestic
wage rates compared with that of rival countries, such as Bangladesh in garment exports.
Summary
In summary, this study hypothesizes that export growth is a better and more robust variable to
represent the international integration to growth linkage than the traditional variables of trade
openness, FDI, and export diversification. Increasing the trade to GDP ratio cannot sustain growth
because this ratio may increase from increased imports that lead to trade deficits in many developing
countries. FDI to growth linkage is often conditional upon certain initial conditions. Moreover, it has
been subject to many criticisms as FDI may jeopardize the growth of indigenous firms, which are
necessary to sustain growth given the global footless mobility of FDI firms that are looking for cheap
wages (Lee and Mathews 2012). Export diversification is certainly a good indicator of the strength
and quality of exports but may be a long-term goal for many developing countries that tend to have
weak export capabilities. Sustaining exports requires continuous upgrading, but upgrading does not
directly mean increasing diversification because upgrading can occur in the value chain of the same
sector or by moving into a new sector, thus changing the sectors of specialization. Diversification can
then emerge as a long-term endeavor that results in a series of sequential specialization across
different sectors.

9
3. Empirical Method and the Results
3.1. Methodology and Data
This study uses the three estimation methods of the Pooled OLS (POLS) estimation, panel
estimations, and the GMM estimation. The panel approach, which was used by Islam (1995), deals
with the omitted variable bias of the OLS method. However, this approach is not free from the
possible endogeneity problem. Thus, the system–GMM estimation from Arellano and Bover (1995)
and Blundell and Bond (1998) is applied to correct this potential problem. To evaluate the system–
GMM estimation model specifications, we use two criteria: the Hansen over-identification test and the
test for second-order serial correlation (AR2) of the residuals in the first differenced equation. The AR
(2) test also provides additional checks on the specification of the model and on the legitimacy of the
instrumental variables in the differenced equation.
In the regression, we use the standard growth model specifications that consist of the typical control
variables (Xit), a set of the interest variables (Zit), and other controls (Oit) as follows:
= Function (Xit, Zit, Oit) + , (1)
where is the GDP per capita growth rate in country i in year t, and is the error terms. Xit
variables include the (log) initial GDP per capita of a country i expressed in constant US dollars
(ln_intgdp ), population growth (popgrowth ), human capital (H_cap ) measured using the primary
and secondary school enrollment, and gross capital formation (P_cap ). Our variables (Zit) of interest
include the four variables of export: growth rate ( , trade openness ( , export
diversification ( , and FDI ( . The additional controls (Oit) include
democracy ), which represents institutions, and life expectancy ( , which represents
the basic health conditions of populations. Therefore, we have the following simple growth equation:
. (2)
In the regression, four variables of interest that represent economic integration are used individually
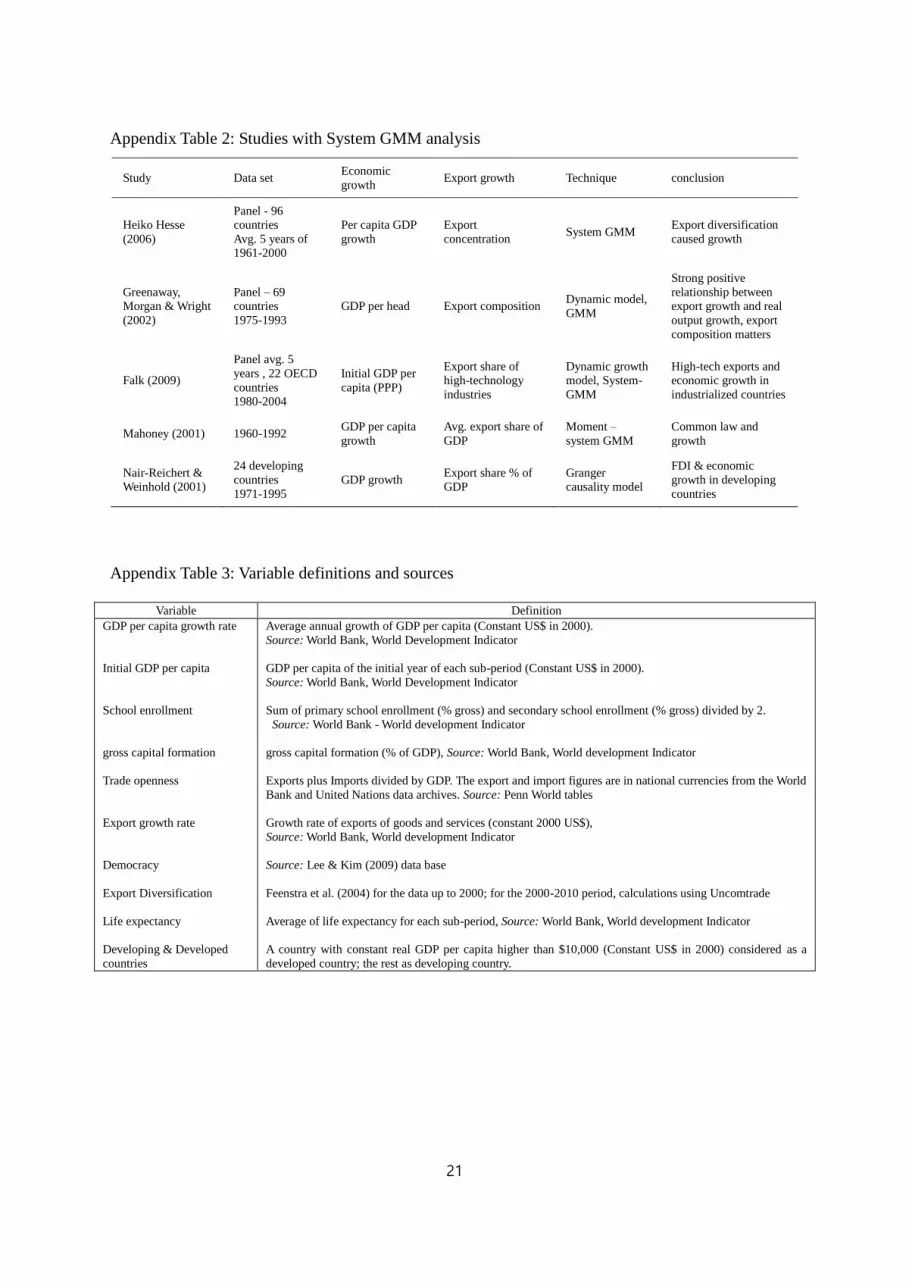
or together as a pair or a group. A detailed explanation of the definitions of the variables and the data
sources is presented in Appendix Table 3. The descriptive statistics are presented as Table 1, and
correlation tables are presented as Appendix Tables 4. The data period is from 1980–2009, which is
divided into six sub-periods, and we consider 156 developing and 49 developed countries.

10
Table 1: Descriptive statistics of the key variables
Variables Developing Countries Developed Countries
Obs. Mean Std. Dev. Min Max Obs. Mean Std. Dev. Min Max
GDP per capita growth 819 1.51 4.91 -42.88 33.14 263 2.15 2.50 -7.16 13.85
Log initial GDP per capita 797 3.04 0.50 1.79 4.20 260 4.29 0.23 3.53 4.95
Population growth 932 1.78 1.36 -4.99 6.81 284 1.24 1.83 -16.05 12.08
School enrollment 816 71.21 24.40 7.94 125.07 211 96.86 14.30 25.28 140.56
Gross capital formation 793 23.39 9.02 3.58 86.79 220 23.11 5.27 11.45 47.50
Export growth rate 593 6.16 8.96 -21.20 73.76 183 5.35 3.59 -3.01 17.72
Trade openness 836 82.13 42.60 1.75 266.42 228 91.97 70.69 12.44 448.67
Export diversification Index (1-HHI) 717 0.65 0.21 0.05 0.96 213 0.75 0.20 0.15 0.95
FDI net inflow (% of GDP) 797 3.36 6.45 -16.64 121.66 212 7.66 36.35 -2.44 388.44
Life expectancy 912 62.81 9.69 29.00 80.00 255 75.98 3.38 65.00 82.00
Democracy 724 -1.33 17.24 -88.00 10.00 178 7.78 4.40 -15.00 10.00
3.2. Regression Results
Given the four variables that represent international economic integration, namely, export growth,
trade openness, export diversification, and FDI, this section tests the robustness of these variables as
determinants of economic growth in countries with different income levels. Robustness is verified in
several steps. First, we run growth regressions with each of the integration variable separately with the
basic control variables. Second, we try different pairs of integration variables, such as export growth
and trade openness with a regression. Third, we combine the four integration variables as the final test.
In these experiments, we run the POLS, fixed effects, and GMM model for each regression model.
The robustness is confirmed only when the variables are significant in all three estimation methods, or
at least in both the fixed and GMM methods. Before running this robustness check, we check the
correlation coefficients among the four integration variables. As they are not highly correlated, we
continue using our model (See Table 2 for the pair wise correlations).
Table 2: Pair wise correlations of the four economic integration variables
Developing Export
growth
Trade
openness
Export diversification
(1-HHI)
FDI net inflow
(% of GDP)
Export growth 1.0000
Trade openness -0.0353 1.0000
Export diversification (1-HHI) 0.0058 0.0660 1.0000
FDI net inflow (% of GDP) 0.2133 0.4046 0.1066 1.0000
Developed Export
growth
Trade
openness
Export diversification
(1-HHI)
FDI net inflow
(% of GDP)
Export growth 1.0000
Trade openness -0.0003 1.0000
Export diversification (1-HHI) 0.1255 -0.2751 1.0000
FDI net inflow (% of GDP) 0.0421 0.6647 0.0187 1.0000

11
First, Table 3 shows the results for the first step or one integration variable in each model separately
for the developing and developed country groups. All the four variables are significant in both the
fixed and GMM results for the developing country group. In other words, the estimated coefficient of
the export growth variable is positively significant for both developing and developed samples. Trade
openness is significant in developing countries but insignificant in developed countries. The FDI
variable is significant in developing countries but insignificant in developed countries. The export
diversification index is negative and significant in developing countries but insignificant in developed
countries.
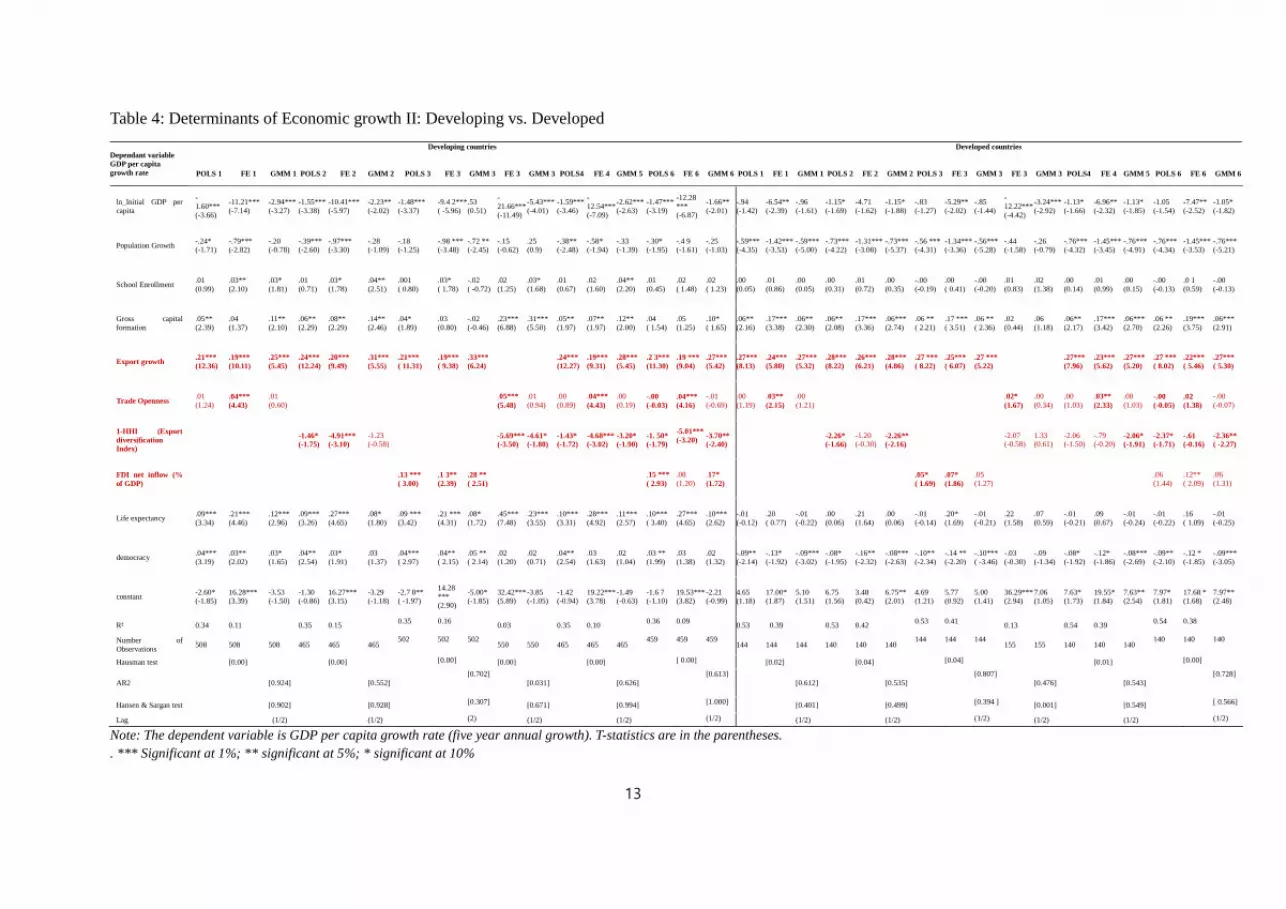
These results change in Table 4 when we try different pairs of the variables and all four in a single
regression model. First, according to the pairwise results, trade openness and export diversification
fail to be significant in both the fixed and GMM results according to the pairwise results, whereas
export growth and DFI are significant in both the fixed and GMM results. Second, only the export
growth and export diversification variables remain significant in both fixed and GMM for the results
involving all four variables. These two variables are actually significant in the OLS, fixed, and GMM
results. In the results of the developed country group, the only variable that passes the test is export
growth. None of the other three variables are significant in both the fixed and GMM results for the
pairwise and all-together models.
Therefore, the emerging picture is that export growth is the only variable that is significant and
robust as a determinant of economic growth in both developing and developed countries. If we
analyze the GMM results with all the four integration variables together, we can also see that export
diversification is negative and significant in all three specifications of OLS, fixed, and GMM in
developing countries. This result implies that sustaining economic growth by not diversifying but by
specializing into a few sectors is the effective way to sustain economic growth in developing countries.
With regard to the other control variables, fixed capital formation and life expectancy are positive and
significant when all the four integration variables are analyzed together, whereas the democracy
variable that represents political institutions is not significant in the economic growth of developing
countries.

12
Table 3: Determinants of Economic growth I: Developing Vs. Developed
Dependant variable
GDP per capita
growth rate
Developing countries Developed countries
POLS 1 FE 1 GMM 1 POLS 2 FE 2 GMM 2 POLS 3 FE 3 GMM 3 POLS 4 FE 4 GMM 4 POLS 1 FE 1 GMM 1 POLS 2 FE 2 GMM2 POLS3 FE 3 GMM 3 POLS 4 FE 4 GMM 4
ln_Initial GDP per
capita
-1.56***
(-3.57)
-9.71***
(-6.18)
-3.01***
(-3.13)
-1.32***
(-2.67)
-16.62***
(-10.15)
-4.72***
(-3.42)
-1.93***
(-3.71)
-19.34***
(-10.29)
-5.01***
(-3.86)
-1.56***
(-3.54)
-10.45 ***
(-6.73)
-3.43***
(-2.89)
-.93
(-1.41)
-4.52*
(0.087)
-.92
(-1.43)
-3.14***
(-3.54)
-11.36***
(-4.96)
-3.58***
(-3.58)
-2.99***
(-3.28)
-11.14***
(-4.11)
-4.16***
(-3.29)
-3.02 ***
(-3.42)
-11.50***
(-5.14)
-3.76 ***
(-3.17)
Population Growth
-.26*
(-1.83)
-1.12***
(-4.02)
-.34
(-1.34)
.08
(0.51)
-.29
(-1.20)
.37
(1.26)
-.04
(-0.23)
-.45*
(-1.89)
.17
(0.63)
.06
(0.44)
-.30
(-1.31)
.11
(0.40)
-.55***
(-4.17)
-1.28***
(-3.17)
-.56***
(-4.89)
-.31**
(-2.39)
-.42
(-1.57)
-.33
(-1.12)
-.25
(-1.60)
-.44
(-1.60)
-.26
(-0.78)
-.34***
(-2.63)
-.47 *
(-1.79)
-.32
(-1.17)
School Enrollment
.01
(1.06)
.03**
(2.07)
.04**
(2.44)
.00
(0.33)
.02
(1.58)
.02
(1.12)
-.00
(-0.08)
.02
(1.43)
.04**
(2.04)
.00
(0.02)
.02
(1.25)
.02
(1.07)
.00
(0.30)
.01
(0.67)
.00
(0.16)
.02
(1.600
.01
(0.76)
.03
(1.61)
.02
(1.55)
.01
(0.76)
.03
(1.58)
.05
(1.10)
.05
(0.33)
.02
(1.03)
Gross capital
formation
.06***
(2.91)
.06**
(1.96)
.12**
(2.35)
.19***
(8.16)
.16***
(5.37)
.31***
(4.52)
.19***
(7.64)
.27***
(7.88)
.32***
(5.67)
.09 ***
(4.36)
.09 ***
(2.85)
0.20***
(3.09)
.06**
(2.04)
.17***
(3.39)
.05**
(2.02)
.06*
(1.66)
.03
(0.49)
.07
(1.20)
.06
(1.55)
.04
(0.79)
.07
(1.35)
.07*
(1.85)
.06
(1.17)
.07
(1.41)
Export growth
.22***
(12.30)
.19***
(10.23)
.28***
(5.49)
.28***
(8.31)
.26***
(6.38)
.28***
(4.95)
Trade Openness
.00
(0.24)
.05***
(5.95)
.02*
(1.78)
-.00
(-0.02)
.02
(1.49)
.00
(0.09)
1-HHI (Export
diversification
Index)
-.94
(-0.96)
-6.45***
(-3.89)
-4.87*
(-1.70)
1.28
(0.86)
-.91
(-0.26)
.44
(0.19)
FDI net inlow (%
of GDP)
.31***
(8.41)
.25 ***
(5.25)
.24***
(3.86)
.06
(1.49)
.13***
(2.63)
.07
(1.12)
Life expectancy
.09***
(3.25)
.23***
(4.68)
.11***
(2.63)
.07**
(2.27)
.30***
(5.45)
.17***
(2.74)
.11***
(3.53)
.45***
(7.45)
.22***
(3.41)
.09***
(3.30)
.26 ***
(5.09)
.16***
(3.03)
.01
(0.09)
.20*
(1.71)
.00
(0.06)
.06
(0.84)
.22
(1.63)
.06
(0.48)
.06
(0.79)
.35***
(3.03)
.09
(0.80)
.04
(0.66)
.31***
(2.92)
.07
(0.56)
democracy
.04***
(3.12)
.03**
(2.12)
.03
(1.51)
.02*
(1.83)
.04***
(2.63)
.04
(1.55)
.02
(1.16)
.02
(1.38)
.02
(0.69)
.05***
(3.95)
.05 ***
(3.37)
.06***
(3.36)
-.09**
(-2.18)
-.15**
(-2.36)
-.09***
(-3.09)
-.08
(-1.44)
-.03
(-0.36)
-.08
(-1.12)
-.10*
(-1.68)
-.05
(-0.55)
-.08
(-1.30)
-.08
(-1.52)
-.0 4
(-0.43)
-.07
(-1.15)
constant -2.43*
(-1.74)
13.66***
(2.79)
-2.99
(-1.19)
-3.51**
(-2.33)
23.71***
(4.62)
-5.32
(-1.32)
-3.32**
(-2.11)
28.78***
(5.14)
-3.94
(-1.07)
-2.60*
(-1.93)
12.85***
(2.66)
-4.69
(-1.59)
3.74
(0.97)
2.14
(0.35)
4.13
(1.09)
8.10
(1.61)
31.34***
(3.31)
9.42
(1.45)
6.78
(1.26)
22.32**
(2.43)
8.82
(1.19)
8.94*
(1.78)
26.05 ***
(3.91)
10.27
(1.55)
R² 0.34 0.16 0.14 0.02 0.16 0.03 0.26 0.08 0.52 0.41 0.19 0.15 0.20 (0.16) (0.21) (0.18)
Number of
Observations 508 508 508 607 607 607 557 557 557 602 602 602 144 144 144 159 159 159 155 155 159 159 159
Hausman test
[0.00] [0.00] [0.00] [0.00] [0.04] [0.00] [0.01] [0.00]
AR2
[0.878] [0.012] [0.037] (0.003) [0.573] [0.507] [0.519] 0.308
Hansen & Sargan
test [0.668] [0.315] [0.329] (0.217) [0.145] [0.001] [0.001] [0.001]
Lag
(1/2) (1/2) (1/2) (1/2) (1/2) (1/2) (1/2) (1/2)
Note: The dependent variable is GDP per capita growth rate ( five year annual averages over the 6 sub-periods during 1980-2009). Figures in parentheses are t-statistics.
*** Significant at 1%;** significant at 5%; * significant at 10%
13
Table 4: Determinants of Economic growth II: Developing vs. Developed
Note: The dependent variable is GDP per capita growth rate (five year annual growth). T-statistics are in the parentheses.
. *** Significant at 1%; ** significant at 5%; * significant at 10%
Dependant variable
GDP per capita
growth rate
Developing countries Developed countries
POLS 1 FE 1 GMM 1 POLS 2 FE 2 GMM 2 POLS 3 FE 3 GMM 3 FE 3 GMM 3 POLS4 FE 4 GMM 5 POLS 6 FE 6 GMM 6 POLS 1 FE 1 GMM 1 POLS 2 FE 2 GMM 2 POLS 3 FE 3 GMM 3 FE 3 GMM 3 POLS4 FE 4 GMM 5 POLS 6 FE 6 GMM 6
ln_Initial GDP per
capita
-
1.60***
(-3.66)
-11.21***
(-7.14)
-2.94***
(-3.27)
-1.55***
(-3.38)
-10.41***
(-5.97)
-2.23**
(-2.02)
-1.48***
(-3.37)
-9.4 2***
( -5.96)
.53
(0.51)
-
21.66***
(-11.49)
-5.43***
(-4.01)
-1.59***
(-3.46)
-
12.54***
(-7.09)
-2.62***
(-2.63)
-1.47***
(-3.19)
-12.28
***
(-6.87)
-1.66**
(-2.01)
-.94
(-1.42)
-6.54**
(-2.39)
-.96
(-1.61)
-1.15*
(-1.69)
-4.71
(-1.62)
-1.15*
(-1.88)
-.83
(-1.27)
-5.29**
(-2.02)
-.85
(-1.44)
-
12.22***
(-4.42)
-3.24***
(-2.92)
-1.13*
(-1.66)
-6.96**
(-2.32)
-1.13*
(-1.85)
-1.05
(-1.54)
-7.47**
(-2.52)
-1.05*
(-1.82)
Population Growth -.24* (-1.71)
-.79*** (-2.82)
-.20 (-0.78)
-.39*** (-2.60)
-.97*** (-3.30)
-.28 (-1.09)
-.18 (-1.25)
-.98 *** (-3.48)
-.72 ** (-2.45)
-.15 (-0.62)
.25 (0.9)
-.38** (-2.48)
-.58* (-1.94)
-.33 (-1.39)
-.30* (-1.95)
-.4 9 (-1.61)
-.25 (-1.03)
-.59*** (-4.35)
-1.42*** (-3.53)
-.59*** (-5.00)
-.73*** (-4.22)
-1.31*** (-3.08)
-.73*** (-5.37)
-.56 *** (-4.31)
-1.34*** (-3.36)
-.56*** (-5.28)
-.44 (-1.58)
-.26 (-0.79)
-.76*** (-4.32)
-1.45*** (-3.45)
-.76*** (-4.91)
-.76*** (-4.34)
-1.45*** (-3.53)
-.76*** (-5.21)
School Enrollment .01
(0.99)
.03**
(2.10)
.03*
(1.81)
.01
(0.71)
.03*
(1.78)
.04**
(2.51)
.001
( 0.80)
.03*
( 1.78)
-.02
( -0.72)
.02
(1.25)
.03*
(1.68)
.01
(0.67)
.02
(1.60)
.04**
(2.20)
.01
(0.45)
.02
( 1.48)
.02
( 1.23)
.00
(0.05)
.01
(0.86)
.00
(0.05)
.00
(0.31)
.01
(0.72)
.00
(0.35)
-.00
(-0.19)
.00
( 0.41)
-.00
(-0.20)
.01
(0.83)
.02
(1.38)
.00
(0.14)
.01
(0.99)
.00
(0.15)
-.00
(-0.13)
.0 1
(0.59)
-.00
(-0.13)
Gross capital
formation
.05**
(2.39)
.04
(1.37)
.11**
(2.10)
.06**
(2.29)
.08**
(2.29)
.14**
(2.46)
.04*
(1.89)
.03
(0.80)
-.02
(-0.46)
.23***
(6.88)
.31***
(5.50)
.05**
(1.97)
.07**
(1.97)
.12**
(2.00)
.04
( 1.54)
.05
(1.25)
.10*
( 1.65)
.06**
(2.16)
.17***
(3.38)
.06**
(2.30)
.06**
(2.08)
.17***
(3.36)
.06***
(2.74)
.06 **
( 2.21)
.17 ***
( 3.51)
.06 **
( 2.36)
.02
(0.44)
.06
(1.18)
.06**
(2.17)
.17***
(3.42)
.06***
(2.70)
.06 **
(2.26)
.19***
(3.75)
.06***
(2.91)
Export growth .21***
(12.36)
.19***
(10.11)
.25***
(5.45)
.24***
(12.24)
.20***
(9.49)
.31***
(5.55)
.21***
( 11.31)
.19***
( 9.38)
.33***
(6.24)
.24***
(12.27)
.19***
(9.31)
.28***
(5.45)
.2 3***
(11.30)
.19 ***
(9.04)
.27***
(5.42)
.27***
(8.13)
.24***
(5.80)
.27***
(5.32)
.28***
(8.22)
.26***
(6.21)
.28***
(4.86)
.27 ***
( 8.22)
.25***
( 6.07)
.27 ***
(5.22)
.27***
(7.96)
.23***
(5.62)
.27***
(5.20)
.27 ***
( 8.02)
.22***
( 5.46)
.27***
( 5.30)
Trade Openness .01
(1.24) .04***
(4.43)
.01
(0.60)
.05***
(5.48)
.01
(0.94)
.00
(0.89)
.04***
(4.43)
.00
(0.19) -.00
(-0.03)
.04***
(4.16)
-.01
(-0.69)
.00
(1.19)
.03**
(2.15)
.00
(1.21)
.02*
(1.67)
.00
(0.34)
.00
(1.03)
.03**
(2.33)
.00
(1.03) -.00
(-0.05)
.02
(1.38)
-.00
(-0.07)
1-HHI (Export
diversification
Index)
-1.46*
(-1.75)
-4.91***
(-3.10)
-1.23 (-0.58)
-5.69***
(-3.50)
-4.61*
(-1.80)
-1.43*
(-1.72)
-4.68***
(-3.02)
-3.20*
(-1.90)
-1. 50*
(-1.79)
-5.01***
(-3.20)
-3.70**
(-2.40)
-2.26*
(-1.66)
-1.20 (-0.30)
-2.26**
(-2.16)
-2.07 (-0.58)
1.33 (0.61)
-2.06 (-1.50)
-.79 (-0.20)
-2.06*
(-1.91) -2.37*
(-1.71)
-.61
(-0.16)
-2.36**
( -2.27)
FDI net inflow (%
of GDP)
.13 ***
( 3.00)
.1 3**
(2.39)
.28 **
( 2.51)
.15 ***
( 2.93)
.08
(1.20)
.17*
(1.72)
.05*
( 1.69)
.07*
(1.86)
.05
(1.27)
.06
(1.44)
.12**
( 2.09)
.06
(1.31)
Life expectancy .09***
(3.34)
.21***
(4.46)
.12***
(2.96)
.09***
(3.26)
.27***
(4.65)
.08*
(1.80)
.09 ***
(3.42)
.21 ***
(4.31)
.08*
(1.72)
.45***
(7.48)
.23***
(3.55)
.10***
(3.31)
.28***
(4.92)
.11***
(2.57)
.10***
( 3.40)
.27***
(4.65)
.10***
(2.62)
-.01
(-0.12)
.20
( 0.77)
-.01
(-0.22)
.00
(0.06)
.21
(1.64)
.00
(0.06)
-.01
(-0.14)
.20*
(1.69)
-.01
(-0.21)
.22
(1.58)
.07
(0.59)
-.01
(-0.21)
.09
(0.67)
-.01
(-0.24)
-.01
(-0.22)
.16
( 1.09)
-.01
(-0.25)
democracy .04***
(3.19)
.03**
(2.02)
.03*
(1.65)
.04**
(2.54)
.03*
(1.91)
.03
(1.37)
.04***
( 2.97)
.04**
( 2.15)
.05 **
( 2.14)
.02
(1.20)
.02
(0.71)
.04**
(2.54)
.03
(1.63)
.02
(1.04)
.03 **
(1.99)
.03
(1.38)
.02
(1.32)
-.09**
(-2.14)
-.13*
(-1.92)
-.09***
(-3.02)
-.08*
(-1.95)
-.16**
(-2.32)
-.08***
(-2.63)
-.10**
(-2.34)
-.14 **
(-2.20)
-.10***
( -3.46)
-.03
(-0.30)
-.09
(-1.34)
-.08*
(-1.92)
-.12*
(-1.86)
-.08***
(-2.69)
-.09**
(-2.10)
-.12 *
(-1.85)
-.09***
(-3.05)
constant -2.60* (-1.85)
16.28*** (3.39)
-3.53 (-1.50)
-1.30 (-0.86)
16.27*** (3.15)
-3.29 (-1.18)
-2.7 8** ( -1.97)
14.28
*** (2.90)
-5.00* (-1.85)
32.42*** (5.89)
-3.85 (-1.05)
-1.42 (-0.94)
19.22*** (3.78)
-1.49 (-0.63)
-1.6 7 (-1.10)
19.53*** (3.82)
-2.21 (-0.99)
4.65 (1.18)
17.00* (1.87)
5.10 (1.51)
6.75 (1.56)
3.48 (0.42)
6.75** (2.01)
4.69 (1.21)
5.77 (0.92)
5.00 (1.41)
36.29*** (2.94)
7.06 (1.05)
7.63* (1.73)
19.55* (1.84)
7.63** (2.54)
7.97* (1.81)
17.68 * (1.68)
7.97** (2.48)
R² 0.34 0.11 0.35 0.15 0.35 0.16
0.03 0.35 0.10 0.36 0.09
0.53 0.39 0.53 0.42 0.53 0.41
0.13 0.54 0.39 0.54 0.38
Number of
Observations 508 508 508 465 465 465
502 502 502 550 550 465 465 465
459 459 459 144 144 144 140 140 140
144 144 144 155 155 140 140 140
140 140 140
Hausman test
[0.00] [0.00] [0.00] [0.00] [0.00] [ 0.00] [0.02] [0.04] [0.04] [0.01] [0.00]
AR2
[0.924] [0.552]
[0.702]
[0.031] [0.626]
[0.613]
[0.612] [0.535]
[0.807]
[0.476] [0.543]
[0.728]
Hansen & Sargan test
[0.902] [0.928] [0.307] [0.671] [0.994] [1.000] [0.401] [0.499] [0.394 ] [0.001] [0.549] [ 0.566]
Lag
(1/2) (1/2) (2) (1/2) (1/2) (1/2) (1/2) (1/2) (1/2) (1/2) (1/2) (1/2)

14
As an additional robustness check of the export growth variable, we run regressions for the long-
term economic growth with the per capita GDP growth over the 15-year period as the dependent
variable (1995–2009). For the groups of developing countries, developed countries, and all countries,
we run OLS estimations with a main concern on the variables of export growth and trade openness,
respectively, and other controls. Table 5 presents the results. The export growth variable is still
positive and significant for the models of the developing, developed, and all countries. However, trade
openness has an insignificant coefficient on the growth of developing, developed, and all countries.
Capital formation and life expectancy remain significant, whereas democracy is not.
Table 5: Determinants of ‘longer term’ economic growth: Cross-country analysis
Note: The dependent variable is GDP per capita growth rate over the fifteen years (1995-2009). Figures in parentheses are t
& z statistics. *** Significant at 1%; ** significant at 5%; * significant at 10%
4. Summary and Concluding Remarks
This research revisits the determinants of economic growth in developing countries with a focus on
international integration variables. The four alternative variables of export growth, trade openness,
export diversification, and FDI are used in a single framework. This study finds that aside from export
Dependent variable
GDP per capita growth rate
Period : 1995-2009 (OLS)
Developing Developed All
1 2 1 2 1 2
ln_Initial GDP per capita -1.44***
(-2.79)
-1.47**
(-2.26)
-1.44***
(-2.79)
-1.47**
(-2.26)
-1.86***
(-4.93)
-1.84***
(-3.95)
Population Growth -.34
(-1.57)
-.17
(-0.65)
-.34
(-1.57)
-.17
(-0.65)
-.29*
(-1.77)
-.11
(-0.54)
School Enrollment
.02
(1.35)
.02
(0.97)
.02
(1.35)
.02
(0.97)
.02*
(1.80)
.02
(1.29)
Gross capital formation .07**
(2.07)
.14***
(3.12)
.07**
(2.07)
.14***
(3.12)
.07**
(2.34)
.12***
(3.32)
Export growth .21***
(6.15)
.21***
(6.15)
.21***
(6.80)
Trade openness
-.01
(-1.08)
-.01
(-1.08)
-.002
(-0.38)
Democracy -.00
(-0.01)
-.03*
(-1.90)
-.00
(-0.01)
-.03*
(-1.90)
-.00
(-0.01)
-.03*
(-1.91)
Landlocked dummy .51
(1.16)
.44
(0.79)
.51
(1.16)
.44
(0.79)
.39
(1.05)
.26
(0.57)
Life expectancy .09***
(2.92)
.07*
(1.70)
.09***
(2.92)
.07*
(1.70)
.09***
(3.34)
.07*
(1.96)
Tropical climate dummy -.41
(-0.87)
-.78
(-1.29)
-.41
(-0.87)
-.78
(-1.29)
-.40
(-0.99)
-.88*
(-1.70)
constant -2.63
(-1.31)
-.11
(-0.04)
-2.63
(-1.31)
-.11
(-0.04)
-1.75
(-1.07)
.55
(0.27)
R² 0.61 0.34 0.61 0.34 0.60 0.34
Number of Observations 95 108 95 108 120 134

15
specialization, export growth is the most robust and that the traditional variables of trade openness
and FDI are not robust. This result is based on econometric estimations using not only cross-section
and fixed-effect panel estimations but also system–GMM estimations. This aggregate level evidence
of importance of export growth is consistent with the firm-level analysis in Lee and Temesgen (2009)
which find a robust impact of export-orientation on firm growth in a large sample of developing
countries, in contrast to the weak impacts of firms engaged in FDI.
The results in this study warn against the traditional emphasis on simple trade openness and FDI as
policy prescriptions for developing countries. In other words, opening an economy for international
integration or for inviting FDI into a host country does not guarantee sustained economic growth
unless these actions lead to export growth, which requires capability building in indigenous firms and
investments in innovation (Jung and Lee 2010). This observation is consistent with the experiences of
successful catching-up economies in Asia, such as Korea, Taiwan, and China.
With these results and the literature on other determinants of growth at different stages of
development, such as Lee and Kim (2009) on the role of institution, education, and innovation, Lee et
al. (2012) on the role of large businesses for middle- or high-income countries, and Kim et al. (2012)
on the role of minor (petit patents) versus regular (regular patents) forms of IPR (intellectual property
rights) protection for economic growth in the South versus the North, we may deliver a
comprehensive picture of economic growth at different stages of economic development. Therefore,
the important variables for economic growth at the low- and lower-middle income level of
development include the variables of export growth, export specialization, political institutions, minor
forms of IPR protection (utility models), and primary and secondary education. For economic growth
at the upper-middle or higher income stages, the important concepts are the variables of innovation,
large business, regular patent protection, high education, and export growth.
Acknowledgements
The authors acknowledge the support from the Korean government through the National Research
Foundation of Korea (NRF-2013S1A3A2053312).
16
References
Acemoglu, D., Johnson, S., & Robinson, J. A. (2001) The colonial origins of comparative
development: An empirical investigation. American Economic Review, 91, 1369–1401.
Acemoglu, D., Johnson, S., & Robinson, J. A. (2002) Reversal of fortune: Geography and institutions
in the making of the modern world income distribution, Quarterly Journal of Economics,
117, 1231– 1294.
Agosin, M.R. (2007) Export diversification and growth in emerging economies, Economiay Negocios,
Universidad De Chiles, SDT 233, P. 1-35
Al-Marhubi, F., (2000) Export diversification and growth: an empirical Investigation, Applied
Economics Letters, 7:9, 559-562
Amurgo-Pacheco, A. and Pierola, A.D. (2008) Patterns of Export Diversification in Developing
Countries, The World Bank, Policy Research Working Paper 447
Arellano, M. and Bover, O. (1995) Another look at instrumental variable estimation of error-
component models, Journal of Econometrics, 68, p.29-51
Arthur Lewis, W. (1980) The Slowing Down of the engine of Growth, The American Economic
Review, P.555-564
Balaguer, J. and Cantavella-Jorda ́, M. (2004) Structural change in exports and economic growth:
cointegration and causality analysis for Spain (1961-2000), Applied Economics, 36, 473–77
Balasubramanyam,V.N., Salisu,M. and Sapsford,D. (1996) Foreign Direct Investment and Growth in
EP and IS Countries, The Economic Journal, io6 (January), 92-I05.
Balcao Reis, A. (2001) On the welfare effects of foreign investment, Journal of international
Economics, 54(2), 411-427
Balassa Bela, (1985) exports, Policy choice, and economic Growth in developing Countries after the
1973 Oil Shock, Journal of Development economics, 18, 23-35, North-Holland.
Ben-David, D. (1993) Equalizing Exchange: Trade Liberalization and Income Convergence, The
Quarterly Journal of Economics, P.653-675.
Besedesˇ, T., Prusa, T.J.,(2006a) Ins, outs, and the duration of trade, Canadian Journal of Economics
39, 266–295.
Besedes, T. and Prusa, T., (2006b) Product Differentiation and Duration of U.S. Import Trade, Journal
of International Economics, 70: 339-358.
Besedes, T. and T. Prusa (2007) The Role of Extensive and Intensive Margins and Export Growth,
NBER Working Paper 13628.
Blundell, R. and Bond, S. (1998) Initial conditions and moments conditions in dynamic panel data
models, Journal of Econometrics, 87, p.115-143
Borensztein, E., De Gregorio, J. and Lee, J-W. (1998) How does foreign direct investment affect
economic 1 growth?, Journal of International Economics 45 ,p. 115–135
Borner, Silvio, Aymo Brunetti, and Beatrice Weder. 1995. Political Credibility and Economic
Development, London: Macmillan
Brenton, P., and R. Newfarmer (2007) Watching More Than the Discovery Channel: Export Cycles
and Diversification in Development.‛ Policy Research Working Paper 4302, World Bank,
Washington DC
Brenton, P. Saborowski, C. and Uexkull, E. (2010) What Explains the Low Survival Rate of
Developing Country Export Flows?, THE WORLD BANK ECONOMIC REVIEW, VOL. 24,
NO. 3, pp. 474–499
Cadot, O., Carrere, C. and Kahn, V. (2009) Export Diversification: What’s behind the Hump? P.1-39
(http://works.bepress.com/ocadot/12)
Carkovic, M., & Levine, R. (2002) Does foreign direct investment accelerate economic growth? U of
Minnesota Department of Finance Working Paper.
Cline, W. R., (1982) Can the East Asian Model of Development Be Generalized?, World Development,
Vol. 10, No. 2, pp. 81-90.
Dalum, B. Laursen, K. and Verspagen, B., (1999) doest specialization matter for growth?, Industrial

17
and corporate change, vol.8
Dennis, A. and Shephers, B. (2007) Trade Costs, Barriers to Entry, And Export Diversification in
Developing Countries, Policy Research Working Paper 4368, The World Bank, P.1-40.
Dollar, D. (1992) Outward-Oriented Developing Economies Really do grow more rapidly: Evidence
from 95 LDSs, 1976-85, Economic Development and Cultural Change, 40(3), P. 523-544.
Doytch N. and Uctum, M., (2011) Does the worldwide shift of FDI from manufacturing to services
accelerate economic growth? A GMM estimation study, Journal of International Money and
Finance, 30 (2011) 410–427.
Durham, J. B. (2004) Absorptive capacity and the effects of foreign direct investment and equity
foreign portfolio investment on economic growth. European economic review, 48(2), 285-
306.
Easterly, W. (2005) What Did Structural Adjustment Adjust? The Association of Policies and Growth
with Repeated IMF and World Bank Loans, Journal of Development Economics 76(1): P.1-
22
Eaton, J., Eslava, M., Kugler, M. and Tybout, J. (2008) _Export dynamics in Colombia: transaction-
level evidence_, in (E. Helpman, D. Marin and T. Verdier, eds), The Organization of Firms in
a Global Economy, Cambridge, MA: Harvard University Press, P. 231–72,
Edwards, S. (1989) Real Exchange Rates, Devaluation and Adjustment: Exchange Rate Policy in
Developing Countries, MIT Press, Cambridge.
Eichengreen, B., Park, D. and Shin, K. (2012) When Fast Growing Economies Slow Down:
International Evidence and Implications for China, Asian Economic Papers 11, pp.42-87.
Eichengreen,B. Park, D. and Shin, K. (2013) Growth Slowdown Redux: New Felipe, Jesus, Arnelyn
Abdon, and Utsav Kumar.(2012) Tracking the Middle-income Trap: What Is It, WhoIs in It,
and Why? Levy Economics Institute Working Paper no. 715.
Felbermayr, Gabriel J., Kohler, Wilhelm, (2006) Exploring the intensive and extensive margins of
world trade. Review of World Economics 142 (4), P. 642–674
Felipe, Jesus, Arnelyn Abdon, and Utsav Kumar.(2012) Tracking the Middle-income Trap: What Is It,
WhoIs in It, and Why? Levy Economics Institute Working Paper no. 715.
Fosu, A. K. (1990) Export Composition and the Impact of Exports on Economic Growth of
Developing Countries, Economic Letters, 34, 67–71.
Frankel, J., Romer, D. (1999) Does trade cause growth?, American Economic Review 89 (3), 379–399.
Ferranti, D., Perry, G. E., Lederman, D. and Maloney, W. F. (2002) From Natural Resources tothe
Knowledge Economy, The World Bank, Washington, DC.
Fugazza, M. and Molina, A.C. (2009) The Determinants of Trade Survival. HEI Working Papers No. 5.
Glaeser, E., Porta, R. L., Lopez-de-Silanes, F., & Shleifer, A. (2004) Do institutions cause growth?
Journal of Economic Growth, 9, 271–303.
Gorg, H. Kneller, R. and Murakozy, B., (2007) What Makes a Successful Export?, CEPR Discussion
paper No. DP6614 (Available at SSRN: http://ssrn.com/abstract=1140543)
Greenaway, D. W. Morgan and P. Wright (1999) ‘Exports, Export Composition and Growth’, Journal
of International Trade and Economic Development, 8, P.41–51
Harrison. A. (1996) Openness and Growth: A time-series, cross-country analysis for Developing
Countries, Journal of Development Economics 48.P. 419-447.
Hasse, H. (2009) Export diversification and economic Growth, Breaking into New Market, World
Bank, Chapter 3, P.55-80
Hausman, R., Hwank, J., and Rodrik, D. (2007) What you export matters, Journal of Economic
Growth 12: P. 1–25
Hausmann, R., L. Pritchett, and D. Rodrik, (2005) Growth accelerations, Journal of Economic Growth
10, P. 303-329.
Helpman E, Melitz. M.J. and Rubinstein, Y. (2008) Estimating Trade Flows: Trading Partners and
Trading Volumes, The Quarterly Journal of Economics, Vol. 123, No. 2, P. 441-487.
Hermes, N., & Lensink, R. (2003) Foreign direct investment, financial development and economic
growth. The Journal of Development Studies, 40(1), P.142-163.
Hsiao, C., & Shen, Y. (2003) Foreign Direct Investment and Economic Growth: The Importance of
18
Institutions and Urbanization, Economic development and cultural change, 51(4),P. 883-896.
Islam, N. (1995) Growth Empirics: A panel data approach, Quarterly Journal of Economics, 110, P.
1127-1170.
Jones, B.J. and Olken, B.A. (2005) Do Leaders Matter? National leadership and Growth since World
War II, The Quarterly Journal of Economics, P.835- 864.
Jung, M. and Keun Lee, (2010) Sectoral systems of innovation and productivity catch-up:
determinants of the productivity gap between Korean and Japanese firms, Industrial and
Corporate Change 19(4), P.1037–1069
Jung, W. and Marshall, P. (1985) Exports, growth and causality in developing countries, Journal of
Development Economics 18, P.1-12.
Kim, Yee Kyoung, Keun Lee, Walter G. Park, and Kineung Choo, (2012), Appropriate Intellectual
Property Protection and Economic Growth in Countries at Different Levels of Development,
Research Policy 41(2), P.358-375.
Knack, S. and Keefer, P. (1995) Institutions and economic performance: cross‐country tests using
alternative institutional measures, Economics & Politics,7(3), P. 207-227
Kóny, L. (2006) Exports and growth: Granger causality analysis on OECD countries with a panel data
approach, Economic Modeling, Vol.23 - 6
Krueger, Anne O. (1978) Foreign Trade Regimes and Economic Development: Liberalization
Attempts and Consequences (Ballinger, 1978).
Lee, K. (2013) Schumpeterian Analysis of Economic Catch-up : Knowledge, Path-Creation, and the
Middle-Income Trap, Cambridge University Press, United Kingdom.
Lee, K. & Kim, B.Y. (2009) Both Institutions and Policies Matter but Differently for Different Income
Groups of Countries: Determinants of Long-Run Economic Growth Revisited, World
Development, vol.37, No.3, P. 533-549.
Lee, K. and T. Temesgen, (2009), What makes Firms Grow in Developing Countries: An Extension
of the Resource-based Theory of the Firm Growth and Empirical Analysis, International
Journal of Technological Learning, Innovation and Development, Vol. 1, no. 3: 139-172.
Lee, K., and J. Mathews, (2012) Firms in Korea and Taiwan, a book chapter in The Innovative firms in
the Emerging Market Economies, edited by John Cantwell and Ed Amann, Oxford Univ.
Press.
Lee, K., Kim, B.Y., Park, Y.Y. and Sanidas, E. (2012) Big businesses and economic growth:
Identifying a binding constraint for growth with country panel analysis, Journal of
Comparative Economics, Elsevier, P.1-22.
Little, I., T. Scitovsky and M. Scott, (1970) Zndustry and Trade in Some Developing Countries: A
Comparative Study (Paris: OECD, 1970).
Makki, S. S., & Somwaru, A. (2004) Impact of foreign direct investment and trade on economic
growth: Evidence from developing countries. American Journal of Agricultural Economics,
86(3), P.795-801.
Michaley, M. (1977) Exports and growth: An empirical investigation, Journal of Development
Economics 4, no. 1, March, P.49-54.
Naude,W. Bosker, M. & Matthee, M., (2010) Export Specialisation and Local Economic Growth, The
World Economy, doi: 10.1111/j.1467-9701.2009.01239.x
Nitsch, V. (2009) Die another day: duration in German import trade, Review of World Economics, 145,
P.133–154.
Pliimper, T. and Graff, M.(2001) Export specialization and economic Growth, Review of International
Political Economy 8:4 Winter 2001: P. 661–688
Pineres S. A. G. and Ferrantino, M. (1997) Export diversification and structural dynamics in the
growth process: the case of Chile, Journal of Development Economics, 52, P. 35- 91.
Ramanayake, S. S., & Lee, K. (2014) Growth Miracle and Slowdown in Mauritius Compared with
Bangladesh: An Example of the Adding-up Problem among Developing
Countries, Millennial Asia, 5(2), P.197-217
Reinhardt, N. (2000) Back to Basics in Malaysia and Thailand: The Role of Resource-Based Exports
in Their Export-Led Growth, World Development Vol. 28, No. 1, Elsevier Science Ltd, P.

19
57-77
Rodrik, D. (2006) Goodbye Washington consensus hello Washington confusion? Journal of Economic
Literature, 44(4), P. 973–987
Rodrik, D., Subramanian, A., & Trebbi, F. (2004) Institutions rule: The primacy of institutions over
geography and integration in economic development, Journal of Economic Growth, 9,
P.131–165.
Rodriguez, F. and Rodrik, D. (2001) Trade Policy and Economic Growth: ASkeptic’s Guide to the
Cross-National Evidence, NBER Macroeconomics Annual 2000, 0-262-02503-5, Volume 15,
P. 261 - 338
Sachs, J.D., Warner, A.M., (1995) Revised 1997, 1999. Natural resource abundance and economic
growth. National Bureau of Economic Research Working paper No. 5398, Cambridge, MA
Subramanian, A. and Roy D. (2001) Who can explain the Mauritian Miracle? MEADE, ROMER,
SACHS OR RODRIC?, Rodrik, D., In search of Prosperity, Princeton University Press, New
Jersy 08540, Chapter 8,P. 205-243.
Tyler, W.G., (1981) Growth and Export Expansion in Developing Countries- Some Empirical
Evidence, Journal of Development Economics 9 , P.121-130.
Vamvakidis, A. (1999) Regional trade agreements or broad liberalization: which path leads to faster
growth? IMF Staff Papers 46 (March), P.42– 68.
Vamvakidis,A.( 2002) How robust is the Growth-Openness Connection? Historical Evidence, Journal
of Economic growth. 7:1, P. 57-80
Volpe Martincus, C. and Carballo, J. (2008) Is export promotion effective in developing countries?
Firm-level evidence on the intensive and the extensive margins of exports, Journal of
International Economics, 76 , P.89–106
Williamson, John. (1990) What Washington Means by Policy Reform, In John Williamson, ed. Latin
American Adjustment: How Much Has Happened? Washington, D.C.: Institute for
International Economics.
Williamson, J. (Ed.) (1994) The political economy of policy reform, Washington, DC: Institute for
International Economics.
Williamson, J. (1996) Are the Latin American Reforms Sustainable? In Hermann Sautter and Rolf
Schinke, eds., Stabilization and Reforms in Latin America: Where Do We Stand? Frankfurt:
Vervuert Verlag.
World Bank, (2010) Escaping the Middle-income trap, World Bank East Asia and Pacific Economic
Update:Robust Recovery, Rising Risks, Washington DC: World Bank, Vol. 2, P. 27-43.
Worz, J. (2005) Dynamics of Trade specialization in developed and less developed countries,
Emerging Markets Finance and Trade, 41 (3): P. 92- 111
Yanikkaya, H. (2003) Trade openness and economic growth: a cross-country Empirical Investigation,
Journal of development Economics, Volume 72, Issue 1, October 2003, P. 57–89.

20
Appendix Table 1: Empirical studies on the relationship between export and economic growth
Source: Jung and Marshel (1985), Greenway et al. (1999)
21
Appendix Table 2: Studies with System GMM analysis
Study Data set Economic
growth Export growth Technique conclusion
Heiko Hesse
(2006)
Panel - 96 countries
Avg. 5 years of 1961-2000
Per capita GDP
growth
Export
concentration System GMM
Export diversification
caused growth
Greenaway, Morgan & Wright
(2002)
Panel – 69 countries
1975-1993
GDP per head Export composition Dynamic model,
GMM
Strong positive
relationship between export growth and real
output growth, export
composition matters
Falk (2009)
Panel avg. 5
years , 22 OECD
countries 1980-2004
Initial GDP per
capita (PPP)
Export share of high-technology
industries
Dynamic growth model, System-
GMM
High-tech exports and economic growth in
industrialized countries
Mahoney (2001) 1960-1992 GDP per capita
growth
Avg. export share of
GDP
Moment –
system GMM
Common law and
growth
Nair-Reichert & Weinhold (2001)
24 developing
countries
1971-1995
GDP growth Export share % of GDP
Granger causality model
FDI & economic
growth in developing
countries
Appendix Table 3: Variable definitions and sources
Variable Definition
GDP per capita growth rate
Initial GDP per capita
School enrollment
gross capital formation
Trade openness
Export growth rate
Democracy
Export Diversification
Life expectancy
Developing & Developed
countries
Average annual growth of GDP per capita (Constant US$ in 2000).
Source: World Bank, World Development Indicator
GDP per capita of the initial year of each sub-period (Constant US$ in 2000).
Source: World Bank, World Development Indicator
Sum of primary school enrollment (% gross) and secondary school enrollment (% gross) divided by 2.
Source: World Bank - World development Indicator
gross capital formation (% of GDP), Source: World Bank, World development Indicator
Exports plus Imports divided by GDP. The export and import figures are in national currencies from the World
Bank and United Nations data archives. Source: Penn World tables
Growth rate of exports of goods and services (constant 2000 US$),
Source: World Bank, World development Indicator
Source: Lee & Kim (2009) data base
Feenstra et al. (2004) for the data up to 2000; for the 2000-2010 period, calculations using Uncomtrade
Average of life expectancy for each sub-period, Source: World Bank, World development Indicator
A country with constant real GDP per capita higher than $10,000 (Constant US$ in 2000) considered as a
developed country; the rest as developing country.

22
Appendix -Table 4: Sample Correlations: Developing country Sample
Variables
Developing countries
GDP per
capita growth
Log initial
GDP per
capita
Population
growth
School
enrollment
Gross capital
formation
Export
growth rate
Trade
openness
Export
diversification
Index (1-HHI)
FDI net
inflow (% of
GDP)
Life
expecta
ncy
Democracy
GDP per capita growth 1.0000
Log initial GDP per capita 0.0505 1.0000
Population growth -0.2062 -0.4277 1.0000
School enrollment 0.1719 0.6511 -0.5864 1.0000
Gross capital formation 0.2464 0.1960 -0.2409 0.2989 1.0000
Export growth rate 0.5138 -0.0527 -0.0181 -0.0251 0.1514 1.0000
Trade openness 0.0850 0.2320 -0.2465 0.2425 0.3183 -0.0399 1.0000
Export diversification Index
(1-HHI) 0.0596 0.2197 -0.4153 0.2912 0.0825 0.0252 0.0699 1.0000
FDI net inflow (% of GDP) 0.3078 0.1210 -0.2967 0.2401 0.2990 0.2284 0.3740 0.1353 1.0000
Life expectancy 0.2268 0.7454 -0.5328 0.7369 0.3169 0.0506 0.2050 0.3398 0.1886 1.0000
Democracy 0.1521 0.2262 -0.2245 0.2666 0.1495 0.0342 0.0690 0.1875 0.1305 0.2516 1.0000


