Embed Size (px)
Citation preview
FIW, a collaboration of WIFO (www.wifo.ac.at), wiiw (www.wiiw.ac.at) and WSR (www.wsr.ac.at)
FIW – Working Paper
Do determinants of FDI to developing countries differ among OECD investors? Insights from Bayesian Model Averaging
Nikolaos Antonakakis1 and Gabriele Tondl2
The main objective of this paper is to examine the determining factors of outward FDI from four major OECD investors US, Germany, France and the Netherlands to developing countries located in different world regions. Our goal is to elucidate whether the motivation for FDI differs among these investors. Rather than relying on specific theories of FDI determinants we examine them all simultaneously employing Bayesian Model Averaging (BMA) in a panel data set with 129 FDI destinations in 5 geographical regions over the period 1995-2008. This approach permits us to select the most appropriate model that governs FDI allocation and to distinguish robust FDI determinants. We find that all our investors search for destinations with whom they have established intensive trade relations and that offer a qualified labor force. However, low wages and attractive tax rates are robust investment criteria too, and a considerable share of FDI is still resource-driven. Our investors show fairly similar strategies in the main FDI destinations. JEL : C11, F0, F21 Keywords: FDI determinants, Bayesian Model Averaging, OECD, Developing
countries, US, Germany, France, Netherlands
1Institute for International Economics and Development, Vienna University of Economics and Business, e-mail: [email protected]. 2 Institute for International Economics and Development, Vienna University of Economics and Business, email: [email protected].
Abstract
The authors
FIW Working Paper N° 76 December 2011

Do determinants of FDI to developing countries differ
among OECD investors? Insights from Bayesian
Model Averaging∗
Nikolaos Antonakakis† Gabriele Tondl‡
December 13, 2011
Abstract
The main objective of this paper is to examine the determining factors of outwardFDI from four major OECD investors US, Germany, France and the Netherlandsto developing countries located in different world regions. Our goal is to elucidatewhether the motivation for FDI differs among these investors. Rather than rely-ing on specific theories of FDI determinants we examine them all simultaneouslyemploying Bayesian Model Averaging (BMA) in a panel data set with 129 FDIdestinations in 5 geographical regions over the period 1995-2008. This approachpermits us to select the most appropriate model that governs FDI allocation andto distinguish robust FDI determinants. We find that all our investors search fordestinations with whom they have established intensive trade relations and thatoffer a qualified labor force. However, low wages and attractive tax rates are robustinvestment criteria too, and a considerable share of FDI is still resource-driven. Ourinvestors show fairly similar strategies in the main FDI destinations.
Key words: FDI determinants, Bayesian Model Averaging, OECD, Developingcountries, US, Germany, France, Netherlands.
JEL codes: C11, F0, F21
∗Financial support from the OeNB Jubilaeumsfond, No. 11701, is gratefully acknowledged. Gabriele
Tondl acknowledges financial support from Europa-Kolleg Hamburg and a DAAD-scholarship. The au-
thors like to thank Joseph Francois and ETSG conference participants for useful comments and sugges-
tions.†Vienna University of Economics and Business, Institute for International Economics, Althanstrasse
39-45, A-1090 Vienna, Austria, e-mail: [email protected].‡Vienna University of Economics and Business, Institute for International Economics & Research Insti-
tute for European Affairs, Althanstrasse 39-45, A-1090 Vienna, Austria, email: [email protected].
1
1 Introduction
Since the mid 1990s OECD countries have begun placing an increasing share of their FDI
into developing countries (DC), specifically, in the regions of Eastern Europe and Central
Asia (ECA), East and South Asia (ESA), Latin America & Caribbean (LAC), Middle
East and North Africa (MENA), and in Sub-Saharan Africa (SSA). Their presence in
these regions reveals a distinct pattern.
If we concentrate among the major OECD investors, namely, the US, Germany, France
and the Netherlands we see that their presence, in the developing regions mentioned above,
varied substantially in terms of value and time.1 As an indicator for FDI commitment in
a country, we consider the amount of foreign direct investment stocks per inhabitant of
the investor country. Figure 1 shows the FDI positions of the regarded OECD investors
in 1995 and 2008. In 1995, the Netherlands had by far the most intensive FDI activity
in DC, ahead of other European countries and the US. It invested primarily in ESA and
LAC. The US concentrated its FDI in LAC and ESA. At that time, Germany engaged
mostly in LAC, while its commitment in ECA and ESA was only half as high. For France,
a similar picture emerged, although its internationalization was even lower than that of
Germany. SSA and MENA were virtually neglected by all OECD investors, except for
some sizable Dutch FDI in MENA.
In 2008, the internationalization through FDI in DC has impressively increased for all
our regarded investor countries. In the case of the European investors this development
was much more pronounced than for the US. The most internationally active European
investor, the Netherlands, has propelled its commitment also in ECA by 2008, becoming
equally high internationalized in ESA and ECA, followed by LAC. Germany has shifted its
focus to ECA, ESA and MENA although its presence in LAC has also increased. A similar
tendency is observed with France. Thus, European investors had not only discovered ECA
in that period, but also ESA and MENA as FDI fields. For the US, LAC remains the
first FDI destination although ESA has become almost equally important. In contrast to
the European investors, ECA and MENA are subordinate for US investors. SSA still is a
1The other main OECD investors into DC are the UK, Switzerland and Japan; unfortunately their
FDI statistics are not fully accessible so that we cannot consider these investors in our study.
2

destination which hardly attracts OECD FDI.
These facts raise several important questions: (i) What determines FDI from high
income countries to different developing regions? (ii) Do different OECD investors show
different motivations and care for different location factors in these regions? (iii) What
are the prospects of these regions for further FDI? Which factors must DC improve to
become attractive FDI locations? (iv) Given the ample of FDI determinants considered
in the literature, which are indeed the most crucial ones?
A bulk of literature investigating the determinants of FDI has emerged aiming pri-
marily to pinpoint which factors FDI recipients have to provide to secure FDI inflows (for
instance, Wernick et al. 2009; Azemar and Desbordes 2009; Bellak et al. 2008; Campos
and Kinoshita 2008; Bevan and Estrin 2004; for a review see Blonigen 2005). In most
studies the key determinants of FDI considered are market potential and labor costs,
for horizontal and vertical FDI, respectively, as well as distance. Others emphasize the
role of certain types of FDI determinants like taxation, human capital, infrastructure,
macroeconomic factors, institutional factors and trade liberalization.
Several studies looked at the determining factors of specific regions (for example,
Barrell and Pain 1997, for Eastern Europe; Trevino et al. 2008, for LAC; Asiedu 2006,
for Africa; and Hattari and Rajan 2009, for Asia). In contrast, there are few studies
that look at the motives of the investor countries (see, for example Nasser 2007 and
Udomkerdmongkol et al. 2009, for the US; Toubal et al. 2003 and Buettner and Ruf 2007,
for Germany; Pfister and Deffains 2005 and Fontagne and Pajot 1998, for France).
Given the distinctly different investment patterns of the OECD investors described
above and the scarce literature in this field, we think it is imperative to further explore how
the motives of these investors differ, and whether these motives differ between certain host
regions. Answers to such questions are of great importance. They would permit OECD
investors to elaborate on their internationalization strategy and OECD governments to
advance a specific international economic dialogue that would support it. Moreover, they
would indicate to DC which conditions must be improved in order to attract more or
specific investors.
The second major contribution this paper aims to offer, is to find out which are
3
indeed the robust FDI determinants for our investor countries in different destinations.
Although the literature has emphasized particular groups of determinants, there is no
study that looks at the complete set of determinants and indicates the crucial ones.
We will look at a large set of more than 30 potential determinants including, market
size and market dynamics, labor costs, human capital, infrastructure, trade relations,
macroeconomic factors and institutional factors. Given the large number of potential
determinants, we apply Bayesian Model Averaging (BMA) to assess which models can
best explain the FDI patterns of our investors, and which are indeed the robust factors
determining FDI to different developing regions.
Our main conclusion is that all our investors prefer: (i) FDI destinations with whom
they already maintain intensive trade relations, and search for advanced developing coun-
tries with a more qualified labor force. (ii) However, low wages and attractive tax rates are
robust investment criteria too, and (iii) a considerable share of their FDI is still resource-
driven. We do not find that macroeconomic and institutional factors are robust FDI
determinants. Our investors show fairly similar strategies in the main FDI destinations,
although, certain particularities appear, like the absence of resource-oriented German FDI
and its request for efficient government authorities. Since many developing countries score
poorly with respect to point (i) they are not attractive for OECD investors.
The remainder of the paper is organized as follows: Section 2 discusses the determi-
nants of FDI and the hypotheses regarding our investor countries. Section 3 describes the
empirical methodology and the data. Section 4 presents the empirical results and section
5 concludes.
2 Motives and Determinants of FDI
In this section we present the theoretical and empirical evidence on the determinants of
FDI found in the literature, and propose the hypotheses concerning our investors.
4
2.1 Market size and market dynamics as determinants for market-
seeking FDI
Market size is one of the key determinants of FDI according to Dunnings Ownership,
Location and Internalization (OLI) paradigm (Dunning, 1993b;a). Establishing the pro-
duction of a good or service in big economies gives access to large sales markets, and
it permits to exploit Economies of Scale (EOS) (Amiti, 1998; Krugman, 1979). Thus,
FDI flows are often explained in gravity type models with market size among the central
variables. Empirically, the relation between the host country’s market size and FDI is
the most tested hypothesis (see for example, Culem 1988; Wheeler and Mody 1992;
Barrell and Pain 1997; 1999; Bevan and Estrin 2004; Bevan and Meyer 2004). Busse
and Hefeker (2007) and Trevino et al. (2008) show that market size is an important de-
terminant of FDI in developing countries. However, if the endogeneity of the regressor is
correctly taken into account, Busse and Hefeker (2007) and Campos and Kinoshita (2008)
concluded that market size and market growth are no longer significant determinants of
FDI flows into developing countries.
A positive relation between the host country’s market size and FDI suggests that
FDI is market-seeking (as opposed to efficiency-seeking and resource-seeking FDI which
is discussed below). Market-seeking FDI typically goes hand in hand with horizontal FDI
where the entire production takes place in the host country in order to serve the local
market, but not the export market. This type of FDI usually permits firms to operate in
markets which are protected by high tariff barriers. Not all countries invest in a region
for market-seeking motives, e.g. US FDI in Mexico is mainly efficiency-seeking whereas
Germany’s FDI in Mexico is market-seeking (see, for instance,Vodusek 2004). Investors
that wish to enter new markets usually prefer dynamic ones, i.e. markets with good
growth performance. Furthermore, developed countries may prefer developed markets
with a high GDP per capita to low income markets, since they would meet demand for
the typical products of developed countries there.
Central European EU countries, such as Austria, have placed a large share of their FDI
in the neighboring CEECs. A large share of US FDI in EU15 is located in the UK and in
Ireland. Spain has become a heavy investor in LAC. From these facts, we conjecture that
5
geographical distance, common language and former colonial links may promote FDI in
certain markets.
Consequently, we are interested to test whether market size and market dynamics are
among the prime determinants of our investor countries. This could be considered as
strong evidence for market-seeking FDI, although we admit that market-seeking FDI can
also be expected in smaller markets. While market-seeking FDI in ordinary consumer
goods will be less sensitive to the development level, market-seeking FDI with techno-
logically advanced products will be constrained to countries with advanced development
(income level, education, infrastructure, see below). Since all regarded investor countries
offer leading world products, we expect market-seeking FDI to be a highly important
strategy. Further, we will test whether geographical distance and cultural proximity of
markets play a significant role for FDI.
2.2 Human capital and infrastructure as determinants for market-
seeking FDI in advanced markets
With more advanced products the availability of skilled labor, labor productivity and a
developed infrastructure becomes important.
Filippaios and Papanastassiou (2008) looked at US multinational investment in Eu-
rope and concluded that in the EU periphery, besides labor costs, the host country’s
labor productivity is important for FDI inflows. Trevino et al. (2008) find that LAC FDI
inflows are related to educational attainment, measured by enrolment in tertiary educa-
tion. Azemar and Desbordes (2009) and Suliman and Mollick (2009) analyze FDI flows
to developing countries and conclude that the relatively low FDI flows into Sub-Saharan
Africa are partly explained by poor human capital and illiteracy. Noorbakhsh et al. (2001)
examine why FDI flows to developing countries have reached only a limited part of them.
Their empirical analysis proposes that human capital is one of the key FDI determinants
and has constantly gained in importance. We propose that market-seeking FDI of OECD
countries, producing higher quality products and services, is linked to the availability of
human capital. As an indicator for human capital we consider labor productivity since
it provides a more accurate picture on the educational level in DC than primary and
6

secondary school enrollment which is the only education indicator available for our large
set of DC.
The manufacture of advanced products entails a need for communication with high
technology media and thus requires a well functioning telecommunication and internet
network. Benassy-Quere et al. (2007) and Bellak and Leibrecht (2009) found that in-
frastructure in Eastern Europe promotes FDI. More specifically, Campos and Kinoshita
(2008) showed that telecommunication is important for FDI in Eastern Europe and LAC
and Bellak et al. (2010) concluded that Information Computer Technologies (ICT) are an
essential factor for FDI in the enlarged EU. Globerman and Shapiro (2003) argued that
US firms invest only in countries with a threshold level of infrastructure.
We hypothesize that telecommunication technologies are important determinants of
FDI and test, in particular, whether investors search destinations with a high rate of
internet accessibility and a high rate of fixed and mobile telephone lines.
2.3 Labor costs and taxation as determinants for efficiency-
seeking FDI
Investment in developing countries often arises from the motivation to save labor costs and
taxes and thus, to dislocate a part of (vertical FDI) or the entire production to low wage
countries or countries with attractive tax rates (efficiency-seeking FDI). The intermediate
or final product needs to be shipped back to the FDI home country, which requires suffi-
ciently low tariffs or free trade arrangements. We expect that FDI to developing countries
is encouraged by big wage gaps with the sender country. There are numerous examples for
efficiency-seeking FDI, e.g., US investment in Central America, EU investment in Eastern
Europe, developed countries’ investment in the textile industry in East Asia. Konings
and Murphy (2006) found that in the post-1992 period US FDI in the EU periphery was
discouraged in places with high labor costs. Bellak et al. (2008) estimated that increasing
labor costs had a negative effect on FDI inflows into the CEECs. Braconier et al. (2005)
found that about 20 per cent of US multinational sales are based on low wages of skilled
labor.
7
Bellak and Leibrecht (2009) find that tax-lowering strategies of CEEC governments
seem to have an important impact on foreign firms’ location decisions. Benassy-Quere
et al. (2007) find that FDI inflows have become very sensitive to tax rates in Eastern
Europe and the enlarged EU respectively. Benassy-Quere et al. (2007) and Bellak and
Leibrecht (2009) argue that the tax elasticity of FDI is higher than with respect to in-
frastructure. Big tax competition of countries wishing to attract FDI will lead to an
undersupply of infrastructure. Cleeve (2008) finds that fiscal incentives, namely tax holi-
days are important for investors in Africa, which was also found by Lansbury et al. (1996)
for investors in Eastern Europe.
Therefore, we are interested in examining whether efficiency-seeking FDI is an impor-
tant motive for our investor countries.
2.4 Resources
Since the beginning of the 2000s, resource-seeking FDI, geared by increasing demand and
rising commodity prices for oil and minerals, has once again boomed (WIR 2007). Thus,
the rising profits in this sector induced a wave of investment. Investment in extractive
industries involves large scale investment and high uncertainty of return. Investors can act
as monopolists. A good relationship with governments is essential. Autocratic regimes
and corruptive systems may facilitate the operation of businesses. However, with this
type of investment, political instability and the risk of expropriation can potentially lead
to high costs and losses (WIR 2007; Buckley 2008).
Asiedu (2006) concludes that natural resources are besides market size the key deter-
minants of FDI in Africa. Consequently, we are interested in knowing to which extent
our investor countries have placed their FDI in resource abundant countries and which
conditions destinations have to offer to investors in extractive industries.
2.5 Host country’s trade openness, bilateral trade experience
and common trade policy framework
The embeddedness of the host country in international trade is relevant for FDI inflows
in several respects.
8
First, open economies – openness being indicated by exports plus imports over GDP
– are heavily linked with the world economy. They have liberal trade regimes, long
established international economic relations and are competitive on the world market.
This should provide a positive setting for investors. FDI would benefit from the liberal
trade regime which would facilitate to use the affiliate as export base. Several studies find
a strong positive effect of openness on inward FDI. For different regions including Eastern
Europe, Asia, LAC and Africa, Campos and Kinoshita (2008), Trevino et al. (2008),
de Boyrie (2010), and Sekkat and Veganzones-Varoudakis (2007) find that openness of
the host country is an important factor explaining FDI inflows.
Secondly, we propose that investors will have a stronger propensity to put their FDI
into countries with whom external relations have been already established. As evidence,
we consider the position of the host country in the home country’s total trade over the
past 5 years.
Third, we conjecture that bilateral free trade agreements (FTA) encourage FDI, no-
tably efficiency-seeking FDI. Bilateral trade agreements provide opportunities to dislocate
a part of, or the entire production in lower cost countries and to import the product with-
out trade barriers. There is evidence that FTAs of the US with Central America have
generated important FDI flows into this region (Waldkirch 2010). The same applies for
FTAs between the EU and Eastern Europe (Baltagi et al. 2008). The perspective of ver-
tical and efficiency-seeking FDI under FTAs will increase with the wage gap of the host
country, as argued in Kim (2007).
Since the early 1990s, the number of Double Taxation Treaties (DTTs) and Bilateral
Investment Treaties (BITs) has grown significantly. BITs contain provisions for investor-
state dispute settlement with international institutions (e.g. the International Center for
Investment Dispute Settlement at the Worldbank) and reduce the uncertainty of expropri-
ation (WIR 2005). Our sample of investors have concluded numerous DTTs. Desbordes
and Vicard (2009) investigated the impact of BITs and found that this depends on the
political relationship between the signatory countries. Only in case of tense relationship,
BITs would promote FDI flows.
9
2.6 Macroeconomic factors: exchange rate, inflation, external
debt
Macroeconomic stability has been stressed in numerous empirical investigations as an
important determinant of FDI (e.g. Campos and Kinoshita 2008; Lansbury et al. 1996;
Asiedu 2006). Macroeconomic stability involves low inflation rates, a stable currency and
low external debt. There are manifold examples that increasing external debts worsen
the creditworthiness of countries, generate solvency problems and lead to currency deval-
uations. Under these conditions, investment can loose considerably in value. Currency
devaluations and high volatility in exchange rates can also result from current account
deficits and other risk factors. High and volatile inflation increases uncertainty and thus,
leads to higher investment risk. Consequently, FDI will be discouraged by such condi-
tions. Busse and Hefeker (2007), Asiedu (2006), Campos and Kinoshita (2008) as well as
Trevino et al. (2008) stressed that the inflation level is an important factor for FDI inflows
in DC. Serven (2002) proves that exchange rate uncertainty, i.e. volatility, discourages
private investment into DC. Clark and Kassimatis (2009) find that default risk leads to
FDI drops in Latin America.
We shall test the impact of changes in exchange and inflation rates, their volatility, as
well as the impact of changes in external debt in order to find out to which extent these
factors are relevant in explaining FDI from our investor countries.
2.7 Institutional factors
In recent years, the importance of institutions for attracting FDI inflows has been increas-
ingly stressed. In view of the unequal FDI flows within Eastern Europe and LAC, and
the low FDI record of Africa, institutions like the Worldbank underlined this factor.
The political system and quality of institutions are likely to be important determi-
nants of FDI activity, particularly for less-developed countries, for a variety of reasons. (i)
Political instability denoted by violence, civil war, or simply weak governments, will dis-
courage FDI. (ii) Countries with a developed democracy/political accountability provide
a more reliable legal base and therefore may encourage FDI inflows. On the other hand,
Li and Resnick (2003) argue that democratic countries limit Multinational Firms (MNF)
10
to pursue a monopolistic behavior and local governments to offer generous incentives,
which may therefore reduce FDI. (iii) Poor legal protection of assets increases the chance
of expropriation of a firm’s assets and is thus making investment less likely. (iv) Poor
quality of institutions that are necessary for well-functioning markets (and/or corruption)
increase the cost of doing business (Antal-Mokos 1998; Meyer 2001) and thus, should also
diminish FDI activity.
In recent years the importance of these factors of FDI has been verified in a number
of empirical studies for large worldwide samples (e.g. Wernick et al. 2009; Busse and
Hefeker 2007; Campos and Kinoshita 2008), or specific regions (Asiedu 2006; Naudand
and Krugell 2007, for Africa; Barrell and Pain 1999, for Eastern Europe; and Trevino
et al. 2008, for LAC).
Several international data sets are maintained which provide indicators of institutional
quality, among them the indicators of the International Country Risk Guide, of the Fraser
Institute and the World Bank’s World Governance Indicators. Since the latter provides
the largest coverage with respect to time and countries, we will use the indicators of this
data set to examine to which extent the quality of institutions is a robust FDI determinant.
3 Model specification and data
To find out which are the principal factors that determine the FDI commitment of the
US, Germany, France and the Netherlands we look at their bilateral FDI positions in
1995-2008 in 129 recipient developing countries classified under five regions: ECA, ESA,
LAC, MENA and SSA (see Table A.2 for more details). We estimate the following model
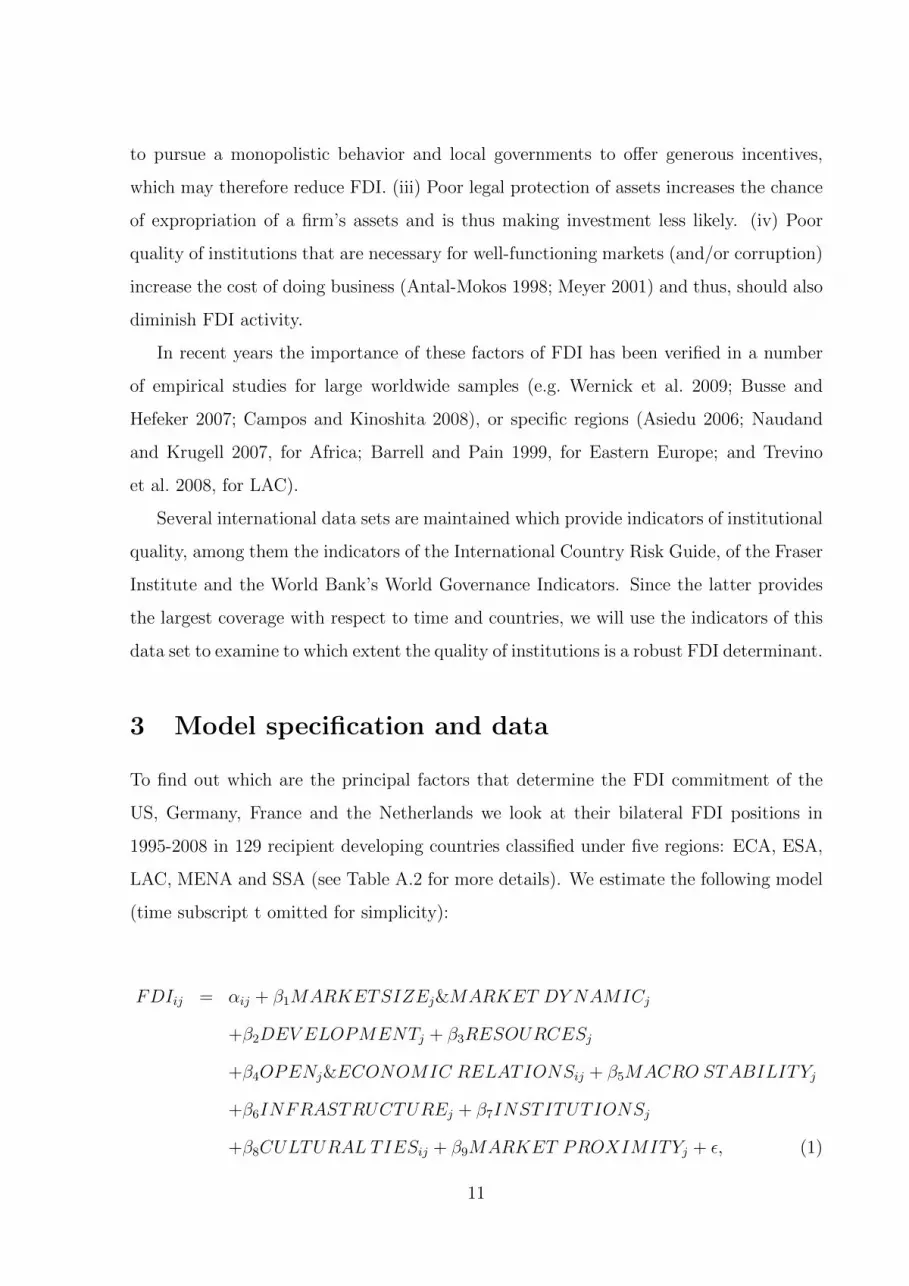
(time subscript t omitted for simplicity):
FDIij = αij + β1MARKETSIZEj&MARKET DY NAMICj
+β2DEV ELOPMENTj + β3RESOURCESj
+β4OPENj&ECONOMIC RELATIONSij + β5MACRO STABILITYj
+β6INFRASTRUCTUREj + β7INSTITUTIONSj
+β8CULTURAL TIESij + β9MARKET PROXIMITYj + ε, (1)
11
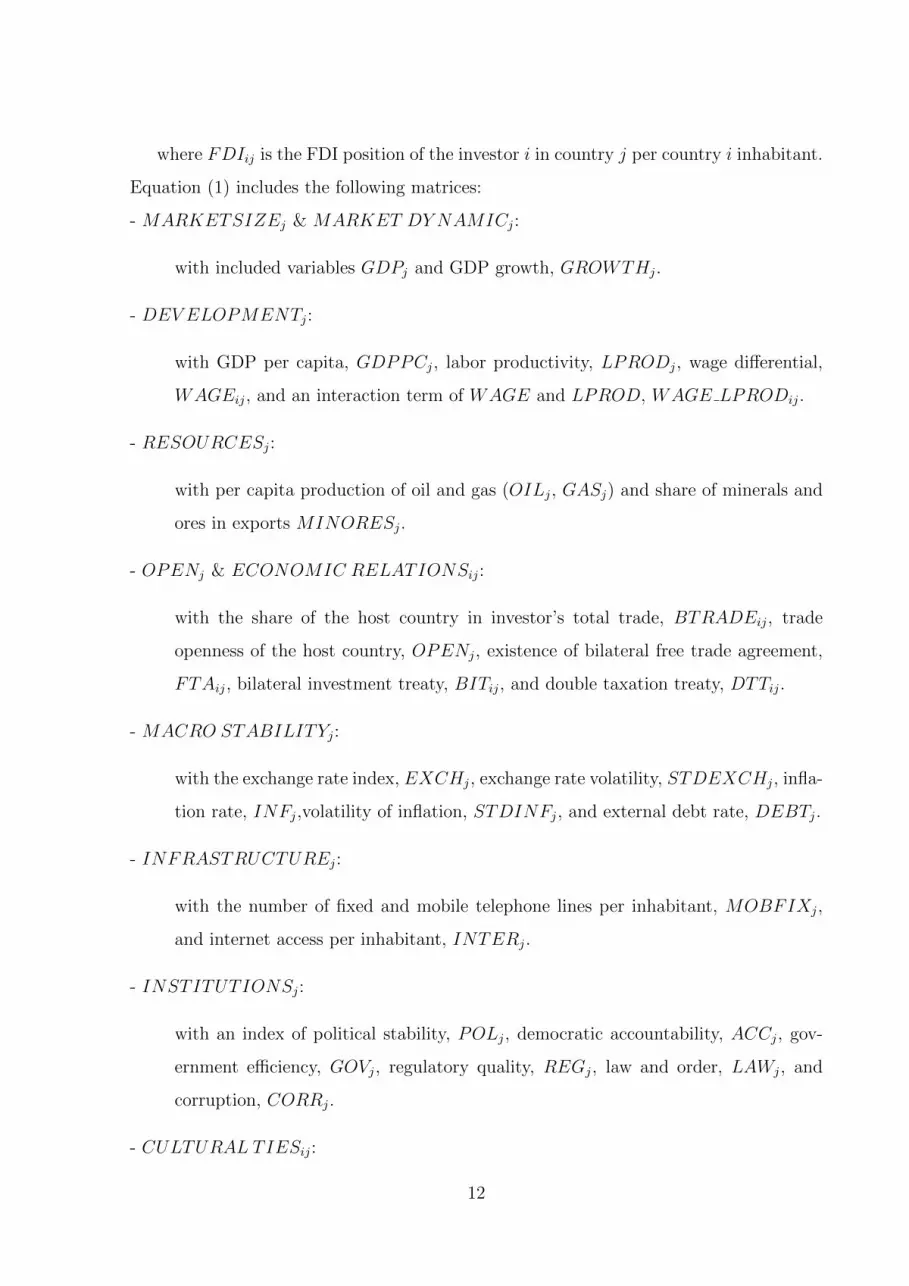
where FDIij is the FDI position of the investor i in country j per country i inhabitant.
Equation (1) includes the following matrices:
- MARKETSIZEj & MARKET DY NAMICj:
with included variables GDPj and GDP growth, GROWTHj.
- DEV ELOPMENTj:
with GDP per capita, GDPPCj, labor productivity, LPRODj, wage differential,
WAGEij, and an interaction term of WAGE and LPROD, WAGE LPRODij.
- RESOURCESj:
with per capita production of oil and gas (OILj, GASj) and share of minerals and
ores in exports MINORESj.
- OPENj & ECONOMIC RELATIONSij:
with the share of the host country in investor’s total trade, BTRADEij, trade
openness of the host country, OPENj, existence of bilateral free trade agreement,
FTAij, bilateral investment treaty, BITij, and double taxation treaty, DTTij.
- MACRO STABILITYj:
with the exchange rate index, EXCHj, exchange rate volatility, STDEXCHj, infla-
tion rate, INFj,volatility of inflation, STDINFj, and external debt rate, DEBTj.
- INFRASTRUCTUREj:
with the number of fixed and mobile telephone lines per inhabitant, MOBFIXj,
and internet access per inhabitant, INTERj.
- INSTITUTIONSj:
with an index of political stability, POLj, democratic accountability, ACCj, gov-
ernment efficiency, GOVj, regulatory quality, REGj, law and order, LAWj, and
corruption, CORRj.
- CULTURAL TIESij:
12
containing interaction terms of host’s GDP and the presence of English/French lan-
guage (GDP LANGUSj, GDP LANGFRAj) and colonial ties, GDP COLONij.
- MARKET PROXIMITYij:
with the interaction of GDP and distance between i and j, GDP DISTij.
α(ij) is a fixed effect, and ε is the error term. Equation (1) explains the FDI commit-
ment of the investor in a region by host country characteristics containing more than 30
variables (a detailed definition and sources of the variables is given in Table A.1 in the
Appendix).
Further, we include interaction terms for investors/regions like GDP BTRADE for
big economies with intensive trade relations, and market development or infrastructure
indicators interacted with institutional or macroeconomic factors. This permits us to
capture multiple investment strategies in a given region. For example, we may find that
an investor does not care for institutional quality, while it does so in locations with
resources.
In any estimation of FDI determinants the issue of endogeneity of variables may arise.
Note that our dependent variable is bilateral FDI stocks per head of the investor country
while the explanatory variables, market size, market dynamics and income level, are
related to the host country. Since we take into account bilateral FDI stocks – not total
inward stock into country j – and not flows, we practically rule out reverse causality. In
the case of bilateral trade relations where endogeneity with FDI may arise, we used past
trade relations.
4 Empirical Methodology - BMA
The theoretical and empirical literature on the determinants of FDI has identified a large
number of variables as being correlated with FDI. A recent survey on FDI determinants
by Faeth (2009) presents nine theoretical models explaining FDI flows along with their
empirical performance. The author shows that there is no single theory of FDI, but a
variety of theoretical models attempting to explain FDI. In other words, not all deter-
minants in each of the nine theoretical models are found significant. Thus, any analysis
13
of FDI determinants should be explained more broadly by a combination of factors from
a variety of theoretical models. Put differently, the various FDI theories are typically
compatible with one another. For instance, a theoretical view holding that market size
matters for FDI is not logically inconsistent with another view that emphasizes the role
of openness on FDI.
Since theory does not provide sufficient guidance for selecting the proper empirical
model, the issue of model uncertainty arises. So far the empirical literature has not
attempted to evaluate the robustness of FDI determinants. Model Averaging techniques
have been proposed to account for such model uncertainty. The basic idea behind Model
Averaging is to estimate the distribution of unknown parameters of interest across different
models. The fundamental principle of Bayesian Model Averaging (BMA) is to treat
models and related parameters as unobservable, and to estimate their distributions based
on the observable data. Based on prior information on the parameters and considering
all possible models, i.e. given by all possible combinations of regressors, the posterior
probability of models and regressors are estimated.
BMA techniques have been applied in numerous empirical applications. In the growth
context, Fernandez et al. (2001b) apply the BMA with different priors to determine the
most robust growth regressors that should be included in linear cross-country growth
regressions. Leon-Gonzalez and Montolio (2004) extend the BMA to a panel data frame-
work. Prufer and Tondl (2008) use this approach to test the robustness of FDI related
growth effects among other growth factors.
We have a dataset on FDI determinants stretching over fourteen years and can thus,
investigate how the effect of FDI determinants changes across countries and over time.
Therefore we will apply BMA in the panel data context based on LSDV estimation. As we
have argued above, we should not encounter endogeneity problems which would demand
a different estimation technique.
In the face of model uncertainty, a formal Bayesian approach can be used to treat the
models as random variables, and conduct inference on them.
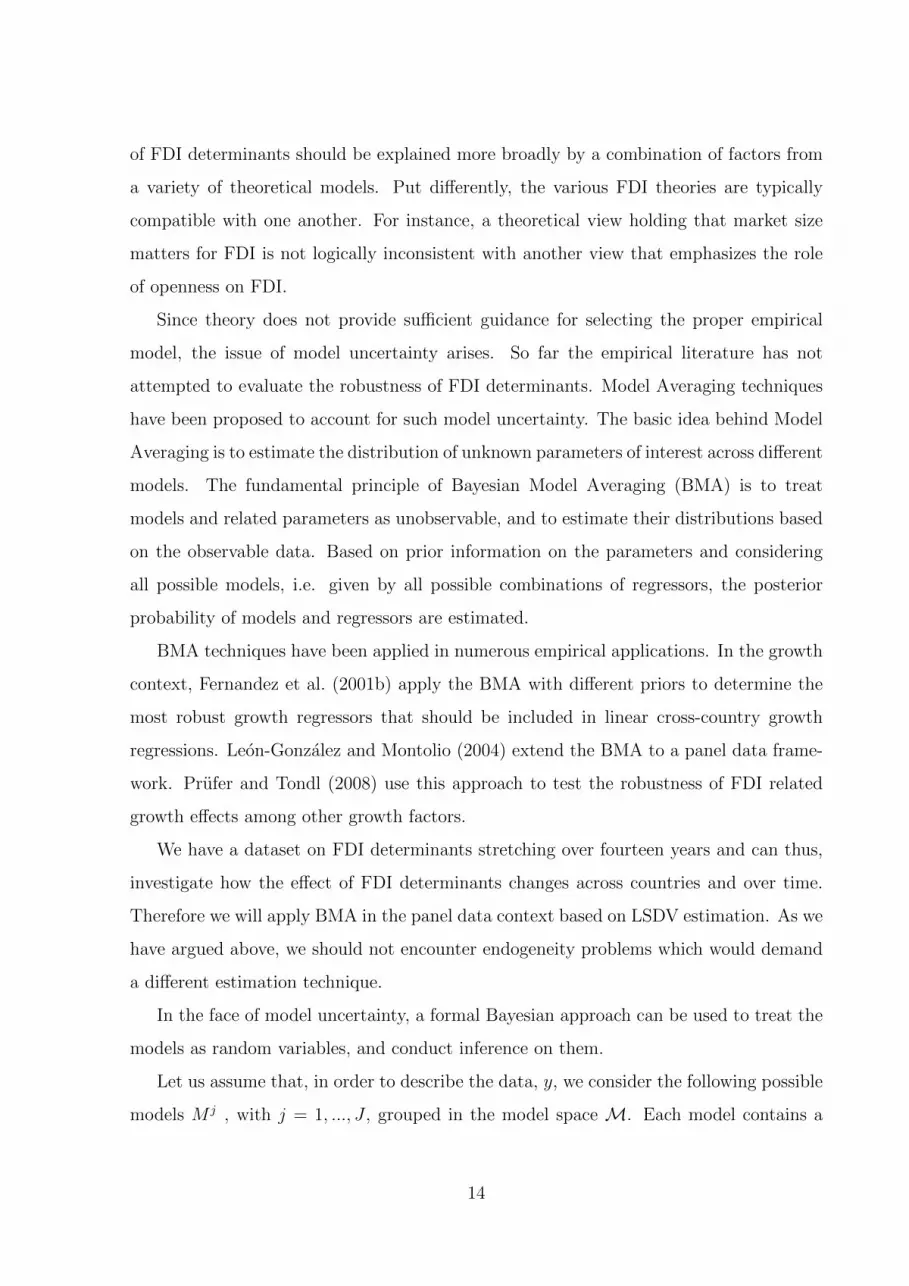
Let us assume that, in order to describe the data, y, we consider the following possible
models M j , with j = 1, ..., J , grouped in the model space M. Each model contains a
14
different set kj of explanatory variables, K, and includes individual effects, αi. These
models are normal linear regression models which differ in their regressors. The number
of possible models is 2K , where K is the number of explanatory variables.
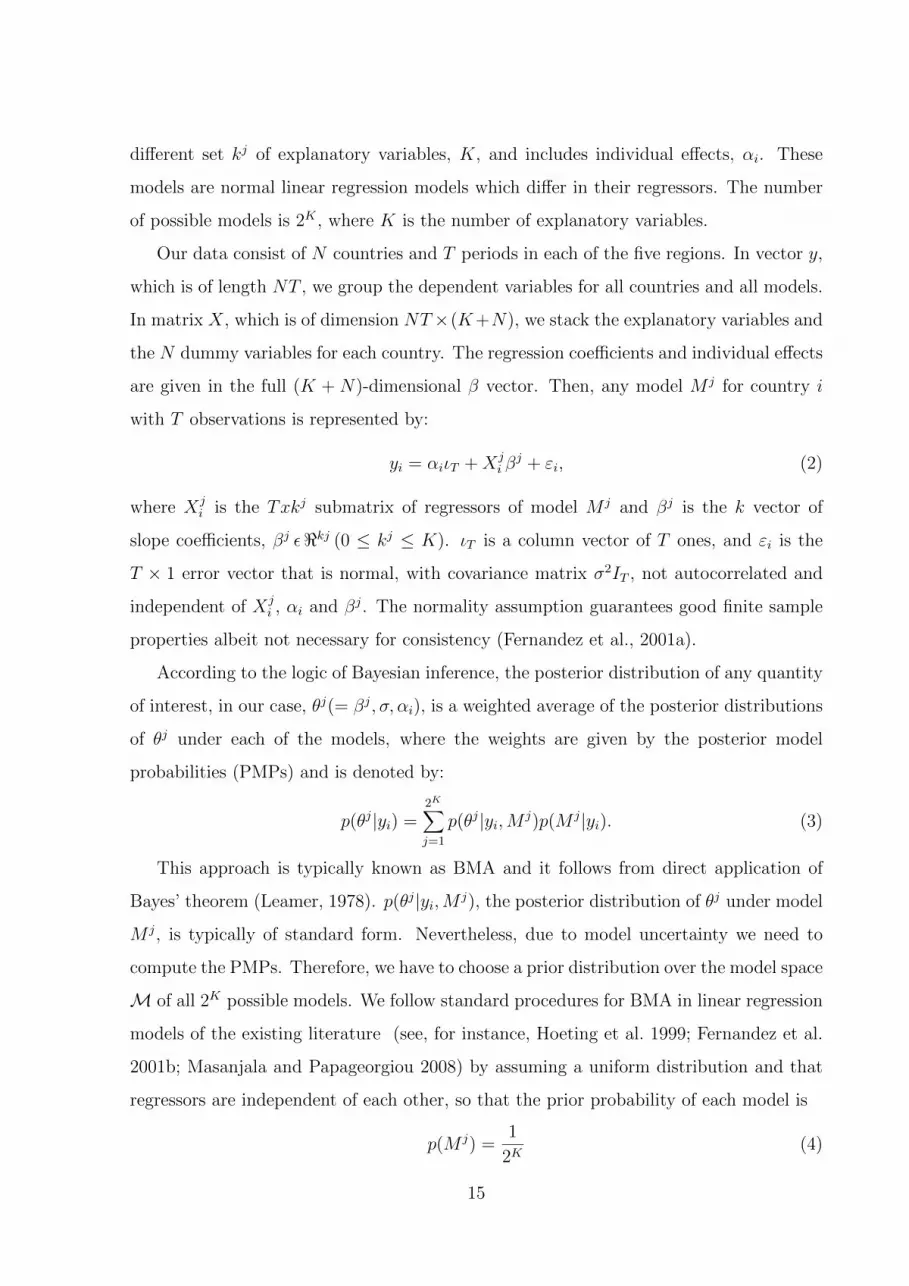
Our data consist of N countries and T periods in each of the five regions. In vector y,
which is of length NT , we group the dependent variables for all countries and all models.
In matrix X, which is of dimension NT×(K+N), we stack the explanatory variables and
the N dummy variables for each country. The regression coefficients and individual effects
are given in the full (K + N)-dimensional β vector. Then, any model M j for country i
with T observations is represented by:
yi = αiιT +Xji β
j + εi, (2)
where Xji is the Txkj submatrix of regressors of model M j and βj is the k vector of
slope coefficients, βj ε<kj (0 ≤ kj ≤ K). ιT is a column vector of T ones, and εi is the
T × 1 error vector that is normal, with covariance matrix σ2IT , not autocorrelated and
independent of Xji , αi and βj. The normality assumption guarantees good finite sample
properties albeit not necessary for consistency (Fernandez et al., 2001a).
According to the logic of Bayesian inference, the posterior distribution of any quantity
of interest, in our case, θj(= βj, σ, αi), is a weighted average of the posterior distributions
of θj under each of the models, where the weights are given by the posterior model
probabilities (PMPs) and is denoted by:
p(θj|yi) =2K∑j=1
p(θj|yi,M j)p(M j|yi). (3)
This approach is typically known as BMA and it follows from direct application of
Bayes’ theorem (Leamer, 1978). p(θj|yi,M j), the posterior distribution of θj under model
M j, is typically of standard form. Nevertheless, due to model uncertainty we need to
compute the PMPs. Therefore, we have to choose a prior distribution over the model space
M of all 2K possible models. We follow standard procedures for BMA in linear regression
models of the existing literature (see, for instance, Hoeting et al. 1999; Fernandez et al.
2001b; Masanjala and Papageorgiou 2008) by assuming a uniform distribution and that
regressors are independent of each other, so that the prior probability of each model is
p(M j) =1
2K(4)
15
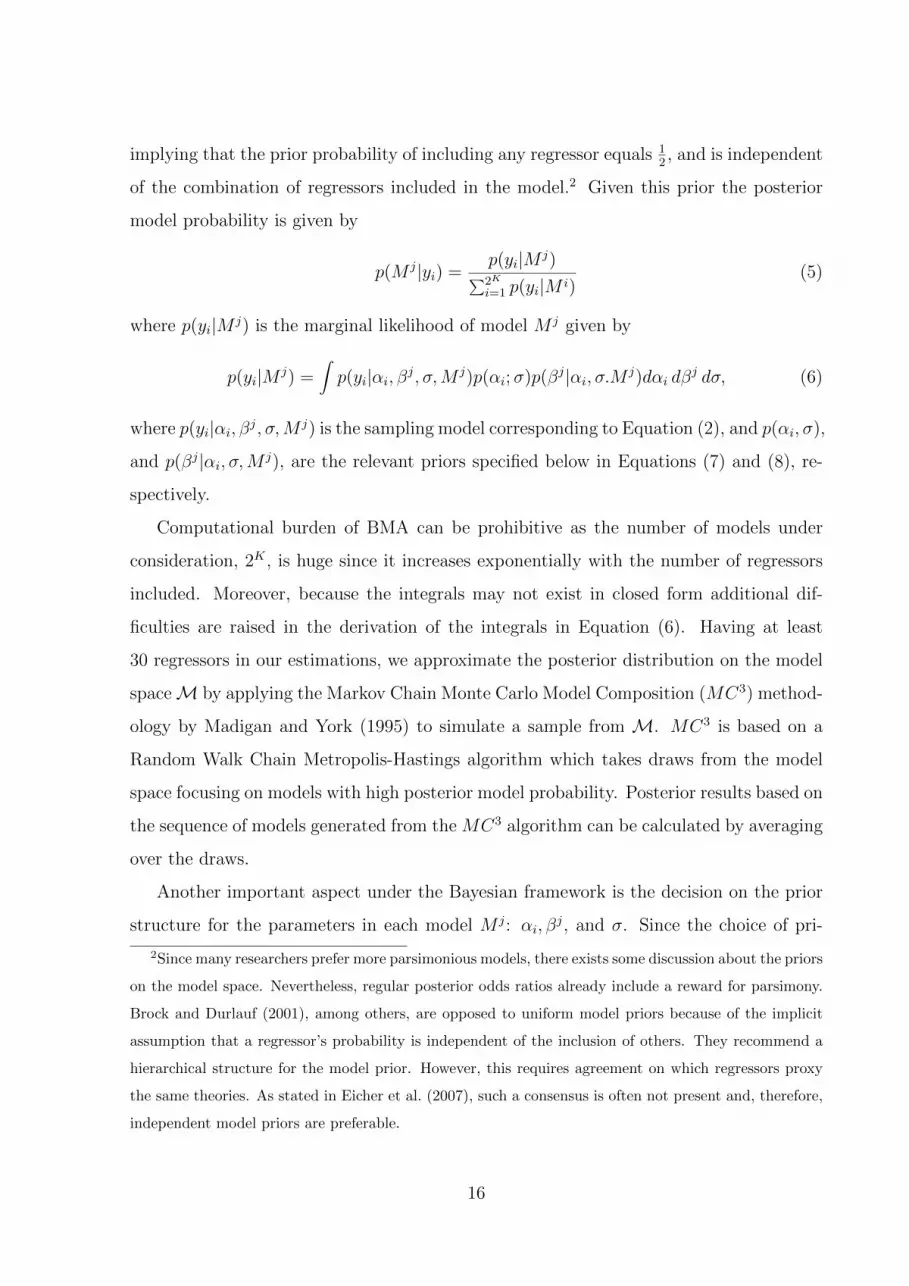
implying that the prior probability of including any regressor equals 12, and is independent
of the combination of regressors included in the model.2 Given this prior the posterior
model probability is given by
p(M j|yi) =p(yi|M j)∑2K
i=1 p(yi|M i)(5)
where p(yi|M j) is the marginal likelihood of model M j given by
p(yi|M j) =∫p(yi|αi, β
j, σ,M j)p(αi;σ)p(βj|αi, σ.Mj)dαi dβ
j dσ, (6)
where p(yi|αi, βj, σ,M j) is the sampling model corresponding to Equation (2), and p(αi, σ),
and p(βj|αi, σ,Mj), are the relevant priors specified below in Equations (7) and (8), re-
spectively.
Computational burden of BMA can be prohibitive as the number of models under
consideration, 2K , is huge since it increases exponentially with the number of regressors
included. Moreover, because the integrals may not exist in closed form additional dif-
ficulties are raised in the derivation of the integrals in Equation (6). Having at least
30 regressors in our estimations, we approximate the posterior distribution on the model
spaceM by applying the Markov Chain Monte Carlo Model Composition (MC3) method-
ology by Madigan and York (1995) to simulate a sample from M. MC3 is based on a
Random Walk Chain Metropolis-Hastings algorithm which takes draws from the model
space focusing on models with high posterior model probability. Posterior results based on
the sequence of models generated from the MC3 algorithm can be calculated by averaging
over the draws.
Another important aspect under the Bayesian framework is the decision on the prior
structure for the parameters in each model M j: αi, βj, and σ. Since the choice of pri-
2Since many researchers prefer more parsimonious models, there exists some discussion about the priors
on the model space. Nevertheless, regular posterior odds ratios already include a reward for parsimony.
Brock and Durlauf (2001), among others, are opposed to uniform model priors because of the implicit
assumption that a regressor’s probability is independent of the inclusion of others. They recommend a
hierarchical structure for the model prior. However, this requires agreement on which regressors proxy
the same theories. As stated in Eicher et al. (2007), such a consensus is often not present and, therefore,
independent model priors are preferable.
16

ors influences the results we therefore choose non-informative priors.3 Yet, improper
non-informative priors for parameters that are not common to all models can lead to
unmeaningful calculated PMPs. Therefore, we use the following benchmark priors devel-
oped by Fernandez et al. (2001a) that do not require subjective input or fine tuning for
each individual model. We take the {αi} to be independently uniformly distributed on
the real line and also adopt a uniform prior for the scale parameter common to all models
which gives us
p(αi, σ) ∝ 1
σ. (7)
This prior implies that equal prior weight is given to all values of α and σ for ln(σ).
Moreover, this distribution is invariant under scale transformations such as changes in
the measurement units. For βj we adopt an informative g-prior structure
p(βj|αi, σ,Mj) ∼ N(0, σ2[gjX
′jXj]−1), (8)
with the following choice of the scalar hyperparameter gj
gj = min{ 1
NT,
1
(K +N)2}. (9)
This weighting factor, which is a decreasing function of the sample size, depends only on
the number of regressors and the sample size. This prior resembles the one suggested by
the risk inflation criterion (RIC) of Foster (1994) and has good small sample performance
(Fernandez et al., 2001a).
5 Empirical results
We base our discussion below on the most important regressors having a Posterior Inclu-
sion Probability (PIP) above the recommended threshold of 0.50. According to Raftery
(1995), evidence for a regressor with a posterior inclusion probability from 50-75 % is called
weak, from 75-95 % positive, from 95-99 % strong, and > 99 % very strong. Masanjala
and Papageorgiou (2008) state that a PIP of 0.50 corresponds approximately to an abso-
lute t-ratio of one. We also indicate the regressors that are included in at least one of the
ten best models, however, we do not discuss them in order to focus on the main results.
3In a growth regression context, two recent studies of Ley and Steel (2009) and Eicher et al. (2007)
have analyzed the effects of prior choices on the robustness of parameter choices and coefficient estimates.
17
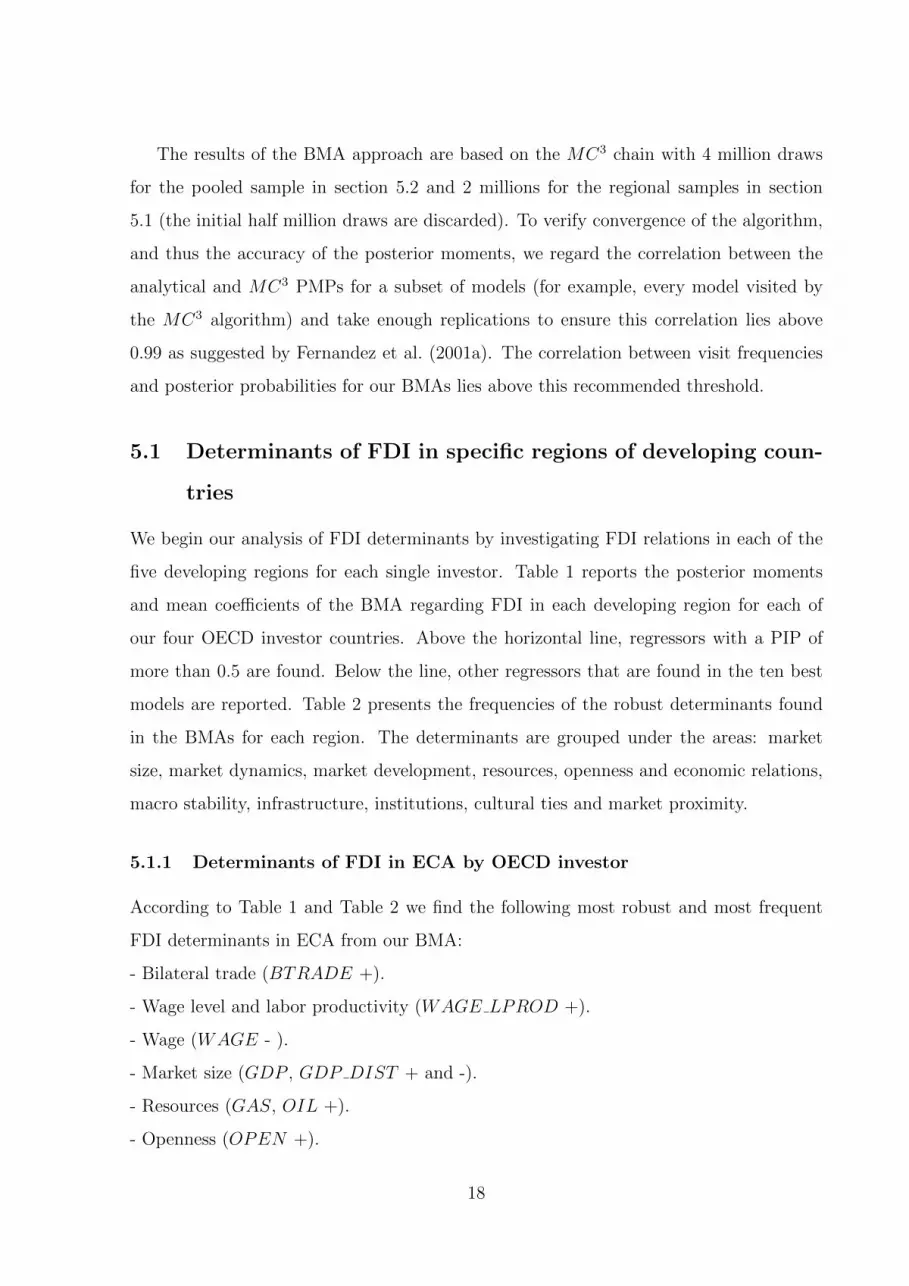
The results of the BMA approach are based on the MC3 chain with 4 million draws
for the pooled sample in section 5.2 and 2 millions for the regional samples in section
5.1 (the initial half million draws are discarded). To verify convergence of the algorithm,
and thus the accuracy of the posterior moments, we regard the correlation between the
analytical and MC3 PMPs for a subset of models (for example, every model visited by
the MC3 algorithm) and take enough replications to ensure this correlation lies above
0.99 as suggested by Fernandez et al. (2001a). The correlation between visit frequencies
and posterior probabilities for our BMAs lies above this recommended threshold.
5.1 Determinants of FDI in specific regions of developing coun-
tries
We begin our analysis of FDI determinants by investigating FDI relations in each of the
five developing regions for each single investor. Table 1 reports the posterior moments
and mean coefficients of the BMA regarding FDI in each developing region for each of
our four OECD investor countries. Above the horizontal line, regressors with a PIP of
more than 0.5 are found. Below the line, other regressors that are found in the ten best
models are reported. Table 2 presents the frequencies of the robust determinants found
in the BMAs for each region. The determinants are grouped under the areas: market
size, market dynamics, market development, resources, openness and economic relations,
macro stability, infrastructure, institutions, cultural ties and market proximity.
5.1.1 Determinants of FDI in ECA by OECD investor
According to Table 1 and Table 2 we find the following most robust and most frequent
FDI determinants in ECA from our BMA:
- Bilateral trade (BTRADE +).
- Wage level and labor productivity (WAGE LPROD +).
- Wage (WAGE - ).
- Market size (GDP , GDP DIST + and -).
- Resources (GAS, OIL +).
- Openness (OPEN +).
18
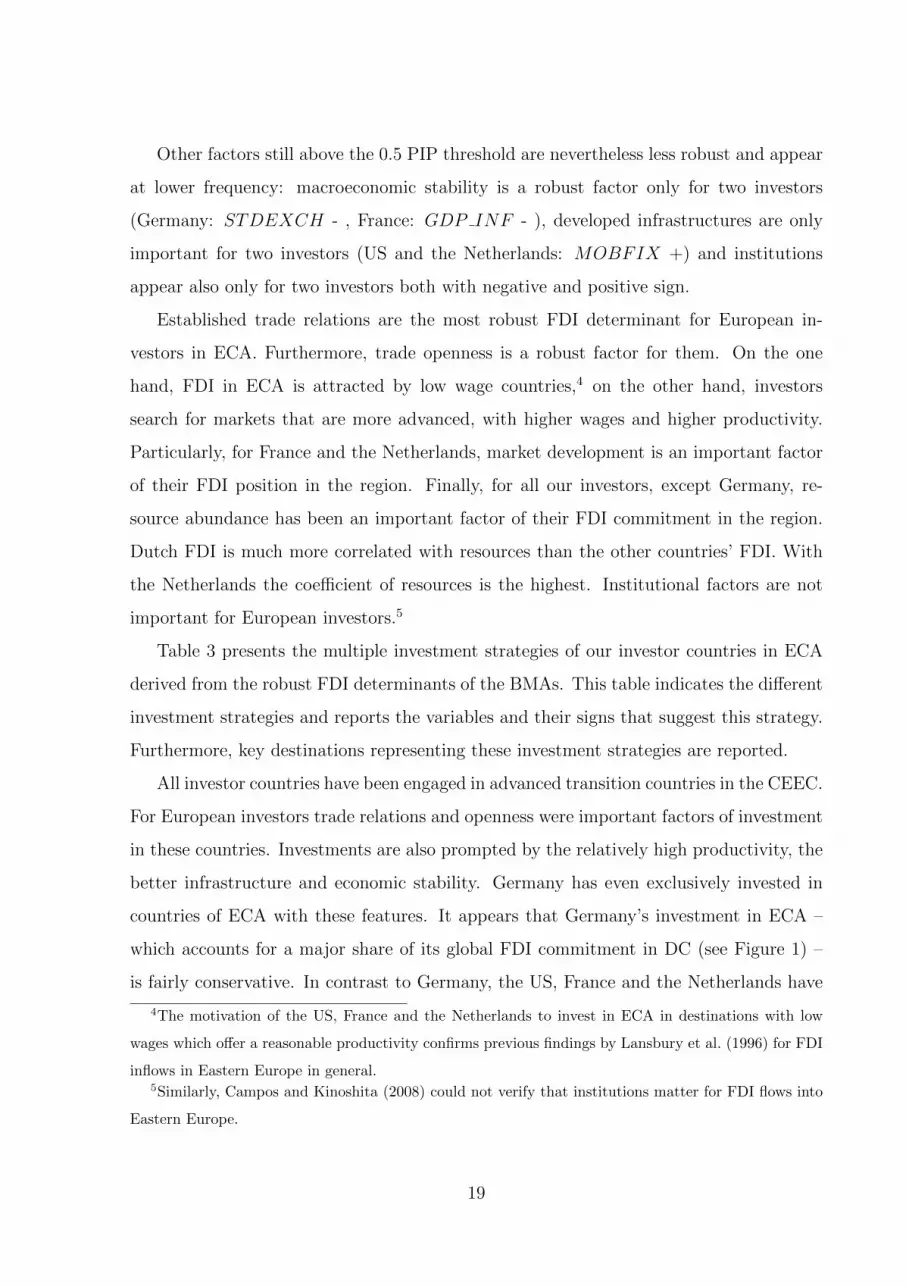
Other factors still above the 0.5 PIP threshold are nevertheless less robust and appear
at lower frequency: macroeconomic stability is a robust factor only for two investors
(Germany: STDEXCH - , France: GDP INF - ), developed infrastructures are only
important for two investors (US and the Netherlands: MOBFIX +) and institutions
appear also only for two investors both with negative and positive sign.
Established trade relations are the most robust FDI determinant for European in-
vestors in ECA. Furthermore, trade openness is a robust factor for them. On the one
hand, FDI in ECA is attracted by low wage countries,4 on the other hand, investors
search for markets that are more advanced, with higher wages and higher productivity.
Particularly, for France and the Netherlands, market development is an important factor
of their FDI position in the region. Finally, for all our investors, except Germany, re-
source abundance has been an important factor of their FDI commitment in the region.
Dutch FDI is much more correlated with resources than the other countries’ FDI. With
the Netherlands the coefficient of resources is the highest. Institutional factors are not
important for European investors.5
Table 3 presents the multiple investment strategies of our investor countries in ECA
derived from the robust FDI determinants of the BMAs. This table indicates the different
investment strategies and reports the variables and their signs that suggest this strategy.
Furthermore, key destinations representing these investment strategies are reported.
All investor countries have been engaged in advanced transition countries in the CEEC.
For European investors trade relations and openness were important factors of investment
in these countries. Investments are also prompted by the relatively high productivity, the
better infrastructure and economic stability. Germany has even exclusively invested in
countries of ECA with these features. It appears that Germany’s investment in ECA –
which accounts for a major share of its global FDI commitment in DC (see Figure 1) –
is fairly conservative. In contrast to Germany, the US, France and the Netherlands have
4The motivation of the US, France and the Netherlands to invest in ECA in destinations with low
wages which offer a reasonable productivity confirms previous findings by Lansbury et al. (1996) for FDI
inflows in Eastern Europe in general.5Similarly, Campos and Kinoshita (2008) could not verify that institutions matter for FDI flows into
Eastern Europe.
19
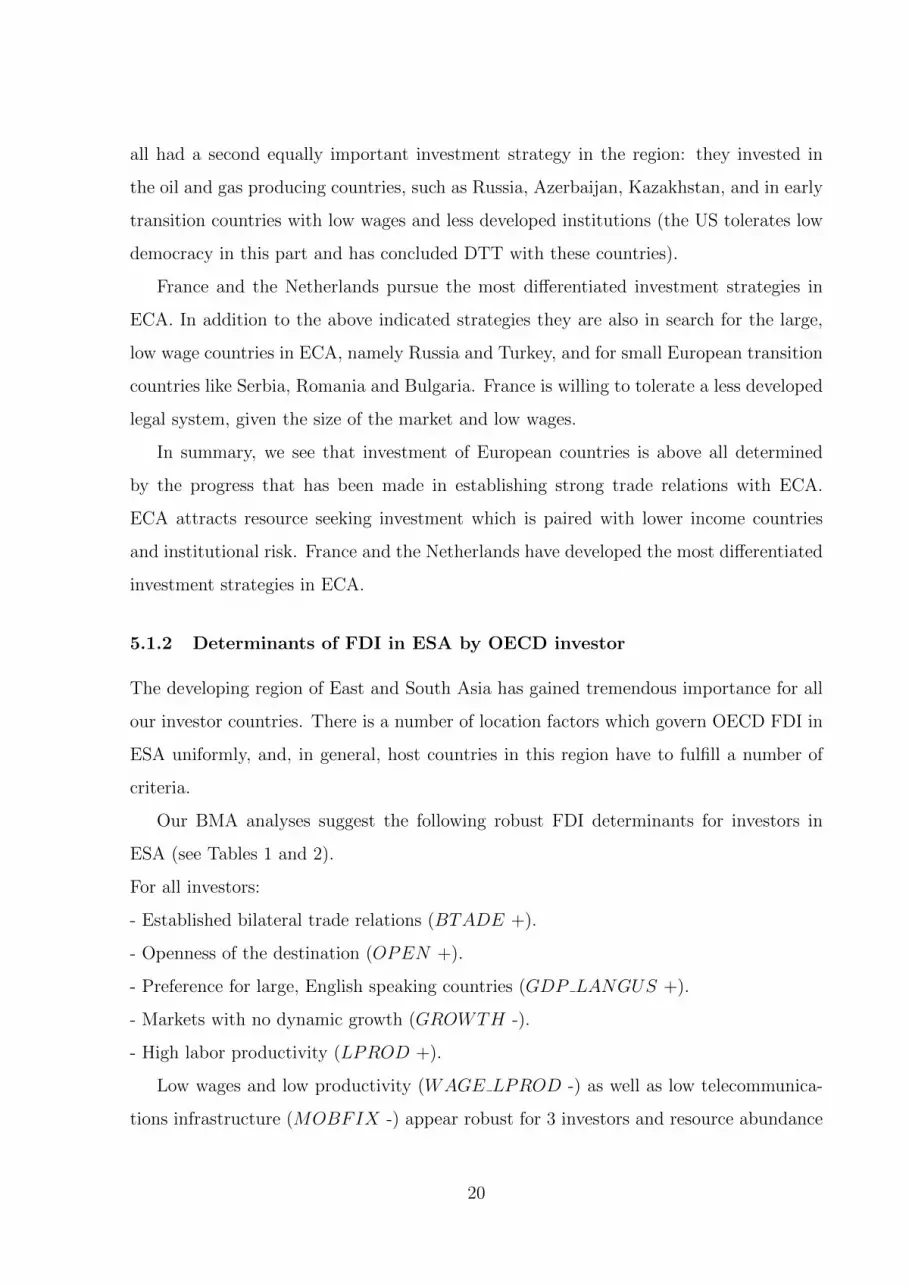
all had a second equally important investment strategy in the region: they invested in
the oil and gas producing countries, such as Russia, Azerbaijan, Kazakhstan, and in early
transition countries with low wages and less developed institutions (the US tolerates low
democracy in this part and has concluded DTT with these countries).
France and the Netherlands pursue the most differentiated investment strategies in
ECA. In addition to the above indicated strategies they are also in search for the large,
low wage countries in ECA, namely Russia and Turkey, and for small European transition
countries like Serbia, Romania and Bulgaria. France is willing to tolerate a less developed
legal system, given the size of the market and low wages.
In summary, we see that investment of European countries is above all determined
by the progress that has been made in establishing strong trade relations with ECA.
ECA attracts resource seeking investment which is paired with lower income countries
and institutional risk. France and the Netherlands have developed the most differentiated
investment strategies in ECA.
5.1.2 Determinants of FDI in ESA by OECD investor
The developing region of East and South Asia has gained tremendous importance for all
our investor countries. There is a number of location factors which govern OECD FDI in
ESA uniformly, and, in general, host countries in this region have to fulfill a number of
criteria.
Our BMA analyses suggest the following robust FDI determinants for investors in
ESA (see Tables 1 and 2).
For all investors:
- Established bilateral trade relations (BTADE +).
- Openness of the destination (OPEN +).
- Preference for large, English speaking countries (GDP LANGUS +).
- Markets with no dynamic growth (GROWTH -).
- High labor productivity (LPROD +).
Low wages and low productivity (WAGE LPROD -) as well as low telecommunica-
tions infrastructure (MOBFIX -) appear robust for 3 investors and resource abundance
20
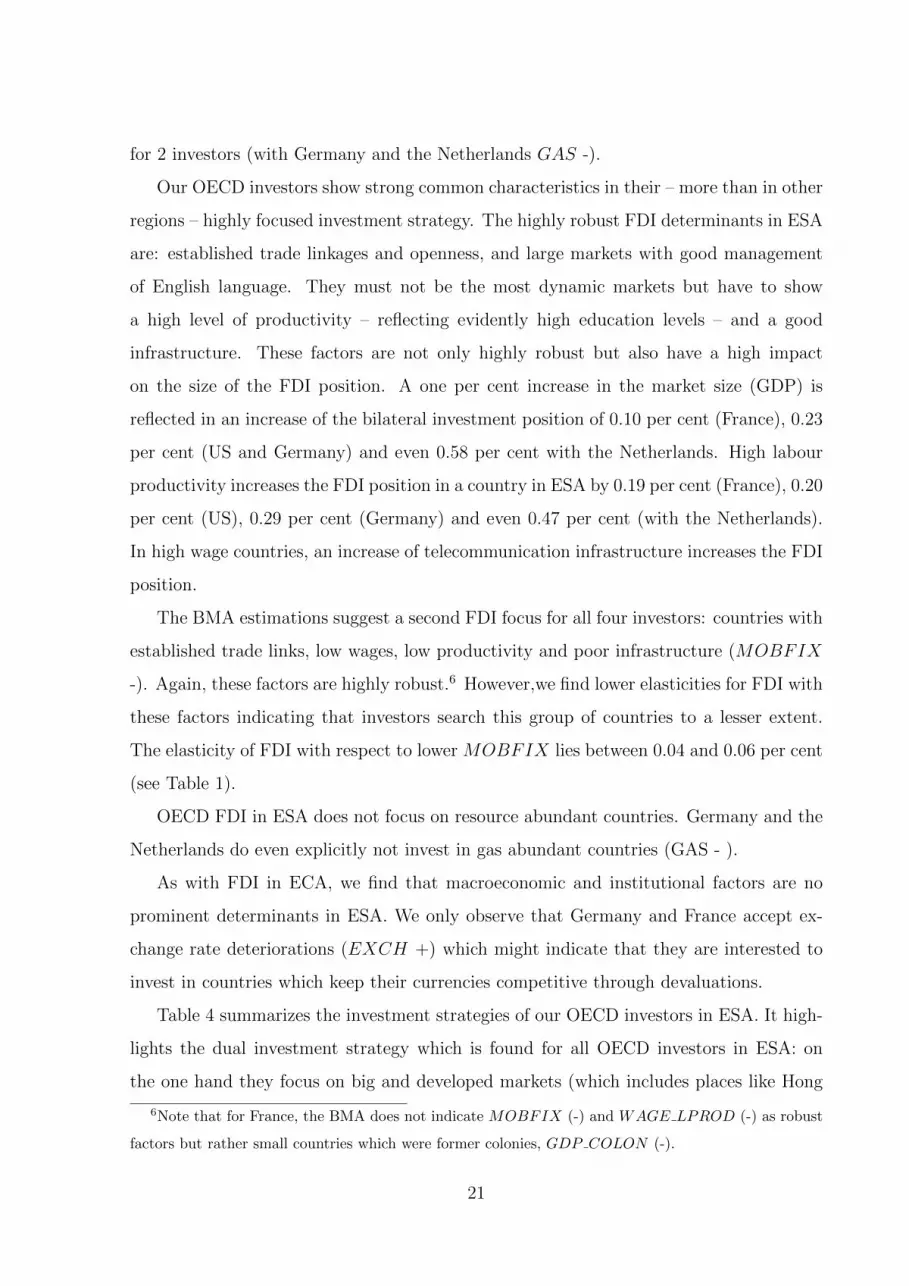
for 2 investors (with Germany and the Netherlands GAS -).
Our OECD investors show strong common characteristics in their – more than in other
regions – highly focused investment strategy. The highly robust FDI determinants in ESA
are: established trade linkages and openness, and large markets with good management
of English language. They must not be the most dynamic markets but have to show
a high level of productivity – reflecting evidently high education levels – and a good
infrastructure. These factors are not only highly robust but also have a high impact
on the size of the FDI position. A one per cent increase in the market size (GDP) is
reflected in an increase of the bilateral investment position of 0.10 per cent (France), 0.23
per cent (US and Germany) and even 0.58 per cent with the Netherlands. High labour
productivity increases the FDI position in a country in ESA by 0.19 per cent (France), 0.20
per cent (US), 0.29 per cent (Germany) and even 0.47 per cent (with the Netherlands).
In high wage countries, an increase of telecommunication infrastructure increases the FDI
position.
The BMA estimations suggest a second FDI focus for all four investors: countries with
established trade links, low wages, low productivity and poor infrastructure (MOBFIX
-). Again, these factors are highly robust.6 However,we find lower elasticities for FDI with
these factors indicating that investors search this group of countries to a lesser extent.
The elasticity of FDI with respect to lower MOBFIX lies between 0.04 and 0.06 per cent
(see Table 1).
OECD FDI in ESA does not focus on resource abundant countries. Germany and the
Netherlands do even explicitly not invest in gas abundant countries (GAS - ).
As with FDI in ECA, we find that macroeconomic and institutional factors are no
prominent determinants in ESA. We only observe that Germany and France accept ex-
change rate deteriorations (EXCH +) which might indicate that they are interested to
invest in countries which keep their currencies competitive through devaluations.
Table 4 summarizes the investment strategies of our OECD investors in ESA. It high-
lights the dual investment strategy which is found for all OECD investors in ESA: on
the one hand they focus on big and developed markets (which includes places like Hong
6Note that for France, the BMA does not indicate MOBFIX (-) and WAGE LPROD (-) as robust
factors but rather small countries which were former colonies, GDP COLON (-).
21
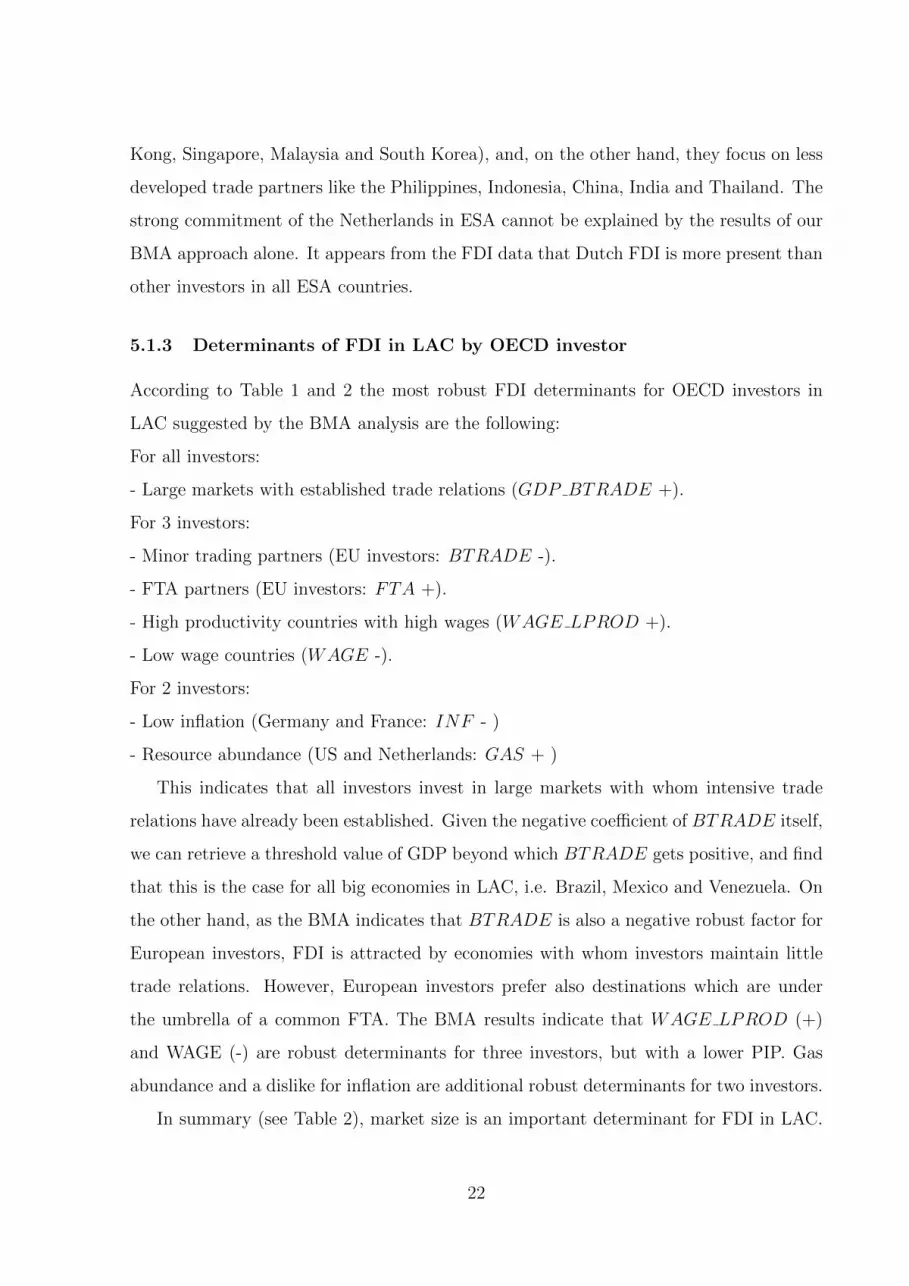
Kong, Singapore, Malaysia and South Korea), and, on the other hand, they focus on less
developed trade partners like the Philippines, Indonesia, China, India and Thailand. The
strong commitment of the Netherlands in ESA cannot be explained by the results of our
BMA approach alone. It appears from the FDI data that Dutch FDI is more present than
other investors in all ESA countries.
5.1.3 Determinants of FDI in LAC by OECD investor
According to Table 1 and 2 the most robust FDI determinants for OECD investors in
LAC suggested by the BMA analysis are the following:
For all investors:
- Large markets with established trade relations (GDP BTRADE +).
For 3 investors:
- Minor trading partners (EU investors: BTRADE -).
- FTA partners (EU investors: FTA +).
- High productivity countries with high wages (WAGE LPROD +).
- Low wage countries (WAGE -).
For 2 investors:
- Low inflation (Germany and France: INF - )
- Resource abundance (US and Netherlands: GAS + )
This indicates that all investors invest in large markets with whom intensive trade
relations have already been established. Given the negative coefficient of BTRADE itself,
we can retrieve a threshold value of GDP beyond which BTRADE gets positive, and find
that this is the case for all big economies in LAC, i.e. Brazil, Mexico and Venezuela. On
the other hand, as the BMA indicates that BTRADE is also a negative robust factor for
European investors, FDI is attracted by economies with whom investors maintain little
trade relations. However, European investors prefer also destinations which are under
the umbrella of a common FTA. The BMA results indicate that WAGE LPROD (+)
and WAGE (-) are robust determinants for three investors, but with a lower PIP. Gas
abundance and a dislike for inflation are additional robust determinants for two investors.
In summary (see Table 2), market size is an important determinant for FDI in LAC.
22
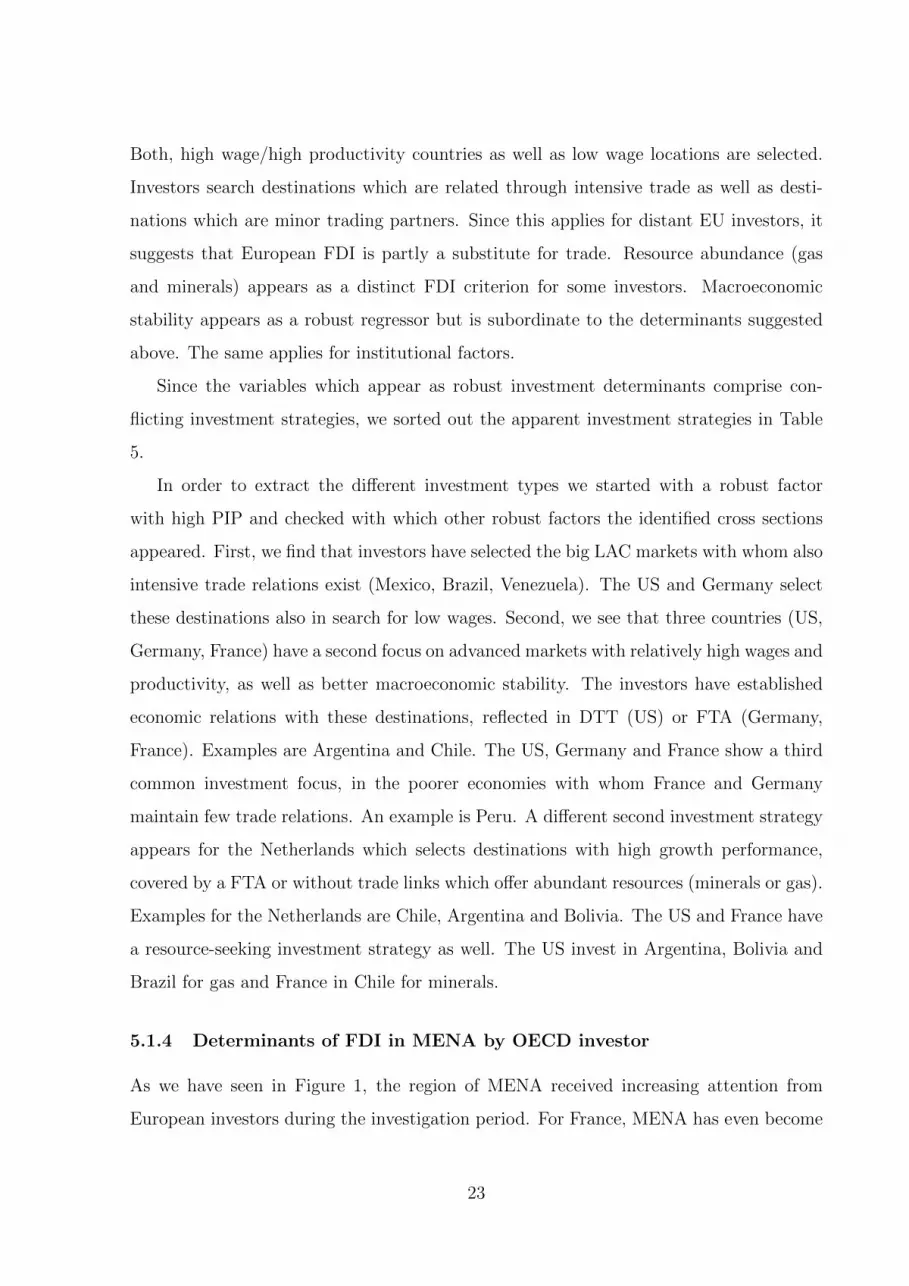
Both, high wage/high productivity countries as well as low wage locations are selected.
Investors search destinations which are related through intensive trade as well as desti-
nations which are minor trading partners. Since this applies for distant EU investors, it
suggests that European FDI is partly a substitute for trade. Resource abundance (gas
and minerals) appears as a distinct FDI criterion for some investors. Macroeconomic
stability appears as a robust regressor but is subordinate to the determinants suggested
above. The same applies for institutional factors.
Since the variables which appear as robust investment determinants comprise con-
flicting investment strategies, we sorted out the apparent investment strategies in Table
5.
In order to extract the different investment types we started with a robust factor
with high PIP and checked with which other robust factors the identified cross sections
appeared. First, we find that investors have selected the big LAC markets with whom also
intensive trade relations exist (Mexico, Brazil, Venezuela). The US and Germany select
these destinations also in search for low wages. Second, we see that three countries (US,
Germany, France) have a second focus on advanced markets with relatively high wages and
productivity, as well as better macroeconomic stability. The investors have established
economic relations with these destinations, reflected in DTT (US) or FTA (Germany,
France). Examples are Argentina and Chile. The US, Germany and France show a third
common investment focus, in the poorer economies with whom France and Germany
maintain few trade relations. An example is Peru. A different second investment strategy
appears for the Netherlands which selects destinations with high growth performance,
covered by a FTA or without trade links which offer abundant resources (minerals or gas).
Examples for the Netherlands are Chile, Argentina and Bolivia. The US and France have
a resource-seeking investment strategy as well. The US invest in Argentina, Bolivia and
Brazil for gas and France in Chile for minerals.
5.1.4 Determinants of FDI in MENA by OECD investor
As we have seen in Figure 1, the region of MENA received increasing attention from
European investors during the investigation period. For France, MENA has even become
23
the most important FDI location, although immediately followed by ECA and ESA. In
contrast, US commitment in the region has remained rather moderate. In Table 1 and
2 we report the posterior moments of the FDI determinants from the BMA analysis and
the frequencies of robust variables, respectively.
Our investors seem to pursue fairly individual investment strategies. Besides GDP ,
which appears – also in combination with cultural ties – for the US and France, no other
determinants are consistently found robust. Three factors which belong to the “market
development” area are found with a negative sign. There are practically no robust factors
in the areas of “economic relations”, “macroeconomic stability” and “infrastructure”. We
find, however, repeatedly institutional factors as robust determinants (twice with negative
and with positive sign). For two countries, “cultural proximity” is a robust investment
factors.
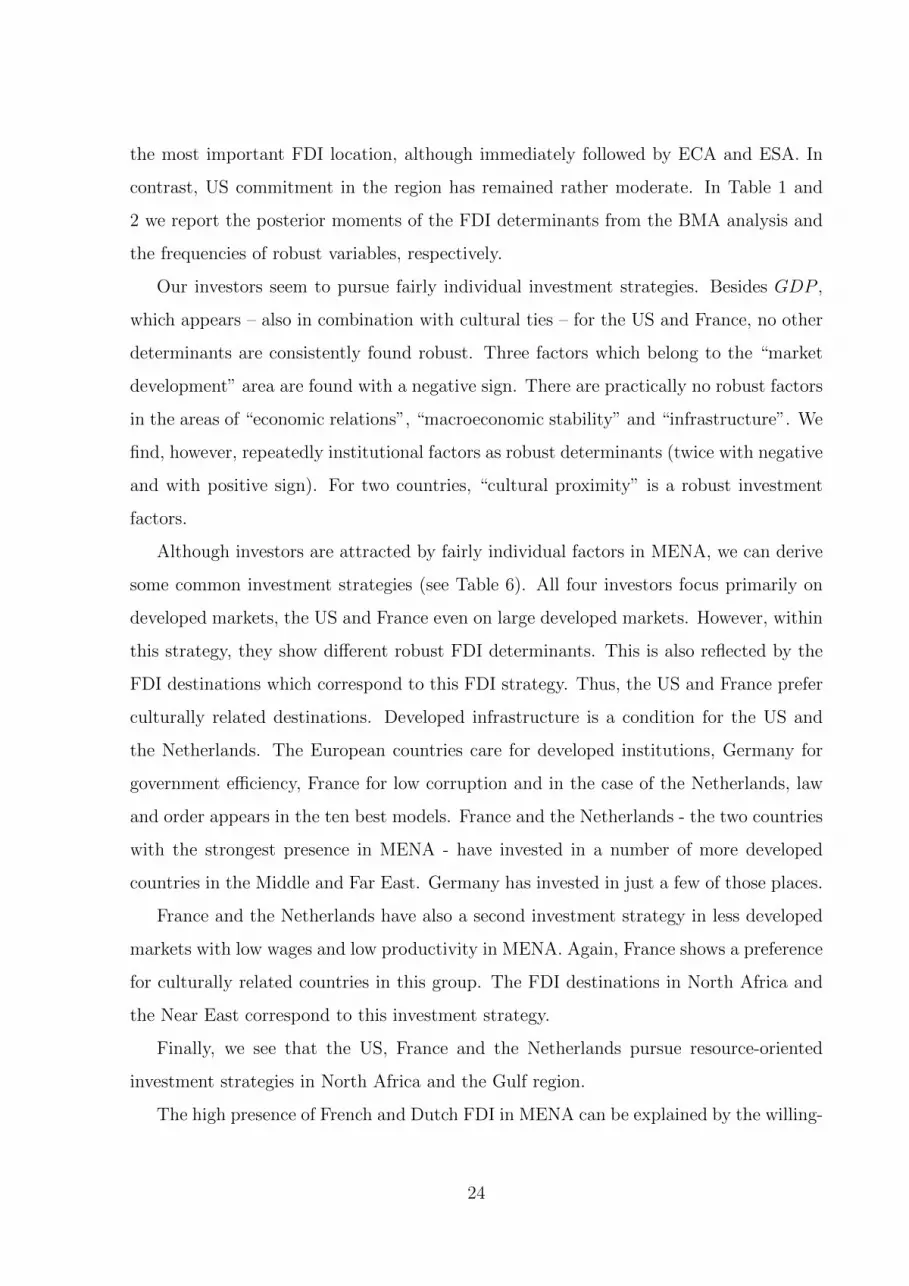
Although investors are attracted by fairly individual factors in MENA, we can derive
some common investment strategies (see Table 6). All four investors focus primarily on
developed markets, the US and France even on large developed markets. However, within
this strategy, they show different robust FDI determinants. This is also reflected by the
FDI destinations which correspond to this FDI strategy. Thus, the US and France prefer
culturally related destinations. Developed infrastructure is a condition for the US and
the Netherlands. The European countries care for developed institutions, Germany for
government efficiency, France for low corruption and in the case of the Netherlands, law
and order appears in the ten best models. France and the Netherlands - the two countries
with the strongest presence in MENA - have invested in a number of more developed
countries in the Middle and Far East. Germany has invested in just a few of those places.
France and the Netherlands have also a second investment strategy in less developed
markets with low wages and low productivity in MENA. Again, France shows a preference
for culturally related countries in this group. The FDI destinations in North Africa and
the Near East correspond to this investment strategy.
Finally, we see that the US, France and the Netherlands pursue resource-oriented
investment strategies in North Africa and the Gulf region.
The high presence of French and Dutch FDI in MENA can be explained by the willing-
24
ness of their investors to engage in very different areas which might also bear higher risk.
Germany has increased its investment selectively in all parts of MENA following, however,
much clearer and thus more restrictive investment criteria. For all European investors,
– to a minor extent for France although–, these destinations are new and challenging.
Established trade relations do not show to be an important criterion. Consequently, a
part of European FDI in MENA seems to be market-seeking.
5.1.5 Determinants of FDI in SSA by OECD investor
The results presented in Table 1 and 2 indicate that FDI of our OECD investors follows
distinctly different location factors in SSA. However, as we shall argue, one can associate
the same types of investment strategy with those factors.
Thus, the robust FDI determinants are manifold, much more than in the other invest-
ment regions. Nevertheless, market size (GDP alone with a positive sign or in combi-
nation with English language) appears in the case of three investors as a robust factor.
Oil and gas are also robust factors with three investors (OIL GAS with positive sign for
the US and the Netherlands, BTRADE OIL with positive sign for France). Three vari-
ables that indicate “market development” are found as further robust factors (GDPPC
+, EXCH GDPPC +, WAGE LPROD +, WAGE +). In contrast to ECA, ESA
and LAC but as in MENA, variables in the area of “openness and economic relations”
are hardly FDI determinants. As with the other investment regions, macroeconomic and
institutional factors are of minor importance.
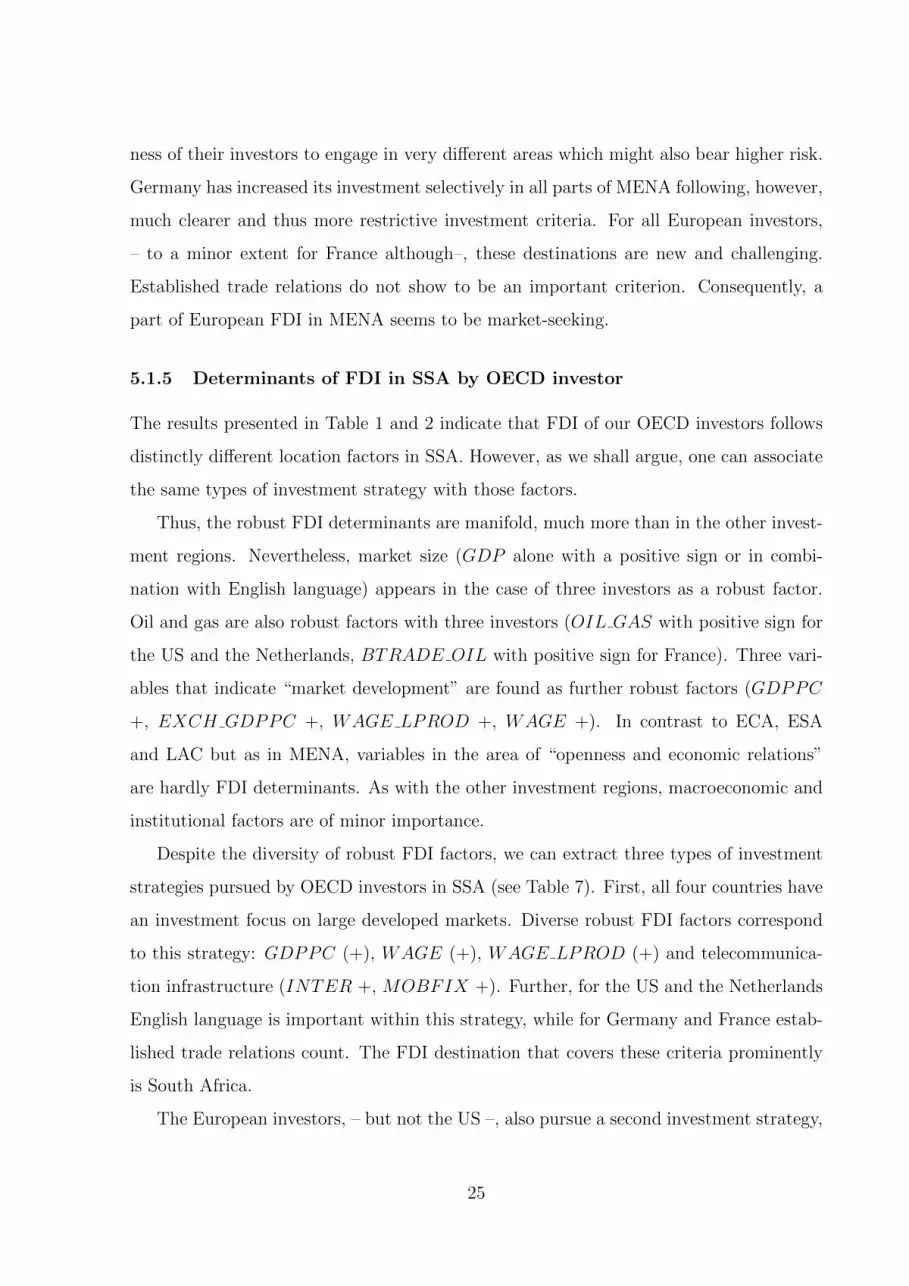
Despite the diversity of robust FDI factors, we can extract three types of investment
strategies pursued by OECD investors in SSA (see Table 7). First, all four countries have
an investment focus on large developed markets. Diverse robust FDI factors correspond
to this strategy: GDPPC (+), WAGE (+), WAGE LPROD (+) and telecommunica-
tion infrastructure (INTER +, MOBFIX +). Further, for the US and the Netherlands
English language is important within this strategy, while for Germany and France estab-
lished trade relations count. The FDI destination that covers these criteria prominently
is South Africa.
The European investors, – but not the US –, also pursue a second investment strategy,
25
placed in poor countries, with poor infrastructure and weak institutions.
Finally the US, France and the Netherlands, – but not Germany –, invest in SSA for
resource-seeking motives. An example is Nigeria. The Netherlands holds resource-seeking
investment in several locations: Nigeria, Angola, Cameroon, the Republic of Congo and
South Africa.
If we compare the FDI determinants found for OECD FDI in SSA with the motives
revealed in the other regions, we see that SSA can be only of minor importance to our
investors. It offers little potential for market-seeking FDI which our investors associate
with a sufficient labor productivity and infrastructure.7 SSA is largely seen as a FDI
location for resource-seeking FDI as pointed out also in Asiedu (2006).
5.2 Determinants of FDI in developing countries in general -
similarities and differences among OECD investors
Having learned about the FDI determinants in specific groups of developing countries,
we would like to conclude our analysis with the factors our investors care in developing
countries in general. For this purpose, we perform the BMA analysis on a worldwide pool
of developing countries. Since we wish to include the taxation factor the pool excludes
several countries in SSA and MENA.
Table 8 reports the posterior inclusion probability (PIP), the posterior mean and the
posterior standard error of the BMA for all developing countries for each of the four
OECD investors during 1995-2008.
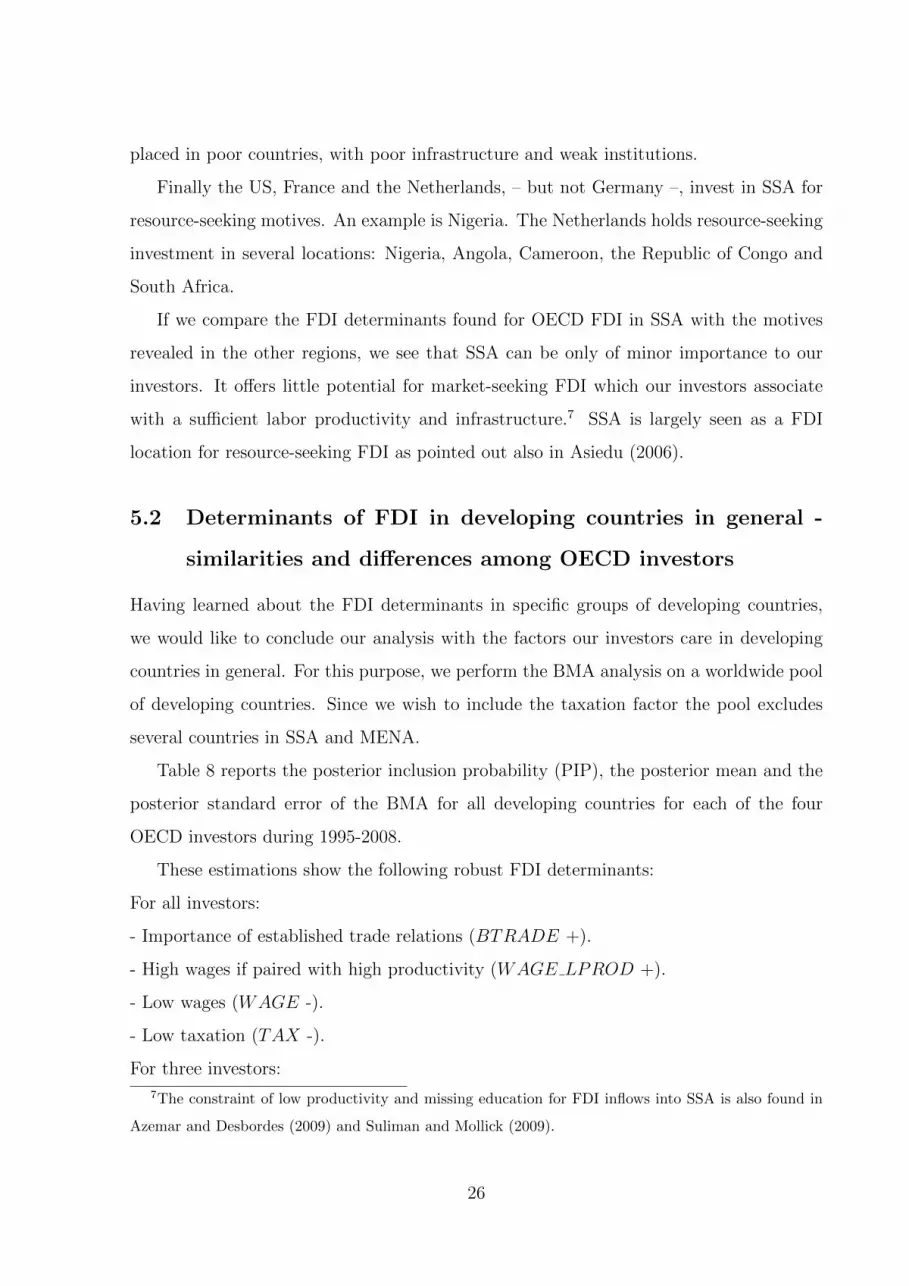
These estimations show the following robust FDI determinants:
For all investors:
- Importance of established trade relations (BTRADE +).
- High wages if paired with high productivity (WAGE LPROD +).
- Low wages (WAGE -).
- Low taxation (TAX -).
For three investors:
7The constraint of low productivity and missing education for FDI inflows into SSA is also found in
Azemar and Desbordes (2009) and Suliman and Mollick (2009).
26

- Market size (GDP +) (not with the Netherlands).
Compared to the above factors, indicators of macroeconomic stability have a lower
PIP or are below the 50 per cent threshold, i.e. are found only in the ten best models.
The sign is always negative, indicating a dislike for economically unstable destinations.
Infrastructure (MOBFIX +, -) is robust only for two investors. Institutional quality
(GOV +) is a robust factor for only one investor (Germany, and it is found among the
ten best models for the other investors). Resources (OIL +) are robust only for one
investor (Netherlands).
We see that all investors prefer destinations with whom good trade relations are es-
tablished. FDI follows trade. The US and France prefer culturally related destinations.
Linguistic ties are an important condition for them. All investors search for the more ad-
vanced markets in the developing world with high wages and high labor productivity and
all, except the Netherlands, search large markets. This suggests that all investors pursue
a market-seeking FDI strategy. Thus we can confirm the result found in the empirical
literature on the importance of the market size factor (see section 2) in a more specific
way. All investors reveal an efficiency-oriented investment strategy, looking for locations
with low wages or low tax rates. This confirms the findings of Braconier et al. (2005),
Benassy-Quere et al. (2007) and Bellak and Leibrecht (2009) but in a much larger country
context than the existing literature. From this, we can also conjecture that investors wish
to engage in vertical FDI where productions are dislocated to low wage destinations.
Comparing the scale of the FDI impact of variables across investor countries we see
that established trade relations have a considerably higher impact for European investors
than for the US. French FDI is less sensitive to the wage level than that of other investor
countries. The US focuses more than the other countries on big markets. FDI of France
and the Netherlands react stronger to taxation than German FDI. The superior size of
the coefficients of all variables in the estimation for the Netherlands reflects its leading
investment position.
In contrast to the picture drawn in the literature (see section 2), we see that macroe-
conomic stability is in general no robust FDI factor and, if so, it appears with a lower
PIP. The little robustness of institutional factors in our results is in contrast to the find-
27
ings of Busse and Hefeker (2007) and Wernick et al. (2009) who propose that institutions
play a major role for FDI decisions. However, their studies include only a very limited
number of other variables while we include some 30 additional explanatory variables in
our BMA. Thus, we have to conclude that when a large number of potential determinants
are included in the estimations, institutional factors are no longer important.
Besides the common FDI determinants, our investor countries show individual prefer-
ences. For the US, the area of “openness and economic relations” is more important than
for other investors. Besides established trade relations, the openness of a destination is
important. The US prefers globalized destinations. Furthermore, it is explicitly searching
for destinations covered by a free trade arrangement. Surprisingly, MOBFIX is a robust
factor with negative sign for the US. This might indicate that a part of its investment
focuses on the poorest developing countries, i.e. those with a poor infrastructure. One
has to note, however, that the impact of these individual US determinants is far less than
that of the above named factors, as shown by the size of the coefficients. Germany is
the only investor for whom institutional quality is a robust FDI determinant. It searches
destinations with efficient government institutions. France and the Netherlands care for
macroeconomic stability, France for exchange rate stability and the Netherlands for low
inflation. Surprisingly, France has an investment focus on countries which are not cov-
ered by a DTT . This might reflect that it thrives among others for destinations which
are less familiar to it. With the Netherlands, MOBFIX (+), INFL (-) and OIL (+)
are additional robust FDI factors. The Netherlands thus explicitly show a preference for
destinations with developed infrastructure, macroeconomic stability and resources.
Developing countries aiming to attract FDI are advised to invest in the qualification
of their workforce, to establish economic relations with potential investors, to keep wages
competitive and offer attractive tax rates.
6 Conclusions
The purpose of this study was to shed light on the determinants of FDI in developing
countries. We examined outward FDI stocks from four major OECD investors, namely the
US, Germany, France and the Netherlands into 129 developing countries grouped into five
28
world regions over the period 1995-2008. In an attempt to find robust explanatory factors
and to account for specific econometric issues, we estimated robust model specifications
by Bayesian Model Averaging (BMA). We scrutinized around 30 different explanatory
variables which can be clustered into market size and market dynamics, market develop-
ment (including labor costs and human capital), resources, openness and bilateral trade
relations, geographical and cultural proximity, macroeconomic factors, institutional fac-
tors and infrastructure. Finally, we allowed for heterogeneity across investor countries in
each developing region. The BMA analysis permitted us to identify the factors which are
indeed the dominant determinants for individual OECD investors, in DC in general and
within the regarded regions.
When investigating the FDI determinants of individual investors in all DC together,
we find that all show a strong FDI preference for countries with established trade re-
lations. All pursue two main strategies: (i) an efficiency-oriented FDI strategy opting
for destinations with low wages and attractive tax rates and (ii) a market-seeking FDI
strategy searching advanced markets with high productivity and high wages with some
preference for big economies. Concerning the size of the impact of these factors on FDI,
the criteria “qualification” and ”established trade relations” are by far the most important
ones. In contrast to the literature, we do not find that macroeconomic and institutional
factors are consistently robust FDI determinants when a large set of determinants is taken
into account. Our investors show some individual requirements on FDI locations: For the
US “openness and economic relations” are more important than for others. The US and
France prefer markets with linguistic ties. Institutional quality is only a robust factor
for Germany, and macroeconomic stability only for France and the Netherlands. The
Netherlands is the only investor that looks explicitly for locations with abundance of
crude oil.
Developing countries that wish to attract FDI should invest in the qualification of
their workforce and establish economic relations with potential investors. Low wages and
taxes have a lower potential to attract FDI.
Within the regarded regions Eastern Europe and Central Asia, East and South Asia,
Latin America and the Caribbean, Middle East and North Africa, and Sub-Saharan Africa,
29
our OECD investors reveal to some extent similar, but also dissenting investment patterns.
Eastern Europe and Central Asia (ECA) has become a major FDI destination for our
European investors, while the commitment of the US has remained moderate. For Ger-
many, this region has become the most import FDI destination, and it ranks second, close
to its Asia commitment, for the Netherlands. European investors give high importance to
destinations in Eastern Europe which have become open economies and are established
trade partners. All investors have searched for the advanced markets in Eastern Europe
with high productivity and higher wages. For Germany, this is the exclusive investment
strategy in ECA, while the US, France and the Netherlands have been also searching for
oil and gas abundant locations in Central Asia. France and the Netherlands pursue the
most diversified investment strategy in ECA searching also for low wage late transition
countries and low wage big economies (like Turkey and Russia). For European investors,
Eastern Europe has gained a similarly important role as Latin America (LAC) for the
US. Their FDI has been attracted by Eastern European countries due to a favorable
productivity-wage level and trade integration. The US commitment in Eastern Europe is
much smaller than the European one in Latin America, which may be related to missing
cultural and political ties that we found to be important for the US when investing in
DC.
East and South Asia (ESA) has significantly gained in importance for all our OECD
investors over the past decade. Particularly the Netherlands have an important FDI
commitment in the region. All our investors show – more than in other regions – a highly
focused and common investment strategy (i) on advanced large markets with a high
productivity level, a good management of English language, which are open economies
and are established trade partners, and (ii) low wage/low productivity destinations with
poor infrastructure with whom they have established good trade relations.
Latin America and the Caribbean (LAC) has been traditionally the most important
FDI destination for the US. It ranks on the fourth place in importance for Germany
and France and on the third place for the Netherlands, the latter having the highest
commitment of all investors in this region. All investors have searched for big LAC markets
with whom good trade relations have already been established. Besides that, investment
30

strategies reveal particularities of investors. European investors have placed their FDI
also in destinations which are minor trade partners which would indicate that FDI is a
substitute for trade in these distant destinations. Investors have searched destinations
with low wages as well as advanced economies with high productivity in LAC. The US,
France and the Netherlands invest in the region for resource-seeking motives. Since Dutch
FDI is to a considerable extent resource-seeking, it has become the most intensive in the
region. Trade liberalization and FTA negotiations seem to have been important for LAC
countries to attract FDI, developing productivity/education will be important for further
FDI.
The Middle East and North Africa (MENA) has also grown significantly in importance
for our European investors, but only modest for the US. Investment motives are very indi-
vidual in this region, although, all four investors have a strong focus on developed markets
in the region. The US and France prefer destinations with cultural proximity. A devel-
oped infrastructure is a strong criterion for the US and the Netherlands. In contrast to
other regions, we find that investors in MENA namely European investors, care for insti-
tutional quality. Established trade relations are no important criterion for investors. For
European investors, except for France, this region is rather new and challenging. The US,
France and the Netherlands, but not Germany have placed resource-oriented investment
in the region. MENA countries can become more attractive for OECD investors when
trade openness and external and cultural relations improve. There is further potential
for market-seeking as well as efficiency-seeking investment. To become more attractive,
countries have to improve their productivity, i.e., education.
The FDI commitment of our OECD investors in Sub-Saharan Africa (SSA) has re-
mained very modest. Despite the variety of individual criteria which investors request in
SSA, one can synthesize that all investors have focused their investment on South Africa,
due to its market size, the English language and the market development which is reflected
in a higher productivity and telecommunication infrastructure. European investors, but
not the US, have also invested in poor countries in SSA. All investors, except for Ger-
many have placed FDI in the region out of resource seeking motives. The commitment of
investors in SSA is not likely to gain immediately in importance, since the region offers
31
little potential for entry in advanced DC markets with an educated workforce, sufficient
infrastructure and effective administrations.
In summary, we can see from the analysis that our OECD investors show to quite
an extent common investment strategies in the regarded regions, although, the factors
identified in our BMA analysis as robust determinants may be quite heterogenous. The
Netherlands and France pursue the most diversified investment strategies while the US
and Germany have a more restricted scope. In contrast to the other investors, resources
are not a robust investment criteria for Germany. A common feature appears: investors
show a strong preference for advanced markets with a qualified labor force, and prefer
destinations which whom trade relations are established. However, they also place FDI
for reasons of cost-efficiency and thus search for locations with competitive wages and
attractive tax rates. Investment is still resource-seeking to a considerable extent.
References
Amiti, M., 1998. New Trade Theories and Industrial Location in the EU: A Survey of
Evidence. Oxford Review of Economic Policy 14 (2), 45–53.
Antal-Mokos, Z., 1998. Privatisation, Politics, and Economic Performance in Hungary.
Cambridge University Press.
Asiedu, E., 2006. Foreign Direct Investment in Africa: The Role of Natural Resources,
Market Size, Government Policy, Institutions and Political Instability. The World Econ-
omy 29 (1), 63–77.
Azemar, C., Desbordes, R., Jun. 2009. Short-run Strategies for Attracting Foreign Direct
Investment. Working Papers 24, Department of Economics, University of Glasgow.
Baltagi, B. H., Egger, P., Pfaffermayr, M., 2008. Estimating Regional Trade Agreement
Effects on FDI in an Interdependent World. Journal of Econometrics 145 (1-2), 194–
208.
Barrell, R., Pain, N., 1997. Foreign Direct Investment, Technological Change, and Eco-
nomic Growth within Europe. The Economic Journal 107 (445), 1770–1786.
32
Barrell, R., Pain, N., 1999. Domestic Institutions, Agglomerations and Foreign Direct
Investment in Europe. European Economic Review 43, 4–6.
Bellak, C., Leibrecht, M., 2009. Do Low Corporate Income Tax Rates Attract FDI? -
Evidence from Central- and East European Countries. Applied Economics 41 (21),
2691–2703.
Bellak, C., Leibrecht, M., Riedl, A., 2008. Labour Costs and FDI Flows into Central
and Eastern European Countries: A Survey of the Literature and Empirical Evidence.
Structural Change and Economic Dynamics 19 (1), 17–37.
Bellak, C., Leibrecht, M., Stehrer, R., 2010. The Role of Public Policy in Closing Foreign
Direct Investment Gaps: an Empirical Analysis. Empirica 37 (1), 19–46.
Benassy-Quere, A., Gobalraja, N., Trannoy, A., 04 2007. Tax and Public Input Competi-
tion. Economic Policy 22, 385–430.
Bevan, A. A., Estrin, S., 2004. The Determinants of Foreign Direct Investment into Eu-
ropean Transition Economies. Journal of Comparative Economics 32 (4), 775–787.
Bevan, A. A. Estrin, S., Meyer, K., 2004. Foreign Investment Location and Institutional
Development in Transition Economies. International Business Review 13 (1), 43–64.
Blonigen, B. A., December 2005. A Review of the Empirical Literature on FDI Determi-
nants. Atlantic Economic Journal 33 (4), 383–403.
Braconier, H., Norback, P.-J., Urban, D., 2005. Multinational Enterprises and Wage Costs:
Vertical FDI Revisited. Journal of International Economics 67 (2), 446–470.
Brock, W. A., Durlauf, S. N., 2001. Growth Empirics and Reality. The World Bank
Economic Review 15 (2), 229–272.
Buckley, P. J., 2008. Do we Need a Special Theory of Foreign Direct Investment for
Extractive Industries? Journal of Chinese Economic and Foreign Trade Studies 1 (2),
93–104.
33
Buettner, T., Ruf, M., 2007. Tax Incentives and the Location of FDI: Evidence from a
Panel of German Multinationals. International Tax and Public Finance 14 (2), 151–164.
Busse, M., Hefeker, C., 2007. Political Risk, Institutions and Foreign Direct Investment.
European Journal of Political Economy 23 (2), 397–415.
Campos, N. F., Kinoshita, Y., Jan. 2008. Foreign Direct Investment and Structural Re-
forms: Evidence from Eastern Europe and Latin America. IMF Working Papers 08/26,
International Monetary Fund.
Clark, E., Kassimatis, K., 2009. The Effect of Country Default Risk on Foreign Direct
Investment. Economia Internazionale / International Economics 62 (3), 342–361.
Cleeve, E., 2008. How Effective are Fiscal Incentives to Attract FDI to Sub-Saharan
Africa? Journal of Developing Areas 42 (1), 135–153.
Culem, C., 1988. The Locational Determinants of Direct Investments among Industrial-
ized Countries. European Economic Review 32 (4), 885–904.
de Boyrie, M. E., 2010. Structural Changes, Causality, and Foreign Direct Investments:
Evidence from the Asian Crises of 1997. Global Economy Journal 9 (4).
Desbordes, R., Vicard, V., 2009. Foreign Direct Investment and Bilateral Investment
Treaties: An International Political Perspective. Journal of Comparative Economics
37 (3), 372–386.
Dunning, J., 1993a. Multinational Enterprises and the Global Economy. Addision-Wesley,
Wokingham.
Dunning, J., 1993b. The Globalisation of Business. Routledge, London, NY.
Eicher, T., Papageorgiou, C., Raftery, A. E., 2007. Determining Growth Determinants:
Default Priors and Predictive Performance in Bayesian Model Averaging. Working Pa-
per 76, Center for Statistics and the Social Sciences, University of Washington.
Faeth, I., 2009. Determinants Of Foreign Direct Investment - A Tale Of Nine Theoretical
Models. Journal of Economic Surveys 23 (1), 165–196.
34
Fernandez, C., Ley, E., Steel, M. F. J., 2001a. Benchmark Priors for Bayesian Model
Averaging. Journal of Econometrics 100 (2), 381–427.
Fernandez, C., Ley, E., Steel, M. F. J., 2001b. Model Uncertainty in Cross-Country
Growth Regressions. Journal of Applied Econometrics 16 (5), 563–576.
Filippaios, F., Papanastassiou, M., 2008. US Outward Foreign Direct Investment in the
European Union and the Implementation of the Single Market: Empirical Evidence
from a Cohesive Framework. Journal of Common Market Studies 46, 969–1000.
Fontagne, L., Pajot, M., 1998. Investissement Direct a l’ etranger et Commerce Interna-
tional: Le cas francais. Revue Economique 49 (3), 593–606.
Foster, D., G. E., 1994. The Risk Inflation Criterion for Multiple Regression. Annals of
Statistics 22, 1947–1975.
Globerman, S., Shapiro, D., 2003. Governance Infrastructure and US Foreign Direct In-
vestment. Journal of International Business Studies 34 (1), 19–39.
Hattari, R., Rajan, R. S., 2009. Understanding Bilateral FDI Flows in Developing Asia.
Asian-Pacific Economic Literature 23 (2), 73–93.
Hoeting, J. A., Madigan, D., Raftery, A. E., Volinsky, C. T., 1999. Bayesian Model
Averaging: A Tutorial. Statistical Science 14 (4), pp. 382–401.
Kim, Y.-H., 2007. Impacts of Regional Economic Integration on Industrial Relocation
through FDI in East Asia. Journal of Policy Modeling 29 (1), 165–180.
Konings, J., Murphy, A. P., 2006. Do Multinational Enterprises Relocate Employment to
Low-Wage Regions? Evidence from European Multinationals. Review of World Eco-
nomics 142 (2), 267–286.
Krugman, P., 1979. Increasing Returns, Monopolistic Competition, and International-
Trade. Journal of International Economics 9 (4), 469–479.
Lansbury, M., Pain, N., Smidkova, K., 1996. Foreign Direct Investment in Central Europe
Since 1990: An Econometric Study. National Institute Economic Review 156, 104–114.
35

Leamer, E. E., 1978. Specification Searches: Ad Hoc Inference with Nonexperimental
Data. New York: John Wiley & Sons.
Leon-Gonzalez, R., Montolio, D., September 2004. Growth, Convergence and Public In-
vestment. A Bayesian Model Averaging Approach. Applied Economics 36 (17), 1925–
1936.
Ley, E., Steel, M. F., 2009. On the Effect of Prior Assumptions in Bayesian Model Aver-
aging with Applications to Growth Regression. Journal of Applied Econometrics 24 (4),
651–674.
Li, Q., Resnick, A., 2003. Reversal of Fortunes: Democratic Institutions and Foreign
Direct Investment Inflows to Developing Countries. International Organization 57 (01),
175–211.
Masanjala, W. H., Papageorgiou, C., 2008. Rough and Lonely Road to Prosperity: a
Reexamination of the Sources of Growth in Africa using Bayesian Model Averaging.
Journal of Applied Econometrics 23 (5), 671–682.
Meyer, K. E., 2001. Institutions, Transaction Costs, and Entry Mode Choice in Eastern
Europe. Journal of International Business Studies 32 (2), 357–367.
Nasser, O. M. A., 2007. The Determinants of the U.S. Foreign Direct Investment: Does
the Region Matter? Global Economic Review 36 (1), 37–51.
Naudand, W. A., Krugell, W. F., 2007. Investigating Geography and Institutions as De-
terminants of Foreign Direct Investment in Africa Using Panel Data. Applied Economics
39 (10), 1223–1233.
Noorbakhsh, F., Paloni, A., Youssef, A., 2001. Human Capital and FDI Inflows to Devel-
oping Countries: New Empirical Evidence. World Development 29 (9), 1593–1610.
Pfister, E., Deffains, B., November 2005. Patent Protection, Strategic FDI and Location
Choices: Empirical Evidence from French Subsidiaries; Location Choices in Emerging
Economies. International Journal of the Economics of Business 12 (3), 329–346.
36
Prufer, P., Tondl, G., 2008. The FDI-Growth Nexus in Latin America: The Role of Source
Countries and Local Conditions. Discussion Paper 2008-61, Tilburg University, Center
for Economic Research.
Raftery, A., 1995. Bayesian Model Selection in Social Research. Sociological Methodology
25, 111–196.
Sekkat, K., Veganzones-Varoudakis, M.-A., November 2007. Openness, Investment Cli-
mate, and FDI in Developing Countries. Review of Development Economics 11 (4),
607–620.
Serven, L., Apr. 2002. Real Exchange Rate Uncertainty and Private Investment in Devel-
oping Countries. Policy Research Working Paper Series 2823, The World Bank.
Suliman, A., Mollick, A. V., 2009. Human Capital Development, War and Foreign Direct
Investment in Sub-Saharan Africa. Oxford Development Studies 37 (1), 47–61.
Toubal, F., Kleinert, J., Buch, C., 2003. Determinants of German FDI: New Evidence
from Micro-Data. Discussion Paper Series 1: Economic Studies 2003,09, Deutsche
Bundesbank, Research Centre.
Trevino, L. J., Thomas, D. E., Cullen, J., February 2008. The Three Pillars of Institu-
tional Theory and FDI in Latin America: An Institutionalization Process. International
Business Review 17 (1), 118–133.
Udomkerdmongkol, M., Morrissey, O., Goerg, H., 2009. Exchange Rates and Outward
Foreign Direct Investment: US FDI in Emerging Economies. Review of Development
Economics 13 (4), 754–764.
Vodusek, Z., 2004. Foreign Direct Investment in Latin America: The Role of European
Investors. An update. SOE-IDB Working Paper Series 5, Inter-American Development
Bank.
Waldkirch, A., 2010. The Effects of Foreign Direct Investment in Mexico since NAFTA.
World Economy 33 (5), 710–745.
37
Wernick, D. A., Haar, J., Singh, S., 2009. Do Governing Institutions Affect Foreign Direct
Investment Inflows? International Journal of Economic and Business Research 1 (3),
317–332.
Wheeler, D., Mody, A., 1992. International Investment Location Decisions. The Case of
US Firms. Journal of International Economics 33, 57–76.
WIR, 2005. World Investment Report 2005: Transnational Corporations and the Inter-
nationalization of R&D. United Nations, New York and Geneva.
WIR, 2007. World Investment Report 2007: Transnational Corporations, Extractive In-
dustries and development. United Nations, New York and Geneva.
38
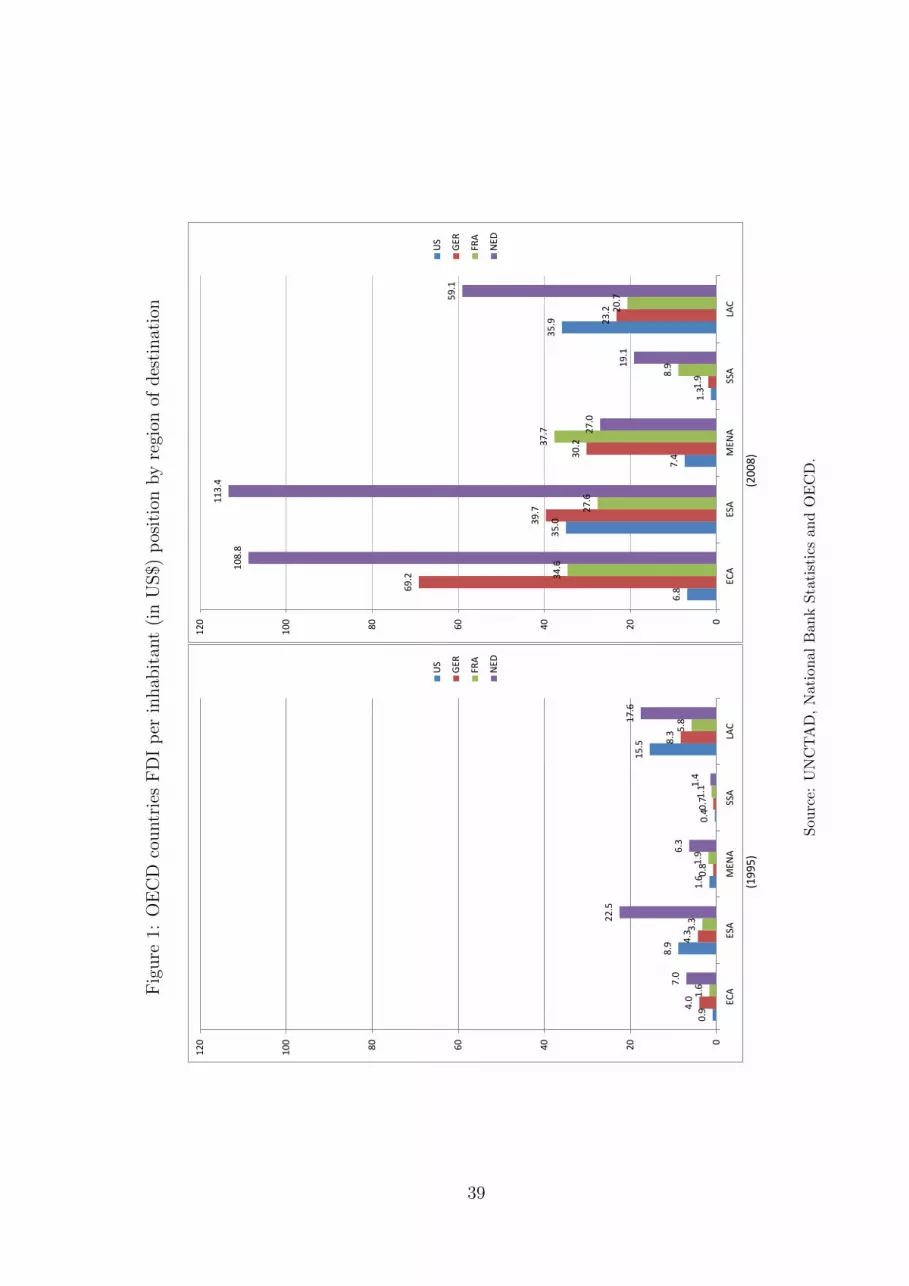
Fig
ure
1:O
EC
Dco
untr
ies
FD
Ip
erin
hab
itan
t(i
nU
S$)
pos
itio
nby
regi
onof
des
tinat
ion
(1
995
)
(20
08
)
0.9
8.9
1.6
0
.4
15
.5
4.0
4
.3
0.8
0
.7
8.3
1.6
3
.3
1.9
1
.1
5.8
7
.0
22
.5
6.3
1.4
17
.6
0
20
40
60
80
10
0
12
0
ECA
ES
A
MEN
A
SSA
LA
C
US
GER
FRA
NED
6.8
35
.0
7.4
1.3
35
.9
69
.2
39
.7
30
.2
1.9
23
.2
34
.6
27
.6
37
.7
8.9
20
.7
10
8.8
11
3.4
27
.0
19
.1
59
.1
0
20
40
60
80
10
0
12
0
ECA
ES
A
MEN
A
SSA
LA
C
US
GER
FRA
NED
Sou
rce:
UN
CT
AD
,N
ati
on
al
Ban
kS
tati
stic
san
dO
EC
D.
39

40
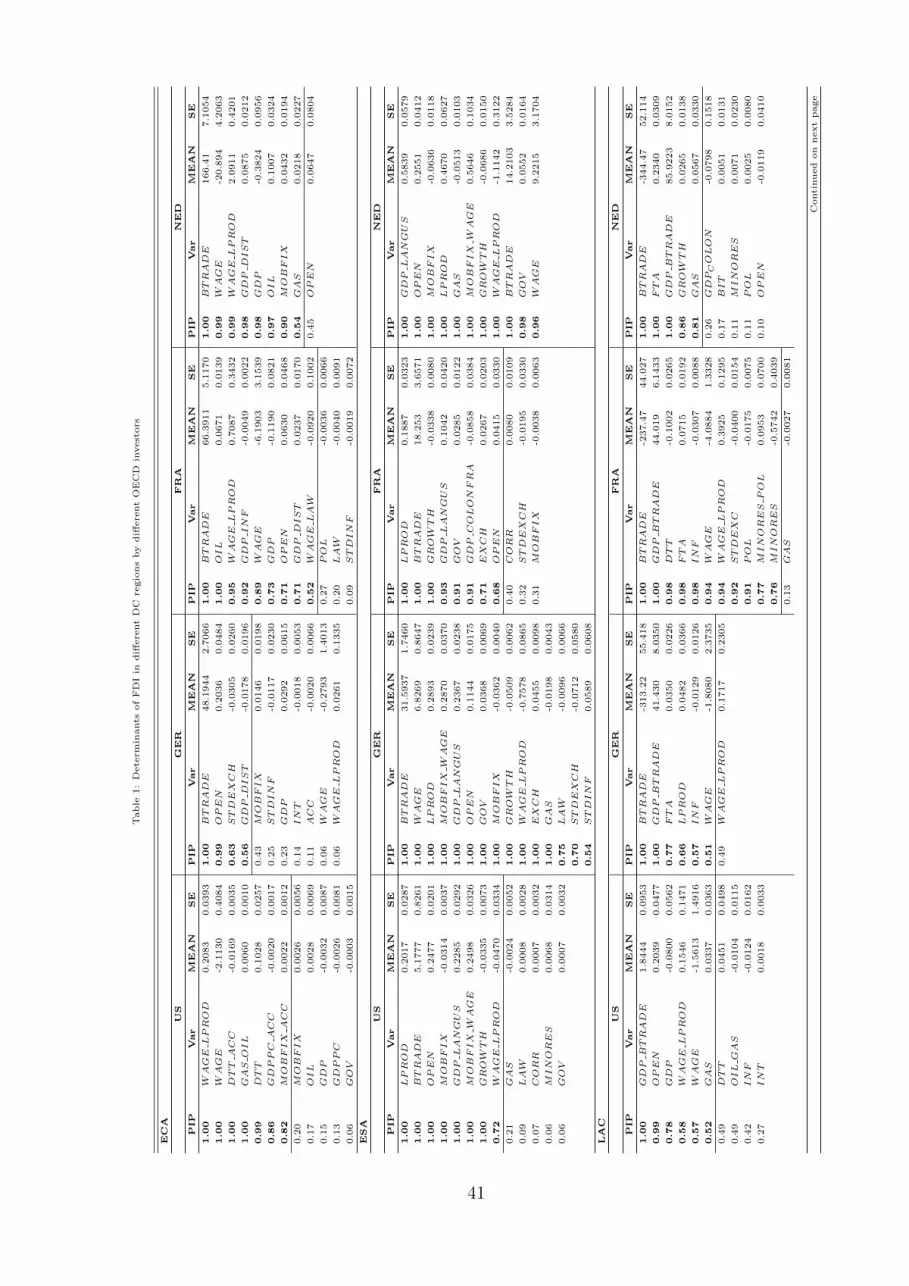
Table
1:
Dete
rmin
ants
of
FD
Iin
diff
ere
nt
DC
regio
ns
by
diff
ere
nt
OE
CD
invest
ors
ECA
US
GER
FR
AN
ED
PIP
Var
MEA
NSE
PIP
Var
MEA
NSE
PIP
Var
MEA
NSE
PIP
Var
MEA
NSE
1.0
0W
AGE
LPROD
0.2
083
0.0
393
1.0
0BTRAD
E48.1
944
2.7
066
1.0
0BTRAD
E66.3
911
5.1
170
1.0
0BTRAD
E166.4
17.1
054
1.0
0W
AGE
-2.1
130
0.4
084
0.9
9OPEN
0.2
036
0.0
484
1.0
0OIL
0.0
671
0.0
139
0.9
9W
AGE
-20.8
94
4.2
063
1.0
0D
TT
ACC
-0.0
169
0.0
035
0.6
3STD
EX
CH
-0.0
305
0.0
260
0.9
5W
AGE
LPROD
0.7
087
0.3
432
0.9
9W
AGE
LPROD
2.0
911
0.4
201
1.0
0GAS
OIL
0.0
060
0.0
010
0.5
6GD
PD
IST
-0.0
178
0.0
196
0.9
2GD
PIN
F-0
.0049
0.0
022
0.9
8GD
PD
IST
0.0
875
0.0
212
0.9
9D
TT
0.1
028
0.0
257
0.4
3M
OBFIX
0.0
146
0.0
198
0.8
9W
AGE
-6.1
903
3.1
539
0.9
8GD
P-0
.3824
0.0
956
0.8
6GD
PPC
ACC
-0.0
020
0.0
017
0.2
5STD
IN
F-0
.0117
0.0
230
0.7
3GD
P-0
.1190
0.0
821
0.9
7OIL
0.1
007
0.0
324
0.8
2M
OBFIX
ACC
0.0
022
0.0
012
0.2
3GD
P0.0
292
0.0
615
0.7
1OPEN
0.0
630
0.0
468
0.9
0M
OBFIX
0.0
432
0.0
194
0.2
0M
OBFIX
0.0
026
0.0
056
0.1
4IN
T-0
.0018
0.0
053
0.7
1GD
PD
IST
0.0
237
0.0
170
0.5
4GAS
0.0
218
0.0
227
0.1
7OIL
0.0
028
0.0
069
0.1
1ACC
-0.0
020
0.0
066
0.5
2W
AGE
LAW
-0.0
920
0.1
002
0.4
5OPEN
0.0
647
0.0
804
0.1
5GD
P-0
.0032
0.0
087
0.0
6W
AGE
-0.2
793
1.4
013
0.2
7POL
-0.0
036
0.0
066
0.1
3GD
PPC
-0.0
026
0.0
081
0.0
6W
AGE
LPROD
0.0
261
0.1
335
0.2
0LAW
-0.0
040
0.0
091
0.0
6GOV
-0.0
003
0.0
015
0.0
9STD
IN
F-0
.0019
0.0
072
ESA
US
GER
FR
AN
ED
PIP
Var
MEA
NSE
PIP
Var
MEA
NSE
PIP
Var
MEA
NSE
PIP
Var
MEA
NSE
1.0
0LPROD
0.2
017
0.0
287
1.0
0BTRAD
E31.5
937
1.7
460
1.0
0LPROD
0.1
887
0.0
323
1.0
0GD
PLAN
GUS
0.5
839
0.0
579
1.0
0BTRAD
E5.1
777
0.8
261
1.0
0W
AGE
6.8
269
0.8
647
1.0
0BTRAD
E18.2
53
3.6
571
1.0
0OPEN
0.2
551
0.0
412
1.0
0OPEN
0.2
477
0.0
201
1.0
0LPROD
0.2
893
0.0
239
1.0
0GROW
TH
-0.0
338
0.0
080
1.0
0M
OBFIX
-0.0
636
0.0
118
1.0
0M
OBFIX
-0.0
314
0.0
037
1.0
0M
OBFIX
WAGE
0.2
870
0.0
370
0.9
3GD
PLAN
GUS
0.1
042
0.0
420
1.0
0LPROD
0.4
670
0.0
627
1.0
0GD
PLAN
GUS
0.2
285
0.0
292
1.0
0GD
PLAN
GUS
0.2
367
0.0
238
0.9
1GOV
0.0
285
0.0
122
1.0
0GAS
-0.0
513
0.0
103
1.0
0M
OBFIX
WAGE
0.2
498
0.0
326
1.0
0OPEN
0.1
144
0.0
175
0.9
1GD
PCOLON
FRA
-0.0
858
0.0
384
1.0
0M
OBFIX
WAGE
0.5
646
0.1
034
1.0
0GROW
TH
-0.0
335
0.0
073
1.0
0GOV
0.0
368
0.0
069
0.7
1EX
CH
0.0
267
0.0
203
1.0
0GROW
TH
-0.0
686
0.0
150
0.7
2W
AGE
LPROD
-0.0
470
0.0
334
1.0
0M
OBFIX
-0.0
362
0.0
040
0.6
8OPEN
0.0
415
0.0
330
1.0
0W
AGE
LPROD
-1.1
142
0.3
122
0.2
1GAS
-0.0
024
0.0
052
1.0
0GROW
TH
-0.0
509
0.0
062
0.4
0CORR
0.0
080
0.0
109
1.0
0BTRAD
E14.2
103
3.5
284
0.0
9LAW
0.0
008
0.0
028
1.0
0W
AGE
LPROD
-0.7
578
0.0
865
0.3
2STD
EX
CH
-0.0
195
0.0
330
0.9
8GOV
0.0
552
0.0
164
0.0
7CORR
0.0
007
0.0
032
1.0
0EX
CH
0.0
455
0.0
098
0.3
1M
OBFIX
-0.0
038
0.0
063
0.9
6W
AGE
9.2
215
3.1
704
0.0
6M
IN
ORES
0.0
068
0.0
314
1.0
0GAS
-0.0
198
0.0
043
0.0
6GOV
0.0
007
0.0
032
0.7
5LAW
-0.0
096
0.0
066
0.7
0STD
EX
CH
-0.0
712
0.0
580
0.5
4STD
IN
F0.0
589
0.0
608
LAC
US
GER
FR
AN
ED
PIP
Var
MEA
NSE
PIP
Var
MEA
NSE
PIP
Var
MEA
NSE
PIP
Var
MEA
NSE
1.0
0GD
PBTRAD
E1.8
444
0.0
953
1.0
0BTRAD
E-3
13.2
255.4
18
1.0
0BTRAD
E-2
37.4
744.0
27
1.0
0BTRAD
E-3
44.4
752.1
14
0.9
9OPEN
0.2
039
0.0
477
1.0
0GD
PBTRAD
E41.4
30
8.0
350
1.0
0GD
PBTRAD
E44.0
19
6.1
433
1.0
0FTA
0.2
340
0.0
309
0.7
8GD
P-0
.0800
0.0
562
0.7
7FTA
0.0
350
0.0
226
0.9
8D
TT
-0.1
002
0.0
265
1.0
0GD
PBTRAD
E85.9
223
8.0
152
0.5
8W
AGE
LPROD
0.1
546
0.1
471
0.6
6LPROD
0.0
482
0.0
366
0.9
8FTA
0.0
715
0.0
192
0.8
6GROW
TH
0.0
265
0.0
138
0.5
7W
AGE
-1.5
613
1.4
916
0.5
7IN
F-0
.0129
0.0
126
0.9
8IN
F-0
.0307
0.0
088
0.8
1GAS
0.0
567
0.0
330
0.5
2GAS
0.0
337
0.0
363
0.5
1W
AGE
-1.8
080
2.3
735
0.9
4W
AGE
-4.0
884
1.3
328
0.2
6GD
PCOLON
-0.0
798
0.1
518
0.4
9D
TT
0.0
451
0.0
498
0.4
9W
AGE
LPROD
0.1
717
0.2
305
0.9
4W
AGE
LPROD
0.3
925
0.1
295
0.1
7BIT
0.0
051
0.0
131
0.4
9OIL
GAS
-0.0
104
0.0
115
0.9
2STD
EX
C-0
.0400
0.0
154
0.1
1M
IN
ORES
0.0
071
0.0
230
0.4
2IN
F-0
.0124
0.0
162
0.9
1POL
-0.0
175
0.0
075
0.1
1POL
0.0
025
0.0
080
0.2
7IN
T0.0
018
0.0
033
0.7
7M
IN
ORES
POL
0.0
953
0.0
700
0.1
0OPEN
-0.0
119
0.0
410
0.7
6M
IN
ORES
-0.5
742
0.4
039
0.1
3GAS
-0.0
027
0.0
081
Conti
nued
on
next
page
41
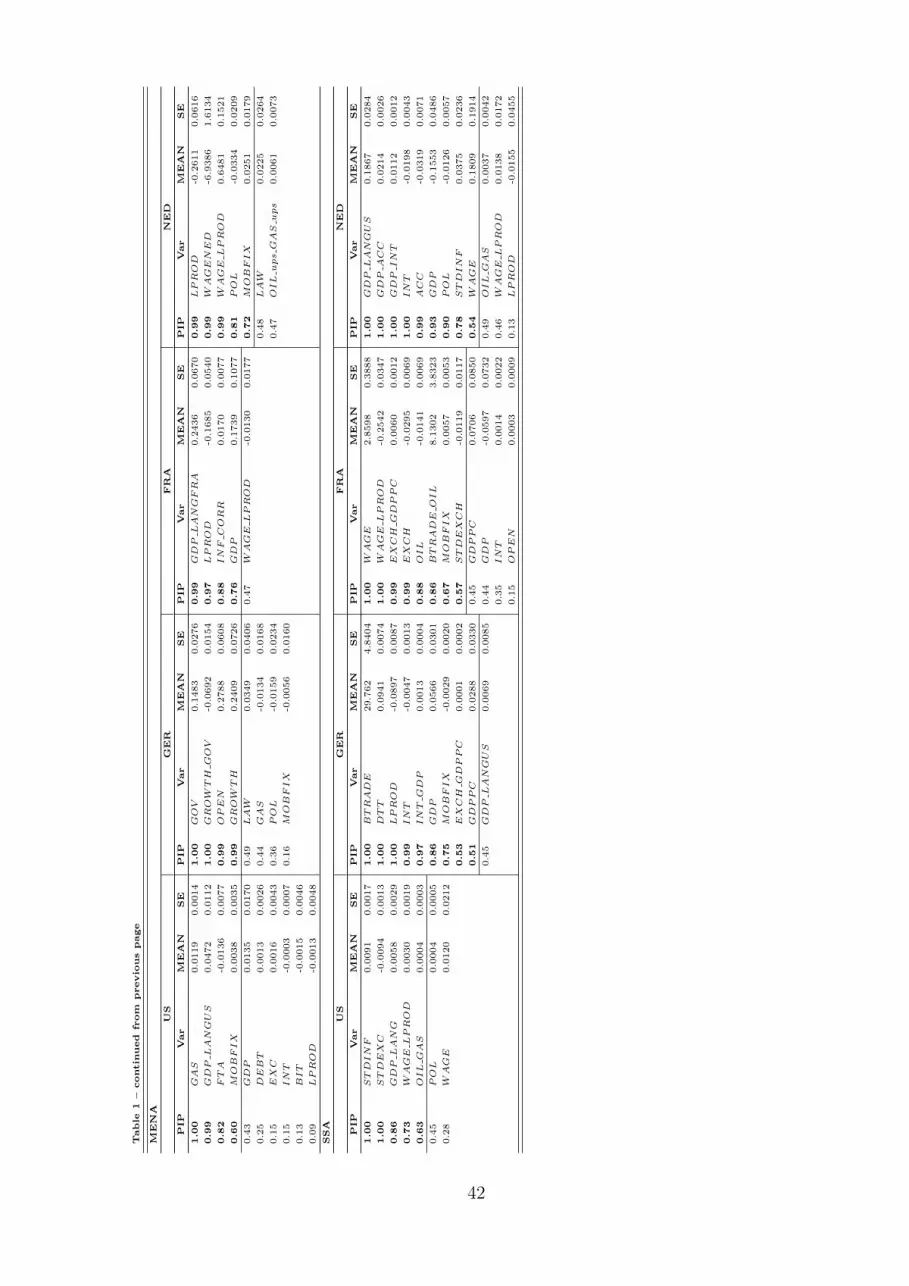
Table
1–
contin
ued
from
previo
us
page
MEN
A
US
GER
FR
AN
ED
PIP
Var
MEA
NSE
PIP
Var
MEA
NSE
PIP
Var
MEA
NSE
PIP
Var
MEA
NSE
1.0
0GAS
0.0
119
0.0
014
1.0
0GOV
0.1
483
0.0
276
0.9
9GD
PLAN
GFRA
0.2
436
0.0
670
0.9
9LPROD
-0.2
611
0.0
616
0.9
9GD
PLAN
GUS
0.0
472
0.0
112
1.0
0GROW
TH
GOV
-0.0
692
0.0
154
0.9
7LPROD
-0.1
685
0.0
540
0.9
9W
AGEN
ED
-6.9
386
1.6
134
0.8
2FTA
-0.0
136
0.0
077
0.9
9OPEN
0.2
788
0.0
608
0.8
8IN
FCORR
0.0
170
0.0
077
0.9
9W
AGE
LPROD
0.6
481
0.1
521
0.6
0M
OBFIX
0.0
038
0.0
035
0.9
9GROW
TH
0.2
409
0.0
726
0.7
6GD
P0.1
739
0.1
077
0.8
1POL
-0.0
334
0.0
209
0.4
3GD
P0.0
135
0.0
170
0.4
9LAW
0.0
349
0.0
406
0.4
7W
AGE
LPROD
-0.0
130
0.0
177
0.7
2M
OBFIX
0.0
251
0.0
179
0.2
5D
EBT
0.0
013
0.0
026
0.4
4GAS
-0.0
134
0.0
168
0.4
8LAW
0.0
225
0.0
264
0.1
5EX
C0.0
016
0.0
043
0.3
6POL
-0.0
159
0.0
234
0.4
7OIL
ups
GAS
ups
0.0
061
0.0
073
0.1
5IN
T-0
.0003
0.0
007
0.1
6M
OBFIX
-0.0
056
0.0
160
0.1
3BIT
-0.0
015
0.0
046
0.0
9LPROD
-0.0
013
0.0
048
SSA
US
GER
FR
AN
ED
PIP
Var
MEA
NSE
PIP
Var
MEA
NSE
PIP
Var
MEA
NSE
PIP
Var
MEA
NSE
1.0
0STD
IN
F0.0
091
0.0
017
1.0
0BTRAD
E29.7
62
4.8
404
1.0
0W
AGE
2.8
598
0.3
888
1.0
0GD
PLAN
GUS
0.1
867
0.0
284
1.0
0STD
EX
C-0
.0094
0.0
013
1.0
0D
TT
0.0
941
0.0
074
1.0
0W
AGE
LPROD
-0.2
542
0.0
347
1.0
0GD
PACC
0.0
214
0.0
026
0.8
6GD
PLAN
G0.0
058
0.0
029
1.0
0LPROD
-0.0
897
0.0
087
0.9
9EX
CH
GD
PPC
0.0
060
0.0
012
1.0
0GD
PIN
T0.0
112
0.0
012
0.7
3W
AGE
LPROD
0.0
030
0.0
019
0.9
9IN
T-0
.0047
0.0
013
0.9
9EX
CH
-0.0
295
0.0
069
1.0
0IN
T-0
.0198
0.0
043
0.6
3OIL
GAS
0.0
004
0.0
003
0.9
7IN
TGD
P0.0
013
0.0
004
0.8
8OIL
-0.0
141
0.0
069
0.9
9ACC
-0.0
319
0.0
071
0.4
5POL
0.0
004
0.0
005
0.8
6GD
P0.0
566
0.0
301
0.8
6BTRAD
EOIL
8.1
302
3.8
323
0.9
3GD
P-0
.1553
0.0
486
0.2
8W
AGE
0.0
120
0.0
212
0.7
5M
OBFIX
-0.0
029
0.0
020
0.6
7M
OBFIX
0.0
057
0.0
053
0.9
0POL
-0.0
126
0.0
057
0.5
3EX
CH
GD
PPC
0.0
001
0.0
002
0.5
7STD
EX
CH
-0.0
119
0.0
117
0.7
8STD
IN
F0.0
375
0.0
236
0.5
1GD
PPC
0.0
288
0.0
330
0.4
5GD
PPC
0.0
706
0.0
850
0.5
4W
AGE
0.1
809
0.1
914
0.4
5GD
PLAN
GUS
0.0
069
0.0
085
0.4
4GD
P-0
.0597
0.0
732
0.4
9OIL
GAS
0.0
037
0.0
042
0.3
5IN
T0.0
014
0.0
022
0.4
6W
AGE
LPROD
0.0
138
0.0
172
0.1
5OPEN
0.0
003
0.0
009
0.1
3LPROD
-0.0
155
0.0
455
42
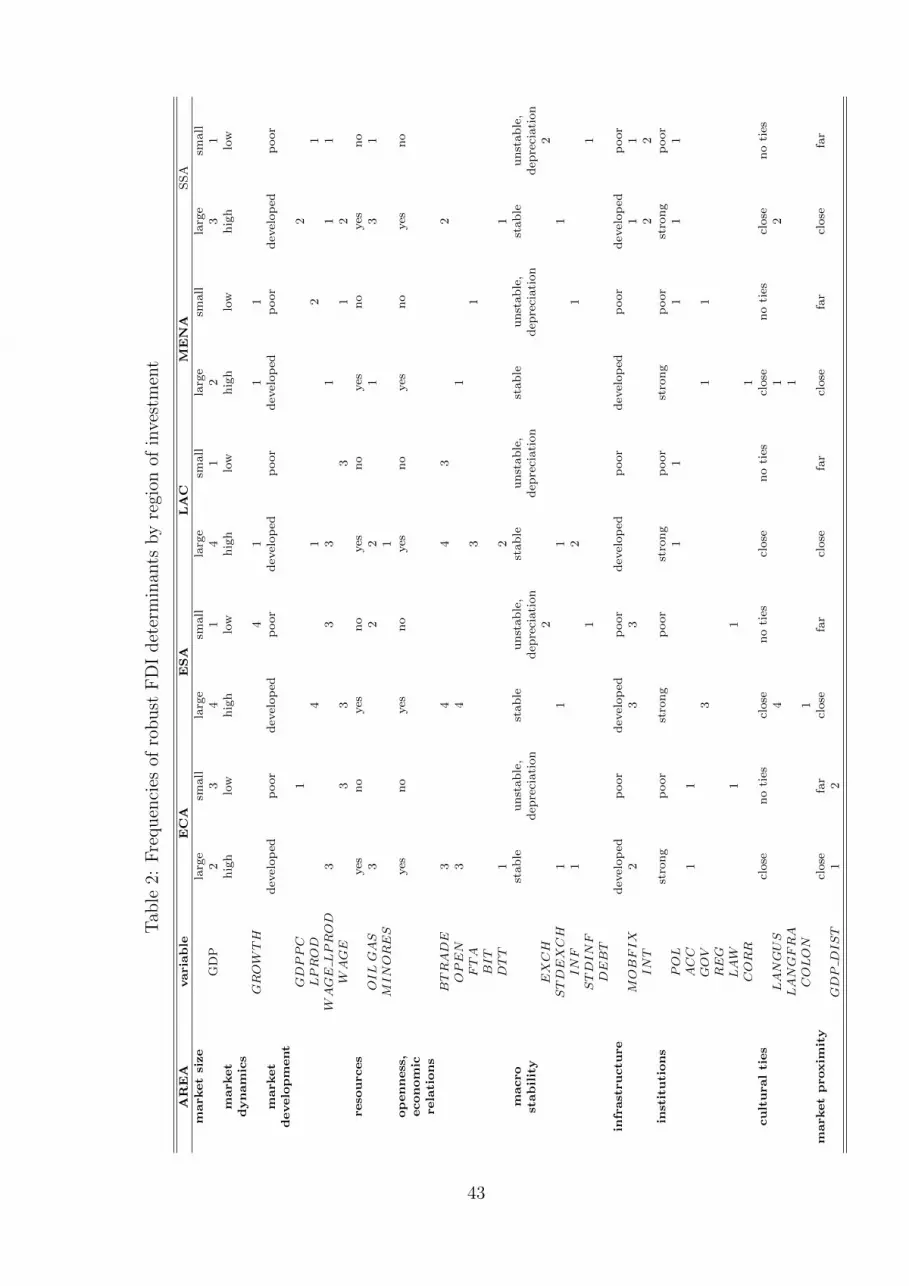
Tab
le2:
Fre
quen
cies
ofro
bust
FD
Idet
erm
inan
tsby
regi
onof
inve
stm
ent
AREA
variable
ECA
ESA
LAC
MENA
SS
Am
arketsize
larg
esm
all
larg
esm
all
larg
esm
all
larg
esm
all
larg
esm
all
GD
P2
34
14
12
31
market
hig
hlo
wh
igh
low
hig
hlo
wh
igh
low
hig
hlo
wdynam
ics
GROW
TH
41
11
market
dev
elop
edp
oor
dev
elop
edp
oor
dev
elop
edp
oor
dev
elop
edp
oor
dev
elop
edp
oor
developm
ent
GDPPC
12
LPROD
41
21
WAGE
LPROD
33
31
11
WAGE
33
31
2reso
urces
yes
no
yes
no
yes
no
yes
no
yes
no
OIL
GAS
32
21
31
MINORES
1openness,
yes
no
yes
no
yes
no
yes
no
yes
no
econom
icrelations
BTRADE
34
43
2OPEN
34
1FTA
31
BIT
DTT
12
1m
acro
stab
leu
nst
ab
le,
stab
leu
nst
ab
le,
stab
leu
nst
able
,st
ab
leu
nst
ab
le,
stab
leu
nst
ab
le,
stability
dep
reci
ati
on
dep
reci
ati
on
dep
reci
ati
on
dep
reci
ati
on
dep
reci
ati
on
EXCH
22
STDEXCH
11
11
INF
12
1STDINF
11
DEBT
infrastructu
re
dev
elop
edp
oor
dev
elop
edp
oor
dev
elop
edp
oor
dev
elop
edp
oor
dev
elop
edp
oor
MOBFIX
23
31
1INT
22
institutions
stro
ng
poor
stro
ng
poor
stro
ng
poor
stro
ng
poor
stro
ng
poor
POL
11
11
1ACC
11
GOV
31
1REG
LAW
11
CORR
1culturalties
close
no
ties
close
no
ties
close
no
ties
close
no
ties
close
no
ties
LANGUS
41
2LANGFRA
1COLON
1m
arketproxim
ity
close
far
close
far
close
far
close
far
close
far
GDP
DIST
12
43
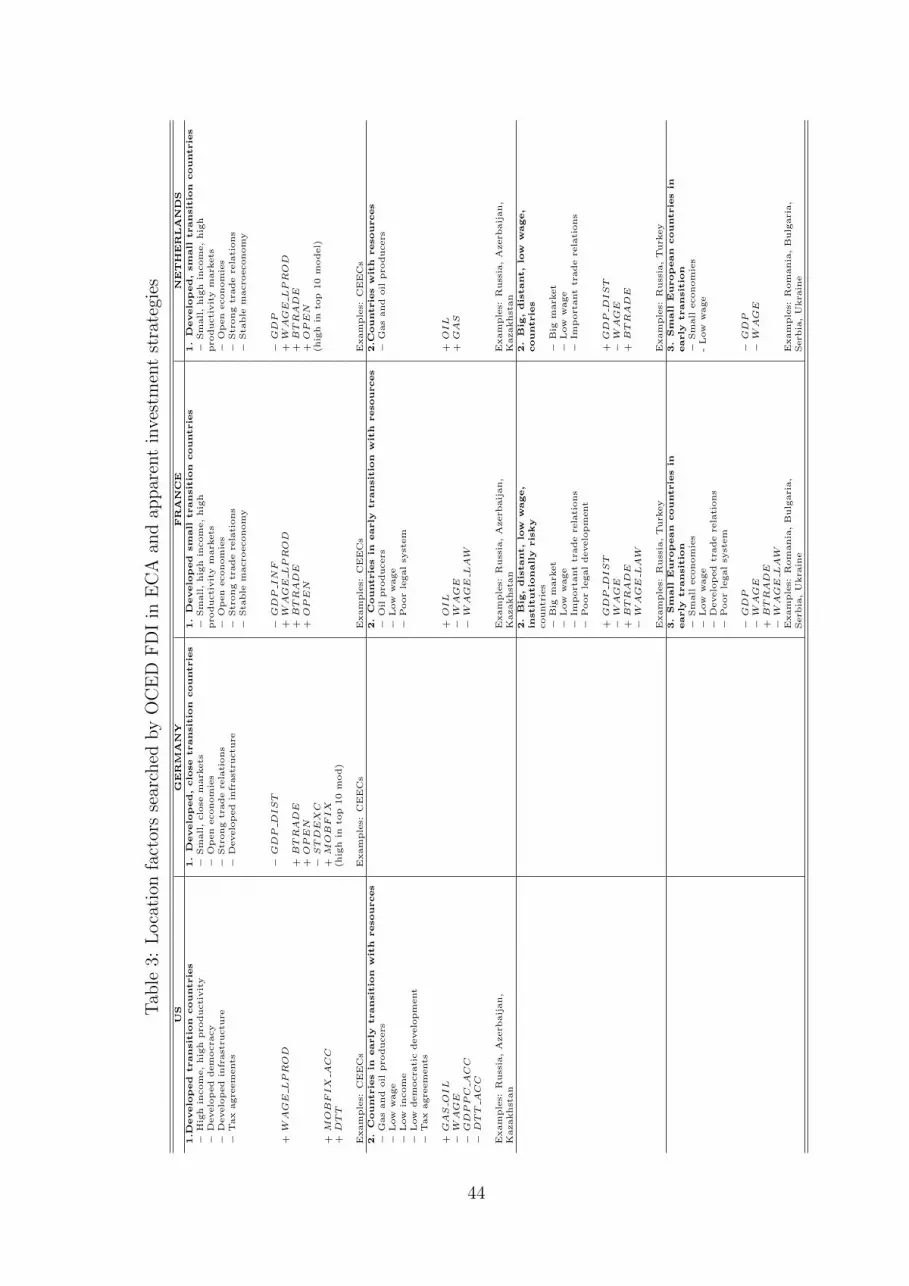
Tab
le3:
Loca
tion
fact
ors
sear
ched
by
OC
ED
FD
Iin
EC
Aan
dap
par
ent
inve
stm
ent
stra
tegi
es
US
GER
MA
NY
FR
AN
CE
NETH
ER
LA
ND
S1.D
evelo
ped
transitio
ncountrie
s1.
Develo
ped,clo
se
transitio
ncountrie
s1.
Develo
ped
sm
all
transitio
ncountrie
s1.
Develo
ped,sm
all
transitio
ncountrie
s−
Hig
hin
com
e,
hig
hpro
ducti
vit
y−
Sm
all,
clo
sem
ark
ets
−Sm
all,
hig
hin
com
e,
hig
h−
Sm
all,
hig
hin
com
e,
hig
h−
Develo
ped
dem
ocra
cy
−O
pen
econom
ies
pro
ducti
vit
ym
ark
ets
pro
ducti
vit
ym
ark
ets
−D
evelo
ped
infr
ast
ructu
re−
Str
ong
trade
rela
tions
−O
pen
econom
ies
−O
pen
econom
ies
−T
ax
agre
em
ents
−D
evelo
ped
infr
ast
ructu
re−
Str
ong
trade
rela
tions
−Str
ong
trade
rela
tions
−Sta
ble
macro
econom
y−
Sta
ble
macro
econom
y
−GD
PD
IST
−GD
PIN
F−
GD
P+
WAGE
LPROD
+W
AGE
LPROD
+W
AGE
LPROD
+BTRAD
E+
BTRAD
E+
BTRAD
E+
OPEN
+OPEN
+OPEN
−STD
EX
C(h
igh
into
p10
model)
+M
OBFIX
ACC
+M
OBFIX
+D
TT
(hig
hin
top
10
mod)
Exam
ple
s:C
EE
Cs
Exam
ple
s:C
EE
Cs
Exam
ple
s:C
EE
Cs
Exam
ple
s:C
EE
Cs
2.
Countrie
sin
early
transitio
nwith
resources
2.
Countrie
sin
early
transitio
nwith
resources
2.C
ountrie
swith
resources
−G
as
and
oil
pro
ducers
−O
ilpro
ducers
−G
as
and
oil
pro
ducers
−L
ow
wage
−L
ow
wage
−L
ow
incom
e−
Poor
legal
syst
em
−L
ow
dem
ocra
tic
develo
pm
ent
−T
ax
agre
em
ents
+GAS
OIL
+OIL
+OIL
−W
AGE
−W
AGE
+GAS
−GD
PPC
ACC
−W
AGE
LAW
−D
TT
ACC
Exam
ple
s:R
uss
ia,
Azerb
aij
an,
Exam
ple
s:R
uss
ia,
Azerb
aij
an,
Exam
ple
s:R
uss
ia,
Azerb
aij
an,
Kazakhst
an
Kazakhst
an
Kazakhst
an
2.
Big
,distant,lo
wwage,
2.
Big
,distant,lo
wwage,
institutio
nally
risky
countrie
scountr
ies
−B
igm
ark
et
−B
igm
ark
et
−L
ow
wage
−L
ow
wage
−Im
port
ant
trade
rela
tions
−Im
port
ant
trade
rela
tions
−P
oor
legal
develo
pm
ent
+GD
PD
IST
+GD
PD
IST
−W
AGE
−W
AGE
+BTRAD
E+
BTRAD
E−
WAGE
LAW
Exam
ple
s:R
uss
ia,
Turk
ey
Exam
ple
s:R
uss
ia,
Turk
ey
3.
Sm
all
European
countrie
sin
3.
Sm
all
European
countrie
sin
early
transitio
nearly
transitio
n−
Sm
all
econom
ies
−Sm
all
econom
ies
−L
ow
wage
-L
ow
wage
−D
evelo
ped
trade
rela
tions
−P
oor
legal
syst
em
−GD
P−
GD
P−
WAGE
−W
AGE
+BTRAD
E−
WAGE
LAW
Exam
ple
s:R
om
ania
,B
ulg
ari
a,
Exam
ple
s:R
om
ania
,B
ulg
ari
a,
Serb
ia,
Ukra
ine
Serb
ia,
Ukra
ine
44
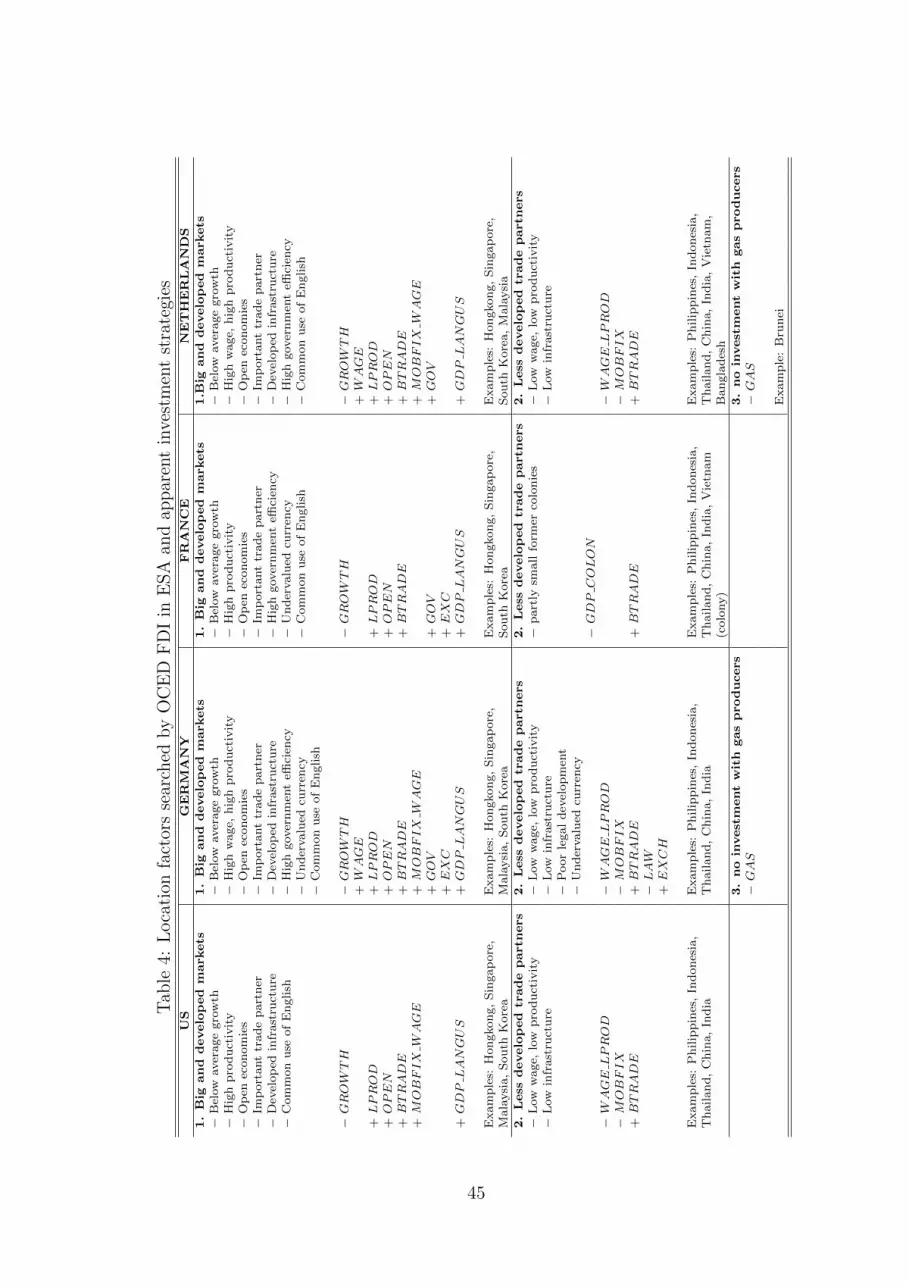
Tab
le4:
Loca
tion
fact
ors
sear
ched
by
OC
ED
FD
Iin
ESA
and
appar
ent
inve
stm
ent
stra
tegi
esUS
GERM
ANY
FRANCE
NETHERLANDS
1.Big
and
developed
markets
1.Big
and
developed
markets
1.Big
and
developed
markets
1.B
igand
developed
markets
−B
elow
aver
age
gro
wth
−B
elow
aver
age
gro
wth
−B
elow
aver
age
gro
wth
−B
elow
aver
age
gro
wth
−H
igh
pro
du
ctiv
ity
−H
igh
wage,
hig
hp
rod
uct
ivit
y−
Hig
hp
rod
uct
ivit
y−
Hig
hw
age,
hig
hp
rod
uct
ivit
y−
Op
enec
on
om
ies
−O
pen
econ
om
ies
−O
pen
econ
om
ies
−O
pen
econ
om
ies
−Im
port
ant
trad
ep
art
ner
−Im
port
ant
trad
ep
art
ner
−Im
port
ant
trad
ep
art
ner
−Im
port
ant
trad
ep
art
ner
−D
evel
op
edin
frast
ruct
ure
−D
evel
op
edin
frast
ruct
ure
−H
igh
gover
nm
ent
effici
ency
−D
evel
op
edin
frast
ruct
ure
−C
om
mon
use
of
En
glish
−H
igh
gover
nm
ent
effici
ency
−U
nd
ervalu
edcu
rren
cy−
Hig
hgover
nm
ent
effici
ency
−U
nd
ervalu
edcu
rren
cy−
Com
mon
use
of
En
glish
−C
om
mon
use
of
En
glish
−C
om
mon
use
of
En
glish
−GROW
TH
−GROW
TH
−GROW
TH
−GROW
TH
+W
AGE
+W
AGE
+LPROD
+LPROD
+LPROD
+LPROD
+OPEN
+OPEN
+OPEN
+OPEN
+BTRADE
+BTRADE
+BTRADE
+BTRADE
+M
OBFIX
WAGE
+M
OBFIX
WAGE
+M
OBFIX
WAGE
+GOV
+GOV
+GOV
+EXC
+EXC
+GDP
LANGUS
+GDP
LANGUS
+GDP
LANGUS
+GDP
LANGUS
Exam
ple
s:H
on
gkon
g,
Sin
gap
ore
,E
xam
ple
s:H
on
gkon
g,
Sin
gap
ore
,E
xam
ple
s:H
on
gkon
g,
Sin
gap
ore
,E
xam
ple
s:H
on
gkon
g,
Sin
gap
ore
,M
ala
ysi
a,
Sou
thK
ore
aM
ala
ysi
a,
Sou
thK
ore
aS
ou
thK
ore
aS
ou
thK
ore
a,
Mala
ysi
a2.Less
developed
tradepartn
ers
2.Less
developed
tradepartn
ers
2.Less
developed
tradepartn
ers
2.Less
developed
tradepartn
ers
−L
ow
wage,
low
pro
du
ctiv
ity
−L
ow
wage,
low
pro
du
ctiv
ity
−p
art
lysm
all
form
erco
lon
ies
−L
ow
wage,
low
pro
du
ctiv
ity
−L
ow
infr
ast
ruct
ure
−L
ow
infr
ast
ruct
ure
−L
ow
infr
ast
ruct
ure
−P
oor
legal
dev
elop
men
t−
Un
der
valu
edcu
rren
cy−
GDP
COLON
−W
AGE
LPROD
−W
AGE
LPROD
−W
AGE
LPROD
−M
OBFIX
−M
OBFIX
−M
OBFIX
+BTRADE
+BTRADE
+BTRADE
+BTRADE
−LAW
+EXCH
Exam
ple
s:P
hilip
pin
es,
Ind
on
esia
,E
xam
ple
s:P
hilip
pin
es,
Ind
on
esia
,E
xam
ple
s:P
hilip
pin
es,
Ind
on
esia
,E
xam
ple
s:P
hilip
pin
es,
Ind
on
esia
,T
hailan
d,
Ch
ina,
Ind
iaT
hailan
d,
Ch
ina,
Ind
iaT
hailan
d,
Ch
ina,
Ind
ia,
Vie
tnam
Th
ailan
d,
Ch
ina,
Ind
ia,
Vie
tnam
,(c
olo
ny)
Ban
gla
des
h3.no
investm
entwith
gasproducers
3.no
investm
entwith
gasproducers
−GAS
−GAS
Exam
ple
:B
run
ei
45
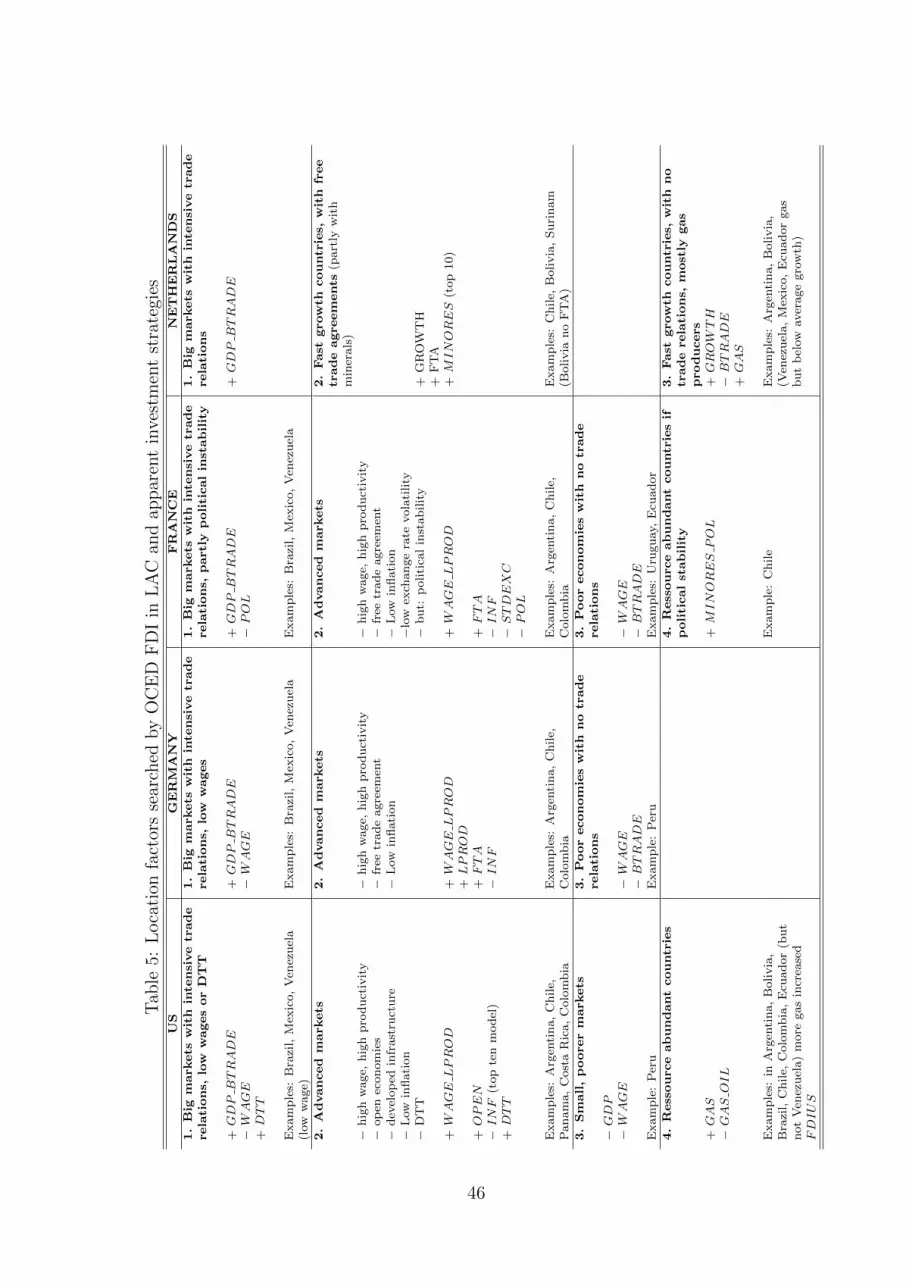
Tab
le5:
Loca
tion
fact
ors
sear
ched
by
OC
ED
FD
Iin
LA
Can
dap
par
ent
inve
stm
ent
stra
tegi
esUS
GERM
ANY
FRANCE
NETHERLANDS
1.Big
markets
with
inte
nsivetrade
1.Big
markets
with
inte
nsivetrade
1.Big
markets
with
inte
nsivetrade
1.Big
markets
with
inte
nsivetrade
relations,
low
wagesorDTT
relations,
low
wages
relations,
partly
politicalin
stability
relations
+GDP
BTRADE
+GDP
BTRADE
+GDP
BTRADE
+GDP
BTRADE
−W
AGE
−W
AGE
−POL
+DTT
Exam
ple
s:B
razi
l,M
exic
o,
Ven
ezu
ela
Exam
ple
s:B
razi
l,M
exic
o,
Ven
ezu
ela
Exam
ple
s:B
razi
l,M
exic
o,
Ven
ezu
ela
(low
wage)
2.Advanced
markets
2.Advanced
markets
2.Advanced
markets
2.Fast
growth
countries,
with
free
tradeagreem
ents
(part
lyw
ith
min
erals
)−
hig
hw
age,
hig
hp
rod
uct
ivit
y−
hig
hw
age,
hig
hp
rod
uct
ivit
y−
hig
hw
age,
hig
hp
rod
uct
ivit
y−
op
enec
on
om
ies
−fr
eetr
ad
eagre
emen
t−
free
trad
eagre
emen
t−
dev
elop
edin
frast
ruct
ure
−L
ow
infl
ati
on
−L
ow
infl
ati
on
−L
ow
infl
ati
on
−lo
wex
chan
ge
rate
vola
tility
−D
TT
−b
ut:
politi
cal
inst
ab
ilit
y+
GR
OW
TH
+F
TA
+W
AGE
LPROD
+W
AGE
LPROD
+W
AGE
LPROD
+M
INORES
(top
10)
+LPROD
+OPEN
+FTA
+FTA
−INF
(top
ten
mod
el)
−INF
−INF
+DTT
−STDEXC
−POL
Exam
ple
s:A
rgen
tin
a,
Ch
ile,
Exam
ple
s:A
rgen
tin
a,
Ch
ile,
Exam
ple
s:A
rgen
tin
a,
Ch
ile,
Exam
ple
s:C
hile,
Bolivia
,S
uri
nam
Pan
am
a,
Cost
aR
ica,
Colo
mb
iaC
olo
mbia
Colo
mb
ia(B
olivia
no
FT
A)
3.Sm
all,poorerm
arkets
3.Pooreconom
ieswith
no
trade
3.Pooreconom
ieswith
no
trade
relations
relations
−GDP
−W
AGE
−W
AGE
−W
AGE
−BTRADE
−BTRADE
Exam
ple
:P
eru
Exam
ple
:P
eru
Exam
ple
s:U
rugu
ay,
Ecu
ad
or
4.Ressourceabundantcountries
4.Ressourceabundantcountriesif
3.Fast
growth
countries,
with
no
politicalstability
traderelations,
mostly
gas
producers
+GAS
+M
INORES
POL
+GROW
TH
−GAS
OIL
−BTRADE
+GAS
Exam
ple
s:in
Arg
enti
na,
Bolivia
,E
xam
ple
:C
hile
Exam
ple
s:A
rgen
tin
a,
Bolivia
,B
razi
l,C
hile,
Colo
mb
ia,
Ecu
ad
or
(bu
t(V
enez
uel
a,
Mex
ico,
Ecu
ad
or
gas
not
Ven
ezu
ela)
more
gas
incr
ease
db
ut
bel
ow
aver
age
gro
wth
)FDIUS
46
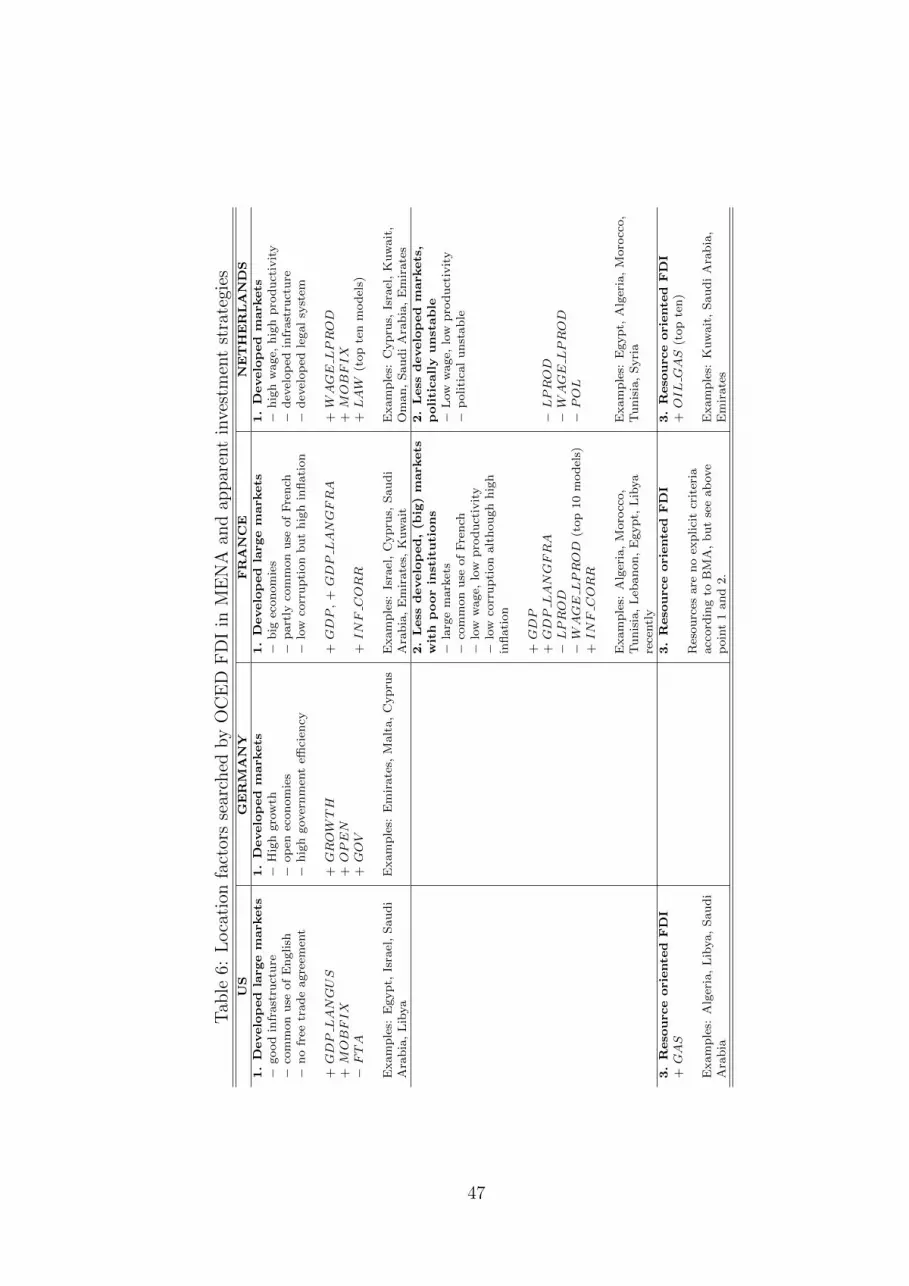
Tab
le6:
Loca
tion
fact
ors
sear
ched
by
OC
ED
FD
Iin
ME
NA
and
appar
ent
inve
stm
ent
stra
tegi
esUS
GERM
ANY
FRANCE
NETHERLANDS
1.Developed
largem
arkets
1.Developed
markets
1.Developed
largem
arkets
1.Developed
markets
−good
infr
ast
ruct
ure
−H
igh
gro
wth
−b
igec
on
om
ies
−h
igh
wage,
hig
hp
rod
uct
ivit
y−
com
mon
use
of
En
glish
−op
enec
on
om
ies
−p
art
lyco
mm
on
use
of
Fre
nch
−d
evel
op
edin
frast
ruct
ure
−n
ofr
eetr
ad
eagre
emen
t−
hig
hgover
nm
ent
effici
ency
−lo
wco
rru
pti
on
bu
th
igh
infl
ati
on
−d
evel
op
edle
gal
syst
em
+GDP
LANGUS
+GROW
TH
+GDP
,+
GDP
LANGFRA
+W
AGE
LPROD
+M
OBFIX
+OPEN
+M
OBFIX
−FTA
+GOV
+INF
CORR
+LAW
(top
ten
mod
els)
Exam
ple
s:E
gyp
t,Is
rael
,S
au
di
Exam
ple
s:E
mir
ate
s,M
alt
a,
Cyp
rus
Exam
ple
s:Is
rael
,C
yp
rus,
Sau
di
Exam
ple
s:C
yp
rus,
Isra
el,
Kuw
ait
,A
rab
ia,
Lib
ya
Ara
bia
,E
mir
ate
s,K
uw
ait
Om
an
,S
au
di
Ara
bia
,E
mir
ate
s2.Less
developed,(b
ig)m
arkets
2.Less
developed
markets,
with
poorin
stitutions
politically
unstable
−la
rge
mark
ets
−L
ow
wage,
low
pro
du
ctiv
ity
−co
mm
on
use
of
Fre
nch
−p
oli
tica
lu
nst
ab
le−
low
wage,
low
pro
du
ctiv
ity
−lo
wco
rru
pti
on
alt
hou
gh
hig
hin
flati
on
+GDP
+GDP
LANGFRA
−LPROD
−LPROD
−W
AGE
LPROD
−W
AGE
LPROD
(top
10
mod
els)
−POL
+INF
CORR
Exam
ple
s:A
lger
ia,
Moro
cco,
Exam
ple
s:E
gyp
t,A
lger
ia,
Moro
cco,
Tu
nis
ia,
Leb
an
on
,E
gyp
t,L
ibya
Tu
nis
ia,
Syri
are
centl
y3.Reso
urceoriente
dFDI
3.Reso
urceoriente
dFDI
3.Reso
urceoriente
dFDI
+GAS
+OIL
GAS
(top
ten
)R
esou
rces
are
no
exp
lici
tcr
iter
iaE
xam
ple
s:A
lger
ia,
Lib
ya,
Sau
di
acc
ord
ing
toB
MA
,bu
tse
eab
ove
Exam
ple
s:K
uw
ait
,S
au
di
Ara
bia
,A
rab
iap
oin
t1
an
d2.
Em
irate
s
47
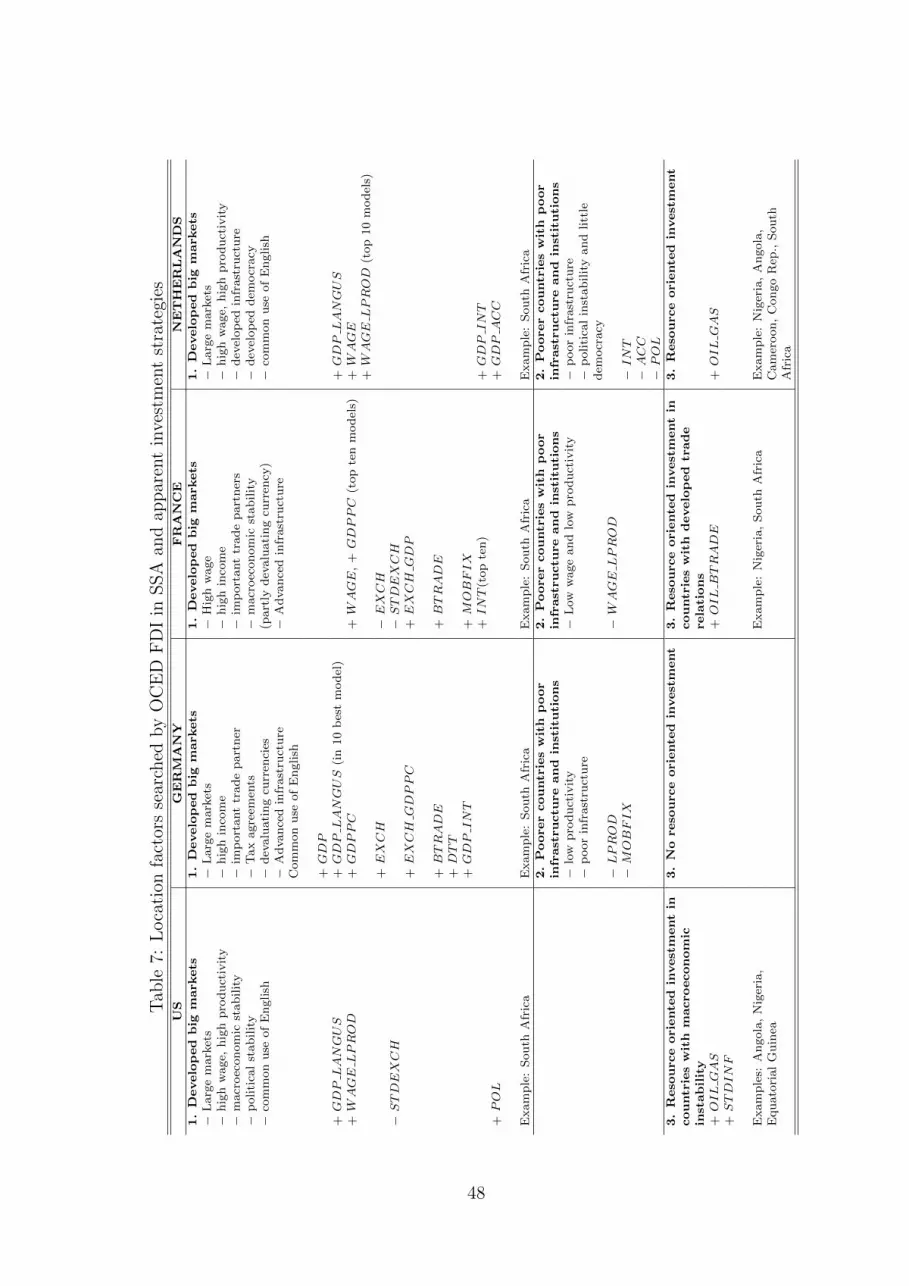
Tab
le7:
Loca
tion
fact
ors
sear
ched
by
OC
ED
FD
Iin
SSA
and
appar
ent
inve
stm
ent
stra
tegi
esUS
GERM
ANY
FRANCE
NETHERLANDS
1.Developed
big
markets
1.Developed
big
markets
1.Developed
big
markets
1.Developed
big
markets
−L
arg
em
ark
ets
−L
arg
em
ark
ets
−H
igh
wage
−L
arg
em
ark
ets
−h
igh
wage,
hig
hp
rod
uct
ivit
y−
hig
hin
com
e−
hig
hin
com
e−
hig
hw
age,
hig
hp
rod
uct
ivit
y−
macr
oec
on
om
icst
ab
ilit
y−
imp
ort
ant
trad
ep
art
ner
−im
port
ant
trad
ep
art
ner
s−
dev
elop
edin
frast
ruct
ure
−p
oli
tica
lst
ab
ilit
y−
Tax
agre
emen
ts−
macr
oec
on
om
icst
ab
ilit
y−
dev
elop
edd
emocr
acy
−co
mm
on
use
of
En
glish
−d
evalu
ati
ng
curr
enci
es(p
art
lyd
evalu
ati
ng
curr
ency
)−
com
mon
use
of
En
glish
−A
dvan
ced
infr
ast
ruct
ure
−A
dvan
ced
infr
ast
ruct
ure
Com
mon
use
of
En
glish
+GDP
+GDP
LANGUS
+GDP
LANGUS
(in
10
bes
tm
od
el)
+GDP
LANGUS
+W
AGE
LPROD
+GDPPC
+W
AGE
,+
GDPPC
(top
ten
mod
els)
+W
AGE
+W
AGE
LPROD
(top
10
mod
els)
+EXCH
−EXCH
−STDEXCH
−STDEXCH
+EXCH
GDPPC
+EXCH
GDP
+BTRADE
+BTRADE
+DTT
+GDP
INT
+M
OBFIX
+INT
(top
ten
)+
GDP
INT
+POL
+GDP
ACC
Exam
ple
:S
ou
thA
fric
aE
xam
ple
:S
ou
thA
fric
aE
xam
ple
:S
ou
thA
fric
aE
xam
ple
:S
ou
thA
fric
a2.Poorercountrieswith
poor
2.Poorercountrieswith
poor
2.Poorercountrieswith
poor
infrastructu
reand
institutions
infrastructu
reand
institutions
infrastructu
reand
institutions
−lo
wp
rod
uct
ivit
y−
Low
wage
an
dlo
wp
rod
uct
ivit
y−
poor
infr
ast
ruct
ure
−p
oor
infr
ast
ruct
ure
−p
oli
tica
lin
stab
ilit
yan
dlitt
led
emocr
acy
−LPROD
−W
AGE
LPROD
−M
OBFIX
−INT
−ACC
−POL
3.Reso
urceoriente
dinvestm
entin
3.No
reso
urceoriente
dinvestm
ent
3.Reso
urceoriente
dinvestm
entin
3.Reso
urceoriente
dinvestm
ent
countrieswith
macroeconom
iccountrieswith
developed
trade
instability
relations
+OIL
GAS
+OIL
BTRADE
+OIL
GAS
+STDINF
Exam
ple
s:A
ngola
,N
iger
ia,
Exam
ple
:N
iger
ia,
Sou
thA
fric
aE
xam
ple
:N
iger
ia,
An
gola
,E
qu
ato
rial
Gu
inea
Cam
eroon
,C
on
go
Rep
.,S
ou
thA
fric
a
48
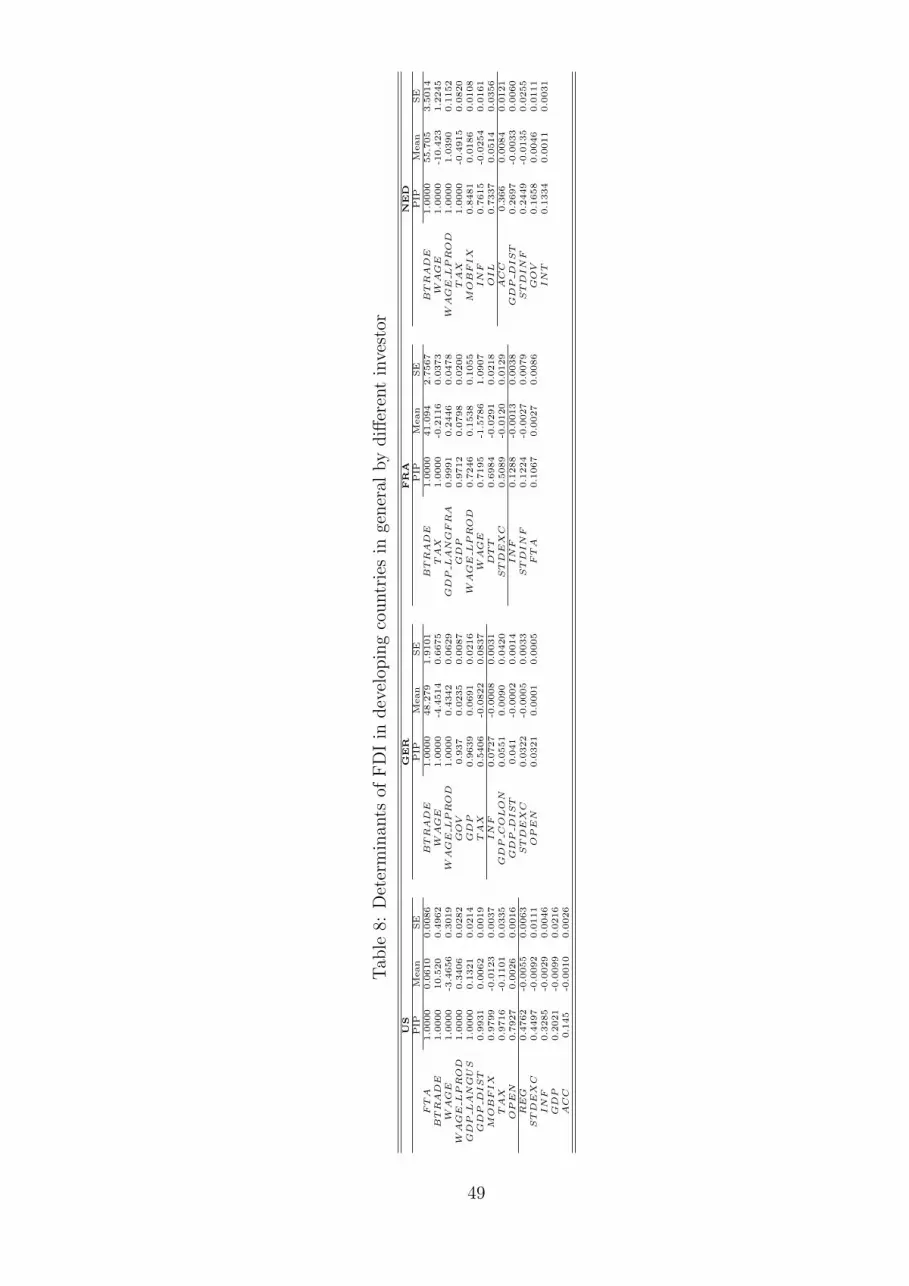
Tab
le8:
Det
erm
inan
tsof
FD
Iin
dev
elop
ing
countr
ies
inge
ner
alby
diff
eren
tin
vest
or
US
GER
FR
AN
ED
PIP
Mean
SE
PIP
Mean
SE
PIP
Mean
SE
PIP
Mean
SE
FTA
1.0
000
0.0
610
0.0
086
BTRAD
E1.0
000
48.2
79
1.9
101
BTRAD
E1.0
000
41.0
94
2.7
567
BTRAD
E1.0
000
55.7
05
3.5
014
BTRAD
E1.0
000
10.5
20
0.4
962
WAGE
1.0
000
-4.4
514
0.6
675
TAX
1.0
000
-0.2
116
0.0
373
WAGE
1.0
000
-10.4
23
1.2
245
WAGE
1.0
000
-3.4
656
0.3
019
WAGE
LPROD
1.0
000
0.4
342
0.0
629
GD
PLAN
GFRA
0.9
991
0.2
446
0.0
478
WAGE
LPROD
1.0
000
1.0
390
0.1
152
WAGE
LPROD
1.0
000
0.3
406
0.0
282
GOV
0.9
37
0.0
235
0.0
087
GD
P0.9
712
0.0
798
0.0
200
TAX
1.0
000
-0.4
915
0.0
820
GD
PLAN
GUS
1.0
000
0.1
321
0.0
214
GD
P0.9
639
0.0
691
0.0
216
WAGE
LPROD
0.7
246
0.1
538
0.1
055
MOBFIX
0.8
481
0.0
186
0.0
108
GD
PD
IST
0.9
931
0.0
062
0.0
019
TAX
0.5
406
-0.0
822
0.0
837
WAGE
0.7
195
-1.5
786
1.0
907
IN
F0.7
615
-0.0
254
0.0
161
MOBFIX
0.9
799
-0.0
123
0.0
037
IN
F0.0
727
-0.0
008
0.0
031
DTT
0.6
984
-0.0
291
0.0
218
OIL
0.7
337
0.0
514
0.0
356
TAX
0.9
716
-0.1
101
0.0
335
GD
PCOLON
0.0
551
0.0
090
0.0
420
STD
EX
C0.5
089
-0.0
120
0.0
129
ACC
0.3
66
0.0
084
0.0
121
OPEN
0.7
927
0.0
026
0.0
016
GD
PD
IST
0.0
41
-0.0
002
0.0
014
IN
F0.1
288
-0.0
013
0.0
038
GD
PD
IST
0.2
697
-0.0
033
0.0
060
REG
0.4
762
-0.0
055
0.0
063
STD
EX
C0.0
322
-0.0
005
0.0
033
STD
IN
F0.1
224
-0.0
027
0.0
079
STD
IN
F0.2
449
-0.0
135
0.0
255
STD
EX
C0.4
497
-0.0
092
0.0
111
OPEN
0.0
321
0.0
001
0.0
005
FTA
0.1
067
0.0
027
0.0
086
GOV
0.1
658
0.0
046
0.0
111
IN
F0.3
285
-0.0
029
0.0
046
IN
T0.1
334
0.0
011
0.0
031
GD
P0.2
021
-0.0
099
0.0
216
ACC
0.1
45
-0.0
010
0.0
026
49

A Appendix
50

Table A.1: Definition of variables
Variable Definition SourceFDI Annual log of bilateral outward FDI stocks per capita at current US$ UNCTAD, OECD and National Bank Statistics
(data scaled upwards by 171 to avoid logs of negative/zero values)GDP Log of GDP at constant 2005 international billions US$, PPP WDIGDPPC Log of GDP per capita at constant 2005 international US$, PPP WDIGROWTH 5-year average of annual growth rate of GDP at constant 2005 US$ Authors’ calculation based on WDI,
relative to 5-year average regional mean WEO and WIIWWAGE Monthly wages of host country (at constant 2005 US$) Author’s calculations based on ILO,
as a share of home country’s monthly wages UNIDO, HDR and WDIMINORES Minerals and ores exports (at current US$, SITC Rev.3, Authors’ calculations based on COMTRADE,
codes 27 and 28) as a share of total exports UNCTAD and WDIOIL Log of Crude oil and NGL production (kt, kbbl/day) per capita Authors’ calculations based on World Oil
(data scaled upwards by 0.001 to avoid logs of zero values) Statistics IEA and Index MundiGAS Log of Natural gas indigenous production (thousand cubic metres) Authors’ calculations based on World Natural
per capita (data scaled upwards by 0.001 to avoid logs of zero values) Gas Statistics IEA and Index MundiOPEN Exports and imports (at current US$) divided by GDP at current Author’s calculations based on WDI
2005 international US$, PPPBTRADE 5-years lag of exports and imports (at current US$) of home country to Author’s calculations based on IMF DOTS,
host country as a share of its total exports and imports of home country COMTRADE and WDIFTA Dummy variable that equals 1 if there is Free Trade Agreement into WTO
force between home and host country, 0 otherwiseBIT Dummy variable that equals 1 if there is Bilateral Investment Treaty into ICSID and UNCTAD
force between home and host country, 0 otherwise (date into force used)DTT Dummy variable that equals 1 if there is Double Taxation Treaty between UNCTAD
home and host country, 0 otherwiseTAX Log of highest marginal tax, corporate tax (%) WDI, KPMG, Michigan University, OECD, Price
Waterhouse, DoingBusiness, Eurostat, Tesche, WIIW,IBFD, Deloitte, Central & East European TaxDirectory, Global Market Briefings, InternationalTax Review, Investment Guide for Southeast Europe,Ernst & Young,
LPROD Labor productivity defined as GDP per person employed at constant Authors’ calculation based on IMF-IFS, WEO, ILO,2005 international US$, PPP WDI and United Nations Statistical Yearbook
EXCH Log of nominal exchange rate index (2005=100) WDI, OECD IDIS and CIA World Factbook,(national currency per currency of the sender country, period average) various years
STDEXC Standard deviation of past 5 years of nominal exchange rate index Author’s calculations based on WDI, OECD IDISdivided by mean of past 5 years of nominal exchange rate index and CIA World Factbook, various years
INF Log of annual growth OF CPI (2005=100) Authors’ calculation based on WDI, WEO, UN(data scaled upwards by 0.172 to avoid logs of negative/zero values) and CIA
STDINF Standard deviation of past 5 years of CPI (2005=100) divided Authors’ calculation based on WDI, WEO, UNby mean of past 5 years of CPI and CIA data
DEBT 1-diff of external debt stocks (at current US$) as a share of total Authors’ calculations based on WDI, WRI, EIU,exports (at current US$) UNECE, UNECA and CIA data
DIST Distance (in 1000 km) between sender country and destination country Author’s calculations based on CEPIILANG Dummy variable that equals 1 if home and host country share a CEPII
common language (that is spoken by at least 20% of the population),and 0 otherwise
COLON Dummy variable that equals 1 if home country was former colonizer CEPIIin the host country
ACC Voice & Accountability WGIPOL Political Stability & Absence of Violence/Terrorism WGIGOV Government Effectiveness WGIREG Regulatory Quality WGILAW Rule of Law WGICORR Control of Corruption WGIINT Log of internet users (per 1000 people) WDI
(data scaled upwards by 0.001 to avoid logs of zero values)MOBFIX Log of mobile and fixed-line telephone subscribers (per 1000 people) WDI
(data scaled upwards by 0.001 to avoid logs of zero values)GDP DIST Interaction of GDP and DISTGDP LANG Interaction of GDP and LANGGDP COLON Interaction of GDP and COLONGDP BTRADE Interaction of GDP and BTRADEGDP DIST Interaction of GDP and DISTGDP INF Interaction of GDP and INFGDP ACC Interaction of GDP and ACCGDP INT Interaction of GDP and INTGDPPC ACC Interaction of GDPPC and ACCGROWTH GOV Interaction of GROWTH and GOVBTRADE OIL Interaction of BTRADE and OILDTT ACC Interaction of DTT and ACCEXCH GDPPC Interaction of EXCH and GDPPCINF CORR Interaction of INF and CORRMOBFIX ACC Interaction of MOBFIX and ACCMOBFIX WAGE Interaction of MOBFIX and WAGEOIL GAS Interaction of OIL and GASWAGE LPROD Interaction of WAGE and LPRODWAGE LAW Interaction of WAGE and LAW
51
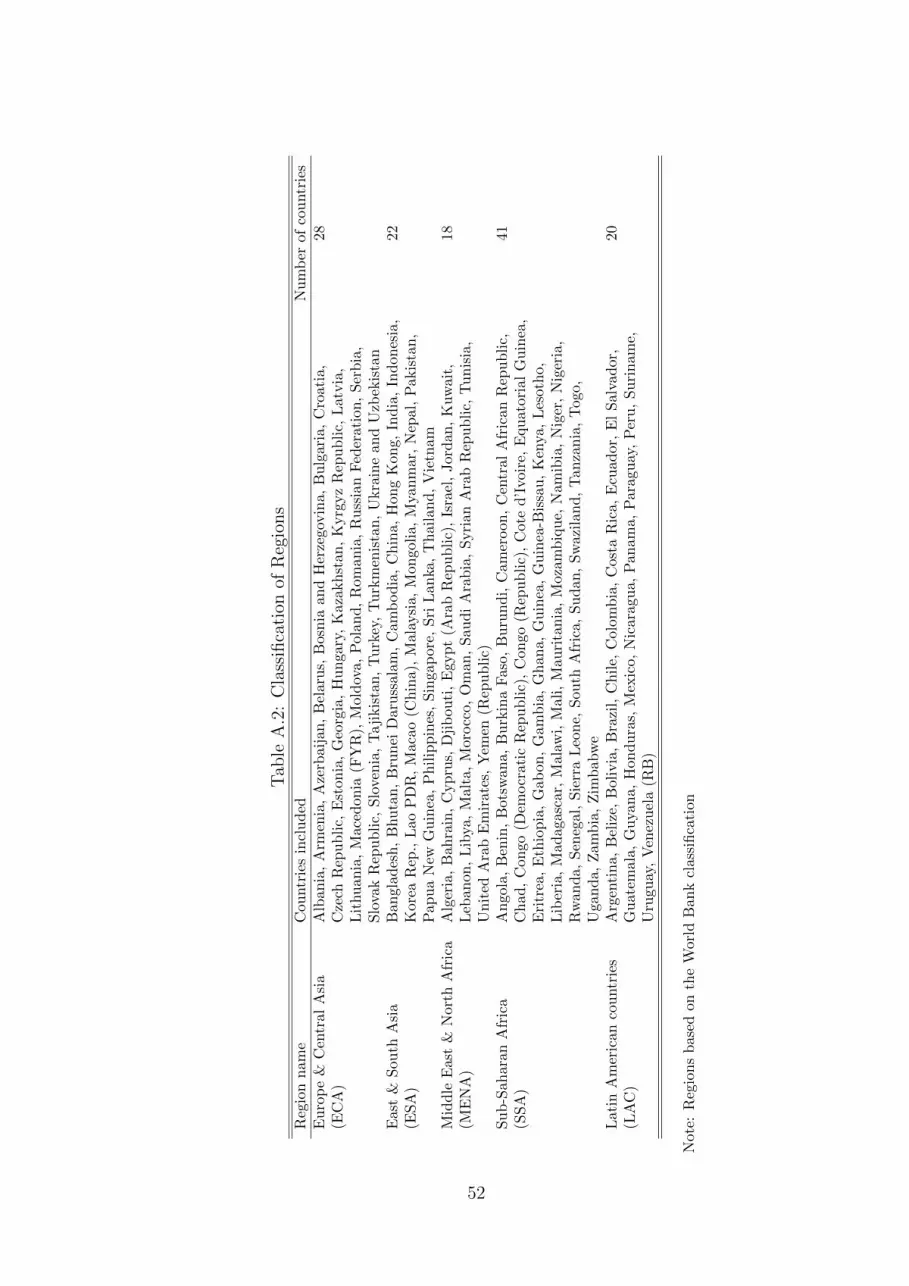
Tab
leA
.2:
Cla
ssifi
cati
onof
Reg
ions
Reg
ion
nam
eC
ountr
ies
incl
ud
edN
um
ber
of
cou
ntr
ies
Eu
rop
e&
Cen
tral
Asi
aA
lban
ia,
Arm
enia
,A
zerb
aij
an
,B
elaru
s,B
osn
iaan
dH
erze
gov
ina,
Bu
lgari
a,
Cro
ati
a,
28
(EC
A)
Cze
chR
epub
lic,
Est
on
ia,
Geo
rgia
,H
un
gary
,K
aza
kh
stan
,K
yrg
yz
Rep
ub
lic,
Latv
ia,
Lit
hu
ania
,M
aced
onia
(FY
R),
Mold
ova,
Pola
nd
,R
om
an
ia,
Ru
ssia
nF
eder
ati
on
,S
erb
ia,
Slo
vak
Rep
ub
lic,
Slo
ven
ia,
Taji
kis
tan
,T
urk
ey,
Tu
rkm
enis
tan
,U
kra
ine
an
dU
zbek
ista
nE
ast
&S
outh
Asi
aB
angl
ades
h,
Bhu
tan
,B
run
eiD
aru
ssala
m,
Cam
bod
ia,
Ch
ina,
Hon
gK
on
g,
Ind
ia,
Ind
on
esia
,22
(ES
A)
Kor
eaR
ep.,
Lao
PD
R,
Maca
o(C
hin
a),
Mala
ysi
a,
Mon
goli
a,
Mya
nm
ar,
Nep
al,
Pakis
tan
,P
apu
aN
ewG
uin
ea,
Ph
ilip
pin
es,
Sin
gap
ore
,S
riL
anka
,T
hail
an
d,
Vie
tnam
Mid
dle
Eas
t&
Nor
thA
fric
aA
lger
ia,
Bah
rain
,C
yp
rus,
Dji
bou
ti,
Egyp
t(A
rab
Rep
ub
lic)
,Is
rael
,Jord
an
,K
uw
ait
,18
(ME
NA
)L
eban
on,
Lib
ya,
Mal
ta,
Moro
cco,
Om
an
,S
au
di
Ara
bia
,S
yri
an
Ara
bR
epu
bli
c,T
un
isia
,U
nit
edA
rab
Em
irat
es,
Yem
en(R
epu
bli
c)S
ub
-Sah
aran
Afr
ica
An
gola
,B
enin
,B
otsw
an
a,
Bu
rkin
aF
aso
,B
uru
nd
i,C
am
eroon
,C
entr
al
Afr
ican
Rep
ub
lic,
41
(SS
A)
Ch
ad,
Con
go(D
emocr
ati
cR
epu
bli
c),
Congo
(Rep
ub
lic)
,C
ote
d’I
voir
e,E
qu
ato
rial
Gu
inea
,E
ritr
ea,
Eth
iop
ia,
Gab
on
,G
am
bia
,G
han
a,
Gu
inea
,G
uin
ea-B
issa
u,
Ken
ya,
Les
oth
o,
Lib
eria
,M
adag
asca
r,M
ala
wi,
Mali
,M
au
rita
nia
,M
oza
mb
iqu
e,N
am
ibia
,N
iger
,N
iger
ia,
Rw
and
a,S
eneg
al,
Sie
rra
Leo
ne,
Sou
thA
fric
a,
Su
dan
,S
wazi
lan
d,
Tan
zan
ia,
Togo,
Uga
nd
a,Z
amb
ia,
Zim
babw
eL
atin
Am
eric
anco
untr
ies
Arg
enti
na,
Bel
ize,
Boli
via
,B
razi
l,C
hil
e,C
olo
mb
ia,
Cost
aR
ica,
Ecu
ad
or,
El
Salv
ad
or,
20
(LA
C)
Gu
atem
ala
,G
uya
na,
Hon
du
ras,
Mex
ico,
Nic
ara
gu
a,
Pan
am
a,
Para
gu
ay,
Per
u,
Su
rin
am
e,U
rugu
ay,
Ven
ezu
ela
(RB
)
Not
e:R
egio
ns
bas
edon
the
Wor
ldB
ank
clas
sifi
cati
on
52


