Embed Size (px)
Citation preview

Final report
Do apprentices alleviate firms’ labour constraints?
Evidence from a unique experiment in Ghana
Morgan Hardy Isaac Mbiti Jamie McCasland
March 2016
When citing this paper, please use the title and the followingreference number:F-33202-GHA-1
Final ReportIGC Ghana Project 1-VCC-VGHA-VXXXX-33202
Do Apprentices Alleviate Firms’ Labor Constraints?
Evidence from a Unique Experiment in Ghana
Morgan HardyIsaac Mbiti
Jamie McCasland
March 3, 2016
PRELIMINARY ANALYSIS, PLEASE DO NOT CITE OR CIRCULATE. Morgan Hardy is an Assistant Pro-fessor at New York University-Abu Dhabi. Email: [email protected]. Isaac Mbiti is an Assistant Professor at theFrank Batten School of Leadership and Public Policy at the University of Virginia. Email: [email protected] McCasland is an Assistant Professor at the Vancouver School of Economics at the University of BritishColumbia. Email: [email protected]. This project received funding from 3ie, USAID, J-PAL, and thePrivate Enterprise Development in Low-Income Countries (PEDL) initiative. We thank Naana Amonoo-Neizer, LoisAryee, Maham Farhad, Robert Obenya, Charles Sefenu, and Yani Tyskerud for excellent research assistance in thefield, and Innovations for Poverty Action-Ghana for hosting the study.
1
1 Introduction
Two of the most ubiquitous features of economic activity in poor countries are an abundance of
very small firms and high rates of youth unemployment. In Ghana, apprenticeships make up a
large share of first job experiences and a large majority of employment in small firms. For example,
in a representative household survey of urban Ghana, Monk, Sandefur and Teal (2008) find that
26.7% of working age adults worked as an apprentice at some point early in their careers. The
National Industrial Census reports that in 2000, 34% of wage employees in formal manufacturing
were apprentices (Sandefur (2010)). Meanwhile, in our baseline survey of primarily informal firms,
the average firm had 2.5 apprentices, compared with 0.6 paid workers.
Despite the importance of apprenticeships in West Africa, relatively little is known about their
impacts on the firms that employ them. In fact, empirical research on small firm growth has focused
primarily on credit constraints and managerial skill deficits (De Mel, McKenzie and Woodruff, 2008;
Bloom and Reenan, 2007; Anagol and Udry, 2006; Bloom et al., 2013; Karlan, Knight and Udry,
2012; Kremer et al., 2013), while conventional wisdom argues that small firms face a frictionless
market for hiring workers (including apprentices) (Rauch, 1991; Zenou, 2008). In this study, we
seek to understand the effects of access to apprentices on firm size and firm profits, by exploiting
exogenous variation generated by an apprentice placement program conducted in collaboration with
the Government of Ghana.
2 Study Design
2.1 Umbrella RCT
The experiment on which we report in this paper was enclosed in a larger randomized controlled
trial which randomized over unemployed young people applying to become apprentices targeted
by the government apprentice placement program. Applicants to the apprenticeship program were
recruited by local government officials in 32 districts, in all 10 regions of the country. Approximately
60% of these applicants were then randomly offered access to the program. While recruitment and
applicant baseline surveys began in August of 2012, a long lag in program roll-out meant that
firm recruitment and apprentice placement did not begin until nearly a year later. Of the 2,360
2
treatment apprentices across 32 districts, about 50% (1,178 people or 30% of the original applicant
sample of 3,948) participated in the 2013 matching meetings and entered the apprentice sample
used in this paper. Long-term follow-up surveys with the apprentice sample will take place in 2017,
about 5 years after recruitment and 4 years after initial program placement.
2.2 Sample Recruitment
Firms in the sample were recruited by local government officials and craft-specific trade associ-
ations to hire and train the unemployed young people who were the targeted recipients of the
program. Recruitment of firms took place independently of apprentice recruitment and after the
apprentice recipients were chosen, though it was targeted in the sense that local government officials
and trade association leadership sought firms that broadly matched the location and trade pref-
erence of program apprentices. The program targeted three main trade groups: garment-making,
hair/beauty/cosmetology, and construction. In our sample, garment-making includes both men
and women, hair and beauty is nearly all women, and construction is nearly all men, both among
firm owners and apprentices. In general, firms were approached directly and asked if they would
be interested in hiring apprentices through the government program. Interested firms were then
invited to attend one of 149 district and trade group level meetings. It was at these meetings
that the research team first enrolled firms in the study, and at these meetings that firm owners
participated in the baseline survey. 1,833 firm owners attended a matching meeting, and 1,087 of
these received interest from at least one apprentice. It is these 1,087 that compose our base sample
in this paper.
2.3 Placement Meetings
Starting in May 2013, firm recruitment and district and trade group meetings began. At these
meetings firm owners were briefed on the program in more detail. In particular, conditional on
geographic feasibility and apprentice willingness, apprentices would be randomly allocated. This
protocol was acceptable in part because the assignment of apprentices to firms was seen by firm
owners as a government benefit, so random placement allowed for arguably fair distribution of that
benefit. In addition, firm owners would not have the opportunity to reject program apprentices
(because the design sought to ensure a placement for every apprentice). Information on capacity
3
constraints was also collected, though due to a relatively disperse sample across districts and trades,
capacity constraints were never binding (i.e. no firm owner was randomly assigned more apprentices
than he or she was willing to accept). Firm owners still interested in hiring apprentices through the
program then introduced themselves to the gathered group of apprentices, and stated the precise
location of their businesses.
Apprentices, for their part, were then given the opportunity to provide a list of firms with which
they would be willing and able to work and train. The instruction was to provide information on
firms within their craft of interest that were close enough to their homes that they could reach
them without incurring large transport costs. However, detailed GPS or other information on firm
location and apprentice home location was not available at the time so district officials and research
field teams had no ability to enforce that instruction. Consequently, the apprentice-specific firm
sets include both geographic feasibility (walkability, generally) and idiosyncratic preference. No
minimum or maximum was placed on the number of firms listed and apprentices who listed only
one firm were assigned that firm. However, the majority of apprentices listed at least two firms, with
a mean of 2.2 firms. Anecdotally, we believe the firm sets to be an honest revelation of preferences,
where apprentices who listed multiple firms were willing to work at all of the listed firms.
Apprentice placement began shortly after all matching meetings were completed, in October of
2013, and some apprentices did not report to their assignments until early 2014.
2.4 Program Intervention
The National Apprenticeship Program was originally envisioned to mirror the traditional appren-
ticeship system in that firm owners would be paid at the start of the apprenticeship (about 150GHc)
and toolkits would be provided to program apprentices. It was intended to depart from traditional
apprenticeships in that the program period would be one year and the curriculum would be more
neatly tailored to the skills qualification system being redesigned by the Government of Ghana.
In the end, however, the program rather departed from the traditional apprenticeship system in
that firm owners were not paid by the government and apprentices did not receive toolkits, but fits
fairly neatly the traditional apprenticeship system in that most apprentices who reported to their
posts appear to still be in training at two years after training began (the timing of the fourth follow
up survey). We cannot experimentally test the effect of these departures both from the traditional
4
apprenticeship system and from the original vision of the program, but anecdotally these changes
do not appear to have had a significant effect on firm owner willingness to train and employ NAP
apprentices or on the basic structure of apprenticeship training and employment in these firms.
2.5 Data
Data for this study come from four sources: (1) firm baseline surveys, (2) apprentice baseline
surveys, (3) apprentice-specific firm sets, and (4) four firm level follow-up surveys. IGC funding
co-funded the third and fourth of these firm level follow up surveys. Survey attrition across rounds
is relatively minimal, with 99% of core sample firms participating in the baseline survey, and
participation rates in rounds one through four of 94%, 92%, 92% and 85% respectively. Further
analysis of attrition patterns is left for a future version of this working paper. Follow-up surveys took
place in January 2014, April 2014, February 2015, and November 2015, spanning approximately 3
months to two years after program placement.
Follow-up survey data collection includes revenues, profits, detail on program apprentices, other
labor inputs, measures of capital stock, and information on subsequent hiring. All survey questions
and strategies were extensively piloted1. Following De Mel, McKenzie and Woodruff (2009), the
revenues and profits questions in each firm survey were as follows:
“What were the TOTAL SALES from your business LAST MONTH?”
“What was the total INCOME the business earned LAST MONTH after paying all expenses in-
cluding wages of employees, but not including any INCOME you paid yourself. That is, what were
the PROFITS of your business LAST MONTH?”
Apprentice cognitive tests, a proxy of ability, include the Ravens matrices group B, a commonly
used measure of abstract cognitive ability. It is a series of 12 patterns, each with a missing piece.
The respondent chooses from six options which piece fits the pattern for each of the 12 patterns.
The Digit Span Recall test is essentially a memory test, in which surveyors read out a number
or series of numbers and respondents repeat the numbers. The number of digits increases over
1Because Ghana has eleven government-sponsored languages and the sample spans 32 districts and all 10 regions,the surveys were printed in English and translated on the spot. Surveyors had with them simple dictionaries developedspecifically to assist in the correct translation of important questions/words.
5

time so that later questions are more difficult than earlier ones. The oral English vocabulary test
includes fifteen English words and possible synonyms for those words, and asks respondents to
choose the synonym. We created the math test ourselves via survey piloting, and it consists of four
word problems that require critical thinking and the use of simple arithmetic. The cognitive ability
index is the sum of the normalized scores on the four individual tests2.
2.6 Randomization and Estimation
Randomization was done on the individual apprentice level. Given the firm set of each apprentice,
a random firm was chosen using a computer generated random number. No re-randomization or
stratification beyond individual apprentice was done, and each randomization was independent. If
the apprentice only listed a single firm as both geographically feasible and desirable generally, he
or she was assigned to that firm.
Consequently, our identifying exogenous variation is conditional on non-random apprentice
interest in each firm, and generates a multi-valued treatment assignment Ti that takes values
between zero and eight apprentices assigned to the firm. We control for dummy variables for
being listed by each apprentice in the sample, which function similar to strata fixed effects as
a control for the probability distribution of the treatment value. The potential outcomes are
independent of the treatment assignment conditional on these apprentice preference dummies. In
earlier versions of this analysis, we focused on a lottery fixed effect specification which pooled the
probability distribution of treatment assignments across apprentices rather than controlling for
individual apprentice preferences (Hardy and McCasland, 2015) .
Our primary outcome families of interest are (1) labor inputs and firms size and (2) revenues
and profits. Following McKenzie (2012), our main specification stacks data from the four follow-up
rounds, controls for the baseline value of the outcome variable, and includes round fixed effects (ηr)
and apprentices dummies (ϕa), as follows:
Yit = α+ βTi + γYi0 + ηr + ϕa + εit (1)
The coefficient β estimates the Intent-to-Treat effect and is identified from within-round, within
2The apprentice baseline survey attempted a fifth cognitive test in reading. Unfortunately, a majority of respon-dents opted out of the reading test, making it a poor measure for ability across apprentices.
6

apprentice-specific randomization variation. β can be interpreted as the average effect of each
assigned apprentice across follow-up rounds, where the effect of each apprentice enters the function
linearly. Standard errors are clustered at the firm level across rounds.
To measure treatment effects across rounds, we estimate:
Yit = α+ β1Ti ∗ η1 + β2Ti ∗ η2 + β3Ti ∗ η3 + β4Ti ∗ η4 + γYi0 + ηr + ϕa + εit (2)
In additional specifications we define treatment separately as Ti,abovemedian and Ti,belowmedian to
measure separate experimental effects associated with access to higher or lower ability apprentices
as measured by our apprentice cognitive tests.
3 Results
3.1 Labor Market for Apprentices
We began our study with a series of informal interviews with small firms owners in Accra and
in rural areas around the country. These discussions highlighted several key features of the labor
market for apprentices. First, small firms owners want to hire more high quality apprentices and
consider them profitable inputs in the business. Secondly, difficulty finding high quality apprentices
and the risk associated with hiring low quality apprentices are widely cited as reasons to avoid
hiring at all. Third, the entry fee that is traditionally required to begin an apprenticeship is nearly
universally motivated by a desire to force apprentices to signal investment in the apprenticeship,
and willingness and ability to learn.
Firm-level baseline surveys included a series of questions meant to quantify, in part, the qual-
itative observations we gleaned from these interviews and survey piloting. The evidence largely
validates our early anecdotal conclusions. Table 1 reproduces some of these questions, and the
most common responses.
3.2 Summary Statistics
In our nationwide sample of 1,087 small firms, apprentices comprise the vast majority of the work-
force. In the 962 firms who have any workers besides the owner at baseline, 80% of the 3,695 workers
7
are apprentices. 46% of the workforce was previously unknown to the firm owner, underlying that
modern apprenticeship is largely an anonymous market activity. The mean monthly wage for an
apprentice during his/her first year of work in our baseline sample is about 21 Ghana Cedis, which
at the time of baseline surveys was about 10 US dollars.
Column 1 of Table 2 displays the summary statistics for a range of other variables at baseline.
We see that garment-makers are the most common trade, that we have more female firm owners
than male firm owners in the sample, and that only about 7% of the sample is registered with the
Registrar General (to pay taxes).
Raw tests of covariate balance reveal that the larger firms received more interest from appren-
tices and were thus assigned more workers. However, tests of covariate balance that control for
our apprentice preference/strata fixed effects show balance along observables conditional on these
randomization controls.
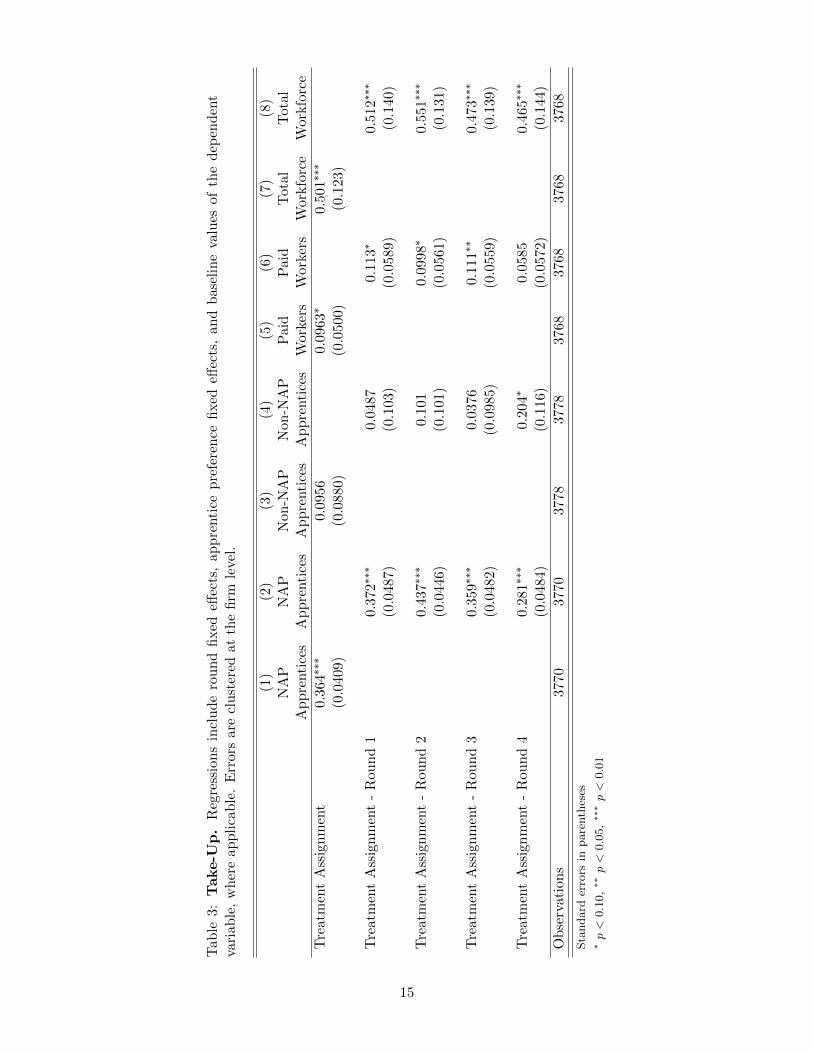
3.3 Take Up
Take-up requires both that the firm owner accept to train and employ apprentices and that ap-
prentices report to their employment assignments. To our knowledge, only one firm in the study
refused to train and employ the apprentice(s) assigned to their firm. However, apprentice take-up
was about 60% of those assigned a firm placement by the placement randomization. In addition,
we had a number of treatment NAP apprentices who entered a sample firm (or another firm) after
the placement randomization (having missed the placement meeting, but still wanting a place in
the program), and a number of treatment apprentices who received a placement but ultimately
reported to another firm either within our sample or elsewhere (i.e. did not comply with their
firm placement treatment assignment). Nonetheless, as Table 3 shows, for each NAP apprentice
assigned to a firm in our core sample, about 0.36 NAP apprentices are observed working over the
course of the four rounds of follow-up data collection.
In columns (3) through (8) of Table 3, we see relatively little evidence of crowd-out, either of
non-NAP apprentices or paid workers in sample firms. If anything, there appears to be evidence
of crowd-in, whereby treatment apprentices led to additional employment of paid workers. We will
continue to investigate this finding as we complete the analysis of our most recent IGC-funded
rounds of data collection.
8

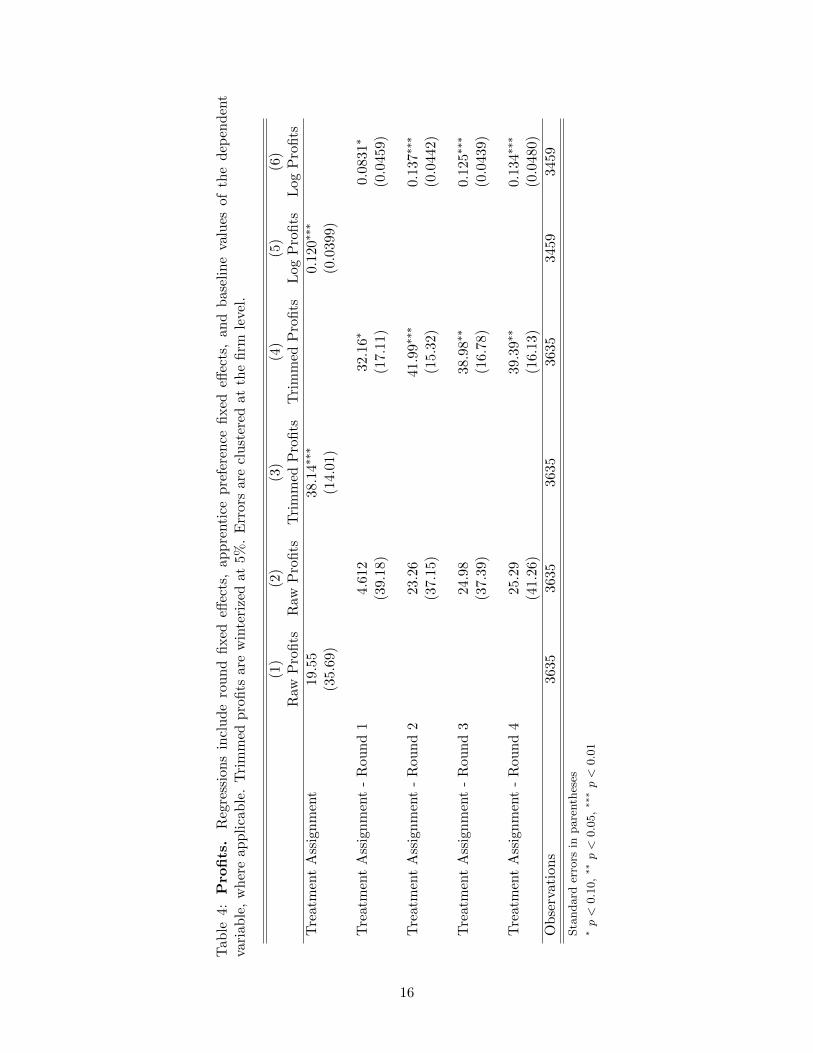
3.4 Revenues and Profits
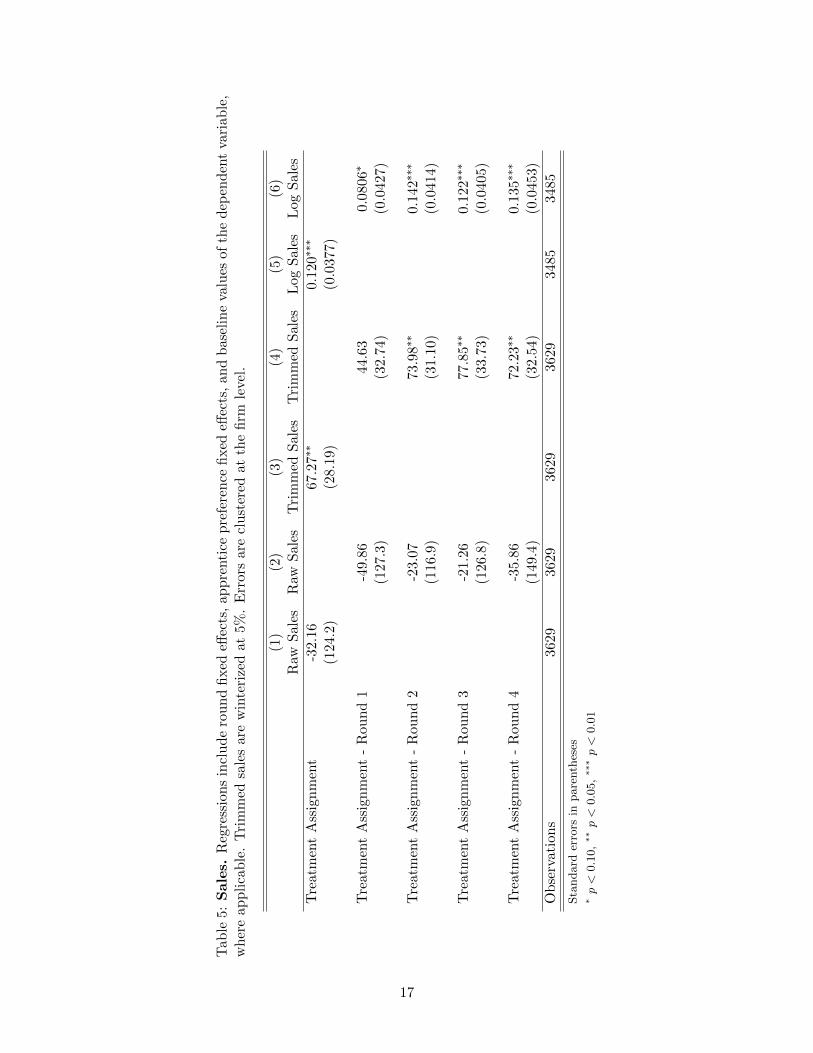
Tables 4 and 5 present Intention to Treat (ITT) results on revenues and sales in both levels and
logs. Raw levels are quite noisy, and insignificant in most specifications. Winterized levels at 5% by
round are positive and significant for both profits and sales, as are log specifications which likewise
address outliers. While log specifications help with power, levels specifications are probably most
appropriate given the level treatment.
In general we find sizable effects on firm output associated with access to apprentices through the
program. Our recent working paper puts forward a theory about the screening mechanism imbedded
in the apprentice recruitment and the long-lag in program roll-out. In this report however, we will
suffice to say that it appears the program has a large effect and interpretations of the effect will be
left for future work.
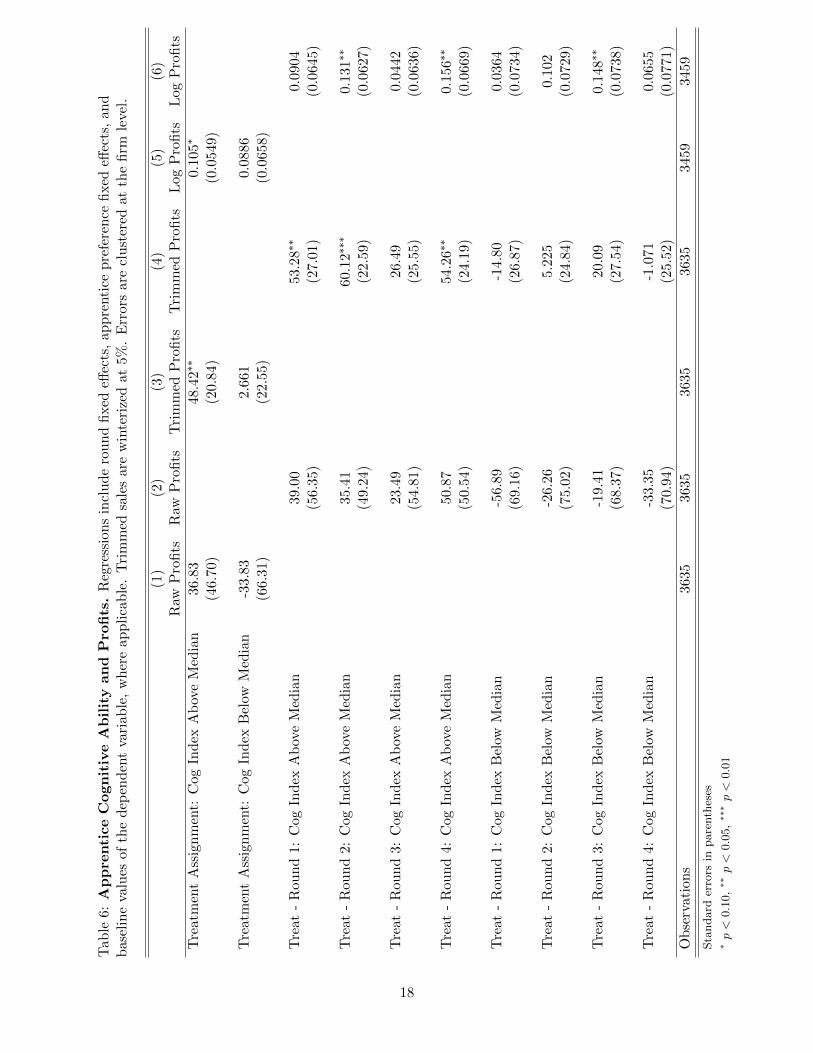
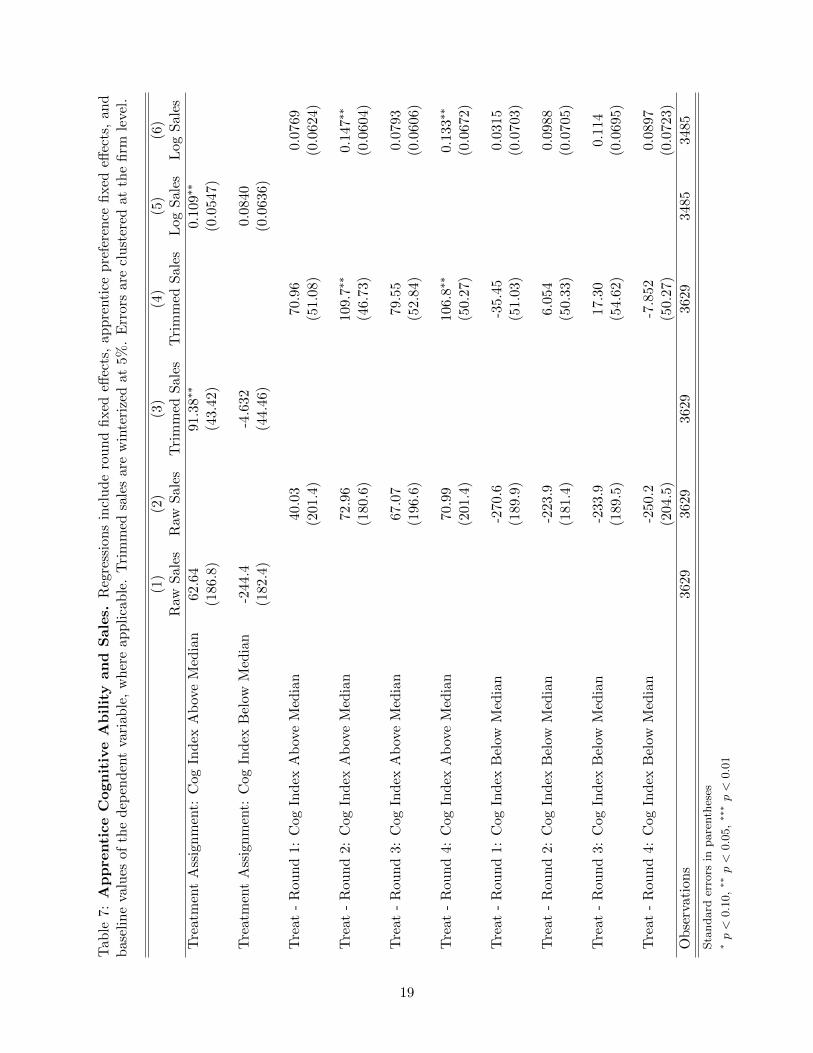
3.5 Apprentice Cognitive Ability
In Tables 6 and 7 we split the apprentices in to those who perform above the median and below
the median on our cognitive ability index, which is composed of the sum of the normalized scores
on four individual tests (ravens, math, vocabulary, and digits forward). In previous work, we
uncovered a pattern that suggests that treatment effects on revenues and profits are larger when
considering access to above median cognitive ability apprentices. Across the four pooled rounds
using new data, the pattern continues to be weakly visible in our data, though like in our earlier
work, power makes it difficult to identify point estimates on above and below median cognitive
ability apprentices that are statistically significantly different from each other.
4 Conclusion
Previous models of small firms in developing countries have largely assumed they face a frictionless
market for workers. The justification for modeling firms in this way comes primarily from the idea
that larger firms are subject to more stringent regulations and wage premia and therefore face
much higher hiring costs. This line of thinking, however, misses the fact that large firms have the
ability and capacity to put significant resources into recruitment and screening of potential workers.
Consequently, they have access to both a larger pool and a more complex mechanism by which
9

to screen workers. Small firms, on the other hand, while they may have more private information
about local young people, have very limited ability and resources to devote to complicated screening
on ability, motivation, and other potentially productivity-enhancing worker characteristics.
This paper argues that small firms in Ghana face high labor market search costs, and in partic-
ular that screening over ability is both difficult and costly. Using the results from a field experiment
which randomly gave firms access to worker recruitment services, we show that small firms offered
workers through the program chose to hire them, leading to large differences in firm size between
control and treatment firms. In addition, we show that access to apprentices through the program
had large ITT effects on revenues and profits. Analysis of the IGC-funded rounds 3 and 4 of the
firm-level follow-up data is still underway. Round 4 in particular has ample data on subsequent
hiring, which may be able to shed light on some of the questions left unanswered by this preliminary
analysis.
10
References
Anagol, Santosh, and Christopher Udry. 2006. “The Return to Capital in Ghana.” American
Economic Review: Papers and Proceedings, February.
Bloom, Nicholas, and John Van Reenan. 2007. “Measuring and Explaining Differences in
Management Practices Across Countries.” Quarterly Journal of Economics, 122(4): 1351–1408.
Bloom, Nicholas, Benn Eifert, Aprajit Mahajan, David McKenzie, and John Roberts.
2013. “Does Management Matter? Evidence from India.” Quarterly Journal of Economics, 128
(1).
De Mel, Suresh, David McKenzie, and Christopher Woodruff. 2008. “Returns to Capi-
tal in Microenterprises: Evidence from a Field Experiment.” Quarterly Journal of Economics,
123(4): 1329–1372.
De Mel, Suresh, David McKenzie, and Christopher Woodruff. 2009. “Measuring Microen-
terprise Profits: Must we ask how the sausage is made?” Journal of Development Economics,
88, pages 19-31.
Hardy, Morgan, and Jamie McCasland. 2015. “Are Small Firms Labor Constrained? Exper-
imental Evidence From Ghana.” Working paper.
Karlan, Dean, Ryan Knight, and Christopher Udry. 2012. “Hoping to Win, Expected to
Lose: Theory and Lessons on Microenterprise Development.” NBER Working paper, 18325.
Kremer, Michael, Jean Lee, Jonathan Robinson, and Olga Rostapshova. 2013. “Be-
havioral Biases and Firm Behavior: Evidence from Kenyan Retail Shops.” American Economic
Review: Papers and Proceedings, 103 (3).
McKenzie, David. 2012. “Beyond Baseline and Follow-up: The Case for more T in Experiments.”
Journal of Development Economics, 99, pages 210-221.
Monk, Courtney, Justin Sandefur, and Francis Teal. 2008. “Does Doing an Apprenticeship
Pay Off? Evidence from Ghana.” CSAE Working Paper Series 2008-08, Centre for the Study of
African Economies, University of Oxford.
11
Rauch, James. 1991. “Modeling the Informal Sector Formally.” Journal of Development Eco-
nomics, vol. 35(1), pages 33-47.
Sandefur, Justin. 2010. “On the Evolution of the Firm Size Distribution in an African Economy.”
CSAE Working Paper Series 2010-05, Centre for the Study of African Economies, University of
Oxford.
Zenou, Yves. 2008. “Job Search and Mobility in Developing Countries: Theory and Policy Im-
plications.” Journal of Development Economics, vol. 86, pages 336-355.
12
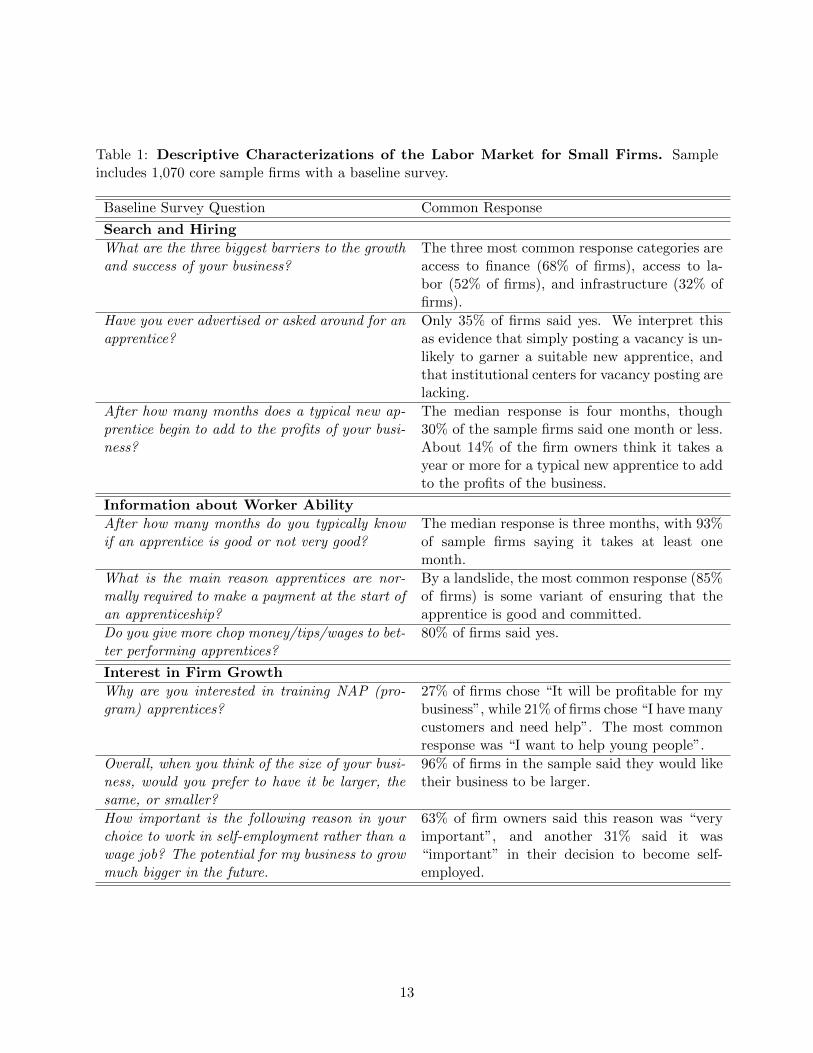
Table 1: Descriptive Characterizations of the Labor Market for Small Firms. Sampleincludes 1,070 core sample firms with a baseline survey.
Baseline Survey Question Common Response
Search and Hiring
What are the three biggest barriers to the growthand success of your business?
The three most common response categories areaccess to finance (68% of firms), access to la-bor (52% of firms), and infrastructure (32% offirms).
Have you ever advertised or asked around for anapprentice?
Only 35% of firms said yes. We interpret thisas evidence that simply posting a vacancy is un-likely to garner a suitable new apprentice, andthat institutional centers for vacancy posting arelacking.
After how many months does a typical new ap-prentice begin to add to the profits of your busi-ness?
The median response is four months, though30% of the sample firms said one month or less.About 14% of the firm owners think it takes ayear or more for a typical new apprentice to addto the profits of the business.
Information about Worker Ability
After how many months do you typically knowif an apprentice is good or not very good?
The median response is three months, with 93%of sample firms saying it takes at least onemonth.
What is the main reason apprentices are nor-mally required to make a payment at the start ofan apprenticeship?
By a landslide, the most common response (85%of firms) is some variant of ensuring that theapprentice is good and committed.
Do you give more chop money/tips/wages to bet-ter performing apprentices?
80% of firms said yes.
Interest in Firm Growth
Why are you interested in training NAP (pro-gram) apprentices?
27% of firms chose “It will be profitable for mybusiness”, while 21% of firms chose “I have manycustomers and need help”. The most commonresponse was “I want to help young people”.
Overall, when you think of the size of your busi-ness, would you prefer to have it be larger, thesame, or smaller?
96% of firms in the sample said they would liketheir business to be larger.
How important is the following reason in yourchoice to work in self-employment rather than awage job? The potential for my business to growmuch bigger in the future.
63% of firm owners said this reason was “veryimportant”, and another 31% said it was“important” in their decision to become self-employed.
13
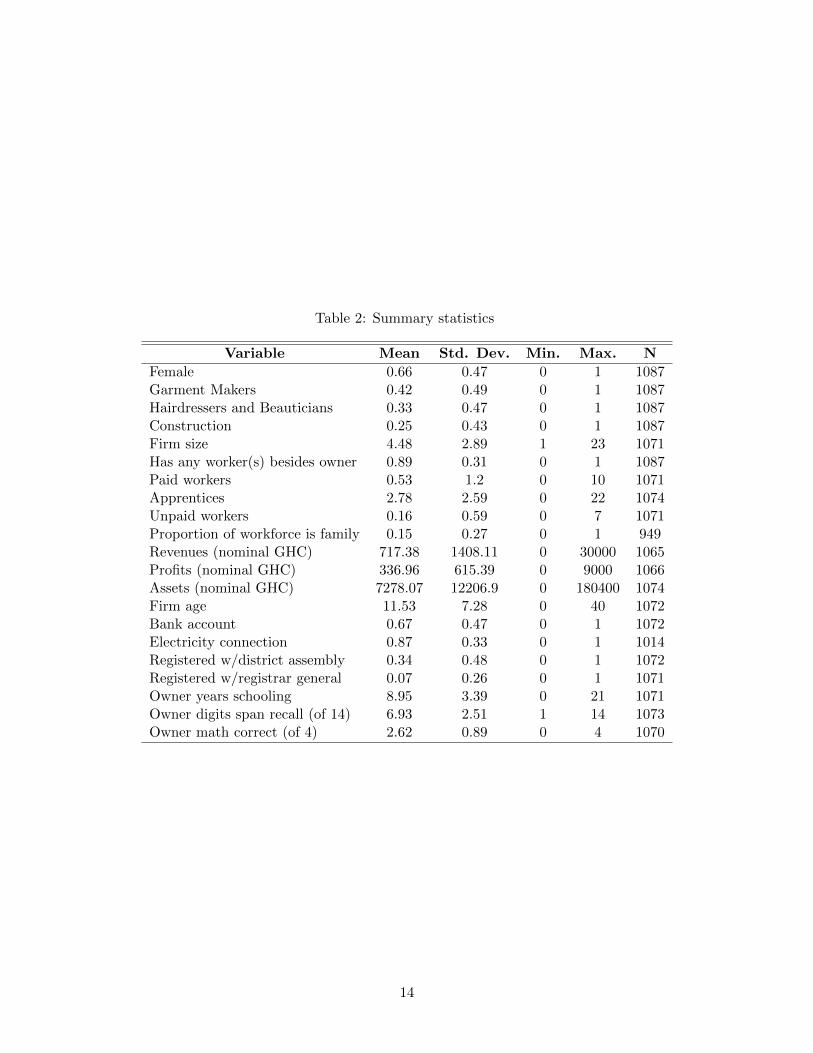
Table 2: Summary statistics
Variable Mean Std. Dev. Min. Max. N
Female 0.66 0.47 0 1 1087Garment Makers 0.42 0.49 0 1 1087Hairdressers and Beauticians 0.33 0.47 0 1 1087Construction 0.25 0.43 0 1 1087Firm size 4.48 2.89 1 23 1071Has any worker(s) besides owner 0.89 0.31 0 1 1087Paid workers 0.53 1.2 0 10 1071Apprentices 2.78 2.59 0 22 1074Unpaid workers 0.16 0.59 0 7 1071Proportion of workforce is family 0.15 0.27 0 1 949Revenues (nominal GHC) 717.38 1408.11 0 30000 1065Profits (nominal GHC) 336.96 615.39 0 9000 1066Assets (nominal GHC) 7278.07 12206.9 0 180400 1074Firm age 11.53 7.28 0 40 1072Bank account 0.67 0.47 0 1 1072Electricity connection 0.87 0.33 0 1 1014Registered w/district assembly 0.34 0.48 0 1 1072Registered w/registrar general 0.07 0.26 0 1 1071Owner years schooling 8.95 3.39 0 21 1071Owner digits span recall (of 14) 6.93 2.51 1 14 1073Owner math correct (of 4) 2.62 0.89 0 4 1070
14
Tab
le3:
Take-U
p.
Reg
ress
ion
sin
clu
de
rou
nd
fixed
effec
ts,
app
renti
cep
refe
ren
cefi
xed
effec
ts,
and
base
lin
eva
lues
of
the
dep
end
ent
vari
able
,w
her
eap
pli
cab
le.
Err
ors
are
clu
ster
edat
the
firm
leve
l.
(1)
(2)
(3)
(4)
(5)
(6)
(7)
(8)
NA
PN
AP
Non
-NA
PN
on-N
AP
Pai
dP
aid
Tota
lT
ota
lA
pp
renti
ces
Ap
pre
nti
ces
Ap
pre
nti
ces
Ap
pre
nti
ces
Wor
kers
Work
ers
Work
forc
eW
ork
forc
e
Tre
atm
ent
Ass
ign
men
t0.
364∗∗
∗0.
0956
0.09
63∗
0.5
01∗
∗∗
(0.0
409)
(0.0
880)
(0.0
500)
(0.1
23)
Tre
atm
ent
Ass
ign
men
t-
Rou
nd
10.
372∗
∗∗0.
0487
0.1
13∗
0.5
12∗∗
∗
(0.0
487)
(0.1
03)
(0.0
589)
(0.1
40)
Tre
atm
ent
Ass
ign
men
t-
Rou
nd
20.
437∗
∗∗0.
101
0.0
998∗
0.5
51∗∗
∗
(0.0
446)
(0.1
01)
(0.0
561)
(0.1
31)
Tre
atm
ent
Ass
ign
men
t-
Rou
nd
30.
359∗
∗∗0.
0376
0.1
11∗
∗0.4
73∗∗
∗
(0.0
482)
(0.0
985)
(0.0
559)
(0.1
39)
Tre
atm
ent
Ass
ign
men
t-
Rou
nd
40.
281∗
∗∗0.
204∗
0.0
585
0.4
65∗∗
∗
(0.0
484)
(0.1
16)
(0.0
572)
(0.1
44)
Ob
serv
atio
ns
3770
3770
3778
3778
3768
3768
3768
3768
Sta
ndard
erro
rsin
pare
nth
eses
∗p<
0.1
0,∗∗
p<
0.0
5,∗∗
∗p<
0.0
1
15
Tab
le4:
Pro
fits
.R
egre
ssio
ns
incl
ud
ero
un
dfi
xed
effec
ts,
app
renti
cep
refe
ren
cefi
xed
effec
ts,
and
base
lin
eva
lues
of
the
dep
end
ent
vari
able
,w
her
eap
pli
cab
le.
Tri
mm
edp
rofi
tsar
ew
inte
rize
dat
5%.
Err
ors
are
clu
ster
edat
the
firm
leve
l.
(1)
(2)
(3)
(4)
(5)
(6)
Raw
Pro
fits
Raw
Pro
fits
Tri
mm
edP
rofi
tsT
rim
med
Pro
fits
Log
Pro
fits
Log
Pro
fits
Tre
atm
ent
Ass
ign
men
t19
.55
38.1
4∗∗
∗0.1
20∗
∗∗
(35.
69)
(14.
01)
(0.0
399)
Tre
atm
ent
Ass
ign
men
t-
Rou
nd
14.
612
32.1
6∗0.0
831∗
(39.
18)
(17.
11)
(0.0
459)
Tre
atm
ent
Ass
ign
men
t-
Rou
nd
223
.26
41.9
9∗∗
∗0.1
37∗∗
∗
(37.
15)
(15.
32)
(0.0
442)
Tre
atm
ent
Ass
ign
men
t-
Rou
nd
324
.98
38.9
8∗∗
0.1
25∗∗
∗
(37.
39)
(16.
78)
(0.0
439)
Tre
atm
ent
Ass
ign
men
t-
Rou
nd
425
.29
39.3
9∗∗
0.1
34∗∗
∗
(41.
26)
(16.
13)
(0.0
480)
Ob
serv
atio
ns
3635
3635
3635
3635
3459
3459
Sta
ndard
erro
rsin
pare
nth
eses
∗p<
0.1
0,∗∗
p<
0.0
5,∗∗
∗p<
0.0
1
16
Tab
le5:
Sale
s.R
egre
ssio
ns
incl
ud
ero
un
dfi
xed
effec
ts,
app
renti
cep
refe
ren
cefi
xed
effec
ts,
and
bas
elin
eva
lues
of
the
dep
end
ent
vari
ab
le,
wh
ere
app
lica
ble
.T
rim
med
sale
sar
ew
inte
rize
dat
5%.
Err
ors
are
clu
ster
edat
the
firm
leve
l.
(1)
(2)
(3)
(4)
(5)
(6)
Raw
Sal
esR
awS
ales
Tri
mm
edS
ales
Tri
mm
edS
ales
Log
Sale
sL
og
Sale
s
Tre
atm
ent
Ass
ign
men
t-3
2.16
67.2
7∗∗
0.1
20∗
∗∗
(124
.2)
(28.
19)
(0.0
377)
Tre
atm
ent
Ass
ign
men
t-
Rou
nd
1-4
9.86
44.6
30.0
806∗
(127
.3)
(32.
74)
(0.0
427)
Tre
atm
ent
Ass
ign
men
t-
Rou
nd
2-2
3.07
73.9
8∗∗
0.1
42∗∗
∗
(116
.9)
(31.
10)
(0.0
414)
Tre
atm
ent
Ass
ign
men
t-
Rou
nd
3-2
1.26
77.8
5∗∗
0.1
22∗∗
∗
(126
.8)
(33.
73)
(0.0
405)
Tre
atm
ent
Ass
ign
men
t-
Rou
nd
4-3
5.86
72.2
3∗∗
0.1
35∗∗
∗
(149
.4)
(32.
54)
(0.0
453)
Ob
serv
atio
ns
3629
3629
3629
3629
3485
3485
Sta
ndard
erro
rsin
pare
nth
eses
∗p<
0.1
0,∗∗
p<
0.0
5,∗∗
∗p<
0.0
1
17
Tab
le6:
Ap
pre
nti
ce
Cogn
itiv
eA
bilit
yan
dP
rofi
ts.
Reg
ress
ion
sin
clu
de
rou
nd
fixed
effec
ts,
app
renti
cep
refe
ren
cefi
xed
effec
ts,
an
db
asel
ine
valu
esof
the
dep
end
ent
vari
able
,w
her
eap
pli
cab
le.
Tri
mm
edsa
les
are
win
teri
zed
at5%
.E
rror
sare
clu
ster
edat
the
firm
level
.
(1)
(2)
(3)
(4)
(5)
(6)
Raw
Pro
fits
Raw
Pro
fits
Tri
mm
edP
rofi
tsT
rim
med
Pro
fits
Log
Pro
fits
Log
Pro
fits
Tre
atm
ent
Ass
ign
men
t:C
ogIn
dex
Ab
ove
Med
ian
36.8
348
.42∗
∗0.1
05∗
(46.
70)
(20.
84)
(0.0
549)
Tre
atm
ent
Ass
ign
men
t:C
ogIn
dex
Bel
owM
edia
n-3
3.83
2.66
10.0
886
(66.
31)
(22.
55)
(0.0
658)
Tre
at-
Rou
nd
1:C
ogIn
dex
Ab
ove
Med
ian
39.0
053.2
8∗∗
0.0
904
(56.
35)
(27.0
1)
(0.0
645)
Tre
at-
Rou
nd
2:C
ogIn
dex
Ab
ove
Med
ian
35.4
160.1
2∗∗
∗0.1
31∗∗
(49.
24)
(22.5
9)
(0.0
627)
Tre
at-
Rou
nd
3:C
ogIn
dex
Ab
ove
Med
ian
23.4
926.4
90.0
442
(54.
81)
(25.5
5)
(0.0
636)
Tre
at-
Rou
nd
4:C
ogIn
dex
Ab
ove
Med
ian
50.8
754.2
6∗∗
0.1
56∗∗
(50.
54)
(24.1
9)
(0.0
669)
Tre
at-
Rou
nd
1:C
ogIn
dex
Bel
owM
edia
n-5
6.89
-14.8
00.0
364
(69.
16)
(26.8
7)
(0.0
734)
Tre
at-
Rou
nd
2:C
ogIn
dex
Bel
owM
edia
n-2
6.26
5.2
25
0.1
02
(75.
02)
(24.8
4)
(0.0
729)
Tre
at-
Rou
nd
3:C
ogIn
dex
Bel
owM
edia
n-1
9.41
20.0
90.1
48∗∗
(68.
37)
(27.5
4)
(0.0
738)
Tre
at-
Rou
nd
4:C
ogIn
dex
Bel
owM
edia
n-3
3.35
-1.0
71
0.0
655
(70.
94)
(25.5
2)
(0.0
771)
Ob
serv
atio
ns
3635
3635
3635
3635
3459
3459
Sta
ndard
erro
rsin
pare
nth
eses
∗p<
0.1
0,∗∗
p<
0.0
5,∗∗
∗p<
0.0
1
18
Tab
le7:
Ap
pre
nti
ce
Cogn
itiv
eA
bilit
yan
dS
ale
s.R
egre
ssio
ns
incl
ud
ero
un
dfi
xed
effec
ts,
app
renti
cep
refe
ren
cefi
xed
effec
ts,
an
db
asel
ine
valu
esof
the
dep
end
ent
vari
able
,w
her
eap
pli
cab
le.
Tri
mm
edsa
les
are
win
teri
zed
at5%
.E
rror
sare
clu
ster
edat
the
firm
level
.
(1)
(2)
(3)
(4)
(5)
(6)
Raw
Sal
esR
awS
ales
Tri
mm
edS
ales
Tri
mm
edS
ale
sL
og
Sale
sL
og
Sale
s
Tre
atm
ent
Ass
ign
men
t:C
ogIn
dex
Ab
ove
Med
ian
62.6
491
.38∗
∗0.1
09∗
∗
(186
.8)
(43.
42)
(0.0
547)
Tre
atm
ent
Ass
ign
men
t:C
ogIn
dex
Bel
owM
edia
n-2
44.4
-4.6
320.0
840
(182
.4)
(44.
46)
(0.0
636)
Tre
at-
Rou
nd
1:C
ogIn
dex
Ab
ove
Med
ian
40.0
370.9
60.0
769
(201
.4)
(51.0
8)
(0.0
624)
Tre
at-
Rou
nd
2:C
ogIn
dex
Ab
ove
Med
ian
72.9
610
9.7
∗∗0.1
47∗
∗
(180
.6)
(46.7
3)
(0.0
604)
Tre
at-
Rou
nd
3:C
ogIn
dex
Ab
ove
Med
ian
67.0
779.5
50.0
793
(196
.6)
(52.8
4)
(0.0
606)
Tre
at-
Rou
nd
4:C
ogIn
dex
Ab
ove
Med
ian
70.9
910
6.8
∗∗0.1
33∗
∗
(201
.4)
(50.2
7)
(0.0
672)
Tre
at-
Rou
nd
1:C
ogIn
dex
Bel
owM
edia
n-2
70.6
-35.4
50.0
315
(189
.9)
(51.0
3)
(0.0
703)
Tre
at-
Rou
nd
2:C
ogIn
dex
Bel
owM
edia
n-2
23.9
6.0
54
0.0
988
(181
.4)
(50.3
3)
(0.0
705)
Tre
at-
Rou
nd
3:C
ogIn
dex
Bel
owM
edia
n-2
33.9
17.3
00.1
14
(189
.5)
(54.6
2)
(0.0
695)
Tre
at-
Rou
nd
4:C
ogIn
dex
Bel
owM
edia
n-2
50.2
-7.8
52
0.0
897
(204
.5)
(50.2
7)
(0.0
723)
Ob
serv
atio
ns
3629
3629
3629
3629
3485
3485
Sta
ndard
erro
rsin
pare
nth
eses
∗p<
0.1
0,∗∗
p<
0.0
5,∗∗
∗p<
0.0
1
19

Designed by soapbox.co.uk
The International Growth Centre (IGC) aims to promote sustainable growth in developing countries by providing demand-led policy advice based on frontier research.
Find out more about our work on our website www.theigc.org
For media or communications enquiries, please contact [email protected]
Subscribe to our newsletter and topic updates www.theigc.org/newsletter
Follow us on Twitter @the_igc
Contact us International Growth Centre, London School of Economic and Political Science, Houghton Street, London WC2A 2AE


