Embed Size (px)
Citation preview
DISCRETE ANALYSIS OFA COMPOSITE VIDEO SIGNAL
Frank F. Carden, William P. Osborne and Alton L. GilbertElectrical Engineering Department
New Mexico State University, Las Cruces, New Mexico
ABSTRACT
In this paper the problem of repre-senting the composite video signal formonochromatic T.V. transmission is exam-ined and a method for computing therequired spectral bandwidth is devisedsuitable for computer applications. Theresults obtained numerically are comparedto measured results and to analyticalsolutions for a determinate signal forspecial cases. Comparison is made withsome 'tmaximum horizontal resolution"methods with a resulting decrease inbandwidth requirements for most applica-tions.
INTRODUCTION
A fundamental problem in the designof any communications system is speci-fying the bandwidth necessary for trans-mission of the required information. Atelevision system is no different in thisrespect than any other communicationsystem. However, estimating the band-width of a television system is a morecomplicated problem than its counterpartin most other communication problems.The basic reason for the added complica-tion is that a television system musttransmit a two dimensional picture over
This work was supported by NASAGrant #NGR-32-003-037. Experimentaldata furnished by Dickey Arndt, NASAManned Spacecraft Center, Houston,Texas.
a one dimensional channel.In most communication problems not
only is the bandwidth important but know-ledge of the actual spectrum is necessaryin order to examine the effects of nar-rowing this bandwidth. The purpose ofthis work is to study video spectrumsand attempt to answer the question ofwhat is the necessary video bandwidthfor satisfactory reproduction and toexamine the composite video spectrum.All numerical analysis is based upon theparameters of the Apollo downlink tele-vision system but the mathematicaldevelopments are for a general televisionsystem with only the requirements beingthat it be monochromatic and use linearscanning for transformation into the timedomain.
PART I
STANDARD METHODS FOR ESTIMATINGVIDEO BANDWIDTH
The vertical resolution of a tele-vision system is directly proportionalto the number of lines in the scanningpattern. The horizontal resolution isa function only of video bandwidth:i.e., the maximum number of verticallines which may be reproduced is a func-tion of the bandwidth of the system. Itshould be observed that the bandwidthnecessary to achieve maximum horizontalresolution is not necessarily the band-width needed to transmit a given image.
There have been numerous methodsdevised for estimating the required
Received October 5, 1970 352
video bandwidth of a television system.However, for the purpose of this work,the authors have selected three repre-sentative methods which appear mostoften. All of the methods have twothings in common--specifying a worst-case bandwidth which is then used as adesign guide-line, and disregarding theactual program material to be transmit-ted through the system.
Method of Maximum Information
One method of determining the bandwidthof a scanned video signal is to assumethat each intersection of a verticalline with a horizontal scan line (usingthe maximum number of vertical lines) isa sample point. This means that the num-ber of sample points will be the productof the number of horizontal scan lines,N, and the maximum possible number ofvertical lines, Nh. Then each of thesesample points may be considered quantizedinto eight levels. It has been shownthat eight .uantitizing levels will re-present an actual analogue televisionsignal with reasonable accuracy. [21
The channel capacity necessary totransmit any signal is equal to the max-imum rate of transmission of information.If n symbols are assumed to occur withequal probability and each takes an iden-tical time, tt, to transmit, then it hasbeen shown [3] that the necessary channelcapacity,CI, is
-10g2nC/ o bits/sec. (1)tt
For a television system, the n symbolsbecome the eight words necessary torepresent the amplitude of a sample, andif the eight words are assumed to occurwith equal probability, then Equation 1is applicable to such a system and thechannel capacity of such a televisionsystem is given by Equation 2.
C/ = t bits/sec.Itt (2)
Now the time required to transmit eachsample is the number of samples dividedinto the vertical framing period
= fNNh sec. (3)
Thus the channel capacity required totransmit the assumed signal is
C/= 3ffNNh bits/sec. (4)
The appropriate relationship betweenbandwidth and channel capacity in a noisychannel has been shown to be [4]
C = BWlog2 (1 + N)g2 N bits/sec. (5)
The signal to noise ratio for high qual-ity image reproduction has been shown tobe approximately thirty. [5] Substitu-ting this value and Equation 4 intoEquation 5 and rearranging, yields asystem bandwidth of
BW = .6f NN hz.f h (6)
Using the parameters from Table 1in Equation 6, an approximation to nec-essary bandwidth for the Apollo systemis obtained as
BW (mode 1) = (.6)(10)(312)(250)
= 468 khz.
BW (mode 2) = (.6)(.625)(500)(1248)= 247 khz.
Method of Vertical Bars
In using this method for determiningthe required system bandwidth, an imageconsisting of nothing but vertical barsof alternating black and white illumina-tion is assumed. It is further assumed
353

TABLE I
Parc
Peak-to-Peal
Peak-to-Pea}
BASIC SCANNING PARAMETERS OF APOLLO TELEVISION SYSTEM [1]
imeter Mode 1
i Video Signal 2.4 V
c Sync Signal 2.4 V
Horizontal Line Period
Horizontal Line Frequency
Vertical Framing Period
Vertical Framing Frequency
Horizontal Sync Burst Period
Serrated Vertical Sync Period
Width of Serrations
Burst Frequency
Burst Waveform
Number of Lines Per Frame
Horizontal Resolution
that these bars are of width h/Nh whereh is the horizontal width of the picture.Thus the system is being required to
operate at its maximum horizontal resolu-tion.
When this type of image is scanned,the ideal video output is a square wave
with a period of 2tQ/Nh and a fifty per-
cent duty cycle. The assumption is thenmade that for the purposes of reproduc-tion, a sinewave of this period is suf-ficient. [6]
Thus, the required bandwidth basedon this type of analysis is given by
Nh_2t hz. (7)Qt9
The necessary bandwidth for the Apollotelevision may be calculated usingEquation 7 and parameters from Table 1.
312.5 ,usec
3.2 khz
100 msec
10 hz
30 ,usec
2.5 msec
45 psec
409.5 khz
Keyed Sinewave
320
250 Lines
BW (mode 1) =
BW (mode 2) =
1250 psec
800 hz
1.6 sec
.625 hz
120 vsec
10 msec
180 lsec
409.5 khz
Keyed Sinewave
1280
500 Lines
210
2(282.5) - 10-6= 380 khz.
500
2 (1220) - 106
= 205 khz.
Method of Maximum Rise Time
The output of the scanning trans-
ducer when it crosses a vertical black
to white boundary is in the ideal case
a step function. However, in a real
system with finite bandwidth, this stephas a rise time which is a function of
system bandwidth.If we assume such a boundary exists,
then it follows that the rise time must
be less than half the width of one of
354
Mode 2
2.4 V
2.4 V

the minimum width vertical lines used tospecify horizontal resolution. The max-imum rise time, tp,, based on the abovediscussion becomes
t = (1/2)ttN secs.h
(8)
The upper 3db frequency, f2, of a systemwhich will pass a pulse with such a risetime is given by the approximation belowwhich may be found in most texts on videoamplifiers. [7]
.35f = hz.2 t
p(9)
Since the upper 3db frequency is a closeapproximation to the required bandwidth,Equations 8 and 9 may be combined toyield an expression for the required sys-tem bandwidth.
.7NBW = hz.
tz(10)
By making use of Equation 10 and theparameters in Table 1, the bandwidth re-quirements for the Apollo system may becalculated under these assumptions.
BW (mode 1) = (.7)(210) = 521 khz.282.5 * 106
BW (mode 2) = (.7)(500) = 280 khz.1250 . 10 6
PART II
THE COMPOSITE VIDEO SPECTRUM
The video signal produced at theoutput of a camera, using linear scanning,may be expressed as the sum of swo sig-nals--the total video signal, v (t), andthe synchronization signal, s(t). Thetotal video signal, v/ (t), may be ex-pressed as the product of three other
BLACK
TYPICAL V(t) TIME
TYPCAn n^n FTYPICAL BL(t) TIE
TYPICAL BV(t)
WH ITE'
V'(t) FOR ABOVE WAVEFORMS
TYPICAL S (t)
WHITE w
Eo (t) FOR ABOVE WAVEFORMS TiMi
TIME DOMAIN REPRESENTATIONOF A COMPOSITE VIDEO SIGNAL
Figure I
functions. One of these is a video sig-nal, v(t), which results from allowingthe output of the camera to exist at alltimes including retrace, or equivalentlyscanning N pictures placed side by sidewith no synchronization or retrace inter-val involved. The second signal is ablanking signal, Bk (t), which is zeroduring horizontal retrace and one at allother times. The third is anotherblanking signal, BV (t), which is zeroduring vertical retrace and one at allother times. Thus
E0 (t) = V(t) B (t) BV (t) + s(t) (11)
This argument is illustrated graphicallyin Figure 1.
Equation 11 has appeared in an ar-ticle by L. E. Franks on a random videoprocess, but apparently has not been ap-plied to a deterministic video signalbefore. [9]
Development of the Composite VideoSpectrum Based on a Time Series Model
Using Equation 11 as a startingpoint, the composite video spectrum may
355

now be developed. The blanking function,BV, represents a square wave with a veryhigh duty cycle and narrow spectrum and,for that reason, neglecting this functionhas no significant effect on the spec-trum of Eo (t). [10] Making use of thisapproximation, Equation 11 becomes
Eo (t) = v (t) BZ (t) + s(t)
00 00
V1 (w) = I B, (n) f v(t)eJ(W-nwQ1)t dt
n=-_0 _ (16)
Where B (n) = t | B(t)e JnPItdt
(12)
Eo(t) is the time representation ofthe composite video signal as it occursat the output of the camera, and, there-fore, its spectrum is the spectrum towhich the remainder of the televisionsystem must respond. The spectrum ofEo (t) is given by the two-sided Fouriertransform of E0 (t).
00
Eo ()={|v(t)B (t)eJt dt_ 00
And wg = 2rfPIMaking use of the fact that the integralrepresents another Fourier transform.
00
V/ (w) =IEn=-a
Where
Bt (n) v (w-nwu) (17)
00
v (w-nw ) = v (t) eJtdt
wow-nw
+ s(t)e J tdt00
(13) Equation 17 represents the envelopeof the spectrum of the composite videosignal.
The second integral is the Fourier trans-form of the synchronization signal orsimply S(w). Equation 13 then becomes
00
E (w) = f v(t) B, (t) ejwt dt_00
+ S(w). (14)
Application of this Model to a Black andWhite Pattern
In order to apply Equation 18 to ablack and white test pattern, the Fouriertransform of v(t) and BQ (t) must be ob-tained. In figure 2, the black and whitetest pattern is shown with the corre-sponding v(t) which it produces. Thev(t) is a square wave of fifty percentduty cycle with its period equal to tf.The corresponding v(m) is known to be
Then V/ (w) is given by
00
V/ () = v (t) B, (t) e dt_00
tf -ja . miTv(m) =- e sin 2
(15)The absolute value of this function is
But Bk,(t) is periodic and may thereforebe represented by a Fourier series.Making use of this fact and rearrangingreduces Equation 15 to
I I ttf (sifl2 )
v(m) =iT(Sn
356
(18)

-IB-
BLACK AND WHITE TEST PATTERN
"olu120T.1 it.ll^t4 Vil*K t It-NK.No
IL1Lm1 nnnil 11 11. nnnn l I11tLf
lIME DOMAIN VIDEO OUTPUT FOR ABOVE IMAGE
BLACK AND WHITE PATTERN
Figure 2
The transform of the blanking signal inFigure 1 is
B (n) = Te(sin'Tr nT/t9)
JTnT/ t9,
The absolute value of this function is
Tsin nTffB (n) = nQnTf (19)
t9
A plot of the product of Equations18 and 19 versus frequencey is the am-plitude spectrum of the composite videosignal produced by the black and whitepattern. This plot is shown in Figure 3with the amplitude component of the zerofrequency term taken as a zero decibelreference. This plot does not show thecomponents about the line frequency har-monics, because such detail is impossibleto achieve on the frequency scale used.However, this detail has been plotted ona linear scale for the first two harmon-ics and is shown in Figure 4. In makingthe plot in Figure 3, the values for T,t9, and tf were taken from Table 1 and
tKHI tRKH. 18BKBEVIDEO SPECTRUM CALCULATED FOR BLACK AND WHITE TEST PATTERN
Figure 3
3BIS M O 36 3110 313 315 31706 316 3116 3533 3 1 336"0 33"1 33 36
SPECTRUM OF BLACK AND WHITE TESTPATTERN ABOUT THE LINE SCANNING FREQUENCY
Figure 4
correspond to those used in the Apollotelevision system.
This spectrum was measured by engi-neers at the Man Space Flight Center inHouston, Texas. Table II is a comparisonof the calculated amplitude spectrum withthe measured spectrum for the firsttwenty-eight harmonics. The agreementbetween the calculated and measured spec-
trum is quite good with the average dif-ference being less than 2db, and onlyfour components showing greater than 3dberror.
The basic video signal, v(t), was a
ten cycle square wave, yet due to the ef-fect of the blanking signal, this patternproduces components which are only about40db down from the maximum component at100khz. This spectrum is analogous to,but certainly not the same as, the spec-
trum generated by sampling a bandlimitedfunction.
357
-10
-20
30-
-40 I I I I
-20-
_"_-
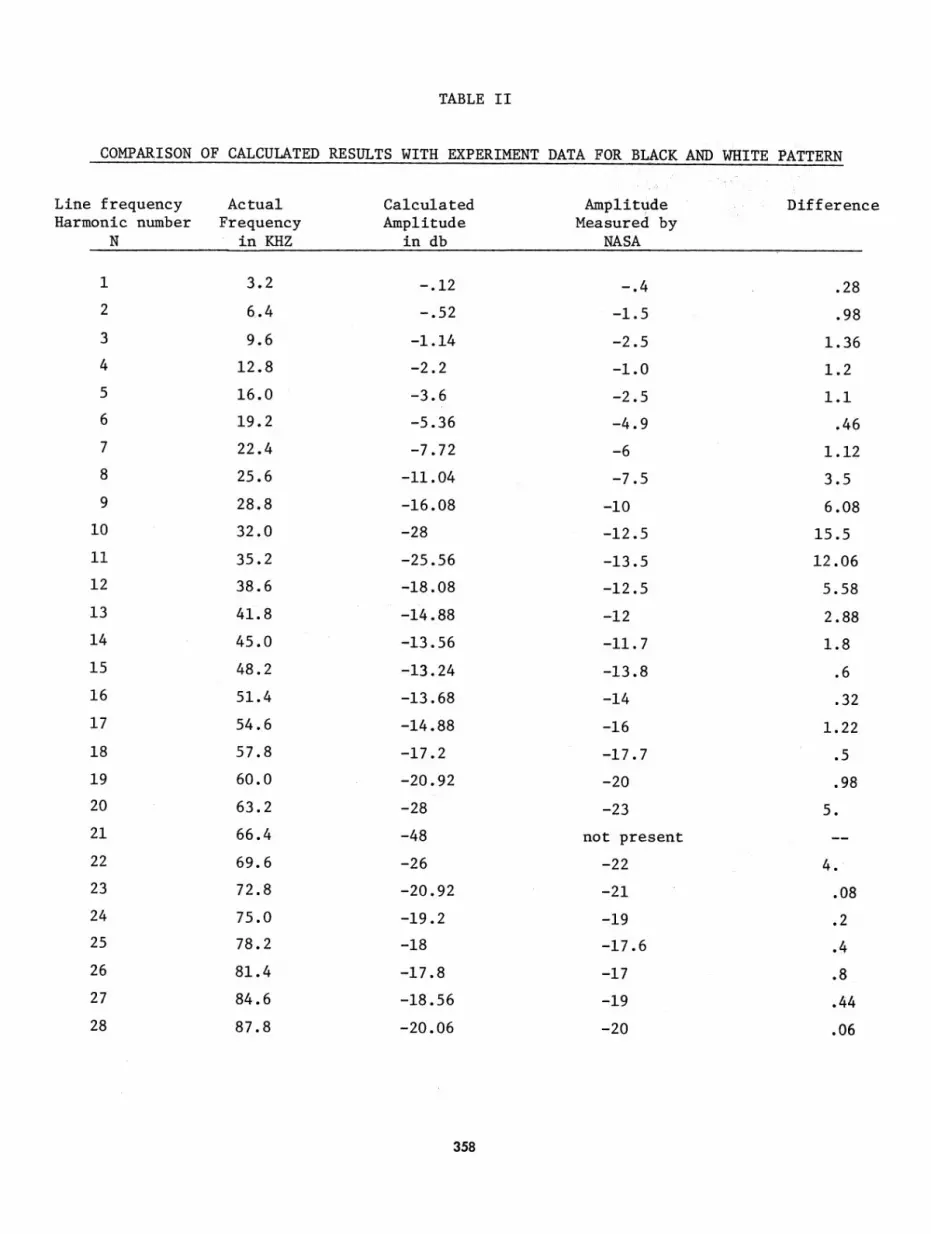
TABLE II
COMPARISON
Line frequencyHarmonic number
N
OF CALCULATED RESULTS WITH EXPERIMENT DATA FOR BLACK
Actual Calculated AmplitudeFrequency Amplitude Measured by
in KHZ in db NASA
AND WHITE PATTERN
Difference
-.4
-1.5
-2.5
-1.0
-2.5
-4.9
-6
-7.5
-10
-12.5
-13.5
-12.5
-12
-11.7
-13.8
-14
-16
-17.7
-20
-23
not present
-22
-21
-19
-17.6
-17
-19
-20
1
2
3
4
5
6
7
8
9
10
11
12
13
14
15
16
17
18
19
20
21
22
23
24
25
26
27
28
3.2
6.4
9.6
12.8
16.0
19.2
22.4
25.6
28.8
32.0
35.2
38.6
41.8
45.0
48.2
51.4
54.6
57.8
60.0
63.2
66.4
69.6
72.8
75.0
78.2
81.4
84.6
87.8
.28
.98
1.36
1.2
1.1
.46
1.12
3.5
6.08
15.5
12.06
5.58
2.88
1.8
.6
.32
1.22
.5
.98
5.
-.12
-.52
-1.14
-2.2
-3.6
-5.36
-7.72
-11.04
-16.08
-28
-25.56
-18.08
-14.88
-13.56
-13.24
-13.68
-14.88
-17.2
-20.92
-28
-48
-26
-20.92
-19.2
-18
-17.8
-18.56
-20.06
4.
.08
.2
.4
.8
.44
.06
358

An examination of Equations 18 and19 reveals some of the parameters whichaffect this spectrum. From Equation 19,it can be seen that Bt (n) has an over-all distribution of the familiar sin x/xform and that the parameter which con-trols the width of the spectrum of B2'(n)is T/t9, the fraction of time spent forretrace.
From Equation 18, the parameterseffecting v(m) may be examined. v(m)also has a sin x/x distribution and itsfirst zero is given by the reciprocal ofthe pulse width or the reciprocal of thetime interval during which the image iswhite. For this very special case, thistime is tf/2, thus yielding a spectrumof v(t) which is approximately 140cycles wide. If the transition fromblac.k to white had been more gradualgoing through several shades of gray inbetween, then v(t) would have had an evennarrower spectrum and the frequency com-ponents of the composite video would havebeen much more tightly bound to the har-monics of the line frequency. In thelimiting case of a single sine variationfrom black to white, there would havebeen only one sideband component for eachline frequency harmonic; and it wouldhave been at the framing frequency, 10hz.
Changing the test pattern will haveno effect on B9 (n), since it is a func-tion of the scanning parameters. Theeffect on v(m), however, may be quitedrastic, since v(t) is a function of thepicture and of the scanning rates.
In considering the effect of otherimages on the spectrum of v(t) and thuson the composite video spectrum, it ismost helpful to divide the possiblev(t)'s into two classes. The first classwill be defined as a set of possibleimages which will generate a correspond-ing set of v(t)'s bandlimited to thebandwidth of B9(n), the second as a setof possible images which will generatecorresponding v(t)'s which have band-widths in excess of the bandwidth ofBk(n). In the case of the Apollo systemoperating in mode one, this dividingbandwidth for the v(t)'s can be taken asapproximately 32 khz. (The first zeroof the sin x/x distribution describing
iL--.A-1X~~~~--. -- ;/-, BJ,\ ,f, 21, 34, M, Sf, 6f 71, L F
ENVELOPE OF THE COMPOSITE VIDEOSPECTEUM FOR THE BW OF VI_) H 1/2 IL
_ AFPPEOXIMATE COMPOSITE ENVELOPE
IIf lot 15, 2HL 25E1 3Efl. 3T1 EEM
APPROXIMATE ENVEtOPE OF THE COMPOSITEVIDEO SPECTRUM FOR THE MW OF V/WI SW OF EdH)
APPROXIMATE COMPOSITE ENVELOPE
101L HLI 2NIL 2El1 30L 2.APPEOXIMATE ENVELOPE OF THE COMPOSITE
VIDEO SPECTRUM FOR T"E SW OF V/W) EW OF &ae
Figure 5
the spectrum of Bk(t)).For the class of video functions
with their bandwidths limited to thebandwidth of Bk(t), the general shape ofthe spectrum is defined by Bk(n). Thejustification for this statement can bestbe shown graphically, but before pro-ceeding to such an argument, consider arestricted case of this class ofv(t)'s. The case is one where v(t) isbandlimited to less than one-half of theline frequency. For such a situation,the composite video spectrum is given byEquation 17. An example of such a caseis plotted in Figure 5a. An inspectionof this figure reveals that the band-width of the composite video spectrum isgiven by the bandwidth of the blankingsignal.
As the bandwidth of v(t) is allowedto increase, the situation becomes morecomplicated, due to the overlapping ofthe spectrum of v(t) about each of theline frequency harmonics. An example ofthis case is shown graphically in Figure5b. This figure is drawn by consideringonly five of thirty or forty v(w)'s dis-placed about each of the thirty or fortyline harmonics given by BZ(n). v(w) is
359
ixI

placed about each line harmonic with theamplitude of v(w) multiplied by the valueof BZ (n) at that harmonic then the en-velope of the composite video spectrumwas approximated by adding on a point topoint basis the envelope of all thev(w)'s. Since only five v(w)'s wereconsidered, this is a fairly crude ap-proximation, but it serves to illustratethe point. A close inspection of Figure5 will reveal that the harmonics in theupper frequency regions are still verysmall and that the bandwidth of the com-posite video signal is still quite closeto that of Bt (t) taken alone. However,the actual fine structure of the compo-site video signal is no longer easilyobtained by this method, since it re-quires adding all of the components ofthe various overlapping v(w)'s at afrequency to obtain the amplitude of thatfrequency component. Since the line fre-quency is a harmonic of the frame fre-quency and each of the sideband com-ponents is separated from the linefrequency by multiples of the frame fre-quency, the overlapping about the linefrequency harmonics places sideband com-ponents of one line frequency harmonicon top of the sideband components of thenext line frequency harmonic.
When the second class of v(t)'s ispresent, v(t) will be the function whichdetermines the bandwidth and not B2(t).Consider first the trivial case of v(t)being a unit impulse. Since v(w) isthen displaced about each of the linefrequencies, it is obvious that the band-width of such a spectrum is infinite,because the v(w) placed about the originextends to infinity with unity amplitudeand the other spectrums are only added tothis one.
As a second example, consider a v(w)bandlimited to about four times the band-width of Bp (t), and assume v(w) is aunity constant out to the limiting fre-quency. A plot of this situation isshown in Figure 5c, once again using onlyfive of the components to obtain the en-velope of the spectrum of the compositevideo. Inspection reveals that the 3dbbandwidth of the composite video for thiscase is g'iven exactly by the bandwidth of
v(w), and the only effect which blankinghas on the composite video spectrum is toraise the level of the very high fre-quency terms, but they still do not be-come of appreciable size.
It should be pointed out that thedivision between the two classes ofv(t)'s is somewhat arbitrary. If eitherv(t) or B2(t) has high frequency compo-nents compared to the other, it will de-fine the bandwidth of the system. Forthe intermediate cases, the bandwidth isgreater than either v(t) or By,(t) wouldindicate, but no simple approximation canbe used to find the bandwidth in thiscase.
Determination of a More Complicated v(t)As a final example, consider the
video function, v(t) generated by scan-ning a white diagonal bar on a blackbackground. The optical image and thecorresponding time domain output of thescanning device are shown in Figure 6.
v(t) consists of a series of pulseseach of width T and each periodic at theframing frequency. The spectrum of anyone of the periodic pulse trains is givenby the Fourier series expansion of thepulse train. Denoting this expansion asK (t), the series becomes
Ti*TIMIE DOMAIN OUTPUT tESULTING FROM SCANNING THE IMAGE
BELOW NEGLECTING BLANKING
DIAGONAL BAR IMAGE
DIAGON AL BAR EXAMPLE
Figure 6
360

00
K1(t) = In=-o
Where K1 (n) = ttf
K (n)e fLwft (20)
t
o
by the fact that the beginning on onepulse train is delayed by one line scanperiod (plus At due to the slant of theline) from the preceeding pulse train.Thus, the phase shift 8 as function ofthe time delay, td, between pulses isgiven by
and wf = 27rff
Thus carrying out the indicated integra-tion for the pulse train in question,
Kl(n) = TeJnwfT (sin nwf'rT/2)1 nw lrTc/2f
(21)
Thus the envelope of K1 (t) is given bythe familiar sin x/x distribution withthe first zero occurring when w = l/T.
However, the spectrum of v(t) isgiven by a summation of Q such pulsetrains or
o = 2rtd f (24)
Where f is the frequency of the compo-nent in question.
The time delay, td, between the firstand second pulses is tt + At; and betweenthe first and third, it is twice thismuch or, in general for the 'th pulse,it is i(tt + At). The amplitude of then, component, A(nl), may be now expressedas the sum of terms with identical am-plitudes and phases given by Equation 24or
A(n) K= (n + K2(n ) eji2dtA(n1) 1() d
+ K3(ne) 4lrtdf ......
v(t) = I Ki(t)i=O
(22)
By substituting Equation 20 into Equation22, the Fourier series representation ofv(t) becomes
V(t)==00
I K (n) eJ f1 (23)i=0 n=-00
An inspection of Equation 23 revealsthat the summing of these pulse trainsaffects only the amplitude of the com-ponents. Thus for some fixed n, say ni,it is necessary to sum all of the Ki'sfrom each train of pulses to find the am-plitude of the component at n1. But forsome fixed n, the amplitude of all theK's is the same and the only differencein the K"s is the phase of the compo-nents. This phase difference is caused
+ K1(nL) eJ td
However, by recalling the KL1(n1) = K2(n1)= .K(ni) the expression reduces to
A(n ) = K(n ) I ej27iTfi=O
(25)
Where T = t + At
However, the series in Equation 25may be put into closed form [10], andthe results are
9. ~~sinir2kTfx j2TiTf - sin 7TTf (26)
i=O
361
a
) tK (t) e-i f dt1

Substitution of Equation 26 into Equation25 yields an expression for A(nl).
-(nl)= |K(nl sinTV QTfA(n1) K(n1 sin TrTf (27)
Since Equation 27 is good for any fixedn, it may be substituted into Equation 23to obtain the Fourier series representa-tion of v(t) as
00
v(t) = I K(n)n=-o
sin7rZTnff jnwftsin7f Tnfff
(28)
The envelope of the resulting v(t)has been plotted in Figure 7 assuming avertical line; i.e., At = 0. The effectof having the sum of pulse trains in-stead of only one pulse train is to mod-ulate the envelope of K(n) with
sinlTZTnffsinTg Tnff
The main effect of this modulation is toconcentrate the energy in bands about theharmonics of the line frequency. Observethat this concentration is accomplishedwithout consideration of the blankingfrequency, and that when the pulse widthis small, the effect of the blanking sig-nal on the composite video spectrum isvery minor by the arguments presented inthe last section. Thus, in this case,the bandwidth necessary to transmit thecomposite video signal is determined bythe v(t) and, more specifically, by thesin x/x envelope of one of the pulses.
One last point of interest is whathappens when At is not zero: i.e., whenthe line is rotated. Examination of themodulating function will reveal that itis periodic and has peaks located atf = l/T. Therefore, if At is not zero,then the peaks of the spectrum envelopeoccur at f = l/tt + At and harmonics off. Thus, for a At small, in comparisonwith tt, the first peak is very near theline frequency, but for the higher
MNIU 20P ,D A
MAGNITUDE OF K{n) FOR DIAGONAL BAR
AMPLITUDE OF SINrLTNf WITH T = 1/fL
IOf, to~~~~~~2f,
ENVELOPE OF THE VIDEOSPECTRUM Of THE DIACGONAL BAR
SPECTRUM FOR DIAGONAL BAR
Figure 7
harmonics of f, the peak occurs fartheraway from the line frequency and thusthe spectrum becomes more diffused inthe higher portion of the video rangefor non-vertical lines.
This effect is analogous to puttinga band of frequencies into a frequencydoubling circuit, and the output is aband of frequencies twice as wide. Forexample, is At is .Oltk, then the firstpeak occurs at f = .99fk, but the 50thpeak occurs at f = 49.5fk or halfway be-tween the forty-ninth and fiftieth har-monic of the line frequency.
PART III
GENERAL METHOD FOR OBTAINING THE SPECTRUMOF THE VIDEO SIGNAL
In Part II, a mathematical model ofthe composite video signal was presented,but in order to use this model, it isnecessary to evaluate the function v(t).This function may be obtained by per-forming the scanning process mentallyand thus generating the video signal, aswas done for the previous two examples.This process, however, becomes very com-plicated for a picture of any complexity.It is therefore of interest to have a
362

2b,
0 ^Xls 2a
TYPICAL IMAGE ANDCOORDINATE SYSTE M
Where
A = conversion gain of the scanningg device
v = velocity of the scanning devicein the x direction
2 a 4a 6a 81 lUaX AXIS
PERIODIC STRUCTURE USED TO OBTAIN THEVIDEO SPECTRUM OF THE IMAGE ABOVE
TYPICAL IMAGE & COORDINATE SYSTEM USED
u = velocity of the scanning devicein the y direction
AkQ. 2 k P,VELOCITY
_1 COM PONENT
A - 1 C e-i fkk-k,~-Z 2 kZP
Now recalling that v/a = 2/tt andv/b = 2/tf and taking Ag = 1 for conven-
ience
Figure 8
method for obtaining the spectrum of v(t)directly from the image and thus avoidthe step of transformation into the timedomain. In this section, a method devel-oped by P. Mertz and F. Gray [11] forobtaining the spectrum of v(t) directlywill be summarized and a numerical tech-nique for machine computation based on
this method will be developed.
Harmonic Analysis of Scanned OpticalImages
Figure 8 represents a typical imageto be transmitted through a televisionsystem. The brightness function over thesurface is defined as B (x,y).
Now Mertz and Gray [111 have shownthat
00 00
j(Tyk Tr=PB(x,y)=kVaxJY
k=-CO £=-00
And that(29)
00 00
v(t) = A I Ik=o =-00
Ag cos [1T (a+t+fkvP.P
Akkos (-T + fl) t +4 k] (30)
00
v(t) = E E
k=o Z=-oo
Akt cos [2'r (f?k + ffZ) t + fkk (31)
Equation 31 represents the generalform of the video output as a functionof time and has the added advantage thatit defines the spectrum of v(t). Inspec-tion of Equation 31 shows that the com-
ponents in the spectrum of v(t) are theline frequency harmonics with sidebandsabout them consisting of the frame fre-quencies. (see Figure 9) This shouldnot be confused with the composite videofrequency spectrum obtained previously,but rather this is the video spectrum be-fore multiplication by the blankingsignal.
The major advantage of expressingv(t) in the form of Equation 31 is that
the coefficients, A k, which determine
the spectrum of v(t may be found
directly from the image function, B(x,y).Using Equation 29, B(x,y) may be
reduced to a cosine expression using the
same method as for v(t). B(x,y) then
becomes
363
SCAN LINE
--,r-

It then follows by orthogonal relation-ships that
{fK+§fL
IL I
f~~~~~~~+ f. '
II I
lI 1 I LI
0 |L 3L OL ff ee
TYPICAL AMPLITUDE SPECTRUM Of A VIDEO SIGNAL
SIDEBANDS DUE TO MOTION'v-. IN THE IMAGE
:f,-2 t 2fL ff 2f, 2fI4q 2"PffDETAIL Of A TYPICAL REGION OF THE VIDEO SPECTRUMSHOWING THE EFFECT OF MOTION IN THE IMAGE
Figure 9
00 00
B(x,y) = I Ik=o Qk=,-
[Akk cos ix + b Y) t + fkzl (32)
However, this expression is expandableby use of trig identities into
00 00
B(x,y)=I I Ik=o Q=-00
- s~~7k iTQakg cos (k x + b Y)yka b
+ b sin ( x + Y)lklJa (33)
1a -
pq 4ab
2a 2b
0 0
B(x,y) cos (p x + 5A y) dx dy (34)a b
la
bpq 4b1pq 4ab
2a 2b
0 0
B(x,y) sin (fRp x + 2a y) dx dya b (35)
Then since A =/ 2 2pq a + bpq pq
the spectrum of v(t) is completelydefined by evaluation of the integralsof Equation 34 and Equation 35.
General Aspects of the Spectrum of v(t)
There are several points of interestconcerning the video spectrum which arebrought to light by this approach. Thefirst of these is that the process ofscanning transforms each of the spacialFourier components of B(x,y) into a com-ponent in the spectrum of v(t). Thistransformation is made on a one to onebasis and any nonlinearity in the scan-ning device which alters the amplitudeof these components or generates new oneswill produce distortion of the videosignal.
Another item of interest is the ef-fect of motion in the image. If theimage is changing from one scan to anoth-er, then the effect this has on theFourier series expansion of B(x,y) is tomake the coefficients, Akk, functions oftime. Since these coefficients are alsothe coefficients in the Fourier seriesexpansion of v (t), each component of v (t)is of the form
A(t) = Ak 21 (t) cos1 1Where ak = A cos
bkk = Akk sin IkQ [ (k1f1+l+1ff) 27rt + kl I (36)lkl
364
a03W
.aa14

Where A(t) is the amplitude of the -k Qcomponents. 1
Inspection of Equation 36 reveals thatit is an exact expression for a doublesideband suppressed carrier signal. Thespectrum of each component of v(t) takeson sidebands with the maximum frequencyof the sidebands equal to the maximumfrequency of the motion in the image.Figure 9 is a blown-up portion of a partof such a spectrum of v(t). Note thatif the frequency of the motion is great-er than 1/2 the frame frequency, ali-asing will result, causing a blurringeffect in the received image.
Another point of interest is the ef-fect of scanning with a finite aperture.Up to this point in the discussion, theaperture through which the scanning de-vice viewed the image has been assumedto be a point. If it is not a point butrather a small area with its responsedependent upon the location of the imagepoint in the area, then these resultsmust be modified. The effect of suchan aperture is to smooth the time seriesrepresenting v(t) and thus to modify thespectrum much as a filter would. Byextending this basic filter concept,Mertz and Gray [11] were able to showthat a finite two dimensional aperturehas the effect of a comb filter with itsresponse peaks at the harmonics of theline frequency. Thus, the effect of afinite aperture on the spectrum is tofurther confine the components to bandsof frequencies about the harmonics ofthe line frequency. (The convergence ofthe Fourier series expansion of v(t) alsohas the effect of confining the energy tothese bands in the spectrum.)
One precaution which must be ob-served in using this method is thatB(x,y) must truly be a function of bothx and y. Otherwise, the integrals ofEquations 34 and 35 are identically zero.However, this is not a fault of thetheory, but rather a violation of one ofits assumptions. It is tacitly assumedthat the Fourier series for B(x,yl) dif-fers from that of B(x,y2). If B(x,y) isnot a function of y, the theory col-lapses. However, when this conditionexists, the situation is easily rectified
by expanding B(x) or B(y) in its corre-sponding one dimensional series.
Development of a Numerical Method forApproximating the Spectrum of v(t)
It is desirable to have a numericaltechnique for approximating the spectrumof v(t) in order to avoid evaluation ofthe integrals in Equation 34 and Equation35. The reason for avoiding this inte-gration is the difficulty of obtaining amathematical expression for B(x,y) whenthe image is normal program material. Inorder to obtain such an approximation, itis sufficient to make x and y discreteand then find coefficients of the doubleFourier series such that the seriesexactly represents B(x,y) at the dis-crete points in question. If x is al-lowed to take on 2N values and y isallowed to take on 2M values, then x andy become periodic in 2N and 2M respec-tively. Taking the new periods of x andy into account, Equation 26 may be re-
written in an approximated form as
N-1 M-1
B(x,y) = I I [ak cos (Tk x
k=o Q=o
+bk sin (k x +M Y-k +: - )
+ M Y)
(37)
Where b0P = bk = 0
The reasons for the limits on the summa-
tion will become clear as formulas forak1 and bk2 are derived. The droppingof the negative values of Q is possiblebecause ak,t = ak -_ and bkP, = bk -Vi.e., the spectrum is symmetrical'withrespect to the line frequency harmonics.
Thus, the problem of expanding theEquation 37 to obtain the video spectrumresolves itself into the problem of ob-taining ak9 and bk, in a numerical formsuitable for machine calculation. Be-fore proceeding to the derivation ofthese coefficients, it is helpful to
state three lemmas (see Appendix I) whichare necessary in the derivation.
365

Lemma I
2N-1 2M-1 N-1 M-1
x=o y=o k=o Q=o
bkZ sin (rk +M Y)kk N
It is now possible to derive expres-sions for apq and bpq as functions ofB(x,y). Multiplying both sides ofEquation 37 by
COS (T X + M y)
NN
2N-1 2M-1 N-1 M-1
x=o y=o k=o Q=o
and summing over x and y yieldsx +
T y) = 'ON 2N-1 2M-1
x y
x=O Y=0
irk ir9,ak9 cos (N x + M- Y)
x k 9,Xx y k Q
B(x,y) cos (NP x +Nq y)
7rk rrQak cos (N I + - Y) cos
(N x +M Y) + kZX X b sinx y k 9
O<q<M-l
O<p<N-1
p and q not both zero
Lemma III
irk +r 'rr
(N x + Mf Y) cos (y x + M Y) (38)
Applying Lemma 2 to the first sum on theright-hand side of Equation 44 and Lemma1 to the second sum of Equation 44 ob-tained to
2N-1 2M-1 N-1 M-1
x=o y=o k=o Q=o
rrk 1ir9b sin (- x + M Y)kR,
2N-1 2M-1
I I B (x,y) cos
x=O y=O
sin (NP x +
= 2MNbpq
O<p<N-l
O<qj:SM-l
(21 x + iA y) = 2MN a
N pq(39)
By rearranging Equation 39, the desiredexpression for apq is obtained as
2N-1 2M-1
a ~=2 B(x,y) cosapq 2NMy-x=0 y=0
(TP x + Y) O<p<N-1
O<q<M-l
p=q 0
(40)
366
Lemma II
(21(w + s y)Cos N M Y
= 2a MNpq

Similarly, multiplying Equation 37through by Tpr
sin Nx + i! y)
and summing over x and y, the expressionfor b is seen to be
pq
2N-1 2M-1
b Ipq 2NM
(Tpw x + mA Y)N N
I B (x, y) cos
x=O y=0
O<p<N-l
O<q<M-l
(41)
Equations 40 and 41 are an approxi-mation of the amplitude and phase spec-trum of v(t) according to Equation 37.Also Equations 40 and 41 are in a formwhich may be used for machine computa-tion, since their evaluation requires nomore than arithmetical operations.
Description of the Computer Program toFind the Spectrum of v(t)
In order to use Equations 40 and 41for machine computation, the brightnessfunction B(x,y) must be specified at 4 MNpoints equally spaced over the image. Inthe program used on this project, thiswas done by forming B into a matrix andstoring this matrix on tape. The valuesof M and N were taken as 150 each, thusyielding 90,000 data points over theimage. These points are then read offthe tape, and Equations 40 and 41 eval-uated to give apq and bpq. Since theamplitude spectrum is of primary interestthe amplitude,
A = 2 2pq a + bpq pq
is calculated and this is the resultplotted in all the following spectrums.A copy of this program, as well as anexample of the ones used to generatethe B matrix, may be found in [13].
The first image which was selectedfor analysis was a white circle and
black background. This image was chosenfor two reasons. The first was that itrepresents typical program material forthe Apollo television system: i.e.,such an image would be seen by astronautsas they approach the moon in their Apollospace capsule. Secondly, an exact ana-lytical result for this image was givenby Mertz and Gray in 1934 [11]. TableIII is a comparison of the computer re-sults with their analytical results.
Another example for which analyt-ical results are available is the diag-onal bar presented in Part II. There-fore, as a second check on the computeralgorithm, this spectrum was investi-gated. The spectrum of the white barplaced at an angle of 450 with the xaxis was analyzed using the computerroutine. The results are presented inFigures 10, 11, and 12. Figure 10 isthe spectrum of the line frequency har-monics and represents the over-allcoarse spectrum. Observe that the envel-ope is very nearly the sin x/x distribu-tion of a single pulse produced by thescanning process as was predicted inPart II. Figures 11 and 12 are blown-upversions of Figure 10, showing the finedetail of the spectrum--both the low andthe high frequency regions. The actualnumbers are representative of the Apollo(mode 1) system. Observe that the spec-trum is more diffused from the line fre-quency harmonics in the upper frequencyregions, as was predicted for a non-vertical line in Part II.
Extension of Computer Model to theComposite Video Spectrum
Up to this point in this chapter,the spectrum under consideration hasbeen the spectrum of the video signalonly: i.e., without blanking and syn-chronization. Since in Part II thesynchronization was shown to be an ad-ditive term resulting from a one di-mensional series, neglecting this termrepresents a straight forward correc-tion.
However, neglecting the blankingsignals is a much more difficult item
367

TABLE III
Q *ACTUAL FREQUENCYIN Hz
0
123-.40
123
40
12340
12340
0
0
0
0
0
0
0
0
0
320032103220323032406400641064206430644096009610962096309640
128001281012820128301284016000196002280026000292003240035600388004200045200
CALCULATEDAMPLITUDE
.152
.131
.079
.023
.014
.094
.079
.042
.0023
.020
.032
.023
.0023
.017
.023
.011
.014
.021
.023
.0169
.023
.0121
.0041
.0118
.0065
.0025
.0072
.0046
.0014
.0048
#MERTZ AND GRAY' SAMPLITUDE
.153
.130
.079
.023
.014
.095
.079
.040
.0024
.021
.032
.023
.0024
.017
.023
.012
.014
.021
.023
.0168
.023
.0126
.0047
.0113
.0061
.0027
.0071
.0042
.0019
.0049
DIFFERENCE
.001
.001
.000
.000
.000
.001
.000
.002
.0001
.001
.00
.00
.001
.000
.000
.001
.000
.000
.000
.0001
.000
.0005
.0006
.0005
.0004
.0002
.0001
.0004
.0005
.0001
* Frequency Calculation based on Apollo
A
# Apq 2ab 2 2 K1 2
Where a =
b =
R =
1
mode 1 scanning parameters
R/ p 2
(2a) 2b
length of pictureheight of pictureradius of circlefirst order bessel function
368
p
1111122222333334444456789
1011121314

SPECTRUM FOR DIAGON AL BAR TEST PATTERN
Figure 10
Odb4
-20
i41tH2 3.341 3.6011.
DETAIL OF DIAGONAL BARSPECTRUM IN LOW FREQUENCY REGION
3IKH0
Figure II
to correct, since the blanking functionsare multiplying v(t). Thus, if the mo-del is to be of any real use, the blank-ing signals must be accounted for. Withthe computer algorithm already developed,the simplest method of adding the blank-ing is to put it into B(x,y). This maybe accomplished by placing a strip ofzero brightness along the top of theimage to represent vertical blanking andby placing a strip of zero brightnessalong the right hand edge to representhorizontal blanking. This argument isillustrated in Figure 13 and the result-ing v(t) is sketched.
With this simple extension, thecomputer algorithm presented in the lastsection yields the composite video spec-trum generated by transmitting any mono-chrome image. In the examples closeobservation will reveal that the nullsin the calculated spectrums are slightlyshifted from those measured by NASA. Thereason for this is the different ratiosof the T/t . NASA's ratio was .0965while the best approximation to thiswhich can be made using the previouslymentioned 300 by 300 grid is .100.
VIDEO SPECTRUMSr
2, 4. 0. Jo lB.
IMAGE FIELD WITH BLANKING ADDED
".I^
DOMAIN OUTPUT FOR ABOVE IMAGE
COMPOSITE VIDEO WAVEFORM
Figure 13
369
32KH.
Figure 12
-36.
-40-
3.31tHt
GL.cK
ZER
Composite Video Spectrums of SomeStandard Test Patterns
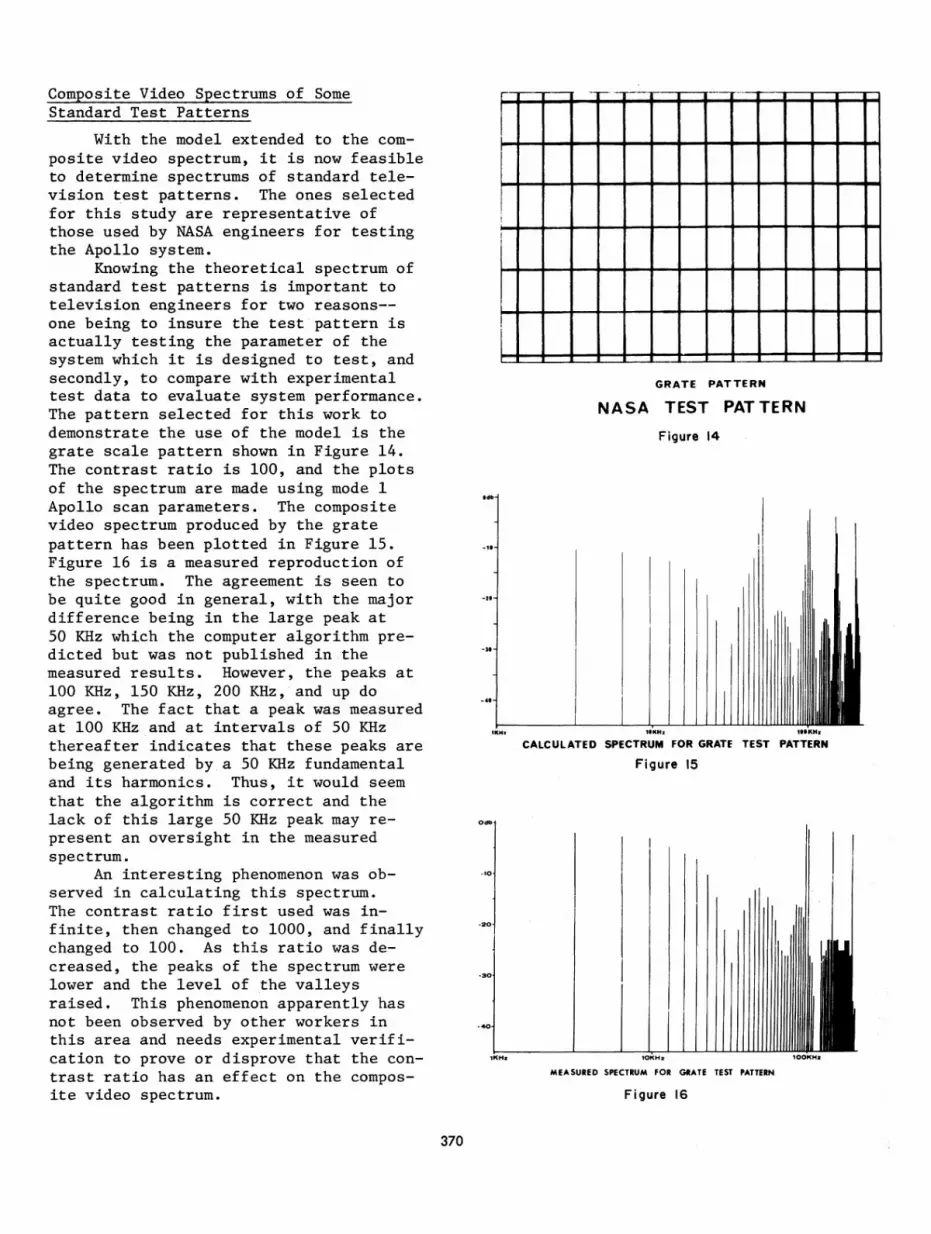
With the model extended to the com-posite video spectrum, it is now feasibleto determine spectrums of standard tele-vision test patterns. The ones selectedfor this study are representative ofthose used by NASA engineers for testingthe Apollo system.
Knowing the theoretical spectrum ofstandard test patterns is important totelevision engineers for two reasons--one being to insure the test pattern isactually testing the parameter of thesystem which it is designed to test, andsecondly, to compare with experimentaltest data to evaluate system performance.The pattern selected for this work todemonstrate the use of the model is thegrate scale pattern shown in Figure 14.The contrast ratio is 100, and the plotsof the spectrum are made using mode 1Apollo scan parameters. The compositevideo spectrum produced by the gratepattern has been plotted in Figure 15.Figure 16 is a measured reproduction ofthe spectrum. The agreement is seen tobe quite good in general, with the majordifference being in the large peak at50 KHz which the computer algorithm pre-dicted but was not published in-themeasured results. However, the peaks at100 KHz, 150 KHz, 200 KHz, and up doagree. The fact that a peak was measuredat 100 KHz and at intervals of 50 KHzthereafter indicates that these peaks arebeing generated by a 50 KHz fundamentaland its harmonics. Thus, it would seemthat the algorithm is correct and thelack of this large 50 KHz peak may re-present an oversight in the measuredspectrum.
An interesting phenomenon was ob-served in calculating this spectrum.The contrast ratio first used was in-finite, then changed to 1000, and finallychanged to 100. As this ratio was de-creased, the peaks of the spectrum werelower and the level of the valleysraised. This phenomenon apparently hasnot been observed by other workers inthis area and needs experimental verifi-cation to prove or disprove that the con-trast ratio has an effect on the compos-ite video spectrum.
GRATE PATTERN
NASA TEST PATTERN
Figure 14
CALCULATED SPECTRUM FOR GRATE TEST PATTERN
Figure 15
MEASURED SPECTRUM FOR GRATE TEST PATTERN
Figure 16
370

Appendix 1:
A mathematical model for a deter-ministic composite video signal has beenpresented and- the resulting spectrumexamined. The most difficult problem in-volved in using the model was obtainingthe spectrum of the scanned video signal.This problem was solved by applying themethods of numerical analysis to thetheory of scanning developed by Mertzand Gray and extending this theory to in--clude blanking. The resulting computerprogram will obtain the composite videospectrum resulting from scanning anygeneral image.
Obtaining the spectrum of the com-posite video signal was only half of theproblem, however. The related problemof specifying the necessary bandwidthfor a television system was discussed.The, conclusions concerning bandwidthwhich may be drawn are twofold. First,if the program material which the tele-vision system must transmit is known,then the methods of this work may be ap-plied to this material and the resultingspectrums will determine the necessarysystem bandwidth. The bandwidth deter-mined in this manner will be a muchbetter approximation than any of themethods presented in Part I. For exam-ple, if the only image to be transmittedis the half black and half white testpattern examined in Part II, then thenecessary system bandwidth would be onthe order 100 KHz. (Assuming Apollo mode1 scan parameters) This is approximatelyone-fourth of the bandwidth predicted byany of the methods in Part I. However,if the only specification concerning thebandwidth available is the maximumhorizontal resolution, then the standardmethods presented in Part I yield goodestimations of the maximum bandwidth.Even in this case, it is feasible to usethe methods of this work on probableimages and let the results serve as acheck on the standard methods.
An extension of this work to randomvideo processes would relieve the burdenof knowing the exact images to be trans-mitted. L. E. Franks of Bell TelephoneLaboratories has published a paper inthis area. [9]
A proof is herein derived for thefirst of the lemmas used in the text.The remaining proofs are similar and arederived in a report prepared for NASA[131.
Lemma I
2N-1 2M-1 N-1 M-1
I I I I b sin ( xk + M Y
x=O y=O k=O Q=O
Cos (w X + m y) =O
Proof:
S = I I I I bkg sin (r x +k Y)x y k b
Cos ( - X + m y)
Expanding by trig. identities
S = I I I I b (sin Nrk x cosT9,
x y k Q7Tk TrQ
+ cos N x sin M y)
(co s NP x sin 2e y
- sin 7TP x sin rq y)N N
Carrying out the indicated multiplication
irfk mQ9, 2E
S = I I I I bkc sin N x cos M cos N x
x y k Q
cos y -
371
CONCLUSION

r~ ~b ikrs in. !PrTQ
L LL bk slnNxs N x cos -
x y k Qi yqsi Y
X sinMif Y cos -Pxx y k Q
cos y -N
vrrv Trk ,TIQ lTrI I L L bk Cos Nx sin M sin 1-xx y k Q
sinT
y
and by rearranging
2M-1
S = IN-1 M-1
I bkTrkcs MqCos - y COS ~F y
y=O k=O Q=O
2M-1 N-1 M-1
L L L bkZsiLn Y sinM Yy=O k=O Q=O
2N-1
L sin N x cos N xx=O
but it is known that (12)
2i-17T. 7TI sinijz cos-.hz = O
z=O
(A)
Thus applying this theorem to each of thesingle series above S becomes, S = 0
2N-lTrk ffp
L sin N -x cos - x
x=O
QED
REFERENCES2N-1 M-1 M-1
I I I b sin N x sin N xL£ k9k N Nx=O k=O ¢ =O
2M-1
I cos MC y sin y +y=O
1. Stanley Lebar and Charles Hoffman,"TV Show of the Century", Electronics,March 6, 1967.
2. R.C. Brainard, "Subjective Evaluationof PCM Noise-Feedback Coder forTelevision", Proceedings of I.E.E.E,March, 1967.
2N-1 N-1 M-1
x=O k=O Q=0
b cos N xco-N xk,N N
3. W.W. Harman, Principles of theStatistical Theory of Communications,McGraw Hill, New York, 1961, pp. 115-116.
Cosq ysiLLTry-cos nMY4. John Hancock, The Principles of
Communication Theory, McGraw Hill,New York, 1961, pp. 175-176.
372
2M-1
y=O

5. V.K. Zworykin and G.A. Morton,Television, John Wiley & Sons, Inc.,New York, 1954, pp. 184-185.
6. Glenn M. Glasford, Fundamentals ofTelevision Engineering, McGraw Hill,New York, 1955, Chapter 2.
7. Jacob Millman and Herbert Taub,Pulse and Digital Circuits, McGrawHill, New York, 1956, p. 66.
8. Harold A. Wheeler and Authur V.Loughren, "Fine Structure of Tele-vision Images", Proceedings of I.R.E.May, 1938.
9. L.E. Franks, "A Model for the RandomVideo Process", Bell System TechnicalJournal, April, 1966.
10. J.B. Chatten, R.G. Clapp, and D.G.Fink, "The Composite Video Signal --Waveforms and Spectrum", I.R.E.Transactions on Broadcast andTelevision Receivers, July, 1955.
11. Pierre Mertz and Frank Gray, "ATheory of Scanning", Bell SystemTechnical Journal, July, 1934.
12. R.W. Hamming, Numerical Methods forScientists and Engineers, Chapter6, McGraw Hill, New York, 1962.
13. Frank Carden, William Osborne, andGeorge Davis, "Advanced Study ofVideo Signal Processing in LowSignal to Noise Environments", NASAResearch Grant NGR-32-003-037. AReport by Engineering ExperimentStation, New Mexico State University,December, 1967.
373

BIOGRAPHIES
Frank F. Carden was born in Abilene, Texas onMarch 15, 1932. He received his B.S. degree in Elec-trical Engineering from Lamar State College of Tech-nology, Beaumont, Texas in 1959, and he received thePh.D. from Oklahoma State University, Stillwater,Oklahoma in 1965.
Mr. Carden has worked as a research engineer atTexas Instruments in the area of anti-radiation missile,and he has worked for NASA as a NASA-ASEE sum-mer fellow.
He is currently Professor and Head of the ElectricalEngineering Department at New Mexico State Univer-sity and the director of the Communication ResearchGroup in the Electrical Engineering Department. Mr.Carden is a consultant for White Sands Missile Rangein the area of communication systems.
Dr. Carden is a member of Eta Kappa Nu andIEEE.
Alton L. Gilbert (S'68) was born in Elmira, NewYork on April 13, 1942. He received the B.S.E.E. de-gree (with high honors) from New Mexico State Uni-versity in 1970. Since June 1969 he has been associatedwith the Communications Research Group at NewMexico State University, and has undertaken researchin communications with two previous papers pub-lished in this area. He is the 1970-71 IEEE FortescueFellow and is doing graduate work at New MexicoState University.
Mr. Gilbert is a member of Sigma Xi, Phi KappaPhi, Eta Kappa Nu, and Sigma Tau.
William P. Osborne (S'65-M'70) was born in Ben-ton, Kentucky on February 2, 1944. He received theB.S.E.E. and M.S.E.E. degrees from the University ofKentucky, Lexington, Kentucky in 1966 and 1968 re-spectively, and the Sc.D. degree from New MexicoState University, Las Cruces, New Mexico in 1970.
During the summer of 1966, he worked for CollinsRadio Company in Cedar Rapids, Iowa. From 1967to 1970, he was employed by the Communications Re-search Group at New Mexico State University. SinceJanuary of 1970, he has been employed with theSystems Division of Radiation, Inc.,. in Melbourne,Florida. His principal interests are in stochastic sys-tems.
Dr. Osborne is a member of Eta Kappa Nu andSigma Xi.
374


