Embed Size (px)
Citation preview
1
Discovery of very large amplitude whistler-mode waves in Earth’s
radiation belts
C. Cattell1, J. R. Wygant1, K. Goetz1, K. Kersten1, P. J. Kellogg1, T. von Rosenvinge 2,
S. D. Bale3,4, I. Roth3, M. Temerin3, M. K. Hudson5, R. A. Mewaldt6, M. Wiedenbeck7,
M. Maksimovic8, R. Ergun9, M. Acuna 2, C. T. Russell10
Abstract. During a passage through the Earth’s dawn-side outer radiation belt, whistler-
mode waves with amplitudes up to more than ~240 mV/m were observed by the Time
Domain Sampler of the STEREO S/Waves instrument. These waves are an order of
magnitude larger than previously been observed for whistlers in the radiation belt.
Although the peak frequency is similar to whistler chorus, there are distinct differences
1 School of Physics and Astronomy, University of Minnesota, 116 Church St. SE,
Minneapolis, MN 55455, USA. 2NASA, Goddard Space Flight Center, Greenbelt, MD,
USA 20771. 3Space Sciences Laboratory, University of California, Berkeley, Berkeley,
CA 94720, USA. 4Dept. of Physics, University of California, Berkeley, CA 94720,
USA. 5Dept. of Physics, Dartmouth College, Hanover NH, 03755, USA. 6Downs
Laboratory, California Institute of Technology, Pasadena, CA 91125 USA. 7Jet
Propulsion Laboratory, California Institute of Technology, Pasadena, CA 91109 USA.
8LESIA, UMR CNRS 8109, Observatoire de Paris, 92195 Meudon, France.
9Laboratory for Atmospheric and Space Physics, University of Colorado, Boulder, CO
USA. 10Institute for Geophysics and Planetary Physics, University of California, Los
Angeles, CA USA.
2
from chorus, in addition to the larger amplitudes, including the lack of drift in frequency
and the oblique propagation with a large longitudinal electric field component.
Simulations show that these large amplitude waves can energize an electron by ther
order of an MeV in less than 0.1s, explaining the rapid enhancement in electron
intensities observed between the STEREO-B and STEREO-A passage during this event.
Our results show that the usual theoretical models of electron energization and
scattering via small-amplitude waves, with timescales of hours to days, are inadequate
for understanding radiation belt dynamics.
It has long been known that the Earth’s magnetosphere is an extremely efficient
accelerator of relativistic particles that make up the Van Allen radiation belts. The
mechanisms via which this acceleration occurs, however, remain a source of
controversy and processes occurring on a variety of timescales have been proposed. The
radiation belts consist of an inner belt at ~1.5 Re (Earth radii) and a more dynamic outer
belt at ~4 Re , both trapped on Earth’s dipole magnetic field lines. The trapped particles
gyrate around the geomagnetic field, bounce between the northern and southern
hemispheres and drift around the Earth. For a 1 MeV electron in the outer belts, the
timescales for these motions are approximately 0.0001s, 0.5s and 3000s. Energization
and/or scattering can occur when electric and/or magnetic fields vary on timescales that
are shorter than, but comparable to, one of these scales. Although whistler-mode
electromagnetic waves have long been invoked as a mechanism for loss of electrons
from the radiation belts (Kennel and Petschek, 1966), it is only recently that their role in
electron energization has been evaluated (Roth et al.,1999) and compared to other
acceleration mechanisms such as radial diffusion (Schulz and Lanzerotti, 1974).

3
Acceleration of electrons by low amplitude whistler-mode ‘chorus’ waves is currently
accepted to be an important process in the outer belt (Summers et al. 1998; Roth et al.,
1999; Summers and Ma, 2000; Meredith et al, 2001; Horne and Thorne, 2003; Horne et
al., 2005b). Theoretical studies of both loss and acceleration mechanisms usually
assume that the whistler waves are low amplitude and that acceleration occurs via
multiple stochastic interactions with a large number of uncorrelated wave packets, so
that the quasi-linear approach can be utilized. The assumption of small amplitudes is
consistent with statistical studies of the waves (Meredith et al, 2001; Horne et al.,
2005b). Because plasma waves in space have traditionally been observed using
instruments which measure in the frequency domain and which often have time
resolutions long compared to the time scales over which wave amplitudes vary, studies
of existing databases may have underestimated the occurrence of large amplitude
waves. This problem is intensified in studies that examined long-time or large-spatial
averages or used instruments that saturate at low amplitudes. The largest whistler
amplitudes reported to date (~30 mV/m) were observed by the Cluster spacecraft using
an instrument designed to capture waveforms, enabling examination of rapidly varying
amplitudes (Santolik et al.,2003). Very few samples have been obtained from this type
of instrument in the Van Allen belts. To understand the role of whistlers in radiation belt
dynamics, it is necessary to determine how often large amplitude waves occur, the wave
properties and how their effects compare to those resulting from lower amplitude
whistlers.
The two-spacecraft STEREO mission (Kaiser,2005) had four encounters with
Earth’s radiation belts during the orbit insertion phase. The Dec. 12, 2006 encounter
provides a unique view of the Van Allen belts because it is the only time that two
4
identically instrumented satellites have passed through this important region on near-
identical orbital paths with a short (~1.6 hour) delay, and because an explosive
energy release process called a ‘magnetospheric substorm’ occurred between the
times of the two passes. The STEREO S/WAVES instrument (Bougeret, et al., 2007)
comprises three orthogonal 6m monopole antennas with electronics that provide
frequency domain measurements of the electric field up to 16 MHz and waveform
measurements using the TDS, which is designed to capture in high time resolution
the largest amplitude waves. For this interval, the TDS sample length was 0.52s and
the sample rate was 32 ksamples/s. Note that the largest amplitude occurs
approximately in the center due to TDS trigger algorithm. The antenna response and
effective boom lengths are discussed by Bale et al. (2007). Effective boom lengths
(and therefore wave amplitudes) are accurate to ~ 25%.
During the passage through the morning-side outer radiation belt, the
S/WAVES Time Domain Sampler (TDS) on STEREO-B, the second satellite to
traverse the region, obtained twenty-four waveform samples, between ~1120 and
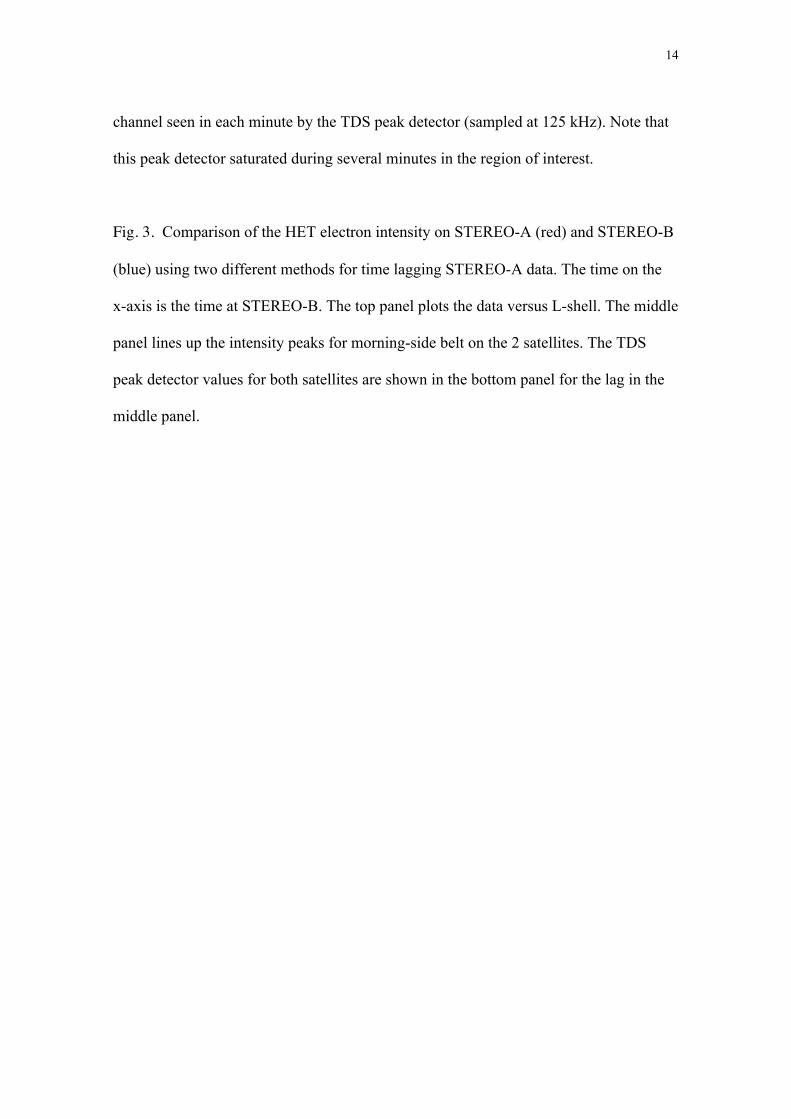
1124 UT, with very large amplitude whistler-mode waves. Figure 1 shows an
example of one sample with a peak electric field amplitude >200 mV/m, an order of
magnitude larger than any previously reported in the radiation belts. For the twenty-
four samples, the observed maximum amplitudes ranged from ~100 mV/m to ~240
mV/m, but were occasionally larger as indicated by the saturation of the instrument
during some samples. The whistler waves occurred in packets with a range of packet
shapes and durations (on the order of ~0.01 to .1 s). Based on the average packet
length, TDS sample duration and the latency in the TDS sampling, one can estimate
that waves larger than ~100 mV/m occurred from ~1% to 4% of the time. For all the
5
TDS samples, the frequency at peak power was ~0.2 fce, the electron cyclotron
frequency, with multiple harmonics of the primary frequency. The electric field in the
first harmonic was down by ~5-10 dB (a factor of ~2-5 in electric field) and the
second harmonic was down by 20-25 dB. The hodogram (D) shows the effect of the
multiple harmonics, as well as the propagation oblique to the geomagnetic field. The
waves are right-hand polarized, consistent with the whistler mode.
Figure 2 shows that the largest wave amplitudes during this event occurred
within the inner (low L) region of the outer radiation belt on the morning-side. Due to
data rate limitations, the TDS keeps in memory the largest amplitude wave events for
transmission; thus, the regions where TDS samples are obtained are the regions with the
largest amplitude waves. Although TDS samples were obtained only during the interval
between ~1120 and 1124, the spectral and peak detector data indicate that the large
amplitude whistler waves occurred from ~1105-1125, with less intense whistlers from
~10:45-10:49, covering the spatial region from L ~3.5 to 4.8 over local times from ~2 to
~3:45. The intense waves occurred during the recovery phase of a large substorm, as
revealed by the AE index which reached a peak value of ~800 nT at ~10:50 UT, when a
brief substorm injection of energetic electrons (~50-200 keV) was observed at
geosynchronous orbit (6.6 Re) by two Los Alamos National Laboratory satellites (data
provided by Benoit Lavraud). It is generally accepted that, as these injected electrons
drift dawnward due to magnetic field gradient and curvature drifts, they provide the
energy source to drive whistler-mode waves.
Using the cold plasma dispersion relation (Stix,1992), the phase velocity and
magnetic field fluctuation amplitude, δB, for the waves can be estimated from the
electric field in minimum variance coordinates. The waves are very oblique with the
6
propagation angle with respect to the geomagnetic field ranging from ~45°-60°.
Estimates of the phase velocity of ~35,000-70,000 km/s and δB~0.5-2 nT are obtained
for a density of 2-5/cm3 (estimated from the spacecraft potential) and measured
geomagnetic field of 300-350 nT. The longitudinal electric field is the largest
component, indicating that the waves were partly electrostatic, consistent with
propagation near the resonance cone (resonance cone angle is ~77°). These results are
also consistent with warm plasma dispersion calculations. Both the measurements and
the warm dispersion results show that there is a component of the electric field parallel
to the geomagnetic field on the order of 10% of the total field.
In addition to the larger amplitudes, there are other distinctions between these
observations and previously published studies of whistler-mode waves in the radiation
belts. The whistler ‘chorus’ waves in the lower band (below 0.5 fce) propagate parallel
to the magnetic field (within ~10°) and are highly dispersive, usually with rising tones
(increasing frequencies) (Goldstein and Tsurutani, 1984; Hayakawa et al., 1984). In
contrast, the waves described herein are very monochromatic with frequency at peak
power of ~0.2 fce throughout the 4 minute interval with waveform samples and the ~30
minutes when whistlers were seen in the spectrum in Figure 1. The waves were
obliquely propagating and had a large longitudinal (electrostatic) component of the
electric field. The differences suggest that these very large amplitude whistlers represent
a new instability mechanism that is different from that for the typical lower amplitude
‘chorus’ whistler waves.
We have performed test particle simulations for the wave parameters observed
by STEREO, utilizing a code developed to look at electron interactions with a single
constant amplitude, obliquely propagating whistler wave (Roth et al., 1999). Results
7
show that the observed waves can have dramatic effects on energetic particles.
Electrons can gain ~0.1 to 4 MeV in a single wave encounter (the order of tens of ms).
Scattering by angles of ~2° to 40° also occurs. These values are one to three orders of
magnitude larger than those for the ~1 mV/m (or smaller) amplitudes typically assumed
in radiation belt studies. The larger amplitudes can trap electrons over a broader energy
range. In contrast to parallel-propagating whistlers, for which only the lowest order
resonant interaction is effective, for obliquely propagating waves, higher order resonant
interactions can occur, and more electrons can be resonant (Kennel, 1966). Although the
simulation assumes constant amplitude waves, the shorter duration of the observed
wave packets may not affect the process because the interactions occur on such short
times. Packets with peak amplitudes of 100 mV/m or larger were observed ~1-4% of the
time for ~25 minutes, so electrons could encounter and resonate with many large
amplitude packets. The energy gains we observe are also consistent with those observed
in a nonlinear acceleration mechanism associated with particle trapping that resulted in
energy gains of ~0.5 MeV in ~1s for waves with amplitudes of tens of mV/m (Omura et
al., 2007). The amplitudes required for the trapping are 1 to 2 orders of magnitude
lower than seen in the STEREO data, while the energy gain in a single interaction scales
as the wave amplitude. Thus, simulations show that waves with the observed amplitudes
can energize electrons by up to several MeV in short times (fractions of a second).
STEREO-A led STEREO-B by ~1.6 hours in the radiation belt traversal, and the
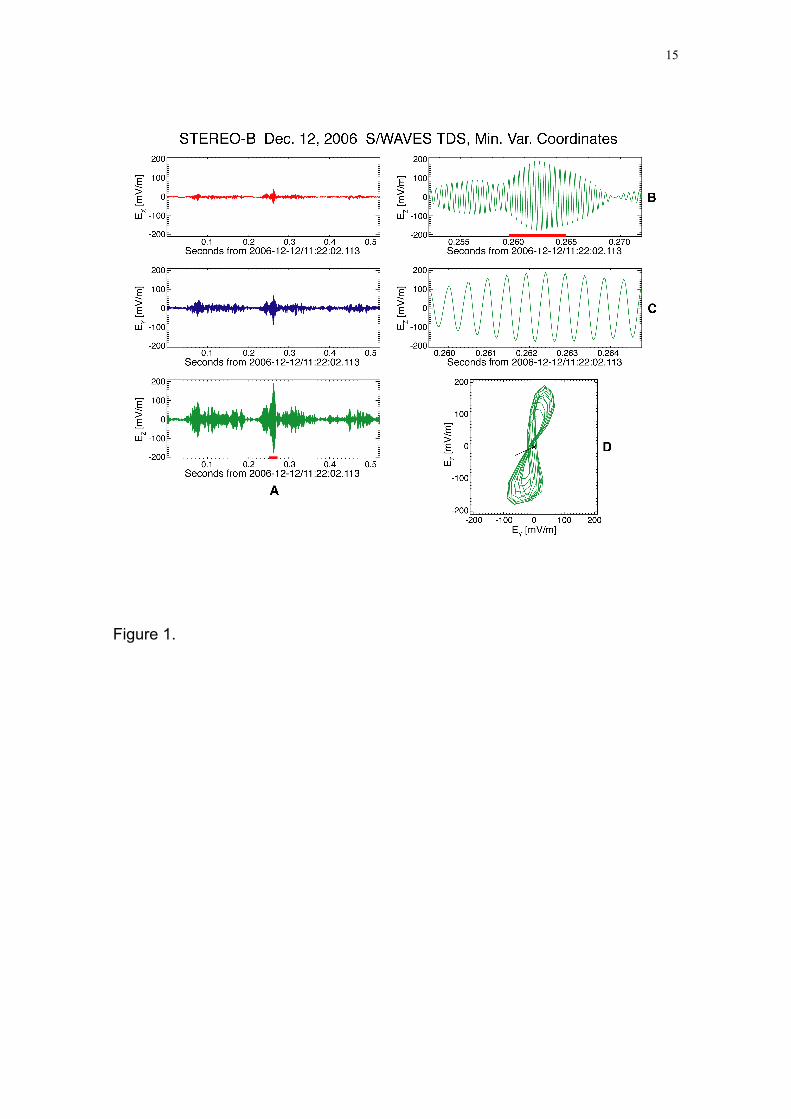
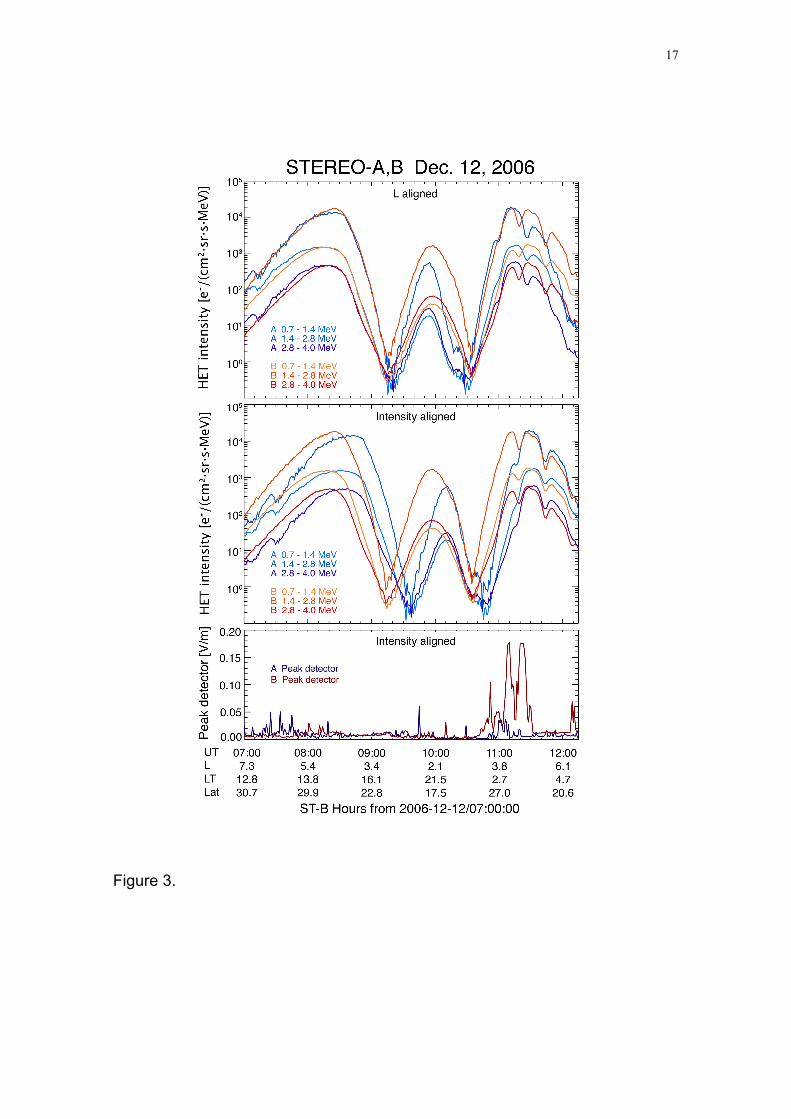
STEREO-A observations were obtained during a period of geomagnetic quiet. The top
panel of Figure 3 shows that the MeV electron intensities seen by the two satellites were
almost identical in the initial (afternoon) traversal of the outer belt, when the
observations are plotted versus L-shell, demonstrating that the outer belt did not change
8
during the ~1.6 hours between the two encounters. The inner belt intensities were
somewhat higher when observed by STEREO-B, but the peak location was not changed.
However, at the morning-side outer belt, there is no clear correlation between the
features seen by the two satellites and the radiation belt has a broader extent in L and
generally higher fluxes on STEREO-B. The middle panel, in which the intensity peaks
for the morning-side belt on the two satellites are aligned, there is a good correlation
between the two peaks seen by STEREO-A and the two outer peaks seen by STEREO-
B. In addition, there is a new region of enhanced MeV electron intensity at the low-L
side of the radiation belt on STEREO-B. Because there was a substorm between the
passage of STEREO-A and STEREO-B through the radiation belt, the geomagnetic
field dipolarized and thus a given magnetic flux tube was closer to Earth during the
passages of STEREO-B. This is consistent with the shift used in the middle panel. The
peak detector values for both satellites are shown in the bottom panel and indicate that
no intense waves occurred during the STEREO-A encounter with the radiation belts.
The differences seen by the two satellites are consistent with a picture in which the
substorm-injected fresh electrons, with energies of ~1-100 keV, excited large amplitude
whistlers that energized electrons to produce the enhanced intensity of MeV electrons
on a time-scale on the order of 10 minutes. The large amplitude, obliquely propagating
waves resulted in energization on time-scales much shorter than the ~1 day expected
from quasi-linear models of whistler interactions (Horne et al., 2003).
The measurements of large amplitude waves and enhanced intensity of
electrons occurred within a solar wind high-speed stream. The solar wind conditions
were relatively constant throughout the day, as observed by ACE, with speeds of
~650-700 km/s and density of ~2/cm3, typical of a high-speed stream. Thus, the
9
STEREO observations are consistent with studies correlating enhanced fluxes with
high speed streams (Paulikas and Blake,1979). Although the observations occurred
after a substorm injection, it was a weak and short-lived injection compared to those
typically observed. In addition, these waves did not occur during a magnetic storm.
Given the much more dramatic changes in the radiation belts seen during storms and
that much larger substorm injections are observed, it is likely that waves of
comparable amplitude are not unusual and that even larger amplitude whistler waves
may occur. The discovery of these waves was enabled by the TDS instrument, which
makes time domain measurements of the full 3d electric field with a very large
dynamic range. These new observations suggest that the standard quasi-linear
approach to studies of energization and scattering may not be adequate to understand
radiation belt dynamics because the large amplitude waves generate nonlinear effects,
including trapping, resulting in energization or scattering loss in one wave packet
encounter. Corroborating evidence of rapid (<1s) scattering is provided by
observations of short-time scale variations in loss rates (‘microbursts’) of MeV
electrons (Blake et al., 1996).
REFERENCES
Bale, S. D. et al., The electric antennas for the STEREO/WAVES experiment, in press,
Space Sci. Rev. (2007).
Blake, J. B. et al., New high temporal and spatial measurements by SAMPEX of the
precipitation of relativistic electrons, Adv. Space Res. 18(8), 171 (1996).
10
J. L. Bougeret, J. L. et al., S/Waves: The Radio and Plasma Wave Investigation on the
STEREO Mission, in press, Space Sci. Rev. (2007).
Goldstein, B. E. and B. T. Tsurutani, Wave normal directions of chorus near the
equatorial source region, J. Geophys. Res. 89, 2789–2810 (1984).
Hayakawa, M., Y. Yamanaka, M. Parrot, F. Lefeuvre, The wave normals of
magnetospheric chorus emissions observed on board GEOS 2, J. Geophys. Res. 89,
2811– 2821(1984).
Horne R. B., R. M. Thorne, 2003, Relativistic electron acceleration and precipitation
during resonant interactions with whistler-mode chorus, Geophys. Res. Lett., 30 (10),
1527, doi:10.1029/2003GL016973.
Horne, R. B., S. A. Glauert, R. M. Thorne, Resonant diffusion of radiation belt electrons
by whistler-mode chorus, Geophys. Res. Lett. 30, 1493,
doi:10.1029/2003GL016963 (2003).
R. B. Horne, et al., Wave acceleration of electrons in the Van Allen radiation belts,
Nature 437, doi:10.1038/nature03939 (2005a).
R. B. Horne, et al., Timescale for radiation belt electron acceleration by whistler mode
chorus waves, J. Geophys. Res. 110, doi:10.1029/2004JA010811 (2005b).
11
Kaiser, M. L. , The STEREO Mission: an Overview, Adv. Space Res. 36(8), 1483-
1488 (2005).
Kennel, C. F. and H. E. Petschek, Limit on stably trapped particle fluxes, J.
Geophys. Res. 71, 1 (1966).
Kennel, C. F., Low frequency whistler mode, Phys. Fluids 9, 2190 (1966).
Luhmann, J. et al., STEREO IMPACT Investigation Goals, Measurements, and
Observations Overview, Space Sci. Rev., 2007.
N. P. Meredith, et al., Evidence for acceleration of outer zone electrons by whistler
mode chorus, Ann. Geophysicae, 20, 967-979 (2002).
N. P. Meredith, R. B. Horne, R. R. Anderson, Substorm dependence of chorus
amplitudes: Implications for the acceleration of electrons to relativistic energies, J.
Geophys. Res. 106, 13,165–13,178, (2001).
Omura, Y., Y. Furuya, D. Summers, Relativistic turning acceleration of resonant
electrons by coherent whistler-mode waves in a dipole magnetic field, J. Geophys.
Res., pip-on-line, (2007).
Paulikas, G. A., J. B. Blake, Effects of the solar wind on magnetospheric dynamics:
Energetic electrons at the synchronous orbit, in Quantitative Modeling of
Magnetospheric Processes, Geophys. Monogr. Ser., vol. 21, edited by W. P. Olson, p.
12
180, AGU, Washington, D. C. (1979).
Roth, I., M. Temerin, M. K. Hudson, Resonant enhancement of relativistic electrons
during geomagnetically active periods, Ann. Geophysicae 17, 631-638 (1999).
O. Santolik, D.A. Gurnett, J. S. Pickett, M. Parrot, N. Cornilleau-Wehrlin, Spatio-
temporal structure of storm-time chorus, J. Geophys. Res. 108
doi:10.1029/2002JA009791 (2003).
M. Schulz, L. J. Lanzerotti, Particle Diffusion in the Radiation Belts (Springer-Verlag,
New York, 1974).
Stix, T. H., Waves in Plasmas (American Institute of Physics, New York, 1992).
Summers, D., R. M. Thorne and F. Xiao, Relativistic theory of wave-particle
resonant diffusion with application to electron acceleration in the magnetosphere},
J.Geophys. Res., 103, 20,487, 1998.
Summers, D. and C.-Y Ma, A model for generating relativistic electrons in the
earth's inner magnetosphere based on gyroresonant wave-particle interactions, J.
Geophys. Res., 105, 2625, 2000.
Acknowledgements: We thank J. Dombeck (UM) and P. Schroeder (UCB) for
programming assistance, and B. Lavraud for providing LANL data. ACE plasma data,
courtesy D. J. McComas, and magnetic field data, courtesy N. Ness, were obtained
13
through the CDAWEB, and AE, through World Data Center for Geomagnetism, Kyoto.
This work was supported by NASA through the Solar Terrestrial Probes and Living
With A Star programs. Test particle simulations were performed at the University of
Minnesota Supercomputing Institute for Digital Simulation and Advanced Computation.
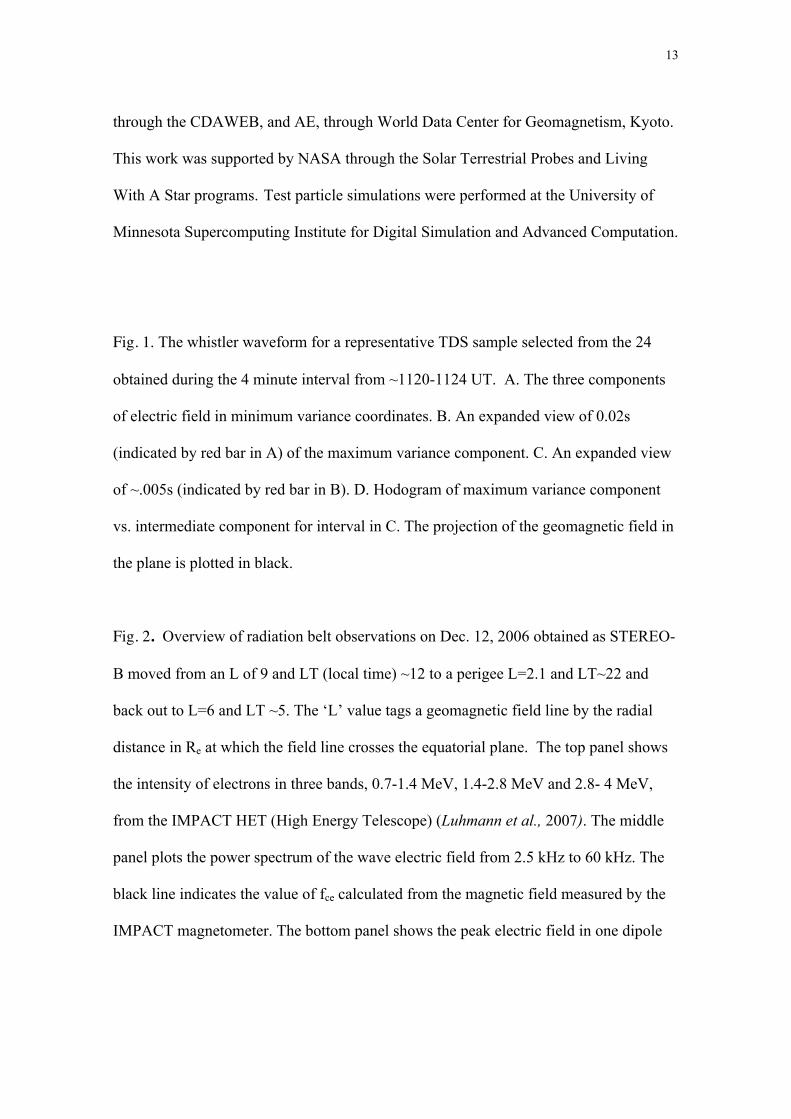
Fig. 1. The whistler waveform for a representative TDS sample selected from the 24
obtained during the 4 minute interval from ~1120-1124 UT. A. The three components
of electric field in minimum variance coordinates. B. An expanded view of 0.02s
(indicated by red bar in A) of the maximum variance component. C. An expanded view
of ~.005s (indicated by red bar in B). D. Hodogram of maximum variance component
vs. intermediate component for interval in C. The projection of the geomagnetic field in
the plane is plotted in black.
Fig. 2. Overview of radiation belt observations on Dec. 12, 2006 obtained as STEREO-
B moved from an L of 9 and LT (local time) ~12 to a perigee L=2.1 and LT~22 and
back out to L=6 and LT ~5. The ‘L’ value tags a geomagnetic field line by the radial
distance in Re at which the field line crosses the equatorial plane. The top panel shows
the intensity of electrons in three bands, 0.7-1.4 MeV, 1.4-2.8 MeV and 2.8- 4 MeV,
from the IMPACT HET (High Energy Telescope) (Luhmann et al., 2007). The middle
panel plots the power spectrum of the wave electric field from 2.5 kHz to 60 kHz. The
black line indicates the value of fce calculated from the magnetic field measured by the
IMPACT magnetometer. The bottom panel shows the peak electric field in one dipole
14
channel seen in each minute by the TDS peak detector (sampled at 125 kHz). Note that
this peak detector saturated during several minutes in the region of interest.
Fig. 3. Comparison of the HET electron intensity on STEREO-A (red) and STEREO-B
(blue) using two different methods for time lagging STEREO-A data. The time on the
x-axis is the time at STEREO-B. The top panel plots the data versus L-shell. The middle
panel lines up the intensity peaks for morning-side belt on the 2 satellites. The TDS
peak detector values for both satellites are shown in the bottom panel for the lag in the
middle panel.
15
Figure 1.

16
Figure 2.
17
Figure 3.


