Embed Size (px)
Citation preview

1
Direct-fired biomass power in China
Sector development and investment outlook
Jorrit Gosens, PhD1
ABSTRACT
Chinese installations of biomass power have increased to circa 1 GW of additional capacity
annually in recent years. This paper provides an overview of the direct-fired biomass power
sector in China, including historical growth in installations, main market players, and support
policies. Further, we combine information from a number of sources to build a database
with detailed information on each of China’s direct-fired biomass power projects. We use
this database to describe technological and market trends, and to create a cash flow model
for a typical project. Without policy intervention, growth should be expected to stall.
Increasing fuel prices, local competition over biomass fuel resources, lower than expected
operational performance and a downturn in carbon markets have deteriorated the
investment outlook. In order to ensure reasonable profitability, the Feed-In-Tariff should be
increased, from the current level of 750 RMB/MWh, to between 800 and 850 RMB/MWh.
Profitability may also be helped with exceptions in corporate income tax or VAT. Where
possible, government organizations should help organize demand for the supply of heat.
Local rural energy bureaus may help organize supply networks for biomass fuels throughout
the country, in order to reduce seasonal fuel scarcity and price fluctuations
1Research Center for Eco-Environmental Sciences, Chinese Academy of Sciences. Contact: [email protected] or
cn.linkedin.com/in/jorritgosens/
2
1. Introduction
A key task in the global transition to sustainable economic growth is a shift towards more
sustainable forms of energy production. Governments around the world are working to
increase the share of renewables in their energy mix in order to reduce greenhouse gas
(GHG) emissions and mitigate potentially dangerous levels of climate change [1].
The challenge for emerging economies such as China is slightly different, because rapid
economic growth is precipitating strong increases in energy demand. Primary energy
demand in China more than doubled between 2000 and 2010, and China has become the
world’s largest emitter of GHG [2]. The production of electricity and heat is the biggest
contributor, estimated to account for circa 53 per cent of Chinese GHG emissions [2].
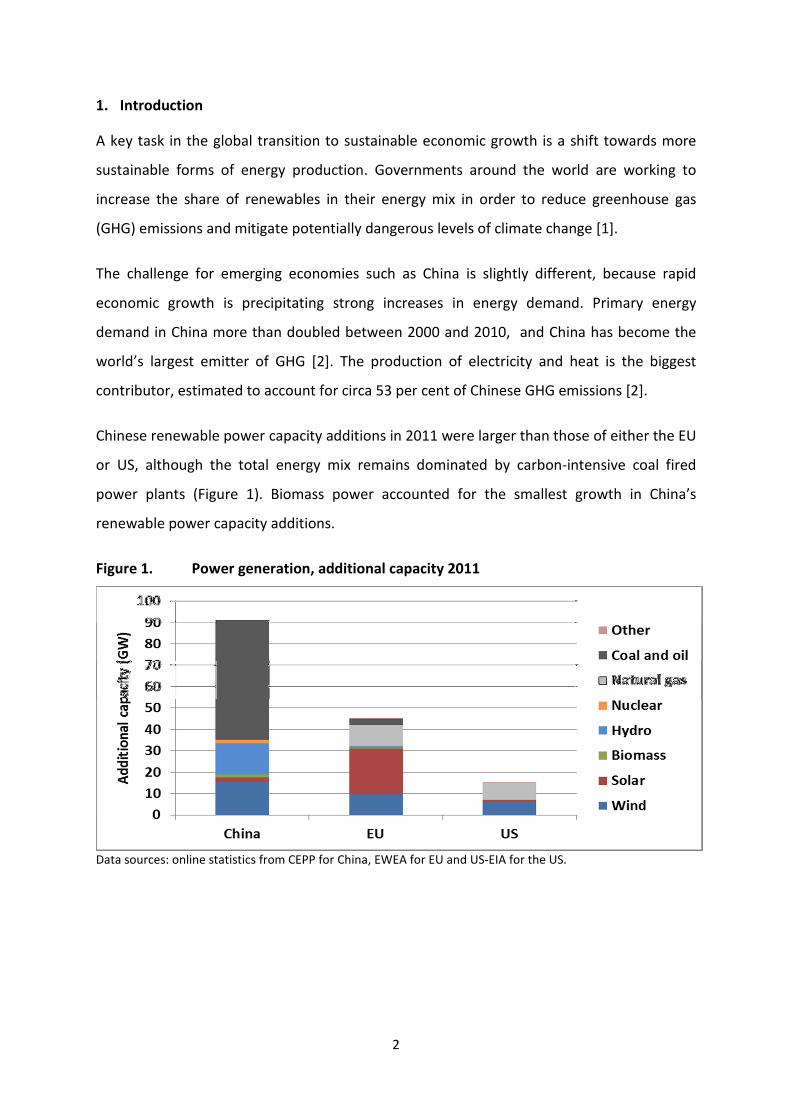
Chinese renewable power capacity additions in 2011 were larger than those of either the EU
or US, although the total energy mix remains dominated by carbon-intensive coal fired
power plants (Figure 1). Biomass power accounted for the smallest growth in China’s
renewable power capacity additions.
Power generation, additional capacity 2011 Figure 1.
Data sources: online statistics from CEPP for China, EWEA for EU and US-EIA for the US.
3
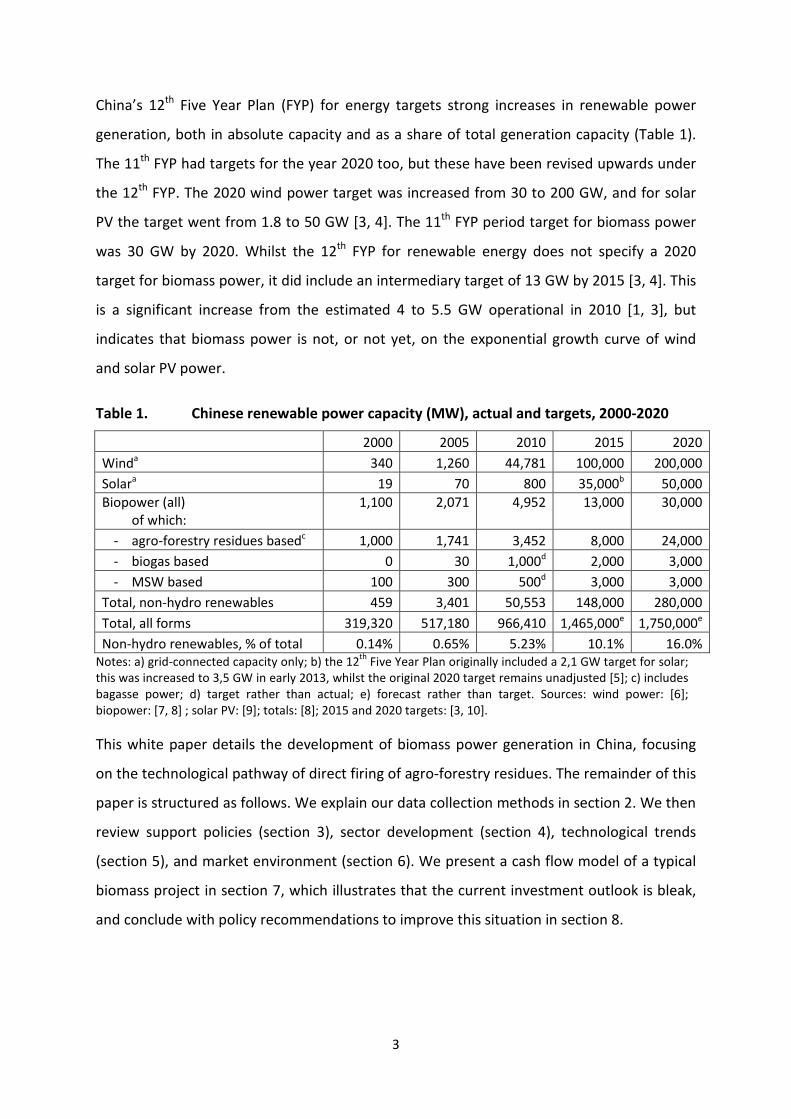
China’s 12th
Five Year Plan (FYP) for energy targets strong increases in renewable power
generation, both in absolute capacity and as a share of total generation capacity (Table 1).
The 11th
FYP had targets for the year 2020 too, but these have been revised upwards under
the 12th
FYP. The 2020 wind power target was increased from 30 to 200 GW, and for solar
PV the target went from 1.8 to 50 GW [3, 4]. The 11th
FYP period target for biomass power
was 30 GW by 2020. Whilst the 12th
FYP for renewable energy does not specify a 2020
target for biomass power, it did include an intermediary target of 13 GW by 2015 [3, 4]. This
is a significant increase from the estimated 4 to 5.5 GW operational in 2010 [1, 3], but
indicates that biomass power is not, or not yet, on the exponential growth curve of wind
and solar PV power.
Table 1. Chinese renewable power capacity (MW), actual and targets, 2000-2020
2000 2005 2010 2015 2020
Winda 340 1,260 44,781 100,000 200,000
Solara 19 70 800 35,000
b 50,000
Biopower (all)
of which:
1,100 2,071 4,952 13,000 30,000
- agro-forestry residues basedc 1,000 1,741 3,452 8,000 24,000
- biogas based 0 30 1,000d 2,000 3,000
- MSW based 100 300 500d 3,000 3,000
Total, non-hydro renewables 459 3,401 50,553 148,000 280,000
Total, all forms 319,320 517,180 966,410 1,465,000e 1,750,000
e
Non-hydro renewables, % of total 0.14% 0.65% 5.23% 10.1% 16.0%
Notes: a) grid-connected capacity only; b) the 12th
Five Year Plan originally included a 2,1 GW target for solar;
this was increased to 3,5 GW in early 2013, whilst the original 2020 target remains unadjusted [5]; c) includes
bagasse power; d) target rather than actual; e) forecast rather than target. Sources: wind power: [6];
biopower: [7, 8] ; solar PV: [9]; totals: [8]; 2015 and 2020 targets: [3, 10].
This white paper details the development of biomass power generation in China, focusing
on the technological pathway of direct firing of agro-forestry residues. The remainder of this
paper is structured as follows. We explain our data collection methods in section 2. We then
review support policies (section 3), sector development (section 4), technological trends
(section 5), and market environment (section 6). We present a cash flow model of a typical
biomass project in section 7, which illustrates that the current investment outlook is bleak,
and conclude with policy recommendations to improve this situation in section 8.
4
2. Method
We compiled a database of grid-connected biomass power projects in China. This database
was used for most of the graphs presented in this paper. Information was collected from the
following, overlapping, sources:
1. CDM project documents
A large majority of Chinese biopower projects applied for registration as a Clean
Development Mechanism (CDM) project. CDM applications include a ‘Project Design
Document’ (PDD), which describes the project in detail, and are publicly available via
the CDM registry [11]. From these, we extracted project info including location,
developer, capacity, boiler brand and technical specifications, construction cost,
estimated fuel consumption etc.
2. Government subsidy reports
The NDRC periodically reports on the power production and subsidies paid to
individual renewable energy projects [12]. These lists were used to verify which
projects were operational, since when, and how much power each produced.
3. Company reports and websites
The database was added to with an up to date project reference list, including
operational projects and those under construction, from DP Cleantech. Wuhan Kaidi,
China’s second largest boiler designer and biopower plant operator, has regular
updates available on its website. We further verified and added to our database with
annual reports and information available via websites of project developers and
boiler manufacturers.
Combined, these sources formed a database of 231 projects with a combined capacity of
5,970 MW. In many of the figures presented in this paper we will differentiate between
operational and planned projects. ‘Operational’ projects are those projects for which we
have been able to confirm that they have started to deliver power to the grid. ‘Planned’
projects, are either under construction, or have been announced in company reports or
CDM project applications.
5
3. Policy guidance and stimulus
The development of grid-connected renewable power generation in China has sped up in
particular since the introduction of the Renewable Energy Law in late 2005. This was a
comprehensive framework law; future development targets and financial mechanisms were
detailed shortly after, in particular in the ‘Medium and long term RE development plan’ [4]
and the ‘Regulations on renewable energy price and cost-sharing management’ [13].
Biomass power targets were set at 5.5 GW by 2010, 13 GW by 2015 and, initially, at 30 GW
by 2020 (see the full list of targets in Table 1).
Biomass power generation has been eligible for a feed-in tariff from January 2006 onwards.
Projects received 250 RMB/MWh on top of the ‘standard grid price’ [13]. This is the price for
power from de-sulfurized coal fired power plants, which is fixed at a government
determined level and differs between 262 and 494 RMB/MWh over different provinces [14].
Using provincial level prices and biomass capacity, the average grid price received was 415
RMB/MWh, excluding FIT, or 665 RMB/MWh including FIT [14, 15].
The FIT is awarded during the first 15 years of operation the project, the standard grid price
applies afterwards. Prices include 17% VAT [13]. Projects that had started operation prior to
January 2006 were not eligible for the FIT. Projects that co-fire more than 20% conventional
fuels have not been eligible either. It does not fit MOA’s policy agenda for sustainable rural
development, as ashes from co-fired plants cannot be returned to agricultural soils for
fertilization, increasing already problematic levels of chemical fertilizer use. A lack of
metering technology for establishing levels of co-firing has raised further concerns about
possible fraud with reported levels of biomass use and corresponding levels of FIT
requested [16]. Although a small number of installations were co-firing biomass resources
(about 30 MW by the end of 2008), these have switched back to fully coal fired, because of
a lack of fiscal incentives [16].
In 2010, the FIT was equalized over all provinces, and set at 750 RMB/MWh (total, not on
top of standard grid price) [17]. All projects eligible for the FIT introduced in 2006, including
existing projects, have been receiving the increased FIT [17, 18].

6
Regulations have also commented on the relationship between biomass resources and
biomass power projects. Larger projects enable the use of larger, more efficient turbines but
do require a larger collection area and transport distances for the biomass fuels. Considering
this, the optimum project scale has been suggested as between 12 and 30 MW [19, 20].
In order to prevent competition over biomass resources between different projects, it is
suggested to develop no more than one project in one county (the smallest unit in China’s
administrative hierarchy), or to develop no further projects in a 100 km radius of an
established project [20]. This implies an exclusive resource collection area with a radius of
50 km for each project, which has been suggested to be sufficient for a 30 MW project [21].
Policies have also addressed the need for compacted fuels (pellets or briquettes), including
the establishment of an infrastructure for fuel collection, processing and distribution [3, 4,
22]. Key points of China’s biomass power policies are presented in Table 2.
Table 2. Key points of Chinese policies for biomass power
2001 10th
Five Year Plan for the new and renewable energy industry [23]
• Support the development of biomass gasification projects and large biogas systems using
industrial wastewater and manure. No mention of power generation
2005 Renewable energy law [24]
• State council will set RE development targets, lower level governments will draft development
plans accordingly
• Compulsory grid connection and full purchase of renewable power, gas and heat
• Electricity surcharge for consumers to cover RE cost: initially set at 1 RMB/MWh in 2006; has
been 8 RMB since 2011 [14, 25]
2006 Renewable energy price and cost-sharing management [13]
• Renewable power pricing determined as 1) a price agreed in tendered concessions; or 2) feed-
in-tariff of 250 RMB/MWh on top of standard grid price. Concession prices may not exceed
standard FIT
• Co-firing projects not eligible if conventional fuels are more than 20% (by heating value) of the
fuel mix
2007 Medium and long term RE development plan [4]
2008 11th
Five year plan for Renewable Energy [10]
• By 2010, 10% of energy should come from renewables; by 2020 this should be 15%
• Renewable portfolio standard (RPS): power companies with more than 5GW of generation
capacity should have 3% of RE (excl. large hydro) by 2010 and 8% by 2020
• Biomass power target of 5.5 GW by 2010, with an annual power generation of 24 TWh.
• Biomass power target of 30 GW by 2020.
• Production of briquettes and pellets should reach 1 Mt by 2010 and 50 Mt by 2020

7
Table 2. Key points of Chinese policies for biomass power (continued)
2007 Agricultural bioenergy industry development plan (2007-2015) [22]
• Includes targets for household scale biogas, manure treatment plants and crop straw
gasification plants, but not biomass power
• Production of briquettes and pellets should reach 20 Mt by 2015
• Develop briquetting technology and establish pilot programmes for the organization of crop
straw collection, transport, storage and pre-processing. Improve crop cultivation practices and
integrate the industrial chain from farmers to power stations and biofuel refinery plant
2008 Strengthening the environmental impact assessment management of biomass power
generation projects [19]
• Suggests higher capacity turbines, in principle no smaller than 12 MW
• Environmental impact assessment must consider effects of collection, transportation and
storage of biomass fuel and other raw materials
• Projects must adhere to prevailing standards for emissions to air
2010 Management of the construction of biomass power generation projects [20]
• Consider the availability of biomass resources in planning of biomass power projects
• As a guiding principle, develop only one project per county or within a radius of 100 km
• As a guiding principle, no projects of a scale of more than 30 MW
2010 Improved pricing policy for agriculture and forestry biomass power [17]
• Feed-in-tariff (FIT) equalized nation-wide and set at 750 RMB/MWh
2012 12th
Five Year Plan for renewable energy [3]
• Biomass power target of 13 GW by 2015, with an annual power generation of 78 TWh. No 2020
target is specified.
• Production of briquettes and pellets should reach 10 Mt by 2015
2012 Improved pricing policy for power from waste incineration [26]
• Feed-in-tariff (FIT) of 650 RMB/MWh, with the energy content of MSW benchmarked at 280
kWh/t
8
4. Development of direct-fired biomass power in China
These are several different processes to use biomass resources to generate heat or
electricity. The most common processes are anaerobic digestion, gasification and direct
firing [16, 27]. Out of these three, the best developed technological pathway globally are
direct firing applications, responsible for circa 88% of biopower [1].
In China, too, direct firing has been the best developing technological pathway, in terms of
installed capacity [7]. Anaerobic digestion is used to provide cooking gas for an estimated 40
million households [28], and larger installations are in use on livestock farms and
wastewater treatment plants [28]. By the end of 2008, only 173 MW of biogas engines were
in use to produce electric power, with only 6 MW connected to the grid [16]. Gasification of
crop wastes, too, has been used to provide cooking gas to rural families, although the village
level gasifiers used for this process have proven difficult to maintain, and most have ceased
production [29]. In food and wood processing industries, waste streams such as rice husks
or sawdust have been gasified to cover in-house heat demand [16, 30]. By the end of 2008,
installed capacity is estimated to have been 68 MW [7], with only two multi-MW turbines
connected to the grid [16]. Below, we provide information on the development of installed
capacity of direct-fired forms of biopower, the main developers and the main turbine
manufacturers active in China.
4.1. Installed capacity
Historically, the largest form of direct-fired biopower in China has been bagasse power, i.e.,
using sugar cane scrap. By the end of the ‘80s, an estimated 800 MW of bagasse power was
in use [7]. This has grown to 1,700 MW in recent years, and it is expected to stay at this level
in the foreseeable future [7, 31]. The bulk of this bagasse power capacity is composed of
generators of several MW in size, and largely utilized to cover in-house electricity and heat
requirements [16, 32]. The 1,700 MW of bagasse power was in use before the enactment of
the ‘Renewable energy law’ of 2005 and the ‘Renewable energy price and cost-sharing
management’ of 2006 (Table 2). This means grid operators had no obligation to purchase
this power, nor is it eligible to receive FIT payments.
9
Since the enactment of these two policies, there has been a relatively rapid development of
direct-fired biomass power plants (as opposed to in-house industrial boilers). China’s first
biomass fired power station was opened in in December of 2006 in Shanxian, Shandong
Province. Growth has accelerated to circa 1 GW of additional capacity in recent years, and
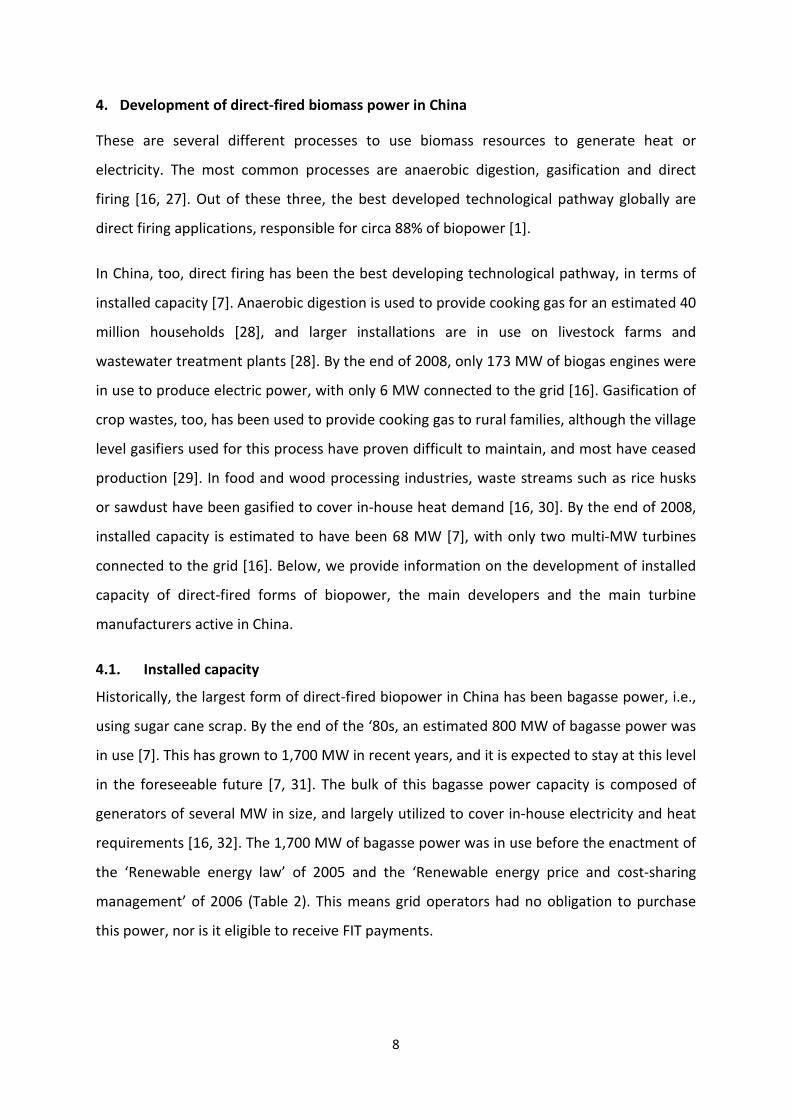
appears to be on track to meet the governments’ target of 8 GW by 2015 (Figure 2).
Direct-fired biomass power in China Figure 2.
Notes: grid-connected applications only; ‘Target’ is the 12
th FYP target for all forms of ‘agro-forestry residues
based biomass power’, including gasification and bagasse power. Source: [33]
4.2. Project developers
China’s first biomass power plant is developed and operated by the National Bio Energy Co.,
Ltd. (NBE; now part of the State Power Group Co., ltd). NBEs’ mission statement is to
develop environmentally friendly and socially responsible forms of energy supply. The
expansion of NBE’s operations was the main driver for market growth in the following few
years. By the end of 2009, NBEs’ power plants have a combined capacity of 564 MW, or
circa 63% of the 901 MW of biopower plants operational in China at the time. NBE remains
the market leader today, operating approximately one-third of all operational biopower
plants in China (Figure 3).
The second largest developer is Wuhan Kaidi Electric Power Co., ltd. (Kaidi). This company
has traditionally been engaged in the design and turn-key development of coal-fired power
plants. In recent years, it has specialized in environmental technologies related to power

10
generation, including clean coal technologies, flue gas desulphurization and MSW
incineration plants. In 2010, Kaidi opened its first biomass power station. By the end of 2013,
it had 19 plants with a combined capacity of 518 MW in (trial) operation, and another 26 in
the planning phase (Figure 3).
Only a small number of projects are operated by the so-called ‘Big 5’ (Figure 3). These five
power companies, CPI, Datang, Guodian, Huadian and Huaneng, are state-owned
enterprises of the central government. They are China’s largest utilities and collectively
operate 50 per cent of all of China’s power capacity [8]. These Big 5 are subject to a
renewable portfolio standard (Table 2), which can be fulfilled with any type of renewable
power. They have been very active in wind power, operating 58 % of Chinas’ 62.7 GW of
wind farms by the end of 2011 [6], as well as in more recent development of China’s large
scale solar PV projects. Interviewees indicated the preference of the Big 5 for wind or solar
projects was due the fact that these can be developed in larger project sizes, and because
wind speeds and solar radiation predictions were considered more predictable than the
biomass fuel supply and price predictions.
The remainder of projects are developed and operated by a very diverse group of state
owned and local utilities, operating between one and four projects each.
Operators of biopower plants in China Figure 3.
Data source:[15].
11
4.3. Boiler designers and manufacturers
NBE has relied on DP Cleantech for its boiler design and manufacture; the two companies
were in fact the two subsidiaries of a mutual parent company called Dragon Power Group
Co., Ltd. The technology used in NBE first power station in Shanxian was largely imported
from Danish boiler designer and manufacturers Bioener. In September 2009, DP Cleantech
acquired Bioener, which, amongst others, removed the need for licensing royalties with
future plants. Boiler manufacture was outsourced to China, to Jinan Boiler Group, which had
previously been manufacturing coal-fired boilers. Jinan Boiler Group was acquired by the
Dragon Power Group in July of 2007 [34]. In 2010, Dragonpower split and NBE and DP
Cleantech became independent companies. They remain each other’s most important
business partners, although both have diversified their supplier or client portfolio.
Apart from the imported technology in DP Cleantech projects, the only other foreign boiler
technology used in Chinese biomass projects is from the Belgian Vyncke.
Kaidi itself developed the boiler design used in its power plants, with boiler manufacturing
outsourced to a number of domestic firms, including Hangzhou Boiler Grp., Jiangxi Jianglian
and Suzhou Hailu. Another boiler brand used in a relatively large number of projects is Wuxi
Huaguang.
Each of these firms has a history in coal-fired boiler manufacturing, and claims the
technology for biomass boilers was developed independently, rather than depending on
foreign technology. The technology for some components has been imported, e.g., Jiangxi
Jianglian is engaged in cooperative R&D on stainless steel with Yamazaki Tekko Iron Works
Co., Ltd from Japan. It further uses flue gas treatment technology from the German Graf-
Wulff GMBH and bag filtering technology from the American AeroPulse, Inc. Wuxi Huaguang
has a license for flue gas treatment technology from the Austrian AE/E.
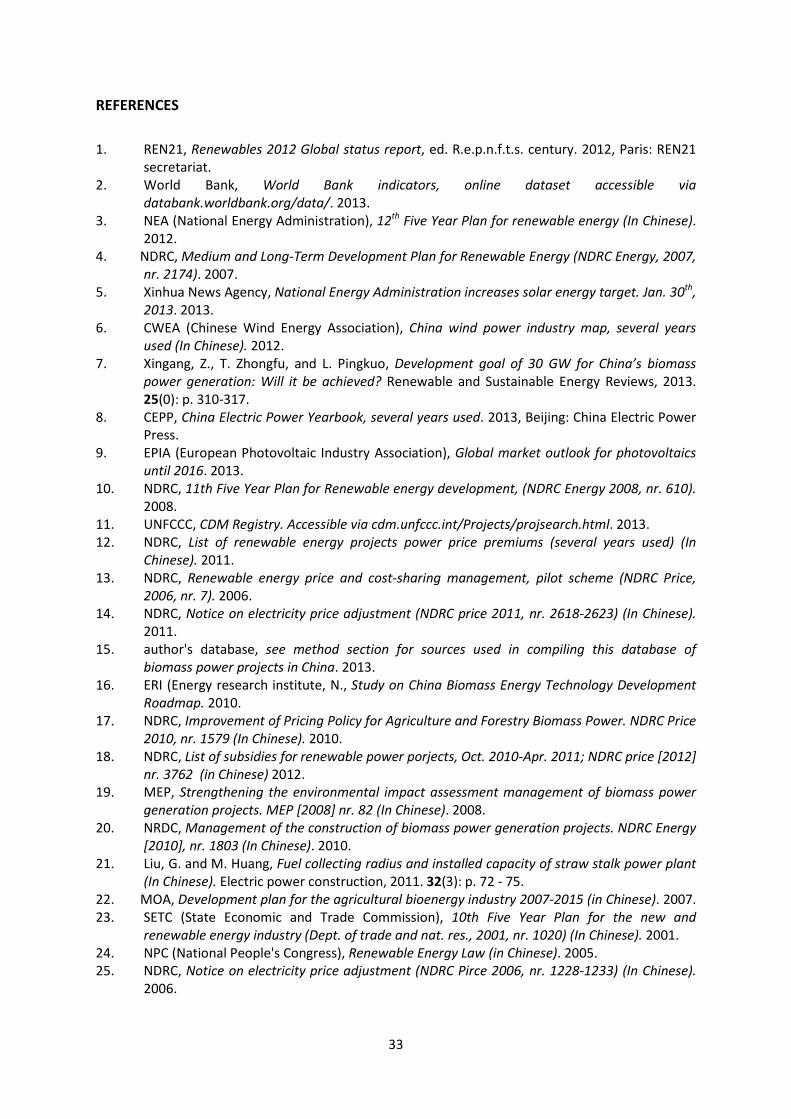
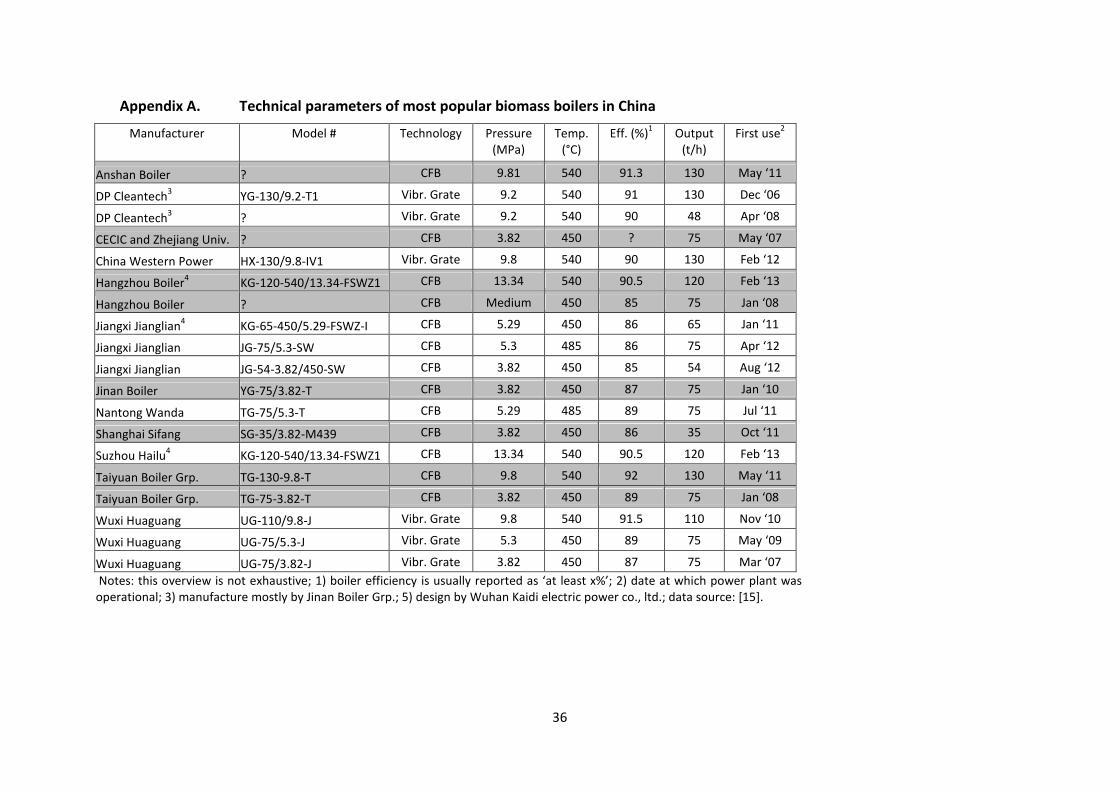
An overview of technical specifications of the most popular boilers used in China’s biomass
power projects is provided in Appendix A.
12
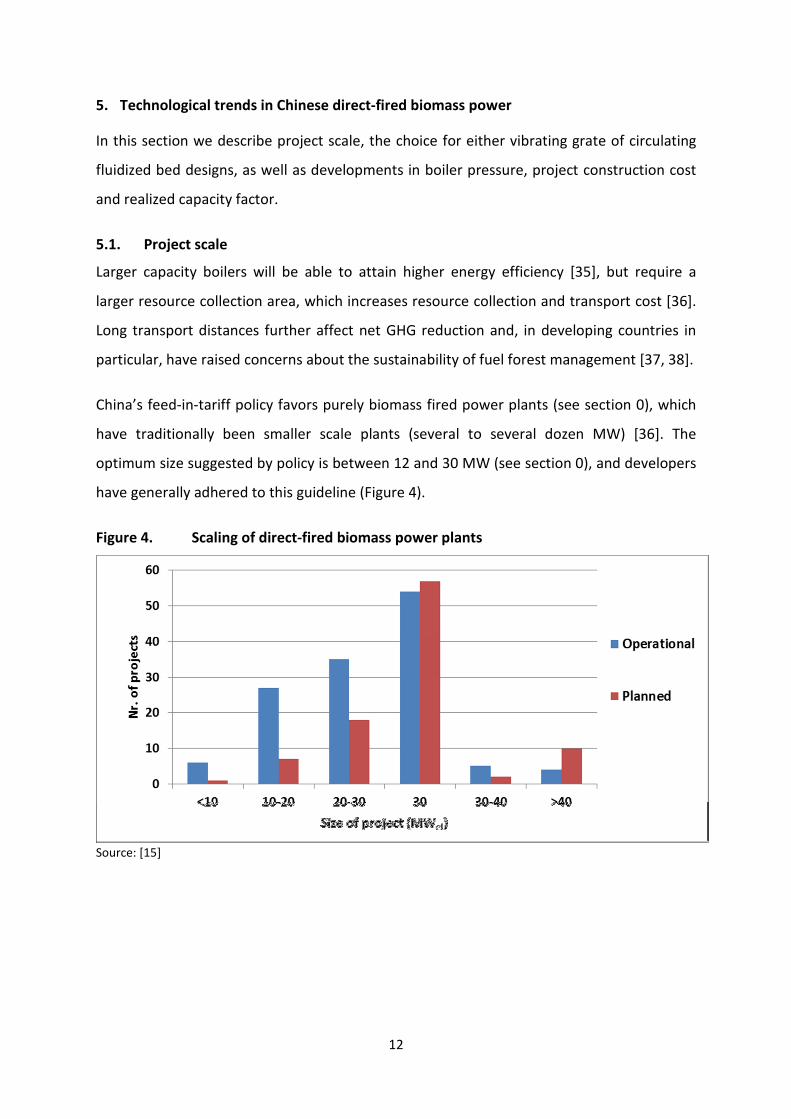
5. Technological trends in Chinese direct-fired biomass power
In this section we describe project scale, the choice for either vibrating grate of circulating
fluidized bed designs, as well as developments in boiler pressure, project construction cost
and realized capacity factor.
5.1. Project scale
Larger capacity boilers will be able to attain higher energy efficiency [35], but require a
larger resource collection area, which increases resource collection and transport cost [36].
Long transport distances further affect net GHG reduction and, in developing countries in
particular, have raised concerns about the sustainability of fuel forest management [37, 38].
China’s feed-in-tariff policy favors purely biomass fired power plants (see section 0), which
have traditionally been smaller scale plants (several to several dozen MW) [36]. The
optimum size suggested by policy is between 12 and 30 MW (see section 0), and developers
have generally adhered to this guideline (Figure 4).
Scaling of direct-fired biomass power plants Figure 4.
Source: [15]

13
The transport of biomass fuels is mostly a problem with unprocessed biomass fuels, which
are therefore predominantly used in local markets [1, 39]. Once these are compacted into
pellets, they are more easily transported over long distances, even internationally. In 2012,
total global pellet production is estimated to have been 22.4 Mt, of which 8.2 Mt were
traded in international markets [1]. This had enabled larger scale biopower projects, for
example, the Tilbury power station in the U.K. (750 MW). The annual fuel requirement of
2.7 Mt of pellets is imported, mainly from the US and Canada [40]. Similarly, one of six 660
MW boilers of the Drax power station, also in the UK is currently being converted to run on
biomass, and will consume 2.3 Mt of pellets annually. Two more boilers of the same size are
planned to undergo conversion in the following years [41].
Chinese imports (or exports) of pelletized fuels are very limited [42]. Domestic production
of compacted biomass fuels was around 3 Mt in 2010 [1] and is targeted to reach 10 Mt by
2015 [3]. Only part of these fuels is meant for use in industrial boilers or power plants,
however. China’s policy plans for solid biofuels are strongly aimed at the production of
biomass briquettes for use in household stoves [22]. These are meant to replace coal
briquettes and unprocessed biomass, which remain popular fuels in rural China until today,
but which burn inefficiently and lead to high levels of indoor fuel smoke [43].
5.2. Boiler design: grate firing or fluidized bed
Two different designs for the combustion of biomass fuels have been used in China: grate
firing and Circulating Fluidized Bed (CFB). Both technologies have their respective
advantages and disadvantages relating to the physical and chemical characteristics of solid
biomass fuels.
CFB installations require more pre-treatment of fuels, in particular reducing the fuels to an
acceptable particle size, whereas grate firing installations can more easily utilize fuels of
different sizes [44]. In principle, both can utilize fuels with diverse composition and water
content as well. With grate firing systems, constant monitoring and adjustment of the air
injection and frequency of the grate vibration is required, in order to ensure complete
burnout [45]. CFB installations can more easily ensure complete burnout, because
incompletely burnt particles get re-circulated into the firing zone as a function of the design
[45]. Compared with conventional fuels, biomass fuels contain more alkali metals and
14
chloride, which increase fouling, slagging and corrosion [46, 47]. Fouling and slagging reduce
the heat transfer of metal surfaces, which reduces fuel efficiency, whilst corrosion reduces
equipment lifetime [46, 47]. Corrosion is a problem in CFB boilers in particular, because of
the high velocity of the bed material and fuel particles along boiler surfaces [45].
Furthermore, biomass fuels increase fouling and agglomeration of the bed material in CFB
boilers, which will require maintenance and boiler shut-down [44, 48]. Fouling is a problem
for grates as well, but can be prevented by cooling of the grate to a point below the melting
point of ashes, which will make these drop off from the grate. A water-cooled vibrating
grate is an engineering challenge, however, in particular the flexible connection in the
water-circuit between the moving grate and stationary furnace walls. Lastly, CFB boilers
further cannot easily operate at partial load, because the bed requires a minimal amount of
heat input to maintain (optimal) combustion conditions [44, 45]; grate firing systems have
no such requirements. This means CFB boilers have a greater need for a more constant fuel
supply.
Three brands active in China use a water-cooled vibrating grate design: DP Cleantech, and
the domestic brands Wuxi Huaguang and China Western Power. The remaining, large
majority of, domestic manufacturers use a CFB design (see also Appendix A). These
manufacturers have used their know-how on coal-fired CFB boilers for the production of
biomass boilers. CFB is the most popular design in thermal power generation in China,
amongst others because the country has a large supply of coal with high sulfur content. CFB
boilers allow for cost-effective emission control of sulfuroxides, by mixing limestone in the
fuel mixture [49].
5.3. Steam pressure, temperature and efficiency
Boilers that operate at higher pressure and temperature (two strongly related boiler
specifications) can achieve higher efficiencies but are more difficult to engineer and tend to
be more costly. In biomass boilers, temperature levels strongly influence alkali and chloride
corrosion. Steel corrosion is negligible at temperatures below 450°C, but increases sharply
at temperatures above 520°C [47]. Traditionally, biomass boilers were often operated below
the 450°C threshold to prevent corrosion of the steam circuit tubing [47]. Alloys with high
resistance to such corrosion are available but costly, and the use of lower steam
temperature remains a cost-effective way to limit corrosion. Increased equipment cost for
15
more efficient boilers may be offset by fuel savings, in particular in case fuel prices are high
(more in sections 0 and 0).
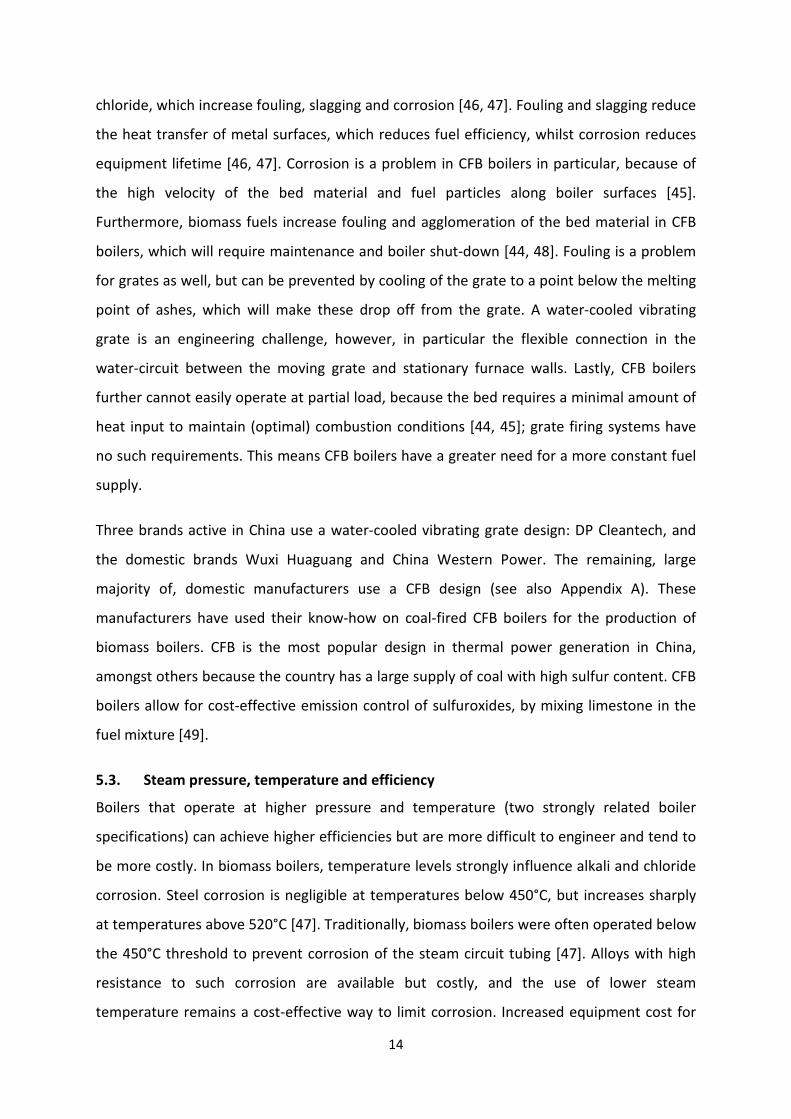
DP Cleantechs boiler, which was the most popular between ‘06 and ’09, is a high pressure,
high temperature design, operating at 9.2 MPa and 540°C. For several years, domestic
manufacturers relied on low and medium pressure designs (ca. 3.8 and 5.3 MPa). The first
domestically designed and manufactured high pressure boilers (ca. 9.2 MPa) came online
late ‘10 and early ‘11 (Figure 5). Wuhan Kaidi, the largest domestic designer and operator of
biopower plants, has developed a super high pressure CFB boiler, operating at 13.3 MPa.
This design is used in six power plants that became operational over the course of 2013.
Kaidi’s remaining operational power plants use its 5.3 MPa design [15].
A number of our interviewees were skeptical of the financial benefits of a design operating
at 13.3 MPa. Kaidi reports a boiler efficiency of 90.49%, basically within the range of high
pressure (9.2 MPa) boilers, whilst equipment cost should be higher. Rather, these
interviewees argued, Kaidi seeks to set itself apart from a field of competitors that all offer
9.2 MPa boilers. It hopes this above average technical specification will help validate its
manufacturing strength, and increase orders from other developers of biopower plants.
Operators in China have, over the entire period since ’06 until recently, continued to use a
diverse mix of low, medium, and high pressure biomass fired boilers. On average, increased
market entry by domestic suppliers of low and medium pressure designs has decreased
average boiler pressure. The increased market share of Kaidi’s super-high pressure design
over 2013 has changed this trend (Figure 5).
16
Steam pressure of biomass power projects (operating and planned) in China Figure 5.
Notes: includes 126 projects for which we had boiler pressure data; source: [15]
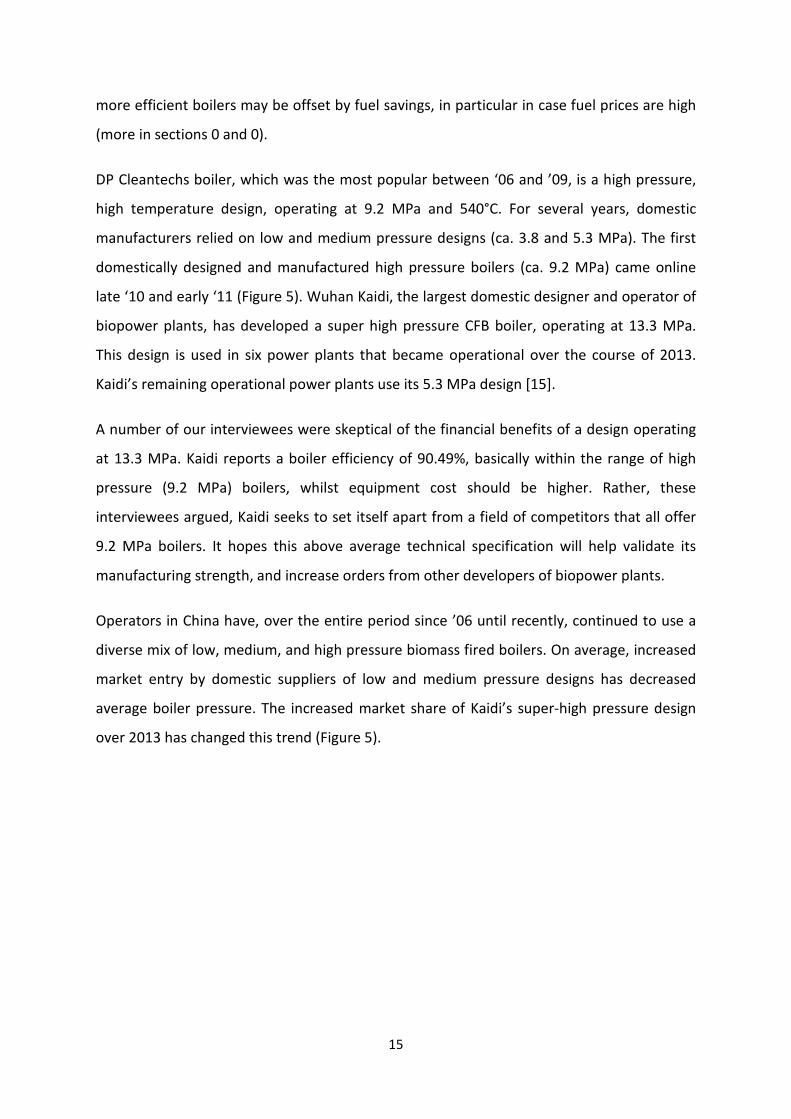
5.4. Construction cost
The notion of learning curves hold that the costs of technology tend to go down over time.
This is attributed to increased experience of manufacturers, technological maturation
and/or economies of scale effects with increased market sizes [50, 51]. The construction
costs for a biomass power project in China have had a downward trend, from circa 10,000
RMB in ‘06/’07 to less than 8,000 in ’13 (Figure 6). Interviewees attributed the downward
trend mostly to increased competition, i.e. more suppliers and a higher number of projects,
as well as the more frequent use of domestic technology. Counter to expectations, boiler
pressure did not appear to affect project cost; even Wuhan Kaidis super-high pressure
design has costs close to the market norm of 8,000 RMB/kW in ’13 [15]. Note, however, that
these costs are taken from CDM ‘project design documents’, and are therefore planned
budgets, and may have been exceeded during construction.
17
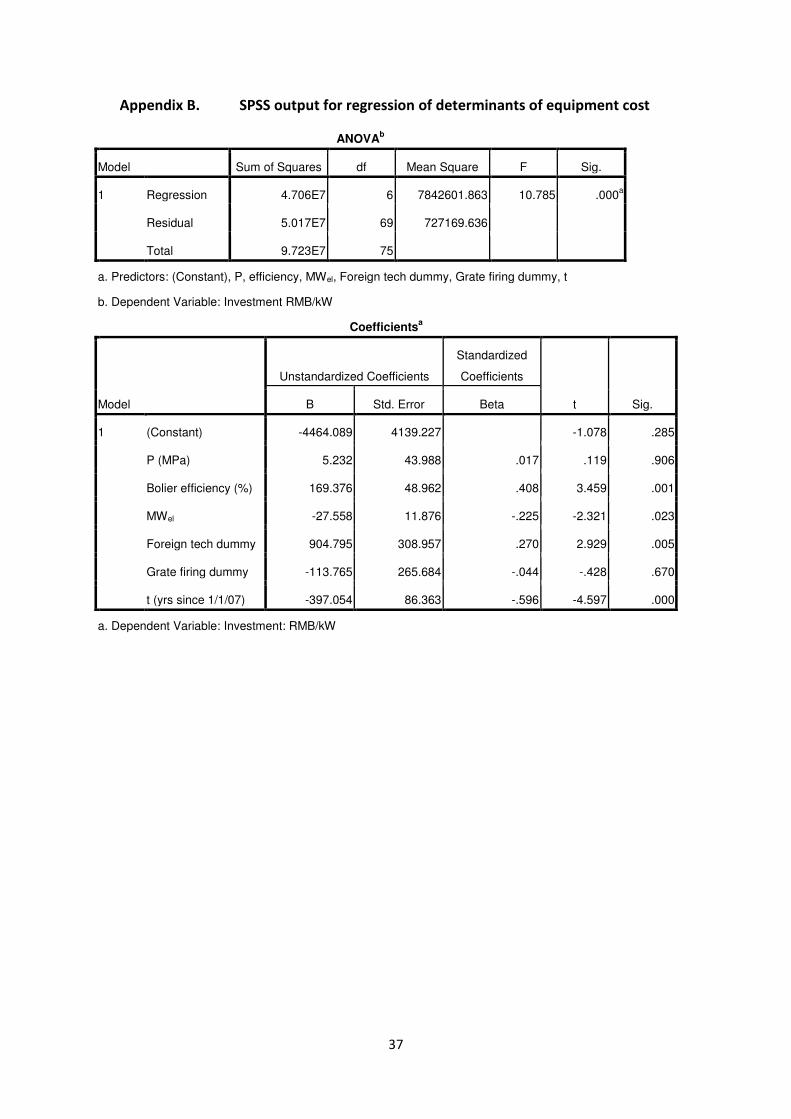
Linear regression using data from our project database [15]revealed that per kW project
cost:
- have decreased by 397 RMB/kW per year;
- are 905 RMB/kW lower when using domestic instead of foreign technology;
- are 169 RMB/kW higher for every percent increase in boiler efficiency;
- are 496 RMB/kW lower for a 30 MW project when compared with a 12 MW project;
No demonstrable differences in cost were found between CFB of grate fired designs, nor did
we find an effect of boiler pressure on project cost (see Appendix B for SPSS output).
Although construction cost has declined over the last few years, interviewees indicated that
they thought a significant further future decline from the current 8,000 RMB/kW to be
unlikely.
Cost of direct fired biopower projects in China Figure 6.
Notes: includes 163 projects for which we had construction cost data; note that the date is of the project
design document (see also section 0), not project start; source: [15].

18
5.5. Operational performance: capacity factor
The operational performance of a power plant can be reported as capacity factor. This is
actual production of power over a period of time, divided by the amount that would have
been produced if the plant had been operating at full load for that entire period of time.
Production is halted when a power plant is shut down for routine maintenance.
Maintenance is also required in the case of equipment failure, and therefore depends on
technological quality. With biomass fired power plants in particular, slagging, fouling and
corrosion increase maintenance needs, when compared with coal-fired power plants [48,
52]. Capacity factors can also be reduced by curtailment, i.e., when the grid operator has no
need for power from a specific plant and refuses to purchase its power. Lastly, production
may be ceased when fuel is unavailable or priced at a level that does not allow for profitable
production [53].
The Chinese policy target, of 48 TWh with 8 GW of installed capacity, implies a capacity
factor of 68.5% (see Table 2). This is ambitious, as even coal fired power plants achieve a
capacity factor of between 60 and 70%, both in China and the US [8, 54] (annual average,
calculated on nameplate capacity). The ‘project design documents’ included with
applications for registration as a CDM project, on average, predict a 62.4% capacity factor
for all Chinese biopower projects [15].
Actual operational performance of Chinese biopower projects, however, has lagged behind
these expectations. Average capacity factor was 54.0%, with a wide variation in
performance for individual projects (Figure 7). This number is based on the NDRC’s subsidy
report for the period Oct. ’10 – Apr. ’11 [18]. We used only the data from projects that were
included in the previous reporting period as well, so that we were sure that projects had
been operational for the entire reporting period.
Our interviewees indicated that curtailment was not an issue. Curtailment is a severe issue
for wind power in China, mostly due to the intermittency of production and a lack of
transport power lines between wind power generation and load centers [55]. Biopower
production is far less intermittent, and power plants are of smaller sizes and closer to load
centers then wind farms are.
19
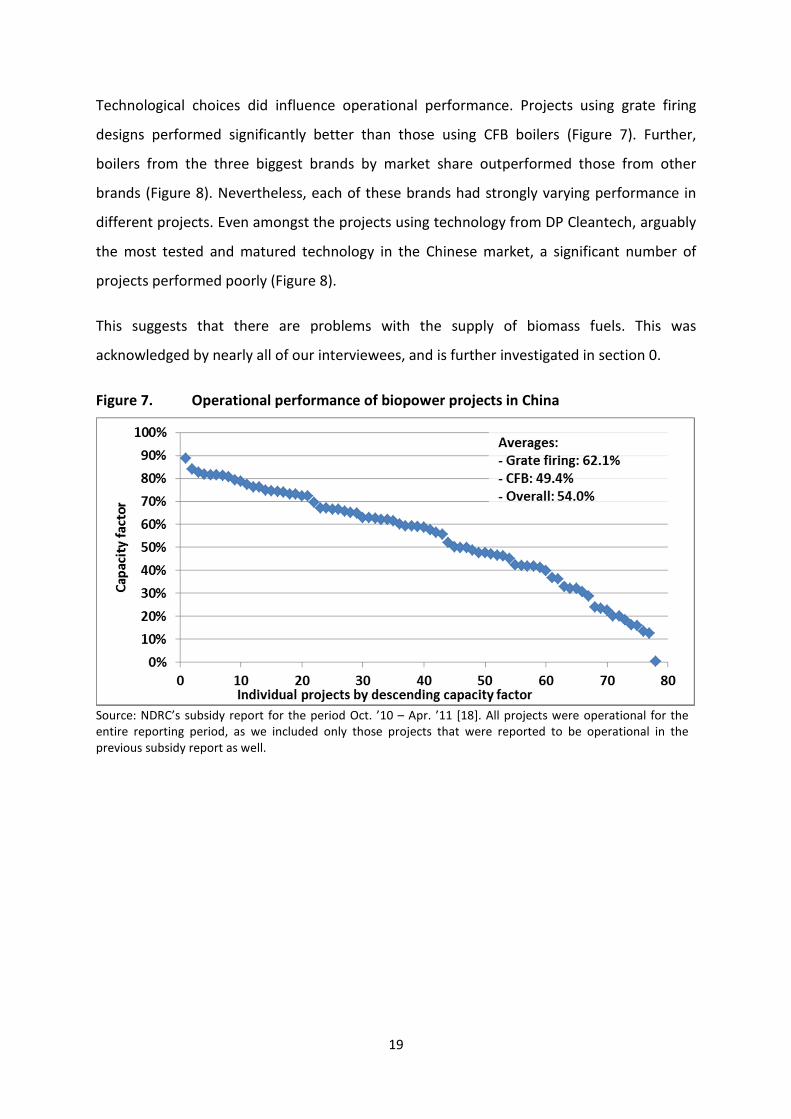
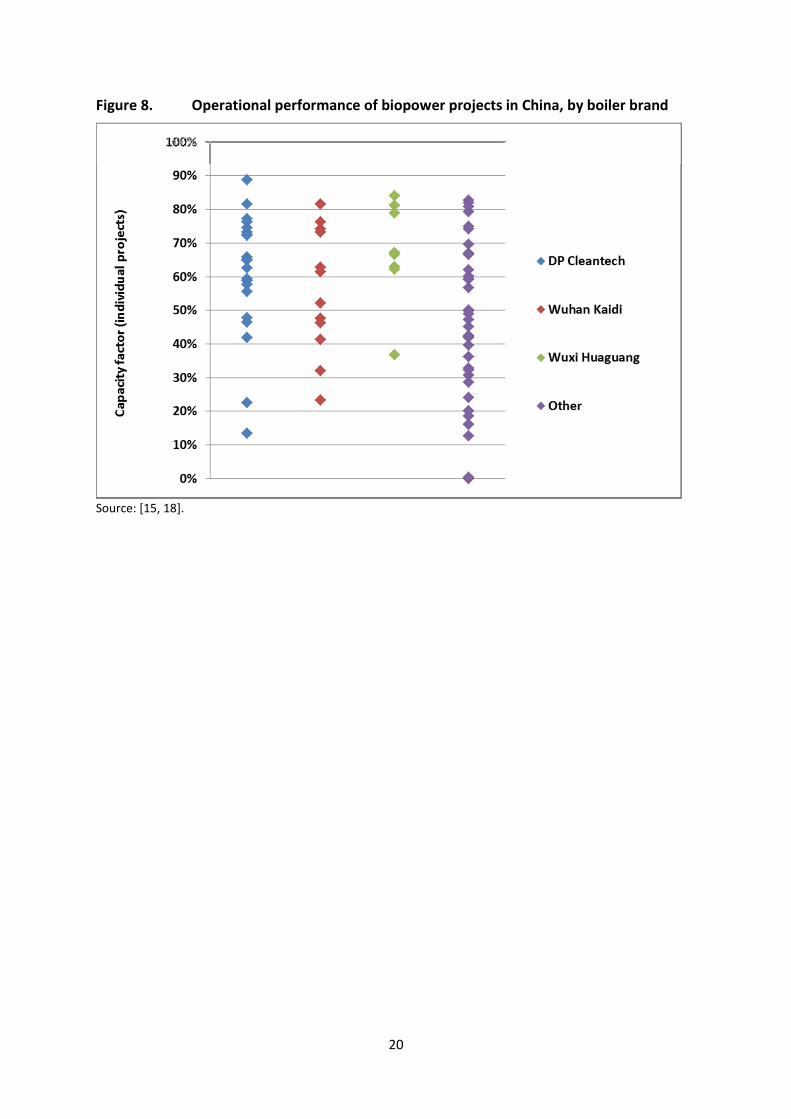
Technological choices did influence operational performance. Projects using grate firing
designs performed significantly better than those using CFB boilers (Figure 7). Further,
boilers from the three biggest brands by market share outperformed those from other
brands (Figure 8). Nevertheless, each of these brands had strongly varying performance in
different projects. Even amongst the projects using technology from DP Cleantech, arguably
the most tested and matured technology in the Chinese market, a significant number of
projects performed poorly (Figure 8).
This suggests that there are problems with the supply of biomass fuels. This was
acknowledged by nearly all of our interviewees, and is further investigated in section 0.
Operational performance of biopower projects in China Figure 7.
Source: NDRC’s subsidy report for the period Oct. ’10 – Apr. ’11 [18]. All projects were operational for the
entire reporting period, as we included only those projects that were reported to be operational in the
previous subsidy report as well.
20
Operational performance of biopower projects in China, by boiler brand Figure 8.
Source: [15, 18].

21
6. Market environment
In this section we discuss aspects that influence the financial performance of operating a
biopower plant in China, including fuel availability, fuel pricing, and sales of heat and carbon
credits.
6.1. Fuel availability
The NDRC has assessed the availability of China’s agro-forestry residue in 2008. Crop residue
availability is assessed from crop production figures and an average yield of residue vs. crop
yield. Residue yield from agriculture are estimated to be 816 Mt annually, with a further 368
Mt of forestry residues [16]. The most abundant crop residues are from corn (265 Mt), rice
(205 Mt) and wheat (150 Mt) [16]. In addition to cotton stalks, these are also the most
commonly used fuels in Chinese biopower plants [15]. These residues do have competing
purposes; 500 Mt is available for energy purposes, of which 129 Mt currently being used for
cooking and heating in rural household stoves (Figure 9).
The NDRC report from which the data for Figure 9 is taken, anticipates strong growth in
manure and MSW production but little growth in future agro-forestry residue yield [16].
Agro-forestry residues: quantity and uses Figure 9.
Source: [16]. Household fuel use includes biomass briquettes/pellets.
22
Meeting China’s 2020 targets for biopower requires circa 271 Mt, or 54% of all available
agro-forestry residues (Table 3). In 2012, we estimate residue consumption for biopower to
have been circa 39 Mt, or 8% of available resources.
Table 3. Agro-forestry residue use for Chinese biopower targets
2012 2015 2020
Agro-forestry residue based biomass power
- Capacity (MW) 4,6321 8,000 24,000
- Production (mln MWh) 22.32 48
3 144
3
- Resource use (Mt)4 33.4 72 216
Compacted fuels
- Production (Mt) 5 10 50
- Resource use (Mt)5 5.5 11 55
Total resource use (Mt) 38.9 83 271
Use as share of available 7.8% 16.6% 54.2%
Notes:1) assuming 2.9 GW biopower plants and 1.7 GW bagasse power (see section 4); 2)
assuming a capacity factor of 54%, see Figure 7; 3) assuming a capacity factor of 68.5%
as targeted by policy [56]; assuming resource use of 1.5t/MWh (average reported in
CDM projects’ PDD); 5) resource use as suggested by [16].
Despite the relatively low fraction of available residues being used in biopower projects,
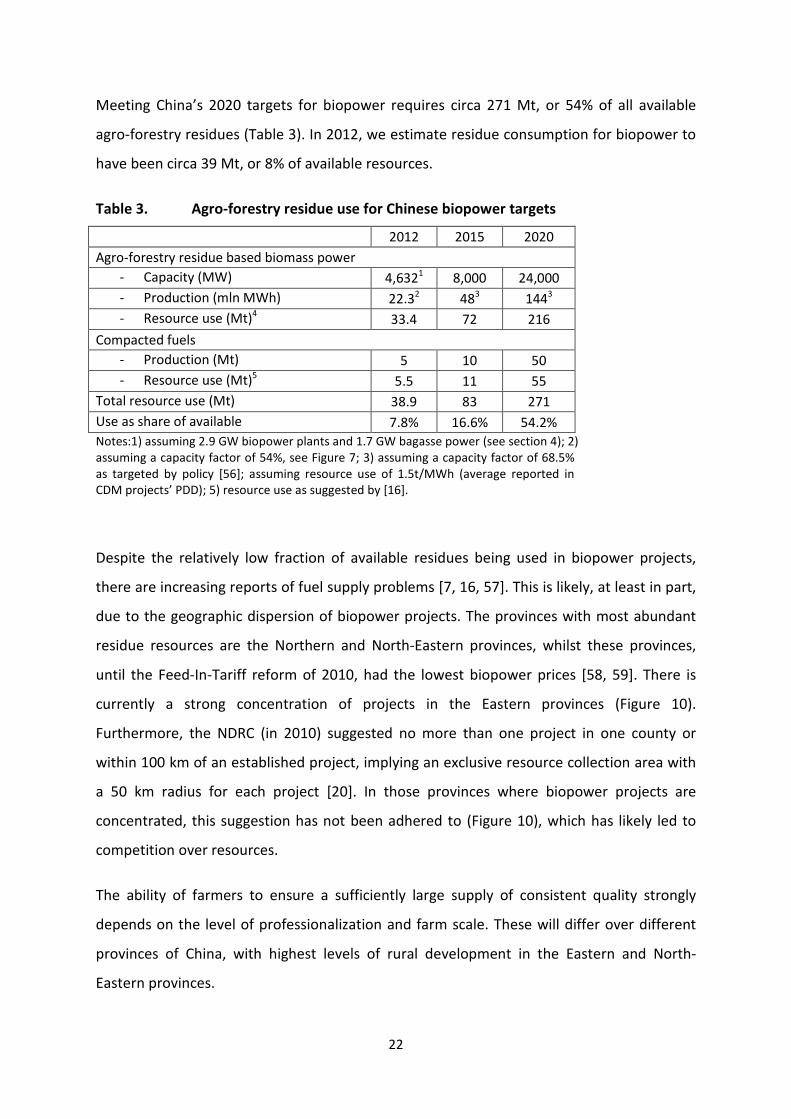
there are increasing reports of fuel supply problems [7, 16, 57]. This is likely, at least in part,
due to the geographic dispersion of biopower projects. The provinces with most abundant
residue resources are the Northern and North-Eastern provinces, whilst these provinces,
until the Feed-In-Tariff reform of 2010, had the lowest biopower prices [58, 59]. There is
currently a strong concentration of projects in the Eastern provinces (Figure 10).
Furthermore, the NDRC (in 2010) suggested no more than one project in one county or
within 100 km of an established project, implying an exclusive resource collection area with
a 50 km radius for each project [20]. In those provinces where biopower projects are
concentrated, this suggestion has not been adhered to (Figure 10), which has likely led to
competition over resources.
The ability of farmers to ensure a sufficiently large supply of consistent quality strongly
depends on the level of professionalization and farm scale. These will differ over different
provinces of China, with highest levels of rural development in the Eastern and North-
Eastern provinces.
23
Regardless, the organization of a fuel supply network should be expected to be a challenging
task anywhere in rural China. A 30 MW power plant will consume circa 250,000 tons of crop
residue annually. The national average yield of corn, the most abundant residue, is 5.5
ton/ha [28]. Residue yield would then be ca. 11 ton/ha [16], of which ca. 2.8 ton/ha will be
available for biomass power purposes (ibid, see also Figure 9). A 30 MW project would then
require ca. 90,000 ha of farmland. The average farm size in China is small, somewhere
between 0.5 and 1.0 ha per household [28, 60, 61]. Further, households in less well
developed areas largely use their farmland for crops as needed by the household rather
than having a single cash crop. Their plots of land are therefore used for a large variety of
crops, which further increases the resource collection area needed to obtain 250,000 tons
of crop residues of a consistent quality. The required network of suppliers should therefore
consist of several 10,000s of households; and even several 100,000s of households in less
well developed areas.
Location of biomass power projects in China Figure 10.
Notes: includes both operational and planned projects; the 50 km radius is the suggested exclusive resource
collection area, see text in section 6.1; the 50 km radius is scaled for the right hand section of the map; data
source: [15].
24
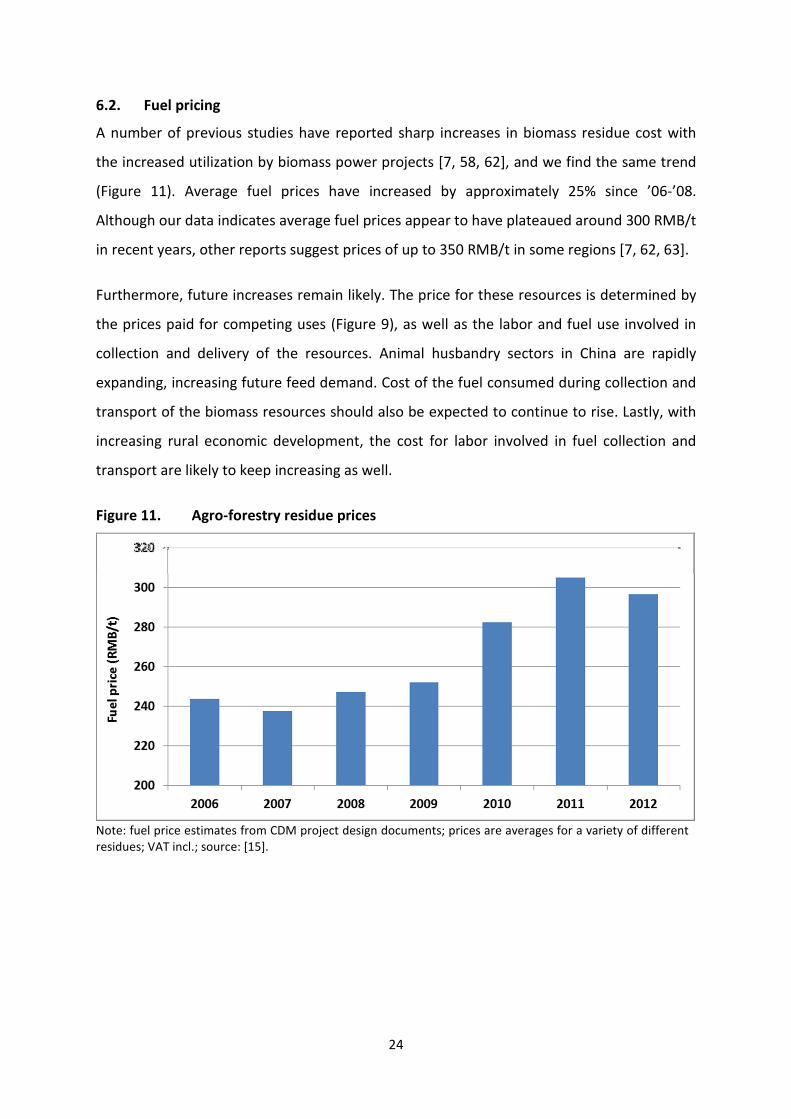
6.2. Fuel pricing
A number of previous studies have reported sharp increases in biomass residue cost with
the increased utilization by biomass power projects [7, 58, 62], and we find the same trend
(Figure 11). Average fuel prices have increased by approximately 25% since ’06-’08.
Although our data indicates average fuel prices appear to have plateaued around 300 RMB/t
in recent years, other reports suggest prices of up to 350 RMB/t in some regions [7, 62, 63].
Furthermore, future increases remain likely. The price for these resources is determined by
the prices paid for competing uses (Figure 9), as well as the labor and fuel use involved in
collection and delivery of the resources. Animal husbandry sectors in China are rapidly
expanding, increasing future feed demand. Cost of the fuel consumed during collection and
transport of the biomass resources should also be expected to continue to rise. Lastly, with
increasing rural economic development, the cost for labor involved in fuel collection and
transport are likely to keep increasing as well.
Agro-forestry residue prices Figure 11.
Note: fuel price estimates from CDM project design documents; prices are averages for a variety of different
residues; VAT incl.; source: [15].
25
6.3. Heat sales revenue
The combined generation heat and power (CHP) can significantly increase revenue of a
biomass power project. A boiler can supply significant amounts of (waste) heat without
significant increases in fuel consumption. Heat is not easily transported over long distances,
however, and therefore needs to be supplied to local district heating networks or industrial
processes. Because of limitations on the transport of heat, CHP works well in particular with
smaller scale (several to several dozen MW) power plants [35, 36]. CHP is a common and
well developed form of biopower in the colder Northern European countries [35, 36].
The average price for the supply of heat is 33.9 RMB/GJ (incl. VAT) [15]. The sale of heat
from biopower plants is not subject to government subsidies. Those biopower projects that
supplied heat, on average, expected to supply about 25,000 GJ per MWel of capacity [15]. At
those average levels of price and of supply, heat sales can increase revenue by
approximately circa 22% (Figure 12).
However, around two-thirds of currently operational projects and an even larger share of
planned projects have failed to find demand for heat supply (Figure 12). Out of the 66
projects supplying heat to end-users, 55 were supplying it to nearby industrial users, and 11
were feeding it into residential district heating grids. Many project design documents
submitted with CDM applications indicated project developers had attempted to secure a
heat supply contract, but either a centralized heating infrastructure or heating demand was
lacking. A small number indicated to continue to look for future opportunities to supply heat
[15].
6.4. Carbon credit sales
Chinese GHG emission reduction projects are eligible for registration as a CDM project and
may trade the resulting carbon credits (‘certified emission reduction’; CER) in international
markets. The large majority of Chinese biomass projects has registered or is requesting
registration as a CDM project (Figure 12).
Between 2009 and 2012, CER futures have traded for approximately €12/tCO2 [64], and
forecasts have long suggested rising CER prices over the period until 2020, up to €15/tCO2 or
more [64, 65]. The latter price equates to 107 RMB/MWh of additional revenue. Project
design documents submitted with CDM applications for Chinese biomass projects have
26
generally assumed circa €9/tCO2 as an average, long-term CER value. We used this value to
indicate the relevance of different components of total revenue in Figure 12.
The carbon market has suffered from strong oversupply, however [66]. Demand in the EU,
the largest active carbon trading market, has lapsed due to slowed economic growth [67].
The European Parliament has worked on propping prices by curbing supply, i.e., with
reduced auctioning of new permits [66]. Although this has had some effect, prices for
credits used in the EU scheme (EU emission allowance; EUA) have fluctuated between circa
€2 and €5/tCO2 in 2013, forecasted to climb to around €8/tCO2 in the longer term only [66].
This is not only affecting new contracts for the supply of carbon credits. Credit buyers with
long-term contracts with (Chinese) CER are delaying the issuance of CER, demanding price
renegotiation or even terminating contracts [68].
Furthermore, in another effort to curb the supply of credits, the European Parliament has
decided that CER from CDM projects registered from Jan. 1st
2013 onwards cannot be
exchanged with EUA, i.e., cannot be used to offset emission reduction obligations in the EU
[69]. The only exception to this are credits from CDM projects from the ‘Least Developed
Countries’ [69]. With this important market closed to CER, demand has fallen and CER prices
have slumped to as low as €0.30/tCO2 [68], with little expectation of strong improvement in
the period until 2020 [68, 70]. This value is so low that it hardly justifies the expense
associated with CDM application procedures, and registration requests from Chinese
projects have nearly ceased altogether. During 2011 and 2012, new Chinese CDM
applications were around 1,000 (all types); during the first six months of 2013, only 10 new
applications were requesting registration [71].
China is currently piloting domestic trading schemes, which will increase future demand for
carbon credits. The current goal is to have national coverage by 2016, following seven
regional trading schemes in operation by the end of 2014, although a group of experts
surveyed on the matter was skeptical of this time table [72]. The same group of experts
expected carbon prices of 38 RMB/tCO2 in 2016, rising to 60 RMB/tCO2 in 2020 [72]. This
would be equivalent to 34 RMB/MWh in 2016 and 54 RMB/MWh in 2020.

27
Nr. of biopower projects supplying heat (CHP) or CDM credits Figure 12.
Source: [15].
Lifetime revenue of a model biopower plant Figure 13.
Notes: revenue incl. VAT; assumptions: see Appendix C
103 210
509
338
1,833
28
7. Investment outlook
In recent years, growth in installed capacity of biopower plants has accelerated to circa 1
GW annually, in line with policy targets. This growth figure does assume that construction
has started on all planned projects on schedule. In order to meet the 2020 target of 24 GW,
growth would have to accelerate to 3+ GW annually. As has been demonstrated in sections
0 and 0, however, a number of parameters have developed in such a way that these will
negatively affect project profitability, which in turn may affect investment decisions.
Such problems are apparent from Wuhan Kaidi’s annual reports. Kaidi reported a gross
profit of 90,7 mln RMB for its biomass arm over 2011. Despite an increase in the number of
operational power plants, the result for 2012 was a gross loss of 38,1 mln RMB [73]. Halfway
through 2012, Kaidi had 7 operational projects, and a further 19 under construction [74]. By
July 2013, 16 of these 19 plants had completed or were nearing construction [75]. Although
Kaidi initially had plans for at least another 19 more plants [15], not a single new project has
started construction since March 2012 [74, 75]. Unfortunately, we don’t have comparable
information on NBE. This company is not publicly traded and therefore does not publish
publicly available annual reports.
In order to provide further insight into the current investment outlook for biopower projects,
we made a project cash flow estimation for a model project. We used average values for
financial and operational parameters for this model project. Most of these parameters and
their range of values have been dealt with in sections 0 and 0, others are averages derived
from Project Design Documents as included with CDM applications. An overview of the key
parameter values used is provided in Appendix C.
We calculated Net Present Value (NPV) of the model project against a range of values for
fuel price, capacity factor, and whether or not the projects developers manage to find
demand for the supply of heat and/or carbon credits (Figure 14).
It appears that either the supply of heat or carbon credits would be sufficient to keep
project NPV above zero over the entire range of fuel prices used. However, with the current
lack of demand for carbon credits from China, and with difficulties for most projects to find
demand for heat supply, it is the bottom three lines in Figure 14 that are most relevant. At a
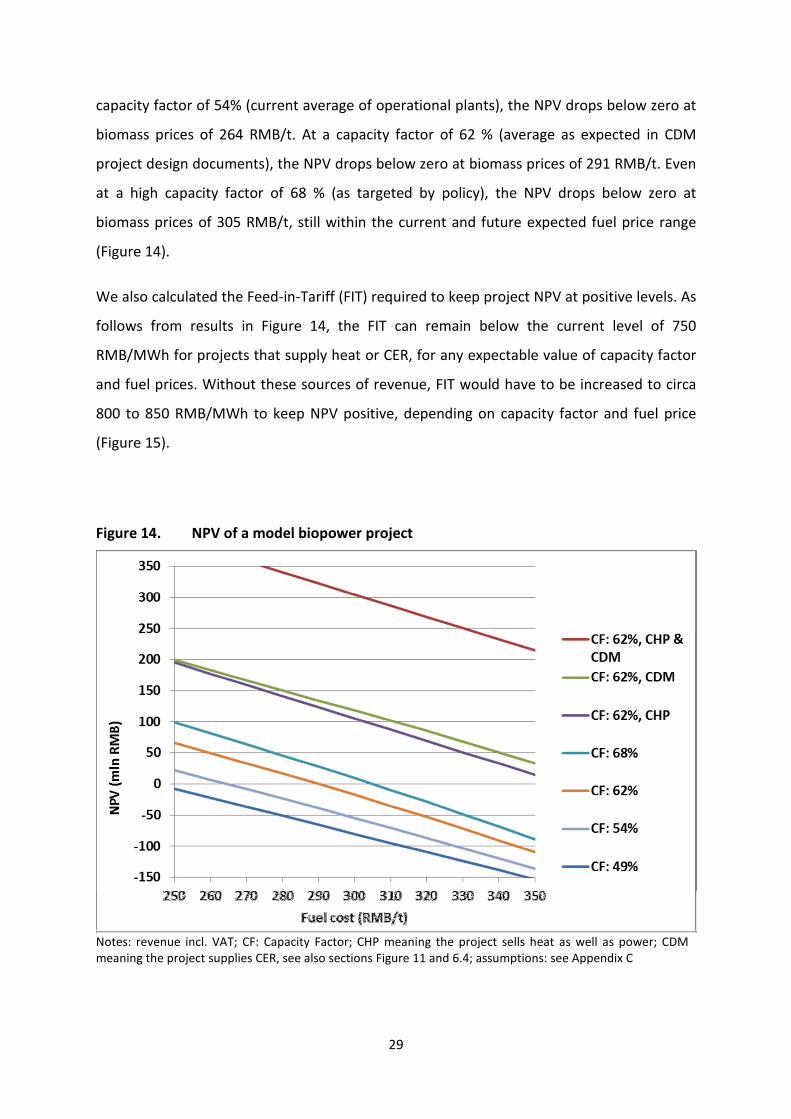
29
capacity factor of 54% (current average of operational plants), the NPV drops below zero at
biomass prices of 264 RMB/t. At a capacity factor of 62 % (average as expected in CDM
project design documents), the NPV drops below zero at biomass prices of 291 RMB/t. Even
at a high capacity factor of 68 % (as targeted by policy), the NPV drops below zero at
biomass prices of 305 RMB/t, still within the current and future expected fuel price range
(Figure 14).
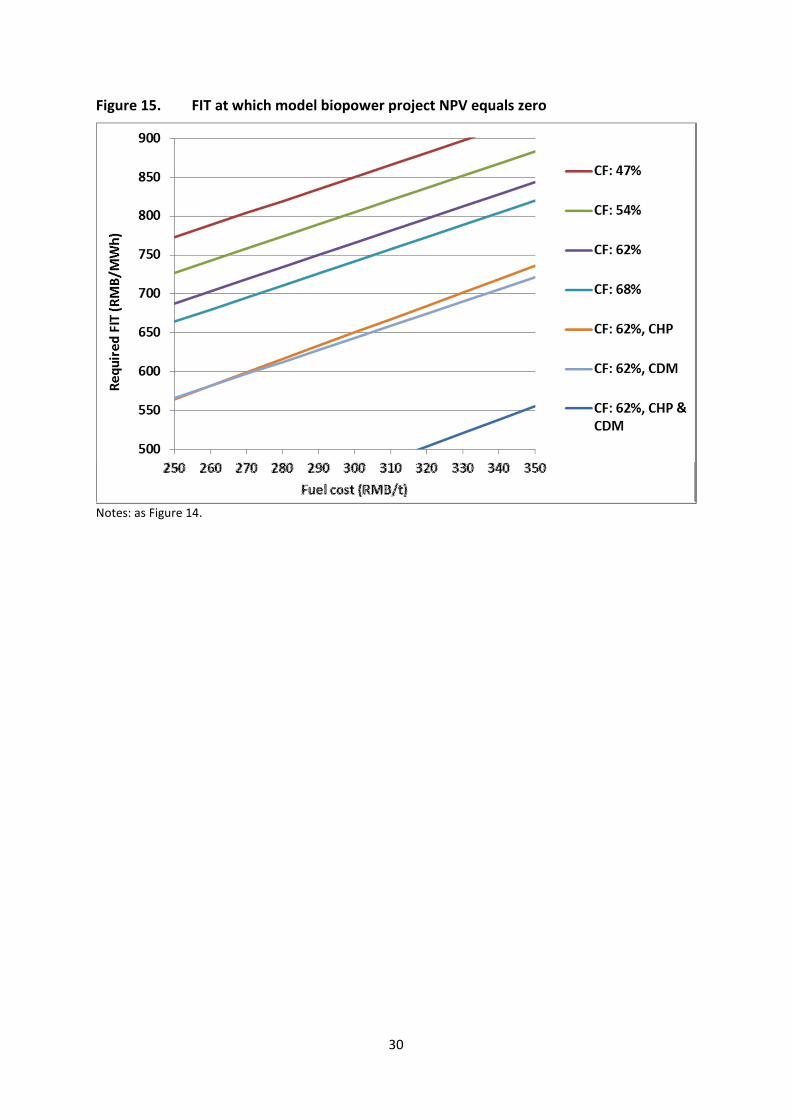
We also calculated the Feed-in-Tariff (FIT) required to keep project NPV at positive levels. As
follows from results in Figure 14, the FIT can remain below the current level of 750
RMB/MWh for projects that supply heat or CER, for any expectable value of capacity factor
and fuel prices. Without these sources of revenue, FIT would have to be increased to circa
800 to 850 RMB/MWh to keep NPV positive, depending on capacity factor and fuel price
(Figure 15).
NPV of a model biopower project Figure 14.
Notes: revenue incl. VAT; CF: Capacity Factor; CHP meaning the project sells heat as well as power; CDM
meaning the project supplies CER, see also sections Figure 11 and 6.4; assumptions: see Appendix C
30
FIT at which model biopower project NPV equals zero Figure 15.
Notes: as Figure 14.
31
8. Conclusion and policy recommendations
Chinese policy ambitions to develop biopower have been successful to a certain extent. The
establishment of a Feed-In-Tariff, combined with a number of ambitious project developers,
has ensured relatively rapid growth of the direct firing pathway in China. Installations have
grown to circa 1 GW of additional capacity annually, and an increasing number of both
project developers and boiler designers and manufacturers have entered the market.
Competition and learning have helped reduce project construction cost and induced
equipment manufacturers to offer an increased variety as well as technologically more
advanced biomass boilers.
Unfortunately, growth can be expected to stall as a number of developments have affected
the investment outlook for biopower projects. Fuel prices have rapidly risen, local
competition over biomass resources may be affecting fuel availability, operational
performance of power plants has remained behind on expectations, and carbon markets are
no longer providing a much needed additional source of revenue. Further, it is entirely
unlikely that these parameters will improve within the foreseeable future. No significant
further reductions in construction costs are to be expected, neither global nor domestic
carbon markets are going to improve significantly within the next few years, and fuel prices
are more likely to rise than to fall. Chinese policy makers should realize that this financial
outlook is not in line with what was projected when the Feed-In-Tariff was set.
The simplest policy solution to ensure reasonable profitability in the sector would be an
increase of the Feed-In-Tariff, to levels of between 800 and 850 RMB/MWh. Instead of an
increased FIT, profit levels may also be improved through exceptions in corporate income
tax or VAT. Such exceptions, and their extent, may be made conditional on fuel prices
and/or whether or not the project manages to secure revenue from heat sales. Such a
conditional system would be better organized via income tax or VAT because this requires
sufficient insight into individual projects finances. The Ministry of Finance and its State
Administration of Taxation can be expected to have such insight, whereas grid operators,
which pay the FIT, may not.
32
Governmental organizations may also help encourage heat utilization. Local governments
may have a key role in organizing heat demand from biomass power projects in local
industrial parks or residential heating networks. This, too, may also require a financial
incentive, e.g., cancelling VAT over heat from renewable resources.
There is also a need for more dependable fuel supply networks. Large operators like NBE
and Kaidi may be relatively experienced in organizing and informing large numbers of
suppliers on fuel quality requirements, preparation etc., but this may be more challenging
for the many developers that operate only one or two projects. Local rural energy bureaus
may be the most suited organization to assist operators with this task, as they have well
developed relationships with local farming communities for a variety of other government
programmes. Experiences and best practices in doing so could be disseminated via
provincial or national networks of local bureaus.
Functional networks are most needed in the direct vicinity of biopower projects, but local
rural energy bureaus could also help set these up in areas more remote from biomass
power projects. Such stations could collect crop wastes and process these into briquettes or
pellets. These may be supplied to the local population, for use in household stoves, or
transported to more remote fuel markets. As the number of collection stations increases,
such supply networks could grow out to provincial or national levels, and even be integrated
with international markets for pelletized fuels. Long range transport of fuels will increase
cost and carbon emissions. A larger supply network however, can help mitigate seasonal or
other fuel shortages and price fluctuations, reducing risk for investors.
33
REFERENCES
1. REN21, Renewables 2012 Global status report, ed. R.e.p.n.f.t.s. century. 2012, Paris: REN21
secretariat.
2. World Bank, World Bank indicators, online dataset accessible via
databank.worldbank.org/data/. 2013.
3. NEA (National Energy Administration), 12th
Five Year Plan for renewable energy (In Chinese).
2012.
4. NDRC, Medium and Long-Term Development Plan for Renewable Energy (NDRC Energy, 2007,
nr. 2174). 2007.
5. Xinhua News Agency, National Energy Administration increases solar energy target. Jan. 30th
,
2013. 2013.
6. CWEA (Chinese Wind Energy Association), China wind power industry map, several years
used (In Chinese). 2012.
7. Xingang, Z., T. Zhongfu, and L. Pingkuo, Development goal of 30 GW for China’s biomass
power generation: Will it be achieved? Renewable and Sustainable Energy Reviews, 2013.
25(0): p. 310-317.
8. CEPP, China Electric Power Yearbook, several years used. 2013, Beijing: China Electric Power
Press.
9. EPIA (European Photovoltaic Industry Association), Global market outlook for photovoltaics
until 2016. 2013.
10. NDRC, 11th Five Year Plan for Renewable energy development, (NDRC Energy 2008, nr. 610).
2008.
11. UNFCCC, CDM Registry. Accessible via cdm.unfccc.int/Projects/projsearch.html. 2013.
12. NDRC, List of renewable energy projects power price premiums (several years used) (In
Chinese). 2011.
13. NDRC, Renewable energy price and cost-sharing management, pilot scheme (NDRC Price,
2006, nr. 7). 2006.
14. NDRC, Notice on electricity price adjustment (NDRC price 2011, nr. 2618-2623) (In Chinese).
2011.
15. author's database, see method section for sources used in compiling this database of
biomass power projects in China. 2013.
16. ERI (Energy research institute, N., Study on China Biomass Energy Technology Development
Roadmap. 2010.
17. NDRC, Improvement of Pricing Policy for Agriculture and Forestry Biomass Power. NDRC Price
2010, nr. 1579 (In Chinese). 2010.
18. NDRC, List of subsidies for renewable power porjects, Oct. 2010-Apr. 2011; NDRC price [2012]
nr. 3762 (in Chinese) 2012.
19. MEP, Strengthening the environmental impact assessment management of biomass power
generation projects. MEP [2008] nr. 82 (In Chinese). 2008.
20. NRDC, Management of the construction of biomass power generation projects. NDRC Energy
[2010], nr. 1803 (In Chinese). 2010.
21. Liu, G. and M. Huang, Fuel collecting radius and installed capacity of straw stalk power plant
(In Chinese). Electric power construction, 2011. 32(3): p. 72 - 75.
22. MOA, Development plan for the agricultural bioenergy industry 2007-2015 (in Chinese). 2007.
23. SETC (State Economic and Trade Commission), 10th Five Year Plan for the new and
renewable energy industry (Dept. of trade and nat. res., 2001, nr. 1020) (In Chinese). 2001.
24. NPC (National People's Congress), Renewable Energy Law (in Chinese). 2005.
25. NDRC, Notice on electricity price adjustment (NDRC Pirce 2006, nr. 1228-1233) (In Chinese).
2006.
34
26. NDRC, Improved pricing policy for power from waste incineration. NDRC Price [2012] Nr. 801
(In Chinese). 2012.
27. REN21, Renewables 2013 Global status report, ed. R.e.p.n.f.t.s. century. 2013, Paris: REN21
secretariat.
28. MOA, China Agriculture Statisticical report (in Chinese); several years used. 2011, Beijing:
China Agriculture Press.
29. Han, J., et al., Small-scale bioenergy projects in rural China: Lessons to be learnt. Energy
Policy, 2008. 36(6): p. 2154-2162.
30. Bridgwater, A.V., et al., An Assessment of the Possibilities for Transfer of European Biomass
Gasification Technology to China. Report of the China-EU Energy Working Group. 1999.
31. NEA (National Energy Administration), 12th Five Year Plan for the development of bio-energy
2012.
32. Cao, Y., Application Status and Development Strategies of Biomass Energy in China.
Advanced Materials Research, 2012. 608-609: p. 261 - 264.
33. Author's database of biomass power projects in China. 2013.
34. Shen, X., Providing biopower to the dragon & the world. Bioenergy International, 2010. 47(6):
p. 17 - 18.
35. IEA, Biomass for Power Generation and CHP. 2007.
36. Faaij, A.P.C., Bio-energy in Europe: changing technology choices. Energy Policy, 2006. 34(3): p.
322-342.
37. Sikkema, R., et al., The international logistics of wood pellets for heating and power
production in Europe: Costs, energy-input and greenhouse gas balances of pellet
consumption in Italy, Sweden and the Netherlands. Biofuels, Bioproducts and Biorefining,
2010. 4(2): p. 132-153.
38. Uslu, A., et al., Use of sustainable biomass to produce electricity, heat and transport fuels in
EU27 (ECN-E--12-021). 2012.
39. Lamers, P., et al., Developments in international solid biofuel trade—An analysis of volumes,
policies, and market factors. Renewable and Sustainable Energy Reviews, 2012. 16(5): p.
3176-3199.
40. RWE AG, Tilbury Biomass Power Station; description on company website. 2013.
41. Drax Group plc, About Drax biomass plans; description on company website. 2013.
42. Roos, J.A. and A.M. Brackley, Asian Markets for Wood Pellets. Report by the United States
Department of Agriculture. 2013.
43. Gosens, J., et al., Sustainability effects of household-scale biogas in rural China. Energy Policy,
2013. article in press.
44. Obernberger, I., Decentralized biomass combustion: state of the art and future development.
Biomass and Bioenergy, 1998. 14(1): p. 33-56.
45. Yin, C., L.A. Rosendahl, and S.K. Kær, Grate-firing of biomass for heat and power production.
Progress in Energy and Combustion Science, 2008. 34(6): p. 725-754.
46. Demirbas, A., Potential applications of renewable energy sources, biomass combustion
problems in boiler power systems and combustion related environmental issues. Progress in
Energy and Combustion Science, 2005. 31(2): p. 171-192.
47. Michelsen, H.P., et al., Deposition and high temperature corrosion in a 10 MW straw fired
boiler. Fuel Processing Technology, 1998. 54(1–3): p. 95-108.
48. Saidur, R., et al., A review on biomass as a fuel for boilers. Renewable and Sustainable Energy
Reviews, 2011. 15(5): p. 2262-2289.
49. Yue, G.X., et al., Latest Development of CFB Boilers in China, in Proceedings of the 20th
International Conference on Fluidized Bed Combustion, G. Yue, et al., Editors. 2010, Springer
Berlin Heidelberg. p. 3-12.
35
50. Ferioli, F., K. Schoots, and B.C.C. van der Zwaan, Use and limitations of learning curves for
energy technology policy: A component-learning hypothesis. Energy Policy, 2009. 37(7): p.
2525-2535.
51. Nemet, G.F., Beyond the learning curve: factors influencing cost reductions in photovoltaics.
Energy Policy, 2006. 34(17): p. 3218-3232.
52. van den Broek, R., A. Faaij, and A. van Wijk, Biomass combustion for power generation.
Biomass and Bioenergy, 1996. 11(4): p. 271-281.
53. Chatzimouratidis, A.I. and P.A. Pilavachi, Technological, economic and sustainability
evaluation of power plants using the Analytic Hierarchy Process. Energy Policy, 2009. 37(3): p.
778-787.
54. US-EIA (US Energy Information Administration), Electric Power Annual. Online database of
power sector statistics. 2013.
55. CWEA (Chinese Wind Energy Association), China wind power outlook 2012. 2012.
56. NEA (National Energy Administration), Twelfth National Five-year Plan for Energy Technology,
2011-2015 2011.
57. Wu, C.Z., et al., The development of bioenergy technology in China. Energy, 2010. 35(11): p.
4445-4450.
58. K&W Network, Kai Johan Jiang of Dragon Power: An Entrepreneur’s High Hopes for China’s
Biomass Energy Industry. Interview published online by Wharton School of the University of
Pennsylvania. . 2010.
59. Zeng, X., Y. Ma, and L. Ma, Utilization of straw in biomass energy in China. Renewable and
Sustainable Energy Reviews, 2007. 11(5): p. 976-987.
60. Chen, R., J. Huang, and F. Qiao, Farmers' knowledge on pest management and pesticide use
in Bt cotton production in china. China Economic Review, 2013. 27(0): p. 15-24.
61. Chen, Z., W.E. Huffman, and S. Rozelle, INVERSE RELATIONSHIP BETWEEN PRODUCTIVITY
AND FARM SIZE: THE CASE OF CHINA. Contemporary Economic Policy, 2011. 29(4): p. 580-
592.
62. Zhang, Q., et al., Cost Analysis of straw-based power generation in Jiangsu Province, China.
Applied Energy, 2013. 102(0): p. 785-793.
63. Zhao, Z.-y. and H. Yan, Assessment of the biomass power generation industry in China.
Renewable Energy, 2012. 37(1): p. 53-60.
64. Covec, Carbon Price Forecasts - report prepared for the Parliamentary Commissioner for the
Environment of New Zealand. 2010.
65. Michaelowa, A., Scenarios for the global carbon markets - Paper 1 for the CDM Policy
Dialogue. 2012.
66. Reuters, Carbon wins lifeline after tight EU parliament vote, Jul. 3rd
, 2013. 2013.
67. CDM Policy Dialogue, Climate change, carbon markets and the CDM: a call to action. 2012.
68. Point Carbon, Low CER prices leave Chinese CDM contracts in disarray; Feb. 23rd
2013. 2013.
69. European Parliament and Council, Directive 2009/29/EC of the European Parliament and of
the Council of 23 April 2009 amending Directive 2003/87/EC so as to improve and extend the
greenhouse gas emission allowance trading scheme of the Community. 2009.
70. Reuters, POLL - Analysts cut EU, UN carbon forecasts. 2012.
71. UNEP/Risoe, CDM Pipeline, online database of CDM projects at cdmpipeline.org, update of
July 2013. 2013.
72. Jotzo, F., D. De Boer, and H. Kater, China Carbon Pricing Survey 2013, China Carbon Forum.
2013.
73. Wuhan Kaidi, Wuhan Kaidi Electrical Power Co. Ltd.; Annual report 2012 (In Chinese). 2013.
74. Wuhan Kaidi, Wuhan Kaidi Electrical Power Co. Ltd.; Half-year report 2012 (in Chinese). 2012.
75. Wuhan Kaidi, Wuhan Kaidi Electrical Power Co. Ltd.; Half-year report 2013 (in Chinese). 2013.
36
Appendix A. Technical parameters of most popular biomass boilers in China
Manufacturer Model # Technology Pressure
(MPa)
Temp.
(°C)
Eff. (%)1 Output
(t/h)
First use2
Anshan Boiler ? CFB 9.81 540 91.3 130 May ‘11
DP Cleantech3 YG-130/9.2-T1 Vibr. Grate 9.2 540 91 130 Dec ‘06
DP Cleantech3 ? Vibr. Grate 9.2 540 90 48 Apr ‘08
CECIC and Zhejiang Univ. ? CFB 3.82 450 ? 75 May ‘07
China Western Power HX-130/9.8-IV1 Vibr. Grate 9.8 540 90 130 Feb ‘12
Hangzhou Boiler4 KG-120-540/13.34-FSWZ1 CFB 13.34 540 90.5 120 Feb ‘13
Hangzhou Boiler ? CFB Medium 450 85 75 Jan ‘08
Jiangxi Jianglian4 KG-65-450/5.29-FSWZ-I CFB 5.29 450 86 65 Jan ‘11
Jiangxi Jianglian JG-75/5.3-SW CFB 5.3 485 86 75 Apr ‘12
Jiangxi Jianglian JG-54-3.82/450-SW CFB 3.82 450 85 54 Aug ‘12
Jinan Boiler YG-75/3.82-T CFB 3.82 450 87 75 Jan ‘10
Nantong Wanda TG-75/5.3-T CFB 5.29 485 89 75 Jul ‘11
Shanghai Sifang SG-35/3.82-M439 CFB 3.82 450 86 35 Oct ‘11
Suzhou Hailu4 KG-120-540/13.34-FSWZ1 CFB 13.34 540 90.5 120 Feb ‘13
Taiyuan Boiler Grp. TG-130-9.8-T CFB 9.8 540 92 130 May ‘11
Taiyuan Boiler Grp. TG-75-3.82-T CFB 3.82 450 89 75 Jan ‘08
Wuxi Huaguang UG-110/9.8-J Vibr. Grate 9.8 540 91.5 110 Nov ‘10
Wuxi Huaguang UG-75/5.3-J Vibr. Grate 5.3 450 89 75 May ‘09
Wuxi Huaguang UG-75/3.82-J Vibr. Grate 3.82 450 87 75 Mar ‘07
Notes: this overview is not exhaustive; 1) boiler efficiency is usually reported as ‘at least x%’; 2) date at which power plant was
operational; 3) manufacture mostly by Jinan Boiler Grp.; 5) design by Wuhan Kaidi electric power co., ltd.; data source: [15].
37
Appendix B. SPSS output for regression of determinants of equipment cost
ANOVAb
Model Sum of Squares df Mean Square F Sig.
1 Regression 4.706E7 6 7842601.863 10.785 .000a
Residual 5.017E7 69 727169.636
Total 9.723E7 75
a. Predictors: (Constant), P, efficiency, MWel, Foreign tech dummy, Grate firing dummy, t
b. Dependent Variable: Investment RMB/kW
Coefficientsa
Model
Unstandardized Coefficients
Standardized
Coefficients
t Sig. B Std. Error Beta
1 (Constant) -4464.089 4139.227 -1.078 .285
P (MPa) 5.232 43.988 .017 .119 .906
Bolier efficiency (%) 169.376 48.962 .408 3.459 .001
MWel -27.558 11.876 -.225 -2.321 .023
Foreign tech dummy 904.795 308.957 .270 2.929 .005
Grate firing dummy -113.765 265.684 -.044 -.428 .670
t (yrs since 1/1/07) -397.054 86.363 -.596 -4.597 .000
a. Dependent Variable: Investment: RMB/kW

38
Appendix C. Model power plant: main parameters
Parameter Value Unit
General
Installed capacity 30 MW
Capacity factor 62.4 %
Net power generation 163,987 MWh/yr
Heat generation 750,000 GJ/yr
Technical lifetime 20 years
Revenue
Electricity Tariff, years 1-15, VAT incl. 750 RMB/MWh
Electricity Tariff, years 16-20, VAT incl. 415 RMB/MWh
Heat price, VAT incl. 33.9 RMB/GJ
Construction
Construction cost 8,000 RMB/kW
Static total investment 240,000,000 RMB
Construction interest 7,680,000 RMB
Static Construction investment 247,680,000 RMB
Discount rate 8 %
O&M
Fuel consumption (pure electric) 1.50 t/MWh
Fuel consumption (CHP) 1.65 t/MWh
Water and other material cost 2,231,538 RMB/yr
Maintenance (5% of investment/yr) 5,882,400 RMB/yr
Staff 4,320,000 RMB/yr
Other 2,800,000 RMB/yr
Taxes
VAT: electricity, CER, equipment, maintenance 17 %
VAT: heat, biomass fuel, water 13 %
Income tax, yrs 1-3 0 %
Income tax, yrs 4-6 12.5 %
Income tax, yrs 7-20 25 %
CER
CER price, VAT incl. 9 EUR/t
Exchange rate EUR/RMB 0.125 n/a
Grid emission factor power 0.893 t CO2-eq/MWh
Grid emission factor heat 0.0955 t CO2-eq/GJ
Crediting period 3x7 year


