Embed Size (px)
Citation preview

Diffusion and Advection of Radionuclides through a Cementitious
Backfill with Potential to be used in the Deep Disposal of Nuclear Waste
by
John Hinchliff
Doctoral Thesis
Submitted in partial fulfillment of the requirements
for the award of
Doctor of Philosophy of Loughborough University
March 2015
© by John Hinchliff 2015

i
ABSTRACT This work focuses on diffusion and advection through cementitious media, the work
arises from two research contracts undertaken at Loughborough University:
“Experiments to Demonstrate Chemical Containment” funded by UK NDA and the
“SKIN” project, funded by the European Atomic Energy Community's Seventh
Framework Programme.
Diffusion will be one of the most significant mechanisms controlling any radionuclide
migration from a nuclear waste, deep geological disposal facility. Advection may also
occur, particularly as the immediate post closure groundwater rebound and
equilibration proceeds but is expected to be limited by effective siting and
management during the operational phase of the facility. In this work advection is
investigated at laboratory scale as a possible shorter timescale technique for
providing insight into the much slower process of diffusion.
Radial techniques for diffusion and advection have been developed and the
developmental process is presented in some detail. Both techniques use a cylindrical
sample geometry that allows the radionuclide of interest to be introduced into a core
drilled through the centre of the test material. For diffusion the core is sealed and
submerged in a container of receiving solution which is sampled and analysed as the
radionuclide diffuses into it. For advection, a cell has been designed that allows
inflow via the central core to pass through the sample in a radial manner and be
collected as it exits from the outer surface. The radionuclide of interest can be
injected directly into the central core without significant disturbance to the advective
flow. Minor improvements continue to be made but both techniques have provided
good quality, reproducible results.
The majority of the work is concentrated on a potential cemetitious backfill known as
NRVB (Nirex Reference Vault Backfill) this is a high porosity, high calcium carbonate
content cementitious material. The radioisotopes used in this work are 3H (in tritiated
water), 137Cs, 125I, 90Sr, 45Ca, 63Ni, 152Eu, 241Am along with U and Th salts. In addition
the effect of cellulose degradation products (CDP) on radioisotope mobility was
investigated by manufacturing solutions where paper tissues were degraded in
water, at 80⁰C, in the absence of air and at high pH due to the presence of the
components of NRVB. All diffusion experiments were carried out under a nitrogen

ii
atmosphere. All advection experiments were undertaken using an eluent reservoir
pressurised with nitrogen where the system remained closed up to the point of final
sample collection.
Results for tritiated water and the monovalent ions of Cs and I were produced on a
timescale of weeks to months for both diffusion and advection. The divalent ions of
Sr, Ca and Ni produced results on a timescale of months to years.
Variations of the experiments were undertaken using the CDP solutions. The effects
of CDP were much more apparent at radiotracer concentration than the much higher
radiotracer with non-active carrier, concentration. In the presence of CDP Cs, I and
Ni were found to migrate more quickly; Sr and Ca were found to migrate more
slowly. Additional Sr experiments were undertaken at elevated ionic strength to
evaluate the effect of the higher dissolved solids content of the CDP solutions.
Some of the results for HTO, Cs, I and Sr have been modelled using a simple
numerical representation of the system in GoldSim to estimate effective diffusivity
and partition coefficient. The diffusion model successfully produced outputs that
were comparable to literature values. The advection model is not yet producing good
matches with the observed data but it continues to be developed and more
processes will be added as new results become available.
Autoradiography has been used to visualise the radionuclide migration and several
images are reproduced that show the fate of the radiotracers retained on the NRVB
at the end of the experiments.
As the experimental programme progressed it was clear that results could not be
produced in a suitable timescale for Eu, Am U and Th. These experiments have
been retained and will be monitored every six months until either diffusion is
detected or the volume of receiving liquid is inadequate to ensure the NRVB is
saturated.

iii
Acknowledgements First and foremost I want to thank my beautiful wife Julie for support not only when I
needed it most but all of the time, I could not have completed this without her and I
love her with all my heart. Also, to our lovely daughters, Jemma and Janna whose
lives have brought me immense pleasure and pride.
I must also express my gratitude to my Mum and late Father for bringing me into the
world and encouraging me to be the person I wanted to be. A special thank you to
my little sister Christine, who helped in her own special way at the time when I
became concerned about how I might make this whole endeavour a reality.
I feel indebted to Peter Warwick and Nick Evans for having sufficient faith in me to
believe that I could make a success of returning to a research environment for the
first time in over 25 years. Once I got started Nick was a great supervisor along with
our “new Prof” David Read who proved to be a valuable source of support and
intelligent intervention.
My most important friend and colleague, in the laboratory and office was Monica
Felipe-Sotelo, I remain very grateful for her help, advice and ideas. My old friend,
David Drury from Golder Associates must be mentioned as he provided the
horsepower for the modelling, making it look easy whilst working very hard.
I’ve had some great times in the laboratory with a bunch of new and for the most
part, much younger friends, including Mei Chew, Amy Young, Stephen Pendleton,
Larry Anjolaya, Hanna Tuovinen, Joan Sutherland, Julie Turner, Sneh Jain, James
Holt, Ollie Preedy, Hayley Gillings, Matt Isaacs, Darren Huxtable, Frank Dal Molin
and of course Ricky Hallam who coaxed me into the laboratory to get me started.
When I think back, I will remember smiling a lot.
I want to acknowledge the help, input and cheerful support of Steve Williams and
Rebecca Beard at the NDA, Tony Milodowski from BGS and Felix Brandt from
Jeulich who looked after my contributions to the SKIN project. Finally, I’m grateful to
Jan Tits of PSI whose comments caused me to look more critically at some aspects
of the work and improved my overall understanding as a consequence.

1
Contents 1.0 Introduction ........................................................................................................ 13
2.0 Background ........................................................................................................ 15
3.0 Geological Disposal Facilities ............................................................................. 21
3.1 The Waste Requiring Disposal ....................................................................... 21
3.1.1 Waste types ............................................................................................. 21
3.1.2 Waste quantities ....................................................................................... 21
3.1.3 The Presence of Cellulose and its Degradation Products in the Waste ... 23
3.2 The Rock Types .............................................................................................. 24
3.3 Geological Disposal Concepts – The Multi Barrier Approach ......................... 25
4.0 Cement and Concrete ........................................................................................ 27
4.1 History ............................................................................................................ 27
4.2 Chemistry ....................................................................................................... 28
4.3 Relevance to this Research ............................................................................ 31
4.4 NRVB .............................................................................................................. 32
5.0 Diffusion Experiments ........................................................................................ 35
5.1 Background: Diffusion, Partition and Ionic Strength ........................................ 35
5.2 Development of Experimental Methodology for Diffusion ............................... 40
5.3 Radial Diffusion Experiment – Detailed General Procedure for NRVB ........... 43
6.0 Advection Experiments ....................................................................................... 46
6.1 Background .................................................................................................... 46
6.2 Background to the Radial Advection Technique ............................................. 46
6.3 Radial Advection Trial Experimental Set Up ................................................... 50
6.4 Permanganate Advection Trial........................................................................ 52
6.5 Trial Results and Discussion........................................................................... 53
6.6 New Equipment and Design Issues Addressed .............................................. 54
7.0 Transport Modelling ............................................................................................ 57
7.1 Goldsim .......................................................................................................... 57
7.2 NRVB Radial Diffusion Simulation .................................................................. 58
7.3 Calculational Basis of the GoldSim Model ...................................................... 59
7.4 Modelling Procedure ....................................................................................... 62
7.4.1 Degree of Discretisation ........................................................................... 63
7.5 Important Limitations of the GoldSim Radial Diffusion Model ......................... 64
8.0 Autoradiography ................................................................................................. 66
9.0 Additional Information ......................................................................................... 67
9.1 Preamble to Sections 10 – 15 ......................................................................... 67
9.2 NRVB Equilibrated Water and CDP Solution .................................................. 68
9.3 Diffusion and Elution Profiles. ......................................................................... 73
2
10.0 Tritiated Water (HTO) ....................................................................................... 74
10.1 Background .................................................................................................. 74
10.2 Additional Experimental Details for HTO Diffusion Experiments ................... 75
10.3 Results HTO NRVB Diffusion with NRVB equilibrated water ........................ 75
10.4 HTO Advection Experiments......................................................................... 79
10.4.1 Additional Experimental Details for HTO NRVB Advection Experiments 79
10.4.2 Results ................................................................................................... 81
10.5 HTO CDP Advection Experiment Results ..................................................... 82
10.5.1 Additional Experimental Detail for the HTO CDP Advection Experiments .......................................................................................................................... 82
10.5.2 Results ................................................................................................... 84
10.6 GoldSim Transport Modelling of HTO Diffusion and Advection Results ....... 85
10.6.1 HTO NRVB Diffusion Model ................................................................... 85
10.6.2 HTO Advection Models .......................................................................... 88
11.0 Caesium ........................................................................................................... 93
11.1 Background .................................................................................................. 93
11.2 Additional Experimental Details for 137Cs Diffusion Experiments .................. 94
11.3 Results of 137Cs diffusion experiments. ......................................................... 96
11.3.1 Results of the 137Cs tracer NRVB diffusion experiment ........................ 96
11.3.2 Results of the 137Cs tracer CDP diffusion experiment .......................... 100
11.3.3 Results of the 137Cs tracer; CsNO3 carrier NRVB diffusion experiment 103
11.3.4 Results of the 137Cs tracer; CsNO3 carrier CDP diffusion experiment .. 106
11.3.5 Comparison of 137Cs tracer and tracer CsNO3 carrier experiments ...... 108
11.4 Cs in the Mixed Element Diffusion Experiments ......................................... 112
11.4.1 Additional information relevant to the mixed element diffusion experiments .................................................................................................... 112
11.4.2 Cs Results for the mixed element diffusion experiments in NRVB equilibrated water and CDP solution ............................................................... 112
11.5 GoldSim Modelling ...................................................................................... 116
11.5.1 Additional information relevant to the Cs NRVB diffusion modelling .... 116
11.5.2 GoldSim models for 137Cs tracer and tracer with carrier using NRVB equilibrated water ............................................................................................ 116
11.5.3 GoldSim models for 90Cs tracer and tracer with carrier using CDP solution ............................................................................................................ 119
11.6 Cs Diffusion Autoradiography ..................................................................... 121
11.7 Cs Diffusion Scanning Electron Microscopy ............................................... 124
11.8 137Cs Tracer Advection with NRVB Equilibrated Water ............................... 126
11.8.1 Additional information relevant to the 137Cs NRVB advection experiment ........................................................................................................................ 126
11.8.2 Results of the 137Cs NRVB advection experiment ................................ 128
11.9 Discussion of the Suite of 137Cs Diffusion and Advection Results............... 128

3
12.0 Iodine ............................................................................................................. 131
12.1 Background ................................................................................................ 131
12.2 Additional Experimental Details for 125I Diffusion Experiments ................... 132
12.3 Results of 125I diffusion experiments ........................................................... 134
12.3.1 Results of the 125I tracer KI carrier NRVB diffusion experiment with NRVB equilibrated water ............................................................................................ 135
12.3.2 Results of the 125I tracer with KI carrier CDP diffusion experiment ....... 137
12.4 Iodine in Mixed Element Diffusion Experiments .......................................... 139
12.4.1 Additional information relevant to the mixed element diffusion experiments .................................................................................................... 139
12.4.2 Iodine Results for the mixed element diffusion experiments in NRVB equilibrated water and CDP solution ............................................................... 139
12.5 125I Tracer Only NRVB Diffusion Experiment .............................................. 144
12.5.1 Results of 125I tracer only diffusion experiment ..................................... 144
12.6 GoldSim Modelling ...................................................................................... 146
12.6.1 Additional information relevant to the 125I NRVB diffusion modelling .... 146
12.7 Iodine Diffusion Autoradiography ................................................................ 148
12.8 125I Tracer Advection with CDP Solution ..................................................... 149
12.8.1 Additional information relevant to the 125I CDP advection experiment .. 149
12.9 Autoradiograph from the 125I CDP Solution Advection Experiment ............. 152
12.10 Discussion of the Suite of 125I Diffusion and Advection Results ................ 153
13.0 Strontium ........................................................................................................ 156
13.1 Background ................................................................................................ 156
13.2 Additional Experimental Details for 90Sr Diffusion Experiments .................. 157
13.3 Results of 90Sr Diffusion Experiments ......................................................... 160
13.3.1 Results of the 90Sr tracer only NRVB diffusion experiment .................. 160
13.3.2 Results of the 90Sr tracer only diffusion experiment using CDP solution ........................................................................................................................ 163
13.3.3 Results of the NRVB 90Sr tracer and Sr(NO3)2 carrier diffusion experiment using NRVB equilibrated water ....................................................................... 166
13.3.4 Results of the NRVB 90Sr tracer and Sr(NO3)2 carrier diffusion experiment using CDP solution .......................................................................................... 169
13.3.5 Results of the NRVB 90Sr tracer only diffusion experiment using gluconate in NRVB equilibrated water ............................................................. 172
13.3.6 Results of the NRVB 90Sr tracer only diffusion experiment using high ionic strength NRVB equilibrated water ................................................................... 175
13.3.7 Results of the NRVB 90Sr tracer only diffusion experiment using gradient ionic strength NRVB equilibrated water ........................................................... 177
13.3.8 Results of the repeated NRVB 90Sr tracer only diffusion experiment using CDP solution ................................................................................................... 179
13.4 Composite Plots Comparing the Sr Diffusion Experiments ........................ 181
13.4.1 Discussion of composite plots .............................................................. 181

4
13.5 GoldSim Models for Sr Diffusion Experiments ............................................ 184
13.5.1 Additional information relevant to the 90Sr NRVB diffusion modelling .. 184
13.5.2 90Sr tracer only NRVB equilibrated water diffusion modelling .............. 185
13.5.3 90Sr tracer only CDP solution diffusion modelling ................................. 187
13.5.4 90Sr tracer and Sr(NO)3 carrier NRVB equilibrated water diffusion modelling ......................................................................................................... 189
13.5.5 90Sr tracer and Sr(NO)3 carrier CDP solution diffusion modelling ......... 191
13.5.6 90Sr tracer only gluconate solution diffusion modelling ......................... 193
13.6 Autoradiographs of the 90Sr Diffusion Experiments .................................... 195
13.6.1 90Sr tracer only using NRVB equilibrated water.................................... 195
13.6.2 Autoradiographs from the 90Sr tracer, tracer carrier and gluconate experiments .................................................................................................... 195
13.7 90Sr Tracer Advection Experiments with NRVB Equilibrated Water and CDP solution ............................................................................................................... 198
13.7.1 Additional information relevant to the 90Sr advection experiments ....... 198
13.7.2 Run 1 90Sr tracer advection experiments with NRVB equilibrated water ........................................................................................................................ 198
13.7.3 Run 2 90Sr tracer advection experiments with NRVB equilibrated water ........................................................................................................................ 201
13.7.4 90Sr tracer advection experiments with CDP solution ........................... 202
13.7.5 Composite plots comparing the 90Sr tracer advection experiments ...... 204
13.8 Autoradiographs of the 90Sr Advection Experiments ................................... 206
13.9 GoldSim Models for Sr Advection Experiments .......................................... 209
13.9.1 Additional information relevant to the 90Sr NRVB advection modelling 209
13.10 Discussion of the Suite of 90Sr Diffusion and Advection Results ............... 211
14.0 Calcium .......................................................................................................... 214
14.1 Background ................................................................................................ 214
14.2 45Ca tracer Diffusion using NRVB equilibrated water .................................. 215
14.3 Autoradiographs from the 45Ca NRVB Tracer Diffusion .............................. 216
14.4 45Ca Tracer Advection with NRVB Equilibrated Water and CDP Solution .. 220
14.4.1 45Ca tracer advection using NRVB equilibrated water .......................... 220
14.4.2 45Ca tracer advection using CDP solution ............................................ 222
14.5 Autoradiographs from the 45Ca NRVB Tracer Advection Experiments ....... 223
15.0 Nickel ............................................................................................................. 227
15.1 Background ................................................................................................ 227
15.2 63Ni Diffusion Experiments .......................................................................... 229
15.2.1 Additional information for the 63Ni diffusion experiments ...................... 229
15.2.2 Results for the diffusion of 63Ni tracer with NiCl2 carrier using NRVB equilibrated water ............................................................................................ 229
15.2.3 Results for the diffusion of 63Ni tracer with NiCl2 carrier using CDP solution ............................................................................................................ 230

5
15.3 Ni in the Mixed Element Diffusion Experiments .......................................... 232
15.3.1 Additional information relevant to the mixed element diffusion experiments .................................................................................................... 232
15.4 63Ni Tracer Advection with CDP Solution .................................................... 234
15.4.1 63Ni tracer advection using NRVB equilibrated water ........................... 234
15.5 Discussion of the Suite of 63Ni Experiments ............................................... 236
16.0 Ongoing Experiments ..................................................................................... 238
17.0 Conclusions .................................................................................................... 239
18.0 Future Work ................................................................................................... 244
19.0 References ..................................................................................................... 247
APPENDIX 1 .......................................................................................................... 262
Data Tables ........................................................................................................ 262
APPENDIX 2 .......................................................................................................... 318
Detailed Information for Mass Balances and Discretisation ................................ 318
A. Mass Balance and Calculation Checks .................................................... 319
B. Details of Changing the Degree of Discretisation ........................................... 321

6
List of Figures Fig. 5.1 Schematic of diffusion apparatus ................................................................ 41 Fig. 5.2 Photographs of experimental set up ............................................................ 42 Fig. 5.3 Photograph of permanganate trial ............................................................... 42 Fig. 6.1 First axial advection experiment showing the clear inlet (left) and crystalline portlandite deposit on the outlet (right) ..................................................................... 47 Fig. 6.2 SEM image of the Portlandite deposit from the outlet and EDX output ....... 48 Fig. 6.3 Schematic of typical axial advection apparatus ........................................... 49 Fig. 6.4 Photograph of axial advection apparatus without outer steel jacket ............ 49 Fig. 6.5 Photograph of fully assembled axial advection apparatus with outer steel jacket, injector loop and applied confining pressure ................................................. 50 Fig. 6.6 Schematic of the radial advection set up ..................................................... 51 Fig. 6.7 Photograph of prototype radial advection cell ............................................. 51 Fig. 6.8 Photograph of permanganate advection showing flow mechanisms and pore water displacement .................................................................................................. 52 Fig. 6.9 Photograph showing extent of permanganate contact ................................ 53 Fig. 6.10 Photographs of advection cell components ............................................... 55 Fig. 6.11 Advection cell in operation......................................................................... 56 Fig. 7.1 Conceptual basis of the GoldSim model ..................................................... 58 Fig. 10.1 Plot of HTO activity concentration vs time for the NRVB equilibrated water diffusion experiment ................................................................................................. 76 Fig. 10.2 Early data plot of HTO activity concentration vs time for the NRVB equilibrated water diffusion experiment .................................................................... 76 Fig. 10.3 HTO Retention vs time for the NRVB equilibrated water diffusion experiment ............................................................................................................... 77 Fig. 10.4 Plot of HTO NRVB advection results using NRVB equilibrated water ....... 80 Fig. 10.5 Plot of recovered HTO from the NRVB advection experiment using NRVB equilibrated water ..................................................................................................... 80 Fig. 10.6 Plot of HTO NRVB advection results using CDP solution ......................... 82 Fig. 10.7 Plot of recovered HTO from the NRVB advection experiment using CDP solution ..................................................................................................................... 83 Fig. 10.8 GoldSim model of HTO NRVB diffusion experiments ................................ 85 Fig. 10.9 Early data from GoldSim model of HTO NRVB diffusion experiments ...... 86 Fig. 10.10 Early data showing minor deviations from GoldSim model of HTO NRVB diffusion experiments ............................................................................................... 87 Fig. 10.11 Observed and GoldSim predicted data for the advection of HTO in NRVB equilibrated water ..................................................................................................... 88 Fig. 10.12 Observed and GoldSim predicted data for the advection of HTO in CDP solution ..................................................................................................................... 89 Fig. 10.13 Observed and GoldSim predicted data for the advection of HTO in NRVB equilibrated water ..................................................................................................... 90 Fig. 11.1 Results of the NRVB 137Cs tracer only diffusion experiment using NRVB equilibrated water ..................................................................................................... 97 Fig. 11.2 Early data from the results of the NRVB 137Cs tracer only diffusion experiment using NRVB equilibrated water .............................................................. 98 Fig. 11.3 C/Cmax relative retention plot of the NRVB 137Cs tracer only diffusion experiment using NRVB equilibrated water .............................................................. 99 Fig. 11.4 Results of the NRVB 137Cs tracer only diffusion experiment using CDP solution ................................................................................................................... 100 Fig. 11.5 Early data from the results of the NRVB 137Cs tracer only diffusion experiment using CDP solution .............................................................................. 101

7
Fig. 11.6 C/Cmax relative retention plot of the NRVB 137Cs tracer only diffusion experiment using CDP solution .............................................................................. 102 Fig. 11.7 Results of the NRVB 137Cs tracer; CsNO3 carrier diffusion experiment using NRVB equilibrated water ........................................................................................ 103 Fig. 11.8 Early data from the results of the NRVB 137Cs tracer; CsNO3 carrier diffusion experiment using NRVB equilibrated water ............................................. 104 Fig. 11.9 C/Cmax relative retention plot of the NRVB 137Cs tracer; CsNO3 carrier diffusion experiment using NRVB equilibrated water ............................................. 105 Fig. 11.10 Results of the NRVB 137Cs tracer; CsNO3 carrier diffusion experiment using CDP solution ................................................................................................. 106 Fig. 11.11 Early data from the results of the NRVB 137Cs tracer; CsNO3 carrier diffusion experiment using CDP solution ................................................................ 107 Fig. 11.12 C/Cmax relative retention plot of the NRVB 137Cs tracer; CsNO3 carrier diffusion experiment using CDP solution ................................................................ 107 Fig. 11.13 Comparative relative retention plot of 137Cs diffusion data for the NRVB equilibrated water experiments .............................................................................. 109 Fig. 11.14 Early data comparative relative retention plot of 137Cs diffusion experiments using NRVB equilibrated water .......................................................... 110 Fig. 11.15 Comparative relative retention plot of 137Cs diffusion data for the CDP solution experiments .............................................................................................. 111 Fig. 11.16 Early data comparative relative retention plot of 137Cs diffusion experiments using CDP solution ............................................................................ 111 Fig. 11.17 Averaged Cs Results for the mixed element diffusion experiments in NRVB equilibrated water and CDP solution ........................................................... 112 Fig. 11.18 Cs raw data from the mixed element diffusion experiments in NRVB equilibrated water ................................................................................................... 114 Fig. 11.19 Cs early raw data from the mixed element diffusion experiments in NRVB equilibrated water ................................................................................................... 114 Fig. 11.20 Cs raw data from the mixed element diffusion experiments in NRVB equilibrated water ................................................................................................... 115 Fig. 11.21 Cs early raw data (unaveraged) from the mixed element diffusion experiments in CDP solution ................................................................................. 115 Fig. 11.22 Experimental and modelled NRVB diffusion curves for 137Cs at tracer and tracer carrier (CsNO3) concentrations in NRVB equilibrated water ........................ 117 Fig. 11.23 Early experimental and modelled NRVB diffusion curves for 137Cs at tracer and tracer carrier (CsNO3) concentrations in NRVB equilibrated water ................. 118 Fig. 11.24 Experimental and modelled NRVB diffusion curves for 137Cs at tracer and tracer carrier (CsNO3) concentrations in CDP solution ........................................... 119 Fig. 11.25 Early experimental and modelled NRVB diffusion curves for 137Cs at tracer and tracer carrier (CsNO3) concentrations in CDP solution .................................... 120 Fig. 11.26 Unenhanced digital autoradiograph of the distribution of 137Cs in the NRVB cylinder used in the diffusion experiments ................................................... 122 Fig. 11.27 ImageJ enhanced digital autoradiograph of the distribution of 137Cs in the NRVB cylinder used in the diffusion experiments ................................................... 123 Fig. 11.28 Micrograph showing calcite (red) and possibly aragonite (yellow) in some localised areas and amorphous magnesium silicates (green), wax seal is the flat sheet lower left ....................................................................................................... 125 Fig. 11.29 Some of the “hot spots” at the edge of the solid corresponded to voids coated with Ca(OH)2 (portlandite) ........................................................................... 125 Fig. 11.30 Results of the 137Cs tracer advection using NRVB equilibrated water ... 127 Fig. 11.31 Recovery plot of the 137Cs tracer advection using NRVB equilibrated water ............................................................................................................................... 127

8
Fig. 12.1 Results of the NRVB 125I tracer; KI carrier diffusion experiment using NRVB equilibrated water ................................................................................................... 135 Fig. 12.2 Early data from the NRVB 125I tracer; KI carrier diffusion experiment using NRVB equilibrated water ........................................................................................ 136 Fig. 12.3 C/Cmax relative retention plot of the NRVB 125I tracer; KI carrier diffusion experiment using NRVB equilibrated water ............................................................ 136 Fig. 12.4 Results of the NRVB 125I tracer; KI carrier diffusion experiment using CDP solution ................................................................................................................... 137 Fig. 12.5 Early data from the NRVB 125I tracer; KI carrier diffusion experiment using CDP solution .......................................................................................................... 138 Fig. 12.6 C/Cmax relative retention plot of the NRVB 125I tracer; KI carrier diffusion experiment using CDP solution .............................................................................. 138 Fig. 12.7 Averaged I Results for the mixed element diffusion experiments in NRVB equilibrated water and CDP solution ...................................................................... 140 Fig. 12.8 C/Cmax relative retention plots for the NRVB and CDP diffusions ............ 140 Fig. 12.9 I Raw data (un-averaged) for the mixed element diffusion experiments in NRVB equilibrated water ....................................................................................... 142 Fig. 12.10 I Early raw data (un-averaged) for the mixed element diffusion experiments in NRVB equilibrated water ............................................................... 142 Fig. 12.11 I Raw Data (un-averaged) for the mixed element diffusion experiments in CDP solution ......................................................................................................... 143 Fig. 12.12 I Early raw data (un-averaged) for the mixed element diffusion experiments in CDP solution ................................................................................. 143 Fig. 12.13 Results from the NRVB 125I tracer only diffusion experiment using NRVB equilibrated water ................................................................................................... 144 Fig. 12.14 C/Cmax relative retention plot of the NRVB 125I tracer experiment using NRVB equilibrated water ........................................................................................ 145 Fig. 12.15 Experimental and modelled diffusion curves for 125I at tracer and tracer carrier (KI) concentrations in NRVB equilibrated water and CDP solution ............. 146 Fig. 12.16 Early experimental and modelled curves for 125I at tracer and tracer carrier (KI) concentrations in NRVB equilibrated water and CDP solution ........................ 147 Fig. 12.17 ImageJ enhanced digital autoradiograph of the distribution of 125I in the NRVB cylinder used in the carrier diffusion experiments ........................................ 149 Fig. 12.18 Results of the 125I tracer only advection using CDP solution ................. 150 Fig. 12.19 Recovery plot of the 125I tracer only advection using CDP solution ....... 151 Fig. 12.20 Photograph and autoradiograph of 125I advection using CDP solution .. 152 Fig. 12.21 Overlay of the photograph and autoradiographs from fig. 12.20 ........... 153 Fig. 13.1 Results of the NRVB 90Sr tracer only diffusion experiment using NRVB equilibrated water ................................................................................................... 161 Fig. 13.2 Early data from the NRVB 90Sr tracer only carrier diffusion experiment using NRVB equilibrated water .............................................................................. 162 Fig. 13.3 C/Cmax relative retention plot of the NRVB 90Sr tracer only diffusion experiment using NRVB equilibrated water ............................................................ 162 Fig. 13.4 Results of the NRVB 90Sr tracer only diffusion experiment using CDP solution ................................................................................................................... 164 Fig. 13.5 Early data from the NRVB 90Sr tracer only diffusion experiment using CDP solution ................................................................................................................... 164 Fig. 13.6 C/Cmax relative retention plot of the NRVB 90Sr tracer only diffusion experiment using CDP solution .............................................................................. 165 Fig. 13.7 Results of the NRVB 90Sr tracer and Sr(NO3)2 carrier diffusion experiment using NRVB equilibrated water .............................................................................. 166 Fig. 13.8 Early data from the NRVB 90Sr tracer and Sr(NO3)2 carrier diffusion experiment using NRVB equilibrated water ............................................................ 167
9
Fig. 13.9 C/Cmax relative retention plot of the NRVB 90Sr tracer and Sr(NO3)2 carrier diffusion experiment using NRVB equilibrated water ............................................. 167 Fig. 13.10 Results of the NRVB 90Sr tracer and and Sr(NO3)2 carrier diffusion experiment using CDP solution .............................................................................. 169 Fig. 13.11 Early data from the NRVB 90Sr tracer and and Sr(NO3)2 carrier diffusion experiment using CDP solution .............................................................................. 170 Fig. 13.12 C/Cmax relative retention plot of the NRVB 90Sr tracer and Sr(NO3)2 carrier diffusion experiment using CDP solution ................................................................ 170 Fig. 13.13 Results of the NRVB 90Sr tracer only diffusion experiment using gluconate in NRVB equilibrated water .................................................................................... 172 Fig. 13.14 Early data from the NRVB 90Sr tracer only diffusion experiment using gluconate in NRVB equilibrated water .................................................................... 173 Fig. 13.15 C/Cmax relative retention plot of the NRVB 90Sr tracer only diffusion experiment using gluconate in NRVB equilibrated water ........................................ 173 Fig. 13.16 Results of the NRVB 90Sr tracer only diffusion experiment using high ionic strength NRVB equilibrated water .......................................................................... 175 Fig. 13.17 C/Cmax relative retention plot of the NRVB 90Sr tracer only diffusion experiment using high ionic strength NRVB equilibrated water .............................. 176 Fig. 13.18 Results of the NRVB 90Sr tracer only diffusion experiment using gradient ionic strength NRVB equilibrated water .................................................................. 177 Fig. 13.19 C/Cmax relative retention plot of the NRVB 90Sr tracer only diffusion experiment using gradient ionic strength NRVB equilibrated water ........................ 178 Fig. 13.20 Results of the repeated NRVB 90Sr tracer only diffusion experiment using CDP solution .......................................................................................................... 179 Fig. 13.20 C/Cmax relative retention plot of the repeated NRVB 90Sr tracer only diffusion experiment using CDP solution ................................................................ 180 Fig. 13.21 Composite plot of data from the series of Sr diffusion experiments ....... 181 Fig. 13.22 Composite plot of early data from the series of Sr diffusion experiments ............................................................................................................................... 182 Fig. 13.23 Experimental and modelled NRVB diffusion curves for 90Sr at tracer concentration in NRVB equilibrated water .............................................................. 185 Fig. 13.24 Early data from the experimental and modelled NRVB diffusion curves for 90Sr at tracer concentration in NRVB equilibrated water ........................................ 186 Fig. 13.25 Experimental and modelled NRVB diffusion curves for 90Sr at tracer concentration in CDP solution ................................................................................ 187 Fig. 13.26 Early data from the experimental and modelled NRVB diffusion curves for 90Sr at tracer concentration in CDP solution ........................................................... 188 Fig. 13.27 Experimental and modelled NRVB diffusion curves for 90Sr tracer and Sr(NO3)2 carrier using NRVB equilibrated water .................................................... 189 Fig. 13.28 Early data from the experimental and modelled NRVB diffusion curves for 90Sr tracer and Sr(NO3)2 carrier using NRVB equilibrated water ............................ 190 Fig. 13.29 Experimental and modelled NRVB diffusion curves for 90Sr tracer and Sr(NO3)2 carrier using CDP solution ....................................................................... 191 Fig. 13.30 Early data from the experimental and modelled NRVB diffusion curves for 90Sr tracer and Sr(NO3)2 carrier using NRVB equilibrated water ............................ 192 Fig. 13.31 Experimental and modelled NRVB diffusion curves for 90Sr at tracer concentration in gluconate solution ........................................................................ 193 Fig. 13.32 Early data from the experimental and modelled NRVB diffusion curves for 90Sr at tracer concentration in gluconate solution ................................................... 194 Fig. 13.33 Autoradiograph of NRVB cylinder from90Sr tracer only using NRVB equilibrated water experiment (a) unenhanced and (b) ImageJ enhanced............. 195 Fig. 13.34 Autoradiographs (unenhanced) from the NRVB/CDP 90Sr tracer, tracer carrier and gluconate experiments ......................................................................... 196

10
Fig. 13.35 Autoradiographs (ImageJ enhanced) from the NRVB/CDP 90Sr tracer, tracer carrier and gluconate experiments ............................................................... 197 Fig. 13.36 Run 1 results of the 90Sr tracer advection experiments using NRVB equilibrated water ................................................................................................... 199 Fig. 13.37 Recovery plot run 1 of the 90Sr tracer advection experiments using NRVB equilibrated water ................................................................................................... 199 Fig. 13.38 Run 2 results of the 90Sr tracer advection experiments using NRVB equilibrated water ................................................................................................... 201 Fig. 13.39 Recovery plot run 2 of the 90Sr tracer advection experiments using NRVB equilibrated water ................................................................................................... 202 Fig. 13.40 Results of the 90Sr tracer advection experiments using CDP solution ... 203 Fig. 13.41 Recovery plot for the 90Sr tracer advection experiments using CDP solution ................................................................................................................... 203 Fig. 13.42 Composite plot comparing the 90Sr tracer advection experiments ......... 204 Fig. 13.43 Composite plot comparing recovery of the 90Sr tracer during the advection experiments ............................................................................................................ 205 Fig. 13.44 Autoradiographs (unenhanced) from the 90Sr tracer advection experiments ............................................................................................................................... 206 Fig. 13.45 ImageJ enhanced autoradiographs from the 90Sr tracer advection experiments ............................................................................................................ 208 Fig. 13.46 Results and GoldSim model for run 2 of the 90Sr tracer advection experiments using NRVB equilibrated water ( observed modelled) ................. 210 Fig. 13.47 Results and GoldSim model for the 90Sr tracer advection experiment using CDP solution ( observed modelled) ................................................................. 210 Fig. 13.48 Results and GoldSim model (assume 10000 Bq at start) for the 90Sr tracer advection experiment using CDP solution ( observed modelled) .................... 211 Fig. 14.1 Unenhanced autoradiographs from the 45Ca diffusion experiment using NRVB equilibrated water (a) shielded, (b) unshielded ............................................ 216 Fig. 14.2 ImageJ enhanced autoradiographs from the 45Ca diffusion experiment using NRVB equilibrated water (a) shielded, (b) unshielded .................................. 216 Fig. 14.3 ImageJ enhanced (shielded) autoradiograph and intensity plot from the 45Ca diffusion experiment using NRVB equilibrated water ..................................... 218 Fig. 14.4 ImageJ enhanced (unshielded) autoradiograph and intensity plot from the 45Ca diffusion experiment using NRVB equilibrated water ..................................... 219 Fig. 14.5 Results of the 45Ca tracer advection experiments using NRVB equilibrated water ...................................................................................................................... 221 Fig. 14.6 Recovery plot the 45Ca tracer advection experiments using NRVB equilibrated water ................................................................................................... 221 Fig 14.7 Flow rates recorded during the 45Ca tracer advection experiments using CDP solution .......................................................................................................... 223 Fig. 14.8 Enhanced autoradiograph from the 45Ca tracer advection experiment using NRVB equilibrated water ........................................................................................ 224 Fig. 14.9 Enhanced autoradiographs with central core (a) unshielded and (b) shielded from the 45Ca tracer advection experiment using CDP solution ............... 224 Fig. 15.1 Photograph and autoradiograph of Ni diffusion using NRVB equilibrated water ...................................................................................................................... 230 Fig. 15.2 Results for the diffusion of 63Ni tracer with NiCl2 carrier using CDP solution ............................................................................................................................... 231 Fig. 15.3 Relative retention plot for the diffusion of 63Ni tracer with NiCl2 carrier using CDP solution .......................................................................................................... 231 Fig. 15.4 Ni Raw data for the mixed element diffusion experiments in NRVB equilibrated water ................................................................................................... 233

11
Fig. 15.5 Ni raw data for the mixed element diffusion experiments in CDP solution ............................................................................................................................... 233 Fig. 15.6 Results of the 63Ni tracer advection experiments using CDP solution ..... 235 Fig. 15.7 Recovery plot for the 63Ni tracer advection experiments using CDP solution ............................................................................................................................... 236

12
List of Tables Appearing in the Main Text Table 3.1 Estimate of radioactive waste eventually requiring disposal ..................... 22 Table 4.1 Cement nomenclature .............................................................................. 29 Table 4.2 Main mineral phases of interest ................................................................ 29 Table 9.1 Composition of NRVB equilibrated water and CDP solution ..................... 70 Table 9.2 Concentrations of CDP components during the equilibration phase of two advection experiments ............................................................................................. 72 Table 11.1 Radioisotopes of Cs in the UK waste inventory at 01/04/2010 ............... 93 Table 12.1 I29I in the UK waste inventory at 01/04/2010 ......................................... 131 Table 13.1 90Sr in the UK waste inventory at 01/04/2010 ....................................... 156 Table 14.1 41Ca in the UK waste inventory at 01/04/2010 ...................................... 214 Table 15.1 59Ni and 63Ni in the UK waste inventory at 01/04/2010 ......................... 227 Table 16.1 Ongoing diffusion experiments ............................................................. 238 Table 17.1 Effective Diffusivity ( ) and partition ratios ( ) derived from the models in comparison with literature values ....................................................................... 239

13
1.0 Introduction This work arises from two research contracts:
Experiments to Demonstrate Chemical Containment – (UK NDA contract
number NPO004404).
And:
Slow Processes in Close to Equilibrium Conditions for Radionuclides in
Water/Solid Systems of Relevance to Nuclear Waste Management (the
“SKIN” project), as part of the European Atomic Energy Community's
Seventh Framework Programme (FP7/2007-2011).
Both of the contracts seek in part, to address the practicality, functionality and
reliability of cementitious chemical barriers in the development of geological disposal
facilities (GDF) for nuclear industry waste. In addition the associated experimental
programmes are expected to provide useful data for GDF performance assessment
models and calculations.
The technical and political background to this research is detailed in sections 2.0 to
4.0. It is important to recognise that the development of radial diffusion and
advection techniques to study radionuclide mobility in cementitious media was a
significant component of this research. Sections 5.0 and 6.0 describe the
development and early trials in detail. Section 7.0 provides information about the
conceptualisation of the radial systems in preparation for numerical modelling and
gives details of the diffusion and advection models used. Section 8.0 describes the
autoradiography technique used to visualise the migration and fate of the
radionuclides. Useful background data is gathered together and reported in section
9.0. Individual sections are then dedicated to each radionuclide where results could
be obtained on a timescale of a few months to a few years. The nature of the
research meant that an iterative and oppportunistic approach to the experimentation
was adopted to provide an adequate range of interesting results. The disadvantage
with this type of approach was that some experiments were missed out and
complete datasets are not always available.

14
The research reported herein is best envisaged as a short term window on a long
term experimental programme. It is clear that some experiments can only produce
results on timescales exceeding the duration of a PhD study and that the extended
duration of the experimental programme must be acknowledged when reading this
work. The full set will be completed over time. Where experiments remain ongoing,
they are detailed in section 16.0. Conclusions are presented in section 17.0 and
recommendations for future work are given in section 18.0.

15
2.0 Background The UK nuclear industry has generated radioactive waste since the 1940s, initially
from defence sector activities associated with developing a nuclear deterrent and
subsequently from the generation of electricity using nuclear reactors. It should be
remembered that until the late twentieth century the nuclear industry in the UK was
almost totally confined to the public sector and attempts to deal with the waste
generated by the industry somewhat subject to political influence. Governments have
come and gone and various initiatives to give the industry a future and deal with the
legacy of accumulated waste and outdated infrastructure have failed to successfully
address the problems.1
The last serious attempt to develop a long term solution, the Nirex (Nuclear Industry
Research Executive) Sellafield site investigations of the late 1980 and 1990s was
terminated in 1997. The termination was assured when an appeal against the
planning application refusal for an underground laboratory (also known as a rock
characterisation facility or RCF) was dismissed following a Public Inquiry 2.
The detailed reasons for refusal will not be reproduced here but after linking the RCF
development to any future GDF development, several technical issues pertinent to
the GDF were highlighted in the conclusions of the Planning Inspector’s report. The
concept of “chemical containment” is mentioned twice:
“…I consider that Nirex's emphasis on the relatively novel chemical containment
concept in the mixed artificial and natural barrier suggests a lack of confidence in the
geosphere.”
And,
“The last assessment published in 1995 assumes that the artificial chemical barrier
would have a very significant retarding effect on release of the longer-lived
radionuclides from the repository, and yet the barrier is new and untried and the
assumptions in the assessment entail great simplifications and may be non-
conservative.”

16
One of the proposed components of the artificial chemical barrier to which the above
statements refer is a cementitious backfill material known as NRVB (Nirex Reference
Vault Backfill).3 Effective testing of this backfill and its containment capability for a
series of radionuclides are together the focus of the majority of this PhD thesis.
The Inspector’s comments provided impetus for research into the potential function
of chemical barriers and whether they could be practically realised. These points are
stressed here because they articulate a significant part of the motivation for the
detailed research activities and results presented herein and initiated the current UK
research effort in this area.
It is important to be aware of the political dimension and its impact when undertaking
any technical or scientific work in the nuclear sector. This was keenly observed by
the technical assessor for the previously mentioned Public Inquiry; Colin Knipe, who
belatedly made the following comment which is clear in its inference that the political
considerations outweighed the financial and technical issues:4
“Early in 1997 John Gummer, Secretary of State for the Environment, formally
rejected the Appeal. More than 10 years of work and several hundred million pounds
of research, investigations and planning by Nirex were frustrated and the future of
nuclear waste disposal in the UK thrown into confusion.”
Whatever the reality of the situation it was clear that a new approach able to bring on
board politicians and the public would be needed if an effective solution was to be
successfully developed.
The House of Lord’s Review in 1999 acknowledged the technical and scientific
shortcomings of the previous attempts to deal with radioactive waste disposal and
stated that the absence of stakeholder engagement as a major consideration must
be addressed if any future plans were to succeed.5 Or perhaps more bluntly, the
failure to engage the wider public in a positive (or at least not a negative) way, has
resulted in politicians being unable to support their own or their predecessors’
initiatives.6
In 2001 a new programme of policies – Managing Radioactive Waste Safely
(MRWS) – was launched by the government. 7 The aims were stated as:

17
“…provide long term protection to people and the environment; based on sound
science, value for money and above all an approach which would be open and
transparent to inspire public confidence.”
The use of the term “sound science” should be viewed as a government commitment
to undertaking the required research and development and moving to a technically
viable solution. It also implied that previous attempts to deal with the issue may not
have been entirely based on sound science.
This was followed in July 2002 by a Department of Trade and Industry (DTI) White
Paper entitled Managing the Nuclear Legacy which laid out a strategy for action with
suggested timescales.8
The following year (July 2003), as part of the MRWS programme, what remained of
Nirex published a technical note recommending that GDF site selection and
investigations progress in a stepwise and iterative manner.9 In the same year the
Committee on Radioactive Waste Management (CoRWM) was established with a
wide ranging brief to review and make preliminary assessments of all nuclear
industry waste management options. Within two years of commencement, CoRWM
was being criticised by the House of Lords Science and Technology Committee
noting that: 10
“…we are astonished that the Committee [CoRWM} should have been told to set
about this task with a blank sheet of paper”
And in relation to the scientific, technical and engineering skills possessed by
members of CoRWM,
“With the greatest respect to the members of CoRWM, who possess expertise in
many areas, we do not feel that these essential skills are adequately represented
within CoRWM”.
Despite this criticism which reflected the ever present desire to revert to the tried and
failed methods of the past, CoRWM set about delivering its remit.

18
All management options for radioactive waste were considered and there was
successful engagement of the public and interested parties. In 2004 (prior to the
criticism highlighted above), CoRWM published a “Long List of Options” 11 and
commenced an extensive programme of consultation including public meetings
throughout the country to arrive at the following short list of four options, presented to
government in July 2006.12
- long-term interim storage.
- near-surface disposal of short-lived wastes.
- deep geological disposal.
- phased deep geological disposal.
An important feature of the long list was the consideration and dismissal of options
such as disposal in space and disposal at sea, that were considered technically
unacceptable but widely believed to be realistic in the wider community accustomed
to reading scare stories in the media. These issues of perception and stakeholder
interest have been the subject of much discussion in the relevant literature and their
importance was eventually recognised by Nirex in 2002 13 and further expanded
upon by CoRWM in 2011 as a result of the experience gained from the public
consultations.14
In October 2006 the government accepted CoRWM’s recommendation that
geological disposal coupled with safe and secure interim storage should be the long-
term management option for the UK’s higher activity wastes.15
It is worth noting that the current (2014) membership of CoRWM has significantly
greater scientific, technical and engineering representation than its original
incarnation. The change of emphasis reflecting the shift to assessment and
evaluation of the selected option.16
The Nuclear Decommissioning Authority (NDA) was created in 2005 17 to take
responsibility for legacy issues including infrastructure decommissioning and was
also given responsibility for funding, planning and implementing geological disposal.
The current government, as did its predecessor, remains committed to the NDA and
an approach based on stakeholder willingness to participate.

19
Bringing this summary up to date; in 2007 the government held a public consultation
on a framework for implementing geological disposal and in June 2008 published,
Managing Radioactive Waste Safely: A framework for implementing geological
disposal.1 This was supported by CoRWM in its review published in June 2008.18 In
October 2009, the Joint Research Centre of the European Commission published its
report “Geological Disposal of Radioactive Waste: Moving Towards Implementation”.
It concluded; “Our scientific understanding of the processes relevant for geological
disposal is developed well enough to proceed with step-wise implementation.”19
Questions about the concept, practicality, functionality and reliability of a chemical
barrier remained and additional research was required. Consequently, in 2009
Loughborough University was commissioned by NDA as part of its research
programme, 20 to undertake a series of experiments to demonstrate chemical
containment. The results of several of the experiments investigating the migration
behaviour of Cs, I, Th, U, Ni and Eu through the potential backfill material NRVB
form a significant part of this thesis. The EU, using funding from the SKIN project, as
part of the European Atomic Energy Community's Seventh Framework Programme
(FP7/2007-2011) also commissioned Loughborough University to undertake a series
of similar experiments investigating the migration behaviour and slow kinetics of Sr,
Am, Ca, Eu and Se in cementitious media. The currently available results from the
SKIN experiments make up the remainder of this thesis.
In the course of this research NRVB samples have been subjected to diffusion and
advective flows similar to and exceeding those likely to be experienced within the
GDF near field under hydrogeologically equilibrated and equilibrating conditions.
Individual processes including solubility, sorption, precipitation and incorporation
have also been considered. The behaviour of the range of radionuclides was
observed, increasing the understanding and predictability of migration rates and
mechanisms. It is recognised that some of the experiments will require extended
timescales, inevitably exceeding the duration of a PhD study.
The NDA is currently engaged in the preparatory work and planning the work
programme whilst setting up the management infrastructure to deliver it. 12 In March
2010 it published “Geological Disposal: Steps Towards Implementation” which
provides information about the variants of geological disposal available to the UK
and likely developmental scenarios.

20
The political process in which the NDA is engaged is not the subject of this thesis but
it continues to be a significant influence on overall timescales and direction. Most
recently, the Cumbria County Council decision (January 2013) to reject plans to find
a suitable site within the County only served to reiterate the point.21

21
3.0 Geological Disposal Facilities The section provides a brief description of GDFs, outlining the main issues and
criteria requiring consideration, from initial concepts to realisation. As stated in
section 2.0, political considerations and stakeholder issues are major concerns but
they are not the focus of this thesis and will not be discussed further.
When considering the technical aspects of GDFs the important issues are the: 22 23
• amount of radioactive waste requiring geological disposal;
• types of rock that potentially could host a facility; and
• potential geological disposal concepts.
These three issues are discussed in more detail below.
3.1 The Waste Requiring Disposal
3.1.1 Waste types The following are the relevant UK definitions: 24 25
Very low level waste (VLLW): is a subset of LLW, formally defined such that each
0.1 m3 contains less than 400 kBq of beta/gamma activity or single items contain
less than 40kBq of beta/gamma activity enabling it to be safely disposed with
ordinary refuse. No alpha emitting waste is permitted to be disposed as VLLW.
Low level Waste (LLW): is higher than VLLW but below 4 kBq g-1 of alpha or 12
kBq g-1 of beta/gamma nuclides.
Intermediate level waste (ILW): is more active than the LLW limits but does not
meet the heat generating criteria required to be classified as high level waste.
High level waste (HLW): generates heat so that it must be cooled, spent nuclear
fuel is HLW.
3.1.2 Waste quantities The current NDA estimate of the inventory of radioactive waste eventually requiring
disposal is shown in table 3.1 below and is usually referred to as “the baseline
inventory as at 1 April 2007 comprising the following radioactive wastes and
materials”.26

22
Materials Notes Packaged volumeRadioactivity
(1.4.2040)
m3 % TBq %
High Level Waste (HLW)
1, 2, 3, 5
1,400 0.30% 36,000,000 41.30%
Intermediate Level Waste (ILW)
1, 2, 5 364,000 76.30% 2,200,000 2.50%
Low Level Waste (not for Low Level Waste Repository)
(LLW)
1, 2, 5 17,000 3.60% <100 0.00%
Spent nuclear fuel 1, 4, 5 11,200 2.30% 45,000,000 51.60%
Plutonium 1, 4, 5 3,300 0.70% 4,000,000 4.60% Uranium 1, 4, 5 80,000 16.80% 3,000 0.00%
Total 476,900 100% 87,200,000 100%
Table 3.1 Estimate of radioactive waste eventually requiring disposal Notes to Table 3.1
1. Quantities of radioactive materials and wastes are consistent with the 2007 UK Radioactive Waste Inventory (UKRWI). 2. Packaging assumptions for HLW, ILW and LLW not suitable for disposal at the existing national LLWR are taken from the 2007 UKRWI. Note that they may change in the future. 3. The HLW packaged volume may increase when the facility for disposing the canisters, in which the vitrified HLW is currently stored, has been implemented. 4. Packaging assumptions for plutonium, uranium and spent nuclear fuels are taken from the 2005 CoRWM Baseline Inventory. Note that they may change in the future. 5. Radioactivity data for wastes and materials was derived using the 2007 UK Radioactive Waste Inventory. 2040 is the assumed start date for the geological disposal facility. 6. It should be noted that at present the Baseline Inventory is based on UK Inventory figures, and as such, currently contains waste expected to be managed under the Scottish Executive’s policy of interim near-surface, near-site storage as announced on 25 June 2007. The figures in table 3.1 should be seen as estimates based on current assumptions
about existing waste quantities. If a new generation of nuclear power stations were
to be constructed in the UK additional waste to that documented above would result.
The current UK NDA plans for a GDF concentrate on disposal of the comparatively
large volume of ILW.

23
3.1.3 The Presence of Cellulose and its Degradation Products in the Waste
UK radioactive waste inventory 26 estimates that current mass of cellulosic material
within ILW is 2000 tonnes and within LLW, between 100,000 and 125,000 tonnes.
The w/w content of cellulosic materials in ILW and LLW were given as 0.7 % and 2 -
2.5%, respectively. The total load of other organics for both ILW and LLW was
estimated at 36,200 tonnes within a total of some 5,000,000 tonnes requiring
disposal. The cellulose will degrade under GDF conditions 27 and previous work has
shown that the cellulose degradation products (CDP) have the potential to affect
cementitious materials and the mobility of some species present in the waste.
These effects include solubility enhancement by complexation, influence on the
sorption to the cement and rate of incorporation; 28 modification of the ionic strength
of the pore water by complexing metals from the cement and the consequent
acceleration of its structural degradation.29
In the current literature much of the attention regarding the effect of CDP has been
focussed on iso-saccharinic acid even though other short chain carboxylic acids in
the mixture are often present at higher concentrations. Moreover, in previous work
carried out by the Loughborough group 30 when the effect on the solubility of Th was
compared for CDP mixtures and solutions of ISA of equivalent concentration, the
effect of the CDP mixture was almost 50 times higher than ISA. This suggests that
mobilisation is dependent on more than one component of the CDP mixture.
Reference is made, where relevant, to more specific literature in later sections.
NDA, being familiar with the work already undertaken on ISA wanted to investigate
more realistic scenarios as the formulation and selection of a suitable backfill
medium must progress. NDA requested that the study of the effect of CDP on
diffusion should be carried out in organic mixtures that reflect in a realistic way the
compositions of the cellulose degradation products in solution, instead of focussing
on only one of them, i.e. ISA. The amount of cellulosic material used in these studies
(see section 9.2) is a realistic representation of the load expected in the UK
inventory.

24
3.2 The Rock Types
Even if generous allowance was made for the spacing of waste packages, the
volumes of waste for disposal detailed in the table are not significant in construction
terms. A UK GDF, assuming no disposal of HLW or spent fuel, will be to all intents
and purposes, a small underground mining and backfilling operation. Technologies
to mine all rock types are highly developed and available now.
The rock types under consideration fall into 3 generic categories: 16 31
Higher strength or crystalline rocks: e.g. basalt and granite, having low matrix
permeability and any water flow that occurs is via fractures in the rock mass. The
Finnish and Swedish disposal programmes plan to construct GDFs in this type of
host rock.
Lower strength sedimentary rocks: e.g. clays and mudstones having physically
uniform structures, low permeability and low fracture frequency, water flow occurs
through the whole structure. The Swiss GDF design will utilise this type of rock.
Evaporites: e.g. Halite, having no available water except that trapped in the
structure at formation and saturated with respect to the composition of the rock
mass, water flow is undetectable. Evaporite mines exhibit “creep” where the rock
appears to flow and close mine openings on a timescale of decades. This property
could be useful in ensuring a “natural closure” of a GDF. It is important to note that
evaporites are usually very soluble in water so hydrogeological and hydrological
isolation is a prerequisite if this rock type is to be used. The Waste Isolation Pilot
Plant in New Mexico, US where waste has been disposed for more than a decade is
constructed in this type of rock.
In the absence of a selected site it is not currently possible to assign a rock type for
the UK GDF. It is worth noting that the Nirex site investigations at Sellafield in the
1990s targeted the high strength, crystalline Borrowdale Volcanic geological
sequence.

25
3.3 Geological Disposal Concepts – The Multi Barrier Approach
A range of disposal concepts or ideas needs to be considered in relation to the
potential geological settings. However it is anticipated that all concepts will utilise a
multi barrier approach and the UK is no exception as it develops its GDF concept.18
The multi barrier approach uses natural and engineered barriers to prevent
radioactive releases to the environment in amounts that could cause harm.
The individual barriers under consideration in the UK disposal concept are
summarised below: 23 24 32 33
The waste form: The waste is conditioned into a chemical and/or physical form to
make it suitable for disposal; examples of conditioning include super-compaction of
low density wastes and vitrification of high-level waste.
The waste container: The conditioned waste (conditioning is often simply mixing
and sealing with cemetitious grouts) is located in the waste container to form the
waste package which must have sufficient strength and corrosion resistance to
safely contain the waste during its storage and transit to the GDF. The material and
design of the container must also provide reliable long term physical containment
within the GDF.
The buffer or backfill: When waste packages have been placed underground in a
disposal facility, they will eventually be surrounded with buffer or backfill materials
which will provide physical support and chemical protection of the waste container,
and chemical containment of the long lived radionuclides.
Mass backfill: Access tunnels and shafts will be filled in with mass backfill which is
required to ensure the integrity of the engineered barriers, prevent collapse of the
access ways and potentially control groundwater flow.
Sealing systems: Engineered seals could be used to prevent or control the flow of
fluids through more permeable zones within the rock.
Geology: The barriers outlined above are all engineered but the geology must also
be correctly selected to act as a barrier. It may limit liquid and gas flow through and
around the GDF which will in turn limit the movement of radionuclides towards the

26
ground surface. The nature of the cover rocks and near surface hydrogeology will be
important over the very long term affording protection from human intrusion and
dilution and dispersion of any leakage that may occur.
A number of descriptive terms for the zones of the GDF are in general use and will
be used in this report:
Near Field: is the zone within the confines of the GDF and includes all areas where
waste is stored.
Excavation disturbed zone: is defined as the region beyond the excavation
boundary where the physical, mechanical and hydraulic properties of the rock mass
have been significantly affected as result of the excavation and redistribution of
stresses.
Alkaline disturbed zone: applies to GDFs that use cementitious packaging and
backfills and is the zone where pH is raised due to leaching from highly alkaline
cements.
Far Field – Is the zone beyond the alkaline disturbed zone which is within the
theoretical range of potential impact of migration from the GDF but where “normal”
environmental conditions are expected to prevail.
The research presented here concentrates on the GDF near field, excavation
disturbed zone and alkali disturbed zone. Specifically, the potential backfill and buffer
material NRVB: that may also be used as the mass backfill is investigated.
Occasional reference will be made to similar experiments using a 3:1, PFA:OPC
packaging grout also being undertaken in the Loughborough laboratory.

27
4.0 Cement and Concrete
4.1 History
This section provides a brief summary of the history and chemistry of cement and
concrete, it concludes with a more detailed description of NRVB noting how its
components are intended to create a cementitious material potentially suitable for
use as a GDF backfill.
Concrete has been manufactured and used in construction since at least 2500 BC
and there is evidence that it was extensively used by the Greeks and early Romans.
The concretes developed by these civilizations used either roasted limestone or
gypsum as a starting material which could be mixed with sand and water to create
mortars to fix stonework or act as cheap structural fillers in conjunction with coarse
rocks. Concrete was to become the dominant technology in Roman buildings due to
a number of developments including the discovery that the addition of volcanic ash
created a material that would continue to harden in wet conditions and even
underwater. This simple addition to the basic “recipe” allowed concrete to be used in
wet ground to construct the foundations for bridges, aqueducts, harbours and large
scale buildings.34
The main cement used in the modern construction industry is Ordinary Portland
Cement (OPC) which is made by roasting a mixture of limestone and clay at
temperatures between 1400-1500°C. The resulting material is known as clinker
which is ground to a fine dust with the addition of small amounts of gypsum (to
control the speed of setting) prior to sale and use.35
It is important to differentiate between the two terms cement and concrete. Cement
is the binder and concrete is the result of mixing cement with other materials
including rocks, stones and pebbles and/or fillers such as various grades of sand
(from coarse to fine), blast furnace slag (BFS), pulverized fuel ash (PFA) or calcium
carbonate. These materials are collectively referred to as aggregates.36 37 Modern
concretes may also utilize a range of additives developed to affect the speed of
setting, chemical resistance and strength, dependent upon specific applications.

28
The term “grout” in the context of this research is applied to concretes that are made
using fine particle size fillers, including but not limited to fine sand, limestone flour,
PFA or ground BFS.
It is important to be aware that the composition of OPC will vary dependent on the
sources of limestone, clay and gypsum and the type of fuel used in its manufacture.
It should also be noted that since 2004 cement manufacturers have been permitted
by implementation of European Standard EN197-1 to add up to 5% “minor
constituents” which can include PFA, to the clinker in an effort to reduce overall
energy consumption. In addition Sn II salts can be added to chemically reduce the
hazardous content of Cr VI to Cr III. 38
4.2 Chemistry Whilst it is true that cements and concretes have been used as construction
materials for thousands of years, the chemistry involved is complex and despite the
attention of many scientists it remains a subject of current research. This is partly
because of the continuous flow of new uses and formulations and partly because
small variations in the chemistry can have significant consequences on the physico-
chemical properties and quality of the final product. 34 36
It is clear from the number of textbooks and scientific literature available that a great
deal of chemical knowledge about what happens when water is added to OPC has
already been accumulated.
The relatively complex nature of the individual chemical compounds present in OPC
has resulted in a notation convention being developed to simplify equations and
communication, in addition the method of expressing elements as oxides used in
geochemistry is often adopted. Tables 4.1 and 4.2 below provide the keys to the
notation and the main compounds of interest expressed in the available conventions.
It is common to refer to the hydrated calcium silicates as CSH gels or gel phases
providing both a simplification of the overall composition and inference that the
waters of crystallisation may be loosely bound.34

29
Oxide form Notation CaO C SiO2 S Al2O3 A Fe2O3 F
SO3/SO4 S H2O H
Table 4.1 Cement nomenclature 36
Chemical Name
Chemical Formula
Oxide Formula Cement Notation
Mineral Name
Tricalcium Silicate
Ca3SiO5 3CaO.SiO2 C3S Alite
Dicalcium Silicate
Ca2SiO4 2CaO.SiO2 C2S Belite
Tricalcium Aluminate
Ca3Al2O6 3CaO.Al2O3 C3A Aluminate
Tetracalcium Aluminoferrite
Ca4AlFeO5 4CaO.Al2O3.Fe2O3 C4AF Ferrite
Calcium hydroxide
Ca(OH)2 CaO.H2O CH Portlandite
Calcium oxide
CaO CaO C Lime
Table 4.2 Main mineral phases of interest 36
In addition oxides of magnesium are abbreviated to M and oxides of sodium to N.
Clearly the miscellany of expressions used to clarify communication is not entirely
successful; in particular, care must be taken not to confuse calcium and carbon,
hydrogen and water, silicon and sulphur, iron and fluorine.
The main reaction occurring is hydration of the metal oxide silicates formed in the
roasting stage of production. The solid particles are finely divided and the solubility of
individual particles ranges from highly soluble alkali metal hydroxides to sparingly
soluble calcium sulphate. The majority of the mass usually comprises four anhydrous
metal oxide silicates (the first four entries in table 4.2 above) which begin to hydrate
on contact with water. The hydration of the mixture gives rise to a series of
significantly hydrated compounds often termed gels, phases or even gel phases with
structures identical to minerals found in geology. Indeed the mineral names are often

30
used to describe individual phases and as a consequence, these have also been
provided in table 4.2 above.
About 90-95% of an OPC comprises the four compounds, C3S, C2S, C3A, and C4AF,
with the remainder being calcium sulphate, alkali sulphates, CaO and MgO; trace
metal concentrations will vary dependent upon the source of raw materials. The four
most prevalent compounds exhibit different behaviour during the hydration
process. C3S and C2S generate the main beneficial hydration product, C-S-H
gel. C3S hydrates more quickly than C2S and contributes most significantly to early
strength development. C3A and C4AF also hydrate, but the products formed are not
significant in short or long term development of strength or chemical resistance. It is
uneconomic to separate C3A and C4AF.34
Tricalcium Silicate (C3S) C3S is the most abundant compound in OPC, occupying 40–70 wt% of the cement; it
is also the most important. Pure C3S has three possible crystal structures. Below
980˚C the equilibrium structure is triclinic, between 980˚C – 1070˚C the structure is
monoclinic, and above 1070˚C it is rhombohedral. The high temperatures of
production mean that these structures can all be present in OPC but variation of the
composition does not lead to significant differences in reactivity with water. The
important feature of the structure and cause of the rapid reaction with water is the
asymmetric packing of the calcium and oxygen ions which leaves holes in the crystal
lattice.
The C3S also contains about 3-4% of oxides other than CaO and SiO2 making it very
similar in composition and structure to the mineral alite. In a typical OPC the C3S
contains about 1 wt% each of MgO, Al2O3, and Fe2O3, along with trace amounts of
Na2O, K2O, P2O5, and SO3.
The impurities Mg and Fe are able to replace Ca and stabilize the monoclinic
structure, preventing loss of strength due to the structural transformation from
monoclinic to triclinic that would occur on cooling. 35 39

31
Dicalcium Silicate (C2S) C2S also occurs in different crystal structures. The β belite structure predominates in
OPC it is also irregular but less so than C3S. This accounts for the slower reactivity
of C2S with water and its importance in the development of long term strength. The
C2S in cement also contains higher levels of impurities than C3S. 35 39
Tricalcium Aluminate (C3A) C3A comprises anywhere from zero to 14% of OPC. Like C3S, it reacts readily and
exothermically with water. The hydration products of C3A contribute little to the
strength or engineering properties but in the presence of sulphate can participate in
expansive reactions causing cracking. 35
Tetracalcium Aluminoferrite (C4AF) A stable compound with any composition between C2A and C2F can be formed, and
the cement mineral termed C4AF is an approximation that represents the series
midpoint. The crystal structure is complex, mainly due to the enrichment of Mn, Ti
and Zn during roasting which can reach percentage concentrations dependent upon
the source of raw materials. It is often termed simply as ferrite though this does not
convey any of the complexity. The hydration C4AF does not contribute to the
strength or engineering properties. 39
4.3 Relevance to this Research The hydrated phases of the compounds above make up the “cement gel” it is
important to note that hydration is non-stoichiometric and may continue to occur over
many decades in finished cement products. The gels have a high surface area
enabling significant and strong sorption of a wide variety of chemical species, in
particular many of the positively charged radionuclide ions likely to be present in a
GDF. The hydrating cement also has small amounts of Na and K hydroxides present
which cause the pH to be above 13 in young cements, these alkali metals are
leached readily because of their high solubility.39 Also, the significant presence of
Portlandite (CH or calcium hydroxide) can maintain the pore solution at a pH of 12.5
for times in excess of 1000 years. 40 41 The reaction of these pore solutions with
atmospheric carbon dioxide and precipitation of calcium carbonate is another aspect
of how the long term chemistry of cements develop. There is clearly an element of

32
kinetic control which must be considered when assessing how radionuclides will be
taken up and retained by cementitious media or how the process of incorporation of
radionuclides into the structures could limit availability for migration. 34 42
The chemical changes occurring with time also cause changes to physical
properties; changes to porosity and permeability are important in the context of this
research as they will be the physical controls on migration into, through and from the
cement.43
The hydrated or hydrating cement has two types of porosity; a non-interconnected
gel porosity due to the presence of poorly crystallised C-S-H and capillary porosity
due to micro pores that were initially water filled and the water has been used up by
cement hydration. The capillary porosity persists despite the increase in total volume
due to the formation of hydration products. 35
Structural quality construction concretes exhibit low permeability, typically in the
range 10-13 – 10-11 ms-1 and diffusion is the most significant mechanism of migration
through the matrix. 35 44 In addition, the long term volume increase associated with
hydrate formation will fill the micro pores and decrease permeability. This research is
not concerned with construction quality concrete and focusses on materials that are
commonly termed grouts and used as backfills, fillers, barriers or buffers in
applications where structural properties are not the main requirement. NRVB, a
potential backfill material is the main subject of this research and it is described in
more detail below.
4.4 NRVB NRVB is composed of a mixture of OPC, limestone flour, hydrated lime and water in
the following proportions:
OPC 450 kg m-3
Hydrated lime aggregate 170 kg m-3
Limestone flour 495 kg m-3
Water 615 kg m-3

33
This produces a high porosity (~50%) relatively homogeneous grout that allows gas
migration. It has high alkalinity for long-lived chemical conditioning i.e. low solubility
and precipitation of many species will be favoured. It is low bleed and high fluidity
providing very good void filling capability. Organic additives are not used so soluble
and mobile metal-organic complexes cannot form and it is low strength so waste
packages can be retrieved if required. The high calcium carbonate content is
unusual and its presence explained by the need for a high calcium content after GDF
closure to condition any inflowing groundwater to a pH greater than 10. This is
expected to enable additional cementation in waste-forms where lack of calcium may
have limited the formation of CSH gels. It is anticipated that the integrity of the
packages will be preserved by preventing the packaging grout from dissolving in
unconditioned groundwater. At the same time, the initial corrosion of the wastes and
the metallic waste packages would rapidly remove any oxygen remaining from the
operational phase. The establishment and long term maintenance of high pH, almost
anaerobic conditions is expected to preserve the integrity of the waste containers
well into the post-closure period. 3 45 It was appreciated when NRVB was formulated
that it may not be effective for chemical containment of alkali metal and halide ions
but there is inference in the published documents that sorption due to the high
surface area of NRVB, will be a significant factor inhibiting migration.
In chemical terms NRVB is complex and it will contain: 22 45 46
Calcium hydroxide; from the lime added and as a product of calcium silicate
hydration.
CSH gel; from calcium silicate hydration. This can be present in several forms,
but is usually poorly crystalline or amorphous.
Aluminate phases; from tricalcium aluminate and calcium aluminoferrite.
Ettringite produced from the gypsum (calcium sulphate) added during cement
manufacture.
Monocarboaluminate; from interaction of aluminate cement phases with
carbonate from the added limestone.
Calcium carbonate as the majority (80-90%) of the added limestone remains
unreacted during NRVB hydration.
The trace chemistry of water equilibrated with NRVB is detailed in section 9.0.

34
The rationale for including NRVB in this research is simple; it has potential to be
used as an engineered, major control or barrier in the overall GDF multi barrier
concept to be implemented by the NDA in the UK. As such the effectiveness with
which it is able to arrest or control the migration of radionuclides is of fundamental
importance to the long term integrity of the UK GDF.

35
5.0 Diffusion Experiments
5.1 Background: Diffusion, Partition and Ionic Strength One of the primary aims of this research is to understand how a range of elements
associated with radioactive wastes diffuse through and interact with NRVB. Diffusion
will be one of the most significant processes driving the migration of isotopes from
the GDF to the wider environment.23 24
Diffusion is the movement of particles from regions of higher concentration to regions
of lower concentration. For a porous solid Fick’s first diffusion equation relates
diffusion flux to the concentration across a path length as follows: 47 48
Where:
J is the diffusion flux with dimensions g m-2 s-1, flux is the amount of
substance flowing through an area during a time interval, expressed per
unit cross sectional area and per unit time, perpendicular to the direction of
flow.
is the effective diffusion coefficient or effective diffusivity (see below)
with dimensions m2 s−1.
is the concentration with dimensions of g m-3 or mol m−3.
x is the position with dimension m.
Fick’s Second Law predicts how the concentration will change with time when
diffusion is occurring; it is presented below in the one dimensional, radial form: 47 48
1
Where, is time and is radial distance.
The effective diffusivity incorporates the physical properties of the solid porous
medium and is defined as:

36
Where:
is the diffusivity in the fluid with dimensions m2 s−1, in the absence of
the solid medium.
is the available porosity expressed as a fraction of the total sample
volume
τ is the tortuosity – a dimensionless factor to account for elongation of the
diffusion path length arising from the “tortuous” nature of the connected
porosity in a solid medium.
δ is the constrictivity – a dimensionless factor associated with pore
narrowing (see below).
Decreasing effective diffusivity due to constrictivity becomes important when pore
diameters are close in size to those of the diffusing particles.49
The dimensionless tortuosity and constrictivity factors are conventionally expressed
on the “top line” of the equation as numbers ≤ 1, so the relationship between and
can also be represented:
Some texts 50 also use expressions of the form:
Where, G is termed a “geometric factor” which can be used to aggregate the relevant parameters into a single value. Partition of the dissolved species between the solid and liquid phases will also be
significant and modifications of the diffusion equations to account for this are
available in the literature.51 52 53 54 An alternative diffusivity coefficient; the sorption
retarded diffusivity (or apparent diffusivity) is used and is defined as:
Where, is the rock capacity factor for the diffusing species and is defined as:
. Where, is the porosity, is the dry bulk density (g m-3) and is the partition
coefficient (m3 g-1).

37
The equation below 54 incorporates the significant parameters affecting diffusion in porous media, including and is a revised version of a previously reported equation.53
1,
is formally defined as the ratio of the quantity of the adsorbate, adsorbed per
mass of solid to the amount of the adsorbate remaining in solution at equilibrium. For
the reaction:
A Ci Ai
The expression for is:
Where:
A = free or unoccupied surface adsorption sites
Ci = total dissolved adsorbate remaining in solution at equilibrium
Ai = amount of adsorbate on the solid at equilibrium.
is given in units of volume mass-1 e.g. m3 g-1 or dm3 kg-1,
The key assumptions are that A is present in excess with respect to Ci, so sites are
always readily available and that the sorption process is fully reversible. 55
The significant quantity of data available in the literature for a variety of cements
and elements have been summarised by SKI in a single report. 56 This report also
provides an indicative range of values to be used in performance assessment and
was used as a comparative data source for the present work.
In some cases, when there is a linear relationship between the concentration in
solution and on the solid; the proportionality constant that relates them is known as
the distribution ratio (Rd) which can be calculated from the concentration initially
added and that remaining in solution as follows:
.

38
This equation does not imply any specific sorption process and clearly sorption
isotherms may deviate from linearity due to saturation of the solid surface or
precipitation of the radionuclide of interest.57 58 59
In practice and because experimentally determined values are similar, the and Rd
termsare often used interchangeably despite the implied standard conditions and
reversibility in the former and pre requisite linearity in the latter.
In addition the ionic nature of the systems studied mean it is necessary to
acknowledge the electrostatic interactions. The movement of an ion in solution will
be restricted by the electrostatic field created by other ions present in solution.
Therefore, from a theoretical point of view it is necessary to be aware of Nernst and
electrical double layer theories to understand the migration of an ion. Accordingly, D
for an ionic species will depend on the molar conductance of the ion (Λi), which is
empirically associated to the concentration by a relationship of the type:
Λ Λ
Where, c is the concentration of the ionic species.60 It is possible to express the
dependence of the diffusivity upon the concentration of the diffusing ion by a similar
empirical equation;
Where, kc is a constant that includes the pore characteristics of the matrix and for
monovalent species n is usually 0.5.61 62 Experimentally, the consequence of these
relationships is that diffusivity will decrease with increasing concentration and ionic
strength.
The equations above provide an insight into the effects likely to be observed as ionic
strength increases but the complexity of the solutions and cementitious solids being
studied negates the possibility of fully quantitative analysis.
Diffusion experiments provide fundamental information to support the performance
assessment of a GDF. Diffusion can be observed and studied by many means. Initial
conditions and whether or not determination is under steady state or non-steady
state are important. Steady state diffusion can be determined by studying the mass
transport from one solution to another separated by a slice of the solid and non-

39
steady state diffusion can be determined by studying the concentration profile in a
solid after contact with a solution containing the species of interest.
Several studies have been devoted to investigating the mobility of ions in
cementitious materials using diverse experimental approaches: (i) in-diffusion, where
the diffusive penetration of a sample is measured;54 63 64 (ii) through-diffusion, where
a sample, often disc shaped or cylindrical is sealed between two reservoirs
containing different concentrations of the diffusant 65 66 67 68 69 70 and most commonly,
(iii) out-diffusion or leaching where samples of known diffusant concentration or
samples doped with a known concentration of diffusant are placed in contact with a
fluid into which diffusion can occur. The subsequent increase of diffusant
concentration in the fluid is the parameter that is usually measured. 71 72 73 74 75 79
A literature search also revealed relevant papers on radioisotope movement through
hardened cement pastes, 77 78 disaggregated rocks, 79 80 structural concrete, 54 64 and
intact rocks, 81 82 83 the rock beaker and diffusion in the geosphere experiments
undertaken by Nirex being of particular interest. 84 85 86 A substantial overview of the
techniques used to investigate radionuclide migration in groundwater and rocks was
commissioned by NDA RWMD and the resulting 2008 report was used to provide up
to date insight into many of the previous references for the current work.87
This research also investigates variation in radionuclide mobility associated with the
presence of organics and in particular cellulose degradation products (CDP).
Previous work has demonstrated that isosaccharinic acid, gluconic acid and other
low molecular weight organics are able to affect the solubility and mobility of
radionuclides in sandstone, calcite and NRVB systems. 83 88 89 90 These studies
amongst others generally indicate a probable enhancement of radionuclide mobility
in the presence of organics.
When developing any dynamic experimental method it is necessary to be aware of
the general engineering references regarding the physical responses of test
equipment and materials to changes in temperature, pressure, effective stress,
abrasion, etc. Information relating to these properties of cementitious media is
readily accessible in the literature. 91 92 93

40
There are also references that collect and collate values for a range of properties of
cementitious media and rocks including , porosity, permeability solubility and
interaction with solvents 56 94 95 which proved useful for scoping the experiments
included in the research. The papers mentioned above provided significant insights
into the issues and problems that might be encountered when developing dynamic
techniques for observing diffusion. However, it was noted that there were no
experiments investigating radial diffusion of radioisotopes through intact samples of
cementitious media in the presence and absence of organics.
5.2 Development of Experimental Methodology for Diffusion It was realised, at an early stage in this research, that setting up experiments aimed
at accurately quantifying diffusion coefficients was unlikely to deliver the quick and
generalised information desired. This is particularly true of the radionuclides likely to
have low solubility at high pH e.g. Eu, Ni and in particular the actinides U, Th and
Am.96
A cheap and reproducible method for comparing isotope diffusion and retention in
various cementitious media was required to enable a significant number of
experiments to be carried out on “identical” samples. After some discussion in the
research group it was decided that developing a radial diffusion method was the
most likely way to generate readily comparable and understandable results.
The experimental approach used in the present work is based on a through-diffusion
set-up in a radial configuration. This approach had been used successfully to study
migration of uranium through granite. 97 This methodology combines the advantages
of through-diffusion experiments, where breakthrough is determined by monitoring
the solution in contact with the solid and the simplicity of out- and in-diffusion
approaches where the use of specially constructed diffusion cells that are prone to
leakage, is avoided.
The main theoretical disadvantage for these radial diffusion experiments is the lack
of effective analytical solution with time-dependent boundary conditions for the
relevant diffusion equation. An analytical solution for hollow cylinders is available 47
but it requires maintenance of a steady state gradient and zero tracer concentration
at the outer edge of the cylinder. This in turn, requires constant removal of the tracer
(presumably without causing mixing or advection). Work published in 2004, 48

41
describes a successful experiment with a rig capable of maintaining the boundary
conditions but it required regular management interventions. It would not be practical
to maintain the boundary conditions over the long time periods requested by NDA.
Also, any model or simulation will have to assume uniform radial diffusion from the
central core over relatively long path lengths compared to the thin disc methods. 77 78
More generally, the relevance of the geometry could be questioned as it only
simulates a small cavity in the NRVB.
A method was developed based on the simplification of an advection technique
being trialled in the research group (see section 6.0). The main issues encountered
during the development of the diffusion and advection techniques were, the design of
effective seals and establishing a geometry where the path length could be fixed and
reproducible to obtain results quickly and faciltate modelling. The experimental set
up is shown schematically in fig. 5.1 and photographed as fig. 5.2.
Fig. 5.1 Schematic of diffusion apparatus
Stopper Upper surface wax seal NRVB Drilled core Diffusant (Cs, U, etc.) Basal wax seal
Diffusive flow lines

42
Fig. 5.2 Photographs of experimental set up
The feasibility of the method was initially tested by filling the core with 5% potassium
permanganate solution, immersing it upside down in a plastic container of water and
leaving for several weeks to establish that the seals functioned appropriately. The
result of one of these experiments is shown in fig. 5.3 below. Although the brown
colour suggests that the permanganate has been reduced to manganese dioxide
(probably by iron (II) or tin (II) salts added to the OPC to reduce the hazard caused
by the presence of Cr(VI) 98 99 100 101 ) a clear and regular pattern of radial diffusion
can be seen.
Fig. 5.3 Photograph of permanganate trial

43
5.3 Radial Diffusion Experiment – Detailed General Procedure for NRVB
The three ingredients of NRVB were purchased in sufficient quantity to ensure that
all samples required for this research could be made from the same starting
materials.
40 mm diameter x 40 – 45mm height NRVB cylinders were manufactured using the
recipe available in the literature 3 using polyethylene 50 cm3 sample containers as
moulds.
A batch of approximately 100 cylinders was manufactured to ensure consistency.
After 24 hours the blocks were demoulded and cured under water in a sealed
container for at least 30 days.102
A 10 mm diameter hole was then drilled in the centre of the cylinder using a
sequential set of drills starting at 2 mm to avoid cracking the cylinder. The hole was
stopped at least 15 mm from the base of the block.
The surface of the block was then allowed to dry for 1 - 2 hours and dipped top and
bottom in melted paraffin wax until a good seal was made.
The block was then returned to the curing water for at least 7 days.
The experiment was commenced by adding the species of interest at the desired
concentration or activity to the central port and topping up with the curing water or
water previously equilibrated with NRVB. Solids and mixtures of solids and solutions
can be added, tracer and tracer carrier experiments can be undertaken in the same
manner.
The core was then plugged using a 10 mm diameter polyethylene tube stopper
wrapped in “parafilm” and washed quickly with water to remove any surface
contamination that may have occurred during the addition of the radionuclide (the
washings were collected and monitored prior to disposal)
The block was then placed in a 250ml Nalgene wide mouth screw top container and
200 cm3 of water previously equilibrated with NRVB added.
44
A sample of the water was taken after 3-4 hours and a further sample after 24 hours
to establish that the contents remained sealed in the block.
Samples were taken daily for 4 days and then the sampling frequency adjusted to a
rate that facilitated detection of breakthrough and stabilisation.
The undrilled cylinders continued to be stored under water in the sealed container
until required.
It is common practice to exclude carbon dioxide from experiments on cementitious
materials that may be used in a GDF application. This measure aims to exclude the
possibility of continuous carbonation and consequent precipitaion of calcium
carbonate during the experiment. The measure is taken to mimic the GDF
environment where carbonation is likely be very slow.103 104 105
It was not possible to undertake all operations in carbon dioxide free conditions due
to practical problems. In particular it was decided that dispensing open sources and
dosing the blocks in the glove box represented too high a risk of spills and
contamination. In addition drilling the holes in the blocks is an activity more easily
accomplished on a laboratory bench. However once the experiment was underway it
was possible to move all operations to a glove box.
A small number of issues were noted as the experimental programme progressed
and although no significant problems appear to have arisen, solutions have been
proposed and are currently being evaluated. The main issues and proposed
solutions are as follows:
Verticality of central hole – holes will be bored using a pedestal drilled and
fixed mount.
Damage and potential for preferential diffusion pathways caused by drilling
the central hole – holes will be drilled sequencially starting at 1 mm diameter
using professional grade drill bits.
Detachment of upper surface and basal wax seals – other sealing materials
are being investigated including polyurethane and epoxy coatings. Wax was
chosen originally because of its perceived inertness.
Ingress of carbon dioxide – a larger glove box is required to enable more of
the procedure to be undertaken in a carbon dioxide free atmosphere.

45
When a large number of samples are taken there is a potential impact on
partition because the 1 cm3 sample that is removed during the early part of an
experiment contains a disproportionately small amount of radioactivity. A
correction calculation has been developed for use on the observations and
models (see section 11.2).
It was also noted that the experiment as it stands could not be undertaken at
increased pressures to reflect potential GDF conditions.
The issues of scale seen when producing small cores to make rock beakers were
not encountered.106
46
6.0 Advection Experiments
6.1 Background Advection is a transport mechanism of a substance, or a conserved property, by a
fluid, due to the bulk motion of the fluid in a particular direction. An example of
advection is the transport of a contaminant through rocks or soil in groundwater. The
motion of the water carries the substance down an hydraulic gradient. Any dissolved
or suspended substance or conserved property can be advected in any fluid.43 107
The fluid motion in advection can be expressed mathematically as a vector field, and
the material transported is typically described by the spatial coordinates and
concentration present in the fluid. Advection requires the movement of a fluid and
cannot happen in solids. Advection does not include diffusion but diffusion and
dispersion perpendicular to flow will be present in most of the advection experiments
undertaken in this research.
In aqueous solute transport systems advection and dispersion are usually dealt with
together and expressed in the form of the advection dispersion equation below:
Ɖ
Where: C is solute concentration, is the average linear velocity, x is the spatial
domain, t is time, and Ɖ is the dispersion coefficient.108 109
The advection experiments reported in the present work should be regarded as trials
and the numerical transport model developed for this research does not use the
advection dispersion equation explicitly (see section 7.0 for details).
6.2 Background to the Radial Advection Technique Initially a series of advection trials were undertaken using packed columns of
crushed and sieved NRVB.110 These trials are not presented herein as they were
only partially successful, further emphasising the need to work on more
representative intact samples.
Advection of intact samples is usually studied in an axial format where the fluid is
pushed through a cylinder of the test material from bottom to top, a comparative

47
study of the types of equipment used is available in the literature.111 For porous
solids the side wall leakage can be eliminated or reduced by sealing the sample in a
heat shrink plastic jacket.
The first axial advection trials were undertaken on NRVB cylinders sealed using a
tubular heat shrunk PTFE side wall seal. The cylinder was clamped in a simple rig
and the NRVB equilibrated water eluent delivered using a Waters HPLC pump. The
experiment was carried out under a nitrogen atmosphere.
The experiment ran for three months at constant flow (1.5 cm3 hr-1) and a steadily
increasing pressure was observed until the sample and seal failed. When the rig was
opened, see fig. 6.1, the inlet was clear but a hard crystalline deposit had formed on
the outlet surface. This deposit was identified as Portlandite (Ca(OH)2) using XRD
and EDX.
Fig. 6.1 First axial advection experiment showing the clear inlet (left) and crystalline portlandite deposit on the outlet (right)
The SEM image and EDX output are shown as fig. 6.2, the hexagonal plates of
Portlandite are clearly visible.

48
Fig. 6.2 SEM image of the Portlandite deposit from the outlet and EDX output
The cores were examined in greater detail and found to contain an area around the
inlet where Portlandite had beeen depleted and areas (specifically air bubbles in the
NRVB matrix) where it had been deposited, these features increased in frequency
towards the outlet.112 This experiment indicated that the path length was too long to
operate the experiments over very long durations without the application of very high
pressures to overcome the porosity reduction associated with the Portlandite
deposition.
A system capable of operating at high pressure was made available by British
Geological Survey, Keyworth, Nottingham, UK and trialled with intact NRVB
samples. The side seal arrangement can subjected to an externally applied
confining water pressure, similar to a triaxial clay permeability cell.111 A schematic of
the apparatus is shown in fig 6.3 below. The axial advection equipment is expensive
as it is engineered to withstand significant pressures and it also proved difficult to
operate. Photographs of the system used are included in figs. 6.4 and 6.5.

49
Fig. 6.3 Schematic of typical axial advection apparatus
Fig. 6.4 Photograph of axial advection apparatus without outer steel jacket
Flow in Flow out Pressurised water jacket Bronze frit/flow spreader Steel outer container PTFE membrane Sample
Flow out Bronze frit/flow spreader Sample PTFE membrane Flow in

50
Fig. 6.5 Photograph of fully assembled axial advection apparatus with outer steel jacket, injector loop and applied confining pressure
Sample injection was via an HPLC injection loop. During trialling of the axial
advection equipment some of the problems that were encountered could not be
easily resolved. Specifically, unanticipated side wall leakage caused unpredictable
short circuiting around the sample which was discovered during experiments when
using HTO as a tracer. This continued to occur despite stepping up the confining
pressure until the differential pressure across the sample exceeded its compressive
strength and caused the mechanical failure. As a consequence the axial advection
experiments were abandoned.
6.3 Radial Advection Trial Experimental Set Up
It is possible to use a radial arrangement similar to the diffusion experiments
described in section 5.0. The Rowe and Barden cell, used to assess consolidation
properties of soils, clays and concretes can be configured radially to allow collection
of consolidation water at the perimeter of the cylindrical samples. 113 48 A similar
approach on a smaller scale was employed when developing the radial advection
technique. The main advantages of exploiting radial flow are that the problem of side
wall leakage is eliminated and the seals are simple. The main disadvantage is that
HPLC injector loop
Outer steel case
Eluent reservoir
Confining pressure gauge
Sample collector
N2 source of confining pressure
Confining pressure control valve

51
the applied pressure cannot exceed the strength of the sample because it is
effectively in tension. A schematic of the arrangement is shown in fig. 6.6.
Fig. 6.6 Schematic of the radial advection set up
The fluid is introduced under nitrogen pressure from a stainless steel reservoir into
the central core and provided the block is correctly securely clamped in place and
sealed, flow can only occur in a radial manner. The fluid exits from the sides of the
block and is collected in a tray. The actual trial set up is shown in fig 6.7 below.
Fig. 6.7 Photograph of prototype radial advection cell
Central cored hole
Eluent in
Wax seals Sample under investigation
Eluent exits from sample surface
Eluent in
NRVB under investigation
Exiting eluent collected in tray

52
6.4 Permanganate Advection Trial
The initial trial for the technique was undertaken using a 1% potassium
permanganate solution. The objectives were to produce radial flow only (i.e. no leaks
through the ends of the block), ascertain whether a consistent flow could be
maintained and show that the fluid had contacted all parts of the block.
The results are demonstrated by the photographs in figs. 6.8 and 6.9 below:
Fig. 6.8 Photograph of permanganate advection showing flow mechanisms and pore water displacement
Matrix flow
Fracture flow
Displaced pore water

53
Fig. 6.9 Photograph showing extent of permanganate contact
6.5 Trial Results and Discussion
The photographs show that the technique is feasible with leakage appearing to be
negligible and contact with all internal surfaces demonstrated by the broken block
shown in fig. 6.9.
The photograph (fig. 6.8) of the experiment in progress shows that flow is occurring
through fractures and the matrix, there is also evidence of residual pore water being
displaced (the clear droplets on the surface). This may indicate that the technique
could be modified to run very slowly and collect pore water as it evolves, which is
known to be difficult to achieve in practice.114
As the experiment progressed the outer surface of the block eventually became
completely purple. The main visible fracture was most likely caused by over
tightening the rig but the photograph is included here because it demonstrates both
the modes of transport occurring together on one picture. The fracture was obviously
a major feature and not likely to have been “autogenousy healed” (self-healed) 115 116
with extended experimental duration. Self-healing is very similar in nature to the
portlandite deposition that had been observed in some of the early axial advection
trials, where it had been associated with the steady pressure increases required to
maintain constant flow. Subsequent advection experiments were undertaken using

54
soft compressible seals on the ends of the block and the fracturing was successfully
avoided.
The final trial experiment was undertaken with a 13.5 KBq 90Sr tracer introduced into
the central core. This experiment identified a significant deficiency (~30%) in the
mass balance, which was attributed to co-precipitation of radioisotope with calcite on
the external surface of the block and more leakage than noted in the previous trials.
The main design issues encountered and needing to be addressed during the trials
were:
leakage caused by ineffective seals,
uneven upper surfaces on the NRVB cylinders causing difficulty clamping the
samples consistently,
NRVB is very weak and the clamps apply load unevenly,
atmospheric carbon dioxide causing excessive precipitation of calcite,
the requirement to dismantle the rig to insert the radioisotope tracer.
6.6 New Equipment and Design Issues Addressed
The issues identified above were addressed by purpose designing a radial advection
cell. The sample under investigation is enclosed to prevent carbon dioxide ingress
and the clamping rods and screws are replaced by manually tightened acrylic
components. Photographs of the rig are shown below as fig 6.10 and fig.6.11. O-ring
seals were incorporated and screw fit closures included top and bottom to enable
smooth tightening onto the seals. Dead space in the system was minimised by
reducing the internal diameter of the cell to 41 mm, a “good fit” for a 40 mm diameter
block. A gas chromatography injector was fitted to allow radioisotope injection into
the central core without interrupting the flow. Fluid can be driven through the block
by inert gas (nitrogen) pressure or a pump. As the fluid exits the block it is piped to a
fraction collector via narrow diameter PTFE pipework.

55
Fig. 6.10 Photographs of advection cell components
Sample
PTFE end stop
Acrylic screw fit outer
O-ring seals
GC injector
Eluent outlet holes
Lock nut
Minimal dead volume (gap < 0.5 mm)
Sample with central core visible
Acrylic outer

56
Fig. 6.11 Advection cell in operation
The purpose designed radial advection equipment proved relatively easy to operate.
The path length for advection is less than the diameter of the sample, the deposition
of Portlandite or Calcite on the outer surfaces was not observed and low pressure
operation could be maintained for many weeks. After trials using tritiated water and 90Sr tracer (see results in sections 10 and 13) it was decided to use the set-up for the
advection experiments undertaken for this research.
Eluent inlet valve
Pressurised eluent reservoir Sample collector
Eluent outlet

57
7.0 Transport Modelling Whilst accepting that the overall objective of the NDA (and to some extent, the
funders of the SKIN research) is to understand the migration processes at a
fundamental level. It was felt that the available results could be suitable for
preliminary transport modelling. The experimental setup used in the present work
was designed to allow observation of the radial migration of radiotracers through
NRVB cylinders. The configuration was simplified and conceptualised as a hollow
cylinder and then treated as one-dimensional for modelling purposes. The modelling
approach detailed below was discussed and agreed with NDA representatives prior
to go ahead.
7.1 Goldsim As an initial approach, GoldSim 117 was selected for the transport modelling. It is an
internationally accepted code for simulating radionuclide migration from waste
facilities and is the platform considered most suitable for use by the Environment
Agency for England and Wales, to carry out performance assessments for shallow
disposal facilities for radioactive waste.118 This modelling tool has been used to
produce preliminary simulations of the HTO, Cs, I and Sr diffusion and advection
experiments. Estimates of the partition coefficients and effective diffusivity values
have been made.
GoldSim is a platform that provides access to a variety of tools that can be employed
to create simulations. It is used commercially to carry out dynamic simulations to
support management and decision-making in business, engineering and science. Its
mixing cell capability can explicitly represent mass transfer, partition and solubility
constraints.
Provided the geometry and physical features of the system being modelled are
known or can be estimated, the processes and properties controlling the rate at
which mass moves between cells can be represented for both diffusive and
advective transport mechanisms. The mixing cells can be “filled” with porous media
and the transferred mass partitioned between the solid and liquid components
present using partition coefficients.

58
When multiple cells are linked together via advective and diffusive mechanisms, the
behaviour of the cell network is mathematically described using a coupled system of
differential equations (GoldSim uses implicit Euler integration to control numerical
error propagation). In effect, a network of cells is mathematically equivalent to a
finite difference network of nodes. GoldSim numerically solves the coupled system of
equations to compute the mass present in each cell (and the mass fluxes between
cells) as a function of time. 119
7.2 NRVB Radial Diffusion Simulation The complexity and heterogeneity of NRVB may have significant effects on the
diffusion of species. However, the absence of a large particle size aggregate and
obvious crystalline assemblages suggests that it is isotropic at the scale of the
experiments and that it can be modelled as a uniformly porous medium.
The model simulates the radial experiments using the Goldsim capability to create
mixing cells that are concentric cylinders, where mass transfer by diffusion takes
place through the defined areas between the cells. The schematic diagram showing
the conceptual basis of the model is given below. 54
Fig. 7.1 Conceptual basis of the GoldSim model

59
The NRVB cylinder was discretised into five concentric cylinders each with the same
wall thickness. Each of the seven parts (5 NRVB cylinders, the central core and the
receiving water) of the experimental system was represented in the modelling as a
perfectly mixed cell containing a volume of solution. The masses of NRVB, water
occupied porosity and receiving water were calculated using the porosity value and
bulk dry density from the literature (0.5 and 1095 kg m-3 respectively).
The seven part model was recommended by the GoldSim development team
because when run in advection mode it would be capable of numerically simulating
~10% dispersion.119
7.3 Calculational Basis of the GoldSim Model
The main sources for the following discussion 50 120 121 specify the general cases
available on the GoldSim platform for calculating mass transfer and partition along
with two functions not used in the present work; solubility limited control and
radioactive decay; as they are applied to multiple geometries, fluids and solids.
The current radial diffusion experiments are a simpler case, with a single fluid, solid
and diffusant and the equations that follow have been modified accordingly. It should
also be noted that the relevant literature uses the engineering terminology of mass
flow, mass transfer and diffusive conductance.
The calculational basis for the numerical model is the mass transfer equation (Fick’s first law, see also section 5) below:
The flux term can also be stated as:
1.
Showing that when diffusive area (A) is fixed, a relatively simple relationship
between mass transfer rate and concentration gradient results.

60
Integrating the above expression for the 2-dimensional system (i.e. diffusion through
an area) it is necessary to introduce a gradient operator, transforming the above
equation into a surface integral. The formalism is also changed to include , the time
differential of mass (mass flow rate, g s-1) and the normal vector of the surface, S
as follows:
∙
This formal fluid dynamics double integral is the integration that the model
approximates numerically.
The diffusive mass flow between neighbouring cells must be considered so that the
diffusion can be discretised. The diffusive mass flow from cell i to cell j is given by:
, → →
ci and cj are the diffusant concentrations in the fluid in cells i and j respectively.
The term is known as diffusive conductance (m3 s-1) and gathers together the
quantities that will remain constant in each time-step:
→
Where:
And:
is the geometric factor (note: GoldSim does not have separate tortuosity
and constrictivity inputs, it uses a single factor which it calls tortuosity that can
be used to estimate some of the physical parameters).
is the inner surface area of cell j,
is the diffusive length (cell thickness). Using cell thickness here averages
the mass transferred throughout the volume of available porosity in cell j.
Each time-step can now be computed and is represented by:
, →→

61
The time step is known (user defined) and the mass transferred between the
adjacent mixing cells is calculated. The mass added to a cell is instantaneously
partitioned amongst the user specified media present in that cell. For the current
experiments the partitioning is controlled by the user defined partition coefficient
( ). New cell concentrations in the fluid are calculated and the next step
commences.
The numerical method used by GoldSim is implicit Euler integration 122 123 and
requires only that the differential form of the equation being integrated satisfies:
,
The key assumption of the Euler integration method is that the rate remains constant
over a time-step. The validity of this assumption is a function of the length of the
time-step and the timescale over which the rate is changing. The assumption is
reasonable if the time-step is sufficiently small.
In the simulation of the advective experiments, the diffusive mass flow rate of a
radionuclide between cells is supplemented with an advective mass flow rate. The
advective mass flow rate is calculated as the product of the concentration of the
radionuclide in the fluid in the cell and the fluid flow rate. The fluid flow rate between
cells is kept equal to the measured rate of flow from the cement block and there is
therefore conservation of fluid mass. Dispersion occurs in advective flow regimes
and a good first approximation for one dimensional transport through a relatively
homogeneous medium is that the dispersivity is 10% of the total length of the
pathway.124 Much of the relevant literature is concerned with large scale geological
features or industrial processes but the equations used by GoldSim are conventional
in engineering laboratories and scalable. The linked cells in the model exhibit a
degree of numerical dispersion that is a function of the number of cells. In particular,
the equivalent numerical dispersivity is equal to half the length of one cell. By
representing the cement block with five cells numerical dispersivity has been
introduced to the model that is equivalent to 10% of the radius of the cement block.
The diffusion and advection simulation methods described above are mass
conservative and assume that NRVB is homogenous and isotropic with regard to
transport properties.

62
Finally, the criterion utilised throughout for the fitting of experimental observations to
modelled output curves is minimisation of the lack of fit (LOF) calculated as:
∑∑
This statistical method generates an output which can be expressed as a
“percentage lack of fit” where, the lower the value; the better the fit.
7.4 Modelling Procedure The model requires the following inputs:
The initial radiotracer concentrations in the seven mixing cells
Dimensions of the sample (including the inner core)
Volume of receiving water
Bulk dry density of the NRVB
Diffusion available porosity
Tortuosity or geometric factor
Time step
The tracer concentration and fluid mass in the inner core at t0 are known. The
sample dimensions are easily measured. The radiotracer concentration in the 5
cylinders and receiving water at t0 is zero. The volume of receiving water is 200 cm3
plus 25 cm3 of water within the porosity. The porosity value and bulk dry density are
0.5 and 1095 kg m-3 respectively. Whilst methods for estimating the geometric
correction factor have been proposed 107 121 124 the appropriateness of their use for
NRVB has not been demonstrated. The geometric correction factor was therefore set
to unity.
Time step lengths were trialled at 0.1 days and 0.01 days and no differences in
output were noted. The shorter time step was favoured for the modelling because
the data files were limited to several thousand data points instead of tens of
thousands.
The user is able to input values for the variables and to obtain model output
curves. In this case the relationship between and is simple (the former is

63
double the latter as the porosity value is 0.5 and geometric factor is set to unity) and
henceforth for clarity, only values will be used in this text.
Fick’s second law indicates a correlation between and the rock capacity factor (α)
(see section 5.1) and therefore also between and . As a consequence, two
independent observations are necessary to determine and from each radial
diffusion experiment. The evolution of the diffusion experiments is such that there is
later, flat part to the curve. can be independently determined from this part of the
curve as net diffusion has ceased and the concentration of the tracer in the receiving
water is dependent only on partition.
The first stage of fitting the data was to run a series of either 3 or 5 attempts (at 0.2
dm3 kg-1 or 0.3 m3 kg-1 intervals) to find the best LOF, value for the flat part of the
curve. This value was then fixed for the model simulation runs and varied (at
0.2x10⁻¹⁰ or 0.3x10⁻¹⁰ m2 s-1 intervals) to find the best LOF for the entire dataset. The
approach was manually checked by undertaking a mass balance on several of the
observed points to check that was being determined satisfactorily (example
results of the mass balances are provided in appendix 2.
Each sample taken represents a reduction in the mass of receiving water present
and when radionuclide migration is occurring, a reduction in the mass of the
radionuclides in the system; both were simulated in the diffusion model.
7.4.1 Degree of Discretisation The degree of discretisation used (5 concentric cells) was tested to see whether a
finer discretisation (50 concentric cells) would significantly change the modelling
outcome. Insufficient discretisation, like too large a time step can adversely affect
error propagation in the initial calculation steps, creating numerical instability and
lack of convergence.
GoldSim has a mesh generator capable of automatically increasing the number of
elements (in this case mixing cells) in a simulation. The original model was set up
manually so a parallel 5 cell model was created using the mesh generator as a cross
check. Both models produced identical outputs.

64
Subsequently, a 50 cell model was produced using the mesh generator. The
effective diffusivity and partition coefficient previously used to fit the CDP 137Cs tracer
only experiment from section 11.3.2 (2.8x10⁻¹⁰ m2 s-1 and 0.7 m3 kg-1) were inputted
to produce the model curve. The outputs for the 5 and 50 cell models along with the
(5 cell) curves for 2.5 and 3.0x10⁻¹⁰ m2 s-1 and the relevant experimental data points
are provided in appendix 2. A very small difference between the two curves can be
seen over the first 4 - 5 days of the simulation but this did not have a significant
effect on the data fit.
As a further check the same procedure was performed on the data from the NRVB 137Cs tracer only experiment (see section 11.3.1; the inputs were 2.0x10⁻¹⁰ m2 s-1 and
2.3 m3 kg-1). The small difference between the curves persists over the first 10 – 12
days of the simulation but once again this did not have a significant effect on the
data fit. The relevant graphs and data fits for the discretisation trials outlined above
are provided in appendix 2.
7.5 Important Limitations of the GoldSim Radial Diffusion Model
The model has important shortcomings, primarily because diffusion below the base
of the inner core is not accurately described using the basic ID radial concept.
Ideally, the experiments should be simulated by a 3D model which accounts for the
diffusion in directions other than horizontal which occurs due to the inner core
stopping at ~15 mm from the base of the block. An alternative practical approach
would be to drill the hole all the way through the cylinder and use a seal at each end.
This was not done initially because the seal was perceived to be a potential source
of leaks.
The model generates the first diffusion surface area using the shorter length of the
inner core and applies the relevant concentration gradient across that area to
generate the mass transferred. In effect, the model assumes that none of the
radiotracer diffuses vertically through the base of the inner core. The likely effect of
this shortcoming is overestimation of the radiotracer concentration for the very early
observations followed by underestimation as the radiotracer taking the extended
pathway through the lower part of the cylinder eventually reaches the receiving
water. The first of the two examples provided in appendix 2 behaves as anticipated
but the second behaves in the opposite manner, suggesting that the situation is

65
more complex. This complexity is also likely to be causing some inaccuracy in the
simulated effective diffusivity determination. Reference is made to this issue at
several points in the following sections where it could be a factor responsible for poor
data fits or anomalous results.
The initial approach to the modelling described in this section proved to be adequate
for the NDA and EU funders of this work. The initial outputs were close enough to
NRVB literature values 3 to provide confidence that the model could be used for the
current work and further developed into a 3D simulation at a later date, if required.

66
8.0 Autoradiography Fuji BAS MP 2025 autoradiography image plates were used for this work. The
plates are flexible 20 cm x 25 cm radiation sensors with a linear response over at
least five orders of magnitude. They comprise a backing coated with a layer of
phosphor crystals embedded in an organic polymer binder which is sealed with a thin
protective layer against humidity and mechanical wear. The photostimulable
phosphor is a barium fluorohalide activated (doped) with divalent europium ions
(BaFBr:Eu2+). 125
Exposure is achieved by placing the radioactive sample material directly onto the
plate for a time largely determined by trial and error. The image plate absorbs
radiation emitted from the sample, causing Eu2+ to oxidise to Eu3+ and the liberated
electron can subsequently be trapped at a Br or F vacancy. This results in a density
pattern of filled electron traps, corresponding and proportional to the distribution and
intensity of radiation emitted by the sample. 126
The plate is developed using a scanning laser-beam in the red part of the spectrum
to excite the trapped electrons and allow relaxation to the ground state in turn
generating the emission of 390 nm blue light (in the case of BaFBr:Eu2+). The
stimulated as well as the incident light are collected by a light guide, routed through a
filter to block the red parts of the spectrum and then funnelled into a high-sensitivity
photomultiplier tube. The signal is amplified, filtered to reduce signal noise and
digitized into a greyscale image. The greyscale images can be
manipulated/colourised etc., using the freely available software package “ImageJ” 127
128
The technique originally used photographic plates and remains in frequent use in
biomedical science for imaging of radio-labelled proteins.129 It has also found
application in the geosciences field to trace and identify radioactive mineral phases
in rock samples.130 131 In this and similar work132 133 it is used to study the fate of
radiotracers added to cement systems.
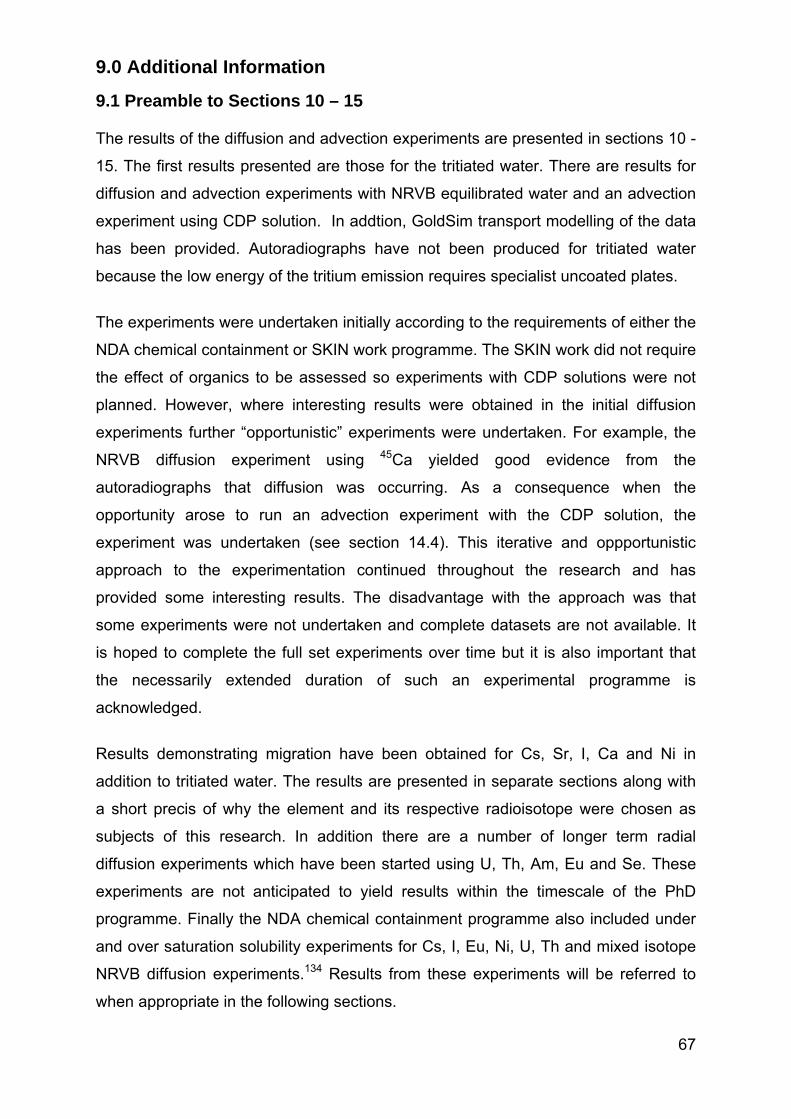
67
9.0 Additional Information
9.1 Preamble to Sections 10 – 15
The results of the diffusion and advection experiments are presented in sections 10 -
15. The first results presented are those for the tritiated water. There are results for
diffusion and advection experiments with NRVB equilibrated water and an advection
experiment using CDP solution. In addtion, GoldSim transport modelling of the data
has been provided. Autoradiographs have not been produced for tritiated water
because the low energy of the tritium emission requires specialist uncoated plates.
The experiments were undertaken initially according to the requirements of either the
NDA chemical containment or SKIN work programme. The SKIN work did not require
the effect of organics to be assessed so experiments with CDP solutions were not
planned. However, where interesting results were obtained in the initial diffusion
experiments further “opportunistic” experiments were undertaken. For example, the
NRVB diffusion experiment using 45Ca yielded good evidence from the
autoradiographs that diffusion was occurring. As a consequence when the
opportunity arose to run an advection experiment with the CDP solution, the
experiment was undertaken (see section 14.4). This iterative and oppportunistic
approach to the experimentation continued throughout the research and has
provided some interesting results. The disadvantage with the approach was that
some experiments were not undertaken and complete datasets are not available. It
is hoped to complete the full set experiments over time but it is also important that
the necessarily extended duration of such an experimental programme is
acknowledged.
Results demonstrating migration have been obtained for Cs, Sr, I, Ca and Ni in
addition to tritiated water. The results are presented in separate sections along with
a short precis of why the element and its respective radioisotope were chosen as
subjects of this research. In addition there are a number of longer term radial
diffusion experiments which have been started using U, Th, Am, Eu and Se. These
experiments are not anticipated to yield results within the timescale of the PhD
programme. Finally the NDA chemical containment programme also included under
and over saturation solubility experiments for Cs, I, Eu, Ni, U, Th and mixed isotope
NRVB diffusion experiments.134 Results from these experiments will be referred to
when appropriate in the following sections.

68
For Cs and Sr, tracer only and tracer carrier, diffusion experiments in the presence
and absence of CDP have been undertaken. The advection experiments were
undertaken at tracer concentration only. Autoradiographs have been produced to
visualise the fate of the radioisotopes. GoldSim transport models are also presented.
In addition the Sr experiments were extended to include high ionic strength and
gluconate surrogate for CDP.
The I experiments were affected by the short half live (60 days) and low gamma
energy (35 keV) of the 125I isotope being used. Good results were obtained for the
tracer carrier diffusion experiments but long duration experiments could not be
undertaken satisfactorily and the autoradiographs were indistinct. In addtion the
experiments without KI carrier were ineffective.
The Ca diffusion experiments yielded results only after stopping one of the duplicate
experiments and producing the autoradiographs. The radiographs indicated that
diffusion was occurring and consequently advection experiments with and without
CDP were undertaken.
The Ni diffusion experiments indicated that Ni was only mobile in NRVB when CDP
was present but that progress to a stable concentration was very slow. The CDP
advection experiment was also undertaken.
Finally, the SKIN programme required investigation of a 3:1, PFA:OPC waste
packaging grout and parallel diffusion experiments were started. These experiments
(with the exception of tritiated water) are not expected to yield results within the PhD
timeframe.
9.2 NRVB Equilibrated Water and CDP Solution The experiments were undertaken using one of two solutions, NRVB equilibrated
water and CDP solution. This section provides details about the solutions.
The NRVB equilibrated water used was the curing water from the sealed containers
where the NRVB cylinders were stored. The water in the sealed container was
topped up periodically with nitrogen sparged tap water. Several storage containers
were in use and water was assumed to be equilibrated with the NRVB after 28 days.

69
The preparation of CDP solution followed a modification of the previously reported
procedure and related material 135 136 as follows:
750 cm3 deionised water were placed in a stainless steel can and sparged for one
hour with N2. 30 g of Kimwipe ® tissues were cut into small pieces (ca. 2 cm2) and
added to the steel canister, followed by 270 g of powdered NRVB. After mixing and
sparging for a further 30 minutes, the container was closed tightly, weighed and
placed in an oven at 80oC for 30 days. A variation on the method using 3 g of tissues
and 297 g of NRVB was also undertaken; analysis revealed that this yielded a
weaker solution of organics. The two methods were used in an attempt to reflect the
potential heterogeneity of w/w cellulosic waste content in different parts of the GDF.
The CDP solutions used in the experiments were 50/50 mixtures of the two products.
This represented a cellulose loading of 1.6% of the total mass in the stainless steel
cans, adequately reflecting the cellulose loading estimated in the UK inventory (see
section 3.1.3). Several batches of the CDP solutions were prepared and mixed prior
to their use in the diffusion experiments in an effort to ensure that all the blocks were
subjected to the similar conditions.
All solutions were filtered under CO2-free conditions before use in the diffusion and
advection experiments. Trace metals were determined by ICP-MS 137 138 in semi-
quantitative mode (7700x series, Agilent) and major cations (Na+, K+ and Ca2+) and
anions (Cl-, NO3- and SO4
2-) by ion chromatography (DX-100, Dionex), using
IonPac® AS4A-SC and CS12A (both Dionex) columns,139 respectively. In addition to
analysis of total organic carbon (TOC) determined by wet oxidation (Sievers
InnovOx, GE),140 the main organic constituents of the CDP liquor were separated
and quantified by capillary ion exchange chromatography (AS11-HC capillary
column, Dionex). The main characteristics of the NRVB-equilibrated water and CDP
mixture are summarised in Table 9.1 below.

70
* LOD
Table 9.1 Composition of NRVB equilibrated water and CDP solution Table 9.1 indicates that there are variations in the solutions used in the experiments.
There are clear differences in ionic concentrations between the NRVB equilibrated
water and CDP solution with the latter having a higher ionic strength. There are three
potential reasons for this increase;
The high temperature at which the CDP solution is produced dissolves more
of the NRVB components
The organic components are increasing solubility of some minor components
by complexation.
The CDP solution is made in contact with the components of NRVB and not
pre formed NRVB.
Technique (units)
Species NRVB equilibrated water CDP solution
Average ± SD
Min Max Average
± SD Min Max
IC (mg dm-3)
Ca+2 462 ± 222 123 847 627 ± 110 513 809 K+ 358 ± 228 138 868 974 ± 184 791 1204
Na+ 102 ± 53 49.4 228 326 ± 112 214 484
IC (mg dm-3 )
Cl- 23 ±8 15.7 44 44 ± 26 22 88 NO3
- 10 ±12 1.4 42 9.0 ± 8.1 2.0 23 SO4
2- 29 ±20 5.6 65 173 ± 220 13 546
ICP-MS (µg dm-3)
Al 268 ± 215 35.6 872 208 ± 131 72 413 Cs 4768 ± 14854 26.3 51741 12609 ± 27681 175 74506 Eu 0.61 ± 0.41 0.096 1.4 0.42 ± 0.37 0.06 0.99 Li 1642 ± 1196 327 4606 5983 ± 1696 4083 9527
Mg 127 ± 163 11.8 443 46 ± 28 11.1 101 Ni 8.3 ± 4.7 1.1 15.2 504 ± 373 13.3 1158 Se 2.3 ± 0.74 1.4 3.5 5.6 ± 0.8 4.2 6.6 Sr 6495 ± 5795 1028 16471 12607 ± 4866 2462 17060 Th 0.06 ±0.03 0.03 0.13 0.11 ± 0.05 0.04 0.16 U 0.04 ± 0.05 0.008 0.2 0.20 ± 0.19 0.014 0.58
TOC (mg dm-3)
TIC (as CO3
2-) 2.5 ±2.4 <0.5* 6.4 4.8 ± 4.9 <0.5* 13
TOC (as C)
3.4 ±4.0 <0.5* 12 187 ± 113 63 374
pH - 12.4 13.0 - 12.8 12.9 Analysis of organics in CDP
IC (Anions, mmol dm-3)
Species Average
± SD Min Max
ISA 0.41 ±0.24 <0.15* 0.77 Lactate 2.0 ±1.6 0.22 5.7 Formate 1.9 ± 1.2 0.4 4.6 Acetate 0.66 ± 0.34 0.17 1.5

71
There is potential for the higher ionic strength to affect diffusivity 60 and competition
for sorption sites (see section 5) in the diffusion experiments. This is dealt with in the
individual experimental sections where relevant.
Table 9.1 also indicates that there is significant variation between individual batches
of NRVB equilibrated water used in the experiments. This was not anticipated and
was most likely due to insufficient equilibration time in the presence of the NRVB
and/or the removal of soluble components in the initial batches. These concentration
variations also had the potential to affect diffusivity and competition for sorption sites.
As a consequence and where possible, experiments requiring comparative data for
an individual element, were undertaken with a single batch of NRVB equilibrated
water.
The variation in organic content and specifically the low iso-saccharinic acid (ISA)
content of the CDP solutions is potentially more significant. The reason for the low
ISA content is likely to be sorption to one or more components of the NRVB.141 142 29
The potential for NRVB to sorb (or precipitate) ISA was briefly investigated at the
start of the CDP advection experiments. The CDP advection experiments typically
commence with a three day equilibration with the CDP solution. This equilibration
period provided an opportunity to investigate whether ISA in the CDP solution would
be retained on the NRVB cylinder.
Consequently samples were collected throughout the equilibration period and a
selection from the beginning, middle and end of two runs were sent to Manchester
University for analysis. The results along with the concentrations in the initial solution
are shown in table 9.2 below:

72
Sample
ISA (mM)
Lactate (mM)
Acetate (mM)
Propionate (mM)
Cl (mM)
SO4 (mM)
NO3 (mM)
CDP initial 0.051 1.51 1.10 0.00 0.76 5.14 0.07
Run 1 4 nd 0.01 0.02 0.00 0.74 0.15 0.10
7 nd 0.01 0.02 0.00 0.68 0.15 0.08
10 nd 0.01 0.07 0.01 0.73 0.15 0.09
12 nd 0.01 0.15 0.00 0.79 0.15 0.10
14 nd 0.01 0.29 0.01 0.85 0.16 0.12
18 nd 0.01 0.52 0.11 0.85 0.16 0.11
23 nd 0.01 0.69 0.20 0.94 0.16 0.12
31 0.002 0.85 0.79 0.33 0.93 0.16 0.11
42 0.004 1.42 0.85 0.41 0.97 0.17 0.11
50 nd 1.60 0.84 0.48 0.89 0.16 0.10
Run 2 3 nd 0.02 0.15 0.00 1.73 0.12 0.09
4 nd 0.01 0.22 0.01 1.95 0.13 0.09
6 nd 0.01 0.39 0.04 2.17 0.13 0.10
7 nd 0.11 0.42 0.07 2.11 0.13 0.09
8 nd 0.18 0.46 0.10 2.15 0.13 0.10
10 nd 0.38 0.50 0.19 2.14 0.13 0.10
12 nd 0.56 0.52 0.22 2.06 0.14 0.10
16 nd 0.69 0.54 0.26 1.93 0.13 0.10
20 nd 0.77 0.56 0.27 1.83 0.20 0.10
24 nd 0.87 0.60 0.32 1.88 0.14 0.10
Table 9.2 Concentrations of CDP components during the equilibration phase of two advection experiments
The concentration of ISA for both runs is reduced below the quantitation limit (0.05
mM) after passing through the NRVB cylinder. This confirmed that ISA is being
sorbed to the NRVB. The concentrations of lactate, acetate and chloride in the CDP
solution fall initially as residual pore water is displaced from the NRVB and begin to
rise back to their initial concentrations. Sulphate concentration is reduced
significantly suggesting precipitation (this may eventually reduce porosity and flow
rate). The propionate concentration rises from below detection to a maximum of 0.48
mM during the runs. Propionate is known to be generated late (~180 days) in the
evolution of CDP. 28 142 The results above suggest that advection through NRVB
initiated the production of propionate.

73
This research is not focussed on the nature of the organics present in CDP but
clearly the results in table 9.2 suggest that there is a significant and dynamic
interaction between the CDP components and NRVB.
9.3 Diffusion and Elution Profiles.
The form of the majority of the diffusion and elution profiles obtained in this research
initially showed rapid diffusion with a steep slope, followed by a smooth reduction in
rate until the concentration in the solution in contact with the solid reached a stable
condition. This kind of profile is certainly not unique and it has been previously
described for the migration of Cs in cementitious material. 48 70 143 144 145 This kind of
profile has been explained 143 by considering two diffusion paths for the migrating
ion; fast migration through pathways of few microns and slower movement through
the network of submicron pores. A similar explanation 145 proposed that, as the initial
phase of the migration commences, the larger pores are filling relatively quickly with
the migrating ions and in the later stage the rate of migration slows down as it moves
through the smaller pores. Consequently, the rate of migration does not only depend
on the overall porosity of the material but also the pore size distribution and
connectivity. For NRVB specifically it has been argued 146 that the distribution of pore
sizes (from 800 to 0.16 nm) could explain the two phases observed in the elution
profiles.

74
10.0 Tritiated Water (HTO)
10.1 Background
Tritiated water contains the radioactive hydrogen isotope tritium ( H or T) which is a
β emitter. The maximum energy of the β electron is low at 18.6 keV and tritium
decays to He with a half-life of 12.32 years,147 an electron anti-neutrino is also
released. The decay equation is:
H→ He 10
Tritium in the environment arises from three sources; natural occurence due to the
interaction of oxygen and nitrogen with cosmic radiation, from historic nuclear
weapons testing and from operational nuclear reactors.148 149 In the past tritium has
not been regarded as a serious pollutant. However as the worldwide inventory of
tritium falls, attention focusses on the environmental emissions, current and historic
from nuclear power plants and risk based assessments and clean ups are being
demanded by regulators.150
Tritiated water is chemically very similar to water and consequently it is an effective
tracer for water in aqueous systems.
The HTO experiments were undertaken to provide confidence that the diffusion and
advection techniques worked satisfactorily and reproducibly. There was also an
assumption that tritiated water represented the most conservative species available
to check that the GoldSim transport model was working correctly at a physical level
i.e. without incorporating partition.
The experiments undertaken were as follows
Diffusion with NRVB equilibrated water
Advection with NRVB equilibrated water
Advection with CDP solution.
In addition a parallel experiment using a 3:1, PFA:OPC waste packaging grout was
commenced but this is not referred to further in this section.

75
10.2 Additional Experimental Details for HTO Diffusion Experiments
The diffusion experiment utilised a 1.8 cm3 addition of 1.7x10⁻⁹ mol dm-3 HTO to the
central core of duplicate NRVB cylinders equivalent to 3317 Bq (or 199035 d min-1
where d = disintegrations). The addition was made in the “dispensing area” of the
laboratory not in the nitrogen glove box, the cylinder was sealed, submerged in 200
cm3 NRVB equilibrated water and returned to the glove box over a period of less
than two minutes. The total volume of equilibrated water in the system is assumed to
be 225 cm3 (the additional 25 cm3 being an estimate of the pore water volume in the
NRVB cylinder). HTO activity concentrations were determined using liquid
scintillation counting 151 152 on a Packard 2100 TR liquid scintillation counter with
GoldStar Multi-purpose liquid scintillation cocktail. Samples were taken throughout
the experimental duration but all determined on one day when the experiment was
completed to negate the need to correct for radioactive decay. In addition “control”
samples were made at the start of the experiment to enable recovery graphs to be
made. The control samples and appropriate blanks were also determined on the
same day as the samples from the experiments. All determinations were subject to
the 2 σ criterion available on the Packard counter to provide confidence that the
results were statistically valid.
10.3 Results HTO NRVB Diffusion with NRVB equilibrated water
Figs. 10.1 and 10.2 below show the complete data and early data for the diffusion
experiments, the plots are presented as the average of two duplicate samples. The
vertical error bars denote the 90% confidence limits assuming a two tailed t
distribution and horizontal error bars are set at +/- 0.25 days. Tabulated results are
presented as table 10.1 in appendix 1. Fig 10.3 presents the recovery of HTO from
the NRVB cylinder as the experiment progressed. The maximum achievable activity
concentration (Cmax) was 885 d min-1 cm-3 (=199035/225). A value of 1.00 implies
that 885 d min-1 cm-3 was achieved and all the HTO was distributed evenly
throughout the system, a value of zero implies that all the HTO remains within the
cylinder.

76
Fig. 10.1 Plot of HTO activity concentration vs time for the NRVB equilibrated water diffusion experiment
Fig. 10.2 Early data plot of HTO activity concentration vs time for the NRVB equilibrated water diffusion experiment
0
2000
4000
6000
8000
10000
12000
14000
16000
18000
0 50 100 150 200 250 300
HT
O A
ctiv
ity
Co
nce
ntr
atio
n (
Bq
dm
-3)
Time (days)
HTO (average)
0
2000
4000
6000
8000
10000
12000
14000
16000
18000
0 10 20 30 40
HT
O A
ctiv
ity
Co
nce
ntr
atio
n (
Bq
dm
-3)
Time (days)
HTO (average)

77
Fig. 10.3 HTO Retention vs time for the NRVB equilibrated water diffusion experiment
The plots show breakthrough at just less than 2 days followed by a smooth almost
linear initial increase in concentration which can be seen in more detail on the early
data graph, fig. 10.2. The rate of diffusion then slows at around 20 days and remains
stable until almost 100 days. Recovery during this period is around 0.85 i.e. about
85% of the total HTO inventory is in solution. The HTO concentration in solution then
continues to rise slowly up to 187 days when recovery reaches 1.08, significantly
exceeding 1.00. The trend of the later data on the recovery plot suggests that the
187 day data point is anomalous even though the high result was repeated in both
samples. The rising trend shows recovery in the later part of the experiment
consistently exceeding 1.00, suggesting that more HTO has been recovered than
was originally added to the experiment.
The suggestion that HTO recovery might exceed 1.00 implies that a mass balance
should be undertaken to check that the liquid scintillation technique used to
determine HTO activity concentration was functioning reasonably.
0
0.2
0.4
0.6
0.8
1
1.2
0 50 100 150 200 250 300
HT
O R
eten
tio
n
Time (days)
HTO (average)

78
The control sample activity concentration of 199035 d min-1 (realistically 199000 d
min-1) represents the start activity at 308 days into the experiment.
By day 308, a total of 32 x 1 cm3 samples had been taken from each experiment
leaving 193 cm3 (225-32) in each container.
The activity concentrations of samples 1 and 2 at day 308 were 909 and 952 Bq
min-1 cm-3 respectively.
The total number of d min-1 in sample 1 and sample 2 were 175473 (909x193) and
183736 (952x193) respectively.
The activity in d min-1 removed during sampling is provided in table 10.1 in appendix
1 and is 16696 for sample 1 and 17092 for sample 2.
Adding the inventory in the sample containers to the amount removed by sampling
should equal the original inventory represented by the control sample.
Sample 1 = (175473+16696) = 191679 d min-1
Sample 2 = (183736+17092) = 200364 d min-1
Average = (191679+200364)/2 = 196022 d min-1
The average for samples 1 and 2 compares well with the control sample being
smaller by only 1.5%.
Control samples at three different activity concentrations were tried due to concerns
about reproducibility caused by chemiluminescence at high pH, quenching, detector
efficiency across the concentration range and old HTO stocks. The control sample
detailed in the mass balance above was made using 200 µL of the original HTO with
10 cm3 of the scintillation cocktail. The result was multiplied by 9 to provide the
equivalent result for 1.8 cm3 of HTO addition. A control sample was also made using
1.8 cm3 of the original HTO and 10 cm3 of the scintillation cocktail produced
erroneously low result of 143729 d min-1 suggesting the detector may have been
saturated ref. Finally a series of 10x10 µL samples were made with 1 cm3 of NRVB
equilibrated water and 10 cm3 of scintillation cocktail added. The results had an

79
average of 995 d min-1 with a high of 1100 d min-1, a low of 908 d min-1 and a
standard deviation of 73 d min-1. The results were multiplied by 180 to enable
comparison, yielding an average of 179100 d min-1 with a low of 163440 d min-1 and
a high of 198000 d min-1.
It is clear that there was a lack of precision in the control samples used for the tritium
analyses. This cast doubt on the use of retention plots because the start
concentration needs to be stated accurately. A further problem arises because Cmax
will change each time a sample is taken (because activity and volume are removed
in different proportions). In later experiments a correction is applied to ensure Cmax is
correctly evaluated. These issues are revisited in the HTO modelling section
(section 10.6) where the concept of a data envelope is developed and used.
10.4 HTO Advection Experiments
10.4.1 Additional Experimental Details for HTO NRVB Advection Experiments A 50 µL injection of tritiated water was used for this experiment, delivering 1765 Bq
or 105900 d min-1 into the central core of the NRVB cylinder, the nitrogen pressure
driving the NRVB equilibrated water through the cylinder was fixed at 12 psi but rose
to 16 psi throughout the duration of the experiment.
The results below have been subjected to a correction for evaporative losses during
the collection of the samples. This was done using a blank tube containing a known
weight of deionised water and monitoring it throughout the experiment. Evaporation
rates were calculated per hour and corrections applied accordingly. The rate of
evaporation of HTO and non tritiated water were assumed to be equal.
The results are shown as figs. 10.4 and 10.5 and presented in table 10.2. The
control samples were made by taking 50 µL of the same HTO and diluting it with 50
cm3 of deionised water. Two control samples were made each using 1 cm3 of the
diluted solution and 10 cm3 of scintillation cocktail. The results were 2104 and 2132 d
min-1 cm-3, the average of the two results was multiplied by 50 to give the 105900 d
min-1 estimate of HTO activity in the injection. Blanks were prepared and all results
have been corrected accordingly.

80
Fig. 10.4 Plot of HTO NRVB advection results using NRVB equilibrated water
Fig. 10.5 Plot of recovered HTO from the NRVB advection experiment using NRVB equilibrated water
0.0
0.2
0.4
0.6
0.8
1.0
1.2
1.4
0
5000
10000
15000
20000
25000
30000
35000
40000
45000
50000
0 20 40 60 80 100 120
Flo
w R
ate
(g H
r-1 )
HT
O c
on
cen
trat
ion
(B
q d
m-3
)
Mass Eluted (g)
HTO
Flow Rate
0
20
40
60
80
100
120
0 20 40 60 80 100 120
% H
TO
Rec
ove
red
Mass Eluted (g)
HTO Recovered

81
10.4.2 Results The results are shown with mass eluted on the x axis; this parameter was selected
as it appeared to be a better way of comparing data for the different dissolved ions
being investigated. It would be more conventional to show time on the x axis but the
variation in flow rate seen across the range of advection experiments means that
time is not the best comparator. Nevertheless, flow rates and time have been
recorded because they are needed for the GoldSim modelling (see section 10.6).
It can be seen from figs. 10.4 and 10.5 that the advection experiment progressed
smoothly and the HTO peak broke through between 11 and 14 g of eluted mass
(between 9 and 12 hours into the experiment). Porosity of the NRVB cylinder can be
roughly estimated using the value at 50% of the upslope 153 which is approximately
21 g, the nominal volume of the cylinders is 48 cm3 (50 cm3 - 2 cm3 for the central
hole), the experimental estimate of porosity is therefore 21/48 = 0.44, which
compares reasonably to the published porosity of 0.5. The flow rate can be seen to
be generally falling over the course of the experiment. Also, the driving pressure
though initially low, increased throughout the experiment (from 12 to 16 psi)
suggesting that blocking could be occurring.
The recovery plot suggests that over 100% of the HTO has been recovered. The
recovered amount is 107% of the amount added and whilst the discrepancy is not
overly large and accepting the “wet and dirty” nature of the experiments, it must be
regarded as significant. It is also noticeable that the discrepancy is very similar to
that seen in the HTO NRVB diffusion experiments even though a different HTO
source was used and extra care was taken to produce control samples in the
anticipated eluent concentration range. It is known that the vapour pressure of HTO
in an enclosed system (containing only HTO and water) is approximately 20% lower
than that of water at ambient temperatures. 154 This implies that the mass of HTO
evaporated is likely to have been over estimated. An accurate correction cannot be
made because the advection experimental sample collection equipment is not
enclosed and the relative rates of evaporation for HTO and water are also dependent
on other variables including, ionic strength of the solution (intermolecular forces) and
relative humidity of the atmosphere.

82
10.5 HTO CDP Advection Experiment Results
10.5.1 Additional Experimental Detail for the HTO CDP Advection Experiments Prior to injection of HTO the NRVB cylinder was “run in” with the CDP solution for a
period of 3 days at the anticipated experimental flow rate (1.0 cm3 hr). As a
consequence approximately 3 pore volumes (70 - 75 cm3) of the CDP solution had
passed through the cylinder prior to the experiment commencing.
A 50 µL injection of HTO water was used for this experiment, delivering 2100 Bq or
126000 d min-1 into the central core of the NRVB cylinder, the nitrogen pressure
driving the NRVB equilibrated water through the cylinder was fixed at 20 psi
throughout the duration of the experiment. The results are presented as figs. 10.6
and 10.7 and table 10.3.
Fig. 10.6 Plot of HTO NRVB advection results using CDP solution
0.0
0.1
0.2
0.3
0.4
0.5
0.6
0.7
0.8
0.9
1.0
0
10000
20000
30000
40000
50000
60000
70000
80000
0 20 40 60 80 100 120
Flo
w R
ate
(g H
r-1 )
HT
O c
on
cen
trat
ion
(B
q d
m-3
)
Mass Eluted (g)
CDP HTO
Flow Rate

83
Fig. 10.7 Plot of recovered HTO from the NRVB advection experiment using CDP solution
0
20
40
60
80
100
120
0 20 40 60 80 100 120
% H
TO
Rec
ove
red
Mass Eluted (g)
CDP HTO Recovered

84
10.5.2 Results It can be seen from figs. 10.6 and 10.7 that the advection experiment progressed
smoothly and the HTO peak broke through between 8 and 10 g of eluted mass
(between 7 and 10 hours into the experiment), quicker than the equivalent NRVB
equilibrated water experiment. The flow rate can be seen to be falling over the
course of the experiment and the driving pressure was maintained 20 psi. The
steady decrease in flow rate at constant pressure suggests blocking may be
occurring.
The recovery plot suggests that over 100% of the HTO has been recovered. The
recovered amount is 102% of the amount added. The discrepancy is small and
accepting the “messy” nature of the experiments, it is not significant (see comments
regarding HTO evaporation at the end of section 10.4.2). The same HTO source was
used as used in the NRVB equilibrated water advection experiment and again care
was taken to produce control samples in the anticipated eluent concentration range.

85
10.6 GoldSim Transport Modelling of HTO Diffusion and Advection Results The construction of the GoldSim models used is described in section 8. The output
files from the models are very large (typically several thousand data points) and as a
consequence the data are presented graphically only and not in tabular form.
10.6.1 HTO NRVB Diffusion Model The model results and observed data for the HTO diffusion experiments are
presented as figs. 10.8 and 10.9; the second figure shows the early data from the
experiment.
Fig. 10.8 GoldSim model of HTO NRVB diffusion experiments
0
2000
4000
6000
8000
10000
12000
14000
16000
18000
0 50 100 150 200 250 300
HT
O A
ctiv
ity
Co
nce
ntr
atio
n (
Bq
dm
-3)
Time (days)
Observed (average)
Initial inventory = 3000 Bq
Upper bound initial inventory = 3390 Bq
Lower bound initial inventory = 2610 Bq
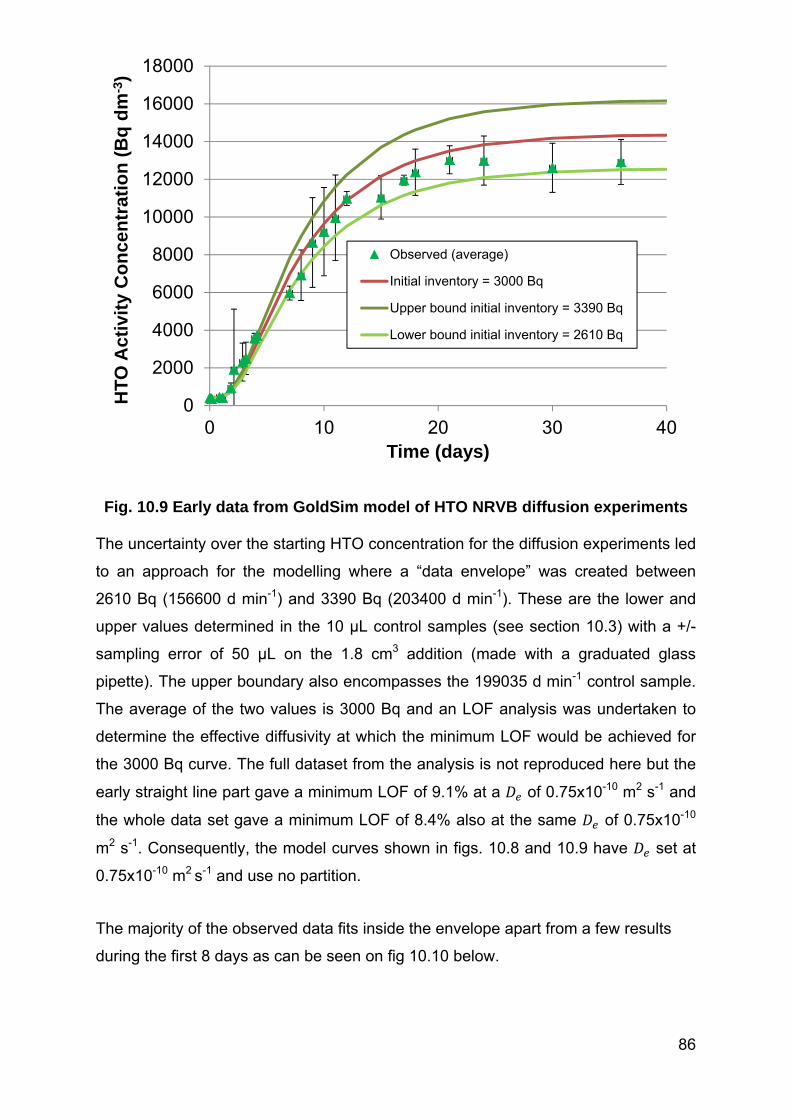
86
Fig. 10.9 Early data from GoldSim model of HTO NRVB diffusion experiments
The uncertainty over the starting HTO concentration for the diffusion experiments led
to an approach for the modelling where a “data envelope” was created between
2610 Bq (156600 d min-1) and 3390 Bq (203400 d min-1). These are the lower and
upper values determined in the 10 µL control samples (see section 10.3) with a +/-
sampling error of 50 µL on the 1.8 cm3 addition (made with a graduated glass
pipette). The upper boundary also encompasses the 199035 d min-1 control sample.
The average of the two values is 3000 Bq and an LOF analysis was undertaken to
determine the effective diffusivity at which the minimum LOF would be achieved for
the 3000 Bq curve. The full dataset from the analysis is not reproduced here but the
early straight line part gave a minimum LOF of 9.1% at a of 0.75x10⁻¹⁰ m2 s-1 and
the whole data set gave a minimum LOF of 8.4% also at the same of 0.75x10⁻¹⁰
m2 s-1. Consequently, the model curves shown in figs. 10.8 and 10.9 have set at
0.75x10⁻¹⁰ m2 s-1 and use no partition.
The majority of the observed data fits inside the envelope apart from a few results
during the first 8 days as can be seen on fig 10.10 below.
0
2000
4000
6000
8000
10000
12000
14000
16000
18000
0 10 20 30 40
HT
O A
ctiv
ity
Co
nce
ntr
atio
n (
Bq
dm
-3)
Time (days)
Observed (average)
Initial inventory = 3000 Bq
Upper bound initial inventory = 3390 Bq
Lower bound initial inventory = 2610 Bq

87
Fig. 10.10 Early data showing minor deviations from GoldSim model of HTO NRVB diffusion experiments
0
2000
4000
6000
8000
10000
12000
14000
0 2 4 6 8 10
HT
O A
ctiv
ity
Co
nce
ntr
atio
n (
Bq
dm
-3)
Time (days)
Observed (average)
Initial inventory = 3000 Bq
Upper bound initial inventory = 3390 Bq
Lower bound initial inventory = 2610 Bq

88
10.6.2 HTO Advection Models The model results and observed data for the HTO diffusion experiments are
presented as figs. 10.11, 10.12 and 10.13. The parameters used to generate the
model curves are presented immediately below the respective figures. The stepped
appearance of the observed data curves occurs because each data point extends
over a period of time (and mass of eluent). Time is presented on the x axis and not
eluted mass because the GoldSim model is easier to manipulate and was found to
produce better results against a time base. The statistical approach used in the
diffusion modelling was not considered appropriate with the advection data because
the experimental methodology is still in the trial stage.
Fig. 10.11 Observed and GoldSim predicted data for the advection of HTO in NRVB equilibrated water
Model Parameters
porosity = 0.5 start inventory = 1765 Bq HTO = 0.75x10⁻¹⁰ m2 s-1 background = 2500 Bq dm-3 = 0.18x10⁻³ m3 kg-1
0
5000
10000
15000
20000
25000
30000
35000
40000
45000
50000
0 25 50 75 100 125 150
HT
O A
ctiv
ity
Co
nce
ntr
atio
n (
Bq
dm
-3)
Time (hours)
Observed HTO concentration
Predicted HTO Concentration

89
Fig. 10.12 Observed and GoldSim predicted data for the advection of HTO in CDP solution
Model Parameters
porosity = 0.5 start inventory = 2100 Bq HTO = 0.75x10⁻¹⁰ m2 s-1 background = 2500 Bq dm-3 no partition
0
10000
20000
30000
40000
50000
60000
70000
80000
0 25 50 75 100 125 150 175
HT
O A
ctiv
ity
Co
nce
ntr
atio
n (
Bq
dm
-3)
Time (hours)
Observed HTO concentration
Predicted HTO Concentration

90
Fig. 10.13 Observed and GoldSim predicted data for the advection of HTO in NRVB equilibrated water
Model Parameters
porosity = 0.5 start inventory = 1765 Bq HTO = 0.75x10⁻¹⁰ m2 s-1 background = 2500 Bq dm-3 no Partition
Commentary Fig. 10.11 shows that the elution curve for HTO in NRVB equilibrated water can be
readily modelled. The main point of interest is that a small amount of partition was
required to produce an accurate match. This suggests that HTO is sorbed
preferentially over water. This behaviour has been observed on silica gels in other
studies 155 156 and was shown to be dilution of the adsorbed HTO by isotopic
exchange with non-tritiated water and hydroxyl groups present in the matrix. A
similar mechanism involving CSH waters of crystallisation 70 could be responsible for
the behaviour observed in the NRVB advection experiments.
Fig. 10.12 shows the elution curve for HTO in the CDP solution is also readily
modelled. The main points of interest are that the advection is faster in the presence
0
10000
20000
30000
40000
50000
60000
70000
0 25 50 75 100 125
HT
O A
ctiv
ity
Co
nce
ntr
atio
n (
Bq
dm
-3)
Time (hours)
Observed HTO concentration
Predicted HTO concentration

91
of CDP and that partition is not required to produce an accurate match. The
difference between the two plots is small but noticeable. The effective diffusivity used
for both diffusion and advection models, is comparable, 157 if a little lower than
literature values (see table 17.1). For comparison, fig. 10.13 shows the effect of
modelling the advection results of HTO in NRVB equilibrated water without partition
and it can be seen that there is a clear mismatch. The limitations of the GoldSim
model mentioned in section 7.5 are also relevant.
There are a number of potential explanations for the results:
One or more of the CDP components is chemically interacting with the NRVB
preventing access to the exchangeable water in the NRVB matrix.
Some tritium is exchanged into the CDP components which have different
sorption characteristics (see section 9) and its migration behaviour is
changed as a consequence.
The physical nature of the NRVB is changed by the process of advection
and/or exposure to CDP and that the experiments have been undertaken at
different stages of the physical evolution of the NRVB.
The results simply exhibit the range of possible outcomes and the presence
of CDP is not having an effect i.e. the results are a reflection of the
reproducibility of the experiments.
In addition to the silica gel studies referred to above this non-conservative behaviour
of HTO has also been observed in cementitious matrices. Some authors,66 156
attributed the deviation mainly to isotope exchange of tritium for hydrogen in the
cement. It has also been proposed 77 that if isotopic exchange was indeed the main
process affecting HTO migration, the for HTO should correspond to the fraction of
water bound to the cement. However, the expected Rd values obtained from ignition
of the cement samples were between 2.5 and 4 times higher than the values
determined from batch sorption or through-diffusion experiments. This suggests that
there are other factors in addition to isotopic exchange that could affect HTO
migration. These could include occluded or variably accessible pore space (see
section 9.3 for additional information).

92
It was realised before starting the experimental programme that prolonged advection
could have a physical effect on the NRVB cylinders and consequently new blocks
were used for each experiment. The reproducibility of the advection experiments has
not been investigated and in particular the effect of running many consecutive
experiments on the same NRVB cylinders.
More confirmatory data may be gathered from the diffusion experiment for HTO
using CDP solution which has yet to be undertaken.
The information provided by these experiments is interesting and the successful
application of a type of model usually used on a much larger scale suggests that the
techniques can be used to compare the migration of radionuclides in porous solids.

93
11.0 Caesium
11.1 Background The main Cs isotope of interest is 137Cs, it is an important component of the UK
radioactive waste inventory and is mentioned along with 135Cs and 134Cs in the latest
estimate at 01/04/2010 26, table 11.1 below reproduces the relevant activities.
Isotope HLW ILW LLW units
137Cs/137mBa 4.2x10⁷ 1.1x10⁶ 8.0 T Bq 135Cs 1.9x10² 6.8 1.5x10⁻⁴ T Bq 134Cs 2.5x10⁵ 4.8x10³ 4.4x10⁻² T Bq
Table 11.1 Radioisotopes of Cs in the UK waste inventory at 01/04/2010 137Cs has a half live of 30.17 years, about 95% of the decays are by beta emission to 137mBa a metastable isomer; 137mBa decays to the ground state with gamma emission
and has a half-life of about 153 seconds.147 It is this decay product that makes 137Cs
an external hazard, it is also the emission commonly used to quantify 137Cs as is the
case in the Cs advection and diffusion experiments described in the following
sections. The specific activity of 137Cs is 3.22x10¹² Bq g-1 and the decay equation is:
→ →
The maximum energy (Emax) of the main beta emission is 0.51MeV (95%) and the
energy of the main gamma emission from 137mBa is 0.66MeV (85%).158
137Cs can be formed in nuclear reactors when an atom of 235U splits asymmetrically
into two large fragments generating fission products with mass numbers between 90
and 140, additional neutrons are also generated by this fission. 135Cs and 137Cs are
produced with relatively high yields of about 7% and 6%, respectively. 137Cs is
present in spent nuclear fuel, high level radioactive wastes resulting from the
processing of spent nuclear fuel, and radioactive wastes associated with the
operation of nuclear reactors and fuel reprocessing plants. 137Cs is an isotope of
concern from an environmental management perspective; it is an alkali metal and
can be very mobile in the groundwater environment. 137Cs is present in soil around
the world largely as a result of fallout from past atmospheric nuclear weapons tests it

94
is also present as a contaminant at locations such as nuclear reactors and facilities
that process spent nuclear fuel.159 As a consequence the potential migration of Cs
through and beyond a GDF is significant to researchers in the area.
The experiments undertaken were as follows:
Diffusion with NRVB equilibrated water using 137Cs tracer only and 137Cs
tracer plus CsNO3 carrier
Diffusion with CDP solution with 137Cs tracer and with 137Cs tracer plus CsNO3
carrier
Mixed element diffusion experiments (NRVB equilibrated water and CDP
solution) where Cs diffusion is evaluated in the presence salts containing Ni,
Eu, U, Th and I.
Advection with NRVB equilibrated water and 137Cs tracer only
Autoradiographs for the diffusion experiments have also been produced along with
gamma spectroscopy of the residual 137Cs in the NRVB cylinders to complete a
mass balance. Environmental SEM micrographs and EDX analyses are also
included. GoldSim transport models have been generated for the 137Cs diffusion
experiments. Reference is also made to a series of solubility experiments (under and
over-saturation) underway in the Loughborough Radiochemistry laboroatory as part
of the NDA chemical containment research.
11.2 Additional Experimental Details for 137Cs Diffusion Experiments
The diffusion experiment utilised a 50 µl addition of 137Cs (produced as the nitrate in
nitric acid by Perkin Elmer) to the central cores of duplicate NRVB cylinders,
equivalent to:
Cmax of 2661 d min-1 (9979 Bq per cylinder and an initial concentration in the
inner core = 1.5x10⁻⁸ mol dm-3) for NRVB equilibrated water with 137Cs tracer
only.
Cmax of 2631 d min-1 (9866 Bq per cylinder and an initial concentration in the
inner core = 1.5x10⁻⁸ mol dm-3) for CDP solution with 137Cs tracer only.
Cmax of 3088 d min-1 (11580 Bq per cylinder and an initial concentration in the
inner core = 1.8x10⁻⁸ mol dm-3) for both the NRVB equilibrated water and CDP
solution 137Cs tracer with CsNO3 carrier

95
Cmax is the maximum possible number of disintegrations per minute in the 1 cm3
sample if the 137Cs was to equilibrate completely with the liquid in the system. The
results figures and tables also utilise a calculation to account for the effect on Cmax
caused by the removal of volume and activity during sampling. A disproportionately
small amount of activity is removed during sampling compared to volume, the overall
effect is to increase Cmax each time a sample is taken. Cmax is used to prepare the
relative retention plots to enable visualisation of a range of diffusion experiments on
the same axes.
The solubility “chemical containment” research 134 did not identify any potential
effects on Cs solubility due to high pH, presence of NRVB, presence of CDP or
reducing agents. Consequently fast breakthrough, equilibration or at least movement
to a stable condition and limited retention of Cs were anticipated.
The mass of Cs added to each of the carrier experiments was 32.9 mg in the form of
(Aldrich) CsNO3. The amount of carrier added was agreed after discussion with NDA
and was calculated so that the maximum concentration in the system, assuming no
sorption would be 10-3 mol dm-3. The initial concentration of the carrier in the inner
cores was 0.15 mol dm-3 The mass of 137Cs (~3.6 ng) added was considered to be
negligible. Initially NDA wanted to investigate a low concentration (the tracer only)
and a high concentration with the option of undertaking further experiments above
the background concentrations (~4x10⁻⁵ and 10-4 mol dm-3 for the NRVB and CDP
solutions respectively) and below the present carrier experiments. These additional
experiments have not been requested by NDA.
The NRVB cylinders used for the experiments were equilibrated in the CDP solution
in sealed containers, in a nitrogen glovebox for 43 days prior to commencement. The
radioisotope addition was made outside the nitrogen glove box, the cylinder was
sealed, submerged in 200 cm3 NRVB equilibrated water and returned to the glove
box over a period of less than two minutes. The total volume of equilibrated water in
the system at the start is assumed to be 225 cm3 (the additional 25 cm3 being an
estimate of the pore water volume in the NRVB cylinder). 137Cs activity
concentrations were determined by counting the peak centred at 0.66 MeV on a NaI
crystal detector, Packard Cobra II auto-gamma counter.160 1 cm3 samples were
taken throughout the experimental duration but all determined on one day when the
experiment was completed to negate the need to correct for radioactive decay (the

96
total decay of 137Cs across the duration of the longest experiment is less than 4% of
the initial amount added). In addition 1 cm3 “control” samples were made at the start
of the experiment to enable retention graphs to be made. The control samples and
appropriate blanks were also determined on the same day as the samples from the
experiments. All determinations were subject to the 2 σ criterion available on the
gamma counter to ensure results are statistically valid.
11.3 Results of 137Cs diffusion experiments.
All results are presented as the average of duplicates along with with vertical error
bars denoting the 90% confidence limits assuming a two tailed t distribution and
horizontal error bars set at +/- 0.25 days. Three graphs are presented for each
experiment; showing all results, early data and C/Cmax relative retention. The data
are presented in two tables for each experiment. A short commentary is provided
after each set of graphs and before the tables.
11.3.1 Results of the 137Cs tracer NRVB diffusion experiment
The results of the 137Cs tracer NRVB diffusion experiment are presented below as
figs. 11.1 to 11.3 and tables 11.2 and 11.3 in appendix 1.

97
Fig. 11.1 Results of the NRVB 137Cs tracer only diffusion experiment using NRVB equilibrated water
0
5000
10000
15000
20000
25000
30000
35000
40000
0 100 200 300 400 500137C
s A
ctiv
ity
Co
nce
ntr
atio
n (
Bq
dm
-3)
Time (days)
Cs-137 Tracer NRVB (average)

98
Fig. 11.2 Early data from the results of the NRVB 137Cs tracer only diffusion experiment using NRVB equilibrated water
0
5000
10000
15000
20000
25000
30000
0 10 20 30 40
137C
s A
ctiv
ity
Co
nce
ntr
atio
n (
Bq
dm
-3)
Time (days)
Cs-137 Tracer NRVB (average)
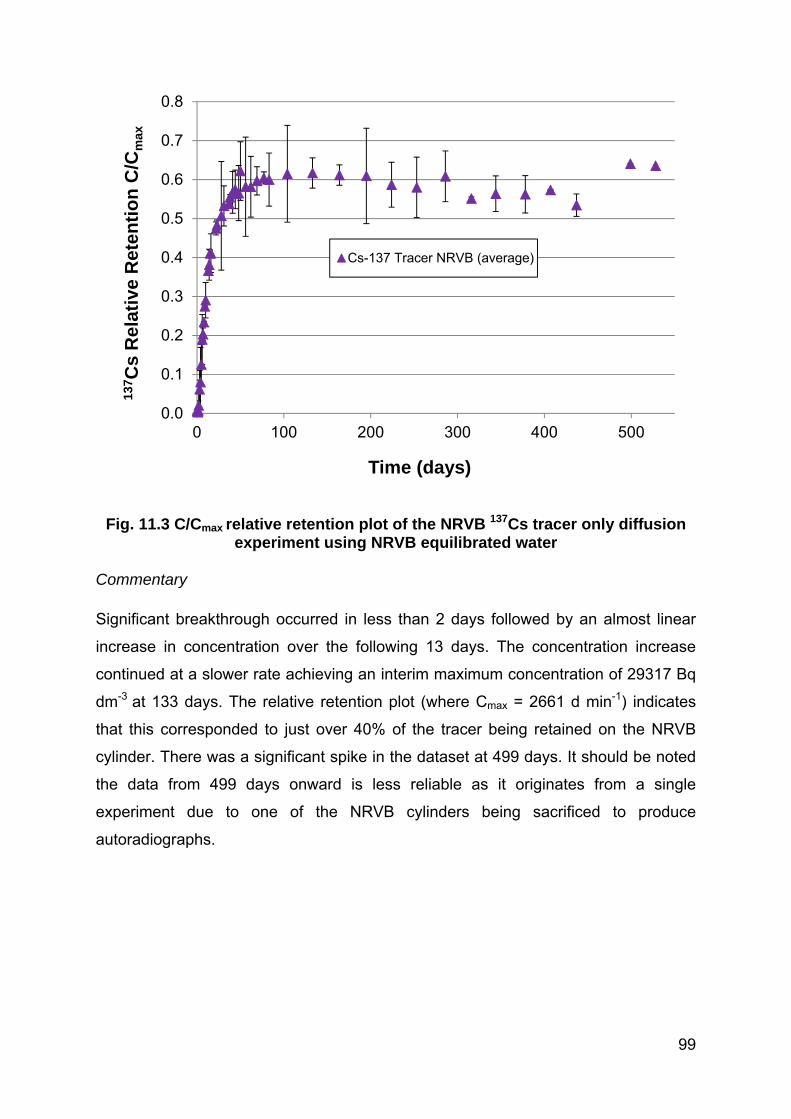
99
Fig. 11.3 C/Cmax relative retention plot of the NRVB 137Cs tracer only diffusion experiment using NRVB equilibrated water
Commentary
Significant breakthrough occurred in less than 2 days followed by an almost linear
increase in concentration over the following 13 days. The concentration increase
continued at a slower rate achieving an interim maximum concentration of 29317 Bq
dm-3 at 133 days. The relative retention plot (where Cmax = 2661 d min-1) indicates
that this corresponded to just over 40% of the tracer being retained on the NRVB
cylinder. There was a significant spike in the dataset at 499 days. It should be noted
the data from 499 days onward is less reliable as it originates from a single
experiment due to one of the NRVB cylinders being sacrificed to produce
autoradiographs.
0.0
0.1
0.2
0.3
0.4
0.5
0.6
0.7
0.8
0 100 200 300 400 500
137C
s R
elat
ive
Ret
enti
on
C/C
max
Time (days)
Cs-137 Tracer NRVB (average)

100
11.3.2 Results of the 137Cs tracer CDP diffusion experiment
The results of the 137Cs tracer CDP diffusion experiment are presented below as figs.
11.4 to 11.6 and as tables 11.4 and 11.5 in appendix 1.
Fig. 11.4 Results of the NRVB 137Cs tracer only diffusion experiment using CDP solution
0
10000
20000
30000
40000
50000
60000
0 50 100 150 200 250 300
137C
s A
ctiv
ity
Co
nce
ntr
atio
n (
Bq
dm
-3)
Time (days)
Cs-137 Tracer CDP (average)

101
Fig. 11.5 Early data from the results of the NRVB 137Cs tracer only diffusion experiment using CDP solution
0
10000
20000
30000
40000
50000
60000
0 5 10 15 20
137C
s A
ctiv
ity
Co
nce
ntr
atio
n (
Bq
dm
-3)
Time (days)
Cs-137 Tracer CDP (average)
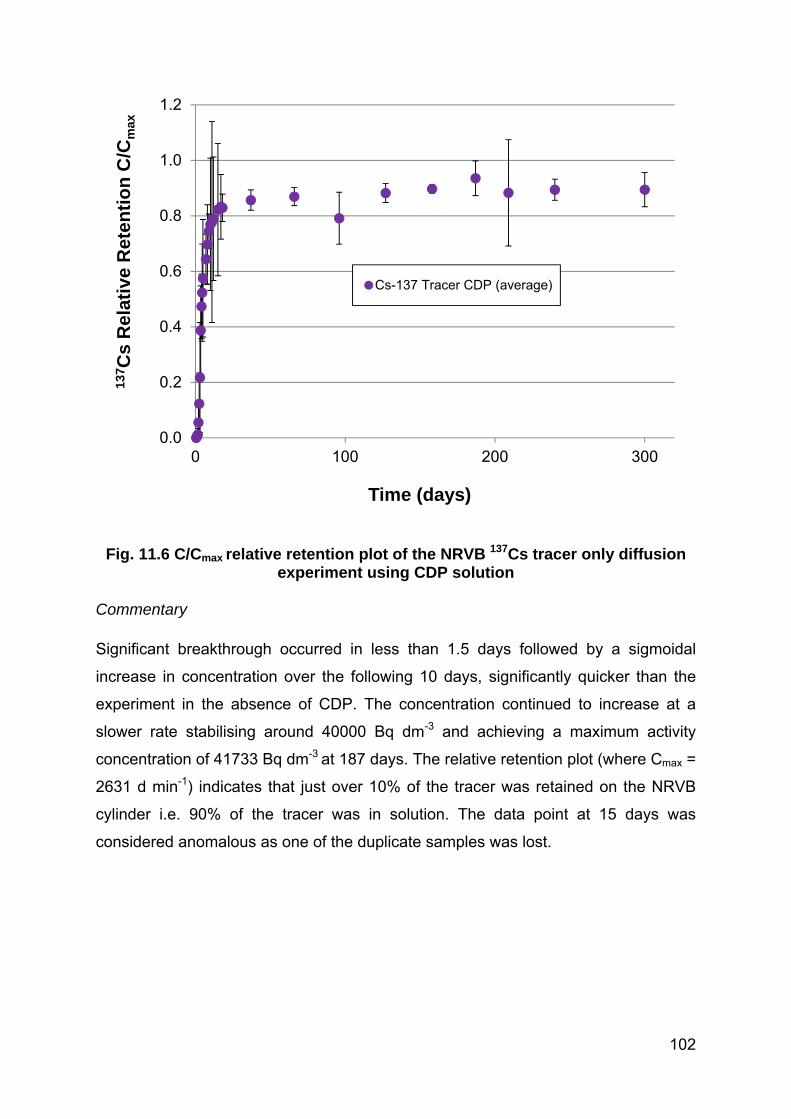
102
Fig. 11.6 C/Cmax relative retention plot of the NRVB 137Cs tracer only diffusion experiment using CDP solution
Commentary
Significant breakthrough occurred in less than 1.5 days followed by a sigmoidal
increase in concentration over the following 10 days, significantly quicker than the
experiment in the absence of CDP. The concentration continued to increase at a
slower rate stabilising around 40000 Bq dm-3 and achieving a maximum activity
concentration of 41733 Bq dm-3 at 187 days. The relative retention plot (where Cmax =
2631 d min-1) indicates that just over 10% of the tracer was retained on the NRVB
cylinder i.e. 90% of the tracer was in solution. The data point at 15 days was
considered anomalous as one of the duplicate samples was lost.
0.0
0.2
0.4
0.6
0.8
1.0
1.2
0 100 200 300
137C
s R
elat
ive
Ret
enti
on
C/C
max
Time (days)
Cs-137 Tracer CDP (average)

103
11.3.3 Results of the 137Cs tracer; CsNO3 carrier NRVB diffusion experiment
The results of the 137Cs tracer; CsNO3 Carrier NRVB diffusion experiment are
presented below as figs. 11.7 to 11.9 and as tables 11.6 and 11.7 in appendix 1.
Fig. 11.7 Results of the NRVB 137Cs tracer; CsNO3 carrier diffusion experiment using NRVB equilibrated water
0
10000
20000
30000
40000
50000
60000
70000
0 50 100 150 200 250 300137C
s A
ctiv
ity
Co
nce
ntr
atio
n (
Bq
dm
-3)
Time (days)
Cs-137 Tracer+CsNO3 Carrier (average)

104
Fig. 11.8 Early data from the results of the NRVB 137Cs tracer; CsNO3 carrier diffusion experiment using NRVB equilibrated water
0
10000
20000
30000
40000
50000
60000
0 5 10 15 20 25137C
s A
ctiv
ity
Co
nce
ntr
atio
n (
Bq
dm
-3)
Time (days)
Cs-137 Tracer+CsNO3 Carrier (average)

105
Fig. 11.9 C/Cmax relative retention plot of the NRVB 137Cs tracer; CsNO3 carrier diffusion experiment using NRVB equilibrated water
Commentary
Breakthrough commenced in less than 2.0 days followed by an almost linear
increase in concentration over the following 9 - 10 days, similar to the equivalent
tracer only experiment. The concentration continued to increase at a slower rate
stabilising between 50000 and 52000 Bq dm-3 but achieving a maximum activity
concentration of 52800 Bq dm-3 at 186 days. This maximum is coincindent with an
apparent spike in the dataset. It is not clear whether there is a spike in concentration
or the previous point at 95 days is anomalously low. The relative retention plot
(where Cmax = 3088 d min-1) indicates that only ~5% of the tracer was retained on the
NRVB cylinder i.e. 95% of the tracer (and carrier) was in solution.
0.0
0.2
0.4
0.6
0.8
1.0
1.2
0 100 200 300
137C
s R
elat
ive
Ret
enti
on
C/C
max
Time (days)
Cs-137 Tracer+CsNO3 Carrier (average)

106
11.3.4 Results of the 137Cs tracer; CsNO3 carrier CDP diffusion experiment
The results of the 137Cs tracer; CsNO3 Carrier CDP diffusion experiment are
presented below as figs. 11.10 to 11.12 and as tables 11.8 and 11.9 in appendix 1.
Fig. 11.10 Results of the NRVB 137Cs tracer; CsNO3 carrier diffusion experiment using CDP solution
0
10000
20000
30000
40000
50000
60000
70000
80000
0 100 200 300
137C
s A
ctiv
ity
Co
nce
ntr
atio
n (
Bq
dm
-3)
Time (days)
Cs-137 Tracer+CsNO3 Carrier CDP (average)

107
Fig. 11.11 Early data from the results of the NRVB 137Cs tracer; CsNO3 carrier diffusion experiment using CDP solution
Fig. 11.12 C/Cmax relative retention plot of the NRVB 137Cs tracer; CsNO3 carrier diffusion experiment using CDP solution
0
10000
20000
30000
40000
50000
60000
70000
80000
0 5 10 15 20 25
137C
s A
ctiv
ity
Co
nce
ntr
atio
n (
Bq
dm
-3)
Time (days)
Cs-137 Tracer+CsNO3 Carrier CDP (average)
0.0
0.2
0.4
0.6
0.8
1.0
1.2
1.4
0 100 200 300
137C
s R
elat
ive
Ret
enti
on
C/C
max
Time (days)
Cs-137 Tracer+CsNO3 Carrier CDP (average)

108
Commentary
Breakthrough commenced in less than 2.0 days followed by a sigmoidal increase in
concentration over the following 10 days. The concentration continued to increase at
a slower rate stabilising between 50000 and 53000 Bq dm-3 but achieving a
maximum activity concentration of 53058 Bq dm-3 at 186 days. The relative retention
plot (where Cmax = 3088 d min-1) indicates that only ~5% of the tracer was retained
on the NRVB cylinder i.e. 95% of the tracer (and carrier) was in solution. The results
were very similar to the tracer carrier experiment in the absence of CDP.
11.3.5 Comparison of 137Cs tracer and tracer CsNO3 carrier experiments As stated earlier the relative retention or C/Cmax plots allow for a quick visual
comparison to be made of the similar experiments where there may be variation in
the starting activities and concentrations. This section graphically presents the Cs
data in a way that allows comparison of the tracer only experiments to the tracer
carrier experiments. As a general rule, care is necessary when considering plots of
this nature, particularly with diffusion experiments where initial concentrations and
concentration gradients are crucially important to the evolution of the results.
Figs. 11.13 to 11.17 below show the Cs data comparatively as experimental pairs
and a brief commentary is provided after each plot.

109
Fig. 11.13 Comparative relative retention plot of 137Cs diffusion data for the NRVB equilibrated water experiments
0.0
0.2
0.4
0.6
0.8
1.0
1.2
0 100 200 300
137C
s R
elat
ive
Ret
enti
on
C/C
max
Time (days)
Cs-137 Tracer+CsNO3 Carrier NRVB (average)
Cs-137 Tracer NRVB (average)

110
Fig. 11.14 Early data comparative relative retention plot of 137Cs diffusion experiments using NRVB equilibrated water
There is a marked contrast between the two datasets for the NRVB equilibrated
water experiments, the tracer only experiment was slower and retention on the
NRVB was significant. The carrier experiment proceeds much more rapidly and the
retention on the NRVB is less than 10%. The early data (Fig 11.14 above) confirms
that the divergence begins in the initial stage of the experiments.
0.0
0.2
0.4
0.6
0.8
1.0
1.2
0 5 10 15 20
137C
s R
elat
ive
Ret
enti
on
C/C
max
Time (days)
Cs-137 Tracer+CsNO3 Carrier NRVB (average)
Cs-137 Tracer NRVB (average)

111
Fig. 11.15 Comparative relative retention plot of 137Cs diffusion data for the CDP solution experiments
Fig. 11.16 Early data comparative relative retention plot of 137Cs diffusion experiments using CDP solution
The CDP solution datasets appear very similar although the tracer only experiment
stabilised with consistently higher retention of Cs. The early data exhibited different
profiles and initial rates of concentration increase. The relative retention plot for the
two carrier experiments (not reproduced here) shows them to be identical.
0.0
0.2
0.4
0.6
0.8
1.0
1.2
0 100 200 300
137C
s R
elat
ive
Ret
enti
on
C/C
max
Time (days)
Cs-137 Tracer+CsNO3 Carrier CDP (average)
Cs-137 Tracer CDP (average)
0.0
0.2
0.4
0.6
0.8
1.0
1.2
0 5 10 15 20 25
137C
s R
elat
ive
Ret
enti
on
C/C
max
Time (days)
Cs-137 Tracer+CsNO3 Carrier CDP (average)
Cs-137 Tracer CDP (average)

112
11.4 Cs in the Mixed Element Diffusion Experiments
11.4.1 Additional information relevant to the mixed element diffusion experiments The mixed element diffusion experiments were set up to investigate the effect on the
diffusion rates of Cs, I, U, Th. Eu and Ni when all were present.134 The experiments,
eleven of each type (NRVB equilibrated water and CDP solution), were the first to be
undertaken using the radial approach. Sufficient CsNO3 and KI were added to
produce a 10-3 mol dm-3 solution in the event of complete equilibration. In addition
precipitates from a neutralised solution containing UO2(NO3)2.6H2O, Th(NO3)4.4H2O,
EuCl3.6H2O and NiCl2.6H2O were mixed with the Cs and I solutions to produce a
slurry which was added to the central cores of the NRVB cylinders. The NRVB
cylinders used for the CDP experiments were equilibrated in a CDP solution for 30
days prior to commencement. The Cs determinations were performed by ICP-MS.
11.4.2 Cs Results for the mixed element diffusion experiments in NRVB equilibrated water and CDP solution The average of eleven results for both types of experiment are presented below as
fig. 11.17 and the data for all experiments provided as tables 11.10 and 11.11 in
appendix 1.
Fig. 11.17 Averaged Cs Results for the mixed element diffusion experiments in NRVB equilibrated water and CDP solution
0.0E+00
1.0E-04
2.0E-04
3.0E-04
4.0E-04
5.0E-04
6.0E-04
7.0E-04
8.0E-04
9.0E-04
0 100 200 300 400 500 600
Cs
co
nce
ntr
atio
n (
mo
l d
m-3
)
Time (days)
NRVB (average)
CDP (average)

113
The main points of interest arising from the Cs diffusion results in the mixed element
experiments are:
The overall behaviour was similar to the single element experiments; the
presence of CDP appeared to cause faster breakthrough and stabilisation but
retention is almost indistinguishable from the experiment in the absence of
CDP
The data are not as consistent as those generated by the single element
versions of the experiments and whilst averaging has helped the visualisation,
the raw data shows a large amount of variation (see figs. 11.18 to 11.21 for
raw data plots). This variation commences early in the experiments, the extent
of variation is less in the CDP experiments.
There appears to be retention of Cs in the early part of the experiment but as
time progresses the amount in solution is getting closer to the Cmax of 10-3 mol
dm-3.
The higher results at the end of the sequence are an average of nine results
as two from each set were sacrificed for inspection and autoradiography.
These experiments were very early attempts at the technique and
modifications have been on-going, in particular handling time outside the
glove box and dosing of the central cores have been speeded up and subject
to more control.
The slurry placed in the central core has not been fully characterised but it is a
complex mixture of salts that could be affecting precipitation, solubility and
subsequent migration.

114
Fig. 11.18 Cs raw data from the mixed element diffusion experiments in NRVB equilibrated water134
Fig. 11.19 Cs early raw data from the mixed element diffusion experiments in NRVB equilibrated water134
0.0E+00
2.0E-04
4.0E-04
6.0E-04
8.0E-04
1.0E-03
1.2E-03
0 100 200 300 400 500 600
Cs
co
nce
ntr
atio
n (
mo
l d
m-3
)
Time (days)
1y-1
1y-2
2y-1
2y-2
3y-1
3y-2
4y-1
4y-2
4y-3
spare-1
spare-2
0.0E+00
1.0E-04
2.0E-04
3.0E-04
4.0E-04
5.0E-04
6.0E-04
0 5 10 15 20 25 30
Cs
co
nce
ntr
atio
n (
mo
l d
m-3
)
Time (days)
1y-1
1y-2
2y-1
2y-2
3y-1
3y-2
4y-1
4y-2
4y-3
spare-1
spare-2

115
Fig. 11.20 Cs raw data from the mixed element diffusion experiments in NRVB equilibrated water 134
Fig. 11.21 Cs early raw data (unaveraged) from the mixed element diffusion experiments in CDP solution 134
0.0E+00
2.0E-04
4.0E-04
6.0E-04
8.0E-04
1.0E-03
1.2E-03
0 100 200 300 400 500
Cs
co
nce
ntr
atio
n (
mo
l d
m-3
)
Time (days)
1y-1
1y-2
2y-1
2y-2
3y-1
3y-2
4y-1
4y-2
4y-3
spare-1
spare-2
0.0E+00
1.0E-04
2.0E-04
3.0E-04
4.0E-04
5.0E-04
6.0E-04
7.0E-04
8.0E-04
0 5 10 15 20 25
Cs
co
nce
ntr
atio
n (
mo
l d
m-3
)
Time (days)
1y-1
1y-2
2y-1
2y-2
3y-1
3y-2
4y-1
4y-2
4y-3
spare-1
spare-2

116
11.5 GoldSim Modelling
11.5.1 Additional information relevant to the Cs NRVB diffusion modelling Details of the GoldSim model are discussed in section 8. The results from the
modelling of the Cs NRVB diffusion experiments are presented as figs. 11.21 to
11.24. Initial concentrations are provided in section 11.2. It is important to be aware
that activity concentrations were modelled and as a consequence a direct
comparison cannot be made in the same manner as possible with the relative
retention plots. Partition is referred to as throughout, primarily because this term,
rather than is used in GoldSim. The LOF calculations are built into the model
enabling it to determine the combination of and parameters that minimise LOF.
Short commentaries explaining the data envelopes, diffusivity, partition coefficientand LOF outputs are also provided.
11.5.2 GoldSim models for 137Cs tracer and tracer with carrier using NRVB equilibrated water The GoldSim models for the 137Cs tracer and tracer with carrier using NRVB
equilibrated water are presented as figs. 11.22 and 11.23.

117
Fig. 11.22 Experimental and modelled NRVB diffusion curves for 137Cs at tracer and tracer carrier (CsNO3) concentrations in NRVB equilibrated water
0
10000
20000
30000
40000
50000
60000
0 100 200 300
137C
s A
ctiv
ity
Co
nce
ntr
atio
n (
Bq
dm
-3)
Time (days)
Cs-137 Tracer+CsNO3 Carrier NRVB
Model Cs-137 Tracer+CsNO3 Carrier NRVB
CS-137 Tracer NRVB
Model Cs-137 Tracer NRVB

118
Fig. 11.23 Early experimental and modelled NRVB diffusion curves for 137Cs at tracer and tracer carrier (CsNO3) concentrations in NRVB equilibrated water
Commentary
The best fit and model results for the carrier experiments were 0.9x10⁻¹⁰ m2 s-1
and 0.2x10⁻³ m3 kg-1, respectively (red long hashed line in fig. 11.22). The LOF for
the best model result was 6.9%. The majority of the experimental data could be
contained in the interval defined by setting between 0.7x10⁻¹⁰ and 1.2x10⁻¹⁰ m2 s-1
and between 0.1x10⁻³ and 0.3x10⁻³ m3 kg-1, (upper pair of solid purple lines in fig.
11.21). The early data plot (fig. 11.23) has been provided to illustrate the difficulty of
setting a suitable envelope. The results that fall outside the envelope can be clearly
seen on the figures. It should be noted that all observed values are included in the
LOF results even those outside the envelope.
The tracer experiments yielded higher best fit and model results than for the
carrier experiments at 2.0x10⁻¹⁰ m2 s-1 and 2.3x10⁻³ m3 kg-1, respectively (red short
hashed lines in fig. 11.22). The LOF for the best model result was 8.5%. The
intervals of and that encompass most of the experimental data were also wider
0
10000
20000
30000
40000
50000
0 5 10 15
137C
s A
ctiv
ity
Co
nce
ntr
atio
n (
Bq
dm
-3)
Time (days)
Cs-137 Tracer+CsNO3 Carrier NRVB
Model Cs-137 Tracer+CsNO3 Carrier NRVB
CS-137 Tracer NRVB
Model Cs-137 Tracer NRVB

119
than for the carrier experiments with between 1.8x10⁻¹⁰ – 2.8x10⁻¹⁰ m2 s-1 and
between 2.0x10⁻³ – 3.0x10⁻³ m3 kg-1, (lower pair of purple solid lines in fig. 11.22
suggesting higher variability).
11.5.3 GoldSim models for 90Cs tracer and tracer with carrier using CDP solution The GoldSim models for the 137Cs tracer and tracer with carrier using CDP solution
are presented as figs. 11.24 and 11.25.
Fig. 11.24 Experimental and modelled NRVB diffusion curves for 137Cs at tracer and tracer carrier (CsNO3) concentrations in CDP solution
0
10000
20000
30000
40000
50000
60000
0 100 200 300
137C
s A
ctiv
ity
Co
nce
ntr
atio
n (
Bq
dm
-3)
Time (days)
Cs-137 Tracer+CsNO3 Carrier CDP
Model Cs-137 Tracer+CsNO3 Carrier CDP
Cs-137 Tracer CDP
Model Cs-137 Tracer CDP

120
Fig. 11.25 Early experimental and modelled NRVB diffusion curves for 137Cs at tracer and tracer carrier (CsNO3) concentrations in CDP solution
Commentary
A change of colours has been used in figs. 11.24 and 11.25 above to enable easier
consideration of the early data plots. The best fit and model results for the
CDP carrier experiments were 1.1×10⁻¹⁰ m2 s-1 and 0.2x10⁻³ m3 kg-1, respectively
(purple hashed line in fig. 11.24). The LOF for the best model result was 4.5%. The
majority of the experimental data could be contained in the interval defined by setting
between 0.7×10⁻¹⁰ and 1.2×10⁻¹⁰ m2 s-1 and with between zero and 0.3x10⁻³ m3
kg-1, (solid purple lines in fig. 11.24). The results that fall outside the envelope can be
clearly seen on the figures. The early data plot (fig. 11.25) has been provided to
illustrate the difficulty of setting a suitable envelope. It should be noted that all
observed values are included in the LOF results even those outside the envelope.
0
10000
20000
30000
40000
50000
60000
0 5 10 15
137C
s A
ctiv
ity
Co
nce
ntr
atio
n (
Bq
dm
-3)
Time (days)
Cs-137 Tracer+CsNO3 Carrier CDP
Model Cs-137 Tracer+CsNO3 Carrier CDP
Cs-137 Tracer CDP
Model Cs-137 Tracer CDP

121
The CDP tracer experiments yielded higher best fit and model results than for
the carrier experiments at 2.8x10⁻¹⁰ m2 s-1 and 2.3x10⁻³ m3 kg-1, respectively
(turquoise hashed line in fig 11.24). The LOF for the best model result was 6.0%.
The intervals of and that encompass most of the experimental data were also
wider than for the CDP carrier experiments, suggesting higher variability with
between 2.6x10⁻¹⁰ – 3.6x10⁻¹⁰ m2 s-1 and =0.3x10⁻³ – 1.0x10⁻³ m3 kg-1, (solid
turquoise lines in fig. 11.24).
11.6 Cs Diffusion Autoradiography One of the duplicates from each diffusion experiment was removed from the
container and sectioned longitudinally using a diamond rotary masonry saw. The
pieces were placed flat face down on a Fuji BAS MP 20 cm x 25cm autoradiography
image plate in darkness and exposed for a period of 4 hours. The sections were then
removed, again in darkness and the plate taken to British Geological Survey,
Nottingham to be developed. The resulting image is shown, unenhanced as fig.
11.26 below. A version of the image that has been enhanced using the software
package ImageJ is shown as fig. 11.27.

122
Fig. 11.26 Unenhanced digital autoradiograph of the distribution of 137Cs in the NRVB cylinder used in the diffusion experiments
Key to fig. 11.26 (a) 137Cs tracer only in NRVB equilibrated water (b) 137Cs tracer only in CDP solution (c) 137Cs tracer and CsNO3 carrier in NRVB equilibrated water (d) 137Cs tracer and CsNO3 carrier in CDP solution

123
Fig. 11.27 ImageJ enhanced digital autoradiograph of the distribution of 137Cs in the NRVB cylinder used in the diffusion experiments
Key to fig. 11.27 (a) 137Cs tracer only in NRVB equilibrated water (b) 137Cs tracer only in CDP solution (c) 137Cs tracer and CsNO3 carrier in NRVB equilibrated water (d) 137Cs tracer and CsNO3 carrier in CDP solution
The autoradiography images (figs. 11.26 and 11.27) of the NRVB cylinders
corroborated with the experimental observation and diffusion profiles. The darker
areas of fig 11.26 indicate higher activity, these have been colourised to produce fig
11.27. The cylinders spiked only with tracer 137Cs concentrations (a and b) showed
higher retention of activity than those with CsNO3 carrier (c and d). Cylinders from
the experiments in the presence and absence of CDP were very similar when carrier
was present. At tracer concentrations the CDP reduced the retention of 137Cs in the
NRVB. The profiles within the blocks were very homogeneous, especially in the case
(a)
(b)
(a)
(b)
(c)
(d)

124
of the tracer experiment in absence of CDP. There were several other interesting
features noticeable on the autoradiographs including; high intensity spots around the
area where the central core is sealed and on the outer surfaces, the central core
appears brighter in three of the four images and non-verticality of the central cores is
evident.
11.7 Cs Diffusion Scanning Electron Microscopy In an attempt to determine the possible mineral phases involved in the retention of
Cs on the outer surface of the NRVB, the same sectioned cylinders were examined
with a Scanning Electron Microscope (SEM) at BGS Nottingham. The imaging (see
figs. 11.28 and 11.29 below) using environmental SEM conditions in combination
with energy-dispersive X-ray analysis (EDX) indicated that most of the outer surface
of the specimens was covered by amorphous forms of CSH. In some localised areas
close to the sealed top of the specimens, calcium carbonate could be found in
crystalline form as calcite and the presence of ettringite was noted. An accumulation
of amorphous magnesium silicates was also evident. The areas at the edge of the
specimens that showed high activity in the autoradiography images did not show an
accumulation of any specific mineral phase. The most intense spots are in the area
of the seal at the top of the NRVB cylinders and are most likely the result of trapping
radiotracer between the stopper and the wax. Some of the spots on the external
surfaces (but by no means all) were noted to be coincident with small voids or pores
partially blocked by Ca(OH)2 as well as Ca silicates which would have been water
filled at the end of the experiment. Subsequent evaporation of the water would have
left locally concentrated regions of radiotracer. This phenomenon needs further
investigation as it challenges the assumption that all of the radiotracer reaching the
NRVB surface is discharged into the receiving water. It could also be causing a delay
in breakthrough and may indicate that a different type of sorption (or even
incorporation) is occurring at the surface.

125
Fig. 11.28 Micrograph showing calcite (red) and possibly aragonite (yellow) in some localised areas and amorphous magnesium silicates (green), wax seal is
the flat sheet lower left
Fig. 11.29 Some of the “hot spots” at the edge of the solid corresponded to voids coated with Ca(OH)2 (portlandite)

126
11.8 137Cs Tracer Advection with NRVB Equilibrated Water
11.8.1 Additional information relevant to the 137Cs NRVB advection experiment Only one 137Cs advection experiment has been undertaken. The experimental
procedure including 3 day “run in” for the NRVB cylinder was identical to that used in
the HTO advection experiments (see section 10.6). The only exception being that the
initial injection volume was 150 µL. The injection contained 2911 Bq or 174660 d
min-1 of 137Cs. All the eluent was collected and analysed for 137Cs and the
evaporation of the eluted mass corrected for by comparison with a weighed water
blank left in the sample collector for the duration of the experiment. All 137Cs
determinations were performed by gamma counting in the same manner as the
diffusion experiments.
The experiment was not completely successful as it was not always possible to
maintain a steady driving pressure. In addition, clearing of blocked pipework caused
an interruption soon after commencement and again near the end. The results are
presented on fig. 11.30 and the interruptions are clearly visible as having caused
step changes in the flow rate. A 137Cs recovery plot is presented as fig.11.31 and the
complete dataset as table 11.12. It is important to note that the x axis is mass eluted
and not time.

127
Fig. 11.30 Results of the 137Cs tracer advection using NRVB equilibrated water
Fig. 11.31 Recovery plot of the 137Cs tracer advection using NRVB equilibrated water
0.0
0.2
0.4
0.6
0.8
1.0
1.2
1.4
1.6
1.8
2.0
0
10000
20000
30000
40000
50000
60000
70000
80000
90000
0 50 100 150 200
Flo
w R
ate
(g H
r-1 )
137C
s C
on
cen
trat
ion
(B
q d
m-3
)
Mass Eluted (g)
Cs-137 NRVB
Flow Rate
0
10
20
30
40
50
60
70
0 50 100 150
% R
eco
very
137
Cs
Mass Eluted (g)
Cs-137 NRVB Recovery

128
11.8.2 Results of the 137Cs NRVB advection experiment The plots resulting from the 137Cs advection experiment appeared to be smooth
despite the practical difficulties encountered. The breakthrough of 137Cs occurred
after 24 g of eluent had passed through the NRVB cylinder, approximately one pore
volume and slower than the comparable HTO experiment. The peak top was sharp
achieving a maximum activity concentration of 78217 at 42 g eluted. The peak was
also asymmetric with significant tailing (this tailing is usually attributed to constricted
porosity causing trapping of a proportion of the Cs 35). The recovery plot indicates
that only ~60% of the 137Cs activity added to the system was recovered.
Autoradiographs of the cylinder were not produced because it went on to be used for
the initial trial runs of HTO and 90Sr. Consequently it was not possible to determine
where the residual 137Cs may have accumulated in the system. The possibilities are
those seen in the diffusion experiments which included, distribution throughout the
NRVB, deposition as hotspots on the outer edge of the cylinder or unmoved within
the central core. Additional possibilities for the advection experiment include losses
within the advection cell, pipework and seals, though monitoring washing and
cleaning after completing the trial runs did not reveal any measureable amounts of 137Cs.
11.9 Discussion of the Suite of 137Cs Diffusion and Advection Results The radial diffusion technique has been successfully used to investigate the
migration of Cs through cylinders of the potential backfill NRVB. Experiments were
performed using NRVB equilibrated water and a solution of cellulose degradation
products (CDP) produced in the presence of the NRVB components.
The diffusion experimental results, notwithstanding the limitations of the GoldSim
model mentioned in section 7.5, showed a decrease in the and in the
presence and the absence of CDP for the carrier experiments when compared with
the results at tracer concentrations. This may be attributable to restriction of ion
mobility by the electrostatic field created by other ions present in solution. It is known
that for an ionic species can be dependent on the molar conductance of the ion
(Λi), which is empirically associated to the concentration by a relationship of the type:
Λc = Λ0-kcn, where c is the concentration of the ionic species (see section 5).60 It is
possible to express the dependence of the diffusivity with the concentration of the

129
diffusing ion by a similar equation; Dc = D0-kccn, where kc is a constant that includes
the pore characteristics of the matrix and for monovalent species n is usually 0.5.62
In the present work a decrease of diffusivity with increasing concentration of Cs is
observed. However, it would be necessary to carry out further investigations to
confirm the relationship between diffusivity and the square root of the concentration.
In the longer term it may be possible to combine Fick’s second equation with
previous empirical observations 61 to produce a better description and predictor of
the movement of 137Cs in these experiments. The main issues are the complexity of
the ionic and dissolved organic solutions and the consequent difficulty assigning
values for molar conductance or diffusivity. A further issue to consider is the initial
addition of Cs for the carrier experiments which is at a relatively high concentration
(~32,000 mg dm-3, 0.25 mol dm-3) that reduces as the experiment proceeds. This
reduction in concentration should result in the electrostatic interaction having a
decreasing effect on diffusivity throughout the experiment.
The reduction of the values observed for the carrier experiments could be
attributed to partial saturation of the solid and reduction of the sites available for
retention of Cs. However, the background concentrations of Cs (see table 9.1) in the
experiments, particularly in the CDP solutions is appreciable (10-5 ~10-4 mol dm-3)
and competing Na+ and K+ ions may provide a more reasonable explanation.
CDP reduced the retention of Cs onto NRVB under diffusive conditions. However, no
effect had been reported in batch studies dealing with sorption of Cs onto ordinary
portland cement (OPC) in contact with ISA 90 (at constant NaOH and KOH
concentrations) or onto NRVB in the presence of CDP.57 The diffusion of Cs through
OPC in contact with a synthetic young pore water has been compared with and
without ISA (5x10⁻³ mol dm-3), reporting no effect of the organic ligand on the
diffusion rate of Cs. When comparing the composition of the NRVB and CDP
solutions used in the present work (see table 9.1), it can be seen that the
concentrations of Na+, K+ and Ca2+ in the CDP liqueur were between 2 and 3 times
higher than in the NRVB equilibrated water. A further study 161 reported reduction of
sorption to hydrated cement as a consequence of the increased concentration of
concomitant ions Na+ and K+.
Consequently it remains possible that the differences observed in the present work
are at least partially attributable to the concentration variation of the alkali metal ions
and not solely due to the presence of CDP.

130
In the case of CDP solutions produced with the same methodology and comparable
ionic strengths, the difference observed between previous batch studies 57 and the
present experiments could be due to the increased surface area available for
sorption as a result of the crushing of the material. The crushed material would
necessarily offer more available sorption sites than intact cements potentially
overcoming the increased concentration of the competing Na+ and K+.
It is difficult to draw any conclusions from the mixed element experiments except that
the presence of other species in the original slurry in the central core appeared to
increase the relative retention of Cs when compared to the carrier experiments. The
low frequency of sampling during the first week of the experiments negated a
meaningful comparison of breakthrough times and early concentration increase.
For the advection experiment it is tempting to link the results with the 137Cs tracer
only diffusion experiment in NRVB equilibrated water where retention of the
radioisotope on the NRVB cylinder was comparable at ~60% of the total added.
However at this early stage in the development of the radial advection technique and
without autoradiographs or model results, it would be unwise to conclude that the
results to have been generated by the same mechanisms.

131
12.0 Iodine
12.1 Background The main iodine isotope of interest is 129I, it is a component of the UK radioactive
waste inventory and is mentioned in the latest estimate at 01/04/2010 26 and table
12.1 below reproduces the relevant activities.
Isotope HLW ILW LLW units 129I 9.0x10⁻² 5.9x10⁻¹ 3.4x10⁻⁴ T Bq
Table 12.1 I29I in the UK waste inventory at 01/04/2010
The activities in the table above may not seem particularly high but 129I has a half live
of 1.57x10⁷ years 141 and this coupled with high mobility in the environment means
that it will be a significant contributor to the long term inventory of a GDF. 129I decays
by beta emission and the decay equation is:
→ ̅
Radioactive isotopes of iodine are produced by nuclear fission. 235U in nuclear
reactors fissions asymmetrically into two large fragments; 131I can be produced in
this manner with a yield close of 3% making it a significant product and problematic
should releases occur. However, its short half-life of 8 days ensures that even very
significant releases will decay in less than 3 months. 129I is produced in the same
manner with a yield of 0.67% and represents a more serious long term hazard. In
terms of human health impact it should be noted that all iodine isotopes migrate
preferentially to the thyroid gland and small exposures to radioactive iodine isotopes
can have detrimental health effects158 162
The readily available isotope, 125I has a 59.9 day half-life and will be used in this
research. 125I decays by electron capture to an excited state of 125Te that
immediately undergoes gamma emission with a maximum energy of 35 keV. This is
the emission used to quantify 125I in this research. The excess energy of the excited 125Te is internally converted to eject electrons (also at 35 keV), produce Auger
electrons and X-rays. Eventually, stable non-radioactive ground-state 125Te is
produced as the final decay product. The specific activity of 125I is 6.45x10¹⁴ Bq g-1.

132
The decay equation is:
→
The natural abundance of 125I is effectively zero. It is created by electron capture
decay of 125Xe, a synthetic isotope of Xe that can be created by neutron activation of 124Xe, it has a naturally occurring abundance of approximately 0.1%. The irradiation
target is natural xenon gas containing 124Xe which is loaded into capsules of zircaloy-
2 (a nonreactive alloy, transparent to neutrons) to a pressure of about 100 bar prior
to neutron activation. The relevant equations for the manufacture of 125I are given
below.163 164
→
→
The diffusion and advection experiments undertaken were as follows:
Diffusion with NRVB equilibrated water using 125I tracer only and 125I tracer
plus KI carrier
Diffusion with CDP solution with 125I tracer plus KI carrier
Mixed isotope diffusion experiments (NRVB equilibrated water and CDP
solution) where I diffusion is evaluated in the presence of Cs, Ni, Eu, U and
Th.
Advection with CDP solution and 125I tracer only
Autoradiographs have been produced where possible and GoldSim transport models
have been generated for the diffusion experiments with the exception of the multi-
element diffusions. Reference is also made to a series of solubility experiments
(under and over-saturation) underway in the Loughborough Radiochemistry
laboratory as part of the NDA chemical containment research.134
12.2 Additional Experimental Details for 125I Diffusion Experiments
The diffusion experiment used a 50 µl addition of 125I (produced as the iodide by
Perkin Elmer) to the central cores of duplicate NRVB cylinders, equivalent to:

133
Cmax of 677 d min-1 (2538 Bq per cylinder and an initial concentration in the
inner core = 2.1x10⁻¹¹ mol dm-3) at 133 days after commencement for NRVB
equilibrated water with 125I tracer and KI carrier.
Cmax of 1261 d min-1 (4727 Bq per cylinder and an initial concentration in the
inner core = 3.9x10⁻¹¹ mol dm-3) at 67 days after commencement for CDP
solution with 125I tracer and KI carrier.
Cmax of 1381 d min-1 (5179 Bq per cylinder and an initial concentration in the
inner core = 4.3x10⁻¹¹ mol dm-3) at 50 days after commencement for the
NRVB equilibrated water with 125I tracer only.
Cmax is the maximum number of disintegrations per minute possible in the 1 cm3
sample if the 125I was to equilibrate completely into the liquid in the system. The
measured activities are quoted at the time (in days) after commencement. The
results, figures and tables also utilise a calculation to account for the effect on Cmax
caused by the removal of volume and activity during sampling. A disproportionately
small amount of activity is removed during sampling compared to the total volume.
The overall effect is to increase Cmax each time a sample is taken. Cmax is used to
prepare the relative retention plots to enable visualisation of a range of diffusion
experiments on the same axes.
The solubility research134 did not identify any potential effects on I solubility due to
high pH, presence of NRVB, presence of CDP or reducing agents. Consequently fast
breakthrough, equilibration or at least movement to a stable condition and limited
retention of 125I were anticipated.
The mass of I as KI added to each of the carrier experiments was 32.8 mg for the
NRVB equilibrated water and 31.8 mg for the CDP solution. This mass was
calculated such that in the case of complete equilibration with the liquid in the
system, the final concentration of I would be ~10-3 mol dm-3. The initial concentration
of the carrier in the inner cores was 0.15 mol dm-3 The mass of 125I added was
considered to be negligible.
The NRVB cylinders used for the experiments were equilibrated in the CDP solution
in sealed containers, in a nitrogen glovebox for 43 days prior to commencement. The
radioisotope addition was made outside the nitrogen glove box, the cylinder was
sealed, submerged in 200 cm3 NRVB equilibrated water and returned to the glove
box over a period of less than two minutes. The total volume of equilibrated water in

134
the system at the start is assumed to be 225 cm3 (the additional 25 cm3 being an
estimate of the pore water volume in the NRVB cylinder). 125I activity concentrations
were determined by counting the peak centred at 0.035 MeV on a Packard Cobra II
auto-gamma counter. 1 cm3 samples were taken throughout the experimental
duration but all determined on one day when the experiment was completed to
negate the need to correct for radioactive decay. In addition 1 cm3 “control” samples
were made at the start of the experiment to enable relative retention graphs to be
made. The control samples and appropriate blanks were also determined on the
same day as the samples from the experiments. All determinations were subject to
the 2 σ criterion available on the gamma counter to ensure results are statistically
valid.
12.3 Results of 125I diffusion experiments
All results are presented as the average of duplicates along with vertical error bars
denoting the 90% confidence limits assuming a two tailed t distribution and horizontal
error bars set at +/- 0.25 days. Three graphs are presented for each experiment;
showing all results, early data and C/Cmax relative retention. The data are presented
in two tables for each experiment. A short commentary is provided after each set of
graphs and before the tables.

135
12.3.1 Results of the 125I tracer KI carrier NRVB diffusion experiment with NRVB equilibrated water
The results of the 125I tracer with KI carrier NRVB equilibrated water diffusion
experiment are presented below as figs. 12.1 to 12.3 and as tables 12.2 and 12.3 in
appendix 1.
Fig. 12.1 Results of the NRVB 125I tracer; KI carrier diffusion experiment using NRVB equilibrated water
0
1000
2000
3000
4000
5000
6000
7000
8000
0 25 50 75 100 125 150
125I A
ctiv
ity
Co
nce
ntr
atio
n (
Bq
dm
-3)
Time (days)
I-125 Tracer+KI Carrier NRVB (average)

136
Fig. 12.2 Early data from the NRVB 125I tracer; KI carrier diffusion experiment using NRVB equilibrated water
Fig. 12.3 C/Cmax relative retention plot of the NRVB 125I tracer; KI carrier diffusion experiment using NRVB equilibrated water
0
1000
2000
3000
4000
5000
6000
7000
8000
0 5 10 15 20 25
125I A
ctiv
ity
Co
nce
ntr
atio
n (
Bq
dm
-3)
Time (days)
I-125 Tracer+KI Carrier NRVB (average)
0.00
0.10
0.20
0.30
0.40
0.50
0.60
0.70
0 25 50 75 100 125 150125I R
elat
ive
Ret
enti
on
(C
/Cm
ax)
Time (days)
I-125 Tracer+KI Carrier NRVB (average)

137
Commentary
The experiment was allowed to run for 133 days but it was clear by this time that the
samples with lower activities were becoming difficult to determine due to radioactive
decay of the 125I. Breakthrough commenced at 3.0 days followed by an almost linear
increase in concentration over the following 18 days. The concentration continued to
increase at a slower rate stabilising at 6000 Bq dm-3 at 31 days. The maximum
activity concentration of 6267 Bq dm-3 was achieved at 102 days. The relative
retention plot (where Cmax = 677 d min-1) indicates that just over 50% of the tracer
(and carrier) was retained on the NRVB cylinder, inferring that just under 50% of the
tracer (and carrier) was in solution.
12.3.2 Results of the 125I tracer with KI carrier CDP diffusion experiment
The results of the 125I tracer with KI carrier using CDP solution, diffusion experiment
are presented below as figs. 12.4 to 12.6 and as tables 12.4 and 12.5 in appendix 1.
Fig. 12.4 Results of the NRVB 125I tracer; KI carrier diffusion experiment using CDP solution
0
2000
4000
6000
8000
10000
12000
14000
16000
18000
0 25 50 75
125I A
ctiv
ity
Co
nce
ntr
atio
n (
Bq
dm
-3)
Time (days)
I-125 Tracer+KI Carrier CDP (average)

138
Fig. 12.5 Early data from the NRVB 125I tracer; KI carrier diffusion experiment using CDP solution
Fig. 12.6 C/Cmax relative retention plot of the NRVB 125I tracer; KI carrier diffusion experiment using CDP solution
0
2000
4000
6000
8000
10000
12000
14000
16000
18000
0 5 10 15 20 25
125I A
ctiv
ity
Co
nce
ntr
atio
n (
Bq
dm
-3)
Time (days)
I-125 Tracer+KI Carrier CDP (average)
0.00
0.10
0.20
0.30
0.40
0.50
0.60
0.70
0.80
0 25 50 75
125I R
elat
ive
Ret
enti
on
(C
/Cm
ax)
Time (days)
I-125 Tracer+KI Carrier CDP (average)

139
Commentary
The experiment was allowed to run for 67 days to ensure the low activity
determinations could be relied upon. It was clear that the activity concentration in
solution had stabilised. Breakthrough commenced between 1 and 2 days followed by
an almost linear increase in concentration over the following 3 days. The
concentration continued to increase at a slower rate stabilising at 15000 Bq dm-3 at
22 days. The maximum activity concentration of 15308 Bq dm-3 was achieved at 21
days. The relative retention plot (where Cmax = 1261 d min-1) indicates that 30-35%
of the tracer was retained on the NRVB cylinder, implying that 65-70% of the tracer
(and carrier) was in solution.
There are clear differences in the diffusion profiles arising from the two experiments
and it apparent that I is more mobile in the presence of CDP, exhibiting both faster
diffusion and lower retention on the solid.
12.4 Iodine in Mixed Element Diffusion Experiments
12.4.1 Additional information relevant to the mixed element diffusion experiments The mixed element diffusion experiments were set up to investigate the effect on the
diffusion rates of Cs, I, U, Th, Eu and Ni when all were present. The experiments,
eleven of each type (NRVB equilibrated water and CDP solution) were the first to be
undertaken using the radial approach. Sufficient CsNO3 and KI were added to
produce a 10-3 mol dm-3 solution in the event of complete equilibration. In addition
precipitates from a neutralised solution containing UO2(NO3)2.6H2O, Th(NO3)4.4H2O,
EuCl3.6H2O and NiCl2.6H2O were mixed with the Cs and I solutions to produce a
slurry which was added to the central cores of the NRVB cylinders. The NRVB
cylinders used for the CDP experiments were equilibrated in a CDP solution for 30
days prior to commencement. The iodine determinations were performed by ion
chromatography using a Dionex DX 150 with AS4 anion exchange column and
carbonate/bicarbonate eluent.
12.4.2 Iodine Results for the mixed element diffusion experiments in NRVB equilibrated water and CDP solution The average of eleven results for both types of experiment is presented below as fig.
12.7. A graph comparing the breakthrough, concentration increase and relative
retention of the NRVB and CDP single element active experiments is also presented

140
as fig. 12.8 on the same page. A brief commentary on figs. 12.7 and 12.8 is also
provided. The data for the mixed element experiments are provided as tables 12.6
and 12.7 in appendix 1.
Fig 12.7 Averaged I Results for the mixed element diffusion experiments in NRVB equilibrated water and CDP solution
Fig. 12.8 C/Cmax relative retention plots for the NRVB and CDP diffusions
0.00E+00
5.00E-05
1.00E-04
1.50E-04
2.00E-04
2.50E-04
3.00E-04
3.50E-04
0 100 200 300 400
I co
nce
ntr
atio
n (
mo
l dm
-3)
Time (days)
NRVB (average)
CDP (average)
0.00
0.10
0.20
0.30
0.40
0.50
0.60
0.70
0.80
0 25 50 75 100 125 150
125I R
elat
ive
Ret
enti
on
(C
/Cm
ax)
Time (days)
I-125 Tracer+KI Carrier CDP (average)
I-125 Tracer+KI Carrier NRVB (average)

141
Commentary
The main points of interest arising from the iodine diffusion results in the mixed
element experiments are:
The overall behaviour was similar to the single element experiments; the
presence of CDP caused faster breakthrough and stabilisation and reduced
retention.
Retention of I was higher in the mixed element experiments than the single
element experiments. Cmax was 10-3 mol dm-3 and retention was ~30% and
~20% in the absence and presence of CDP, respectively.
The mixed element data are not as consistent as those generated by the
single element versions of the experiments and whilst averaging has helped
the visualisation, the raw data shows a large amount of variation across the
eleven replicates (see figs. 12.9 to 12.12 for raw data plots). This variation
commences early in the experiments, the extent of variation is less
pronounced in the CDP experiments.
These experiments were very early attempts at the technique and
modifications have been on-going, in particular handling time outside the
glove box and dosing of the central cores have been speeded up and subject
to more control.

142
Fig. 12.9 I Raw data (un-averaged) for the mixed element diffusion experiments in NRVB equilibrated water 134
Fig. 12.10 I Early raw data (un-averaged) for the mixed element diffusion experiments in NRVB equilibrated water 134
0.00E+00
5.00E-05
1.00E-04
1.50E-04
2.00E-04
2.50E-04
3.00E-04
3.50E-04
4.00E-04
0 100 200 300 400
I co
nce
ntr
atio
n (
mo
l dm
-3)
Time (days)
1Y-1
1Y-2
2Y-1
2Y-2
3Y-1
3Y-2
4Y-1
4Y-2
4Y-3
Spare 1
Spare 2
0.00E+00
5.00E-05
1.00E-04
1.50E-04
2.00E-04
2.50E-04
3.00E-04
3.50E-04
4.00E-04
0 10 20 30
I co
nce
ntr
atio
n (
mo
l dm
-3)
Time (days)
1Y-1
1Y-2
2Y-1
2Y-2
3Y-1
3Y-2
4Y-1
4Y-2
4Y-3
Spare 1
Spare 2

143
Fig. 12.11 I Raw Data (un-averaged) for the mixed element diffusion experiments in CDP solution 134
Fig. 12.12 I Early raw data (un-averaged) for the mixed element diffusion experiments in CDP solution 134
0.00E+00
5.00E-05
1.00E-04
1.50E-04
2.00E-04
2.50E-04
3.00E-04
3.50E-04
4.00E-04
4.50E-04
0 100 200 300 400
I co
nce
ntr
atio
n (
mo
l dm
-3)
Time (days)
1Y-1
1Y-2
2Y-1
2Y-2
3Y-1
3Y-2
4Y-1
4Y-2
4Y-3
Spare 1
Spare 2
0.00E+00
5.00E-05
1.00E-04
1.50E-04
2.00E-04
2.50E-04
3.00E-04
3.50E-04
4.00E-04
4.50E-04
0 10 20 30
I co
nce
ntr
atio
n (
mo
l dm
-3)
Time (days)
1Y-1
1Y-2
2Y-1
2Y-2
3Y-1
3Y-2
4Y-1
4Y-2
4Y-3
Spare 1
Spare 2

144
12.5 125I Tracer Only NRVB Diffusion Experiment
12.5.1 Results of 125I tracer only diffusion experiment
The results of the 125I tracer only NRVB equilibrated water diffusion experiment are
presented below as figs. 12.13 and 12.14 and as tables 12.8 and 12.9 in appendix 1.
Fig. 12.13 Results from the NRVB 125I tracer only diffusion experiment using NRVB equilibrated water
0
200
400
600
800
1000
1200
1400
1600
1800
0 25 50125I A
ctiv
ity
Co
nce
ntr
atio
n (
Bq
dm
-3)
Time (days)
I-125 Tracer NRVB (average)

145
Fig. 12.14 C/Cmax relative retention plot of the NRVB 125I tracer experiment using NRVB equilibrated water
Commentary
The experiment was allowed to run for 50 days to ensure the low activity
determinations could be relied upon. It was clear that the activity concentration in
solution had not stabilised and that the concentration increase was proceeding very
slowly in relation to the half-life of 125I. Breakthrough commenced at around 15 days
(in contrast to the 1-3 days in the carrier experiments), followed by an almost linear
increase in concentration over the following 35 days. The relative retention plot
(where Cmax = 1381 d min-1) indicated that 95% of the tracer was retained on the
NRVB cylinder after 50 days. The mass of 125I added was only ~8 pg and this
coupled to the ability of NRVB to retain iodide as seen in the carrier experiments
explain the observations. The tracer only experiment using CDP solution was not
undertaken due to the same concerns arising about the ability to achieve results in a
workable timeframe.
0.00
0.01
0.02
0.03
0.04
0.05
0.06
0.07
0 25 50
125I A
ctiv
ity
(C/C
max
)
Time (days)
I-125 Tracer NRVB (average)

146
12.6 GoldSim Modelling
12.6.1 Additional information relevant to the 125I NRVB diffusion modelling Details of the GoldSim model are fully discussed in section 7. The results from the
modelling of the single element 125I with KI carrier, diffusion experiments are
presented as fig. 12.15 and 12.16. Initial concentrations are provided in section
12.2. It is important to be aware that activity concentrations were modelled and as a
consequence a direct comparison cannot be made in the same manner as possible
with the relative retention plots. Partition is referred to as throughout, primarily
because this term, rather than is used in GoldSim. The LOF calculations are built
into the model enabling it to determine the combination of and parameters that
minimise LOF. Short commentaries explaining the data envelopes, effective
diffusivity, partition coefficient and LOF outputs are also provided.
Fig. 12.15 Experimental and modelled diffusion curves for 125I at tracer and tracer carrier (KI) concentrations in NRVB equilibrated water and CDP solution
0
2000
4000
6000
8000
10000
12000
14000
16000
18000
0 50 100 150
125I A
ctiv
ity
Co
nce
ntr
atio
n (
Bq
dm
-3)
Time (days)
I-125 Tracer+KI Carrier NRVB
Model I-125 Tracer+KI Carrier NRVB
I-125 Tracer+KI Carrier CDP
Model I-125 Tracer+KI Carrier CDP

147
Fig. 12.16 Early experimental and modelled curves for 125I at tracer and tracer carrier (KI) concentrations in NRVB equilibrated water and CDP solution
Commentary
A change of colours has been used in figs. 12.15 and 12.16 for clarity. It is important
to note that figs. 12.15 and 12.16 are not relative retention plots and cannot be used
to make comparisons between the NRVB and CDP experiments because of the
different initial tracer concentrations and experimental durations (the relative
retention plot is fig 12.8 earlier in this section).
The best fit and model results for the NRVB carrier experiments were 2.5x10⁻¹⁰
m2 s-1 and 3.4x10⁻³ m3 kg-1, respectively (hashed red line in figs. 12.15 and 12.16).
The LOF for the best model result was 3.6%. The majority of the experimental data
could be contained in the interval defined by setting in a range between 1.8x10⁻¹⁰
and 3.3x10⁻¹⁰ m2 s-1 and between 3.2x10⁻³ and 3.6x10⁻³ m3 kg-1, (solid turquoise
lines on the figures). The results that fall outside the envelope can be clearly seen.
The early data plot (fig. 12.16) has been provided to illustrate the fit is good even at
0
2000
4000
6000
8000
10000
12000
14000
16000
18000
0 5 10 15 20 25
125I A
ctiv
ity
Co
nce
ntr
atio
n (
Bq
dm
-3)
Time (days)
I-125 Tracer+KI Carrier NRVBModel I-125 Tracer+KI Carrier NRVBI-125 Tracer+KI Carrier CDPModel I-125 Tracer+KI Carrier CDP

148
low concentrations. It should be noted that all observed values are included in the
LOF results even those outside the envelope.
The carrier experiments using CDP solution yielded best fit and model results
of 3.8x10⁻¹⁰ m2 s-1 and 1.7x10⁻³ m3 kg-1, respectively (red dotted line on the figures).
The LOF for the best model result was 4.5%. The majority of the experimental data
could be contained in the interval defined by setting between 2.3x10⁻¹⁰- 4.0x10⁻¹⁰
m2 s-1 and between1.6x10-3-1.9x10⁻³ m3 kg-1, (solid dark blue lines on the figures).
The effective diffusivity values for the NRVB and CDP experiments are close but the
value is significantly lower in the presence of CDP.
12.7 Iodine Diffusion Autoradiography
The autoradiography produced two usable images from the iodine diffusion
experiments. These experiments were the first to be completed and attempts to
manually hack-saw the blocks failed, resulting in broken and uneven pieces
unsuitable for good images. A diamond rotary saw was purchased but the elapsed
time, low energy of the 125I emissions and its short half-life required long exposures
to be made as soon as possible after the experiments were concluded. As a
consequence of these issues further attempts to produce good images were
abandoned. Fig 12.17 shows the two ImageJ enhanced images from the NRVB
carrier experiment.
The images were produced using a Fuji BAS MP 20 cm x 25cm autoradiography
image plate with an exposure duration of 5 days. The plate was developed at BGS,
Nottingham.

149
Fig. 12.17 ImageJ enhanced digital autoradiograph of the distribution of 125I in the NRVB cylinder used in the carrier diffusion experiments
When compared with the images obtained for 137Cs (see section 11.6), clear
differences are observed in the behaviour of the two isotopes. In the case of 137Cs,
distribution of the isotope is homogeneous within the solid, for 125I a gradient from
the centre of the NRVB cylinder can be observed, with higher activity in the central
area of the block. Preferential paths generated by micro-fissures in the cement are
not observed.
12.8 125I Tracer Advection with CDP Solution
12.8.1 Additional information relevant to the 125I CDP advection experiment Only one 125I advection experiment has been undertaken. The experimental
procedure including 3 day “run in” for the NRVB cylinder was identical to that used in
the HTO advection experiments (see section 10.6). The control samples indicated
that the150 µL injection contained 1807 Bq or 108417 d min-1 of 125I at the start of
the 8 day experiment and1638 Bq or 98267 d min-1 at the conclusion. The latter
value was used to determine recovery of the radionuclide as all samples (including
relevant controls) were determined at the end of the experiment. All the eluent was
collected and analysed for 125I and the evaporation of the eluted mass corrected for
by comparison with a weighed water blank left in the sample collector for the
duration of the experiment. All determinations were performed by gamma counting in
the same manner as the diffusion experiments.
Initially the experiment appeared to progress smoothly with no significant
interruptions. It had been anticipated that the presence of CDP would cause relative
retention to be low, even at tracer concentration and that rapid elution would occur.

150
However, it soon became evident that the radioisotope was being eluted from the
NRVB cylinder much more slowly than expected. Consequently, the experiment was
stopped at 8 days to try to get a good quality autoradiograph and ascertain the fate
of the 125I in the NRVB cylinder. The results up to 8 days are presented as fig. 12.18;
the 125I recovery plot as fig.12.19 and the complete dataset as table 12.10. A short
commentary is provided after the figures. It is important to note that the x axis is
mass eluted and not time.
Fig. 12.18 Results of the 125I tracer only advection using CDP solution
0.00
0.10
0.20
0.30
0.40
0.50
0.60
0.70
0
1000
2000
3000
4000
5000
6000
7000
8000
9000
0 20 40 60 80 100 120
Flo
w R
ate
(g h
r-1 )
125 I
Act
ivty
Co
nce
ntr
atio
n (
Bq
dm
-3)
Mass Eluted (g)
I-125 CDP
Flow Rate

151
Fig. 12.19 Recovery plot of the 125I tracer only advection using CDP solution
Commentary
The plots resulting from the 125I advection experiment appeared to be smooth and a
steady flow rate of ~0.6 g hr-1 was maintained throughout. The breakthrough of 125I
occurred after 40 g of eluent had passed through the NRVB cylinder, almost two
pore volumes and somewhat slower than the comparable HTO and Cs experiments.
The recovery plot indicates that less than 10% of the 125I activity had been recovered
after 125 g or five pore volumes had eluted. It was clear that the experiment could
take a significant time to complete as almost 90% of the radionuclide remained on
the NRVB after 8 days. The issues of short half-life and weak emissions created a
choice between running to completion or using the opportunity to stop the
experiment and produce an autoradiograph. The latter option was selected. The
resulting autoradiograph is discussed in section 12.9 after table 12.10.
0
1
2
3
4
5
6
7
8
9
0 20 40 60 80 100 120
125I R
eco
very
(%
)
Mass Eluted (g)
I-125 CDP

152
12.9 Autoradiograph from the 125I CDP Solution Advection Experiment The 125I CDP advection NRVB cylinder was removed from the cell, dried and
sectioned longitudinally and transversely using a diamond rotary masonry saw. The
pieces were placed face down on a Fuji BAS MP 20 cm x 25cm autoradiography
image plate in darkness and exposed for a period of 6 hours. The sections were then
removed, again in darkness and the plate taken to British Geological Survey,
Nottingham to be developed. The resulting ImageJ enhanced image is shown
adjacent to a photograph of the same cylinder, as fig. 12.20 below. Alternative
transverse images were produced but the one reproduced below was the best
quality.
Fig. 12.20 Photograph and autoradiograph of 125I advection using CDP solution
There are a number of points of interest arising from the images in fig. 12.20:
The cylinder contains numerous black inclusions clearly visible on the
photograph. The inclusions are ashy particles present in the OPC that sink to
the bottom of the wet NRVB mix and accumulate in the final cylinders to be
poured.
The cylinder shows evidence of accumulations of radioactivity associated with
the inclusions (see overlay fig. 12.21 below). This could be due simply to a
change in surface area associated with the black inclusions or an increase in
pozzolanic properties of the type seen when PFA is added to cements.41 99
The 125I is confined to the lower part of the cylinder suggesting that the
radionuclide injection was not evenly distributed in the central core.

153
There is evidence of 125I on the outer edge of the upper section of the cylinder
even though no activity moved in that direction. This raises the possibility that
it was deposited there after elution through the cylinder.
Fig. 12.21 Overlay of the photograph and autoradiographs from fig. 12.20
12.10 Discussion of the Suite of 125I Diffusion and Advection Results The radial diffusion technique has been successfully used to investigate the
migration of I through cylinders of the cementitious backfill NRVB. Experiments were
performed using NRVB equilibrated water and a solution of cellulose degradation
products (CDP) produced in the presence of the NRVB components.
The diffusion experiments using 125I with KI carrier showed a clear reduction in
retention from 50% to 30% in the presence of CDP. In the mixed element
experiments retention was ~30% and ~20% in the absence and presence of CDP,
respectively.
Previous studies 165 have indicated that the uptake of I- onto degraded and
undegraded cement pastes is highly correlated with the concentration of Ca in
solution and the consequent development of positive charges on the surface of the
cement. This mechanism would enable the uptake of I- onto the cement by
electrostatic, non-specific interactions. At the pH of the cement solution (12.8-12.9
see table 9.1), the organic components of CDP are expected to be negatively
charged ions. Under similar conditions the sorption of ISA (the main component of
the CDP) onto cement has been reported 29 and more recently 165 where a decrease
of the values for the anionic species SeO32- in presence of ISA was observed. It
was suggested that the cause of the reduction of SeO32- retention was the increase
of repulsive electrostatic effects on the surface of the cement generated either by

154
sorption to the solid of the negatively charged H4ISA- or/and the removal of Ca2+
from the solid surface by formation of CaH3ISA and CaH4ISA+ complexes. The same
hypotheses could be also applied to the partition of I- in presence of CDP seen in the
present work.
The differences seen between the single element radioactive and the mixed element
experiments could be due to a number of factors. Two of likely issues which were
mentioned in section 11 when Cs behaviour in the experiments was discussed, are
repeated below:
The experiments were very early attempts at the technique and modifications
have been on-going, in particular handling time outside the glove box and
dosing of the central cores have been speeded up and subject to more
control.
The slurry placed in the central core has not been fully characterised but it is a
complex mixture of salts that could be affecting precipitation, solubility and
subsequent migration.
The comparatively slow evolution of the results for the 125I tracer only experiment
reflect the very small mass of 125I added (~8 pg) in relation to the capacity of NRVB
to retain I, as demonstrated by the carrier experiments.
Autoradiography imaging was used to determine the fate of the radionuclides in the
NRVB. The concentration of 125I in the solution in contact with the blocks was
constant after a period of 30 days but the profile of 125I in the block clearly showed
accumulation of the radioisotope in the first 8 mm from the central well. This
contrasted with the 137Cs experiments where the distribution of the radionuclide was
homogeneous. It is worth remembering that Cs and I will be singly charged cation
and anion respectively under the experimental conditions and as a consequence
unlikely to behave identically.
The GoldSim model simulated a good fit to the observed diffusion profiles and
allowed determination of the diffusivity ( ) and partition coefficient ( ) values. The
partition coefficients obtained for I- were comparable with literature values 3 at 1.7 to
3.4x10⁻³ m3 kg-1. The diffusivity values for I- ranged between 0.50 - 0.65x10⁻⁹ m2 s-1,
significantly higher than those reported for high porosity cements. It is obvious from
the results that many experimental factors may affect the values, including

155
concentration of the diffusing species, ionic strength, and porosity of the media and
also experimental setup (in-diffusion, leaching or through-diffusion) and caution must
be taken when applying these values to make predictions.
Finally, the CDP advection experiment may have provided an insight into the location
of I retention in the NRVB. There is a clear although maybe not wholly convincing
association between the black inclusions seen in the NRVB and the accumulated
presence of 125I activity. The nature of the black inclusions is presently not known but
they were assumed to be dense ashy particles accumulated at the bottom of the
NRVB liquid mix. However, the photograph in fig. 12.20 shows the particles to be
evenly distributed and not accumulated near the base.

156
13.0 Strontium
13.1 Background
The main strontium isotope of interest is 90Sr, it is a component of the UK radioactive
waste inventory and is mentioned in the latest estimate at 01/04/2010 26 and table
13.1 below reproduces the relevant activities (note – it is common to report 90Sr
activity in conjunction with its short lived daughter 90Y).
Isotope HLW ILW LLW units 90Sr/90Y 3.2x10⁷ 6.2x10⁵ 3.5 T Bq
Table 13.1 90Sr in the UK waste inventory at 01/04/2010 The activities in the table above are clearly significant but 90Sr has a relatively short
half-life of 29.1 years and this means that the inventory will have effectively decayed
completely within 1000 years. 147 However, if a failure of the GDF engineering
occurred within the operational phase or soon after closure, the migration of 90Sr
would be important and potentially diagnostic of the failure mechanism.
90Sr is a potential hazard to humans as it can replace calcium in the solid tissues of
the body preventing effective excretion. After entering the body, most often by
ingestion of contaminated food or water, 20 – 30% of the dose may be absorbed and
deposited in bones, bone marrow, teeth etc. Its presence in bones can cause bone
cancer, cancer of nearby tissues, and leukaemia.166
90Sr has a half-life of 29.1 years and decays by beta emission to 90Y which in turn
decays by beta emission to 90Zr with a half-life of 64 days. The energy of the 90Sr
emission is 0.54 MeV whilst the energy of the 90Y emission is much higher at 2.28
MeV. The 90Y emission is the one usually measured when determining 90Sr. The
specific activities of 90Sr and 90Y are 5.21x10¹² and 1.99x10¹⁶ Bq g-1 respectively.
→
→ Sixteen major radioactive isotopes of Sr exist, but only 90Sr has a half-life sufficiently
long to cause concern at nuclear facilities including GDFs. Similar to 137Cs, 90Sr can
be produced when an atom of 235U splits asymmetrically into two large fragments

157
with mass numbers between 90 and 140. In nuclear reactors it is produced with a
yield of about 6% of fissions. 90Sr is a significant component of spent nuclear fuel,
high-level radioactive wastes resulting from processing spent nuclear fuel, and
radioactive wastes associated with the operation of reactors and fuel reprocessing
plants. It is also present in surface soil around the world as a result of fallout from
past atmospheric nuclear weapons tests and contamination incidents of all scales at
nuclear facilities. 158 166
Sr is a Group II element like Ca and features in this research because it will be
present in nuclear industry waste and has the potential to interact or exchange with
the significant concentrations of Ca in cementitious media.
The experiments undertaken were as follows:
Diffusion with NRVB equilibrated water using 90Sr tracer only and 90Sr tracer
plus Sr(NO3)2 carrier
Diffusion with CDP solution with 90Sr tracer and with 90Sr tracer only plus
Sr(NO3)2 carrier
Repeat of diffusion with CDP solution with 90Sr tracer only with an extended
pre-equilibration time.
Diffusion with NRVB using 90Sr tracer with gluconate as CDP surrogate in
NRVB equilibrated water.
Diffusion with NRVB using 90Sr tracer with high ionic strength solution and
gradient ionic strength.
Advection with NRVB equilibrated water and CDP solution using 90Sr tracer
only.
Autoradiographs for most of the diffusion experiments have been produced. GoldSim
transport models have been generated for the 90Sr diffusion experiments. The
GoldSim transport model has also been tested on the advection experiments. The
results of the advection models suggest that there is still development work to do
and consequently they are presented as GoldSim screenshots.
13.2 Additional Experimental Details for 90Sr Diffusion Experiments
The diffusion experiment used a 50 µl or 100 µl addition of 90Sr (produced as the
nitrate by Perkin Elmer) to the central cores of duplicate NRVB cylinders, equivalent
to:

158
Cmax of 3758 d min-1 (14092 Bq per cylinder and an initial concentration in the
inner core = 1.9x10⁻⁸ mol dm-3) for the 90Sr tracer only, NRVB equilibrated
water and CDP solution experiments.
Cmax of 6709 d min-1 (25159 Bq per cylinder and an initial concentration in the
inner core = 3.4x10⁻⁸ mol dm-3) for the 90Sr tracer with Sr(NO2)2 carrier, NRVB
equilibrated water and CDP solution experiments.
Cmax of 3380 d min-1 (12675 Bq per cylinder and an initial concentration in the
inner core = 1.7x10⁻⁸ mol dm-3) for the 90Sr tracer with gluconate, NRVB
equilibrated water experiment.
Cmax of 3279 d min-1 (12296 Bq per cylinder and an initial concentration in the
inner core = 1.7x10⁻⁸ mol dm-3) for the 90Sr tracer high ionic strength and
gradient ionic strength in NRVB equilibrated water experiment.
Cmax of 3279 d min-1 (12296 Bq per cylinder and an initial concentration in the
inner core = 1.7x10⁻⁸ mol dm-3) for the 90Sr tracer (single cylinder) extended
CDP equilibration repeat of the CDP solution experiment.
Cmax is the maximum number of disintegrations per minute possible in the 1 cm3
sample if the 90Sr was to equilibrate completely into the liquid in the system. The
results figures and tables use a calculation to account for the effect on Cmax caused
by the removal of volume and activity during sampling. A disproportionately small
amount of activity is removed during sampling compared to the total volume, the
overall effect is to increase Cmax each time a sample is taken. Cmax is used to
prepare the relative retention plots to enable visualisation of a range of diffusion
experiments on the same axes.
The NRVB cylinders used for the basic tracer and tracer carrier experiments were
equilibrated in the CDP solution in sealed containers, in a nitrogen glovebox for 30
days prior to commencement. The radioisotope addition was made outside the
nitrogen glove box, the cylinder was sealed, submerged in 200 cm3 NRVB
equilibrated water and returned to the glove box over a period of less than two
minutes. The total volume of equilibrated water in the system at the start is assumed
to be 225 cm3 (the additional 25 cm3 being an estimate of the pore water volume in
the NRVB cylinder). The mass of Sr as Sr(NO3)2 added to each of the carrier
experiments was 21.8 mg. This mass was calculated such that in the case of
complete equilibration with the liquid in the system, the final concentration of Sr

159
would be ~10-3 mol dm-3. The initial concentration of the carrier in the inner cores
was 0.15 mol dm-3. The mass of 90Sr added was considered to be negligible.
The gluconate experiment was devised to ascertain whether a single organic
substance could be used as a surrogate for the mixture of organics present in the
CDP solution. This also enabled an experiment to be undertaken in the presence of
a high concentration of a relevant organic but in the absence of the increased ionic
strength seen in the CDP solution. The gluconate solution was made by adding an
accurately weighed amount of gluconolactone (C6H12O7, the lactone form of gluconic
acid with no counter ions present) to the NRVB equilibrated water to produce a
2x10⁻³ mol dm-3 (400 ppm) solution, equivalent to a total organic carbon (TOC) of
~0.75x10⁻³ mol dm-3 (147 ppm).
By the time these experiments commenced it was evident that equilibration time for
the NRVB cylinder and solution was an important parameter for the experiments with
organic components. Early trials that allowed a CDP solution to migrate into the
central core, where it was sampled and the internal and external TOC results
compared, suggested that 30 days would be sufficient. However, the first 90Sr
diffusion results showed that stable conditions for 90Sr were not reached until in
excess of 100 days had elapsed. It was not possible to determine whether
equilibrating organics or equilibrating Sr concentrations (or both) were responsible.
As a consequence the NRVB cylinders were allowed to equilibrate in the gluconate
solution for 103 days before the addition of the 90Sr tracer.
Two types of high ionic strength experiment were undertaken. The first, simply ran
the experiment in NRVB equilibrated water with NaCl and KCl added at a
concentration of 0.05 mol dm-3 each i.e. 0.1 mol dm-3 NaCl/KCl solution. The second
added the same mass of NaCl/KCl (0.658g NaCl, 0.838g KCl and assumed 225 cm-3
liquid in system) in 1 cm-3 NRVB equilibrated water to the central core with the 90Sr
tracer. This represented a maximum start concentration of ~11 mol dm-3 each, for
NaCl and KCl reducing to 0.1 mol dm-3 as the solution equilibrated with the contents
of the central core i.e a gradient of ionic strength which should, at least initially
decrease diffusivity (see section 5) . It should be noted that the two salts were added
as a slurry immediately followed by the radiotracer.
One further diffusion experiment was undertaken which was a repeat of the 90Sr
tracer only in CDP solution with an extended equilibration time of 50 days, the

160
original experiment had used 30 days. Again this experiment was commenced prior
to understanding that equilibration times were likely to be longer than originally
anticipated. This experiment was not undertaken in duplicate as it was incorrectly
assumed the results would be confirmatory of the earlier experiment.
90Sr activity concentrations were determined by liquid scintillation counting using
Goldstar multi-purpose scintillation cocktail and a Packard 2100TR liquid scintillation
counter. 1 cm3 samples were taken throughout the experimental duration but all
determined on one day when the experiment was completed to negate the need to
correct for radioactive decay. In addition 1 cm3 control samples (the source of the
Cmax values above) were made at the start of the experiment to enable relative
retention graphs to be made. The control samples and appropriate blanks were also
determined on the same day as the samples from the experiments. All
determinations were subject to the 2 σ criterion available on the counter to provide
confidence of statistical validity.
13.3 Results of 90Sr Diffusion Experiments
All results are presented as the average of duplicates (where undertaken) along with
vertical error bars denoting the 90% confidence limits assuming a two tailed t
distribution and horizontal error bars set at +/- 0.25 days. Three graphs are
presented for each experiment; showing all results, early data and C/Cmax relative
retention. The data are tabulated in two tables for each experiment. A short
commentary is provided after each set of graphs and before the tables.
13.3.1 Results of the 90Sr tracer only NRVB diffusion experiment
The results of the 90Sr tracer only NRVB equilibrated water diffusion experiment are
presented below as figs. 13.1 to 13.3 and as tables 13.2 and 13.3 in appendix 1.
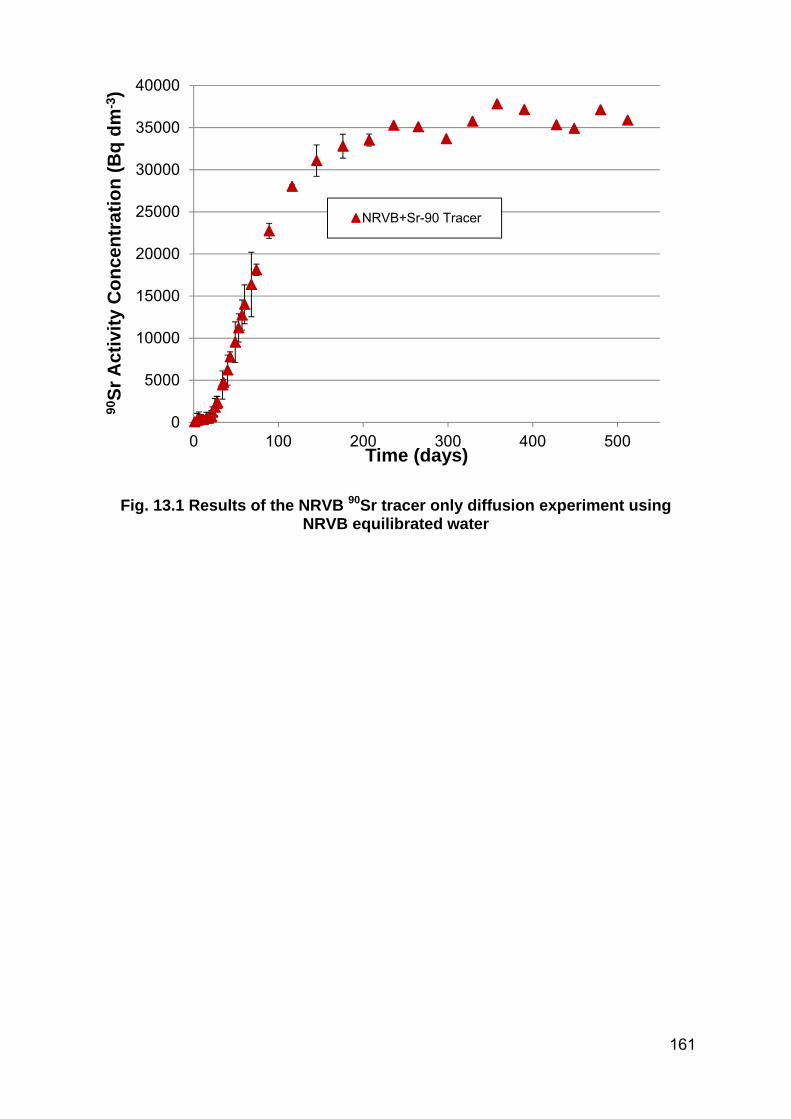
161
Fig. 13.1 Results of the NRVB 90Sr tracer only diffusion experiment using NRVB equilibrated water
0
5000
10000
15000
20000
25000
30000
35000
40000
0 100 200 300 400 500
90S
r A
ctiv
ity
Co
nce
ntr
atio
n (
Bq
dm
-3)
Time (days)
NRVB+Sr-90 Tracer

162
Fig. 13.2 Early data from the NRVB 90Sr tracer only carrier diffusion experiment using NRVB equilibrated water
Fig. 13.3 C/Cmax relative retention plot of the NRVB 90Sr tracer only diffusion experiment using NRVB equilibrated water
0
5000
10000
15000
20000
25000
30000
35000
40000
0 20 40 60 80 100
90S
r A
ctiv
ity
Co
nce
ntr
atio
n (
Bq
dm
-3)
Time (days)
NRVB+Sr-90 Tracer
0.00
0.10
0.20
0.30
0.40
0.50
0.60
0.70
0.80
0.90
1.00
0 100 200 300 400 500
90S
r R
elat
ive
Ret
enti
on
C/C
max
Time (days)
NRVB+Sr-90 Tracer

163
Commentary
Breakthrough of 90Sr commenced at approximately 20 days, followed by a linear
increase in concentration over the following 70 days, this is clearly shown on fig 13.2
the early data plot. The concentration continued to increase at a slower rate
stabilising at 35000 Bq dm-3 at 250 days and achieving a maximum activity
concentration of 37833 Bq dm-3 at 358 days. The relative retention plot (where
initially Cmax = 3758 d min-1) indicates that ~50% of the tracer was retained on the
NRVB cylinder i.e. 50% of the tracer was in solution. The effect of the steadily
increasing Cmax value can be seen in the later part of the results. The concentration
plot fig. 13.1 exhibits much more variability than the somewhat flattened data shown
in the relative retention plot, fig. 13.3.
It is important to be aware that the data points from 207 days onwards are not
averages of duplicates. This is because one of the NRVB cylinders was removed to
evaluate the autoradiography technique. The autoradiograph produced is presented
in section 13.6 and clearly showed that a concentration gradient was present in the
cylinder even though the results appeared to have stabilised.
13.3.2 Results of the 90Sr tracer only diffusion experiment using CDP solution
The results of the 90Sr tracer only CDP diffusion experiment are presented below as
figs. 13.4 to 13.6 and as tables 13.4 and 13.5 in appendix 1.

164
Fig. 13.4 Results of the NRVB 90Sr tracer only diffusion experiment using CDP solution
Fig. 13.5 Early data from the NRVB 90Sr tracer only diffusion experiment using CDP solution
0
5000
10000
15000
20000
25000
30000
35000
0 100 200 300 400 500
90S
r A
ctiv
ity
Co
nce
ntr
atio
n (
Bq
dm
-3)
Time (days)
CDP+Sr-90 Tracer
0
5000
10000
15000
20000
25000
0 20 40 60 80 100 120
90S
r A
ctiv
ity
Co
nce
ntr
atio
n (
Bq
dm
-3)
Time (days)
CDP+Sr-90 Tracer

165
Fig. 13.6 C/Cmax relative retention plot of the NRVB 90Sr tracer only diffusion experiment using CDP solution
Commentary
Breakthrough of 90Sr commenced at approximately 25 days, followed by a linear
increase in concentration over the following 90 days, this is clearly shown on fig 13.5
the early data plot. The concentration continued to increase at a slower rate, initially
stabilising at ~26000 Bq dm-3 after 236 days and then very slowly rising again to
stabilise at ~28500 Bq dm-3 before achieving a maximum activity concentration of
29133 Bq dm-3 at 358 days. The relative retention plot (where initially Cmax = 3758 d
min-1) indicates that ~60% of the tracer was retained on the NRVB cylinder i.e. 40%
of the tracer was in solution. The effect of the steadily increasing Cmax value can be
seen in the later part of the results. The concentration plot fig. 13.4 exhibits much
more variability than the somewhat flattened data shown in the relative retention plot,
fig. 13.6.
The contrast between the experiments in the presence and absence of CDP was
marked and contrary to the results seen for Cs and I, where the presence of CDP
appeared to be responsible for an increase in the rate of migration and decrease in
retention. The comparison can be seen on the composite plots (see section 13.4,
figs. 13.21 and 13.22 These observations started an ongoing investigation into
relevance of the equilibration times which can clearly run well in excess of 100 days.
0.00
0.10
0.20
0.30
0.40
0.50
0.60
0.70
0.80
0.90
1.00
0 100 200 300 400 500
90S
r R
elat
ive
Ret
enti
on
C/C
max
Time (days)
CDP+Sr-90 Tracer

166
13.3.3 Results of the NRVB 90Sr tracer and Sr(NO3)2 carrier diffusion experiment using NRVB equilibrated water
The results of the 90Sr tracer and Sr(NO3)2 NRVB diffusion experiment are presented
below as figs. 13.7 to 13.9 and as tables 13.6 and 13.7 in appendix 1.
Fig. 13.7 Results of the NRVB 90Sr tracer and Sr(NO3)2 carrier diffusion experiment using NRVB equilibrated water
0
10000
20000
30000
40000
50000
60000
70000
80000
0 100 200 300
90S
r A
ctiv
ity
Co
nce
ntr
atio
n (
Bq
dm
-3)
Time (days)
NRVB+Sr-90 Tracer+Sr(NO3)2 Carrier

167
Fig. 13.8 Early data from the NRVB 90Sr tracer and Sr(NO3)2 carrier diffusion experiment using NRVB equilibrated water
Fig. 13.9 C/Cmax relative retention plot of the NRVB 90Sr tracer and Sr(NO3)2 carrier diffusion experiment using NRVB equilibrated water
0
10000
20000
30000
40000
50000
60000
70000
80000
0 20 40 60 80
90S
r A
ctiv
ity
Co
nce
ntr
atio
n (
Bq
dm
-3)
Time (days)
NRVB+Sr-90 Tracer+Sr(NO3)2 Carrier
0.00
0.10
0.20
0.30
0.40
0.50
0.60
0.70
0.80
0.90
1.00
0 50 100 150 200 250 300 350
90S
r R
elat
ive
Ret
enti
on
C/C
max
Time (days)
NRVB+Sr-90 Tracer+Sr(NO3)2 Carrier

168
Commentary
It is important to be aware that double the activity of 90Sr tracer was erroneously
added to the carrier experiments although there does not appear to have been any
detrimental effect on the results. Breakthrough of 90Sr commenced at approximately
17 days, followed by a linear increase in concentration over the following 66 days,
this is clearly shown on fig 13.8 the early data plot. The concentration continued to
increase at a slower rate, initially stabilising at ~62000 Bq dm-3 after 156 days and
then very slowly rising again to stabilise at ~70000 Bq dm-3 before achieving a
maximum activity concentration of 69858 Bq dm-3 at 248 days. The relative retention
plot (where initially Cmax = 6709 d min-1) indicates that ~40% of the tracer was
retained on the NRVB cylinder i.e. 60% of the tracer was in solution. The effect of the
steadily increasing Cmax value is still present but not as obvious as on previous plots,
due to the shorter experimental duration and the smaller number of samples taken.

169
13.3.4 Results of the NRVB 90Sr tracer and Sr(NO3)2 carrier diffusion experiment using CDP solution
The results of the 90Sr tracer and Sr(NO3)2 NRVB diffusion experiment are presented
below as figs. 13.10 to 13.12 and as tables 13.8 and 13.9 in appendix 1.
Fig. 13.10 Results of the NRVB 90Sr tracer and and Sr(NO3)2 carrier diffusion experiment using CDP solution
0
10000
20000
30000
40000
50000
60000
70000
80000
0 50 100 150 200 250 300 350
90S
r A
ctiv
ity
Co
nce
ntr
atio
n (
Bq
dm
-3)
Time (days)
CDP+Sr-90 Tracer+Sr(NO3)2 Carrier

170
Fig. 13.11 Early data from the NRVB 90Sr tracer and and Sr(NO3)2 carrier diffusion experiment using CDP solution
Fig. 13.12 C/Cmax relative retention plot of the NRVB 90Sr tracer and Sr(NO3)2 carrier diffusion experiment using CDP solution
0
10000
20000
30000
40000
50000
60000
70000
80000
0 20 40 60 80 100
90S
r A
ctiv
ity
Co
nce
ntr
atio
n (
Bq
dm
-3)
Time (days)
CDP+Sr-90 Tracer+Sr(NO3)2 Carrier
0.00
0.10
0.20
0.30
0.40
0.50
0.60
0.70
0.80
0.90
1.00
0 50 100 150 200 250 300
90S
r R
elat
ive
Ret
enti
on
C/C
max
Time (days)
CDP+Sr-90 Tracer+Sr(NO3)2 Carrier

171
Commentary
It is important to be aware that double the activity of 90Sr tracer was erroneously
added to the carrier experiments although there does not appear to have been any
detrimental effect on the results. In addition, some data points are absent, this can
be seen from the tables, the main causes of missing data points were mislabelling of
sample vials and spills.
Breakthrough of 90Sr commenced at approximately 13 days, followed by a linear
increase in concentration over the following 60 days, this is clearly shown on fig
13.11, the early data plot. The concentration continued to increase at a slower rate,
initially stabilising at ~66500 Bq dm-3 after around 200 days, achieving a maximum of
67025 Bq dm-3 at 185 days. The relative retention plot (where initially Cmax = 6709 d
min-1) indicates that ~45% of the tracer was retained on the NRVB cylinder i.e. ~55%
of the tracer was in solution. The flattening effect of the steadily increasing Cmax
value is present but not as obvious as on previous plots, due to the shorter
experimental duration and the smaller number of samples taken.
The Sr carrier diffusion results were very similar. The CDP experiment appeared to
be a little slower with slightly more retention of Sr but this could be experimental
error. The error bars are clearly visible on the Sr carrier plots indicating greater
variability between the duplicates compared to other diffusion experiments
undertaken in this research. The comparison of the carrier experiments with the
other experiments presented in this section can be seen on the composite plots (see
section 13.4, figs. 13.21 and 13.22).

172
13.3.5 Results of the NRVB 90Sr tracer only diffusion experiment using gluconate in NRVB equilibrated water
The results of the 90Sr tracer only diffusion experiment using gluconate in NRVB equilibrated water are presented below as figs. 13.13 to 13.15 and as tables 13.10 and 13.11 in appendix 1.
Fig. 13.13 Results of the NRVB 90Sr tracer only diffusion experiment using gluconate in NRVB equilibrated water
0
5000
10000
15000
20000
25000
30000
0 50 100 150 200 250 300 350
90S
r A
ctiv
ity
Co
nce
ntr
atio
n (
Bq
dm
-3)
Time (days)
NRVB Gluconate+Sr-90 Tracer

173
Fig. 13.14 Early data from the NRVB 90Sr tracer only diffusion experiment using gluconate in NRVB equilibrated water
Fig. 13.15 C/Cmax relative retention plot of the NRVB 90Sr tracer only diffusion experiment using gluconate in NRVB equilibrated water
0
5000
10000
15000
20000
25000
0 20 40 60 80 100
90S
r A
ctiv
ity
Co
nce
ntr
atio
n (
Bq
dm
-3)
Time (days)
NRVB Gluconate+Sr-90 Tracer
0.00
0.10
0.20
0.30
0.40
0.50
0.60
0.70
0.80
0.90
1.00
0 50 100 150 200 250 300 350
90S
r R
elat
ive
Ret
enti
on
C/C
max
Time (days)
NRVB Gluconate+Sr-90 Tracer

174
Commentary
Breakthrough of 90Sr commenced at approximately 19 days, followed by a linear
increase in concentration over the following 70 days, this is clearly shown on fig
13.14, the early data plot. The concentration continued to increase at a slower rate,
initially stabilising at ~22500 Bq dm-3 at 184 days, achieving a maximum of ~24300
Bq dm-3 at 244 days. The relative retention plot (where initially Cmax = 3380 d min-1)
indicates that ~60% of the tracer was retained on the NRVB cylinder i.e. ~40% of the
tracer was in solution. The flattening effect of the steadily increasing Cmax value can
be seen in the later part of the results. The concentration plot fig. 13.13 exhibits more
variability than the somewhat flattened data shown in the relative retention plot, fig.
13.15. Note that the final data point at 336 days is a single value because the
duplicate was removed for autoradiography.
The tracer in the gluconate experiment breaks through more quickly than it does in
the equivalent CDP experiment. However, the relative retention is very similar at
~60%. The equilibration time for the gluconate solution and NRVB cylinders was
over 100 days and for the comparable CDP experiment it was only 30 days. This
supported the supposition that the cylinders used in the CDP experiment were still
equilibrating when the experiment started i.e. Sr from the CDP solution was
migrating into the block and the tracer could not migrate out until the concentration
gradient had subsided. The comparison of the carrier experiments with the other
experiments presented in this section can be seen on the composite plots (see
section 13.4, figs. 13.21 and 13.22).

175
13.3.6 Results of the NRVB 90Sr tracer only diffusion experiment using high ionic strength NRVB equilibrated water
The results of the 90Sr tracer only diffusion experiment using high ionic strength NRVB equilibrated water are presented below as figs. 13.16 and 13.17 and as tables 13.12 and 13.13 in appendix 1. The early data plot is not presented because the experimental results currently extend to only 115 days.
Fig. 13.16 Results of the NRVB 90Sr tracer only diffusion experiment using high ionic strength NRVB equilibrated water
0
2000
4000
6000
8000
10000
12000
14000
16000
0 20 40 60 80 100 120
90S
r A
ctiv
ity
Co
nce
ntr
atio
n (
Bq
dm
-3)
Time (days)
NRVB Sr-90 Tracer High Ionic Strength

176
Fig. 13.17 C/Cmax relative retention plot of the NRVB 90Sr tracer only diffusion experiment using high ionic strength NRVB equilibrated water
Commentary
Breakthrough of 90Sr commenced at approximately 25 days, followed by a linear
increase in concentration over the following 62 days, this is clearly shown on fig
13.15. The concentration continued to increase at a slower rate, initially stabilising at
~14000 Bq dm-3 after 102 days, achieving a maximum of 13817 Bq dm-3 at the latest
available data point of 115 days. The relative retention plot (where initially Cmax =
3279 d min-1) indicates that >75% of the tracer was retained on the NRVB cylinder
i.e. <25% of the tracer was in solution.
The tracer in the high ionic strength experiment breaks through more slowly than
comparable experiments in the series. The equilibration time for the high ionic
strength solution and NRVB cylinders was only 3 days. The results in the phase
where concentration is increasing linearly are very similar to the tracer only CDP
(see fig. 13.22) indicating an effect on diffusivity. It is not yet possible to state
whether the results are beginning to stabilise. Clearly more results need to be
0.00
0.05
0.10
0.15
0.20
0.25
0.30
0.35
0.40
0 20 40 60 80 100 120
90S
r R
elat
ive
Ret
enti
on
C/C
max
Time (days)
NRVB Sr-90 Tracer High Ionic Strength

177
collected before any significant conclusions can be proposed. The comparison of
these experiments with the other experiments presented in this section can be seen
on the composite plots (see section 13.4, figs. 13.21 and 13.22).
13.3.7 Results of the NRVB 90Sr tracer only diffusion experiment using gradient ionic strength NRVB equilibrated water
The results of the 90Sr tracer only diffusion experiment using gradient ionic strength
NRVB equilibrated water are presented below as figs. 13.18 and 13.19 and tables
13.14 and 13.15. The early data plot is not presented because the experimental
results currently extend to only 119 days. In addition and for the first time significant
and as yet unexplained divergence between the duplicates was observed and
consequently they are plotted separately.
Fig. 13.18 Results of the NRVB 90Sr tracer only diffusion experiment using gradient ionic strength NRVB equilibrated water
0
2000
4000
6000
8000
10000
12000
14000
0 20 40 60 80 100 120
90S
r A
ctiv
ity
Co
nce
ntr
atio
n (
Bq
dm
-3)
Time (days)
NRVB Sr-90 Gradient Ionic Strength 1
NRVB Sr-90 Gradient Ionic Strength 2

178
Fig. 13.19 C/Cmax relative retention plot of the NRVB 90Sr tracer only diffusion experiment using gradient ionic strength NRVB equilibrated water
Commentary
Breakthrough of 90Sr commenced at 42 days for sample 1 and 51 days for sample 2 ,
followed by a linear increase in concentration over the following ~50 days, this is
clearly shown on fig 13.18. The concentrations appeared to be stabilising at ~6000
and 12000 Bq dm-3 at the latest available data point of 115 days. The relative
retention plot (where initially Cmax = 3279 d min-1) indicates that the retention on the
NRVB is likely to be higher than that observed during the non-gradient high ionic
strength experiments. It remains to be seen whether these experiments (gradient
and non-gradient) which have the same total amount of NaCl and KCl added will
converge over a longer time duration.
It is clear from the longer breakthrough times that the very high ionic strength at the
start of these experiments has suppressed diffusivity. These experiments clearly
need more data points before any more significant conclusions can be proposed
particularly in relation to retention on the NRVB. The comparison of these
experiments with the other experiments presented in this section can be seen on the
composite plots (see section 13.4, figs. 13.21 and 13.22).
0.00
0.05
0.10
0.15
0.20
0.25
0.30
0 20 40 60 80 100 120
90S
r R
elat
ive
Ret
enti
on
(C
/Cm
ax)
Time (days)
NRVB Sr-90 Tracer Gradient Ionic Strength 1
NRVB Sr-90 Tracer Gradient Ionic Strength 2

179
13.3.8 Results of the repeated NRVB 90Sr tracer only diffusion experiment using CDP solution
The results of the repeated 90Sr tracer only diffusion experiment using CDP solution
are presented below as figs. 13.20 and 13.21 and as table 13.16 in appendix 1. The
experiment was not undertaken in duplicate and an early data plot has not been
presented.
Fig. 13.20 Results of the repeated NRVB 90Sr tracer only diffusion experiment using CDP solution
0
5000
10000
15000
20000
25000
30000
0 50 100 150 200 250 300
90S
r A
ctiv
ity
Co
nce
ntr
atio
n (
Bq
dm
-3)
Time (days)
CDP Sr-90 Tracer rpt

180
Fig. 13.20 C/Cmax relative retention plot of the repeated NRVB 90Sr tracer only diffusion experiment using CDP solution
Commentary
Breakthrough of 90Sr commenced at approximately 15 days, followed by an almost
linear increase in concentration over the following ~111 days, this is clearly shown
on fig 13.19. The concentrations appeared to be stabilising at ~25000 Bq dm-3 with
the last available data point at 241 days appearing to be anomalously low at 22350
Bq dm-3. The relative retention plot (where initially Cmax = 3279 d min-1) indicates that
the retention of the tracer on the NRVB cylinder is likely to be ~60% similar to the
original 90Sr tracer only CDP experiment presented in section 13.3.1.
The main difference between this experiment and the earlier tracer only CDP
experiments is the pre-equilibration time in the presence of the CDP solution. The
original experiments had a 30 day pre-equilibration and this experiment had a 50 day
equilibration. This appeared to shorten the breakthrough time and leave the relative
retention unaffected providing more evidence that the original CDP tracer only
experiments were still equilibrating when the tracer was added. The comparison of
this experiment with the other experiments presented in this section can be seen on
the composite plots (see section 13.4, fig. 13.21 and 13.22).
0.00
0.10
0.20
0.30
0.40
0.50
0 50 100 150 200 250 300
90S
r R
elat
ive
Ret
enti
on
(C
/Cm
ax)
Time (days)
CDP Sr-90 Tracer rpt
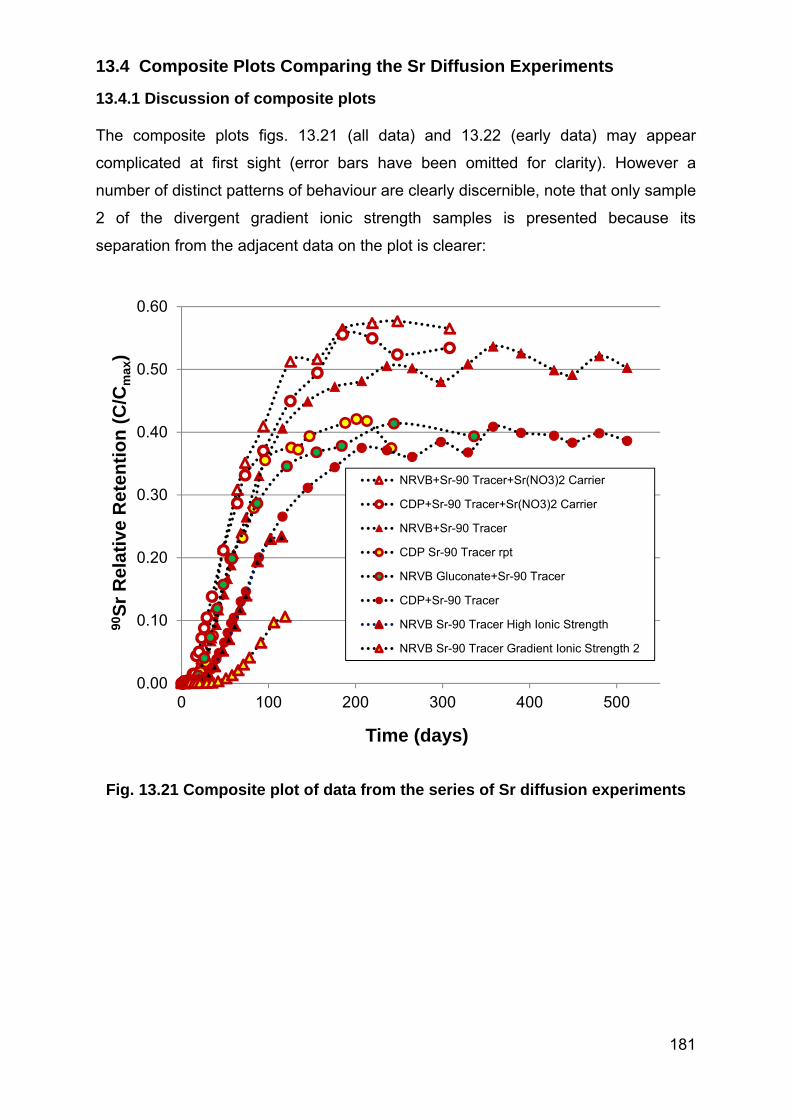
181
13.4 Composite Plots Comparing the Sr Diffusion Experiments
13.4.1 Discussion of composite plots
The composite plots figs. 13.21 (all data) and 13.22 (early data) may appear
complicated at first sight (error bars have been omitted for clarity). However a
number of distinct patterns of behaviour are clearly discernible, note that only sample
2 of the divergent gradient ionic strength samples is presented because its
separation from the adjacent data on the plot is clearer:
Fig. 13.21 Composite plot of data from the series of Sr diffusion experiments
0.00
0.10
0.20
0.30
0.40
0.50
0.60
0 100 200 300 400 500
90S
r R
elat
ive
Ret
enti
on
(C
/Cm
ax)
Time (days)
NRVB+Sr-90 Tracer+Sr(NO3)2 Carrier
CDP+Sr-90 Tracer+Sr(NO3)2 Carrier
NRVB+Sr-90 Tracer
CDP Sr-90 Tracer rpt
NRVB Gluconate+Sr-90 Tracer
CDP+Sr-90 Tracer
NRVB Sr-90 Tracer High Ionic Strength
NRVB Sr-90 Tracer Gradient Ionic Strength 2

182
Fig. 13.22 Composite plot of early data from the series of Sr diffusion experiments
Commentary
The Sr concentration was highest in the carrier experiments and this can be
seen to dominate, producing the fastest movement towards stabilisation and
highest relative concentrations in solution (lowest relative concentrations
retained on the NRVB cylinders). The presence or absence of CDP makes
very little difference, similarly the higher ionic strength associated with the
CDP solution.
The 90Sr tracer only with NRVB equilibrated water is very similar to the carrier
experiments although marginally slower to stabilise and producing a lower
relative concentration of the tracer in solution.
The tracer only experiments in the presence of organics (CDP with 30 days
pre-equilibration, CDP repeat with 50 day pre-equilibration and gluconate with
103 days pre-equilibration) eventually stabilised at very similar relative
concentrations in solution, i.e. about 60% retained on the NRVB cylinders.
0.00
0.10
0.20
0.30
0.40
0.50
0.60
0 20 40 60 80
90S
r R
elat
ive
Ret
enti
on
(C
/Cm
ax)
Time (days)
NRVB+Sr-90 Tracer+Sr(NO3)2 Carrier
CDP+Sr-90 Tracer+Sr(NO3)2 Carrier
NRVB+Sr-90 Tracer
CDP Sr-90 Tracer rpt
NRVB Gluconate+Sr-90 Tracer
CDP+Sr-90 Tracer
NRVB Sr-90 Tracer High Ionic Strength
NRVB Sr-90 Tracer Gradient Ionic Strength 2

183
The high ionic strength experiments appeared to stabilise at much lower
relative concentrations in solution. However it is clear that more results are
needed for confirmation).
The early data shows that the carrier experiments break through most rapidly
The tracer only experiments with organics and long pre-equilibration times are
initially grouped together with the tracer only in the absence of organics.
The CDP and high ionic strength tracer only experiments are also grouped
together initially
The gradient high ionic strength (sample 2) is much slower than any of the
other experiments and has the lowest relative concentration in solution.
The experiments, when considered as a set provide evidence that:
A high Sr initial concentration dominates other effects, even the presence of
CDP solution
The presence of CDP increases the relative retention of tracer concentrations
of 90Sr from 45% to 60%
Initial breakthrough and subsequent relative concentration increase can be
affected by pre-equilibration time, suggesting that “back diffusion” of the
higher Sr concentration in the CDP solution into the NRVB cylinder must
occur before the 90Sr tracer can begin to migrate.
The presence of high ionic strength significantly decreases diffusivity and
increases relative retention when compared to an increase in the Sr
concentration gradient.
Clearly there is a need to undertake the high ionic strength, 90Sr tracer and Sr(NO3)2
carrier experiments to confirm the dominant mechanism. In addition, the equilibration
times for the CDP components and gluconate with NRVB will need to be better
defined and understood.
The autoradiographs presented in section 13.6 provide some visual evidence that
competing mechanisms may be responsible for the variety of results seen in this
series of diffusion experiments. Some of the autoradiographs show spots of activity
on the external surface and residual activity in the central core suggesting that
precipitation may also need to be considered as this work progresses.

184
13.5 GoldSim Models for Sr Diffusion Experiments
13.5.1 Additional information relevant to the 90Sr NRVB diffusion modelling Details of the GoldSim model are fully discussed in section 7. The results from the
modelling of the Sr diffusion experiments are presented as figs. 13.23 to 13.32. Initial
concentrations are provided in section 12.2. It is important to be aware that for
simplicity, activity concentrations were modelled and as a consequence a direct
comparison cannot be made in the same manner as possible with the relative
retention plots. Partition is referred to as throughout, primarily because this term,
rather than Rd is used in GoldSim. The model employs a background activity
concentration equivalent to the experimental blanks. This results in the activity
concentration points on the plots being approximately 1000 Bq dm-3 higher than
those shown for the individual experiments earlier in this section. The LOF
calculations are built into the model enabling it to determine the combination of
parameters that minimise LOF. Data envelopes that encompass all or the majority of
the observed data are also included to provide an indication of the variability of the
observed data within a range of partition coefficient and diffusivity values. Short
commentaries explaining the data envelopes along with , and LOF outputs are
also provided.

185
13.5.2 90Sr tracer only NRVB equilibrated water diffusion modelling
Fig. 13.23 Experimental and modelled NRVB diffusion curves for 90Sr at tracer concentration in NRVB equilibrated water
0
10000
20000
30000
40000
50000
60000
0 100 200 300
90S
r A
ctiv
ity
Co
nce
ntr
atio
n (
Bq
dm
-3)
Time (days)
Sr-90 Tracer NRVB
Model Sr-90 Tracer NRVB

186
Fig. 13.24 Early data from the experimental and modelled NRVB diffusion curves for 90Sr at tracer concentration in NRVB equilibrated water
Commentary
The best fit and model results for the 90Sr tracer only diffusion with NRVB
equilibrated water were 4.4x10⁻¹¹ m2 s-1 and 3.0x10⁻³ m3 kg-1, respectively (black
long hashed line in figs. 13.23 and 13.24). The LOF for the best model result was
3.2%. The majority of the experimental data could be contained in the interval
defined by setting in the range 3.5x10⁻¹¹ to 5.4x10⁻¹¹ m2 s-1 and between
2.8x10⁻³ and 3.1x10⁻³ m3 kg-1, (the solid black lines in fig. 13.23). The early data plot
(fig. 13.24) has been provided to illustrate the difficulty of setting a suitable envelope
to encompass both parts of the dataset. The results that fall outside the envelope
can be clearly seen on the figures. It should be noted that all observed values
(except the final somewhat anomalous data point) are included in the LOF results
even those outside the envelope.
0
5000
10000
15000
20000
25000
30000
35000
0 20 40 60 80 100
90S
r A
ctiv
ity
Co
nce
ntr
atio
n (
Bq
dm
-3)
Time (days)
Sr-90 Tracer NRVB
Model Sr-90 Tracer NRVB

187
13.5.3 90Sr tracer only CDP solution diffusion modelling
Fig. 13.25 Experimental and modelled NRVB diffusion curves for 90Sr at tracer concentration in CDP solution
0
5000
10000
15000
20000
25000
30000
35000
0 100 200 300 400
90S
r A
ctiv
ity
Co
nce
ntr
atio
n (
Bq
dm
-3)
Time (days)
Sr-90 Tracer CDPModel Sr-90 Tracer CDP
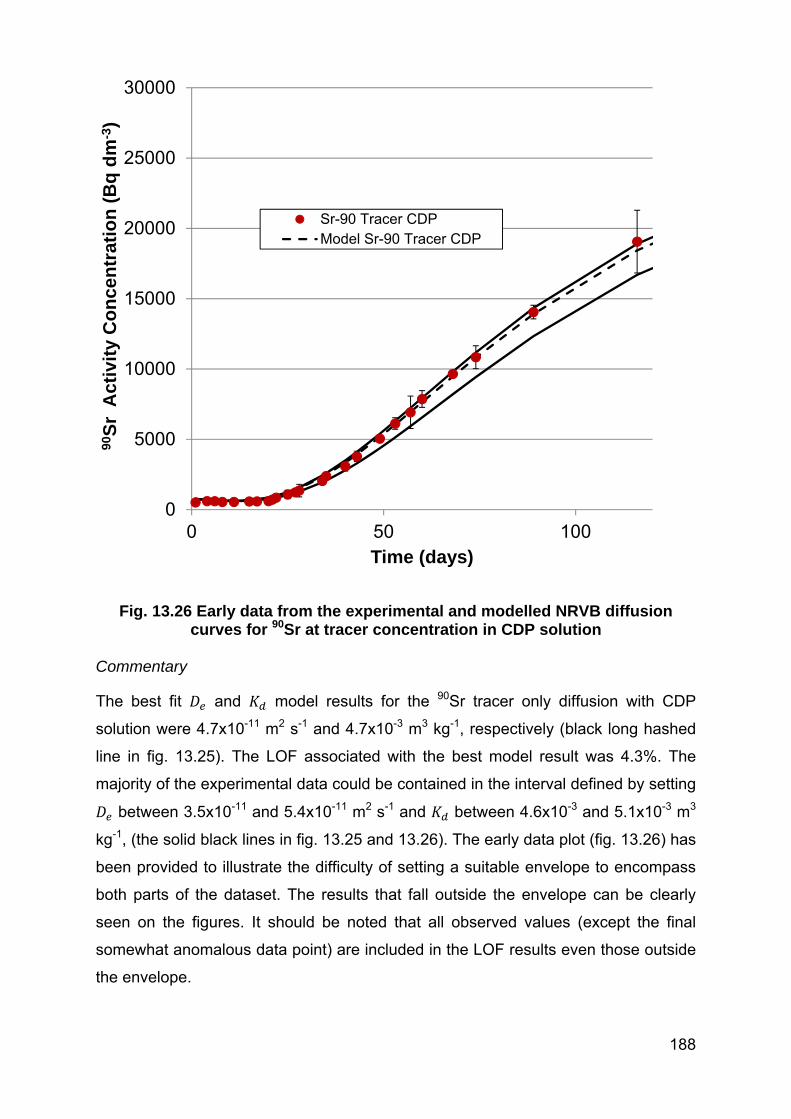
188
Fig. 13.26 Early data from the experimental and modelled NRVB diffusion curves for 90Sr at tracer concentration in CDP solution
Commentary
The best fit and model results for the 90Sr tracer only diffusion with CDP
solution were 4.7x10⁻¹¹ m2 s-1 and 4.7x10⁻³ m3 kg-1, respectively (black long hashed
line in fig. 13.25). The LOF associated with the best model result was 4.3%. The
majority of the experimental data could be contained in the interval defined by setting
between 3.5x10⁻¹¹ and 5.4x10⁻¹¹ m2 s-1 and between 4.6x10⁻³ and 5.1x10⁻³ m3
kg-1, (the solid black lines in fig. 13.25 and 13.26). The early data plot (fig. 13.26) has
been provided to illustrate the difficulty of setting a suitable envelope to encompass
both parts of the dataset. The results that fall outside the envelope can be clearly
seen on the figures. It should be noted that all observed values (except the final
somewhat anomalous data point) are included in the LOF results even those outside
the envelope.
0
5000
10000
15000
20000
25000
30000
0 50 100
90S
r A
ctiv
ity
Co
nce
ntr
atio
n (
Bq
dm
-3)
Time (days)
Sr-90 Tracer CDPModel Sr-90 Tracer CDP

189
13.5.4 90Sr tracer and Sr(NO)3 carrier NRVB equilibrated water diffusion modelling
Fig. 13.27 Experimental and modelled NRVB diffusion curves for 90Sr tracer and Sr(NO3)2 carrier using NRVB equilibrated water
0
10000
20000
30000
40000
50000
60000
70000
80000
0 100 200 300
90S
r A
ctiv
ity
Co
nce
ntr
atio
n (
Bq
dm
-3)
Time (days)
Sr-90 Tracer+Sr(NO3)2 Carrier NRVB
Model Sr-90 Tracer+Sr(NO3)2 Carrier NRVB

190
Fig. 13.28 Early data from the experimental and modelled NRVB diffusion curves for 90Sr tracer and Sr(NO3)2 carrier using NRVB equilibrated water
Commentary
The best fit and model results for the 90Sr tracer and Sr(NO3)2 diffusion with
NRVB equilibrated water were 4.4x10⁻¹¹ m2 s-1 and 2.4x10⁻³ m3 kg-1, respectively
(black long hashed line in fig. 13.25). The LOF associated with the best model result
was 3.04%. The majority of the experimental data could be contained in the interval
defined by setting between 4.3x10⁻¹¹ and 4.5x10⁻¹¹ m2 s-1 and between values
of 2.3x10⁻³ and 2.6x10⁻³ m3 kg-1, (the solid black lines in fig. 13.25 and 13.26). The
early data plot (fig. 13.26) illustrates that data from both parts of the dataset are
encompassed in the relatively tight range. The results that fall outside the envelope
can be clearly seen on the figures. It should be noted that all observed values are
included in the LOF results even those outside the envelope.
0
10000
20000
30000
40000
50000
60000
70000
80000
0 20 40 60 80 100
90S
r A
ctiv
ity
Co
nce
ntr
atio
n (
Bq
dm
-3)
Time (days)
Sr-90 Tracer+Sr(NO3)2 Carrier NRVB
Model Sr-90 Tracer+Sr(NO3)2 Carrier NRVB

191
13.5.5 90Sr tracer and Sr(NO)3 carrier CDP solution diffusion modelling
Fig. 13.29 Experimental and modelled NRVB diffusion curves for 90Sr tracer and Sr(NO3)2 carrier using CDP solution
0
10000
20000
30000
40000
50000
60000
70000
80000
0 100 200 300
90S
r A
ctiv
ity
Co
nce
ntr
atio
n (
Bq
dm
-3)
Time (days)
Sr-90 Tracer+Sr(NO3)2 Carrier CDP
Model Sr-90 Tracer+Sr(NO2)3 Carrier CDP

192
Fig. 13.30 Early data from the experimental and modelled NRVB diffusion curves for 90Sr tracer and Sr(NO3)2 carrier using NRVB equilibrated water
Commentary
The best fit and model results for the 90Sr tracer and Sr(NO3)2 diffusion with
CDP solution were 5.9x10⁻¹¹ m2 s-1 and 3.1x10⁻³ m3 kg-1, respectively (black long
hashed line in fig. 13.25). The LOF associated with the best model result was 11.0%.
The majority of the experimental data could not be easily contained in the type of
curves generated by the model. However, an interval defined by setting between
5.6x10⁻¹¹ and 6.1x10⁻¹¹ m2 s-1 and between 2.8x10⁻³ and 3.3x10⁻³ m3 kg-1, (the
solid black lines in figs. 13.27 and 13.28) approximates the data range. The early
data plot (fig. 13.26) illustrates the difficulty of encompassing the data range, if a
larger diffusivity range is selected the early data points will fall within the envelope
but the range for the later data will be very wide and not reflect the actual range
observed. The results that fall outside the envelope can be clearly seen on the
figures. It should be noted that all observed values are included in the LOF results
even those outside the envelope. The differences between the NRVB equilibrated
water and CDP solution diffusion profiles is not apparent at first sight but the
0
10000
20000
30000
40000
50000
60000
70000
80000
0 20 40 60 80 100
90S
r A
ctiv
ity
Co
nce
ntr
atio
n (
Bq
dm
-3)
Time (days)
Sr-90 Tracer+Sr(NO3)2 Carrier CDP
Model Sr-90 Tracer+Sr(NO2)3 Carrier CDP
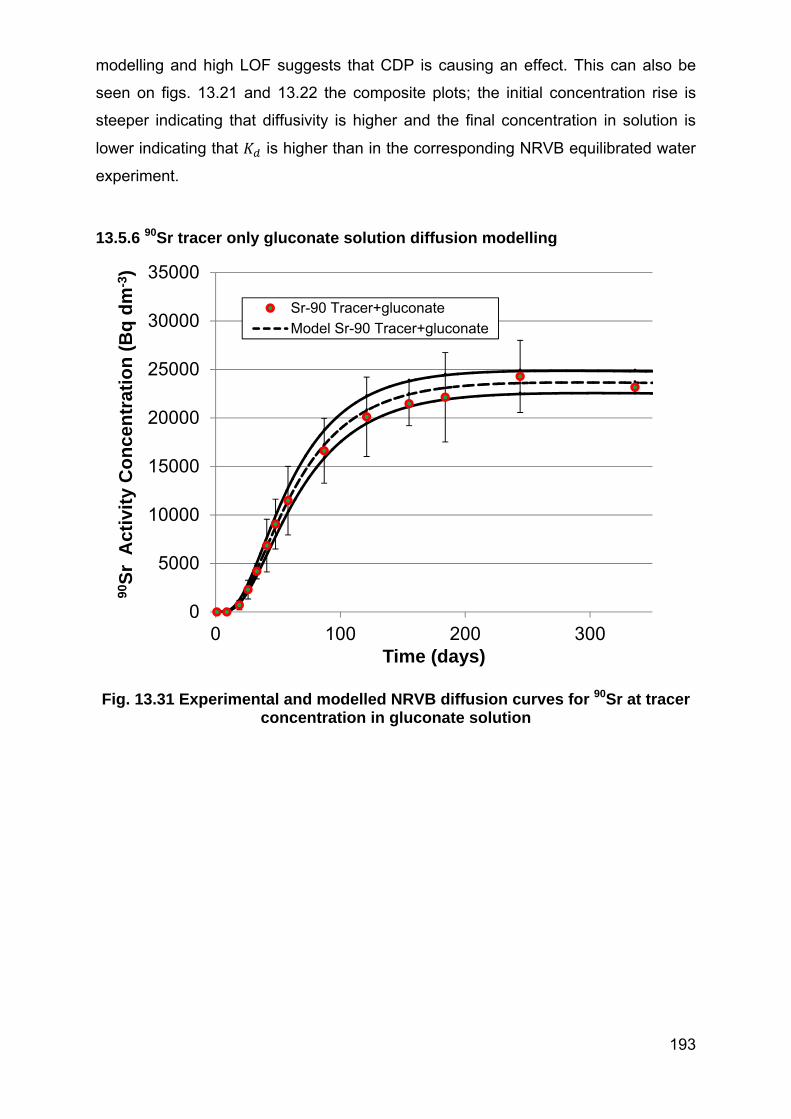
193
modelling and high LOF suggests that CDP is causing an effect. This can also be
seen on figs. 13.21 and 13.22 the composite plots; the initial concentration rise is
steeper indicating that diffusivity is higher and the final concentration in solution is
lower indicating that is higher than in the corresponding NRVB equilibrated water
experiment.
13.5.6 90Sr tracer only gluconate solution diffusion modelling
Fig. 13.31 Experimental and modelled NRVB diffusion curves for 90Sr at tracer concentration in gluconate solution
0
5000
10000
15000
20000
25000
30000
35000
0 100 200 300
90S
r A
ctiv
ity
Co
nce
ntr
atio
n (
Bq
dm
-3)
Time (days)
Sr-90 Tracer+gluconate
Model Sr-90 Tracer+gluconate
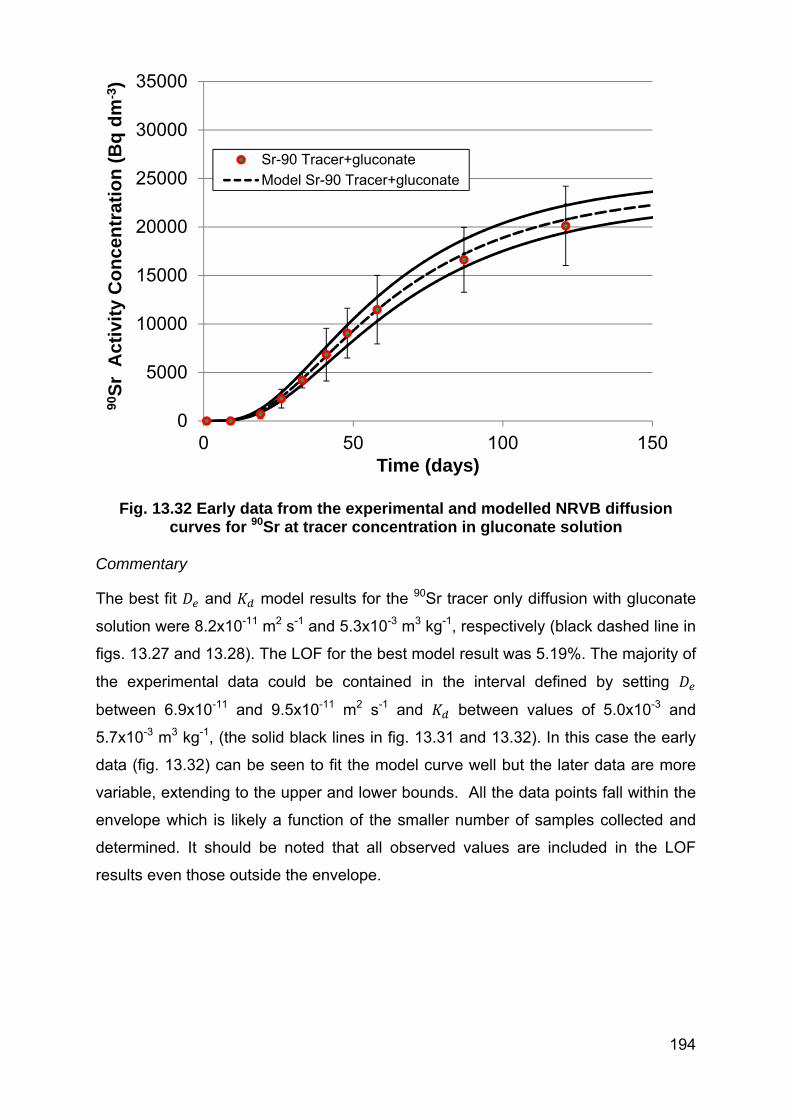
194
Fig. 13.32 Early data from the experimental and modelled NRVB diffusion curves for 90Sr at tracer concentration in gluconate solution
Commentary
The best fit and model results for the 90Sr tracer only diffusion with gluconate
solution were 8.2x10⁻¹¹ m2 s-1 and 5.3x10⁻³ m3 kg-1, respectively (black dashed line in
figs. 13.27 and 13.28). The LOF for the best model result was 5.19%. The majority of
the experimental data could be contained in the interval defined by setting
between 6.9x10⁻¹¹ and 9.5x10⁻¹¹ m2 s-1 and between values of 5.0x10⁻³ and
5.7x10⁻³ m3 kg-1, (the solid black lines in fig. 13.31 and 13.32). In this case the early
data (fig. 13.32) can be seen to fit the model curve well but the later data are more
variable, extending to the upper and lower bounds. All the data points fall within the
envelope which is likely a function of the smaller number of samples collected and
determined. It should be noted that all observed values are included in the LOF
results even those outside the envelope.
0
5000
10000
15000
20000
25000
30000
35000
0 50 100 150
90S
r A
ctiv
ity
Co
nce
ntr
atio
n (
Bq
dm
-3)
Time (days)
Sr-90 Tracer+gluconate
Model Sr-90 Tracer+gluconate

195
13.6 Autoradiographs of the 90Sr Diffusion Experiments
13.6.1 90Sr tracer only using NRVB equilibrated water
The first NRVB cylinder from a Sr experiment to be autoradiographed was one of
the 90Sr tracer only using NRVB equilibrated water duplicates after 207 days had
elapsed. The decision to stop one of the duplicate experiments was taken because
the concentration in solution appeared to have stabilised and the two samples were
behaving very similarly. There was also an interest in whether a concentration
gradient could be seen even though a stable concentration was being approached.
The image was produced using a Fuji BAS MP 20 cm x 25cm autoradiography
image plate with an exposure duration of 5 days. The plate was developed at BGS,
Nottingham and is reproduced below as fig.13.33 in unenhanced and ImageJ
enhanced versions.
Fig. 13.33 Autoradiograph of NRVB cylinder from90Sr tracer only using NRVB equilibrated water experiment (a) unenhanced and (b) ImageJ enhanced
The 5 day exposure was overly long and the original unenhanced image is intense
but ill-defined as a consequence. The enhanced version showed that even after 207
days a concentration gradient was clearly visible from the centre of the cylinder to
the edges. There was also a residual amount of the tracer present in the central
core. The “spot” to the upper left could not be identified on the cylinder and is
assumed to be of no relevance. The “scuff” marks to the lower left may have been
caused by the masonary saw when the cylinder was sectioned.
13.6.2 Autoradiographs from the 90Sr tracer, tracer carrier and gluconate experiments The autoradiographs from the 90Sr diffusion experiments (the exception being the
high ionic strength ones which are being allowed to continue) are presented in
(a) (b)

196
unenhanced and ImageJ enhanced versions with short commentaries below. The
images were produced using a Fuji BAS MP 20 cm x 25cm autoradiography image
plate with an exposure duration of 5 hours. The plate was developed at BGS,
Nottingham. Each experiment is represented by a pair of images one of which (the
one to the left) has the central core filled with modelling clay to shield radiation
coming from any residual tracer that may be present.
Fig. 13.34 Autoradiographs (unenhanced) from the NRVB/CDP 90Sr tracer, tracer carrier and gluconate experiments
Commentary
The images in the unenhanced version presented in fig. 13.34 above are not
particularly informative. However, it is worth noting that the tracer carrier images
appeared darker because almost double (1.79 times) the amount of tracer was
added. The effect of the modelling clay used as shielding is clear. A few residual
high intensity spots can be seen in the central core and on the outer edges of the
carrier experiments. The blank (an unused piece of NRVB cylinder) serves to
demonstrate the amount of background radiation that the plate is subjected to during
the exposure.
The ImageJ enhanced plates are shown in the following figures, they have been
separated to allow the intensities of the carrier experiment images to be divided by
1.79 to make them comparable to the tracer only images.
Blank
NRVB 90Sr tracer only
CDP 90Sr tracer and Sr(NO3)2 carrier
NRVB 90Sr tracer and Sr(NO3)2 carrier
CDP 90Sr tracer only
Gluconate
90Sr tracer only

197
Fig. 13.35 Autoradiographs (ImageJ enhanced) from the NRVB/CDP 90Sr tracer, tracer carrier and gluconate experiments
Commentary
The enhanced autoradiographs in fig.13.35 all exhibited homogeneous distribution of
the tracer in the NRVB matrix and a gradient like the one seen in fig.13.33 was not
visible. The distribution of tracer in the NRVB matrix for the tracer only experiment
was uniform but “grainy”. The cylinder from the CDP tracer experiment was more
intense than the one without CDP, reflecting the experimental results. The two
carrier experiments were almost identical, both exhibited residual tracer at the
central core seal and spots of tracer on external surfaces. The distribution of tracer in
the NRVB matrix for the carrier experiments was totally uniform and “smooth”. The
increase in intensity associated with the unshielded central cores may have been
caused by a larger (curved) area being exposed to irradiate the plate. The cylinder
used in the gluconate experiment has more residual tracer in the central core than
the others which may be indicative of precipitation but distribution of the tracer that
has diffused into the matrix is uniform. The GoldSim modelling suggested that
diffusivity and partition were higher than those determined for the tracer and carrier
experiments. The autoradiograph casts doubt on the modelling results as it can be
NRVB 90Sr tracer only
NRVB 90Sr tracer and Sr(NO3)2 carrier
Gluconate
90Sr tracer only
CDP 90Sr tracer and Sr(NO3)2 carrier
CDP 90Sr tracer only

198
seen that the diffusion is incomplete. The gluconate experiment had run for only 207
days compared to 512 days for the tracer only experiments and 308 days for the
carrier experiments. Consequently, the experiment will be continued and further
investigated at a later date by sectioning the duplicate for autoradiography.
13.7 90Sr Tracer Advection Experiments with NRVB Equilibrated Water and CDP solution
13.7.1 Additional information relevant to the 90Sr advection experiments Three 90Sr tracer only advection experiments have been undertaken; two runs using
NRVB equilibrated water, these were undertaken on the same NRVB cylinder and a
run using CDP solution undertaken on a separate cylinder.
The experimental procedure, including a 3 day “run in” for the NRVB cylinder was
identical to that used in the HTO advection experiments (see section 10.6). The only
exception being that the initial injection volume was 50 µL. The injection contained
12346 Bq or 740850 d min-1 of 90Sr for each of the NRVB equilibrated water runs and
12409 Bq or 744525 d min-1 for the CDP run. All the eluent was collected and
analysed for 90Sr and the evaporation of the eluted mass corrected for by
comparison with a weighed water blank left in the sample collector for the duration of
the experiment. All 90Sr determinations were performed by liquid scintillation counting
in the same manner as the diffusion experiments.
The experiments appeared to be quite successful but maintaining a steady driving
pressure and flow rate remained issues. Also a malfunction of the sample collector at
a critical point in the NRVB equilibrated water runs had an impact on the quality of
the data collected.
13.7.2 Run 1 90Sr tracer advection experiments with NRVB equilibrated water The results are presented separately below as eluted mass and 90Sr recovery plots
on figs. 13.36 and 13.37. A table showing the data is also presented as tables 13.17.
A brief commentary on the individual plots is also included. Finally, composite plots
showing all three runs for comparative purposes are presented as fig. 13.42 and
13.43.

199
Fig. 13.36 Run 1 results of the 90Sr tracer advection experiments using NRVB equilibrated water
Fig. 13.37 Recovery plot run 1 of the 90Sr tracer advection experiments using NRVB equilibrated water
0.00
0.20
0.40
0.60
0.80
1.00
1.20
0
10000
20000
30000
40000
50000
60000
70000
80000
90000
100000
0 100 200 300 400
Flo
w R
ate
(g h
r-1 )
90S
r A
ctiv
ity
Co
nce
ntr
atio
n (
Bq
dm
-3)
Mass Eluted (g)
NRVB Sr-90 Advection Run 1
Flow Rate
0
10
20
30
40
50
60
70
80
90
0 100 200 300 400
90S
r R
eco
very
Mass Eluted (g)
NRVB Sr-90 Recovery Advection Run 1

200
Commentary
Initial breakthrough of the tracer occurred after approximately 50 g of NRVB
equilibrated water had eluted. This was followed by a steep rise in concentration
initially maximising at ~80000 Bq dm-3, followed by erratic results caused by a
malfunction of the sample collector (the data in this area of the plot contains real, lost
and estimated points). The next major feature was a second maximum concentration
at ~94000 Bq dm-3 followed by a steady fall in concentration and elongated tail
slowly returning to concentrations near background. The erratic flow rate was a
feature of the experiment and this occurred even though the driving pressure was
constant throughout at 21 psi. The tracer recovery plot indicates that over 85% of the 90Sr was recovered.

201
13.7.3 Run 2 90Sr tracer advection experiments with NRVB equilibrated water The results are presented separately below as eluted mass and 90Sr recovery plots
on figs. 13.38 – 13.39. The data are also presented as table 13.18. A brief
commentary on the individual plots is also included. Finally, composite plots showing
all three runs for comparative purposes are presented as fig. 13.42 and 13.43.
Fig. 13.38 Run 2 results of the 90Sr tracer advection experiments using NRVB equilibrated water
0.00
0.20
0.40
0.60
0.80
1.00
1.20
0
10000
20000
30000
40000
50000
60000
70000
80000
90000
100000
0 50 100 150 200 250
Flo
w R
ate
(g h
r-1 )
90S
r A
ctiv
ity
Co
nce
ntr
atio
n (
Bq
dm
-3)
Mass Eluted (g)
NRVB Sr-90 Advection Run 2
Flow Rate
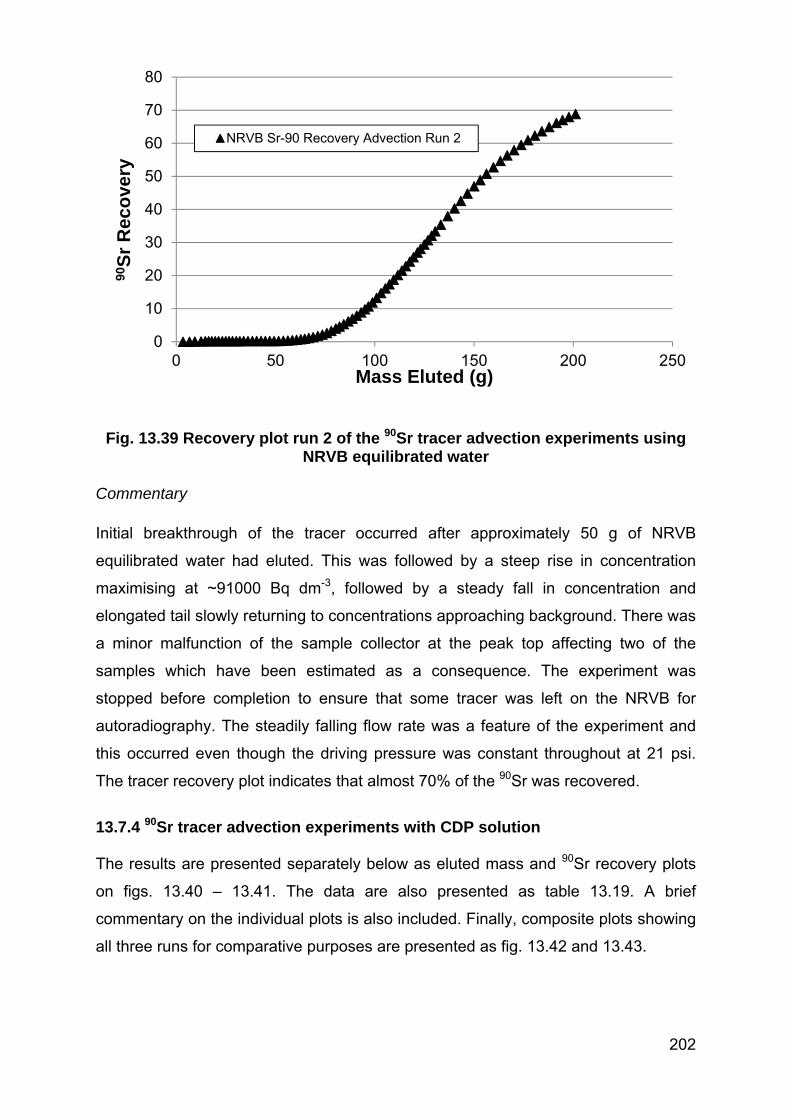
202
Fig. 13.39 Recovery plot run 2 of the 90Sr tracer advection experiments using NRVB equilibrated water
Commentary
Initial breakthrough of the tracer occurred after approximately 50 g of NRVB
equilibrated water had eluted. This was followed by a steep rise in concentration
maximising at ~91000 Bq dm-3, followed by a steady fall in concentration and
elongated tail slowly returning to concentrations approaching background. There was
a minor malfunction of the sample collector at the peak top affecting two of the
samples which have been estimated as a consequence. The experiment was
stopped before completion to ensure that some tracer was left on the NRVB for
autoradiography. The steadily falling flow rate was a feature of the experiment and
this occurred even though the driving pressure was constant throughout at 21 psi.
The tracer recovery plot indicates that almost 70% of the 90Sr was recovered.
13.7.4 90Sr tracer advection experiments with CDP solution The results are presented separately below as eluted mass and 90Sr recovery plots
on figs. 13.40 – 13.41. The data are also presented as table 13.19. A brief
commentary on the individual plots is also included. Finally, composite plots showing
all three runs for comparative purposes are presented as fig. 13.42 and 13.43.
0
10
20
30
40
50
60
70
80
0 50 100 150 200 250
90S
r R
eco
very
Mass Eluted (g)
NRVB Sr-90 Recovery Advection Run 2

203
Fig. 13.40 Results of the 90Sr tracer advection experiments using CDP solution
Fig. 13.41 Recovery plot for the 90Sr tracer advection experiments using CDP solution
0.00
0.10
0.20
0.30
0.40
0.50
0.60
0.70
0.80
0.90
0
10000
20000
30000
40000
50000
60000
70000
0 50 100 150 200 250 300
Flo
w R
ate
(g h
r-1 )
90S
r A
ctiv
ity
Co
nce
ntr
atio
n (
Bq
dm
-3)
Mass Eluted (g)
CDP Sr-90 Advection
Flow Rate
0
10
20
30
40
50
60
70
0 50 100 150 200 250 300
90S
r R
eco
very
Mass Eluted (g)
CDP Sr-90 Recovery Advection

204
Commentary
Initial breakthrough of the tracer occurred after approximately 35 g of NRVB
equilibrated water had eluted. This was followed by a steep rise in concentration
generally peaking at ~50000 Bq dm-3 but with excursions as high as 57500 Bq dm-3,
followed by a steady fall in concentration and elongated tail slowly returning to
concentrations approaching background. The experiment was stopped before
completion to ensure that some tracer was left on the NRVB for autoradiography.
The initial steady rise in flow rate was a feature of the experiment and this occurred
even though the driving pressure was constant throughout at 21 psi. The downslope
has three clear spikes that appear to correlate with short term flow rate minima. The
tracer recovery plot indicates that almost ~65% of the 90Sr was recovered.
13.7.5 Composite plots comparing the 90Sr tracer advection experiments
The composite plots figs. 13.42 and 13.43 show all the 90Sr tracer data together and
whilst initially they may appear complex, a number of important observations can be
made.
Fig. 13.42 Composite plot comparing the 90Sr tracer advection experiments
0
10000
20000
30000
40000
50000
60000
70000
80000
90000
100000
0 100 200 300 400
90S
r A
ctiv
ity
Co
nce
ntr
atio
n (
Bq
dm
-3)
Mass Eluted (g)
NRVB Sr-90 Tracer Advection Run 1
NRVB Sr-90 Tracer Advection Run 2
CDP Sr-90 Tracer Advection

205
Fig. 13.43 Composite plot comparing recovery of the 90Sr tracer during the advection experiments
Observations from composite plots
The NRVB equilibrated water runs 1 and 2 show that the experiment is
capable of providing reproducible results despite significant changes in flow
rate and equipment malfunctions.
The flat topped peaks and long tails indicate that dispersion is significant for
all the experiments but more pronounced in when CDP solution is present.
More mass appears to have been retained when CDP solution is used (this
was also the case for the diffusion experiments).
The tracer breaks through more quickly when the CDP solution is used, this
was not anticipated as increased retention should have produced a delayed
breakthrough. It should be noted that the CDP run used a different NRVB
cylinder which could have had slightly different, dimensions, hydraulic
properties and internal core verticality.
The composite recovery plot shows that the NRVB advection experiments
evolved almost identically and that tracer recovery with CDP solution was
noticeably different.
0
10
20
30
40
50
60
70
80
90
0 100 200 300 400
90S
r R
eco
very
Mass Eluted (g)
NRVB Sr-90 Recovery Advection Run 1
NRVB Sr-90 Recovery Advection Run 2
CDP Sr-90 Recovery Advection

206
Final recovery results could not be produced because of the need to leave
enough tracer on the cylinders for autoradiography. However the composite
recovery plot provided a clear indication that less tracer was recovered when
CDP was present.
13.8 Autoradiographs of the 90Sr Advection Experiments The autoradiographs from the 90Sr tracer advection experiments are presented in
unenhanced and ImageJ enhanced versions with short commentaries below. Each
experiment is represented by a pair of images one of which (the one to the right) has
the central core filled with a polythene plug to shield radiation coming from any
residual tracer that may be present. The images were produced using a Fuji BAS MP
20 cm x 25cm autoradiography image plate with an exposure duration of 5 hours.
The plate was developed at BGS, Nottingham. The cylinders were widely spaced on
the autoradiography plate and were edited to be closer together, explaining the faint
straight lines within the background. All images were enhanced at the same time
using the same methodology.
Fig. 13.44 Autoradiographs (unenhanced) from the 90Sr tracer advection experiments
90Sr tracer advection using NRVB equilibrated water
90Sr tracer advection using CDP solution
Core shielded using polythene plugs

207
Commentary
The images in the unenhanced version are not particularly informative, even the
effect of shielding the central core is not particulary clear. A few residual high
intensity spots can be seen in the central core, one of which (the upper right cylinder)
is very intense. In addition, spots can be seen on the outer edges of the CDP
solution experiments. A blank (an unused piece of NRVB cylinder) was used but was
edited out of the final image.

208
Fig. 13.45 ImageJ enhanced autoradiographs from the 90Sr tracer advection experiments
Commentary
The enhanced images have helped visualise some important features and highlight
differences between the two types of advection experiment.
NRVB equilibrated water
There is a distinct ring of 90Sr tracer activity within the NRVB matrix extending
to the outer edge.
Spots of activity are absent from the outer edge.
There is a ring of inactivity surrounding the central core.
The central core has significant residual activity present, this is particularly
evident on the upper right image where the intense activity can be clearly
seen despite the shielding (Note that this cylinder has had two active runs).
There is a possibility that the outer ring is Sr and calcite co-precipitation
caused by the ingress of atmospheric carbon dioxide similar to that observed
in the trial advections.
The outer ring of activity could also be evidence of the tracer tail being eluted.
90Sr tracer advection using NRVB equilibrated water
90Sr tracer advection using CDP solution
Core shielded using polythene plugs

209
CDP solution
More tracer is present in the NRVB matrix than seen in the NRVB equilibrated
water experiment.
The tracer is more evenly distributed although there are distinct areas where
more tracer is present, suggesting preferential flow or an artefact associated
with the tracer injection similar to that seen in the iodine CDP advection.
The experiment was stopped at an earlier stage than the NRVB equilibrated
water experiment potentially explaining the presence of more activity.
There are spots of tracer activity on the outer edge which appear to be
contiguous with the areas of possible preferential flow.
There is residual tracer activity in the central core but none of the very intense
spots seen in the central core of the NRVB equilibrated water experiment.
The ring of activity around the outer edge is present though not as extensive
as in the NRVB equilibrated water experiment.
There is a possibility that the outer ring is Sr and calcite co-precipitation
caused by the ingress of atmospheric carbon dioxide similar to that observed
in the trial advections.
13.9 GoldSim Models for Sr Advection Experiments
13.9.1 Additional information relevant to the 90Sr NRVB advection modelling
Details of the GoldSim model are fully discussed in section 7. The results from the
modelling of the 90Sr tracer advection experiments are presented as fig. 13.46 to
13.48. The advection model is still being developed; the results are presented as
GoldSim screenshots as the modelling has been only partially successful. Time is
presented on the x axis and not eluted mass because the GoldSim model was found
to produce better results against a time base for the HTO advection experiments
(see section 10.4). The statistical approach used in the diffusion modelling was not
considered appropriate with the advection data because the experimental
methodology is still in the trial stage. Partition is referred to as throughout,
primarily because this term, rather than is used in GoldSim.

210
Fig. 13.46 Results and GoldSim model for run 2 of the 90Sr tracer advection experiments using NRVB equilibrated water ( observed modelled)
Fig 13.46 above was the result of modelling: 4.4x10⁻¹¹ m s-2, 2.7 m3 kg-1 with
an initial injection of 13000 Bq 90Sr (slightly higher than the real experiments). All the
parameters were very similar to those determined in the diffusion modelling. The
GoldSim model has applied the measured experimental flow rate and 10%
mechanical dispersion. The result was not a good match; modelled breakthrough is
too early, peak concentration too early and low and dispersion too high (the peak is
flatter and wider).
However, when the same parameters are modelled against the CDP advection
results, a good match for the general shape of the peak is obtained. The result can
be seen below in fig. 13.47. The model output has more mass (effectively equal to
the area under the curves) present than the real data.
Fig. 13.47 Results and GoldSim model for the 90Sr tracer advection experiment using CDP solution ( observed modelled)
0
2.0e04
4.0e04
6.0e04
8.0e04
1.0e05
0 100 200 300
(Bq/
l)
Time (hours)
0
2.0e04
4.0e04
6.0e04
8.0e04
1.0e05
0 100 200 300 400
(Bq/
l)
Time (hours)
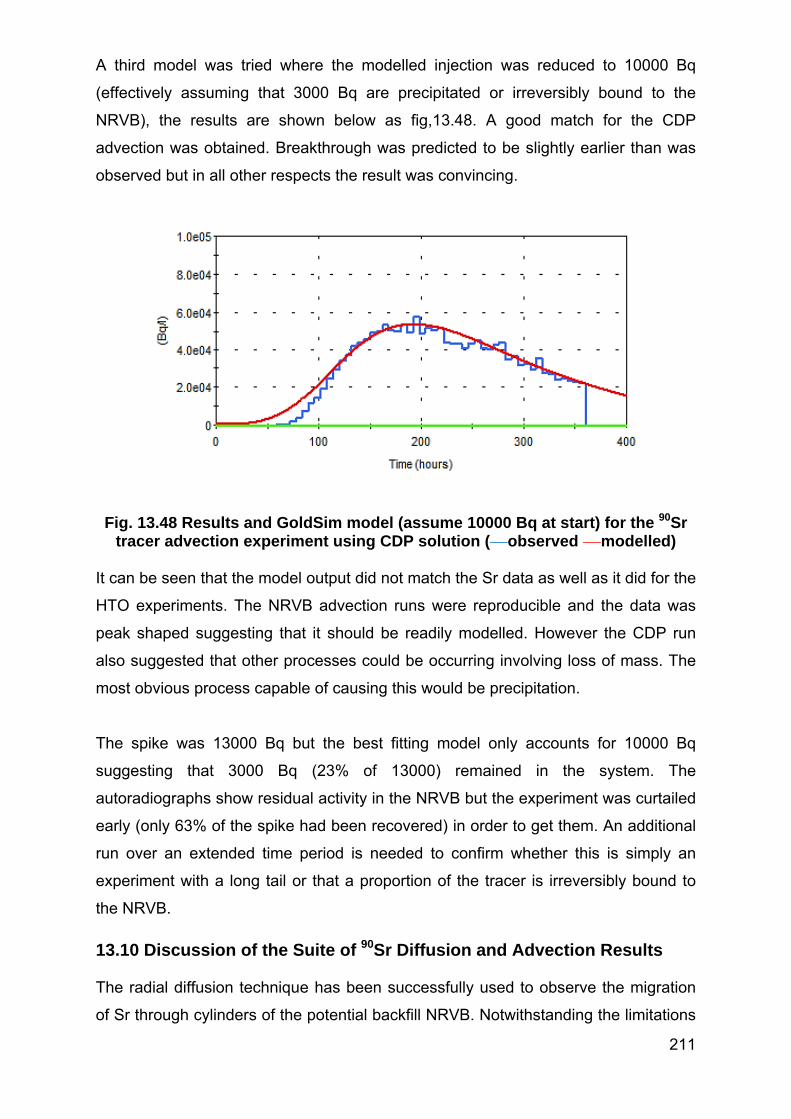
211
A third model was tried where the modelled injection was reduced to 10000 Bq
(effectively assuming that 3000 Bq are precipitated or irreversibly bound to the
NRVB), the results are shown below as fig,13.48. A good match for the CDP
advection was obtained. Breakthrough was predicted to be slightly earlier than was
observed but in all other respects the result was convincing.
Fig. 13.48 Results and GoldSim model (assume 10000 Bq at start) for the 90Sr tracer advection experiment using CDP solution ( observed modelled)
It can be seen that the model output did not match the Sr data as well as it did for the
HTO experiments. The NRVB advection runs were reproducible and the data was
peak shaped suggesting that it should be readily modelled. However the CDP run
also suggested that other processes could be occurring involving loss of mass. The
most obvious process capable of causing this would be precipitation.
The spike was 13000 Bq but the best fitting model only accounts for 10000 Bq
suggesting that 3000 Bq (23% of 13000) remained in the system. The
autoradiographs show residual activity in the NRVB but the experiment was curtailed
early (only 63% of the spike had been recovered) in order to get them. An additional
run over an extended time period is needed to confirm whether this is simply an
experiment with a long tail or that a proportion of the tracer is irreversibly bound to
the NRVB.
13.10 Discussion of the Suite of 90Sr Diffusion and Advection Results The radial diffusion technique has been successfully used to observe the migration
of Sr through cylinders of the potential backfill NRVB. Notwithstanding the limitations

212
of the GoldSim model detailed in section 7.5, determinations of and when
made, were comparable with literature values (see table 17.1).
Experiments were performed using NRVB equilibrated water and a solution of
cellulose degradation products (CDP) produced in the presence of the NRVB
components. Additional experiments were undertaken at increased ionic strength
and also in the presence of gluconate.
A study undertaken as late as 2002 167 documented dynamic experiments that were
of inadequate duration to make relevant observations and concluded that Sr was
strongly bound. In 2003 a study 64 noted that Sr mobility was not affected by the
presence of organics.
More recent batch studies have noted that Sr uptake by CSH phases in alkali free
solutions can be described in terms of Sr/Ca ion exchange with equal affinity of CSH
for Sr and Ca. However, the same study also noted the potential for irreversible
incorporation of Sr into the CSH matrix in the presence of artificial cement water
where the completion with high concentrations of Na+ and K+ ions was also
considered.168 A further study 169 extended the experiments using the radioisotope 85Sr to investigate the uptake of Sr by CSH phases and concluded that the process
was reversible. Both studies indicate that sorption models are suitable for predicting
Sr interactions with CSH in a GDF environment. The present work suggests that
sorption models may be insufficient and that a significant proportion of the Sr could
be irreversibly bound to the NRVB solid.
It is important to note that the present experiments have been undertaken on intact
samples of NRVB, a high limestone content, backfill material and that alternative
sorption and incorporation mechanisms could be occurring.
The diffusion experiments have been affected by the longer than anticipated pre-
equilibration time for Sr. Indeed this could be the reason why the gradient is
observed on the first autoradiograph (see fig.13.33) even though stable
concentrations in the receiving water had been attained i.e. non active Sr could still
be migrating within the sample as the 90Sr tracer moves out.

213
The tracer with carrier experiments in both the presence and absence of CDP were
virtually indistinguishable suggesting that the Sr concentration was more significant
than the presence of organics. The tracer only experiments did show that the
presence of CDP increased uptake.
There is very limited information in the literature relating to the interaction of the
organic substances present in CDP with CSH and the consequent effects on Sr
mobility. The present series of experiments were not designed to provide an insight
into the nature of the interaction. However, the possible mechanisms include
precipitation of low solubility organic salts, change in surface Ca to Si ratio (see
section 12.10) and formation of tertiary complexes (CSH-Sr-org or CSH-org-Sr).
The gluconate experiment was an attempt to isolate the effect of organics by using a
surrogate for CDP that did not increase the ionic strength. The experiment was not
entirely successful as it did not have time to run to completion and a significant
amount of the 90Sr tracer appeared to have precipitated in the inner core of the
NRVB cylinder.
More recently experiments have been commenced to look into the effect of changes
in ionic strength, the initial results appear to confirm that there is a decrease in
diffusivity associated with increasing ionic strength. The effect is usually attributed to
restriction of ion mobility by the electrostatic field created by other ions present in
solution (see section 5.0 for theoretical aspects and 11.10 where a similar point is
made in relation to the Cs experiments).
The advection experiments that have been completed also show that the presence
of CDP slowed the elution of Sr. The associated autoradiographs show evidence of
residual Sr in the central core and flows that may not have been as uniform as the
elution profiles suggest. However, the method could be seen as a way of providing
relevant data very quickly in comparison to the equivalent diffusion experiment.

214
14.0 Calcium
14.1 Background
The main calcium isotope of interest is 41Ca, it is a component of the UK radioactive
waste inventory and is mentioned in the latest estimate at 01/04/2010, 26 and table
14.1 below reproduces the relevant activities.
Isotope HLW ILW LLW units 41Ca 1.2x10⁻¹ 3.6 1.1x10⁻³ T Bq
Table 14.1 41Ca in the UK waste inventory at 01/04/2010
The activities in the table above may not appear significant but 41Ca is a long lived
isotope (half-life, 103000 years). It arises from the neutron activation of calcium
present in the concrete structures of nuclear reactors. It is important to understand
the mechanism and rate of migration of radioactive calcium in the geological disposal
facility (GDF) environment where the non-active calcium concentration may be very
high due to the use of cementitious media in packaging grouts and backfill.147
41Ca is a potential hazard to humans as it can replace non-active calcium in the solid
tissues of the body preventing effective excretion. After entering the body, most
often by ingestion of contaminated food or water, 20 – 30% of the dose may be
absorbed and deposited in bones, bone marrow, teeth etc. Its presence in bones
can cause bone cancer, cancer of nearby tissues, and leukaemia.
41Ca decays by electron capture to the ground state isotope 41K.
→ ̅ There are no gamma emissions associated with this transition but the subsequent
rearrangement of electrons gives rise to x-ray and auger electron emissions.158
The weak emissions associated with 41Ca make it unsuitable for use in the diffusion
and advection experiments and consequently 45Ca, (half-life, 163 days) has been
used as a surrogate. 45Ca decays by beta electron emission with a maximum energy
of 0.25 MeV and an average energy of 0.075 MeV, to the ground state isotope 45Sc,
according to the equation below.158

215
→ ̅
The specific activity of 45Ca is 7.03x10¹⁴ Bq g-1, it is readily and efficiently detected
and determined by liquid scintillation counting.
The Sr experiments provided an indication that experimental timescales for the
diffusion experiments would be in the range of months to years. Previous work,
suggested that diffusion constrained by isotope exchange with Ca containing gel
phases would be the main transport mechanism.169 Clearly, the short half-live of the
isotope becomes an issue as experimental duration increases.
The experiments undertaken were as follows:
Diffusion with NRVB equilibrated water using 45Ca tracer
Advection with NRVB equilibrated water and CDP solution using 45Ca tracer
only.
Autoradiographs for the diffusion and advection experiments have been produced.
The advection experiments were undertaken after the initial results from the diffusion
experiments had been seen and the objective was to ascertain whether it was
possible to obtain relevant information more quickly.
14.2 45Ca tracer Diffusion using NRVB equilibrated water
The diffusion experiment used an addition of 9000 Bq 45Ca (produced as the chloride
by Perkin Elmer) to duplicate NRVB cylinders. For safety and convenience the
addition was not carried out in the nitrogen glove box. The cylinders were
submerged in 200 cm3 of NRVB equilibrated water and sampled weekly for 4 weeks
and monthly thereafter. When one year had elapsed and no tracer had been
detected in the external solution it was decided that one of the duplicate experiments
should be stopped and the cylinder sectioned for autoradiography. The main reason
was that over two half-lives had occurred, only 1914 Bq of the original addition
remained and it was not known how much activity was required to produce a useable
autoradiograph.

216
14.3 Autoradiographs from the 45Ca NRVB Tracer Diffusion
The two autoradiographs in figs. 14.1 to 14.4 below were produced using a Fuji BAS
MP 20 cm x 25cm autoradiography image plate with an exposure duration of 5 days.
The plate was developed at BGS, Nottingham. The enhancement and intensity plots
were undertaken using ImageJ software. A polythene plug was used to shield
radiation from the central core to provide a better visualisation of the migrating
isotope. Shielded and unshielded images are presented.
Fig. 14.1 Unenhanced autoradiographs from the 45Ca diffusion experiment using NRVB equilibrated water (a) shielded, (b) unshielded
The unenhanced images are difficult to interpret although the shielding did enable
the migrating tracer to be seen. Note: (a) and (b) are the same sample of NRVB
which can be seen from the hotspots i.e. rotate (a) to the right and the hotspots will
match. Some hotspots matched visible inclusions and voids in the original samples
but not all.
Fig. 14.2 ImageJ enhanced autoradiographs from the 45Ca diffusion experiment using NRVB equilibrated water (a) shielded, (b) unshielded
(a) (b)
(a) (b)

217
The enhanced images clearly show that 45Ca has migrated into the NRVB matrix; it
is also evident that a significant proportion of the tracer remained in the central core.
The migration profile appeared uniform with a similar depth of penetration from the
perimeter of the central core. The two images are not directly comparable as they
have been adjusted separately and differently to improve the visualisation. The
contrast was increased for image (a) to emphasise the activity in the NRVB matrix
and decreased for image (b) to reduce the “flare” from the central core. The different
treatments are evidenced as a clear difference between the backgrounds.
ImageJ also has a function enabling the relative intensity of the radioactivity to be
plotted graphically. Figs. 14.3 and 14.4 show the results of using the function on the
autoradiographs. It was originally hoped that it would be possible to attribute the start
concentration to the edge of the central core and estimate diffusivity. This was not
feasible because a significant proportion of the activity is present, presumably
precipitated on the walls of the central core and there is a steep fall in activity to the
level observed in the NRVB matrix. This can be seen on fig. 14.4 where the central
core is unshielded.
The two images have been subject to a high contrast increase to produce the
intensity plots and as a consequence they are not directly comparable. A further
consequence is that the hotspot signals have been overwhelmed on the shielded
image fig. 14.3.

218
Fig. 14.3 ImageJ enhanced (shielded) autoradiograph and intensity plot from the 45Ca diffusion experiment using NRVB equilibrated water
Inferred edge of NRVB cylinder
Central core plugged
Area sampled for the intensity plot

219
Fig. 14.4 ImageJ enhanced (unshielded) autoradiograph and intensity plot from the 45Ca diffusion experiment using NRVB equilibrated water
The usefulness and flexibility of the autoradiography technique is demonstrated by
the images in figs. 14.2 – 14.4. The experiment provided clear evidence that Ca
isotopes will migrate through cementitious media even with a very low tracer
concentration gradient (the mass of 45Ca added was ~13 pg). Unfortunately it has
not been possible to use the data in a quantitative manner to ascertain whether
isotope exchange was a factor. This is due to the difficulty of making an estimate the
proportion of the 45Ca that has remained in the central core. In addition, the
experiment was somewhat compromised by the time taken for it to progress. Indeed
the remaining duplicate has not yet (some 2 years after commencement) shown
evidence of 45Ca breakthrough. It is now certain that the rate of decay compared to
migration rate means that breakthrough will not occur. It is important to note that the
Ca isotope of concern for the security of a GDF is 41Ca which has a very long half-life
and its migration will not be reduced by radioactive decay in the same way as 45Ca.
Area sampled for the intensity plot
Inferred edge of NRVB cylinder
Central core unplugged

220
14.4 45Ca Tracer Advection with NRVB Equilibrated Water and CDP Solution
The diffusion experiments were not carried out in the presence of CDP, primarily
because there was no requirement from either NDA or the SKIN project. However,
the advection experiments undertaken on HTO, Cs, Sr and Ni (see section 15)
suggested that it may be possible to acquire some comparative data on the effect of
CDP on Ca migration relatively quickly. Consequently both experiments were
scheduled and undertaken.
14.4.1 45Ca tracer advection using NRVB equilibrated water The experimental procedure, including a 3 day “run in” for the NRVB cylinder was
identical to that used in the HTO advection experiments (see section 10). The only
exception being that the initial injection volume was 50 µL. The injection contained
6700 Bq or 402000 d min-1 of 45Ca. The experiment ran for 49 days after which time
radioactive decay meant that 5450 Bq or 327000 d min-1 remained in the system. All
the eluent was collected and analysed for 45Ca. The evaporation of the eluted mass
was corrected for by comparison with a weighed water blank left in the sample
collector for the duration of the experiment. All 45Ca determinations were performed
by liquid scintillation counting 170 using Goldstar multi-purpose liquid scintillation
cocktail and a Packard 2100TR liquid scintillation counter.
The experiment ran without significant problems but there was still some difficulty
maintaining a steady driving pressure and flow rate.
The results are presented separately as eluted mass and 45Ca recovery plots on figs.
14.5 and 14.6, the data are presented as table 14.2 in appendix 1. A brief
commentary on the individual plots is also included.

221
Fig. 14.5 Results of the 45Ca tracer advection experiments using NRVB equilibrated water
Fig. 14.6 Recovery plot the 45Ca tracer advection experiments using NRVB equilibrated water
0.0
0.5
1.0
1.5
2.0
2.5
3.0
3.5
0
500
1000
1500
2000
2500
0 500 1000 1500 2000
Flo
w R
ate
(g h
r-1 )
45C
a A
ctiv
ity
Co
nce
ntr
atio
n (
Bq
dm
-3)
Mass Eluted (g)
NRVB Ca-45 Advection
Flow Rate
0.00
5.00
10.00
15.00
20.00
25.00
30.00
0 500 1000 1500 2000
45C
a %
Rec
ove
ry
Mass Eluted (g)
NRVB Ca-45 Advection Recovery

222
Commentary
Initial breakthrough of the tracer occurred after approximately 500 g of NRVB
equilibrated water had eluted. This was followed by a steep rise in concentration
initially maximising at ~2200 Bq dm-3, followed by an erratic, general decrease in
concentration with second maximum of 1900 Bq dm-3 at 1600 g eluted. The eluted
volumes prior to breakthrough were over 10 times higher than the equivalent
experiment using 90Sr tracer (see section 13.6.1) and over 50 times higher than the
equivalent HTO experiment (see section 10.4.1) undertaken in this research. The
overall impression is one of steep and steady rise in concentration followed by a
much gentler decrease and elongated tail slowly returning to concentrations near
background. The experiment was stopped early to leave enough activity in the NRVB
to produce an autoradiograph. The recovery plot, which was produced using the
lower decayed inventory, estimated at the end of the experiment, shows that more
than 70% of the tracer should have remained in the NRVB matrix. The NRVB
cylinder was removed from the cell dried and sectioned for autoradiography.
The high and erratic flow rate was a feature of the experiment and this occurred
even though the driving pressure was constant throughout at 40-42 psi. The higher
flow rate (2 - 3 g hr-1) was used because the diffusion experiments indicated that
movement of the tracer through the NRVB would be slower than the other elements
under investigation.
14.4.2 45Ca tracer advection using CDP solution The experimental procedure, including a 3 day “run in” for the NRVB cylinder was
identical to that used in 14.2.1 above. The only exception being that the initial
injection volume was 90 µL because 136 days had elapsed since the previous 45Ca
tracer advection experiment and the same tracer stock solution was used. Thus the
injection contained ~6700 Bq or ~402000 d min-1 of 45Ca. The experiment ran until
~1500 g of CDP solution had been eluted. The evaporation of the eluted mass was
corrected for by comparison with a weighed water blank left in the sample collector
for the duration of the experiment. All the eluent was collected and analysed for 45Ca.
No 45Ca tracer was found in any of the samples. The experiment was stopped at
approximately 1500 g of CDP solution eluted, which was the point where the
maximum concentrations of 45Ca were being eluted during the equivalent NRVB
equilibrated water advection. The flow rates recorded throughout the experiment are

223
presented on fig 14.7. It was not possible to maintain a steady flow rate or driving
pressure. The experiment started with a stable flow rate of ~1 g hr-1, but the pressure
was increased from 32 to 40 psi increase flow, this worked initially but the flow rate
soon started to fall again. The pressure was increased again on two further
occasions (at ~550 g and 1100 g) to a final reading of 50 psi, where concern about
possible fracturing of the NRVB cylinder prevented further progress. The NRVB
cylinder was removed from the cell dried and sectioned for autoradiography.
Fig 14.7 Flow rates recorded during the 45Ca tracer advection experiments using CDP solution
14.5 Autoradiographs from the 45Ca NRVB Tracer Advection Experiments
The two autoradiographs in figs. 14.8 to 14.9 below were produced using Fuji BAS
MP 20 cm x 25cm autoradiography image plates with an exposure duration of 5
days. The plates were developed at BGS, Nottingham. The enhancements and
intensity plots were produced using ImageJ software. Unenhanced images have not
been presented. Modelling clay was used to shield radiation from the central core to
provide a better visualisation of the migrating isotope. Shielded and unshielded
images are presented for the experiment with CDP solution.
0
0.2
0.4
0.6
0.8
1
1.2
1.4
1.6
1.8
0 500 1000 1500
Flo
w R
ate
(g h
r-1 )
Mass Eluted (g)
CDP Advection Flow Rate

224
Fig. 14.8 Enhanced autoradiograph from the 45Ca tracer advection experiment using NRVB equilibrated water
Fig. 14.9 Enhanced autoradiographs with central core (a) unshielded and (b) shielded from the 45Ca tracer advection experiment using CDP solution
Commentary
The enhanced autoradiograph in figs.14.8 shows a residual amount of the tracer in
the central core, the experimental data suggested that the residual amount could be
as high as 70% of the original inventory injected (after decay correction). It is not
clear why there is so little evidence of the tracer in the main body of the NRVB
cylinder, or why it “sticks” to the central core and not anywhere else. It can also be
implied that this is occurring to all of the Ca present in the advecting solution. A
similar phenomenon was observed in the NRVB equilibrated water diffusion
Inferred edge of NRVB cylinder
Inferred edge of central core
Inferred edge of central core
Modelling clay shielding central core
Inferred edge of NRVB cylinder
225
experiments (see section 14.3) where the autoradiograph shows deposition of a
significant proportion of the 45Ca addition on the side walls of the central core.
The tracer must have been advected through the cylinder to reach the sample
collector and as there is no evidence of leakage around the sides, the images
suggest that the inner surface of the central core behaved differently to the main
body of the NRVB. In addition the tracer was also only present in the lower part of
the central core similar to the finding in the iodine advection experiment (see section
12.9).
The autoradiographs from the CDP solution advection experiment shown in fig. 14.9
are in line with expectations from the experimental results which showed that none of
the tracer was eluted from the NRVB cylinder. It is clear from the images that the
tracer is moving from the central core and this is more apparent when the central
core is shielded with modelling clay. The concentration gradient is visible and there
is still a significant signal from the central core where tracer distribution appears to
be homogeneous. There is no indication of how much tracer would finally be left in
the central core were the experiment to have been extended.
It was noted that the analytical data acquired during “the run in” period showed that
sulphate was removed from the eluent. The influent sulphate concentration was
5.14x10⁻³ mol dm-3 and the effluent concentration was 1.7x10⁻⁴ mol dm-3.(see table
9.2 in section 9.2). The possibility of gypsum (CaSO4.2H2O) precipitation was
examined briefly using the Chess code and user interface JChess.171 This suggested
that gypsum would not form and that portlandite and the sulphate containing mineral,
ettringite (Ca6Al2(SO4)3(OH)12·26H2O) were likely to precipitate and subsequently
redissolve. However, ettringite is known to form in the OPC system as a result of the
presence and reaction of calcium sulphate and calcium aluminate. 34 This suggests
that the JChess equilibrium model was not suitable. Indeed the JChess model was
used originally only as an indicator of possible outcomes and was not pursued
further as advective systems are clearly not at equilibrium.
The precipitation of organic salts also remains a possibility. If precipitation in the
NRVB was occurring a steady fall in flow rate could be anticipated as porosity was
filled with the precipitate. This may have been why it was necessary to keep
increasing pressure to maintain the flow rate in the CDP advection experiment. In
contrast, a steady rise in flow rate was observed throughout the NRVB equilibrated

226
water advection experiment suggesting that the organic material in the CDP solution
was responsible the precipitation.
These advection experiments have started to provide information on the behaviour
and fate of Ca isotopes in Ca rich systems. It is clear that more focussed versions of
the experiments are required. In particular the advection experiments with CDP
solution need to be run over a much longer duration or to the point where a flow
cannot be sustained. This should ensure that sufficient precipitate is present to be
able to examine it under the SEM and determine the morphology and composition.

227
15.0 Nickel
15.1 Background
The main nickel isotopes of interest are 59Ni and 63Ni. They are components of the
UK radioactive waste inventory and are mentioned in the latest estimate at
01/04/2010, 26 table 15.1 below reproduces the relevant activities.
Isotope HLW ILW LLW units 59Ni 3.0 5.2x10³ 5.7x10⁻³ T Bq 63Ni 3.4x10² 5.6x10⁵ 7.9x10⁻¹ T Bq
Table 15.1 59Ni and 63Ni in the UK waste inventory at 01/04/2010
The activities in the table above are significant; 59Ni is a long lived isotope (half-life,
~76000 years) and will persist in the inventory into the long term. 63Ni is relatively
short lived (half-life, ~100 years) but a large amount is present in the inventory. Were
its presence in the environment around a GDF to be detected it would be diagnostic
of an early containment failure. 147
59Ni and 63Ni are present nuclear industry waste as part of the steel and other alloys
used in the fuel and plant hardware. 63Ni is initially more prevalent than 59Ni.
When 235U fissions it can split asymmetrically into two large fragments with mass
numbers between 90 and 140 these fissions also emit neutrons. The neutrons can
cause additional fissions to sustain the chain reaction in the reactor, escape from the
reactor, or irradiate nearby materials. Reactor components are constructed from a
variety of alloys and steels that contain chromium, manganese, nickel, iron, and
cobalt. When the most abundant isotopes of Ni (58Ni and 62Ni) absorb these neutrons
the radioisotopes 59Ni and 63Ni are formed along with a range of activation
products.158
59Ni decays by electron capture to the ground state isotope 59Co.
→ ̅ There are no gamma emissions associated with this transition but the subsequent
rearrangement of electrons gives rise to x-ray and auger electron emissions. There
is also a low probability (10-8) positron emission.

228
→ The weak emissions associated with 59Ni make it unsuitable for use in the diffusion
and advection experiments and consequently 63Ni has been used. 63Ni decays by
beta electron emission with a maximum energy of 0.67 MeV and an average energy
of 0.17 MeV to the ground state isotope 63Cu, according to the equation below.
→ ̅
The specific activity of 63Ni is 2.1x10¹² Bq g-1, it is readily and efficiently detected and
determined by liquid scintillation counting.158
Ni is known to precipitate at high pH and it was anticipated that experimental
timescales for the diffusion experiments would be in the range of months to years.
If it enters the body 63Ni presents a health hazard from the emitted beta particles.
The main health concern is the increased likelihood of cancer with the large bowel
being the primary target organ.
Ni has some unusual chemical properties including its ability to form square planar
complexes in aqueous solutions.172 It is present in the raw materials for producing
grouts and concretes, it is more mobile than Am, U and Th and less mobile than Cs
and I in high pH environments where it precipitates as the very low solubility Ni(OH)2
salt.
Ni also exhibits chemical toxicity. The most common effect is an allergic reaction of
the skin often caused by the presence of Ni in jewellery. There are recognised
occupational issues for Ni workers that include asthma, skin lesions and
gastrointestinal disorders. 173
The experiments undertaken were as follows:
Diffusion with NRVB equilibrated water using 63Ni tracer and NiCl2 carrier.
Diffusion with CDP solution with 63Ni tracer and NiCl2 carrier.
Advection with CDP solution using 63Ni tracer only.

229
Solubility experiments were also undertaken as part of the chemical containment
demonstration project and these indicated that Ni solubility could increase by almost
two orders of magnitude in the presence of CDP solution (from 7x10⁻⁷ to 4x10⁻⁴ mol
dm-3).134 As noted previously the elevated temperature used in the manufacture of
the CDP solution is likely to be at least in part responsible for the higher
concentrations of many species observed including Ni. However, the increase in
concentration of Ni was particularly marked implying that mobility could be
significantly enhanced in the presence of CDP.
15.2 63Ni Diffusion Experiments
15.2.1 Additional information for the 63Ni diffusion experiments
The NRVB equilibrated water and CDP solution 63Ni diffusion experiments were set
up with a I cm3 deionised water addition containing 300200 Bq of 63Ni and NiCl2.6H20
equivalent to 7.3x10⁻⁴ g of Ni (i.e. 1Bq 63Ni counted is equal to 2.4x10⁻⁹ g of non
active Ni, assuming the mass of 63Ni added to be insignificant). The NRVB cylinders
were topped up with the respective solutions, sealed and submerged in the same
manner detailed in previous sections. Deionised water was used to minimise the
possibility of precipitation in the tubes used to prepare the addition.
15.2.2 Results for the diffusion of 63Ni tracer with NiCl2 carrier using NRVB equilibrated water
The duplicate experiments have been running for 2 years and no migration of Ni
from the blocks into the surrounding solution has been observed.
The decision was taken to stop one of the duplicate experiments at 2 years to
investigate and potentially produce an autoradiograph.
When the seal was broken the liquid along with any free solid material inside the
central core was collected and counted for 63Ni after acidification with hydrochloric
acid to dissolve the solid. Over 80% of the initial addition was present. Unfortunately
it was not possible to determine how much was present in the liquid and solid
separately. This can be addressed when the second duplicate is opened and
analysed.

230
The cylinder was sectioned using a masonry saw and an autoradiograph produced
which is shown below adjacent to a photograph, as fig. 15.1.
Fig. 15.1 Photograph and autoradiograph of Ni diffusion using NRVB equilibrated water
It is clear from the images in fig. 15.1 that no migration of Ni into the NRVB matrix
has occurred during the 2 year period. The edge of the inner core is sharply defined
and mirrors the outline seen on the photograph of the same cylinder.
15.2.3 Results for the diffusion of 63Ni tracer with NiCl2 carrier using CDP solution The results of the 63Ni tracer with NiCl2 carrier are presented below as figs. 15.2 and
15.3; the data is also presented as table 15.2 in appendix 1. The early data plot has
not been presented as the early data are clear. The divergence in the duplicate
experiments also necessitated presenting both datasets instead of the average with
error bars. A brief commentary on the results is also provided.

231
Fig. 15.2 Results for the diffusion of 63Ni tracer with NiCl2 carrier using CDP solution
Fig. 15.3 Relative retention plot for the diffusion of 63Ni tracer with NiCl2 carrier using CDP solution
0
10000
20000
30000
40000
50000
60000
70000
0 100 200 300 400
63N
i Act
ivit
y C
on
cen
trat
ion
(B
q d
m-3
)
Time (days)
CDP Diffusion Ni-63 Tracer + NiCl2 Carrier (1)
CDP Diffusion Ni-63 Tracer + NiCl2 Carrier (2)
0.000
0.005
0.010
0.015
0.020
0.025
0.030
0.035
0.040
0.045
0 100 200 300 400
63N
i Rel
ativ
e R
eten
tio
n (
C/C
max
)
Time (days)
CDP Diffusion Ni-63 Tracer + NiCl2 Carrier (1)
CDP Diffusion Ni-63 Tracer + NiCl2 Carrier (2)

232
Commentary
Breakthrough of 63Ni commenced at approximately 29 days, followed by a linear
increase in concentration continuing to the current position of 455 days, this is clearly
shown on fig 15.3. The divergence of the results from the duplicate experiments is
marked and has not been observed to the same extent in any off the previous
experiments (the gradient ionic strength Sr experiment may be an exception). The
relative retention plot (where initially Cmax = 80060 d min-1) indicates that ~95% of the
tracer was retained on the NRVB cylinder i.e. less than 5% of the tracer was in
solution. This suggests that the experiment is continuing to develop and
consequently neither duplicate has been sacrificed to produce an autoradiograph.
The effect of the steadily increasing Cmax value is present but not obvious.
15.3 Ni in the Mixed Element Diffusion Experiments
15.3.1 Additional information relevant to the mixed element diffusion experiments The mixed element diffusion experiments were set up to investigate the effect on the
diffusion rates of Cs, I, U, Th. Eu and Ni when all were present. The experiments,
eleven of each type (NRVB equilibrated water and CDP solution) were the first to be
undertaken using the radial approach. Sufficient CsNO3 and KI were added to
produce a 10-3 mol dm-3 solution in the event of complete equilibration. In addition
precipitates from a neutralised solution containing UO2(NO3)2.6H2O, Th(NO3)4.4H2O,
EuCl3.6H2O and NiCl2.6H2O were mixed with the Cs and I solutions to produce a
slurry which was added to the central cores of the NRVB cylinders. The NRVB
cylinders used for the CDP experiments were equilibrated in a CDP solution for 30
days prior to commencement. The Ni determinations were performed by ICP-MS.
The Ni data from the eleven replicates of the NRVB equilibrated water and CDP
solution diffusion experiments are reproduced below as figs. 15.4 and 15.5.

233
Fig. 15.4 Ni Raw data for the mixed element diffusion experiments in NRVB equilibrated water 134
Fig. 15.5 Ni raw data for the mixed element diffusion experiments in CDP solution 134
Commentary
The behaviour seen in the NRVB equilibrated water mixed element diffusion
experiment has been the same as the corresponding single element 63Ni tracer
experiment i.e. there is no evidence of migration of Ni through the NRVB cylinder.
However there is a contrast between the single and mixed element experiments in
CDP solution. The mixed element Ni results show a clear decrease in concentration
with time, suggesting that Ni is migrating back into the NRVB cylinder or potentially
0.0E+00
2.0E-07
4.0E-07
6.0E-07
8.0E-07
1.0E-06
1.2E-06
1.4E-06
0 100 200 300 400 500 600 700
Ni c
on
cen
trat
ion
(m
ol
dm
-3)
Time (days)
2y-1
2y-2
3y-1
3y-2
4y-1
4y-2
4y-3
spare-1
spare-2
0.0E+00
5.0E-07
1.0E-06
1.5E-06
2.0E-06
2.5E-06
3.0E-06
3.5E-06
4.0E-06
0 200 400 600 800
Ni c
on
cen
trat
ion
(m
ol
dm
-3)
Time (days)
2y-1
2y-2
3y-1
3y-2
4y-1
4y-2
4y-3
spare-1
spare-2

234
precipitating on the outside surface. The Ni concentration in the multi element CDP
diffusion experiment does not approach 4x10⁻⁴ mol dm-3 which was seen in the
solubility experiments. The pre-equilibration time was only 30 days and so it is
possible that the cylinders had not stabilised prior to the start of the experiment.
However, the start concentration is in the range seen in CDP solutions at ~3x10⁻⁶
mol dm-3 or ~0.18 ppm, (see table 9.1 for further information). The Ni concentrations
reach a low of ~5.0x10⁻⁷ mol dm-3 and then appear to begin rising again. There is no
evidence of the steady linear rise in concentration seen in the corresponding single
element CDP diffusion experiment.
As mentioned previously it is important to be aware that these experiments were
very early attempts at the technique and modifications have been on-going, in
particular handling time outside the glove box and dosing of the central cores have
been speeded up and subject to more control. The slurry placed in the central core
has not been fully characterised but it is a complex mixture of salts that could be
affecting precipitation, solubility and subsequent migration.
15.4 63Ni Tracer Advection with CDP Solution
The single element diffusion experiment that was carried out in the presence of CDP,
suggested that it may be possible to acquire data on the effect of CDP on Ni
migration relatively quickly from an advection experiment.
15.4.1 63Ni tracer advection using NRVB equilibrated water The experimental procedure, including a 3 day “run in” for the NRVB cylinder was
identical to that used in the HTO advection experiments (see section 10.4). The only
exception being that the initial injection volume was 100 µL. The injection contained
20000 Bq or 1200000 d min-1 of 63Ni. All the eluent was collected and analysed for 63Ni. The evaporation of the eluted mass was corrected for by comparison with a
weighed water blank left in the sample collector for the duration of the experiment.
All 63Ni determinations were performed by liquid scintillation counting using Goldstar
multi-purpose liquid scintillation cocktail and a Packard 2100TR liquid scintillation
counter
The experiment was successful but maintaining a steady driving pressure and flow
rate remained issues.

235
The results are presented separately as eluted mass and 63Ni recovery plots on figs.
15.6 and 15.7 and the data are presented as table 15.4 in appendix 1. A brief
commentary on the individual plots is also included.
Fig. 15.6 Results of the 63Ni tracer advection experiments using CDP solution
0.00
0.20
0.40
0.60
0.80
1.00
1.20
0
50000
100000
150000
200000
250000
300000
0 50 100 150 200 250 300
Flo
w R
ate
(g h
r-1 )
63N
i Act
ivit
y C
on
cen
trat
ion
(B
q d
m-3
)
Mass Eluted (g)
CDP+ Ni-63 Tracer Advection
Flow Rate

236
Fig. 15.7 Recovery plot for the 63Ni tracer advection experiments using CDP solution
Commentary
Initial breakthrough of the tracer occurred after approximately 18 g of CDP solution
had eluted. This was followed by a steep rise in concentration peaking at ~260000
Bq dm-3, followed by a steady fall in concentration and elongated tail slowly returning
to concentrations approaching background. The elution profile is very similar to the
one observed for HTO. The steady almost cyclical fall in flow rate throughout was a
feature of the experiment and this occurred even though the driving pressure was
kept constant at 21 psi. There is a short discontinuity at ~200g eluted that
corresponds with a refilling of the eluent reservoir. The tracer recovery plot indicates
that almost ~95% of the 63Ni was recovered. The NRVB cylinder was not recovered
for autoradiography because the very rapid elution of the tracer caused suspicion
that the system had failed in some way. Consequently the system was checked by
using a 90Sr tracer injection onto the same NRVB cylinder. The system was found to
be functioning correctly.
15.5 Discussion of the Suite of 63Ni Experiments The 63Ni experiments have demonstrated that the increase in solubility of Ni
observed in the presence of CDP translates into an increase in mobility in the
diffusion experiments. The effect is very noticeable when compared to the equivalent
0
10
20
30
40
50
60
70
80
90
100
0 50 100 150 200 250 300
63N
i % R
eco
very
Mass Eluted (g)
NRVB Ni-63 Recovery Advection

237
experiment in the absence of CDP. This has the potential to affect the security of
GDFs accepting cellulose containing waste.
There is a suggestion that the migration of Ni is controlled solely by solubility, this is
supported by a previous study 174 and the tracer only (i.e. very low concentration)
advection in the presence of CDP which generates results similar to HTO. Other
studies 175 176 note the presence of a Ni-Al layered double hydroxide (LDH) phase
which continues to form (provided an Al source is available) consuming Ni(OH)2 as
hydration proceeds. The production of this Ni-Al LDH phase could be a factor in the
lack of Ni mobility seen in the diffusion experiments without CDP. Alternatively, it
could be interpreted as the CDP hindering the production of the Ni-Al LDH phase
and not a simple increase in solubility due to complexation. It should be noted that
the concentration of Ni used in the published work is much higher (5000 ppm) than
that used in the present work and consequently the comparison may not be
appropriate.
The diffusion experiments with CDP solution will need to run to completion (or at
least stability) and the autoradiographs produced before any further experiments with
a range of Ni concentrations, can be scoped.

238
16.0 Ongoing Experiments
There are a number of diffusion experiments underway that have yet to show any
evidence of migration of the isotope into the external solution. The majority of these
experiments have been running over 2 years and consequently can be interpreted as
positive results in terms of chemical containment.
The experiments are listed in table 16.1 below:
ElementCement Matrix
Organic
241Am NRVB
241Am 3:1
PFA:OPC 152Eu NRVB 152Eu NRVB CDP 152Eu
3:1 PFA:OPC
U NRVB U NRVB CDP Th NRVB Th NRVB CDP
90Sr 3:1
PFA:OPC 45Ca
3:1 PFA:OPC
Table 16.1 Ongoing diffusion experiments
A significant proportion of the experiments already described in sections 10 – 15
remain ongoing although many are now only single samples because one of the
duplicates has been sacrificed for autoradiography.
In addtion, diffusion experiments with 75Se (half-life 120 days 158) have also been
started. The Se experiments and indeed the 45Ca; 3:1 PFA:OPC ones will not be
able to progress into the long term due to the relatively short half-lives.
The PFA containing grout is interesting because it appears to be containing the
divalent ions Sr and Ca which were found to be mobile in the NRVB experiments.
There is a need to undertake Cs and I diffusion experiments on the PFA grout.
Table 16.1 provides some evidence that the higher valency elements are contained
more effectively.

239
17.0 Conclusions
This research has demonstrated that relatively simple radial diffusion and advection
techniques can be used to gather good quaity data relevant to the understanding of
the mobility and migration potential of a series of radionuclides.
Radial techniques are unusual in the relevant literature but they have proven to be
robust and reproducible in this research. The diffusion results in particular have been
very good. The radial geometry allowed the use of a simple 1D GoldSim transport
model that successfully produced diffusivities and partition coefficients comparable
with literature values (see table 17.1).
Species Reference (m2 s-1) (m3 kg-1)
HTO This work 0.75×10⁻¹⁰ 0.2x10⁻³ (advective flow) Tits et al. (2003) (2.88 - 3.00)×10-10 (0.808-0.817)×10-3 Bucur et al. (2010) 2.2×10⁻¹¹; 4.2×10⁻¹¹
Nirex (1994) 3.7-4.8x10⁻¹⁰
Cs
This work
No-CDP-tracer 2.0×10⁻¹⁰ (1.3 - 2.8)×10-10 2.3×10⁻³ (2.0 - 3.0)×10-3 No-CDP-carrier 0.9×10⁻¹⁰ (0.7 - 1.2)×10-10 0.2×10⁻³ (0.1 - 0.3)×10-3 CDP-tracer 2.8×10⁻¹⁰ (2.3 - 3.8)×10-10 0.7×10⁻³ (0.3 - 1.0)×10-3 CDP-carrier 1.1×10⁻¹⁰ (0.7 - 1.2)×10-10 0.2×10⁻³ (0 - 0.3)×10-3
Nirex (1994) 1.0x10⁻¹⁰ Andersson et al.(1981) 1.7×10⁻¹⁴ – 8.1×10⁻¹⁴ Atkinson and Nickerson (1984) 1.8×10⁻¹⁵ - 6.0×10⁻¹¹ Johnston and Wilmot (1992) 2.6×10⁻¹³ – 1.1×10⁻¹² Sarott et al. (1992) 1.4×10⁻¹⁰ - 1.9×10⁻¹⁰; 5×10⁻³; 6×10⁻³ Jakob et al. (1999) 11.2×10⁻¹¹ 15.7×10⁻¹¹ 0.61×10⁻³; 0.84×10⁻³ El-Kamash et al. (2002) 5.4×10⁻⁸ – 4.6×10⁻⁷ - Plecas (2003) 9.3×10⁻¹⁵ – 1×10-13 1.7×10⁻³ – 18.3×10⁻³ Bucur et al. (2010) 2.16×10⁻¹⁴ 1.8×10⁻¹² 4.8×10⁻³ 9.6×10⁻³
I
This work No-CDP-carrier 2.5×10⁻¹⁰ (1.8 - 3.3)×10-10 3.4×10⁻³ (3.2 - 3.8)×10-3 CDP-carrier 3.8×10⁻¹⁰ (2.6 - 4.0)×10-10 1.7×10⁻³ (1.6 - 1.9)×10-3
Nirex (1994) 2.6x10⁻¹⁰ Andersson et al.(1981) 10-14 Atkinson and Nickerson (1984) 1.6×10⁻¹⁰- 2.5×10⁻¹³ Sarott et al. (1992) 2.2×10⁻¹¹ - 3.0×10⁻¹¹ Jakob et al. (1999) (2.22 ± 0.06)×10-11 1×10⁻³
Sr
This work
No-CDP-tracer 4.4×10⁻¹¹ (3.5 - 5.4)×10-10 3.0×10⁻³ (2.8 - 3.1)×10-3 No-CDP-carrier 4.7×10⁻¹⁰ (3.5 - 5.4)×10-10 2.4×10⁻³ (2.3 - 2.6)×10-3 CDP-tracer 4.4×10⁻¹⁰ (4.3 - 4.5)×10-10 4.7×10⁻³ (4.6 - 5.1)×10-3 CDP-carrier 5.9×10⁻¹⁰ (5.6 - 6.1)×10-10 3.1×10⁻³ (2.8 - 3.3)×10-3
Wieland et al (2008) 0.08-0.12x10⁻³
Savage and Stenhouse (2002) 1.0-5.0x10⁻³
El-Kamash et al. (2006) 0.54x10⁻¹⁰
Table 17.1 Effective Diffusivity ( ) and partition ratios ( ) derived from the models in comparison with literature values
The table shows that the range of diffusivity values reported for cementitious media
is significant and extends over eight orders of magnitude. The majority of the
diffusivity values in the table are for OPC or hardened cement pastes which exhibit

240
lower diffusivity than the highly porous NRVB. However, there is good agreement
with the values published by Nirex when developing this backfill material. The
literature values also illustrate the lack of consistency in the reporting of diffusivity
e.g. including or excluding tortuosity or capacity factors (this lack of consistency is
itself the subject of technical discussion 177).
The relevant values are subject to much lower variation both in the literature and
the results produced in the course of this work.
These dynamic experiments were aimed at demonstrating the effectiveness of
chemical containment and arriving at a detailed understanding of the mechanisms by
which CDP affects migration was not part of this work.
It has been possible to observe a wide range of behaviour from the highly mobile
monovalent ions (Cs, I), through the lower mobility divalent ions (Sr, Ca, Ni) to the
apparent immobilisation of the trivalent Eu, Am, tetravalent Th and hexavalent U.
The diffusion experiments involving the higher valency elements are being
maintained and regular observations and determinations of the mineral phases
present and morphological changes occurring have been scheduled over the next
few years.
Differences in behaviour dependent on concentration have also been observed with
the tracer only experiments behaving differently to those with tracer and non active
carrier. Radionuclide uptake is also different i.e. varies with concentration; this
can be seen clearly in the Cs and Sr diffusion experiments (and I, although the
relevant experiment could not be completed) where higher values have been
indicated by the models i.e proportionately more of the radionuclide is retained at
very low concentration. This suggests NRVB has a small but finite capacity to retain
some radionuclides irreversibly.
The combination of diffusivity and partition can be discerned; in particular it is
possible to see that diffusivities of the monovalent ions (Cs and I) are similar or
higher than that of HTO and that partition is the main contributor to mobility. This
result contrasts with the Nirex literature values where HTO exhibits the highest
diffusivity. It is also appears that the presence of CDP affects diffusivity and partition
at tracer concentrations but only diffusivity at carrier concentrations. It is important to
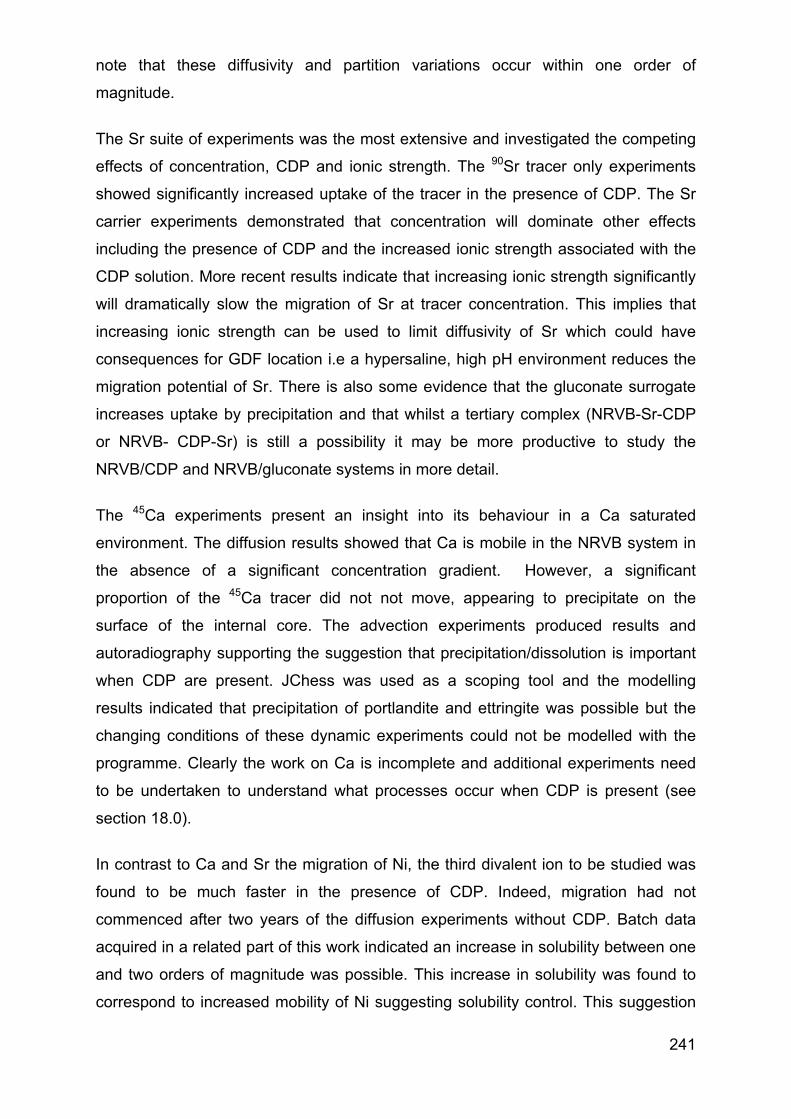
241
note that these diffusivity and partition variations occur within one order of
magnitude.
The Sr suite of experiments was the most extensive and investigated the competing
effects of concentration, CDP and ionic strength. The 90Sr tracer only experiments
showed significantly increased uptake of the tracer in the presence of CDP. The Sr
carrier experiments demonstrated that concentration will dominate other effects
including the presence of CDP and the increased ionic strength associated with the
CDP solution. More recent results indicate that increasing ionic strength significantly
will dramatically slow the migration of Sr at tracer concentration. This implies that
increasing ionic strength can be used to limit diffusivity of Sr which could have
consequences for GDF location i.e a hypersaline, high pH environment reduces the
migration potential of Sr. There is also some evidence that the gluconate surrogate
increases uptake by precipitation and that whilst a tertiary complex (NRVB-Sr-CDP
or NRVB- CDP-Sr) is still a possibility it may be more productive to study the
NRVB/CDP and NRVB/gluconate systems in more detail.
The 45Ca experiments present an insight into its behaviour in a Ca saturated
environment. The diffusion results showed that Ca is mobile in the NRVB system in
the absence of a significant concentration gradient. However, a significant
proportion of the 45Ca tracer did not not move, appearing to precipitate on the
surface of the internal core. The advection experiments produced results and
autoradiography supporting the suggestion that precipitation/dissolution is important
when CDP are present. JChess was used as a scoping tool and the modelling
results indicated that precipitation of portlandite and ettringite was possible but the
changing conditions of these dynamic experiments could not be modelled with the
programme. Clearly the work on Ca is incomplete and additional experiments need
to be undertaken to understand what processes occur when CDP is present (see
section 18.0).
In contrast to Ca and Sr the migration of Ni, the third divalent ion to be studied was
found to be much faster in the presence of CDP. Indeed, migration had not
commenced after two years of the diffusion experiments without CDP. Batch data
acquired in a related part of this work indicated an increase in solubility between one
and two orders of magnitude was possible. This increase in solubility was found to
correspond to increased mobility of Ni suggesting solubility control. This suggestion

242
was further supported by the advection experiment with CDP where a tracer quantity
of 63Ni (i.e well below any solubility limit) was found to be as mobile as HTO. The
solubility increase found in the batch experiments occurred in the absence of the
NRVB solid and consequently interaction of the CDP and solid in contrast to Sr and
Ca, can be discounted as a reason for the increased mobility. Clearly the work on Ni
is incomplete and additional experiments at a variety of concentrations need to be
undertaken to confirm the details of the solubility control (see section 18.0).
The data generated by the radial method are reproducible and it is hoped that they
can be used to provide a more representative basis for performance assessment as
the UK GDF programme is developed.
The diffusion technique was demonstrated to be suitable for low strength porous
grouts and backfills, producing data in a cost effective manner with no significant
management requirements. The method is flexible and could be scaled up (or down)
and potentially trialled for other cementitious construction materials. The method is
unlikely to be suitable for structural concrete or concretes with large particle size
aggregate due to very low diffusivity and difficulty obtaining a representative sample
for laboratory scale work.
The advection technique also appeared to be suitable for low strength porous grouts
and backfills although the results were not always reproducible. The technique and
equipment are still being developed with minor modifications to the injection system
and sample collection currently underway. The problems with flow rate and pressure
control can almost certainly be addressed by using pumps with constant flow or
constant pressure capabilities. It should be appreciated that the flow rates used in
the advection experiments were extremely high in relation to what might be
experienced by the backfill in the real GDF scenario. Consequently there could be
other phenomena which have not yet been considered (e.g mass removal by
dissolution and washing out of fines causing an increase of porosity) affecting the
way the experiments proceed over time.
Autoradiography proved to be an effective technique for visualising the fate of the
radionuclides used in the experiments. It was possible to see when diffusion had
been homogeneous and where diffusion gradients were present. Residual activity
could clearly be identified in the central cores along with the presence of hotspots in
the NRVB matrix and on the outer surface of the cylinders.

243
The experiments were undertaken on intact samples of the actual materials at the
associated high pH values and directly relevant concentrations so the effects seen
must be anticipated, to be present for the full scale GDF scenario.
There are areas where better control would have improved the outcome, these
include:
Less variability in the solutions used, the CDP solution in particular has significant
variabilty between batches, this is also true of the NRVB equilibrated water.
Synthetic solutions were considered but it was decided to proceed in a realistic
manner with realistic variability to observe the full range of results.
The effect of counter ions has not been considered and these may be important as
significant amounts of chloride and nitrate can be present in the isotope solutions
when purchased. Effects due to these counter ions were not considered as the
concentrations could not be accurately measured in the presence of the
radioisotopes.

244
18.0 Future Work
This research has collected and processed information relevant to the potential for
escape and subsequent migration of selected radionuclides from a GDF. It is clear
that the research could be expanded to cover a wider range of elements and it is
also clear that the diffusion and advection methods that have been developed can
provide results quickly for monovalent and divalent ions.
Despite the significant amount of data gathered in the course of this research
significant gaps remain. The data that have been gathered also have shortcomings
that could be addressed in the future. In particular it should be possible to augment
the methods with spectroscopic techniques and electron microscopy to understand
the transport process at a more fundamental level.
A number of ideas with the potential to provide meaningful results can be suggested
to progress the research, these include:
Fill in the gaps in the current series; in particular the HTO CDP diffusion
experiments, the Ca diffusion experiments with CDP solution and the work at varied
Ni concentrations needed to confirm that migration in NRVB is solubility controlled.
The diffusion experiment can be modified to eliminate the downward diffusion that
was not accounted for in the modelling. The solution would be to drill the central core
all the way through the sample and seal both ends. This was not done for the current
programme of experiments because during development, the seals were viewed as
a weakness and using two for each experiment would double the chance of failure.
This hollow cylinder geometry would also make the need to construct a 3D GoldSim
model less important.
The Cs advection experiment in the presence of CDP needs to be undertaken as it
would provide information about the CDP interaction with NRVB and its effect on the
migration of monovalent ions.
Maintain the current long term experiments for further investigation.
To make the simulations more realistic more processes need to be included in the
advection models, in particular precipitation and consequent source depletion.

245
The use of reactive transport models should be explored to simulate
thermodynamics and chemical processes.
Full characterisation of the CDP solution and determination of the influence of
component(s) of significance, other than ISA, on radionuclide mobility. This would be
particularly interesting for the Ni experiments where a radical change in migration
behaviour was observed in the presence of the CDP solution.
Investigation of the long term changes in the CDP solution due to exposure to
cementitious materials and high pH.
The interaction of the CDP solution with NRVB has been shown to be complex. In
particular, the sorption/precipitation of ISA needs to be investigated further by
running the advection experiments for longer durations (months to years) and
establishing whether precipitation will eventually prevent flow.
The isotope pair 82Sr/82Rb (82Rb is a short half-life; 1.27 minutes, positron emitter)
could be utilised to visualise the Sr migration if access to suitable PET scanner
facilities can be arranged.
Reversibility remains an issue, it could be further investigated by sequential removal
of the receiving water and replacement with equilibrated water free from the
radionuclide of interest.
The experiments should be repeated, where possible, at sufficently high
concentration with non radioactivactive isotopes to facilitate surface characterisation
and identification of mineral phases using SEM/EDX and spectroscopic techniques.
The diffusion and advection techniques could be used to assess the effect of other
organic materials likely to be used in cementitious media associated with radioactive
waste disposal. In particular, NDA is known to be concerned about the effect of
super plasticisers, having recently commissioned studies at Loughborough
University.
The majority of the work has been undertaken on NRVB (with a few experiments on
a PFA packaging grout) and should be widened to include a range of cementitious
construction materials including bentonite cements, BFS formulations and shotcrete.

246
Scaled up experiments should be attempted to ascertain if the same phenomena are
observed.
All the experiments have been undertaken in carbon dioxide free conditions and it
would be prudent to assess the effect of carbon dioxide better reflecting the potential
siting of a GDF in carbonate rich groundwater.
It is possible to artificially age cements 178 179 by forcing complete carbonation using
high pressure carbon dioxide innundation or exposure to supercritical carbon
dioxide. Using fully carbonated cementitious media in diffusion and advection
experiments could provide insights into performance at timescales exceeding 1000
years.
3D X ray tomography should be used to record the physical nature of the samples at
defined time intervals to ascertain what effect, if any, the testing is having on the
integrity of the cements.
The techniques could be easily modified to allow interfaces to be studied by casting
concentric rings of the media of interest e.g. mimicking the shotcrete to backfill
interface likely to be present at the outer edge of the GDF excavation.
The 45Ca experiments could be extended to more conventional cementitious
construction materials to track Ca movement under saturated conditions.

247
19.0 References 1. UK Government White Paper by Defra, BERR and the devolved administrations for Wales and Northern Ireland: Managing radioactive waste safely: A framework for implementing geological disposal June 2008. 2. Inspectors Report. Cumbria County Council Appeal by United Kingdom NIREX, APP1H09001M9412470 19. March 1997. 3. Francis, A J, Cather, R, and Crossland, I G, Development of the Nirex Reference Vault Backfill; report on current status in 1994, Nirex Science Report S/97/014, UK Nirex Ltd., Harwell, UK, 1997. 4. Colin Knipe’s statement accessed at http://www.jpb.co.uk/nirexinquiry/nirex.htm August 2013. 5. House of Lords Committee: Management of Nuclear Waste, 3rd Report, Session 1998-1999 (HL Paper 41), 6. Personal opinion based on 25 years working in a technical capacity in the nuclear sector. 7. DEFRA, Managing Radioactive Waste Safely; Proposals for developing a policy for managing solid radioactive waste in the UK. 2001 8. DTI White Paper: Managing the Nuclear Legacy - A strategy for action. July 2002. 9. Nirex Technical Note: Site selection and investigations for a deep geological repository, preliminary technical planning in support of the stepwise process. July 2003. 10. House of Lords Science and Technology Committee - Second Report, Radioactive Waste Management: a further update. Accessed August 2013 http://www.publications.parliament.uk/pa/ld200910/ldselect/ldsctech/95/9502.htm. 11. CoRWM "Long List of Options" November 2004 accessed at http://www.nda.gov.uk/aboutus/geological-disposal/history.cfm on 21 July 2011. 12. CoRWM, Managing our Radioactive Waste Safely: CoRWM's Recommendations to Government, 700, July 2006. 13. Rawles K, Compensation in radioactive waste management: Ethical issues in the treatment of host communities. Nirex paper May 2002. 14 CoRWM: Position paper on public and stakeholder engagement. 2850 Draft 12 February 2011.

248
15. Geological disposal options: CoRWM's government advice July 2006, accessed July 2013 at https://www.gov.uk/government/publications/geological-disposal-options-corwms-government-advice. 16. Current CoRWM membership and management structure can be accessed at https://www.gov.uk/government/organisations/committee-on-radioactive-waste-management/about/our-governance. 17. NDA established April 2005 under the provisions of The Energy Act 2004, Accessed July 2013 at http://www.legislation.gov.uk/ukpga/2004/20/contents. 18. CoRWM, Review of managing radioactive waste safely: A framework for implementing geological disposal. (7386, June 2008). 19. W. F. Falck, K F Nilsson. “Geological Disposal of Radioactive Waste: Moving Towards Implementation”. Joint Research Centre of the European Commission JRC 45385 October 2009. 20. NDA, Radioactive Waste Management Directorate Proposed Research and Development Strategy. 2008 21. Cumbria County Council. Minutes of a Meeting of the Cabinet held on Wednesday, 30 January 2013 at 10.00 am at The Courts, Carlisle. Accessed at http://councilportal.cumbria.gov.uk/ieListDocuments.aspx?CId=123&MId=6834&Ver=4 July 2013. 22. Hicks T W, Baldwin T D, Hooker P J, Richardson P J, Chapman N A, McKinley I G, and Neall F B: Concepts for the Geological Disposal of Intermediate-level Radioactive Waste, April 2008. 23. Chapman N A, McKinley I G, Hill M D, The geological disposal of nuclear waste, (J. Wiley, 1987) ISBN: 0471912492. 24. Savage D: The Scientific and regulatory basis for the geological disposal of radioactive waste, (J Wiley 1995) ISBN-10: 047196090X. 25. UK DEFRA, Guidance on the scope of and exemptions from the radioactive substances legislation in the UK. Guidance Document September 2011, Version 1.0. 26. The 2010 UK Radioactive Waste Inventory; Report prepared for the Department of Energy & Climate Change (DECC) and the Nuclear Decommissioning Authority (NDA) by Pöyry Energy Limited, February 2011 (URN 10D/987 NDA/ST/STY(11) 006).

249
27. Glaus, M.A., van Loon, L.R., Achatz, S., Chodura, A., Fischer, K., 1999. Degradation of cellulosic materials under the alkaline conditions of a cementitious repository for low and intermediate level radioactive waste Part I: Identification of degradation products. Anal. Chim. Acta. 398, 111–122. 28. Chambers, A.V., Williams, S.J. Parameter value selection for performance assessments: The impact of cellulosic degradation on repository performance. Serco Assurance Report SA/ENV-0595 2006. 29. Pointeau, I., Coreau, N., Reiller, P.E. Uptake of anionic radionuclides onto degraded cement pastes and competing effect of organic ligands. Radiochim.Acta.96, 367-374 2008. 30. Warwick, P., Evans, N., Heath, C. Effect of experimental method on the solubility of thorium in the presence of cellulose degradation products. NDA Report LBORO CMNDA2 2012. 31. William M Miller: Geological disposal of radioactive wastes and natural analogues (Elsevier 2000) ISBN: 0444542523. 32. NDA News article, February 2011; Multi-barrier approach is the key to safe disposal of radioactive waste. Accessed at http://www.nda.gov.uk/news/multi-barrier-approach-key-to-safety.cfm on July 15 2011. 33. Nirex Report No: N/034 Why a cementitious repository? June 2001 34. Taylor H F W: Cement Chemistry (Thomas Telford 1997, first published 1990). 35. Lea F M, Hewlett P C: Chemistry of cement and concrete (Arnold 1998). 36. Taylor H F W; The chemistry of cement, volume 2, (Academic Press 1964). 37. Malhotra P, V M Mehta K: Pozzolanic and cementitious materials. (Spon Press 1996) ISBN- 2884492119. 38. Magistri, Matteo and Padovani, Davide; “Chromate Reducing Agents”, International Cement Review, October, 2005 pages 49-56. 39. Spence R D; Chemistry and microstructure of solidified wasteforms (Lewis1993) ISBN-10: 0873717481. 40. Nielsen EP, Herfort D, Geiker MR. Phase equilibria of hydrated portland cement. Cement and Concrete Research Volume 35, January 2005, pages 109-115. 41. Wesselsky A, Jensen OM. Synthesis of pure portland cement phases. Cement and Concrete Research Volume 39, November 2009, pages 973-980.

250
42. Sun J, Simons S J R; Experimental investigation of the carbonation of NRVB. Centre for CO2 Technology, Department of Chemical Engineering, University College London (undated), accessed at http://archivos.labcontrol.cl/wcce8/ offline/techsched/manuscripts%5Cqouprm.pdf on 3 August 2011. 43. Freeze R A, Cherry J A; Groundwater (Prentice-Hall 1979). 44. Abdullah M. Alshamsi and Hassan D. A. Imran; Development of a permeability apparatus for concrete and mortar. Cement and Concrete Research Volume 32, Issue 6, June 2002, Pages 923-929. 45. Personal communication with S Williams of NDA, March 2011 and reference to Nexia Solutions memorandum regarding grout sample preparation from J Borthwick dated August 2007 46. McCarter W J, Crossland I, and Chrisp T M: Hydration and drying of Nirex Reference Vault Backfill August 2003. 47. Crank J; The mathematics of diffusion (Clarendon Press 1979). 48. 114. L. R. van Loon, J. M. Soler, W. Muller, M. H. Bradbury. Anisotropic Diffusion in Layered Argillaceous Rocks: A Case Study with Opalinus Clay Environ. Sci. Technol. 2004, 38, 5721-5728.
49. van Brakel, J., Heertjes, P. M. (1974): Analysis of diffusion in macroporous
media in terms of a porosity, a tortuosity and a constrictivity factor. Int. J. Heat Mass
Transfer, 17: 1093–1103 50. Pulkkanen, V.M., Nordman, H., 2010. Modelling of near-field radionuclide transport phenomena ina KBS-3V type of repository from nuclear waste with Goldsim code – and verification against previous methods. Posiva working report 2010-14. 51. Andersson, K.,Torstenfelt, B., Allard, B., 1981. Diffusion of cesium in concrete. Mater. Res. Soc. Symp. Proc. 3, 235-242. 52. Andersson K, Torstenfelt B. Allard B: Sorption and diffusion studies of Cs and I in concrete Department of Nuclear Chemistry Chalmers University of Technology Göteborg, Sweden January 1983. 53. Massoudieh, A., Ju, D., Young, T. M., Ginn, T. R., 2008. Approximation of a radial diffusion model with a multiple-rate model for hetero-disperse particle mixtures. J. Contam. Hydrol. 97, 55-66. 54. Felipe-Sotelo, M., Hinchliff, J., Drury, D., Evans, N., Williams, S., Read, D., Radial diffusion of radiocaesium and radioiodide through cementitious backfill, JPCE 2285 (2014).

251
55. Understanding Variation in Partition Coefficient, K , Values, 1999, Volume I, K Model, Measurement Methods, and Application of Chemical Reaction Codes, USEPA 402-R-99-004A. 56. Savage D, Stenhouse M: SKI Report 02 53 SRF 1 Vault Database April 2002 www.stralsakerhetsmyndigheten.se%2fGlobal%2fPublikationer%2fSKI_import%2f040303%2f97c461bb623c92855d73209a530f1ee5%2f02_53.pdf last accessed on 2 Feb 2014. 57. M. Felipe-Sotelo, J. Hinchliff, N. Evans, P. Warwick and D. Read. Sorption of radionuclides to a cementitious backfill material under near-field conditions. Mineral Mag, December 2012, v. 76, p. 2865-287 58. Baker S.,Oliver P. and McCrohon R.(2002) Near-field batch sorption studies – 1992 to 1998. AEA Technology Report AEAT/ERRA-0345 59. G. M. N. Baston1, M. M. Cowper1 and T. A. Marshall. Sorption properties of aged cements. Mineral Mag, December 2012, v. 76, p. 2865-2871. 60. Chatterji, S., 1994. Transportation of ions through cement based materials. Part 1: Fundamental equations and basic measurement techniques. Cem. Concr. Res. 24, 907-912. 61. Chatterji, S., 1995. On the applicability of Fick’s second law to chloride ion migration through Portland cement concrete. Cem. Concr. Res. 25, 299-303. 62. Chatterji, S., 1999. Evidence of variable diffusivity of ions in saturated cementitious materials. Cem. Concr. Res. 29, 595-598. 63. Albinsson, Y., Andersson, K., Börjesson, S., Allard, B., 1996. Diffusion of radionuclides in concrete and concrete-bentonite systems. J. Contam. Hydrol. 21, 189-200. 64. Bath A, Deissmann G, Jefferis, S; Radioactive contamination of concrete: uptake and release of radionuclides. Proceedings of ICEM 2003 (ICEM03 4814). 65. Atkinson, A., Nickerson, A.K., 1984. The diffusion of ions through water-saturated cement. J. Mater. Sci. 19, 3068-3078. 66. Johnston, H.M., Wilmot, D.J., 1992. Sorption and diffusion studies in cementitious grouts. Waste Manage. 12, 289-297. 67. Sarott, F.A., Bradbury, M.H., Pandolfo, P., Spieler, P., 1992. Diffusion and adsorption studies on hardened cement paste and the effect of carbonation on diffusion rates. Cem. Concr. Res. 22, 439-444.

252
68. Jakob, A., Sarott, F.A., Spieler, P., 1999. Diffusion and sorption on hardened cement pastes – experiments and modelling results. PSI-Bericht, Nr. 99-05. 69. Chida, T., Sugiyama, D., 2009. Diffusion behaviour of organic carbon and iodine in low-heat Portland cement containing fly ash. Mater. Res. Soc. Symp. Proc., 1124, 379-384. 70. Bucur, C., Olteanu, M., Cristache, C., Palevescu, M., 2010. Radionuclide transport through matrices. Rev. Chim. 61, 458-461. 71. Mattigod, S.V., Whyat, G.A., Serne, R.J., Martin, P.F., Schwab, K.B., Wood, M.I., 2001. Diffusion and leaching of selected radionuclides (Iodine-129, Technetium-99, and Uranium) through category 3 waste encasement concrete and soil fill material. PNNL-13639 for the U.S. Department of Energy (DE-AC06-76RL01830). 72. El-Kamash, A.M., El-Dakroury, A.M., Aly, H.F., 2002. Leaching kinetics of 137Cs and 60Co radionuclides fixed in cements and cement-based materials. Cem. Concr. Res. 32, 1797-1803. 73. Plecas, I., 2003. Immobilisation of 137Cs and 60Co in concrete matrix. Ann. Nucl. Energy. 30, 1899-1903. 74. Papadokostaki, K.G., Savidou, A., 2009. Study of leaching of caesium ions incorporated in ordinary Portland cement. J. Hazard. Mater. 171, 1024-1031. 75. Sinha, P.K., Shanmugamani, A.G., Renganathan, K., Muthia, R., 2009. Fixation of radioactive chemical sludge in a matrix containing cement and additives Ann. Nucl. Energy. 36, 620-525. 76. Ojovan, M.I., Varlackova, G.A., Golubeva, Z.I., Burlaka, O.N., 2011. Long-term field and laboratory leaching tests of cemented radioactive wastes. J. Hazard. Mater. 187, 296-302. 77. Tits, J., Jakob, A., Wieland, E., Spiler, P., 2003. Diffusion of tritiated water and 22Na+ through non-degraded hardened cement pastes. J. Contam. Hydrol. 61, 45-62. 78. Jakob A, Diffusion of tritiated water (HTO) and 22Na+-ions through non-degraded hardened cement pastes – II. Modelling results. PSI-Bericht Nr. 02-21 December 2002. 79. Mibus J, Sachs S, Pfingsten W, Nebelung C, Bernhard G, Migration of uranium(IV)/(VI) in the presence of humic acids in quartz sand: A laboratory column study. Journal of Contaminant Hydrology 89 (2007).

253
80. Pala´gyi S, Tamberg K S, Vodickova H; Transport and sorption of Sr-85 and I-125 in crushed crystalline rocks under dynamic flow conditions. Journal of Radioanalytical Nuclear Chemistry 2010 page 283. 81. Hölttä P, Poteri A, Siitari-Kauppi M, Huittinen N; Retardation of mobile radionuclides in granitic rock fractures by matrix diffusion University of Helsinki, Laboratory of Radiochemistry June 2008. 82. García-Gutiérrez M, Cormenzana J L, Missana T, Mingarro M, Alonso U, Samper J, Yang Q, Yi S, Diffusion experiments in Callovo-Oxfordian clay from the Meuse/Haute-Marne URL, France. Experimental setup and data analyses CIEMAT, Departamento de Medio Ambiente, Av. Complutense 22, 28040 Madrid, Spain. 83. Read D, Ross D, Sims RJ. The migration of uranium through Clashach Sandstone: the role of low molecular weight organics in enhancing radionuclide transport. Journal of Contamaminant Hydrology 1998 12/15;35(1-3): pages 235-248. 84. Berry J.A., Bond K.A., Brownsword M., Ferguson D.R., Green A., Littleboy A.K. 1990. Radionuclide sorption on generic rock types. Nirex Report NSS/R182. 85. Baker A.J., Jackson C.P., Jefferies N.L., Lineham T.R. 2002. The role of rock-matrix diffusion in retarding the migration of radionuclides from a radioactive waste repository. Nirex Report N/051. 86. Jefferies N.L. & Swanton S.W. 2003. An overview of research on diffusion in the geosphere undertaken within the Nirex Safety Assessment Research Programme. Serco Assurance Report SA/ENV-0447. 87. Quintessa Report (L. Knight, J. Black S. Watson) QRS-1421A-R3 Measurement of rock properties relevant to radionuclide migration NDA-RWMD Geosphere Characterisation Project: Data Acquisition Report: April 2008. 88. Tits J, Wieland R, Bradbury M H; The effect of isosaccharinic acid and gluconic acid on the retention of Eu(III), Am(III) and Th(IV) by calcite. Applied Geochemistry 20 November 2005 Volume 20, Issue 11 pages 2082-2096. 89. Hurdus, M.H., Pilkington, N.J., 2000. The solubility and sorption of 2-C-(hydroxymethyl)-3-deoxy-D-pentonic acid in the presence of Nirex Reference Vault Backfill and its degradation under alkaline conditions. Nirex report, AEAT/ERRA-0153. 90. Holgersson, S., Albinsson, Y., Allard, B., Borén, H., Pavasars, I., Engkvist, I., 1998. Effects of gluco-isosaccharinate on Cs, Ni, Pm and Th sorption onto, and diffusion into cement. Radiochim. Acta. 82, 893-398.

254
91. Savage D, Soler JM, Yamaguchi K, Walker C, Honda A, Inagaki M, et al. A comparative study of the modelling of cement hydration and cement-rock laboratory experiments. Applied Geochemistry 26 July 2011 pages 1138–1152. 92. Massazza F. Pozzolanic cements. Cement and Concrete Composites 1993; 15(4): pages 185-214. 93. Nielsen EP, Herfort D, Geiker MR. Phase equilibria of hydrated Portland cement. Cement and Concrete Research Volume 40, Number 4, 2005 pages 405-417. 94. Lawrence CE. International review of the composition of cement pastes, mortars, concretes and aggregates likely to be used in water retaining structures. London : HMSO; 1994. 95. Pankow J F, Cherry J A; Dense chlorinated solvents and other DNAPLs in groundwater (Waterloo Press 1996). 96. Altenhein-Haese C, Bischoff H, Fu L, Mao J, Marx G. Adsorption of actinides on cement compounds. Journal of Alloys and Compounds Volumes 213-214 October 1994, pages 554-556. 97. Markovaara-Koivisto, M., Read, D., Lindberg, A., Siitari-Kauppi, M., Togneri, L., 2009. Geology of the Sievi, Kuru and Askola sites. Uranium mineralogy at Askola. Research Report TKK-GT-A-4, Helsinki University of Tecnology. 98. J. Hill, J. H. Sharp. The hydration products of Portland cement in the presence of tin(II) chloride. Cement and Concrete Research Volume 33, Issue 1, January 2003, Pages 121–124. 99. K.K. Sagoe-Crentsil, F.P. Glasser, V.T. Yilmaz. Corrosion inhibitors for mild steel; stannous tin, Sn(II) in ordinary portland cement. Cement and Concrete Research Volume 33, Volume 24, Issue 2, 1994, Pages 313–318. 100. Leslie A. Jardine, Charles R. Cornman, Vijay Gupta, Byong-Wa Chun. Cement composition having chromium reducer. US Patent number 7232483.June 2007. 101. Roto P, Sainio H, Reunala T, Laippala P. Addition of ferrous sulfate to cement and risk of chromium dermatitis among construction workers. Contact Dermatitis. 1996 Jan;34(1):43-50. 102. 29. McCarter W J, Crossland I, and Chrisp T M: Hydration and drying of Nirex Reference Vault Backfill. August 2003. 103. Nirex Report No: N/034 Why a cementitious repository? June 2001.

255
104. Personal communication with S Williams of NDA, March 2011 and reference to Nexia Solutions memorandum regarding grout sample preparation from J. Borthwick dated August 2007. 105. Rice G, Miles N, and Farris S: Approaches to control the quality of cementitious PFA grouts for nuclear waste encapsulation, Powder Technology 174, Issues 1-2, 16 May 2007, Pages 56-59. 106. NDA Report SA/ENV-0805, M C Cowper, C P Jackson and D A Partington, Serco Assurance, Implications of Using Smaller Cores to Prepare Rock Beakers for In-diffusion Tests. 107. Millington R J, Quirk J P: The permeability of porous solids. Departments of Agronomy and agricultural chemistry, University of Adelaide 1960. 108. Domenico, P.A., and F.W. Schwartz. 1998. Physical and Chemical Hydrogeology, 2nd ed., 506. New York: John Wiley &Sons. 109. L.F. Konikow The Secret to Successful Solute-Transport Modeling Groundwater 49, no. 2: 144–159. 110. Poster presentation: Advective Transport Experiments Through Crushed Cementitious Backfill Under Near Field Conditions. M. Felipe-Sotelo, J. Hinchliff, P. Warwick, N. D. M. Evans. 11th Environmental Radiochemical Analysis- 15-17 September 2010- Chester, UK. 111. C. M. Filomena, J. Hornung, and H. Stollhofen. Assessing accuracy of gas-driven permeability measurements: a comparative study of diverse Hassler-cell and probe permeameter devices. Solid Earth Discuss., 5, 1163–1190, 2013. 112. P.Warwick, M. Felipe-Sotelo: Deep geological disposal of intermediate and low level waste in UK: Experiments to demonstrate chemical containment. Proc 11th International symposium on radiochemical analysis, Chester, UK RSC 2011 113. Rowe P W, Barden L; A new consolidation cell. Géotechnique, Vol. 16, No. 2, 1966, pages 116-124. 114. Berner UR. Evolution of pore water chemistry during degradation of cement in a radioactive waste repository environment. Cementitious materials in radioactive waste management 12, Issues 2-3, 1992, pages 201-219. 115. Edvardsen, C. Water permeability and autogenous healing of cracks in concrete ACI Materials Journal Volume 96, Issue 4, July 1999, Pages 448-454.

256
116. Y. Yang, M. D. Lepech, E. Yang, V. C. Li. Autogenous healing of engineered cementitious composites under wet–dry cycles. Cement and Concrete Research 39 (2009) 382–390. 117. GoldSim Technology Group LLC, 2011. The GoldSim Monte Carlo Simulation Software. Issaquah, Washington. 118. E.A., Environment Agency for England and Wales, July 2002. Performance Assessment Codes for Radioactive Waste Repositories. R&D Technical Report P3-069/TR. 119. Personal conversation with Mr D Drury of Golder Associates UK (Ltd) March 2013 after consulting the GoldSim team in Seattle. 120. GoldSim User Guide Vols 1 - 2, GoldSim Technology Group LLC Version 11.1 May 2014 121. GoldSim Contaminant Transport Module, GoldSim Technology Group LLC, Version 6.4 May 2014 122. E. Henley, J. Seader, D. Roper, Separation Process Principles, Third Edition 2011, John Wiley & Sons, ISBN 978-0-470-64611-3. 123. K. A. Atkinson, An Introduction to Numerical Analysis Second edition 1989, New York: John Wiley & Sons, ISBN 978-0-471-50023-0 124. Gelhar, FW, Welty, C and Rehfeldt, KR. July 1992. A critical review of data on field-scale dispersion in aquifers. Water Resources Research, 28, No.7, pp1955-1974. 125. Takahashi K, Progress in science and technology on photostimulable BaFX : Eu2+ (X = Cl, Br, I) and imaging plates. Journal of Luminescence 100(1-4): 307-315 2002 126. Rufer, D and Preusser, F. Potential of autoradiography to detect spatially resolved radiation patterns in the context of trapped charge dating. Institute of Geological Sciences, University of Bern, Baltzerstrasse 1+3, 3012 Bern, Switzerland 127. Salis M. On the photo-stimulated luminescence of BaFBr : Eu+2 phosphors. Journal of Luminescence 2003104(1-2): 17-25. 128. Rasband, W.S. ImageJ, U. S. National Institutes of Health, Bethesda, Maryland, USA, http://imagej.nih.gov/ij/, 1997-2012. 129. Z. Liu, L. Wyffels, C. Barber, L. Wan, H. Xu, M. M. Hui, L. R. Furenlid, and J. M. Woolfenden Characterization of 99mTc-labeled cytokine ligands for inflammation imaging via TNF and IL-1 pathways. Nucl Med Biol. October 2012; 39(7): 905–915.

257
130. S. Suksi, M. Siitari-Kauppi, E. Kamarainen and A.Lindberg. The Effect of Groundwater - Rock interactions on the migration of redox sensitive radionuclides. Mat. Res. Soc. Syrup. Proc. Vol. 127.1989. 131. S. Muuronen, E. Kamarainen, T. Jaakkola, S. Pinnioja and A. Lindberg. Sorption and diffusion of radionuclides in rock matrix and natural fracture surfaces studied by autoradiography. Mat. Res. Soc. Syrup. Proc. Vol. 50. 1985. 132. A.J.Young. The Stability of Cement Superplasticiser and its Effect on Radionuclide Behaviour Unpublished PhD Loughborough University 2012. 133. A. Young, P. Warwick, A. E Milowdowski, D. Read, Behaviour of radionuclides in the presence of superplasticiser, Advances in Cement Research, 2013, 25(1), 32-43. 134. Dr M. Felipe-Sotelo, Mr. J. Hinchliff, Prof. D. Read, Chemical Containment Demonstration Experiments, Quarterly Report Jan-Mar 2013. Loughborough University (available on request). 135. Chambers, A.V., Williams, S.J., 2006. Parameter value selection for performance assessments: The impact of cellulosic degradation on repository performance. Serco Assurance Report SA/ENV-0595. 136. Chambers, A.V., Green, A., Harris, A.W., Heath, T.G., Hunter, F.M.I., Manning, M.C., Williams, S.J., 2006. The Diffusion of Radionuclides through Waste Encapsulation Grouts. Mater. Res. Soc. Symp. Proc. 932, 705-712. 137. Jarvis K E, Gray A L, Houk R S: Handbook of inductively coupled plasma mass spectrometry (Blackie 1992). 138. Hill S J; Inductively Coupled Plasma Spectrometry and Its Applications (J Wiley 2008). 139. Methods, columns, reagents etc. available at http://www.dionex.com/en-us/products/columns/lp-81265.html accessed July 2013. 140. Details available at http://www.geinstruments.com/products-and-services/toc-analyzers-and-sensors/innovox-laboratory accessed July 2013. 141. C. R. Heath. Interactions of radionuclides with cellulose degradation products. Unpublished PhD thesis, Loughborough University (2008). 142. Glaus, M.A., van Loon, L.R., 2008. Degradation of cellulose under alkaline conditions: New insights from a 12 years degradation study. Env. Sci. Technol. 42, 2906–2911.

258
143. Idemitsu, K., Kuwata, K.I., Furuta, H., Inagaki, Y., Arima, T., 1997. Diffusion paths of cesium in water-saturated mortar. Nucl. Technol, 118, 233-241. 144. Abdel Rahman, R.O., Zaki, A.A, El-Kamash, A.M., 2007. Modeling the long-term leaching behaviour of 137Cs, 60Co and 152,154Eu radionuclides from cement-clay matrices. J. Hazard. Mater. 145, 372-380. 145. Volchek, K., Miah, M.Y., Kuang, W., DeMaleki, Z., Tezel, F.H., 2011. Adsorption of cesium on cement mortar from aqueous solutions. J. Hazard. Mater. 194, 331-337. 146. Bamforth, P.B., Baston, G.M.N., Beryy, J.A., Glasser, F.P., Heath, T.G., Jackson, C.P., Savage, D., Swanton, S.W., 2012. Cement material for use as backfill, sealing and structural materials in geological disposal concepts. A review of the current status. Serco report for NDA serco-005125-001. 147. D. Delacroix, J. P. Guerre, P. Leblanc, C. Hickman Radionuclide and radiation protection data handbook 2002. Radiation protection dosimetry Vol. 98 No 1, 2002. ISBN 1 870965 87 6. 148. Weaver, C L, Harward, E D, Peterson, H T. Tritium in the environment from nuclear powerplants. Public health reports 84 (4): 363-371; 1969. 149. Weaver, C L; Harward, E D. Surveillance of nuclear power reactors. Public health reports 82 (10): 899-912; 1967. 150. Personal communication with Mr T Uppington Business Lines Director. URS Corporation Ltd November 2012. 151. Dyer A: Liquid scintillation counting practice (Heyden 1980). 152. Ross H, Noakes J E, Spaulding J; Liquid scintillation counting and organic scintillators (Lewis 1991). 153 C. Shackelford, P. Redmond, Solute breakthrough curves for processed kaolin at low flow rates J. Geotech. Engrg. 1995.121:17-32. 154. A.H. Price. Vapour pressure of tritiated water. January 1958, Nature vol 181 page 262. 155. R. Rosson, P. D. Fledderman, S. Klima, and B. Kahn 2000.Correcting tritium concentrations in water vapor monitored with silica gel. Health Phys.,78–83. 156. M. Herranz, N.Alegrian, R.Idoeta, F.Legarda. Sampling tritiated water vapor from the atmosphere by an active system using silica gel. Radiation Physics and Chemistry 80 (2011) 1172–1177.

259
157. Lovera, O., Galle, C., Le Bescop, P., 2001. Towards an intrinsic relationship between diffusion coefficients and microscopic features of cements? Mat. Res. Soc. Symp. Proc. 663, 81-88. 158. Laboratoire National Henri Bequerel, Recommended Data accessed July 2012 at http://www.nucleide.org/DDEP_WG/DDEPdata.htm. 159. Argonne National Laboratory Fact Sheets 2005 accessed on 21 July 2012 at http://www.doeal.gov/SWEIS/OtherDocuments/499%20cesium.pdf. 160. 47. Siegbahn K; Alpha, beta and gamma-ray spectroscopy (North-Holland Publishing Company 1965). 161. Ochs, M., Pointeau, I., Giffaut, E., 2006. Caesium sorption by hydrated cement as a function of degradation state: Experiments and modelling. Waste Manage. 26, 725-732. 162. Argonne National Laboratory Fact Sheets 2005 accessed July 2012 at http://www.evs.anl.gov/pub/doc/Iodine.pdf. 163. I. Kiss, P. Groz, A. Revesz and T. Sipos. Production of 125I from pile irradiated xenon difluoride. J. inorg, nucl. Chem., 1969, Vol. 31, pp. 1225 to 1227. 164. S.B. Hassal. United States Patent 6056929 Method and apparatus for production of radioactive iodine 1997. 165. Pointeau, I., Coreau, N., Reiller, P.E., 2008. Uptake of anionic radionuclides onto degraded cement pastes and competing effect of organic ligands. Radiochim. Acta. 96, 367-374. 166. Argonne National Laboratory Fact Sheets 2005 accessed July 2012 http://doeal.gov/SWEIS/OtherDocuments/500 strontium.pdf 167. Zs. Szántó, É. Svingor, M. Molnár, L. Palcsu, I. Futó, Z. Szucs. Diffusion of 3H, 99Tc, 125I, 36Cl and 85Sr in granite, concrete and bentonite 168. J. Tits, E. Wieland, C.J. Müller, C. Landesman, M.H. Bradbury. Strontium binding by calcium silicate hydrates. Journal of Colloid and Interface Science 300 (2006) 78–87 169. E. Wieland , J Tits , D Kunz and R Dahn. Strontium uptake by cementitious Materials. Environ. Sci. Technol. 2008, 42, 403–409.

260
170. 43. Carr T E F and Parsons B J: A method for the assay of calcium-45 by liquid scintillation counting. The International Journal of Applied Radiation and Isotopes Volume 13, Issue 2 February 1962. 171. J. van der Lee and L. De Windt (2002). CHESS Tutorial and Cookbook. Updated for version 3.0. Users Manual Nr. LHM/RD/02/13,´Ecole des Mines de Paris, Fontainebleau, France. 172. J.C. Pleskowicz, E.J. Billo. Mechanisms of ligand replacement in square planar nickel(II) complexes. II. Reaction of cyanide with nickel(II) complexes of two methyl-substituted ethylenediamine ligands. 173. UK HPA. Public Health England Nickel toxicological overview, accessed at http://www.hpa.org.uk/webc/HPAwebFile/HPAweb_C/1236757324101 July 2013. 174. Wieland, E., Tits, J., Ulrich, A., Bradbury, M.H. Experimental evidence for solubility limitation of the aqueous Ni(II) concentration and isotopic exchange of 63Ni in cementitious systems. Radiochimica Acta Volume 94, Issue 1, 2006, Pages 29-36. 175. M. Vespa, R. Dahn, D. Grolimund, M. Harfouche, E. Wieland, A. M. Scheidegger, Speciation of heavy metals in cement-stabilized waste forms: A micro-spectroscopic study. Journal of Geochemical Exploration 88 (2006) 77–80. 176. M. Vespa, R. Dahn, D. Grolimund, E. Wieland, A. M. Scheidegger Spectroscopic Investigation of Ni Speciation in Hardened Cement Paste Environ. Sci. Technol. 2006, 40, 2275-2282 177. Shackelford, C. Moore, S. Fickian diffusion of radionuclides for engineered containment barriers: Diffusion coefficients, Porosities, and complicating issues. Engineering Geology Volume 152, 18 January 2013, Pages 133-147. 178. L. Fernández-Carrascoa, J. Rius, Carles Miravitlles. Supercritical carbonation of calcium aluminate cement. Cement and Concrete Research Volume 38, Issues 8–9, August 2008, Pages 1033–1037. 179. Carlos A. García-González, Nadia el Grouh, Ana Hidalgo, Julio Fraile, Ana M. López-Periago, Carmen Andrade, Concepción Domingo,New insights on the use of supercritical carbon dioxide for the accelerated carbonation of cement pastes. The Journal of Supercritical Fluids Volume 43, Issue 3, January 2008, Pages 500–509.

261

262
APPENDIX 1
Data Tables

263
List of Data Tables Table 10.1 Results of the NRVB HTO diffusion experiment using NRVB equilibrated water ...................................................................................................................... 265 Table 10.2 Results of the HTO NRVB advection experiment using NRVB equilibrated water ...................................................................................................................... 266 Table 10.3 Results of the HTO NRVB advection experiment using CDP solution .. 267 Table 11.2 Results of the NRVB 137Cs tracer only diffusion experiment using NRVB equilibrated water ................................................................................................... 269 Table 11.3 Results of the NRVB 137Cs tracer only diffusion experiment using NRVB equilibrated water expressed as activity concentrations......................................... 270 Table 11.4 Results of the NRVB 137Cs tracer only diffusion experiment using CDP solution ................................................................................................................... 271 Table 11.5 Results of the NRVB 137Cs tracer only diffusion experiment using CDP solution expressed as activity concentrations ........................................................ 272 Table 11.6 Results of the NRVB 137Cs tracer; CsNO3 carrier diffusion experiment using NRVB equilibrated water .............................................................................. 273 Table 11.7 Results of the NRVB 137Cs tracer; CsNO3 carrier diffusion experiment using NRVB equilibrated water .............................................................................. 274 Table 11.8 Results of the NRVB 137Cs tracer; CsNO3 carrier diffusion experiment using CDP solution ................................................................................................. 275 Table 11.9 Results of the NRVB 137Cs tracer; CsNO3 carrier diffusion experiment using CDP solution ................................................................................................. 276 Table 11.10 Cs Results for the mixed element diffusion experiments in NRVB equilibrated water ................................................................................................... 277 Table 11.11 Cs Results for the mixed element NRVB diffusion experiments in CDP solution ................................................................................................................... 278 Table 11.12 Results of the 137Cs tracer advection using NRVB equilibrated water 280 Table 12.2 Results of the NRVB 125I tracer; KI carrier diffusion experiment using NRVB equilibrated water ........................................................................................ 281 Table 12.3 Results of the NRVB 125I tracer; KI carrier diffusion experiment using NRVB equilibrated water expressed as Bq dm-3 .................................................... 282 Table 12.4 Results of the NRVB 125I tracer; KI carrier diffusion experiment using CDP solution ................................................................................................................... 283 Table 12.5 Results of the NRVB 125I tracer; KI carrier diffusion experiment using CDP solution ................................................................................................................... 284 Table 12.6 I Results for the mixed element diffusion experiments in NRVB equilibrated water ................................................................................................... 285 Table 12.7 I Results for the mixed element diffusion experiments in CDP solution 286 Table 12.8 Results of the NRVB 125I tracer only experiment using NRVB equilibrated water ...................................................................................................................... 287 Table 12.9 Results of the NRVB 125I tracer only diffusion experiment using NRVB equilibrated water expressed as concentration ...................................................... 288 Table 12.10 Results of the 125I tracer advection using CDP solution ...................... 289 Table 13.2 Results of the NRVB 90Sr tracer only diffusion experiment using NRVB equilibrated water ................................................................................................... 290 Table 13.3 Results of the NRVB 90Sr tracer only diffusion experiment using NRVB equilibrated water expressed as activity concentration .......................................... 291 Table 13.4 Results of the NRVB 90Sr tracer only diffusion experiment using CDP solution ................................................................................................................... 292 Table 13.5 Results of the NRVB 90Sr tracer only diffusion experiment using CDP solution expressed as activity concentration .......................................................... 293

264
Table 13.6 Results of the NRVB 90Sr tracer and Sr(NO3)2 carrier diffusion experiment using NRVB equilibrated water .............................................................................. 294 Table 13.7 Results of the NRVB 90Sr tracer and Sr(NO3)2 carrier diffusion experiment using NRVB equilibrated water expressed as activity concentration ...................... 295 Table 13.8 Results of the NRVB 90Sr tracer and Sr(NO3)2 carrier diffusion experiment using CDP solution ................................................................................................. 296 Table 13.9 Results of the NRVB 90Sr tracer and Sr(NO3)2 carrier diffusion experiment using CDP solution expressed as activity concentration ........................................ 297 Table 13.10 Results of the NRVB 90Sr tracer only diffusion experiment using gluconate in NRVB equilibrated water .................................................................... 298 Table 13.11 Results of the NRVB 90Sr tracer only diffusion experiment using gluconate in NRVB equilibrated water expressed as activity concentration ........... 299 Table 13.12 Results of the NRVB 90Sr tracer only diffusion experiment using high ionic strength NRVB equilibrated water .................................................................. 300 Table 13.13 Results of the NRVB 90Sr tracer only diffusion experiment using high ionic strength NRVB equilibrated water expressed as activity concentration ......... 301 Table 13.14 Results of the NRVB 90Sr tracer only diffusion experiment using gradient ionic strength NRVB equilibrated water .................................................................. 302 Table 13.15 Results of the NRVB 90Sr tracer only diffusion experiment using gradient ionic strength NRVB equilibrated water expressed as concentration ..................... 303 Table 13.16 Results of the repeated NRVB 90Sr tracer only diffusion experiment using CDP solution ................................................................................................. 304 Table 13.17 Run 1 results of the 90Sr tracer advection experiments using NRVB equilibrated water ................................................................................................... 307 Table 13.18 Run 2 results of the 90Sr tracer advection experiments using NRVB equilibrated water ................................................................................................... 309 Table 13.19 Results of the 90Sr tracer advection experiments using CDP solution 311 Table 14.2 Results of the 45Ca tracer advection experiments using NRVB equilibrated water ...................................................................................................................... 314 Table 15.2 Results for the diffusion of 63Ni tracer with NiCl2 carrier using CDP solution ................................................................................................................... 315 Table 15.3 Results for the diffusion of 63Ni tracer with NiCl2 carrier using CDP solution expressed as activity concentration .......................................................... 316 Table 15.4 Results of the 63Ni tracer advection experiments using NRVB CDP solution ................................................................................................................... 317

265
Time Sample 1 Sample 1 Sample
2 Sample 2 Average 90% conf Retention 90% conf
days d min-1 cm-3
Bq dm-3 d min-1 cm-3
Bq dm-3 Bq dm-3 +/- +/-
0 25 417 24 400 408 36 0.03 0.002
0.1 22 367 22 367 367 0 0.02 0.000
0.9 26 433 27 450 442 36 0.03 0.002
1.1 26 433 24 400 417 76 0.03 0.004
1.9 60 1000 53 883 942 259 0.06 0.015
2.1 158 2633 72 1200 1917 3199 0.13 0.189
2.9 152 2533 125 2083 2308 1004 0.16 0.059
3.2 162 2700 139 2317 2508 857 0.17 0.051
3.9 211 3517 218 3633 3575 259 0.24 0.015
4.1 221 3683 224 3733 3708 112 0.25 0.007
7 363 6050 353 5883 5967 370 0.4 0.022
8 433 7217 397 6617 6917 1339 0.47 0.079
9 487 8117 551 9183 8650 2378 0.59 0.141
10 522 8700 585 9750 9225 2342 0.63 0.139
11 567 9450 628 10467 9958 2267 0.68 0.134
12 664 11067 654 10900 10983 370 0.74 0.022
15 647 10783 678 11300 11042 1151 0.75 0.068
17 714 11900 721 12017 11958 259 0.81 0.015
18 726 12100 759 12650 12375 1227 0.84 0.073
21 772 12867 792 13200 13033 745 0.88 0.044
24 762 12700 797 13283 12992 1303 0.88 0.077
30 774 12900 739 12317 12608 1303 0.86 0.077
36 759 12650 791 13183 12917 1191 0.88 0.071
49 724 12067 801 13350 12708 2865 0.86 0.170
65 736 12267 783 13050 12658 1749 0.86 0.104
95 764 12733 752 12533 12633 446 0.86 0.026
125 806 13433 806 13433 13433 0 0.91 0.000
156 815 13583 843 14050 13817 1040 0.94 0.062
187 937 15622 965 16089 15856 1040 1.08 0.062
217 879 14644 892 14867 14756 495 1 0.029
248 873 14550 925 15417 14983 1932 1.02 0.114
308 909 15150 952 15867 15508 1597 1.05 0.095
Total 16696 17092
(d min-1)
Table 10.1 Results of the NRVB HTO diffusion experiment using NRVB equilibrated water

266
Mass eluted
(g)
Cumulative mass eluted
(g)
Flow rate
(g hr-1)
Time (hr)
d min-1 g-1 Total
(d min-1) Bq dm-3
Cumulative counts
% recovery
3.7227 3.7227 1.2409 3 127 474 2122 474 0.45
3.5982 7.3210 1.1994 6 122 439 2032 913 0.86
3.5755 10.8964 1.1918 9 136 488 2273 1400 1.32
3.3184 14.2149 1.1061 12 291 967 4855 2367 2.24
3.3782 17.5931 1.1261 15 817 2761 13622 5128 4.84
3.2675 20.8606 1.0892 18 1559 5093 25977 10221 9.65
3.2606 24.1212 1.0869 21 2137 6967 35614 17188 16.23
3.4833 27.6045 1.1611 24 2623 9139 43725 26327 24.86
3.5743 31.1788 1.1914 27 2829 10113 47156 36440 34.41
3.2156 34.3944 1.0719 30 2708 8709 45141 45149 42.63
3.2127 37.6071 1.0709 33 2583 8297 43044 53446 50.47
3.1182 40.7254 1.0394 36 2323 7244 38720 60690 57.31
3.0432 43.7685 1.0144 39 2127 6472 35444 67162 63.42
2.9590 46.7275 0.9863 42 1945 5755 32414 72917 68.85
2.7579 49.4854 0.9193 45 1699 4686 28316 77602 73.28
3.0932 52.5786 1.0311 48 1403 4340 23384 81942 77.38
2.7542 55.3328 0.9181 51 1289 3550 21484 85493 80.73
2.8250 58.1578 0.9417 54 1169 3302 19481 88795 83.85
2.1288 60.2867 0.7096 57 980 2087 16338 90882 85.82
2.7885 63.0751 0.9295 60 836 2330 13927 93212 88.02
2.6901 65.7653 0.8967 63 766 2061 12766 95272 89.96
2.6531 68.4183 0.8844 66 713 1891 11878 97163 91.75
2.7692 71.1875 0.9231 69 657 1818 10944 98981 93.47
3.2236 74.4111 1.0745 72 578 1863 9633 100845 95.23
3.5003 77.9115 1.1668 75 521 1823 8680 102668 96.95
3.4259 81.3374 1.1420 78 520 1782 8669 104450 98.63
3.3580 84.6953 1.1193 81 449 1509 7490 105959 100.06
3.2128 87.9081 1.0709 84 421 1353 7021 107312 101.33
3.1533 91.0614 1.0511 87 393 1239 6548 108551 102.50
2.5956 93.6570 0.8652 90 262 681 4373 109232 103.15
2.7182 96.3753 0.9061 93 225 612 3750 109844 103.72
5.1500 101.5252 1.7167 96 213 1099 3557 110943 104.76
2.3501 103.8753 0.7834 99 241 566 4015 111509 105.30
2.2860 106.1613 0.7620 102 249 570 4154 112078 105.83
1.7547 107.9159 0.5849 105 236 414 3930 112492 106.22
1.9677 109.8836 0.6559 108 179 352 2985 112845 106.56
1.9603 111.8440 0.6534 111 186 364 3093 113208 106.90
2.1754 114.0194 0.7251 114 173 376 2878 113584 107.26
Table 10.2 Results of the HTO NRVB advection experiment using NRVB equilibrated water

267
Mass eluted (g)
Cumulative mass eluted (g)
Flow rate (g
hr-1)
Time (hr)
d min-1 g-1 Total
d min-1 Bq dm-3
Cumulative counts
% Recovery
2.6553 2.6553 0.89 3 12 33 205 33 0.03
2.6380 5.2933 0.88 6 12 31 197 64 0.05
2.6366 7.9299 0.88 9 18 49 307 112 0.09
2.5638 10.4937 0.85 12 136 348 2262 460 0.37
2.5114 13.0051 0.84 15 1201 3015 20009 3475 2.76
2.4442 15.4493 0.81 18 2867 7008 47784 10483 8.32
2.4173 17.8665 0.81 21 4199 10151 69988 20634 16.38
2.3596 20.2261 0.79 24 4216 9949 70272 30582 24.27
2.3743 22.6004 0.79 27 4127 9798 68781 40381 32.05
2.3034 24.9038 0.77 30 3779 8704 62978 49085 38.96
2.2841 27.1879 0.76 33 3343 7636 55722 56721 45.02
1.9847 29.1727 36 5332 62053 49.25
2.2573 31.4300 0.75 39 2681 6053 44690 68106 54.05
2.2389 33.6688 0.75 42 6230 74336 59.00
2.2586 35.9274 0.75 45 2405 5431 40079 79767 63.31
2.2627 38.1901 0.75 48 2138 4837 35627 84604 67.15
2.1927 40.3828 0.73 51 1801 3950 30023 88554 70.28
2.1119 42.4947 0.70 54 1640 3464 27337 92018 73.03
2.1387 44.6334 0.71 57 1513 3236 25221 95254 75.60
2.0970 46.7304 0.70 60 1408 2953 23466 98206 77.94
2.0431 48.7735 0.68 63 1285 2626 21419 100832 80.03
2.0013 50.7748 0.67 66 1211 2423 20181 103255 81.95
1.9303 52.7051 0.64 69 1130 2181 18829 105436 83.68
1.8889 54.5940 0.63 72 1040 1965 17335 107401 85.24
1.6489 56.2429 0.55 75 957 1577 15942 108978 86.49
1.9235 58.1663 0.64 78 970 1866 16169 110844 87.97
1.8424 60.0087 0.61 81 788 1451 13128 112295 89.12
1.8869 61.8956 0.63 84 732 1381 12200 113676 90.22
1.8834 63.7790 0.63 87 670 1262 11170 114939 91.22
1.8492 65.6282 0.62 90 600 1110 10008 116049 92.10
1.7869 67.4151 0.60 93 573 1024 9555 117073 92.92
2.2411 69.6562 0.75 96 469 1051 7818 118125 93.75
2.0861 71.7423 0.70 99 465 971 7756 119096 94.52
3.6646 75.4069 0.61 105 380 1391 6326 120487 95.62
3.2407 78.6476 0.54 111 439 1421 7310 121908 96.75
3.3551 82.0027 0.56 117 342 1146 5695 123054 97.66
3.5018 85.5045 0.58 123 270 947 4507 124001 98.41
3.6319 89.1364 0.61 129 252 917 4206 124918 99.14
3.5506 92.6871 0.59 135 225 799 3750 125717 99.78
3.6710 96.3581 0.61 141 204 749 3400 126466 100.37
3.6770 100.0350 0.61 147 184 676 3063 127141 100.91
3.7245 103.7595 0.62 153 165 615 2750 127756 101.39
3.5300 107.2895 0.59 159 146 514 2425 128270 101.80
3.5045 110.7941 0.58 165 132 464 2208 128734 102.17
2.7216 113.5157 171 151 411 2516 129145 102.50
Table 10.3 Results of the HTO NRVB advection experiment using CDP solution

268
Time Sample
1 Minus blank
Counts Removed
Cmax C/Cmax Minus Blank
Counts Removed
Cmax C/Cmax Mean C/Cmax
90% conf Sample 2
Days d min-1
cm-3 d min-1
cm-3 d min-1
cm-3 d min-1
cm-3
d min-1
cm-3 d min-1
cm-3 d min-1 cm-3
d min-1
cm-3 +/-
0 86 23 23 2589 0.009 71 8 8 2589 0.003 0.006 0.013
0.5 83 20 43 2600 0.008 65 2 10 2589 0.001 0.004 0.015
1 77 14 57 2612 0.005 64 1 11 2600 0.000 0.003 0.011
1.5 97 34 91 2623 0.013 68 5 16 2612 0.002 0.007 0.025
2 155 92 183 2635 0.035 78 15 31 2624 0.006 0.020 0.065
3 255 192 375 2646 0.073 197 134 165 2635 0.051 0.062 0.048
4 329 266 641 2657 0.100 222 159 324 2646 0.060 0.080 0.089
5 428 365 1006 2667 0.137 365 302 626 2657 0.114 0.125 0.052
6 532 469 1475 2678 0.175 607 544 1170 2667 0.204 0.190 0.064
7 619 556 2031 2688 0.207 597 534 1704 2677 0.199 0.203 0.016
8 693 630 2661 2697 0.234 693 630 2334 2686 0.235 0.234 0.002
9 807 744 3405 2706 0.275 802 739 3073 2695 0.274 0.275 0.002
10 824 761 4166 2715 0.280 876 813 3886 2704 0.301 0.290 0.045
13 1059 996 5162 2724 0.366 1057 994 4880 2712 0.367 0.366 0.002
14 1081 1018 6180 2732 0.373 1125 1062 5942 2720 0.390 0.382 0.040
15 1193 1130 7310 2739 0.413 1178 1115 7057 2728 0.409 0.411 0.009
16 1223 1160 8470 2747 0.422 1157 1094 8151 2735 0.400 0.411 0.050
22 1360 1297 9767 2754 0.471 1375 1312 9463 2742 0.478 0.475 0.017
23 1405 1342 11109 2761 0.486 1383 1320 10783 2749 0.480 0.483 0.013
28 1380 1317 12426 2768 0.476 1546 1483 12266 2755 0.538 0.507 0.139
31 1508 1445 13871 2774 0.521 1565 1502 13768 2761 0.544 0.532 0.052
37 1557 1494 15365 2781 0.537 1553 1490 15258 2768 0.538 0.538 0.002
38 1605 1542 16907 2787 0.553 1606 1543 16801 2774 0.556 0.555 0.007
41 1614 1551 18458 2793 0.555 1673 1610 18411 2779 0.579 0.567 0.054
44 1703 1640 20098 2799 0.586 1633 1570 19981 2785 0.564 0.575 0.050
45 1637 1574 21672 2805 0.561 1642 1579 21560 2791 0.566 0.563 0.010
48 1608 1545 23217 2811 0.550 1689 1626 23186 2797 0.581 0.565 0.071
50 1862 1799 25016 2816 0.639 1759 1696 24882 2803 0.605 0.622 0.075
56 1625 1562 26578 2823 0.553 1777 1714 26596 2808 0.610 0.582 0.127
62 1659 1596 28174 2829 0.564 1749 1686 28282 2814 0.599 0.582 0.078
69 1732 1669 29843 2835 0.589 1769 1706 29988 2820 0.605 0.597 0.036
77 1770 1707 31550 2841 0.601 1780 1717 31705 2825 0.608 0.604 0.015
83 1728 1665 33215 2847 0.585 1805 1742 33447 2831 0.615 0.600 0.068
104 1738 1675 34890 2853 0.587 1886 1823 35270 2836 0.643 0.615 0.124
133 1852 1789 36679 2859 0.626 1792 1729 36999 2842 0.608 0.617 0.039
164 1799 1736 38415 2865 0.606 1822 1759 38758 2848 0.618 0.612 0.026
195 1734 1671 40086 2871 0.582 1880 1817 40575 2853 0.637 0.609 0.122
224 1715 1652 41738 2878 0.574 1778 1715 42290 2859 0.600 0.587 0.058
253 1686 1623 43361 2884 0.563 1775 1712 44002 2865 0.598 0.580 0.078
286 1780 1717 45078 2891 0.594 1852 1789 45791 2871 0.623 0.609 0.065
316 1659 1596 46674 2898 0.551 1653 1590 47381 2878 0.552 0.552 0.004
344 1730 1667 48341 2904 0.574 1660 1597 48978 2885 0.554 0.564 0.046
378 1731 1668 50009 2911 0.573 1658 1595 50573 2892 0.552 0.562 0.048

269
Table 11.2 Results of the NRVB 137Cs tracer only diffusion experiment using NRVB equilibrated water
407 1737 1674 51683 2918 0.574 1724 1661 52234 2899 0.573 0.573 0.002
437 1608 1545 53228 2926 0.528 1635 1572 53806 2906 0.541 0.534 0.029
499 1929 1866 55672 2912 0.641 0.641
528 1918 1855 57527 2918 0.636 0.636
560 1834 1771 59298 2924 0.606 0.606
591 1841 1778 61076 2931 0.607 0.607

270
Time Sample 1 Sample 2 Mean 90% conf
Days Bq dm-3 Bq dm-3 Bq dm-3 +/-
0 383 133 258 558
0.5 333 33 183 669
1 233 17 125 482
1.5 567 83 325 1080
2 1533 250 892 2865
3 3200 2233 2717 2155
4 4433 2650 3542 3980
5 6083 5033 5558 2342
6 7817 9067 8442 2789
7 9267 8900 9083 817
8 10500 10500 10500 0
9 12400 12317 12358 187
10 12683 13550 13117 1932
13 16600 16567 16583 76
14 16967 17700 17333 1637
15 18833 18583 18708 558
16 19333 18233 18783 2454
22 21617 21867 21742 558
23 22367 22000 22183 817
28 21950 24717 23333 6171
31 24083 25033 24558 2119
37 24900 24833 24867 147
38 25700 25717 25708 36
41 25850 26833 26342 2195
44 27333 26167 26750 2601
45 26233 26317 26275 187
48 25750 27100 26425 3012
50 29983 28267 29125 3828
56 26033 28567 27300 5653
62 26600 28100 27350 3346
69 27817 28433 28125 1374
77 28450 28617 28533 370
83 27750 29033 28392 2865
104 27917 30383 29150 5501
133 29817 28817 29317 2231
164 28933 29317 29125 857
195 27850 30283 29067 5430
224 27533 28583 28058 2342
253 27050 28533 27792 3311
286 28617 29817 29217 2677
316 26600 26500 26550 223
344 27783 26617 27200 2601
378 27800 26583 27192 2713
407 27900 27683 27792 482
437 25750 26200 25975 1004
499 31100 31100
528 30917 30917
Table 11.3 Results of the NRVB 137Cs tracer only diffusion experiment using NRVB equilibrated water expressed as activity concentrations

271
Time Sample 1 Minus blank
Counts Remove
Cmax C/Cmax Sample 2 Minus Blank
Counts Remove
Cmax C/Cmax Mean C/Cmax
90% conf.
Days d min-1
cm-3 d min-1
cm-3 d min-1
cm-3 d min-1
cm-3
d min-1
cm-3 d min-1
cm-3 d min-1
cm-3 d min-1
cm-3 +/-
0.5 78 0 0 2568 0.00 78 0 0 2568 0.00 0.00 0.000
1 78 0 0 2568 0.00 103 25 25 2568 0.01 0.00 0.022
1.5 80 17 17 2580 0.01 106 43 68 2580 0.02 0.01 0.022
2 168 105 122 2591 0.04 244 181 249 2591 0.07 0.06 0.065
2.5 319 256 378 2603 0.10 448 385 634 2602 0.15 0.12 0.111
3 515 452 830 2613 0.17 747 684 1318 2612 0.26 0.22 0.198
3.5 984 921 1751 2623 0.35 1172 1109 2427 2621 0.42 0.39 0.161
4 1240 1177 2928 2631 0.45 1376 1313 3740 2628 0.50 0.47 0.117
4.5 1339 1276 4204 2638 0.48 1544 1481 5221 2634 0.56 0.52 0.175
5 1458 1395 5599 2644 0.53 1706 1643 6864 2639 0.62 0.58 0.212
7 1716 1653 7252 2650 0.62 1819 1756 8620 2644 0.66 0.64 0.090
8 1827 1764 9016 2654 0.66 1993 1930 10550 2648 0.73 0.70 0.143
9 2006 1943 10959 2659 0.73 2074 2011 12561 2651 0.76 0.74 0.062
10 1969 1906 12865 2662 0.72 2247 2184 14745 2654 0.82 0.77 0.238
11 1920 1857 14722 2666 0.70 2345 2282 17027 2657 0.86 0.78 0.362
12 2037 1974 16696 2669 0.74 2294 2231 19258 2658 0.84 0.79 0.223
15 2119 2056 18752 2673 0.77 2394 2331 21589 2661 0.88 0.82 0.238
17 2211 2148 20900 2663 0.81 2350 2287 26324 2663 0.86 0.83 0.116
18 2302 2239 23139 2665 0.84 2243 2180 28504 2665 0.82 0.83 0.049
37 2370 2307 25446 2667 0.86 2326 2263 30767 2667 0.85 0.86 0.037
66 2364 2301 27747 2669 0.86 2403 2340 33107 2669 0.88 0.87 0.033
96 2233 2170 29917 2671 0.81 2121 2058 35165 2671 0.77 0.79 0.094
127 2442 2379 32296 2673 0.89 2402 2339 37504 2674 0.87 0.88 0.034
158 2454 2391 34687 2675 0.89 2472 2409 39913 2676 0.90 0.90 0.014
187 2529 2466 37153 2676 0.92 2605 2542 42455 2677 0.95 0.94 0.063
209 2542 2479 39632 2677 0.93 2313 2250 44705 2678 0.84 0.88 0.192
240 2480 2417 42049 2678 0.90 2436 2373 47078 2680 0.89 0.89 0.038
300 2423 2360 44409 2680 0.88 2498 2435 49513 2681 0.91 0.89 0.062
Table 11.4 Results of the NRVB 137Cs tracer only diffusion experiment using CDP solution

272
Time Sample 1 Sample 2 Mean 90% conf
Days Bq dm-3 Bq dm-3 Bq dm-3 +/-
0.5 0 0 0 0
1 0 417 208 928
1.5 283 717 500 968
2 1750 3017 2383 2824
2.5 4267 6417 5342 4796
3 7533 11400 9467 8625
3.5 15350 18483 16917 6992
4 19617 21883 20750 5055
4.5 21267 24683 22975 7621
5 23250 27383 25317 9223
7 27550 29267 28408 3828
8 29400 32167 30783 6171
9 32383 33517 32950 2530
10 31767 36400 34083 10338
11 30950 38033 34492 15804
12 32900 37183 35042 9557
15 34267 38850 36558 10227
17 35800 38117 36958 5167
18 37317 36333 36825 2195
37 38450 37717 38083 1637
66 38350 39000 38675 1450
96 36167 34300 35233 4163
127 39650 38983 39317 1486
158 39850 40150 40000 669
187 41100 42367 41733 2824
209 41317 37500 39408 8513
240 40283 39550 39917 1637
300 39333 40583 39958 2789
Table 11.5 Results of the NRVB 137Cs tracer only diffusion experiment using CDP solution expressed as activity concentrations

273
Time Sample 1 Minus blank
Counts Remove
Cmax C/Cmax Sample 2 Minus Blank
Counts Removed
Cmax C/Cmax Mean C/Cmax
90% conf
Days d min-1
cm-3 d min-1
cm-3 d min-1
cm-3 d min-1
cm-3 d min-1
cm-3 d min-1
cm-3 d min-1 cm-3
d min-1
cm-3 +/-
0 107 44 44 3038.3 0.01 67 4 4 3038 0.00 0.008 0.032
0.5 101 38 82 3051.7 0.01 72 9 13 3052 0.00 0.008 0.021
1 136 73 155 3065.3 0.02 63 0 13 3066 0.00 0.012 0.053
1.5 127 64 219 3078.8 0.02 80 17 30 3079 0.01 0.013 0.034
2 138 75 294 3092.5 0.02 109 46 76 3093 0.01 0.02 0.021
2.5 161 98 392 3106.3 0.03 122 59 135 3107 0.02 0.025 0.028
3 260 197 589 3120.1 0.06 227 164 299 3121 0.05 0.058 0.024
3.5 319 256 845 3133.6 0.08 280 217 516 3135 0.07 0.075 0.028
4 432 369 1214 3146.9 0.12 400 337 853 3148 0.11 0.112 0.023
4.5 502 439 1653 3159.8 0.14 473 410 1263 3161 0.13 0.134 0.021
6 981 918 2571 3172.5 0.29 870 807 2070 3174 0.25 0.272 0.078
7 976 913 3484 3183.1 0.29 1247 1184 3254 3185 0.37 0.329 0.189
8 1559 1496 4980 3193.8 0.47 2064 2001 5255 3195 0.63 0.547 0.352
9 1728 1665 6645 3201.9 0.52 1841 1778 7033 3201 0.56 0.538 0.079
10 2054 1991 8636 3209.2 0.62 2094 2031 9064 3207 0.63 0.627 0.029
11 2319 2256 10892 3215 0.70 2233 2170 11234 3213 0.68 0.689 0.059
14 2384 2321 13213 3219.6 0.72 2543 2480 13714 3218 0.77 0.746 0.111
16 2577 2514 15727 3224 0.78 2606 2543 16257 3222 0.79 0.785 0.021
18 2634 2571 18298 3227.4 0.80 2906 2843 19100 3225 0.88 0.839 0.189
21 2847 2784 21082 3230.6 0.86 2809 2746 21846 3227 0.85 0.856 0.024
36 3071 3008 24090 3232.8 0.93 2693 2630 24476 3229 0.81 0.872 0.259
65 2730 2667 26757 3233.9 0.82 3066 3003 27479 3232 0.93 0.877 0.233
95 2665 2602 29359 3236.7 0.80 2799 2736 30215 3233 0.85 0.825 0.095
126 3258 3195 32554 3239.9 0.99 3204 3141 33356 3236 0.97 0.978 0.035
157 3251 3188 35742 3240.1 0.98 3115 3052 36408 3236 0.94 0.964 0.091
186 3213 3150 38892 3240.4 0.97 3222 3159 39567 3237 0.98 0.974 0.008
218 3110 3047 41939 3240.8 0.94 3212 3149 42716 3237 0.97 0.956 0.073
249 3216 3153 45092 3241.8 0.97 3106 3043 45759 3238 0.94 0.956 0.073
309 3187 3124 48216 3242.3 0.96 3070 3007 48766 3239 0.93 0.946 0.078
Table 11.6 Results of the NRVB 137Cs tracer; CsNO3 carrier diffusion experiment using NRVB equilibrated water

274
Time Sample 1 Sample 2 Mean 90% conf
Days Bq dm-3 Bq dm-3 Bq dm-3 +/-
0 733 67 400 1486
0.5 633 150 392 1080
1 1217 0 608 2713
1.5 1067 283 675 1749
2 1250 767 1008 1080
2.5 1633 983 1308 1450
3 3283 2733 3008 1227
3.5 4267 3617 3942 1450
4 6150 5617 5883 1191
4.5 7317 6833 7075 1080
6 15300 13450 14375 4127
7 15217 19733 17475 10075
8 24933 33350 29142 18775
9 27750 29633 28692 4203
10 33183 33850 33517 1486
11 37600 36167 36883 3199
14 38683 41333 40008 5912
16 41900 42383 42142 1080
18 42850 47383 45117 10115
21 46400 45767 46083 1414
36 50133 43833 46983 14055
65 44450 50050 47250 12493
95 43367 45600 44483 4984
126 53250 52350 52800 2008
157 53133 50867 52000 5055
186 52500 52650 52575 335
218 50783 52483 51633 3793
249 52550 50717 51633 4092
309 52067 50117 51092 4350
Table 11.7 Results of the NRVB 137Cs tracer; CsNO3 carrier diffusion experiment using NRVB equilibrated water

275
Time Sample 1 Minus blank
Counts Removed
Cmax C/Cmax Sample 2 Minus Blank
Counts Removed
Cmax C/Cmax Mean C/Cmax
90% conf
Days d min-1
cm-3 d min-1
cm-3 d min-1 cm-3
d min-1
cm-3
d min-1
cm-3 d min-1
cm-3 d min-1 cm-3
d min-1
cm-3 +/-
0 101 38 38 3024.8 0.01 83 20 20 3025 0.01 0.01 0.013
0.5 136 73 111 3038.1 0.02 98 35 55 3038 0.01 0.018 0.028
1 146 83 194 3051.4 0.03 108 45 100 3052 0.01 0.021 0.028
1.5 150 87 281 3064.8 0.03 167 104 204 3065 0.03 0.031 0.012
2 228 165 446 3078.3 0.05 205 142 346 3079 0.05 0.05 0.017
2.5 254 191 637 3091.5 0.06 249 186 532 3092 0.06 0.061 0.004
3 424 361 998 3104.7 0.12 437 374 906 3105 0.12 0.118 0.009
3.5 438 375 1373 3117.3 0.12 477 414 1320 3118 0.13 0.127 0.028
4 586 523 1896 3130 0.17 728 665 1985 3130 0.21 0.19 0.101
4.5 763 700 2596 3142 0.22 1143 1080 3065 3142 0.34 0.283 0.270
6 1162 1099 3695 3153.4 0.35 1553 1490 4555 3151 0.47 0.411 0.277
7 1516 1453 5148 3163 0.46 1909 1846 6401 3159 0.58 0.522 0.279
8 1593 1530 6678 3171 0.48 2007 1944 8345 3165 0.61 0.548 0.294
9 1870 1807 8485 3178.8 0.57 2296 2233 10578 3171 0.70 0.636 0.303
10 2088 2025 10510 3185.3 0.64 2531 2468 13046 3175 0.78 0.706 0.316
11 2414 2351 12861 3190.8 0.74 2607 2544 15590 3179 0.80 0.769 0.142
14 2596 2533 15394 3194.8 0.79 2782 2719 18309 3182 0.85 0.824 0.138
16 2930 2867 18261 3198 0.90 2812 2749 21058 3184 0.86 0.88 0.074
18 2825 2762 21023 3199.6 0.86 2957 2894 23952 3186 0.91 0.886 0.101
21 3029 2966 23989 3201.7 0.93 2853 2790 26742 3187 0.88 0.901 0.114
36 2959 2896 26885 3202.9 0.90 3008 2945 29687 3189 0.92 0.914 0.043
65 2993 2930 29815 3204.4 0.91 2761 2698 32385 3191 0.85 0.88 0.154
95 3175 3112 32927 3205.7 0.97 3027 2964 35349 3193 0.93 0.95 0.095
126 3241 3178 36105 3206.2 0.99 2580 2517 37866 3194 0.79 0.89 0.453
157 3215 3152 39257 3206.3 0.98 3065 3002 40868 3198 0.94 0.961 0.099
186 3328 3265 42522 3206.6 1.02 3165 3102 43970 3199 0.97 0.994 0.108
218 3151 3088 45610 3206.3 0.96 3095 3032 47002 3199 0.95 0.955 0.034
249 3051 2988 48598 3206.9 0.93 3154 3091 50093 3200 0.97 0.949 0.076
309 3041 2978 51576 3208 0.93 3086 3023 53116 3200 0.94 0.936 0.037
Table 11.8 Results of the NRVB 137Cs tracer; CsNO3 carrier diffusion experiment using CDP solution

276
Time Sample1 Sample 2 Mean 90% conf
Days Bq dm-3 Bq dm-3 Bq dm-3
0 633 333 483 669
0.5 1217 583 900 1414
1 1383 750 1067 1414
1.5 1450 1733 1592 634
2 2750 2367 2558 857
2.5 3183 3100 3142 187
3 6017 6233 6125 482
3.5 6250 6900 6575 1450
4 8717 11083 9900 5278
4.5 11667 18000 14833 14131
6 18317 24833 21575 14537
7 24217 30767 27492 14613
8 25500 32400 28950 15393
9 30117 37217 33667 15840
10 33750 41133 37442 16473
11 39183 42400 40792 7175
14 42217 45317 43767 6916
16 47783 45817 46800 4386
18 46033 48233 47133 4908
21 49433 46500 47967 6546
36 48267 49083 48675 1820
65 48833 44967 46900 8625
95 51867 49400 50633 5501
126 52967 41950 47458 24576
157 52533 50033 51283 5577
186 54417 51700 53058 6059
218 51467 50533 51000 2084
249 49800 51517 50658 3828
309 49633 50383 50008 1673
Table 11.9 Results of the NRVB 137Cs tracer; CsNO3 carrier diffusion experiment using CDP solution

277
Sample 1y-1 1y-2 2y-1 2y-2 3y-1 3y-2 4y-1 4y-2 4y-3 Spare 1 Spare 2 Average
Days 10-3 mol dm-3
10-3 mol dm-3
10-3 mol dm-3
10-3 mol dm-3
10-3 mol dm-3
10-3 mol dm-3
10-3 mol dm-3
10-3 mol dm-3
10-3 mol dm-3
10-3 mol dm-3
10-3 mol dm-3
10-3 mol dm-3
0 0.00 0.01 0.01 0.00 0.00 0.00 0.01 0.01 0.01 0.01 0.01 0.01
7 0.07 0.04 0.06 0.07 0.08 0.05 0.08 0.00 0.01 0.10 0.06 0.06
14 0.18 0.13 0.22 0.19 0.24 0.17 0.20 0.17 0.17 0.24 0.23 0.19
21 0.25 0.16 0.32 0.27 0.31 0.24 0.25 0.24 0.28 0.31 0.25 0.26
28 0.33 0.24 0.47 0.37 0.45 0.33 0.34 0.34 0.41 0.39 0.46 0.38
59 0.33 0.25 0.47 0.40 0.51 0.39 0.40 0.34 0.45 0.46 0.40 0.40
94 0.40 0.28 0.48 0.36 0.14 0.33 0.43 0.34 0.40 0.38 0.40 0.36
121 0.40 0.25 0.62 0.54 0.40 0.50 0.42 0.07 0.59 0.49 0.51 0.43
156 0.39 0.26 0.50 0.44 0.17 0.36 0.55 0.37 0.44 0.58 0.41 0.41
185 0.35 0.24 0.47 0.46 0.36 0.35 0.31 0.44 0.41 0.37 0.38
215 0.57 0.31 0.60 0.47 0.66 0.16 0.17 0.50 0.53 0.59 0.64 0.47
246 0.39 0.33 0.70 0.41 0.66 0.56 0.31 0.49 0.52 0.57 0.37 0.48
275 0.38 0.22 0.46 0.31 0.51 0.26 0.30 0.34 0.35 0.39 0.30 0.35
304 0.36 0.21 0.41 0.33 0.40 0.30 0.32 0.33 0.38 0.41 0.34 0.35
337 0.31 0.23 0.50 0.31 0.35 0.43 0.36 0.35 0.40 0.43 0.35 0.37
368 0.38 0.25 0.47 0.35 0.49 0.35 0.36 0.34 0.42 0.43 0.42 0.39
488 0.90 0.86 0.84 0.66 0.48 0.43 0.73 0.84 0.68 0.71
550 0.60 0.69 1.00 0.40 0.42 0.57 0.36 0.69 0.57 0.59
Table 11.10 Cs Results for the mixed element diffusion experiments in NRVB equilibrated water

278
Sample 1y-1 1y-2 2y-1 2y-2 3y-1 3y-2 4y-1 4y-2 4y-3 Spare 1 Spare 2 Average
Days 10-3 mol dm-3
10-3 mol dm-3
10-3 mol dm-3
10-3 mol dm-3
10-3 mol dm-3
10-3 mol dm-3
10-3 mol dm-3
10-3 mol dm-3
10-3 mol dm-3
10-3 mol dm-3
10-3 mol dm-3
10-3 mol dm-3
0 0.00 0.00 0.00 0.00 0.00 0.00 0.00 0.00 0.00 0.00 0.00 0.00
7 0.32 0.23 0.27 0.28 0.34 0.29 0.32 0.27 0.31 0.27 0.25 0.29
13 0.45 0.30 0.34 0.41 0.47 0.43 0.54 0.42 0.42 0.36 0.35 0.41
19 0.44 0.24 0.36 0.42 0.53 0.49 0.58 0.45 0.50 0.41 0.38 0.44
28 0.50 0.32 0.33 0.40 0.52 0.40 0.55 0.42 0.51 0.43 0.43 0.44
60 0.49 0.32 0.35 0.41 0.52 0.40 0.59 0.46 0.50 0.44 0.43 0.45
87 0.73 0.41 0.48 0.68 0.63 0.91 0.80 0.41 0.91 0.69 0.50 0.65
122 0.48 0.40 0.44 0.46 0.57 0.49 0.62 0.46 0.53 0.46 0.45 0.49
151 0.43 0.39 0.41 0.46 0.47 0.43 0.59 0.47 0.47 0.45 0.40 0.45
181 0.35 0.24 0.47 0.00 0.46 0.36 0.35 0.31 0.44 0.41 0.37 0.38
212 0.61 0.47 0.35 0.33 0.54 0.49 0.70 0.59 0.71 0.32 0.62 0.52
241 0.40 0.29 0.35 0.36 0.36 0.46 0.53 0.40 0.44 0.37 0.44 0.40
270 0.42 0.27 0.32 0.38 0.42 0.38 0.50 0.39 0.41 0.41 0.38 0.39
303 0.53 0.32 0.36 0.43 0.43 0.44 0.50 0.39 0.41 0.52 0.49 0.44
334 0.48 0.34 0.36 0.40 0.50 0.46 0.58 0.45 0.48 0.43 0.41 0.44
424
0.53 0.56 0.83 0.65 0.63 0.76 0.82 0.85 0.00 0.70
485
0.58 0.75 0.84 0.82 0.75 1.05 0.00 0.70 0.73 0.78
Table 11.11 Cs Results for the mixed element NRVB diffusion experiments in CDP solution

279
Mass eluted
(g)
Cumulative mass eluted
(g)
Flow rate (g
hr-1)
Time (hr)
d min-
1 g-1 Total
d min-1 Bq
dm-3 Cumulative counts min-1
% recovery
3.6031 3.6031 1.80 2 24 87 1450 87 0.00
3.4189 7.0220 1.71 4 21 73 1217 160 0.00
3.5667 10.5886 1.78 6 24 84 1400 244 0.00
3.5600 14.1486 1.78 8 42 150 2500 394 0.00
3.6011 17.7497 1.80 10 85 307 5117 701 0.00
3.3494 21.0992 1.67 12 224 749 12483 1450 0.01
2.9809 24.0801 1.49 14 471 1403 23383 2853 0.02
2.7390 26.8191 1.37 16 769 2106 35100 4959 0.03
2.6690 29.4881 1.33 18 1051 2804 46733 7763 0.04
2.6501 32.1382 1.33 20 1280 3391 56517 11154 0.06
2.4701 34.6083 1.24 22 1674 4136 68933 15290 0.09
2.5819 37.1901 1.29 24 1700 4389 73150 19679 0.11
2.3736 39.5637 1.19 26 1834 4353 72550 24032 0.14
2.5193 42.0830 1.26 28 1863 4693 78217 28725 0.16
2.5284 44.6115 1.26 30 1832 4633 77217 33358 0.19
2.2606 46.8721 1.13 32 1857 4197 69950 37555 0.21
2.4939 49.3660 1.25 34 1718 4285 71417 41840 0.24
2.4793 51.8453 1.24 36 1687 4183 69717 46023 0.26
2.4673 54.3126 1.23 38 1603 3955 65917 49978 0.29
2.3167 56.6293 1.16 40 1525 3534 58900 53512 0.31
2.4499 59.0791 1.22 42 1483 3632 60533 57144 0.33
2.2643 61.3434 1.13 44 1356 3071 51183 60215 0.34
2.4229 63.7663 1.21 46 1188 2879 47983 63094 0.36
2.4650 66.2314 1.23 48 1153 2843 47383 65937 0.38
2.4551 68.6865 1.23 50 1074 2638 43967 68575 0.39
2.5035 71.1900 1.25 52 977 2445 40750 71020 0.41
2.4928 73.6828 1.25 54 965 2405 40083 73425 0.42
2.4873 76.1701 1.24 56 912 2269 37817 75694 0.43
2.4905 78.6606 1.25 58 835 2079 34650 77773 0.45
2.2205 80.8810 1.11 60 770 1709 28483 79482 0.46
2.4616 83.3426 1.23 62 682 1679 27983 81161 0.46
2.4440 85.7866 1.22 64 643 1571 26183 82732 0.47
2.4503 88.2370 1.23 66 589 1444 24067 84176 0.48
2.4432 90.6802 1.22 68 572 1397 23283 85573 0.49
2.4875 93.1677 1.24 70 560 1394 23233 86967 0.50
2.1631 95.3308 1.08 72 516 1117 18617 88084 0.50
2.4669 97.7978 1.23 74 454 1119 18650 89203 0.51
2.3386 100.1364 1.17 76 528 1234 20567 90437 0.52
2.4770 102.6134 1.24 78 508 1259 20983 91696 0.52
2.4491 105.0625 1.22 80 456 1117 18617 92813 0.53
2.4956 107.5580 1.25 82 418 1043 17383 93856 0.54
2.4727 110.0307 1.24 84 339 838 13967 94694 0.54
2.4546 112.4853 1.23 86 281 690 11500 95384 0.55
2.4715 114.9568 1.24 88 287 710 11833 96094 0.55
2.4891 117.4459 1.24 90 271 675 11250 96769 0.55
2.4793 119.9253 1.24 92 269 667 11117 97436 0.56
2.5357 122.4610 1.27 94 249 631 10517 98067 0.56
2.1145 124.5755 1.06 96 276 583 9717 98650 0.56
1.7030 126.2785 0.85 98 313 533 8883 99183 0.57
1.7483 128.0268 0.87 100 298 521 8683 99704 0.57

280
1.7564 129.7832 0.88 102 278 489 8150 100193 0.57
1.6938 131.4770 0.85 104 270 457 7617 100650 0.58
1.7027 133.1796 0.85 106 250 426 7100 101076 0.58
1.7123 134.8919 0.86 108 244 417 6950 101493 0.58
1.6475 136.5394 0.82 110 238 392 6533 101885 0.58
1.6544 138.1939 0.83 112 233 385 6417 102270 0.59
1.6610 139.8549 0.83 114 215 357 5950 102627 0.59
1.6656 141.5205 0.83 116 215 358 5967 102985 0.59
1.7316 143.2521 0.87 118 198 342 5700 103327 0.59
1.2078 144.4600 0.60 120 223 269 4483 103596 0.59
1.4336 145.8936 0.72 122 148 212 3533 103808 0.59
1.9249 147.8185 0.96 124 142 274 4567 104082 0.60
1.8986 149.7171 0.95 126 153 290 4833 104372 0.60
1.7948 151.5119 0.90 128 162 290 4833 104662 0.60
1.7272 153.2391 0.86 130 158 273 4550 104935 0.60
1.6966 154.9356 0.85 132 157 267 4450 105202 0.60
1.6637 156.5993 0.83 134 157 262 4367 105464 0.60
1.6690 158.2683 0.83 136 152 253 4217 105717 0.61
1.5959 159.8643 0.80 138 145 232 3867 105949 0.61
1.6386 161.5029 0.82 140 143 234 3900 106183 0.61
1.6414 163.1443 0.82 142 135 221 3683 106404 0.61
Table 11.12 Results of the 137Cs tracer advection using NRVB equilibrated water

281
Time Sample
1 Minus blank
Counts Removed
Cmax C/Cmax Sample
2 Minus Blank
Counts Removed
Cmax C/Cmax Mean C/Cmax
90% conf
Days d min-1
cm-3 d min-
1 cm-3 d min-1
cm-3 d min-1
cm-3
d min-1
cm-3 d min-1
cm-3 d min-1
cm-3 d min-1
cm-3 +/-
0 17 2 2 665 0.00 24 9 9 662 0.01 0.01 0.024
3 18 3 5 668 0.00 23 8 17 665 0.01 0.01 0.017
4 30 15 20 671 0.02 34 19 36 668 0.03 0.03 0.014
5 50 35 55 674 0.05 49 34 70 671 0.05 0.05 0.003
6 76 61 116 676 0.09 71 56 126 673 0.08 0.09 0.016
7 108 93 209 679 0.14 94 79 205 676 0.12 0.13 0.045
10 164 149 358 682 0.22 146 131 336 679 0.19 0.21 0.057
11 197 182 540 684 0.27 189 174 510 682 0.26 0.26 0.024
12 203 188 728 687 0.27 199 184 694 684 0.27 0.27 0.011
13 228 213 941 689 0.31 215 200 894 686 0.29 0.30 0.040
14 228 213 1154 691 0.31 226 211 1105 689 0.31 0.31 0.004
17 269 254 1408 694 0.37 288 273 1378 691 0.40 0.38 0.064
19 296 281 1689 696 0.40 297 282 1660 693 0.41 0.41 0.007
25 323 308 1997 698 0.44 366 351 2011 695 0.51 0.47 0.142
31 378 363 2360 699 0.52 367 352 2363 696 0.51 0.51 0.030
38 380 365 2725 701 0.52 366 351 2714 698 0.50 0.51 0.040
46 380 365 3090 703 0.52 384 369 3083 700 0.53 0.52 0.017
52 379 364 3454 704 0.52 403 388 3471 701 0.55 0.53 0.081
73 364 349 3803 706 0.49 389 374 3845 703 0.53 0.51 0.084
102 386 371 4174 708 0.52 396 381 4226 705 0.54 0.53 0.037
133 376 361 4535 709 0.51 364 349 4575 706 0.49 0.50 0.033
Table 12.2 Results of the NRVB 125I tracer; KI carrier diffusion experiment using NRVB equilibrated water

282
Time Sample 1 Sample 2 Mean 90% conf
Days Bq dm-3 Bq dm-3 Bq dm-3 +/-
0 33 150 92 260
3 50 133 92 186
4 250 317 283 149
5 583 567 575 37
6 1017 933 975 186
7 1550 1317 1433 521
10 2483 2183 2333 669
11 3033 2900 2967 297
12 3133 3067 3100 149
13 3550 3333 3442 483
14 3550 3517 3533 74
17 4233 4550 4392 706
19 4683 4700 4692 37
25 5133 5850 5492 1599
31 6050 5867 5958 409
38 6083 5850 5967 521
46 6083 6150 6117 149
52 6067 6467 6267 892
73 5817 6233 6025 930
102 6183 6350 6267 372
133 6017 5817 5917 446
Table 12.3 Results of the NRVB 125I tracer; KI carrier diffusion experiment using NRVB equilibrated water expressed as Bq dm-3

283
Table 12.4 Results of the NRVB 125I tracer; KI carrier diffusion experiment using CDP solution
Time Sample 1 Minus blank
Counts Remove
Cmax C/Cmax Sampl
e 2 Minus Blank
Counts Remove
Cmax C/Cmax Mean C/Cmax
90% conf
Days d min-1
cm-3 d min-1
cm-3 d min-1
cm-3 d min-
1 cm-3
d min-1
cm-3 d min-1
cm-3 d min-1
cm-3 d min-1
cm-3 +/-
0 19 1 1 1248 0.00 16 0 0 1248 0.00 0.00 0.002
0.5 19 1 2 1254 0.00 18 0 0 1254 0.00 0.00 0.002
1 22 4 6 1260 0.00 16 0 0 1260 0.00 0.00 0.007
2 80 62 68 1265 0.05 63 45 45 1265 0.04 0.04 0.030
3 189 171 239 1271 0.13 165 147 192 1271 0.12 0.13 0.042
4 293 275 514 1276 0.22 262 244 436 1276 0.19 0.20 0.054
5 417 399 913 1281 0.31 399 381 817 1281 0.30 0.30 0.032
7 562 544 1457 1285 0.42 557 539 1356 1285 0.42 0.42 0.009
8 622 604 2061 1288 0.47 595 577 1933 1289 0.45 0.46 0.047
9 666 648 2709 1291 0.50 637 619 2552 1292 0.48 0.49 0.051
10 719 701 3410 1294 0.54 692 674 3226 1295 0.52 0.53 0.047
13 741 723 4133 1297 0.56 738 720 3946 1298 0.55 0.56 0.006
14 829 811 4944 1300 0.62 798 780 4726 1301 0.60 0.61 0.054
15 850 832 5776 1302 0.64 823 805 5531 1303 0.62 0.63 0.047
16 869 851 6627 1304 0.65 886 868 6399 1306 0.66 0.66 0.028
19 918 900 7527 1307 0.69 898 880 7279 1308 0.67 0.68 0.035
20 919 901 8428 1309 0.69 870 852 8131 1310 0.65 0.67 0.085
21 954 936 9364 1311 0.71 919 901 9032 1312 0.69 0.70 0.061
22 932 914 10278 1312 0.70 910 892 9924 1314 0.68 0.69 0.039
38 908 890 11168 1314 0.68 892 874 10798 1316 0.66 0.67 0.029
67 886 868 12036 1317 0.66 932 914 11712 1318 0.69 0.68 0.076
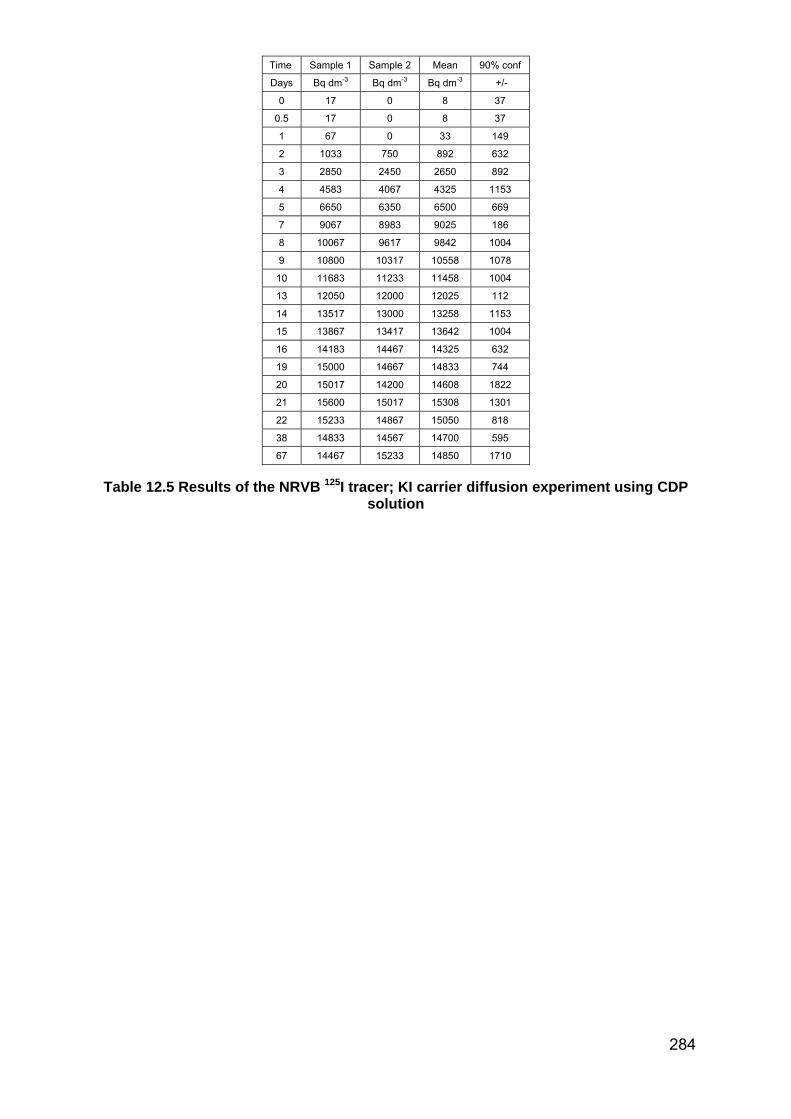
284
Time Sample 1 Sample 2 Mean 90% conf
Days Bq dm-3 Bq dm-3 Bq dm-3 +/-
0 17 0 8 37
0.5 17 0 8 37
1 67 0 33 149
2 1033 750 892 632
3 2850 2450 2650 892
4 4583 4067 4325 1153
5 6650 6350 6500 669
7 9067 8983 9025 186
8 10067 9617 9842 1004
9 10800 10317 10558 1078
10 11683 11233 11458 1004
13 12050 12000 12025 112
14 13517 13000 13258 1153
15 13867 13417 13642 1004
16 14183 14467 14325 632
19 15000 14667 14833 744
20 15017 14200 14608 1822
21 15600 15017 15308 1301
22 15233 14867 15050 818
38 14833 14567 14700 595
67 14467 15233 14850 1710
Table 12.5 Results of the NRVB 125I tracer; KI carrier diffusion experiment using CDP solution

285
Sample 1y-1 1y-2 2y-1 2y-2 3y-1 3y-2 4y-1 4y-2 4y-3 Spare
1 Spare
2 Mean
Days 10-3 mol dm-3
10-3 mol dm-3
10-3 mol dm-3
10-3 mol dm-3
10-3 mol dm-3
10-3 mol dm-3
10-3 mol dm-3
10-3 mol dm-3
10-3 mol dm-3
10-3 mol dm-3
10-3 mol dm-3
10-3 mol dm-3
0 0.00 0.00 0.00 0.00 0.00 0.00 0.00 0.00 0.00 0.00 0.00 0.00
7 0.00 0.00 0.00 0.02 0.02 0.00 0.01 0.00 0.00 0.03 0.00 0.01
14 0.08 0.03 0.08 0.09 0.09 0.07 0.10 0.08 0.12 0.10 0.09 0.08
21 0.14 0.03 0.14 0.14 0.18 0.14 0.16 0.17 0.22 0.17 0.12 0.15
28 0.19 0.11 0.31 0.18 0.22 0.18 0.20 0.18 0.24 0.22 0.18 0.20
59 0.23 0.14 0.24 0.24 0.27 0.22 0.21 0.23 0.26 0.25 0.22 0.23
94 0.26 0.14 0.26 0.24 0.28 0.22 0.25 0.24 0.28 0.26 0.23 0.24
121 0.25 0.15 0.26 0.25 0.28 0.22 0.25 0.25 0.28 0.25 0.21 0.24
156 0.22 0.13 0.23 0.22 0.25 0.21 0.23 0.21 0.25 0.23 0.20 0.22
185 0.21 0.14 0.25 0.27 0.21 0.23 0.22 0.27 0.23 0.21 0.22
215 0.26 0.11 0.33 0.21 0.27 0.16 0.20 0.22 0.26 0.24 0.15 0.22
246 0.11 0.20 0.22 0.22 0.17 0.25 0.26 0.37 0.12 0.19 0.21
275 0.24 0.12 0.22 0.23 0.26 0.19 0.21 0.23 0.25 0.23 0.21 0.22
304 0.23 0.13 0.24 0.22 0.21 0.23 0.22 0.30 0.23 0.20 0.22
337 0.19 0.11 0.21 0.22 0.20 0.24 0.22 0.19 0.22 0.23 0.20 0.20
368 0.21 0.13 0.24 0.22 0.25 0.16 0.22 0.25 0.26 0.23 0.18 0.21
Table 12.6 I Results for the mixed element diffusion experiments in NRVB equilibrated water

286
Sample 1y-1 1y-2 2y-1 2y-2 3y-1 3y-2 4y-1 4y-2 4y-3 Spare
1 Spare
2 Mean
Days 10-3 mol dm-3
10-3 mol dm-3
10-3 mol dm-3
10-3 mol dm-3
10-3 mol dm-3
10-3 mol dm-3
10-3 mol dm-3
10-3 mol dm-
3
10-3 mol dm-3
10-3 mol dm-3
10-3 mol dm-3
10-3 mol dm-3
0 0.00 0.00 0.00 0.00 0.00 0.00 0.00 0.00 0.00 0.00 0.00 0.00
7 0.15 0.10 0.13 0.15 0.20 0.12 0.11 0.12 0.13 0.13 0.09 0.13
14 0.26 0.17 0.25 0.25 0.32 0.23 0.23 0.21 0.22 0.23 0.19 0.23
21 0.28 0.21 0.27 0.30 0.38 0.28 0.27 0.28 0.28 0.28 0.23 0.28
28 0.30 0.24 0.27 0.31 0.39 0.31 0.32 0.30 0.31 0.33 0.31 0.31
59 0.32 0.25 0.30 0.34 0.41 0.32 0.32 0.30 0.32 0.33 0.27 0.32
94 0.33 0.21 0.31 0.35 0.40 0.32 0.34 0.34 0.32 0.33 0.28 0.32
121 0.30 0.29 0.29 0.32 0.40 0.30 0.33 0.28 0.30 0.31 0.26 0.31
151 0.30 0.23 0.28 0.31 0.39 0.30 0.32 0.30 0.29 0.30 0.26 0.30
181 0.22 0.22 0.28 0.31 0.38 0.29 0.32 0.25 0.30 0.25 0.28
212 0.30 0.17 0.27 0.41 0.31 0.41 0.35 0.31 0.33 0.32 0.30 0.32
241 0.29 0.28 0.30 0.36 0.28 0.27 0.30 0.30 0.28 0.24 0.29
270 0.33 0.24 0.28 0.30 0.39 0.16 0.31 0.29 0.28 0.27 0.25 0.28
303 0.27 0.25 0.26 0.31 0.30 0.37 0.32 0.28 0.30 0.32 0.25 0.29
334 0.33 0.21 0.27 0.29 0.34 0.27 0.29 0.28 0.28 0.29 0.23 0.28
Table 12.7 I Results for the mixed element diffusion experiments in CDP solution

287
Time Sample
1 Minus blank
Counts Removed
Cmax C/Cmax Sample
2 Minus Blank
Counts Removed
Cmax C/Cmax Mean C/Cmax
90% conf
Days d min-1
cm-3 d min-1
cm-3 d min-1 cm-3
d min-
1 cm-3
d min-1
cm-3 d min-1
cm-3 d min-1 cm-
3 d min-
1 cm-3 +/-
0 19 1 1 1369 0.00 18 0 0 1369 0.00 0.00 0.002
1 16 0 1 1375 0.00 19 1 1 1378 0.00 0.00 0.002
2 21 3 4 1382 0.00 18 0 1 1385 0.00 0.00 0.004
3 16 0 4 1388 0.00 17 0 1 1391 0.00 0.00 0.000
4 17 0 4 1394 0.00 17 0 1 1397 0.00 0.00 0.000
5 17 0 4 1400 0.00 20 2 3 1404 0.00 0.00 0.003
6 19 1 5 1407 0.00 17 0 3 1410 0.00 0.00 0.002
7 23 5 10 1413 0.00 18 0 3 1416 0.00 0.00 0.008
8 19 1 11 1420 0.00 16 0 3 1423 0.00 0.00 0.001
9 23 5 16 1426 0.00 23 5 8 1430 0.00 0.00 0.000
10 18 0 16 1433 0.00 21 3 11 1436 0.00 0.00 0.005
13 19 1 17 1440 0.00 18 0 11 1443 0.00 0.00 0.002
14 20 2 19 1447 0.00 17 0 11 1450 0.00 0.00 0.003
15 21 3 22 1453 0.00 25 7 18 1457 0.00 0.00 0.006
16 21 3 25 1460 0.00 20 2 21 1464 0.00 0.00 0.001
22 29 11 37 1467 0.01 28 10 31 1471 0.01 0.01 0.002
23 28 10 47 1474 0.01 32 14 45 1478 0.01 0.01 0.005
28 37 19 66 1481 0.01 41 23 68 1485 0.02 0.01 0.006
31 48 30 97 1489 0.02 49 31 98 1492 0.02 0.02 0.000
35 53 35 132 1496 0.02 62 44 142 1499 0.03 0.03 0.013
36 54 36 168 1503 0.02 60 42 184 1506 0.03 0.03 0.008
37 54 36 204 1510 0.02 60 42 227 1513 0.03 0.03 0.009
38 55 37 241 1517 0.02 68 50 276 1521 0.03 0.03 0.019
41 72 54 295 1525 0.04 75 57 333 1528 0.04 0.04 0.004
43 69 51 347 1532 0.03 77 59 392 1535 0.04 0.04 0.011
44 72 54 400 1539 0.03 77 59 451 1543 0.04 0.04 0.007
45 73 55 455 1547 0.04 88 70 521 1550 0.05 0.04 0.022
48 90 72 527 1555 0.05 80 62 583 1558 0.04 0.04 0.015
50 91 73 600 1562 0.05 92 74 657 1565 0.05 0.05 0.002
Table 12.8 Results of the NRVB 125I tracer only experiment using NRVB equilibrated water

288
Time Sample 1 Sample 2 Mean 90% conf
Days Bq dm-3 Bq dm-3 Bq dm-3 +/-
0 20 0 10 45
1 0 20 10 45
2 43 0 22 97
3 0 0 0 0
4 0 0 0 0
5 0 30 15 67
6 20 0 10 45
7 87 0 43 193
8 10 0 5 22
9 83 83 83 0
10 0 57 28 126
13 17 0 8 37
14 33 0 17 74
15 57 117 87 134
16 53 40 47 30
22 190 163 177 59
23 173 233 203 134
28 320 383 352 141
31 503 510 507 15
35 587 737 662 335
36 603 697 650 208
37 607 707 657 223
38 610 830 720 491
41 907 950 928 97
43 853 980 917 283
44 897 980 938 186
45 910 1163 1037 565
48 1203 1037 1120 372
50 1210 1230 1220 45
Table 12.9 Results of the NRVB 125I tracer only diffusion experiment using NRVB equilibrated water expressed as concentration

289
Mass eluted (g)
Cumulative mass eluted (g)
Flow rate (g hr-1)
Time (hr)
d min-1
g-1 Total
d min-1 Cumulative
d min-1 Bq dm-3
% recovery
1.2187 1.2187 0.61 2 31 25 31 517 0.03 1.2205 2.4392 0.61 4 30 25 61 500 0.06 1.1719 3.6111 0.59 6 30 26 91 500 0.09 1.1688 4.7799 0.58 8 31 27 122 517 0.12 1.1042 5.8841 0.55 10 31 28 153 517 0.16 1.1701 7.0542 0.59 12 34 29 187 567 0.19 1.2123 8.2666 0.61 14 32 26 219 533 0.22 1.1340 9.4005 0.57 16 30 26 249 500 0.25 1.1361 10.5366 0.57 18 30 26 279 500 0.28 1.0662 11.6028 0.53 20 29 27 308 483 0.31 1.1525 13.9297 0.58 24 36 31 369 600 0.38 0.6110 14.5406 0.61 26 8 13 377 133 0.38 1.1828 15.7234 0.59 28 32 27 409 533 0.42 1.2761 16.9995 0.64 30 32 25 441 533 0.45 1.2872 18.2866 0.64 32 28 22 469 467 0.48 1.2021 19.4887 0.60 34 27 22 496 450 0.50 1.1917 20.6804 0.60 36 29 24 525 483 0.53 1.2102 21.8906 0.61 38 27 22 552 450 0.56 1.2121 23.1027 0.61 40 27 22 579 450 0.59 1.2081 24.3108 0.60 42 22 18 601 367 0.61 1.1513 25.4621 0.58 44 24 21 625 400 0.64 1.1943 26.6564 0.60 46 24 20 649 400 0.66 1.2683 27.9247 0.63 48 27 21 676 450 0.69 1.2269 29.1516 0.61 50 29 24 705 483 0.72 1.2683 30.4199 0.63 52 23 18 728 383 0.74 1.2291 31.6491 0.61 54 20 16 748 333 0.76 1.2284 32.8774 0.61 56 25 20 773 417 0.79 1.2285 34.1059 0.61 58 25 20 798 417 0.81 1.2331 35.3390 0.62 60 32 26 830 533 0.84 1.2311 36.5701 0.62 62 30 24 860 500 0.88 1.2338 37.8039 0.62 64 37 30 897 617 0.91 1.1868 38.9907 0.59 66 33 28 930 550 0.95 1.1831 40.1739 0.59 68 43 36 973 717 0.99 1.0751 41.2490 0.54 70 33 31 1006 550 1.02 1.2292 42.4782 0.61 72 48 39 1054 800 1.07 1.2225 43.7006 0.61 74 54 44 1108 900 1.13 1.2188 44.9194 0.61 76 57 47 1165 950 1.19 1.2205 46.1399 0.61 78 65 53 1230 1083 1.25 1.2207 47.3606 0.61 80 64 52 1294 1067 1.32 1.1072 48.4678 0.55 82 57 51 1351 950 1.37 1.1729 49.6408 0.59 84 67 57 1418 1117 1.44 1.1370 50.7778 0.57 86 61 54 1479 1017 1.51 1.1376 51.9154 0.57 88 71 62 1550 1183 1.58 1.1449 53.0603 0.57 90 76 66 1626 1267 1.65 1.0953 54.1556 0.55 92 76 69 1702 1267 1.73 1.1709 55.3265 0.59 94 87 74 1789 1450 1.82 1.1033 56.4298 0.55 96 83 75 1872 1383 1.91 2.4766 58.9065 0.62 100 157 63 2029 2617 2.06 2.3714 61.2779 0.59 104 184 78 2213 3067 2.25 2.3633 63.6412 0.59 108 196 83 2409 3267 2.45 2.3584 65.9996 0.59 112 218 92 2627 3633 2.67 2.3154 68.3150 0.58 116 214 92 2841 3567 2.89 2.2931 70.6081 0.57 120 221 96 3062 3683 3.12 2.3543 72.9624 0.59 124 239 102 3301 3983 3.36 2.3177 75.2802 0.58 128 248 107 3549 4133 3.61 2.3819 77.6620 0.60 132 270 113 3819 4500 3.89 2.4314 80.0934 0.61 136 283 116 4102 4717 4.17 2.2751 82.3685 0.57 140 294 129 4396 4900 4.47 2.3638 84.7324 0.59 144 306 129 4702 5100 4.78 2.3284 87.0608 0.58 148 312 134 5014 5200 5.10 2.1954 89.2562 0.55 152 309 141 5323 5150 5.42 2.2963 91.5525 0.57 156 331 144 5654 5517 5.75 2.3075 93.8600 0.58 160 312 135 5966 5200 6.07 2.1465 96.0065 0.54 164 314 146 6280 5233 6.39 2.3228 98.3293 0.58 168 334 144 6614 5567 6.73 2.3729 100.7022 0.59 172 353 149 6967 5883 7.09 2.3101 103.0123 0.58 176 365 158 7332 6083 7.46
Table 12.10 Results of the 125I tracer advection using CDP solution

290
Time Sample
1 Minus blank
Counts Removed
Cmax C/Cmax Sample
2 Minus Blank
Counts Remove
Cmax C/Cmax Mean C/Cmax
90% conf
Days d min-1
cm-3 d min-1
cm-3 d min-1 cm-
3
d min-1
cm-3
d min-1
cm-3 d min-1
cm-3 d min-1
cm-3
d min-1
cm-3 +/-
1 48 9 9 3736 0.00 30 0 0 3736 0.00 0.00 0.005
4 65 26 35 3752 0.01 43 4 4 3752 0.00 0.00 0.013
6 70 31 66 3769 0.01 45 6 10 3769 0.00 0.00 0.015
8 70 31 97 3786 0.01 56 17 27 3786 0.00 0.01 0.008
11 67 28 125 3803 0.01 54 15 42 3803 0.00 0.01 0.008
15 78 39 164 3820 0.01 59 20 62 3821 0.01 0.01 0.011
17 75 36 200 3838 0.01 63 24 86 3838 0.01 0.01 0.007
20 86 47 247 3855 0.01 71 32 118 3856 0.01 0.01 0.009
21 92 53 300 3873 0.01 74 35 153 3873 0.01 0.01 0.010
22 120 81 381 3891 0.02 103 64 217 3891 0.02 0.02 0.010
25 161 122 503 3908 0.03 133 94 311 3909 0.02 0.03 0.016
27 185 146 649 3926 0.04 162 123 434 3927 0.03 0.03 0.013
28 192 153 802 3944 0.04 173 134 568 3945 0.03 0.04 0.011
34 328 289 1091 3962 0.07 283 244 812 3963 0.06 0.07 0.025
35 320 281 1372 3979 0.07 329 290 1102 3981 0.07 0.07 0.005
40 436 397 1769 3997 0.10 388 349 1451 3998 0.09 0.09 0.027
43 498 459 2228 4014 0.11 514 475 1926 4016 0.12 0.12 0.009
49 643 604 2832 4032 0.15 578 539 2465 4033 0.13 0.14 0.036
53 735 696 3528 4048 0.17 690 651 3116 4050 0.16 0.17 0.025
57 828 789 4317 4065 0.19 780 741 3857 4067 0.18 0.19 0.027
60 911 872 5189 4081 0.21 849 810 4667 4083 0.20 0.21 0.034
68 1073 1034 6223 4096 0.25 970 931 5598 4099 0.23 0.24 0.056
74 1135 1096 7319 4112 0.27 1117 1078 6676 4115 0.26 0.26 0.010
89 1416 1377 8696 4127 0.33 1392 1353 8029 4130 0.33 0.33 0.014
116 1723 1684 10380 4140 0.41 1718 1679 9708 4144 0.41 0.41 0.003
145 1879 1840 12220 4153 0.44 1929 1890 11598 4156 0.45 0.45 0.026
176 1988 1949 14169 4164 0.47 2026 1987 13585 4168 0.48 0.47 0.020
207 2060 2021 16190 4176 0.48 2041 2002 15587 4179 0.48 0.48 0.011
236 2156 2117 18307 4187 0.51 0.51
265 2146 2107 20414 4197 0.50 0.50
298 2060 2021 22435 4208 0.48 0.48
329 2185 2146 24581 4219 0.51 0.51
358 2309 2270 26851 4230 0.54 0.54
390 2268 2229 29080 4240 0.53 0.53
428 2160 2121 31201 4251 0.50 0.50
449 2134 2095 33296 4262 0.49 0.49
480 2267 2228 35524 4274 0.52 0.52
512 2193 2154 37678 4285 0.50 0.50
Table 13.2 Results of the NRVB 90Sr tracer only diffusion experiment using NRVB equilibrated water
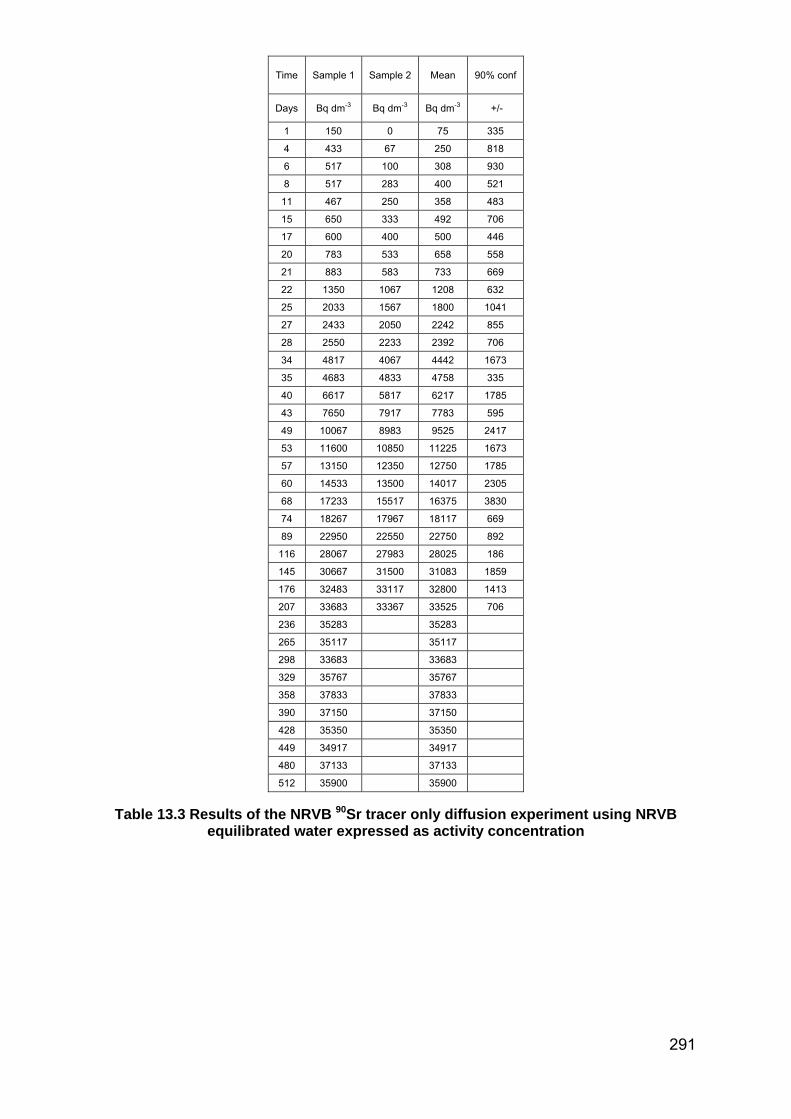
291
Time Sample 1 Sample 2 Mean 90% conf
Days Bq dm-3 Bq dm-3 Bq dm-3 +/-
1 150 0 75 335
4 433 67 250 818
6 517 100 308 930
8 517 283 400 521
11 467 250 358 483
15 650 333 492 706
17 600 400 500 446
20 783 533 658 558
21 883 583 733 669
22 1350 1067 1208 632
25 2033 1567 1800 1041
27 2433 2050 2242 855
28 2550 2233 2392 706
34 4817 4067 4442 1673
35 4683 4833 4758 335
40 6617 5817 6217 1785
43 7650 7917 7783 595
49 10067 8983 9525 2417
53 11600 10850 11225 1673
57 13150 12350 12750 1785
60 14533 13500 14017 2305
68 17233 15517 16375 3830
74 18267 17967 18117 669
89 22950 22550 22750 892
116 28067 27983 28025 186
145 30667 31500 31083 1859
176 32483 33117 32800 1413
207 33683 33367 33525 706
236 35283 35283
265 35117 35117
298 33683 33683
329 35767 35767
358 37833 37833
390 37150 37150
428 35350 35350
449 34917 34917
480 37133 37133
512 35900 35900
Table 13.3 Results of the NRVB 90Sr tracer only diffusion experiment using NRVB equilibrated water expressed as activity concentration

292
Time Sample
1 Minus blank
Counts Removed
Cmax C/Cmax Sample
2 Minus Blank
Counts Removed
Cmax C/Cmax Mean C/Cmax
90% conf
Days d min-1
cm-3 d min-
1 cm-3 d min-1 cm-3
d min-1
cm-3
d min-1
cm-3 d min-1
cm-3 d min-1
cm-3 d min-1
cm-3 +/-
1 32 0 9 3736 0.00 27 0 0 3736 0.00 0.00 0.000
4 35 0 9 3752 0.00 36 0 0 3752 0.00 0.00 0.000
6 38 0 9 3769 0.00 39 0 0 3769 0.00 0.00 0.000
8 35 0 9 3786 0.00 31 0 0 3786 0.00 0.00 0.000
11 35 0 9 3803 0.00 34 0 0 3804 0.00 0.00 0.000
15 45 6 15 3821 0.00 33 0 0 3821 0.00 0.00 0.004
17 39 0 15 3838 0.00 37 0 0 3838 0.00 0.00 0.000
20 44 5 20 3856 0.00 39 0 0 3856 0.00 0.00 0.003
21 46 7 27 3874 0.00 44 5 5 3874 0.00 0.00 0.001
22 51 12 39 3892 0.00 46 7 12 3892 0.00 0.00 0.003
25 60 21 60 3910 0.01 68 29 41 3910 0.01 0.01 0.005
27 76 37 97 3928 0.01 81 42 83 3928 0.01 0.01 0.003
28 74 35 132 3947 0.01 86 47 130 3947 0.01 0.01 0.007
34 126 87 219 3965 0.02 130 91 221 3965 0.02 0.02 0.002
35 139 100 319 3984 0.03 141 102 323 3984 0.03 0.03 0.001
40 190 151 470 4002 0.04 199 160 483 4002 0.04 0.04 0.005
43 239 200 670 4021 0.05 229 190 673 4021 0.05 0.05 0.006
49 300 261 931 4039 0.06 303 264 937 4039 0.07 0.06 0.002
53 361 322 1253 4057 0.08 372 333 1270 4057 0.08 0.08 0.006
57 446 407 1660 4076 0.10 415 376 1646 4076 0.09 0.10 0.017
60 475 436 2096 4094 0.11 459 420 2066 4094 0.10 0.10 0.009
68 578 539 2635 4112 0.13 573 534 2600 4112 0.13 0.13 0.003
74 655 616 3251 4129 0.15 633 594 3194 4130 0.14 0.15 0.012
89 865 826 4077 4147 0.20 878 839 4033 4147 0.20 0.20 0.007
116 1175 1136 5213 4163 0.27 1115 1076 5109 4164 0.26 0.27 0.032
145 1386 1347 6560 4179 0.32 1296 1257 6366 4179 0.30 0.31 0.048
176 1493 1454 8014 4193 0.35 1473 1434 7800 4194 0.34 0.34 0.011
207 1639 1600 9614 4207 0.38 1595 1556 9356 4208 0.37 0.38 0.024
236 1613 1574 11188 4220 0.37 1599 1560 10916 4222 0.37 0.37 0.008
265 1577 1538 12726 4234 0.36 1556 1517 12433 4235 0.36 0.36 0.011
298 1676 1637 14363 4248 0.39 1670 1631 14064 4249 0.38 0.38 0.003
329 1643 1604 15967 4261 0.38 1571 1532 15596 4263 0.36 0.37 0.038
358 1823 1784 17751 4275 0.42 1751 1712 17308 4277 0.40 0.41 0.038
390 1745 1706 19457 4288 0.40 1756 1717 19025 4290 0.40 0.40 0.005
428 1751 1712 21169 4302 0.40 1721 1682 20707 4304 0.39 0.39 0.016
449 1665 1626 22795 4315 0.38 1723 1684 22391 4318 0.39 0.38 0.029
480 1736 1697 24492 4330 0.39 1792 1753 24144 4332 0.40 0.40 0.028
512 1715 1676 26168 4344 0.39 1720 1681 25825 4346 0.39 0.39 0.002
Table 13.4 Results of the NRVB 90Sr tracer only diffusion experiment using CDP solution

293
Time Sample 1 Sample 2 Mean 90% conf
Days Bq dm-3 Bq dm-3 Bq dm-3 +/-
1 0 0 0 0
4 0 0 0 0
6 0 0 0 0
8 0 0 0 0
11 0 0 0 0
15 100 0 50 223
17 0 0 0 0
20 83 0 42 186
21 117 83 100 74
22 200 117 158 186
25 350 483 417 297
27 617 700 658 186
28 583 783 683 446
34 1450 1517 1483 149
35 1667 1700 1683 74
40 2517 2667 2592 335
43 3333 3167 3250 372
49 4350 4400 4375 112
53 5367 5550 5458 409
57 6783 6267 6525 1153
60 7267 7000 7133 595
68 8983 8900 8942 186
74 10267 9900 10083 818
89 13767 13983 13875 483
116 18933 17933 18433 2231
145 22450 20950 21700 3346
176 24233 23900 24067 744
207 26667 25933 26300 1636
236 26233 26000 26117 521
265 25633 25283 25458 781
298 27283 27183 27233 223
329 26733 25533 26133 2677
358 29733 28533 29133 2677
390 28433 28617 28525 409
428 28533 28033 28283 1115
449 27100 28067 27583 2157
480 28283 29217 28750 2082
512 27933 28017 27975 186
Table 13.5 Results of the NRVB 90Sr tracer only diffusion experiment using CDP solution expressed as activity concentration

294
Time Sample 1 Minus blank
Counts Remove
Cmax C/Cmax Sample 2 Minus Blank
Counts Removed
Cmax C/Cmax Mean C/Cmax
90% conf
Days d min-1
cm-3 d min-1
cm-3 d min-1
cm-3 d min-1
cm-3
d min-1
cm-3 d min-1
cm-3 d min-1 cm-3
d min-1
cm-3 +/-
0 47 15 15 6707 0.00 25 0 0 6707 0.00 0.00 0.005
2 55 23 38 6737 0.00 30 0 0 6737 0.00 0.00 0.008
3 51 19 57 6767 0.00 32 0 0 6767 0.00 0.00 0.006
7 61 29 86 6798 0.00 36 4 4 6798 0.00 0.00 0.008
13 85 53 139 6828 0.01 54 22 26 6829 0.00 0.01 0.010
15 90 58 197 6859 0.01 100 68 94 6860 0.01 0.01 0.003
16 197 6890 94 6891 0.000
17 119 87 284 6922 0.01 94 6923 0.01 0.000
20 192 160 444 6954 0.02 229 197 291 6955 0.03 0.03 0.012
23 291 259 703 6985 0.04 318 286 577 6986 0.04 0.04 0.009
26 412 380 1083 7017 0.05 446 414 991 7018 0.06 0.06 0.011
29 532 500 1583 7048 0.07 559 527 1518 7049 0.07 0.07 0.009
35 775 743 2326 7079 0.10 863 831 2349 7079 0.12 0.11 0.028
48 1474 1442 3768 7109 0.20 1637 1605 3954 7109 0.23 0.21 0.051
64 2221 2189 5957 7136 0.31 2243 2211 6165 7135 0.31 0.31 0.007
73 2447 2415 8372 7160 0.34 2645 2613 8778 7159 0.37 0.35 0.062
94 2798 2766 11138 7182 0.39 3144 3112 11890 7181 0.43 0.41 0.108
125 3665 3633 14771 7204 0.50 3779 3747 15637 7200 0.52 0.51 0.036
156 3770 3738 18509 7221 0.52 3748 3716 19353 7217 0.51 0.52 0.006
185 4136 4104 22613 7238 0.57 4090 4058 23411 7234 0.56 0.56 0.013
219 4142 4110 26723 7253 0.57 4244 4212 27623 7250 0.58 0.57 0.032
248 4254 4222 30945 7269 0.58 4193 4161 31784 7265 0.57 0.58 0.018
308 4130 4098 35043 7284 0.56 4164 4132 35916 7280 0.57 0.57 0.011
Table 13.6 Results of the NRVB 90Sr tracer and Sr(NO3)2 carrier diffusion experiment using NRVB equilibrated water

295
Time Sample 1 Sample 2 Mean 90% conf
Days Bq dm-3 Bq dm-3 Bq dm-3 +/-
0 250 0 125 558
2 383 0 192 855
3 317 0 158 706
7 483 67 275 930
13 883 367 625 1153
15 967 1133 1050 372
16 0
17 1450 1450 0
20 2667 3283 2975 1376
23 4317 4767 4542 1004
26 6333 6900 6617 1264
29 8333 8783 8558 1004
35 12383 13850 13117 3272
48 24033 26750 25392 6061
64 36483 36850 36667 818
73 40250 43550 41900 7362
94 46100 51867 48983 12865
125 60550 62450 61500 4239
156 62300 61933 62117 818
185 68400 67633 68017 1710
219 68500 70200 69350 3793
248 70367 69350 69858 2268
308 68300 68867 68583 1264
Table 13.7 Results of the NRVB 90Sr tracer and Sr(NO3)2 carrier diffusion experiment using NRVB equilibrated water expressed as activity concentration

296
Time Sample
1 Minus blank
Counts Remove
Cmax C/Cmax Sample
2 Minus Blank
Counts Removed
Cmax C/Cmax Mean C/Cmax
90% conf
Days d min-1
cm-3 d min-1
cm-3 d min-1
cm-3
d min-1
cm-3
d min-1
cm-3 d min-1
cm-3 d min-1 cm-3
d min-1
cm-3 +/-
0 30 0 15 6707 0.00 78 0 0 6707 0.00 0.00 0.000
2 32 0 15 6737 0.00 77 0 0 6737 0.00 0.00 0.000
3 34 2 17 6767 0.00 75 43 43 6767 0.01 0.00 0.014
7 34 2 19 6798 0.00 91 59 102 6798 0.01 0.00 0.019
13 115 83 102 6829 0.01 153 121 223 6828 0.02 0.01 0.012
15 102 6859 0.00 243 211 434 6859 0.03 0.02 0.069
16 102 6891 249 434 6889 0.000
17 338 306 408 6923 0.04 332 300 734 6921 0.04 0.04 0.002
20 372 340 748 6953 0.05 392 360 1094 6952 0.05 0.05 0.006
23 537 505 1253 6984 0.07 1094 6982 0.07 0.000
26 657 625 1878 7014 0.09 642 610 1704 7015 0.09 0.09 0.005
29 784 752 2630 7044 0.11 758 726 2430 7045 0.10 0.10 0.008
35 1098 1066 3696 7074 0.15 923 891 3321 7075 0.13 0.14 0.055
48 1761 1729 5425 7103 0.24 1313 1281 4602 7104 0.18 0.21 0.141
64 2192 2160 7585 7128 0.30 1966 1934 6536 7132 0.27 0.29 0.071
73 2306 2274 9859 7152 0.32 2501 2469 9005 7157 0.34 0.33 0.060
94 2847 2815 12674 7175 0.39 2534 2502 11507 7179 0.35 0.37 0.098
125 3396 3364 16038 7196 0.47 3142 3110 14617 7202 0.43 0.45 0.079
156 3508 3476 19514 7215 0.48 3698 3666 18283 7222 0.51 0.49 0.058
185 4033 4001 23515 7233 0.55 4074 4042 22325 7239 0.56 0.56 0.012
219 4051 4019 27534 7249 0.55 3984 3952 26277 7255 0.54 0.55 0.022
248 3809 3777 31311 7265 0.52 3868 3836 30113 7271 0.53 0.52 0.017
308 3968 3936 35247 7282 0.54 3882 3850 33963 7288 0.53 0.53 0.027
Table 13.8 Results of the NRVB 90Sr tracer and Sr(NO3)2 carrier diffusion experiment using CDP solution

297
Time Sample 1 Sample 2 Mean 90% conf
Days Bq dm-3 Bq dm-3 Bq dm-3 +/-
0 0 0 0 0
2 0 0 0 0
3 33 717 375 1524
7 33 983 508 2119
13 1383 2017 1700 1413
15 3517 3517 0
16 0
17 5100 5000 5050 223
20 5667 6000 5833 744
23 8417 8417 0
26 10417 10167 10292 558
29 12533 12100 12317 967
35 17767 14850 16308 6507
48 28817 21350 25083 16658
64 36000 32233 34117 8403
73 37900 41150 39525 7250
94 46917 41700 44308 11638
125 56067 51833 53950 9444
156 57933 61100 59517 7065
185 66683 67367 67025 1524
219 66983 65867 66425 2491
248 62950 63933 63442 2194
308 65600 64167 64883 3198
Table 13.9 Results of the NRVB 90Sr tracer and Sr(NO3)2 carrier diffusion experiment using CDP solution expressed as activity concentration

298
Time Sample 1 Minus blank
Counts Removed
Cmax C/Cmax Sample
2 Minus Blank
Counts Removed
Cmax C/Cmax Mean C/Cmax
90% conf
Days d min-1
cm-3 d min-1
cm-3 d min-1 cm-
3 d min-1
cm-3
d min-1
cm-3 d min-1
cm-3 d min-1 cm-3
d min-1
cm-3 +/-
1 27 0 15 3363 0.00 24 0 0 3363 0.00 0.00 0.00
9 27 0 15 3378 0.00 32 0 0 3378 0.00 0.00 0.00
19 81 49 64 3393 0.01 68 36 36 3393 0.01 0.01 0.009
26 183 151 215 3408 0.04 157 125 161 3408 0.04 0.04 0.017
33 294 262 477 3423 0.08 273 241 402 3423 0.07 0.07 0.014
41 479 447 924 3438 0.13 406 374 776 3438 0.11 0.12 0.047
48 610 578 1502 3451 0.17 541 509 1285 3452 0.15 0.16 0.045
58 768 736 2238 3465 0.21 673 641 1926 3466 0.18 0.20 0.061
87 1074 1042 3280 3477 0.30 984 952 2878 3479 0.27 0.29 0.058
121 1294 1262 4542 3488 0.36 1184 1152 4030 3490 0.33 0.35 0.071
155 1351 1319 5861 3499 0.38 1290 1258 5288 3501 0.36 0.37 0.039
184 1422 1390 7251 3509 0.40 1298 1266 6554 3512 0.36 0.38 0.079
244 1539 1507 8758 3519 0.43 1439 1407 7961 3522 0.40 0.41 0.064
336 8758 3529 1422 1390 9351 3532 0.39 0.39
Table 13.10 Results of the NRVB 90Sr tracer only diffusion experiment using gluconate in NRVB equilibrated water

299
Time Sample 1 Sample 2 Mean 90% conf
Days Bq dm-3 Bq dm-3 Bq dm-3 +/-
1 0 0 0 0
9 0 0 0 0
19 817 600 708 483
26 2517 2083 2300 967
33 4367 4017 4192 781
41 7450 6233 6842 2714
48 9633 8483 9058 2566
58 12267 10683 11475 3532
87 17367 15867 16617 3346
121 21033 19200 20117 4090
155 21983 20967 21475 2268
184 23167 21100 22133 4611
244 25117 23450 24283 3718
336 23167 23167
Table 13.11 Results of the NRVB 90Sr tracer only diffusion experiment using gluconate in NRVB equilibrated water expressed as activity concentration

300
Time Sample
1 Minus blank
Counts Removed
Cmax C/Cmax Sample 2 Minus Blank
Counts Removed
Cmax C/Cmax Mean C/Cmax
90%
Days d min-1
cm-3 d min-1
cm-3 d min-1
cm-3 d min-1
cm-3
d min-1
cm-3 d min-1
cm-3 d min-1 cm-3
d min-1
cm-3 +/-
0 50 18 15 3261 0.01 33 1 0 3261 0.00 0.00 0.012
3 48 16 31 3276 0.00 41 9 9 3276 0.00 0.00 0.005
5 46 14 45 3291 0.00 43 11 20 3291 0.00 0.00 0.002
7 48 16 61 3306 0.00 44 12 32 3306 0.00 0.00 0.003
10 45 13 74 3321 0.00 43 11 43 3321 0.00 0.00 0.001
14 56 24 98 3336 0.01 51 19 62 3336 0.01 0.01 0.003
17 47 15 113 3351 0.00 49 17 79 3351 0.01 0.00 0.001
20 46 14 127 3366 0.00 61 29 108 3366 0.01 0.01 0.010
24 53 21 148 3382 0.01 56 24 132 3382 0.01 0.01 0.002
25 62 30 178 3397 0.01 61 29 161 3397 0.01 0.01 0.001
31 81 49 227 3413 0.01 85 53 214 3413 0.02 0.01 0.003
38 129 97 324 3429 0.03 122 90 304 3429 0.03 0.03 0.005
47 210 178 502 3445 0.05 213 181 485 3445 0.05 0.05 0.002
54 279 247 749 3460 0.07 274 242 727 3460 0.07 0.07 0.003
61 362 330 1079 3475 0.09 340 308 1035 3475 0.09 0.09 0.014
67 445 413 1492 3490 0.12 444 412 1447 3491 0.12 0.12 0.001
74 545 513 2005 3505 0.15 500 468 1915 3505 0.13 0.14 0.029
87 755 723 2728 3520 0.21 678 646 2561 3520 0.18 0.19 0.049
102 850 818 3546 3533 0.23 840 808 3369 3534 0.23 0.23 0.006
115 880 848 4394 3546 0.24 842 810 4179 3547 0.23 0.23 0.024
Table 13.12 Results of the NRVB 90Sr tracer only diffusion experiment using high ionic strength NRVB equilibrated water

301
Time Sample 1 Sample 2 Mean 90% conf
Days Bq dm-3 Bq dm-3 Bq dm-3 +/-
0 300 17 158 632
3 267 150 208 260
5 233 183 208 112
7 267 200 233 149
10 217 183 200 74
14 400 317 358 186
17 250 283 267 74
20 233 483 358 558
24 350 400 375 112
25 500 483 492 37
31 817 883 850 149
38 1617 1500 1558 260
47 2967 3017 2992 112
54 4117 4033 4075 186
61 5500 5133 5317 818
67 6883 6867 6875 37
74 8550 7800 8175 1673
87 12050 10767 11408 2863
102 13633 13467 13550 372
115 14133 13500 13817 1413
Table 13.13 Results of the NRVB 90Sr tracer only diffusion experiment using high ionic strength NRVB equilibrated water expressed as activity concentration

302
Time Sample
1 Minus blank
Counts Removed
Cmax C/Cmax Sample
2 Minus Blank
Counts Removed
Cmax C/Cmax Mean C/Cmax
Days d min-1
cm-3 d min-1
cm-3 d min-1 cm-3
d min-1
cm-3
d min-1
cm-3 d min-1
cm-3 d min-1 cm-
3 d min-1
cm-3
0 42 10 15 3261 0.00 33 1 0 3261 0.00 0.00
1 43 11 26 3276 0.00 36 4 4 3276 0.00 0.00
2 45 13 39 3291 0.00 35 3 7 3291 0.00 0.00
4 42 10 49 3306 0.00 33 1 8 3306 0.00 0.00
7 42 10 59 3321 0.00 40 8 16 3321 0.00 0.00
8 46 14 73 3336 0.00 38 6 22 3336 0.00 0.00
10 44 12 85 3351 0.00 37 5 27 3351 0.00 0.00
14 53 21 106 3366 0.01 36 4 31 3367 0.00 0.00
17 47 15 121 3382 0.00 34 2 33 3382 0.00 0.00
21 47 15 136 3397 0.00 35 3 36 3398 0.00 0.00
28 53 21 157 3413 0.01 36 4 40 3414 0.00 0.00
29 49 17 174 3429 0.00 35 3 43 3430 0.00 0.00
35 40 8 182 3445 0.00 36 4 47 3446 0.00 0.00
42 79 47 229 3462 0.01 44 12 59 3462 0.00 0.01
51 156 124 353 3478 0.04 60 28 87 3479 0.01 0.02
58 207 175 528 3494 0.05 78 46 133 3495 0.01 0.03
65 284 252 780 3510 0.07 106 74 207 3512 0.02 0.05
71 363 331 1111 3526 0.09 138 106 313 3528 0.03 0.06
78 422 390 1501 3541 0.11 178 146 459 3545 0.04 0.08
91 608 576 2077 3556 0.16 263 231 690 3562 0.06 0.11
106 756 724 2801 3571 0.20 379 347 1037 3578 0.10 0.15
119 781 749 3550 3585 0.21 414 382 1419 3594 0.11 0.16
Table 13.14 Results of the NRVB 90Sr tracer only diffusion experiment using gradient ionic strength NRVB equilibrated water

303
Time Sample 1 Sample 2 Mean
Days Bq dm-3 Bq dm-3 Bq dm-3
0 167 17 92
1 183 67 125
2 217 50 133
4 167 17 92
7 167 133 150
8 233 100 167
10 200 83 142
14 350 67 208
17 250 33 142
21 250 50 150
28 350 67 208
29 283 50 167
35 133 67 100
42 783 200 492
51 2067 467 1267
58 2917 767 1842
65 4200 1233 2717
71 5517 1767 3642
78 6500 2433 4467
91 9600 3850 6725
106 12067 5783 8925
119 12483 6367 9425
Table 13.15 Results of the NRVB 90Sr tracer only diffusion experiment using gradient ionic strength NRVB equilibrated water expressed as concentration

304
Time Sample 1 Minus Blank
Counts Removed
Cmax C/Cmax Activity
concentration
Days d min-1 cm-
3 d min-1
cm-3 d min-1 cm-3
d min-1
cm-3 Bq dm-3
1 36 4 4 3363 0.00 67
4 41 9 13 3378 0.00 150
7 44 12 25 3393 0.00 200
15 51 19 44 3408 0.01 317
22 95 63 107 3424 0.02 1050
28 148 116 223 3439 0.03 1933
36 294 262 485 3454 0.08 4367
56 720 688 1173 3469 0.20 11467
70 839 807 1980 3482 0.23 13450
83 1008 976 2956 3495 0.28 16267
96 1278 1246 4202 3506 0.36 20767
126 1353 1321 5523 3517 0.38 22017
134 1345 1313 6836 3527 0.37 21883
147 1425 1393 8229 3538 0.39 23217
188 1504 1472 9701 3548 0.41 24533
201 1530 1498 11199 3558 0.42 24967
213 1523 1491 12690 3568 0.42 24850
241 1373 1341 14031 3578 0.37 22350
Table 13.16 Results of the repeated NRVB 90Sr tracer only diffusion experiment using CDP solution

305
Mass eluted (g)
Cumulative mass eluted
(g)
Flow rate (g
hr-1) Time (hr)
d min-1
g-1 Total d
min-1 Bq dm-3
Cumulative d min-1
% recovery
2.6335 2.6335 0.8778 3.0 8 20 127 20 0.00
2.6375 5.2710 0.8792 6.0 9 23 145 43 0.01
2.5923 7.8633 0.8641 9.0 8 20 129 63 0.01
2.5193 10.3826 0.8398 12.0 11 28 185 91 0.01
2.4959 12.8785 0.8320 15.0 10 25 167 116 0.02
2.4849 15.3634 0.8283 18.0 8 21 141 137 0.02
2.5411 17.9045 0.8470 21.0 12 31 203 168 0.02
2.7561 20.6606 0.9187 24.0 10 28 169 196 0.03
2.9170 23.5776 0.9723 27.0 10 28 160 224 0.03
2.9719 26.5495 0.9906 30.0 11 33 185 257 0.03
2.8845 29.4340 0.9615 33.0 11 31 179 288 0.04
2.7953 32.2293 0.9318 36.0 11 32 191 320 0.04
2.6723 34.9016 0.8908 39.0 14 38 237 358 0.05
2.5712 37.4728 0.8571 42.0 16 41 266 399 0.05
2.5868 40.0596 0.8623 45.0 19 50 322 449 0.06
2.8059 42.8655 0.9353 48.0 20 56 333 505 0.07
2.9235 45.7890 0.9745 51.0 29 86 490 591 0.08
2.9749 48.7639 0.9916 54.0 41 122 684 713 0.10
2.9856 51.7495 0.9952 57.0 49 145 809 858 0.12
2.8854 54.6349 0.9618 60.0 79 227 1311 1085 0.15
2.8682 57.5031 0.9561 63.0 120 344 1999 1429 0.19
2.8034 60.3065 0.9345 66.0 199 559 3323 1988 0.27
2.9209 63.2274 0.9736 69.0 320 934 5329 2922 0.39
3.1760 66.4034 1.0587 72.0 462 1466 7693 4388 0.59
3.0497 69.4531 1.0166 75.0 667 2033 11110 6421 0.87
2.9784 72.4315 0.9928 78.0 929 2766 15478 9187 1.24
2.9283 75.3598 0.9761 81.0 1124 3290 18725 12477 1.68
2.9649 78.3247 0.9883 84.0 1507 4468 25116 16945 2.29
2.7913 81.1160 0.9304 87.0 1861 5196 31025 22141 2.99
2.6870 83.8030 0.8957 90.0 2293 6161 38215 28302 3.82
2.7668 86.5698 0.9223 93.0 2692 7449 44872 35751 4.83
2.9195 89.4893 0.9732 96.0 3209 9370 53491 45121 6.09
2.7031 92.1924 0.9010 99.0 3562 9628 59364 54749 7.39
2.8251 95.0175 0.9417 102.0 3938 11124 65625 65873 8.89
2.8275 97.8450 0.9425 105.0 4202 11882 70038 77755 10.50
2.6632 100.5082 0.8877 108.0 4391 11694 73184 89449 12.07
2.5776 103.0858 0.8592 111.0 4556 11743 75929 101192 13.66
2.6052 105.6910 0.8684 114.0 4626 12051 77096 113243 15.29
2.5423 108.2333 0.8474 117.0 4672 11877 77861 125120 16.89
2.5483 110.7816 0.8494 120.0 4785 12194 79751 137314 18.53
2.6996 113.4813 0.8999 123.0 4855 13108 80925 150422 20.30
2.5878 116.0690 0.8626 126.0 4744 12277 79070 162699 21.96
2.2282 118.2973 0.7427 129.0 4403 9810 73376 172509 23.29
2.4843 120.7816 0.8281 132.0 4422 10986 73703 183495 24.77
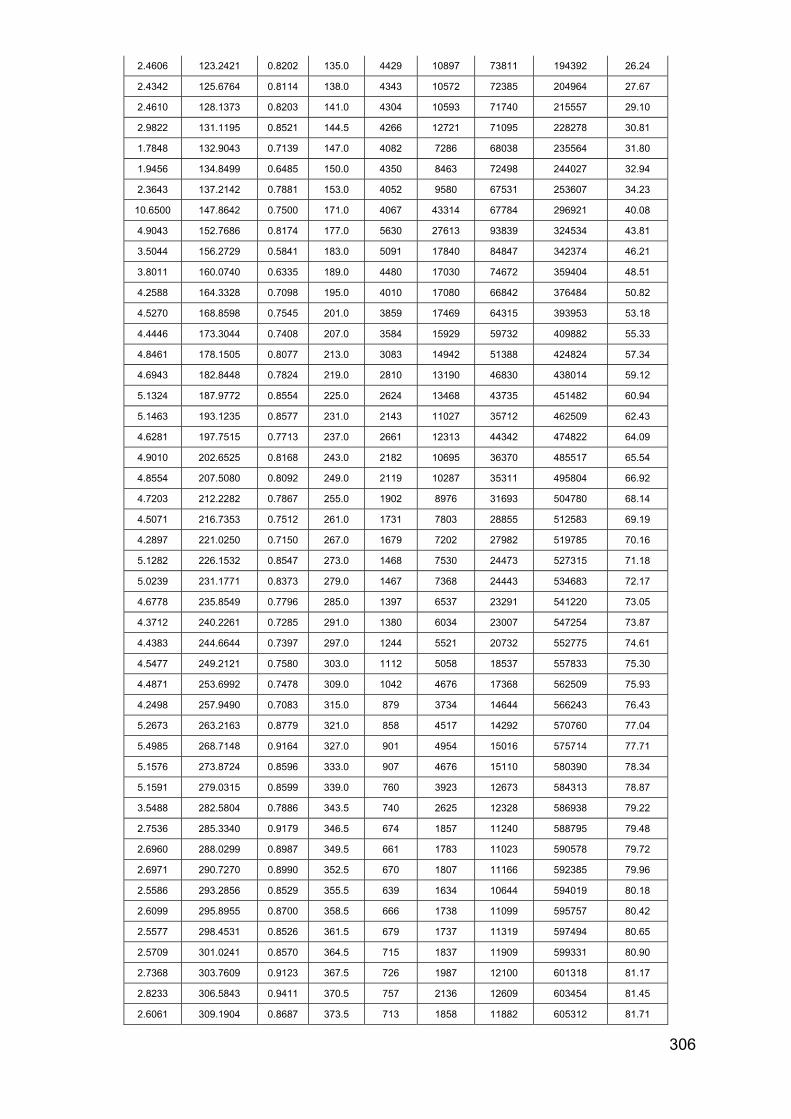
306
2.4606 123.2421 0.8202 135.0 4429 10897 73811 194392 26.24
2.4342 125.6764 0.8114 138.0 4343 10572 72385 204964 27.67
2.4610 128.1373 0.8203 141.0 4304 10593 71740 215557 29.10
2.9822 131.1195 0.8521 144.5 4266 12721 71095 228278 30.81
1.7848 132.9043 0.7139 147.0 4082 7286 68038 235564 31.80
1.9456 134.8499 0.6485 150.0 4350 8463 72498 244027 32.94
2.3643 137.2142 0.7881 153.0 4052 9580 67531 253607 34.23
10.6500 147.8642 0.7500 171.0 4067 43314 67784 296921 40.08
4.9043 152.7686 0.8174 177.0 5630 27613 93839 324534 43.81
3.5044 156.2729 0.5841 183.0 5091 17840 84847 342374 46.21
3.8011 160.0740 0.6335 189.0 4480 17030 74672 359404 48.51
4.2588 164.3328 0.7098 195.0 4010 17080 66842 376484 50.82
4.5270 168.8598 0.7545 201.0 3859 17469 64315 393953 53.18
4.4446 173.3044 0.7408 207.0 3584 15929 59732 409882 55.33
4.8461 178.1505 0.8077 213.0 3083 14942 51388 424824 57.34
4.6943 182.8448 0.7824 219.0 2810 13190 46830 438014 59.12
5.1324 187.9772 0.8554 225.0 2624 13468 43735 451482 60.94
5.1463 193.1235 0.8577 231.0 2143 11027 35712 462509 62.43
4.6281 197.7515 0.7713 237.0 2661 12313 44342 474822 64.09
4.9010 202.6525 0.8168 243.0 2182 10695 36370 485517 65.54
4.8554 207.5080 0.8092 249.0 2119 10287 35311 495804 66.92
4.7203 212.2282 0.7867 255.0 1902 8976 31693 504780 68.14
4.5071 216.7353 0.7512 261.0 1731 7803 28855 512583 69.19
4.2897 221.0250 0.7150 267.0 1679 7202 27982 519785 70.16
5.1282 226.1532 0.8547 273.0 1468 7530 24473 527315 71.18
5.0239 231.1771 0.8373 279.0 1467 7368 24443 534683 72.17
4.6778 235.8549 0.7796 285.0 1397 6537 23291 541220 73.05
4.3712 240.2261 0.7285 291.0 1380 6034 23007 547254 73.87
4.4383 244.6644 0.7397 297.0 1244 5521 20732 552775 74.61
4.5477 249.2121 0.7580 303.0 1112 5058 18537 557833 75.30
4.4871 253.6992 0.7478 309.0 1042 4676 17368 562509 75.93
4.2498 257.9490 0.7083 315.0 879 3734 14644 566243 76.43
5.2673 263.2163 0.8779 321.0 858 4517 14292 570760 77.04
5.4985 268.7148 0.9164 327.0 901 4954 15016 575714 77.71
5.1576 273.8724 0.8596 333.0 907 4676 15110 580390 78.34
5.1591 279.0315 0.8599 339.0 760 3923 12673 584313 78.87
3.5488 282.5804 0.7886 343.5 740 2625 12328 586938 79.22
2.7536 285.3340 0.9179 346.5 674 1857 11240 588795 79.48
2.6960 288.0299 0.8987 349.5 661 1783 11023 590578 79.72
2.6971 290.7270 0.8990 352.5 670 1807 11166 592385 79.96
2.5586 293.2856 0.8529 355.5 639 1634 10644 594019 80.18
2.6099 295.8955 0.8700 358.5 666 1738 11099 595757 80.42
2.5577 298.4531 0.8526 361.5 679 1737 11319 597494 80.65
2.5709 301.0241 0.8570 364.5 715 1837 11909 599331 80.90
2.7368 303.7609 0.9123 367.5 726 1987 12100 601318 81.17
2.8233 306.5843 0.9411 370.5 757 2136 12609 603454 81.45
2.6061 309.1904 0.8687 373.5 713 1858 11882 605312 81.71

307
2.6303 311.8207 0.8768 376.5 709 1866 11824 607178 81.96
2.5910 314.4117 0.8637 379.5 689 1785 11482 608963 82.20
2.5655 316.9772 0.8552 382.5 697 1789 11622 610752 82.44
2.5332 319.5104 0.8444 385.5 670 1698 11172 612450 82.67
2.4093 321.9197 0.8031 388.5 633 1525 10549 613975 82.87
2.7110 324.6306 0.9037 391.5 637 1728 10624 615703 83.11
2.4744 327.1050 0.8248 394.5 609 1507 10151 617210 83.31
2.5742 329.6791 0.8581 397.5 555 1429 9252 618639 83.50
2.0088 331.6880 0.6696 400.5 483 971 8056 619610 83.64
2.6367 334.3247 0.8789 403.5 410 1081 6833 620691 83.78
2.5990 336.9237 0.8663 406.5 427 1111 7124 621802 83.93
2.6199 339.5437 0.8733 409.5 448 1175 7475 622977 84.09
2.7039 342.2476 0.9013 412.5 460 1244 7668 624221 84.26
2.6183 344.8659 0.8728 415.5 505 1322 8415 625543 84.44
3.1655 348.0314 1.0552 418.5 528 1672 8803 627215 84.66
3.1494 351.1807 1.0498 421.5 477 1501 7943 628716 84.86
3.1403 354.3211 1.0468 424.5 456 1431 7595 630147 85.06
3.0633 357.3844 1.0211 427.5 448 1371 7459 631518 85.24
3.0638 360.4481 1.0213 430.5 439 1346 7322 632864 85.42
2.5857 363.0338 0.8619 433.5 286 740 4770 633604 85.52
Table 13.17 Run 1 results of the 90Sr tracer advection experiments using NRVB equilibrated water

308
Mass eluted
(g)
Cumulative mass eluted
(g)
Flow rate (g hr-1)
Time (hr)
d min-1 g-1 Total d
min-1 Bq dm-3
Cumulative d min-1
% recovery
3.3852 3.3852 1.1284 3 0 0 0 0 0.00
3.2578 6.6430 1.0859 6 0 0 0 0 0.00
2.7137 9.3567 0.9046 9 141 382 2345 382 0.05
3.1438 12.5005 1.0479 12 72 226 1197 608 0.08
2.0974 14.5979 0.6991 15 234 491 3900 1098 0.15
1.7056 16.3035 0.5685 18 23 40 391 1138 0.15
1.5507 17.8542 0.5169 21 0 0 0 1138 0.15
1.7404 19.5946 0.5801 24 0 0 0 1138 0.15
1.7433 21.3379 0.5811 27 0 0 0 1138 0.15
1.8211 23.1590 0.6070 30 42 76 700 1215 0.16
1.7744 24.9334 0.5915 33 83 147 1379 1362 0.18
1.6719 26.6053 0.5573 36 11 19 189 1381 0.19
1.7165 28.3218 0.5722 39 0 0 0 1381 0.19
1.8852 30.2070 0.6284 42 0 0 0 1381 0.19
1.8316 32.0386 0.6105 45 0 0 0 1381 0.19
1.9186 33.9572 0.6395 48 34 64 560 1445 0.20
2.1572 36.1144 0.7191 51 0 0 0 1445 0.20
2.2219 38.3363 0.7406 54 0 0 0 1445 0.20
2.1569 40.4932 0.7190 57 21 46 358 1491 0.20
2.2218 42.7150 0.7406 60 0 0 0 1491 0.20
2.1847 44.8997 0.7282 63 0 0 0 1491 0.20
2.2053 47.1050 0.7351 66 0 0 0 1491 0.20
2.1707 49.2757 0.7236 69 33 72 554 1564 0.21
2.2960 51.5717 0.7653 72 66 152 1102 1715 0.23
2.3659 53.9376 0.7886 75 120 285 2006 2000 0.27
2.2873 56.2250 0.7624 78 288 658 4798 2659 0.36
2.2308 58.4557 0.7436 81 373 832 6219 3491 0.47
2.1360 60.5917 0.7120 84 397 848 6615 4339 0.59
2.1475 62.7392 0.7158 87 534 1147 8898 5485 0.74
1.9448 64.6840 0.6483 90 572 1113 9539 6598 0.89
2.0779 66.7619 0.6926 93 790 1641 13161 8239 1.11
2.2137 68.9756 0.7379 96 900 1993 15003 10232 1.38
2.3580 71.3337 0.7860 99 1142 2693 19031 12924 1.74
2.2680 73.6017 0.7560 102 1378 3125 22967 16050 2.17
2.2452 75.8468 0.7484 105 1562 3506 26028 19556 2.64
2.2388 78.0857 0.7463 108 2055 4600 34243 24156 3.26
2.2839 80.3696 0.7613 111 2345 5355 39077 29511 3.98
1.8763 82.2458 0.6254 114 2417 4534 40275 34045 4.60
2.1179 84.3637 0.7060 117 2449 5186 40810 39231 5.30
2.2412 86.6049 0.7471 120 2884 6465 48073 45695 6.17
2.0865 88.6914 0.6955 123 2914 6081 48575 51776 6.99
2.2286 90.9200 0.7429 126 3029 6751 50485 58527 7.90
2.1820 93.1020 0.7273 129 3307 7217 55122 65744 8.87
1.8911 94.9931 0.6304 132 3698 6993 61631 72737 9.82
1.8016 96.7947 0.6005 135 3495 6297 58252 79033 10.67

309
2.0224 98.8171 0.6741 138 4459 9018 74319 88052 11.89
2.1096 100.9268 0.7032 141 4732 9983 78872 98035 13.23
2.2184 103.1451 0.7395 144 4884 10834 81399 108870 14.70
2.1952 105.3403 0.7317 147 4864 10677 81065 119547 16.14
1.9969 107.3373 0.6656 150 4533 9053 75557 128600 17.36
2.1581 109.4954 0.7194 153 4780 10315 79665 138915 18.75
2.1134 111.6088 0.7045 156 4900 10356 81672 149272 20.15
2.0326 113.6414 0.6775 159 4990 10143 83168 159414 21.52
1.9836 115.6249 0.6612 162 5024 9966 83734 169380 22.86
2.0096 117.6346 0.6699 165 5095 10239 84914 179619 24.24
1.8459 119.4804 0.6153 168 5255 9699 87576 189318 25.55
1.9775 121.4580 0.6592 171 5414 10707 90238 200025 27.00
1.5594 123.0174 0.5198 174 4952 7723 82540 207748 28.04
1.9052 124.9226 0.6351 177 5248 9998 87460 217745 29.39
1.8597 126.7823 0.6199 180 5343 9937 89057 227682 30.73
1.8411 128.6233 0.6137 183 5306 9769 88440 237452 32.05
1.8537 130.4771 0.6179 186 5271 9770 87845 247222 33.37
2.7794 133.2565 0.4632 192 5378 14947 89631 262169 35.39
3.4965 136.7530 0.5828 198 5485 19178 91416 281348 37.98
3.3884 140.1414 0.5647 204 5143 17427 85720 298775 40.33
3.1912 143.3325 0.5319 210 5223 16666 87044 315441 42.58
3.3341 146.6667 0.5557 216 4965 16555 82753 331996 44.81
3.3937 150.0603 0.5656 222 4770 16187 79496 348183 47.00
3.0474 153.1078 0.5079 228 4562 13904 76041 362087 48.87
3.1729 156.2807 0.5288 234 4471 14187 74520 376273 50.79
3.5004 159.7810 0.5834 240 4171 14600 69518 390874 52.76
3.4908 163.2719 0.5818 246 4015 14017 66921 404890 54.65
3.4288 166.7006 0.5715 252 3666 12570 61101 417460 56.35
3.4252 170.1259 0.5709 258 3402 11654 56707 429114 57.92
3.5737 173.6996 0.5956 264 3312 11836 55201 440951 59.52
3.4349 177.1345 0.5725 270 3108 10674 51792 451625 60.96
3.4933 180.6278 0.5822 276 2906 10152 48437 461777 62.33
3.4892 184.1170 0.5815 282 2757 9621 45954 471398 63.63
3.7045 187.8214 0.6174 288 2569 9517 42818 480915 64.91
3.6602 191.4817 0.6100 294 2468 9034 41137 489949 66.13
3.1018 194.5834 0.5170 300 2169 6728 36154 496677 67.04
3.1822 197.7657 0.5304 306 2052 6530 34203 503208 67.92
3.4226 201.1883 0.5704 312 1982 6784 33036 509992 68.84
Table 13.18 Run 2 results of the 90Sr tracer advection experiments using NRVB equilibrated water

310
Mass eluted
(g)
Cumulative mass eluted
(g)
Flow rate (g hr-1)
Time (hr)
d min-1 g-1 Total d
min-1 Bq dm-3
Cumulative d min-1
% recovery
3.2923 3.2923 0.5487 6 86 282 1427 282 0.04
2.9545 6.2468 0.4924 12 0 0 0 282 0.04
3.0194 9.2662 0.5032 18 42 128 704 410 0.06
3.1602 12.4264 0.5267 24 1 4 23 414 0.06
3.1550 15.5814 0.5258 30 10 32 171 446 0.06
3.1377 18.7191 0.5230 36 0 0 0 446 0.06
3.4622 22.1814 0.5770 42 0 0 0 446 0.06
3.2854 25.4667 0.5476 48 0 0 0 446 0.06
3.1497 28.6164 0.5250 54 5 16 83 462 0.06
3.3145 31.9310 0.5524 60 0 0 0 462 0.06
3.1952 35.1261 0.5325 66 32 102 533 564 0.08
3.5587 38.6848 0.5931 72 48 171 803 735 0.10
3.4825 42.1674 0.5804 78 133 464 2222 1200 0.16
3.6632 45.8305 0.6105 84 259 949 4320 2149 0.29
3.7572 49.5877 0.6262 90 447 1680 7452 3829 0.51
3.7890 53.3768 0.6315 96 708 2682 11799 6511 0.87
4.0537 57.4304 0.6756 102 897 3635 14946 10147 1.36
4.4130 61.8435 0.7355 108 1175 5187 19589 15333 2.06
4.4030 66.2465 0.7338 114 1486 6541 24758 21874 2.94
4.5532 70.7997 0.7589 120 1789 8146 29818 30020 4.03
4.5417 75.3414 0.7570 126 2077 9431 34608 39451 5.30
4.5499 79.8913 0.7583 132 2240 10191 37329 49642 6.67
4.6240 84.5153 0.7707 138 2514 11626 41903 61267 8.23
4.5228 89.0381 0.7538 144 2624 11869 43739 73137 9.82
4.8892 93.9273 0.8149 150 2719 13295 45321 86432 11.61
4.6949 98.6222 0.7825 156 2937 13790 48952 100221 13.46
4.5637 103.1859 0.7606 162 2986 13626 49763 113847 15.29
4.6418 107.8277 0.7736 168 3195 14829 53244 128676 17.28
4.5968 112.4245 0.7661 174 3010 13834 50159 142511 19.14
4.5213 116.9458 0.7536 180 2987 13506 49788 156017 20.96
4.6524 121.5982 0.7754 186 3181 14800 53018 170817 22.94
4.6310 126.2292 0.7718 192 2940 13614 48997 184431 24.77
4.8695 131.0987 0.8116 198 3449 16793 57475 201224 27.03
4.9356 136.0343 0.8226 204 2907 14346 48443 215569 28.95
4.8290 140.8633 0.8048 210 3100 14968 51659 230537 30.96
3.6781 144.5414 0.6130 216 3031 11147 50512 241684 32.46
4.7372 149.2786 0.7895 222 3076 14571 51266 256256 34.42
4.5784 153.8570 0.7631 228 2635 12066 43923 268321 36.04
4.7483 158.6053 0.7914 234 2608 12385 43471 280706 37.70
4.5318 163.1372 0.7553 240 2603 11796 43382 292502 39.29
4.6909 167.8280 0.7818 246 2443 11461 40720 303963 40.83
4.5202 172.3482 0.7534 252 2587 11695 43123 315658 42.40
4.5638 176.9120 0.7606 258 2706 12349 45099 328008 44.06
4.6433 181.5553 0.7739 264 2443 11345 40722 339353 45.58

311
4.7042 186.2595 0.7840 270 2425 11407 40415 350760 47.11
4.4364 190.6959 0.7394 276 2563 11372 42721 362132 48.64
4.5214 195.2173 0.7536 282 2634 11907 43893 374039 50.24
4.3000 199.5173 0.7167 288 2078 8936 34634 382975 51.44
4.4736 203.9909 0.7456 294 2194 9817 36573 392792 52.76
4.4739 208.4647 0.7456 300 1913 8560 31888 401351 53.91
4.3088 212.7735 0.7181 306 1950 8402 32501 409754 55.04
4.2864 217.0599 0.7144 312 1766 7570 29434 417324 56.05
4.5242 221.5841 0.7540 318 2137 9668 35617 426992 57.35
3.9564 225.5405 0.6594 324 1681 6652 28023 433644 58.24
4.1509 229.6914 0.6918 330 1644 6826 27407 440470 59.16
4.1762 233.8676 0.6960 336 1456 6079 24261 446549 59.98
4.2403 238.1079 0.7067 342 1503 6371 25043 452921 60.83
4.3764 242.4843 0.7294 348 1423 6225 23709 459146 61.67
4.2626 246.7469 0.7104 354 1388 5918 23138 465064 62.46
4.4469 251.1938 0.7411 360 1340 5959 22332 471022 63.26
Table 13.19 Results of the 90Sr tracer advection experiments using CDP solution

312
Mass eluted (g)
Cumulative mass eluted
(g)
Flow rate (g hr-1)
Time (hr)
d min-1
g-1 Total d
min-1 Bq dm-3
Cumulative d min-1
% recovery
9.7095 503.2505 2.43 226 2 15 26 932 0.27
9.6233 512.8738 2.41 230 2 18 31 950 0.28
9.6903 522.5641 2.42 234 2 16 28 966 0.28
9.8657 532.4297 2.47 238 2 23 39 989 0.29
10.1090 542.5387 2.53 242 2 21 35 1010 0.30
10.2503 552.7890 2.56 246 2 23 37 1033 0.30
9.7780 562.5670 2.44 250 3 28 48 1061 0.31
10.3875 572.9545 2.60 254 2 19 30 1080 0.32
10.3773 583.3318 2.59 258 2 24 39 1104 0.32
10.0882 593.4201 2.52 262 2 22 36 1126 0.33
10.2875 603.7076 2.57 266 3 31 50 1157 0.34
10.5451 614.2527 2.64 270 3 33 52 1190 0.35
10.3575 624.6102 2.59 274 3 34 55 1224 0.36
10.6238 635.2341 2.66 278 4 41 64 1265 0.37
9.9180 645.1521 2.48 282 5 46 77 1311 0.38
10.0581 655.2102 2.51 286 5 48 80 1359 0.40
10.4827 665.6930 2.62 290 4 47 75 1406 0.41
10.3936 676.0865 2.60 294 5 54 87 1460 0.43
10.0060 686.0925 2.50 298 5 47 78 1507 0.44
10.3182 696.4107 2.58 302 4 45 73 1552 0.45
9.8541 706.2647 2.46 306 6 63 107 1615 0.47
9.5743 715.8390 2.39 310 6 60 104 1675 0.49
9.9765 725.8155 2.49 314 7 74 124 1749 0.51
9.8389 735.6544 2.46 318 9 91 154 1840 0.54
9.7475 745.4018 2.44 322 11 103 176 1943 0.57
9.7457 755.1475 2.44 326 11 105 180 2048 0.60
9.4233 764.5708 2.36 330 10 97 172 2145 0.63
10.2808 774.8516 2.57 334 11 113 183 2258 0.66
8.6376 783.4893 2.16 338 13 113 218 2371 0.69
8.5652 792.0545 2.14 342 22 186 362 2557 0.75
8.6287 800.6832 2.16 346 22 193 373 2750 0.80
8.4943 809.1775 2.12 350 24 205 402 2955 0.86
8.5584 817.7359 2.14 354 22 187 364 3142 0.92
16.5689 834.3048 2.07 362 12 195 196 3337 0.98
9.3617 843.6666 2.34 366 31 293 522 3630 1.06
9.4972 853.1638 2.37 370 24 229 402 3859 1.13
9.2083 862.3721 2.30 374 30 279 505 4138 1.21
9.0390 871.4112 2.26 378 30 267 492 4405 1.29
9.4747 880.8859 2.37 382 27 255 449 4660 1.36
9.6847 890.5706 2.42 386 29 279 480 4939 1.44
9.8961 900.4668 2.47 390 29 286 482 5225 1.53
9.9553 910.4220 2.49 394 33 333 557 5558 1.62
9.5261 919.9481 2.38 398 34 322 563 5880 1.72
9.6647 929.6128 2.42 402 36 350 604 6230 1.82
9.4397 939.0524 2.36 406 38 355 627 6585 1.92
9.4330 948.4854 2.36 410 41 384 678 6969 2.04
9.6064 958.0917 2.40 414 46 438 760 7407 2.17
9.8302 967.9219 2.46 418 44 431 731 7838 2.29
9.3934 977.3153 2.35 422 43 408 724 8246 2.41
9.5396 986.8549 2.38 426 52 492 859 8738 2.55
9.0399 995.8947 2.26 430 57 516 951 9254 2.70
9.5766 1005.4713 2.39 434 53 508 884 9762 2.85

313
9.8472 1015.3185 2.46 438 57 563 953 10325 3.02
9.5553 1024.8738 2.39 442 56 539 940 10864 3.18
9.9575 1034.8313 2.49 446 54 537 899 11401 3.33
9.7217 1044.5530 2.43 450 59 572 981 11973 3.50
9.2181 1053.7711 2.30 454 67 621 1123 12594 3.68
9.6560 1063.4271 2.41 458 62 596 1029 13190 3.86
9.8526 1073.2797 2.46 462 69 682 1154 13872 4.05
10.1563 1083.4360 2.54 466 73 743 1219 14615 4.27
10.0849 1093.5208 2.52 470 81 820 1355 15435 4.51
10.1155 1103.6363 2.53 474 71 714 1176 16149 4.72
9.7040 1113.3404 2.43 478 75 726 1247 16875 4.93
10.1089 1123.4493 2.53 482 88 890 1467 17765 5.19
10.4170 1133.8662 2.60 486 81 843 1349 18608 5.44
10.2884 1144.1546 2.57 490 78 805 1304 19413 5.67
10.0120 1154.1666 2.50 494 71 709 1180 20122 5.88
10.0948 1164.2614 2.52 498 81 816 1347 20938 6.12
6.2146 1170.4760 2.49 500.5 127 792 2124 21730 6.35
3.7350 1174.2110 2.49 502 118 439 1959 22169 6.48
9.6044 1183.8154 2.40 506 113 1082 1878 23251 6.80
9.5738 1193.3891 2.39 510 131 1256 2187 24507 7.16
9.5512 1202.9403 2.39 514 104 990 1728 25497 7.45
9.4860 1212.4263 2.37 518 128 1218 2140 26715 7.81
9.2354 1221.6618 2.31 522 119 1099 1983 27814 8.13
9.5445 1231.2063 2.39 526 113 1080 1886 28894 8.45
9.7024 1240.9087 2.43 530 123 1195 2053 30089 8.80
9.8452 1250.7539 2.46 534 112 1104 1869 31193 9.12
9.4566 1260.2105 2.36 538 107 1011 1782 32204 9.41
9.3362 1269.5467 2.33 542 126 1172 2092 33376 9.76
9.3696 1278.9163 2.34 546 115 1081 1923 34457 10.07
9.6340 1288.5503 2.41 550 124 1190 2059 35647 10.42
9.8679 1298.4182 2.47 554 101 998 1686 36645 10.71
9.7543 1308.1726 2.44 558 107 1046 1787 37691 11.02
10.0860 1318.2585 2.52 562 105 1064 1758 38755 11.33
9.6787 1327.9372 2.42 566 101 976 1681 39731 11.61
9.3443 1337.2815 2.34 570 118 1099 1960 40830 11.93
9.2001 1346.4816 2.30 574 119 1099 1991 41929 12.26
10.1938 1356.6754 2.55 578 117 1189 1944 43118 12.60
10.1139 1366.7894 2.53 582 104 1055 1739 44173 12.91
10.3853 1377.1746 2.60 586 89 923 1481 45096 13.18
10.0769 1387.2515 2.52 590 99 1001 1656 46097 13.47
9.7458 1396.9973 2.44 594 109 1061 1814 47158 13.78
9.8770 1406.8743 2.47 598 105 1033 1743 48191 14.09
11.1150 1417.9893 2.78 602 90 1003 1504 49194 14.38
11.1614 1429.1507 2.79 606 85 950 1419 50144 14.66
10.5675 1439.7182 2.64 610 93 981 1547 51125 14.94
10.5770 1450.2952 2.64 614 91 964 1519 52089 15.23
10.4368 1460.7320 2.61 618 94 983 1570 53072 15.51
10.3164 1471.0484 2.58 622 103 1062 1716 54134 15.82
11.4744 1482.5228 2.87 626 92 1055 1532 55189 16.13
11.3591 1493.8819 2.84 630 92 1049 1539 56238 16.44
10.7882 1504.6701 2.70 634 81 873 1349 57111 16.69
10.6752 1515.3452 2.67 638 91 974 1521 58085 16.98
10.6382 1525.9835 2.66 642 87 929 1455 59014 17.25
5.8000 1531.7835 646 88 511 1468 59525 17.40
11.7068 1543.4903 2.93 650 83 976 1390 60501 17.68

314
11.3438 1554.8340 2.84 654 91 1036 1522 61537 17.99
10.0139 1564.8479 2.50 658 104 1037 1726 62574 18.29
9.8144 1574.6623 2.45 662 115 1130 1919 63704 18.62
10.0544 1584.7167 2.51 666 108 1081 1792 64785 18.94
10.0936 1594.8103 2.52 670 102 1032 1704 65817 19.24
11.0994 1605.9097 2.77 674 96 1063 1596 66880 19.55
12.6258 1618.5355 3.16 678 78 985 1300 67865 19.84
9.3641 1627.8996 2.34 682 101 948 1687 68813 20.11
10.3731 1638.2727 2.59 686 90 931 1496 69744 20.39
10.1094 1648.3821 2.53 690 90 908 1497 70652 20.65
9.6485 1658.0307 2.41 694 102 986 1703 71638 20.94
9.9193 1667.9500 2.48 698 95 947 1591 72585 21.22
9.6856 1677.6356 2.42 702 97 939 1616 73524 21.49
9.6235 1687.2592 2.41 706 94 905 1567 74429 21.76
10.4504 1697.7095 2.61 710 85 892 1423 75321 22.02
10.9176 1708.6271 2.73 714 81 880 1343 76201 22.27
10.8729 1719.5000 2.72 718 74 808 1239 77009 22.51
10.8216 1730.3216 2.71 722 78 845 1301 77854 22.76
10.6283 1740.9498 2.66 726 76 805 1262 78659 22.99
11.4257 1752.3755 2.86 730 56 642 936 79301 23.18
11.7652 1764.1407 2.94 734 56 662 938 79963 23.37
10.9852 1775.1260 2.75 738 65 715 1085 80678 23.58
10.6633 1785.7893 2.67 742 66 701 1096 81379 23.79
10.5701 1796.3594 2.64 746 68 722 1138 82101 24.00
10.2406 1806.6000 2.56 750 62 636 1035 82737 24.18
10.9406 1817.5407 2.74 754 69 758 1155 83495 24.41
12.3506 1829.8912 3.09 758 60 737 995 84232 24.62
11.6754 1841.5666 2.92 762 53 621 886 84853 24.80
11.9212 1853.4878 2.98 766 55 657 919 85510 25.00
11.6050 1865.0928 2.90 770 54 621 892 86131 25.18
11.3354 1876.4281 2.83 774 51 582 856 86713 25.35
9.3346 1885.7627 2.33 778 60 563 1005 87276 25.51
Table 14.2 Results of the 45Ca tracer advection experiments using NRVB equilibrated water

315
Time Sample 1 Minus blank
Counts Remove
d Cmax C/Cmax Sample 2
Minus Blank
Counts Removed
Cmax C/Cmax Mean C/Cmax
Days d min-1
cm-3 d min-1
cm-3 d min-1
cm-3 d min-1
cm-3
d min-1
cm-3 d min-1
cm-3 d min-1 cm-3
d min-1
cm-3
0 51 9 9 80373 0.000 49 7 7 80373 0.000 0.000
29 107 65 74 80733 0.001 110 68 75 80733 0.001 0.001
42 219 177 251 81097 0.002 216 174 249 81097 0.002 0.002
58 293 251 502 81463 0.003 265 223 472 81463 0.003 0.003
72 425 383 885 81832 0.005 399 357 829 81832 0.004 0.005
90 483 441 1326 82204 0.005 471 429 1258 82204 0.005 0.005
103 653 611 1937 82579 0.007 605 563 1821 82579 0.007 0.007
119 813 771 2708 82957 0.009 728 686 2507 82957 0.008 0.009
128 846 804 3512 83337 0.010 726 684 3191 83338 0.008 0.009
149 980 938 4450 83721 0.011 867 825 4016 83723 0.010 0.011
163 1258 1216 5666 84108 0.014 1001 959 4975 84110 0.011 0.013
180 1354 1312 6978 84497 0.016 1004 962 5937 84500 0.011 0.013
201 1426 1384 8362 84889 0.016 1117 1075 7012 84894 0.013 0.014
211 1404 1362 9724 85285 0.016 1166 1124 8136 85292 0.013 0.015
240 1709 1667 11391 85685 0.019 1318 1276 9412 85692 0.015 0.017
274 1878 1836 13227 86087 0.021 1399 1357 10769 86096 0.016 0.019
303 2337 2295 15522 86492 0.027 1718 1676 12445 86504 0.019 0.023
363 2994 2952 18474 86899 0.034 2192 2150 14595 86914 0.025 0.029
455 3638 3596 22070 87306 0.041 2561 2519 17114 87325 0.029 0.035
Table 15.2 Results for the diffusion of 63Ni tracer with NiCl2 carrier using CDP solution

316
Sample 1 Sample 2 Mean SD
Days Bq dm-3 Bq dm-3 Bq dm-3
0 150 117 133 17
29 1083 1133 1108 25
42 2950 2900 2925 25
58 4183 3717 3950 233
72 6383 5950 6167 217
90 7350 7150 7250 100
103 10183 9383 9783 400
119 12850 11433 12142 708
128 13400 11400 12400 1000
149 15633 13750 14692 942
163 20267 15983 18125 2142
180 21867 16033 18950 2917
201 23067 17917 20492 2575
211 22700 18733 20717 1983
240 27783 21267 24525 3258
274 30600 22617 26608 3992
303 38250 27933 33092 5158
363 49200 35833 42517 6683
455 59933 41983 50958 8975
Table 15.3 Results for the diffusion of 63Ni tracer with NiCl2 carrier using CDP solution expressed as activity concentration
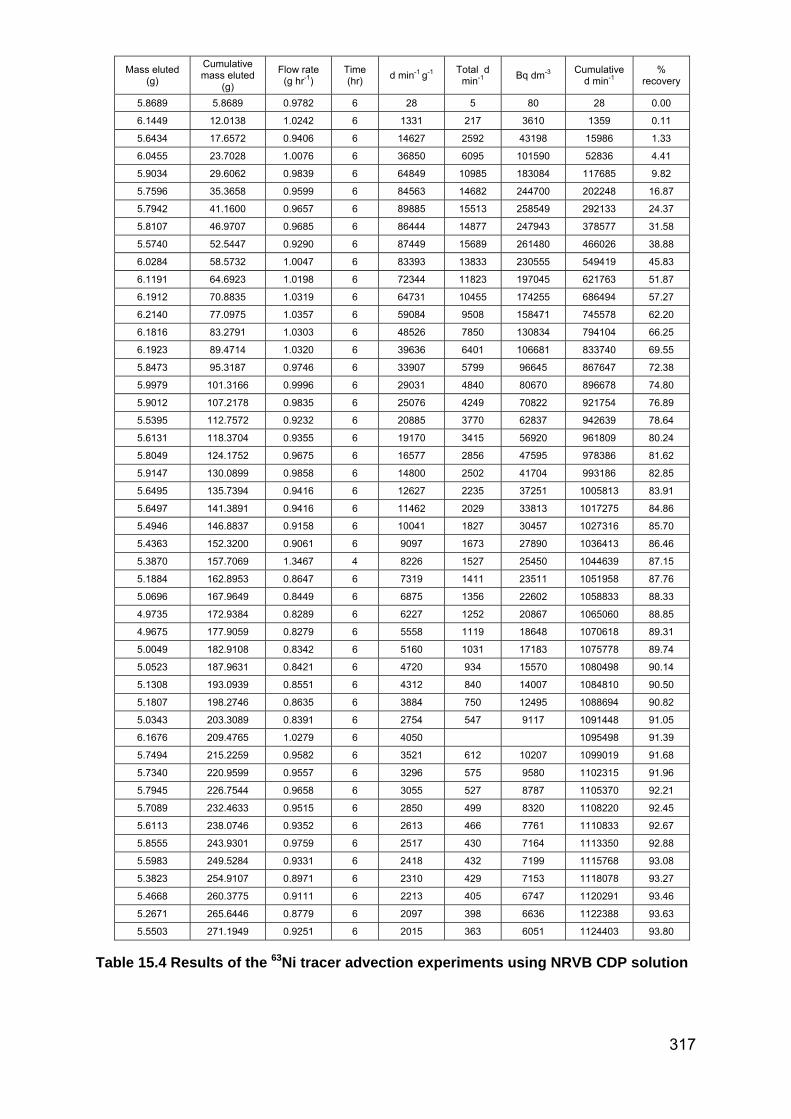
317
Mass eluted (g)
Cumulative mass eluted
(g)
Flow rate (g hr-1)
Time (hr)
d min-1 g-1 Total d
min-1 Bq dm-3
Cumulative d min-1
% recovery
5.8689 5.8689 0.9782 6 28 5 80 28 0.00
6.1449 12.0138 1.0242 6 1331 217 3610 1359 0.11
5.6434 17.6572 0.9406 6 14627 2592 43198 15986 1.33
6.0455 23.7028 1.0076 6 36850 6095 101590 52836 4.41
5.9034 29.6062 0.9839 6 64849 10985 183084 117685 9.82
5.7596 35.3658 0.9599 6 84563 14682 244700 202248 16.87
5.7942 41.1600 0.9657 6 89885 15513 258549 292133 24.37
5.8107 46.9707 0.9685 6 86444 14877 247943 378577 31.58
5.5740 52.5447 0.9290 6 87449 15689 261480 466026 38.88
6.0284 58.5732 1.0047 6 83393 13833 230555 549419 45.83
6.1191 64.6923 1.0198 6 72344 11823 197045 621763 51.87
6.1912 70.8835 1.0319 6 64731 10455 174255 686494 57.27
6.2140 77.0975 1.0357 6 59084 9508 158471 745578 62.20
6.1816 83.2791 1.0303 6 48526 7850 130834 794104 66.25
6.1923 89.4714 1.0320 6 39636 6401 106681 833740 69.55
5.8473 95.3187 0.9746 6 33907 5799 96645 867647 72.38
5.9979 101.3166 0.9996 6 29031 4840 80670 896678 74.80
5.9012 107.2178 0.9835 6 25076 4249 70822 921754 76.89
5.5395 112.7572 0.9232 6 20885 3770 62837 942639 78.64
5.6131 118.3704 0.9355 6 19170 3415 56920 961809 80.24
5.8049 124.1752 0.9675 6 16577 2856 47595 978386 81.62
5.9147 130.0899 0.9858 6 14800 2502 41704 993186 82.85
5.6495 135.7394 0.9416 6 12627 2235 37251 1005813 83.91
5.6497 141.3891 0.9416 6 11462 2029 33813 1017275 84.86
5.4946 146.8837 0.9158 6 10041 1827 30457 1027316 85.70
5.4363 152.3200 0.9061 6 9097 1673 27890 1036413 86.46
5.3870 157.7069 1.3467 4 8226 1527 25450 1044639 87.15
5.1884 162.8953 0.8647 6 7319 1411 23511 1051958 87.76
5.0696 167.9649 0.8449 6 6875 1356 22602 1058833 88.33
4.9735 172.9384 0.8289 6 6227 1252 20867 1065060 88.85
4.9675 177.9059 0.8279 6 5558 1119 18648 1070618 89.31
5.0049 182.9108 0.8342 6 5160 1031 17183 1075778 89.74
5.0523 187.9631 0.8421 6 4720 934 15570 1080498 90.14
5.1308 193.0939 0.8551 6 4312 840 14007 1084810 90.50
5.1807 198.2746 0.8635 6 3884 750 12495 1088694 90.82
5.0343 203.3089 0.8391 6 2754 547 9117 1091448 91.05
6.1676 209.4765 1.0279 6 4050 1095498 91.39
5.7494 215.2259 0.9582 6 3521 612 10207 1099019 91.68
5.7340 220.9599 0.9557 6 3296 575 9580 1102315 91.96
5.7945 226.7544 0.9658 6 3055 527 8787 1105370 92.21
5.7089 232.4633 0.9515 6 2850 499 8320 1108220 92.45
5.6113 238.0746 0.9352 6 2613 466 7761 1110833 92.67
5.8555 243.9301 0.9759 6 2517 430 7164 1113350 92.88
5.5983 249.5284 0.9331 6 2418 432 7199 1115768 93.08
5.3823 254.9107 0.8971 6 2310 429 7153 1118078 93.27
5.4668 260.3775 0.9111 6 2213 405 6747 1120291 93.46
5.2671 265.6446 0.8779 6 2097 398 6636 1122388 93.63
5.5503 271.1949 0.9251 6 2015 363 6051 1124403 93.80
Table 15.4 Results of the 63Ni tracer advection experiments using NRVB CDP solution

318
APPENDIX 2
Detailed Information for Mass Balances and Discretisation

319
A. Mass Balance and Calculation Checks
The model should automatically conserve mass and account for the reduction in liquid and tracer mass removed due to sampling. A manual check (mass balance) that the correct curves were being generated for a given NRVB mass, , tracer mass and receiving water mass was undertaken to validate the model.
The data used were from the 137Cs NRVB tracer only experiment. The best fit value was 2.3 m3 kg-1 (see graph below).
Later data from the 137Cs NRVB tracer only experiment
Do the relevant masses and volumes at the times of the observations produce a of 2.3 m3 kg-1? Taking point at time T104 the information needed is: Mass of NRVB = (volume of cylinder – volume of central hole).dry bulk density ((43..400)-(30..25)).1.095 = 56.6 g. Height of both cylinders was 43 mm, the value originally used in the modelling; bulk dry density is the literature value.
0
5000
10000
15000
20000
25000
30000
35000
70 120 170 220 270137C
s A
ctiv
ity
Co
nce
ntr
atio
n (
Bq
dm
-3)
Time (Days)
Automatic 50 cell Discretisation 5 Cell Manual Discretisation Observed data

320
Volume of receiving water and water in porosity at T104 = Initial vol. – sample vol. 225 - 34 = 191 cm3
T104 is sample number 34 therefore 34 cm3 have been removed during sampling, starting mass was 225 cm3. 137Cs tracer remaining at T104 = Initial inventory - tracer removed during sampling 9979 – 585 = 9394 Bq Information calculated from section 11.2 and table 11.2 respectively, average values from the two experiments have been used.
Then to determine using:
–
C0 = 9394 (1000/191) = 49183 Bq dm3 C104 = 29150 Bq dm3 (taken from table 11.3) Substituting into the equation gives:
191 49183– 29150
56.6 29150
2.32 m3 kg-1
The point is on the model line and 2.3 is the expected result. Using the same procedure at T253 the result is:
186 49737– 29092
56.6 29092
2.33 m3 kg-1
The observed data point at the same time is given by:
186 49737– 27792
56.6 27792
2.59 m3 kg-1
The observed point is below the model line so a higher than 2.3 is expected. The checks confirm that the model calculates correctly and is compensating for the removal of water and tracer due to sampling. It also means that the initial modelling stage of fixing from the later, flat part of the graph is appropriate.

321
B. Details of Changing the Degree of Discretisation
GoldSim has a mesh generator capable of automatically increasing the number of elements (in this case mixing cells).
The original 5 cell model was set up manually so a parallel 5 cell model was created using the mesh generator as a cross check. Both models produced identical outputs.
A 50 cell model was produced using the mesh generator. The effective diffusivity and partition coefficient previously used to fit the CDP 137Cs tracer only experiment (2.8x10⁻¹⁰ m2 s-1 and 0.7 m3 kg-1) were inputted to produce the model curve. The outputs for the 5 and 50 cell model together with the (5 cell) curves for 2.5 and 3.0x10⁻¹⁰ m2 s-1 and the relevant experimental data points are shown below.
Comparison of 5 and 50 cell discretisations at 2.8x10⁻¹⁰ m2 s-1 and 0.7 dm3
kg-1 with observed CDP 137Cs tracer only data over first 5 days, with model curves for 2.5x10⁻¹⁰ and 3.0x10⁻¹⁰ m2 s-1
0
5000
10000
15000
20000
25000
30000
0 1 2 3 4 5
137C
s A
ctiv
ity
Co
nce
ntr
atio
n (
Bq
dm
-3)
Time (days)
Manual discretisation into 5 cylinders Automatic discretisation into 50 cylinders
Observed (mean) De 2.5.0E‐10
De 3.0E‐10

322
The 20 day plot below is provided to show more of the data in relation to the modelled curves
Comparison of 5 and 50 cell discretisations at 2.8x10⁻¹⁰ m2 s-1 and 0.7 m3
kg-1 with CDP 137Cs tracer only data observed data over first 20 days, with model curves for 2.5x10⁻¹⁰ and 3.0x10⁻¹⁰ m2 s-1
0
5000
10000
15000
20000
25000
30000
35000
40000
45000
50000
0 5 10 15 20
137C
s A
ctiv
ity
Co
nce
ntr
atio
n (
Bq
dm
-3)
Time (days)
Manual discretisation into 5 cylinders Automatic discretisation into 50 cylinders
Observed (mean) De 2.5.0E‐10
De 3.0E‐10

323
The curves from the 5 and 50 cell model are very similar. The difference between the two curves persists over the initial 4-5 days after which no further differences are observed.
The best fit for the entire dataset remains 2.8x10⁻¹⁰ m2s-1 for diffusivity and 0.7 dm3 kg-1 for
The LOF values for the first 5 days are 17.8% for the 5 cell model 16.7% for the 50 cell model.
The LOF values for the entire data set are 6.0% for the 5 cell model and 6.2% for the 50 cell model.
The 50 cell model is a slightly poorer fit to the early data but indistinguishable over the entire data set.
The uncertainty in the observed values far outweighs any difference between the two degrees of discretisation.

324
Due to the difference between the different degrees of discretisation being small the procedure was repeated with the data from the 137Cs NRVB tracer only experiments. The input values were 2.0x10⁻¹⁰ m2s-1 for and 2.3 dm3 kg-1 for .
The results are shown below.
Comparison of 5 and 50 cell discretisations at 2.0x10⁻¹⁰ m2 s-1 and 2.3 dm3 kg-1 with observed data137Cs tracer only data over first 15 days, with model
curve for 2.3x10⁻¹⁰ m2 s-1
0
5000
10000
15000
20000
25000
0 5 10 15
137C
s A
ctiv
ity
Co
nce
ntr
atio
n (
Bq
dm
-3)
Time (Days)
Automatic 50 cell Discretisation 5 Cell Manual Discretisation
Observed data De 2.3E10-10

325
The 30 day plot below is provided to show more of the data in relation to the modelled curves.
Comparison of 5 and 50 cell discretisations at 2.0x10⁻¹⁰ m2 s-1 and 2.3 dm3 kg-1 with observed 137Cs tracer only data over first 30 days, with model
curve for 2.3x10⁻¹⁰ m2 s-1
The curves from the 5 and 50 cell model are again very similar but the difference between the two curves persists over the initial ~15 days.
The best fit for the entire dataset remains 2.0x10⁻¹⁰ m2s-1 for diffusivity and 2.3 dm3 kg-1 for
The LOF values for the first 15 days are 14.2% for the 5 cell model and 16.8% for the 50 cell model.
The LOF values for the entire data set are 8.5% for the 5 cell model and 8.7% for the 50 cell model.
Again the 50 cell model is a slightly poorer fit to the early data but indistinguishable over the entire data set.
The next nearest fit was the model curve for diffusivity 2.3x10⁻¹⁰ m2 s-1 which had LOF values of 15.0% over the first 15 days and 9.6% over the entire dataset. The inclusion of the curve on the plots above illustrates the difficulty of fitting diffusivity to
0
5000
10000
15000
20000
25000
30000
0 5 10 15 20 25 30137C
s A
ctiv
ity
Co
nce
ntr
atio
n (
Bq
dm
-3)
Time (Days)
Automatic 50 cell Discretisation 5 Cell Manual Discretisation
Observed data De 2.3E10-10

326
the early data once the has been fixed and is the reason why data envelopes were used in the thesis.
The uncertainty in the observed values far outweighs any variation between the two degrees of discretisation and the 5 cell model is satisfactory.
The error bars are: vertical 90% confidence limits for the mean used (see response to 5. below for more details) and horizontal +/- 0.2 days.


