Embed Size (px)
Citation preview
mathematics
Article
Differential and Integral Calculus in First-Year EngineeringStudents: A Diagnosis to Understand the Failure
Maria Emília Bigotte de Almeida 1,*, Araceli Queiruga-Dios 2 and María José Cáceres 3
�����������������
Citation: Almeida, M.E.B.d.;
Queiruga-Dios, A.; Cáceres, M.J.
Differential and Integral Calculus in
First-Year Engineering Students: A
Diagnosis to Understand the Failure.
Mathematics 2021, 9, 61. https://
doi.org/10.3390/math9010061
Received: 26 November 2020
Accepted: 24 December 2020
Published: 29 December 2020
Publisher’s Note: MDPI stays neu-
tral with regard to jurisdictional clai-
ms in published maps and institutio-
nal affiliations.
Copyright: © 2020 by the authors. Li-
censee MDPI, Basel, Switzerland.
This article is an open access article
distributed under the terms and con-
ditions of the Creative Commons At-
tribution (CC BY) license (https://
creativecommons.org/licenses/by/
4.0/).
1 Department of Physics and Mathematics, Coimbra Engineering Institute, Polytechnic Institute of Coimbra,3000-271 Coimbra, Portugal
2 Department of Applied Mathematics, University of Salamanca, 37700 Salamanca, Spain;[email protected]
3 Department of Didactics of Mathematics and Experimental Sciences, University of Salamanca,37008 Salamanca, Spain; [email protected]
* Correspondence: [email protected]
Abstract: Difficulties in the curricular units (CU) of the mathematical science area, particularly thoserelated to differential and integral calculus (DIC), are often found among students of engineeringdegrees, leading to high failure rates. A research work was developed with the objective of findingthe reasons that lead the students to fail in the CU of DIC (CU-DIC) taught in the 1st year ofthe engineering undergraduate degrees at the Coimbra Engineering Institute (ISEC), in Portugal.Applying a case study methodology, this article will present a current diagnosis with the objective toestablish relationships between teaching methods and students’ learning strategies, and besides, wepropose to build learning environments that lead to higher success. The analysis of collected dataallows us to conclude that the CU-DIC in the ISEC maintain an identical distribution in the hourlyload in several engineering degrees, where contents are adjusted to each context taking into accountthe CUs of each degree. The data analysis found better results in the academic year that includes twoexamination moments without any relationship between class attendance, dropout and pass rates.We propose some different teaching/learning strategies in CU-DIC and new learning environmentsthat enhance freshmen students’ engagement and participation in their own learning process.
Keywords: differential and integral calculus; mathematical knowledge in engineering; teachingand learning
1. Introduction
Curricular units of differential and integral calculus are the best way to acquire thetheoretical basis necessary for engineering students’ professional futures, and for this,they are present in most of the undergraduate degrees taught in several higher educationinstitutions (HEI).
However, despite its obvious importance, it has been noticed over the years thatthis basic science is the cause of high failure rates in engineering undergraduate degrees,resulting in several problems, such as absenteeism and, consequently, dropping out ofuniversity studies.
The failure and dropout rates in CU-DIC have evidenced the need to questionwhat methodologies and teaching approaches are applied, which learning environmentsare developed that best allow students to be co-responsible in their educational pro-cess, and which assessment practices are related to their school success and lead tosignificant learning [1–3].
These issues related to mathematics failure in teaching engineering students havefrequently appeared in national and international discussions being addressed in severalpublished works, which have received well deserved mention by the international special-ized literature. In 1991, American Mathematical Monthly presented data showed that 45%
Mathematics 2021, 9, 61. https://doi.org/10.3390/math9010061 https://www.mdpi.com/journal/mathematics
Mathematics 2021, 9, 61 2 of 18
of students enrolled in a course of engineering calculus obtained a level equal or higherthan C (marks goes from A to E, with A being the best one and E the worst one).
David Tall, for example, has been a lead researcher in the field of advanced mathemat-ical thinking, whose questions revolve around the difficulties encountered in learning basicconcepts of calculus, with cognitive psychology as a background for their epistemologicalanalysis [4,5].
Another international example of this concern was the movement to reform theteaching of calculus, which began in the 1980s and was known as the “calculus reform”.This movement had as a starting point a controversial document of the mathematicianPeter Lax, who attacked the courses of calculus at the time. According to its precursors, the“calculus reform” had as basic characteristics the use of technology, that is, computationalsoftware and graphing calculators, both for the learning of concepts and theorems and forproblem solving [6–12].
There has also been a growing debate about the relationship between skills develop-ment emerging from upper secondary education and failure in the teaching of mathematicsin engineering [13]. Recently, with the general objective of highlighting the changesproduced in the teaching of engineering in European studies, within the scope of theRULES_MATH project, some examples were presented from the University of Salamanca(Spain) and the University of Gazi (Turkey). In this study, technological tools were usedfor teaching and learning calculus, from training in calculation strategies to reasoningprocesses in the application of contents in engineering situations [14].
Also, the acquisition of basic and elementary knowledge, essential to the full integra-tion of students in DIC, has been one of the main reasons for failure in higher education.This discussion has led to the definition of multiple strategies that aim to overcome thedifficulties detected and a consequent analysis of the impact of the implementation of thesemeasures [15–23].
An analysis of student’s mistakes in examination tests also allowed to identify and tocategorize different difficulties that appeared in the learning of basic contents strategieswhere established to overcome these mistakes later on [24–26].
Abdulwahed et al. summarized the innovative methods used in response to thenecessary reform of mathematics education [27]. The trends observed in the proposedchanges in learning and teaching, many of which are rooted in constructivist ideology,were categorized into six groups:
1. The use of learner-centred methods.2. Contextualization of mathematics using real-world examples.3. Development of strategies to overcome gaps in basic and elementary knowledge.4. Applying face-to face classes and student conversation.5. Improvement of students’ motivation, involvement and self-efficiency.6. Different learning styles approaches.
Ni Fhloinn & Carr presented a diversity of formative assessment types for mathemat-ical engineering, including classroom exercises, homework, mock exam questions, deskquizzes, presentations, critical analysis of statistical articles, peer-to-peer teaching, andon-line assessments and electronic voting systems [28]. They provided practical tips forimplementing such assessments, with a particular focus on time or resource constraintsin case of large classes, as well as effective feedback methods. They also considered thebenefits of such formative assessments for students and staff.
Technology is evidenced as a facilitator in the innovative approaches applied inmathematics teaching, not only in software packages use for mathematical analysis ofspecific domain but also in the general use of learning technologies and online tools [29–32].
Computers can contribute to the learning process. Its use may influence curriculum,teaching, assessment, motivation, socialization, etc. [33–40].
There are no perfect solutions, but the identification of constraints to the implemen-tation of new approaches in teaching mathematics will allow the necessary adaptation
Mathematics 2021, 9, 61 3 of 18
to the contexts and will consequently lead to eventual behavioural changes of the educa-tional agents.
For this study, we considered that, in general, in the mathematical community, thereare several options to construct a curriculum [41]. Cardella proposed the use of math-ematical thinking identified by Schoenfeld, extending the horizon to be reached by theteaching of mathematics in engineering degrees. Schoenfeld argued that in addition tolearning contents, there are strategies for problem solving; metacognitive processes in theuse of mathematical resources, goals and practices that together make up mathematicalthinking [42–44]. Since understanding a concept does not happen in the same way for dif-ferent individuals, genetic decomposition serves as support in the elaboration of teachinginstructions that consider the possible cognitive paths that students use in the process ofacquiring a concept. Similarly, Asiala et al. presented in broad sense the meaning of “learnand know something in mathematics”:
“An individual’s mathematical knowledge is her or his tendency to respond toperceived mathematical problem situations by reflecting on problems and theirsolutions in a social context and by constructing or reconstructing mathematicalactions, processes, and objects by organizing these in schemas to use in dealingwith situations”. [45] (p. 5).
In 2004, the Committee on the Undergraduate Program in Mathematics (CUPM) ofthe American Mathematical Association wrote a curriculum guide containing recommen-dations that followed the same strategic line [46]. This report was based on workshopswhere professors from a broad range of partners’ disciplines presented their understandingof the necessary qualifications for success in mathematics curricular units.
Finally, the Danish KOM project led by Niss organized a detailed and systematicdescription of what is achieved with mathematics teaching using the concept of compe-tence that influenced the description of learning objectives reflected in the OECD-PISAstudies [47]:
“Mathematical competence means the ability to understand, judge, make and usemathematics in a variety of intra and extra mathematical contexts in situations inwhich mathematics plays or can play a role. Necessary, but certainly not sufficient,prerequisites for mathematical competence are lots of factual knowledge andtechnical skills in the same way as vocabulary, orthography, and grammar arenecessary but not sufficient prerequisites for literacy”. [48] (pp. 6–7).
The KOM project has identified eight mathematical competencies which, while over-lapping in some respects, emphasize others. These competencies are:
• Thinking mathematically (C1), reasoning mathematically (C2), posing and solvingmathematical problems (C3), and modelling mathematically (C4), which make up theability to ask and answer questions in and with mathematics.
• Representing mathematical entities (C5), handling mathematical symbols and for-malism (C6), communicating in, with, and about mathematics (C7), and makinguse of aids and tools (C8) are concerned with “the ability to deal with and managemathematical language and tools” [48].
It is clearly accepted that these eight competencies cannot be acquired just by attend-ing classes, so appropriate forms of student involvement and co-responsibility must beimplemented.
There is a lot of research that tries to explain the failure in the UC-DIC but there issome lack of scientific production that proposes an integrated and sustained intervention.It will be important to articulate, to describe and to analyze a practice of teaching andassessment, implemented in classroom context, which can be relate to the learning and theacademic success of the students [49].
Mathematics 2021, 9, 61 4 of 18
2. Portuguese Context in the Access to Engineering Studies
In Portugal, compulsory education is until the age of 18 and consists of two levels:basic (nine years) and secondary (three years). The access to higher education is throughthe application to the national contest organized by the General Directorate for HigherEducation (GDHE). This competition is held each year at the end of upper secondaryeducation and is organized in three phases, according to a previously defined calendar.The National Commission for Access to Higher Education is responsible for definingrules for fixing admission tests for each academic year (specific tests are required for eachundergraduate degree).
Although they may take other forms, entrance exams are currently implemented infinal national examinations, which are held at two different times through of secondarycompulsory education. The final mark obtained in these examinations will include theweighted average together with the final internal classification obtained by the studentsduring the three years of secondary education. For each degree, candidates will get a scorethat will be serialized according to the existing candidates.
The definition of specific tests is made according to the requirements of each un-dergraduate degree in the conditions of admission and intends to prove the capacity ofstudents to attend higher education.
The entrance exams that are required for each course are fixed by each institution, andcannot, in general, be more than two.
The policies for entering into higher education and the current relationship betweentraining and demand intend to be a democratic process, with a clear deficit in demandin 2013. Since 2014 the offer tends to stabilize and there is an inversion of the situation(https://www.dges.gov.pt/estatisticasacesso/2018/).
Portuguese higher education includes university and polytechnic system. The dif-ference between the conceptions regarding the two subsystems has marked the students’choices in the access to higher education and generates some doubts to students.
The university education, traditionally related to knowing how to think and currently,largely due to Anglo-Saxon influence, linked to scientific research, is composed by 55%of students who access higher education. On the other hand, polytechnic education,traditionally linked to know-how and to knowledge applicability, is followed by theremaining 45%.
In the last five years, this proportion did not have significant variability. This asym-metry may be explained by the absence of real different offers, since both systems conferidentical degrees (graduations and masters degrees), with doctorates (still) being reservedfor universities. To increase the confusion of the candidates, the offer of the type of coursesis often identical, and in most cases, there are no different pedagogies in both systemsof education.
Democratization in the access to higher education also reveals asymmetries in theoffer/demand of the various courses, noting that engineering areas have been deprecatedin recent years. The number of engineering courses (HEE) corresponds to 20% of the offerof higher education (HE). This percentage is distributed by the university system (USE)with 56% of the undergraduate engineering degrees, and by polytechnic (PSE) with theremaining degrees (http://www.dges.gov.pt).
The available data on the GDHE website shows an increasing demand for engineeringdegrees with a percentage of vacancies filled, on average, by 90.11% in the USE and by94.91% of the candidates in the PSE. Civil engineering degrees have the lowest demandand computer engineering the highest one.
The low offer/demand for engineering studies could be explained by the fact thatin 2012, mathematics and physics were introduced as compulsory subjects in entranceexams to access to most engineering courses. Higher education teachers certified thismeasure as an essential one considering the requirement of theoretical bases in crucial areasof knowledge. However, the inability to generate the preference and vocation for thosedisciplines leads to disinterest in those areas. This abandonment necessarily implies the
Mathematics 2021, 9, 61 5 of 18
lack of preparation in mathematics and physics of the majority of students at the end of thesecondary cycle, provoking, cumulatively, a lack of interest in engineering. This deficit indemand has forced HEIs to change the number of vacancies due to the positions obtainedin previous years, implying the closure and/or creation of new degrees.
Coimbra Engineering Institute is an organic unit of the Polytechnic Institute ofCoimbra that offers engineering undergraduate degrees, such as: industrial management(EGI), bioengineering (BioE), mechanics (EM), electromechanics (EEM), electrotechnology(normal-EE and post-work regime-EE (PL)), informatics (normal-EI, post-work regime-EI(PL) and European course-EI (CE)), biomedical (EBiom) and civil (EC). In the 2018/19 aca-demic year, and in order to meet the weak demand for EC, ISEC created a new engineeringdegree in sustainable cities management (GSC) which was presented with a curricular planfocused on economic, environmental and social sustainability of learning methodologiesthat allow students to develop professional skills.
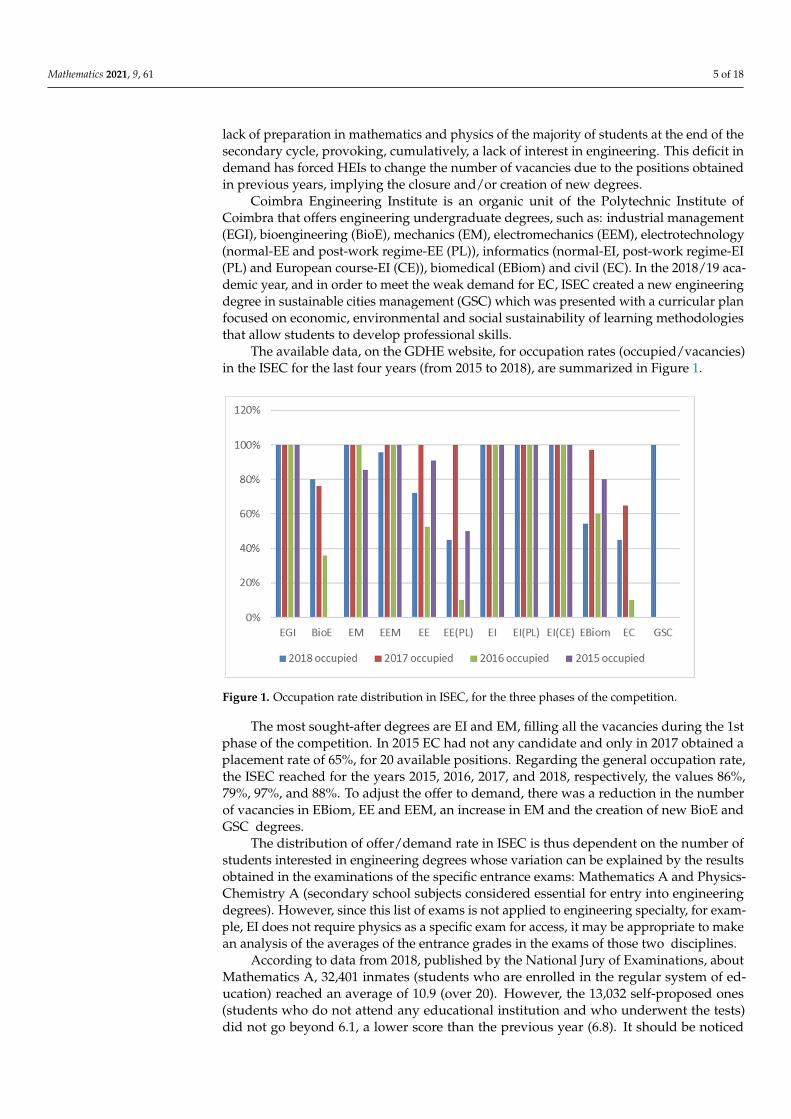
The available data, on the GDHE website, for occupation rates (occupied/vacancies)in the ISEC for the last four years (from 2015 to 2018), are summarized in Figure 1.
Mathematics 2021, 9, x FOR PEER REVIEW 5 of 19
an essential one considering the requirement of theoretical bases in crucial areas of knowledge. However, the inability to generate the preference and vocation for those disci-plines leads to disinterest in those areas. This abandonment necessarily implies the lack of preparation in mathematics and physics of the majority of students at the end of the sec-ondary cycle, provoking, cumulatively, a lack of interest in engineering. This deficit in demand has forced HEIs to change the number of vacancies due to the positions obtained in previous years, implying the closure and/or creation of new degrees.
Coimbra Engineering Institute is an organic unit of the Polytechnic Institute of Coim-bra that offers engineering undergraduate degrees, such as: industrial management (EGI), bioengineering (BioE), mechanics (EM), electromechanics (EEM), electrotechnology (nor-mal-EE and post-work regime-EE (PL)), informatics (normal-EI, post-work regime-EI (PL) and European course-EI (CE)), biomedical (EBiom) and civil (EC). In the 2018/19 academic year, and in order to meet the weak demand for EC, ISEC created a new engineering de-gree in sustainable cities management (GSC) which was presented with a curricular plan focused on economic, environmental and social sustainability of learning methodologies that allow students to develop professional skills.
The available data, on the GDHE website, for occupation rates (occupied/vacancies) in the ISEC for the last four years (from 2015 to 2018), are summarized in Figure 1.
Figure 1. Occupation rate distribution in ISEC, for the three phases of the competition.
The most sought-after degrees are EI and EM, filling all the vacancies during the 1st phase of the competition. In 2015 EC had not any candidate and only in 2017 obtained a placement rate of 65%, for 20 available positions. Regarding the general occupation rate, the ISEC reached for the years 2015, 2016, 2017, and 2018, respectively, the values 86%, 79%, 97%, and 88%. To adjust the offer to demand, there was a reduction in the number of vacancies in EBiom, EE and EEM, an increase in EM and the creation of new BioE and GSC degrees.
The distribution of offer/demand rate in ISEC is thus dependent on the number of students interested in engineering degrees whose variation can be explained by the results obtained in the examinations of the specific entrance exams: Mathematics A and Phys-ics-Chemistry A (secondary school subjects considered essential for entry into engineering degrees). However, since this list of exams is not applied to engineering specialty, for ex-ample, EI does not require physics as a specific exam for access, it may be appropriate to make an analysis of the averages of the entrance grades in the exams of those two disci-plines.
Figure 1. Occupation rate distribution in ISEC, for the three phases of the competition.
The most sought-after degrees are EI and EM, filling all the vacancies during the 1stphase of the competition. In 2015 EC had not any candidate and only in 2017 obtained aplacement rate of 65%, for 20 available positions. Regarding the general occupation rate,the ISEC reached for the years 2015, 2016, 2017, and 2018, respectively, the values 86%,79%, 97%, and 88%. To adjust the offer to demand, there was a reduction in the numberof vacancies in EBiom, EE and EEM, an increase in EM and the creation of new BioE andGSC degrees.
The distribution of offer/demand rate in ISEC is thus dependent on the number ofstudents interested in engineering degrees whose variation can be explained by the resultsobtained in the examinations of the specific entrance exams: Mathematics A and Physics-Chemistry A (secondary school subjects considered essential for entry into engineeringdegrees). However, since this list of exams is not applied to engineering specialty, for exam-ple, EI does not require physics as a specific exam for access, it may be appropriate to makean analysis of the averages of the entrance grades in the exams of those two disciplines.
According to data from 2018, published by the National Jury of Examinations, aboutMathematics A, 32,401 inmates (students who are enrolled in the regular system of ed-ucation) reached an average of 10.9 (over 20). However, the 13,032 self-proposed ones(students who do not attend any educational institution and who underwent the tests)did not go beyond 6.1, a lower score than the previous year (6.8). It should be noticed
Mathematics 2021, 9, 61 6 of 18
that self-proposed students represent 28.68% of the total number of students who passedMathematics A test, and the number of students who did this test decreased by 8% about2017. Despite the improvements in grades, Mathematics A continues to be among thedisciplines where there is more failure: 14% of the inmates do not pass (compared to 13%in 2017) and 78% of the self-proposed also had negative marks (compared to 72% in 2017).It should also be noticed that the average scores obtained by the internal students in theentrance exams fall drastically concerning the results obtained at the end of secondaryeducation, from 14.0 to 10.9 (over 20 values).
Also, Mathematics A is among the disciplines with the highest number of tests carriedout in the 1st phase, which present distribution of the means of the exam classificationswith greater dispersion of the data and consequently with higher value of the coefficient ofvariation. It should be noted that in the second phase this test shows the same behaviourin terms of the characteristics of the respective distributions.
These values indicate that the distributions of the classifications in these disciplineshave a significant number of extreme values, which have a great influence on the averagevalues of the classifications. Thus, the study of these distributions should also considerother measures of central tendency, namely the median and the fashion.
Physics-Chemistry A averages increased in relation to the results of 2017: from 9.9 to10.6 for the internal students and from 8.0 to 9.5 for the self-proposed students. This rise inthe marks of Physics-Chemistry resumes the behaviour of three consecutive years of risesafter a drastic fall in 2017 when the discipline took the last place of the table.
Self-proposed students represent 38.41% of the total number of students who under-went a Physical-Chemistry exam. The number of students who participated in this test hasdecreased by 8% in relation to 2017. The failure rate, although considerable, has decreasedcompared to the previous year: 10% of the internal students failed (compared to 14% in2017) and 52% of the self-proposed also had negative results (compared to 64% in 2017). Itshould be noticed that in an analogous way that in Mathematics A, the scores obtainedin Physics-Chemistry A by the internal students in the entrance exams fell drastically inrelation to the results obtained at the end of the secondary school, from 14.2 to 10.9.
Because of the poor results and the fluctuation of the marks obtained in these tests,which are key disciplines to accessing engineering degrees, students naturally tend toavoid engineering and look for alternatives in other areas.
Against this background, the Polytechnic Higher Education schools are attemptingto fill the decrease in demand for engineering degrees by making use of other accessmodalities allowed by law, such as access over 23 years of age, holders of upper or middlecourses, diplomas of technological specialization, specials, etc. It is, however, an audiencewith diverse personal, motivational and cognitive characteristics, with consequent het-erogeneity in basic and elementary knowledge, essential for integration in engineeringcourses, especially in the area of mathematics. Although this alternative may benefit thefinancing of higher education, more attention will inevitably be devoted to the definitionof alternative means to complement the training of some of the admitted profiles [23].
In this context, it is a priority that mathematics teachers in engineering degrees,especially those who teach in the first year, seek changes in their pedagogical practices. Itis important to adapt educational strategies to the characteristics of students, their modesof communication, difficulties and learning styles. This practice becomes a permanentchallenge for teachers of higher education and makes them to debate some importantissues, namely as regards the relation of the students’ success with their motivation andway of learning as well as the way teachers do their assessment practices.
3. Differential and Integral Calculus in ISEC
Teachers in ISEC have proven, during several years of teaching, what the literaturepresents, realizing the great difficulties of the students, in particular with CU-DIC, in the1st semester of the 1st year in all of undergraduate engineering degrees. The curricula ofthe engineering degrees are sequentially constructed and all the UC contents are taught
Mathematics 2021, 9, 61 7 of 18
in an articulated form, so it is very important that the students acquire the essential andelementary mathematics concepts to integrate CU-DIC.
Indeed, these courses lead to high failure rates and therefore to a demotivation ofall those involved in the educational process, placing teachers in constant self-reflection.Engineering teachers should develop appropriate strategies to adapt, as best as possible,to the ever-increasing heterogeneity in the knowledge and skills acquired by students insecondary education [21,23,50].
Aware of the difficulties in accessing to higher education, ISEC’s Department ofPhysics and Mathematics (DFM) has developed several activities that allow students theopportunity to bridge gaps in mathematics. One of the measures found by the DFM wasto offer CU-DIC in a sliding regime. This extraordinary regime arises from the attempt toovercome the failure detected over the years, in the CU of Mathematics, taught in the 1styear/1st semester of engineering studies. In fact, in the academic year 2002/2003, the Sci-entific Committee (CC) of the Scientific Area of Mathematics (ACM) of ISEC implementedthe pedagogical experience “sliding disciplines” which, after analysis and corrections intro-duced to optimize resources and improvement of results, began to integrate the distributionof teaching service. These CUs are conducted in alternative semesters, complementing thecurricular program of the degrees. This operation also allows students over 23 years toaccess ISEC, with prior preparation during the first semester to acquire the basic essentialknowledge to the integration in the curricular units of DIC.
Notwithstanding all this effort, we have verified that students did not meet theexpectations, showing low pass rates and high dropout rates (both in classes and examina-tion moments).
Reversing these trends in students’ performance is an unequivocal purpose associatedwith teaching practice. An exploratory study was carried out, to allow a diagnosis of thesituation regarding the teaching of the DIC in the CUs in engineering degrees at ISECin general, and in particular in the CU whose head is one of this study’s authors. Theanalysis of these data may subsequently lead to the need for a research that seeks to design,develop, and evaluate an intervention at the level of teaching and assessment practices ofthe CU-DIC that leads to better learning and increased success rates.
4. The Study4.1. Methodology
This exploratory study follows a methodology of quantitative research, consideringthe observation and analysis of collected data. Taking into account that the analysis mayallow us to understand and explain the factors that affect students’ failure in CU-DICintegrated into the curricular plan of engineering degrees, the approach of this case studywill be done according to an interpretative paradigm. Therefore, it is intended, without anykind of control over the situation, to obtain explanations that allow the establishment ofrelations between the operation of the various CU-DICs taught at ISEC and their respectivepass rates. The conclusions may lead to the implementation of teaching, learning andassessment strategies that contribute to the promotion of success in those CUs. The datatreatment had a descriptive statistical approach.
4.2. Instruments
From the academic year 2010/2011, CC-ACM requested CU managers from severaldisciplinary groups (groups of teachers who teach CU in the same mathematical area:analysis, algebra, statistics, and applied mathematics) the characterization records of eachCU (called FCU), which integrate the respective programmed contents, the assessmentmethodologies and the skills to be developed. Other important documents are systematiza-tion of information reports (RCU) that include class attendance, dropout and pass rates.These records and reports (FCU and RCU) are completed semi-annually by the professorsresponsible for each CU-DIC and constitute the data collection to be evaluated in order tocarry out a continuous analysis of the results obtained in the CU-CDI.
Mathematics 2021, 9, 61 8 of 18
These instruments refer to the period from 2011/2012 to 2017/2018, corresponding to7 academic years, associated with 11 CU-DIC, and integrated into the disciplinary groupof analysis.
Considering the context and the objective of the study that was proposed, we collectedthe following relevant information:
• Contents taught in the CU-DIC of each degree of engineering at ISEC.• Assessment methodologies.• Students’ competencies that will be acquired.• Type of classes integrated by each CU (theoretical, theoretical-practical, or
tutorial orientation).• The number of hours of on-site classes with students and unaccompanied work.• Attendance classes’ rate, considering only the highest lowest rate found with an
indication of the week in which each occurrence was confirmed.• Attendance rate in examination moments are given by the ratio between the number
of students participating in the assessment (P) and the number of enrolled students inthe CU (I), i.e., P/I;
• Dropout rate in the examination moments given by the ratio between the number ofevaluated students (A) and the number of students participating in the assessment(P), i.e., A/P.
• Pass rate in examination moments are given by the ratio between the number ofstudents approved (Ap) and the number of evaluated students (A), i.e., Ap/A.
The analysis of these assessment rates corresponds to the exam (Ex) and distributedevaluation (AD), which includes 2 or more mid-term examination moments. The studywas conducted in different forms of assessment in order to understand which strategy hasthe best final results.
However, since the RCUs integrate final information elaborated in a systematizedform by the teachers responsible for each CU-DIC, they do not allow to draw more specificconclusions on the relation of the pass rates with the alternative assessment methods.Consequently, a complementary study was carried out in the degrees of EI and EBiom.
For this purpose, the assessment guidelines were analysed in these 7 years underreview, and which integrate the data of the pass rate in AD, Ex and the final pass rate (T). Itshould be noted that, similar to the RCU, these pass rates are calculated in relation to thenumber of students evaluated, thus excluding dropouts.
4.3. Sample
As mentioned above, the results presented here come from the analysis over a periodof 7 years, between the academic year 2011/2012 and 2017/2018. UC-DIC’s records andevaluation reports (FCU and RCU) of 11 engineering degrees were analysed, for the 1stsemester (EGI, BioE, EM, EEM, EE, EI, EBiom, EC, GSC and Chemical (EQ) and BiologicalEngineering (EBiol) which became extinct in 2015) and 4 of these UC-DIC (EM, EEM, EEand EI) taught in the 2nd semester, under the CU sliding regime.
In total, 126 records and reports were analysed: 51 characterization records (FCU) and75 information of systematization reports (RCU). From these 75 reports of each curricularunit, 51 were from the first semester, and 24 were from the second semester and refer to theCU sliding regime.
5. Results
The research developed has the objective of finding the reasons that lead the studentsto fail in the CU-DIC taught in the 1st year of the engineering undergraduate degreesin ISEC. A diagnosis to establish relationships between teaching methods and students’learning strategies was performed. Table 1 summarizes the main results, which are detailedin subsequent sections.
Mathematics 2021, 9, 61 9 of 18
Table 1. Main results.
Aspect Results
General scope
The hours of on-site classes are distributed by theoretical, practical andtheoretical-practical classes, the latter model being the most used in allthe degrees studied.Contents common to all CU-DICs under study are Basics Concepts ofDifferential and Integral Calculus, curricular plans integrate other morespecific topics according to the degree.Only Reasoning Mathematically competence is common to all degrees.The attendance rate decreases notably over the two semesters, reaching adropout rate of over 90% in some cases.The overall average of the pass rate in both semesters is low, closely 58%.
Private Sector—Biomedical and Informatics
EBiom results show a high attendance rate for exams.EI results shows a low attendance rate for exams.Distributed assessment is the preferred modality of students with asignificant pass rate, in both degrees.
5.1. General Scope
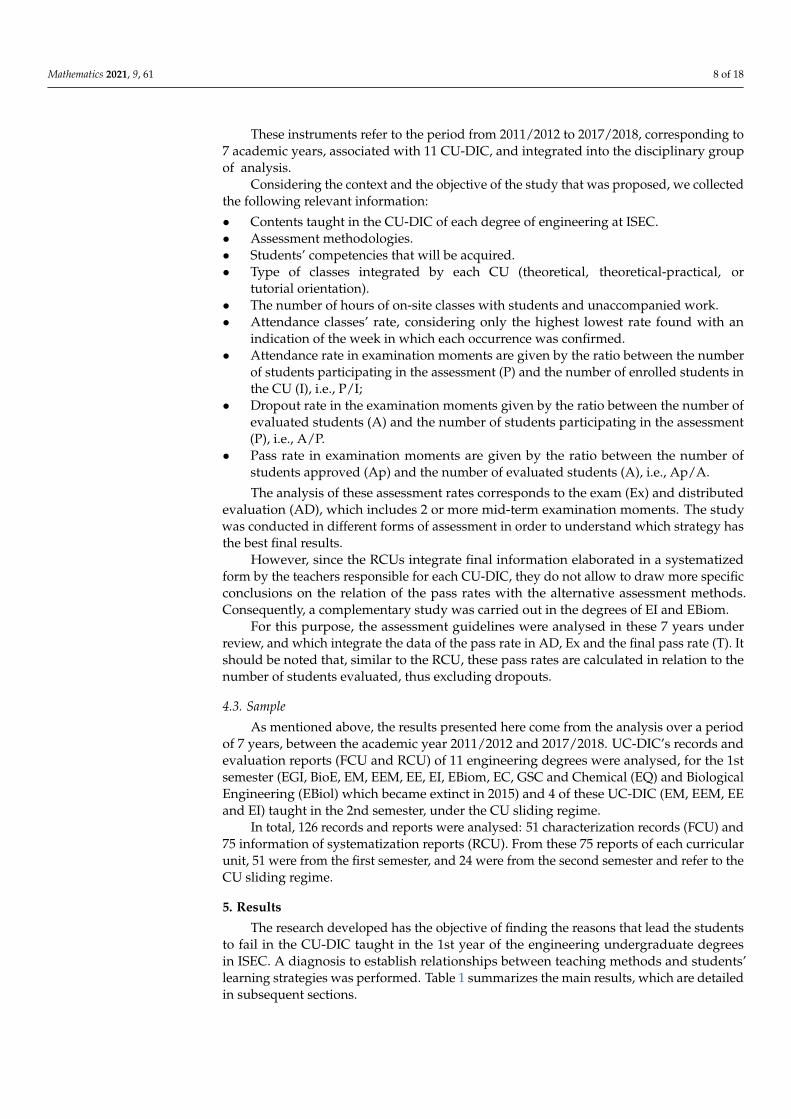
From the observation of the FCU, the hours of on-site classes of the different CUsare currently distributed by theoretical, practical and theoretical-practical classes and areshown in Figure 2. From the analysis, we conclude that EC and GSC only have theoretical-practical classes in a total of 77 h (5.5 h/week) and 49 h (3.5 h/week), respectively. Theremaining UCs have 28 h of theoretical classes (2 h/week) and 28 h of theoretical-practicalclasses (2 h/week), except EBiol that registers 30 h and EBiom that contemplates 42 htheoretical-practical (3 h/week). EM and EI also have 14 h (1 h/week) of practical classesand EE 14 h (1 h/week) of tutorial orientation classes.
Mathematics 2021, 9, x FOR PEER REVIEW 9 of 19
5. Results The research developed has the objective of finding the reasons that lead the stu-
dents to fail in the CU-DIC taught in the 1st year of the engineering undergraduate de-grees in ISEC. A diagnosis to establish relationships between teaching methods and stu-dents´ learning strategies was performed. Table 1 summarizes the main results, which are detailed in subsequent sections.
Table 1. Main results.
Aspect Results
General scope
The hours of on-site classes are distributed by theoretical, practical and theoretical-practical classes, the latter model being the most used in all the degrees studied. Contents common to all CU-DICs under study are Basics Concepts of Differential and Inte-gral Calculus, curricular plans integrate other more specific topics according to the degree. Only Reasoning Mathematically competence is common to all degrees. The attendance rate decreases notably over the two semesters, reaching a dropout rate of over 90% in some cases. The overall average of the pass rate in both semesters is low, closely 58%.
Private Sec-tor—Biomedical and
Informatics
EBiom results show a high attendance rate for exams. EI results shows a low attendance rate for exams. Distributed assessment is the preferred modality of students with a significant pass rate, in both degrees.
5.1. General Scope From the observation of the FCU, the hours of on-site classes of the different CUs are currently distributed by theoretical, practical and theoretical-practical classes and are shown in Figure 2. From the analysis, we conclude that EC and GSC only have theoreti-cal-practical classes in a total of 77 h (5.5 h/week) and 49 h (3.5 h/week), respectively. The remaining UCs have 28 h of theoretical classes (2 h/week) and 28 h of theoretical-practical classes (2 h/week), except EBiol that registers 30 h and EBiom that contemplates 42 h theoretical-practical (3 h/week). EM and EI also have 14 h (1 h/week) of practical classes and EE 14 h (1 h/week) of tutorial orientation classes.
Figure 2. On-site classes distribution of the different CUs at ISEC. Figure 2. On-site classes distribution of the different CUs at ISEC.
Regarding the contents contemplated in the FCU, these were grouped into the follow-ing categories: Real functions of real variables: exponential and logarithmic (RF); limitsand continuity (LC); derivation (D); hyperbolic functions (HF); trigonometric and inversefunctions (TF); primitivation (P); applications of integral calculus (AIC); improper integral(II); differential equations (DE); theory of errors—Taylor’s polynomial (TE); non-linearequations—numerical methods (NLE); numerical integration (NI); differential equations—numerical methods (DEN); numerical series (NS); matrices (M); determinants (Dt).
Mathematics 2021, 9, 61 10 of 18
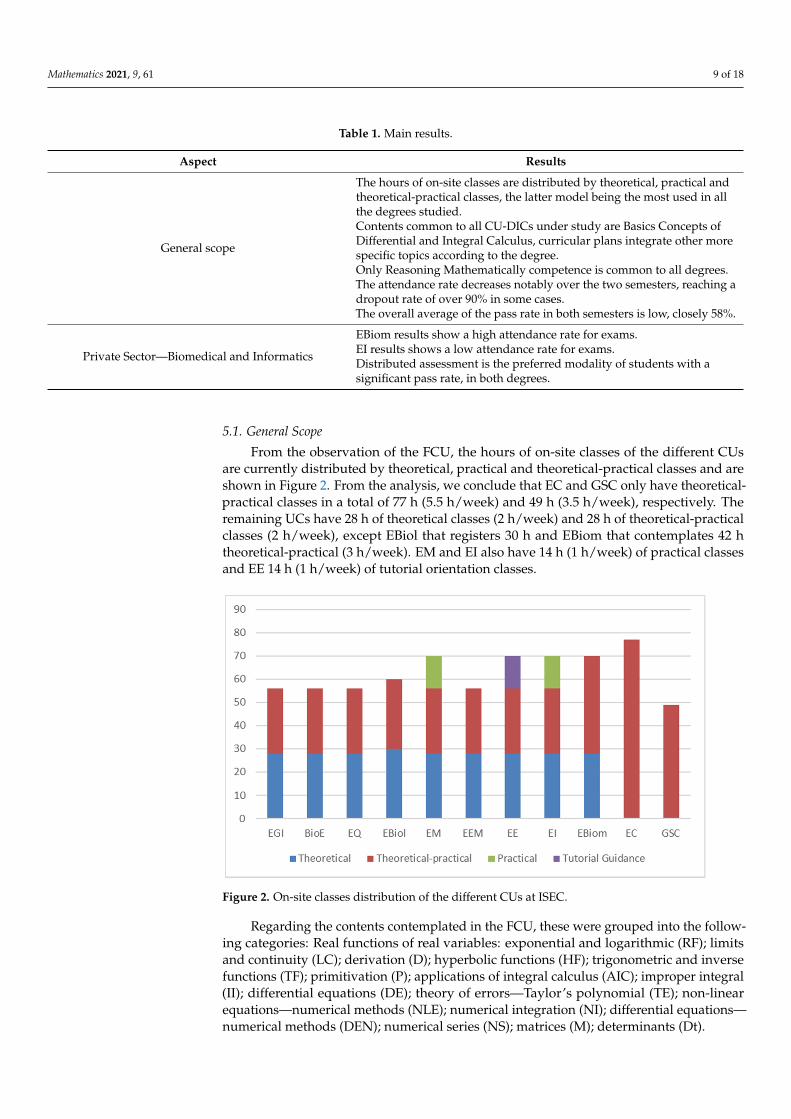
We found some items that are common to all CU-DICs under study, namely, basicsconcepts of differential and integral calculus (Figure 3) such as trigonometric and inversefunctions, primitivation and applications of integral calculus, although the curricular plansintegrate other more specific topics according to the degree they are referring to (numericalcalculus, differential equations, numerical series and basic concepts of algebra). Matricesand determinants are subjects covered in UC-DIC when the undergraduate curriculumdoes not contain an algebra unit.
Mathematics 2021, 9, x FOR PEER REVIEW 10 of 19
Regarding the contents contemplated in the FCU, these were grouped into the fol-lowing categories: Real functions of real variables: exponential and logarithmic (RF); limits and continuity (LC); derivation (D); hyperbolic functions (HF); trigonometric and inverse functions (TF); primitivation (P); applications of integral calculus (AIC); im-proper integral (II); differential equations (DE); theory of errors—Taylor´s polynomial (TE); non-linear equations—numerical methods (NLE); numerical integration (NI); dif-ferential equations—numerical methods (DEN); numerical series (NS); matrices (M); de-terminants (Dt).
We found some items that are common to all CU-DICs under study, namely, basics concepts of differential and integral calculus (Figure 3) such as trigonometric and inverse functions, primitivation and applications of integral calculus, although the curricular plans integrate other more specific topics according to the degree they are referring to (numerical calculus, differential equations, numerical series and basic concepts of alge-bra). Matrices and determinants are subjects covered in UC-DIC when the undergraduate curriculum does not contain an algebra unit.
Figure 3. Programmed content distribution.
The analysis of the competencies to be acquired by students, defined in the KOM project was based on the description made by the teachers in the FCU. These competen-cies are distributed in the different degrees as is presented in Figure 4. Reasoning mathematically competence is the only one common to all degrees. It should be stressed that some competencies mentioned in the KOM project are not explicitly included in some degrees. This will not mean that teachers do not consider them at the time of the present study.
Figure 3. Programmed content distribution.
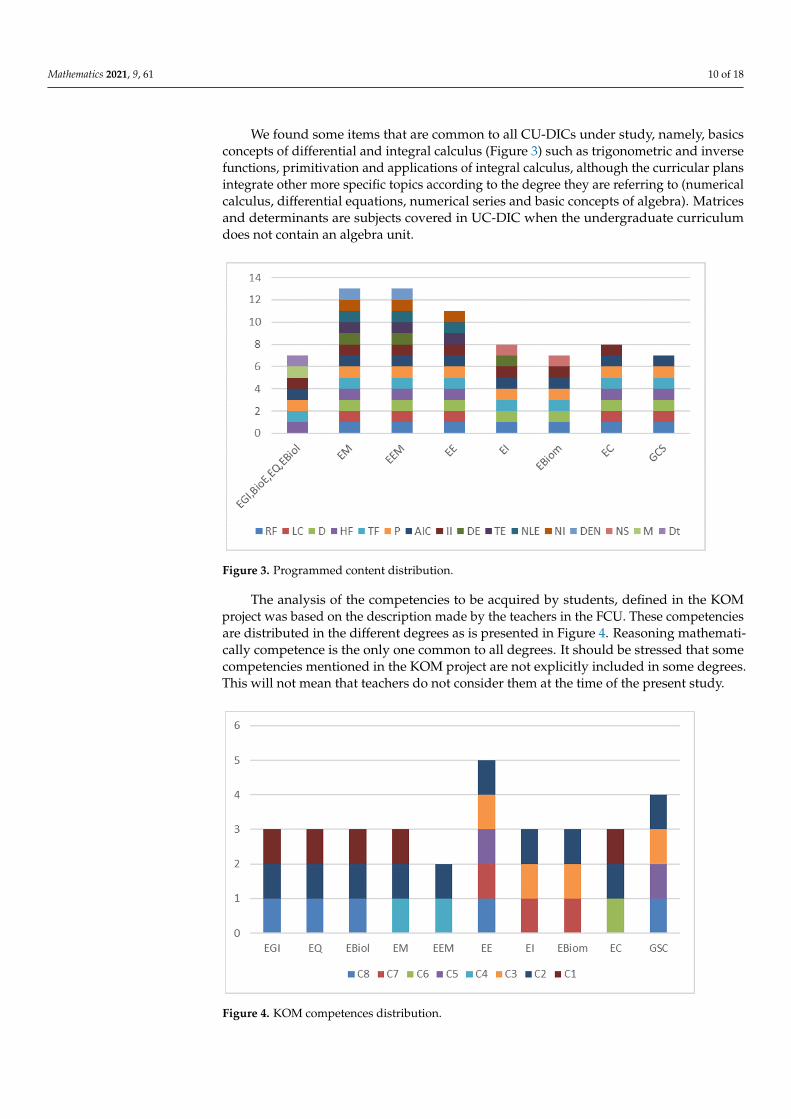
The analysis of the competencies to be acquired by students, defined in the KOMproject was based on the description made by the teachers in the FCU. These competenciesare distributed in the different degrees as is presented in Figure 4. Reasoning mathemati-cally competence is the only one common to all degrees. It should be stressed that somecompetencies mentioned in the KOM project are not explicitly included in some degrees.This will not mean that teachers do not consider them at the time of the present study.
Mathematics 2021, 9, x FOR PEER REVIEW 11 of 19
Figure 4. KOM competences distribution.
Regarding attendance classes rate, it was found that there was a significant decrease in all CUs during both semesters.
Of the 75 RCUs analysed, 50 reported that the attendance rate is less than 50% and 21 show a rate between 50% and 75%. EBiom degree registered the highest attendance rate (above 80%). However, it should be noted that the degrees with the lowest attend-ance rate (less than 30%) are reported in the sliding CU (in 18 of the 24 RCUs). The values ranged from 10.5% (EEM in 2014/2015) and 73.7% (EE in 2011/2012) with an average of 27.97%, in the seven academic years. This result is easily justified by the fact that these sliding regimes work in addition to the curricular program of the degree, thus burdening the teaching component in the second semester.
Overall, about the dropout rate, it is observed that only nine CU have percentages below 75% and 50% of the RCU refer to values above 90%. Also, in this approach, the lowest values are achieved in the CUs that operate in a sliding regime.
The pass rates in the seven years under analysis are summarized in Figure 5 and Figure 6. Note that the values corresponding to the EQ, EGI, BioE, and EBiol degrees were only broken down in the academic year 2017/2018. The data in the RCU for the first semester concludes that EBiom presents the best results with a mean of 73.10% (between 62.5% and 88.2%), with EE showing lower results than the other undergraduate degrees (between 27.9% and 52.1%), presenting an average of 42.24%.
It is also verified that the overall average of the pass rate in the first half of the year is 58.40%, with a standard deviation of 14.34% and an average deviation of 12.4%.
Figure 4. KOM competences distribution.
Mathematics 2021, 9, 61 11 of 18
Regarding attendance classes rate, it was found that there was a significant decreasein all CUs during both semesters.
Of the 75 RCUs analysed, 50 reported that the attendance rate is less than 50% and 21show a rate between 50% and 75%. EBiom degree registered the highest attendance rate(above 80%). However, it should be noted that the degrees with the lowest attendance rate(less than 30%) are reported in the sliding CU (in 18 of the 24 RCUs). The values rangedfrom 10.5% (EEM in 2014/2015) and 73.7% (EE in 2011/2012) with an average of 27.97%, inthe seven academic years. This result is easily justified by the fact that these sliding regimeswork in addition to the curricular program of the degree, thus burdening the teachingcomponent in the second semester.
Overall, about the dropout rate, it is observed that only nine CU have percentagesbelow 75% and 50% of the RCU refer to values above 90%. Also, in this approach, thelowest values are achieved in the CUs that operate in a sliding regime.
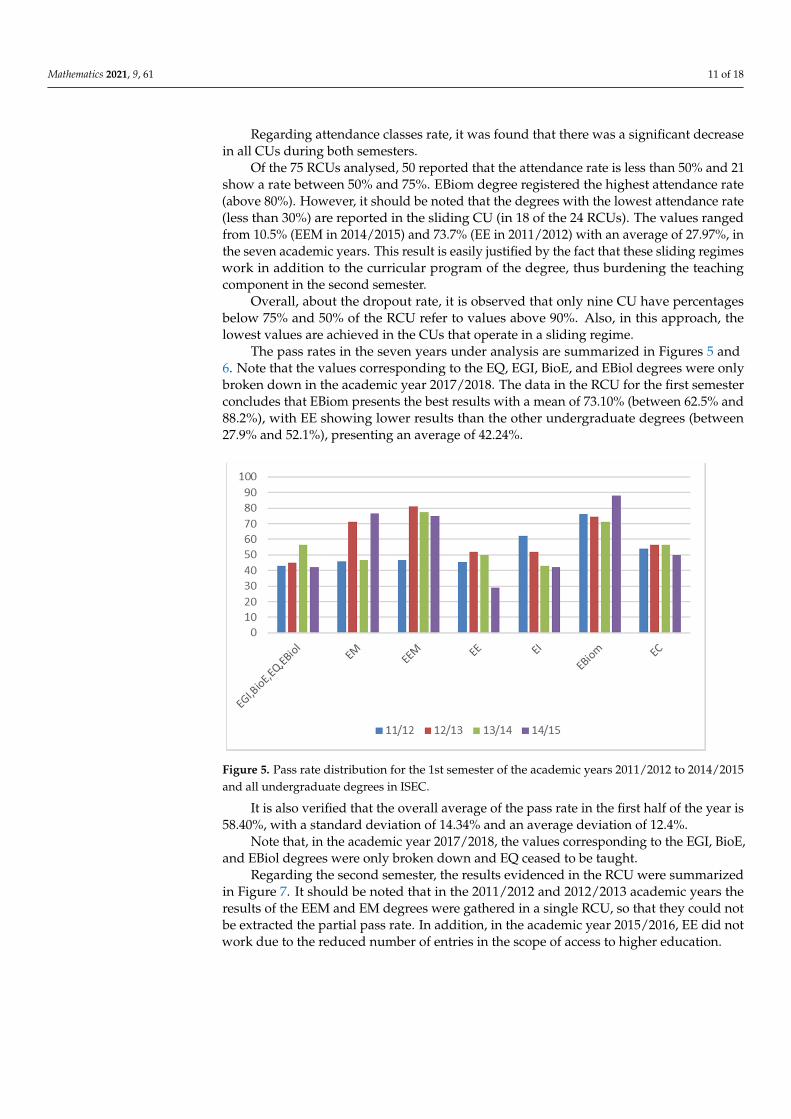
The pass rates in the seven years under analysis are summarized in Figures 5 and6. Note that the values corresponding to the EQ, EGI, BioE, and EBiol degrees were onlybroken down in the academic year 2017/2018. The data in the RCU for the first semesterconcludes that EBiom presents the best results with a mean of 73.10% (between 62.5% and88.2%), with EE showing lower results than the other undergraduate degrees (between27.9% and 52.1%), presenting an average of 42.24%.
Mathematics 2021, 9, x FOR PEER REVIEW 12 of 19
Figure 5. Pass rate distribution for the 1st semester of the academic years 2011/2012 to 2014/2015 and all undergraduate degrees in ISEC.
Note that, in the academic year 2017/2018, the values corresponding to the EGI, Bi-oE, and EBiol degrees were only broken down and EQ ceased to be taught.
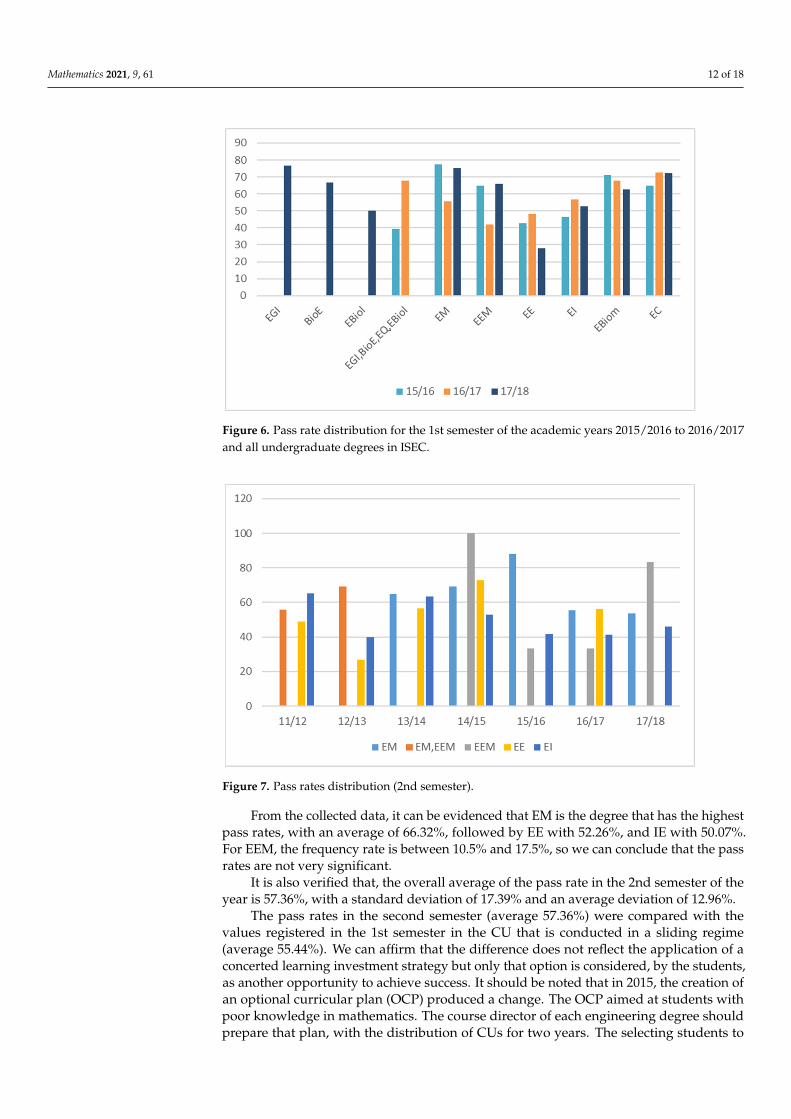
Figure 6. Pass rate distribution for the 1st semester of the academic years 2015/2016 to 2016/2017 and all undergraduate degrees in ISEC.
Regarding the second semester, the results evidenced in the RCU were summarized in Figure 7. It should be noted that in the 2011/2012 and 2012/2013 academic years the results of the EEM and EM degrees were gathered in a single RCU, so that they could not be extracted the partial pass rate. In addition, in the academic year 2015/2016, EE did not work due to the reduced number of entries in the scope of access to higher education.
From the collected data, it can be evidenced that EM is the degree that has the highest pass rates, with an average of 66.32%, followed by EE with 52.26%, and IE with 50.07%. For EEM, the frequency rate is between 10.5% and 17.5%, so we can conclude that the pass rates are not very significant.
It is also verified that, the overall average of the pass rate in the 2nd semester of the year is 57.36%, with a standard deviation of 17.39% and an average deviation of 12.96%.
Figure 5. Pass rate distribution for the 1st semester of the academic years 2011/2012 to 2014/2015and all undergraduate degrees in ISEC.
It is also verified that the overall average of the pass rate in the first half of the year is58.40%, with a standard deviation of 14.34% and an average deviation of 12.4%.
Note that, in the academic year 2017/2018, the values corresponding to the EGI, BioE,and EBiol degrees were only broken down and EQ ceased to be taught.
Regarding the second semester, the results evidenced in the RCU were summarizedin Figure 7. It should be noted that in the 2011/2012 and 2012/2013 academic years theresults of the EEM and EM degrees were gathered in a single RCU, so that they could notbe extracted the partial pass rate. In addition, in the academic year 2015/2016, EE did notwork due to the reduced number of entries in the scope of access to higher education.
Mathematics 2021, 9, 61 12 of 18
Mathematics 2021, 9, x FOR PEER REVIEW 12 of 19
Figure 5. Pass rate distribution for the 1st semester of the academic years 2011/2012 to 2014/2015 and all undergraduate degrees in ISEC.
Note that, in the academic year 2017/2018, the values corresponding to the EGI, Bi-oE, and EBiol degrees were only broken down and EQ ceased to be taught.
Figure 6. Pass rate distribution for the 1st semester of the academic years 2015/2016 to 2016/2017 and all undergraduate degrees in ISEC.
Regarding the second semester, the results evidenced in the RCU were summarized in Figure 7. It should be noted that in the 2011/2012 and 2012/2013 academic years the results of the EEM and EM degrees were gathered in a single RCU, so that they could not be extracted the partial pass rate. In addition, in the academic year 2015/2016, EE did not work due to the reduced number of entries in the scope of access to higher education.
From the collected data, it can be evidenced that EM is the degree that has the highest pass rates, with an average of 66.32%, followed by EE with 52.26%, and IE with 50.07%. For EEM, the frequency rate is between 10.5% and 17.5%, so we can conclude that the pass rates are not very significant.
It is also verified that, the overall average of the pass rate in the 2nd semester of the year is 57.36%, with a standard deviation of 17.39% and an average deviation of 12.96%.
Figure 6. Pass rate distribution for the 1st semester of the academic years 2015/2016 to 2016/2017and all undergraduate degrees in ISEC.
Mathematics 2021, 9, x FOR PEER REVIEW 13 of 19
Figure 7. Pass rates distribution (2nd semester).
The pass rates in the second semester (average 57.36%) were compared with the values registered in the 1st semester in the CU that is conducted in a sliding regime (av-erage 55.44%). We can affirm that the difference does not reflect the application of a concerted learning investment strategy but only that option is considered, by the stu-dents, as another opportunity to achieve success. It should be noted that in 2015, the cre-ation of an optional curricular plan (OCP) produced a change. The OCP aimed at stu-dents with poor knowledge in mathematics. The course director of each engineering de-gree should prepare that plan, with the distribution of CUs for two years. The selecting students to join the OCP would be done through the application of the diagnostic test, based on the following three assumptions: • Complementary course related to essential knowledge in mathematics (CU
pre-calculus frequency). • Attendance of CU-DIC in sliding regime. • Integration in OCP, taking into account compulsory frequency in pre-calculus unit.
This proposal would allow a reinforcement of the basic and elementary knowledge essential to the integration in the CU-DIC, which are fundamental in the teaching of en-gineering.
5.2. Private Sector—Biomedical and Informatics In the analysis of the assessment guidelines of CU-DIC, we can infer from the EBiom
results that the attendance rate at the examinations is high (except the year 2014/2015 which registers a lower rate even though higher than that found in other undergraduate degrees). As for the pass rate, the AD is the students’ preferred modality; although in 2016/2017 there was a reversal of the situation (Figure 8). The AD pass rates are between 83.33% and 100%, while Ex varies between 25% and 66.67%. Total pass rates are between 71.79% and 88.24%, with an average of 78.82%.
Figure 7. Pass rates distribution (2nd semester).
From the collected data, it can be evidenced that EM is the degree that has the highestpass rates, with an average of 66.32%, followed by EE with 52.26%, and IE with 50.07%.For EEM, the frequency rate is between 10.5% and 17.5%, so we can conclude that the passrates are not very significant.
It is also verified that, the overall average of the pass rate in the 2nd semester of theyear is 57.36%, with a standard deviation of 17.39% and an average deviation of 12.96%.
The pass rates in the second semester (average 57.36%) were compared with thevalues registered in the 1st semester in the CU that is conducted in a sliding regime(average 55.44%). We can affirm that the difference does not reflect the application of aconcerted learning investment strategy but only that option is considered, by the students,as another opportunity to achieve success. It should be noted that in 2015, the creation ofan optional curricular plan (OCP) produced a change. The OCP aimed at students withpoor knowledge in mathematics. The course director of each engineering degree shouldprepare that plan, with the distribution of CUs for two years. The selecting students to
Mathematics 2021, 9, 61 13 of 18
join the OCP would be done through the application of the diagnostic test, based on thefollowing three assumptions:
• Complementary course related to essential knowledge in mathematics (CU pre-calculus frequency).
• Attendance of CU-DIC in sliding regime.• Integration in OCP, taking into account compulsory frequency in pre-calculus unit.
This proposal would allow a reinforcement of the basic and elementary knowl-edge essential to the integration in the CU-DIC, which are fundamental in the teachingof engineering.
5.2. Private Sector—Biomedical and Informatics
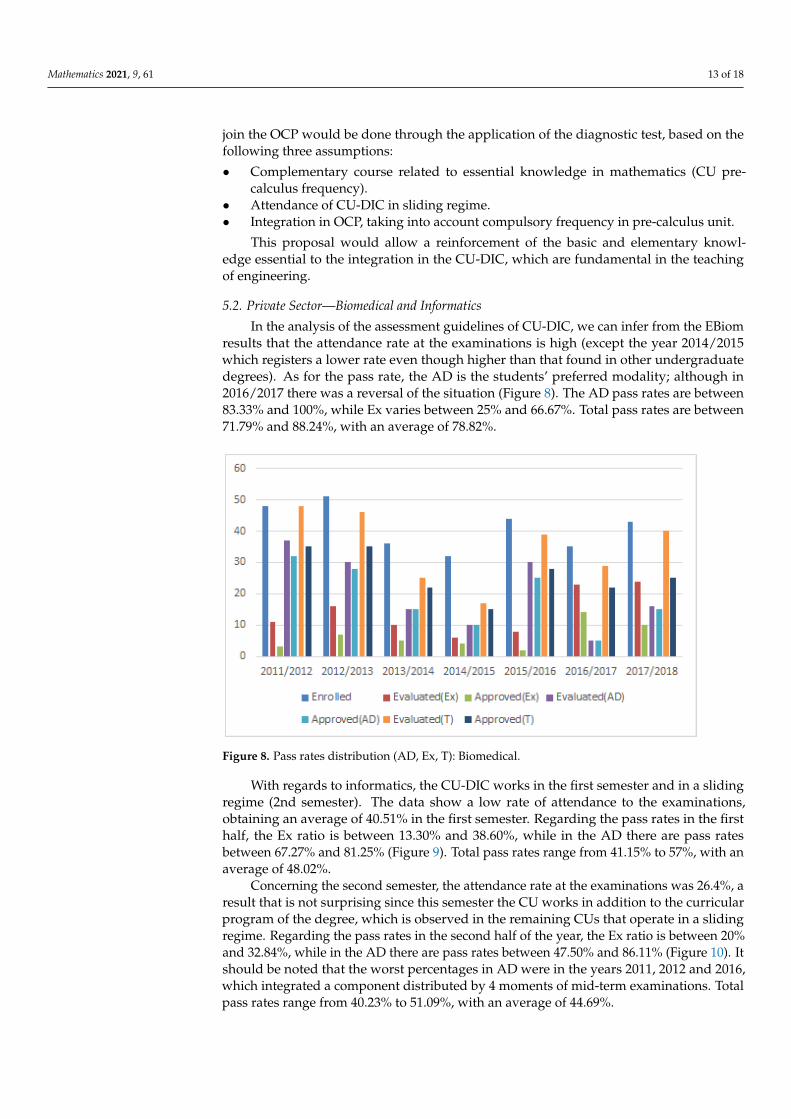
In the analysis of the assessment guidelines of CU-DIC, we can infer from the EBiomresults that the attendance rate at the examinations is high (except the year 2014/2015which registers a lower rate even though higher than that found in other undergraduatedegrees). As for the pass rate, the AD is the students’ preferred modality; although in2016/2017 there was a reversal of the situation (Figure 8). The AD pass rates are between83.33% and 100%, while Ex varies between 25% and 66.67%. Total pass rates are between71.79% and 88.24%, with an average of 78.82%.
Mathematics 2021, 9, x FOR PEER REVIEW 14 of 19
Figure 8. Pass rates distribution (AD, Ex, T): Biomedical.
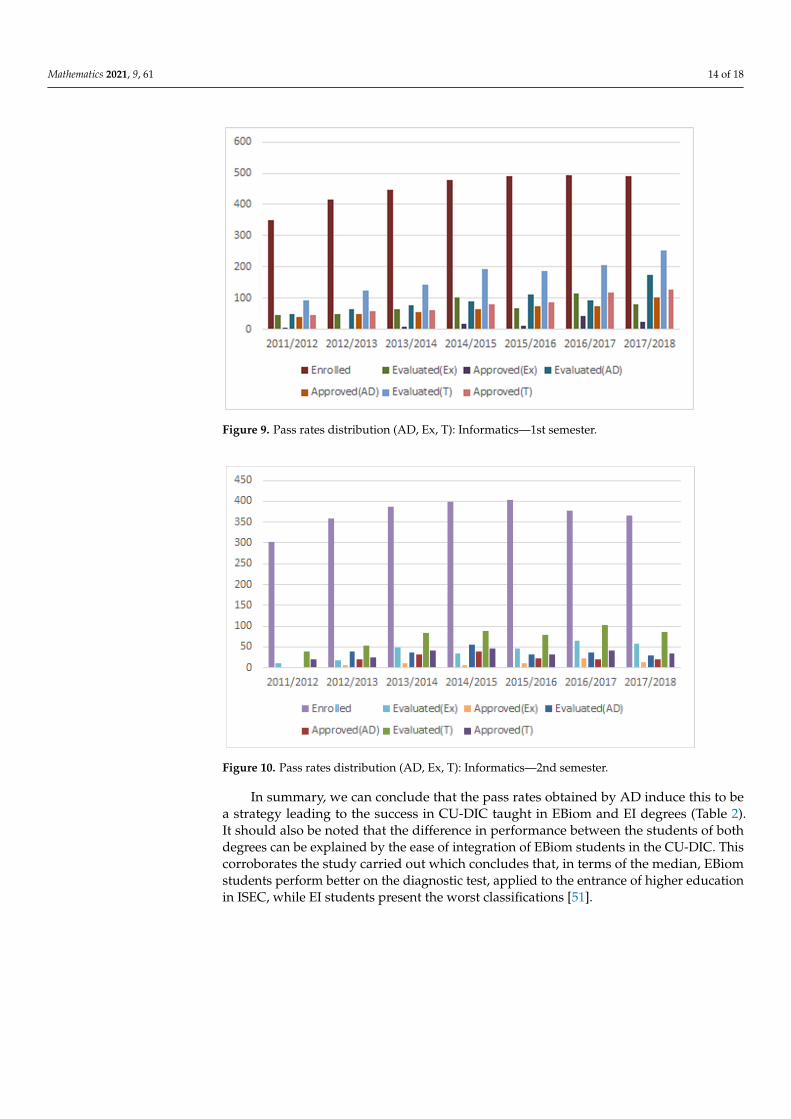
With regards to informatics, the CU-DIC works in the first semester and in a sliding regime (2nd semester). The data show a low rate of attendance to the examinations, ob-taining an average of 40.51% in the first semester. Regarding the pass rates in the first half, the Ex ratio is between 13.30% and 38.60%, while in the AD there are pass rates between 67.27% and 81.25% (Figure 9). Total pass rates range from 41.15% to 57%, with an average of 48.02%.
Figure 9. Pass rates distribution (AD, Ex, T): Informatics—1st semester.
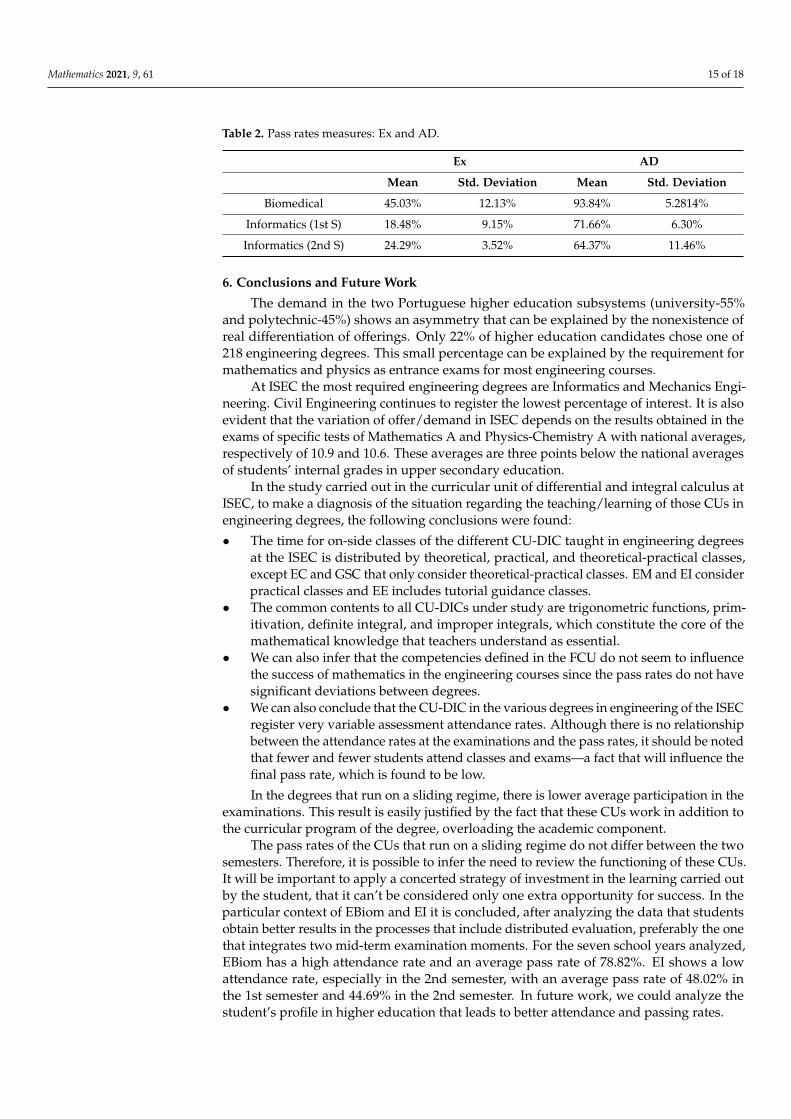
Concerning the second semester, the attendance rate at the examinations was 26.4%, a result that is not surprising since this semester the CU works in addition to the curric-ular program of the degree, which is observed in the remaining CUs that operate in a sliding regime. Regarding the pass rates in the second half of the year, the Ex ratio is between 20% and 32.84%, while in the AD there are pass rates between 47.50% and 86.11% (Figure 10). It should be noted that the worst percentages in AD were in the years 2011, 2012 and 2016, which integrated a component distributed by 4 moments of mid-term examinations. Total pass rates range from 40.23% to 51.09%, with an average of 44.69%.
Figure 8. Pass rates distribution (AD, Ex, T): Biomedical.
With regards to informatics, the CU-DIC works in the first semester and in a slidingregime (2nd semester). The data show a low rate of attendance to the examinations,obtaining an average of 40.51% in the first semester. Regarding the pass rates in the firsthalf, the Ex ratio is between 13.30% and 38.60%, while in the AD there are pass ratesbetween 67.27% and 81.25% (Figure 9). Total pass rates range from 41.15% to 57%, with anaverage of 48.02%.
Concerning the second semester, the attendance rate at the examinations was 26.4%, aresult that is not surprising since this semester the CU works in addition to the curricularprogram of the degree, which is observed in the remaining CUs that operate in a slidingregime. Regarding the pass rates in the second half of the year, the Ex ratio is between 20%and 32.84%, while in the AD there are pass rates between 47.50% and 86.11% (Figure 10). Itshould be noted that the worst percentages in AD were in the years 2011, 2012 and 2016,which integrated a component distributed by 4 moments of mid-term examinations. Totalpass rates range from 40.23% to 51.09%, with an average of 44.69%.
Mathematics 2021, 9, 61 14 of 18
Mathematics 2021, 9, x FOR PEER REVIEW 14 of 19
Figure 8. Pass rates distribution (AD, Ex, T): Biomedical.
With regards to informatics, the CU-DIC works in the first semester and in a sliding regime (2nd semester). The data show a low rate of attendance to the examinations, ob-taining an average of 40.51% in the first semester. Regarding the pass rates in the first half, the Ex ratio is between 13.30% and 38.60%, while in the AD there are pass rates between 67.27% and 81.25% (Figure 9). Total pass rates range from 41.15% to 57%, with an average of 48.02%.
Figure 9. Pass rates distribution (AD, Ex, T): Informatics—1st semester.
Concerning the second semester, the attendance rate at the examinations was 26.4%, a result that is not surprising since this semester the CU works in addition to the curric-ular program of the degree, which is observed in the remaining CUs that operate in a sliding regime. Regarding the pass rates in the second half of the year, the Ex ratio is between 20% and 32.84%, while in the AD there are pass rates between 47.50% and 86.11% (Figure 10). It should be noted that the worst percentages in AD were in the years 2011, 2012 and 2016, which integrated a component distributed by 4 moments of mid-term examinations. Total pass rates range from 40.23% to 51.09%, with an average of 44.69%.
Figure 9. Pass rates distribution (AD, Ex, T): Informatics—1st semester.Mathematics 2021, 9, x FOR PEER REVIEW 15 of 19
Figure 10. Pass rates distribution (AD, Ex, T): Informatics—2nd semester.
In summary, we can conclude that the pass rates obtained by AD induce this to be a strategy leading to the success in CU-DIC taught in EBiom and EI degrees (Table 2). It should also be noted that the difference in performance between the students of both degrees can be explained by the ease of integration of EBiom students in the CU-DIC. This corroborates the study carried out which concludes that, in terms of the median, EBiom students perform better on the diagnostic test, applied to the entrance of higher education in ISEC, while EI students present the worst classifications [51].
Table 2. Pass rates measures: Ex and AD.
Ex AD Mean Std. Deviation Mean Std. Deviation
Biomedical 45.03% 12.13% 93.84% 5.2814%
Informatics (1stS) 18.48% 9.15% 71.66% 6.30%
Informatics (2ndS) 24.29% 3.52% 64.37% 11.46%
6. Conclusions and Future Work The demand in the two Portuguese higher education subsystems (university-55%
and polytechnic-45%) shows an asymmetry that can be explained by the nonexistence of real differentiation of offerings. Only 22% of higher education candidates chose one of 218 engineering degrees. This small percentage can be explained by the requirement for mathematics and physics as entrance exams for most engineering courses.
At ISEC the most required engineering degrees are Informatics and Mechanics En-gineering. Civil Engineering continues to register the lowest percentage of interest. It is also evident that the variation of offer/demand in ISEC depends on the results obtained in the exams of specific tests of Mathematics A and Physics-Chemistry A with national averages, respectively of 10.9 and 10.6. These averages are three points below the national averages of students’ internal grades in upper secondary education.
In the study carried out in the curricular unit of differential and integral calculus at ISEC, to make a diagnosis of the situation regarding the teaching/learning of those CUs in engineering degrees, the following conclusions were found: • The time for on-side classes of the different CU-DIC taught in engineering degrees at
the ISEC is distributed by theoretical, practical, and theoretical-practical classes, ex-
Figure 10. Pass rates distribution (AD, Ex, T): Informatics—2nd semester.
In summary, we can conclude that the pass rates obtained by AD induce this to bea strategy leading to the success in CU-DIC taught in EBiom and EI degrees (Table 2).It should also be noted that the difference in performance between the students of bothdegrees can be explained by the ease of integration of EBiom students in the CU-DIC. Thiscorroborates the study carried out which concludes that, in terms of the median, EBiomstudents perform better on the diagnostic test, applied to the entrance of higher educationin ISEC, while EI students present the worst classifications [51].
Mathematics 2021, 9, 61 15 of 18
Table 2. Pass rates measures: Ex and AD.
Ex AD
Mean Std. Deviation Mean Std. Deviation
Biomedical 45.03% 12.13% 93.84% 5.2814%
Informatics (1st S) 18.48% 9.15% 71.66% 6.30%
Informatics (2nd S) 24.29% 3.52% 64.37% 11.46%
6. Conclusions and Future Work
The demand in the two Portuguese higher education subsystems (university-55%and polytechnic-45%) shows an asymmetry that can be explained by the nonexistence ofreal differentiation of offerings. Only 22% of higher education candidates chose one of218 engineering degrees. This small percentage can be explained by the requirement formathematics and physics as entrance exams for most engineering courses.
At ISEC the most required engineering degrees are Informatics and Mechanics Engi-neering. Civil Engineering continues to register the lowest percentage of interest. It is alsoevident that the variation of offer/demand in ISEC depends on the results obtained in theexams of specific tests of Mathematics A and Physics-Chemistry A with national averages,respectively of 10.9 and 10.6. These averages are three points below the national averagesof students’ internal grades in upper secondary education.
In the study carried out in the curricular unit of differential and integral calculus atISEC, to make a diagnosis of the situation regarding the teaching/learning of those CUs inengineering degrees, the following conclusions were found:
• The time for on-side classes of the different CU-DIC taught in engineering degreesat the ISEC is distributed by theoretical, practical, and theoretical-practical classes,except EC and GSC that only consider theoretical-practical classes. EM and EI considerpractical classes and EE includes tutorial guidance classes.
• The common contents to all CU-DICs under study are trigonometric functions, prim-itivation, definite integral, and improper integrals, which constitute the core of themathematical knowledge that teachers understand as essential.
• We can also infer that the competencies defined in the FCU do not seem to influencethe success of mathematics in the engineering courses since the pass rates do not havesignificant deviations between degrees.
• We can also conclude that the CU-DIC in the various degrees in engineering of the ISECregister very variable assessment attendance rates. Although there is no relationshipbetween the attendance rates at the examinations and the pass rates, it should be notedthat fewer and fewer students attend classes and exams—a fact that will influence thefinal pass rate, which is found to be low.
In the degrees that run on a sliding regime, there is lower average participation in theexaminations. This result is easily justified by the fact that these CUs work in addition tothe curricular program of the degree, overloading the academic component.
The pass rates of the CUs that run on a sliding regime do not differ between the twosemesters. Therefore, it is possible to infer the need to review the functioning of these CUs.It will be important to apply a concerted strategy of investment in the learning carried outby the student, that it can’t be considered only one extra opportunity for success. In theparticular context of EBiom and EI it is concluded, after analyzing the data that studentsobtain better results in the processes that include distributed evaluation, preferably the onethat integrates two mid-term examination moments. For the seven school years analyzed,EBiom has a high attendance rate and an average pass rate of 78.82%. EI shows a lowattendance rate, especially in the 2nd semester, with an average pass rate of 48.02% inthe 1st semester and 44.69% in the 2nd semester. In future work, we could analyze thestudent’s profile in higher education that leads to better attendance and passing rates.
Mathematics 2021, 9, 61 16 of 18
As already mentioned, the teaching of CU-DIC has been evidenced in many studies,namely about difficulties demonstrated by students in basic and elementary contents,essential to their full integration in that subject. This inevitably leads to an adaptation ofthe curricular organization and the definition of actions that allow modifying the situation.Since 2015, ISEC has been implementing a mathematics support center that aims to helpstudents overcome gaps in essential math concepts. Another solution may be the introduc-tion of teaching strategies that allow students to adapt their learning styles to the desiredlearning outcomes.
The low participation of the students in the curricular assessment process togetherwith the pass rate obtained in the distributed evaluation can lead us to enunciate a set ofquestions that are related to:
1. Student’s profile attending and participating in different examination models pro-posed by teachers.
2. Relationship between the attendance rates (at the classes and examinations) andeconomic, social, cultural, technology development conditions.
3. Teaching/learning strategies to be applied, aimed at reaching students who do notcarry out the examination and understand the consequent reasons that led themto dropout.
4. The set of basic and elementary level knowledge that students need to master uponentering higher education.
5. Mistakes made in basic and elementary knowledge that allow the definition of astructured intervention in overcoming gaps.
6. Environments that lead to meaningful learning and involve all actors (teachers andstudents) in the educational process.
The answer to these and other questions that may be related shall form the basis forfuture work.
Author Contributions: Investigation, M.E.B.d.A., A.Q.-D. and M.J.C.; Methodology, M.E.B.d.A.,A.Q.-D. and M.J.C.; Supervision, A.Q.-D.; Writing—original draft, M.E.B.d.A.; Writing—review& editing, A.Q.-D. and M.J.C. All authors have read and agreed to the published version ofthe manuscript.
Funding: This research was supported by the project “New Rules for Assessing MathematicalCompetencies (RULES-MATH)” and the Coimbra Engineering Institute, ISEC.
Institutional Review Board Statement: Not applicable.
Informed Consent Statement: Not applicable.
Data Availability Statement: Data sharing not applicable.
Acknowledgments: This research was partially supported by the project “New Rules for AssessingMathematical Competencies (RULES-MATH)” (2017-1-ESO1-KA203-038491), financed by Erasmus+program, “Análisis de tareas matemáticas planteadas por estudiantes para maestro a partir deprocesos reflexivos.” (SA050G19) financed by Ministry of Education of the Junta de Castilla y Léon,Spain. Any opinions, findings, conclusions, or recommendations expressed in the material are thoseof the authors and do not necessarily reflect those of funding agencies. This research work is madewithin University of Salamanca PhD Programme on Education in the Knowledge Society scope.
Conflicts of Interest: The authors declare no conflict of interest.
References1. Barbosa, M.A. O Insucesso no Ensino e Aprendizagem na Disciplina de Cálculo Diferencial e Integral. Master’s Thesis, Pontifícia
Universidade Católica do Paraná, Curitiba, Brazil, 2004.2. Rezende, W.M. O Ensino de Cálculo: Dificuldades de Natureza Epistemológica. Ph.D. Thesis, Faculdade de Educação, Universi-
dade de São Paulo, USP, Sao Paulo, Brazil, 2003.3. Rosa, O.S. Aspectos Motivacionais do Cálculo Diferencial e Integral. Post-Graduate Program. Master’s Thesis, Universidade de
Severino Sombra, Vassouras, Brazil, 2011.4. Tall, D. Advanced Mathematical Thinking; Kluwer Academic Publishers: Dordrecht, The Netherlands, 1991.
Mathematics 2021, 9, 61 17 of 18
5. Tall, D. The Transition to Advanced Mathematical Thinking: Functions, Limits, Infinity and Proof. In Handbook of Research onMathematics Teaching and Learning; Grouws, D.A., Ed.; Macmillan: New York, NY, USA, 1992; pp. 495–511.
6. Arts, J.A.R.; Gijselaers, W.H.; Segers, M.S.R. Enhancing Problem-Solving Expertise by Means of an Authentic, Collaborative,Computer Supported and Problem-Based Course. Eur. J. Psychol. Educ. 2006, 21, 71–90. [CrossRef]
7. Baldino, R.R.; Cabral, T.C.B. Revivendo o Cálculo Infinitesimal com uso de Tecnologia do Ponto de Vista da Educação Matemática;Departamento de Matemática, IGCE, UNESP: Rio Claro, Brazil, 2000.
8. Berman, A.; Verner, I.M.; Aroshas, S. The Teaching Calculus with Applications Experiment Succeeded-Why and What Else? InProceedings of the Fifth Congress of the European Society for Research in Mathematics Education, CERME 5, Larnaca, Cyprus, 22–26February 2007; Pitta-Pantazi, D., Philippou, G., Eds.; University of Cyprus and ERME: Lanarca, Cyprus, 2007; pp. 2060–2069.
9. Domenico, L.C.A. Aprendizagem de Cálculo Diferencial e Integral por Meio de Tecnologias de Informação e Comunicação.Master’s Thesis, Pontifícia Universidade Católica do Paraná, Curitiba, Brazil, 2006.
10. Hallett, D.H. What Have We Learned from Calculus Reform? The Road to Conceptual Understanding. MAA Notes 2006, 69, 43.11. Skouras, A.S. Coordinating Formal and Informal Aspect of Mathematics in a Computer Based Learning Environment. Int. J.
Math. Educ. Sci. Technol. 2006, 37, 947–964. [CrossRef]12. Gomes, G.; Frant, J.; Powell, A. O Pensamento Matemático Dos Estudantes de Engenharia: Um Estudo de Caso do Projeto de
Final de Curso. In Proceedings of the XIII CIAEM-IACME, Recife, Brazil, 26–30 June 2011.13. Silius, K.; Pohjolainen, S.; Kangas, J.; Joutsenlahti, J. What Can Be Done to Bridge the Competency Gap between Upper-Secondary
School and University Mathematics? In Proceedings of the 2011 IEEE Global Engineering Education Conference (EDUCON),Amman, Jordan, 4–6 April 2011; pp. 428–436.
14. Martín-Vaquero, J.; Cáceres, M.J.; Rodríguez, G.; Queiruga-Dios, A.; Yilmaz, F. Basic Mathematics Assessment in EngineeringDegrees: Case Study. In Proceedings of the 2018 IEEE Global Engineering Education Conference (EDUCON), Canary Islands,Spain, 18–20 April 2018; pp. 1639–1644.
15. Koch, D.; Herrin, G.D. Intervention Strategy for Improving Success Rates in Calculus. In Proceedings of the 2006 ASEE AnnualConference and Exposition, Chicago, IL, USA, 18 June 2006; Volume 775.
16. Gill, O.; O’Donoghue, J. Justifying the Existence of Mathematics Learning Supports Measuring the Effectiveness of a MathematicsLearning Centre. In Proceedings of the ALM, Rotterdam, The Netherlands, 2–5 July 2017.
17. Gill, O.; O’Donoghue, J. The Mathematical Deficiencies of Students Entering Third Level: An Item by Item Analysis of StudentDiagnostic Tests. In Proceedings of the Second National Conference on Research in Mathematics Education (MEI2), St. Patrick’sCollege, Dublin, Ireland, 14–15 September 2007; pp. 228–239.
18. O’Sullivan, C.; Bhaird, C.; Fitzmaurice, O.; Fhloinn, E. An Irish Mathematics Learning Support Network (IMLSN) Report on StudentEvaluation of Mathematics Learning Support: Insights from a Large Scale Multi-Institutional Survey; National Centre for Excellence inMathematics and Science Teaching and Learning (NCEMSTL): Limerick, Ireland, 2014.
19. Hieb, J.; Lyle, K.; Ralston, P.; Chariker, J. Predicting Performance in a First Engineering Calculus Course: Implications forInterventions. Int. J. Math. Educ. Sci. Technol. 2015, 46, 40–55. [CrossRef]
20. Nite, S.B.; Capraro, R.M.; Capraro, M.M.; Allen, G.D.; Pilant, M.; Morgan, J. A Bridge to Engineering: A Personalized Precalculus(Bridge) Program. In Proceedings of the 2015 IEEE Frontiers in Education Conference (FIE), El Paso, TX, USA, 21–24 October2015; pp. 1–6.
21. Fidalgo, C.; Bigotte, E.; Rasteiro, D. Understanding the Difficulties in Mathematics of Engineering Students in the Transitionfrom Second to Third Level Education. In Proceedings of the 4th ATEE Winter Conference, Lisbon, Portugal, 2–4 April 2012;pp. 477–487.
22. Bigotte, E.; Gomes, A.; Branco, J.R.; Pessoa, T. The Influence of Educational Learning Paths in Academic Success of Mathematicsin Engineering Undergraduate. In Proceedings of the 2016 IEEE Frontiers in Education Conference (FIE), Eire, PA, USA, 12–15October 2016; pp. 1–6.
23. Carr, M.; Fidalgo, C.; Bigotte, E.; Branco, J.R.; Santos, V.; Murphy, E.; Ni Fhloinn, E. Mathematics Diagnostic Test in Engineering:An International Comparison between Ireland and Portugal. Eur. J. Eng. Educ. 2015, 40, 546–556. [CrossRef]
24. Borasi, R. Exploring Mathematics Through the Analysis of Errors. Learn. Math. 1987, 7, 2–8.25. Cury, H. Análise de Erros em Disciplinas Matemáticas de Cursos Superiores. In Proceedings of the III Seminário Internacional de
Pesquisa em Educação Matemática, Águas de Lindóia, São Paulo, Brazil, 10–14 October 2006.26. Bigotte, E.; Fidalgo, C.; Rasteiro, D. The Teaching of Mathematics in Engineering: The ACAM-Assessment of Competen-
cies/Improvement Actions Project. In Proceedings of the 16th Seminar Mathematical Education of Engineers SEFI, Salamanca,Spain, 28–30 June 2012.
27. Abdulwahed, M.; Jaworski, B.; Crawford, A. Innovative Approaches to Teaching Mathematics in Higher Education: A Reviewand Critique. Nordic Stud. Math Educ. 2012, 17, 49–68.
28. Ni Fhloinn, E.; Carr, M. Formative Assessment in Mathematics for Engineering Students. Eur. J. Eng. Educ. 2017, 42, 458–470.[CrossRef]
29. Kaput, J. The Representational Roles of Technology in Connecting Mathematics with Authentic Experience. In Didactics ofMathematics as a Scientific Discipline; Biehler, R., Scholz, R.W., Sträßer, R., Winkelmann, B., Eds.; Kluwer Academic Publishers:Dordrecht, The Netherlands, 1994; pp. 379–397.
30. Teodoro, V.D. Modellus: Learning Physics with Mathematical Modelling; Universidade Nova de Lisboa: Lisbon, Portugal, 2002.
Mathematics 2021, 9, 61 18 of 18
31. Blackwell, L.S.; Trzesniewski, K.H.; Dweck, C.S. Implicit Theories of Intelligence Predict Achievement across an AdolescentTransition: A Longitudinal Study and an Intervention. Child Dev. 2007, 78, 246–263. [CrossRef] [PubMed]
32. Martins, S.I.C.G. An Approach to Teach Calculus/Mathematical Analysis (for Engineering Students) Using Computers andActive Learning—Its Conception, Development of Materials and Evaluation. Ph.D. Thesis, Faculdade de Ciências e Tecnologia daUniversidade Nova de Lisboa, Lisbon, Portugal, 2013.
33. Tall, D.; Smith, D.; Piez, C. Technology and Calculus. In Research on Technology and the Teaching and Learning of Mathematics;Volume I: Research Syntheses; Heid, M.K., Blume, G.M., Eds.; IAP: Charlotte, NC, USA, 2008; pp. 207–258.
34. Rasteiro, D.; Bigotte, E.; Fidalgo, C. Contributions of B-Learning in the Teaching of Mathematics in Engineering: An EffectiveShared Responsibility of Students. In Proceedings of the Atas do II Congresso Internacional TIC e Educação (TICEduca2012),Lisbon, Portugal, 24 April 2012; pp. 3164–3183.
35. Sevimli, E. Do Calculus Students Demand Technology Integration Into Learning Environment? Case of Instructional Differences.Int. J. Educ. Technol. High. Educ. 2016, 13, 37. [CrossRef]
36. Firmino, G.L.; Siqueira, A.M.O. A Matemática No Ensino de Engenharia. J. Eng. Exact Sci. 2017, 3, 331–334. [CrossRef]37. Mendezabal, M.; Tindowen, D. Improving Students’ Attitude, Conceptual Understanding and Procedural Skills in Differential
Calculus Through Microsoft Mathematics. J. Technol. Sci. Educ. 2018, 8, 385–397. [CrossRef]38. Almendra, M. Competency-Based Learning for Motivation and Academic Performance in a Pre-calculus Course. Am. J. Educ. Res.
2019, 7, 58–63.39. Kinnari-Korpela, H. Enhancing Learning in Engineering Mathematics Education Utilising Educational Technology and Promoting
Active Learning. Ph.D. Thesis, Tampere University, Tampere, Finland, 2019.40. Davis, M.; Hunter, G.; Thalaal, L.; Tran Ba, V.; Wooding-Olajorin, A. Developing “Smart” Tutorial Tools to Assist Students Learn
Calculus, Taking Account of Their Changing Preferred Approaches to Learning. In Intelligent Environments 2019. WorkshopProceedings of the 15th International Conference on Intelligent Environments, Rabat, Morocco, 24–27 June 2019; IOS Press: Amsterdam,The Netherlands, 2019; Volume 26, p. 227.
41. Alpers, B.A.; Demlova, M.; Fant, C.H.; Gustafsson, T.; Lawson, D.; Mustoe, L.; Olsson-Lehtonen, B.; Robinson, C.; Velichova,D. A Framework for Mathematics Curricula in Engineering Education: A Report of the Mathematics Working Group; LoughboroughUniversity: Loughborough, UK, 2013.
42. Cardella, M. Which Mathematics Should We Teach Engineering Students? An Empirically Grounded Case for a Broad Notion ofMathematical Thinking. Teach. Math. Its Appl. Int. J. IMA 2008, 27, 150–159. [CrossRef]
43. Schoenfeld, A.H. Learning to Think Mathematically: Problem Solving, Metacognition, and Sense-Making in Mathematics. InHandbook of Research on Mathematics Teaching and Learning; Grouws, D.A., Ed.; Macmillan: New York, NY, USA, 1992; pp. 334–370.
44. Schoenfeld, A.H. Reflections on Doing and Teaching Mathematics. In Mathematical Thinking and Problem Solving; LEA: HillsdaleNJ, USA, 1994; pp. 53–75.
45. Asiala, M.; Brown, A.; DeVries, D.J.; Dubinsky, E.; Mathews, D.; Thomas, K. A Framework for Research and CurriculumDevelopment in Undergraduate Mathematics Education. Res. Coll. Math. Educ. 1996, 2, 1–32.
46. Barker, W.; Bressoud, D.; Epp, S.; Ganter, S.; Haver, B.; Pollatsek, H. Undergraduate Programs and Courses in Mathematical Sciences.CUPM Curriculum Guide 2004; The Mathematical Association of America: Washington, DC, USA, 2004.
47. Schleicher, A.; Zimmer, K.; Evans, J.; Clements, N. PISA 2009 Assessment Framework: Key Competencies in Reading, Mathematics andScience; OECD Publishing (NJ1): Paris, France, 2010.
48. Niss, M. Mathematical Competencies and the Learning of Mathematics: The Danish KOM Project. In Proceedings of the 3rdMediterranean Conference on Mathematics Education, Athens, Greece, 3–5 January 2003; Gagatsis, A., Papastravidis, S., Eds.; HellenicMathematical Society and Cyprus Mathematical Society: Athens, Greece, 2003; pp. 115–124.
49. Rasmussen, C.; Ellis, J.; Zazkis, D. Features of Successful Calculus Programs at Five Doctoral Degree Granting Institutions. InProceedings of the Joint Meeting of PME 38 and PME-NA 36, Vancouver, BC, Canada, 15–20 July 2014; Nicol, C., Oesterle, S., Liljedahl,P., Allan, D., Eds.; PME: Vancouver, BC, Canada, 2014; Volume 5, pp. 33–40.
50. Bigotte, E.; Branco, J.R. A Program to Promote Mathematical Knowledge for Students’ Integration in Engineering Degrees:CeAMatE. In Proceedings of the CISPEE 2018—International Conference of the Portuguese Society for Engineering Education,Aveiro, Portugal, 27–29 June 2018; pp. 1–6.
51. Bigotte, E.; Correia, A.; Fidalgo, C.; Caridade, C.R.M.; Rasteiro, D.M.L.D.; Amorim, M.C.; Baeta, N.M.S.; Rosa, P.; Silva, P.M.;Silva, P.; et al. Projeto “ACAM-Avaliação de Competências/Ações de Melhoria”. In Proceedings of the Actas XIX Colóquioda Secção Portuguesa da AFIRSE: Revisitar os Estudos Curriculares. Onde Estamos e Para Onde Vamos? EDUCA/SecçãoPortuguesa da AFIRSE, Lisbon, Portugal, 2–4 February 2012; pp. 1546–1559.