Embed Size (px)
Citation preview

Development’s Tortoise and Hare: Pubertal Timing, PubertalTempo, and Depressive Symptoms in Boys and Girls
Jane Mendle,Department of Psychology, University of Oregon
K. Paige Harden,Department of Psychology, University of Texas at Austin
Jeanne Brooks-Gunn, andDepartment of Pediatrics, Teachers College, Columbia University
Julia A. GraberDepartment of Psychology, University of Florida
AbstractAlthough the sequence of pubertal maturation remains consistent across most individuals, thetiming and tempo of development fluctuate widely. While past research has largely focused on thesequelae of pubertal timing, a faster tempo of maturation might also present special challenges tochildren for acclimating to new biological and social milestones. Using latent growth curvemodeling, the present study investigated how pubertal tempo and pubertal timing predicteddepressive symptoms over a 4-year period in a sample of children recruited from New York Cityarea public schools. Rate of intraindividual change in parent-reported Tanner stages was used asan index of pubertal tempo, and more advanced Tanner development at an earlier chronologicalage was used as an index of pubertal timing. For girls (N = 138, M = 8.86 years old at Time 1),pubertal timing emerged as the most salient factor, and the tempo at which girls progressedthrough puberty was not significant. In boys (N = 128, M = 9.61 years old at Time 1), both timingand tempo of development were significant; notably, however, the effects of pubertal tempo werestronger than those of timing. These findings highlight the need to consider multiple sources ofindividual variability in pubertal development and suggest different pubertal challenges for boysand girls.
Keywordspuberty; gender differences; depression; pubertal timing; pubertal tempo
The hare darted out of sight almost at once. … The tortoise plodded on and ploddedon.—Aesop, The Hare and the Tortoise
Nearly a half-century ago, Marshall and Tanner categorized secondary sexual changesoccurring at puberty—specifically breast development in girls, genital development in boys,and pubic hair development in both genders—into five stages of development (Marshall &Tanner, 1969, 1970; Tanner, 1962). Stage 1 indexed no visible signs of maturation, andStage 5 indexed a full level of maturation, consistent with adult physical stature. Marshall
© 2010 American Psychological AssociationCorrespondence concerning this article should be addressed to Jane Mendle, Department of Psychology, 12227 University of Oregon,Eugene, OR 97403-1227., [email protected].
NIH Public AccessAuthor ManuscriptDev Psychol. Author manuscript; available in PMC 2011 June 14.
Published in final edited form as:Dev Psychol. 2010 September ; 46(5): 1341–1353. doi:10.1037/a0020205.
NIH
-PA Author Manuscript
NIH
-PA Author Manuscript
NIH
-PA Author Manuscript

and Tanner observed considerable fluctuations in children’s progression through thesestages. In particular, they recorded two separate sources of variation: (a) pubertal timing,which they described as “variation in the chronological age at which adolescence begins anddifferent stages of physical maturity are reached” and (b) pubertal tempo, which theydescribed as “variation in the time taken to pass through the various stages of development.”(Marshall & Tanner, 1969, p. 291, and Marshall & Tanner, 1970, p. 14, respectively).
Since the publication of Marshall and Tanner’s seminal work, psychologists have beenintrigued by individual differences in the process of maturation and how these might relateto later health and emotional well-being (see Mendle, Turkheimer, & Emery, 2007, for areview). While the pubertal timing literature is expansive, less is known about thedevelopmental impact of pubertal tempo. The present article aims to contribute to a broaderknowledge of the salience of pubertal tempo in psychosocial adjustment, specificallyinvestigating depressive symptoms in early adolescence. As children differ from each otherboth in their timing and in their tempo of maturation, we contrast how pubertal timing andpubertal tempo each predict trajectories of depressive symptoms in early adolescence.
Pubertal TimingThe timing of puberty, particularly in girls, stands out as one of the most well-researchedand well-replicated antecedents of adolescent difficulties. Early pubertal timing in girls hasbeen associated with risk in multiple functional domains including psychological (i.e.,depression, anxiety, disordered eating, delinquency; Graber, Lewinsohn, Seeley, & Brooks-Gunn, 1997; Stice, Presnell, & Bearman, 2001; Wichstrom, 2000;); medical (i.e., humanpapillomavirus infection, obesity, teenage pregnancy; Fisher, Rosenfeld, & Burk, 1991;Udry, 1979; Wellens et al., 1992), and academic (i.e., truancy, academic difficulties, lack ofpursuit of higher education; Stattin & Magnusson, 1990). Of particular relevance to thecurrent study, early maturation, across a variety of measurement modalities and samples, hasbeen associated with higher levels of depressive symptoms, poor self-esteem, suicideattempts, and Diagnostic and Statistical Manual of Mental Disorders (4th ed., AmericanPsychiatric Association, 1994) criteria for major depressive disorder (Ge, Conger, & Elder,2001; Graber et al., 1997; Patton et al., 1996; Stice et al., 2001).
The predominant explanation for the association between early pubertal timing andsubsequent psychological outcomes is the maturation disparity hypothesis (reviewed in Ge& Natsuaki, 2009), which references the mismatch between physical and emotionaldevelopment. As children mature, they are faced with a startling array of new challenges.These include new parental expectations, burgeoning feelings of sexual attraction, hormone-related emotional lability, and shifting peer relationships (Brooks-Gunn & Warren, 1985;McClintock & Herdt, 1996; Paikoff & Brooks-Gunn, 1991; Steinberg, 1987). Becausephysical and emotional development do not necessarily occur in synchrony, earlier maturingchildren are forced to grapple with these new stressors with fewer resources than peers whoachieve the same developmental milestones at a later chronological age (Ge, Conger, &Elder, 1996, 2001; Petersen & Crockett, 1985; Petersen, Sarigiani, & Kennedy, 1991; Stattin& Magnusson, 1990). The maturation disparity hypothesis has been used to explain higherrates of psychopathology and problem behavior among early maturing children of bothgenders (e.g., Haynie, 2003; Weichold, Silbereisen, & Schmitt-Rodermund, 2003) and issometimes alternatively termed the stage termination hypothesis (e.g., Petersen & Taylor,1980).
Whereas in the literature pubertal timing is consistently associated with a wide gamut ofnegative outcomes in girls, the literature on pubertal timing for boys lacks the breadth andreplicable pattern of results obtained for girls (Ge et al., 2001). Findings are particularly
Mendle et al. Page 2
Dev Psychol. Author manuscript; available in PMC 2011 June 14.
NIH
-PA Author Manuscript
NIH
-PA Author Manuscript
NIH
-PA Author Manuscript

inconsistent with regard to internalizing disorders. Some studies show early maturing boysexperience elevations in negative affect, anxiety, and depression relative to later developingpeers (Ge et al., 2001; Susman, Dorn, and Chrousos, 1991), while others implicate bothearly and late development (e.g., “off-time” maturation) with high rates of internalizingproblems (Alsaker, 1992). Still, other studies show no correlation between pubertal timingand internalizing symptoms (Kaltiala-Heino, Marttunen, Rantanen, & Rimpela, 2003). Anadditional cluster of work suggests more positive social sequelae for early maturers, due tothe advantages of increased body size and mass for athletics (Jones, 1965; Jones & Bayley,1950). Late maturers are conversely believed to be prone to poor self-esteem and frequentself-derogation although Ge et al. (2001) cautioned that this is a largely “historical”perspective in need of revision.
The inconsistency in the pubertal timing literature for boys is likely due, in part, to theabsence of a “hallmark” milestone for puberty that is analogous to menarche in girls. Age atmenarche is among the more common measures for determining pubertal timing in girls.(Later, we discuss age at menarche as an indicator of pubertal timing in more detail.)Spermarche, or first ejaculation, could plausibly be considered a comparable milestone tomenarche, but there is greater Tanner stage variability when boys reach spermarche than isthe case for girls reaching menarche (Dorn, Dahl, Woodward, & Biro, 2006), and boys,moreover, often do not feel comfortable reporting spermarche (Downs & Fuller, 1991;Gaddis & Brooks-Gunn, 1985). The absence of an easily assessed, reliably reportedindicator of pubertal timing in boys further eliminates the possibility of retrospective studies,which are relatively common in investigations of timing of menarche and psychologicaloutcomes (e.g., Fairburn, Welch, Doll, Davies, & O’Connor, 1997). This contributes to lessoverall understanding of how individual differences in the timing of maturation mightpredict relevant psychosocial outcomes in boys.
Pubertal TempoWhile pubertal timing indexes a level of maturation relative to others of the same gender atthe same chronological age, pubertal tempo is defined with reference to a child’s ownprevious development. Some people mature comparatively rapidly (to use an analogy fromAesop, they are developmental hares), whereas others have a slower, more gradualprogression through puberty (e.g., developmental tortoises). Pubertal tempo is a measure ofthis rate of intraindividual change over time. In Marshall and Tanner’s investigation, themagnitude of individual variation in time taken to pass through the five stages of pubertaldevelopment was not insignificant. For breast development, the mean interval between Stage2 and Stage 5 was 4 years, but the extremes ranged between 1.51 years (5th percentile) andnearly 9 years (95th percentile). For boys, the mean interval between Stage 2 and Stage 5 forgenital development was approximately 3 years but ranged between 1.86 and 4.72 years(Marshall & Tanner, 1969, 1970). Marshall and Tanner, moreover, observed that timing andtempo appeared to be relatively independent of each other and that an earlier timing ofpubertal onset was not systematically associated with either a more rapid or more dilatorymaturational tempo.
Most of what is known about pubertal tempo comes from medical studies, whose goals aresimply to observe and report on secular trends in maturation (e.g., Biro et al., 2006;Pantsiotou et al., 2008). Collectively, these studies imply that pubertal tempo may be abetter predictor of age at menarche than timing of pubertal onset (Papadimitriou, Fretzayas,& Nicolaidau, 2006). Within psychological research, a single study has linkedintraindividual change to children’s psychosocial outcomes. Ge et al. (2003) investigatedpuberty and symptoms of major depression in African American children. In this study, theauthors measured pubertal timing and what they termed pubertal change at two time points
Mendle et al. Page 3
Dev Psychol. Author manuscript; available in PMC 2011 June 14.
NIH
-PA Author Manuscript
NIH
-PA Author Manuscript
NIH
-PA Author Manuscript
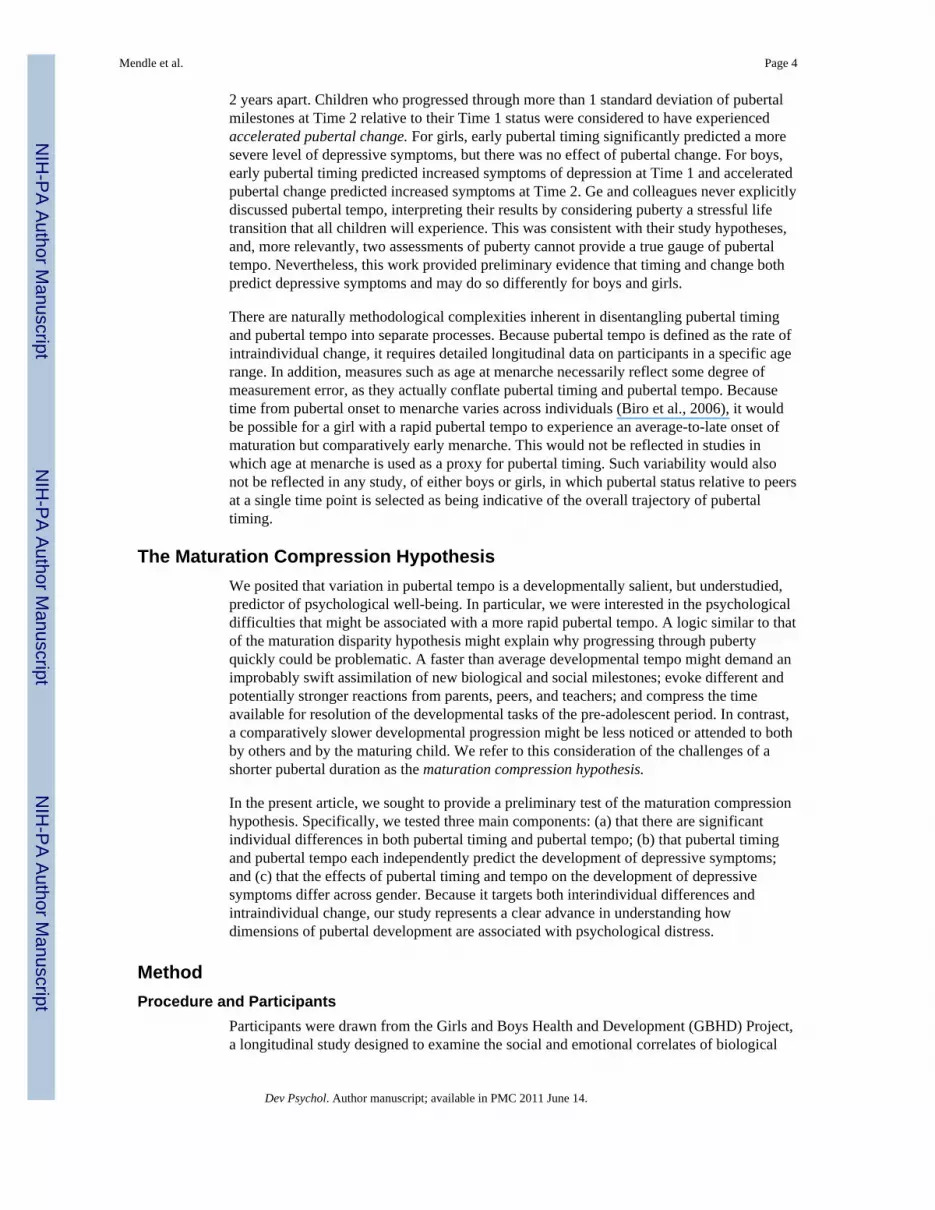
2 years apart. Children who progressed through more than 1 standard deviation of pubertalmilestones at Time 2 relative to their Time 1 status were considered to have experiencedaccelerated pubertal change. For girls, early pubertal timing significantly predicted a moresevere level of depressive symptoms, but there was no effect of pubertal change. For boys,early pubertal timing predicted increased symptoms of depression at Time 1 and acceleratedpubertal change predicted increased symptoms at Time 2. Ge and colleagues never explicitlydiscussed pubertal tempo, interpreting their results by considering puberty a stressful lifetransition that all children will experience. This was consistent with their study hypotheses,and, more relevantly, two assessments of puberty cannot provide a true gauge of pubertaltempo. Nevertheless, this work provided preliminary evidence that timing and change bothpredict depressive symptoms and may do so differently for boys and girls.
There are naturally methodological complexities inherent in disentangling pubertal timingand pubertal tempo into separate processes. Because pubertal tempo is defined as the rate ofintraindividual change, it requires detailed longitudinal data on participants in a specific agerange. In addition, measures such as age at menarche necessarily reflect some degree ofmeasurement error, as they actually conflate pubertal timing and pubertal tempo. Becausetime from pubertal onset to menarche varies across individuals (Biro et al., 2006), it wouldbe possible for a girl with a rapid pubertal tempo to experience an average-to-late onset ofmaturation but comparatively early menarche. This would not be reflected in studies inwhich age at menarche is used as a proxy for pubertal timing. Such variability would alsonot be reflected in any study, of either boys or girls, in which pubertal status relative to peersat a single time point is selected as being indicative of the overall trajectory of pubertaltiming.
The Maturation Compression HypothesisWe posited that variation in pubertal tempo is a developmentally salient, but understudied,predictor of psychological well-being. In particular, we were interested in the psychologicaldifficulties that might be associated with a more rapid pubertal tempo. A logic similar to thatof the maturation disparity hypothesis might explain why progressing through pubertyquickly could be problematic. A faster than average developmental tempo might demand animprobably swift assimilation of new biological and social milestones; evoke different andpotentially stronger reactions from parents, peers, and teachers; and compress the timeavailable for resolution of the developmental tasks of the pre-adolescent period. In contrast,a comparatively slower developmental progression might be less noticed or attended to bothby others and by the maturing child. We refer to this consideration of the challenges of ashorter pubertal duration as the maturation compression hypothesis.
In the present article, we sought to provide a preliminary test of the maturation compressionhypothesis. Specifically, we tested three main components: (a) that there are significantindividual differences in both pubertal timing and pubertal tempo; (b) that pubertal timingand pubertal tempo each independently predict the development of depressive symptoms;and (c) that the effects of pubertal timing and tempo on the development of depressivesymptoms differ across gender. Because it targets both interindividual differences andintraindividual change, our study represents a clear advance in understanding howdimensions of pubertal development are associated with psychological distress.
MethodProcedure and Participants
Participants were drawn from the Girls and Boys Health and Development (GBHD) Project,a longitudinal study designed to examine the social and emotional correlates of biological
Mendle et al. Page 4
Dev Psychol. Author manuscript; available in PMC 2011 June 14.
NIH
-PA Author Manuscript
NIH
-PA Author Manuscript
NIH
-PA Author Manuscript

development during late childhood and early puberty. The GBHD comprises a communitysample of families from the New York City metropolitan area. As the project originallytargeted girls’ development and was later expanded to include boys, girls and boysparticipated separately in two sets of data collection, each collection spanning a 4-yearperiod and including four separate waves of assessments. All assessments and procedureswere approved by the institutional review board (IRB) at Columbia University. Girls andtheir families were recruited in 1995–1996 and boys and their families were recruited in2001–2002 through public elementary schools. Schools were targeted for recruitment on thebasis of a high level of ethnic diversity and location in working- and middle-classneighborhoods in Brooklyn, Queens, and Yonkers. A series of flyers describing the studywere distributed to the children in school when girls were in third grade and boys were infourth grade. This grade difference was intentional, to account for the later onset of pubertaldevelopment in boys.
Parents (typically mothers) returned cards with their contact information if they wereinterested in learning more about the project. During a follow-up call, research assistantsextensively apprised parents of the study requirements. Parents who wanted to participatewere scheduled for a home visit in the late afternoon after school. Because flyers werepassed out in multiple waves to the children, a precise count of how many families receivedthis information could not be established. Of those who participated in a follow-up call, 85%enrolled in the study. Only parents who indicated that they (and their children) would beable to complete the project in English were enrolled. Mothers of 100% of the girls and 99%of the boys reported that English was spoken at home. As schools were selected on the basisof demographic characteristics designed to increase sample diversity, approximately 14% ofmothers reported that another language in addition to English was spoken at home; mostoften this language was Spanish.
At the start of the home visit, mothers signed informed consent forms on their own behalfand for their child’s participation. Children additionally gave assent for their participation.Two data collectors conducted each home visit. Only female data collectors conducted homevisits with girls and their mothers, while male and female data collectors conducted homevisits with boys and their mothers. For boys, the male data collector was assigned tointeractions with the child, while the other data collector interacted with the child’s mother.At least one data collector was matched to family ethnicity whenever possible.
During the home visit, mothers completed a structured interview, providing information ondemographic variables, family composition, family medical and psychological history, andchildren’s temperament, behavior, and emotional states. Both mothers and childrenadditionally completed a variety of standard, paper- and -pencil measures assessingpsychological distress, problem behavior, and social functioning. Under the guidelines of theIRB, children who reported clinically significant levels on these measures were recontactedand offered referrals for services. In addition, referrals were given to any parent interested inthis information, regardless of child or parent survey reports. Children received a gift (e.g.,T-shirt, tote bag, miniature football) for their participation, and mothers were paid $60 atbaseline and $75 in subsequent years for their family’s participation in the home visit andother study protocols.
Following the initial home visit, participants were asked to complete three subsequentassessments, including repeated use of all paper- and -pencil questionnaire items. For girls,follow-up assessments were initially planned for 6-month intervals. As protocols were timeintensive for families, this resulted in a reduced sample size at Wave 2. Subsequentassessments (Waves 3 and 4) were therefore conducted at approximately 1-year intervals.The number of girls who participated at each time point was 138 (Wave 1), 78 (Wave 2), 92
Mendle et al. Page 5
Dev Psychol. Author manuscript; available in PMC 2011 June 14.
NIH
-PA Author Manuscript
NIH
-PA Author Manuscript
NIH
-PA Author Manuscript

(Wave 3), and 116 (Wave 4). At Wave 4 assessment, 19.5% of the original sample had beenlost.
As indicated, girls were recruited from third grade classrooms and were 8.86 years old onaverage at Wave 1 (SD = 0.49), with their age ranging from 7.6 years to 10.2 years. Of the138 girls, 63 (46%) were European American, 51(37%) were African American, and 24(17%) were Hispanic/Latina. At the start of the study, 58.7% of girls lived in two-parenthouseholds. At successive assessments, 9%, 3%, and 6% of mothers (respectively) reportedchanges in their marital or significant partner status.
Boys, recruited from fourth grade classrooms, were 9.61 years old on average at Wave 1(SD = 0.70), with their age ranging from 8.1 years to 12.0 years. Of the 128 boys, 40 (31%)were European American, 55 (43%) were African American, and 33 (26%) were Hispanic/Latino. At Wave 1, 53.1% of boys lived in two-parent households. At successiveassessments, 10%, 7%, and 9% of mothers (respectively) reported changes in their marital orsignificant partner status.
For boys, follow-up assessments were conducted annually. Due to concerns aboutparticipant burnout, the home visit at Time 4 was replaced with a structured telephoneinterview, conducted separately for boys and their mothers, and with mailed questionnaires.The number of boys who participated at each time point was 128 (Wave 1), 103 (Wave 2),91 (Wave 3), and 82 (Wave 4), corresponding to a loss of 35.9% of the sample.
With regard to sample attrition, girls who participated in all assessments did notsignificantly differ in their baseline pubertal status from girls who missed one or moreassessments. Girls who participated at all time points reported significantly lower baselinelevels of depression on the Children’s Depression Inventory (CDI; Kovacs, 1985) at Time 1(M = 5.36, SD = 4.86) than girls who missed one or more assessments (M = 9.35, SD =7.71); were more likely to be European American (69.8% vs. 30.2%), and less likely to beAfrican American (29.9% vs. 45.9%). Boys who participated in all assessments did notsignificant differ from boys who missed one or more assessments with regards to baselinepubertal status or to baseline depressive symptoms. However, boys who missed one or moreassessments were significantly different with regards to race/ethnicity (15.2% EuropeanAmerican for boys who missed at least one assessment vs. 40.2% European American forboys who participated in all assessments). As will be described later in more detail, we usedfull information maximum likelihood our analytic plan to deal with missing data andresponse bias.
MeasuresDemographic data—Children reported their date of birth, and exact age was calculatedfrom the date of home visit. During each follow-up assessment, mothers reported familycharacteristics, child ethnicity, their own education and occupational status, and theeducation and occupational status of any other parent/caregiver in the household. We usedthese responses to construct a measure of family socioeconomic status (SES) based on theHollingshead Scale, with the standard scoring accounting for different household types(Hollingshead, 1975). The range of possible scores for girls’ family SES was 7.5–65.0 atWave 1 (M = 37.50, SD = 14.55). The mean Hollingshead score equated to a high schooldiploma and employment as clerical workers, sales workers, or owners of small businesses.In subsequent years, Hollingshead scores were comparable: M = 35.99 at Wave 2, M = 36.76at Wave 3, and M = 38.30 at Wave 4. For boys, the range of family SES was 9.0–66.0 atWave 1 (M = 36.50, SD = 13.88), which represents the same employment and educationlevel as reported by girls’ families. Hollingshead scores for boys’ families remained
Mendle et al. Page 6
Dev Psychol. Author manuscript; available in PMC 2011 June 14.
NIH
-PA Author Manuscript
NIH
-PA Author Manuscript
NIH
-PA Author Manuscript
comparable across waves: M = 38.24 at Wave 2, M = 36.59 at Wave 3, and M = 37.85 atWave 4.
Pubertal status—At each wave of data collection, mothers were provided with schematicdrawings representing the five Tanner stages of pubertal maturation and asked to circle thefigure that looked most like their child (Morris & Udry, 1980). Tanner Stage drawingsprovide a method for categorizing the status of physical development based on externalprimary and secondary sex characteristics, where Stage 1 represents no visible signs ofpubertal development and Stage 5 indicates a level of maturation consistent with adultstatus. In the current study, mothers of children of both genders were asked to completeTanner ratings for pubic hair development and either breast or genital development(depending on child gender). If a mother indicated that she did not have sufficientknowledge of the child’s current pubertal status, the child completed the pubertal ratingsusing the same line drawings used by the mother. For boys at Wave 1, all ratings werecompleted by the mother. There were 13 boys who reported on their own pubertal status atWave 2 (13%), 17 at Wave 3 (19.3%), and 8 at Wave 4 (17%). Boys’ own ratings of level ofpubertal development were strongly and positively correlated with their mothers’ ratings atthe previous assessment wave (polychoric r = .63 at Wave 3 and 0.59 at Wave 4). For girls,all ratings at Waves 1–3 were completed by the mother, and eight girls rated their ownpubertal status at Wave 4 (7.4%). As with the boys’ ratings, girls’ own ratings of theirpubertal status at Wave 4 were strongly and positively correlated with their mothers’ ratingsat Wave 3 (polychoric r = .79). The distribution of Tanner stages by gender at Waves 1–4 isshown in Tables 1 and 2.
For the current analyses, we used the Tanner stage assessments of pubic hair growth in girlsand genital development in boys. These were chosen in accordance with the followingconsiderations from Dorn et al. (2006): (a) averaging Tanner scores for different pubertalcharacteristics to create a single measure conflates divergent hormonal processes; (b)“testicular volume in boys is a particularly good choice for research if one is interested inknowing when pubertal processes begin” (p. 40); and (c) reports of pubic hair developmentin girls are generally more accurate than reports of breast development, due to difficultydistinguishing adipose tissue from breast tissue without palpation by a trained examiner(e.g., Bonat, Pathomvanich, Keil, Field, & Yanovski, 2002; Kaplowitz & Oberfield, 1999).
In general, maternal accuracy of Tanner ratings varies when compared with physicianexamination (Brooks-Gunn, Warren, Rosso, & Gargiulo, 1987; Dorn, Susman, Nottelmann,Inoff-Germain, & Chrousos, 1990). In our sample, 41% of girls reported that they hadreached menarche at Wave 4. Of these girls, 75.5% were rated by mothers as being atTanner Stage 4 or 5 for pubic hair development. For girls who reported they had not reachedmenarche, 25% were rated as being at Tanner Stage 4 and none at Tanner Stage 5. Althoughindividual indicators of puberty are not perfectly correlated within girls, these associationssuggest that there was convergent validity in maternal ratings by Wave 4. Moreover, thesematernal ratings are consistent with Marshall & Tanner’s (1969) findings that 77% ofparticipants achieved menarche at either Stage 4 or 5 of pubic hair development.
Pubertal timing and tempo—Pubertal timing was operationalized as a latent factorrepresenting whether level of Tanner development of a child was more or less advanced thanthat of other participants at the beginning of the study period. As can be seen in Tables 1 and2, most children were still at Tanner Stage 1 at Wave 1. Therefore, children with a moreadvanced Tanner stage at the initiation of the study were the earliest maturing children.Pubertal tempo was operationalized as a latent factor representing how quickly a childprogressed through Tanner stages over the study period. The latent factors representingpubertal timing and tempo are described in more detail in the Analyses section.
Mendle et al. Page 7
Dev Psychol. Author manuscript; available in PMC 2011 June 14.
NIH
-PA Author Manuscript
NIH
-PA Author Manuscript
NIH
-PA Author Manuscript
Depressive symptoms—Participants completed the CDI at each wave. The CDI hasbeen adapted from the Beck Depression Inventory (Beck, Ward, Mendelson, Mock, &Erbaugh, 1961) for use with children between the ages of 7 and 17 years. For each item onthe CDI, three statements reflecting depressive symptoms are provided and participantsendorse the statement that best describes their current mood. Each statement is on a 0–2scale, and the 26 items are summed with higher scores indicating greater endorsement ofdepressive symptoms. The CDI demonstrated good reliability in the current sample(Cronbach’s α = .81 at Wave 1, .86 at Wave 2, .84 at Wave 3, and .87 at Wave 4). A score of19 has typically been used to signify clinically relevant levels of depressions. Across thefour waves, girls’ depression scores ranged from 0 to 34 (M = 6.58, SD = 6.38). In boys,depression scores ranged from 0 to 39 (M = 6.40, SD = 5.65).
AnalysesAll analyses were modeled with the software program Mplus (Muthén & Muthén, 1998–2009). Full information maximum likelihood (FIML) was used to account for missing data,as this has been recommended as the preferred method for analysis of missing data (Schafer& Graham, 2002). As noted in Wothke (1998, p. 224), the FIML method “uses all theinformation of the observed data, including information about the mean and variance for themissing portion of the variable, given the observed portion of other variables.” Nestedmodels were compared with each other using the chi-square difference test. Differences inmodel chi squares are themselves distributed as chi squares, with degrees of freedom equalto the difference between the models’ degrees of freedom. In all models, we controlled forpotential racial and ethnic differences in pubertal timing, pubertal tempo, and depressivesymptoms by including two dummy-coded variables for African American race andHispanic ethnicity as statistical covariates.
Test 1: Latent Growth Models (LGM) of Pubertal Development in Boys and Girls toEstimate Pubertal Timing and Tempo
Our first step was to establish that participants in our sample exhibited significant individualdifferences in pubertal timing and pubertal tempo. We modeled timing and tempo ofpubertal development, separately for boys and girls, using latent growth models (LGM;McArdle & Nesselroade, 2002; Meredith & Tisak, 1990). Analyzing longitudinal data withLGM allows one to characterize both intraindividual change and interindividual differencesin change (McArdle & Nesselroade, 2002), in accordance with the major goals oflongitudinal research (Baltes & Nesselroade, 1979). The basic latent growth curve modelcan be written as follows (Ferrer, Hamagami, & McArdle, 2004):
(1)
where η1i is a latent factor representing the initial level (often referred to as the latentintercept) and η2i is a latent factor representing the slope of change over time. In a LGM ofpuberty, the latent intercept factor represents pubertal timing. Children with a higher latentintercept have higher pubertal status at the earliest age of observation; that is, they are earlymaturing relative to their peers. The latent slope factor represents pubertal tempo: Childrenwith a higher latent slope are predicted to increase in pubertal status more quickly over time.
In addition, λt is a vector of age-specific basis coefficients representing the shape of changeover time. Constraining the values of λt constitutes a test of specific hypotheses regardingthe shape of change. For example, if the values of λt were fixed to be zero at all time points,the implied shape would be a flat line (a “no-growth” model). A no-growth model,obviously, is a highly implausible account of puberty. Rather, we constrained the values of
Mendle et al. Page 8
Dev Psychol. Author manuscript; available in PMC 2011 June 14.
NIH
-PA Author Manuscript
NIH
-PA Author Manuscript
NIH
-PA Author Manuscript
λt to increase linearly with age (0, 1, 2, 3, and so on). At first glance, a linear model mayseem inappropriate for pubertal development: Over an entire lifespan, the mean relationbetween pubertal status and age is, of course, S-shaped, with nearly everyone at TannerStage 1 in childhood and everyone reaching a plateau at Tanner Stage 5 in adulthood. Overthe ages observed in the current study, however, the observed relation between meanpubertal status and age was indeed approximately linear, as shown in Figure 1.
Finally, et is a vector of time-specific (or age-specific) residual errors. For each individual iat each age t, a latent, continuous, normally distributed factor (yti) was assumed to underliethe observed ordinal (Tanner stage) data (Yti), such that Yt = c (representing the category ofthe ordinal data, i.e., Tanner stage), if τc < yt ≤ τc + 1.
In the current analyses, four thresholds (the number of ordinal data categories minus one)were estimated, and the thresholds were constrained to be invariant across ages. In order toestimate the threshold factors freely, we had to fix the mean of the latent intercept factor tozero.
The full LGM for the pubertal development model is illustrated in Figure 2 (race/ethnicityregressions not depicted). For all LGM, we controlled for the race/ethnicity by regressingboth the latent intercept and latent slope on two dummy-coded variables corresponding toAfrican American or Hispanic race/ethnicity, with European American children as thecontrol group. As can be seen in Figure 1, mean age trends in Tanner stages overlappedconsiderably across racial/ethnic groups, with a trend for African American children to havehigher pubertal status and European American children to have lower pubertal status at eachage in both boys and girls.
Test 2: Dual LGM of Puberty and Depressive SymptomsWe next fit dual LGMs to test the relation among pubertal timing, pubertal tempo, andsymptoms of depression in early adolescence. Again, models were fit separately for boysand girls. The full dual LGM for boys is shown in Figure 3; the model for girls wasidentical, except the age range was 8–13 years. The left side of Figure 3 depicts the LGM forpubertal development, and it is identical to the model we have described. The right side ofFigure 3 depicts the LGM for depressive symptoms. Because the observed depressivesymptoms were distributed continuously, the lowest level of the model—linking theobserved data to an underlying continuous distribution—was unnecessary for the LGM ofdepressive symptoms.
The key portions of the dual LGM analyses were the regressions from the latent growthfactors of depressive symptoms to the latent growth factors of puberty. The first regression,labeled βX1-Y1, tested whether children who had higher initial pubertal status (i.e., wereearly maturing) also showed more depressive symptoms at the start of the study. This can bethought of as an effect of pubertal timing. The second regression, labeled βX1-Y2, testedwhether children who were early maturing also showed greater changes in depressivesymptoms from ages 8 to 14. This can also be thought of as an effect of pubertal timing. Incontrast, the third and fourth regressions, labeled βX2-Y1 and βX2-Y2, tested whether childrenwho matured more rapidly than their peers demonstrated higher overall levels and greaterincreases in depressive symptoms, respectively. These effects can be thought of as effects ofpubertal tempo.
In all dual-process LGMs, we also controlled for race/ethnicity by regressing the latentintercept and latent slope factors for both pubertal development and depressive symptomsonto two dummy-coded variables representing African American and Hispanic race/
Mendle et al. Page 9
Dev Psychol. Author manuscript; available in PMC 2011 June 14.
NIH
-PA Author Manuscript
NIH
-PA Author Manuscript
NIH
-PA Author Manuscript

ethnicity. The race/ethnicity regressions are not shown in Figure 2 for the sake of illustrativeclarity.
Test 3: Multiple-Group LGM of Gender DifferencesTo test if the relations of pubertal timing and tempo with depressive symptoms differedacross boys and girls, we fit a series of multiple-group LGMs to analyze data from boys andgirls in a single model. The first and second set of models in this series tested which growthcurve parameters for pubertal development and depressive symptoms, respectively, could beconstrained to be equal for boys and girls. We then combined the most parsimonious modelsfor gender differences in pubertal development and depressive symptoms in order to test thekey parameters of interest: whether the effects of pubertal timing and tempo on depressivesymptoms differed between boys and girls. This multiple-group LGM was compared with areduced model in which the effects of pubertal timing and tempo were constrained to beequal across genders.
ResultsTest 1: Are There Individual Differences in Both Pubertal Timing and Pubertal Tempo?
Results from LGM of timing and tempo of pubertal development are shown in Table 3. Forboth boys and girls, the full LGM (Figure 2) was compared with a more restricted model inwhich the variance in the linear slope (Ψ22) was fixed to zero. In girls, the restricted modelfit significantly worse (Δχ2 = 8.41, Δdf = 2, p = .02) than the full model. In boys, therestricted model also fit significantly worse (Δχ2 = 66.72, Δdf = 2, p < .001) than the fullmodel. These results indicate that there are indeed significant individual differences in thetempo of pubertal development.
For boys, the mean slope equaled 2.12 (SD = 2.14). This can be interpreted in terms of theestimated thresholds for the categorical Tanner stage variables. For example, the thresholdfor Tanner Stage 4 was estimated to be 10.17; thus, a boy with an average pubertal tempowould achieve Tanner Stage 4 at around 13 years old, or almost 5 years from the beginningof the study (10.17/2.12 = 4.80 years). In contrast, a boy whose pubertal tempo was 1standard deviation above the mean pubertal tempo would achieve Tanner Stage 4 in only 3years (10.17/3.58 = 2.84 years), around age 11. For girls, the mean slope equaled 3.29 (SD =1.06). Thus, a girl with average pubertal tempo would achieve Tanner Stage 4 inapproximately 4 years, or around age 12 (14.25/3.29 = 4.33 years), whereas a girl whosepubertal tempo was 1 standard deviation above the mean would achieve Tanner Stage 4 inapproximately 3 years (14.24/4.35 = 3.28 years), around age 11.
African American girls had significantly earlier pubertal timing than European Americangirls, β = .62, 95% confidence interval (CI) [0.15, 1.09], but did not have significantly fasterpubertal tempo, β = −.20, p = .59. There were no significant differences between Hispanicgirls and European American girls with respect to either timing, β = .50, p = .15, or tempo, β= −.42, p = .39. For boys, neither Hispanic boys nor African American boys weresignificantly different than European American boys in either pubertal timing βAfAmerican = .24, p = .33; βHispanic = .08, p = .79, or pubertal tempo βAfAmerican = − .21, p = .41; βHispanic= − .39, p = .18.
For both boys and girls, there was a moderate negative correlation (r = − .40) between thelatent intercept and latent slope factors. This negative correlation may reflect a ceilingeffect: early maturing children who are already at an advanced Tanner stage at the beginningof the study would have both a higher latent intercept and, because they have less pubertaldevelopment remaining, a lower latent slope. As can be seen from the R2 estimates, which
Mendle et al. Page 10
Dev Psychol. Author manuscript; available in PMC 2011 June 14.
NIH
-PA Author Manuscript
NIH
-PA Author Manuscript
NIH
-PA Author Manuscript

range from .83 to .93 in boys and .86 to .91 in girls, the parameters of the LGM accountedvery well for the observed Tanner stages at each age.
Test 2: Do Pubertal Timing and Tempo Independently Predict Depressive Symptoms?Results from the dual LGM of puberty and depressive symptoms are shown in Table 4 (seeFigure 3 for model). In boys, the (standardized) regression parameters indicate effects ofboth pubertal timing and pubertal tempo on change in depressive symptoms. The meanlatent slope for depressive symptoms (μ2) in boys was actually negative, indicating thatboys’ depressive symptoms, on average, decreased in their during pre-adolescence. Theeffects of pubertal timing and pubertal tempo on the latent slope were positive, indicatingthat boys who mature earlier and boys who mature more rapidly than average experienceless negative (i.e., less rapid) decreases in depressive symptoms. That is, boys with earlypubertal timing or rapid pubertal tempo did not experience the reduction in depressiveproblems that was usually enjoyed by boys their age. Hispanic boys had a significantlyhigher initial level of depressive symptoms than European American boys, β = .98, 95% CI[0.29, 1.67] but did not have significantly different change in depressive symptoms, β = −.49, p = .27. There were no differences between African American and European Americanboys with regards to initial level, β = .41, p = .19, or change in depressive symptoms, β = −.48, p = .23.
A pairwise parameter comparison of the regression coefficients for pubertal timing andpubertal tempo confirmed that the relation of pubertal tempo with depressive symptoms wassignificantly greater than that of pubertal timing, Wald test = 5.071, p = .024. In addition, wetested a nested model in which the regression effect of pubertal tempo was fixed to equal 0,and we compared the difference in R2 for change in depressive symptoms. A model withonly the effect of pubertal timing accounted for only 2.7% of the variance in change indepressive symptoms, whereas a model with both pubertal timing and pubertal tempoaccounted for 42% of the variance in change in depressive symptoms.
In contrast, the regression parameters in girls indicated effects of only pubertal timing ondepressive symptoms. There were no effects of pubertal tempo, nor were there any effects(of either timing or tempo) on change in depressive symptoms. In other words, earlymaturing girls experienced higher average levels of depressive symptoms during pre-adolescence, consistent with previous research findings. Independent of this effect ofpubertal timing, rapidly maturing girls demonstrated no worse outcomes. Finally, there wereno significant effects of race/ethnicity on either level or change in depressive symptoms ingirls.
Test 3: Do the Effects of Pubertal Timing Versus Tempo Differ Across Genders?Multiple-group LGM was used to test whether the growth curve parameters for pubertaldevelopment and depressive symptoms could be constrained to be equal across boys andgirls without significant decrement in model fit. The first set of nested model comparisonsindicated that boys and girls significantly differed in their mean pubertal timing (intercept)and mean pubertal tempo (slope), Δχ2 = 30.9, Δdf = 2, p < .001. However, all other growthparameters for pubertal development, including the variances and covariance of the interceptand slope factors and regressions of intercept and slope on race/ethnicity could beconstrained to be equal across genders, Δχ2 = 6.86, Δdf = 9, p = .68. Similarly, the secondset of nested model comparisons indicated that for growth curves of depressive symptoms,the intercept and slope variances and covariance, time-specific residual variances, andregressions of intercept and slope on race and ethnicity could be constrained to be equalacross genders, Δχ2 = 12.87, Δdf = 10, p = .23.
Mendle et al. Page 11
Dev Psychol. Author manuscript; available in PMC 2011 June 14.
NIH
-PA Author Manuscript
NIH
-PA Author Manuscript
NIH
-PA Author Manuscript
Consequently, the final multiple-group LGM constrained all parameters to be equal acrossgenders, except for the means of the intercept and slope factors and the effects of pubertaltiming and tempo on the development of depressive symptoms. Results from the finalmultiple-group LGM are shown in Table 5. A nested model that constrained the regressioncoefficients to be equal across gender fit significantly worse than the full model wherecoefficients were free to differ across gender, Δχ2 = 11.14, Δdf = 4, p = .03. This indicatesthat the relative impact of pubertal timing and pubertal tempo significantly differed acrossboys and girls.
DiscussionPuberty represents a universal transition, yet seems to hold more resonance and presentmore of a stumbling block for some people than for others. Children certainly differ in theirresponse, awareness, and capacity to navigate the challenges of puberty. But they also differin their biological experiences, and the psychological significance of puberty is not unrelatedto these individual maturational nuances. Early timing of puberty, particularly in girls, is oneof the best-researched predictors of psychological distress during adolescence. This articlehighlights the importance of another individual difference in the process of maturation:pubertal tempo, a topic which has been understudied to date.
Our study concentrates on depressive symptoms as children progress from late childhoodinto puberty. Consistent with previous literature, our results replicated the well-establishedfinding that girls who experience an earlier onset of maturation also report a greater level ofdepressive symptoms during puberty. While early pubertal timing also predicted depressiveseverity for boys, we notably obtained stronger effects for pubertal tempo than for pubertaltiming: Boys who matured more quickly than peers reported more depressive symptoms,with those boys who matured early and quickly being at greatest risk. This was not the casefor boys with more normative developmental timing and tempo.
To date, the process of puberty in boys has been more difficult to capture than that of girlsand has yielded less consistent results than the girls’ literature. This is particularly true forassociations of pubertal timing with clinical outcomes for boys. Our results indicate thatpubertal tempo may perhaps be a more salient augur in the trajectory of boys’ puberty thantiming alone. This is in support of the maturation compression hypothesis proposed in thisarticle. Our findings additionally help to explain why the pubertal timing literature for boyshas yielded relatively disparate results; to understand the psychological significance of boys’development, we may need to move beyond simple consideration of timing of development.
It is worth cautioning that the dearth of research on pubertal tempo makes interpretation ofour findings results somewhat speculative. Yet it seems notable that timing was the strongestpredictor of depressive symptoms in girls, and tempo was the strongest predictor in boys.This finding is similar to results obtained by Ge et al. (2003) in an investigation of pubertaltiming versus pubertal change at two time points in African American children. On a moreintuitive level, it seems apparent that puberty comprises markedly different biologicalprocesses, maturational challenges, social changes, benefits, and risks for boys and girls.One possible explanation of the gender difference is that timing and tempo may holddifferent importance for boys and girls because of inherent differences in the pubertalprocess. Specifically, girls mature, on average, 1 year earlier than boys. This means thatwhen early maturing girls start to manifest visible signs of puberty, they are the first of alltheir classmates and peers to do so. When early maturing boys start to manifest signs ofpuberty, they may be the first boys but are not the first of their overall peer group to makethis transition. In effect, timing in girls may supersede the effects of tempo for the simplereason that early maturation places girls in a uniquely vulnerable position that is not shared
Mendle et al. Page 12
Dev Psychol. Author manuscript; available in PMC 2011 June 14.
NIH
-PA Author Manuscript
NIH
-PA Author Manuscript
NIH
-PA Author Manuscript

either by an early maturing boy or by a later but more speedily developing child of eithergender. For this reason, early onset of development may have something of a “trumping”effect over tempo in girls. In support of this, both boys and girls tend to report feelingembarrassment, excitement, fear, pride, and other mixed emotions about their development(Brooks-Gunn, Newman, Holderness, & Warren, 1994; Dubas, Graber, & Petersen, 1991;Gaddis & Brooks-Gunn, 1985), but the most consistently negative reactions to pubertalchanges have been voiced by girls who experience early pubertal timing (Dubas et al.,1991).
Certainly, understanding normal developmental processes—and where they may go awry forsome children—is a research endeavor that holds direct clinical relevance. There are amultitude of school-based health and intervention programs presently used to reduce theknown correlates of early pubertal timing, including depression and low self-esteem, as wellas externalizing behaviors and risky sexual activity (e.g., Aten, Siegal, Enaharo, & Auinger,2000; Botvin, Griffin, & Nichols, 2006; Eddy, Reif, & Fetrow, 2000; O’Dea and Abraham,2000). Our results offer a number of implications for clinicians and researchers interested infurther calibrating existing interventions to be both effective and meaningful for children.Although some of these programs discuss normative pubertal changes, they tend not to begender specific nor do they include a psychoeducational component that addressesindividual variations in development. Yet the importance of “normalizing,” and placingstressors in context has repeatedly been shown to be clinically effective (see Gabbard, Beck,& Holmes, 2007). Although children’s biological processes may not be malleable, theirresponses to such processes are. By suggesting that relations of individual differences atpuberty with outcomes may differ across gender, we offer in this study specific areas totarget for reframing the impact of the pubertal transition within an intervention context.
LimitationsThere has been little research on pubertal tempo coupled with inconsistent findings onassociations of psychological outcomes with pubertal timing in boys. As the present study isone of the first, if not only, studies on pubertal tempo to date, we consider this a preliminaryexploration. This is particularly important given the limitations in our study. First andforemost, our initial sample size was not large and experienced attrition over time. Somechildren, moreover, went more than 1 year between assessments. This question of missingdata is perhaps a more troubling scenario for our study than for other longitudinal research,given the nature of pubertal tempo and the need to measure subtle changes occurring duringa relatively compact span. Although we used growth curve modeling with FIML to accountfor missing data, our statistical power may have been compromised to detect all effects. Ofparticular note, we obtained a null effect of pubertal tempo for girls. Replications in othersamples with a greater number of participants and less attrition will be critical to determinewhether this is a “true” null effect or simply an artifact of sample size concerns. For thisreason, we feel it worth emphasizing that our interpretations regarding the gender differenceare particularly provisional, in accordance with the confines of the data.
In addition to attrition and missing data, our findings are further limited by concerns aboutgeneralizability. Our sample was drawn from families who responded to recruitment inpublic schools. Parents managing high levels of life stress, unusually tumultuous puberty intheir children, and depression or other forms of psychopathology (for themselves, theirpartners, or their children) may have been less likely to participate in a time-intensivepsychological study. As we simply do not know the reasons some families responded to therecruitment flyer and others did not, we are unable to ascertain generalizability of results.
Lastly, it is worth commenting on the limitations in our measure of puberty. Pubertal statusat each wave was primarily drawn from parental reports of Tanner stages. In general, the
Mendle et al. Page 13
Dev Psychol. Author manuscript; available in PMC 2011 June 14.
NIH
-PA Author Manuscript
NIH
-PA Author Manuscript
NIH
-PA Author Manuscript
accuracy of parent report of pubertal development varies when compared with physicalexamination. Some studies show that parent reports of Tanner stage are reasonably wellcorrelated with assessments of Tanner stage obtained by a trained examiner conducting aphysical examination (e.g., .57–.87; Brooks-Gunn et al., 1987). Yet kappa coefficients, inwhich the likelihood of chance agreement is taken into account, are considerably lower (.33–.50; Dorn et al., 1990). Moreover, it would be reasonable to infer that some parents maynot have had sufficient or recent opportunity to observe their children’s bodies in enoughdetail for Tanner ratings to be accurate; indeed, a minority of parents voiced that they feltunable to complete these rating, and children therefore completed the ratings themselves.The inclusion of multiple reporters of development is certainly not optimal, particularly notwhen compared with the “gold standard” of a physical examination (Dorn et al., 2006).
In addition, our study was an investigation of a 4-year span of pubertal development, withassessments ending in early adolescence. Yet puberty was already underway for someparticipants at the start of the study, and conversely, a relatively small percentage ofparticipants had completed development by the end of the study. This highlights a moregeneral methodological problem inherent in the study of puberty: Capturing the completespectrum of pubertal development in all individuals in a sample would necessitate assessingparticipants between the ages 6 and 16 with reasonable frequency. This is obviously anexpensive and difficult proposition and leads to pubertal data that are often truncated. Withregard to the present study, it is plausible that some of the less-developed participants atWave 4 might still go on to experience a rapid period of developmental change. In fact, wecan make no predictions about long-term effects and can specify the relations of pubertaltiming and tempo and depressive symptoms in early adolescence only.
ConclusionAbove all, the present study reinforces the benefits to investigators of moving beyondpubertal timing to examine additional sources of individual variability at puberty. While astudy in which pubertal timing is disentangled from pubertal tempo is a clear advance overstudies with no measures of tempo, our findings concentrate on one outcome during earlyadolescence. It is not clear whether similar effects would be replicated for other outcomes orfor pubertal changes occurring later in adolescence. Additional research into pubertal tempowill help both researchers and clinicians build a more comprehensive understanding of thiscritical developmental window.
AcknowledgmentsData collection for the Girls and Boys Health and Development project was supported by National Institutes ofHealth Grants HD32376 and MH56557.
ReferencesAlsaker FD. Pubertal timing, overweight, and psychological adjustment. Journal of Early Adolescence.
1992; 12:396–419.American Psychiatric Association. Diagnostic and statistical manual of mental disorders. 4.
Washington, DC: Author; 1994.Aten MJ, Siegel DM, Enaharo M, Auinger P. Keeping middle school students abstinent: Outcomes of
a primary prevention intervention. Journal of Adolescent Health. 2002; 31:70–78. [PubMed:12090967]
Baltes, PB.; Nesselroade, JR. History and rationale of longitudinal research. In: Nesselroade, JR.;Baltes, editors. Longitudinal research in the study of behavior and development. New York, NY:Academic Press; 1979. p. 21-27.
Mendle et al. Page 14
Dev Psychol. Author manuscript; available in PMC 2011 June 14.
NIH
-PA Author Manuscript
NIH
-PA Author Manuscript
NIH
-PA Author Manuscript

Beck AT, Ward CH, Mendelson M, Mock J, Erbaugh J. An inventory for measuring depression.Archives of General Psychiatry. 1961; 4:561–571. [PubMed: 13688369]
Biro FM, Huang B, Crawford PB, Lucky AW, Striegel-Moore R, Barton BA, Daniels S. Pubertalcorrelates in black and white girls. Journal of Pediatrics. 2006; 148:234–240. [PubMed: 16492435]
Bonat S, Pathomvanich A, Keil MF, Field AE, Yanovski JA. Self-assessment of pubertal stage inoverweight children. Pediatrics. 2002; 110:743–747. [PubMed: 12359788]
Botvin GJ, Griffin KW, Nichols TR. Preventing youth violence and delinquency through a universalschool-based prevention approach. Prevention Science. 2006; 7:403–408. [PubMed: 17136462]
Brooks-Gunn J, Newman D, Holderness C, Warren MP. The experience of breast development andgirls: Stories about the purchase of a bra. Journal of Youth and Adolescence. 1994; 23:539–565.
Brooks-Gunn J, Warren MP. Measuring physical status and timing in early adolescence: Adevelopmental perspective. Journal of Youth and Adolescence. 1985; 14:163–189.
Brooks-Gunn J, Warren MP, Rosso J, Gargiulo J. Validity of self-report measures of girls’ pubertalstatus. Child Development. 1987; 58:829–841. [PubMed: 3608653]
Dorn LD, Dahl RE, Woodward HR, Biro F. Defining the boundaries of early adolescence: A user’sguide to assessing pubertal status and pubertal timing in research with adolescents. AppliedDevelopmental Science. 2006; 10:30–56.
Dorn LD, Susman EJ, Nottelmann ED, Inoff-Germain G, Chrousos GP. Perceptions of puberty:Adolescent, parent, and health care personnel. Developmental Psychology. 1990; 26:322–329.
Downs AC, Fuller MJ. Recollections of spermarche: An exploratory investigation. CurrentPsychology: Research & Reviews. 1991; 10:93–102.
Dubas JS, Graber JA, Petersen AC. A longitudinal investigation of adolescents’ changing perceptionsof pubertal timing. Developmental Psychology. 1991; 27:580–586.
Eddy JM, Reid JB, Fetrow RA. An elementary school-based prevention program targeting modifiableantecedents of youth delinquency and violence: Linking the Interests of Families and Teachers(LIFT). Journal of Emotional & Behavioral Disorders. 2000; 8(3):165–176.
Fairburn C, Welch S, Doll H, Davies BA, O’Connor ME. Risk factors for bulimia nervosa: Acommunity-based case control study. Archives of General Psychiatry. 1997; 54:509–517.[PubMed: 9193191]
Ferrer E, Hamagami F, McArdle JJ. Modeling latent growth curves with incomplete data usingdifferent types of structural equation modeling and multilevel software. Structural EquationModeling. 2004; 11:452–483.
Fisher M, Rosenfeld WD, Burk RD. Cervicovaginal human papillomavirus infection in suburbanadolescents and young adults. Journal of Pediatrics. 1991; 119:821–825. [PubMed: 1658285]
Gabbard, GO.; Beck, JS.; Holmes, J. Oxford textbook of psychotherapy. New York, NY: OxfordUniversity Press; 2007.
Gaddis A, Brooks-Gunn J. The male experience of pubertal change. Journal of Youth andAdolescence. 1985; 14:61–69.
Ge X, Conger RD, Elder GH. Coming of age too early: Pubertal influences on girls’ vulnerability topsychological distress. Child Development. 1996; 67:3386–3400. [PubMed: 9071784]
Ge X, Conger RD, Elder GH. Pubertal transition, stressful life events, and the emergence of genderdifferences in adolescent depressive symptoms. Developmental Psychology. 2001; 37:404–417.[PubMed: 11370915]
Ge X, Kim IJ, Brody GH, Conger RD, Simon RL, Gibbons FX, Cutrona CE. It’s about timing andchange: Pubertal timing effects on symptoms of depression among African American youths.Developmental Psychology. 2003; 39:430–439. [PubMed: 12760513]
Ge X, Natsuaki MN. In search of explanations for early pubertal timing effects on developmentalpsychopathology. Current Directions in Psychological Science. 2009; 18:327–331.
Graber JA, Lewinsohn PM, Seeley JR, Brooks-Gunn J. Is psychopathology associated with the timingof pubertal development? Journal of the American Academy of Child and Adolescent Psychiatry.1997; 36:1768–1776. [PubMed: 9401339]
Haynie D. Context of risk? Explaining the link between girls’ pubertal development and theirdelinquency involvement. Social Forces. 2003; 82:355–397.
Mendle et al. Page 15
Dev Psychol. Author manuscript; available in PMC 2011 June 14.
NIH
-PA Author Manuscript
NIH
-PA Author Manuscript
NIH
-PA Author Manuscript

Hollingshead, AB. Four-factor index of social status. New Haven, CT: Yale University Press; 1975.Jones MC. Psychological correlates of somatic development. Child Development. 1965; 36:899–911.
[PubMed: 5892336]Jones MC, Bayley N. Physical maturing among boys as related to behavior. Journal of Educational
Psychology. 1950; 41:129–148.Kaltiala-Heino R, Marttunen M, Rantanen P, Rimpela M. Early puberty is associated with mental
health problems in adolescence. Social Science and Medicine. 2003; 57:1055–1064. [PubMed:12878105]
Kaplowitz PB, Oberfield SE. Reexamination of the age limit for defining when puberty is precociousin girls in the United States: Implications for evaluation and treatment. Pediatrics. 1999; 104:936–941. [PubMed: 10506238]
Kovacs M. The Children’s Depression Inventory (CDI). Psychopharmacology Bulletin. 1985; 21:995–1124. [PubMed: 4089116]
Marshall WA, Tanner JM. Variations in the pattern of pubertal changes in girls. Archives of theDiseases in Childhood. 1969; 44:291–303.
Marshall WA, Tanner JM. Variations in the pattern of pubertal changes in boys. Archives of theDiseases in Childhood. 1970; 45:13–23.
McArdle, JJ.; Nesselroade, JR. Growth curve analysis in contemporary psychological research. In:Schinka, J.; Velicer, W., editors. Comprehensive handbook of psychology: Vol. 2. Researchmethods in psychology. New York, NY: Wiley; 2002.
McClintock M, Herdt G. Rethinking puberty: The development of sexual attraction. Current Directionsin Psychological Science. 1996; 5:178–183.
Mendle J, Turkheimer E, Emery RE. Detrimental psychological outcomes associated with earlypubertal timing in adolescent girls. Developmental Review. 2007; 27:151–171. [PubMed:20740062]
Meredith W, Tisak J. Latent curve analysis. Psychometrika. 1990; 55:107–122.Morris NM, Udry JR. Validation of a self-administered instrument to assess stage of adolescent
development. Journal of Youth and Adolescence. 1980; 9:271–280.Muthén, LK.; Muthén, BO. Mplus user’s guide. Los Angeles, CA: Authors; 1998–2009.O’Dea JA, Abraham S. Improving the body image, eating attitudes, and behaviors of young male and
female adolescents: A new educational approach that focuses on self-esteem. International Journalof Eating Disorders. 2000; 28:43–57. [PubMed: 10800013]
Paikoff R, Brooks-Gunn J. Do parent–child relationships change during puberty? PsychologicalBulletin. 1991; 110:47–66. [PubMed: 1891518]
Pantsiotou S, Papadimitriou A, Douros K, Priftis K, Nicolaidou P, Fretzayas A. Maturational tempodifferences in relation to the timing of the onset of puberty in girls. Acta Pædiatrica. 2008; 97:217–220.
Papadimitriou A, Fretzayas A, Nicolaidou P. The tempo of puberty. Journal of Pediatrics. 2006;149:732–733. [PubMed: 17095363]
Patton GC, Hibbert ME, Carlin J, Shao Q, Rosier M, Caust J, Bowes G. Menarche and the onset ofdepression and anxiety in Victoria, Australia. Journal of Epidemiology and Community Health.1996; 50:661–666. [PubMed: 9039386]
Petersen AC, Crockett L. Pubertal timing and grade effects on adjustment. Journal of Youth andAdolescence. 1985; 14:191–206.
Petersen AC, Sarigiani PA, Kennedy RE. Adolescent depression: Why more girls than boys? Journalof Youth and Adolescence. 1991; 20:191–215.
Petersen, AC.; Taylor, B. The biological approach to adolescence: Biological change andpsychological adaptation. In: Adelson, J., editor. Handbook of adolescent psychology. New York,NY: Wiley; 1980.
Schafer JL, Graham JW. Missing data: Our view of the state of the art. Psychological Methods. 2002;7:147–177. [PubMed: 12090408]
Stattin, H.; Magnusson, D. Pubertal maturation in female development: Volume 2. Paths through life.Hillsdale, NJ: Erlbaum; 1990.
Mendle et al. Page 16
Dev Psychol. Author manuscript; available in PMC 2011 June 14.
NIH
-PA Author Manuscript
NIH
-PA Author Manuscript
NIH
-PA Author Manuscript

Steinberg L. Impact of puberty on family relations: Effects of pubertal status and pubertal timing.Developmental Psychology. 1987; 23:451–460.
Stice E, Presnell K, Bearman SK. Relation of early menarche to depression, eating disorders,substance abuse, and comorbid psychopathology among adolescent girls. DevelopmentalPsychology. 2001; 37:608–619. [PubMed: 11552757]
Susman EJ, Dorn LD, Chrousos GP. Negative affect and hormone levels in young adolescents:Concurrent and predictive perspectives. Journal of Youth and Adolescence. 1991; 20:167–190.
Tanner, JM. Growth at adolescence. 2. Oxford, England: Blackwell; 1962.Udry JR. Age at menarche, at first intercourse, and at first pregnancy. Journal of Biosocial Science.
1979; 11:433–441. [PubMed: 511871]Weichold, K.; Silbereisen, RK.; Schmitt-Rodermund, E. Short- and long-term consequences of early
versus late physical maturation in adolescents. In: Hayward, C., editor. Gender differences atpuberty. Cambridge, England: Cambridge University Press; 2003. p. 241-276.
Wellens R, Malina RM, Roche AF, Chumlea WC, Guo S, Siervogel RM. Body size and fatness inyoung adults in relation to age at menarche. American Journal of Human Biology. 1992; 4:783–787.
Wichstrom L. Predictors of adolescent suicide attempts: A nationally representative longitudinal studyof Norwegian adolescents. Journal of the American Academy of Child and Adolescent Psychiatry.2000; 39:603–610. [PubMed: 10802978]
Wothke, W. Longitudinal and multi-group modeling with missing data. In: Little, TD.; Schnabel, KU.;Baumert, J., editors. Modeling longitudinal and multiple group data: Practical issues, appliedapproaches, and specific examples. Mahwah, NJ: Erlbaum; 1998.
Mendle et al. Page 17
Dev Psychol. Author manuscript; available in PMC 2011 June 14.
NIH
-PA Author Manuscript
NIH
-PA Author Manuscript
NIH
-PA Author Manuscript

Figure 1.Mean growth in Tanner stage for European American, African American, and Hispanic boysand girls.
Mendle et al. Page 18
Dev Psychol. Author manuscript; available in PMC 2011 June 14.
NIH
-PA Author Manuscript
NIH
-PA Author Manuscript
NIH
-PA Author Manuscript

Figure 2.Latent growth model of pubertal development in boys from age 8 to age 14. Observedordinal Tanner stage variables (Y8i–Y14i) are depicted as “circles within squares” to indicatethat children were not measured at every age; that is, some data are missing by design ateach age. Threshold structure for ordinal Tanner Stage variables is not depicted. Residualvariances for the continuous latent variables (y8i–y14i) underlying observed ordinal variableswere constrained to be equal across ages. Mean of the latent intercept factor (μ1) was fixedto 0.0. Regressions of latent intercept and latent slope factors on dummy-coded race/ethnicity variables not depicted. Model for girls was identical, except age range was from 8to 13 years. i = individual; η1i = latent factor representing the initial level (often referred toas the latent intercept); η2i = latent factor representing the slope of change over time; Ψ =variance in linear slope.
Mendle et al. Page 19
Dev Psychol. Author manuscript; available in PMC 2011 June 14.
NIH
-PA Author Manuscript
NIH
-PA Author Manuscript
NIH
-PA Author Manuscript

Figure 3.Latent growth model of pubertal development and depression in boys from ages 8 to 14years. Observed variables are depicted as “circles within squares” to indicate that childrenwere not measured at every age; that is, some data are missing by design at each age.Residual variances for the continuous latent variables (x8i–x14i) underlying observed ordinalvariables were constrained to be equal across ages. Residual variances for observeddepression scores (Y8i–Y14i) were also constrained to be equal across ages. Mean of thelatent intercept factor for puberty (μx1) was fixed to 0.0. Regressions of latent intercept andlatent slope factors on dummy-coded race/ethnicity variables not depicted. Model for girlswas identical, except age range was from 8 to 13 years. i = individual; η1i = latent factorrepresenting the initial level (often referred to as the latent intercept); η2i = latent factorrepresenting the slope of change over time; Ψ = variance in linear slope; βX1-Y1 = regressionof depression intercept on puberty intercept; βX1-Y2 = regression of depression slope onpuberty intercept; βX2-Y1 = regression of depression intercept on puberty slope; βX2-Y2 =regression of depression slope on puberty slope.
Mendle et al. Page 20
Dev Psychol. Author manuscript; available in PMC 2011 June 14.
NIH
-PA Author Manuscript
NIH
-PA Author Manuscript
NIH
-PA Author Manuscript

NIH
-PA Author Manuscript
NIH
-PA Author Manuscript
NIH
-PA Author Manuscript
Mendle et al. Page 21
Tabl
e 1
Num
ber o
f Boy
s at E
ach
Tann
er S
tage
at W
aves
1 T
hrou
gh 4
Stag
e
Wav
e 1
(Mea
n ag
e =
9.61
yea
rs)
Wav
e 2
(Mea
n ag
e =
11.1
3 ye
ars)
Wav
e 3
(Mea
n ag
e =
12.2
7 ye
ars)
Wav
e 4
(Mea
n ag
e =
13.1
4 ye
ars)
Gen
ital
Hai
rG
enita
lH
air
Gen
ital
Hai
rG
enita
lH
air
n%
n%
n%
n%
n%
n%
n%
n%
159
5095
7924
2444
442
212
140
00
0
238
3225
2139
3939
3921
2425
288
178
17
317
140
023
2312
1235
4029
3313
2715
32
45
40
013
133
326
3019
2218
3819
40
50
00
01
11
14
53
38
175
11
Tota
l11
912
010
099
8888
4747
Not
e. G
enita
l = g
enita
l dev
elop
men
t; ha
ir =
pubi
c ha
ir gr
owth
.
Dev Psychol. Author manuscript; available in PMC 2011 June 14.

NIH
-PA Author Manuscript
NIH
-PA Author Manuscript
NIH
-PA Author Manuscript
Mendle et al. Page 22
Tabl
e 2
Num
ber o
f Girl
s at E
ach
Tann
er S
tage
at W
aves
1 T
hrou
gh 4
Stag
e
Wav
e 1
(Mea
n ag
e =
8.86
yea
rs)
Wav
e 2
(Mea
n ag
e =
9.69
yea
rs)
Wav
e 3
(Mea
n ag
e =
10.5
6 ye
ars)
Wav
e 4
(Mea
n ag
e =
11.8
4 ye
ars)
Bre
ast
Hai
rB
reas
tH
air
Bre
ast
Hai
rB
reas
tH
air
n%
n%
n%
n%
n%
n%
n%
n%
163
5195
7519
2545
6118
2029
337
717
17
247
3826
2042
5620
2736
4026
3023
2122
21
319
104
312
167
926
2917
2046
4327
26
41
12
22
31
17
811
1325
2327
26
50
00
00
01
12
24
57
610
10
Tota
l13
012
775
7489
8710
810
3
Not
e. B
reas
t = b
reas
t dev
elop
men
t; ha
ir =
pubi
c ha
ir gr
owth
.
Dev Psychol. Author manuscript; available in PMC 2011 June 14.

NIH
-PA Author Manuscript
NIH
-PA Author Manuscript
NIH
-PA Author Manuscript
Mendle et al. Page 23
Table 3
Parameters From Latent Growth Models of Pubertal Development in Boys and Girls
Model parameters
Boys Girls
Estimate 95% CI Estimate 95% CI
Growth factors
Mean intercept (μ1) 0.00 [0.00, 0.00] 0.00 [0.00, 0.00]
Mean slope (μ2) 2.12 [1.48, 2.77] 3.29 [2.23, 4.34]
Variance of intercept (Ψ11) 28.55 [12.38, 44.73] 22.25 [4.57, 39.93]
Variance of slope (Ψ22) 2.14 [0.88, 3.40] 1.13 [0.00, 2.55]
Covariance of intercept–slope (Ψ12) −5.47 [−9.09, −1.85] −2.00 [−5.32, 1.31]
Tanner stage thresholds
Stage 1–2 2.31 [0.30, 4.32] 6.78 [4.12, 9.41]
Stage 2–3 6.30 [4.06, 8.54] 11.01 [7.57, 14.45]
Stage 3–4 10.17 [7.61, 12.72] 14.25 [10.22, 18.27]
Stage 4–5 15.00 [11.86, 18.13] 18.59 [13.65, 23.54]
Age-Specific R2
Age 8 0.90 0.88
Age 9 0.86 0.87
Age 10 0.83 0.86
Age 11 0.82 0.87
Age 12 0.86 0.89
Age 13 0.90 0.91
Age 14 0.93 NA
Model fit indices
Log likelihood −547.56 −348.55
Bayesian information criterion 1115.02 718.00
Note. CI = confidence interval.
Dev Psychol. Author manuscript; available in PMC 2011 June 14.

NIH
-PA Author Manuscript
NIH
-PA Author Manuscript
NIH
-PA Author Manuscript
Mendle et al. Page 24
Table 4
Parameters From Dual Latent Growth Models of Pubertal Development and Depressive Symptoms (EstimatedSeparately in Boys and Girls)
Model parameters
Boys Girls
Estimate 95% CI Estimate 95% CI
Growth factors: Puberty
Mean intercept (μX1) 0.00 [0.00, 0.00] 0.00 [0.00, 0.00]
Mean slope (μX2) 2.19 [1.52, 2.86] 3.18 [2.39, 3.97]
Variance of intercept (ΨX11) 29.57 [12.78, 46.37] 20.27 [8.10, 32.44]
Variance of slope (ΨX22) 2.28 [0.93, 3.62] 1.10 [0.04, 2.16]
Covariance of intercept–slope (ΨX12) −5.74 [−9.55, −1.94] −1.79 [−3.99, 0.42]
Growth factors: Depression
Mean intercept (μY1) 6.94 [3.52, 10.37] 8.74 [1.44, 16.05]
Mean slope (μY2) −0.91 [−2.03, 0.22] 0.55 [−1.63, 2.73]
Variance of intercept (ΨY11) 13.46 [1.71, 25.21] 10.40 [0.00, 32.70]
Variance of slope (ΨY22) 0.60 [0.00, 1.77] 0.43 [0.00, 3.26]
Covariance of intercept–slope (ΨY12) −0.82 [−4.08, 2.45] 0.26 [−6.38, 6.90]
Regression effects (standardized)
Puberty intercept–depression intercept (βX1-Y1) −0.34 [−0.80, 0.12] 0.45 [0.06, 0.84]
Puberty intercept–depression slope (βX1-Y2) 0.67 [0.08, 1.27] −0.60 [−1.91, 0.71]
Puberty slope–depression intercept (βX2-Y1) −0.35 [−0.83, 0.13] −0.25 [−0.79, 0.29]
Puberty slope–depression slope (βX2-Y2) 0.82 [0.12, 0.73] −0.004 [−0.88, 0.87]
Tanner stage thresholds
Stage 1–2 2.55 [0.48, 4.72] 6.45 [4.38, 8.51]
Stage 2–3 6.59 [4.26, 8.91] 10.63 [8.05, 13.21]
Stage 3–4 10.51 [7.85, 13.17] 13.85 [10.84, 16.86]
Stage 4–5 15.43 [12.16, 18.70] 18.09 [14.09, 22.09]
R2: Depression
Latent intercept 0.24 0.42
Latent slope 0.43 0.33
Age 8 0.54 0.45
Age 9 0.50 0.44
Age 10 0.48 0.45
Age 11 0.51 0.47
Age 12 0.56 0.50
Age 13 0.62 0.55
Age 14 0.68 NA
Note. Lower bound for confidence intervals (CI) of variance components bounded at zero. Log likelihood for model = −1347.27 in girls and−1602.038 in boys. Bold typeface indicates regression estimates where the confidence interval does not include 0 (i.e., significance).
Dev Psychol. Author manuscript; available in PMC 2011 June 14.

NIH
-PA Author Manuscript
NIH
-PA Author Manuscript
NIH
-PA Author Manuscript
Mendle et al. Page 25
Table 5
parameters From Multiple-Group LGM of Gender Differences (Boys and Girls Estimated Together)
Model parameters
Boys Girls
Estimate 95% CI Estimate 95% CI
Growth factors: Puberty
Mean intercept (μ X1) 3.69 [1.94, 5.43] 0.00 [0.00, 0.00]
Mean slope (μ X2) 1.73 [1.15, 2.31] 3.15 [2.38, 3.91]
Variance of intercept (ΨX11) 27.79a [15.41, 40.18] 27.79a [15.41, 40.18]
Variance of slope (ΨX22) 1.97a [0.95, 2.99] 1.97a [0.95, 2.99]
Covariance of intercept–slope (ΨX12) −4.53a [−7.19, 1.86] −4.53a [−7.19, 1.86]
Growth factors: Depression
Mean intercept (μ Y1) 9.54 [5.30, 13.78] 8.91 [3.78, 14.04]
Mean slope (μ Y2) −1.31 [−2.80, 0.20] 0.30 [−1.63, 2.23]
Variance of intercept (ΨY11) 14.21a [4.85, 23.58] 14.21a [4.85, 23.58]
Variance of slope (ΨY22) 0.71a [0.00, 1.77] 0.71a [0.00, 1.77]
Covariance of intercept–slope (ΨY12) −0.94a [−3.69, 1.81] −0.94a [−3.69, 1.81]
Regression effects (standardized)
Puberty intercept–depression intercept (βX1-Y1) −0.32 [−0.78, 0.14] 0.43 [0.12, 0.73]
Puberty intercept–depression slope (βX1-Y2) 0.58 [0.03,1.13] −0.50 [−1.05, 0.05]
Puberty slope–depression intercept (βX2-Y1) −0.36 [−0.83, 0.11] −0.16 [−0.58, 0.26]
Puberty slope–depression slope (βX2-Y2) 0.71 [0.15,1.27] −0.12 [−0.95, 0.71]
Tanner stage thresholds
Stage 1–2 5.46a [3.26, 7.66] 5.46a [3.26, 7.66]
Stage 2–3 9.63a [7.18, 12.08] 9.63a [7.18, 12.08]
Stage 3–4 13.35a [10.64, 16.05] 13.35a [10.64, 16.05]
Stage 4–5 18.02a [14.90, 21.15] 18.02a [14.90, 21.15]
R2: Depression
Latent intercept 0.15 0.35
Latent slope 0.35 0.20
Note. Lower bound for confidence intervals (CI) of variance components bounded at zero. Log-likelihood for model = −3142.19, and sample-sizeadjusted Bayesian information criterion = 6501.69. Bold typeface indicates regression estimates where the confidence interval does not include 0(i.e., significance).
aParameter constrained to be equal across boys and girls, based on results of previous nested model comparisons.
Dev Psychol. Author manuscript; available in PMC 2011 June 14.


