Embed Size (px)
Citation preview

ISSN-0976-0245 (Print) • ISSN-0976-5506 (Electronic)
Website:
www.ijphrd.com
INDIAN JO
URNA
L OF
PUBLIC HEALTH RESEARCH & DEVELOPMENT
NEW DELHI
Volume 3 Number 2 April - June, 2012
Indian Journal of Public Health Research & Development
An International Journal

Indian Journal of Public Health Research & DevelopmentEditor
Prof. (Dr) R. K. SharmaDean (R&D), Saraswathi Institute of Medical Sciences, Panchsheel Nagar (UP)
E-mail: [email protected]
Chairman Editorial BoardProf. Saudan Singh
Director General, Medical Education & Training DirectorateLucknow, Uttar Pradesh
Associate EditorDr Manish Chaturvedi
Associate Professor, Community MedicineSchool of Medical Sciences and Research, Sharda University, Greater Noida
Assistent Editor (s)Dr. M. Salman Shah, Aligarh Dr. Shailesh Gupta, VaranasiDr. Sonu Goel, Chandigarh
Editorial Advisory BoardDr. Gaurav Jain, O&M Dental Surgeon, Modi Nagar
Prof. K. C. Singhal, Vice Chancellor, NIMS, JaipurProf. J. V. Singh, Community Medicine, Principal, M. N. M. C. (U.P.)
Prof. A. K. Asthana, Anatomy, Principal, Subharti Medical College, MeerutProf. P. D. Desai, Ob&Gy, Ex President FOGSI, Vadodara
Prof. J. L. Agarwal, Physiology, GhaziabadProf. M.L.S. Prabha, Andhra Pradesh
Prof. Sanjay Singhal, Microbiology, GurgaonProf. Pradeep Khanna, Community Medicine Rohtak
Prof. G. S. Meena, Community Medicine, DelhiDr. Anil Chaturvedi, General Medicine, Delhi
Dr. Bhanu Pratap, International Federation of Red Cross and Red Crescent SocietiesProf. S.D. Kandpal, Dehradun
Prof. Vijay L. Grover, Greater NoidaProf. K.P.S. Malik, Meerut
Prof. I. B. Sareen, GurgaonProf. V. K. Gupta, Greater Noida
Prof. Ashutosh Niranjan, Greater Noida
Print-ISSN: 0976-0245 Electronic - ISSN: 0976-5506, Frequency: Quaterly (Four issues per volume)
Indian Journal of Public Health Research & Development is a double blind peer reviewed international Journal. The frequency is half yearly. It deals with all aspects of Public Health including Community Medicine, Public Health, Epidemiology, Occupational Health, Environmental Hazards, Clinical Research, Public Health Laws and covers all medical specialities concerned with research and development for the masses. The journal strongly encourages reports of research carried out within Indian continent and south east Asia.
The journal has been assigned international standards (ISSN) serial number and is indexed with Index Copernicus (Poland). It is also brought to notice that the journal is being covered by many international databases. The journal is covered by EBSCO (USA), EMBASE (Scopus) database. The journal in now part of DST, CSIR and IJGC consortia.
Website: www.ijphrd.com
©All right reserved. The views and opinions expressed are of the authors and not of the Indian Journal of Public Health Research & Development. The journal does not guarantee directly or indirectly the quality or efficacy of any product or service featured in the advertisement in the journal, which are purely commercial.
EditorDr. R.K. Sharma
First Floor, Punjab National Bank Building Main Dadri Road, Bhangel, NOIDA - 201 304, UTTAR PRADESH
Printed, published and owned by Dr. R.K. Sharma
First Floor, Punjab National Bank Building Main Dadri Road , Bhangel, NOIDA - 201 304, UTTAR PRADESH
Printed atProcess & Spot
C-112/3, Naraina Industrial Area, Phase-INew Delhi-110 028
Published atFirst Floor, Punjab National Bank Building
Main Dadri Road , Bhangel, NOIDA - 201 304, UTTAR PRADESH
Scientific CommitteeDr. P. S. Mittal, Ob&Gy, Gwalior Dr. Bhupendra Singh, Psychiatry, Banglore Dr. Sadhna Awasthi, Community Medicine, Haldwani Dr. Bhavna Pant, Community Medicine, Meerut Dr. V. Chavli, Orthopedics, Vadodara Dr. Shailendra Kumar, Community Medicine, Meerut Prof. G. Gupta, Community Medicine, Ghaziabad Dr. Sangeeta Kansal, Community Medicine, Varanasi Dr. Neeta Singla, Public Health, Delhi

www.ijphrd.com
Volume 3, Number 2
1 Pattern of antibiotic prescription in the management of endodontic infections amongst oral and maxillofacial surgeons and endodontists in Gujarat
Amit Mahajan, Vaibhav Sharma, Ankur Vats, Anjali Srivastav4 Histoplasmosis of the periodontium – An uncommon condition Sayan Mukherjee, Anshul Garg, Debabrata Kundu7 Operationalisation and Utilisation of AYUSH Clinics in Chandigarh, India: A cross sectional evaluation study Gursimer Jeet, Arun K Aggarwal12 ABO blood group and secretor status in IHD patients Ashwini D. Pujari, Dinanath K. Pujari16 Central Adiposity and General Adiposity as Major Risk Predictors of Various Life Styles Related Diseases
especially Hypertension and Type 2 DM Bandana Sachdev20 Comparative assessment of efficacy of a single application of Potassium Oxalate and N-Butyl 2-Cyanoacrylate
in treatment of hypersensitive teeth-A clinical study Gururaj Naregal, Chandrashekar Raju25 Role of human bite mark identification and DNA technology in forensic odontology: A review Rohit Malik, Deepankar Misra, Akansha Misra28 Congenital malformations detected at birth – A prospective study in Bangalore Dinanath K. Pujari, Ashwini D. Pujari32 A rare form of aggressive pregnancy gingival enlargement - A case report Amitabh Srivastava, Krishna Kumar Gupta, Jaishree Garg, Sunita Srivastava35 A two year study of polycystic ovary syndrome in Davangere, Karnataka Gayatri Linganagouda Patil, Geeta Hosanemati, L.S. Patil, Vijayanath V, Venkatesh M. Patil, Rajeshwari R. Surpur40 A pilot syudy of relation of polycystic ovary syndrome and metabolic disorder in Davangere, Karnataka Geetha Hosanemati, Gayatri Patil, Prema Prabhudev, Anitha M.R, Vijayanath V, L.S. Patil45 Clinical use and safety of medical method of first trimester Abortion Geetha Hosanemati, Gayatri Patil, Prema Prabhudev, Anitha M.R, Vijayanath V, L.S. Patil49 Epidemiology of breast cancer in female in Meerut, India: patients characteristics and survival analysis Haroon AS, S.M. Gupta, B.B. Tyagi, J. Farhat53 Urban-rural differences in prevalence of CHD: A population based Study Mahajan H, Chaturvedi M, Lal P, Saha R, Grover VL56 A comparative study of random urine protein: creatinine ratio with 24 hour urine protein excretion in diabetic
nephropathy Hamsaveena, Rashmi M.V58 Diagnostic imaging in implantology: From conventional to newer paradigms Hemen Das, Himanshu Gupta, Ajay Singh, Geeta Verma63 A clinical and histopathological study of efficacy of chlorhexidine on gingival healing S. Bhudevamma, Mukhatar Ahmed Javali, Girish Katti68 Effect of two tongue cleaning methods on oral mutans Streptococci level Jayachandra M.G, Anil V. Ankola, Karibasappa G.N., Vijayanath V.72 A study of oxidative stress and altered endothelial cell function in preeclampsia Juhi Aggarwal, Mayur Kumar, Narendra Kumar76 Knowledge, attitude, practice regarding breast feeding practice among mothers attending Alluri Sita Rama
Raju Academy of Medical Sciences, Eluru, Andhra Pradesh Radhika Malireddy, K. Chandra Sekhar, P.G. Deotale80 Comparison of sub mucosal diathermy and partial resection of inferior turbinate in the treatment of
symptomatic nasal valve blockage Kapil KR Singh, Shakun Singh, Hemant KR Singh83 Patients’ perception towards professionalism in dentistry at K.L.E.S’s Institute of Dental Sciences, Belgaum, India G.N. Karibasappa, L. Nagesh88 Telavancin: A promising weapon against antimicrobial resistance Neirita Hazarika, Kingshuk Lahon
Contents
Indian Journal of Public Health Research & Development
I
April - June 2012
Indian Journal of Public Health Research & Development. April - June, 2012, Vol. 3, No. 2

II
93 Developing training modules for nurses in safe motherhood Komal Preet Allagh, Anitha Thippaiah97 Co-relation between chronic periodontitis and anemia – A pilot study Kshitiz Parashar, Tarun Khera, Rani Somani, Pradeep Shukla101 A Study on perceptions of key health care staff towards disease outbreak Kumar Praveen N, Parameshwar S106 Prevalence of Abo and Rhesus blood groups among blood donors Basavaraj P.B, Kavitha G.U, Shashikala P110 Comparative study of lipid profile in chronic smokers with and without acute myocardial infarction Pampareddy B. Kollur, Manjula R., Sangappa V. Kashinakunti, Gurupadappa S. Kallaganada, Jagadish B. Ingin113 bilateral Talon Cusp-An unusual presentation and its management Bhavna Dave, BS Rajashekhara, BS Manjunatha, Sunanda G Sujan116 Synthetic drinks and ill health in children S.K. Manuprakash, K.Varadarajshenoy120 Assessment of knowledge & practices among teachers regarding school health programme S.R.Nigudgi, Venkatesh M Patil, J V Pattankar, Shrinivasreddy B, Vijayanath V123 Correlation of Apoptotic Index and bcl-2 protein with other histological prognostic factors in prostate
carcinoma Malik P Nisha, Sharma V.K, Gupta Ankush127 Comparative cytomorphological profile of paediatric and adult lymphadenopathy with emphasis on smear
characteristics in tuberculous lymphadenitis Parul Singhal, Sanjay Gupta131 Direct observation pattern of DoTS (Directly observed Treatment Short Course) by alternate DoTS providers
for patients treated under RNTCP in a Tertiary Care Hospital Pethuru Devadason, K R John, Pearline Suganthi135 oral plasmablastic lymphoma in an HIV negative patient – A case report Punit Chitlangia, Samit Purohit, Chintan Narad, Rohan Bhise137 Lymphangiomatous macroglossia: A Case report Punit Chitlangia, S.V. Kumaraswamy, Abhishek Mathur140 A Study of disabilities among children (0-14 years) in rural field practice area of Rural Medical College, Loni, Maharashtra Rajagopal Rao Kodali, Chandrasekhar Ch.143 Left unilateral super numerary renal artery- A case report Sugavasi Raju, G.Kanchana Latha, Anandakumar L.145 Trichobezoar – A case report and literature overview Saila Rekha N, Murali Mohan K.V, Sampath Kumar K.L, Subba Rayudu K147 A pilot study comparing Propofol-Thiopentone Admixture with Propofol-Ketamine Admixture for ambulatory anaesthesia at SIMS, Ghaziabad, Uttar Pradesh Sanjay Kumar Lal, Ritu Goyal, Sharad Goel, Saurabh Goel151 Comparative analysis of variation in intraocular tension with vecuronium bromide and atracurium besylate: A prospective study Shailja Sharma, Arati Srivastava, Sharad Goel, Vikrant Sharma, Ashutosh Niranjan154 A comparison of post operative analgesia and adverse effects produced by neostigmine and morphine when given intrathecally Sharad Goel, Sanjay Lal, Ritu Goyal158 Nasopalatal Cyst – A case report Shilpa B.J A, Kodhandarama G.S B, Nagarajappa D C, Tanveer Ahmed D, Shivshankar C E161 Feeding practices and early childhood caries - A review Sowmya Rajshekar Anaberu, Laxminarayan Nagesh, Sunder Kote K165 Gamma Glutamyl Transpeptidase and total cholesterol levels in smokers and congestive cardiac failure patients Sreekantha, Vinodchandran, Amareshwar M, Avinash S S, Remya, Kodliwadmath M.V168 Clinical audit in dentistry – The third eye of oral care Sujatha A., Nagesh L.173 Aesthetic management of malpositioned implant following extraction of endodontically failed tooth: A case report Sumit Deshpande, D R V Kumar, Sudhendra Deshpande, Ajay Gaikwad1, Sharas Chandra176 biomedical waste management practices: A cross-sectional study in an urban setting Sushil Dohare, Himanshu Chauhan, Vijay l Grover, Shabana M. Khan, Sunil K Dohare, Madhu Bala179 A study of cytomorphological patterns and their diagnostic importance in tubercular lymphadenopathy Uma Tayal, Bharat Bhushan, A.K. Garg, Nishant182 Knowledge of Swine Flu among Students in a University of Western Turkey: A cross-sectional study Mustafa Tozun, Gul Arslan, Unal Ayranci, Alaettin Unsal
Indian Journal of Public Health Research & Development. April - June, 2012, Vol. 3, No. 2

1Indian Journal of Public Health Research & Development. April - June, 2012, Vol. 3, No. 2
Pattern of antibiotic prescription in the management of endodontic infections amongst oral and maxillofacial surgeons and endodontists in GujaratAmit Mahajan1, Vaibhav Sharma2, Ankur Vats3, Anjali Srivastav4
1Ass. Prof., Oral Surgery, 2P.G Student, Oral Surgery, 3P.G Student, Operative Dentistry, 4P.G Student, Operative Dentistry, Department of Oral and Maxillofacial Surgery, K.M. Shah Dental College & Hospital, Sumandeep Vidyapeeth, Piparia-391760, Waghodia Road, Vadodara, Gujarat
Abstract
AimTo identify antibiotic prescription in the treatment of endodontic infections amongst Oral Surgeons and Endodontists in Gujarat.
MethodologyThe Oral Surgeons & Endodontists registered with the Gujarat State Dental Council were surveyed on antibiotic prescription for six different pulpal and periapical diagnoses. A total of 70 questionnaires were delivered with 59 returned (84%).
ResultsThe average duration of antibiotic therapy was 7.0 ± 1.0 days. Ninety five percent of respondents selected amoxicillin as the first choice of antibiotic in patients with no medical allergies, alone (34%) or associated to clavulanate (61%). The first drug of choice for patients with an allergy to penicillins was clindamycin (65%), followed by azithromycin (15%) and metronidazole (13%). For cases of irreversible pulpitis, 86% of respondents prescribed antibiotics. For the scenario of a necrotic pulp, acute apical periodontitis and no swelling, 71% prescribed antibiotics. Almost 60% of respondents prescribed antibiotics for necrotic pulps with chronic apical periodontitis and a sinus tract.
ConclusionsThe majority of the Oral Surgeons & Endodontists in Gujarat were selecting the appropriate antibiotic for use in endodontic infections, but there are still many who are prescribing antibiotics inappropriately. The use of antibiotics for minor infections, or in some cases in patients without infections, could be a major contributor to the world problem of antimicrobial resistance.
KeywordsApical periodontitis, endodontic infections, irreversible pulpitis, orofacial infections, pharmacology.
IntroductionAntibiotics are prescribed by the dentists for treatment as well as prevention of infection. Indications for the use of systemic antibiotics in dentistry are limited, since most of the dental and periodontal diseases are best managed by operative intervention and oral hygiene measures. However, the literature provides evidence of inadequate prescribing practices by the dentists, due to a number of factors ranging from inadequate knowledge to certain social factors1.
Dentists prescribe medications for the management of a number of oral conditions, mainly orofacial infections. Since most human orofacial infections originate from odontogenic infections, the prescription of antibiotics by dental practitioners has become an important aspect of dental practice. For this reason, antibiotics account for the vast majority of medicines prescribed by the dentists. Dentists prescribe between 7% and 11% of all common antibiotics (betalactams, macrolides, tetracyclines, clindamycin, and metronidazole). In the UK, for instance, dentists accounted for 7% of all community prescriptions of antimicrobials. On the other hand, the National Centre for Disease Control and Prevention estimated that approximately one-third of all outpatient antibiotic prescriptions were unnecessary2,3. Al-Haroni & Skau in 2007 analysed268 834 prescriptions issued by 4765 dentists and showed that the dentists’ prescriptions of antibiotics contributed 8% of the total national consumption in Norway6.
Yingling et al. in 2002 concluded that the majority of the members of the AAE were selecting the appropriate antibiotic for use in orofacial infections, but there were still many who are prescribing antibiotics inappropriately7.
Antibiotic prescribing may be associated with unfavourable side effects ranging from gastrointestinal disturbances to fatal anaphylactic shock and development of resistance. Cars et al. in 2001, concluded that Spain had one of the highest antibiotic consumption rate in Europe, therefore, has the highest percentages of bacterial resistance9.
The increasing resistance problems of recent years are probably related to misuse of broad-spectrum agents such as cephalosporins and fluoro-quinolones. We now have entered an era where some of the bacterial species are resistant to the full range of antibiotics. The methicillin-

2 Indian Journal of Public Health Research & Development. April - June, 2012, Vol. 3, No. 2
resistant Staphylococcus aureus being the most widely known example of extensive resistance4. Dentistry’ contributes to the problem of antibiotic resistance substantially, because dentists prescribe approximately 10% of all common antibiotics.
To our best knowledge, data of antibiotic prescription by Gujarati Oral Surgeons & Endodontists is scarce. Therefore, this study was carried out to determine antibiotic prescription trends among them.
MethodologyA cross sectional survey was conducted in the state of Gujarat which included all the Oral Surgeons & Endodontists. Candidates were requested to answer a one-page questionnaire which surveyed the pattern of use of antibiotics in the treatment of endodontic infections. The questions were based on the previous surveys developed in the USA (Whitten et al. 1996, Yingling et al. 2002) and Spain (Rodriguez-Nunez et al. 2009). Seventy questionnaires were delivered to the Oral Surgeons & Endodontists of Gujarat. Only 59 questionnaires were returned completed (84%).
A database was created for further analysis, using version 15.0 of the Statistical Package for Social Sciences (SPSS; SPSS Inc., Chicago, IL, USA). Data description was carried out by frequency tables. When obtaining the numerical representation by percentages, the total number of answers for each query was taken into account. Data was analyzed using descriptive statistics, chi square test of independence and logistic regression. Statistically significant differences were considered for P < 0.05.
ResultsThe demographics of the respondents are described in the Table 1. Male respondents accounted for 49% and females 51% of the total. Seventy six percent of the respondents were less than 36 years old and11% more than 45 years old. The mean age of the respondents was 34 years. The average duration of antibiotic therapy was 7.0 ± 1.0 days (Fig. 2). The standard deviation in this response indicated that majority prescribed for a period of 6 to 8 days. There were no significant differences amongst respondents in relation with age and gender. Most of respondents (95%) chose amoxicillin in non-allergic patients (Table 2), alone (40%) or associated to clavulaunic acid (61%). Amoxicillin/Clavulaunic acid 875/125 mg was prescribed as first choice antibiotic by 42% of respondents, where as 18%, 9%, 3% and 1%selected amoxicillin 750 mg, amoxicillin 500 mg, clindamycin and metronidazole, respectively. The first drug of choice for patients with an allergy to penicillin was clindamycin 300 mg (65%), followed by azithromicyn (15%) and metronidazole (13%) (Table 3). Table 4 lists the percentage of respondents who prescribed antibiotics for various pulpal and periapical diagnoses. For cases
of irreversible pulpits with moderate/severe symptoms and irreversible pulpitis with acute apical periodontitis and moderate/severe symptoms, 32% and 54% of respondents, respectively, prescribed antibiotics. In cases of a necrotic pulp, chronic apical periodontitis, no swelling and no other symptoms, antibiotics were prescribed by 31%. In the scenario of necrotic pulp, acute apical periodontitis, moderate/severe symptoms but no swelling, 71%prescribed antibiotics. For a case of necrotic pulp, chronic apical periodontitis,asymptomatic but with asinus tract, 60% prescribe antibiotics. In the case of a necrotic pulp, acute apical periodontitis, swelling and other moderate/severe symptoms, 95% of respondents prescribed antibiotics.
DiscussionIn our study, the questions and the six endodontic treatment situations proposed were based on those asked in previous surveys developed in the USA(Whitten et al. 1996, Yingling et al. 2002)and Spain (Rodriguez-Nunez et al. 2009). The overall response rate of 84% can be considered to be an acceptable rate of return for surveys. In relation with antibiotic therapy, an endodontic infection must be persistent or systemic to justify the need for antibiotics, i.e. fever, swelling, lymphadenopathy, trismus or malaise in a healthy patient (Yingling et al. 2002). Endodontic infections typically have a rapid onset and short duration, 2–7 days or less, particularly if the cause is treated or eliminated(Pallasch 1993). The average length of antibiotic prescriptions in this study was 7.0 ± 1.0 days, in accordance with the result (6.8 days) reported previously by Rodriguez-Nu´n˜ez et al. (2009) amongst Spanish Endodontists. The proper dose and duration of an antibiotic are enough when there is sufficient evidence that the patient host defenses have gained control of the infection. When the infection is resolving or has resolved, then the drug should be terminated (Pallasch 1993, Yingling et al. 2002). A 6- to7-day course would probably be appropriate for most endodontic infections. An antibiotic loading dose should be used whenever the half-life of the antibiotics longer than 3 h or whenever a delay of 12 h or more is unacceptable to achieve therapeutic blood levels (Montgomery & Kroeger 1984). Confusion about prescribing antibiotics and inappropriate prescribing practices, however, were reported by respondent dentists. The majority of endodontic infections resolve in 3–7 days (Epstein et al.2000); thus, the18.0% of respondents who routinely prescribe antibiotics for more than 7 days should reassess how they prescribe antibiotics.
The first drug of choice for patients with an allergy to penicillins was clindamycin (65%), in accordance with the result previously found amongst Spanish Endodontists (63%) (Rodriguez-Nu´n˜ez et al. 2009). In the United States, the study of Whitten et al. (1996) reported a 21.6% for clindamycin as first choice antibiotic, but the study

3Indian Journal of Public Health Research & Development. April - June, 2012, Vol. 3, No. 2
carried out by Yingling et al. (2002) found a percentage (57.03%) similar to that reported in this study.
Conclusions The majority of the Oral Surgeons & Endodontists in Gujarat were selecting the appropriate antibiotic for use in endodontic infections, but there are still many who are prescribing antibiotics in appropriately. The use of antibiotics for minor infections, or in some cases inpatients without infections, could be a major contributor to the world problem of antimicrobial resistance.
References1. Pattern of antibiotic prescription in the management of
endodontic infections amongst Spanish oral surgeons. International Endodontic Journal, 2010,43, 342–350,
2. Al-Haroni M, Skaug N. Knowledge of prescribing antimicrobials among Yemeni general dentists. Acta Odontologica
Scandinavica 2006, 64, 274–80.3. NajlaSaeed Dar-Odeh,Khaled. Antibiotic prescribing practices
by dentists: a review. TherClin Risk Manag. 2010; 6: 301–306.4. Lewis MA. Why we must reduce dental prescription of
antibiotics: European Union Antibiotic Awareness Day. Br Dent J. 2008;205(10):537–538
5. Pallasch TJ. Global antibiotic resistance and its impact on the dental community. Journal of the California Dental Association. 2000 28, 215–33.
6. Al-Haroni M, Skaug N. Incidence of antibiotic prescribing in dental practice in Norway and its contribution to national consumption. Journal of Antimicrobial Chemotherapy 2007, 59, 1161–6.
7. YinglingNM, Byrne BE, Hartwell GR. Antibiotic use by members of the American Association of Endodontists in the year 2000: report of a national survey. Journal of Endodontics 2002; 28, 396–404.
8. Slaus G, Bottenberg P. A survey of endodontic practice amongst Flemish dentists. International Endodontic Journal 2002,35, 759–67.
9. Cars O, Molstad S, Melander A. Variation in antibioticuse in the European Union. Lancet 2001;357, 1851–3.

4 Indian Journal of Public Health Research & Development. April - June, 2012, Vol. 3, No. 2
Histoplasmosis of the periodontium – An uncommon conditionSayan Mukherjee1, Anshul Garg1, Debabrata Kundu2
1Post Graduate Trainee, 2Professor and Head, Department of Periodontics, Dr. R. Ahmed Dental College & Hospital, Kolkata
AbstractHistoplasmosis is caused by the fungus Histoplasma capsulatum, a dimorphic fungus that grows in the yeast form in infected tissue. The Periodontium consists of investing and supporting tissue of the tooth: gingival, periodontal ligament, cementum and alveolar bone. This report describes an unusual form of presentation of Histoplasmosis of gingiva including palate and retromolar region, which could have been mistaken as an inflammatory swelling or tubercular ulcer unless histological examination was carried out. The man was non-diabetic & Enzyme-Linked – Immunosorbent assay (ELISA) test for Human Immunodeficiency Virus was negative. During further evaluation the patient was found to have hyponatraemia and bilateral adrenal mass. He developed adrenal crisis and was managed with hydrocortisone and sodium supplementation. He has been successfully treated with Amphotericin B followed by I traconazole. Periodontal treatment includes proper brushing instruction, 0.2%, 10 ml chlorhexidine oral rinse twice daily for 30 days.
Key wordsPeriodontium, Histoplasmosis, Histoplasma capsulatum.
IntroductionHistoplasmosis, a systemic mycosis resulting from inhalation of the spores of the fungus Histoplasma capsulatum, was first described in 1906 in Panama. The organism is found in acidic soils.
Histoplasmosis is clinically classified as a primary acute pulmonary form (usually asymptomatic); a chronic pulmonary form (occurs in the presence of underlying pulmonary disease) and a disseminated form (exclusively in infants, the elderly, and in debilitated or immunocompromised patients). The latter is characterized by the progressive spread of infection to extra pulmonary sites, and the lesions in this form may be extra pulmonary in the oral cavity or intestine.
The disseminated form of histoplasmosis (DH) is most common1 (affected age group over 54 years). In 1985, DH was added to the spectrum of ‘AIDS-defining’ diseases2.
Rare oral lesions are present as ulcer, granulomas or
verrucous and plaque like lesion 3 and have been detected up to 50% of individuals with DH and HIV infection4.
Case ReportA 51-year-old man reported to the Department of Periodontics of Dr. R. Ahmed Dental College and Hospital, with the chief complain of inability to take food for about last 2-3 months due to excessive swollen gums and burning sensation and painful ulceration on palate which started insidiously and increased gradually.
Clinical examination revealed, scattered red and white granulomatous lesions on the gingiva in the right maxillary region (Fig.1) and in the both retromolar regions showing the most extensive involvement (Fig. 2 & 3). The labial gingiva exhibited patches of sloughing epithelium (Fig. 1). The palatal side of right maxillary region showing (Fig. 4) erythematous, ulcerative lesion. Patient’s oral hygiene was poor with moderate to heavy plaque and generalized inflammation.
Patient gave history of smoking and beetle-nut chewing for past 10 years.
Medical history revealed that he was suffering with intermittent low grade fever (100ºF/99ºF) coming every
Fig. 1: Gingival involvement.
Fig. 2: Left retromolar region involvement.

5Indian Journal of Public Health Research & Development. April - June, 2012, Vol. 3, No. 2
week for last one month. There was gradual loss of weight and generalized weakness, cough and cramps in both lower extremities for about last 3 months. Patient gave history of fever and cough 1 year ago, which was treated by local physician. Investigation showed Hb-8.9 gm%, TLC-4200, N-71%, L-24%, M-2%, E-3%, ESR-103 mm/1st hour. His Post Prandial blood sugar was 102 mg%. His Post Prandial blood sugar was 102 mg%. Sputum for AFB was negative.
Routine periodontal treatment include proper brushing instruction, 10 ml, 0.2% chlorhexidine oral rinse twice daily for 1 month and supragingival scaling showed no improvement of the gingival and palatal lesion.
Incisional biopsy was taken from palatal lesion under local anesthesia. Histological examination of the biopsy specimen revealed- section showed multiple fragments of tissue infiltrated by sheets of histiocytes admixed with chronic inflammatory cells. Some of the histiocytes contain fungal bodies resembling Histoplasma capsulatum. Each of these microorganisms was composed of an eosinoplilic core surrounded by a clear halo and showed positive staining with Giemsa, methenamine silver consistent with Histoplasma capsulatum(Fig. 9).
The patient was referred to the School of Tropical Medicine (STM), Kolkata for HIV – Screening test as the diagnosis of Histoplasmosis often follows the diagnosis of HIV – infection2.
The patient was diagnosed as HIV Negative by ELISA.
During further evaluation at STM, the patient was found to have bilateral cervical lymphadenopathy, enlargement of liver upto 4 cms, hyponatremia and bilateral adrenal
Fig. 3: Right retromolar region involvement.
Fig. 4: Palatal involvement.
Fig. 5: Gingival involvement after Treatment.
Fig. 6: Left retromolar region involvement after treatment.
Fig. 7: Right retromolar region after treatment.
Fig. 8: Palatal view after treatment.
Fig. 9: Histopathological section showing yeast form of Histoplasma.

6 Indian Journal of Public Health Research & Development. April - June, 2012, Vol. 3, No. 2
mass in Ultrasonography of abdomen. Bone marrow has been aspirated and sent for fungal culture which showed growth of fungus.
The patient developed adrenal crisis and was managed with hydrocortisone and sodium supplementation. He has been successfully treated with Amphotericin B followed by Itraconazole (Fig 5 to 8).
DiscussionHistoplasmosis is a potentially serious condition. The occurence of oral manifestation of histoplasmosis in non-HIV infected patients has been demonstrated in several case reports 4and in case series. Padhye et al (1994) described oral histoplasmosis cases from India5. Studies demonstrate the extremely low prevalence of oral histoplasmosis in South – East Asia.
In conclusion, histoplasmosis, particularly oral histoplasmosis, seems to be rare in HIV-negative individuals of south and southeast region of Asia. Diagnosis depends on demonstration of the organisms by histology and culture of tissue specimens. Definitive diagnosis is usually made by a combination of culture, detection of the organism in tissues, measurement of
antibodies, or detection of antigen. (last two tests are not available here.) Therapy is achieved by administration of Amphotericin B followed by Itraconazole or Itraconazole6.
References1. Ng KH, Siar CH. Review of oral histoplasmosis in Malaysians.
Oral Surg Oral Med Oral Pathol Oral Radiol Endod 1996;81: 303-307.
2. Wheat LJ, Slama TG, Norton JA, Kohler RB, Eitzen HE, French ML. Risk factors for disseminated and fatal hisoplasmosis. Ann I Med 1982; 96: 159-163
3. Prabhu SR, Wilson DF, Daftary DK et al (eds). Oral diseases in the Tropics. Oxford : Oxford Medical Publications 1992; 169-171.
4. Siwamogstham P, Reichart PA, Thosaporn W, Prapamonton N. Oral histoplasmosis associated with HIV Disease: Report of two cases from Thailand. Oral Bioscience Medicine. 2005; 4 : 253-257
5. Padhye AA, Pathak AA, Katakar VJ, Hazare VK, Kaufman L. Oral Histoplasmosis in India : A case report and an overview of cases reported during 1968-1992. J Med Vet Mycol 1994; 32: 93-103.
6. Wheat L J, Freifeld A G, Kleiman M B et al. Clinical Practice Guidelines for the Management of Patients with Histoplasmosis: 2007 Update by the Infectious Diseases Society of America. Clinical Infectious Diseases 2007; 45:807–25

7Indian Journal of Public Health Research & Development. April - June, 2012, Vol. 3, No. 2
Operationalisation and Utilisation of AYUSH Clinics in Chandigarh, India: A cross sectional evaluation studyGursimer Jeet1, Arun K Aggarwal2
1MPH, 2Professor, Community Medicine, School of Public Health, Post- Graduate Institute of Medical Education and Research, Chandigarh, India
AbstractNational Rural Health Mission (NRHM) strategy of mainstreaming AYUSH health facilities, require evaluations for continual improvement.
ObjectivesTo assess operationalisation and utilization of AYUSH clinics, to ascertain the level of patient satisfaction, to explore the perceptions of AYUSH practitioners regarding implementation of AYUSH scheme and to assess the factors influencing AYUSH scheme implementation.
Material and MethodsCross-sectional study design and mixed methodology was followed that included record review, and interviews with AYUSH service users and the service providers, of both Allopathic and AYUSH streams.
ResultsAYUSH system has been implemented successfully in Chandigarh and people are using these services. Females, prior users of allopathic medicine and suffering from chronic problems were the main users. Client satisfaction with service provision by AYUSH clinics was high. However, allopathic practitioners are not much enthusiastic about recognizing these systems as scientific therapies. More publicity about AYUSH in the region is required as the main goal of integration is not being fulfilled.
Key WordsAYUSH, Ayurveda, NRHM, Health, Evaluation.
IntroductionNational Rural Health Mission (NRHM) envisaged total functional integration between AYUSH dispensaries/hospitals with the allopathic system to improve access to wider spectrum of treatments at affordable costs1. There is a need for evaluation and conduct surveys to understand the lacunae in service delivery.2 Therefore this study was conducted with the objectives to know how successful Chandigarh health sector has been in achieving mainstreaming of AYUSH systems under
the NRHM umbrella, what are the satisfaction levels of patients regarding these services, how allopathic as well as AYUSH practitioners perceive the scheme and what are the underlying factors affecting the implementation of this scheme in Chandigarh.
Material and MethodsStudy design and sampling: Cross sectional study was done during August 2009 – December 2010, in two community health centres, where both allopathic clinics and AYUSH clinics (NRHM) were operational under one roof. Study participants were a) The AYUSH practitioners employed under NRHM by Chandigarh administration and their collocated allopathic counterparts and b) patients attending AYUSH clinics. Sample size of 96 patients was calculated for patients interview, based on the assumption of 60% patient satisfaction level 3, 95% confidence level, and beta error of 5%. A total of 100 patients available at the institutional level were interviewed.
Study tools and their administration: Self-administered questionnaires were given to the doctors of both the streams to explore their perceptions regarding the AYUSH scheme. Questionnaire for AYUSH doctors had questions on overview about various issues pertaining to the work pattern, constraints faced, if any, etc. For Allopathic doctors, 5-item semi-structured questionnaire was administered to know their perceptions on the integration of AYUSH systems, their attitude towards cross-referral between two systems, trainings and their role in health service provision to the community.
Interview schedule was administered to the patient respondents. It covered the socio demographic profile of the respondents, followed by a brief history of the disease for which the patient attended the AYUSH clinic and allopathic treatment, if taken. Questions on the satisfaction levels of patients regarding services available at the clinic, attitude of doctors, infrastructure and maintenance of the clinic were also included in the schedule in addition to their willingness to recommend these services to their friends and relatives etc. Likert scale in the form of money scale was used to record the satisfaction levels of the patients. Each item statement was read to the patient, who would indicate his/her level of agreement with the statement by mentioning a money

8 Indian Journal of Public Health Research & Development. April - June, 2012, Vol. 3, No. 2
amount. The interview schedule contained 12 items.
Record review was done to get information regarding utilization of the AYUSH scheme. All the information sought from the officials was marked in the checklists. Morbidity data of AYUSH as well as Allopathic clinics was compiled from the records.
The study was approved by Institutional ethics committee and informed consent was obtained from all participants.
ResultsInfrastructure and operationalisation
Set up of the AYUSH clinics was as per Indian Public Health Standards (IPHS) except for posting of AYUSH specialist and space for pharmacy cum store in one CHC (Table 1).
AYUSH professionals were involved in various health societies, but their involvement in the national health programmes was very minimal. They had received some trainings on some programmes and they were involved in conducting health educational activities such as organisation of AYUSH Melas, health camps etc. There were not involved in planning, and managerial functions at the CHC levels.
Socio-economic and morbidity profile of the patients
Socioeconomic profile of the patients is given in Table 2. Ayurvedic clinics catered to 30.6 per cent of the total patient load whereas, 68.6 per cent of the patients were registered at homeopathic clinics of these centres.
One year (2009-10) morbidity analysis revealed that more patients attended these clinics for chronic problems (Figure 1). Homeopathy was more popular for allergic/ skin disorders, whereas, Ayurvedic stream was preferred for joint problems and digestive system/diarrhoeal diseases (17.9%). Ranking of morbidity, body system wise was done and top 10 ailments in both allopathic and AYUSH streams are given in Table 3. Whereas, allopathic systems were preferred for surgical and orthopaedic problems requiring acute care or for infections, AYUSH systems were preferred for chronic skin problems and joint problems.
Record review for the period of three months (January- March, 2010) revealed only 17 per cent of patients used AYUSH services. Over the period of three months, old registration was more in Ayurvedic and Homeopathic streams as compared to Allopathy and; more females attended AYUSH as well as Allopathic clinics than males. (Figure 2)
77 per cent (95% CI 67.5-84.8) of the patients had taken allopathic treatment for the same health problem and 29 per cent of them had taken the allopathic medicines for
Table 1: IPHS Standards Compliance Chart of AYUSH clinics
Services to be delivered at CHC:
IPHS Standards:
Status at selected health
centres:
AYUSH Specialist (Post-graduate in AYUSH)
One None
AYUSH General duty Medical Officer (Graduate in AYUSH)
One One each clinic.
AYUSH Pharmacist One One each clinic.
Pharmacy cum store 6.4 x 3.2 m CHC 1: 2.5 x 3 mCHC 2: 6 x 3 m
Space for each AYUSH doctor’s room
3.2 x 3.2 m CHC 1: 4 x 3 mCHC 2: 5 x 4 m
AYUSH drugs As per the list in annexure
Available as per the list.
Table 2: Socioeconomic characteristics of the patients attending AYUSH clinics (n= 100)
Characteristics Percentage of population
Age (years)
0-10 years 8
11- 20 years 14
21-30 years 21
31-40 years 28
41- 50 years 15
51- 60 years 7
61-70 years 6
71-80 years 1
Sex
Male 27
Female 73
Occupation
House wife 51
Business 4
Government job 11
Laborer 1
Non worker 14
Private job 19
Level of education
Illiterate 10
Primary education 23
Higher secondary 12
Matriculation 20
Graduation 24
Post graduation 10
Figure 1: Bar diagram representing comparative morbidity profile of patients of AYUSH clinics

9Indian Journal of Public Health Research & Development. April - June, 2012, Vol. 3, No. 2
years altogether, before switching over to AYUSH clinic. Out of the patients who had availed allopathic treatment before, 73 per cent (95% CI 63.2- 81.4, n=77) of them did not tell their allopathic practitioner about the switchover to AYUSH. Sixty five per cent (95% CI 53.8-73.4) of total patients were referred to these clinics. Of these 49% (95% CI: 53.8-73.4) of the referrals were made by friends/relatives. Only 4% of the referrals were made by allopathic doctors. Among patients, who were not referred by anyone, source of information was variable, with 24 % coming on their own, and receptionist sending 11% (95%
CI: 5.6- 18.8) of the patients due to non-availability of an allopathic doctor. Advertisements (newspapers and televisions) contributed 8% of the patients who had come to the clinic without any referral. Only 1% of the patients came by reading the information board displayed in the dispensary.
Why a switch over?
Side effects and non-effectiveness of the allopathic medicines were quoted as the major reasons for switching over from allopathic to AYUSH clinic, by 40% and 54% of the patients respectively. Only 3% of the patients cited non-satisfaction with allopathic doctor’s behaviour as the reason for switching over to AYUSH clinic. 51% (95% CI: 40.8-61.1) of the patients attending clinic had no prior experience of AYUSH system of medicine.
Satisfaction level of patients with different aspects of services being provided
High satisfaction to the level of above 80% was expressed by patients regarding doctor’s communication with respect to diagnosis, treatment plan, follow up plan, and precautions need to be taken; however regarding medicines being provided, less than half of the patients were satisfied to this much extent (Table 4).
DiscussionThis study conducted to assess the status of operationalization of AYUSH scheme in Chandigarh, its utilisation by patients and perceptions of AYUSH and Allopathic practitioners about the scheme has given some important insights.
First, Chandigarh is on track for mainstreaming AYUSH, by putting necessary infrastructure and manpower in place. Involvement of AYUSH practitioners in various national health programmes and health educational activities is an encouraging sign. Major shortfalls in the operationalization of the AYUSH scheme are that; specialists in the AYUSH stream have not been engaged as yet, and medicine supplies are not sufficient. According to the IPHS standards there should be at least one specialist in each AYUSH dispensary2. Consequently, speciality services like Panchkarma, Ksharasutra, etc. are not being provided by these facilities and the AYUSH doctors are merely functioning as general practitioners. Unlike an unpublished report on mainstreaming of AYUSH in four states of India in 20094, there are no major bottlenecks with respect to infrastructure, manpower and materials except for having more medicines and specialists.
Secondly, patient satisfaction with AYUSH services was found to be very high. There seems to be no major issue with respect to sitting place, cleanliness and examination facilities. However, not many were satisfied with the medicines and with the ultimate relief from the problem they were suffering with.
Most of these patients shifted to AYUSH after trying
Table 3: Utilisation of Allopathic and AYUSH clinics for top 10 disease categories
Ranking Allopathic system AYUSH system
1st Women diseases (Mainly pregnancy related problems and deliveries) followed by infections.
Others (A major chunk of patients is put under this category, which do not fit in other well-defined categories.)
2nd Surgical, Eye and ENT problems (Abcess, cysts, cataract operations)
Skin diseases(Chronic problems)
3rd Orthopaedics (Fracture patients followed by arthritis)
Orthopaedics (Chronic problems, mainly age related changes)
4th Gastric diseases (Mainly infectious conditions e.g. diarrhoea, enteric fever, bacillary dysentery etc.)
Pyrexia of unknown origin
5th Diabetes, Hypertension, Stroke, CAD (Constitute first line of treatment followed by patients)
Gastric diseases (Chronic problems like malabsorption, indigestion)
6th Upper and lower respiratory tract infections
Upper and lower respiratory tract infections
7th Pyrexia of unknown origin (Acute problems)
Women diseases (Chronic problems like menorrhagia, dysmenorrhia)
8th Road traffic accidents Surgical, eye, ENT problems (No surgical treatment being provided.Mostly chronic age related changes.)
9th Infectious diseases Diabetes, hypertension, Stroke, CAD
10th Skin diseases Infectious diseases(like Japanese Encephalitis)
Figure 2: Comparative utilization of Allopathic and AYUSH services by adult males and females.

10 Indian Journal of Public Health Research & Development. April - June, 2012, Vol. 3, No. 2
allopathic treatment. This may have happened due to greater and reliable access to this alternate treatment. However, inability to provide relief to these patients may initiate reverse referral. Non relief may be due to non-availability of specialist doctors and specialised treatment therapies.
Thirdly, study has further shown poor referral by allopathic doctors. It may be due to their misperceptions and non-orientation to AYUSH system5. In our study also one of the allopathic doctors expressed his distrust for AYUSH system. Such perceptions can be changed through sensitization workshops and repeated dialogues6.
There are some noteworthy observations regarding extent of AYUSH service utilisation and the factors influencing the utilisation. Annual AYUSH clinics utilisation of 17 per cent was less than the utilisation of CAM use in Singapore7 Israel8, Japan9 and India10. In our study, there was higher usage of Homeopathy as compared to the Ayurvedic system, contrary to other available evidences where Ayurveda was found to be more popular11.
Increased utilisation of AYUSH services over time may reflect their dissatisfication in some way with conventional treatment7. More than three-fourth of the patients in the present study had taken allopathic medicines and were dissatisfied, prior to shifting over to the AYUSH systems. Higher cost of treatment was not the major reason for switching over to other systems. In the present study, more than half of the patients were found to have switched over to AYUSH systems of medication due to the non-effectiveness of the allopathic medicine, whereas 40% did so due to their side effects. Modern medicine is considered to bring only symptomatic improvement and is not curative of the underlying problem10. Patients while shifting, preferred not to inform their allopathic doctors, as was observed in other studies7,12,13.
Patients with chronic diseases were found to be more likely
to use AYUSH services, as was found in other studies14,15. For pregnancy related issues and deliveries, women had to resort to the co-located allopathic system. AYUSH practitioners were neither providing any emergency services nor any specialized services to patients.
Education has inconsistent association with use of CAM 9,12,16,17. Our findings of higher AYUSH use among lower income groups, was also inconsistent with the other available evidence18. It may be due to overall lack of utilization of public services by high income group population.
In conclusion, AYUSH systems of medicines have been implemented successfully in Chandigarh and people are using these services. There is need to generate more awareness among allopathic practitioners, and appoint specialist AYUSH practitioners.
Conflict of interest: None declared
Funding: None
References1. MoHFW.India. AYUSH in national health care. [Press release]:
Press Information Bureau 2007 [updated August 13]; Available from: http://pib.nic.in/release/rel_print_page.asp?relid=29845.
2. MoHFW. India. Mainstreaming AYUSH, revitalizing local health traditions under NRHM- an appraisal of the annual state programme implementation plans 2007-10 and mapping technical assistance needs New Delhi: National Health Systems Resource Centre; 2009.
3. WHO Traditional Medicine Strategy- 2002-2005. Geneva: World Health Organization; 2002.
4. Mutatkar RK, Arole RS. Mainstreaming of AYUSH in Health Care (NRHM) Studies in Himachal Pradesh, Madhya Pradesh, Chhattisgarh and Maharashtra. 2009.
5. Ernst E. Obstacles to research in complementary and alternative medicine. Med J Aust. 2003 Sep 15;179(6):279-80.
6. Bhat S, Gupta V, Srikanth N, Lavekar GS. Feasibility of integrating Ayurveda with modern system of medicine in a
Table 4: Degree of patient satisfaction in relation to various quality parameters (n=100)
S. No. Parameters measured 1-20 paisa 21-40 paisa 41-60 paisa 61-80 paisa 81paisa-1Re
1. With the doctor’s communication with respect to
a. Diagnosis 0% 1% 5% 17% 77%
b. The treatment plan 1% 2% 10% 19% 68%
c. The follow up plan 0% 2% 5% 31% 62%
d. The precautions that need to be taken 2% 3% 8% 26% 50%
2 With the medicines given* 1% 1% 17% 25% 44%
3 With sitting place in clinic 0% 5% 10% 36% 49%
4 With the cleanliness 0% 2% 11% 38% 49%
5 With the examination facility 0% 0% 10% 29% 61%
6 Relief felt from the problem** 4% 17% 19% 26% 11%
7 Will come again to avail services here 1% 2% 34% 55% 8%
8 Will recommend this treatment to others 1% 3% 31% 57% 8%
9 Overall satisfaction with AYUSH doctor’s services at the health centre
0% 0% 16% 44% 40%
*12% did not respond** 33% gave no response (or had just started treatment)

11Indian Journal of Public Health Research & Development. April - June, 2012, Vol. 3, No. 2
tertiary care hospital for management of osteoarthritis (knee)- An operational Study. New Delhi: Central Council for Research in Ayurveda and Siddha.2007.
7. Lee G, Charn T, Chew Z, Ng T. Complementary and alternative medicine use in patients with chronic diseases in primary care is associated with perceived quality of care and cultural beliefs. Family Practice. 2004 December 1, 2004;21(6):654-60.
8. Kitai E, Vinker S, Sandiuk A, Hornik O, Zeltcer C, Gaver A. Use of complementary and alternative medicine among primary care patients. Family Practice. 1998 October 1, 1998;15(5):411-4.
9. Sato T, Takeichi M, Shirahama M, Fukui T, Gude JK. Doctor-shopping patients and users of alternative medicine among Japanese primary care patients. Gen Hosp Psychiatry. 1995 Mar;17(2):115-25.
10. Singh V, Raidoo DM, Harries CS. The prevalence, patterns of usage and people’s attitude towards complementary and alternative medicine (CAM) among the Indian community in Chatsworth, South Africa. BMC Complement Altern Med. 2004 Feb 4;4:3.
11. Lodha R, Bagga A. Traditional Indian systems of medicine. Ann Acad Med Singapore. 2000 Jan;29(1):37-41.
12. MacLennan AH, Wilson DH, Taylor AW. Prevalence and cost of alternative medicine in Australia. Lancet. 1996 Mar 2;347(9001):569-73.
13. Shih V, Chiang JY, Chan A. Complementary and alternative medicine (CAM) usage in Singaporean adult cancer patients. Ann Oncol. 2009 Apr;20(4):752-7.
14. Al-Windi A. Determinants of complementary alternative medicine (CAM) use. Complement Ther Med. 2004 Jun-Sep;12(2-3):99-111.
15. Fouladbakhsh JM, Stommel M. Gender, symptom experience, and use of complementary and alternative medicine practices among cancer survivors in the U.S. cancer population. Oncol Nurs Forum. 2010 Jan;37(1):E7-E15.
16. Eisenberg DM, Kessler RC, Foster C, Norlock FE, Calkins DR, Delbanco TL. Unconventional medicine in the United States. Prevalence, costs, and patterns of use. N Engl J Med. 1993 Jan 28;328(4):246-52.
17. Astin JA. Why patients use alternative medicine: results of a national study. JAMA. 1998 May 20;279(19):1548-53.
18. Kumar D, Bajaj S, Mehrotra R. Knowledge, attitude and practice of complementary and alternative medicines for diabetes. Public Health. 2006 Aug;120(8):705-11.

12 Indian Journal of Public Health Research & Development. April - June, 2012, Vol. 3, No. 2
ABO blood group and secretor status in IHD patientsAshwini D. Pujari1, Dinanath K. Pujari2
1Asst. Professor, Dept. of Physiology, MRMC, Gulbarga, 2Asst. Professor, Dept. of Anatomy, MRMC, Gulbarga, Karnataka
AbstractVarious studies have been done trying to relate ABO blood groups with diseases e.g. Peptic ulcer, duodenal ulcer, pernicious anaemia, gallstones, carcinoma of stomach and IHD. The same blood group antigens are secreted in the body fluids. The blood group antigens have protective action on its secreting mucosa. Some studies have related secretor status with various diseases. Very few studies have been done in India, to relate IHD with ABO blood groups and secretor status. The present study was undertaken to determine, whether the correlation exists between IHD and ABO blood group and secretor status.
Two hundred IHD patients admitted in SJIC, Bangalore were studied for blood group and secretor status and compared with age and sex matched controls. Among the control group ‘O’ was most common while in the IHD patients, an overall excess of blood group ‘A’ was found. In the gender difference serum HDL values were significantly higher in females than males. Serum triglyceride values were significantly higher in blood group ‘A’ compared to other groups. IHD cases have been divided into MI and non MI group and its relation has been observed with blood group. There was significant excess of Myocardial infarction in blood group ‘O’ and ‘B’.
In this study we have not observed any significant relation of IHD with secretor status.
Key WordsIschemic Heart Disease; ABO Blood group; secretor status.
IntroducitonABO agglutinogens are not strictly confined to the red cells alone but they could also be demonstrated in other body tissues and are secreted in body fluids. The presence of A and B antigens in the saliva of A and B group individuals, was first discovered in 1930 by Lehr and Putkomen who classified the world population into two groups, secretors and non-secretors.
Obesity, dyslipidemia, hypertension, diabetes mellitus, smoking, stress, sedentary lifestyle and genetic factors are some well known risk factors for IHD. Considering ABO blood group phenotype and secretor status as a part of the genetic factors, this study was undertaken to
observe the influence of genetic factors on IHD.
Knowledge of secretor status can be applied for tissue transplantation among other applications. Numerous studies have been reported, correlating the frequency of diseases with the ABO blood groups and secretor status.
Several studies have suggested with the ABO blood group phenotype and secretor status of individuals are associated with an increased risk of Ischaemic Heart Disease. Ischaemic Heart Disease has emerged as the number one killer disease, the world over, including India. The association between ABO blood group and secretor status and IHD in India, was recognized as an important lacuna to be filled. Hence, the need for such a study.
Material and MethodsSubjects recruited for this study were Ischeamic Heart Disease (IHD) patients, in Sri Jayadeva Institute of Cardiology, Bangalore, Karnataka. Patients were diagnosed by cardiologist on the basis of clinical history, ECG, blood investigations, enzyme markers and angiography. Two hundred patients were studied, one hundred and sixty were males and forty were females, in the age group of 35 to 65 years. IHD patients with other systemic disorders (eg. CVA, COPD, endocrine disorders) except Diabetes Mellitus and Hypertension were excluded.
Blood group of volunteer blood donors in the St. Martha’s hospital and Sri Jayadeva Institute of Cardiology blood bank, Bangalore, Karnataka were included as controls. Two hundred blood donors (age and sex matched) with no evidence of any disease were included in the control group.
ABO blood group: ABO blood group was determined, using slide agglutination technique1. Secretor status was examined using the agglutination inhibition technique1.Saliva was collected in between 9 AM to 11AM. before breakfast after rinsing the mouth. The sample was examined within one hour.
If the blood group antigens are present in saliva, when an appropriate antiserum is added to it, an antigen – antibody reaction occurs. The antibodies in the serum neutralise the antigens in saliva. When a red cell suspension of the same blood group is now added to this mixture, there is no agglutination due to previous inhibition of the antiserum. Thus in the case of secretors

13Indian Journal of Public Health Research & Development. April - June, 2012, Vol. 3, No. 2
there will be no agglutination seen. In the case of non-secretors, there will be an agglutination reaction.
Lipid profile: Total serum cholesterol, serum triglycerides, low density lipoproteins (LDL) and high density lipoproteins (HDL), were estimated in milligram percent, using the autoanalyser, (Hitachi LTD – Tokyo – Japan 704-1703 Sr. No. 0391 – 1) and expressed in milligram percent. The hemoglobin percent was done by laboratory technician and reports were collected from laboratory. Statistical analysis done using SPSS version-10.6. One-way analysis of variance (ANOVA) and the Chi-square tests were used to analyze the data.
ResultsDistribution of ABO blood group in the case group was; ‘O’ group 88(44%), ‘B’ group 66 (33%), ‘A’ group 37 (18.5%) and ‘AB’ group 9 (4.5%).Among the control group blood group ‘O’ is the commonest followed by B, A and AB. In IHD group, overall the number of patients with blood group ‘O’ were highest. Compared to controls, there was an overall excess of blood group ‘A’ and the difference was statistically significant. There was a significant deficit in blood group ‘O’.
Lipid profile values obtained were higher in females, as compared to males but this difference was statistically significant only for serum HDL.
The mean serum cholesterol level was greater in patients belonging to blood group-A, compared to the other group but this was not statistically significant.
The mean serum triglycerides level was greater in patients belonging to blood group-A, compared to the other groups and this was statistically significant.
The mean hemoglobin level was 13.19+-1.84 gm%.
The chi-square test shows, that the difference between patients presenting with myocardial infarction, versus those without infarction was statistically significant. There was a significant excess of ‘O’ in patients with myocardial infarction.
Lipid profile showed higher values for serum cholesterol, serum triglycerides and LDL in secretors, compared to nonsecretors but this was not statistically significant.
DiscussionThe controls in our study showed a proportionate frequency of the ABO blood groups as follows: the maximum number belonged to the ‘O’ group (44%), followed by ‘B’ group (33%), ‘A’ group (18.5%) and ‘AB’ group (4.5%). This is similar to the findings of KRC Naidu in Bellary, Karnataka2.
In the IHD group, the overall frequency of ‘O’ group was higher (38.5%), followed by ‘A’ (31%), ‘B’ (23%) and ‘AB’ (12.5%) groups. As compared to the controls, an overall excess was found in ‘A’ group and an overall deficit in the ‘O’ group.
The frequency of secretors noted was 73.29% and of nonsecretors 26.71%, in the control population. In our study, in the IHD group 77.5% were secretors and 22.5%
Table I: Distribution of ABO blood group among controls and IHD cases
Blood Group Observed number (O)
Expected number (E)
O – E
OCases 77 82.5 -5.5
Controls 88 82.5 +5.5
ACases 62 49.5 +12.5*
Controls 37 49.5 -12.5
BCases 46 56 -10
Controls 66 56 +10
ABCases 15 12 +3
Controls 9 12 -3
Table II: Lipid profile in different blood groups in IHD patients(One-way ANOVA)
Blood group
Lipid profileSerum
cholesterol (mg%)
Serum triglycerides
(mg%)
LDL (mg%) HDL (mg%)
On=77
191 + 44.1 191.9 + 9.5 119.3 + 38.5 32.9 + 5.9
An=62
201.1 + 30.7 242.2 + 105.2* 121.2 + 32.5 32.6 + 6.3
Bn=46
191.8 + 41.2 165.5 + 65.9 128.9 + 33.9 30.2 + 8.2
ABn=15
181.6 + 31.6 180.9 + 87.7 140.9 + 45.1 32.9 + 6.3
Table III: Distribution of IHD patients in MI and Non-MI groups
Blood group
IHD Group
Observed number (O)
Excepted number (E)
O –E
On=77
MI 50 38.5 +11.5*
Non-MI 27 38.5 -11.5
An=62
MI 37 31 +6
Non-MI 25 31 -6
Bn=46
MI 30 23 +7**
Non-MI 16 23 -7
ABn=15
MI 9 7.5 +1.5
Non-MI 6 7.5 -1.5
Table IV: Distribution of male IHD patients in MI and Non-MI groups
Blood group
IHD Group
Observed number (O)
Excepted number (E)
O –E
O n=63MI 41 31.5 +9.5*
Non-MI 22 31.5 -9.5
A n=48MI 31 24 +7**
Non-MI 71 24 -7
B n=38MI 27 19 +8***
Non-MI 11 19 -8
AB n=11MI 7 5.5 +1.5
Non-MI 4 5.5 -1.5

14 Indian Journal of Public Health Research & Development. April - June, 2012, Vol. 3, No. 2
were nonsecretors. This was similar to the findings in other studies in India and western countries3,4.
Age and gender are considered to be risk factors for atherosclerosis. Males are at a higher risk than female but the gap between sex narrows, as age increases.
The human male in his early and mid-adult years, is several times more likely to develop atherosclerosis than the female, suggesting that the male sex hormones might be atherogenic or conversely, that female sex hormones might be protective. In our study it was observed that 80% were males and 20% were females.
Experimental studies suggest that excess blood levels of iron can lead to atherosclerosis, perhaps by forming free radicals in the blood that damage the vessel wall5. In our study none of the IHD patients were anaemic.
Blood groups are one of the most prominent inherited characters. Therefore, if genetic factors influence diseases, the susceptibility to IHD should also be reflected in the pattern of blood group distribution. This has been found to be the case by several workers.
Among the control group the blood group ‘O’ was the commonest, while in the IHD series of patients, an excess of blood group ‘A’ as compared to controls, was found. This agrees with the findings of other workers6,7. In our
study the serum cholesterol was on the higher side in blood group ‘A’ patients, than in other groups but the difference was not statistically significant. The analysis of variance showed that the difference for lipid profile values, between blood groups was statistically significant for serum triglycerides. Serum triglyceride values were higher in blood ‘A’ patients. However there is a less certain association between triglycerides and coronary heart disease (as compared to LDL cholesterol8). O’ Brein and Patton proposed that the reason for the association between ABO blood groups and serum cholesterol levels, may probably be related to the site of cholesterol in the erythrocyte membrane, of which the ABO antigen forms a part and this supposes the ABO locus itself, as the source of association9.
Mehta et.al9, found that blood group ‘A’ neonates have a high serum cholesterol and low serum phospholipid levels. It can be suggested that an increase in cholesterol, which is hydrophobic and a decrease in phospholipid, obstruct the transport of lipids. Thus high serum cholesterol and a low serum phospholipid level should make an individual more prone for development of atherosclerosis in the future. Though our study does not include serum phospholipid estimation, cholesterol levels were found to be higher in group ‘A’ subjects, which supports the above hypothesis.
In our study, there was an excess of blood group ‘A’ and a deficit of blood group ‘O’ among IHD patients and this difference in the two groups was found to be statistically significant. This finding is similar to those reported by Denborough 10, Beg et al7, Srivastava et al 8 and Bronte Stewart et al11. A comparative table of the ABO blood group distribution reported by different authors and in our study is shown below.
Table V: Secretor status in male and female patients
SexSecretor status
Secretors Non-secretors
Male(n=160)
127 (79.4)
33(20.6)
Female(n=40)
28(70)
12(30)
Total 155(77.5)
45(22.5)
Table VI: Lipid profile and secretors status in IHD patients (One-way ANOVA)
Secretor Status Lipid profile Serum Cholesterol (mg%) Serum Triglycerides (mg%) LDL (mg%) HDL (mg%)
Secretors n=155 196 + 40.2 207 + 98.3 125.2 + 38.4 33.3 + 6.2
Non-Secretors n=45 184.8 + 33.2 178.08 + 76.5 118.5 + 29.8 33.29 + 7.9
Table VII: Blood Group Distribution in Various Studies of IHD
StudyBlood Group
Group A B AB O
M. Beg7 et alCases 74 (37%) 69 (34.5%) 9 (4.5%) 48 (24%)
Controls 123 (24.6%) 191 (38.2%) 37 (7.4%) 149 (29.8%)
D.K. Srivastava et. al8 1966Cases 78 (39.4%) 66 (33.3%) 14 (7.1%) 40 (20.2%)
Controls 1995 (21.55%) 3551 (38.36%) 802 (8.66%) 2909 (31.43%)
M A Denborough10 1962Cases n=205 (50%) (11%) (3%) (36%)
Controls n=17,700 (40%) (10%) (3%) (47%)
B Bronte Stewart et al 11 1962Cases 347 (43.7%) 120 (15.1%) 41 (5.4%) 284 (35.8%)
Controls 2443 (38.5%) 828 (13.2%) 376 (6.0%) 2719 (42.3%)
Present study 2005Cases 62 (31%) 46 (23%) 15 (12.5%) 77 (38.5%)
Controls 37 (18.5%) 66 (33%) 9 (4.5%) 88 (44%)

15Indian Journal of Public Health Research & Development. April - June, 2012, Vol. 3, No. 2
On the other hand as these studies were confined mainly to survivors of IHD, the finding could have another interpretation. Group A and B individual are more likely to survive, than group ‘O’7. A large prospective study is required to elucidate this association. The following possibilities may be considered (i) the genetic influence may be operating, by determining the anatomy of coronary vessels, or their liability to the atherosclerotic process or (ii) Group ‘O’ in some unknown way offers a protective substance, which reduces the incidence of coronary heart disease12.
There was an excess of group ‘O’ patients presenting with myocardial infarction. When compared with group ‘A’.
Our results differ from those of Allan13. They found an excess of ‘A’ group patients presenting with MI compared to ‘O’ group patients with IHD. Sweeney et al also found lower level of factor VIII: and vWf: Ag in group ‘O’ which increases bleeding tendency15. The presence of blood group ‘A’ determinants on the vWf locus is known and ‘A’ antigen is also expressed on platelets. The amount of blood group ‘A’ substance on platelets is proportional to the amount present in plasma. The presence of ‘A’ antigen interferes with the interaction between platelets and vWf. In group ‘O’ individuals lacking the A determinant, platelets would aggregate more effectively and occlude the vessels15.
It has been observed, that blood group ‘O’ subjects have lower levels of antihemophilic globulin (factor VIII) and are more likely to bleed. Hence it can be concluded, that atherosclerotic patients with blood group ‘O’, might not tend to thrombose but rather hemorrhage into the arterial walls and sustain more tissue damage, leading to myocardial infarction16.
A recent study reported that ‘non-O’ individuals have higher levels of vWf and fVIII than ‘O’ individuals due to prolonged clearance rates of vWf20.
‘Non-O’ individuals could have a high risk of venous thromboembolism via having greater level of fVIII or vWf. AsfVIII levels are determined mainly by vWf, higher levels of vWf might explain the higher incidence of venous thromboembolism among non-O individuals19.
Small intestinal alkaline phosphatase is known to play an important role in handling of fat. The occurrence of small intestinal alkaline phosphatase activity in serum has been found to depend on the ABO blood group and ABH secretor status of individuals18.
Thus group ‘A’ non-secretors might be more prone to atherosclerosis because serum alkaline phosphatase activity is altered and hence fat metabolism will also be altered in these individuals.
In our study we have not found any significant difference in the secretor status, between the IHD and control group. However the IHD patients show a preponderance of secretors. This result is similar to the finding of Hall
et al in peripheral arteriosclerosis17 and contrasts with Langmans’ results18.
ConclusionThe group ‘A’ individuals appear more prone to IHD. Since the study was conducted in survivors of IHD, the progress of the disease might be slower in group ‘A’ than in ‘O’. The frequency of secretor status was similar in case and control series, indicates no influence of secretor status in IHD in our study.
References1. John V Dacie and Lewis SM .Practical Hematology. 6th edition.
Churchil Livingston 1984.pg 356-359.2. Naidu KRC. The incidence of ABO and RH blood grouping in the
Bellary area-A Random Study. J.Assoc. Physicians India.1973; 21(3):321-2.
3. Dutta AK, Mondal SB.Dutta SB.ABO blood group and secretory status in vitiligo.J.Indian M.A.1969; 53(4):186-189.
4. Sehgal VN,Dube B.Secretion of blood group specific substances in saliva of vitiligo patients. Br.J. Dermatology1967; 79(12):704-05.
5. Guyton and Hall. Textbook of Medical Physiology.10th edition.Saunders Harcourt.India 2000;pg.789.
6. Oliver MF,Cumming RA.Blood groups and heart disease.Brit.Med.J.1962;ii:51.
7. Bronte-Stewart B,Botha MC, Krut LH.ABO blood groups in relation to Ischaemic Heart Dosease. Brit.Med. J.1962;1:1646-1650.
8. Braunald, Fausi, Kasper, Hauser, Longo, Jameson. Harrison’s Principles of Internal Medicine. 14th edition VolumeII.Mc Graw Hill Publication.1998.pg.2142-2143.
9. Mehta MN, Mehta NJ. Serum lipid and ABO blood groups in cord blood of neonates.Indian J.Paediat.1984; 51:39-43.
10. Denborough MA.Blood groups and Ischaemic Heart Disease.Brit. Med.J.1962; 2:927.
11. Beg M, Singh M, Mehmood O, Singh PN, Ahmed SS.A study of ABO blood groups and Ischaemic heart disease in men.INd.J.Physiol. and Allied Sci.2001;55(1):39-42.
12. Srivastava DK,Thakur CP and Das M.ABO blood groups in relation to Ischaemic Heart Disease. Indian Heart J.1966;18:140-149.
13. Allan TM, Audrey A.Dawson.ABO blood groups and Ischaemic Heart Disease. Brit. Heart J.1968;30:377-382.
14. Joseph D. Sweeney, James W Labuzetta,Lynee A. Hoering, John E Fitzpatrick.Platelet function and ABO blood group.Am.J. Clin. Pathol1989; 91:79-81.
15. KingsburyKJ. Relation of ABO blood groups to atherosclerosis.The Lancet1971; 1:199-203.
16. Hall R, Bunch GA, Humphrey CS.The frequencies of ABO blood groups and of Secretors of ABH group substances in peripheral arteriosclerosis. Atherosclerosis1971;14:241-246.
17. Langman MJS,Constantinopoulos A ,Bouchier IAD.ABO blood groups, secretor status and Intestinal mucosal concentrations of Alkaline phosphatase.Nature1968;217:863-65.
18. Ohira T. et al ABO blood group, other risk factors and incidence of venous thromboembolism: the Longitudinal Investigation of Thromboembolism Etiology (LITE). Journal of Thrombosis and Haemostasis.July 2007; 5(7):1455-1461
19. Nossent A.Y. von Willebrand factor and its propeptide: the influence of secretion and clearance on protein levels and the risk of venous thrombosis. Journal of Thrombosis and Haemostasis. July 2006; 4(12):2556-2562

16 Indian Journal of Public Health Research & Development. April - June, 2012, Vol. 3, No. 2
Central Adiposity and General Adiposity as Major Risk Predictors of Various Life Styles Related Diseases especially Hypertension and Type 2 DMBandana SachdevWomen Scientist under DST Project, Biological Sciences Group, 2243 M, Faculty Division II, Birla Institute of Technology and Science (BITS), Pilani, 333031 Rajasthan, India
AbstractThe functional roles of Waist circumference (WC), Waist and hip ratio (W/H ratio) and Body mass index (BMI) as risk factors for hypertension and type 2 diabetes mellitus (DM) in the Nomads Tribal population of Rajasthan State are evaluated in the paper. Four hundred and forty-five participants, aged between 18 to 100 years old are taken as subjects for scientific study. The prevalence of pre-hypertension (34.4%), hypertension (22.5%), prediabetes 5.2 % (n= 23) and diabetes (approximately 3.4 %) (n =15) is noted in the select population. Body mass index, waist circumference, and waist/hip ratio in the study are shown to be associated with type 2 DM and hypertension. Women with W/H ratio > 85+ and men with W/H ratio > 1.0+ are shown to be prone to increased risk of diabetes. And subjects having body mass index (BMI) particularly in the range of (obese) >25 appear to be vulnerable to hypertension. Similarly subjects with greater waist circumferences look to be exposed to hypertension. The study in the paper also supports the observation that both BMI and WC yield almost the same results. The findings suggests that by keeping a check on modifying risk factors like BMI, WC and W/H ratio we can control the prevalence of life styles associated diseases like hypertension and type 2 DM.
Key WordsNomads, adiposities, incidence, SBP, DBP and FBG levels.
IntroductionThe prevalence of type 2 DM is rising throughout the world, most rapidly in populations like India which are undergoing the epidemiologic transition from a mainly rural subsistence economy to an increasingly urban industrial economy1,2. The associations of increased weight and body fat composition with non-communicable diseases, particularly cardiovascular diseases and diabetes, are well established3. Obesity has become a major worldwide epidemic affecting more than 300 million people. It is an important risk factor for type 2 DM, a chronic disorder of carbohydrate, fat, and protein metabolism. From the clinical perspective, visceral adipose tissue is known to generate diabetogenic substance4 and, as such, may be more informative than total fat for diagnostic evaluation.
Body mass index, waist circumference, and waist/hip ratio have been shown to be associated with type 2 DM and hypertension. As expected, epidemiologic studies have demonstrated that these three obesity indicators are strong and consistent predictors of lifestyles related diseases like type 2 DM and hypertension. However, despite the clear, clinical difference between visceral and other forms of fat, little epidemiologic difference would be expected in the relation of diabetes with body mass index versus waist hip ratio. From a statistical perspective, the two measures yield similar information, with the correlation coefficient typically about 0.85. Several studies have shown that WC is a better predictor of type 2 DM, than is BMI, but these findings are inconclusive,6-8 while other studies provide evidence that W/H ratio has a positive effect independent of BMI9-11.
In addition, the ability of these obesity indicators to predict diabetes may differ by ethnicity, age, and sex12-14. For example, among Asian populations, central obesity has been shown to be a more consistent predictor of diabetes than is total obesity11,15, while general obesity has been shown to be a better predictor among white US populations and Europeans16,17. To compare associations of hypertension and type 2 DM incidence with general and central obesity indicators, we conducted a pilot study based on Tribal population of Rajasthan in India. Not a single study has been done so far on the population chosen so ours is the first attempt to study the role of central adiposity and general adiposity as indicators for the lifestyle related diseases especially diabetes and hypertension.
Study design and Data collectionPresent search was limited to tribal population of Jhunjhunu district of Rajasthan state in India. Data was collected through snow and ball method of sampling. We had gone to twelve to sixteen camps and collected data of nearly four hundred and forty-five participants. The study was approved by the institutional human ethics committee at BITS, Pilani and performed according to the Declaration of Helsinki. All study members received detailed explanation of the study in their regional language before giving consent. A survey questionnaire was designed and finalized after a field trial. Men and women ≥18 years of age were considered eligible except pregnant women, seriously ill subjects, and those

17Indian Journal of Public Health Research & Development. April - June, 2012, Vol. 3, No. 2
who were on herbal medication or on drugs such as corticosteroids and oral contraceptive pills. Each subject was asked to report at a selected investigation site after an overnight fast.
Each participant was interviewed to know about occupation, education, housing, sanitation, family income and number of members in the family. Their status of physical activities, family history of diabetes, hypertension, and other kinds of diseases was also taken into account for this study. Other investigations included anthropometry, systolic and diastolic blood pressure, fasting plasma glucose and random plasma glucose test. Measurements of height, weight, and waist and hip circumference were taken with light clothes and without shoes. The weighing tools were calibrated daily by known standard weights. For taking standing height, the measurement has been taken with the help of stadiometer. Waist circumference was measured at the belly button or just above it. Similarly, the hip circumference was measured at its widest part. Blood pressure was taken after a 10-min rest with digital blood pressure machine. Classification of hypertension was based on ADA guidelines (a) Healthy blood pressure: < 120.80 (b) Pre-hypertension: between 120/80 and 140/90 (c) Hypertension: 140/90 or higher. For diabetes the diagnostic criteria of the American Diabetes Association were used18. Statistical analysis: Linear regression analysis and scatter plots was drawn to find out the correlation between associated risk factors and the prevalence of type 2 DM and hypertension.
ResultsOverall, mean and standard deviation values for each variables i.e. FBG levels, systolic blood pressure(SBP), diastolic blood pressure(DBP), and general, central adiposity and dietetic pattern were available for all 445 participants given in Table1.
As can be seen from Table 2 a higher number of females were overweight (12.4%) and obese (17.6 %) as compared to males. It was observed that there was (11.3%) obese
male among the participants. In overweight category 13.1% of participants were having early high blood pressure and 17 % obese subjects were having early high blood pressure (pre-hypertension). Similarly in overweight category 11% of participants were having high blood pressure and 23 % obese respondents were having high blood pressure (hypertension). The subjects found positive for diabetes had BMI in the range of 23-25 (33.3%) and obese persons had BMI more than 25 or greater (20 %).Those subjects that found at risk zone had BMI in the range of 23-25 (13.3%) and obese persons had BMI more than 25 or greater (17.4%). Females were more prone to increased Body mass index (BMI) related diseases as compared to males. Similarly it was noticed that females had more W/H ratio i.e. 67.6% as compared to males (10.3%). Waist to hip ratio has been divided into three categories i.e. low risk, moderate risk and high risk. The participants come under high risk category having cut off w/h ratio (85+) cm for females and (1.0+) for males. In high risk group, 31.7% of subjects had early high blood pressure and 28.6 % had high blood pressure, 33.3% of them had positive blood glucose test and 56.5% were at risk zone of pre-diabetes. The waist circumference was also found to be high in case of females (30%) as compared to males i.e. (12.8%). Thirty three (32%) subjects having circumferences higher than 80 cm for females and 90 cm for men had early high blood pressure and 33% of
Table 1: Descriptive Statistics of study participants
Parameters (n=445) Data
Age (yrs) – Mean+ SD 45.39 +18.39
Sex- n (%)MaleFemaleHeight (cm) – Mean + SDWeight (cm) – Mean + SDBMI(kg/m2) – Mean + SDWaist circumference(cm) – Mean+SDHip circumference (cm) –Mean+SDWaist to hip ratio(cm) – Mean+SDBlood PressureSystolic(mm/Hg) - Mean+SDDiastolic(mm/Hg) –Mean + SDFBG levels (mg/dl) –Mean+ SD
195 (43.8)250 (50.2)160.21 + 9.3653.73 + 11.1820.94 + 3.9674.74 + 12.3584.19 +11.88.8898 +. 08335
125.44 +18.8980.36 +13.12108.32 +27.64
Table 2: Prevalence of associated risk factors by gender, prehypertension hypertension, diabetes and prediabetes
Variables MaleN (%)
FemaleN (%)
Pre-hypertension N (%)
Hypertension N (%)
DiabetesN (%)
PrediabetesN (%)
Body mass index:Kg/m2
Normal(18-22.9)Overweight(23-25)
Obese (> 25)Under weight (below 18
97 (49.7%)20 (10.3%)22 (11.3%)56 (28.7%)
109 (43.6%)31 (12.4%)44 (17.6%)66 (26.4%)
64 (41.8%)20(13.1%)26 (17%)43 (28.1%)
49 (49.0%)11 (11%)23 (23%)17 (17.7%)
5 (33.3%)5 (33.3%)3 (20%)2 (13.3%)
10(43.5%)3 (13.3%)4 (17.4%)6 (26.1%)
Waist to hip ratio: cmLow risk *
Moderate risk **High risk ***Normal****
16 (8.2 %)26 (13.3%)20 (10.3%)133(68.2%)
7 (2.8%)35 (14.0%)169(67.6%)39(15.6%)
8 (34.8%)16 (26.2%)60 (31.7%)69 (40.1%)
7 (30.4%)11 (18.0%)54 (28.6%)28 (16.3%)
3 (20 %)2 (13.3%)5 (33.3%)5 (33.3%)
1 (4.3%)5 (21.7%)13 (56.5%)4 (17.4%)
Abdominal Overweight :(>80cm) & (>90 cm) 25 (12.8 %) 75 (30%) 32 (32%) 33 (33%) 6 (40.0%) 6 (26.1%)
*0.80 & 0.95 or below, ** 0.81 to 0.85 &*** 0.96 to 1.0+

18 Indian Journal of Public Health Research & Development. April - June, 2012, Vol. 3, No. 2
participants had high blood pressure whereas 26.1% of them were at risk zone for prediabetes and 40.0%of them had positive blood glucose test
Linear regression analysis was done to find out the correlation between general adiposity i.e. BMI and SBP and BMI and DBP, a positive relationship (r=0.226) was observed between SBP and Body mass index and based on the t-value (4.872) and p-value (0.001). Similarly it was found positively correlated between DBP and BMI (r=0.183) based on t value (3.923) and p-value (0.001) as shown in Figure 1.
Binary Linear regression analysis was observed between abdominal circumference and SBP and DBP. There was found a strong positive correlation for SBP. (r = .215, p= 0.001) and DBP (r=.163, p = 0.001) Figure 2.
Although correlation between increasing body mass index(r=0.09, p=0.05),Waist circumference(r=0.08 p= 0.07) and the prevalence of type 2 DM disease was observed positive but it was not found as strongly correlated as with the incidence of hypertension.
Logistic regression analysis was done to correlate the relationship between waist to hip ratio and with the
incidence of type 2 DM among Tribal population. It was found to be highly correlated (r=0.109) based on t-value (2.305) p= 0.022 as shown in Figure 3. Whereas the value of regression was not giving significant correlation with Systolic i.e. (r= .084, t=1.778, p=.076) and Diastolic blood pressure (r= -.034, t= -.719, p= .473)
DiscussionThe association of BMI, WC, and W/H ratio with incident type 2 DM and hypertension were confirmed in our study by significant logistic regression analysis. When comparing the associations with these indicators - BMI and WC and W/H ratio, the body mass index (57.3%) was found to be strongly associated with hypertension(including both overweight and obese category) and waist to hip ratio (r=.109, p=.022) was correlated strongly with positive blood glucose test. Waist circumference was also found to be correlated strongly with hypertension (chi-square= 8.559, p= .014, df =2) as compared to diabetes.
Ford et al.19 support the use of WC as a measure of obesity to predict health risk. Among their arguments are that WC has been shown to be a good or better predictor than BMI of the metabolic syndrome, diabetes, cardiovascular disease, and all-cause mortality. it provides information about health risk in addition to body mass index; and it is conceptually easy to measure, although it does require
Figure 1: Correlation between BMI, SBP and DBP among Nomad Tribal Population
Figure 2: Scatter plot diagram to show the correlation between waist circumference, systolic and diastolic blood pressure
Figure 3: Correlation between W/H ratio and type 2 DM.
Figure 4: Correlation between BMI and WC with hypertension.
3002001000
40
30
20
10
Body mass index
Diastolic blood pres
Body mass index
Systolic blood press
3002001000
120
100
80
60
40
20
Waist circumference
Diastolic blood pres
Waist circumference
Systolic blood press
Type 2 DM
4003002001000
Wa
ist
to h
ip r
atio
1.3
1.2
1.1
1.0
.9
.8
.7
.6
3002001000
120
100
80
60
40
20
0
Body mass index
Diastolic blood pres
Body mass index
Systolic blood press
Waist circumference
Diastolic blood pres
Waist circumference
Systolic blood press

19Indian Journal of Public Health Research & Development. April - June, 2012, Vol. 3, No. 2
some training and standardization. However, others have noted that substitution of BMI by WC as an indicator of risk for cardiovascular disease and diabetes may be an oversimplification20,21,22. Some counter arguments nonetheless prove that waist circumference is strongly correlated to body mass index (r 0.08) (19, 23, 24,) Our study also supported that BMI and WC (r = 0.05) (Fig 4) were strongly correlated with each other and both predicts the same results for hypertension.
Other indicators have been suggested to describe fat distribution associated with abdominal obesity i.e. W/H ratio22. In our analysis, we had also included W/H ratio as it was the most common obesity-related predictor of diabetes and it has a weaker correlation with body mass index than waist circumference. However, some have argued against the use of W/H ratio as a measure of obesity because of its ambiguous biologic interpretation, its lesser sensitivity to weight gain, its greater variability across age, sex, and ethnic groups, and its greater computational complexity and interpretation in a public health context22.
ConclusionThe present study demonstrated consistently strong associations between body mass index versus waist circumference and waist circumference versus waist to hip ratio. It also showed positive association with type 2 diabetes and hypertension. Finally we can conclude our study by saying that all the indicators were strongly associated with each other and Body mass index and waist circumference had strong association with hypertension than diabetes. Waist to hip ratio had also positive association with hypertension but had strongly correlated with diabetes.
References1. Amos AF, McCarty DJ, Zimmet P. The rising global burden of
diabetes and its complications: estimates and projections to the year 2010. Diabetic Med 1997; 14 (Suppl 5):S7-S85.
2. King H, Aubert RE, Herman WH. Global burden of diabetes, 1995-2025; prevalence, numerical estimates and projections. Diabetes Care 1998; 21: 1414-1431
3. World Health Organization (WHO). Obesity: Preventing and Managing the Global Epidemic. Geneva: WHO, 1998.
4. DeFronzo RA. Pathogenesis of type 2 diabetes mellitus. Med Clin North Am (2004) 88:787–835.[Cross Ref ][Web of Science][Medline]
5. Ford ES, Mokdad AH, and Giles WH. Trends in waist circumference among U.S. adults. Obes Res (2003) 11:1223–31.
6. Wei M, Gaskill SP, Haffner SM, et al. Waist circumference as the best predictor of noninsulin dependent diabetes mellitus (NIDDM) compared to body mass index, waist/hip ratio and other anthropometric measurements in Mexican Americans—a 7-year prospective study. Obes Res (1997) 5:16–23.
7. Janssen I, Katzmarzyk PT, Ross R. Waist circumference and not body mass index explains obesity-related health risk. Am J Clin Nutr (2004) 79:379–84.
8. Stevens J, Couper D, Pankow J, et al. Sensitivity and specificity of anthropometrics for the prediction of diabetes in a biracial cohort. Obes Res (2001) 9:696–705.
9. Ohlson LO, Larsson B, Bjorntorp P, et al. Risk factors for type 2 (non-insulin-dependent) diabetes mellitus. Thirteen and one-half years of follow-up of the participants in a study of Swedish men born in 1913. Diabetologia (1988) 31:798–805.
10. Lundgren H, Bengtsson C, Blohme G, et al. Adiposity and adipose tissue distribution in relation to incidence of diabetes in women: results from a prospective population study in Gothenburg, Sweden. Int J Obes (1989) 13:413–23.
11. Cassano PA, Rosner B, Vokonas PS, et al. Obesity and body fat distribution in relation to the incidence of non-insulin-dependent diabetes mellitus. A prospective cohort study of men in the Normative Aging Study. Am J Epidemiol (1992) 136:1474–86.
12. Nakagami T, Qiao Q, Carstensen B, et al. Age, body mass index and type 2 diabetes—associations modified by ethnicity. Diabetologia (2003) 46:1063–70.
13. Abate N, Chandalia M. The impact of ethnicity on type 2 diabetes. J Diabetes Complications (2003) 17:39–58.
14. Haffner SM, Mitchell BD, Hazuda HP, et al. Greater influence of central distribution of adipose tissue on incidence of non-insulin-dependent diabetes in women than men. Am J Clin Nutr (1991) 53:1312–17.
15. Cassano PA, Rosner B, Vokonas PS, et al. Obesity and body fat distribution in relation to the incidence of non-insulin-dependent diabetes mellitus. A prospective cohort study of men in the Normative Aging Study. Am J Epidemiol (1992) 136:1474–86
16. Boyko EJ, Fujimoto WY, Leonetti DL, et al. Visceral adiposity and risk of type 2 diabetes: a prospective study among Japanese Americans. Diabetes Care (2000) 23:465–71.
17. Chan JM, Rimm EB, Colditz CA, et al. Obesity, fat distribution, and weight gain as risk factors for clinical diabetes in men. Diabetes Care (1994) 17:961–9.
18. Expert Committee on the Diagnosis and Classification of Diabetes Mellitus: Report of the Expert Committee on the Diagnosis and Classification of Diabetes Mellitus (Position Statement). Diabetes Care 20:1183–1197, 1997
19. Ford ES, Mokdad AH, Giles WH. Trends in waist circumference among U.S. adults. Obes Res (2003) 11:1223–31.
20. Molarius A, Seidell JC. Selection of anthropometric indicators for classification of abdominal fatness—a critical review. Int J Obes Relat Metab Disord (1998) 22:719–27.
21. Seidell JC, Bjorntorp P, Sjostrom L, et al. Regional distribution of muscle and fat mass in men—new insight into the risk of abdominal obesity using computed tomography. Int J Obes (1989) 13:289–303.
22. Janssen I, Heymsfield SB, Allison DB, et al. Body mass index and waist circumference independently contribute to the prediction of nonabdominal, abdominal subcutaneous and visceral fat. Am J Clin Nutr (2002) 75:683–8.
23. Wei M, Gaskill SP, Haffner SM, et al. Waist circumference as the best predictor of noninsulin dependent diabetes mellitus (NIDDM) compared to body mass index, waist/hip ratio and other anthropometric measurements in Mexican Americans—a 7-year prospective study. Obes Res (1997) 5:16–23.
24. CODA Study group, Duval SJ. The association of BMI and waist circumference with diabetes in an international context: the CODA (Collaborative Study of Obesity and Diabetes in Adults) project. Presented at the American Diabetes Association 64th Scientific Sessions, Orlando, Florida, June 4–8, 2004.
20 Indian Journal of Public Health Research & Development. April - June, 2012, Vol. 3, No. 2
Comparative assessment of efficacy of a single application of Potassium Oxalate and N-Butyl 2-Cyanoacrylate in treatment of hypersensitive teeth-A clinical studyGururaj Naregal1, Chandrashekar Raju2
1Prof., Department of Periodontics, S.J.M. Dental College and Hospital, Chitradurga, Karnataka, India, 2Lecturer, Department of Oral Pathology, S.J.M. Dental College and Hospital, Chitradurga, Karnataka, India
AbstractPain has been so closely associated with dentistry that the word ‘pain’ and ‘dentistry’ have almost become inseparable, and one of the most important objective of dentistry has been the control/elimination of pain.
Dentin hypersensitivity is a common painful condition of the teeth, which has caught the attention of people since our ancient times. In today’s busy world, it is difficult for the suffering patient to keep up the repeated visits to get treated for hypersensitivity. This has led to evolving of treatment modalities utilizing single application medicaments like the resins, oxalates and cyanoacrylates.
KeywordsHypersensitivity, cyanoacrylates, oxalate.
IntroductionPain has been so closely associated with dentistry that the word ‘pain’ and ‘dentistry’ have almost become inseparable, and one of the most important objective of dentistry has been the control/elimination of pain. Dentinal hypersensitivity can be defined as pain arising from exposed dentin, typically in response to chemical, thermal, tactile or osmotic stimuli that cannot be explained as arising from any other form of dental defect or pathology6.
In the earlier days dentinal hypersensitivity was treated randomly using traditional cures like materials of natural origin (roots, plant extracts, animal parts, and naturally occurring salts). Most of the therapies proposed, rely on one of the two major suppressive mechanisms i.e. sealing off the dentinal tubules or dampening neural impulses.
Almost all of the agents used in the effective treatments of dentin hypersensitivity have major drawbacks such as requiring multiple applications, application by professionals. In today’s busy world, it is difficult for the suffering patient to keep up the repeated visits to get treated for hypersensitivity. This has led to evolving of treatment modalities utilizing single application medicaments like the resins, oxalates and cyanoacrylates.
Various salts of oxalates, like the ferric oxalate, potassium oxalate are used. These salts precipitate to occlude the dentinal tubule orifice and thus reduce sensitivity.
Cyanoacrylates have made its way into dentistry as a tissue adhesive, based on which property the use of cyanoacrylates to block the dentinal tubule orifice is studied.
The present short term clinical trial aims at an in vivo assessment of 30% dipotassium oxalate and n-butyl 2 cyanoacrylates as desensitizing agents.
Aims & ObjectivesTo compare the clinical efficacy of a single application of 30% dipotassium oxalate and n-butyl 2-cyanoacrylate in treating hypersensitive teeth.
Materials & MethodThis short term clinical study was carried out on 45 teeth from 15 patients from the out patient section of Department of Periodontics, for a comparative evaluation of the efficacy of single application of 30% dipotassium oxalate and n-butyl 2-cyanoacrylate in the management of hypersensitive teeth.
The criteria for selection of patient were:
Inclusion criteria:• Patients with a history of dentinal hypersensitivity due
to exposure of root surface by periodontal disease.• The labial surfaces of the anteriors were selected.
Exclusion criteria:• Presence of caries.• Recent treatment of any type for hypersensitivity by
the patients or professionals.• Hypersensitivity due to abrasion, erosion and attrition.• Patients with any systemic disease, cardiac pacemakers.
Pretreatment assessments: The presence of hyper-sensitivity was assessed prior and during treatment in two ways:
1. Subjective assessment. a. Visual analogue scale (VAS)2. Objective assessment a. Tactile stimulation b. Electrical stimulation
The subjective and objective assessments were recorded prior to the treatment; immediately after treatment and at weekly intervals thereafter for 12 weeks.

21Indian Journal of Public Health Research & Development. April - June, 2012, Vol. 3, No. 2
Treatment modalitiesA total of 15 patients with hypersensitive teeth due to denudation of root because of periodontal disease, but not due to wasting disease (attrition, abrasion, erosion) were selected. Three anterior teeth were selected per patient. The selected teeth were divided into 3 groups:
Group I - Application of distilled water for 1 min (control group) with a cotton pallet.
Group II - Application of 30% dipotassium oxalate for 1 min with a cotton pallet.
Group III - Application of n-butyl 2-cyanoacrylate for 1 min with a cotton pallet.
Freshly prepared 30% dipotassium oxalate solution was used for every application. About 30 grams of dipotassium oxalate crystals were dissolved in 100 ml of distilled water at room temperature, to get 30% dipotassium oxalate solution.
Scaling was done and patients recalled after one week. At that time patients who continued having subjective and objective symptoms of hypersensitivity were treated.
As previously mentioned each patient was divided into 3 groups and treated with respective solutions. After application for 1 min the patients were asked to rinse with water, following which subjective and objective
assessments were redone and recorded immediately. Assessment was done at weekly intervals thereafter for 12 weeks.
Observations & ResultsA total of 45 teeth were treated (in vivo), which were divided into 3 groups of 15 each, assigned to as group I, II and III. Group I specimens (control group) were treated with distilled water; Group II were treated with 30% dipotassium oxalate and Group III were treated with N-butyl 2-cyanoacrylate.
Severity of hypersensitivity was assessed before application, immediately after application, later on at
Table 1:
Time Control (distilled water)
Mean± SD
30% Dipotassium oxalate
Mean± SD
N-butyl 2-cyanoacrylate
Mean± SD
F* Value
Pair wise comparison
I - II I - III II - III
BAI A VI WeekX I I Week
7 .3 ±1. 17 .2 ±1. 17 .2 ± 1. 16 .4 ±0. 6
7 .7 ± 0. 93 .1 ± 0. 53 .1 ± 0. 53 .1 ± 0. 5
8 .0 ± 0. 82 .7 ± 0. 83 .1 ± 0. 73 .3 ± 1. 0
1. 8 51 2 8 .91 2 1. 49 3. 2
N S< .0 1< .0 1< .0 1
N S< .0 1< .0 1< .0 1
N SN SN SN S
*ANOVA F –Test [If F > 8 .2, P < 0. 0 0 1] = Highly SignificantNewman-Keul’s range test [If Difference > minimum mean value = Significant range, P < 0.01= Significant] BA- Before Application, IA- Immediately after application

22 Indian Journal of Public Health Research & Development. April - June, 2012, Vol. 3, No. 2
weekly intervals for 12 weeks. The statistical analysis of the data collected was done using one factor ANOVA, Newman Keul’s range test.
One factor ANOVA was used for comparing different groups. For pair wise group comparison, Newman Keul’s range test was used. The values are expressed as Mean ± S.D. A ‘P’ value for less than .05 was considered significant.
Visual analogue scale (Table - 1):It was observed that the mean value during the initial period i.e. before treatment showed a definite evidence of hypersensitivity, mean: Group I - 7.3; Group II - 7.7; Group III - 8.0.
After treatment there was a gradual decline in the readings right after the immediate application to 12th week, except for the control group (i.e. group treated with distilled water).
Mean value of visual analogue scale with regards to Group I showed a reduction of sensitivity at 7th week, (Mean - 6.6). Group II showed a reduction (Mean - 3.1) immediately after application and was the same for 12 weeks, Group III also showed reduction (Mean - 2.7) immediately after application, but the mean score increased at 6th week (Mean - 3.1).
Analysis variance (ANOVA) test revealed that the mean values for visual analogue scale method at different periods decreased significantly (F - 93.2).
Pair wise (Neuman Keul’s Range test) showed that comparison between Group I & II, I & III were statistically significant throughout the 12 weeks (P<.01), whereas group II & III were not statistically significant.
Tactile stimulus (Table - 2):It was also observed that the mean value during the initial period I before treatment, mean: Group 1-2.7; Group II - 2.7; Group III -.7 showed a definite evidence of hypersensitivity.
In Group I the reduction of mean score was noted after seventh week (Mean - 1.7), in group II there was an immediate reduction in mean score after immediate application (Mean - 0) and was the same for the following12 weeks. Group III showed reduction (Mean - 0) immediately after application, but the mean score increased after 7th week (Mean - 0.9). Analysis variance (ANOVA) test revealed that the mean value for tactile stimulus score method at different periods decreased significantly (F - 79.4).
Pair wise (Newman – Keul’s Range test) showed that comparison of group I & II, I & III were statistically significant throughout the 12 weeks (P<0.01). Group II & III were statistically significant after 7th week (P<.01).
Electric stimulus (Table - 3):The mean value during the initial period i.e. before treatment also showed a definite evidence of hypersensitivity, mean: Group I -13.5; Group II - 13.5; Group III - 14.6.
In Group I the increase in mean score was noted after 7th week (Mean - 14.3), in Group II there was an increase in the mean score immediately after application (Mean - 43.3) and was the same for 12 weeks. In Group III, there was a similar increase in the mean score immediately after application (Mean - 54.5), which gradually reduced by 6th week (Mean - 48.9).
Analysis variance (ANOVA) test revealed that the mean value for electric stimulus score method at different periods decreased significantly (F -203).
Pair wise (Newman Keul’s range test) showed that comparison between Group I & II, I & III was statistically significant through out the 12 weeks (P<0.01) but Group II & III were statistically significant upto 7th week (P<0.01).
DiscussionMany therapeutic means and agents have been tried to treat dentin hypersensitivity. Patient’s testimony concerning every day experiences provides a useful guide to the state of the problem and the need for treatment.
To prevent and to treat hypersensitivity more effectively, attention must be given to etiology, mechanism and methods for the assessment of hypersensitivity.
In the present study, only the hypersensitive teeth with recession due to periodontal diseases but not due to abrasion or attrition were selected. In patient with vigorous home care procedures by brushing (abrasion), electron micro radiographic findings demonstrated that dentinal tubules on and near the surface had been obstructed by mineral deposition and these areas were never sensitive (William H. Hiatt 1972)8.
The patients after scaling were recalled one week later for the continuation of the study. David H. Pasley (1990)3 stated that the smear layer created during manipulation of root surface may last for 5 to 7 days.
Table 2:
Time Control (distilled water)
Mean± SD
30% Dipotassium oxalate
Mean±SD
N-butyl 2-cyanoacrylate
Mean± SD
F*Value
Pair wise comparison
I - II I - III II - III
BAI AVI WeekX I I Week
2 .7 ± 0. 52 .7 ± 0. 52 .6 ± 0. 51 .6± 0. 5
2 .7± 0. 7000
2 .7 ± 0. 5001 .1 ± 0. 3
0. 04 4 8 .04 4 8 .07 9. 4
N S< .0 1< .0 1< .0 1
N S< .0 1< .0 1< .0 5
N SN SN S< .0 1
Newman-Keul’s range test [If Difference > minimum mean value = Significant range, P < 0.05, P < 0.01 = Significant]

23Indian Journal of Public Health Research & Development. April - June, 2012, Vol. 3, No. 2
This study focuses on clinical efficacy of 30% dipotassium oxalate and n-butyl 2-cyanoacrylate by single application.
The present study showed that the mean values of visual analogue scale with 30% dipotassium oxalate decreased significantly immediately after application (Table - 1).The mean values of tactile stimulus & electric stimulus with 30% dipotassium oxalate decreased immediately after application and were the same for the 12 weeks (Table - 2, 3).
It can be concluded that there was an immediate decrease in hypersensitivity after 30% dipotassium oxalate single application which was in agreement of the results presented by M.S Seo. et al., (1991)7, whereas in the study by Kathleen Brough Muzzin (1989)5 no significant difference was noted for teeth treated with distilled water followed by 30% dipotassium oxalate. This could be attributed to the fact that, they used distilled water prior to the application of 30% dipotassium oxalate.
The present study revealed the decrease in the mean values of visual analogue scale significantly immediately after application of n-butyl 2-cyanoacrylate and gradual increase in the mean values was noted at VII weeks (Table - 1).The mean value of tactile stimulus with n-butyl 2-cyanoacrylate decreased immediately after application, but a gradual increase in the mean values was noted at around VII week (Table - 2).
The current which is required to elicit hypersensitivity, increases as tooth sensitivity decreases, the less sensitive the tooth, the greater the voltage required to deliver the current flow. The mean value of electric stimulus with
n-butyl 2-cyanoacrylate increased immediately after application, but a gradual decrease in the mean value was noted at around V week in our study (Table - 3).
Finally, the present study with the use of n-butyl 2-cyanoacrylate concluded that there was immediate reduction in hypersensitivity after single application but there was a gradual increase in hypersensitivity noted around 6th week which is in accordance with the study of Bahram Javid et al. (1987)2.
Summary & ConclusionComparison of 30% dipotassium oxalate and n-butyl 2-cyanoacrylate exhibited no significant difference with VAS. There was a statistical significant difference in tactile stimulus after 7 weeks for both experimental groups, (as compared to control) wherein the 30% dipotassium oxalate group showed consistent absence of hypersensitivity till the end of the study. With electric stimulus, the difference was statistically significant up to 6 week for both experimental groups, (as compared to control) wherein the n-butyl 2-cynoacrylate group showed more reduction in hypersensitivity than 30% dipotassium oxalate.
With respect to cost effectiveness and long term efficacy 30% dipotassium oxalate could have an edge over n-butyl 2-cyanoacrylate as a desensitizing agent.
In conclusion of the study, it was seen that a single application of 30% dipotassium oxalate and n-butyl 2-cyanoacrylate were almost equally effective as
Table 3:
Time Control (distilled water)
Mean± SD
30% Dipotassium oxalate
Mean±SD
N-butyl 2-cyanoacrylate
Mean±SD
F* Value
Pair wise comparison
I - II I - III II - III
BAI A VI WeekX I I Week
1 3.5 ± 1. 81 3.7 ± 2. 11 3.7 ± 1. 81 5.1± 3. 5
1 3.5 ± 2. 44 3.3 ± 4. 84 3.4± 4. 84 3.7 ± 4. 4
1 4 .6± 1. 15 4 .5± 2. 84 8. .9± 5. 94 2. .5± 5. 2
1. 815 7 2.22 6 5.42 0 3. 0
N S< .0 1< .0 1< .0 1
N S< .0 1< .0 1< .0 1
N S< .0 1< .0 5N S
Newman-Keul’s range test [If Difference > minimum mean value = Significant range, P < 0.01 = Significant]

24 Indian Journal of Public Health Research & Development. April - June, 2012, Vol. 3, No. 2
desensitizing agents upto 6-7 weeks after application - Beyond this, the 30% dipotassium oxalate group showed a consistent absence of hypersensitivity till the end of the study.
References1. Addy M., “Dentin hypersensitivity: definition, prevalence,
distribution and etiology. In Martin Addy, Graham Embery, Michael Edgar W., Robin Orchardson (eds). Tooth wear and sensitivity, clinical advances in restorative dentistry. Martin-Dunitz”; 2000: 239-248.
2. Bahram Javid., Ranmat A. “Cyanoacrylate a new treatment for hypersensitivity dentin and cementum”: J. Am. Dent. Assoc.; 114: 4: 1987: 486-488.
3. David H. Pasley “Mechanism of dentin sensitivity”: Dental Clinics of North America; 1990: 34: 3: 449-474.
4. David H. Pasely et al., “An in vitro study of dental tubule occlusion of ferric oxalate”: J. Periodontol: 1993; 64: 1045-1051.
5. Kathleen Broagh Muzzin “effects of potassium oxalate on dentin hypersensitivity in vivo”: J. Periodontol. ; 1989: 60: 5: 151-158.
6. Martin addy “Etiology and clinical implication of dentin hypersensitivity”: Dental Clinics of North America; 1990: 34: 7: 503-513.
7. Seo M.S., Park O.S. “The effectiveness of potassium oxalate and sodium fluoride on the reduction of dentinal sensitivity”: J. Dent. Res.; 1991: 70: 4: 818 (0-91).
8. William H. Hiatt “Root preparation I: Obturation of dentinal tubule is treatment of root hypersensitivity”: J. Periodontol; 1972: 43: 6: 373-380.

25Indian Journal of Public Health Research & Development. April - June, 2012, Vol. 3, No. 2
Role of human bite mark identification and DNA technology in forensic odontology: A reviewRohit Malik1, Deepankar Misra2, Akansha Misra3
1Professor, 2Senior Lecturer, Department of Oral Medicine and Radiology, 3PG Student, Department of Oral and Maxillofacial Pathology, Institute of Dental Studies and Technology, Modinagar, UP India
AbstractOut of the numerous fields of study and analysis in forensic odontology an important principle is the recognition and interpretation of marks and injuries produced for human bites in foods founded in crime scenes or in the human skin. Thus, the knowledge of the anatomical detail and particularities of human dentition and distribution in the dental arcs can be of real value to forensic odontologist. These bite marks are usually found over the skin, as a result of rapes, fights, assaults, abuses and child violence, this evidence can mean the crime resolution, assuming a decisive role in the criminal identification. In this direction, the DNA technology can be used in the recovery of the genetic material, through the saliva deposited in the skin, after the production of a bite mark, due to the fact that dental impression can be adulterated easily and showing problems on expert analysis. This review emphasizes the importance of the recognition and identification of these injuries combining them with the use of the DNA technology for individual identification.
Key WordsBite marks, DNA, saliva.
Introduction The forensic dentist field of activity is not restricted just to the examination of dental remains but extending to several areas such as anthropology, genetics, biochemistry, forensic traumatology, radiology, computing and images mixing, and is regulated by a pertinent federal law.
Today, oral conditions analysis has been presented as a crucial tool to the forensic investigation team members when solving identification problems and it has been helpful to Criminal and Civil Justice1.
One of the possibilities in Forensic Dentistry field is related to the human identification process, such as in cases which involve the study of bite marks. Bite can be defined as the mark made by human or animal teeth in the skin of living people, cadavers or unanimated objects with relatively softened consistence2.
Besides the agent identification, bite mark analysis, in a forensic investigation, can elucidate the kind of violence and the elapsed time between its production and the examination. It can show if the bite was produced ante
mortem or post-mortem and, in case of several bite marks, identify the sequence of them2.
Therefore, by observing, analyzing and interpreting, the bite marks constitute a important medical-judiciary proof in some cases of offense and help in suspects’ exclusion or point out the culpability elements3. However, bite marks do not embody all the requisites of an ideal identification method, but it can represent, in some cases, the unique signs of real value to criminal investigation.
Nowadays, there are three kinds of human identification using oral characters. Two of them have been used since long time. The first one is denominated comparative dental identification and involves a comparison between ante mortem and post-mortem records. The second one is composed by the reconstruction of post-mortem dental profile and is used in the cases in which there is no suspicion of the person or his/her descendents. The third kind works on the application of the modern techniques of DNA, in order to establish the identity4.
The present work intends to display some applications of DNA technology in human identification by studying the bite marks in Forensic Dentistry.
Production of Bite marks Bite marks are produced as a result of teeth pressure on skin, described as force combination. In general, when a person bites an object, the superior teeth hold the object while the inferior ones cut it. The mark left by the superior teeth, however, is extremely relevant in order to provide information such as: dental alignment, size and shape of dental archs5. Human adult dentition consists of 32 teeth and each one of them has its own size, shape and features. The action of the dental arch on the skin may produce many kinds of lesions, as the dental elements act as incisive instruments or even incisive-cut6.
The greatest challenge is Forensic Dentistry are bite marks found in human skin, because of the distortion presented and the time elapsed between the production and the analysis7. Moreover, many factors can affect the structure of the lesions produced by bite marks, which include: applied force, bite duration and movement between tissues and teeth.
Use of DNA in bite mark identificationTechniques involving DNA in Forensic Dentistry offers a new tool when traditional identification methods fail due to the effects of heat, traumatism or autolytic processes8,
26 Indian Journal of Public Health Research & Development. April - June, 2012, Vol. 3, No. 2
as well as in distortions and difficulties in analysis. DNA analysis in forensic samples has been increasingly used in human identification processes9.
Due to this abundance of material, the use of the technique based on PCR (Polymerase Chain Reaction) has acquired great importance in DNA post-mortem analysis in forensic cases. Polymerase Chain Reaction is an enzymatic amplification of a specific DNA sequence, aiming millions of copies production from this sequence in a test tube, which was first described by Kary Mullis, in the late 1980’s, and enabling a new strategy of gene analysis though a simple and fast method, excusing all the laborious stages of genic cloning10.
When treating of forensic samples, the DNA study is usually done through the analysis of regions of short tandem repeats (STR), which can be defined as DNA hypervariable regions that present tandem repeats of fragment that have from two until nine pairs of bases (pb).The most valuable STR’s to human identification present a higher polymorphism (larger alleles amount), smaller size, greater heterozygosity frequency (higher than 90%) and low mutation frequency11.
In order to perform human identification, it is more interesting to use the molecular markers that have great variability within the population. In other words, high level of polymorphism, enabling that the probability of two people that present the same alleles gets smaller. And, when we wish to identify a subject that comes from a certain population, the study of different markers in that population is necessary, in order to know what the present alleles are and how often they appear, with the purpose of defining the best markers to be used.
Besides the genomic DNA, inside the cell nucleus, it is possible to use mitochondrial DNA. This organela has a number that ranges from 100 to 10,000 copies per cell, enabling the material analysis with limited amounts and also DNA samples partially degraded12.
Saliva is a very useful DNA source due to the fact of being collected by painless and non-evasive way, able to be used even when it is stored in the most different conditions13.The amount of saliva deposited on the skin is generally very little in bite mark cases, making it necessary to use methods for collecting, whose result in the recovery is the maximum possible amount of saliva and minimizes any contamination through the victim’s skin cells14. When checking the DNA analysis reproducibility of collected saliva on the skin, simulating cases that involve bite marks in 20 samples, the double swab technique showed to be sensitive and efficient in criminal cases when there is presence of saliva in bite marks15. Saliva, in contact with intact skin, maintains itself in stable conditions and can be recovered, at least, 60 hours after its deposit16.
However, it is not always possible to recover DNA from a bite mark, due to the fact that it will be subject to a series of modifications, such as contamination, degradation
and putrefaction, depending on the circumstances the body and/or object were submitted17.
Bite Mark identification: DNA analysis and genotypical composition of oral bacteria.
The human oral cavity has a large and varied bacterial community, many of which are unique for this habitat. There is wide evidence that oral bacteria are transferred during the human bite act and, in some cases, survive and multiply, creating infections. Besides, there are evidences that individuals shelter unique bacterial species stocks in the oral cavity and that those stocks can be identified by techniques such bacterial typing and protein profiles18.
It is important to note that the oral Streptococcus recovery from the skin or objects seems to imply the contact with oral surfaces or deposit saliva which can lead to evidences of buccal-envolvement in the injury19.
In a study where 10ìl fresh saliva sample was collected without stimulation and applied to areas of the upper left quadrant of the thorax, so that the loss rate of units that make up the colony and its recovery ranged from 45 to 50% per hour. They have also noticed that 6, 25 hours after the saliva deposition, oral viable streptococcus could be recovered20. In another research, volunteers bit their own arms firmly and the bite marks were sampled in time intervals to recover isolated viable streptococcus, in order to make a genotypical comparison with bacteria from the oral cavity. It was concluded that it is possible to recover bacteria up to 24 hours after the production of the bite, but identification assertiveness is only possible when compared to samples acquired from the subjects’ teeth responsible for the bite. Isolated Streptococcus from recent bite marks can be listed by PCR and compared to the teeth that were responsible for the bite. Moreover, they claim it is preferable to recover the subject’s DNA, but such strategy is not always possible, the recovery of the bacteria derived from the subject’s tooth may enable the link with the suspect of a crime21.
In conclusions, the knowledge proceeding from Forensic Dentistry and Molecular Biology has great importance to the expert practice when we think of a dentist inserted in forensic investigation team in a bite mark case. It’s necessary to broaden the pertinent studies of the theme, in order to establish protocols to allow additional tools in criminal investigation.
It is stated that, in judicial proceedings involving Dentistry, being Civil or Criminal, it is extremely necessary the presence of a professional that militates in Forensic Dentistry as a judicial expert.
References1. Syrjänenn SM, Sainio P. Forensic dentistry recent development
towards on independent discipline in modern dentistry. Proc Finn Dent Soc. 1990; 86: 157-70.
2. Melani RFH. Identificação por marcas de mordida. In: Silva M. Compêndio de odontologia legal. Rio de Janeiro: Medsi; 1997.

27Indian Journal of Public Health Research & Development. April - June, 2012, Vol. 3, No. 2
3. Ramirez AIC. Estomatologia forense. México: Trillas; 1990. 4. Sweet D, Pretty IA. A look at forensic dentistry Part 2: teeth as
weapons of violence identification of bitemarks perpetrators. Br Dent J. 2001; 190: 415-8.
5. Dinkel-Junior EH, Captain MS. The use of bite mark evidence as an investigative aid. J Forensic Sci. 1974; 19: 535-47.
6. Gomes E de M, Melani RFH. O estudo das marcas de mordidas e a identificação humana. [monografia] São Paulo: Fundecto; 1999.
7. Sheasby DR, MacDonald DG. A forensic classification of distortion in human bite marks. Forensic Sci Int. 2001; 122: 75-8.
8. Pötsch L, Meyer U, Rothschild S, Schneider PM, Rittner C. Application of DNA techniques for identification using human dental pulp as a source of DNA. Int J Leg Med. 1992; 105: 139-43.
9. Remualdo VR, Oliveira RN. Potencial de análise forense do DNA de diferentes amostras biológicas. Rev Assoc Paul Cir Dent. 2005; 59: 421-4.
10. Farah SB. DNA no diagnóstico das doenças humanas. In: Farah SB. DNA: segredos & mistérios. São Paulo: Sarvier; 1997. p.103-40.
11. Galante-Filho H, Figini AL, Reis AB, Jobim LF, Silva M. Identificação humana. Porto Alegre: Sagra Luzzatto; 1999.
12. Allen M, Engström AS, Meyers S, Handt O, Saldeen T, Von Haeseler et al. Mitochondrial DNA sequencing of shed hairs and saliva on robbery caps: sensivity and matching probabilities. J Forensic Sci. 1998; 43: 453-64.
13. Koh D, Ng DPK, Choo SGL, Ng V, Fu Q. Effect of storage conditions on the extraction of PCR-quality genomic DNA from saliva. Clin Chim Acta. 2004; 343: 191-4.
14. Cate T. Oral histology: development, structure and function. Saint Louis: Mosby; 1988.
15. Sweet D. Why a dentist for identification? Dent Clin North Am. 2001; 45): 237-51
16. Smith BC, Holland MM, Sweet D, DiZinno JA. DNA and the forensic odontologist. In: Bowers CM, Bell GL. Manual of forensic odontology. 3rd ed. Colorado Springs: American Society of Forensic Odontology; 1997. p.283-98.
17. Elliot TR, Rogers AH, Haverkamp JR, Groothuis D. Analytical pyrolysis of streptococcus salivarius as an aid to identification in bite-mark investigation. Forensic Sci Int. 1984; 26: 131-7.
18. Borgula LM, Robinson FG, Rahimi M, Chew KEK, Birchmeier KR, Owens SG et al. Isolation and genotypic comparison of oral streptococci from experimental bitemarks. J Forensic Odontostomatol. 2003; 21: 23-9.
19. Brown KA, Elliot TR, Rogers AH, Thonard JC. The survival of oral streptococci on human skin and its implication in bite mark investigation. Forensic Sci Int. 1984; 26: 193-7.
20. Rahimi M, Heng NCK, Kieser JA, Tompkins GR. Genotypic comparison of bacteria recovered from human bitemarks and teeth using arbitrarly primed PCR. Soc Appl Microbiol. 2005; 99: 1265-70.
21. Silva RHA. Atividade ilícita profissional em odontologia: análise do conhecimento de acadêmicos, magistrados e entidades promotoras de cursos de aperfeiçoamento e/ou especialização, no município de Bauru-SP [dissertação]. Bauru: FOB-USP; 2005.

28 Indian Journal of Public Health Research & Development. April - June, 2012, Vol. 3, No. 2
Congenital malformations detected at birth – A prospective study in BangaloreDinanath K. Pujari1, Ashwini D. Pujari2
1Asst. Professor, Dept. of Anatomy, MRMC, Gulbarga, 2Asst. Professor, Dept. of Physiology, MRMC, Gulbarga, Karnataka
AbstractIn a prospective study of 4280 births in Vanivilas Hospital, Bangalore Medical College, Bangalore 61 cases of congenital malformations were observed with an Incidence of 14.25/1000 live births. A total of 117 malformations were observed. Among these 95 were major and 22 were of minor type. The central nervous system, gastro-intestinal and multiple system involvement were the commonest with 12 cases each (19.67%), followed by musculoskeletal 11 (18.03%), cardio-vascular 4 (6.56%), genito urinary 02 (3.30%)cases), cutaneous 1 (1.64%) and 07 (11.49%) cases were miscellaneous. Malformations in the new born males were 52.46%, in females it was 45.90% and 1.64% are of ambiguous genitalia thereby showing male preponderance. Maximum of 42 cases (68.85%) were born to non-consanguineous group and 19 cases (31.15%) were to consanguineous couples.
KeywordsCongenital malformations, Neonate, Consanguinity.
IntroductionA Congenital malformation is a functional or structural anomaly which result from chromosomal aberrance, deficiency or damage to the organism in the process of growth and development occurring prior to birth.
These congenital malformations occur all over the world and constitute an impenetrable core of perinatal mortality in developed countries. The awareness of incidence, prevalence and patterns of malformations can help medical and paramedical personnel to identify ‘at- risk’ cases early and plan appropriate and effective intervention in treatment and prevention if possible. Hence the present study was undertaken with a view to assess the frequency of congenital malformations in newborns and to analyze the magnitude of the problem.
Material and MethodsThe study was conducted at Vanivilas Hospital, attached to Bangalore Medical College, Bangalore for a period of 1 year. All the live newborns delivered at Vanivilas Hospital were screened for congenital anomalies within 24–48 hours after birth with a written consent from parents / relatives for examination.
The details of each of the congenital anomalous newborns regarding sex, major and minor malformations and parental consanguinity were recorded. The information was sought from the mother or father regarding consanguinity and previous births.
Major malformations were included, the anomalies which caused serious structural, cosmetic and functional disability requiring surgical or medical management. The minor anomalies included those anomalies which were unlikely to cause serious hindrance to life like preauricular tag, polydactyly etc.
ResultsOut of total 4280 births, 61 cases of congenital malformations were observed. In these 61 cases 117 malformations were noted in which, thirty two (52.46%) were male and twenty eight 45.90% were females) with one case of ambiguous genitalia. The distribution of congenital malformation is high among male children with a male female ratio of 1.4:1.
DiscussionThe incidence of congenital malformations in our study is 14.25 per 1000 live births carried out at Vanivilas Hospital, Bangalore which includes both major and minor anomalies. Several studies reported to have higher incidence of 34/1000 by Kulshresta et al4. WHO has reported 18.87/1000, 22.54/1000 at Melbourne and Johannesburg respectively1. These reported incidence rates may not reflect the true as Mcintosh et al5 reported that only 43% of anomalies will be detected at birth and
Table 1: System Wise Distribution of Abnormalities
SL NO.
Abnormalities Total number % Incidence /100 live births
1 CNS 12 19.67 2.80
2 GIT 12 19.67 2.80
3 Multiple system 12 19.67 2.80
4 Musculoskeletal Sys. 11 18.03 2.57
5 CVS 4 6.56 0.93
6 Genito urinary Sys. 2 3.30 0.47
7 Skin 1 1.64 0.23
8 Miscellaneous 7 11.40 1.64
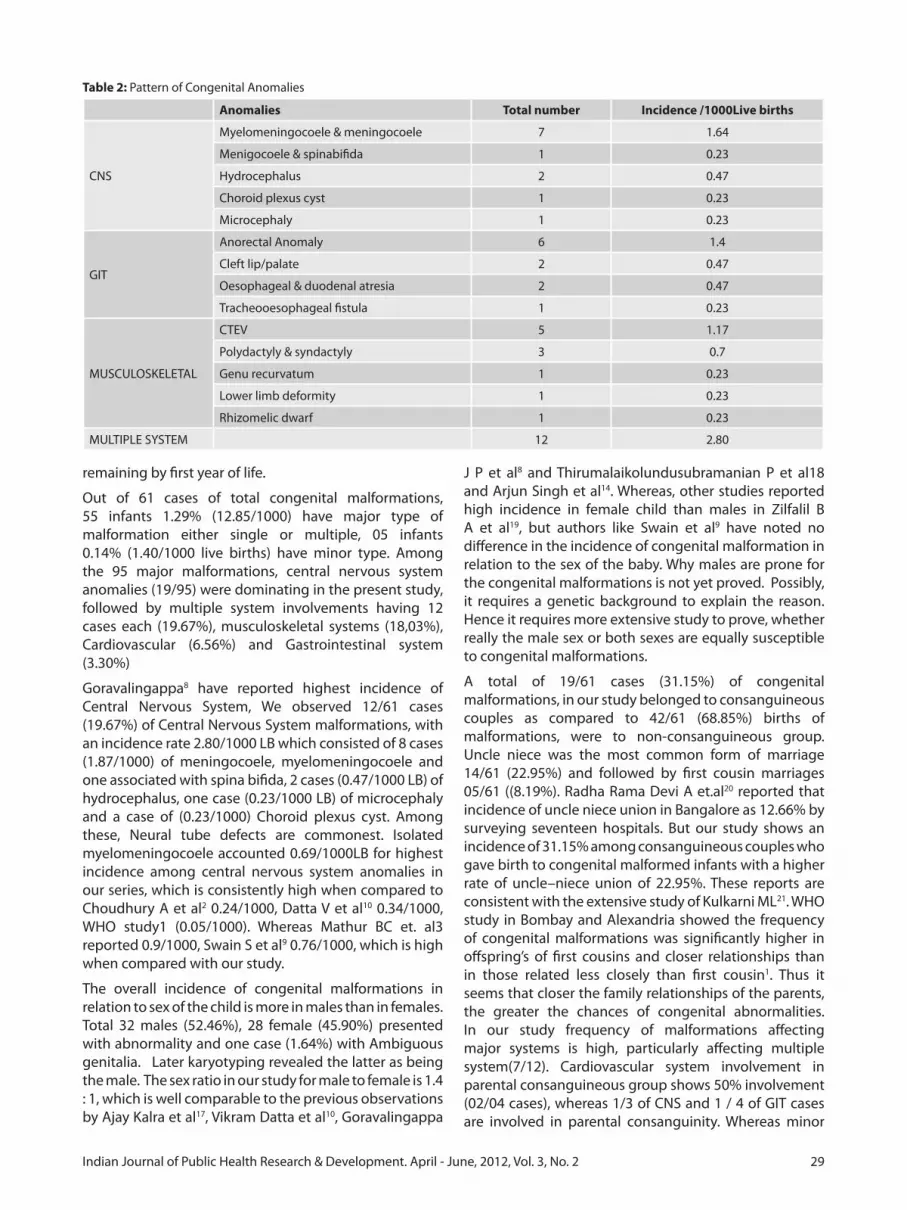
29Indian Journal of Public Health Research & Development. April - June, 2012, Vol. 3, No. 2
remaining by first year of life.
Out of 61 cases of total congenital malformations, 55 infants 1.29% (12.85/1000) have major type of malformation either single or multiple, 05 infants 0.14% (1.40/1000 live births) have minor type. Among the 95 major malformations, central nervous system anomalies (19/95) were dominating in the present study, followed by multiple system involvements having 12 cases each (19.67%), musculoskeletal systems (18,03%), Cardiovascular (6.56%) and Gastrointestinal system (3.30%)
Goravalingappa8 have reported highest incidence of Central Nervous System, We observed 12/61 cases (19.67%) of Central Nervous System malformations, with an incidence rate 2.80/1000 LB which consisted of 8 cases (1.87/1000) of meningocoele, myelomeningocoele and one associated with spina bifida, 2 cases (0.47/1000 LB) of hydrocephalus, one case (0.23/1000 LB) of microcephaly and a case of (0.23/1000) Choroid plexus cyst. Among these, Neural tube defects are commonest. Isolated myelomeningocoele accounted 0.69/1000LB for highest incidence among central nervous system anomalies in our series, which is consistently high when compared to Choudhury A et al2 0.24/1000, Datta V et al10 0.34/1000, WHO study1 (0.05/1000). Whereas Mathur BC et. al3 reported 0.9/1000, Swain S et al9 0.76/1000, which is high when compared with our study.
The overall incidence of congenital malformations in relation to sex of the child is more in males than in females. Total 32 males (52.46%), 28 female (45.90%) presented with abnormality and one case (1.64%) with Ambiguous genitalia. Later karyotyping revealed the latter as being the male. The sex ratio in our study for male to female is 1.4 : 1, which is well comparable to the previous observations by Ajay Kalra et al17, Vikram Datta et al10, Goravalingappa
J P et al8 and Thirumalaikolundusubramanian P et al18 and Arjun Singh et al14. Whereas, other studies reported high incidence in female child than males in Zilfalil B A et al19, but authors like Swain et al9 have noted no difference in the incidence of congenital malformation in relation to the sex of the baby. Why males are prone for the congenital malformations is not yet proved. Possibly, it requires a genetic background to explain the reason. Hence it requires more extensive study to prove, whether really the male sex or both sexes are equally susceptible to congenital malformations.
A total of 19/61 cases (31.15%) of congenital malformations, in our study belonged to consanguineous couples as compared to 42/61 (68.85%) births of malformations, were to non-consanguineous group. Uncle niece was the most common form of marriage 14/61 (22.95%) and followed by first cousin marriages 05/61 ((8.19%). Radha Rama Devi A et.al20 reported that incidence of uncle niece union in Bangalore as 12.66% by surveying seventeen hospitals. But our study shows an incidence of 31.15% among consanguineous couples who gave birth to congenital malformed infants with a higher rate of uncle–niece union of 22.95%. These reports are consistent with the extensive study of Kulkarni ML21. WHO study in Bombay and Alexandria showed the frequency of congenital malformations was significantly higher in offspring’s of first cousins and closer relationships than in those related less closely than first cousin1. Thus it seems that closer the family relationships of the parents, the greater the chances of congenital abnormalities. In our study frequency of malformations affecting major systems is high, particularly affecting multiple system(7/12). Cardiovascular system involvement in parental consanguineous group shows 50% involvement (02/04 cases), whereas 1/3 of CNS and 1 / 4 of GIT cases are involved in parental consanguinity. Whereas minor
Table 2: Pattern of Congenital Anomalies
Anomalies Total number Incidence /1000Live births
CNS
Myelomeningocoele & meningocoele 7 1.64
Menigocoele & spinabifida 1 0.23
Hydrocephalus 2 0.47
Choroid plexus cyst 1 0.23
Microcephaly 1 0.23
GIT
Anorectal Anomaly 6 1.4
Cleft lip/palate 2 0.47
Oesophageal & duodenal atresia 2 0.47
Tracheooesophageal fistula 1 0.23
MUSCULOSKELETAL
CTEV 5 1.17
Polydactyly & syndactyly 3 0.7
Genu recurvatum 1 0.23
Lower limb deformity 1 0.23
Rhizomelic dwarf 1 0.23
MULTIPLE SYSTEM 12 2.80

30 Indian Journal of Public Health Research & Development. April - June, 2012, Vol. 3, No. 2
malformations and skin anomalies shows no association with parental consanguinity. Consanguinity contributes to intra uterine growth retardation. There are recessive genes with a slightly retarding effect on fetal growth present in general population22.
Summary and ConclusionIn present study out of 4280 new born delivered 61 cases of congenital malformations were studied with an Incidence of 14.25/1000 live births. In all the 61 cases, a total of 117 malformations were observed. Among these 95 were major & 22 were of minor type.
Malformations in the new born males were 52.46%, in females it was 45.90% and 1.64% are of ambiguous genitalia thereby showing male preponderance. The central nervous system, gastro-intestinal and multiple system involvement were the commonest with 12 cases each (19.67%), followed by musculoskeletal 11 (18.03%), cardio-vascular 4 (6.56%), genito urinary 02 (3.30%)cases), cutaneous 1 (1.64%) and 07 (11.49%) cases were miscellaneous. The commonest anomaly was neural tube defects (NTD) particularly myelomeningocoele in central nervous system, ano-rectal anomaly in gastro-intestinal system, talipes equinovarus in musculoskeletal and congenital heart disease in cardiovascular and multiple
Table 3: Major Malformations (22.20/1000 Live births)
SL. NO. ANOMALIES TOTAL Incidence /1000LB
1 CTEV 6 1.402 Rocker bottom foot 1 0.233 Rhizomelic limb 2 0.474 Torticollis 1 0.235 Cong. Diaphragmatic hernia 1 0.236 Gum hypertrophy 1 0.237 Natal tooth buds 1 0.238 Tibial bone deformity 1 0.239 Omphalocoele 1 0.23
10 Multiple limb anomalies 1 0.2311 Anorectal anomaly 2 0.4712 Imperforate anus with fistula 9 2.1013 Cleft lip /Cleft palate 4 0.9314 Oesophageal atresia 1 0.2315 Duodenal atresia 1 0.2316 Tracheoesophageal fistula 1 0.2317 CHD-VSD 3 0.7018 CHD-PDA 5 1.1619 CHD-ASD 4 0.9320 CCHD 2 0.4721 Single umbilical artery 1 0.2322 Harlequin syndrome 1 0.2323 Hydrocephalus 5 1.1624 Myelomeningocoele 9 2.1025 Spina bifida 1 0.2326 Dandy walker cyst
malformation1 0.23
27 Microcephaly 2 0.4728 Cong. Choroids plexus cyst 1 0.2329 Cong. Hydronephrosis 2 0.4730 Scrotum like fused phallus 1 0.2331 Ambiguous genitalia 1 0.2332 Ectopia vesicae 1 0.2333 Micrognathia 1 0.2334 Sacrococcygeal teratoma 3 0.7035 Low set ears 6 1.4036 Corneal opacity 1 0.2337 Hypertelorism 5 1.1638 Clouding of cornea 1 0.2339 Multiplecraniofacial anomaly 1 0.2340 Proboscis 1 0.2341 Fused eye balls 1 0.2342 Inguinal hernia 1 0.23
TOTAL 95
Table 4: Minor Malformations (5.14/1000 LB)
SL. NO.
MALFORMATIONS TOTAL NUMBER
Incidence /1000 live births
1 Polydactyly 4 0.93
2 Syndactyly 4 0.93
3 Genu recurvatum 1 0.23
4 Preauricular tag 1 0.23
5 Prominent occiput 1 0.23
6 Short neck 2 0.47
7 Depressed nasal bridge 2 0.47
8 Fish like mouth 1 0.23
9 High arched palate 3 0.70
10 Incurving of fingers 1 0.23
11 Long toes 1 0.23
12 Congenital hydrocele 1 0.23
Total 22
Table 5: Relation of Consanguinity to Congenital Malformations
Consanguinity Cases
Consanguineous 19(31.15%)
Non-consanguineous 42(68.85%)
Total 61
Table 6: Incidence of Congenital Malformation at Various Places Compared With Present Study
Sl. No.
AUTHOR REGION INCIDENCE (PER 1000 BIRTHS)
1 Ghosh & Bali L.6 Delhi 34.0
2 Stevenson AC et al- WHO1 Bombay 8.6
3 Stevenson AC et al - WHO1 Calcutta 3.1
4 Mathur BC3 Hyderabad 31.0
5 Choudhury et.al2 Calcutta 2.9
6 Mishra PC et al7 Allahabad 14.64
7 Goravalingappa8 Hubli 31.27
8 Swain S et al9 Banaras 12.0
9 Datta V et.al10 Sevagram (Wardha)
12.4
10 Presents Study Bangalore 14.25

31Indian Journal of Public Health Research & Development. April - June, 2012, Vol. 3, No. 2
Table 11: Comparative study showing system wise distribution of cases
S. NO.
AUTHOR CNS GIT MS CVS RS GUS SKIN MULTIPLE MISC
1 McIntosh Ret al5
60 11/1000
41 07/1000
154 28/1000
33 06/1000
701/1000
39 07/1000
88 16/1000
0 501/1000
2 Ghosh S et al6 389/1000
266/1000
6414.7
61.3
10.2
102/1000
235/1000
0 0
3 WHO BOMBAY Stevenson AC et al1
142 4.19/1000
38 0.58/1000
78 1.95/1000
9 0.22/1000
0 6 0.15/1000
4 Stevenson AC et al – Calcutta1
11 1.86/1000
3 0.15/1000
22 1.14/1000
2 0.10/1000
4 0.20/1000
5 Tibrewala NS16 et al
19 1.54/1000
56 4.53/1000
44 3.56/1000
30 2.43/1000
0 41 3.32/1000
67 4.53/1000
0 4 0.32/1000
6 Sugunabai NS et. al13
21 2.9/1000
31 4.3/1000
10 1.4/1000
7 1.0/1000
0 4 0.6/1000
16 2.2/1000
304.2/1000
13 1.8/1000
7 Choudhury A2 et al
13 0.69/1000
15 0.74/1000
9 0.44/1000
0 3 0.14/1000
0 0 20.09/1000
0
8 Datta V et al10 5 1.71/1000
8 2.7/1000
9 3.11/1000
2 0.69/1000
0 3 1.02/1000
0 0 13 4.53/1000
9 PRESENT STUDY
12 2.80/1000
12 2.80/1000
11 2.57/1000
4 0.93/1000
0 2 0.47/1000
1 1.64/1000
122.80/1000
7 1.64/1000
(Figures underneath the number indicate incidence)
systems involvement. Maximum of 42 cases (68.85%) were born to non-consanguineous group and 19 cases (31.15%) were to consanguineous couples.
In conclusion, the incidence of congenital malformations in this study is comparatively low to other parts of India and abroad. Mostly etiological factors remain obscure, but require detailed history taking and thorough investigations for the early diagnosis and treatment. Genetic study should be made mandatory for all the pregnancies presenting with family history of suspected chromosomal anomalies and in pregnancies of repeated abortions/still births which are highly suggestive of chromosomal aberrations and in such cases prenatal genetic counseling is a must.
References1. Alan C. Stevenson, Harold A. Johnston, patrica stewart MI et
al Congenital Malformations: A report of a study of series of consecutive Births in 24 centres. Bull. WHO 1966; 34: 1-127.
2. Arati Choudhury, Geeta Talukder and Archana Sharma. Neonatal congenital malformations in Calcutta. Indian Journal of Pediatrics 1984; 21: 399-405.
3. Mathur BC, Sheila Karan and Vijaya Devi KK. Congenital Malformations in the Newborn. Indian Journal of pediatrics 1975; XII (2): 179-183.
4. Kulshrestha R., Nath LM. and Upadhyaya P. Congenital Malformations in live born infants. A Rural Community. Indian Journal of Pediatrics 1983; 20 : 45-49.
5. Rustin McIntosh, Katharine K merritt, Mary R. Richards et al. The Incidence of Congenital Malformations: A study of 5964 pregnances. Journal of Pediatrics 1954; 14: 505-521.
6. Shanti Ghosh and Lata Bali, Congenital Malformations In the Newborn. Indian Journal of Child Health 1963; 12: 448-452.
7. Mishra PC. and Baveja R. Congenital malformations in the newborn – A prospective study. Indian Journal of Pediatrics 1989; 26 ; 32-35.
8. Goravalingappa JP. and Nashi HK. Congenital malformations in a study of 2398 consecutive births. Indian Journal of Medical
Research 1979 : 69 : 140-146.9. Swain S., Agrawal A. and Bhatia BD. Congenital Malformations
at birth. Indian Journal of Pediatrics 1994 ; 31 ; 1187-1191.10. Vikram Datta and Pushpa Chaturvedi. Congenital
Malformations In Rural Maharashtra. Indian Journal of Pediatrics 2000 ; 37 : 998-1001.
11. Philip M Marden, David W Smith and Michael J Donald Congenital anomalies in the newborn infant including minor variations. The Journal of Pediatrics 1964; 64(3): 357-371.
12. Singh M., Jawadi MH., Arya LS. et.al. congenital malformations at birth among live-born infants in Afghanistan, a prospective study. Indian Journal of Pediatrics 1982; 49 : 331-335.
13. Sugunabai NS., Mary Mascarene, Syamalan et.al., An Etiological Study of Congenital Malformation In the New Born. Indian Journal of Pediatrics 1982 ; 19 : 1003-1007.
14. Arjun Singh, Ravinder K Gupta. Pattern of Congenital Anomalies in Newborn: A Hospital Based Prospective Study. JK science. 11 (1); January-March 2009: 34-36
15. Ali, Ahmadzadeh; Zahad, Safikhani; Masoumeh, Abdulahi; Azar, Ahmadzadeh. Congenital malformations among live births at Arvand hospital, Ahwaz, Iran – Aprospective study. Pakistan Journal of Medical Sciences 2008; 24 (1): 33-37
16. Tibrewala NS and Pai PM. Congenital Malformations in the Newborn period. Indian Journal of Pediatrics 1974; XI (6): 403-407.
17. Ajay Kalra, Kalra K, Sharma V. et.al., Congenital malformations. Indian Journal of Pediatrics 1984 ; 21 : 945-950.
18. Thirumalaikolundusubramanian P. and Jayaprakash CA. Congenital Anomalies and sex of the baby. Indian Journal of Pediatrics 1985; 22 ; 75.
19. Zilfalil BA. and Rowani MR. Online Birth Defects in Newborn at Hospital Universiti sains Malaysia, Kelantan. Web page http:/uia4.tripod.com/Vol2-No-1/Vol2-No1-B3.htm
20. Radha Rama Devi A., Appaji Rao N, and Bittles AH., Inbreeding in the state of Karnataka, South India. Journal of Human Heridity 1982: 32 ; 8-10.
21. Kulkarni ML. and Mathew Kurian. Consanguinity and the effect on fetal growth and development: A South Indian Study. Journal of Medical Genetics 1990; 27: 348-352.
22. Sibert J.R., Malati Jadhav and Inbaraj S.G., Petal growth and parental Consanguinity. Archieves of Disease in Childhood. 1979; 54:317-319.

32 Indian Journal of Public Health Research & Development. April - June, 2012, Vol. 3, No. 2
A rare form of aggressive pregnancy gingival enlargement - A case reportAmitabh Srivastava1, Krishna Kumar Gupta2, Jaishree Garg3, Sunita Srivastava4
1Reader, 2Professor, 3Senior Lecturer, Department of Periodontology, 4Post Graduate Student, Department of Oral Medicine, Diagnosis and Radiology, Sardar Patel Post Graduate Institute of Dental and Medical Sciences, Lucknow
AbstractGingival enlargement related to pregnancy is sometimes seen in the oral cavity. Pregnancy is a physiological state that brings full of changes in a woman’s life. The metabolism and immunology of the body are modified by progesterone and estrogen as well as other local factors, these sex hormones may modify the oral mucosa and may lead to various periodontal diseases. A case of female patient 23 yrs of age reported during 8th month of pregnancy with a localised gingival enlargement affecting the buccal aspect of left maxillary central incisor upto canine. The hormonal changes occurring during pregnancy may be associated with generalized or localised gingival enlargement and the presence of local factors may accentuate the gingival response.
IntroductionPregnancy has far reaching systemic effects extending beyond the reproductive system involving complex physical and psychological changes that have an impact on even the healthy woman. These effects occur mainly due to hormones on almost every organ system1,2. Progesterone is the main sex pregnancy hormone. The level of it rises until the 8th month of pregnancy and after that it becomes stable until giving birth. The estrogen level rises slowly until the end of the pregnancy3. The high level of hormones in blood and saliva may cause some periodontal reaction and may increase or cause periodontal disorders.The gingival enlargement has been associated with a variety of local and systemic factors so differential diagnosis becomes an important aspect for complete management of the lesion. Most of the causative factors lead to an unusual hyperplastic tissue response to chronic inflammation associated with local irritants such as plaque, calculus or bacteria and their products4. Hormonal changes occurring during pregnancy and puberty, have been known to be associated with varying types of gingival enlargement. Hormonal changes can significantly potentiate the effects of local irritants on gingival connective tissue5.
In all forms of enlargements, good oral hygiene is necessary to minimize the effects of systemic factors, Gingivoplasty or Gingivectomy may be required after pregnancy but should be done in combination with prophylaxis and oral hygiene instructions6. The pregnancy gingival
tumour is a disorder found in .2 to .5% of the pregnant females. It is a benign rapidly growing lesion occurring usually in 1st trimester of pregnancy and extends upto 3rd trimester. Pregnancy tumour is a smooth or lobulated exophytic lesion with a pedunculated or sessile base. This paper presents a case report of a pregnancy associated aggressive gingival enlargement of enormous size.
Case ReportA female patient of 23 years of age reported to the Department of Periodontics, with a localized massive gingival overgrowth on the upper left front region in relation to maxillary left central incisor, lateral incisor and cannine with protruding lips (fig:1,2,3 and 4). There was no history of drug intake and hereditary reasons. Patient was eight months pregnant and revealed that her gums used to bleed on brushing since three months of pregnancy, but the enlargement came to the present size at this time, the patient reported that she felt difficuilty in chewing, speech and closing of the lips, her esthetics was also compromised because of the enlargement.
Fig. 1: Gingival enlargement i.r.t 21, 22 & 23 during 8TH month of pregnancy
Fig. 2: Gingival enlargement extraoral view

33Indian Journal of Public Health Research & Development. April - June, 2012, Vol. 3, No. 2
The gingival swelling was so massive that it was evident extraorally. On Intraoral examination the size of the lesion was about 3.5 x 2 cms in dimension and pedunculated. The tumour was bright red in colour, soft that bled on slightest provocation. Subgingival calculus and plaque was present. Patient was unable to maintain oral hygiene in this area, because of gingival enlargement. Oral prophylaxis was performed after routine haematological investigation. Instructions regarding maintenance of oral hygiene were given and advised to return post partum.She reported to the department one month after the delivery of the baby. The dimension of the tumour was same as before delivery. The gingival overgrowth was excised with the help of 15 no. b.p blade and electrocautery, the bleeding was controlled by the help of the ball tip of the electrocautery (fig:5,6). Periodontal dressing was done in the involved region.(fig:9) The excised lesion (fig:7) was sent for histopathological examination, which revealed epithelial proliferation and underlying capillary proliferation along with marked inflammatory cell infiltration seen (fig:8). The healing was uneventful and no relapse was seen on follow up. (fig:10)
DiscussionThe gingival changes in pregnancy were described as early as 1898 by Pinard. Gingivitis in pregnancy is caused by bacterial plaque, like in non-pregnant individuals. Pregnancy accentuates the gingival response to plaque. The incidence of gingivitis in pregnancy varies from
around 50 to 100%. Pregnancy does not alter the healthy gingiva it effects the severity of previously inflamed area. In some cases the inflammed gingiva forms a discrete mass referred to as pregnancy tumour7. Kornman & Loesch (1980) reported that the subgingival flora changes to a more anaerobic flora as pregnancy progresses Prevotella intermedia is the microorganism that increases significantly during pregnancy8. They also stated that the increase is due to elevations of levels of systemic estradiol and progesterone. O’Neil (1979) suggested that the altered tissue response to plaque is due to depression of the maternal T lymphocyte9. Formicola & Associates (1970) have shown that gingiva is a target organ for female sex hormones10.Therefore, the maintenance of oral hygiene before and during pregnancy is very important in order to reduce the incidence and the severity of gingival inflammation. It is generally accepted that increase in gingival inflammation typically begins in the second month and reaches the maximal level during the eighth month of pregnancy. These inflammatory changes may lead to gingiva that appears edematous, hyperplastic and erythematous; the changes may be localized or generalized, and are usually noted on the marginal gingiva and interdental papilla11,12.
Summary & ConclusionThe local factors i.e. plaque and calculus are known to be responsible for gingival enlargement during pregnancy. The hormonal factors also play a role in aggravating the hyperplasia. Therefore, the importance of regular dental check up and oral prophylaxis(scaling) cannot be overlooked. In all forms of gingival enlargements, good oral hygiene is necessary to minimize the effects of
Fig. 3: Side view
Fig. 4: Gingival enlargement during post-partum period
Fig. 5: Use of Electrocautery
Fig. 6: After excision of the massive gingival enlargment

34 Indian Journal of Public Health Research & Development. April - June, 2012, Vol. 3, No. 2
systemic factors. In the present case, the massive size of the hyperplastic tissue was excised by surgical excision and the contouring was done by electrocautery thus relieving the patient from difficuilty in speech, chewing, closing of lips and esthetics.
References1. Sangeeta gajendra oral health and pregnancy NYSDJ. 2004,
40-42. Barak s, oettinger M.Common oral manifestations during
pregnancy a review. Obstet gynecol surv.2003,58(9):624-8.3. Laine MA : Effect of pregnancy on periodontal and dental
health. Acta Odontol.Scand.2002,60,257-2644. Regezi JA, Sciubba J (eds): Oral Pathology, Clinical-Pahological
Correlations, 2nd edition. Philadelphia; WB Saunders. 1993; pp196-202.
5. Daley TD, Nartey NO, Wysocki GP. Pregnancy tumor: an analysis. Oral Surg Oral Med Oral Pathol 1991;72:196-199.
6. Maier AW, Orban B. Gingivitis in Pregnancy. Oral Surg 1949;2:234.
Fig. 7: Excised Tissue
Fig. 8: Histopathological photograph
Fig. 9: Periodontal dressing given.
Fig. 10: Post-operative after 1 month
7. Cohen DW, Shapiro J, Friedman L, et al. A longitudinal investigation of the periodontal changes during pregnancy and fifteen months May 2010;4(2) post partum. J periodontal 1971;42:653.
8. Kornman KS, Loesch WJ. The subgingival microbial flora during pregnancy. J Perio dont Res 1980;15:111.
9. O’Neil TCA. Maternal T-lymphocyte response and gingivitis in pregnancy. J Periodontal 1979;50:178.
10. Formicola AJ, Weatherford T, Grape H Jr. The uptake of H3-estradiol by oral tissues in rats. J Periodontal Res 1970;5:269. 10. Abberitg G, Sigurdson A. Hyperplastic lesions of the gingival and alveolar mucosa. A study of 175 cases. Acta Odontol Scand 1983;41:75-86. 1]
11. S. Offenbacher, D. Lin, R. Strauss, et al., “Effects of periodontal therapy during pregnancy on periodontal status, biologic parameters, and pregnancy outcomes: a pilot study,” Journal of Periodontology, vol. 77, no. 12, pp. 2011–2024, 2006.
12. B. Clothier, M. Stringer, and M. K. Jeffcoat, “Periodontal disease and pregnancy outcomes: exposure, risk and intervention,” Best Practice and Research, vol. 21, no. 3, pp. 451–466, 2007.

35Indian Journal of Public Health Research & Development. April - June, 2012, Vol. 3, No. 2
A two year study of polycystic ovary syndrome in Davangere, KarnatakaGayatri Linganagouda Patil1, Geeta Hosanemati2, L.S. Patil3, Vijayanath V4, Venkatesh M. Patil5, Rajeshwari R. Surpur6
1Associate Professor, 2Assistant Professor, Department of OBG, 3Associate Professor, Department of Surgical Oncology, 4Associate Professor, Department of Forensic Medicine & Toxicology, 5Assistant Professor, Dept. of Pharmacology, 6Associate Professor, Dept. of Microbiology, S.S Institute of Medical Sciences and Research Centre, Davangere- 577005, Karnataka
Abstract
IntroductionPolycystic ovarian syndrome (PCOS) is one of the common gynaecological condition of diverse etiology 30% of the infertile women have anovulation due to polycystic ovarian disease, 20-30% of them have hyperandrogenemia and hyperprolactenemia1.
MethodsAn explorative type of hospital based study of 102 patient, during a 2 year period was done with 75 (73.52%) married women and 27 (26.47%) unmarried women with varied symptomatology.
Results67.6% were in the age group 21-30 years. Ovulation induction was done in all the infertile group, an ovulation induction rate of 88.40% was achieved and of these 21 (34.42%) conceived, others on follow up.
Of the unmarried women, all had menstrual irregularities along with obesity (51.85%) and hirsutism (48.14%), after treatment 66.66% had an improvement in their symptoms, other still on follow up.
ConclusionThis study demonstrates the various presentations either single or in combination and their response to various medical and surgical management.
There should be a rational approach to therapy, treatment of polycystic ovarian syndrome should be tailored according to the major symptoms of the patients.
IntroductionPCOS is an incompletely understood enigmatic disorder of heterogeneous nature and is the commonest endocrinopathy of the reproductive age. PCOS starts appearing from 15-25 years of age and it may take years, for its clinical presentation to appear. It is diagnosed in 5-10% of women between adolescence and menopause2.
It has an autosomal dominant inheritance3 with great
phenotypic variability presenting with infertility (mean incidence 74%), menstrual irregularity (mean incidence of DUB 29%, and ammenorrhoea 51%) and androgen excess (mean incidence of hirsutism 69% while of virilization being 21%),4 along with serious long term consequences like endometrial carcinoma, obesity, hyperinsulinsim, cardiovascular risks, bone disease etc., leaving their impact on quality of life, morbidity and mortality3.
The diagnosis of PCOS depends on confirming the presence of hyperandrogenism with elevated serum, testosterone and an elevated LH:FSH ratio. Either or both of these may be found in 60-70% of patients, with greatest sensitivity and specificity2.
Ultrasound is now considered as the gold standard in the evaluation of infertility1. Diagnostic laparoscopy with or without ovarian drilling is used as a second line of management in cases of failed induction or in unexplained infertility and also to assure tubal patency5.
The purpose of this study is to know about the clinical course and outcome of polycystic ovarian disease.
Study Aims and ObjectivesAim is to find out the various presentations either single or in combination and their response to the various medical and surgical management.
Objectives1) To study the clinical presentations and hormonal
imbalances in these women with polycystic ovarian disease.
2) Sonological evaluation of women with polycystic ovarian disease and its correlation with hormonal values.
3) Laparoscopic evaluation and/or ovarian drilling of infertile women with polycystic ovarian disease, after failed ovulation induction.
4) To study the outcome of all the modalities of treatment particularly in hirsutism and infertility.
Study Design and Study PopulationType of study
Explorative type of hospital based study.

36 Indian Journal of Public Health Research & Development. April - June, 2012, Vol. 3, No. 2
Place of study
All the women attending the gynaecology out patient department at S.S. Institute of Medical Science and Research Centre with complaints of hirsutism, infertility and menstrual irregularities were studied.
Study Eligibility CriteriaSample size of duration of study
The criteria was that a total of about 100 patients or the number of patients with polycystic ovarian disease in a period of 2 years from Oct. 2008 to Oct. 2010 were recruited for the purpose of the study. The related data were collected by detailed history and clinical examination.
Inclusion CriteriaAll patients with polycystic ovarian disease irrespective of age and body weight.
Exclusion CriteriaPatients were later excluded if the cause of hirsutism, infertility and obesity was of non-ovarian origin.
Methodology
Study ProcedureIn the out patient clinic, an informed consent was taken, and patients were recruited for the study. Then a detailed history and general examination was done.
A diagnosis of PCOS was made based on the relevant history, clinical findings and confirmed by relevant investigations which included basic investigations like hemoglobin levels, urine routine and random blood sugar estimations, hormonal profile testosterone, follicle stimulating hormone, leutinising hormone, prolactin, thyroid stimulating hormone levels were assessed within 3 days of menstruation and an ultrasound examination for prediction of ovulation was done around the time of ovulation.
The semen analysis of the husband, if the patient presented with infertility was done to rule out an associated male factor as a cause of infertility.
For those who desired to conceive, ovulation induction with clomiphene citrate was the initial choice, with 50 mg/day for 5 days, starting on D2 of cycle. Follicular study was done on 10th, 12th and 14th day of the cycle.
To improve the mid cycle LH surge, Inj HCG (5000 – 10000 u) Im was given around the time at which the follicle size was 18-20 mm and HCG administered patients required intense follow-up for any evidence of ovarian hyperstimulation symptoms.
Patients with hirsutism were more resistant to CC alone and so dexamethasone was added at a low dose of 0.5 mg, orally and those with high prolactin levels were given bromocriptine strating at an usual dose of 2.5 mg/day, orally for 2 months along with clomiphene. A repeat hormonal assay was done after 2 months of treatment to see for the response.
If all the above combinations failed, then preparations of gonadotropins (HMG) was given for follicle stimulation beginning by 7-14 days of the cycle with continuous daily intramuscular injections beginning with 75 u/day or with purified FSH preparations with a dose of 1 amp/day (75 Iu FSH) intramuscularly was given and monitored.
Metformin was added to obese or those with insulin resistance as 500 mg tid for 3-4 months. If when the medical line of treatment was unsuccessful to achieve conception, diagnostic hystero laparoscopy with chromopertubation was planned, with or without ovarian drilling under general anaesthesia. Following laparoscopy, clomiphene was restarted. Conception rates improved, conceived women were followed up to know the outcome of pregnancy.
In the other group of unmarried women with polycystic ovarian disease, apart from a general advise of weight reduction, they were started on either oral contraceptives with or without Finasteride (Once a day) and Aldactone (Once a day) for a period of 3 to 6 months and then evaluated for the improvement of symptoms being regularization of cycles, decreasing hirsutism scores and reduction in body weight. A repeat hormonal assay was done 3 months later for the response to the treatment.
ResultsOf the 102 patients with PCOS, 67.6% group of 21-30 years.
75 women (73.52%) were married and 27 (26.47%) were unmarried women.
Chief complaints in the married woman group.
Table 1: Chief complaints
Presenting complaints Frequency Percentage
Infertility 75 73.50
Primary infertility 57 78.66
Secondary infertility 18 21.33
Hirsutism 26 25.49
Menstrual irregularities 56 74.66
Obesity 47 46.07
Early virilisation 02 01.96
Total 75
Infertility (73.5%) was their chief complaint along with menstrual irregularities (74.66%) and obesity (46.07%) and Virilisation in 1.96%.
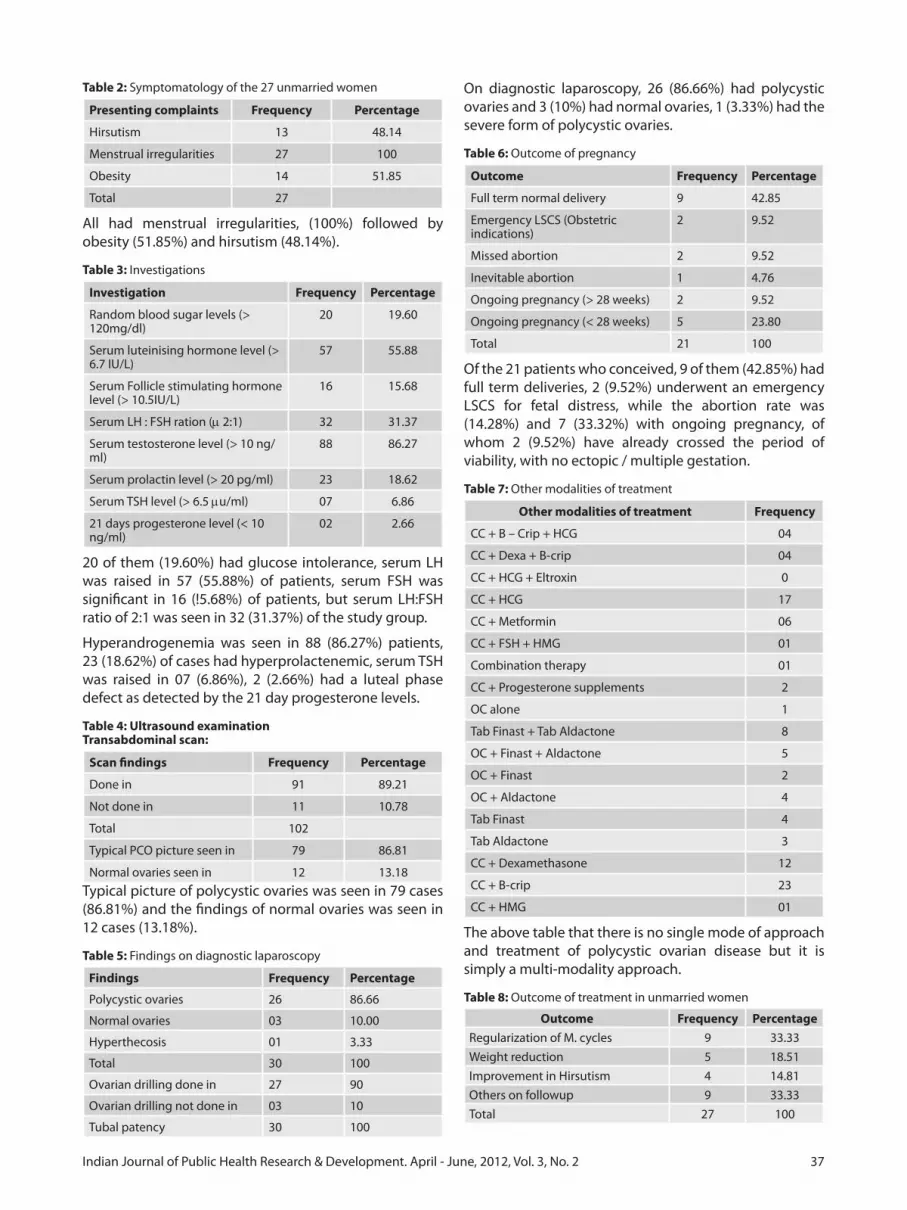
37Indian Journal of Public Health Research & Development. April - June, 2012, Vol. 3, No. 2
Table 2: Symptomatology of the 27 unmarried women
Presenting complaints Frequency Percentage
Hirsutism 13 48.14
Menstrual irregularities 27 100
Obesity 14 51.85
Total 27
All had menstrual irregularities, (100%) followed by obesity (51.85%) and hirsutism (48.14%).
Table 3: Investigations
Investigation Frequency Percentage
Random blood sugar levels (> 120mg/dl)
20 19.60
Serum luteinising hormone level (> 6.7 IU/L)
57 55.88
Serum Follicle stimulating hormone level (> 10.5IU/L)
16 15.68
Serum LH : FSH ration (m 2:1) 32 31.37
Serum testosterone level (> 10 ng/ml)
88 86.27
Serum prolactin level (> 20 pg/ml) 23 18.62
Serum TSH level (> 6.5 mu/ml) 07 6.86
21 days progesterone level (< 10 ng/ml)
02 2.66
20 of them (19.60%) had glucose intolerance, serum LH was raised in 57 (55.88%) of patients, serum FSH was significant in 16 (!5.68%) of patients, but serum LH:FSH ratio of 2:1 was seen in 32 (31.37%) of the study group.
Hyperandrogenemia was seen in 88 (86.27%) patients, 23 (18.62%) of cases had hyperprolactenemic, serum TSH was raised in 07 (6.86%), 2 (2.66%) had a luteal phase defect as detected by the 21 day progesterone levels.
Table 4: Ultrasound examinationTransabdominal scan:
Scan findings Frequency Percentage
Done in 91 89.21
Not done in 11 10.78
Total 102
Typical PCO picture seen in 79 86.81
Normal ovaries seen in 12 13.18Typical picture of polycystic ovaries was seen in 79 cases (86.81%) and the findings of normal ovaries was seen in 12 cases (13.18%).
Table 5: Findings on diagnostic laparoscopy
Findings Frequency Percentage
Polycystic ovaries 26 86.66
Normal ovaries 03 10.00
Hyperthecosis 01 3.33
Total 30 100
Ovarian drilling done in 27 90
Ovarian drilling not done in 03 10
Tubal patency 30 100
On diagnostic laparoscopy, 26 (86.66%) had polycystic ovaries and 3 (10%) had normal ovaries, 1 (3.33%) had the severe form of polycystic ovaries.
Table 6: Outcome of pregnancy
Outcome Frequency Percentage
Full term normal delivery 9 42.85
Emergency LSCS (Obstetric indications)
2 9.52
Missed abortion 2 9.52
Inevitable abortion 1 4.76
Ongoing pregnancy (> 28 weeks) 2 9.52
Ongoing pregnancy (< 28 weeks) 5 23.80
Total 21 100
Of the 21 patients who conceived, 9 of them (42.85%) had full term deliveries, 2 (9.52%) underwent an emergency LSCS for fetal distress, while the abortion rate was (14.28%) and 7 (33.32%) with ongoing pregnancy, of whom 2 (9.52%) have already crossed the period of viability, with no ectopic / multiple gestation.
Table 7: Other modalities of treatment
Other modalities of treatment Frequency
CC + B – Crip + HCG 04
CC + Dexa + B-crip 04
CC + HCG + Eltroxin 0
CC + HCG 17
CC + Metformin 06
CC + FSH + HMG 01
Combination therapy 01
CC + Progesterone supplements 2
OC alone 1
Tab Finast + Tab Aldactone 8
OC + Finast + Aldactone 5
OC + Finast 2
OC + Aldactone 4
Tab Finast 4
Tab Aldactone 3
CC + Dexamethasone 12
CC + B-crip 23
CC + HMG 01
The above table that there is no single mode of approach and treatment of polycystic ovarian disease but it is simply a multi-modality approach.
Table 8: Outcome of treatment in unmarried women
Outcome Frequency PercentageRegularization of M. cycles 9 33.33Weight reduction 5 18.51Improvement in Hirsutism 4 14.81Others on followup 9 33.33Total 27 100

38 Indian Journal of Public Health Research & Development. April - June, 2012, Vol. 3, No. 2
With oral contraceptives, 9 (33.33%) had cycle regularization, hirsutism improved with aldactone and finastride in 14.8% cases.
Table 9: Final outcome of the infertility group
Outcome Frequency PercentageTotal patients treated 75 100Ovulation induction done in 69 92.0Patients who ovulated 61 88.40No. of women who conveived 21 34.42Unexplained infertility 04 5.33Mild OHSS 02 2.89On followup 48 69.56
With 88.40% of ovulation induction rates, (34.42%) conceived, with a total unexplained infertility 4 (5.33%) and incidence of mild OHSS occurred in2 (2.89%) while the others 48 (69.56%) are still on follow up.
Table 10: Correlation of clinical presentation and hormonal imbalances in the infertility group
Correlations Frequency PercentageMenstrual irregularities 56 74.66Obesity 47 62.66Hirsutism 26 34.66Virilisation 02 2.66Serum LH (> 6.7 Iu/L) 44 58.66Serum FSH (> 10.5 Iu/L) 13 17.33Serum LH:FSH (> 2:1) 26 34.66Serum testosterone (> 10 mg/dl) 46 61.33Serum prolactin (>10 pg/ml) 16 21.33Serum TSH (> 6.5 mu/ml) 07 9.33Random blood sugars (> 120 mg/dl) 20 19.60Total 75
A significant LH:FSH ratio of > 2:1 was seen in only 34.66% cases but a raised serum testosterone value definitely correlated with the symptoms in 61.33% of these cases. And so serum testosterone can be used as a definitive hormonal test for diagnosing PCOS.
Carbohydrate intolerance, hyperprolactinaemia and hypothyroidism were present in 19%, 21% and 9% respectively.
Table 11: Correlation of scan findings with hormonal values in the infertility group
Correlations Frequency PercentageOn transabdominal scan Typical PCO picture seen in 63 84.00Normal ovaries seen in 12 16.00Serum FSH (> 10.5 Iu/L) 13 17.33Serum LH (> 6.5 Iu/L) 44 58.66Serum LH/FSH ratio (> 2:1) 26 34.66Serum testosterone (> 10 mg/ml) 46 61.33Total 75
It could be concluded that scan picture correlated with the serum testosterone value and is more definitive in the approach towards the disease.
Statistical AnalysisAnalysis shows that a high LH:FSH ratio (p < 0.01) cases fared better with surgical therapy and high testosterone (p < 0.05) cases fared better with medical therapy.
DiscussionKey findings of the results are as follows:
• 81.37%presentedwithmenstrualirregularities,withpolycystic ovaries on scan is 86% and 92% of them had atleast one hormonal abnormality to support the diagnosis, correlated with the incidence of 75%, 56.75% and 93% respectively, reported by Adams et al.1
• Results reveal that 26 (34.56%) of infertile patientswith abnormal LH/FSH ratio, only 21 (80.76%) had typical polycystic ovarian morphology on ultrasound and 5 (19.23%) had normal ovaries on scan. Ardaens et al in their study have showed that transvaginal scan is more sensitive in diagnosing polycystic ovarian when compared to a transabdominal scan.6
• ElevatedLHlevelswasseenin58.66%FSHin17.35%and testosterone in 61.33% and LH/FSH ratio > 2:1 with p value < 0.01 are similar to results of the study conducted by Robinson et al.7,8
• Ovulation induction rates of 88.4%, with averagefollicular size 19 x 21 mm and 41.93% conception rates correlate with Rajan et al9 and abortion rates of 13% correlated with Compo et al.10
ConclusionIn polycystic ovarian syndrome there is no single test as the gold standard to prove the disease, as it is a cohort of abnormalities requiring a multi modality approach towards the disease.
In this study, there was an overall improvement of symptoms in 66.66% of unmarried women with PCOD, after appropriate treatment.
In the infertility group of patients, the ovulation rate of 88.40%, pregnancy rate of 34.43% and the pregnancy rate after laparoscopy / drilling of 26.7% was acceptable statistically. With a significant difference between the medical and surgical modalities of management with respect to a high LH:FSH ratio and testosterone values.
Proper selection of the patients, intense monitoring and early detection of complications go a long way towards the success of conception.
References1. Adams J, Polson DW, Franks S. Prevalence of polycystic ovaries
in women with anovulation and idiopathic hirsutism. Br Med J, 1986;293:355-358.
2. Robisnson S. et al. Which hormone tests for the diagnosis of polycystic ovary syndrome ? Bri J Obstet and Gynaecol, 1992;99:232-238.

39Indian Journal of Public Health Research & Development. April - June, 2012, Vol. 3, No. 2
3. Campo, Sebastiano. Ovulatory cycles, pregnancy outcome and complications after surgical treatment of polycystic ovary syndrome. Obstet Gynaecol Survey, 1998;53(5):297-305.
4. Shah D, Agarwal S. Polycystic ovarian syndrome in the Adolescent girl. J Obstet Gynaecol India, 1999;49(5):46-48.
5. Rajan R. Endocrinology of PCOs : clinical presentation. Chap. 22, Postgraduate Reproductive Endocrinology, Jaypee Publishers, New Delhi, 4th edition. 1997. pg.325.
6. Attaran M. Polycystic ovarian syndrome, Cleveland clinic, center for continuing education, 2008;1-8.
7. Al-Ojaimi EH. Laparoscopic ovarian drilling for polyeystic
ovarian syndrome in clomiphene resistant women with anovulatory infertility. Bahrian Med Bull; 2003;25(2):58-63.
8. Rogerio LA. The role of neurotransmitters and opioids in polycystic ovarian syndrome. Endocrinol Metabol Clin North Am 1988;17(4):667.
9. Gloria BA. Polycystic Ovary Syndrome : Metabolic challenges and new treatment options. Am J Obstet Gynaecol, 1998;179(6)2:S87-S113.
10. Ardaens et al. Polycystic ovarian disease: contribution of vaginal endosonography and reassessment of ultrasonic diagnosis. Fertil Steril 1991;55(6):1062-1068.

40 Indian Journal of Public Health Research & Development. April - June, 2012, Vol. 3, No. 2
A pilot syudy of relation of polycystic ovary syndrome and metabolic disorder in Davangere, KarnatakaGeetha Hosanemati1, Gayatri Patil2, Prema Prabhudev3, Anitha M.R4, Vijayanath V5, L.S. Patil6
1Assistant Professor, 2Associate Professor, 3Professor and Head, Department of Obstetrics and Gynaecology, 4Assistant Professor, Department of Anatomy, 5Associate Professor, Department of Forensic Medicine & Toxicology, 6Associate Professor, Department of Surgical Oncology, S.S.Institute of Medical Sciences & Research Centre, Davangere-577005, Karnataka, India
Abstract
IntroductionPolycystic ovarian syndrome (PCOS) is seen in 5 – 10% of women of the reproductive age, is the most common form of anovulatory infertility1,2,3.
Evidence prove that these women exhibit a characteristic dyslipidaemia non insulin dependent diabetes and cardiovascular disease in later life, which are the hallmarks of the metabolic syndrome4.
Presence of 3 of 5 common cardiovascular risk factors as a criteria, the prevalence of metabolic syndrome in PCOS is very high (43 – 46%)5.
Primary infertility cases with clinical features of menstrual irregularities, weight gain, hirsutism, acne and galactorrhea with scan picture of polycystic ovaries were considered for diagnosing PCOS cases.
Aim of the StudyAim is to establish the relation between PCOS and metabolic syndrome.
Material and Methods
Study DesignA prospective, noninterventional case control study was conducted with 60 primary infertility patients, attending the gynaecological department, S.S. Institute of Medical Sciences and Research Centre, Davangere, Karnataka.
Study population: All these patients had clinical features suggestive of PCOS, of these 30 patients with ultrasound findings of polycystic ovaries were taken as cases and the others were age matched contemporary controls.
Age group: 20 – 30 years.
Duration of study: 8 months. (Dec. 2009 – July 2010)
MethodologyAfter a brief history, waist circumference and blood pressure was recorded, then patients were asked to come on overnight fasting for a fasting blood sugar level and lipid profile assessment.
ResultsIn the present study all the five parameters needed for diagnosing metabolic syndrome were raised in PCOS cases and compared to controls. Values were statistically significant by student’s unpaired ‘t’ test.
An incidence of 38% of metabolic syndrome was noted in the PCOS cases studied.
ConclusionWomen with PCOS were strongly associated with metabolic syndrome when compared with the controls.
Obesity, high triglycerides and low high density lipoprotein levels are closely linked to insulin resistance and they are independent predictors of myocardial infarction and cardiovascular disease.
Results strongly indicate the need for comprehensive screening and education program for women of all ages with PCOS. Modification of lifestyle factors such as diet and exercise along with insulin sensitizers and lipid lowering agents can prevent long term health risks.
IntroductionPolycystic ovarian syndrome (PCOS) is the most commonly encountered endocrinopathy in women of reproductive age (5-10%)3 with significant reproductive and non reproductive consequences.6
The existence of two of the following criteria like oligoovulation, anovulation, clinical or biochemical signs of hyperandrogenism and polycystic ovaries on ultrasound is required to make the diagnosis of PCOS, as per the American society of reproductive medicine6.
PCOS patients are at a higher risk for the metabolic syndrome, which is a group of cardiovascular risk factors that include dyslipidaemia, type II diabetes mellitus, hypertension and obesity6. Hyperinsulinemia is noted in 50-70% of these patients while the rates of obesity ranges from 38-87%6. Thus, polycystic ovarian syndrome seems to have many of the hallmarks of the metabolic syndrome and should no longer be considered a purely gynaecological disorders.
Affected women seem to have subclinical insulin resistance and a form of the metabolic syndrome that

41Indian Journal of Public Health Research & Development. April - June, 2012, Vol. 3, No. 2
manifests itself in early adult life with gynaecological symptoms. They may therefore gain particular benefit from early screening for metabolic syndrome7.
Criteria used to define metabolic syndrome
Most widely adapted are the criteria proposed by the American National Cholesterol Education Program (NCEP). Adult Treatment Panel III (ATP-III)). These criteria require the presence of 3 of 5 common CV risk factors (increased waist circumference, blood pressure, elevated fasting blood glucose, low serum high-density lipoprotein (HDL)-cholesterol, and increased triglycerides). Using these criteria, the prevalence in PCOS has been reported to be extremely high, 43-46%, primarily on the basis of abnormal lipids and increased waist circumference5.
Incidence
Metabolic syndrome (MBS) which is a common disorder related to visceral obesity and insulin resistance (IR) is associated with atherosclerosis and cardiovascular (CV) disease. The prevalence of MBS is high, occurring in 23.7% of the USA population over 20 years. The prevalence also increases with age, from 6.7% in the third decade to 43.5% in the7th decade5.
Aim of the StudyTo establish the relation between PCOS and metabolic syndrome.
Study ObjectivesPrimary objective1) Correlating fasting blood glucose levels with systolic
and diastolic blood pressure of cases to control groups.
2) To compare waist circumference with total cholesterol values in both cases and control population.
3) To correlate total triglyceride (TTG), high density lipoprotein – C (HDL-C) values and TTG/HDL-C ratio in PCOS cases and controls.
Secondary objective1) To compare the obese and the nonobese of the
PCOS group with respect to insulin resistance (FBS), total triglycerides and HDL-C levels as a predictor for cardiovascular disease.
2) To know the prevalence of raised total triglycerides to HDL-C ratio in PCOS women as a marker for atherosclerosis in later life.
Study design and study populationStudy design: A prospective Case control hospital based non interventional study.
Study population: 50 primary infertility patients attending the gynaecological outpatient department at S.S. Institute of Medical Science and Research Institute, Davangere, Karnataka.
Cases : 25 primary infertility patients with an ultrasound diagnosis of polycystic ovaries.
Controls: 25 primary infertility patients with a normal pelvic study on ultrasound examination.
Study start date: November 2009
Completion date: April 2010
Subject eligibility criteria
Sample size: A total of 50 primary infertility patients in the age group 18-35 years will be randomized into the study.
The study will be conducted at the gynaecological, radiological and biochemistry departments at S.S. Institute of Medical Sciences and Research Institute Davangere, Karnataka 05.
Inclusion criteria
• Age:18–35years.• Maritalstatus:Married• Primaryinfertilitypatientsatgynaecologyoutpatient
department with clinical features of PCOS like abdominal obesity ie., increased waist circumference (> 35 inches), hirsutism, menstrual irregularities and / or ultrasound findings are taken as physically identifiable factors for detecting PCOS.
• Informedconsent.
Exclusion criteria
• Patientswhorefusetoparticipateinthestudy.• Secondaryinfertilitypatientsexcluded.• CasesofprimaryinfertilityofnonPCOSgroupwillbe
excluded.
Study procedure
At the outpatient department the investigator will complete the history protocol, informed consent taken and their height, weight and waist circumference is measured.
Body weight being recorded to the nearest 0.1 kg using a standard balance scale with subjects bare foot. Body height being measured to 0.1 cm with free standing magnimeter stadiometer. Body mass index (BMI) will then be assessed waist circumference measured in inches.
Patient is asked to empty her bladder and lie down in supine position, privacy maintained. A blood pressure is checked in supine position, right upper arm, Korotkov V sound used for diastolic pressure measurement.
A general physical examination and a pelvic examination is done as a routine examination.
Then the patients will be sent to the radiology department for a pelvic ultrasound and if the scan shows a polycystic picture, they will be included in the study as cases and those with normal pelvic study on ultrasound examination will be considered and controls.
Later these patients will be asked to come fasting the next

42 Indian Journal of Public Health Research & Development. April - June, 2012, Vol. 3, No. 2
day morning at 9 am to the biochemistry department and blood samples will be taken for the measurement of following parameters.
1) Fasting glucose.2) Lipid profile
a) Total triglyceridesb) Total cholesterolc) HDL
Normal reference values8
BMI = wt (kg) / ht sqm2
Normal 18.5 – 24.9Underweight Low < 18.5Obese high > 30Overweight 25 – 29.9
Waist circumference> 35 inches is significant, the WHO clinical criteria for metabolic syndrome uses BMI > 30 and a waist circumference > 35 inches.
Blood pressure range (supine position) (>130 / >85 mmHg))
Systolic 120 mmHg
Diastolic 80 mmHg
1) Fasting blood glucose will be done by glucose Drytech (DT method) and a reference normal range will be 60-100 mg/dl.
2) Lipid profile will be done using cholesterol Drytech DT method for total cholesterol levels.
Reference interval
Conventional units mg/dl
SI units mmol/L
Desirable < 200 < 5.2
Borderline (high) 200 – 239 5.2 – 6.2
High > 240 > 6.2
3) HDL cholesterol levels using dry tech (DT) method, using end point caloximetric model.
Reference interval for HDL conventional unitsLow < 40
High > 60
4) Triglycerides are analyzed using the Drytech (DT) method, calorimetric model, with reference intervals for Trig DT.
Conventional units mg/dl SI units mmol/L
Normal < 150 < 1.69
Borderline high 150 – 199 1.69 – 2.25
High 200 – 499 2.26 – 5.64
Very high > = 500 > 5.65
The patients are instructed to take a non fatty meal the previous night.
Health education will then be given to patients regarding modification of life style factors such as diet and exercise
to modify risk factors such as diet and exercise to prevent long term effects of polycystic ovarian syndrome.
The infertility management will then continue as per the standard protocol of the respective unit chiefs.
Qualitative data were analyzed by using students unpaired t-test odds ratio.
ResultsTabulation
1) Correlation between fasting blood glucose levels with systolic and diastolic blood pressure of cases to control groups.
Controls FBG (mg%) Systolic mmHg Diastolic mmHg
Average 84.84 109.2 77.6
S.D + 5.17 7.44 4.35
PCOS cases
Average 101.36 126 84.4
S.D. + 10.53 13.54 5.06
P value p < 0.001 p < 0.001 p < 0.001
Significance Significant Significant Significant
A raised fasting blood glucose levels, rise in systolic and diastolic blood pressure was noted in the cases and the values are statistically significant.
2) To compare waist circumference with total cholesterol levels in both cases and control population.
Controls Waist circumference (inches)
Total cholesterol (mg%)
Average 33.36 197.12
S.D. + 1.25 7.41
PCOS cases Weist circumference (inches)
Total cholesterol (mg%)
Average 36.96 200.12
S.D. + 2.95 11.76
p value p < 0.001 p < 0.05
Significance Significant Less significant
Waist circumference and total cholesterol levels too were higher in PCOS cases.
3) To correlate total triglyceride (TTG), high density lipoprotein C (HDL-C) values and TTG/HDL-C ratio in PCOS cases and controls.
Controls TTG (mg%)
HDL-C (mg%) TTG/HDL-C ratio
Average 134.48 49.68 2.71
S.D + 9.00 3.11 0.17
Cases
Average 157.68 43.38 3.65
S.D + 6.33 3.29 0.31
p value p < 0.001 p < 0.001 p < 0.0005
Significance Significant Significant Highly significant

43Indian Journal of Public Health Research & Development. April - June, 2012, Vol. 3, No. 2
Total triglycerides levels and high density lipoprotein cholesterol levels were higher in PCOS cases when compared to controls, with p value being significant (p < 0.001).
Ratio of total triglycerides to high density lipoprotein cholesterol levels in PCOS cases is highly significant (p < 0.0005).
4) Analyzing the PCOS group with respect to BMI, FBS, total triglycerides and HDL-C levels.
Obese PCOS FBS mg/dl TTG (mg/d)
HDL-C (mg%)
Average 36.96 101.36 157.68 43.38S.D + 2.95 10.53 6.33 3.29
Nonobese PCOS
FBS mg/dl TTG (mg/d)
HDL-C (mg%)
Average 33.26 84.84 134.48 49.68S.D + 1.25 5.17 9.00 3.11p value < 0.001 < 0.001 < 0.001 < 0.001Significance Significant Significant Significant Significant
Above findings, depict that the FBS, TTG and HDL-C values were significantly higher in obese PCOS cases as compared to nonobese PCOS cases.
Study)5. Abdominal obesity, abnormalities in HDL-C, and triglycerides were most frequently detected in women with PCOS10.
Obesity and insulin resistance have been implicated in the pathophysiology of metabolic syndrome due to its association with hypertension, hyperglycemia, and dyslipidemia10. In our study group, some nonobese women exhibited metabolic syndrome. High triglycerides and low HDL-C levels are closely linked to insulin resistance and are independent predictors of myocardial infarction and cardiovascular disease12.
Increase triglycerides/HDL – C ratio is also a market for atherogenesis with small, dense LDL particles13. In a study the findings revealed that triglycerides/ HDL – C more than 3.2 had high sensitivity and specificity, suggestion the possible use of this cutoff to screen for metabolic syndrome14,15.
ConclusionPolycystic ovarian syndrome presents with overt symptoms of infertility, hirsutism and acne and is strongly related to obesity and chronic hyperinsulinaemia this is well established after National Cholesterol Education Program and Adult Treatment Panel III16. In the present study most of the women showing more than three risk factors out of five risk factors of metabolic syndrome. Risk factors may not always progress to disease. Treatment of the individual components of the syndrome, including dyslipidemia, obesity and hypertension clearly decrease the incidence of cardiovascular disease. Therefore, the approach requires emphasis on the modification of lifestyle factors such as diet and exercise to modify risk factors in preventing clinical disease17.
Young women diagnosed with PCOS should be informed of the possible long term risks to health. Healthcare providers should educate these women regarding tranquil life style with an appropriate diet and exercise program. Early pharmacotherapy with insulin sensitizers and lipid lowering agents may be considered if therapeutic lifestyle changes are unsuccessful.
References1. Hull MGR. Epidemilogy of infertility and polycystic ovarian
disease : endocrinological and demographic studies. Gynecol Endocrinol 1987;1(235-45).
2. Adams J, Polson DW, Franks S. Prevalenceof polycystic ovaries in women with anovulation and idiopathic hirsutism. Br Med J 1986;239:355-9.
3. Frank S. Polycystic ovary syndroem. N Engl J Med 1995;333:853-861.
4. Glueck CJ, Papanna R, Wang P et al. Incidence and treatmetn of metabolic syndrome in newly referred women with confirmed polycystic ovary syndrome. Metabolism 2003;52:908-15.
5. Ford ES, Giles WH, Dietz WH. Prevalence of metabolic syndrome among us adults : findings from the third national health and trition examination survey. JAMA 2002;287:356-9.
DiscussionIn our study women with abdominal obesity ie. increased waist circumference (> 35 inches) and / or ultra-sound findings are taken as physically identifiable factors for detecting PCOS cases. Ultra-sound findings are similar in women with abdominal obesity and in a smaller group of lean patients with PCOS9. Although categorical abdominal obesity (waist circumference > 35 inches) is most strongly associated with metabolic syndrome, the world health organization clinical criteria for metabolic syndrome used BMI more than 30 or waist/hip ratio interchangeably. Our findings are similar to the prevalence of metabolic syndrome in women with PCOS reported using abdominal waist circumference4.
The results of our study indicate that women with PCOS are strongly associated with metabolic syndrome compare with age-matched, increase of metabolic syndrome in women with PCOS compared with age matched contemporary controls as per NHANES III (3rd National Health and Nutrition Examination Survey

44 Indian Journal of Public Health Research & Development. April - June, 2012, Vol. 3, No. 2
6. Attaran Marjan. Polycystic ovary syndrome, cleveland clinicmeded 2004;1-8.
7. Conway G, Agarwal R, Betteridge DJ, Jacobs HS. Risk factors for coronary heart disease in lean and obese PCOS. Clin Endocrinol 1992;37:119-125.
8. Revised 2003 consensus on diagnostic criteria and long term health risks related to polycystic ovary syndrome. Fertil Steril 2004;81:19-25.
9. Faloia E, Canibus P, Gatti C, Frezza F, et al. Body composition, fat distribution and metabolic characteristics in lean and obese women with polycystic ovary syndrome. J Endocrinol Invest 2004;27:424-9.
10. Dahlgren E, Janson PO, Johansson S. Polycystic ovary syndrome and risk for myocardial infarction evaluated for a risk factor model based on a prospective study of women. Acta Obstet Gynecol Scand 1992;71:599-604.
11. Legro RS, Kunselman AR, Dodson WC, Dunaif A. Prevalence and predictors of risk for type 2 diabetes mellitus and impaired glucose tolerance in polycystic ovary syndrome : a prospective controlled study in 254 affected women. J Clin Endocrinol Metab 1999;84:165-9.
12. Gaziano JM, Hennekens CH, O’Donnell. Fasting triglycerides, high density lipoprotein and risk of myocardial infarction. Circulation 1997;96:2520-5.
13. Maruyama C, Imamura K, Teramato T. Assessment of LDL particle size by triglyceride / HDL cholesterol ratio in nondiabetic heatlhy subjects. J Atheroscler Thromb 2003;10:186-91.
14. McLaughlin T, Abbasi F, Cheal K, Chu J, et al. Use of metabolic markers identify overweight individuals who are insulin resistant. Ann Intern Med 2003;139:802-9.
15. Brehm A, Pfeiler G, et al. Relationship between serum lipopotein ratios and insulin resistance in obesity. Clin Chem 2004;54:2316-22.
16. Executive summary of the third report of the NECP, expert panel on detection, evaluation and treatment of high blood cholesterol in adults (ATP III). J Am Med Asso 2001;285:2486-2497.
17. Barnard RJ, Wen SJ. Exercise and diet in the prevention and control of the metabolic syndrome. Sports Med 1994;18:218-28.

45Indian Journal of Public Health Research & Development. April - June, 2012, Vol. 3, No. 2
Clinical use and safety of medical method of first trimester AbortionGeetha Hosanemati1, Gayatri Patil2, Prema Prabhudev3, Anitha M.R4, Vijayanath V5, L.S. Patil6
1Assistant Professor, 2Associate Professor, 3Professor and Head, Department of Obstetrics and Gynaecology, 4Assistant Professor, Department of Anatomy, 5Associate Professor, Department of Forensic Medicine & Toxicology, 6Associate Professor, Department of Surgical Oncology, S.S.Institute of Medical Sciences & Research Centre, Davangere-577005, Karnataka, India
Abstract
IntroductionWomen have a right to undergo an abortion if she wishes. Medical abortion is legally accepted under the Indian law. Mifepristone and misoprostol combination offers a safe, nonsurgical alternative for pregnancy termination with good success rates.
Aims and ObjectivesThe purpose of this study was to evaluation of the clinical efficacy of the combination of mifepristone and misoprostol orally for early termination of pregnancy.
MethodsA prospective clinical study conducted during a one year period included 100 healthy pregnant women consenting for a legal abortion with an ammenorrhoea of no more than 63 days.
ResultsThis method had a success rate of 94%, with an average induction abortion interval between 40-50 hours, one women needed surgical curettage. No serious side effects expect for nausea was noted.
ConclusionThe combination of mifepristone and misoprostol is effective for the termination of early pregnancy in terms of success, tolerance, safety and practicality.
IntroductionMedical termination of pregnancy today has become a way of life. Women have come a long way since the days, when abortion was illegal, secret and socially unacceptable procedure, hidden from family members.
The Indian parliament liberalized the abortion laws of the country as a measure of the socioeconomic need of the country.
The aim of this social legislation was to remove the
social stigma attached to this procedure and to minimize maternal morbidity and mortality arising out of the need to go to quacks for procuring an abortion.
Public education and awareness have led to a healthy trend where women now seek for abortion earlier in the pregnancy. The medical termination act in India was implemented form April 1972 and specifies the place, duration of pregnancy and the person licenced to perform the procedure1.
Though early first trimester surgical termination of pregnancy is safe and simple, but needs a well trained doctor, operation theatre and anaesthesia facilities to perform. About 40-50 million abortions are estimated to take place annually in the world, more than half are illegal and performed by unskilled persons in unhygienic conditions2.
Today, we have the best option of using an antiprogestational drug Ru 486 (Mifepristone) along with PGE, (Misoprostol) for termination of early pregnancy. This combination offers a safe, non surgical alternative for pregnancy termination, which is readily acceptable by women Ru 486 when administered alone, succeeds in termination of pregnancy in about 75% of patients, but when combined with a prostaglandin analogue the success rate goes upto 95-98%1.
Background and RationaleThe “abortion pill” is mifepristone (Ru 486), a progesterone antagonist leads to decidual necrosis and detachment of the products of conception3 and endogenous prostaglandin activity,4 was approved by the FDA in 2000.
Prostalandin E, is a prostaglandin analogue, both drugs are active on oral administration.
Aim of the StudyTo know the clinical efficacy of the combination of Ru 486 and prostaglandin E1 misoprostol, orally for early termination of pregnancy.
Objectives• To evaluate the effectiveness of medical methods
for early termination of pregnancy with 9 weeks of gestation.

46 Indian Journal of Public Health Research & Development. April - June, 2012, Vol. 3, No. 2
• Toevaluate themorbidity andmortality associatedwith medical method of early termination of pregnancy.
Study design and study populationType of study: Prospective interventional hospital based study.
Place of study: Women attending the gynaecology out patient department at S.S. Institute of Medical Sciences and Research Centre requesting for early pregnancy termination.
Study eligibility criteria
The criteria was that a total of 100 consequtive patients requesting for early pregnancy termination in a period of 1 year from September 2009 to September 2010 were recruited for the study.
Inclusion criteria
• Patientrequestingforabortion,withpregnancylessthan 9 weeks of gestation
• Pregnancy confirmed by clinical examination, andultrasound examination.
• Singleton,intrauterinegestation• Willingtoterminatepregnancybysurgicalmethod,
in case of failure of treatment.• Informedconsenttaken.
Exclusion criteria
• Cardiovascular disorder and other serious medicaldisorder.
• Gestationalagemorethan9weeks.• Threatenedabortioncases.• Patientagemorethan35years• Smoking• Asthma• Hemoglobinlessthan8g%.
MethodologyStudy procedure
Women fulfilling the criteria underwent a thorough general physical examination, systemic examination including cardiovascular respiratory, per abdomen, per speculum and per vaginal examination was done.
Investigations
• Urineforalbumin,sugar,microscopy• Blood forhemoglobin,bloodgroupandRh typing,
HIV and HbsAg status• Urinepregnancytest.• Pelvicultrasound
Informed consent was taken. Then on
Day one : 200mg Ru 486 was given orally to the women on outpatient basis.
Day three: after 36 hours, cases were reviewed and received two tablets of 200 mcg of misoprostol and 6
hours later another single tablet of 200mg of misoprostol was given. So the women received 600mcg of misoprostol in total. Patients being informed about possible side effects like vomiting, diarrhea, abdominal pain, expulsion of product of conception.
On the tenth day cases were reviewed for number of days of bleeding, pain abdomen and any other side effects. Pelvic ultrasound confirmed the completeness of the abortion.
Assessing out come of the treatment
Successful outcome
Success was defined as complete expulsion of the conceptus, without the need for a surgical procedure.
The outcome was considered as successful when the following criteria were fulfilled,
• Historyofonsetofbleedingpervagina.• Historyofexpulsionofproductsofconception• Decreaseinuterinesize• Pelvicultrasoundshowingemptyuterinecavitywith
no retained products. • Nointerventionrequired.
Unsuccessful outcome
This comprised of incomplete abortion or continuing of pregnancy or trial interruption. In these conditions pregnancy is terminated or abortion process is completed by appropriate surgical procedures. The tissue obtained should be sent for histopathological examination.
1) Incomplete abortion: The outcome of treatment was considered as incomplete abortion when the following conditions were fulfilled.
• Historyofbleedingpervagina• Uterinesizeremainingatpretreatmentsizeorbulky• Ultrasound report showing retained products of
conception. • Some intervention was required to complete the
abortion.
2) Continuation of pregnancy
The outcome of treatment was considered as continuation of pregnancy when the
• Sizeofuterusincreasedfrompretreatmentassessment.• Ultrasoundreportshowingongoingpregnancy.• Bleedingmayormaynothavestarted.
3) Trial interruption: The outcome of treatment was also considered as unsuccessful when the pregnancy had to be interrupted before day 10 due to,
• Heavybleeding• Othermedicalreasons.
Results

47Indian Journal of Public Health Research & Development. April - June, 2012, Vol. 3, No. 2
1) Age distributionAge in years Number of cases Percentage
20-25 years 34 34%
26-30 years 62 62%
31-35 years 4 4%
Majority of them belonged to the 26-30 years age group.
2) Parity Index
Gravida Number of cases Percentage
1 0 0%
2 42 42%
3 52 52%
4 4 4%
5 2 2%
None of them were primigravidas and majority of them were second and third gravidas.
3) Period of gestation
Weeks in gestation
Number of cases Percentage
< 6 weeks 24 24%
> 6 weeks with in 9 weeks
76 76%
Majority of the women were beyond 6 weeks of gestation.
4) Induction abortion interval
Time in hours Number of cases Percentage
40 – 50 hours 90 90%
51 – 60 hours 6 6%
61 – 70 hours 4 4%
90% of women had an induction abortion interval of around 40-50 hours.
5) Comparison with gestational age and induction abortion time
Gestation in weeks Number of cases Percentage
< 6 weeks 20 40-50 hours
4 46-50 hours
> 6 weeks with in 9 weeks 66 40-50 hours
6 51-60 hours
4 61-70 hours
24 women with gestational age less than 6 weeks, had an induction abortion interval within 40-50 hours, all of them had a complete abortion, while in the remaining who had a gestational age of more than 6 weeks but less than 9 weeks, 66 women had an abortion in 40-50 hours time, 6 of them required 51 – 60 hours and another 4 of them took almost 61-70 hours for an abortion.
6) Side effects
Side effects Number of cases Percentage
Nausea 52 52%
Vomiting 6 6%
Severe abdominal pain
8 8%
Chills 2 2%
Diarrhoea 2 2%
Nausea was the commonest (52%) side effect noted, severe abdominal pain during the abortion process was seen in 8% of women in the study.
7) Success rate
Results Number of cases Percentage
Complete abortion 94 94%
Incomplete abortion - -
Continuation of pregnancy - -
Lost to follow – up 4 4%
Trial of interruption 2 2%
94% of them had a complete abortion, 2 women needed trial of interruption as they started to have heavy bleeding after 11 hours of expulsion of the products of conception, requiring emergency curettage. 4 cases were lost followup.
DiscussionThe results of our study reveal a success rate of 94%, with less morbidity and without any mortality. This can be compared with similar success rates of 94% by Mc Kinley et al and 95% (Sang et al)5.
Ru 486 when administered alone succeeds in 75% of early trimester pregnancies but when followed by a prostaglandin analogue achieves complete abortion in 95-98%.6
The age and the parity index of the women did not alter the outcome in the present study.
Side effects due to the drugs used were of minor concern, more so nausea (52%), pain abdomen (8%) and vomiting (6%) were observed. An antispasmodic was prescribed in a few cases (4%). Similar side effects noted by studies conducted by Peyron et al7 and Refaey et al. These side effects were mainly due to prostaglandin administration.
Efficacy of this method of medical abortion seems to be clearly linked to gestational age, the failure rate is increased in pregnancies with higher gestational age, as shown by Norman et al3 who included women in 8 weeks of gestation and showed low failure rates.
The induction abortion interval was between 40-50 hours in 90% of cases and it is within 51-60 hours in 6% of cases and within 61-70 hours in 4% of cases, can be compared with Peyron et al7, who had an average of 12-36 hours
48 Indian Journal of Public Health Research & Development. April - June, 2012, Vol. 3, No. 2
interval.
Trial of interruption with an emergency check curettage was done in one woman (1%) and 2 cases did not turn up for followup on the 10th day. Clinical studies shows failure rate of 2-3%8.
In spite of the satisfactory results reported here, we wish to emphasize that the abortion procedure should be done under medical supervision.9 Appropriate counseling of the patients, detailed history to rule out contraindications for usage and proper followup of patients is of importance.
ConclusionPregnancy termination is an important maternal health issue. In developing countries, legal abortions carry a mortality rate of 5 per 100000, but the mortality rate due to illegal abortions is 100 per 1000002. In India, though abortion was legalized in 1972, illegally induced abortion is a major killer of women. It accounts for one of ten maternal deaths due to lack of information and because facilities cannot meet the demand.
Unmarried teenagers and most of the married women requesting abortion are reluctant to go to a registered clinic or hospital because of want of adequate privacy and fear about surgical procedure10. Medical abortion should be made available to abortion seekers through a supervised national programme, it may revolutionise abortion management and decrease maternal deaths, especially in the rural areas.
Attractive features of medical abortion include the ease of swallowing pills simpler, privacy, autonomy and avoidance of psychological effect of physically invasive operation. It is more comfortable and less dangerous11.
The combination of mifepristone and misoprostol is effective for the termination of early pregnancy in
terms of success, tolerance, safety and practicality7. It is a desirable option which should be made available to women through the providers of family planning services.
References1. Manju MV. Jassawalla MJ. Manual ontermination of pregnancy,
3rd edn., 1999;9-11,55-59. 2. WHO : Pregnancy termination with mifepristone and semeprost
– A multicentre comparison between repeated doses and a single dose of mifepristone; fertile steril; 1991:56:32-40.
3. Norman JE, Kelly RW, Glasler AF. Effects of Mifepristone in vivo on decidual prostaglandin synthesis and metabolism; contraception; 1991;49:88-89.
4. Usha K. Antiprogesterons, today and tomarrow, review article. J Obs Gynec 2000;26-34.
5. Wel SG et al. Termination of early pregnancy by two regimens of mifepristone with misoprostol and PGO5 – a multicentre randomized clinical trial in china; Contraception; 1994;50:501-510.
6. Birgerson L, Odlind V. Early pregnancy termination with antiprogestins : a comparative clinical study of Ru 486 given in two dose regimens and epostane, Fertil Steril 1987;48(4):565-70.
7. Remi P, Elisabeth A et al. Early termination of pregnancy with mifepristone and the orally active prostaglandin misoprostol, N Engl J Med 1993;328:1509-13.
8. Bahzad C, Wyssling H, Saraya, Yougen S. Termination of early human pregnancy with mifepristone and the prostaglandin analogue sulprostone; a multicentre randomized comparison between two treatment regimens; Oxford J Human Reprod 1989;4(6):718-725.
9. Beatrice C, LeNelly S, Andre U et al. Termination of early pregnancy by the progesterone antagonist Ru (486) Mifepristone, N Engl J Med, 1996;315:1565-1570.
10. UK Multicentre trial : The efficacy and tolerance of mifepristone and prostaglandin in first trimester termination of pregnancy, Br J Obstet Gynaecol; 1998;97:480-86.
11. Florence D, Catherine D, Joelle B, Rene F. Efficacy of progesterone antagonist Ru 486 (Mifepristone) for preoperative cervical dilatation during first trimester abortion, Oxford J Human Reproduct 1988;3(5):583-84.

49Indian Journal of Public Health Research & Development. April - June, 2012, Vol. 3, No. 2
Epidemiology of breast cancer in female in Meerut, India: Patients characteristics and survival analysisHaroon AS1, S.M. Gupta2, B.B. Tyagi3, J. Farhat4
1Research Scholar, Department of Statistics, Meerut College Meerut, 2Professor & Head, Department of Statistics, Meerut College, Meerut, 3Ex Senior Scientist, AIIMS, New Delhi, 4Assistant Professor, Department of Zoology, Daulat Ram College, New Delhi
AbstractBreast cancer is the first common cancer among women in Meerut city and western India. All breast cancer cases were collected during 2008-2009, of these 60 (21%) death cases out of 285 were found in many hospitals/home. The survival rates by Kaplan Meier and Estimated survival rate by Logistic Regression for 1, 2 and more than 3 years were found 88.30%, 76.27% & 63.63% and 77.38%, 63.98% & 49.98% respectively. Cancer stage have <5cm displayed poorer survival rate (51.2%) at more than 3 year than stage <2cm with survival rate (72.73%), and the survival rate in religion, Hindu (55.47%) has better than Muslim with survival rate (54.51%), both were statistically significant. More research and interventions are suggested to formulate and implement strategies to educate and increase the knowledge of communities for healthy life style and disease prevention strategies including early detection of breast cancer to control in India.
Key WordsBreast cancer; survival rate by Kaplan Meier and logistic regression; developing countries.
IntroductionCancer is not a communicable disease. In India, the registration cases require an active tracing for records for cancer patients. Breast cancer is the second most common cancer among women in Meerut city, Delhi, Mumbai and Southern India after cervix cancer. This study depends upon the data of survival rate of female breast cancer patients, who were registered in hospitals and clinical nursing homes in Meerut city. The Meerut city, belong to the Uttar Pradesh with a population of about 1.6 million in 2009. The morbidity data are collected by personal interviews of patients themselves and medical record review. The follow-up data are obtained from obstructing mortality information from Statistical Division of Municipality of Meerut city.
The data was based upon the different parameters and date of diagnose of cancer, method of confirmation of diagnosis (histology, radiography, FNACs, etc) and clinical extent of disease, which was equivalent to tumor stages. Data of different types of tumor stages was based on
clinical assessment before the treatment. The criteria use for coding of diseases of clinical extant are define for population based cancer registries13.
Martial and MethodsThis data was taken between the first diagnosis date of cancer (from 1st January, 2008) and closing date of study (31st December, 2009) at Meerut city in Utter Pradesh. Only 60 (21%) breast cancer cases were registered as death, and had been excluded from the study. The remaining 225 (79%) breast cancer cases were found a part of analysis for the present study. In this study used some method as below.
Observed survival was computing by the Kaplan Meier Method 1and cumulative survival rate at the end of each year of follow-up, the proportion of patients still surviving can be calculated at intervals as short as the accuracy of recording date of death. Log rank test was used to evaluate the prognostic factors in an univariate analysis2. The relationship between the prognostic factors and survival in Meerut city was studied using a proportional hazards regression model3. Cox Regression Method is useful in situations where we have censured observations, where some of the patients do not die during the observation period. Another important method is used as below.
This study, data was divide by two categories such as complete to follow up belong to 155 cases and incomplete follow up belong to 130 cases out of 285 total cases. In this situation, we find 36 more death probabilities in incomplete data with the base of complete to follow up by using the logistic regression4. So that estimated deaths were calculated 96 out of the total cases and check the goodness of this data by using the Cross Validation Method5.
ResultsThe entire variable in table 1 has been observed survival rate by using given methods and table-2 showed the hazard rate of above parameters respectively.
Table1. Showed that survival rate with 95% confidence interval by using the Kaplan Meier Method were found 60 deaths and estimated survival rate by using the logistic regression method were found 96 deaths out of 285 cancer cases.

50 Indian Journal of Public Health Research & Development. April - June, 2012, Vol. 3, No. 2
By age groupThe table (1) showed that the survival rate for age group <40, 40-49, 50-59 and 60+ years were found to be 67.93% ,54.23% ,59.19% and 51.28% and found no significant in all the age groups respectively. All age group, the cumulative survival rate was found to be 50.4% with median 51. The cumulative survival rates had been observed 88.30%, 76.27% and 63.63% at 1, 2, and 3+ year respectively. A clearly decreasing trend was found in cumulative survival rate with increasing age. From the table (2) showed that the hazard ratio for the age group 40-49 years was 33% reduced, 50-59 years and ≥ 60-years were found, 16% and 38 % increased respectively for the corresponding age group.
Similarly another method showed that the survival rate for age group <40, 40-49, 50-59 and 60+ years were found to be 50.49%, 51.20 %, 53.62 % and 51.16%, and found no significant in all the age groups respectively, and all age group, the cumulative survival rate was 51.30, it was much cleared that a decreasing trend found in cumulative survival rate with increasing age at diagnosis, which is statistically significant (p < 0.05). From the table 2, the hazard ratio was observed that for the age group 40-49 years and 50-59 years was 36% and 37% reduced. But in the age group more than 60 years, the hazard ratio was found to be 57% increased for the corresponding age group factor.
By Menopausal StageIn this study 127 cases belonging to pre-menopausal Stage were included, which had cumulative survival
rate 57.51% and 55.34% and 51 and 37 median survival respectively and 158 cases of post-menopausal Stage had cumulative survival rate of 50.52% with median 50 and 51.86% with 28 median for respectively tables. The result was statistically significant (p < 0.05) by logistic regression methods and the hazard ratio of post menopausal stage was found 46% increased and post menopausal stage was found 66% increased corresponding pre menopausal stage.
By Size of Cancer i.e. stagesThere were 65 (23%) breast cancer patients, which diagnosed with a lump size of < 2 cm. and had cumulative survival rates 72.73% and 67.41% from table 1. While 65 (23%) breast cancer cases was obtained from the data with a lump size of 2-5 cm., having cumulative survival rates 73.95% and 55.67%. Where 155 (54%) breast cancer patients had a lump size more than 5 cm. gave the cumulative survival rates 51.2% and 53.06%.The elevation in the lump size shows statistically highly significant results (p < 0.001). The risk of dying among those patients, which had lump size more than 5 cm., was approximately 3 times greater than those patients with the lump size of < 2 cm.
By ReligionThis factor reveals that 233(82%) breast cancer cases were belong to Hindu religion in Meerut city and had cumulative survival rates 55.47% and 30.52% respectively methods from table 1. While 52 (18%) breast cancer cases were belong to Muslim religion and had
Table1: Depicts the estimate of survival rates by using Kaplan Meier
Original data based Survival Analysis Estimated data based Survival AnalysisFactor Total
Cases% Death C.I Survival
RateP-Value Estimated
DeathC.I Survival
RateP-Value
Age <40 59 21 11 30-42 67.93
0.117
17 27-47 50.49
0.007640-49 92 32 15 31-75 54.23 22 30-72 51.2050-59 72 25 16 23-61 59.19 25 16-44 53.6260+ 62 22 18 6--72 51.28 32 8-18 51.16All Ages 285 100 60 37-65 50.40 96 26-40 51.30
Menopausal StagePre 127 45 22 34-68 57.51
0.14832 23-51 55.34
0.0145Post 158 55 38 41-59 50.52 64 14-42 51.86
Stages< 2 cm 65 23 5 37-50 72.73
0.00058 34-47 67.41
0.00092 to <5 cm 65 23 7 44-56 73.95 17 24-76 55.67more than 5cm 155 54 48 24-48 51.20 71 17-35 5306
ReligionHindu 233 82 43 33-67 55.47
0.037972 29-45 50.62
0.0804Muslim 52 18 17 12-62 54.51 24 15-43 51.49
LateralityRight 117 41 24 52-66 55.36
0.919737 16-86 51.87
0.8451Left 168 59 36 31-53 50.96 59 23-37 50.80
TreatmentSurgery 218 76 46 25-59 52.29
0.32776 21-39 50.40
0.2449Radiation 13 4.6 5 32-60 65.45 5 32-60 65.45Chemotherapy 54 19 9 36-54 65.77 15 21-79 55.67

51Indian Journal of Public Health Research & Development. April - June, 2012, Vol. 3, No. 2
cumulative survival rates 54.51% and 51.49%. This result was statistically significant results (p < .01) and the risk of dying of Hindu community is 78% and 49% increase compared to Muslim community breast cancer patients.
By LateralityRegarding to this parameter, there were 117 (41%) breast cancer patients affected to right breast and they had cumulative survival rates 55.36% and 51.87%. In the case of left breast cancer cases 168(59%) breast cancer patients was found, which had cumulative survival rates 50.96% and 50.80% from the above table and hazard ratio of left breast cancer patients was approximately equal to the right breast cancer patients.
By TreatmentIn the present study, 218 (76%) breast cancer cases were treated by surgery, which had cumulative survival rates 51.29% and 50.40% using both methods. Whereas 13(5%) breast cancer cases were observed to treated by
radiation and have cumulative survival rates 65.45% and 65.45 % with same median. There were 54 (19%) breast cancer patients also treated by chemotherapy, which had cumulative survival rates 65.77% and the risk of dying of women breast cancer patients which were treated with chemotherapy and radiation had approximately 30% and 50% reduced compared to other treatment such as surgery.
DiscussionThe present study provides substantial information about the survival rates of women diagnosed with breast cancer. The survival data is not readily available in many developing and under developed countries because of lack of proper information systems and the difficulties faced for follow up in due to some unavoidable reason of cancer cases until death, and another important factor completeness of cancer registration which give the affecting results of survival analysis. While in complete registration, the complete information of cancer cases is not available in most of the developed and under
Table 2. Showed that the ratio of dying of all cancer cases were found with 95 % confidence interval based on original and overall data by using Cox regression method
Table 2: Hazard Ratio was found of all cases with 95% confidence interval for overall data and Estimated data
Original data with 60 deaths Estimated data with 96 deaths
Factor Hazard Ratio C.I P value Hazard Ratio C.I P value
Age-group
<40 1.000 − − 1.000 − −
40-49 0.672 (.370-1.471) 0.320 0.641 (.339 -1.212) 0.171
50-59 1.165 (.538-2.524) 0.699 0.637 (.624 -2.158) 0.637
60+ 1.389 (.645-2.990) 0.402 1.579 (.866- 2.880) 0.136
Menopausal Stage
Pre 1.000 − − 1.000 − −
Post 1.463 (.863-2.480) 0.158 1.667 (1.088 -2.553) 0.019
Stages
< 2 cm 1.000 − − 1.000 − −
2 to <5 cm 0.972 (.307-3.076) 0.962 1.521 (.654- 3.537) 0.330
More than 5cm 3.134 (1.242-7.912 ) 0.016 2.933 (1.406 -6.117) 0.004
Religion
Hindu 1.000 − − 1.000 − −
Muslim 1.786 (1.013-3.149) 0.045 1.49 (.934 -2.377) 0.094
Laterality
Right 1.000 − − 1.000 − −
Left 0.974 ( .580-1.636) 0.921 1.041 (.689 -1.572) 0.850
Treatment
Surgery 1.000 − − 1.000 − −
Radiation 0.915 (.357-2.350) 0.854 0.565 (.226 -1.417) 0.224
Chemotherapy 0.702 (.343-1.438) 0.333 0.721 (.414- 1.257) 0.249
Analysis of Survival rates on the base of original and estimated data by Kaplan Meier Method

52 Indian Journal of Public Health Research & Development. April - June, 2012, Vol. 3, No. 2
developed country because of skill problem or financial constraints’, the time estimate of the survival data is not available, if we delete this incomplete data. We may have under estimate of survival rate. While in complete registration of cases and major exclusion are likely to bias the survival estimates, inadequate information on several variables would limit interpretation of the results.
An anther research showed that the cumulative survival rate was better among older than younger patient and it was challenged by a few studies. Several studies have been shown that the age has a significant prognostic effect even after stratification for stage of disease^(6-7) and average annual age-adjusted incidence rate of 22.0 in during (1982-93) in Madras8.
Several studies have shown that breast cancer in younger women especially those less than 40 years old has a poor prognosis9-10. In present study ,it was found that the large proportion of the cases (32%) occurring in the age group 40-49 years, which over half (53%) < 50 years of age, and in the age group < 40 years, the survival rate was found (67.93%) compare with the age >60 years survival rate (51.28%). The overall survival rate was 50.4%, which was poorer compare the above age group by Kaplan Meier Method but Logistic Regression showed that less than 40 years age group had survival rate 50.49% compare with the age group was greater than 60 year age group having survival rate 51.16%. The overall survival rate have 51.30%, was not a poorer the respective age group.
In menopausal stage and survival rate was statistically insignificant and significant due to corresponding methods. The post-menopausal Stage has hazard rate corresponding to pre-menopausal Stage, which are 40% and 60% increased from respective methods. Therefore increase the age of patient give the more risk of breast cancer.
The present work reveals that 23% of cases have tumor size 2-5 cm and 23% have tumor size < 2 cm, while 54% cases have the size of tumor more than 5 cm, which were statistically significant stages and cumulative survival rates. However Fakhro11 observed that 51.3 % cases belong to 2-5 cm cancer size and 70% cases belong to the tumor size < 2 cm.
According to the religion parameter observed that 82% breast cancer cases belong to the Hindu religion and 18% breast cancer cases belong to the Muslim religion. The present findings indicate that the breast cancer risk compare of Hindu and Muslim religion, it was observed that higher elevated breast cancer risk was found in Muslim religion by using Cox regression Method.
There was statistically insignificant association found between cumulative survival rates and laterality during this study, which include 41% breast cancer patient are affected in the right breast and 59% in the right breast.
The survival rates to regard this parameter 55.3% and 50.96 % by Kaplan Meir Method and 51.87% and 50.80% with logistic regression. This is due to the effect explaining left side the more aggressive disease present in of breast cancer. The similar study has been done by Arkoob12 and concluded that survival rate 61.1% belong to the right breast and 59.1 % survival rate belong to the left breast in Jordon.
In reviewing the line of treatment, the present study reveals that 52.29% and 50.40% of cases are managed by surgery alone, 65.45% cases are treated by radiation and 65.77% & 55.67% cases are also treated by chemotherapy with both methods respectively.
This type of studies requires identifying the incidence and probability of developing breast cancer in relation to specific demographic variables in Meerut. On the other hand some weaknesses occur in present study such as medical record of many patients was not complete, they were lost to follow up that’s why some important information was missing in L.L.R.M. College and in private nursing homes.
References1. Kaplan EL and Meier P (1958) nonparametric estimation from
incomplete observations. J Anm Stat Assoc, 53: 457-481.2. Mantel N (1966) Evaluation of survival data and two new rank
order statistics arising in its consideration. Cancer Chemo Rep, 50: 163-170.
3. Cox DR (1972) Regression models and life tables. J R Stat Soc B, 34: 187-220.
4. Hosmer DW(1989) Lemeshow S. Applied Logistic Regression. New York: Wiley.
5. Elsner, J. B., and C. P. Schmertmann, (1994): Assessing forecast skill through cross validation. Wea orecasting, 9, 619–624.
6. Ewertz M (1993) Survival of Danish cancer patients (I1943-87), breast. APMIS 33 (suppl): 99-106
7. Sant M, Gatta G, Micheli A, Verdecchia A, Capocaccia R, Crosignani P and Berrino F (1991) Survival and age at diagnosis of breast cancer in a population – based cancer registry. Eur J Cancer 27: 981-984
8. Shanta V, Gajalakshmi CK and Swaminathan R (1995) Cancer Incidence and Mortality in Madras, India, 1993. Annual Report. Madras Metropolitan Tumour Registry, Cancer Institute (WIA): Madras.
9. Chen LM, Zhang X, Chai KX(2004): Regulation of prostasin expression and function in the prostate. Prostate, 59:1-12.
10. Kroman N, Jensen MB, Wohlfahrt J, Mourisden HT, Andersen PK and Melbye M (2000) Factors influencing the effect of age on prognosis in breast cancer: population-based study. BMJ 320: 474–479.
11. Arkoob K., M. Al-Nsour, O. Al-Nemry and B. Al-Hajawi (2010) Epidemiology of breast cancer in women in Jordan: patient characteristics and survival analysis. 16 (10).
12. A.E. Fakhro, B.E. Fateha, N. Al-Asheeri and S.A. Al-Ekri (1999) Breast cancer patient characteristics and survival analysis at Salmaniya Medical Complex, Bahrain. 5(3): 430-439.
13. National Cancer Registry Programme (1987) ICMR Code Mainlual for Population based Cancer Registry. Indian Council of Medical Research: New Delhi.

53Indian Journal of Public Health Research & Development. April - June, 2012, Vol. 3, No. 2
Urban-rural differences in prevalence of CHD: A population based StudyMahajan H1, Chaturvedi M2, Lal P3, Saha R4, Grover VL5
1Assistant Professor, Community Medicine, SMS & R, Greater Noida, UP, 2Associate Professor, Community Medicine, SMS&R, Greater Noida, UP, 3Professor, Community Medicine, MAMC, Delhi, 4Assistant Professor, Statistician, Community Medicine, MAMC, Delhi, 5Professor & Head, Community Medicine, SMS&R, Greater Noida, UP
Abstract
ObjectiveThe present study was carried out with the objective to determine and compare the prevalence of CHD in urban and rural communities of Delhi.
MethodsA community-based epidemiological study from Delhi. The study was carried out by conducting a house-to-house survey. WHO Rose Questionnaire was used to detect angina among the study subjects. ECG was recorded using single-channel BPL ECG machine and was reported by a cardiologist.
ResultsThe overall prevalence of Coronary heart disease was observed to be 12.0% (95%CI: 9.71-14.29). The prevalence of Coronary heart disease was observed to be significantly higher among urban study subjects (14.8%; 95%CI: 11.05-18.55) as compared to that among rural study subjects (9.7%; 95%CI: 6.88-12.52) (p<0.05). Out of the total 92 cases of Coronary heart disease in the present study, 51(55.5%) cases were detected either on the basis of ECG tracing or Rose questionnaire, while rest of the 41(44.5%) cases were known cases of Coronary heart disease.
ConclusionThe present study clearly indicates that the prevalence of CHD in India is a major problem of public health importance in India.
KeywordsCHD, prevalence, urban, rural, WHO Rose questionnaire, ECG, public health.
IntroductionCoronary heart disease (CHD) is now the leading cause of death worldwide1. More than 60% of the global burden of CHD occurs in developing countries. Retrospective analysis of previous epidemiological studies on CHD has shown an increase in its prevalence in India. The
prevalence of CHD has increased in urban areas of India from 1% in the year 1960 to 11% in the year 2001. Similarly, in the rural areas too, its prevalence has increased from 2% in the year 1974 to 5% in the year 20022,3. To monitor the trends in the prevalence of coronary heart disease, periodically well organized systematic epidemiological studies are required in various geographical areas of India. The present study was carried out with the objective to determine and compare the prevalence of CHD in urban and rural communities of Delhi.
Material and MethodsA community-based epidemiological study was conducted from Jan 2007-March 2008 on 1000 adults in the age group ≥ 20 years living in urban and rural areas of Delhi. Population of Gokulpuri and Yamuna Vihar was included as urban community and that of village Barwala was included as rural community.
A total of 500 subjects from the urban community (250 each from Gokulpuri and Yamuna Vihar) were included in the study. Similarly, another 500 subjects from the rural community (Village Barwala) were included in the study. A total of 250 households each from Gokulpuri and Yamuna Vihar were selected by systematic random sampling. A total of 500 households from Barwala were selected by simple random sampling. One person above 20 years of age from each household was selected by simple random sampling using lottery method.
The study was carried out by conducting a house-to-house survey. The subjects were interviewed using a pre-coded and pre-tested semi-structured schedule after getting informed verbal consent. History of present as well as past episode of coronary heart disease was recorded. WHO Rose Questionnaire4 was used to detect angina among the study subjects. Physical examination of the subjects was carried out. The subjects were called to the health centre on specified days for ECG. Each subject was given three reminders to get his/her ECG done after which he/she was declared as defaulter. ECG was recorded using single-channel BPL ECG machine and was reported by a cardiologist. Medical records available with the study subjects were also utilized in the study for confirmation of the diagnosis of CHD.
Three diagnostic criteria were adopted to diagnose coronary heart disease. They were as follows:

54 Indian Journal of Public Health Research & Development. April - June, 2012, Vol. 3, No. 2
1. Clinically documented coronary heart disease2. WHO Rose-questionnaire positive angina 3. ECG changes (ST, T or Q waves)4,5
If any one or more than one of these criteria were present, the study subject was considered to be a case of CHD.
Data collected was tabulated and analyzed by using statistical package for social science (SPSS) software. The prevalence was recorded in percentages. Chi-square test or Fisher Exact test was applied for statistical analysis.
ResultsTable 1 depicts the socio-demographic profile of the study subjects. The study subjects in the urban area ranged from 20-87 years of age, whereas, the subjects in the rural area ranged from 20-90 years of age. The mean age of the urban subjects was 45.42±15.22 yrs while the mean age of the rural subjects was 44.32±15.79 yrs. Amongst all study subjects, 43.5% of the subjects were males and 56.5% of the subjects were females. The overall literacy rate among study subjects was observed to be 77.3%. More than half of the study subjects in both urban and rural areas were housewives/unemployed. Among those who were employed, a large number of subjects
were either semi-skilled/skilled workers (18.1%) followed by clerical/shop-owner/farm-owner (17.5%). A small number of study subjects were unskilled workers (5.5%) and very few subjects were either semi-professionals/professionals (2.9%). Majority of the subjects belonged either to lower income group (44.5%) or middle income group (43.2%). Only 12.3% of the subjects belonged to the upper income group.
Table 2 depicts prevalence of Coronary heart disease among the study subjects. Out of 1000 study subjects, 755 subjects underwent ECG (337 in the urban area and 418 in the rural area). Out of the remaining 245 subjects, 12 subjects were either known cases of coronary heart disease or had Rose-questionnaire positive Angina (8 in the urban area and 4 in the rural area). Thus, in total, 767 subjects were screened for coronary heart disease (345 in the urban area and 422 in the rural area). The overall prevalence of Coronary heart disease was observed to be 12.0% (95%CI: 9.71-14.29). The prevalence of Coronary heart disease was observed to be significantly higher among urban study subjects (14.8%; 95%CI: 11.05-18.55) as compared to that among rural study subjects (9.7%; 95%CI: 6.88-12.52) (p<0.05). Out of the total 92 cases of Coronary heart disease in the present study, 51(55.5%) cases were detected either on the basis of ECG tracing
Table 1: Socio-demographic profile of study subjects
Characteristics Urban (n=500) Rural (n=500) Total (N=1000)Age (years)20-2930-3940-4950-5960 and aboveMean ± SDGenderMaleFemale
Educational status*IlliteratePrimary/Just literateMiddle schoolHigh schoolIntermediate/PostHigh school diplomaGraduatePG/Professional
Occupation*UnemployedUnskilledSemi-skilledSkilledClerical/Shop-owner/Farm-ownerSemi-professionalProfessional
Income group**LowerUpper lowerLower middleUpper middleUpper
93(18.6)112(22.4)87(17.4)
100(20.0)108(21.6)
45.42±15.22
211(42.2)289(57.8)
116(23.2)61(12.2)73(14.6)67(13.4)69(13.8)
83(16.6)31(6.2)
272(54.4)24(4.8)37(7.4)46(9.2)
100(20.0)
14(2.8)7(1.4)
36(7.2)151(30.2)137(27.4)82(16.4)94(18.8)
95(19.0)128(25.6)118(23.6)65(13.0)94(18.8)
44.32±15.79
224(44.8)276(55.2)
111(22.2)90(18.0)69(13.8)
114(22.8)73(14.6)
28(5.6)15(3.0)
288(57.6)31(6.2)41(8.2)
57(11.4)75(15.0)
7(1.4)1(0.2)
47(9.4)211(42.2)161(32.2)52(10.4)29(5.8)
188(18.8)c
240(24.0)205(20.5)165(16.5)202(20.2)
44.87±15.52
435(43.5)a
565(56.5)
227(22.7)d
151(15.1)142(14.2)181(18.1)142(14.2)
111(11.1)46(4.6)
560(56.0)b55(5.5)78(7.8)
103(10.3)175(17.5)
21(2.1)8(0.8)
83(8.3)d362(36.2)298(29.8)134(13.4)123(12.3)
Figures in parenthesis are percentages*According to Modified Kuppuswamy classification** According to Mahajan-Gupta Socio-economic scalea. p value not significant; b. p<0.05; c. p<0.01; d. p<0.001

55Indian Journal of Public Health Research & Development. April - June, 2012, Vol. 3, No. 2
or Rose questionnaire, while rest of the 41(44.5%) cases were known cases of Coronary heart disease.
DiscussionThe prevalence of Coronary heart disease in the present study was observed to be 14.8% in the urban area and 9.7% in the rural area. The prevalence of Coronary heart disease in the urban area in the present study was observed to be higher than that in the previous studies conducted in the urban populations by Gupta et al5,6 in Jaipur in 1995 (7.5%) and in 2002 (7.3%), by Singh et al7 in Moradabad (8.5%) and by Chadha et al8 in Delhi (9.6%). The prevalence in the rural area in the present study was also observed to be higher than the earlier studies conducted in the rural populations by Singh et al7 in Uttar Pradesh (3.0%), Gupta et al9 in Rajasthan (3.5%), Wander et al10 in Punjab (3.0%) and Gupta et al3 in Himachal (5.0%). This increasing prevalence of Coronary heart disease in both urban and rural populations could be attributed to increasing longevity, urbanization and lifestyle changes.
The limitation of the present study is that it cannot project a representative picture of the problem of the whole country, considering the wide variation in socio-economic groups, dietary habits and cultural patterns existing in the country. The prevalence rates estimated in this study may be applied to urban and rural population of northern India, where socio-economic and other environmental factors are almost similar.
Conclusions and recommendationsThe present study clearly indicates that CHD, as assessed by both clinical history and ECG criteria is of a magnitude that makes it a major problem of public health importance in India. The prevalence of coronary heart disease reported in the rural area is much higher in the present study than that reported in the earlier studies which necessitates that the IEC activities regarding the prevention of CHD should focus not only in the urban areas but also in the rural areas.
To obtain a composite picture for the whole country, community based epidemiological studies will have to be undertaken in the urban and rural areas of different parts of the country. Moreover, the diverse diagnostic criteria of coronary heart disease and the varying survey methods used in various studies make it difficult to estimate the trends of the disease over time, or the variations between
different geographical regions. Thus, more periodically well organized systematic epidemiological studies with uniform methodology and uniform diagnostic criteria of CHD are required in various geographical areas of India to monitor trends of the disease over time and to study the variations between different areas.
AcknowledgementsI am thankful to the Department of Community Medicine, Maulana Azad Medical College, Delhi for providing me the help and support during the study.
Conflict of interest: NIL
References1. Mackay J, Mensah GA. WHO Atlas of heart disease and stroke.
2004: 46-49.2. Gupta OP, Phatak S. Pandemic trends in prevalence of Diabetes
Mellitus and Associated Coronary Heart Disease in India – Their Causes and Prevention. Int J Diab Dev Countries 2003; 23: 37-49.
3. Gupta AK, Bharadwaj A, Ashotra S, Gupta BP. Feasibility of training multipurpose Workers in detection, prevention and control of coronary artery disease in apple-belt of Shimla hills. South Asian J Prev Cardiol 2002; 6:17-22
4. Rose GA, Blackburn H, Gillum RF, Prineas RJ. Cardiovascular Survey Methods. 2nd ed. WHO monograph series no. 56. Geneva: World Health Organization. 1982.
5. Gupta R, Prakash H, Mazumdar S, Sharma S, Gupta VP. Prevalence of Coronary Heart Disease and coronary risk factors in urban population of Rajasthan. Indian Heart J 1995; 47: 331-8
6. Gupta R, Gupta VP, Sarna M, Bhatnagar S, Thanvi J, Sharma V, et al. Prevalence of Coronary heart disease and risk factors in an urban Indian population: Jaipur Heart Watch -2. Indian Heart J 2002; 54 (1): 59-66.
7. Singh RB, Sharma JP, Rastogi V, Raghuvanshi RS, Moshiri M, Verma SP, et al. Prevalence of coronary artery disease and coronary risk factors in rural and urban population of North India. Eur Heart J 1997; 18: 1728-35
8. Chadha SL, Gopinath N, Shekhawat S. Urban-rural differences in the prevalence of coronary heart disease and its risk factors in Delhi. Bull World Health Organ 1997; 75(1): 31-38.
9. Gupta R, Prakash H, Gupta VP, Gupta KD. Prevalence and determinants of coronary heart disease in rural population of India. Indian J Clin Epidemiol 1997; 50(2): 203-9
10. Wander GS, Khurana SB, Gulati R, Sachar RK, Gupta RK, Khurana S, et al. Epidemiology of coronary heart disease in a Rural Punjab Population – Prevalence and Correlation with various risk factors. Indian Heart J 1994; 46 (6): 319-23
Table 2: Prevalence of Coronary heart disease among study subjects
Criteria Urban Rural TotalN n (%) N n (%) N n (%)
Known CHDRQ +ve AnginaECG changesQ wave changes onlyST-T wave changes onlyBoth Q wave + ST-T wave changesOverall prevalence
500500337337337337345
30(6.0)13(2.6)21(6.2)7(2.0)
13(3.8)1(0.03)
51(14.8)
500500418418418418422
11(2.2)11(2.2)31(7.4)3(0.7)
28(6.7)0(0.0)
41 (9.7)
10001000755755755755767
41(4.1)c
24(2.4)a
52(6.8)a
10(1.3)a
41(5.4)a
1(0.001)a
92(12.0)b
Figures in parenthesis are percentagesa. p value not significant; b. p<0.05; c. p<0.01

56 Indian Journal of Public Health Research & Development. April - June, 2012, Vol. 3, No. 2
A comparative study of random urine protein: creatinine ratio with 24 hour urine protein excretion in diabetic nephropathyHamsaveena1, Rashmi M.V2
1Assistant professor, Department of Biochemistry, 2Associate professor, Department of Pathology Sree Siddhartha Medical College and Research Center, Tumkur, Karnataka
AbstractRenal involvement in diabetes is one of the long term complications leading to morbidity and premature mortality. Proteinuria is the most widely accepted clinical sign of diabetic nephropathy. The present study was a correlation between 24 hour urine protein excretion and random urine protein: creatinine ratio in diabetic subjects for predicting renal involvement. A total of 69 diabetic subjects were studied. It was observed that protein excretion in 24 hr sample correlated significantly with random urine protein: creatinine ratio in physiological and also in nephrotic range of proteinuria. This may have important clinical applications as single urine specimens, which can be collected easily in outpatient clinics and field studies, could replace the more traditional timed urine collections that have been used to assess the risk of clinical diabetic renal disease.
Key WordsDiabetic nephropathy, protein: creatinine ratio.
IntroductionDiabetic nephropathy is a devastating complication of diabetes mellitus and is among the leading indications for dialysis and kidney transplantation. It is the commonest cause of end stage renal disease. Occurrence of nephropathy is around 40% in type 1 and 25% in type 2 diabetes mellitus1.
Degree of proteinuria is the useful marker for renal involvement and response to treatment. Protein excretion rate is ordinarily determined from a 24-hour urine collection. Random specimens vary considerably in protein concentration. 24-hour urine sample collection could be inconvenient and cause frequent collection errors. Random urine sampling for protein:creatinine ratio would be more acceptable and less time consuming. The protein: creatinine ratio takes into account the fact that creatinine excretion remains fairly constant in presence of a stable Glomerular Filtration Rate. The protein excretion would also be fairly stable. Therefore the ratio of the two in a single voided sample would reflect the cumulative protein excretion over the day, as the two stable rates would cancel out the time factor2.
The protein:creatinine ratio in a single voided urine samples is an accurate, convenient, inexpensive and reliable estimate of total proteinuria in the vast majority of patients. Hence protein: creatinine ratio in single voided urine samples may be even more reproducible than 24 hours urinary protein excretion3. The protein: creatinine ratio of a randomly obtained urine specimen correlates with 24-hour urine protein in patients with type 1 diabetes and may be a useful tool in screening a patient for proteinuria or estimating range of proteinuria in patients4.
MethodsTotal of 69 diabetics were selected. 12 were with 24 hours urinary protein levels > 3g/day, 39 with protein levels 0.2 – 3.0 g/day and 18 were with < 0.2g/day. Detailed medical history and relevant clinical examinations were carried out in these patients. Patients with chronic renal failure, glomerular nephritis due to other systemic conditions and hypertensives were excluded from the study. 24 hour urine was collected in the container having 4ml of 10% thymol in isopropanol as a preservative for 24 hours. This was thoroughly mixed and a sample of 2ml was taken for evaluation of proteins. Total volume was noted and calculation was done for 24 hours. A random urine sample of 5ml was collected on next day any time just before the analysis. The biochemical parameters were analyzed.
ResultsOf the 69 diabetic subjects studied , 16 subjects with 24 hour urine protein < 0.2 g/day had P:C ratio of < 0.2, 37 subjects with 24 hour urine protein 0.2 – 3.0 g/day had P:C ratio of 0.2 – 3.0 g/day and 9 subjects with 24 hour urine protein > 3.0 g/day had P:C ratio of >.3.0 g/day. It is evident that correspondence of 24 hr urine protein and protein:creatinine ratio in diabetic subjects is highly significant (p<0.001).
DiscussionThe reference method for estimating urine protein concentration is accurately timed 24-hour urine specimen which is considered to be difficult in some circumstances because of difficulties associated with obtaining a complete collection. An alternative approach

57Indian Journal of Public Health Research & Development. April - June, 2012, Vol. 3, No. 2
of estimating urine protein : creatinine ratio in random specimen can be considered. Protein : creatinine ratio in single voided urine samples correlates well with measurements of 24-hour urinary protein, this may be even more reproducible than 24-hour urinary protein excretion5.
More over a random urine sample in an outpatient tested usually represents renal excretion during two to four hours of varied activity and most of the daily urinary excretion of protein of an outpatient takes place during activity not recumbency6. Correlation between random urine protein:creatinine ratio and 24 hour urine protein excretion was significant and strong protein:creatinine ratio is highly useful test in outpatient clinical setting but its precision and accuracy may be affected by patient’s physical activity7.
Urinary protein excretion is routinely expressed as the amount of protein excreted per unit of time per unit body surface area. Since creatinine production and excretion are also related to body size, it is possible that good correlation exist between protein : creatinine ratio and quantitative protein excretion in individual patients8. It is noted in earlier studies and also in present study that patients who excreted > 3 gm protein in 24 hour had protein:creatinine ratio that exceed 3.0 which predicted nephrotic proteinuria. Similarly those patients who excreted < 200 mg protein in 24 hour had protein:creatinine ratio of < 0.2, which reflect insignificant or physiological protein excretion9. Hence a highly significant correlation exist between 24-hour urinary protein concentration and protein : creatinine ratio levels in random urine sample10.
By careful choice of cut-off, protein: creatinine ratio can be used in patients with kidney disease to rule out abnormal 24 hr loss of protein. Random samples can be used as surrogate for 24 hour sample11.
ConclusionProteinuria is an important clinical sign of diabetic nephropathy. The definitive method for quantifying urinary protein excretion is 24-hour urine sample, but
obtaining these samples is cumbersome, time consuming and inaccurate.
The present study suggests estimating protein : creatinine ratio in random urine sample for renal involvement in diabetic subjects provide a convenient method for early diagnosis and intervention of diabetic nephropathy. Hence the single voided test is simple, reliable and useful in screening, assessment and follow-up of diabetic nephropathy.
References1. Ronald CK, Gordon CW. Joslin’s Diabetes Mellitus. 13th edn : B.I.
Waverly Pvt Ltd (New Delhi) 1994; 624.2. Indira Agarwal, Chellam Kirubakaran, Markandeyulu,
Selvakumar. Quantitation of proteinuria by spot urine sampling. Indian journal of Clinical Biochemistry 2004; 19(2): 45-47.
3. Schwab SJ, Chirstensen RL, Dougherty K, Klahr S. Quantitation of proteinuria by the use of protein to creatinine ratios in single urine samples. Arch Intern Med 1987; 147:943-944
4. Rodby RA, Rohde RD, Sharon Z, Pohl MA, Bain RP, Lewis EJ. The urine protein to creatinine ratio as a predictor of 24-hour urine protein excretion in type 1 diabetic patients with nephropathy. American Journal of Kidney diseases 1995; 26(6): 904-909.
5. Price CP, Newall RG, Boyd JC. Use of protein : creatinine ratio measurements on random urine samples for prediction of significant proteinuria : A systematic review. Clinical Chemistry 2005; 51(9): 1577-1586.
6. Abuelo JG. Proteinuria : Diagnostic principles and procedures. Annals of Internal Medicine 1983; 98: 186-191.
7. Sadjadi SA & Jaiparel N. Correlation of random urine Protein: Creatinine ( P:C) ratio with 24 hour urine protein and protein : creatinine ratio based physical activity : a pilot study. Ther Clin Risk Mana 2010; 6: 351- 357.
8. Xing, Wang M, Jiao L, Xu G, Wang H. Protein-to-creatinine ratio in spot urine samples as a predictor of quantitation of proteinuria. Clinica Chimica Acta 2004; 350: 35-39.
9. Kunzelman CL, Knowler WC, Pittitt DJ, Benett PH. Incidence of proteinuria in type 2 diabetes mellitus in the Pima Indians. Kidney international 1989 ; 35: 681-687.
10. Ginsberg JM, Chang BS, Matarese RA, Garella S. Use of single voided urine samples to estimate quantitative proteinuria. N Engl J Med. 1983; 309: 1543-1546.
11. Mark G et al. Protein and albumin : creatinine ratios in random urine accurately predict 24 hour protein and albumin loss in patient with kidney disease. Ann Clin Biochem 2009;46: 468-472.
Table 1: Correlation Between Protein: Creatinine Ratio In Random Urine Sample And 24 Hour Urinary Protein Concentration
24 hour urinary protein concentrationPr
otei
n :
crea
tini
ne ra
tio
in ra
ndom
uri
ne
sam
ple
< 0.2 (g/day) 0.2 – 3.0 (g/day) > 3.0 (g/day) Total
< 0.2 16 2 - 18
0.2 - 3.0 2 37 3 42
> 3.0 - - 9 9
Total 18 39 12 69
X2 = 92.0 p < 0.001 HS (highly significant)

58 Indian Journal of Public Health Research & Development. April - June, 2012, Vol. 3, No. 2
Diagnostic imaging in implantology: From conventional to newer paradigmsHemen Das1, Himanshu Gupta2, Ajay Singh3, Geeta Verma4
1Professor, Dept. of Prosthodontics, Sardar Patel Post Graduate Institute of Dental And Medical Sciences, Rai Baraeli Road, Lucknow, 2Senior Lecturer, Dept. of Prosthodontics, Sardar Patel Post Graduate Institute of Dental And Medical Sciences, Rai Baraeli Road, Lucknow, 3Professor and Head, Dept. of Prosthodontics, Sardar Patel Post Graduate Institute of Dental And Medical Sciences, Rai Baraeli Road, Lucknow, 4Post Graduate Student, Dept. of Orthodontics, Faculty of Dental Sciences, CSMMU (Former King George Medical College), Lucknow
AbstractImaging is an useful adjunct for many dental procedures in general but is essential in the clinical practice of implantology. Apart from ruling out local bone and tooth pathology, imaging helps clinicians to determine bone quality and quantity and give a fair idea of implant orientation. Unlike endodontics, which can rely on conventional intra oral periapical assays (IOPA), imaging in implantology require definite cross sectional views to appreciate buccal and lingual bone plates and overall bone quality and quantity bucco-lingually. From conventional IOPAs and orthopantomograms (OPG) to cone beamcomputed tomography (CBCT) and three dimensional implant planning software with computer aided designined and machinined surgical guide templates, the diagnostics in implantology has gone through a sea change. With prosthetically guided implant placement becoming a standard protocol today, the need for computed tomography has also increased. This article reviews various diagnostic imaging modalities used in implantology today with clinical guidelines to adhere in the end.
KeywordsImaging, IOPA, OPG, CBCT, three dimensional implant planning software.
IntroductionThe influence of implants in clinical dentistry has been phenomenal. These are in a way unique as they provide a range of additional artificial abutments – a possibility which never existed before. The success of implants in providing optimum esthetics and function is unparalled by any other treatment modality in prosthodontics1,2,3.
In the past few years, the advances in science related to implant diagnosis and treatment planning has also been incredible. From conventional periapical films to three dimensional implant planning software with computer aided designing and machining, the diagnostics in implantology has gone through a sea change. Without these advancements, certain concepts like flapless surgery and ideal positioning of the implant would have not seen the light of the day. Overall, the precision in patient and implant selection, implant placement, evaluation of the need for hard and soft tissue augmentation has been greatly enhanced with the help of these advancements.
This review series covers the conventional techniques and also deals with the advancements like multiplanar reformatted computed tomography and three dimensional imaging techniques as used in implantology today with clinical guidelines to adhere in the end.
The requirements and objectives of imaging in implantology:
The requirements for imaging in implantology are:4
a) Presurgical planningb) Restorative treatmentc) Maintenance, monitoring of research trials d) Diagnosis of failing implant.
The basic objectives of imaging in implantology are: a) Identify disease.b) Determine bone quality.c) Determine bone quantity.d) Determine implant position.e) Determine implant orientation.
The standard diagnostic and imaging protocol in an implant case:
This is the standard protocol which can be followed in all
Fig. 1: The stepwise procedure from examination to placement.

59Indian Journal of Public Health Research & Development. April - June, 2012, Vol. 3, No. 2
implant cases as given by Rosenfeld and Mecall5 helping clinicians to place implants with clinical precision. With the help of diagnostic wax up, correct alignment of the replacing tooth can be finalised. Barium coated templates will help clinicians to determine the exact implant alignment and multiplanar reformatted computed tomography will help clinicians to determine the need for any hard or soft tissue augmentation. Although recommended, this protocol may not be possible in every implant case because of economic, time, space and availability concerns.Standard intraoral periapical assays (IOPA) and orthopantomograms (OPG) although do not provide cross sectional imaging but still are of significance as these can be used as screening and also for non complicated cases having abundant bone.
Various imaging modalities in implantologya) Parallel IOPA:
Conventional IOPA are used mainly to rule out any local bone or dental disease but has limited value in determining bone quality and quantity. Normally, a no.2 size dental film captures 25x 40 mm of view, hence certain landmarks like inferior alveolar canal and maxillary sinuses are beyond its view. In addition, there is difficulty in obtaining an undistorted film in areas of shallow palate and reduced sulcus depth. Long cone paralleling technique limits distortion and magnification to 10%.Low cost and low radiation dosage is an advantage.
Recommended in:
1) Single tooth implants with abundant bone width.2) Estimating crestal bone loss over a period of time.
However, it’s to be noted that vertical bitewing intraoral x ray is better than IOPA in estimating crestal bone loss
3) To check fit of the abutment and sulcus formers.4) Diagnosis of a failing implant.
b) Digital IOPA:
The charged couple device systems use rigid sensors placed intraorally to capture the image. When radiograph is made, the remmant x ray beam exiting the patient is captured to scintillator coating a silicon chip. The resulting image flashes at the monitor in seconds of exposure and hence allows operator to make necessary adjustments if required during surgery. Advantages include better sharpness and contrast and less exposure than conventional IOPAs6.
In a study comparing diagnostic potential of direct digital and conventional intraoral radiography in the evaluation of periimplant conditions, it was observed that there is no statistically significant difference between the two. However, there was a tendency of more consistent evaluation in digital radiographs. Also, the speed of delivery of view and low radiation exposure make the digital IOPA the suitable option in today’s scenario7.
In a study on imaging of peri-implant bone levels of implant with buccal bone defects, it was concluded that periapical assay does not provide valid data on the circumferential bone level in implants with buccal bone defects but in general reflects the bone level on the lingual side, hence overestimating the bone anchorage of these implants8.
c) Lateral cephalogram:
Demonstrates geometric skeletal anatomy, interarch relationship,anterior crown to implant ratio and clear view of the sinuses. However as only the median area is shown, it has got limited use in implant placement.
d) Oblique lateral cephalogram:
In extreme mandibular atrophy it can be difficult to obtain intraoral radiographs of adequate diagnostic quality. Extraoral oblique lateral cephalometric radiographs (OLCR) can then be an alternative and also reproducible images of large parts of mandible can be obtained. In vitro, the results of densitometry using periapical films and OLCR were shown to be similar9.
Tomography:
Tomography otherwise known as body section radiography, planigraphy, laminography or stratigraphy
Fig. 2: IOPA showing crestal bone loss
Fig. 3: Oblique lateral cephametric radiograph

60 Indian Journal of Public Health Research & Development. April - June, 2012, Vol. 3, No. 2
is a process of using motion of a x ray source and film in generating images in one plane at a time.
It’s basically of two types i.e linear and complex. Complex again can be divided into many types like circular, spiral, elliptical, figure-8, trispiral and hypocycloidal
Each of these motions has advantages regarding the way in which out of plane structures are blurred. For example, a linear structure which is aligned with the linear motion of a linear tomograph, will not appear blurred, except at the ends, whereas such a structure will be blurred by the circular motion of a circular tomograph.
e) Pantomography:
It is a special tomography technique where panoramic roentgenograms of curved surfaces are obtained by rotating the X ray tube and film-screen holder around the patient.
It’s the most widely used imaging modality but not the most diagnostic. It’s considered as a screening radiograph which provides a good overall picture, but are subject to distortion and magnification .Vertical magnification is 10% while horizontal is 20% and also variable.
Uses:
1) Opposing landmarks are easily identified2) Vertical bone height can be assessed3) Procedure performed with great ease and speed4) Gross anatomy and related pathology can be
assessed
A,B- from alveolar crest to nasal fossa in the maxillary anteriors.
C,D- from alveolar crest to maxillary sinus floor in maxillary posteriors.
E- from alveolar crest to inferior alveolar canal in mandibular posteriors.
F- from alveolar crest to lower border of the mandible in mandibular anteriors
G- from alveolar crest to mental foramen in mandibular premolar region.
Disadvantages:
1) Does not demonstrate bone quality2) Misleading due to magnification3) Little use in depicting the spatial relation4) Least useful in deciding angulation. 5) Overlapping in maxillary anterior region.
To reduce errors and to aid in orientation, stents are often used. These may be copies of a denture incorporating steel balls of known dimension, twists of wire or vaccum moulded splints painted with radiopaque material.
The formula for calculating the bone height is as follows:
Radiographic bone height = Radiographic dimension of the metal ball
Actual bone height Actual dimenion of the metal ball
In a study relating to the effectiveness of an OPG in clinical placement of mandibular implants, it was found that there was no permanent sensory disturbances of the inferior alveolar nerve in any of the cases and there were only two cases of postoperative paresthesia, representing 2/2584 (0.08%) of implants inserted in the posterior
Fig. 4: Movement of the film and and x ray tube in linear tomography
Fig. 5: Panoramic movement of the film ands x ray tube in an OPG
Fig. 6: Determination of bone height for implants in various regions.
Fig. 7: Steel ball incorporatewd in the putty index10
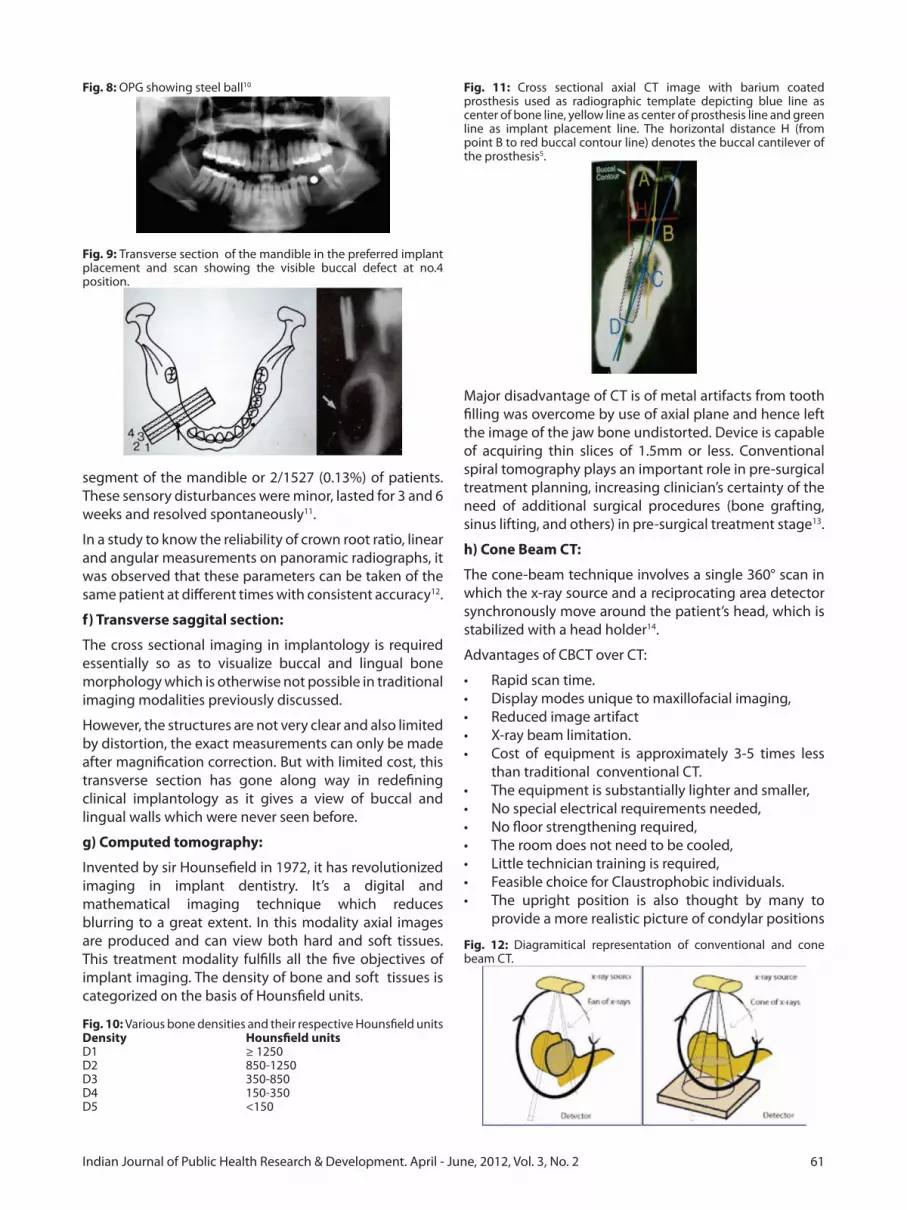
61Indian Journal of Public Health Research & Development. April - June, 2012, Vol. 3, No. 2
segment of the mandible or 2/1527 (0.13%) of patients. These sensory disturbances were minor, lasted for 3 and 6 weeks and resolved spontaneously11.
In a study to know the reliability of crown root ratio, linear and angular measurements on panoramic radiographs, it was observed that these parameters can be taken of the same patient at different times with consistent accuracy12.
f) Transverse saggital section:
The cross sectional imaging in implantology is required essentially so as to visualize buccal and lingual bone morphology which is otherwise not possible in traditional imaging modalities previously discussed.
However, the structures are not very clear and also limited by distortion, the exact measurements can only be made after magnification correction. But with limited cost, this transverse section has gone along way in redefining clinical implantology as it gives a view of buccal and lingual walls which were never seen before.
g) Computed tomography:
Invented by sir Hounsefield in 1972, it has revolutionized imaging in implant dentistry. It’s a digital and mathematical imaging technique which reduces blurring to a great extent. In this modality axial images are produced and can view both hard and soft tissues. This treatment modality fulfills all the five objectives of implant imaging. The density of bone and soft tissues is categorized on the basis of Hounsfield units.
Fig. 10: Various bone densities and their respective Hounsfield unitsDensity Hounsfield unitsD1 ≥ 1250D2 850-1250D3 350-850D4 150-350D5 <150
Major disadvantage of CT is of metal artifacts from tooth filling was overcome by use of axial plane and hence left the image of the jaw bone undistorted. Device is capable of acquiring thin slices of 1.5mm or less. Conventional spiral tomography plays an important role in pre-surgical treatment planning, increasing clinician’s certainty of the need of additional surgical procedures (bone grafting, sinus lifting, and others) in pre-surgical treatment stage13.
h) Cone Beam CT:
The cone-beam technique involves a single 360° scan in which the x-ray source and a reciprocating area detector synchronously move around the patient’s head, which is stabilized with a head holder14.
Advantages of CBCT over CT:
• Rapidscantime.• Displaymodesuniquetomaxillofacialimaging,• Reducedimageartifact• X-raybeamlimitation.• Cost of equipment is approximately 3-5 times less
than traditional conventional CT. • Theequipmentissubstantiallylighterandsmaller,• Nospecialelectricalrequirementsneeded,• Nofloorstrengtheningrequired,• Theroomdoesnotneedtobecooled,• Littletechniciantrainingisrequired,• FeasiblechoiceforClaustrophobicindividuals.• The upright position is also thought by many to
provide a more realistic picture of condylar positions
Fig. 8: OPG showing steel ball10
Fig. 9: Transverse section of the mandible in the preferred implant placement and scan showing the visible buccal defect at no.4 position.
Fig. 11: Cross sectional axial CT image with barium coated prosthesis used as radiographic template depicting blue line as center of bone line, yellow line as center of prosthesis line and green line as implant placement line. The horizontal distance H (from point B to red buccal contour line) denotes the buccal cantilever of the prosthesis5.
Fig. 12: Diagramitical representation of conventional and cone beam CT.

62 Indian Journal of Public Health Research & Development. April - June, 2012, Vol. 3, No. 2
during a TMJ examination, • Bothjawscanbeimagedatthesametime(depending
on the specific cone beam machine), • Radiation dose is considerably less than with a
conventional CT.i) Three dimensional Implant planning software:
First preoperative implant planning software was developed in 1993 in Columbia under the name Simplant .These kind of softwares have revolutionized imaging and preoperative planning in implantology as choosing the exact length and diameter of the implant, exact site of placement and knowing the exact density of the bone have become increasingly easy. As the software provides three dimensional imaging it is even possible to do a virtual mock surgery. Dentascan and Implan are the other similar softwares available These softwares also help us in fabrication of CT based surgical guides which are made on the precise measurements obtained by a three dimensional scan and hence precise placement of the implant. Nobleguide and M guide are two such examples.
Fig13.Implant planning software with features like virtual implant placement, color contrast for nerves
Dosages in various imaging modalities
Full mouth IOPA 13–100 µSv
OPG 10 µSv
CT 1,320–3,324 µSv
CBCT 36.9–50.3 µSv
Guidelines and conclusionThe conventional two dimensional imaging modalities discussed in this article may not provide an exact overall picture as computed tomography and other three dimensional implant planning softwares but are very useful, handy, economic and efficient provided magnification is corrected. These can be used in relatively simple cases and in patients having abundant bone. The advancements like multiplanar reformatted computed tomography and three dimensional imaging planning softwares are essential in cases where hard and soft tissue augmentation is needed and multiple implants are planned. Cone beam computed tomography has become
a standard of care owing to its advantages of being economical, in office design and image accuracy.
References1. Carl E Misch. Dental Implants Prosthetics.2004 Mosby
publishers.2. Stephen L. Wheeler. Implant Complications in the Esthetic
Zone, J Oral Maxillofac Surg 2007,65-93-102.3. Moy and Aghaloo. Which hard tissue augmentation techniques
are the most successful in furnishing bony support for implant placement? Int J Oral Maxillofac Implants, 2007;22 Suppl49-70.
4. Rita Mason and Bourne. A Guide to Dental Radiographs, Oxford University Press, 1998
5. Rosenfeld Mecall,Nevinis and Melloning, Implant therapy: clinical approaches and evidence of success, Vol 2, Quintessence publishers 1998.
6. Singh A, Shekhar A, Singh SK: Diagnostic Dental Imaging and Implant Prosthodontics. Indian Dentist Research and ReviewJan2010, 97-103
7. Morner-SvallingA-C, Tronje G, Andeson LG, Welander U. Comparison of the diagnostic potential of direct digital and conventional intraoral radiographyin the evaluation of peri implant conditions. Clin Oral Impl Res,14,2003;714-719.
8. Schliephake H,Wichmann M, Donnerstag F, Vogt S,. Imaging of periimplant bone levels of implants with buccal bone defects. Clin Oral Impl Res,14,2003;193-200.
9. Verhoeven JW, Ruijter J, Cune MS, Terlou M. Oblique lateral cephalometric radigraphs of the mandible in implantology: usefulness and reproducibility of the technique in quantitative densitometric measurements of the mandible in vivo Clin Oral Impl Res,11, 2000, 476-486.
10. Frei C, Buser D, Dula K. Study on the necessity for cross sectional imaging of the posterior mandible for treatment planning of standard cases in implant dentistry. Clin Oral Impl Res,15, 2004;490-497.
11. Vazquezv L, SaulaicN, Belser U, Bernard J-P. Efficacy of panoramic radiographs in the preoperative planningof posterior mandibular implants:a prospective clinical study of 1527 consequitively treated patients. Clin Oral Impl Res, 19,2008;81-85.
12. Stramotas S, Geenty JP, Darendeliler MA, Byloff F, Berger J , Petocz P. The reliability of crown root ratio, linear and angular measurementson panoramic radiographs. Clin Orthod Res. 3 2000;182-191.
13. Diniz AF et al. Changes in pre surgical treatment planning using conventional spiral tomography Clin Oral Implants Res. 2008 Mar;19(3):249-53
14. Scarfe WC, Farman AG, Sukovic P, Clinical applications of cone beam computed tomography in dental practice J Can Dent Assoc 2006; 72(1):75–80.

63Indian Journal of Public Health Research & Development. April - June, 2012, Vol. 3, No. 2
A clinical and histopathological study of efficacy of chlorhexidine on gingival healingS. Bhudevamma1, Mukhatar Ahmed Javali2, Girish Katti3
1Professor and Head, Department of Periodontics, Saint Joseph Dental College & Hospital, Eluru – 585 104, AP, India2Associate Professor, Department of Periodontics, Al-Badar Dental College & Hospital, Gulbarga – 585 104, Karnataka, India3Professor and Head, Department of Oral Medicine & Radiology, Al-Badar Dental College & Hospital, Gulbarga – 585 104, Karnataka, India
Abstract
BackgroundPeriodontal dressing are advocated post operatively to afford wound healing and prevent patient discomfort. And these materials are not readily modified by addition of antibiotics or antiseptics to provide antibacterial properties.
Material and MethodsSubjects for this study consisted of 21 patients of both sexes in the age group of 20 to 40 years, requiring periodontal therapy.
ResultsThe present study showed that there was marked reduction in plaque index, gingival index, gingival exudates measurement and the degree of inflammatory cells on Chlorhexidine treated side compared to the control side.
Summary and ConclusionFurther longitudinal experimental studies are necessary to delve into the usefulness of Chlorhexidine gluconate as a post-operative surgical dressing.
Key WordsPeriodontal Dressing, Chlorhexidine, Flap surgery, Gingival index, Gingival exudates.
IntroductionPeriodontal dressing are used following surgery with the aim of providing comfort to the patient during wound healing1. However,relatively few dressing have any well documented evidence to substantiate their efficacy. With the advent of Chlorhexidine gluconate and its proven effectiveness as an anti-bacterial agent much interest has been shown in its use for post-operative care2,3. Currently, Chlorhexidine gluconate is being used either in the form of topical application or mouth wash in gingival inflammatory condition. Jorgensen et al3and Addy et al2
have reported better healing after periodontal surgery
with the use of periodontal dressing incorporating Chlorhexidine and have attributed this to anti-bacterial property of Chlorhexidine.
However, no study so far has been undertaken to determine the efficacy of Chlorhexidine as a plaque inhibiting agent to promote better gingival healing after periodontal surgery.
Therefore, a clinical and histological study has been planned with the following objectives.
1. To comparatively evaluate the effect of topical Chlorhexidine and conventional eugenol containing periodontal dressing on gingival healing after flap surgery.
2. To throw more light on the possible role of Chlorhexidine as plaque inhibiting agent in post surgical wound care.
Method and MaterialsSubjects for this study consisted of 21 patients of both sexes in the age group of 20 to 40 years, who visited the department of periodontics, requiring periodontal therapy. Subjects with periodontal pockets of 4 to 6mm were included in the present study.
The clinically parameters included were, quantitative measurement of gingival exudates, histological examination of gingiva, plaque index system of Silness and Loe4 for oral hygiene status, gingival index of Loe and Silness5 and the pocket depth were measured by using William’s periodontal probe.
Full thickness flap surgery was chosen as the treatment of choice to eradicate periodontal pocket in the selected subjects. After the surgical procedure the wound was covered with a thin film of 2% Chlorhexidine gluconate as a post operative dressing with the help of a swab on one half of the operated site and conventional eugenol containing pack was placed on the other half as a control.
The effect of topical Chlorhexidine lasts for a few hours and hence patients was called post operatively every day for a period of seven days and 2% Chlorhexidine gluconate was applied in the experimental side for continuous and prolonged action. Sutures were removed on the 8th day and information regarding any notable difference in pain, discomfort, sensitivity to hot and cold, between experimental and control side was recorded.

64 Indian Journal of Public Health Research & Development. April - June, 2012, Vol. 3, No. 2
Quantitative measurement of gingival exudatesGingival exudates measurement was performed on the mid-labial aspects of gingiva in all the three of both experimental and controlled teeth separately. The exudates measurements were made using modified intracrevicular method of Loe and Holm Pederson6. After the gingiva and surrounding tissue were carefully dried with air, strips of filter paper Whatman No.3 of 1.5mm in width and several millimeters in length were gently placed parallel to the long axis of the tooth at the entrance of the gingival crevice avoiding physical irritation to the crevicular epithelium. The strips remained in place for 3 minutes (Fig 1). They were then removed, dried and immediately stained with an alcoholic solution of 0.2 % ninhydrin Brill7 (Fig 2). Only the area which absorbed crevicular fluid was then measured with travelling microscope and mean scores were calculated.
Histopathological examination of gingiva to assess the degree of inflammation by taking biopsiesHistopathological examination of gingiva was done by taking biopsy from identical sites that is between 21 and 21 in both experimental and control sides. Biopsies obtained were immediately transferred into bottled containing 10% formalin and allowed to fix for 24 hours. Later, they were embedded in paraffin blocks and sections of 5 microns thickness were cut with the help of a rotating microtome. The sections were stained with hematoxyline and Eosin and mounted with a cover slip by using Canada balsm. The tissue sections were examined under a microscope. The density of inflammatory cells
infiltration was assessed at 100 x magnification according to the following criteria.
O – No inflammatory cells in the connective tissue and epithelium.
1 – Sparse distribution of inflammatory cells.
2 – Moderately dense accumulation of inflammatory cells in isolated areas, sparse distribution in other areas.
3 – Dense aggregation of inflammatory cells throughout the subepithelial connective tissue.
Oral hygiene, gingival status and quantity of gingival exudates were periodically assessed post-operatively on 15th,22nd and 29th day. However; gingival biopsy was repeated, only on 29th day, from the area between 32 and 23.
Statistical AnalysisThe mean, standard deviation of oral hygiene index, gingival index and gingival exudates measurement of different post-operative intervals were then calculated and correlated with clinical and histopathological evidence of degree of inflammation for both experimental and controlled sides. The different parameters of experimental sites were then compared with that of the controlled sites. Student‘t’ test was applied to find out the statistical experimental and control areas both clinically and histopathologically.
Results and DiscussionPeriodontal dressings are advocated post-operatively to afford wound protection and prevent discomfort8. But there is still lack of agreement as to whether these dressings have any specific effect on plaque control and enhance better gingival healing. However, no study so far has been undertaken to determine the efficacy topical Chlorhexidine as a plaque inhibiting agent to promote better gingival healing after periodontal surgery. There is also a lacuna in the information on the histopathological evidence to confirm the efficacy of Chlorhexidine in promoting better gingival healing. Therefore a comparative clinic-histopathological study was undertaken to find out the role of topical Chlorhexidine gluconate on wound healing after flap surgery in comparison with conventional eugenol containing periodontal dressing.
The results of the present study are tabulated in the tables I to V.
In the present study most of the patients had less or no discomfort and compared to that of control side. This is in agreement with the finding of Jorgensen et al3, Newman et al9 and Addy and Dolby2. However, during the rest of the post-operative period there was no noticeable difference between both the sides.
Figure 1: Clinical photograph demonstrating the placement of No.3 whatman filter paper strips in the gingival sulcus.
Figure 2: Photograph illustrating the accumulation of crevicular fluid on the filter strips after staining with 0.2% ninhydrin solutions.

65Indian Journal of Public Health Research & Development. April - June, 2012, Vol. 3, No. 2
Plaque IndexThe mean and standard deviation of plaque index was less on the side where Chlorhexidine was topically applied compared to the control side with the conventional periodontal dressing on the 8th post-operative day. This again confirms the earlier reports by Loe and Schiot10, Lindhe et al11, Flotra et al12, Hoyos et al13 and Sally et al14, who have observed a reduction in mean plaque index with the use of Chlorhexidine as a plaque inhibiting agent either in the form of mouth wash or as a topical application or being incorporated into the gel. The mean plaque index during the rest of the post-operative period was same on both the sides.
Gingival Exudate:
The gingival exudates measurement was less on the experimental side on 8th and 15th post-operative days compared to the control side. This confirms with the above finding of Lindhe et al11 and Jorgensen et al3.However, there was no statistically significant difference
on both sides during the rest of the post-operative period.
Gingival IndexA statistically significant reduction in gingival index was noted on chlorhexidine treated side.The above finding are in agreement with the earlier findings of Hoyos et al12, Loe and Schiot10, Jorgensen et al3 and Newman et al8,Hoyos et al13 has reported a marked reduction in plaque index and gingival index scores with the use of corosodyl dental gel in 56 children after one month with regular oral hygiene methods.
Jorgensen et al3 also observed less gingival exudates and decreased tendency to bleeding with the use of Chlorhexidine containing surgical dressing during healing of reverse beveled flap operations.
Histopathological measurementsThe distribution of inflammatory cells were minimal
Table I: Subjective Symptoms.
No of patients Period of study Groups Number of patients with different subjective symptoms
Pain Discomfort Sensitivity Better Feeling
21 8th day Control 13 16 .. 6
Expt 5 3 2 16
21 15,22 & 29 days Control - - - -
Expt - - - -
Table II: Plaque index.
No of Patients Period of Study Groups Mean and Standard Deviation t-test Statistical significance
21 Pre-surgicalControl 2.00±0.11 0.06 P > 0.05
Experimental 1.96±0.17
21 8th dayControl 0.66±0.07 7.59 P >0.001
Experimental 0.30±0.03
21 15th dayControl 0.46±0.05 1.91 P > 0.05
Experimental 0.32±0.05
21 22nd dayControl 0.33±0.05 1.58 P > 0.05
Experimental 0.30±0.05
21 29th dayControl 0.28±0.05 0.41 P > 0.05
Experimental 0.25±0.05
Table III: Gingival exudates measurement.
No of Patients Period of Study Groups Mean and Standard Deviation t-test Statistical significance
21 8th dayControl 2.34±0.09 1.92 P > 0.01
Experimental 1.97±0.09
21 15th dayControl 1.4±0.07 2.12 P > 0.05
Experimental 1.19±0.07
21 22nd dayControl 0.73±0.05 1.41 P > 0.05
Experimental 0.70±0.05
21 29th dayControl 0.39±0.05 0.16 P > 0.05
Experimental 0.40±0.04

66 Indian Journal of Public Health Research & Development. April - June, 2012, Vol. 3, No. 2
or sparse in most of the patients on the side with Chlorhexidine dressing on 8th post – operative day.However,on the 29th post-operative day the degree of inflammation was very minimal and almost the same on both the sides (Fig 3,4,5,6). The above finding are in agreement with the reports of Robert et al15ho demonstrated microscopically that 2% Chlorhexidine gluconate applied topically each day to the teeth and gingival margin of dogs, resulted in significant reduction in inflammation in healing gingival wound.
The difference in the different parameters noted on both experimental and the control sides indicate that the use of 2% Chlorhexidine gluconate topical application as a post-operative dressing on the experimental side showed better healing of gingival wounds after periodontal surgery. Davies et al16, Lindhe et al11 and Schiot17 have shown that topical application of 2% chlorhexidine gluconate on teeth can completely inhibit the plaque formation. Hence from the present study it can be
concluded that the beneficial effect of Chlorhexidine on wound healing is due to its potent antibacterial activity as well as its non- irritating character.
From the above discussion it may be inferred that the decrease in the gingival index and the gingival exudates measurement on the experimental side in the present study may be due to antibacterial and plaque inhibiting effect of chlorhexidine. The clinic-histopathological finding during the initial healing phase following the flap surgery shows that a better results was noticed on the experimental side where topical 2% Chlorhexidine gluconate was used compared to the control side where a conventional eugenol containing dressing was given.
Summary and ConclusionThe present study showed that there was marked reduction in plaque index, gingival index, gingival exudates measurement and the degree of inflammatory
Table IV: Gingival Index.
No of Patients Period of Study Groups Mean and Standard Deviation t-test Statistical significance
21 Pre-surgicalControl 2.06±0.10 0.07 P >0.05
Experimental 2.05v0.10
21 8th dayControl 0.82±0.09 4.95 P > 0.05
Experimental 0.35±0.03
21 15th dayControl 0.16±0.02 1.52 P>0.05
Experimental 0.12±0.02
21 22nd dayControl - - -
Experimental -
21 29th dayControl - - -
Experimental -
Table V: Histopathological Assessment of degree of Inflammation.
No of Patients Period of Study GroupsNumber of patients with different grading
Grade 0 Grade 1 Grade 2 Grade 3 Grade 4
21 8th dayControl 2 3 5 8 3
Experimental 8 1 11 0 1
21 29th dayControl 8 6 3 4 -
Experimental 10 4 4 4 -
Table V shows histopathological assessment of degree of inflammation in 21 patients on 8th and 29th post-operative periods. The distributions of inflammatory cells were minimal or sparse in most of the patients on the side with Chlorhexidine dressing on 8th post-operative day. However on the 29th post-operative day the degree of inflammation was very minimal and almost the same on the both sides.
Figure 3: Photomicrograph of gingiva showing minimal inflammation in the underlying epithelium and connective tissue on 8th post-operative day (expt side). H & E stain in low power.
Figure 4: Photomicrograph of gingiva showing moderate inflammation in the underlying epithelium and connective tissue on 8th post-operative day (control side). H & E stain in low power.

67Indian Journal of Public Health Research & Development. April - June, 2012, Vol. 3, No. 2
cells on Chlorhexidine treated side compared to the control side where conventional eugenol containing periodontal dressing was given.
Results obtained in the present study shows at the end of first post-operative week there was stastically significant difference in different parameters on Chlorhexidine treated side. During the observation period, the gingiva which had Chlorhexidine dressing showed less gingival exudates decreased bleeding tendency and less inflammatory cells indicating of that topical application of 2% Chlorhexidine gluconate as a post operative dressing increased the healing rate.
However, further longitudinal experimental studies are necessary to delve into the usefulness of Chlorhexidine gluconate as a post-operative surgical dressing.
References1. Bernier JL and Kaplan H.The report of gingival tissue after
surgical intervation.J.A.D A.1972, 35:679.2. Addy M and Dolby AE.The use of Chlorhexidine mouth
wash compared with a periodontal dressing following the gingivectomy prodedure.J.Clin.Periodontol.1976.3:59.
3. Asboe Jorgenson et al.Effect of Chlorhexidine dressing on the healing after periodontal surgery.Jperiodontol.1974.45:13.
4. Sillness J and Loe H.Periodontal disease in pregnancy part II correlation between oral hygiene and periodontal condition.Acta. Odont.Scand.1964.22:121
Figure 6: Photomicrograph of gingiva showing no inflammation in the underlying epithelium and connective tissue on 29th post-operative day (control t side). H & E stain in low power.
Figure 5: Photomicrograph of gingiva showing no inflammation in the underlying epithelium and connective tissue on 29th post-operative day (expt side).H & E stain in low power.
5. Loe H and Sillness J.Periodontal disease in pregnancy, prevalence and severity. Acta.Odont.Scand.1963.21:533.
6. Loe H and Holm Pederson A.Absence and presence of fluid from normal and inflamed gingiva.periodontics, 3:171, 1965.
7. Brill N.Effect of chewing on flow of tissue fluid into human gingival pockets. Acta.Odont.Scand.1959.17:277.
8. Baer P,Summer EL and Miller H.Periodontal dressing. Dental Clinics of North America.1969.13:181.
9. Newman PS and Addy PA.Comparizon of periodontal dressing and Chlorhexidine gluconate mouth wash after internal beveled flap procedure.J.periodontol.1969.40:231.
10. Loe H and Schiot CR.The effect of mouth rinses and topical application of Chlorhexidine on development of dental plaque and gingivitis in man. J.Perio.Res.1970.5:79.
11. Lindhe JG et al.Effects of topical application of Chlorhexidine on the oral mucosa of the hamsters.J.Perio res.1970.5:177.
12. Flotra H,Gjermo P and Rolla G.A full mouth study of effect of Chlorhexidine mouth wash on 50 soldiers.Scand.Journal of Dental RTesearch.1972.80:10.
13. Hoyos Df and Murray JJ. The effect of Chlorhexidine gel on plaque and gingivitis in children. BDA.1977.142:366.
14. Sally Jet al. The use of Chlorhexidine containing gel in plaque control programme. BDJ.1979.146.105.
15. Robert C et al.Microscopic evaluation of topically applied Chlorhexidine gluconate on gingival wound healing in dogs.J. Scand.dental. Research. 1973.41.311.
16. Davies RM et al. The effect of topical application of Chlorhexidine on bacterial colonization of the tooth and gingiva. J.Perio Res.1970.5:96.
17. Schiot T et al.The effect of Chlorhexidine mouth rinse on human oral flora. J.Perio.Res.1970.5:84.

68 Indian Journal of Public Health Research & Development. April - June, 2012, Vol. 3, No. 2
Effect of two tongue cleaning methods on oral mutans Streptococci levelJayachandra M.G1, Anil V. Ankola2, Karibasappa G.N.3, Vijayanath V.4
1Assistant Professor, Department of Preventive and Community Dentistry, Bapuji Dental College and Hospital, Davangere-5770042Professor and Head, Department of Preventive and Community Dentistry, KLES’s Institute of dental sciences, Nehru Nagar, Belgaum3Reader, Department of Preventive and Community Dentistry, Bapuji Dental College and Hospital, Davangere-577004, 4Associate Professor, Department of Forensic Medicine & Toxicology, S.S. Institute of Medical Sciences & Research Centre, Davangere-577005, Karnataka, India
Abstract
BackgroundTongue scraping and brushing have been appreciated for hundreds of years but are still appreciated or used by the public. Scientific evidence has validated the need to practice habitual and tongue cleaning as part of daily home oral hygiene procedures.
ObjectiveTo assess and compare the effect of tongue scraping and tongue brushing on oral Mutans streptococci level.
Methods20 healthy subjects aged 14 to 15 years were randomly selected. Flat plastic tongue scraper and Nylon multitufted small headed tooth brush are the two tongue cleaning devise used. Unstimulated salivary samples were obtained at4 intervals from each individual. Salivary samples were inoculated on Mitis Salivary Agar Plate and Sorbital Broth was used for identification of Mutans streptococci group.
ResultsPaired and unpaired ‘t’ test were employed. Reduiction in the Mutans streptococci level from 48.4X10⁴ CFU and 38.3X10⁴ CFU at baseline in tongue scraping and tongue brushing group respectively to 0.34X10⁴ and 0.39X10⁴ CFU after 7th day. Conclusion: Both tongue coating removal methods evaluated were efficient in reducing Mutans streptococci level. This implies that physical removal of the coating on the dorsum of the tongue is important and not the method used for the same.
Key WordsTongue scraping, Tongue brushing, Tongue cleaning, Mutans streptococci.
IntroductionThe most common concept concerning individual health is the harmony of one’s physical, mental, and social well
being. The simple absence of disease is not accepted as an indication of health. Tongue cleaning being an ancient habit, is practiced for centuries in many Eastern and Oriental cultures, though not very popular in the Western Civilizations1.
Recent literature has shown that tongue cleaning leads to healthy oral Environment2. Tongue is a small but powerful organ of the body since it performs the function of - Taste, speech, mastication and deglutition. Hence the need for tongue cleaning has become a part of daily oral hygiene. Gilmore and Bhaskar presented convincing evidence that plaque forming streptococci counts increased ten folds after a week of not brushing the tongue2.
Tongue Care in AntiquityAlthough largely an unknown practice in the west, tongue brushing and scraping have been used since antiquity and are still used by natives of Africa, Arabia and India. In the early civilizations, oral cleansing often had religious ritual significance. The Hindus regarded ‘mouth as the gateway of the body, therefore it was necessary to keep it scrupulously clean’. The ancient Hindus used tongue scrapers with sharp curved edges made of Gold, Silver, Ivory or Tin1.
The Mohammedans used Siwak wood brush once a day in a manner specified in the Koran. Prophet Mohammed said ‘You shall clean your tongue for that is the way to praise God’ and in Mohammedans the final stage of oral cleansing involved vigorous tongue brushing1.
From 15th-19th century, tongue cleaning was known to be practiced primarily by the affluent leisure class. More recently, during the 20th century, tongue cleaning was not a popular concept, and only a few references are mentioned in the literature3.
Why Clean the TongueTongue, because of its surface texture contributes significantly in plaque formation and accumulation, has remained a neglected part in the oral cavity4.
The dorsal posterior part of most tongues has a coating of millions of microorganisms. Studies have shown that Dorsum of the tongue is an important reservoir for Mutans streptococci5.

69Indian Journal of Public Health Research & Development. April - June, 2012, Vol. 3, No. 2
Further more, studies have also found a significant correlation between the prevalence of Mutans streptococci in saliva and its prevalence on the dorsum of the tongue5.
Mutans streptococci (MS) are one of the most virulent cariogenic pathogens in the oral cavity. Tooth brushing alone is effective in reducing bacterial counts in the mouth, but not dramatically. Tongue cleaning seems to have a more dramatic effect on the salivary levels of caries-causing bacteria, Such as Mutans streptococci5. With tongue scraping becoming established as an excellent tool for reducing the levels of Mutans streptococci in the oral cavity, it would be of great interest to compare the efficacy to tongue brushing method for decreasing the bacterial count in the oral cavity.
In this regard the effect of mechanical oral hygiene techniques on the levels of microorganisms, especially Mutans streptococci, is of great interest to dentists focused preventive care.
Objectives of the Study1. To assess the effect of tongue scraping and tongue
brushing on oral Mutans streptococci level.2. To compare the two methods of tongue cleaning on
the reduction of oral Mutans streptococci level.
Material and MethodsStudy design: Double blinded Randomized Controlled Trial
Study population: 20 healthy subjects with similar food habits aged 14-15 years were selected and randomly distributed into two groups:
Group A-10 subjects, Group B-10 subjects.
Following tongue cleaning devices had been selected.
• Flatplastictonguescraper-groupAsubjects.• Nylonmultituftedsmallheadedtoothbrush-group
B subjects.
Inclusion criteria: • Subjectswithpermanentdentitionwereincluded.• All levels of Oral hygiene and dental caries were
accepted those who had either rampant tooth decay or very poor oral hygiene were also included in this study this was important to see if the protocol was effective for all ranges of oral hygiene or not.
Exclusion criteria:• SubjectssufferingfromTonsillitis• Subjectswithanycontributingmedicalhistory• Subjects who have performed any type of tongue
cleaning habits.
Method of collection of salivary samples
Unstimulated salivary samples were collected in the test tube by spitting method from all subjects prior to start of
the experiment to establish base line Mutans streptococci level, after routine tooth brushing.
Demonstration to perform tongue scraping and tongue brushing was given to both the groups by a single examiner. Subjects were told to clean the tongue every morning after routine tooth brushing for 7 days.
Group A, involving 10 subjects, were given a tongue scraper and asked to scrape the dorsum of the tongue along the linea mediana and at each lateral part of the tongue once every morning after routine tooth brushing, every day for 7 days. Group B, consisted of 10 subjects were asked to brush the tongue with forward and backward strokes along the linea mediana and at each lateral borders of the tongue once every morning after routine tooth brushing, every day for 7 days.
Upon scraping or brushing the tongue, the patients were asked to spit out the excess saliva that had accumulated on the tongue. Then unstimulated salivary samples were obtained at 1 hour, 3rd day, and 7th day after the start of the experiment. A total of 4 samples were collected from each individual. During the entire study participants continued their habitual oral hygiene and were instructed not to take any antibiotics without prior information.
One ml of salivary samples were collected in the test tube and transported through Thyroglycolate broth media. 10 micro liters of saliva from each sample was inoculated on Mitis Salivary Agar Plate and Incubation was done at 37°c in 5-10% carbon dioxide for 48hrs. Sorbital broth was used for identification of Mutans streptococci group.
Ethical Clearance and informed consent:
Before staring the study, ethical clearance was obtained from ethical review committee board of K.L.E’s Institute of dental science, Belgaum, Karnataka state India. Oral consent was obtained from all the children and written informed consent was obtained from the parents.
Statistical AnalysisStatistical test employed for the obtained data in our study were Paired and unpaired ‘t’ tests. There were 20 participants in this research study. Paired ‘t’ test was used to compare within the group at different intervals and unpaired ‘t’ test was used to compare between the two groups.
ResultsReduiction in the Mutans streptococci level from 48.4X10⁴ colony forming units (C.F.U) and 38.3X10⁴ C.F.U at baseline in tongue scraping and tongue brushing group respectively to 0.34X10⁴ and 0.39X10⁴ C.F.U after 7th day (p<0.01).
Graph I show the comparisons of mean number of Mutans streptococci in tongue scraping and tongue brushing groups at baseline. Mean number of Mutans streptococci

70 Indian Journal of Public Health Research & Development. April - June, 2012, Vol. 3, No. 2
in tongue scraping group was 48.8 X I04 and in tongue brushing group it was 38.3X10⁴ colonies forming units. The results demonstrate that there were no significant differences between group means at base line. This simply states that the groups were statistically equivalent before the start of the treatment. Base line measurements were compared to ascertain if there were any differences among the groups before the start of the treatment.
Graph II shows the mean decrease in Mutans streptococci level in tongue scraping group at different time intervals. When baseline value was compared with 1 hour, third day and seventh day value (p<0.01) and 1 hour value with 7th day value statistically highly significant difference was found. But when 1 hour value was compared with 3rd day value and 3rd day value with 7th day value no significant difference was found.
Graph III shows the mean decrease in Mutans streptococci level in tongue brushing group at different time intervals. When baseline value was compared with 1 hour, third day and seventh day value (p<0.01) and 1 hour value with 3rd day and 7th day value statistically highly significant difference was found. Only when 3rd day value was compared with 7th day value no significant difference was found.
Graph IV shows the gradual reduction of microorganisms from baseline to one hour, 3rd day and 7th day (p<0.01) but when it was compared between the groups at the final stage (after 7th day) no significant difference was found.
DiscussionThe data obtained from this research project showed very clear trends and highly significant results. In the
present study, there was a gradual reduction in the Mutans streptococci count from base line to 7th day after tongue scraping which is in close agreement with the study conducted by Almas.et.al2, White GE.et.al5 and Bordas A.et.al7. Since this method is performed every day there will be a gradual reduction of microorganisms from the tongue coating. Hence by 7th day the count reduced significantly. Bordas A. et.al7 reported that while mechanical tongue cleaning with or without chemical intervention can reduce bacterial load on the tongue, this effect is transient, and regular tongue cleaning is required to provide a long lasting (overnight) reduction in bacterial numbers. Nevertheless, tongue cleaning is an oral hygiene procedure that is little practiced due to discomfort and/or lack of awareness on the part of dental professionals and their patients.
In a study conducted by Quirynen. M.et.al6 no significant reduction in bacterial load was found when using toothbrush or scraper to clean the tongue. This may be because of different methods employed in collection of microbial sample from the tongue and analysis of non specific bacteria, where as in the present study, only Mutans streptococci level has been evaluated and saliva samples were collected by spitting method.
Hence this study is unique, being the first to compare two different methods of tongue cleaning and evaluating its effects on the reduction of specific microorganisms. Thus the clinical significance of this study should not be overlooked as research has proved the need to include the tongue in all oral hygiene measures. Thorough preventive measures need to include an effective means of reducing the pool of Mutans streptococci inhabiting the dorsum
Graph 1: Comparison of mean number of Mutans streptococci in tongue scraping and tongue brushing groups at base line (all values in 104 C.F.U)
48.8
38.3
0.0
10.0
20.0
30.0
40.0
50.0
60.0
Mea
n v
alu
es
Baseline valuesTongue scraping Tongue brushing
Graph 2: Comparison of mean decrease in Mutans streptococci level in tongue scraping group at different time intervals (all values in 104 C.F.U )
25.30
40.93
48.46
15.63
23.16
7.53
0.00
10.00
20.00
30.00
40.00
50.00
60.00
Mea
n v
alu
es
Base line
-1 hour
Base line
-3rd day
Base line
-7th day
1 hour -
3rd day
1 hour -
7th day
3rd day -
7th day
Time intervals
Graph 3: Comparison of mean decrease in Mutans streptococci level in tongue brushing group at different time intervals (all values in 104 C.F.U )
Graph 4: Comparison of mean number of Mutans streptococci in tongue scraping and tongue brushing groups at different time periods (all values in 104 C.F.U )
19.10
33.26
37.92
14.16
18.82
0.00
5.00
10.00
15.00
20.00
25.00
30.00
35.00
40.00
45.00
50.00
Mea
n v
alu
es
Base line -1hour
Base line -3rd day
Base line -7th day
1 hour - 3rdday
1 hour -7thday
3rd day - 7thday
Time intervals
4.66
48.8
38.3
23.519.2
7.87 5.040.34 0.39
0.0
10.0
20.0
30.0
40.0
50.0
60.0
Mea
n v
alu
es
Baseline 1 hour 3rd day 7th day
Time periods
Tongue scraping Tongue brushing
71Indian Journal of Public Health Research & Development. April - June, 2012, Vol. 3, No. 2
of the tongue if one is to truly expect a striking reduction in caries.
ConclusionIn summary, both tongue coating removal methods evaluated were efficient in reducing Mutans streptococci level. This implies that physical removal of the coating on the dorsum of the tongue is important and not the method used for the same. On the basis of literature there appears to be enough data to justify the necessity to clean the tongue on a regular basis and as part of daily home oral hygiene practice.
Tongue cleaning is simple, fast and the benefits for most people far out weigh the small investment and time required to accomplishing this procedure. Therefore oral hygiene measures should include the dorsum of the tongue, especially in high-risk patients, who have endogenously high levels of Mutans streptococci residing in the oral cavity.
References1. Christen AG, Swanson BZ. Oral hygiene: a history of tongue
scraping and brushing. J Am Dent Assoc Feb 1978;96:215-192. Almas K, AI-Sanawi E, AI-Shahrani B. The effect of tongue
scraper on mutans streptococci and lactobacilli in patients with caries and periodontal disease. Odontostomatol Trop Mar 2005;28(109):5-10.
3. Gordon. J. Christensen. Why clean your tongue? J Am Dent Assoc. Nov 1998;129(11):1605-7.
4. Gulati MS, Gupta L. Clinical evaluation of supplementing tongue brushing to most advocated regime of tooth brushing. J Indian Soc Pedod Prev Dent. 1998 Mar;16:12-6.
5. White GE, Armaleh MT. Tongue scraping as a means of reducing oral mutans Streptococci. J Clin Pediatr Dent. Winter 2004;28(2):163-6.
6. Quirynen M, Avontroodt P, Soers C, Zhao H, Pauwels M, Steenberghe D. Impact of tongue cleansers on microbial load and taste. J Clin Periodontol Jul 2004;31(7):506-10.
7. Bordas A, McNab R, Staples AM, Bowman J, Kanapka J, Bosma MP. Impact of different tongue cleaning methods on the bacterial load of the tongue dorsum. Arch Oral Biol. 2008 Apr;53 Suppl 1:S13-8.

72 Indian Journal of Public Health Research & Development. April - June, 2012, Vol. 3, No. 2
A study of oxidative stress and altered endothelial cell function in preeclampsiaJuhi Aggarwal1, Mayur Kumar2, Narendra Kumar3
1Assistant Professor, Department of Biochemistry, Santosh Medical College and Hospital, Ghaziabad- 201009, 2Senior Resident, Department of Biochemistry, VMMC and Safdarjang Hospital, Delhi- 110029, 3Post Graduate Student- III year, Department of Physiology, Santosh Medical College and Hospital, Ghaziabad- 201009
AbstractPreeclampsia is a complex multisystem disorder characterized by hypertension and proteinuria. It is one of the most common and potentially fatal complications of pregnancy. A case control study was carried out to assess the levels of homocysteine, lipid peroxidation and antioxidant status in patients with preeclampsia. Fasting venous samples were collected during antepartum period and serum levels of homocysteine (Hcy), malondialdehyde (MDA), ascorbic acid (vitamin C) and uric acid were measured. In the preeclamptic group, Hcy and MDA levels were significantly raised while antioxidant ascorbic acid level was significantly reduced (p < 0.01) and uric acid concentration was increased significantly (p <0.01). These findings suggest that Hcy and lipid peroxidation are associated with preeclampsia. In preeclampsia, antioxidants are extensively utilized to counter act the cellular changes and endothelial dysfunction mediated by oxidative stress. Placental oxidative stress which results from the ischemic reperfusion injury is reported to be involved in the etiopathogenesis of preeclampsia.
KeywordsPreeclampsia, Homocysteine, lipid peroxidation, antioxidants.
IntroductionPreeclampsia is a pregnancy specific disorder which complicates 7-10% of all gestation1. This common disorder, which is more prevalent in first pregnancies, is associated with approximately 10-15% of maternal and fetal morbidity and mortality, with serious outcomes occurring in developing countries2.
Preeclampsia is a triad of oedema, hypertension and proteinuria occurring primarily after the 20th gestational week and most frequently near term3.
It is associated with defective placentation, in which the dislodging of extravillous tropohoblast plugs in the maternal spiral arteries. This leads to the onset of blood flow into the intervillous space, causing an oxidative burst that generates reactive oxygen species (ROS)4. Also, the reduced uteroplacental perfusion due to the aberrant placentation leads to ischemic reperfusion injury to the placenta5.
Preeclampsia is characterized as a state of oxidative stress resulting from increased generation of free radicals and decreased levels of antioxidants6.
The free radicals thus, generated are capable of exerting mediating processes such as tissue remodeling, hormone signaling oocyte maturation, folliculogenesis, tubal function, ovarian steroidogenesis and germ cell function. Its increased levels can inflict significant damage to cell structure7.
Oxidative stress has been proposed as a promoter of endothelial cell dysfunction and lipid peroxidation8 which results in production of lipid peroxidation products i.e. malondialdehyde (MDA) and lipid hydroperoxides9. Homocysteine is a sulfur containing amino acid derived from the metabolic demethylation of methionine10.
Homocysteine by autooxidation generates superoxide and hydrogen peroxide, both of which damage the arterial endothelial lining, causing endothelial dysfunction11.
Recently, homocysteine has been observed as an independent risk factor for vascular endothelial cell injury in cardiovascular factor disease and common obstetric problems i.e. preeclampsia12.
It is observed that oxidative stress leads to focal collagen damage in the fetal membranes and results in preterm labour13.
Significantly decrease levels of antioxidants i.e. vitamin C, vitamin E and uric acid have been reported in patients with preeclampsia14.
In this context, the present study has been undertaken determine the changes in serum levels of total homocysteine, lipid peroxidation product, MDA and antioxidant levels with vitamin C and uric acid.
Material and MethodsA case control study was conducted in Department of Biochemistry, Santosh Medical College and Hospital, Ghaziabad. Fifty severe eclamptic patients (criteria of severe preeclampsia: systolic blood pressure of 160 mmHg or more and diastolic blood pressure of 110 mmHg or more, persistent proteinuria of atleast 2+ by dipstick or 24 hour urinary excretion of 2 g or more, persistent headache, oligouria, nausea, vomiting, epigastric pain, pulmonary oedema, thrombocytopenia) and fifty normotensive healthy pregnant controls.

73Indian Journal of Public Health Research & Development. April - June, 2012, Vol. 3, No. 2
Subjects free from pre-existing hypertension, cardiovascular disease, cerebrovascular disease, diabetes mellitus, renal disease, liver disease and hypothyroidism were included in the study.
Study subjects of both groups were matched with respect to maternal age, gestational age and BMI. Sociodemographic features of subjects are given in Table I.
Ethical clearance for the study was taken from the concerned authorities. Informed written consent was taken from the subjects.
With all aseptic precautions morning blood samples from all the study subjects were collected before any medication was given. Samples were centrifuged at 3000 rpm; serum was separated and stored at -70.C.
Serum homocysteine concentration was analysed by fluorescence polarization immunoassay (FPIA) method by Abbot’s Ax SYM system.
Serum MDA levels were measured by Thiobarbituric acid reactive substances assay (TBARS) at 532 nm wavelength by spectrophotometer.
Ascorbic acid concentration was measured by Dinitrophenyl Hydrazine (DNPH) method at 520 nm wavelength by spectrophotometer and uric acid concentration was measured by Uricase method using Erba Mannheim Diagnostics kit at 550 nm.
Statistical analysis was performed using Mann Whitney U test and Spearman Correlation analysis.
ResultsRegardless of the preeclampsia none of the subjects had any chronic disease or pregnancy complications. No significant difference was found between the clinical features of the preeclamptics and the normotensive pregnant controls other than hypertension and proteinuria Table I.
Table I: Sociodemographic features of the subjects
S. No.
Parameters Cases (n±50)(Mean ± SD)
Controls(n ±50)
(mean ± SD)
p-Value
1 Age 25.30± 2.59 26.75 ±2.12 >0.05
2. Gestational age (days)
235 ±13 226 ±14 >0.05
3. Pregnancy (Number)
4.3 ±1.9 4.6 ±2.2 >0.05
4. Blood pressure (mmHg) Systole Diastole
164 ± 12114 ±6
116 ±1176 ±4 <0.05*
5. Proteinuria (mg/24 hours)
5300 ±1250 54 ±24 <0.05*
Serum homocyteine MDA and antioxidant status concentrations of preeclamptics and normotensive pregnant controls were given in Table II.
Serum homocyteine concentrations of preeclamptics were higher than those of controls (p<0.05). Likewise, MDA levels were also higher in preeclamptics patients (p<0.05).
There is significant decrease in ascorbic acid levels (p<0.01) in cases as compared to controls and on the other hand, there is significant elevation of uric acid (p<0.01) in cases as comparison to the controls.
Table II: Biochemical parameters to assess Homocysteine, lipid peroxidation and antioxidant status of the subjects.
S. No.
Parameters Cases (n±50)(Mean ± SD)
Controls(n ±50)
(mean ± SD)
p-Value
1 Homocysteine (µmol/l)
18.78 ±6.71 12.59 ±5.06 <0.05*
2. Malondialdehyde (nmol/l)
5.46 ±0.20 3.46 ±0.18 <0.05*
3. Ascorbic acid (mg/dl)
0.72 ±0.21 0.98 ±0.17 <0.01*
4. Uric acid (mg/dl) 8.16 ±1.68 4.72±0.91 <0.01*(*: significant)
Discussion Preeclampsia is one of the leading causes of maternal and perinatal mortality in the developing countries. It affects as many as 8,370,000 causes worldwide per year. Though the etiopathogenesis of preeclampsia is largely not understood, oxidative stress and a generalized inflammatory state forms the principle factors contributing to preeclampsia15.
Our study suggests that Hcy and a marker of free radical, MDA were significantly increased in patients of preeclampsia.
Preeclampsia has been proposed as a two stage disorder. In the first stage, the placenta produces a cytotoxic factor and in the second stages the increased mitochondrial activity of the placenta results in increased generation of ROS16.
Abnormal placenta in preeclampsia results in the placental ischemia17. The ischemia reperfusion injury to the placenta leads to generation of placental oxidative stress and hence, increased synthesis of ROS. Increased superoxide ion generation in the placenta has been detected with the direct electron paramagnetic spin resonance technique18.
The deleterious effects of free radicals include the initiation of lipid peroxidation, cellular dysfunction and leukocyte activation leading to endothelial dysfunction19.
Numerous independent studies demonstrating a significant association between preeclampsia and the levels of various biomarkers of oxidative stress have strengthened our evidence for lipid peroxidation in preeclamptic patients20,21.
Serum concentrations of Hcy decrease in normal pregnancy either due to physiological response to pregnancy, increase in estrogen or hemodilution22.

74 Indian Journal of Public Health Research & Development. April - June, 2012, Vol. 3, No. 2
Our study demonstrates an increase in the Hcy levels in the patients with preeclampsia along with a positive correlation in between MDA and Hcy in these patients23.
In a study conducted it was shown that hyperhomocysteinemia decreases total vessel surface and disrupts placental perfusion in preeclamptics24.
It is also seen that vascular damage in maternal uteroplacental circulation is present in endothelial dysfunction and smooth muscle cell proliferation, both of which are characteristic features of preeclampsia25.
Along with these findings it is corroborated that there is decreased endothelial nitric oxide (NO) synthesis and activity due to effect of increased Hcy levels26.
In consistent with present findings, Vandergit et al27 and Rajkovic et al28 also found Hcy concentration to be raised in preeclamptic patients.
Preeclampsia is associated with increased utilization of the antioxidants. Several studies have demonstrated presence of decrease serum levels of ascorbic acid as compared to normal pregnant women29,30 and same findings were found in the present study.
There is a significant increase in the serum uric acid levels in the present study. It implicates antioxidative response related to the pathogenesis of preeclampsia31.
Hence, in conclusion, preeclampsia predisposes the vascular endothelium to oxidative stress and elevated Hcy levels. There is increase in total oxidant and decrease in antioxidant activities of these patients leading to endothelial injury and vasospasm. There is need to further evaluate the Hcy lowering effect of vitamin B6, vitamin B12 and folate supplementation. Also, the results of ongoing trials using vitamin C and E supplementation may be able to delineate the role of oxidative stress in the pathophysiology of preeclampsia.
References1. Niyazi T, Hasnu C, Gurkan C, Ogaz O, Ahmet A. The correlation
between plasma homocysteine and malondialdehyde level in preeclampsia. Journal of Neuroendocrinolgy 2003; 24 (6): 446- 448.
2. Vilare K, Say L, Gulmezoglu AM, Merialdi M, Lindleimer MD, Betran AP, Piaggio G. Eclampsia and preeclampsia: a health problem for 2000 years. London : RCOG Press; 2003: 189.
3. Mabie WC, Sibai BM. Hypertensive states of pregnancy. In: Decherney AH, Pernoll M, editors: Current obstetrics and gynecologic diagnosis and treatment. USA: Appleton and Lange; 1994: 380.
4. Packer JE, Slater TF, Wilson RL. Direct observation of a free radical interaction between Vitamin E and Vitamin C. Nature 1979; 278: 737- 738.
5. Atamer Y, Kocyigit Y, Yokus B. Lipid peroxidation , antioxidant defense , status of trace metals and leptin levels in preeclampsia. Eur J Obstet Gynecol Reprod Biol 2005; 119: 60-66.
6. Hung TH, Skepper JN, Chamock- Jones DS. Hypoxia reoxygenation: a potent inducer inducer of apoptotic changes in the human placenta and possible etiological factor in preeclampsia. Circ Res 2002; 90: 1274-1281.
7. Agrawal A, Gupta S, Sharma R. Oxidative stress and its complications in female infertility – a clinician perspective. Reprod Biomed 2005; II (5): 641-650.
8. Yoneyama Y, Sawa R, Suzuki S. Relationship between plasma malondialdehyde levels and adenosine deaminase activities in preeclampsia. Clin Chim Acta 2002; 322:169- 173.
9. Sikkema JM, Van Rijn BB, Franx A. Placental superoxide is increased in preeclampsia. Placenta 2001; 22: 304-308.
10. Refsum H, Uelend PM, Nygard O, Brattstroml L, Vollet SE. Total homocysteine and cardiovascular disease. Journal Internal Medicine 1999; 246: 425-454.
11. Wakler MC, Smith GN, Perkins SL, Kelly EJ, Garner PR. Changer in homocysteine levels during normal pregnancy. American Journal of Obst. and Gynaecology 1999:180(3):660-664.
12. Hajjar KA. Homocysteine : a sulph’rous fire. J Clin Invest 2001; 107: 663- 664.
13. Pressman EK, Cavanaugh KL, Mingione M. Effects of maternal antioxidant supplementation on maternal and fetal antioxidant levels: a randomized, double blind study. Am J Obstet Gynecol 2003; 189: 1720- 1725.
14. Raijmakers MT, DeChend R, Poston L. Oxidative stress and preeclampsia: rationale for antioxidant Oxidative stress and preeclampsia clinical trials. Hypertension 2004; 44: 374- 380.
15. Gastrich MD, Faro R, Rosen T. Markers of preeclampsia and the relationship to cardiovascular disease: review of the twenty first century literature. Journal of Maternal, Fetal and Neonatal Medicine 2010; 23(8): 751- 768.
16. Shibata E, Nanri H, Ejima K. Enhancement of mitochondrial oxidative stress and upregulation of antioxidant protein peroxidation III/ SP-22 in the mitochondria of preeclamptic placentae. Placenta 2003; 24: 698- 705.
17. Van Beck E, Peeters LL. Pathogenesis of preeclampsia: a comprehensive model. Obstet Gynecol Surv 1998; 53: 233-239.
18. Gupta S, Agrawal A, Sharma RK. The role of placental oxidative stress and lipid peroxidation in preeclampsia. Obstet Gynecol Surv 2005; 60 (12): 807- 817.
19. Ranta V, Viinikka L, Halmesmaki E. Nitric oxide production with preeclampsia. Obstet Gynecol 1999; 93: 442-445.
20. Sharma JB, Sharma L, Bahadur A, Vimala N, Satyam A, Mittal S. Oxidative stress markers and antioxidant levels in normal pregnancy and preeclampsia. International Journal of Gynecology and Obstetrics 2006; 94: 23-27.
21. Bowen RS, Moodley J, Dutton MF, Theron AJ. Oxidative stress in preeclampsia. Acta Obstet Gynecol Scand 2001; 80(8): 719-725.
22. de la Calle M, Usandizaga R, Sancha M. Homocystine, folic acid and B group vitamins in Obstetrics and Gynecology. Eur J Obstet Gynecol Reprod Biol 2003; 107: 125-134.
23. Iqbal MP, Lindblad BS, Mehboobali N, Yousuf FA, Khan AH,. Iqbal SP. Folic acid and vitamin B6 deficiencies related to hyperhomocysteinemia in apparently healthy Pakistani adults in mass micronutrient supplementation indicated in this population. J Coll Physicians Surg Pak 2009; 19: 308- 312.
24. Nelen WL, Bulten J, Steegers EA, Blom HJ, Hanselaar AG. Maternal homocysteine and chorionic vascularisation in recurrent early pregnancy loss. Hum Reprod 2000; 15: 954- 960.
25. Welch GN, Loscalzo J. Homoysteine and atherothrombosis. N Engl J Med 1998; 338: 1042-1050.
26. Loscalzo J. The oxidative stress of hyperhomocysteinemia. J Clin Invest 1996; 98 : 5-7.
27. Vanderjagt DJ, Patel RJ, EL- Nafty AU, Melah GS, Crossey MJ. High density lipoprotein and homocysteine levels correlate inversely in preeclamptic women in Northern Nigeria. Acta Obstetricia et Gynecologica Scandinavica 2004; 83 (6): 536- 542.
28. Rajkovic A, Mahomed K, Malinow MR, Sorensen TK, Woelk

75Indian Journal of Public Health Research & Development. April - June, 2012, Vol. 3, No. 2
GB, Williams MA. Plasma homocysteine concentrations in eclamptic and preeclamptic African women postpartum. Obstetrics and Gynecology 1999; 94: 355- 360.
29. Riza Madazali, Ali Benian Koray Gumata. Lipid peroxidation and antioxidants in preeclampsia. Eur J Obstet Gynecol and Reprod Biol 1999; 85 (2): 205-208.
30. Wang Yand, Walsh SW. Antioxidant activities and mRNA expression of superoxide dismutase, catalase and glutathione peroxidase in normal and preeclamptic placenta. J Soc Gynecol Investig 1996; 3: 179- 184.
31. Chappel LC, Seed PT, Briley A, Kelly SRN, Frank J, Hunt BJ. A longitudinal study of biochemical variables in women at risk of preeclampsia. Am J Obstet Gynecol 2002; 187 (1): 127- 136.

76 Indian Journal of Public Health Research & Development. April - June, 2012, Vol. 3, No. 2
Knowledge, attitude, practice regarding breast feeding practice among mothers attending Alluri Sita Rama Raju Academy of Medical Sciences, Eluru, Andhra PradeshRadhika Malireddy1, K. Chandra Sekhar2, P.G.Deotale3
1Final Year MBBS Student, 2Associate Professor, 3Professor & HOD, Department of Community Medicine, Alluri Sita Rama Raju Institute of Medical Sciences (ASRAM), Eluru, A.P.
Abstract
BackgroundBreast feeding practice rates vary in different places. Little is known about breast feeding practice and barriers women experience. In addition information is scant on how organisations can best promote breastfeeding. It is estimated that a breastfed baby is 14 times less likely to die from diarrhoea, 4 times less likely to die from respiratory diseases and 2.5 times less likely to die from other infections than a non breast fed infant.
Objectives1) To determine knowledge, attitude, and practice of rural mothers regarding breastfeeding. 2) To find association of knowledge, attitude, and practice of rural mothers regarding breast feeding with demographic variables.
MethodologyThe hospital based descriptive study was undertaken in departments of Paediatrics and Gynaecology, Obstetrics in both the outpatient and inpatient wards in Alluri Sita Rama Raju Academy of Medical Sciences, Eluru, Andhra Pradesh. In this study 214 mothers who had children less than 2 years of age were selected. A structured questionnaire was applied and children above two years of age group were excluded from the study.
ResultsAbout 32.7% of the mothers had the knowledge regarding 6 months of breast feeding is enough. 86.9% of the mothers gave the opinion regarding attitude, breast feeding is a good way to decrease family expences. Out of 214 mothers who were interviewed 27 mothers are illiterates, 39 mothers have primary schooling, 105 mothers have high school education, 23 mothers had secondary education, and 20 mothers are graduates. 78.9% mothers were > 24 yrs of age 20.1% mother were < 24 years of age. Of the 214 mothers interviewed 189 mothers gave colostrums, whereas 25 mothers (11.81%) discarded colostrums. In mothers who delivered by vaginal delivery out of 140 mothers 118(84.2%) initiated breastfeeding within 12 hrs after delivery whereas out of
70 mothers who delivered by caesarean section 49(70%) initiated breast feeding 12 hrs after delivery.
ConclusionsIn the present study conducted on 214 mothers showed that high proportion of population gave exclusive breast feeding. However lot of gap is seen between literate and illiterate mothers in breast feeding practices which need to be changed. The positive changing trends are seen in aspects of colostrum feeding. Hence there is a need for awareness programs regarding breast feeding in this area.
Key WordsKnowledge, Attitude, Practice Regarding Breast Feeding.
IntroductionChildren are our future and most precious resources. After the birth the health of the baby depends upon the nurturing practice adopted by the family. Breast feeding is the first step in life which ensures that infants and young children get a healthy and nutritious state in life. It is one of the few consistent sources of energy dense food. The first milk is most suitable for new born, the sastras call it Peeyusha and Western sciences use the word Colostrums. It is the infant’s first immunization. For most of the children breast feeding makes the difference between life and death and it is the infants Passport to life. Exclusive breast feeding can save many lives by preventing malnutrition and reducing the risk of infections and hypothermia.
Exclusive breastfeeding should be practiced for at least four months and preferably six months in poor countries since they have a high risk of infection through contaminated water and food. In the year 2001-2002 a survey conducted in a rural area of district Dehradun, Uttaranchal suggested that 56.3% mothers reported to have fed colostrums, 74.1% mothers put their children on full breast feeding while only 26.0% with partial feeding.
Breast feeding practice rates vary in different places. Little is known about breast
feeding and barriers of women experience. In addition information is scant on how Organizations can best promote breastfeeding. To improve rates of full

77Indian Journal of Public Health Research & Development. April - June, 2012, Vol. 3, No. 2
breastfeeding, specific information about the beliefs and practices that influence this outcome is needed. The duration of breastfeeding varies with rural or urban residence, literacy, socio-economic status and other factors. Keeping in mind the above viewpoints this study is conducted to assess various socio-economic and cultural factors associated with knowledge, attitude and practices regarding breastfeeding in a rural community of Eluru.
Objectives1. To determine knowledge, attitude, and practice of
rural mothers regarding breast feeding.2. To find association of knowledge, attitude, and
practice of rural mothers regarding breast feeding with demographic variables.
Material & MethodsA hospital based descriptive study was undertaken in departments of Paediatrics and Gynaecology, Obstetrics in both the outpatient and inpatient wards in Alluri Sita Rama Raju Academy of Medical Sciences, Eluru, Andhra Pradesh during the period of 6(six) months.
Inclusion criteria: 214 mothers who had children less than 2 years of age were selected.
Exclusion Criteria: Above two years of children excluded.
A structured questionnaire with 40 items was used. It included
1. Demographic variables (12 items)2. Related to knowledge (13 items)3. Related to attitude (8 items)4. Related to practice (7 items)Pretested questionnaire and validity of the tool was established in consultation with guide, experts from the departments of obstetrics, gynaecology, and paediatrics. The statistical package Microsoft office excel 2003 was used for data processing and statistical analysis. Variables were described using frequency distribution for categorical and mean and standard deviations for continuous variables.
ResultsOut of 214 mothers who were interviewed, of which, 78.9% mothers were > 24 yrs of age 20.1% mother were < 24 years of age. Regarding educational status of mothers, 12.6% of mothers were illiterates, 18.2% mothers have completed primary school, 49.1% mothers have completed high school education, 10.7% of mothers had secondary education, and 19.4% mothers were graduates. 91.6 % mothers were housewife and remaining mothers were working group. About 75.7% of mothers having > 2 children and remaining 24.3% were having > 2 children. Regarding the status of birth, about
65.5% deliveries taken place vaginal route and remaining 34.5% deliveries were caesarian section. About 19.6% of child birth needed Hospital admission.
Out of 214 mothers were interviewed, of which, each mother was given multiple answers regarding knowledge and attitude variables. About 32.7% of the mothers had the knowledge regarding 6 months of breast feeding is enough. 86.9% of the mothers gave the opinion regarding attitude, breast feeding is a good way to decrease family expences.
Table 3 reveals that of the 214 mothers interviewed 189 mothers gave colostrums, whereas 25 mothers (11.81%) discarded colostrums.
Table I: Socio-Demographic characteristics of Study population:
Table 2: Mothers’knowledge and attitude about breast feeding:

78 Indian Journal of Public Health Research & Development. April - June, 2012, Vol. 3, No. 2
The significant association between educational status and colostrum feeding was tested using chi-square test. Using chi-square test, the test result was significant at 1% level of significance. X2 value is 6.86 and the ‘p’ value is <0.01. This showed that there was an association between education qualifications of the mother with feeding of colostrum.
Table 4 depicts that about 32% of the mothers given prelacteal feeds to child and remaining 68% of the mothers not given prelacteal feeds.
Table 5 shows that in the present study, 74.5% started giving breast feed before 12 hours after delivery where as25.5% mothers gave breast feed 12 hours after delivery. In literate mothers, 152 (81.34%) started breast feeding before 12 hrs after delivery, whereas 16(60%) of illiterate mothers started breast feeding before 12 hrs after delivery.
Table 6 reveals that in initiation of breast feeding, mode of delivery also played an important role. In mothers who delivered by vaginal delivery out of 140 mothers 118(84.2%) initiated breastfeeding within 12 hrs after delivery whereas out of 70 mothers who delivered by caesarean section 49(70%) initiated breast feeding 12 hrs after delivery.
Table 7 depicts that of the 214 mothers interviewed 122 mothers (57.2%) gave exclusive breast feeding up to 6 months period and 92 mothers (42.8%) did not give exclusive breast feeding. Out of 92 mothers, 77 mothers were literates and 15 were illiterates.
DiscussionThis cross sectional study was conducted to determine the knowledge, attitude,
Practice regarding breast feeding mothers from rural population and also to find Association of knowledge, attitude, and practice with demographic profiles of rural Population. In this study 100% of mothers responded positively that breast feeding is Convenient, also women had better attitude regarding breast feeding.
This study showed that 11.81% discarded colostrums. The present study is not Coinciding with study of S. P.Srivatsava, Vijay Kumar, and Sharma et al 1 where 82.91% of mothers discarded colostrums. The probable discordance may be due to increased awareness and also due to inclusion of more educated women in the present study because educated women had better practice. In this study 75.5% mothers started breast feeding before
Table 3: About colostrum practice
Table 4: Prelacteal feeds:
Table 5: Initiation of Breast feeding practice versus Literacy:
Table 6: Breast feeding practice versus type of Delivery:
Table 7: Exclusive breast feeding (EBF) versus literacy:

79Indian Journal of Public Health Research & Development. April - June, 2012, Vol. 3, No. 2
12 hours after delivery which accounted for 81.34% of literates and 60% of illiterates. In Tamilnadu a study at Chengalput by BPNI 2 71% of mothers initiated breast feeding at right time, which is similar to the present study. The 10th year plan goal of early initiation of breast feeding is to increase it from 15.8% to 50% by 2007 which is surpassed in this study. The mothers who delivered by caesarean section delayed initiation of breast feeding, where mothers rarely care for their babies in the first 2 days postoperatively3.
The present study showed that practice of exclusive breast feeding is higher in rural and illiterate mothers when compared to literate mothers. Pragti Chhabra Vijay L. Grover et al 4 demonstrated in their study the same proportion which is similar to the present study. In the present study literate mothers introduced complementary feeds earlier than illiterate mothers. In a study by BPNI conducted at Chengalput and Chidambaram districts of Tamilnadu, the starting of complementary feeding at 6 months of age was around 74% and 88.3% respectively, which is similar to the present study. The early start of complimentary feeding by literate mothers is due to impact from media as they get attracted to fancy advertisements about complimentary feeds and also due to poor knowledge regarding expression and storage of breast milk among working women.
Majority of the participants reported that reason for stopping of breast feeding is that milk is not sufficient. Education of women is required in this aspect and also regarding time needed for colostrums to change to transitional milk and education regarding ways of successful breast feeding can be valuable in decreasing concern about milk supply. Women reported that community and health workers encouraged breast feeding.
A limitation of our study was its short period of study, cross sectional design and also active non intervention. For inclusion in this study, the child’s age is limited to a maximum of 2 years. This would have diminished the risk of recall bias. Further cohort studies are needed to explore the effect of socioeconomic development on children health and nutrition.
ConclusionsBased on the results observed in the present study, 214 mothers showed that high proportion of population gave exclusive breast feeding. However lot of gap was seen between literate and illiterate mothers in breast
feeding practices which need to be changed. The positive changing trends are seen in aspects of colostrum feeding, early initiation of feeding. The changing trends are negative in aspects of exclusive breast and duration of breast feeding. Literacy rate plays a major role in this aspect even many mothers feel that they will spoil the health of the baby if they feed with expressed breast milk which needs to be changed. Hence there is a need for initiation of wide IEC programs regarding breast feeding practices.
AcknowledgementsI wish to express my sincere thanks to all study subjects, research funding agency ICMR and completed this study under Student short term fellowship from ICMR and HOD of OBG and HOD of Paediatrics of Alluri Sita Rama Raju Academy of Medical Sciences, Eluru, A.P for helping me to complete the required sample.
References1. S.P. Srivatsa, Vijay Kumar Sharma and Vijay Kumar Breast
Feeding Patterns in Neonates. Indian Pediatrics, Vol. 31, Sep. 1994.
2. BPNI Report 2003 Status of infant and young child feeding in 49 districts (98 blocks) of India.
3. Ten steps to successful breast feeding protection, promotion and supporting breast fee. Special role of health science. A joint WHO / UNICEF statement, Geneva 1989.
4. Pragti Chhabra,Vijay L.Grover, O.P.Agarwal and K.K.Dubey Breast feeding pattern in urban resettlement colony in Delhi Indian Pediatrics, Vol.65,Nov.1998.
5. Rajammal P. Devdas., Vijayalakshmi purushottaman and Mercy Paul. Trends in breast feeding practices The Indian J. Nutr, Dietetics (1996), Vol.36.
6. Chandra R., Vishnu Bhat B. and Puri R.K. Why breast feed? Indian Paediatrics, vol. 30, June 1993.
7. M. Behar Physiological Development of the infant and its implications for complimentary feeding. Ind. Pediatrics, Vol. 24, Oct 1987.
8. WHO contemporary patterns of breast feeding, Report of WHO collaborative study of breast feeding-1981, WHO, Geneva.
9. Lactation current concepts and concerns ICMR Bulletin 25(8) Aug. 1995.
10. Warren I, Choo Tan G., Dicxon P.D. and Ghaus K Breast feeding success and early discharge for preterm infants.. Journal of Neonatal Nursing Vol.6 issue 2, 2000.
11. C.R. Banapurmath, Shobha Banapurmath and Nirmala Kesaree Development of and breast feeding. Indian Pediatrics, Vol. 33, Jan 1996.
12. A Ajay Vatsayan, Anmol K.Gupta and Dneshwar et al ge during Breast feeding and Timely Suckling … Indian J Pediatrics 1996, Vol. 63, No. 791-794.

80 Indian Journal of Public Health Research & Development. April - June, 2012, Vol. 3, No. 2
Comparison of sub mucosal diathermy and partial resection of inferior turbinate in the treatment of symptomatic nasal valve blockageKapil KR Singh1, Shakun Singh2, Hemant KR Singh3
1Asstt. Professor, Department of ENT, Saraswathi Institute of Medical Sciences Hapur Ghaziabad, 2Assistant Professor, Deptt. of Gyn. & Obst., LLRM Medical College, Meerut, 3Assistant Professor/Statistican, Deptt. of Community Medicine, SIMS, Hapur, Ghaziabad
Abstract
ObjectivesTo evaluate the efficacy of sub mucosal diathermy (SMD) and partial resection of inferior turbinate (PRIT) in the treatment of symptomatic enlarged inferior turbinate.
Study Design: Prospective
MethodsSixty patients of age group 18 -56 yrs. with symptomatic enlarged inferior turbinate had given choices for SMD and PRIT. All the patients had history of failed medical treatment.
ResultsEach thirty patients underwent SMD (group I), PRIT (group II), eight patients of group1, have anterior nasal packing after surgery for bleeding. Four patients complained of excessive rhinorrhoea for first 2 weeks while 4 patients of Group 1 complained of nasal blockage for 1 week even after intervention. In group 2, 8 patients have re-anterior nasal packing after pack removal. Both groups followed up for 6 months. 13 patients were lost in follow up, so excluded from the study. Following 6 months of follow up, 8 patient of group I had recurrence with nasal blockage and in gr. II none had recurrence.
ConclusionPRIT is better than SMD in long course; nevertheless it should be reserved for failed SMD, not as a primary option. Ink described the nasal valve in 1903. The nasal valve is formed medially by the septum and laterally by the caudal edge of the upper lateral cartilage and it accounts for approximately 50% of total upper airway resistance. The anterior tip of the inferior turbinate is found in the nasal valve region, and hypertrophy of this structure can cause exponential increase in airway resistance.
IntroductionNasal valve is area of greatest constriction throughout the entire respiratory tract; limited medially by the septum, inferiorly by the floor of the nose and by the anterior
portion of inferior turbinate. Nasal valve is a dynamic valve as swelling of the venous erectile tissue of the inferior turbinate and nasal septum can cause complete obstruction of the nasal passage. Enlargement of the inferior turbinate is mainly due to swelling of the sub mucosa and rarely due to enlargement of the bone itself. Hypertrophy of inferior turbinate caused by dilation of sub mucosal venous sinusoids is the cause in intrinsic rhinitis, and responds to decongestant1. Sometimes the inferior turbinate enlargement due to sub mucosal fibrosis does not respond to decongestant2. In few cases of inferior turbinare hypertrophy, the venous sinusoids become atonic and also do not respond to decongestant3. When inferior turbinate hypertrophy is symptomatic, it needs treatment. There are different modalities of treatment but most popular and effective are SMD and PRIT. This paper aims to compare the efficacy of these methods in the treatment of symptomatic inferior turbinate hypertrophy.
Material and MethodsAll together 60 patients (36 women and 24 men) with symptomatic inferior turbinare hypertrophy were included for the study. The patients were of age group 18-56 and they had history of failed medical treatment. After counseling all the patients and discussing all the pros and cons of both surgical interventions, patients were given choices to select their surgical procedure themselves. 30 patients (24 women and 6 men) underwent SMD (sub mucosal diathermy) under sedation and given a tag Group 1, and 30 patients (12 women and18 men) underwent PRIT under general anesthesia and were given tag of Group 2. After surgical intervention in Group 1, nasal cavity were filled with antibiotic ointment and patients were discharged on the same day, whereas Group 2 patients were discharged after anterior nasal packing removal on the 3rd post operative day. In both group broad spectrum antibiotic and NSAID were given.
ResultsGroup 1
− Out of 30 patients of Group 1 (SMD) 8 patients needed anterior nasal packing after surgical intervention and discharged then after.
− 4 patients complained of excessive rhinorrhoea for the first 2 weeks.

81Indian Journal of Public Health Research & Development. April - June, 2012, Vol. 3, No. 2
− 4 patients complained of nasal blockage just after the surgical intervention.
Group 2
− Out of 30 patients 8 had to have reanterior nasal packing after pack removal after 48 hours of operation, for the bleeding and their discharge was delayed.
− 3 patients complained of nasal dryness and excessive crusting for 2 months.
− Both the groups of patients were followed up regularly- weekly for the first 2 weeks, 2 weekly for one month, and then every month till 6 months.
− At the end of 6 months we lost 13 patients (7 of Gr1 and 6 of Gr2) and one patients of Group 2 died in road accident. At the completion of 6 months 8 patients of Group 1 had recurrence of nasal blockage and in Group 2 none had recurrence.
DiscussionSymptoms of nasal obstruction may persist despite maximal medical management. In many patients who continue to complain of nasal obstruction, inferior turbinate hypertrophy can be confirmed by physical exam and rhinometry, though the latter is infrequently performed in clinical settings. It has been shown that inferior turbinate enlargement can prevent adequate medical management by preventing the transmission of topical steroids and topical antihistamines to the superior nasal cavity (4). So surgical procedures that reduce the size of the inferior turbinate can not only improve symptoms, but can also potentiate medical management of rhinitis. Numerous procedures exist for this purpose, and controversy abounds as to which is the best. There are very few randomized studies comparing different procedures to each other, and those that exist are generally not long-term studies. Procedures can be classified as those that address bony causes of nasal obstruction, and those that address mucous and sub mucous swelling. Patients with symptomatic nasal obstruction due to sorts of medical treatment, some sort of surgical intervention is recommended. The classically performed procedure for inferior turbinate hypertrophy was total turbinate resection. This procedure involves clamping the inferior turbinate at its base to achieve haemostasis, followed by the use of nasal scissors or endoscopic instruments to resect the entire turbinate along its base. This procedure definitively widens the nasal airway and has been shown to be one of the most effective procedures in achieving long-term nasal patency, with a retrospective study by Ophir et al showing that 80% of 150 patients had subjectively improved nasal breathing and 91% had widely patent nasal airways at an average follow-up time of 2.5 years (range 1 to 7). The most common complication of total inferior turbinectomy appears to be haemorrhage. The procedure often requires nasal packing after completion. Also, nasal crusting, synechiae,
and discomfort are frequent occurrences for several months afterward because of exposed bone at the lateral nasal wall. A 1985 retrospective study by Moore et al condemned total inferior turbinectomy, reporting that 66 percent of their 18 patients had ozena, or advanced atrophic rhinitis characterized by chronic crusting and dysosmia even leading to anosmia due to destruction of olfactory cells. Others, such as Ophir, have refuted this notion and report that atrophic rhinitis is a rare and even insignificant complication of total turbinectomy. However, many otolaryngologists today have abandoned this procedure. Partial turbinectomy is a procedure developed to remove the anterior part of the inferior turbinate. It is directed at relieving obstruction at the nasal valve, while leaving a portion of the turbinate to continue its function of air conditioning. Nasal patency rates show great subjective improvement immediately after surgery, with one retrospective study suggesting that 70 of 76 patients reporting improvement at about 8 years (6). However, other studies have suggested decreased effectiveness with time (7), similar to nonresection procedures. Complications are similar to those for total turbinectomy, though the crusting is usually less severe, as is the risk of haemorrhage. Atrophic Rhinitis with this procedure is rare. Electrocautery has been used successfully in the ablation of inferior turbinates. Two forms of the procedure exist - submucosal diathermy, and mucosal cautery. Both procedures can be performed in the office under local anaesthesia. Mucosal cautery, as the name implies, utilizes the electrocautery device to burn from posterior to anterior along the inferior turbinate. This causes more pain and greater risk of haemorrhage. It also damages mucosa with subsequent increase in mucosal transport time. Submucosal diathermy avoids those risks. It involves inserting a bipolar cautery to cause a submucosal lesion along the inferior border of the inferior turbinate. The device frequently has two sharp points that are used to pierce the inferior portion of the inferior turbinate SMD- is an effective method of treatment for symptomatic inferior turbinate hypertrophy (Wenself, gleasa and siodlan, 1986). It reduces nasal blockage by 65 %(Jones et al 1989), but in our study it is 60%. Many rhinologist advocate SMD in cases where inferior turbinate shrinks with an alphareceptor agonist (Jones et al 1989).But nevertheless SMD in our study 4 complained of excessive rhinorrhoea for the first 2 weeks, then goes off automatically. Another 4 patients from the very beginning complained nasal blockage, initially it may due to post operative oedema, but as symptom lingers on for more then 2 months it indicate its negative aspects. In 6 months follow up we have 8 cases of failure, the cause may be fibrosis in the submucosal plain. Other popular method of surgical intervention is resection of inferior turbinate- partial resection or radical resection. PRIT is preferred one as radical trimming can cause unwanted results as atrophic rhinitis (Martinez et al 1983). In our study 3 patients complained of excessive

82 Indian Journal of Public Health Research & Development. April - June, 2012, Vol. 3, No. 2
crusting for first 2 months, then we treated with nasal douching, which eventually disappeared. Up to 6 months we didn’t noticed any cases of atrophic rhinitis and we had no recurrence of nasal blockage in Group 2 (PRIT). It shows that anterior trimming is equally effective in reducing nasal blockage as radical operation(Weight, Jones , Clegg 1988) with less side effective. As PRIT has no recurrence of nasal blockage, and had nasal crusting in 3 patients (15%) in the initial period in our study; PRIT is a safe and effective procedure with minimal side effect (weight, Jones and Buckingham, 1990).
ConclusionSMD should establish as a procedure in all patients with inferior turbinate hypertrophy unresponsive to medical treatment. If inferior turbinate hypertrophy recurs following SMD, partial resection of inferior turbinate (PRIT) should be carried out.
References1. Anggard, A. and Edwall, L. (1974): The effect of sympathetic
nerve stimulation on tracer disappearance rate and local
blood content in the nasal mucosa. Acta Otolaryngologica, 77,131- 139.
2. Aschan, G and Drettner, B.(1964): An objective investigation of the decongestive effective of xylometazoline. Eye, Ear, Nose, Throat Monthly, 43, 66-74.
3. Cauna, N. and Cauna, D.(1975): The fine structure and intervention of vthe cushion veins of the human nasal respiratory mucosa. Anatomy research.181, 1-16.
4. Jones, A.S., Lancer, J.(1987): Does submucosal diathermy to the inferior turbinates reduces nasal resistance to airflow in the long term? Journal of Laryngology and Otology, 101,448-451
5. Jones, A., Wight,R.G, Kabil, Y. and Beckingham. E.(1989): Predicting theoutcome of submucosal diatheermy to the inferior turbinates. Clinical Otolaryngology,14, 41-44.
6. Martinez, S. A., Nissan, A. J., Stock, C.R. and Tesmer. T.(1983): Nasal turbinate resection for relief of nasal obstruction.Laryngoscope,93, 871-875
7. Ophir, D., Shapira, A. and Marshak, G.(1985): Total inferior turbinectomy for nasal airway obstruction. Archives of Otolaryngology, 111, 93-95.
8. Wight. R. G., Jones, A. S. and Beckingham, E.(1990): Trimming of the inferior turbinates a prospective study long-term study. Clinical otolaryngology, 15, 347-350
9. Wight. R. G., Jones, A. S. and Clegg, R.T.(1988): A comparison of anterior and radical trimming of the inferior nasal turbinate and the effects on nasal resistance to airflow.Clinical Otolaryngology,13, 223-226

83Indian Journal of Public Health Research & Development. April - June, 2012, Vol. 3, No. 2
Patients’ perception towards professionalism in dentistry at K.L.E.S’s Institute of Dental Sciences, Belgaum, IndiaG.N. Karibasappa1, L. Nagesh2
1Reader, 2Professor and Head, Department of Preventive and Community Dentistry, Bapuji Dental College and Hospital, Davangere, Karnataka, India
Abstract
BackgroundDentist - Patient relationship is the heart of successful dentistry. Physical appearance, behavior and communication skills of professionals might influence doctor-patient relationship.
AimThe purpose of the present study was to determine how patients perceived about professionalism in dentistry.
Study DesignCross-sectional survey.
MethodsThe study was conducted on 305 subjects who visited the Department of Preventive and Community Dentistry, K.L.E.S’s Institute of Dental Sciences, Belgaum, Karnataka, India. It was conducted using a self-designed standard close ended questionnaire which included provision for recording demographic characteristics and questions pertaining to the appearance and professionalism of the dentists. The data was collected, tabulated and subjected to statistical analysis using chi – square test. Results: Attire and physical appearance of the dentists had an influence on the patients’ comfort and anxiety levels, and majority of patients agreed that the first impression of dentists affected their confidence level. Hairstyle, skin complexion and facial hair (for male dentists) appeared to have little effect on patients’ opinion of the various dental care providers.
ConclusionGood human relationship between dentists and patients is essential for imparting positive attitude towards dentist and dentistry.
Key WordsProfessionalism, dentistry, attire, behavior
IntroductionThe term “relationship” means nothing more than indicating the relative position of two objects in time and space or in a classification system. What is life? When J. Krishna Murthy, a philosopher was asked by a person, he replied “Life is full of relationships”. From birth till death we all live a life of relationships. We establish, sustain, break, renew, rejuvenate and retreat our relationships with the world. Establishing and sustaining good and healthy relationship helps for better interaction. Human relationship implies that the participants have some understanding of each other’s behavior and act in ways that take this into account. Participants have expectations about each other, which influence the particular form of actions that will be taken.
Relationship between a doctor and his or her patient is one that is oriented toward the doctor helping the patient to deal effectively with a health problem. Patients cooperate with doctors and doctors attempt to return patients to as normal level of functioning as possible. Doctors usually take some type of action to satisfy the patients’ expectations. Doctors should be attentive not only to patients’ complaints but also to other factors that brought them to the doctor.
Profession refers to having special knowledge or skill in a particular field. Bernard Shaw rightly said, “Skill is not enough, trust is essential”1. The layman might imagine that the primary concern of professionals would be professional competence. However, physical appearance, behavior and communication skills of professionals might influence doctor-patient relationship, especially for those patients who have never met the dentist previously.
Patients’ attitude towards the dental care becomes important because patients’ satisfaction with their dentists is a primary determinant to seek dental care, people who are dissatisfied tend to avoid care and jeopardize their dental health2. Dentist - Patient relationship is the heart of successful dentistry. So, what does the public think of dentistry and what do dental patients think of dentists is vital for complete understanding of the image of dentistry3. Sparse data are available to answer these questions, so the current study is carried out to assess the patients’ attitudes towards dentists and the dental profession.

84 Indian Journal of Public Health Research & Development. April - June, 2012, Vol. 3, No. 2
Material and MethodsThe study was conducted using a self-designed standard close ended questionnaire format to collect required and relevant information. To aid in the development of our questionnaire, previous surveys were reviewed and also observations done by us on various dentists were considered. Thus, the questions that addressed our concerns were selected. A copy of the questionnaire has been enclosed. Ethical clearance was obtained from the Local Ethical Committee and written informed consent was obtained from the participating subjects. The study was conducted at the Department of Preventive and Community Dentistry, K.L.E.S’s Institute of Dental Sciences, Belgaum, Karnataka, India.
Questionnaires were offered to all patients who visited the department to seek treatment for the first time in our department. Reason for including only the first time visitors was to avoid having too many patients with a long time relationship with their dentist, which could lead to better or worse patient satisfaction thus avoiding any possible bias in our results. Informed consent was obtained from all patients prior to enrolment. Questionnaires were prepared in three different local languages i.e., Kannada, Marathi and English, to enable the patient understand the questions appropriately and easily. Before patients filled their questionnaire format, the purpose of the study was explained to all of them. Each patient was given sufficient time to complete the questionnaire. Those who were unable to understand the questions properly were explained by the interviewer himself.
Questions were adapted to elicit demographic characteristics, education level, occupation, socioeconomic status (revised Kuppuswamy scale4 for socioeconomic status was slightly modified as
per our convenience in our study) of the patients and also pertaining to the appearance, time management and professionalism of the dentist. The questionnaire contained eighteen statements and used 3 point likert scale to assess dentists professionalism (1-Agree, 2-Disagree, 3-Neutral). Patients were asked to classify the dentist based on their physical characteristics and behavior. Patients were also requested to provide their perception of the overall treatment procedure including comfort, anxiety, and confidence in the dental care provider and regarding their first impression on dentist.
The data was collected, tabulated and subjected to statistical analysis. As the data obtained in the present survey was- non parametric (nominal) data which is represented in frequencies, chi – square test was applied. The level of significance (α) was fixed at 5% (p = 0.05). SPSS version 12 was used for the present analysis.
ResultsThe study was conducted to know the patients’ perceptions of professionalism in dentistry in 305 patients (males 151 and females 154). The data obtained from the study was subjected to statistical analysis and the following results were obtained. Table 1 shows that majority of study subjects belonged to 20-29 years age group (33.8%). Males (49.5%) and females (50.5%) were almost equally distributed. Table 2 shows that majority of study subjects (34.8%) belonged to university level of education. Table 3 denotes that lower socioeconomic status comprised greater part of the study group (55.1%).
Data related to physical appearance of dentists shows that majority of study subjects agreed that skin complexion, hairstyle, attire and overall appearance of dentist affected their confidence level on them (Table 4), yet not statistically significant. Dentist’s built, facial hair of the male dentist and facial expression were found to
Table 1: Distribution of Study Subjects Based on Age and Gender
Age Males Females TotalN (%)
10 – 19 11 29 40 (13.1)
20 – 29 47 56 103 (33.8)
30 – 39 30 24 54 (17.7)
40 – 49 27 21 48 (15.7)
>50 36 24 60 (19.7)
Total n (%) 151 (49.5) 154 (50.5) 305 (100)
Table 2: Distribution of Study Subjects Based on Different Level of Education
Level of Education Number of Subjectsn (%)
Illiterate 70 (22.9)
Elementary 59 (19.4)
High school 70 (22.9)
University 106 (34.8)
Table 3: Distribution of Study Subjects Based on Socioeconomic Status
Socioeconomic Status Number of Subjectsn (%)
Upper 8 (2.6)
Middle 129 (42.3)
Lower 168 (55.1)
Table 4: Response Given by Participants to Various Questions Related to the Physical Appearance of the Dentists
QuestionsResponse
p valueAgreen (%)
Disagree n (%)
Neutraln (%)
Skin Complexion 130 (42.6) 128 (42) 47 (15.4) 0.12
Hairstyle 155 (50.8) 102 (33.5) 48 (15.7) 0.18
Dentist’s Dress 229 (75.1) 63 (20.6) 13 (4.3) 0.13
Dentist’s overall appearance
254 (83.2) 21 (6.9) 30 (9.9) 0.1

85Indian Journal of Public Health Research & Development. April - June, 2012, Vol. 3, No. 2
influence their opinion about dentists. Distribution was done based on socioeconomic status and the results were statistically significant. (Table 5)
Opinion about time management, dentist’s working unit, treatment procedure, appraisal of expenditure of treatment, dentist’s voice, first impression of the dentist (Table 6) revealed that majority of the study subjects agreed that these variables were of major concern for them but the results were not statistically significant. Dentists’ politeness, attentiveness, behavior and communicative skill (Table 7) were found to profoundly influence the patients and when these variables were stratified according to socio economic status they were statistically significant.
DiscussionProfessionalism is the basis of medicine’s contract with society. It entails placing the interest of patients above those of the health care workers, while setting and maintaining clear standard of behavior that emphasize compassion, competence and integrity. For maintenance of professionalism in our health care environment, we must look out for some very specific outcomes. These outcomes will ensure professional behavior as a norm in our health care environment. Effective practice of dentistry requires not only technical competence but also behavioral knowledge and skills to achieve one’s full professional potential.
This study was conducted to explore patient’s perceptions of professional attire and behavior of dental care providers as indicators of the professional integrity and competence. Professional integrity is the ability of the health care provider to be worthy of trust, have concern for others, and have a substantial commitment to the patient. Professional competence is the health care provider’s ability to provide adequate dental care.
A total of 305 patients (151 males and 154 females) were surveyed and the results are tabulated and compiled. Total valid comparisons could not be done between the present study and other studies reported in the literature due to wide variations observed with respect to selected age groups and methodologies employed. However, an attempt is done to compare and discuss to the extent possible and permissible.
Majority of the patients in our study agreed that dentist’s built (p<0.001), skin complexion (p=0.12), facial hair of male dentist (p<0.001), hair style (p=0.18) affected their confidence in them. (Table 4 and 5) The general patient preference toward traditional/ formal physician dress observed by Kanzler and Gorsulowsky5, and Gjerdingen et al6 was confirmed by our data. More than 75% of the patients agreed that formal attire was appropriate for dental care providers and should be required to wear clean trousers and shirt with polished shoes and white apron. Despite a recent movement towards more relaxed, casual attire in the general public and within the office
Table 5: Response Given by Participants to Various Questions Related to the Physical Appearance of the Dentists.
Questions Response Upper classn (%)
Middle classn (%)
Lower classn (%)
Totaln (%)
p value
Built
Agree 3 (37.5) 90 (69.8) 112 (66.6) 205 (67.2)
<0.001Disagree 0 26 (20.1) 27 (16.1) 53 (17.4)
Neutral 5 (62.5) 13 (10.1) 29 (17.3) 47 (15.4)
Facial Hair of male dentist
Agree 6 (75) 76 (58.9) 74 (44.1) 156 (51.5)
<0.001Disagree 2 (25) 47 (36.5) 73 (43.4) 122 (40)
Neutral 0 6 (4.6) 21 (12.5) 27 (8.5)
Dentist’s facial expression
Agree 8 (100) 113 (87.5) 127 (75.6) 248 (81.3)
0.04Disagree 0 3 (2.4) 13 (7.7) 16 (5.2)
Neutral 0 13 (10.1) 28 (16.7) 41 (13.5)
Table 6: Response Given by Participants to Various Questions Related to Professionalism of Dentists
QuestionsResponse
p valueAgreen (%)
Disagreen (%)
Neutraln (%)
Time management 257 (84.2) 24 (7.9) 24 (7.9) 0.07
Dentist’s language 261 (85.6) 23 (7.5) 21 (6.9) 0.47
Dentist’s working unit 224 (73.4) 23 (7.6) 58 (19) 0.11
Treatment procedure 262 (85.9) 18 (5.9) 25 (8.2) 0.3
Appraisal of expenditure of treatment 212 (69.5) 43 (14.1) 50 (16.4) 0.15
Dentist’s voice 203 (66.6) 58 (19) 44 (14.4) 0.87
First impression of the dentist 262 (85.9) 18 (5.9) 25 (8.2) 0.3

86 Indian Journal of Public Health Research & Development. April - June, 2012, Vol. 3, No. 2
setting, it appears that patients continue to expect a formally dressed dental health care provider.
The patients’ responses were largely in the segment of “AGREE” by more than 80%, when questions related to facial expression (p=0.04), time management (p=0.07), treatment procedure (p=0.3), politeness (p=0.005) and attentiveness (p=0.03) were asked (Table 5, 6 and 7 respectively). This reflects positive attitude and professional competence exhibited by the dental care providers in the department clinic while rendering health services.
In the present study majority agreed that, dentist’s voice, behavior, working unit was satisfactory while providing the dental treatment. The first impression created in the mind of the patient about the physician can have strong influence in the future relationship and can positively or negatively reflect the rapport. Majority of patients agreed that their first impression of dentist affected their confidence level.
Successful doctor is one who knows how well to communicate with his/her patient. The doctor who is able to communicate with his/her patient is bound to give maximum psychological satisfaction to their patients. In the current study it was found that majority of patients were neutral with respect to the question asked related to the dentist’s communicative skill (p=0.001) (Table 7). It is a pointer towards improvement in communication skills. Positive patient attitudes can lead to an increase in exchange of information between the patient and the dental health care provider, in turn leading to more efficient and improved delivery of dental care.
Our findings indicate that patients are satisfied with the dental care they received, value their dentist’s competence and caring attributes. In brief, patients are pleased with their dentist. Dr. Michael Perich said, “Dentistry is a one-to-one situation. Each individual dentist, properly treating
his or her patient, enhances dentistry’s image”7. Dentists can improve the image of dentistry by providing skillful dentistry, communicating articulately and clearly with patients, and showing patients that they are cared for. It is also important that the profession frequently monitors patients’ attitudes towards dentistry and dentists3.
Practicing dentists who are aware of potential consumers concern can use this knowledge to improve their skills in treating patients and acquire an increased sense of control in their attempts to improve their practices.
Conclusions1. Majority of the study subjects opined that dental care
providers’ professional appearance and behavior influenced their confidence.
2. Patients preferred more formal dress attire from the dental care providers.
3. Attire greatly affected both the comfort and anxiety levels of the patients.
4. Hairstyle, skin complexion and facial hair (male dentist) appeared to have little effect on patient’s opinion of the various dental care providers.
5. Majority of the study subjects opined that dental care providers’ voice affected their anxiety level.
6. 50% of the study subjects were neutral in their opinion regarding dentist’s communicative skills.
Probing questions which can provide further information related to the influence of independent variables selected in the study on patients’ satisfaction are required to have better understanding of patients’ perception towards dentist and dentistry.
AcknowledgementsWe would like to thank all the subjects who participated in the study.
Table 7: Response Given by Participants to Various Questions Related to Professionalism of Dentists.
Questions Response Upper classn (%)
Middle classn (%)
Lower classn (%)
Totaln (%)
p value
Dentist’s politeness
Agree 5 (62.5) 120 (93) 140 (82.8) 265 (86.9)
0.005Disagree 0 2 (1.6) 10 (5.9) 12 (3.9)
Neutral 3 (37.5) 7 (5.4) 18 (11.3) 28 (9.2)
Dentist’s attentiveness
Agree 7 (87.5) 120 (93) 136 (80.9) 262 (86.3)
0.03Disagree 0 5 (3.9) 17 (10.2) 22 (7.2)
Neutral 1 (12.5) 4 (3.1) 15 (8.9) 20 (6.5)
Dentist’s behavior
Agree 7 (87.5) 120 (93) 130 (77.4) 257 (84.3)
0.008Disagree 0 3 (2.3) 10 (5.9) 13 (4.2)
Neutral 1 (12.5) 6 (4.7) 28 (16.7) 35 (11.5)
Dentist’s communicative skill
Agree 1 (12.5) 39 (30.2) 80 (47.6) 120 (39.4)
0.001Disagree 0 10 (7.8) 20 (12) 30 (9.8)
Neutral 7 (87.5) 80 (62) 68 (40.4) 155 (50.8)

87Indian Journal of Public Health Research & Development. April - June, 2012, Vol. 3, No. 2
References1. Manson JD. Some Problems of Professionalism Today. Br Den J
1994; 23: 290-294.2. Dumatteo R, Mcbride CA, Shugals DA, O’Neil H. Public attitudes
towards dentists: A US Household survey. J Am Dent Assoc 1995; 126: 1563-1570.
3. Gerbert B, Bleecker T, Saub E. Dentist and the patients who love them: Professional and Patient view of dentistry. J Am Dent Assoc 1994; 125: 265-272.
4. Mishra D and Singh HP. Kuppuswamy’s socioeconomic status scale - a revision. Ind J Pediatrics 2003; 70: 273- 4.
5. Kanzler MH, Gorsulowsky DC. “Patients attitudes regarding physical characteristics of medical care providers in dermatologic practices”. Arch Dermatol 2002; 138: 463-466.
6. Gjerdingen DK, Simpson DE, Titus SL. Patients and physicians attitudes regarding the physician’s professional appearance. Arch Intern Med 1984; 147: 1209-1212.
7. Berry JH, McCann D. Dentistry’s Public Image: Does it need a boost? J Am Dent Assoc 1989; 118(6): 687-692.

88 Indian Journal of Public Health Research & Development. April - June, 2012, Vol. 3, No. 2
Telavancin: A promising weapon against antimicrobial resistanceNeirita Hazarika1, Kingshuk Lahon2
1Assistant Professor, Department of Dermatology, Tagore Medical College, Chennai, 2Associate Professor, Department of Pharmacology, Mahatma Gandhi Medical College & Research Institute, Pondicherry
AbstractAntimicrobial resistance threatens the clinical effectiveness of many current antimicrobials, while jeopardizing important advances being made against major infections. This has led the World Health Organisation (WHO) to adopt Antimicrobial resistance as its theme for World Health Day 2011. While rational prescribing practices will help decrease the problem of resistance, we must have reserve drugs in our hands to fight this ever-increasing menace.
Over the past few years, there has been an intensified focus on the emergence of methicillin-resistant Staphlococcus aureus (MRSA), including both community-acquired and hospital-acquired strains, against which vancomycin became the drug of choice. Increased frequency of staphylococcal and enterococcal resistance to vancomycin has prompted a search for newer anti-MRSA agents.
Telavancin, a semi-synthetic derivative of vancomycin, was approved in September 2009 by the FDA for the treatment of complicated skin and skin structure infections, (cSSSI), caused by susceptible gram-positive bacteria, especially methicillin-resistant S. aureus (MRSA). It is also being proposed for treatment of nosocomial pneumonia, with focus on MRSA infections.
Major advantage of telavancin over vancomycin is its therapeutic potential against vancomycin-resistant organisms, including vancomycin-resistant enterococci and vancomycin-resistant S. aureus (VRSA). Telavancin inhibits bacterial cell wall synthesis and is ten times more active than vancomycin in this respect. However, unlike vancomycin, which has a slow, primarily bacteriostatic action telavancin demonstrates rapidly bactericidal properties. It also disrupts bacterial cell membrane potential and increases permeability and outflow of essential ions. It shows considerable penetration into skin blister fluid, thus accounting for its use in cSSSIs. With predictable and linear pharmacokinetic profile and low level of resistance against it, telavancin is a welcome addition to the clinicians’ armoury in the fight against antimicrobial resistance.
Key WordsAntimicrobial resistance, MRSA, Telavancin, Complicated skin and skin structure infections.
IntroductionThe widespread danger of antimicrobial resistance threatens the continued effectiveness of many current medicines to treat the sick, while jeopardizing important advances being made against major infectious killers. This has led the World Health Organisation (WHO) to adopt Antimicrobial resistance as its theme for World Health Day 2011. While rational prescribing practices will help decrease the problem of resistance, we must have reserve drugs in our hands to fight this ever-increasing menace.
Over the past few years, there has been an intensified focus on the emergence of methicillin-resistant Staphlococcus aureus (MRSA), including both community-acquired and hospital-acquired strains. Staph aureus is associated with non-invasive skin and soft tissue infections to invasive infections of the bone, cardiovascular system, blood and lungs. Shortly after the introduction of penicillin, resistant strains of S. aureus were isolated. This led to the development of methicillin to treat the resistant strains; however, MRSA was quickly noted and glycopeptide antibiotic vancomycin emerged as the drug of choice for MRSA infections1. Increased frequency of staphylococcal and enterococcal resistance to vancomycin has prompted a search for newer anti-MRSA agents like linezolid, daptomycin and quinupristin/dalfopristin to treat some types of MRSA infections2,3. Telavancin, a newer agent, demonstrates discernible advantages over some of the existing anti-MRSA drugs.
Telavancin, a semi-synthetic derivative of vancomycin, was approved in September 2009 by the FDA for the treatment of complicated skin and skin structure infections, (cSSSI), caused by susceptible gram-positive bacteria, especially methicillin-resistant S. aureus (MRSA)4.
Antimicrobial SpectrumThe spectrum of activity of telavancin is similar to that of vancomycin, with activity against staphylococci, streptococci, and enterococci. However, its major advantage over vancomycin is its therapeutic potential against vancomycin-resistant organisms, including vancomycin-resistant enterococci and vancomycin-resistant S. aureus (VRSA). Combination therapy, particularly with gentamicin, may improve bacterial killing against certain strains3.

89Indian Journal of Public Health Research & Development. April - June, 2012, Vol. 3, No. 2
Telavancin shows concentration-dependent activity in vitro against gram-positive organisms including multi-drug resistant isolates such as MRSA. It is also active against vancomycin-susceptible Enterococcus species in vitro. Strains of enterococci, primarily Enterococcus faecium, which contains the Van A gene, are vancomycin resistant and telavancin is similarly ineffective in vitro against such species. Telavancin may be active against vancomycin-intermediate Staphylococcus aureus (VISA). For vancomycin-resistant Staphylococcus aureus (VRSA), higher minimum inhibitory concentrations (MICs) of telavancin are needed5.
As with vancomycin, telavancin is also effective against gram-positive anaerobic bacteria, including Clostridium, Corynebacterium, Lactobacillus, Propionibacterium and Peptostreptococcus species4.
Structure and ClassificationTelavancin is a lipoglycopeptide antibiotic, structurally derived from the glycopeptide vancomycin which has enhanced potency against gram positive organisms, especially those developing resistance to vancomycin.
Vancomycin and other glycopeptide antibiotics inhibit cell wall synthesis in susceptible bacteria by forming a carboxylate binding pocket that imparts strong affinity for peptidoglycan precursors containing the D-alanyl-D-alanine (D-Ala-D-Ala) motif6. Telavancin is distinguished from these glycopeptide antibiotics by N-linked long chain acyl-D-glucosamine decorations7.
With telavancin, increased potency results from ability to anchor onto the binding sites on the growing cell wall primarily due to the presence of lipophilic side chains. These hydrophobic side chains place this newer glycopeptide into a separate subset of antibiotics, namely, the lipoglycopeptides.
The lipoglycopeptide molecules dimerize and thus stabilize binding to the peptidoglycan cell wall. The telavancin dimers can then anchor themselves to the bacterial membrane by their hydrophobic substituents, increasing binding affinity to the D-ala-D-ala site and increasing potency.
On binding to the target, a favorable interaction occurs between neighbouring drug molecules which also stabilizes binding to the peptidoglycan structure4.
Mechanism of ActionTelavancin binds to C terminal D-Ala-D-Ala residues and inhibits cell wall synthesis. However, unlike vancomycin, which has a slow, primarily bacteriostatic action telavancin demonstrates rapidly bactericidal properties. Due to its strong binding to bacterial cell membranes, telavancin is ten times more active than vancomycin at inhibiting both the transglycosylation and the synthesis
of peptidoglycan4 by interfering with polymerization and cross-linking of the peptidoglycan framework.
Telavancin also disrupts bacterial cell membrane potential and permeability, leading to leakage of cellular ATP and potassium ions6,8.
This dual mechanism of action may confer advantages over traditional glycopeptides due to both increased potency and rapid bactericidal activity6.
PharmacokineticsTelavancin displays linear and predictable pharmacokinetic properties. It has a pharmacokinetic profile similar to that of vancomycin, but with high protein binding of about 93%.Telavancin has a half-life of 7.5 hours, which allows for convenient once-daily dosing. Telavancin also has a small volume of distribution (0.12 L/kg) and a high level of renal excretion (72%). Dose reductions for patients with moderate to severe renal dysfunction are required.
Penetration into skin blister fluid is important for its use in complicated skin and skin structure infections. Telavancin demonstrated considerable penetration into skin blister fluid, with penetration ratios of 0.79 and 0.82, respectively after 3 and 4 days of treatment. Telavancin also showed good penetration into the epithelial lining fluid of a healthy subject with a fluid: plasma concentration ratio of 0.754.
Pharmacodynamic ProfileWhen compared with other antimicrobials, for the treatment of methicillin-susceptible S. aureus (MSSA), telavancin was sixteen times more potent than vancomycin and forty times more potent than oxacillin. Against MRSA, telavancin was four and thirty times more potent than vancomycin and linezolid, respectively.
Postantibiotic effect (PAE) is the delayed growth of bacteria after removal of an antibiotic so that its concentration is below the MIC. In one study, there was a significant PAE for telavancin against S. aureus (including MSSA, MRSA and VISA) in vitro with a duration of 4–6 hours. Vancomycin has a PAE of only one hour.
Coagulase-negative staphylococci are often the cause of infections related to indwelling medical devices. These infections which may affect the skin and skin structures are commonly associated with a biofilm adherent to the device. They are difficult to treat because of either a low growth rate or a lack of antibiotic penetration into the biofilm. In a study, telavancin was compared with vancomycin, teicoplanin, linezolid, and moxifloxacin for the treatment of MSSA, MRSA, and glycopeptide intermediate S. aureus biofilms. Telavancin outperformed the glycopeptides and linezolid against all strains, but moxifloxacin proved to be superior to telavancin4.

90 Indian Journal of Public Health Research & Development. April - June, 2012, Vol. 3, No. 2
IN VIVO Animal StudiesAnimal models suggest that telavancin may be effective in the treatment of soft-tissue infections, bacteremia, endocarditis, meningitis, and pneumonia caused by gram-positive pathogens9.
Clinical TrialsPhase II trials
The FAST and FAST 2 studies were randomized, double-blind, active-controlled multicentre phase II trials conducted to evaluate the treatment of cSSSIs.
The study aim of FAST was to determine the efficacy of IV telavancin at a dose of 7.5 mg/kg/day as treatment for cSSSIs caused by gram-positive organisms compared with vancomycin 1 gm every 12 hours or anti-staphylococcal penicillins (nafcillin 2 gm every six hours, oxacillin 2 gm every six hours, or cloxacillin 0.5-1 gm every six hours).
FAST 2 was an identical study with a dose of telavancin 10mg/kg/day.
The results in both studies were similar and demonstrated comparable cure rates to the other agents, and no statistical difference was found.
A big limitation of the FAST studies was that in treating S. aureus (MSSA and MRSA) infections, the administered standard initial dose of vancomycin 1 gm 12 hourly IV does not achieve goal trough levels for most patients with normal renal function2.
Phase III trials
1. Two pivotal, Phase III clinical trials (ATLAS I and II) were conducted to evaluate the efficacy and safety of telavancin in the treatment of cSSSI. The study aims were:
• Toevaluateiftelavancinisnon-inferiortovancomycinfor the treatment of cSSSI, including those infected with MRSA.
• Ifnon-inferiorityisestablishedinbothphaseIIIclinicaltrials, a secondary goal was to test for superiority of telavancin to vancomycin in patients infected with MRSA for the treatment of cSSSI in pooled analyses.
These two phase III trials were identical parallel, active-control, randomized, double-blind multicentre trials. Patients were randomized to treatment with telavancin (10mg/kg IV every 24 hours) or vancomycin (1 gram IV every 12 hours) for 7-14 days9.
In ATLAS I (n=1867), overall cure rates were 88% for the telavancin group and 87% for the vancomycin group. Again, cure rates for complicated SSSIs caused by MRSA were higher with telavancin than with vancomycin (90% and 85%, respectively).
ALTAS II was a retrospective sub-study of telavancin versus vancomycin for treatment of cSSSI associated with surgical procedures. The subset (n=194) of the original
patients of ATLAS I was evaluated for clinical efficacy and microbiological efficacy on follow up (7-14 days at completion of therapy).
The results of both ATLAS I and ALTAS II did not demonstrate statistical difference between the groups.
The authors concluded that telavancin was non-inferior to vancomycin for the treatment of cSSSI, associated with a surgical site. The results of these trials proved that telavancin was at least equivalent to vancomycin for the treatment of cSSSIs, including those caused by MRSA; these results were the basis for telavancin receiving FDA approval9,10,11.
2. Two phase III trials (ATTAIN1 and ATTAIN 2) evaluated the use of telavancin in patients with hospital-acquired pneumonia, with a focus on MRSA infections12,13. The two trials, with a total of 1503 patients, aimed to prove non-inferiority in the clinical cure rate of nosocomial pneumonia with intravenous telavancin 10mg/kg once daily against intravenous vancomycin 1g 12 hrly. In both studies, telavancin achieved the objective of non-inferiority in the all-treated and clinically evaluable patient populations14.
In one study, the antimicrobial activity of telavancin against 2279 clinical gram-positive cocci obtained from patients with nosocomial pneumonia including those with ventilator-acquired pneumonia (VAP) located in numerous medical centres worldwide was evaluated. Telavancin was highly active against Staphylococcus aureus, coagulase-negative staphylococci, Streptococcus pneumoniae, viridans group streptococci, β-haemolytic streptococci and vancomycin-susceptible enterococci. Telavancin inhibited all staphylococci at ≤0.5 mg/L. Among enterococci non-susceptible to vancomycin (all Enterococcus faecium), telavancin was active against isolates exhibiting a Van B phenotype, but less potent against Van A strains. Telavancin demonstrated equal or greater potency than the comparators (vancomycin, teicoplanin, daptomycin, linezolid and quinupristin/dalfopristin) against Gram-positive pathogens implicated in nosocomal pneumonia15.
Phase IV trials (Post-marketing study)
The pharmaceutical sponsors of telavancin will conduct a prospective study over a five-year period after introduction of telavancin to the market to determine if decreased susceptibility to telavancin is occurring in the target population of bacteria11.
Indications for USE• TelavancinisapprovedbytheFDAforthetreatment
of adult patients with complicated skin and skin structure infections (cSSSI) caused by susceptible Gram-positive bacteria ie, Staphylococcus aureus (methicillin susceptible and methicillin-resistant isolates), Streptococcus pyogenes, Streptococcus

91Indian Journal of Public Health Research & Development. April - June, 2012, Vol. 3, No. 2
agalactiae, Streptococcus anginosus group (S. anginosus, S. intermedius, S. constellatus) or Enterococcus faecalis (vancomycin-susceptible isolates only).
• A recent new drug application for telavancin wassubmitted to FDA for nosocomial pneumonia. However, the FDA issued a complete response letter indicating that additional data and analyses were required to support efficacy and safety of telavancin for treatment of hospital-acquired pneumonia15.
Dosage and AdministrationTelavancin is supplied as 250- and 750-mg single-use vials and should be stored in a refrigerator at 2–8 degrees C. Before administration, the contents of the vial should be reconstituted to a concentration of 15 mg/mL and the appropriate amount removed and diluted to 100–250 mL. The recommended dose of telavancin is 10 mg/kg once daily administered over one hour for 7 to 14 days16.
Adverse Drug Reactions (ADRs)The most common adverse events observed were taste disturbance (metallic or soapy taste), nausea, vomiting, headache and foamy urine. Decreased appetite, diarrhea, stomach pain, chills, pruritus, dizziness and pain or redness at the site of administration are other adverse effects16. Serious adverse events include raised serum creatinine and nephrotoxicity, hypokalemia, QT prolongation, and infusion-related reactions (ie “Red-man syndrome”).
Precautions and Contraindications• Renal Impairment: Monitoring of renal function is
required; if renal function decreases, we need to consider risk/benefit of continuing telavancin or changing to alternative agent. There is decreased efficacy of the drug in patients with moderate to severe renal impairment (CrCl ≤50mL/min) compared to patients with CrCL ≥ 50mL/min. Available recommended dosage adjustments in renal impairment are as follows:
Table: Dosage Adjustments in Renal Impairment
Creatinine Clearance (mL/min) Dosage Regimen
30-50 7.5 mg/kg once daily (24 hours)
10- < 30 10 mg/kg once in two days (every 48 hours)
• Hepatic Impairment: No dosage adjustments are recommended in patients with mild or moderate hepatic impairment.
• Pregnancy: Telavancin is classified as Pregnancy Category C, with potential risk of fetal development toxicity if pregnant female is exposed to it. A serum pregnancy test is recommended prior to the administration of telavancin along with effective
contraception during therapy (if pregnant test result was negative). It has caused adverse fetal effects, including limb abnormalities, in animal studies. Women should avoid the use of telavancin during pregnancy unless potential benefit to the patient outweighs potential risk for the fetus.
• Lactation: Unknown whether telavancin is excreted in human milk.
• Cross reactivity: Telavancin should be avoided in patients with known hypersensitivity to vancomycin.
• Infusion reactions: As with vancomycin, “Red-mansyndrome” (with flushing, urticaria, pruritis, or rash) may occur with rapid infusion of telavancin5.
• CDAD: Clostridium difficile-associated diarrhea (CDAD) may be considered in all patients with diarrhea following use of telavancin. Warning signs are watery or bloody stools, stomach cramps, or fever up to two or more months after stopping treatment16.
• QTc prolongation: We should avoid telavancin in patients with a history of congenital QT syndrome, known prolongation of the QTc interval, uncompensated heart failure, or severe left ventricular hypertrophy, and caution is warranted in patients concomitantly receiving other drugs known to prolong the QTc interval.
Drug InteractionsDrug-drug interactions
• Renal dysfunction can occur on concurrentadministration of telavancin with angiotensin-converting enzyme (ACE) inhibitors; angiotensin receptor blockers (ARBs) or with aspirin and other non-steroidal anti-inflammatory drugs (NSAIDS).
• Concurrent administration of telavancin withantiarrhythmic drugs like amiodarone, disopyramide, dofetilide, procainamide, quinidine and sotalol, antibiotics like erythromycin, sparfloxacin, moxifloxacin and gatifloxacin, antipsychotics such as pimozide and thioridazine and prokinetic drugs like cisapride carry the risk of QTc prolongation.
• In vitro studies have shown that telavancininhibits CYP 3A4/5 at potentially clinically relevant concentrations.
Drug-lab interactions• EffectsofTelavancinonCoagulationTestParameters:
Telavancin binds to the artificial phospholipid surfaces added to anticoagulation tests and interferes with the ability of the coagulation complexes to assemble on the surface of phospholipids and promote clotting in vitro. Thus, a false increase in prothrombin time (PT), international normalized ratio (INR), activated partial thromboplastin time (aPTT), activated clotting time (ACT) and coagulation based factor Xa tests may occur. It is recommended to obtain blood samples within 6 hours prior to the patient’s next dose of telavancin.

92 Indian Journal of Public Health Research & Development. April - June, 2012, Vol. 3, No. 2
• Effects of Telavancin on Urine Protein Tests: Telavancin interferes with the urine qualitative dipstick protein assays and quantitative dye methods; however, it does not interfere with concomitant use of microalbumin assays5.
ConclusionTelavancin is a new lipoglycopeptide, for which phase III trials have been completed and is approved by the FDA. It is rapidly bactericidal and possesses activity against a broad spectrum of gram-positive organisms, including methicillin-resistant and vancomycin-resistant strains and anaerobic species. In clinical studies, efficacy was shown in complicated SSSIs and is also considered potential treatment of hospital-acquired pneumonia.
Key advantages of telavancin include activity against vancomycin-resistant strains, rapid bactericidal activity and a low level of resistance. As antimicrobial resistance continues to increase worldwide, telavancin will add to the clinicians’ armoury in the fight against resistance caused by gram positive bacteria.
References1. Boeser KD. Another anti-MRSA agent making its way to the
market. Infectious Disease News 2009 Nov 1. <Available from http://www.infectiousdiseasenews.com/article/50602.aspx> Accessed October 5, 2010
2. Leonard, SN, Vidaillac C, Rybak, MJ. Activity of Telavancin against Staphylococcus aureus Strains with Various Vancomycin Susceptibilities in an In Vitro Pharmacokinetic/Pharmacodynamic Model with Simulated Endocardial Vegetations. Antimicrobial Agents and Chemotherapy 2009 July; 53(7):2928-33
3. Guskey MT, Tsuji BT. A Comparative Review of the Lipoglycopeptides: Oritavancinm, Dalbavancin, and Telavancin. Pharmacotherapy. 2010;30(1):80-94
4. Corey RG, Stryjewski../../Downloads/telavancin/nrd3051.html - a1 EM, Weyenberg W, Yasothan U, Kirkpatrick../../Downloads/telavancin/nrd3051.html - a3 P. Fresh from the Pipeline: Telavancin. Nature Reviews Drug Discovery 2009 Dec; 8: 929-30
5. Jariwala R.VA Pharmacy Benefits Management Services, Medical Advisory Panel, and VISN Pharmacist Executives. Telavancin (VibativTM). National Drug Monograph 2010 March; 1-12
6. Higgins DL, Chang R, Debabov DV, Leung J, Wu T, Krause KM, Sandvik E, Hubbard JM, Kaniga K, Schmidt Jr. DE, Qiufeng G, Cass RT, Karr DE, Benton BM, Humphrey PP. Telavancin, a Multifunctional Lipoglycopeptide, Disrupts both Cell Wall Synthesis and Cell Membrane Integrity in Methicillin-Resistant Staphylococcus aureus. Antimicrobial Agents and Chemotherapy 2005 March; 49(3):1127-34
7. Zou Y, Brunzelle JS, Nair SK. Crystal Structures of Lipoglycopeptide Antibiotic Deacetylases: Implications for the Biosynthesis of A40926 and Teicoplanin. Chemistry & Biology 2008 June 23;15(6):533-545
8. Attwood RJ, LaPLante KL. Telavancin: A novel lipoglycopeptide antimicrobial agent. American Journal of Health-System Pharmacy 2007; 64(22): 2335-48
9. Stryjewski ME, Graham DR, Wilson SE, et al. Telavancin versus vancomycin for the treatment of complicated skin and skin-structure infections caused by gram-positive organisms. Clin Infect Dis 2008;46:1683–93
10. Available from <http://clinicaltrials.gov/ct2/show/NCT00091819?term=telavancin+AND+cSSSI&rank=3> Accessed September 20, 2010 <http://clinicaltrials.gov/ct2/show/NCT00107978?term=telavancin+AND+cSSSI&rank=4> Accessed September 20, 2010
11. Available from http://www.centerwatch.com/drug-information/fda-approvals/drug-details.aspx?DrugID=1055 . Accessed September 22, 2010
12. Theravance, Inc. Theravance submits U.S. NDA for telavancin for the treatment of hospital-acquired pneumonia. January 26, 2009. <Available from http://ir.theravance.com/ReleaseDetail.cfm?ReleaseID=361466.> Accessed September 26, 2010
13. United States National Library of Medicine, National Institutes of Health. Comparison of telavancin and vancomycin for hospital-acquired pneumonia due to methicillin-resistant Staphylococcus aureus (ATTAIN 1). 2007. <Available from http://clinicaltrials.gov/ct2/show/NCT00107952.> Accessed October 14, 2010
14. United States National Library of Medicine, National Institutes of Health. Comparison of telavancin and vancomycin for hospital-acquired pneumonia due to methicillin-resistant Staphylococcus aureus (ATTAIN 2). 2007. <Available from http://clinicaltrials.gov/ct2/show CT00124020?term=ATTAIN+2&rank=1.> Accessed October 14, 2010
15. Pfaller MA, Mendes RE, Sader HS, Jones RN. Telavancin activity against Gram-positive bacteria isolated from respiratory tract specimens of patients with nosocomial pneumonia. J. Antimicrob. Chemother. (2010); doi: 10.1093/jac/dkq33).<Available from http://jac.oxfordjournals.org/content/early/2010/09/15/jac.dkq335.full.> Accessed October 10, 2010.
16. <Available from http://www.nlm.nih.gov/medlineplus/druginfo/meds/a610004.html.> Accessed October 15, 2010

93Indian Journal of Public Health Research & Development. April - June, 2012, Vol. 3, No. 2
Developing training modules for nurses in safe motherhoodKomal Preet Allagh1, Anitha Thippaiah2
1Student of M.P.H., Loma Linda University, USA, 2Assistant Professor, Indian Institute of Public Health (IIPH), Hyderabad, India
Abstract
BackgroundMaternal mortality remains a challenge in India. The current maternal mortality rate in India is 254 (India statistics, WHO, 2005). In Andhra Pradesh, the maternal mortality rate is 154 (2009) and the 2015 target is to reach below 100. The Each One save One (EOSO) program believes that no mother and child should lose their life in the natural process of childbirth. EOSO aims to reduce the incidence of maternal mortality in Andhra Pradesh by training student nurses on safe birthing practices.
AimsThe goals of the program are 1) to increase knowledge on safe birth practices among student nurses in Andhra Pradesh, India. 2) To improve the ability of nurses to identify complications during labor and to take quick action. And the objectives were that at the end of the program, 80% of the nurse participants at Modern Government Maternity Hospital will have an increase in knowledge about safe childbirth practices and complications.
Material and MethodsThe program was run from 1st July 2010 to 30th August 2010. The program was targeted to the final year Bsc students of NIMS College and Laxmi College of nursing. The classes were conducted at the Modern Government Maternity Hospital, Hyderabad. There were a total of 61 nurses who attended the training modules. The program includes four educational training modules.
ResultThe mean score on pretests was 7, and the mean score on post test was 10. A paired t-test conducted on participants who took both pre and post test, showed the result to be statistically significant (p < 0.05). By the end of the program, 91% of the nurses had increase in knowledge, when compared with the pretest.
ConclusionThe Each One Save One program can be used to educate
more student nurses throughout Andhra Pradesh and the other states of India, where there is a lack of instructors. Our study shows that there was significant increase in knowledge among the nurses following the intervention program. This knowledge when converted to action will help in reducing maternal mortality rates.
KeywordsMaternal mortality, Nurses, Educational modules.
Introduction1. Program Rationale
The Eight Millennium Development Goals (MDG) was created to get the world on the right path to better health. In September of 2000, leaders of 189 countries all over the world signed the Millennium Declaration which committed their countries to striving towards ending extreme poverty by 2015 through the 8 different Millennium Development Goals. The fifth goal is to improve maternal health. The two targets for the 5th Millennium Development Goal are:
a) Target 1: Reduce by three quarters, between 1990 and 2015, the maternal mortality ratio.
b) Target 2: To achieve, by 2015, universal access to reproductive health.
Maternal mortality remains a challenge for India. The current maternal mortality rate in India is 254 (India statistics, WHO, 2005). India’s maternal mortalities account for about 25% of all maternal deaths in the world (Aparajita, Ramanakumar, 2005). In hopes to improve these indicators, India agreed to pursue the achievement of the MDGs by 2015. In India, 65% of births occur at home and one in seven was attended by medical personnel (Biswas, 2003).
A survey conducted in 2005-2006 showed that approximately 76% of women who gave atleast a live birth received Antenatal care, and 74% did so from a skilled provider. It has been surveyed that three quarters of all maternal deaths occur during delivery and in the immediate post-partum period. Hence one of the most significant interventions for safe motherhood is to ensure skilled care provided by skilled professionals during pregnancy and childbirth. Although 75% of births were

94 Indian Journal of Public Health Research & Development. April - June, 2012, Vol. 3, No. 2
reported to occur in rural areas, just about 37% of them were assisted by Skilled Birth Attendants (WHO 2008).
In Andhra Pradesh, the current maternal mortality rate is 154 (2009) and the 2015 target is to reduce it below 100. The Each One save One (EOSO) program believes that no mother and child should lose their life in the natural process of childbirth. EOSO aims to reduce the incidence of maternal mortality in Andhra Pradesh by training student nurses on safe birthing practices. Nursing students were selected as they numbered more in the region and there is an acute shortfall of physicians (Prakasamma, M. 2009).Nursing professionals deal with maternity care and it is anticipated that by increasing their knowledge and skills of nurses, the availability of skilled birth attendants with safer birthing practices result in fewer maternal and neonatal deaths.
2. Literature Review
As more than 60% of births are domiciliary deliveries, India needs to come up with an option to provide skilled birth attendance at community level. Lack of qualified midwives is a major human resource constraint for providing locally accessible skilled delivery care for rural women. Any country with a political pledge to reducing maternal mortality has to focus on well-trained midwives in the hospital and the community. With the change in the role of ANMs and program priorities, comprehensive services have been ignored. The National Family Health Survey (2006) shows that only 52% of women receive three antenatal contacts and 42% receive any postnatal care.
In Andhra Pradesh (A.P.), India, the incidence of maternal mortality is 154, compared to national level of 254. The major factors for the steadily high Maternal Mortality Rates are the low awareness among women and families about risks and low access to resources and services. Only 68.8% of women in Andhra Pradesh delivered in an institution (Prakasamma, M. 2009). The malfunction of the public-health system at the grassroots level to put forward a skilled birth attendant for every pregnant woman is a vital factor in the existing high maternal mortality rate. There is a smaller amount of priority in training the traditional birth attendants, resulting in scarcity of skilled care in the community.
Under NRHM and RCH –II (2005-2010), the government of India is actively pursuing the goals of reduction of maternal mortality by focusing on the four major strategies of essential obstetric care and new born care to all, skilled attendance at birth, emergency obstetric care for those having complications and referral services (India country report, 2007).
The nurse’s community has to join hands with the government to come up with a long term plan of action to reduce maternal deaths through skilled midwifery services. Unless every PHC has a 24 hour availability of a qualified and skilled nurse midwife, childbirth assistance
cannot become a reality in rural India (Regu, M., Tabish, S.A., 2002).
3. Description of the Intervention Venue
The Modern Government Maternity hospital is a 462 bedded Obstetrics and Gynecology Tertiary care Hospital. The hospital has an everyday patient load of 1000 patients. The hospital caters to pregnant women from all over the State of Andhra Pradesh, together with referrals of high risk cases from neighboring states of Karnataka and Maharashtra.
4. Description of Target Audience
The primary target group of the “Each One save One” (EOSO) program were student nurses studying in the Final year BSc. Program. EOSO aimed to reduce maternal mortality, by increasing the knowledge on safe birth practices among student nurses in Andhra Pradesh, and improve their ability to identify complications during labor and to take quick action. The nurses posted for their clinical rotations, at the Modern Government Maternity Hospital were requested to participate in weekly teaching programme for one month duration. The participants were from the Nizam Institute of Medical Sciences (NIMS) College and Laxmi College of Nursing in Hyderabad. A total of 61 nurses participated in the program, 54 were BSc. Nursing students, 5 were MSc. nursing students and two were nursing tutors. The student nurses consisted of both male and female nurses.
Material and Method1. Program Description
The purpose of this program was to increase the nurse’s knowledge about safe childbirth practices. This intervention program involved teaching educational modules to student nurses from Bsc. Nursing final year. The program consisted of four educational training modules, which were taught once a week for length of approximately 75 minutes. The sessions were conducted in the auditorium at the Modern Maternity Government Hospital, Hyderabad. The medium in which the classes were conducted was English and each session was conducted by a health educator.
Four modules were developed keeping in line with the maternity cycle. In the first module, covered topics related to safe motherhood and antenatal care, both essential and trimester based care. In the second module the topics covered were, danger signs during pregnancy and labor and immediate management that a nurse can perform in case an emergency arises. In the third module, an elaborate description was given about stages of normal labor, mechanism of normal labor and identifying abnormal labor in terms of delay or arrest in progress of labor. A video on normal labor was shown to emphasize the stages of labor. In the last module, the main intent was to educate on the current maternal mortality status

95Indian Journal of Public Health Research & Development. April - June, 2012, Vol. 3, No. 2
in India and make them aware about the 5th millennium development goal of reducing maternal deaths. The main causes of maternal deaths in Andhra Pradesh (eclampsia and post partum hemorrhage) were discussed at length. A video on maternal death in India was shown to sensitize the nurses about the current maternal mortality scenario in rural areas.
During each session, brochures were distributed to the nurses. These brochures summarized essential points from each session. Outcome evaluation of the program was done with the help of, a pre test conducted prior to the start of the first training session and a post test at the end of the program. The pre test consisted of 15 objective types of questions which were made from topics covered in the four modules. The same questionnaire was used to conduct a post test at the end of the fourth training session, to assess if the program made any difference in knowledge among the student nurses. Another evaluation done was a post program survey. The questionnaire was developed to evaluate the entire program “Each One Save One Program”.
2. Evaluation Tools
To ensure a thorough evaluation of the program, the evaluation consisted of process, impact and outcome evaluations in the following stages:
Planning phase
• Process Evaluation: A needs assessment was doneprior to implementing the program. It was done based on a thorough literature review. A lesson plan for each training module was developed, which helped the sessions proceed in an organized manner and made sure that the health educator covered all the necessary topics.
Implementation phase
• Process Evaluation: Sign in sheets were used tomonitor attendance of the nurses. An evaluation form was distributed at the end of the last session to measure the quality of the training session. This method of verification can help improve the program.
• Impact Evaluation: Pre tests and were conductedbefore the first session and post tests were conducted at the end of the last session. This method of verification helped to look for any variation in knowledge among the nurses after the training sessions.
End of Program Phase
• Process Evaluation: The survey conducted at the end of the program was used to measure the quality of the entire program. This included teaching methods, handouts and there was a provision for nurses to comment/suggest how to improve the program.
• Impact Evaluation: A post test was given at the end of the last session, which contained same questions as in the pretest.
• Outcome/Program Evaluation: After conducting the pre and post tests, the results were evaluated based on the paired t-test, which showed there was a significant variation in knowledge after the sessions were completed. The mean, mode and median scores were calculated from the pretests and post tests.
Statistical AnalysisThere were a total of 61 participants in the program. During the first session there were 25 participants, hence the initial round of pretest was conducted among these students. During the following week, another 24 new participants joined the program and they too took the pre test. There were a total of 49 pretest questionnaires completed. The participants, who did the pretest on a later date, were also taught the module that they missed.
The mean score on the pretest was 7 out of a total of 15. Total score on pretests for 49 students was 344. The median score was 7.25 and mode was 9.
There were a total of 39 students who attended the last session. Hence only these 39 students completed the post test questionnaire and the pos survey of the entire program. The mean score on the post test was 10.5 out of 15. Total score on post test for 39 students was 411. The median score was 10 and the mode obtained was 13 in the post test.
Table 1: Comparison of results between pretest and posttest
Mean Median Mode
Pre-Test 7 7.25 9
Post-Test 10.5 10 13
The paired t-test was conducted on the students who did both the pre and post test, there were 35 such participants. The p value obtained after conducting the paired t-test was 1.46 X 10⁻¹⁰. The test was statistically significant (p < 0.05). The post test surveys were completed by 39 participants.
ResultThe evaluation from pre and post test found an increase in knowledge among the nurses about safe birth practices. This was achieved as the mean score on pretest was 7, while mean score seen on post test was 10.5. This increase in score was significant (p< 0.05) as evaluated by a paired t-test, showing a significant increase in knowledge among the nurses. Another significant finding noted at the end of the program was that 91% of the nurses fared better as compared by the pre test and post test.
DiscussionThe program EOSO was carried on from 1st July 2010 to 31st August 2010 on 61 student nurses of the final year Bsc

96 Indian Journal of Public Health Research & Development. April - June, 2012, Vol. 3, No. 2
Nursing from NIMS College and Laxmi College of nursing. These nurses were trained on safe motherhood and safe birth practices which was designed into four educational training modules. The program was in collaboration with staff at the Indian Institute of Public Health, Hyderabad and Modern Government Maternity Hospital, Hyderabad.
The aim of the program was to facilitate reduction of maternal mortality in Andhra Pradesh which was at 154 per lakh live births at the time of intervention. In attempts to reduce maternal mortality, everyone in the health sector needs to act in unity to help reach the MDG of reducing maternal mortality rate to below 100 by 2015. Hence nursing students were chosen as the target population for this intervention, as they are the future nurse midwives and will work within the community.
This program was an effort made in reducing the maternal deaths by educating the nurses on practical aspects of pregnancy.
The program “Each One save One” can be seen as a pilot study, which was proven to be useful among the student nurses as the outcome evaluation showed a statistically significant result. This training model along with changes suggested by the participants can be used for training nurses in other hospital settings initially in Hyderabad and then in the rest of Andhra Pradesh.
ConclusionTraining of the nurses on safe birth practices and safe motherhood has led to an increase in knowledge among the nurses. Sixty one student nurses in their final year were trained on four interactive educational modules at the Modern Maternity Government Hospital, Hyderabad, India. Pre and post tests were conducted. The data obtained was compiled and statistically analyzed. The program found a significant increase in knowledge among the nurses after training on four modules. Hence it can be concluded that training nurses on safe motherhood
and safe birth practices significantly increased their knowledge level.
References1. Aparajita C., Ramanakumar A. (2005). Burden of Disease in
Rural India: An Analysis through Cause of Death. The Internet Journal of Third World Medicine.2005; 2(2)
2. Cabral M, Kamal I, Kumar V, Mehra L. Training of Traditional Birth Attendants (TBAs) - An illustrated guide for TBAs. Program of Maternal and Child health and Family planning, World Health Organization.1992; 1-43.
3. Electronic Patient Recording and Management system. Modern Government Maternity Hospital.(Cited on 2nd October 2010). Available from http://www.eindia.net.in/2010/awards/details/eHealth_ICT-Enabled-Hospital-Details.asp?PNo=21
4. Mavalankar D, Vora K, Prakasamma M. Achieving Millennium Development Goal 5: Is India serious? Bulletin of the World Health Organization.2008; 86(4), 241-320.
5. Millennium development goals India country report 2007. Improve maternal Health; 2007 (Cited on 6th July 2010). Available from http://www.mospi.gov.in/mdg_main.htm
6. Population Reference Bureau. Maternal Care in India Reveals Gaps between Urban and Rural, Rich and Poor; 2003(cited 29 January 2010). Available from: http://www.prb.org/Articles/2003/lCareinIndiaRevealsGapsBetweenUrbanandRuralRichandPoor.aspx
7. Prakasamma M. Maternal Mortality-reduction Programme in Andhra Pradesh. Journal of Health Population and Nutrition.2009; 27(2), 220-234.
8. Regu M, Tabish SA. Nursing Partnership for Safe Motherhood. The journal of Indian society of Health Administrators. 2002; 13(1), 75-79.
9. World Health Organization. The Midwife in the community. Midwifery Education module one- second edition; 2008(Cited on 14th July 2010). Available from http://whqlibdoc.who.int/publications/2008/9789241546669_1_eng.pdf
10. World Health Organization. The Midwife in the community. Midwifery Education module two- second edition; 2008(Cited on 18th July 2010). Available from: http://whqlibdoc.who.int/publications/2008/9789241546669_2_eng.pdf
11. World Health organization. India Country’s Profile. Department of Making Pregnancy safer; 2007 (Cited on 12th August 2010). Available from http://www.who.int/making_pregnancy_safer/countries/ind.pdf

97Indian Journal of Public Health Research & Development. April - June, 2012, Vol. 3, No. 2
Co-relation between chronic periodontitis and anemia – A pilot studyKshitiz Parashar1, Tarun Khera1, Rani Somani2, Pradeep Shukla3
1PG Student, 2Prof. & H.O.D, Department of Paedodontics and Preventive Dentistry, D J College of Dental Sciences and Research, Modinagar -201204, Uttar Pradesh, India, 3Prof. & H.O.D, Department of Periodontics and Implantology, D J College of Dental Sciences and Research, Modinagar -201204, Uttar Pradesh, India
Abstract
AimAnemia of chronic disease, a cytokine-mediated anemia, is a frequent complication of many chronic inflammatory conditions. The present case control study was aimed to evaluate levels of systemic hematological markers indicative of anemia in patients with generalized, severe, chronic periodontitis.
MethodsA convenience quota sample of 110 systemically-healthy, urban, male patients of a town Modinagar district Ghaziabad (42 Kms from New Delhi), comprised two groups, based on full mouth periodontal examination: group A patients (n = 50) were diagnosed with generalized, severe, chronic periodontitis, and group B patients comprised the control group (n = 50), which included patients with a clinically-healthy periodontium. Out of these 10 patients were eliminated due to diagnosis of systemic diseases. Laboratory blood investigations included hemoglobin (g%), total number of erythrocytes (red blood cells), hematocrit/packed cell volume, erythrocyte sedimentation rate, mean corpuscular volume of erythrocytes, and mean corpuscular hemoglobin concentration. An analysis was done to compare the mean values of hematological parameters within groups.
ResultsThe mean values of hemoglobin, red blood cells, packed cell volume, and mean corpuscular hemoglobin concentration were significantly lower, while the mean corpuscular volume of erythrocytes and erythrocyte sedimentation rate were significantly higher in group A patients compared to those in group B, indicating mild anemia.
ConclusionsSevere periodontal disease can be linked with anemic status.
Key WordsAnemia of Chronic disease, Periodontitis, Anemia.
IntroductionThe initiation and progression of gingivitis and periodontitis may be affected by certain systemic conditions. The converse side of the relationship between systemic health and oral health has also been demonstrated. This means that there may be potential effects of periodontal disease on a wide range of organ systems1. Anemia of chronic disease is defined as anemia occurring in chronic infections, inflammatory conditions or neoplastic disorders that are not due to marrow deficiencies or other diseases, and occurring despite presence of adequate iron stores and vitamins. 2 Recently, Hutter2 has concluded that periodontitis, like other chronic conditions, lead to anemia.
Periodontitis, a chronic, infectious disease associated with gram-negative microorganisms that exist in a subgingival biofilm,3 is one of the most widespread diseases worlwide4. The prevalence of periodontitis is reported as affecting 30–50% of the population, with approximately 10% having a severe form, and it is more prevalent in developing countries5–7. Chronic periodontitis is the most common form of periodontal disease, which progresses relatively slowly and is more common in adults.
Anemia is defined as a state of reduced Hb concentration, reduced number of circulating erythrocytes in the blood, or both. Anemia is a common and serious health disorder among both sexes and all age groups, although it has a higher prevalence among women than men in India.8 Anemia of chronic disease (ACD) is a form of anemia that occurs in chronic infections and inflammatory conditions; it occurs in the presence of adequate iron stores and vitamins, and is not due to marrow deficiency.
Anemia of chronic disease (ACD) has been described in the literature, and seems to be one of the most common forms of anemia observed in clinical medicine10-12. ACD is defined as the anemia occurring in chronic infections, chronic inflammatory processes or tumor formation that is not due to dysfunction of bone marrow cells or other diseases, and occurring despite the presence of adequate iron stores and vitamins10-12. A characteristic finding of the disorders associated with ACD was the increased

98 Indian Journal of Public Health Research & Development. April - June, 2012, Vol. 3, No. 2
production of the cytokines that mediate the immune or inflammatory response; such as tumor necrosis factor, interleukin-1, and the interferon. All the processes involved in the development of ACD can be attributed to these cytokines, including shortened red cell survival, blunted erythropoietin response to anemia, impaired erythroid colony formation in response to erythropoietin, and abnormal mobilization of reticuloendothelial iron stores13. These cytokines are also released by periodontal tissues in response to bacterial infection, which suggests that periodontitis like other chronic disease may cause ACD.
However, conflicting results have been reported regarding the association of periodontal disease and anaemia14–17. The purpose of this pilot study was to compare the hematological parameters related to anemia in male patients with severe periodontal disease with that of periodontally healthy male patients, and thereby evaluate a possible association between severe periodontal disease and anemia.
Material and MethodsA convenience quota sample of 110 adult, male patients in the age range of 30–60 years, who reported to the, Department of Periodontics and Oral Implantology in D.J.College of Dental Science & Research, India, were enrolled in the study. Out of these 10 patients were excluded due to detection of systemic diseases. The study protocol was approved by the institutional ethical committee. Informed consent was obtained from patients. Demographic and clinical data were collected by means of a questionnaire, survey of any previous medical records, and oral examination.
Inclusion criteria included presence of at least 20 teeth, body mass index of 18.5–25, and self-reported consumption frequency of at least four times per week
of food from the following groups: milk or curd; pulses; fruits; dark green, leafy vegetables; eggs; chicken or meat; and fish. Exclusion criteria were a self-reported intake of vitamins and iron supplementation or any anti-inflammatory or antimicrobial drug within the previous 3 months; a self-reported history of acute or chronic medical conditions, including diabetes or viral, fungal, or bacterial infections; smokers or smokeless tobacco or betel (areca) nut and betel quid (paan) consumers; alcohol consumers; past periodontal treatment; or a recent history of trauma or tooth extractions. A full mouth periodontal examination was conducted (Figure1).
Clinical periodontal parameters were recorded with a Williams graduated probe at six sites on each tooth for both case and control groups. These were probing depth (PD), clinical attachment loss (CAL), and bleeding on probing (BOP), as recorded on visual examination after 30–60 sec of probing. Based on the clinical examination, selected patients were grouped into case and control groups.
Fifty patients with at least 30% of sites with a CAL of 5 mm or more, along with 10% or greater number of sites with a PD of 6 mm or more were diagnosed with generalized, severe, chronic periodontitis. These patients made up group A. Fifty patients with 0% of sites with CAL were considered periodontally healthy and made up the control group, group B.
Blood collection and analysis10 mL venous blood samples were collected by venepuncture under aseptic conditions in the antecubital fossa without excessive venous stasis between 9.00 and 12.00 hours for both case and control group patients. The blood was transferred into ethylenediaminetetraacetic acid containing bulbs. Centrifugation of blood using REMI R-8C laboratory centrifuge for measuring serum ferritin was assessed. (Figure 2)
The hematological parameters assessed in the present study were hemoglobin (Hb) (in g% by Sahli’s method), (Figure 2) total number of erythrocytes (red blood
Figure 1: CPITN probe used for measuring the pocket depth and clinical attachment level at baseline
Figure 2: Centrifugation of blood using REMI R-8C laboratory centrifuge for measuring serum ferritin

99Indian Journal of Public Health Research & Development. April - June, 2012, Vol. 3, No. 2
cells [RBC]) (in million/mm3 by a Neubauer counting chamber), hematocrit/packed cell volume (PCV) (in mm by Wintrobe’s tube centrifuge method) (Figure 3), erythrocyte sedimentation rate (ESR) (in mm by Wintrobe’s tube centrifuge method) mean corpuscular volume of erythrocytes (MCV) (in cu mu), and mean corpuscular hemoglobin concentration (MCHC) (in %)(Figure 4),. Student’s t-test and an analysis of covariance for age adjustment were performed with appropriate Microsoft Excel software for a comparative analysis of outcome parameters between groups A and B.
ResultsThe mean age of group A, which was 53.46 (±7.4) years, was significantly higher than that of control group B, which was 42.13 (±5.9) years. Thus, the analysis of covariance for age adjustment was applied to compare outcome parameters. The mean values of Hb and RBC were significantly lower in group A (11.19[±1.97]g/dL and 4.81 ± .392 million/mm3) compared to group B (16±1.8 g/dL and 6.09±.30 million/ mm3) (P < 0.001). Similarly, the mean values for the PCV and MCHC were significantly lower in group A being 38.71[± 4.22] % and 32.88[± 2.1] %, respectively) compared to those recorded
for group B 44.9[±3.7]% and 37.11[± 1.2]%, respectively (P < 0.001). The mean MCV in group A 97.51[± 7.29]cu mu) was significantly higher than that of group B 88.5[± 3.03]cu mu). The mean value of ESR was also noted to be higher in group A (19.71[± 9.82]mm) compared to group B [3.72± .921]mm), which was statistically significant (P < 0.001) (Table 2). Even after adjusting for the age difference between both groups by the analysis of covariance, the differences between both groups remained statistically significant.
Table I: Mean & SD and student ‘t’ test significance values for systemic Parameters within groups. (n=50)
PARAMETERS GRP. (A)mean (±SD)
(n= 50)
GRP. (B)mean (±SD)
(n=50)
P-VALUE
Hemoglobin 11.19±1.97 16±1.8 .0007*(P<.001)
RBC 4.81 ± .392 6.09±.30 .00002* (P<.001)
Packed cell volume 38.71± 4.22 44.9±3.7 .00038*(P<.001)
Erythrocyte sedimentation rate
19.71± 9.82 3.72± .921 .00000*(P<.001)
Mean corpus volume 97.51± 7.29 88.5± 3.03 .00001*(P<.001)
Mean corpus hemoglobin concentration or (P<.05)
32.88± 2.1 37.11± 1.2 .0005*(P<.001)
* P<.001 snows a high significant different between group A & B
DiscussionAnemia of chronic disease is the second most prevalent form of anemia after nutritional, iron-deficiency anemia, and can coexist together, causing additional anemic burden. ACD is a cytokine-mediated anemia characterized by hypoferremia, with adequate reticuloendotelial iron stores and normal-to-elevated ferritin concentrations. It is a known, frequent complication of chronic inflammatory conditions18,19 such as rheumatoid arthritis. The pathogenesis is reported to be dysregulation of iron homeostasis, depressed erythropoiesis, and a blunted erythropoietin response caused by elevated levels of systemically-circulating pro-inflammatory cytokines resulting due to a local chronic inflammatory process20.
Various studies have tried to evaluate the relationship between periodontitis and hemoglobin. Hutter et al.2 and Thomas et al.21 found that periodontitis patients have lower hematocrit, lower numbers of erythrocytes, lower hemoglobin levels and higher erythrocyte sedimentation rates when compared to healthy controls. Rai and Kharb22 found an increased in hemoglobin and RBC levels in patients with severe periodontitis after scaling and root planning. Considering the relatively high prevalence of anemia, as well as periodontal disease, in Indians, determining the etiological contribution of periodontitis to the presence of an anemic status assumes clinical
Figure 3: Symex cell counter used for measuring Hb, RBC and PCV
Figure 4: Wintrobe’s tube method for detecting the mean corpuscular volume (MCV) (in cu mu), and mean corpuscular hemoglobin concentration (MCHC) of erythrocytes.

100 Indian Journal of Public Health Research & Development. April - June, 2012, Vol. 3, No. 2
significance. Smoking tobacco alters systemic cytokine levels and contributes to anemia,23 as well as increased periodontal destruction24.
In our study, MCV levels in both groups were within the reference values,25 indicating normocytic anemia in group A, as commonly seen in ACD. As MCV levels greater than 95 have been reported as less likely to indicate iron deficiency anemia, and are suggestive of ACD with high predictability26,27 we can attribute the anemia in group A as ACD. The normal range of MCHC is 28–33 g%, and the means for both groups fell within this range, although group A showed a significantly lower mean MCHC, indicating mildly hypochromic anemia. While hypochromia is commonly suggestive of iron deficiency anemia, a mildly hypochromic ACD has been reported in 30–40% of cases9.
Although the RBC indices noted in our study are suggestive of ACD, an analysis of serum ferritin levels and the soluble serum transferrin receptor concentration, or a bone marrow examination, would be necessary28 to quantify iron stores and definitively distinguish between ACD and iron-deficiency anemia in patients with periodontal disease. Within the limits of the study, our results indicate a possible effect of severe periodontal inflammation on the severity of anemia, and we suggest that periodontal therapy might have a potential role in improving anemic status in periodontally-diseased individuals.
Long term, multicenter, prospective studies are essential to verify the magnitude and clinical relevance of this potential therapeutic effect.
ConclusionGeneralized, severe, chronic periodontal disease is positively associated with decreased levels of Hb, hematocrit, and RBC counts, along with increased ESR and MCV levels, suggesting that mild ACD is induced by the systemic effects of periodontal inflammation in patients with severe periodontal disease.
References1. Newman M, Takei H, Klokkevold P, Carranza F. Clinical
Periodontology. 10 th ed. W.B. Saunders; 2006.2. Hutter JW, van der Velden U, Huffels RAM, Hoek FJ, Loos BG.
Lower numbers of erythrocytes and lower levels of hemoglobin in periodontitis patients compared to control subjects. J Clin Periodontol 2001;28:930-6.
3. Grossi SG, Mealey BL, Rose LF. Effect of periodontal infection on systemic health and well being. In: Rose LF, Mealey BL, Genco RJ, Cohen DW, ed. Periodontics: medicine, surgery and implants. St Louis: Elsevier, 2004: 846–7.
4. Research and Science Therapy Committee of the American Academy of Periodontology. Position Paper-Epidemiology of Periodontal Diseases. J Periodontol 1996; 67: 935–45.
5. Waerhaug JH. Prevalence of periodontal disease in Ceylon. Acta Odontol Scand 1967;25: 205- 31.
6. Baelum V, Fejerskov O, Manji F. Periodontal diseases in adult Kenyans. J Clin Periodontol 1988; 15: 455–452.
7. Rahimah AK. Profile of periodontal conditions in selected West Malaysian adults. Singapore Dent J 1994; 19: 4–7.
8. Malhotra P, Kumari S, Kumar R,Varma S. Prevalence of anaemia in adult rural population of north India. J Assoc Physicians India 2004; 52: 18–20.
9. Weiss G, Goodnough LT. Anemia of chronic disease. N Engl J Med 2005; 352:1011–23.
10. Lee GR. The anemia of chronic disease. Semin Hematol 1983; 20(2): 61-80.
11. Beutler E. The common anemias. JAMA 1988; 259(16): 2433-2437.
12. Means RT, Jr., Krantz SB. Progress in understanding the pathogenesis of the anemia of chronic disease. Blood 1992; 80(7): 1639-1647.
13. Means RT, Jr. Advances in the anemia of chronic disease. Int J Hematol 1999; 70(1): 7-12.
14. Hutter JW, Velden UVD, Varoufaki A, Huffels RAM, Hork FJ, Loos BG. Lower numbers of erythrocytes and lower levels of hemoglobin in periodontitis patients compared to control subjects. J Clin Periodontol 2001; 28: 930–6.
15. Erdemir EO, Nalcaci R, Caglayan O. Evaluation of systemic markers related to anemia of chronic disease in the peripheral blood of smokers and non-smokers with chronic periodontitis. Eur J Dent 2008; 2: 102–9.
16. Wakai K, Kawamura T, Umemura O et al. Associations of medical status and physical fitness with periodontal disease. J Clin Periodontol 1999; 26: 664–72.
17. Havemose-Poulsen A, Westergaard J, Stoltze K et al. Periodontal and hematological characteristics associated with aggressive periodontitis, juvenile idiopathic arthritis, and rheumatoid arthritis. J Periodontal 2006; 77: 280–8.
18. Means RT. Hepcidin and cytokines in anemia. Hematology 2004; 9:357–62.
19. Lea JP, Norris K, Agodoa L. The role of anemia management in improving outcomes for African-Americans with chronic kidney disease. Am J Nephrol 2008; 28: 732–43.
20. Weiss G, Goodnough LT. Anemia of chronic disease. N Engl J Med 2005; 352:1011–23.
21. Thomas B, Ramesh A, Ritesh K. Relationship between periodontitis and erythrocyte count. JISP 2006;10:288-91.
22. Rai B, Kharb S. Effect of Scaling and Root Planning in Periodontitis on Peripheral Blood. IJDS 2008; 6(1).
23. Leifert JA. Anemia and cigarette smoking. Int J Lab Hematol 2008; 30: 177–84. Bergstrom J. Cigarette smoking as risk factor in chronic periodontal disease. Community Dent Oral Epidemiol 1989; 17: 245–7.
24. Bergstrom J. Cigarette smoking as risk factor in chronic periodontal disease. Community Dent Oral Epidemiol 1989; 17: 245–7.
25. Zuckerman K. Approach to the anemia’s. In: Goldman L, Ausiello D, eds. Cecil medicine, 23rd edn. Philadelphia, PA: Saunders Elsevier, 2007: 1179–86.
26. Guyatt GH, Patterson C, Ali M et al. Diagnosis of iron-deficiency anemia in the elderly. Am J Med 1990; 88: 205–9.
27. Vreugdenhil G, Baltus CAM, Van Eijk HG, Swakk AJG. Anemia of chronic disease: diagnostic significance of erythrocyte and serological parameters in iron deficient rheumatoid arthritis patients. Br J Rheumatol 1990;29:105–10.
28. Wians FH Jr, Urban JE, Keffer JH, Kroft SH. Discriminating between iron deficiency anemia and anemia of chronic disease using traditional indices of iron status vs transferring receptor concentration. Am J Clin Pathol 2001; 115: 112–8.

101Indian Journal of Public Health Research & Development. April - June, 2012, Vol. 3, No. 2
A Study on perceptions of key health care staff towards disease outbreakKumar Praveen N1, Parameshwar S2
1Assistant Professor, Department of Community Medicine, 2Assistant Professor, Department of General Medicine, Shimoga Institute of Medical Sciences, Shimoga, Karnataka
AbstractTo understand health care workers’ perceptions towards a disease outbreak, a survey was conducted in 5 districts of Karnataka, India between August 2009 and December 2009, to understand the factors that may influence their ability and willingness to report to duty in such an event. The data suggest that nearly half of health care workers are not likely to report to duty during an outbreak. The stated likelihood of reporting to duty was significantly greater for clinical than technical and support staff, and perception of the importance of one’s role in the district’s overall response was the single most influential factor associated with willingness to report for work. The perceived risk among the health care workers was shown to be associated with several factors peripheral to the actual hazard of this event. Lacunae in knowledge identified serve as barriers to outbreak response and must be specifically addressed to enable effective local public health response to this significant threat.
Key WordsPerceptions, Outbreak, health care staff.
IntroductionThe health and the medical education departments are considered the backbone of public health response plans for any and all disease outbreaks and emergencies. Emerging Infectious disease outbreaks are considered increasingly likely, and are now considered one of the most significant and urgent threats to India’s public health preparedness infrastructure. The threat of emerging infectious diseases is a product of the globalization process. Changing lifestyles, patterns of behaviour and several such complex factors have led to the emergence and spread of disease in India. Outbreaks of diseases like SARS, Japanese encephalitis, dengue, chickungunya, malaria, bird flu, etc., in recent times, have critically influenced human lives in India. Added to this, is the recent pandemic of swine flu. A deliberate or a natural outbreak of disease would force the target state to mobilize the government machinery, human and financial resources while combating the disease1.
The recent outbreak of swine flu in India has brought to light deficiencies that exist regarding disease
preparedness, prevention and lifestyle in India. The numbers of cases have been on a rise since May 2009 and many people have been affected2. Successful containment relies on effective system for outbreak detection, rapid data collection, analysis, assessment and timely reporting3. These activities would require an extensive prompt response by local health departments. Previous studies have shown that during extreme scenarios, a varying proportion of healthcare workers may be unable or unwilling to report to duty4-6. Data from even the developed countries like the United States indicate inconsistent and sometimes slow after-hours response by health departments to urgent events involving communicable disease7.
Risk perception theory provides a revealing framework for better understanding response limitations and needs of the public health workforce. The perceived risk, according to this theory, is a multifactorial phenomenon, involving the summation of actual risk and other peripheral influences independent of the actual risk, such as perceived authority, trust, and situational control; these peripheral influences have been termed “outrage” or “dread.”[8]. Based on these models, it was previously suggested that contributing factors peripheral to the actual risk will have a considerable practical impact on how the health care employees would respond in a crisis9.
Aside from physical and circumstantial barriers such as availability of transportation or dependency of family members, specific risk perception issues whose impact may be markedly high and of unique importance for the public health workforce’s response to a crisis were identified. These factors arise from a number of features previously suggested to have been associated with elevated risk perception, including manageability of the threat; risk to future generations; direct personal impact; and sense of control over events.
Based on these factors, several major barriers to effective health workforce emergency response were suggested; these include uncertainty regarding working environment safety, unclear expectations of role-specific emergency response requirements, safety and well being of family members, inadequate emphasis on the critical value of each employee to the district’s response efforts, and insufficient emphasis on stress management techniques – all of which may heighten employees’ sense of dread due to a lack of personal control9.
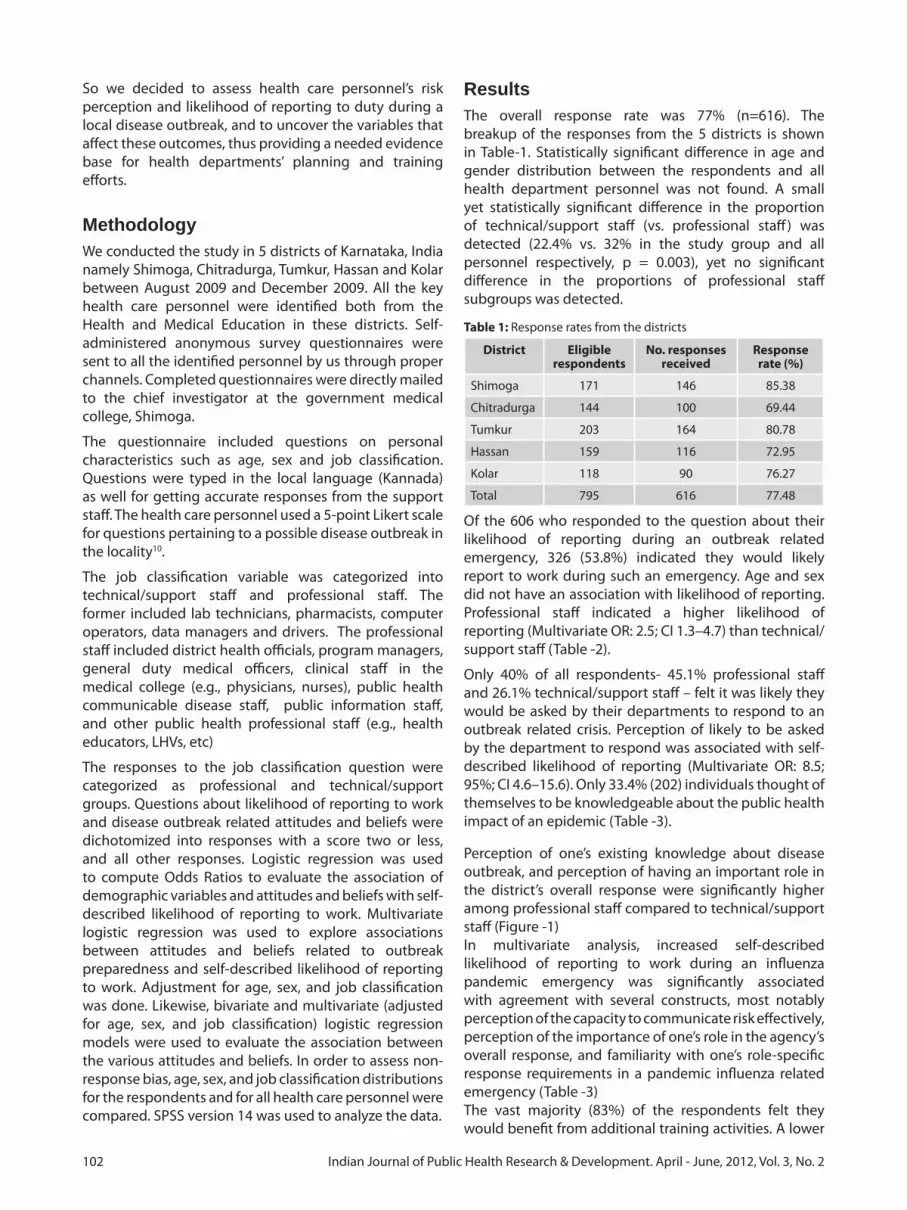
102 Indian Journal of Public Health Research & Development. April - June, 2012, Vol. 3, No. 2
So we decided to assess health care personnel’s risk perception and likelihood of reporting to duty during a local disease outbreak, and to uncover the variables that affect these outcomes, thus providing a needed evidence base for health departments’ planning and training efforts.
Methodology We conducted the study in 5 districts of Karnataka, India namely Shimoga, Chitradurga, Tumkur, Hassan and Kolar between August 2009 and December 2009. All the key health care personnel were identified both from the Health and Medical Education in these districts. Self- administered anonymous survey questionnaires were sent to all the identified personnel by us through proper channels. Completed questionnaires were directly mailed to the chief investigator at the government medical college, Shimoga.
The questionnaire included questions on personal characteristics such as age, sex and job classification. Questions were typed in the local language (Kannada) as well for getting accurate responses from the support staff. The health care personnel used a 5-point Likert scale for questions pertaining to a possible disease outbreak in the locality10.
The job classification variable was categorized into technical/support staff and professional staff. The former included lab technicians, pharmacists, computer operators, data managers and drivers. The professional staff included district health officials, program managers, general duty medical officers, clinical staff in the medical college (e.g., physicians, nurses), public health communicable disease staff, public information staff, and other public health professional staff (e.g., health educators, LHVs, etc)
The responses to the job classification question were categorized as professional and technical/support groups. Questions about likelihood of reporting to work and disease outbreak related attitudes and beliefs were dichotomized into responses with a score two or less, and all other responses. Logistic regression was used to compute Odds Ratios to evaluate the association of demographic variables and attitudes and beliefs with self-described likelihood of reporting to work. Multivariate logistic regression was used to explore associations between attitudes and beliefs related to outbreak preparedness and self-described likelihood of reporting to work. Adjustment for age, sex, and job classification was done. Likewise, bivariate and multivariate (adjusted for age, sex, and job classification) logistic regression models were used to evaluate the association between the various attitudes and beliefs. In order to assess non-response bias, age, sex, and job classification distributions for the respondents and for all health care personnel were compared. SPSS version 14 was used to analyze the data.
ResultsThe overall response rate was 77% (n=616). The breakup of the responses from the 5 districts is shown in Table-1. Statistically significant difference in age and gender distribution between the respondents and all health department personnel was not found. A small yet statistically significant difference in the proportion of technical/support staff (vs. professional staff) was detected (22.4% vs. 32% in the study group and all personnel respectively, p = 0.003), yet no significant difference in the proportions of professional staff subgroups was detected.
Table 1: Response rates from the districts
District Eligible respondents
No. responses received
Response rate (%)
Shimoga 171 146 85.38
Chitradurga 144 100 69.44
Tumkur 203 164 80.78
Hassan 159 116 72.95
Kolar 118 90 76.27
Total 795 616 77.48
Of the 606 who responded to the question about their likelihood of reporting during an outbreak related emergency, 326 (53.8%) indicated they would likely report to work during such an emergency. Age and sex did not have an association with likelihood of reporting. Professional staff indicated a higher likelihood of reporting (Multivariate OR: 2.5; CI 1.3–4.7) than technical/support staff (Table -2).
Only 40% of all respondents- 45.1% professional staff and 26.1% technical/support staff – felt it was likely they would be asked by their departments to respond to an outbreak related crisis. Perception of likely to be asked by the department to respond was associated with self-described likelihood of reporting (Multivariate OR: 8.5; 95%; CI 4.6–15.6). Only 33.4% (202) individuals thought of themselves to be knowledgeable about the public health impact of an epidemic (Table -3).
Perception of one’s existing knowledge about disease outbreak, and perception of having an important role in the district’s overall response were significantly higher among professional staff compared to technical/support staff (Figure -1)In multivariate analysis, increased self-described likelihood of reporting to work during an influenza pandemic emergency was significantly associated with agreement with several constructs, most notably perception of the capacity to communicate risk effectively, perception of the importance of one’s role in the agency’s overall response, and familiarity with one’s role-specific response requirements in a pandemic influenza related emergency (Table -3)The vast majority (83%) of the respondents felt they would benefit from additional training activities. A lower

103Indian Journal of Public Health Research & Development. April - June, 2012, Vol. 3, No. 2
perceived level of familiarity with one’s role was not significantly associated with a higher perceived need for additional training (Multivariate OR: 1.4; CI 0.6–3.4). Most of the respondents also perceive psychological support during the event (57.1%) and post-event psychological support (61.3%) as important. Psychological support during and after the event was deemed more important by staff who considered themselves likely to be asked to report to duty during an event (Multivariate OR: 2.4; CI 1.4–4.2 and OR: 2.8; CI 1.6–4.8), respectively.
66% of the respondents perceived themselves to be at personal risk when performing their duties during such an event. Confidence in personal safety was associated with several constructs independently of one’s job classification, including perception of existing knowledge about public health impact of disease outbreak (Multivariate OR: 4.1; CI 2.3–7.6); family preparation (Multivariate OR: 2.5; CI 1.4–4.3); their department’s perceived ability to provide timely information (Multivariate OR: 5.4; CI 2.7–10.7); perception of the capacity to effectively communicate risk (Multivariate OR: 4.8; CI 2.6–9.0); perception of the importance of one’s role in the district’s overall response (Multivariate OR: 4.1; CI 2.9–7.7); and familiarity with one’s role-specific response requirements (Multivariate OR: 3.5; CI 1.8–6.2). The associations between self-identified likelihood of
reporting to work and perception of one’s capacity to effectively communicate risk were substantially stronger for technical/support staff compared to professional staff (Bivariate OR: 19.4; CI 2.4–160.4 vs. OR: 5.9 CI 2.9–12.2) respectively.
DiscussionExperience has shown, localized “hot spots” of increasing transmission can continue to occur even when the pandemic has peaked at the national level [10]. Existing plans account for personnel shortages within the healthcare settings. Our data suggest that, nearly half of the local health department workers are likely not to report to duty during such an extreme public health crisis. In fact, most of the workers (and nearly three out of four technical/support workers) do not believe they will even be asked to report to work.
It was found that the willingness to report to duty during an outbreak varies considerably according to the individual’s job classification. Clinical staff state they are significantly more likely to report to duty, compared with all other workers. This difference correlates well with the single most influential construct associated with willingness to report to duty – the perception of the importance of one’s role in the district’s overall response. Less than a third of the respondents believed they will have an important role in the district’s response to local outbreaks of an infectious disease, but within this subgroup, willingness to report to duty was as high as
Table 2: Demographic profile of the health care personnel
Likelihood of reporting to duty
Characteristic n (%) Bivariate OR (95% CI)
Multivariate OR (95%CI)
Age (yrs)
20 - 25 40 (6.6) Reference Reference
25 - 30 96 (15.8) 1.2 (0.4–3.4) 0.9 (0.3–2.8)
30 - 35 204 (33.6) 1.3 (0.5–3.3) 0.8 (0.3–2.5)
35 - 40 214 (35.2) 1.3 (0.5–3.3) 0.9 (0.3–2.5)
>40 54 (8.9) 0.9 (0.3–3) 0.5 (0.1–1.9)
Sex
Female 118 (19.1) Reference Reference
Male 498 (80.9) 0.7 (0.4–1.4) 0.6 (0.3–1.2)
Job
Technical/Support Staff
138 (22.4) Reference Reference
Public Health Officials
14 (2.3) 2.6 (0.5–14.2) 1.9 (0.3–11)
General Duty Medical Officers
204 (33.1) 2.3 (1.2–4.4) 2.5 (1.3–4.7)
Clinical Staff in medical colleges
78 (12.7) 0.9 (0.4–1.9) 0.6 (0.2–1.4)
Program Managers
24 (3.9) 3.1 (0.8–12.4) 3 (0.7–12.1)
Public Information Staff
16 (2.6) 0.6 (0.2–1.4) 0.4 (0.1–1.9)
Other Public Health Staff
142 (23.1) 0.7 (0.3–1.3) 0.7 (0.3–1.3)
Table 3: Association of perceptions regarding disease outbreak preparedness with projected likelihood of reporting to duty
Characteristic Construct agreement
=n
Bivariate OR (95%CI)
Multivariate Model OR
(95%CI)Perceived importance of training and education
508 3.8 (1.9–7.5) 3.4 (1.6–7.1)
Perception of the capacity to effectively communicate risk
160 7.1 (3.6–13.9) 6.6 (3.2–13.5)
Department’s perceived ability to provide timely information
390 2.4 (1.5–3.8) 2.3 (1.3–3.8)
Perception of existing knowledge about public health impact of an outbreak
202 3.5 (2.1–5.9) 3.1 (1.8–5.5)
Familiarity with one’s role-specific response requirements
142 7.2 (3.5–14.7) 7.6 (3.4–16.9)
Perception of the importance of one’s role in the district’s overall response
186 10.4 (5.3–20.3)
9.5 (4.6–19.9)
Family preparation 310 2.4 (1.5–3.8) 2.1 (1.2–3.4)Confidence in personal safety
200 4.4 (2.6–7.6) 4 (2.2–7.2)

104 Indian Journal of Public Health Research & Development. April - June, 2012, Vol. 3, No. 2
86.8%. Belief in the importance of one’s role was lowest among technical/support staff, program, and other non-clinical professional staff (15.1%, 18.4% and 18.8% respectively), groups in which willingness to report was shown to be lowest. Therefore we feel it is important that further efforts must be directed at ensuring that all local public health workers, but most notably non-clinical professional staff, understand in advance the importance of their role during an outbreak – otherwise they will fail to show up when they are most needed.
Lack of knowledge, ambiguity regarding one’s exact tasks, and questionable ability in performing one’s role as risk communicator were all significantly associated with a higher perceived personal risk and a two- to ten-fold decrease in willingness to report to duty; these factors proved to be more influential even than the perceived level of family preparedness to function in one’s absence. It is therefore important to recognize that public health employees, who are intended to serve as purveyors of risk communication for their communities, themselves represent a community with specific perceptions that must be addressed in the context of emergency readiness training. It was only in the last one year; H1N1 strain became increasingly pandemic in Southeast Asia and as lethal infections with the virus occurred in an alarmingly increasing rate among humans, that the urgency of the situation was openly declared by national and international health authorities. The rapidity of this evolving situation may serve to explain why only one third of the respondents felt they were adequately knowledgeable on outbreaks, and why only one in five respondents felt capable in effectively communicating pandemic risks. Only 2 of the 78 technical/support staff workers who felt incapable of effective risk communication was willing to report to duty, even though most of them believed the health department will have the ability to provide timely information.
The study has some important limitations that must be factored into the overall analysis. First, the sample was
limited to five non-randomly selected districts, and all of which have staff sizes under 300. The job classifications do not necessarily map neatly onto functional responsibilities in disaster response. For example, health educators may play as frontline a role as clinical staff, in terms of their degree of interface with the public in a disaster. The lack of significant difference in age and gender distribution, as well as the lack of significant difference in job classification other than technical/support staff indicates that the extent of such a bias in the study is probably limited.
This study show similar patterns to data on the willingness of urban healthcare workers from non-public health settings to respond to emergencies: a survey of 6248 employees from 47 healthcare facilities in the New York City area revealed that these workers were least willing (48%) to report to duty during an untreatable naturally-occurring infectious disease outbreak affecting their facility (SARS), compared to other disaster scenarios [6]. In the face of a pandemic H1N1 influenza threat, local health department employees’ unwillingness to report to duty may pose a threat to the nation’s emergency response infrastructure. Addressing the specific factors associated with this unwillingness is necessary to help ensure that existing local health department preparedness competencies11.
ConclusionMost of the health care personnel feel they work under significant personal risk, in a scenario they are not adequately knowledgeable about, performing a role they are not sufficiently trained for, and believing this role does not have a significant impact on the district’s overall response. These specific perceptions and needs must be attended, and specific intervention programs must be initiated. In order to reduce the perceived risk associated with the worker’s role in a case of a disease outbreak, each worker must have better understanding of the scenario and importance of his or her personal role within these settings, confidence that the district will provide adequate protective equipment for its employees, psychological support and timely information, and a belief of being well-trained to cope with emergency responsibilities including the ability to communicate risk to others.
AcknowledgementThe authors are grateful to all the respondents who took part in the study
References1. Monalisa J: Responses to Disease Outbreak: A Perspective from
India. Society for study of peace and conflict, opinion/analysis, Article No: 143, March 06, 2008
2. Ministry of health and Family welfare, Information on swine flu; daily press release. http://mohfw.nic.in/press- release-on-swine-flu.htm
Figure 1: Proportion of individuals who agreed with each of the attitude and belief constructs by staff type

105Indian Journal of Public Health Research & Development. April - June, 2012, Vol. 3, No. 2
3. WHO India, News and highlights; Influenza A (H1N1). http://www.whoindia.org/en/index.htm
4. Qureshi KA, Merrill JA, Gershon RR, Calero-Breckheimer A: Emergency preparedness training for public health nurses: a pilot study. J Urban Health 2002, 79(3):413-416
5. Shapira Y, Marganitt B, Roxiner I, Scochet T, Bar Y, Shemer J: Willingness of staff to report to their hospital duties following an unconventional missile attack: a state-wide survey. Isr Med Sci 1991, 27:704-711.
6. Qureshi K, Gershon RR, Sherman MF, et al.: Health care workers’ ability and willingness to report to duty during catastrophic disasters. J Urban Health 2005, 82(3):378-88
7. Dausey DJ, Lurie N, Diamond A: Public Health Response to Urgent Case Reports. Health Aff (Millwood), in press
8. Sandman PM, Miller PM, Johnson BB, Weinstein ND: Agency communication, community outrage, and perception of risk: three simulation experiments. Risk Anal 1993, 13(6):585-598
9. Barnett DJ, Balicer RD, Blodgett DW, Everly GS Jr, Omer SB, Parker CL, Links JM: Applying Risk Perception Theory to Public Health Workforce Preparedness Training. J Public Health Manag Pract 2005, 11(6 Suppl):S33-S37
10. Preparing for the second wave: lessons from current outbreak; Pandemic (H1N1) 2009 briefing note. http://www.who.int/csr/disease/swineflu/notes/h1n1_secondwave_20090828/en/index.html
11. Columbia University School of Nursing Center for Health Policy: Bioterrorism and Emergency Readiness: Competencies for All Public Health Workers. 2002. http:/ / www.cumc.columbia.edu/ dept/ nursing/ institutes-centers/ chphsr/ btcomps.pdf
106 Indian Journal of Public Health Research & Development. April - June, 2012, Vol. 3, No. 2
Prevalence of ABO and Rhesus blood groups among blood donorsBasavaraj P.B1, Kavitha G.U2, Shashikala P3
1Assistant Professor, 2Associate Professor, 3Professor & Head, Dept. of Pathology, SSIMS & RC, Davangere
Abstract
BackgroundABO and Rhesus (Rh) blood group antigens are hereditary characters and are useful in population genetic studies, in resolving medico-legal issues and more importantly for the immunologic safety of blood during transfusion.
ObjectivesTo document the distribution pattern of the ABO and Rh blood groups among blood donors in and around Davangere (Karnataka).
MethodsThe distribution of ABO and Rh blood group was analyzed among 19,413 blood donors, over a period of 5 years (2005 to 2009). The age group and sex of donors, frequency of ABO blood groups and Rh status were calculated.
ResultsThe predominant donors belonged to the age group between 18-35 years (86.18%). Male to female ratio among donors was 86:1. The most prevalent blood group was O (36.76%), followed by group B (29.85%) and group A (26.15%). The least common blood group was AB (7.24%). The prevalence of Rh positive and negative distribution in the studied population was 94.48 and 5.52% respectively. The highest frequency of coexisting ABO-Rh phenotypes was that of O positive (34.67%) followed by B positive (29.85%) and A positive (26.15%).
Conclusion: Knowledge of frequencies of the different blood groups is very important for blood banks and transfusion service policies that could contribute significantly to the National Health System.
Key WordsBlood groups, ABO, Rhesus, phenotypes, blood donors.
IntroductionOver 700 erythrocyte antigens have been reported in the literature and have been organized into 30 blood group
systems by the International Society of Blood Transfusion. 1 The two most significant blood group systems were discovered by Karl Landsteiner during early experiments with blood transfusion: the ABO group in 1901 2 and in co-operation with Alexander S Wiener the Rhesus group in 19373. The discovery of the ABO system marked the beginning of modern blood banking and transfusion medicine. The ABO system is the single most important blood groups which hold a respectable position in view of the safety of blood/blood component transfusion to date4,5.
Blood groups are genetically determined and exhibit polymorphism in different populations6. The knowledge of the distribution of ABO and rhesus (Rh) blood group is essential for effective management of blood banks inventory, be it a facility of a smaller local transfusion service or a regional or national transfusion service. Apart from their importance in blood transfusion practice, ABO and Rh blood groups are useful in population genetic studies, researching population migration patterns, as well as resolving certain medico-legal issues, particularly of disputed parentage. It is, therefore, imperative to have information on the distribution of these blood groups in any population7.
The frequencies of ABO and Rh blood groups vary from one population to another. There are very few documented works devoted to the study blood groups in India and no data is available for Davangere, Karnataka. Our aim was to determine the ABO and Rh blood group distribution pattern among blood donors in a tertiary care hospital and to compare our results with other studies in India and elsewhere.
Material and MethodsABO and Rh blood group of 19,413 blood donors (includes both voluntary and replacement donors) who donated blood for various reasons at the S S Blood Bank, Davangere, were analyzed from the inception of blood bank in 2005 to 2009 (five years). Donors were also recruited from various blood donations camps held in association with Indian Red Cross society and district hospital Davangere. The blood group phenotypes were detected by the classic slide and tube method by the antigen-antibody agglutination test with appropriate positive and negative control by mixing whole blood

107Indian Journal of Public Health Research & Development. April - June, 2012, Vol. 3, No. 2
with appropriate anti-sera. In case of doubt, the test was examined under a microscope or the results were confirmed by reverse grouping using known group A and B red cells. Results of donors’ age, male to female ratio and frequency of ABO and Rh blood groups were analyzed.
ResultsA total of 19,413 blood donor’s blood groupings were done. The donors were aged 18-60 years with the maximum donors between 18-35 years (86.18%) [Table 1]. Male donors (19189, 98.85%) were more than females (224, 1.15%) with male to female ratio of 86:1. The number of voluntary and replacement donors were 1197 (6.17%) and 18216 (93.83%) respectively.
Table 1: Age distribution of blood donors
Age Group (Years) No. of Donors Percentage
18- 25 8950 46.11
26- 30 5119 26.37
31- 35 2659 13.70
36- 40 1562 8.05
41- 45 691 3.55
46- 50 336 1.73
51-55 78 0.40
56-60 18 0.09
Total 19413 100
The most common ABO blood group was found to be group O (7133, 36.76%), followed by group B (5795, 29.85%) and group A (5078, 26.15%). The least common blood group was AB group (1407, 7.24%) i.e., O> B > A > AB. Rh antigen was detected in 18,339 (94.48%) donors while Rh negative phenotype was found in 1074 (5.52%) donors [Table 2 and Figure 1].
Rh-D negative was common to the blood group O (2.09 % of all blood groups) as compared to blood group of AB (0.30%). The Rh group negativity for blood groups A and B were close (1.54% and 1.59% respectively). There was no association between ABO blood group and Rh status.
DiscussionBoth ABO and Rh blood grouping is very important for safe blood transfusion. Dangerous hemolytic transfusion reactions may occur when blood is transfused into an individual with an incompatible blood type8. The severity
of the resulting transfusion reaction may vary from an asymptomatic minor rise in the plasma bilirubin level to severe jaundice and renal tubular damage, with anuria and death. Another complication due to “Rh incompatibility” arises when an Rh negative mother carries an Rh positive fetus (erythroblastosis fetalis)5.
ABO and Rh genes and phenotypes vary widely across races and geographical boundaries9-11 despite the fact that the antigens involved are stable throughout life. The resultant polymorphism remains important in population genetic studies, estimating the availability of compatible blood, evaluating the probability of hemolytic disease in the new born, resolving disputes in paternity / maternity and for forensic purposes4,12.
In our study, maximum donors were between 18-35 years because young adults usually volunteer to donate blood than older age group. It was also evident that numbers of female donors were less because of their low body weight, low hemoglobin concentration, ignorance, lack of motivation and awareness and fear among the females regarding blood donation. The similar findings were noted by Ahad et al13 Hence, general population needs more motivation and many voluntary blood donation camps need to be conducted to meet the increasing demand for blood.
We have compared the frequency of distribution of blood groups ABO and Rh to previous studies [Table 3]. The present study is useful in providing information about the status of ABO and Rh blood group among blood donors which might represent ABO and Rh frequency in general population.
As far as distribution of ABO blood group is concerned, the group O is the most frequently encountered phenotype in the population under study. This observation is in accordance with previous reports from other parts of
Table 2: The frequency of combined ABO and Rh blood groups among blood donors.
Blood Group Rh positive % Rh negative % No. of Donors Prevalence (%)
A 4778 24.61 300 1.54 5078 26.15
B 5486 28.26 309 1.59 5795 29.85
AB 1348 6.94 59 0.3 1407 7.24
O 6727 34.67 406 2.09 7133 36.76
Total 18339 94.48 1074 5.52 19413 100
Figure 1: Frequency of ABO and Rh phenotypes among donors.

108 Indian Journal of Public Health Research & Development. April - June, 2012, Vol. 3, No. 2
South India14,15,18. Another south Indian study conducted on the population of Chittoor district of Andhra Pradesh also showed similar pattern of distribution of blood groups17.
With regard to the other ABO blood group phenotypes, the frequency of group ‘A’ in the present study is in proximity to the reported frequency among the Bangaloreans14. Slightly higher frequency for group A was reported in Gangadikara Vokkaligas of Mysore15.
A proportion of group ‘B’ as in our study is similar to report by other studies from South India14,18 whereas in north India blood group ‘B’ was found to be commonest ABO subtype19,20. The discrepancy between our findings and that reported by Wadhwa et al19 and Sidhu20 may be attributed to the ethnic difference among the population of India, or it could be due to the smaller sample size as against a relatively larger sample size in the present study. A Study done by Nanu and Thapliyal 29] also reports that group B is the most predominant ABO group in the north Indian population as also in neighboring Pakistan21. Bombay group was not found in our study.
The frequency of Rh negative phenotype is close to those reported from other parts of South India14,18 and north-India19,29. This indicates that frequency of Rh-D negative phenotype in India is around 5% in sharp contrast to the frequency of about 15% phenotype reported in other nations6,11.
ConclusionThis study establishes that there is a significant difference in ABO blood groups between south and north India, and India as well as different parts of the world. Among blood donors, the various ABO and Rh blood groups in south India, group O is the commonest, followed by blood groups B and A, where as in north India group B is the commonest phenotype. The frequency of Rh-negative in India is similar to other series. The results of this study could contribute significantly to the National Health System in aiding the prediction of percussions of certain diseases related to blood groups, as well as the requirement for certain blood groups within the blood donation programme. Knowledge of the frequencies of the different blood groups in this part of India is very important for blood banks and transfusion service policies. Knowledge of blood group phenotype distribution is also important for clinical studies (for example disease association), as well as for population studies.
Thinking about the life threatening complications and dangerous sequel of transfusion reaction we should be very careful regarding ABO and Rh blood grouping starting from blood collection, blood grouping and cross matching and up to transfusion to the recipient. Only sincerity and awareness can bring these dangerous transfusion reactions to zero.
Table 3: Comparison of distribution of ABO and Rh blood groups in the present study and other countries. (DNA-data not available)
Study A B AB O Rh + Rh -
Present 26.15 29.85 7.24 36.76 94.8 5.52
Bangalore14 23.85 29.95 6.37 39.82 94.2 5.79
Mysore15 34.3 25.3 6 37.4 97.3 2.67
Mysore16 26.6 28.72 12.77 31.91 96.8 3.19
Chittoor17 18.95 25.79 7.89 47.37 90.6 8.42
Vellore18 18.85 32.69 5.27 38.75 94.5 5.47
Gujarat19 23.3 35.5 8.8 32.5 94.2 5.8
Punjab20 21.9 37.6 9.3 9.3 97.3 2.7
Bangladesh13 24.17 34.54 8.27 33.05 97.1 2.89
Pakistan21 23.8 38 10 10 89.1 10.9
Nepal22 34 29 4 33 96.7 3.33
Niger-Delta7 23.8 20.7 2.8 52.7 93.9 6.12
Yemen23 29.6 16.5 2.3 2.3 92.9 7.1
Iran24 33.1 23.3 8.9 8.9 88.7 11.3
Saudi Arabia25 33.4 6 3.8 56.8 92.8 7.2
Bahrain26 21.5 24.4 4.5 4.5 94.5 4.5
Australia27 38 10 3 49 DNA DNA
United Kingdom28 42 8 3 47 DNA DNA
USA (Blacks/Whites)28 27/40 20/11 4/4 49/45 DNA DNA
World’s population28 32 24 7 37 DNA DNA

109Indian Journal of Public Health Research & Development. April - June, 2012, Vol. 3, No. 2
References1. International Society of Blood Transfusion (ISBT). “Table of
blood group systems”. Oct 2008, http://ibgrl.blood.co.uk/isbt. 2. Landsteiner K. Zur Kenntnis der antifermentativen, lytischen
und agglutinierenden Wirkungen des Blutserums und der Lymphe. Zentralblatt Bakteriologie 1900;27:357-62.
3. Landsteiner K, Wiener AS. An agglutinable factor in human blood recognized by immune sera for rhesus blood. Proc Soc Exp Biol Med 1940;43:223-224.
4. Reid ME, Calhoun L, Petz LD. Erythrocyte antigens and antibodies. In: Lichtman M, Beutler E, Kipps TJ, Seligsohn U, Kaushansky K, Prchal JK. Editors. Williams hematology. 7th ed. McGraw-Hill Medical publishing division:New York;2006. pp 2119-2136.
5. Blaney KD, Howard PR. editors. ABO and H group systems and secretor status. In :Basic and applied concepts of immunohematology. 2nd ed. Mosby Elsevier:Missouri; 2009. pp.78-107
6. Mourant AE, Kopec Ada C, Damaniewssta - Sobczak K. editors. Distribution of Human blood groups and other polymorphism. 2nd ed. Oxford University Press:London;1976.
7. Enosolease ME, Bazuaye GN. Distribution of ABO and Rh-D blood groups in the Benin area of Niger-Delta: Implication for regional blood transfusion. Asian J Transf Sci 2008; 2(1):3-5.
8. Barret KE, Barman SM, Boitano S, Brook HL. Editors. Blood types. In: Ganong’s Review of Medical Physiology. 23rd ed. Tata McGraw Hill: New York; 2010:527-530.
9. Knowles S, Regan F. Blood cell antigens and antibodies, erythrocytes, platelets and granulocytes. In: Lewis SM, Bain BJ, bates I. Editors. Practical hematology. 10th ed. Churchill Livingstone:Philadelphia; 2006. pp 481-522.
10. Reid ME, Lomas-Frances C. The blood group antigens facts book. Academics Press: SanDiego;1997.
11. Technical manual. In: Vengelen-Tyler, editor. 12th ed. American Association of Blood Banks: Bethesda MD;1996.
12. Polesky HF, Roby RK. Blood group, human leucocytes antigens and DNA polymorphism in Parentage and forensic testing. In:McPherson RA, Pincus MR. editors. Henry’s clinical diagnosis and management by laboratory methods. 21st ed. Saunders:Philadelphia;2007. pp 1340-1349.
13. Ahad MA, Bakar MA, Ahsan HAM. Pattern of ABO and Rhesus (Rh) blood group among blood donors. Taj 2002;15(2):68-70.
14. Periyavan A, Sangeetha SK, Marimuthu P, Manjunath BK, Seema. Distribution of ABO and Rhesus-D groups in and around Bangalore. Asian J Transfus Sci 2010;4(1):41.
15. JaiPrabhakar SC, Gangadhar MR. Study of ABO and Rh (D)
blood groups among Gangadikara Vokaligas of Mysore. Anthropologist 2009;11(1):63-64.
16. Prabhakar SCJ, Gangadhar MR. Reddy KR. ABO and Rh (D) blood groups among the Vishwakarmas of Mysore district, Karnataka. Anthropologist 2005;7(1):71-72.
17. Reddy KSN, Sudha G. and Rh (D) blood groups among the desuri Reddis of Chittoor District, Andhra Pradesh. Anthropologist, 2009;11(3):237-238.
18. Das PK, Nair SC, Harris VK, Rose D, Mammen JJ, Bose YN, Sudarsanam A. Distribution of ABO and Rh-D blood groups among blood donors in a tertiary care centre in South India. Trop Doct. 2001;31(1):47-8.
19. Wadhwa MK, Patel SM, Kothari DC, Pandey M, Patel DD. Distribution of ABO and Rhesus-D groups in Gujarat, India: a hospital based study. Indan J Ped Oncol 1998; 19 (4):137-141.
20. Sidhu S. Distribution of the ABO Blood Groups and Rh(D) Factor Among the Scheduled Caste Population of Punjab. Anthropologist 2003; 5: 203-204.
21. Hammed A, Hussain W, Ahmed J, Rabbi F, Qureshi JA. Prevalence of Phenotypes and Genes of ABO and Rhesus (Rh) Blood Groups in Faisalabad, Pakistan. Pak J Biol Sci 2002; 5: 722-724.
22. Pramanik T, Pramanik S. Distribution of ABO and Rh blood groups in Nepalese medical students: a report. East Mediterr Health J. 2000 Jan;6(1):156-8.
23. Bahaj AA. ABO and Rhesus Blood Groups Distribution In Hadhramout Population. Hadhramout for Studies & Researches 2003; 4: 52-58.
24. Boskabady MH, Shademan A, Ghamami G, Mazloom R. Distribution of Blood Groups Among Population in the city of Mashhad (North East of Iran). Pak J Med Sci 2005; 21: 194-198.
25. Sarhan MA, Saleh KA, Bin-Dajem SM. Distribution of ABO blood groups and rhesus factor in Southwest Saudi Arabia. Saudi Med J 2009; Vol. 30 (1): 116-119
26. Al-Arrayed S, Shome DK, Hafadh NAS et al. ABO Blood Group and Rh-D Phenotypes in Bahrain: Results of Screening School Children and Blood Donors. Bahrain Med Bull 2001;23(3):112-15.
27. Australian red cross society. Available from: http://www.donateblood.com.au/all-about-blood/blood-types
28. Racial & ethnic distribution of ABO blood types. Last revised on 07/13/2008. Available From: http://www.bloodbook.com/world-abo.html.
29. Nanu A, Thapliyal RM. Blood group gene frequency in a selected north Indian population. Indian J Med Res. 1997;106:242-6.

110 Indian Journal of Public Health Research & Development. April - June, 2012, Vol. 3, No. 2
Comparative study of lipid profile in chronic smokers with and without acute myocardial infarctionPampareddy B. Kollur1, Manjula R.2, Sangappa V. Kashinakunti3, Gurupadappa S. Kallaganada4, Jagadish B. Ingin5
1Assistant Professor, Dept. of Biochemistry, D. Y. Patil Medical College, Khollapur, Maharashtra, 2Assistant Professor, Dept. of Community Medicine S.N. Medical College, Bagalkot, Karnataka, 3Associate Professor, Dept. of Biochemistry, S.N. Medical College, Bagalkot, Karnataka, 4Professor and HOD, Dept. of Biochemistry, SIMS Shimoga , Karnataka, 5Professor and HOD, Dept. of Biochemistry, M.R. Medical College, Gulbarga, Karnataka, India
Abstract
BackgroundSmoking is one of the major risk factors in the genesis of coronary atherosclerosis and development of coronary heart disease. Smoking may alter normal plasma lipoprotein levels.
ObjectiveThe present study was undertaken to compare the lipid profile between chronic smokers (Group A) and chronic smokers with myocardial infarction (Group B).
Material and MethodsFifty apparently healthy chronic smokers and 50 smokers with myocardial infarction were selected for the study.Fasting venous blood sample was collected in controls, in AMI patients sample was collected before any intervention, and total cholesterol (TC), triglycerides (TG), and high density lipoprotein cholesterol (HDL-C) were measured. Low density lipoprotein cholesterol (LDL-C) and Very low density lipoprotein cholesterol (VLDL-C) were calculated by Friedwald’s formula. Statistical analysis was done by Z test.
ResultsThe lipid profile was compared between Group A and Group B.
There was a significant rise in TC, TG, LDL-C, VLDL-C and significant decrease in HDL-C in Group B as compared to Group A.
ConclusionCigarette smoking modulates the IHD risk through gene- environment interaction and smoking increases the risk of atherosis. Further studies are required to ascertain the gene environment interaction .
Key WordsChronic smokers, Myocardial infarction, Lipid profile.
IntroductionSmoking is among the 10 greatest risk to health1. Cigarette smoking done more than 10 per day for 6-8 years is strongly implicated risk factor and also leading cause of death for chronic obstructive pulmonary disease(COPD), lung cancer and atherosclerosis2.
There is a mechanistic link between increased levels of oxidative stress associated with smoking and the onset and progression of cardiovascular diseases. Two major phases were identified in cigarette smoker: A tar phase and a gas phase. The tar phase of cigarette contains semiquinone radical which can react with oxygen to produce superoxide anion, hydroxyl radical and hydrogen peroxide. The gas phase contains alkyl and peroxyl type. In one puff of cigarette, the smoker is exposed to more than 1015 free radicals in gas phase alone, with addition exposure in tar phase equal to more than 1017 free radicals per gram3.
Smoking is associated with increased of lipid, protein and DNA oxidation. Increased oxidative stress and conversion of LDL to oxidized LDL could lead to atherosclerotic lesions. Circulating products of lipid peroxidation and autoantibody titers to oxidized LDL are significantly increased in smokers. It has been described that nicotine increases the circulatory pool of atherogenic LDL via accelerated transfer of lipids from HDL and impaired clearance of LDL from plasma compartment. Therefore, it increases the deposition of LDL-C in the arterial wall [4]. The triglyceride/ high-density lipoprotein abnormalities have recently been suggested to be related to insulin resistance.
In smokers there will be significant increase in the levels of serum cholesterol, triglycerides and LDL-C, but HDL-C is lowered in smokers than non-smokers [4]. Many studies have been done to compare the level of lipid profile among smokers and non smokers, and the non smokers and smokers with myocardial infarction . None of the studies which we have reviewed, have compared between chronic smokers with out myocardial infarction and chronic smokers with myocardial infarction. Therefore, the focus of this study was to find any other component that could have a role to play in lipid profile among chronic smokers and subsequent complications. In this context, the present study was undertaken to compare the lipid profile in apparently healthy chronic

111Indian Journal of Public Health Research & Development. April - June, 2012, Vol. 3, No. 2
smokers (Group A) and chronic smokers with myocardial infarction (Group B).
Material and MethodsIn this case control study, 50 apparently healthy chronic smokers were chosen as controls and 50 chronic smokers with diagnosed myocardial infarction were included as cases after appropriate matching. All of them were male subjects. Both chronic smokers and chronic smokers with myocardial infarction, who smoked 14 or more cigarettes per day for more than 12 or more years ( Mean values are mentioned in the table 1) were selected from Hanagal Shri Kumareshwara Hospital, Bagalkot, Karnataka, India
Those excluded from the study were persons abusing alcohol, ex-smokers, patients with diabetes mellitus, hypertension, renal diseases, hepatic impairment, endocrine disorders, obese individuals and patients on drugs like β-blockers, lipid lowering drugs and thiazide diuretics.
Ethical Clearance was obtained from S.Nijalingappa Medical College Ethical Committee. Informed consent was obtained from all the subjects.
Each subject was interviewed and information about demographic details and smoking was obtained.
The demographic details included age, sex, body weight, body mass index (BMI). Smoking habit included smoking period and number of cigarettes smoked daily.
Fasting venous blood sample was collected, serum was separated and analyzed for the following parameters -Triglycerides (TG) were measured by GOP-PAP method5,6, optical density was measured at 546 nm. Total cholesterol (TC) and High Density Lipoprotein cholesterol (HDL-C)were measured by CHOD-PAP method5,6,7,8,9, optical density was measured at 500 nm. Low Density Lipoprotein cholesterol (LDL- C) and Very Low Density Lipoprotein cholesterol (VLDL-C) were calculated by Friedwald’s formula10.
Statistical analysis was done by ‘Z’ test using SPSS version 15.0 . P< 0.05 was considered as statistically significant.
ResultsThe demographic characteristics of all the subjects are shown in Table -1. All of them were male subjects in the study. There was no significant difference in mean age, body weight and BMI among Group A and Group B. Group A and Group B were hypertensive, both groups smoked 14 or more cigarettes per day for 12 or more years ( Mean values are mentioned in the table 1).
Table 2 shows lipid profile in chronic smokers (Group A) and chronic smokers with MI (Group B) The mean TC in Group A and Group B was 196.38± 22.40 mg/dl and 224.52± 13.10 mg/dl respectively. Group A had a mean TG of 166.40± 12.10 mg/dl and Group B, 192.18± 13.40 mg/dl.
The mean HDL-C in Group A was 29.70± 2.90 mg/dl and in Group B , 28.48 ± 2.60 mg/dl. The mean VLDL-C in Group A and Group B was 31.40±3.20 mg/dl and 40.18±3.16 mg/dl respectively. The mean LDL-C in Group A was 122.18± 13.60 mg/dl and in Group B, 150.84± 8.83mg/dl.
TC, TG, VLDL-C and LDL-C in Group B were significantly higher as compared to Group A (P<0.001 for all parameters).
But there was significant decrease in HDL-C in Group A and Group B (P<0.05).
DiscussionThe present study showed that the lipid parameters, TC (P<0.001), TG (P<0.001), VLDL-C (P<0.001), LDL-C (P<0.001) were significantly higher and HDL-C was significantly lower in chronic smokers with MI than chronic smokers, even when both the groups were matched for age, body weight, BMI and smoking habits. Although cigarette smoking is a well established risk factor for vascular diseases, the genetic mechanisms that link cigarette smoking to an increased incidence of stroke are not well understood.
The inter subject variability in the atherosclerotic process in smokers may be partially mediated by genetic variants. Either CYP1A1 MSP polymorphism or certain endothelial NO synthase intorn 4 polymorphisms increased the susceptibility to cigarette smoke exposure – related atherosclerotic diseases including multi-vessel CHD and MI11.
C alleles were associated with higher risk of carotid plaque formation and were found to act synergistically with other inflammatory single nucleotide polymorphisms (SNPs) to increase carotid intima media thickness (IMT), specifically among the smokers12.
Cigarette smoke has shown to increase the expression of proinflammatory cytokines including IL-6. Furthermore,
Table 1: Demographic characteristics of chronic smokers and smokers with Myocardial Infarction (MI).
Demographics Chronic Smokers (Group A)
Chronic Smokers with MI (Group B)
No of subjects 50 50
Sex- Male 100% 100%
MeanAge (Years) 46.3±8.1 48.4±9.3
Body Wt(Kg) 56±6.8 62±3.2
BMI (Kg/m2) 28.1±1.04 30.28±0.88
SBP (mmHg) 140.21±4.83 146.84±09.92
DBP (mmHg) 91.83±04.20 98.93±4.91
Smoking status 100% 100%
Smoking Period (Years)
12.3±1.6 13.4±2.1
No. of Cigarettes smoked daily
14±2 15±3

112 Indian Journal of Public Health Research & Development. April - June, 2012, Vol. 3, No. 2
several studies have demonstrated that IL-6 polymorphism may mediate carotid artery intima-media wall thickness. Genetic variation in IL-6 may modify stroke risk, and that this increased risk may be due to synergistic effect between pro inflammatory genotypes and smoking12.
The inflammatory gene SNPs are associated with early onset ischemic stroke among African-American women (1L-6) and cigarette smoking may modulate stroke risk through a gene-environment interaction (IL6, CD14)12.
Several environmental factors are documented to influence redox metabolism , relatively little known about genetic effects. TAS, an indicator of redox homeostasis, is under strong genetic control, especially in smokers, this could lead to the increase in lipid peroxidation products, ultimately results in increased in oxidized LDL-C levels in chronic smokers with MI than the chronic smokers13.
In conclusion, the present study suggests that smoking may modulate the IHD risk through a gene-environment interaction and which causes significant rise in TC,TG, LDL-C and VLDL-C and significant decrease in HDL-C, thereby increasing the risk of atherosclerosis, The limitations of present study were1. the sample size is small2. MDA is more accurate when it is applied for larger population during epidemiological surveys3. diet history was not taken in depth4. extent of smoking ie amount of smoke exposed to lungs is not document and which is very difficult to measure5. all the subjects were males.
However, further studies and long period follow up is needed- a) to find whether Group A subjects end up with myocardial infarction in due course. b) to ascertain the gene environment interaction in Group A and Group B subjects. c) to answer why all chronic smokers (14 or more cigarettes per day for a period of 12 or more years) do not have an MI.
References1. Ning L, Xudong J, Oliver Chen CY et al. Almond consumption
reduces oxidative DNA damage and lipid peroxidation in male smokers. J. Nutr. 2007 137; 2717- 2722.
2. Pasupathi P, Sarvanan G, Farook J et al. Oxidative stress biomarkers and antioxidant status in cigarette smokers compared to non-smokers. J. Pharm.sci. & Res. 2009; 1(2): 55-62.
3. Khaled AAS. Effect of exercise on cardiovascular dysfunction induced by cigarette smoking.Journal of stress physiology and biochemistry. 2008;4/2; 14-29.
4. Akbari M A, Bhatti M S, Shakoor M. Lipid profile in smoking. JAMC 2000;12 (3) : 19-21.
5. Buccolo G. and David H. Quantitative determination of serum triglycerides by the use of enzymes. Clinical Chemistry 1973;19:476-482.
6. Werner M, Gabrielson D G, Eastman J. Ultramicro Determination of Serum Triglycerides by Bioluminescent Assay. Clinical Chemistry 1981;27(2):268- 271.
7. Allen J K, Hensley W J, Nicholls A V et al. An Enzymic and Centrifugal Method for Estimating High-Density Lipoprotein Cholesterol. Clinical Chemistry 1979; 25(2):325- 327.
8. Lopes-Virella M F, Pamela S, Ellls S et al. Cholesterol Determination in High- Density Lipoproteins Seperated by Three Different Methods. Clinical Chemistry 1977;23(5):882-884.
9. Miller N E, Forde O H, Thelle D S et al. High density lipoprotein and coronary heart disease - a prospective case-control study. Lancet 1977;1:965-968.
10. Friedwald W T, Levy R I, Fredrickson D S. Estimation of the Concentration of Low-Density Lipoprotein Cholesterol in Plasma Without Use of the Preparative Ultracentrifuge. Clinical Chemistry 1972;18:499-502
11. John A, Rajat SB. The pathophysiology of cigarette smoking and cardiovascular disease. JACC 2004 May 19; 43/10: 1731-1737.
12. Cole J W, Brown D W,Giles W H et al. Ischaemic stroke risk, smoking, and the genetics of inflammation in a biracial population: The stroke prevention in young women study. Thrombosis Journal 2008;6(11):1-8.
13. Xing LW, rainwater DL, Vandeberg JF et al. Genetic contributions to plasma total antioxidant activity. Arterioscler Thromb Vasc Biol 2001; 21: 1190-1195.
Table 2: Lipid profile of chronic smokers and chronic smokers with Myocardial Infarction(MI)
Parameter Chronic Smokers(Group A)
Chronic Smokers with MI (Group B)
Z Value P Value
TC (mg/dl) 196.38±22.40 224.52± 13.10 7.92 P<0.001
TG (mg/dl) 166.12±12.10 192.18± 13.40 10.20 P<0.001
HDL-C (mg/dl) 29.70 ±2.90 28.48±2.60 2.20 P<0.05
VLDL-C (mg/dl) 31.40 ±3.20 40.18±3.16 13.90 P<0.001
LDL-C (mg/dl) 122.18±13.6 150.84±8.83 9.90 P<0.001

113Indian Journal of Public Health Research & Development. April - June, 2012, Vol. 3, No. 2
Bilateral Talon Cusp-An unusual presentation and its managementBhavna Dave1, BS Rajashekhara2, BS Manjunatha3, Sunanda G Sujan4
1Professor and Head, 2Post Graduate Student, 3Reader, Department of Oral and Maxillofacial Pathology, 4Professor, Department of Pedodontics and Preventive Dentistry, K M Shah Dental College & Hospital
AbstractThe talon cusp is a relatively rare developmental anomaly characterized by the presence of an accessory cusp like structure projecting from the cingulum area or cemento-enamel junction of the maxillary or mandibular anterior teeth in both the primary and permanent dentition. The prevalence of talon cusp varies considerably among Populations. These are usually seen in maxillary incisors unilaterally. An uncommon presentation of bilateral maxillary palatal talon cusp and its management is reported. The talon cusp can occur as an isolated finding or in association with other dental anomalies and has been reported in patients with Rubinstein-Taybi syndrome, Mohr syndrome, Sturge-Weber syndrome, incontinentia pigmenti achromians and Ellis-van Creveld syndrome. The purpose of this article is to present a case of bilateral talon cusp on geminated maxillary incisors which caused clinical problems and to describe treatment modalities.
Key WordsTalons cusp;accessory cusp;dens evaginatus.
IntroductionTalon cusp is a well delineated cusp like anomalous structure located on the surface of an anterior tooth; it is found in both primary and permanent dentitions and can be located on lingual or labial surface, it can be unilateral or bilateral1. This is a relatively rare anomaly, with a prevalence ranging from 0.04% to 10% and affects mainly the maxillary lateral incisor, unilaterally or bilaterally2.
Talon cusp has been classified by Hattab et al.3 into three basic types according to its formation and extent:
• TypeI (talon) ischaracterizedbyanadditionalcuspprojecting from the palatal aspect of an anterior tooth and extending for half the distance between the cemento-enamel junction and the incisal edge
• TypeII(semi-talon)ischaracterizedbyanadditionalcusp 1 mm in extent or more, extending from the cemento-enamel junction for less than half the distance to the incisal edge and
• Type III (trace talon) manifests as a prominentcingulum and its variations.
Presence of bilateral talons cusp is very less in comparison
to unilateral condition. Thus an unusual case of bilateral maxillary palatal talon cusps in all incisors and its management is reported.
Case ReportA 14 year old girl reported to Dept. of Pedodontics and Preventive Dentistry, KM Shah Dental College & Hospital, Vadodara, with a complaint irregularly arranged front teeth. Intraoral examination revealed well defined accessory cusps (talon cusps) on the palatal aspect of both the permanent maxillary central and lateral incisors which were fully erupted (Figure 1). The accessory cusps were markedly developed and pyramidal. These accessory cusps in lateral incisors were slightly more prominent than in the central incisors. These extra prominent cusps extended almost from the cervical third of the crown to the middle third of the crown. The developmental grooves were pronounced between the talon cusps and the palatal surface of the crown. The talons cusps were not interfering with the alignment of the mandibular anteriors during occlusion.
Both intra-oral and extra-oral examination of the patient did not reveal any abnormalities and any kind of genetic syndromes. The trait was not present in any of the family members and relatives and so the case was considered as an isolated developmental abnormality. The medical and dental histories were noncontributory.
A periapical radiograph revealed multiple V shaped radio-opaque cusp like structures without a pulpal extensions (Figure 2). On this basis a diagnosis of multiple Talons cusp was made. A conservative and preventive mode of
Figure 1: Pre-treatment photograph showing prominent talon cusp on laterals and mild talon cusp on centrals.

114 Indian Journal of Public Health Research & Development. April - June, 2012, Vol. 3, No. 2
treatment was planned. Study casts were prepared using the impressions and also for to check any interferences (Figure 3). A periodic reduction of the talon cusps was carried out at 4–6 week intervals, using a diamond bur in a high-speed water-cooled hand-piece. Following each grinding procedure, the exposed surface was treated with fluoride varnish as a desensitizing agent. In addition, the patient was scheduled for periodic dental examination and finally, the sealant was placed near the grooves to prevent any caries (Figure 4). The patient did not have any problem other than crowding of teeth and so was referred for orthodontic treatment.
DiscussionMitchell was the first to describe a talon cusp in 1892, Mellor and Ripa named the accessory cusp as ‘talon cusp’ because of its resemblance in shape to an eagle’s talon. To differentiate a talon cusp from an enlarged cingulum it has been suggested that a talon cusp must extend at least half the distance from the Cementoenamel Junction (CEJ) to the Incisal edge1.
Other names for this condition include dens evaginatus, interstitial cusp, tuberculated premolar, odontoma of the axial core type, evaginated odontoma, occlusal enamel pearl, occlusal anomalous tubercle and supernumerary cusp4. The prevalence of talon cusp is low, with estimates
ranging from less than 1%5 to approximately 8% of the population6. The anomaly is commonly unilateral, but one-fifth of the cases are bilateral in occurrence3. The association of talon cusp with syndromes includes Mohr syndrome, Sturge–Weber syndrome, Rubinstein–Taybi syndrome, Incontinentia Pigmenti Achromians and Ellis–van Creveld syndrome7.
Talon cusp has been classified by Hattab et al.3 into three basic types according to the size of the accessory cusp and its extent. According to this classification, the talon cusps described in this paper were classified as follows:
• The anomalous cusp on the maxillary lateralincisors bilaterally were prominently projected from the lingual aspect and extended from the cementoenamel junction to the incisal edge and categorized as a type 1 talon cusp.
• Theotheranomalousaccessorycusponthemaxillarycentral incisors extended half the distance from the cemento-enamel junction to the incisal edge and categorized as a type 2 semi-talon.
Small talon cusps (type 2 & 3) are usually asymptomatic and need no treatment. Large talon cusps (type 1) may cause clinical problems including occlusal interference, displacement of the affected tooth, irritation of the tongue during speech and mastication, carious lesion in the developmental grooves that delineate the cusp, pulpal necrosis, periapical pathosis, attrition of the opposing tooth and periodontal problems due to excessive occlusal forces3,8-11. The treatment of talon cusp involves careful clinical judgment and review of whether the cusp contains or is devoid of a pulp horn8. However, in general, the management depends on individual presentation and complications.
The prognosis of teeth with talon cusp depends on the timing of diagnosis. If it is diagnosed early, the accessory cusp may be progressively removed with polishing and the abraded area should be treated with fluoride varnish. At the last appointment, the reduced cusp should be covered with resin composite. This procedure can prevent premature contact and reduce the risk of caries12. The same procedure was followed in the present case and there was
Figure 2: Intra-oral periapical radiograph (IOPA) showing bilateral overlapping cusp like structures (talon cusps) on lateral incisors.
Figure 3: Photograph of diagnostic casts showing bilateral talons cusps on central and lateral incisors.
Figure 4: Post treatment photograph showing normal appearing centrals and laterals.

115Indian Journal of Public Health Research & Development. April - June, 2012, Vol. 3, No. 2
no caries and other endodontic or periodontal problems. To the best of our knowledge, English Literature reports or studies of bilateral talon cusps involving all incisors are very few. Little or no epidemiological information is available in this regard.
Summary and ConclusionThe talon cusp is a developmental anomaly characterized by the presence of an accessory cusp like structure projecting from the cingulum area of the maxillary or mandibular anterior teeth in both dentitions. Here we report a rare case of bilateral maxillary palatal talon cusp and its management is also discussed. The talon cusp can occur as an isolated finding or in association with many syndromes and other dental anomalies. Talon cusp is a not an innocuous defect, as it may provide a substantial challenge during diagnosis and treatment planning to clinician. Early diagnosis may minimize local problems such as caries, periodontal disease and malocclusion. The role of a pedodontist in managing such a case is utmost important because the minimal are the future complications, better is the prognosis. So it is essential to have precise diagnostic criteria and standardization of terminology for categorization of an accessory cusp as a talon cusp.
References1. McNamara T, Haeussler AM, Keane J. Facial talon cusps. Int J
Paediatr Dent. 1997;7:259-62.2. Tulunoglu Ö, Çankala DU, Özdemir RC. Talon’s cusp: report of
four unusual cases. J Indian Soc Pedod Prev Dent. 2007;3:52-5. 3. Hattab FN, Yassin OM, Al-Nimri KS. Talon cusp in permanent
dentition associated with other dental anomalies: review of literature and reports of seven cases. ASDC J Dent Child. 1996;63:368-76.
4. AI-Omari MAO, Hattab FN, Darwazeh AMG, Dummer PMH. Clinical problems associated with unusual cases of talon cusp. Int Endod J 1999;32:183-90.
5. Sedano HO, Carreon Freyre I, Garza de la Garza ML, Gomar Franco CM, Grimaldo Hernandez C, Hernandez Montoya ME et al. Clinical orodental abnormalities in Mexican children. Oral Surg Oral Med Oral Pathol. 1989;68:300-11.
6. Chawla HS, Tewari A, Gopalakrishnan NS. Talon cusp--a prevalence study. J Indian Soc Pedod Prev Dent. 1983;1:28-34.
7. Dash JK, Sahoo PK, Das SN. Talon cusp associated with other dental anomalies: a case report. Int J Paediatr Dent. 2004;14:295-300.
8. Mellor JK, Ripa LW. Talon cusp: a clinically significant anomaly. Oral Surg Oral Med Oral Pathol. 1970;29:225-8.
9. Mader CL. Talon cusp. J Am Dent Assoc. 1981;103:244-6.10. Davis PJ, Brook AH. The presentation of talon cusp: diagnosis,
clinical features, associations and possible aetiology. Br Dent J. 1986;160:84-8.
11. Hattab FN, Yassin OM, al-Nimri KS. Talon cusp--clinical significance and management: case reports. Quintessence Int. 1995;26:115-20.
12. Segura-Egea JJ, Jiménez-Rubio A, Velasco-Ortega E, Ríos-Santos JV. Talon cusp causing occlusal trauma and acute apical periodontitis: report of a case. Dent Traumatol. 2003;19:55-9.

116 Indian Journal of Public Health Research & Development. April - June, 2012, Vol. 3, No. 2
Synthetic drinks and ill health in childrenS.K. Manuprakash1, K.Varadarajshenoy2
1Assistant Professor of Pediatrics, Hassan Institute of Medical Sciences, Hassan, Karnataka 573201, 2Professor, Fr Muller’s Medical College, Mangalore, Karnataka
AbstractThe per capita consumption of carbonated soft drink has increased over the years especially among the pediatric population. This review attempts to give an insight of the impact of soft drinks on child’s health and suggests some alternative for a healthy life style. Various research studies have shown that children consuming soft drinks have developed various acute and chronic ill effects such as nutritional deficiency, obesity, dental diseases, bone pathologies & psychological illness. As rightly said “an ounce of prevention is better than a pound cure”, Government, parents, teachers, health professionals & mainly manufacturing companies should play a crucial role in solving the problems related to soft drink consumption.
Key WordsSynthetic drinks, carbonated drinks, obesity.
IntroductionProgressive globalization of the food supply chain and the increased consumption of soft drinks, snacks, fast foods form a significant part of daily life causing acute and chronic illness1,2.
Synthetic drinks are perceived as the “other” drinking problem in society in which the addicts are mostly kids. Intense marketing efforts by large soft drink manufacturers have ensured this addiction2.
This review gives an insight of the impact of soft drinks on human health & suggests alternatives for a healthy life style.
Consumption DataThe per capita consumption of all carbonated soft drinks in united states increased from 24 gallons per year in 1970 3 to 52 gallons per year in 2005 an increase of 117%. Another report from an Australian soft drink industry says that the average per capita consumption of soft drink was 110 liters in 2003. This amount equates to approximately 300ml of soft drink consumed per person per day4.
Reasons for elevated soft drink consumption:
1) Cultural shifts play a major role in changing food habits.
2) There is strong association of high television viewing rate & unhealthy food habits leading to obesity in adolescents2,4
3) Watching movies has been another major influence.4) Soft drinks being tasty & easily available, it is wrongly
considered to be a stress reliever.
Synthetic drink & its ingredients
Synthetic drink or soft drink is a non alcoholic beverage containing water & a flavoring agent.
Carbonated soft drinks were discovered by Europeans in 18th Century & later bubbly drinks were patented in US in 1810.
Synthetic drink components:
1. Sweeteners: It can be in the form of sugar, saccharin & aspartame. Though aspartame in small doses is said to be harmless it is one of the most controversial additives. The uncontrolled consumption of soft drinks containing aspartame leads to acute & chronic methanol toxicity in humans.
2. Aromatic Substances: The pleasant taste in the soft drinks is due to aromatic substances. They also provide better stability to the drink.
3. Carbonated water: This is supposed to make the drink more refreshing. Carbonation is done by dissolving carbon dioxide in water under pressure in chilled temperature just before the bottle is capped.
4. Acids: Citric acid, Phosphoric acid & Malic acid are most commonly used. Acidity in the drink balances the sweetness.
5. Food Colorants: Color makes the drink appetizing & attractive. Since many colorants are toxic, the usage of colorants is strictly restricted, as it can trigger asthma, hives & attention deficit hyperactive disorders in children.
6. Preservatives: Preservatives like natriumbenzoate & potassium sorbate increases the shelf life of the product. Sodium benzoate is used as a broad spectrum antimicrobial, inhibiting bacteria, molds & yeasts. However preservative like sulfur dioxide can trigger asthma, rashes, hyperactivity, fainting, shock &coma.
7. Antioxidants: Ascorbic acid prevents reactions that destroy aromatic substances in soft drinks.
8. Additives: Emulsifying agents, stabilizing agents &

117Indian Journal of Public Health Research & Development. April - June, 2012, Vol. 3, No. 2
thickening agents such as pectin, alginates & carraghen are also added to keep the drinks even bodied.
9. Caffeine: Caffeine can be addictive. It can stimulate the central nervous system & increase the heart rate. It can increase the excretion of calcium.
10. Undisclosed Ingredients: These are ethyl alcohol, sodium alginate, bromine in vegetable oil & Caffeine. Sodium alginate is hazardous during pregnancy.
Health hazards of soft drink consumption
Various research studies have shown that children consuming soft drinks have developed acute and chronic ill effects6.
1. Displacement of healthier foods from diet
A high level of soft drink consumption is associated with less intake of vitamins, minerals & dietary fiber7. Another nutritional survey has shown that soft drink consumption by adolescents has increased leading to decline in milk consumption by 10%,8 as a consequence of which there will be decreased intake of calcium, magnesium, phosphorus, vitamin A and protein, resulting in short & long term bone diseases.
2. Obesity:
The major dietary factors associated with developing childhood obesity include, increased consumption of soft drinks, fat, oils & sodium. The most frequently encountered barriers in the management of obesity include consumption of fast food & soft drinks9.
There is a significant association of soft drink consumption & obesity as shown by Ludwig.et al10 & James J et al11 in their studies. It was also shown that soft drink consumption has increased obesity by 57%10.
In a study by National heart, lung & blood institute, where in over 2000 girls were followed from ages 9-10 years till 18 -19 years of age, revealed that the average soda consumption increased almost 300% over 10years of study. This study concluded that, soda was the only beverage that was associated with increased obesity (BMI)25.
Crawford PB et al study has concluded that, out of 28 dietary factors thought to be associated with obesity in children, sweetened beverages was the only dietary factor that was consistently linked to over weight in children.
Theoretically, daily consumption of one can of sweetened soft drink (500 kJ ) over a period of 10 years could lead to a 50kg increase in weight, conversely by reducing daily intake of small quantity of energy or on increasing energy expenditure (energy gap), one may prevent unhealthy weight gain.
In children who increased their consumption of sugar sweetened drinks by one serving a day, their body mass index increased by 0.24kg/m2 & their odds of being obese significantly increased10.
3. Dental Health
Consumption of soft drinks in large quantity & increased frequency may cause damage to teeth in the form of enamel erosions & dental caries13.
Demineralization of dental enamel has increased in the recent past, due to larger usage of soft drinks, which eventually leads to calcium & phosphorus mobilization from the enamel, as a consequence of which collapse of the surface structures occurs. Another hypothesis is that, soft drinks may cause damage to teeth through acidogenicity & cariogenicity.
Dental erosion is the situation of a chronic loss of dental hard tissue that is chemically etched away from the tooth surface by acid & chelating agents without bacterial involvement. Compared with caries, dental erosion seems to have much stronger relationship with soft drinks16.
It is found that over time, exposing dental enamel to carbonated beverage weakens & permanently destroys enamel17.
According to Australian dental association, damage to tooth enamel by acid erosion was reported in 25-45% of those surveyed.18 Sugared versions of soft drinks proved to be more erosive than their diet counterparts19.
The low PH & high acidity leads to erosion of enamel surface. The sugars in drinks are metabolized by plaque microorganisms to generate organic acids that adds to process of demineralization, leading to dental caries14.
A study at Iowa found that intake of regular soda pop was the strongest predictor of the severity of caries6. There is also a strong association between the frequency of in between-meal consumption soda pop & caries15.
4. Bone health
Commonly encountered problems following prolonged consumption of soft drinks are fractured bone, low bone density, osteoporosis & hypocalcaemia.
Several studies have shown that common bone problems occur due to displacement of milk from the diet & also due to direct effects of soft drinks. For example, caffeine causes loss of calcium in the urine20 leading to osteoporosis. In the market, available 375ml of soft drink contain 40-50 mg of caffeine.
Studies have also shown that, there is strong association between soft drink & kidney stones21.
5. Psychological & behavioral illness
Soft drinks containing caffeine can cause CNS disturbances like sleep disturbance, bed wetting, anxiety, headache, fatigue, decreased alertness, depressed mood & irritability22.
6. Other long term implications on health
Several studies have shown that consuming soft drinks for prolonged period can cause obesity, hypertension, impaired glucose tolerance & hypercholesterolemia.

118 Indian Journal of Public Health Research & Development. April - June, 2012, Vol. 3, No. 2
Presence of Benzene 23 in soft drink can be carcinogenic.
Framingham heart study has shown that, those who drank one or more sodas per day were 50% more likely to develop metabolic syndrome (a combination of risk factors, such as high waist circumference, high blood pressure, impaired fasting glucose or diabetes, that strongly predicts the likelihood of developing cardiovascular disease) than those who drank less than one soda per week26.
Healthy alternatives
1. Coconut water: Highly alkaline & easy to digest. It has all the properties of mother’s milk.
2. Sugarcane juice & melon drinks- These are rich in natural minerals.
3. Lime juice & Butter milk4. Dates.
Strategies to reduce soft drink consumption1. Main goals should be to
a) Reduce intake of soft drink consumption by young children.
b) Reduce frequency & quantity of soft drink consumption.
c) Replace soft drinks with naturally available drinks.
d) Replace sweetened soft drinks with milk based drinks.
2) Recommendation for public & others• Parentsshouldbecarefulwhilechoosingabeverage.
It is important that “parents serve as role models”.• Parents&teachersshouldshowmoreconcernabout
the overall health of children & the foods consumed in the school.
• Pediatricians, dentists, health care professionals&dieticians should promote & support a healthy school environment.
• Schools should hold a thorough discussion beforemaking any decision such as, for installing a vending machine in school to dispense a food or drink.
• Strict policies regarding prohibition of the sale ofsoft drinks & unhealthy food stuffs inside the school campus.
• Ban on advertisements of beverages in the schoolcampus.
• Promoting healthy food stuffs in the public places,where people gather in large numbers.
• Manufacturing companies must acknowledge theproblems of rising rates of obese children & work within their limits in influencing children from taking soft drinks.
• Government should sponsor further research toexplore the ill effects of soft drinks.
• Additional taxes on each bottle of soft drinks tocurtail consumption.
ConclusionSeveral studies have proved beyond doubt that synthetic drink is no more a safe drink. “An ounce of prevention is better than a pound cure”. Government, parents, teachers, health professionals & mainly manufacturing companies should play a crucial role in solving the problems related to soft drink consumption.
References1. WHO: Risks to oral health and intervention: Diet & nutrition-
WHO [www.who.int]2. Anne Nordrehaug Astros, Joyce Rose Masalu: Oral health
behavior patterns among Tanzanian university students: a repeat cross-sectional survey: BMC Oral Health. 2001; 1(1):2.
3. Putnam j, Allshouse j. U.S. per capita food supply trends. Food review. 1998; 2-11.
4. Australian Beverages Council: “Carbonated Soft Drinks.” Retrieved 5th September, 2007, Pg10079.
5. Martin-Villa MC, Vidal-Valverde C, and Rojas-Hidalgo E: Soluble sugars in soft drinks: Am J Clin Nutr. 1981 Oct; 34(10):2151-3.
6. Michael F Jacobson, Liquid Candy: How Soft Drinks are Harming Americans’ Health: Centre for Science in the Public Interest, Washington DC 1998; 2nd Ed. 2005: 1-28.
7. Harnack L, Stang J and Story M: Soft drink consumption among US children and adolescents: nutritional consequences. J Am Diet Assoc 99(4): 436–441.
8. Cook T, Rutishauser I and Seelig M: Comparable data on food and nutrient intake and physical measurements from the 1983, 1985 and 1995 national nutrition surveys: Canberra, Australian Food and Nutrition Monitoring Unit.
9. Perrin, E.M., Flower, K.B., Garret, J. and Am merman, A.S. 2005. Preventing and treating obesity: Pediatricians’ self-efficacy, barriers, resources, and advocacy. Ambulatory Pediatrics, 5 (3):150-156.
10. Ludwig DS, Peterson KE, Gortmaker SL. Relation between consumption of sugar-sweetened drinks and childhood obesity: a prospective, observational analysis. Lancet 2001; 357:505-8.
11. James J, Thomas P, Cavan D, Kerr D. Preventing childhood obesity by reducing consumption of carbonated drinks: cluster randomized controlled d trial:BMJ 2004;328:1237-41
12. Butte NF and Ellis KJ (2003). “Comment on ‘Obesity and the Environment: Where Do we go from Here?’ ” Science 301(5633): 598b.
13. Jandt, K.D. 2006. Probing the future in functional soft drinks on nanometer scale towards tooth friendly soft drinks. Trends in Food Science and Technology, 17 (5): 263-271.
14. Sorvari, R. and Rytoma, I. 1991. Drinks and dental health. Proceedings of the Finnish Dental Society, 87: 621-631.
15. AI Ismail, BA Burt, and SA Eklund: The carcinogenicity of soft drinks in the United States: J Am Dent Assoc, Vol. 109, No 2, 241-245
16. Ran Cheng, Hui Yang, Mei-yang Shao, Tao HU, Xue-dong: Dental erosion and severe tooth decay related to soft drinks: a case report and literature review: Journal of Zhejiang University science B; 2009 10(5):395-399
17. Soda Attack: Soft Drinks, Especially Non-colas and Iced Tea, Hurt Hard Enamel: Oral Health Resources: General Dentistry July/August 2004 issue- www.agd.org
18. Australian dental association: Drinks and Dental Decay: ADA: Aug 2005
19. Jain P, Nihill P, Sobkowski J, Agustin MZ: Commercial soft drinks: pH and in vitro dissolution of enamel: Gen Dent. 2007 Mar-Apr;55(2):150-4; 155, 167-8

119Indian Journal of Public Health Research & Development. April - June, 2012, Vol. 3, No. 2
20. Kynast-Gales SA and Massey LK (1994). “Effect of caffeine on circadian excretion of urinary calcium and magnesium.” J Am Coll Nutr 13(5): 467–472.
21. Shuster, J., Jenkins, A., Logan, C., Barnett, T., Riehle, R., Zackson, D., Wolf, H., Dale, R., Daley, M., Malik, I. and Schnarch, S. 1992. Soft drink consumption and urinary stone recurrence: A randomized prevention trial. Journal of Clinical Epidemiology, 45 (8): 911-916.
22. Juliano. LM and Griffiths RR (2004). “A critical review of caffeine withdrawal: Empirical validation of symptoms and signs, incidence, severity, and associated Features.” Psychopharmacology 176(1): 1–29.
23. Garnet LK and Lawrence GD (1993). “Benzene production from decarboxylation of benzoic acid in the presence of ascorbic acid and a transition-metal catalyst.” J Agric Food Chem. 41(5): 693–695.
24. Vereecken C.A., Todd, J., Robert, C., Mulvihill.C and Maes, L. 2006. Television viewing behavior and associations with food habits indifferent countries. Public Health Nutrition, 9 (2):244-250.
25. Striegel- moore RH, Thomson D, Affenito SG, Franko DL, Obarzanek E, Barton BA, Schreiber GB, Daniels SR, Schmidt M< Crawford PB. Correlates of beverage Intake in adolescent girls: the national heart, lung, & blood Institute growth & health study. J. pediatric. 2006; 148(2): 183-187.
26. Dhingra R, Sullivan L, Jacques PF, Wang TJ, Fox CS, Meigs JB, D’ Agostino RB, Gaziano JM, Vasan RS. Soft drink consumption & risk of developing cardio metabolic risk factors & the metabolic syndrome in middle-aged adults in the community. Circulation. 2007; 116(5):480-488.

120 Indian Journal of Public Health Research & Development. April - June, 2012, Vol. 3, No. 2
Assessment of knowledge & practices among teachers regarding school health programmeS.R.Nigudgi1, Venkatesh M Patil2, J V Pattankar3, Shrinivasreddy B4, Vijayanath V5
1Associate Professor, Dept. of Community Medicine, M R Medical College, Gulbarga, Karnataka, 2Associate Professor, Department of Pharmacology, Navodaya Medical College, Raichur, Karnataka, 3Professor, Dept. of Community Medicine, M R Medical College, Gulbarga, Karnataka, 4Biostatistician, Dept. of Community Medicine, M R Medical College, Gulbarga, Karnataka, 5Associate Professor, Department of Forensic Medicine & Toxicology, S.S.Institute of Medical Sciences & Research Centre, Davangere, Karnataka
Abstract
ObjectiveTo study the knowledge & practice among Teachers regarding school health programme.
Study DesignCross sectional study.
Key WordsMinor ailments, Immunization, sex education, Nutrition.
Material MethodThe study was carried out in 8 higher primary schools in Gulbarga city, by systematic random sampling technique the schools were selected & 100 Teachers were selected for study. The pre tested proformas were given to all 100 Teachers.
Results100 Teachers selected for our study comprised 39 males & 61 females. Weighted average score system was used to assess the knowledge of teacher regarding school health. Mean Knowledge of male Teachers was 20.7±7.14 and female Teachers 23.77±5.18 which was statistically significant. 82 Teachers were against giving sex education in school, out of which 79% of male Teachers & 84% female Teachers which is statistically insignificant.
ConclusionAttitude of teacher is one important determinant of state of many health topics.
IntrodutionEvery child should be taught early in his life that to preserve his own life & his own health and the lives and health of others is one of his most important and constantly abiding duties. The responsibility of this lies in the hands of Parents, Teachers, health administrators and the community1.
A systematically planned & implemented health education program, modification is essential to achieve the goals more objectively, this will help to reduce the increasing burden on existing curative services2.
Material Methodthe present study was carried out in 37 government higher primary schools, i.e. 5th, 6th & 7th standard in Gulbarga city having 222 teachers3. All the schools are arranged in alphabetic order in those schools all teachers are arranged in alphabetic orders, to select a sample of 100 teachers from 222 teachers using systematic random sampling
i.e. sample interval = population size/sample size = 222/100 = 2.22 ≈ 2
Every 2nd teacher was included in the study, one random number was selected between 2numbers, i.e. 2, so the teachers 2nd, 4th. 6th & so on included in the study.
Results & DiscussionHealth promotion & health education being the most important component of school health services for which teachers are the ideal role models to impart them. They can shape & instill good habits by various methods such as role play, during games & physical education as well as by way of story telling thus teachers play a very important role especially where there is shortage of health workers in maintaining the positive health of a child, who are future citizens of the country4.
Out of the 100 teachers under study 39 were males and 61 were females. Maximum 38 teachers were in the age group of 41-50 years and minimum i.e. 11 teachers were in the age group of 21-30 years.
Table 1 shows Knowledge assessment of the teachers regarding school health as a whole was done by weighted average score, the mean knowledge score of male teachers was 20.7±7.14 and female teacher was 23.77±5.18, the difference in mean score between male & female teacher was statistically significant, i.e. female teachers have good knowledge regarding health and disease as compared to male teachers,
Table 2 shows knowledge score regarding school health

121Indian Journal of Public Health Research & Development. April - June, 2012, Vol. 3, No. 2
services, which was maximum in the group of teachers with S.S.L.C qualification with training i.e. 23.90±4.88 and minimum in the group of post graduate with training i.e. 18.16 ± 4.26,which is statistically significant.
Table 3 shows there is no statistical significance in knowledge in relation to the length of service of the teachers.
Table 4 shows nearly 40% of the teachers don’t have the knowledge regarding one or other six killer diseases of the childhood which is statistically found highly significant.
Table 5 shows that out of 100 teachers 72 teachers generally knew about respiratory diseases, 66 about dental diseases, 61 about communicable diseases 48 about nutritional diseases 47 about water born diseases and 16 knew about diseases caused by the bacteria’s.
Table 6 shows nutritional importance of non-vegetarian diet was not known among 37 males and 61 female teachers, but most of the male & female teachers knew about the nutritional importance of the vegetarian diet.
Table 7 our study shows 82 teachers were against giving sex education,79% of male teachers and 84% of female teachers were against giving sex education, which is statistically insignificant.
ConclusionThe attitude of teachers is one of the most important determinants of state of many health topics it is only essential to find out what teachers know but also to explore their attitude and feeling towards any health education programme. Successful introduction and long term sustainability of school health program is heavily dependent on the support provided by the school teachers.
AcknowledgementWe express our gratitude to director of department of education Gulbarga for having given permission to conduct the study, and to the Principals and Teachers.
Table 1: Distribution of teacher’s knowledge regarding school health according to their age & sex
Age & Sex No Knowledge scoreMean ± SD
Male/Female Male Female Male Female
21-30 01 10 16±00 22.23±4.20
31-40 12 13 19±9.16 24.6±5.44
41-50 16 22 23.13±6.33 23.5±4.59
51 & above 10 16 18.72±6.29 24.26±6.39
Total 39 61 20.7±7.14 23.77±5.18
Grand Total 100 22.41±6.30
Male Vs Female t98 d.f =2.37 P<0.05 Significant
Table 2: Distribution of knowledge score according education qualification of Teachers
Qualification With training
No. Knowledge score Mean ± SD
Group 1 S.S.L.C 66 23.90±4.88
Group 2 P.U.C 09 20.22±4.49
Group 3 Degree 19 20.73±4.55
Group 4 Post Graduate 06 18.16±4.26
Total 100 22.41±6.30
Group1 Vs Group 2 t73 d.f=2.28 P<0.05 significantGroup1 Vs Group 3 t83 d.f=2.64 P<0.01 significantGroup1 Vs Group 4 t70 d.f=3.13 P<0.001 highly significantGroup2 Vs Group 3 t26 d.f=0.28 P>0.05 InsignificantGroup2 Vs Group 4 t13 d.f=0.89 P>0.05 InsignificantGroup3 Vs Group 4 t23 d.f=1.27 P>0.05 Insignificant
Table 3: Distribution of knowledge regarding school health according to their service
Service No. Knowledge scoreMean ± SD
Group 1 0-10 19 23.21±5.38
Group 2 11-20 42 22.14±6.59
Group 3 21-30 30 22.36±6.26
Group 4 31-40 09 22.89±7.2
Total 100 22.41±6.30
Group1 Vs Group 2 t59 d.f=0.67 P>0.05 InsignificantGroup1 Vs Group 3 t47 d.f=0.50 P>0.05 InsignificantGroup1 Vs Group 4 t26 d.f=0.11 P>0.05 InsignificantGroup2 Vs Group 3 t70 d.f=0.14 P>0.05 InsignificantGroup2 Vs Group 4 t49 d.f=0.28 P>0.05 InsignificantGroup3 Vs Group 4 t37 d.f=0.20 P>0.05 Insignificant
Table 4: Distribution of Teachers according to their knowledge about six killer diseases
Six killer Diseases Know Don’t know Total
No. % No. % No. %
Tuberculosis 53 53 47 47 100 100
Diphtheria 61 61 39 39 100 100
Pertusis 61 61 39 39 100 100
Tetanus 61 61 39 39 100 100
Polio Myelitis 51 51 49 49 100 100
Measles 32 32 68 68 100 100
χ²5 d.f=25.43 P<0.001 highly significant
Table 5: Distribution of Teachers according to their knowledge regarding common diseases
Common Diseases yes No Total
No. % No. % No. %
Disease due to Bacteria 16 16 84 84 100 100
Communicable Diseases 61 61 39 39 100 100
Respiratory Diseases 72 72 28 28 100 100
Nutritional disorders 48 48 52 52 100 100
Water borne diseases 47 47 53 53 100 100
Dental diseases 66 66 34 34 100 100

122 Indian Journal of Public Health Research & Development. April - June, 2012, Vol. 3, No. 2
Table 7: Opinion of Teachers regarding sex education for children
Sex education to be given
Male female Total
No. % No. % No. %
Yes 08 21 10 16 18 18
No 31 79 51 84 82 82
Total 39 100 61 100 100 100
χ1.df=3.73 P>0.05 Insignificant
References1. Andra pradesh School health project: An Appraisal report on
base line survey:19912. Andra pradesh School health project: Report of impact
evaluation of teachers training :19963. Facts & figures of Gulbarga district: District statistical records
office Gulbarga, Karnataka,1998.4. Jessis Helen Haag, “Textbook on school health programme”,
1968
Table 6: Distribution of Teachers according to their knowledge regarding nutritive foods for children
Advice nutritive food for children Male Female Total
Yes % Don’t Know % Yes % Don’t Know % No. %
Milk 16 16 23 23 33 33 28 28 100 100
Fruits 19 19 20 20 32 32 29 29 100 100
Fresh green leafy vegetables(carrot) 19 19 20 20 29 29 32 32 100 100
Egg 17 17 22 22 26 26 35 35 100 100
Meat/fish 02 02 37 37 00 00 61 61 100 100

123Indian Journal of Public Health Research & Development. April - June, 2012, Vol. 3, No. 2
Correlation of Apoptotic Index and Bcl-2 protein with other histological prognostic factors in prostate carcinomaMalik P Nisha1, Sharma V.K2, Gupta Ankush3
1 Lecturer Pathology, LLRM Medical College Meerut, 2Professor, Department of Pathology, L.L.R.M Medical College Meerut, 3Junior Resident, Department of Surgery, S. N. Medical College, Agra
AbstractThis study was conducted to evaluate the correlation of Apoptotic Index and Bcl-2 protein expression immuno-histochemically in Prostate Cancers with known histological prognostic factors in prostate Carcinoma including Gleason’s score and Angiogenic index (AgCD-31). The study group consisted of 35 cases of prostate adenocarcinoma obtained from the patients admitted in Dept. of Surgery and from cancer registry of Department of SN medical collage Agra. The specimens were subjected to hematoxylin and eosin staining, bcl-2 immuno histochemical staining, Apoptotic index calculation, Gleason’s grading. Univariate analysis showed no correlation between apoptotic index (A.I.) & Gleason’s grade {mean A.I. 2.23±1.72 (intermediate grade) and 1±0.85 (high grade); p>0.05}, negative correlation between apoptotic index and angiogenic index {mean angiogenic index =109.82 (intermediate grade) & 247.35 (high grade); p<0.05}.Bcl-2 showed a positive correlation with Gleason’s grade (intermediate grade 7.69% & high grade 21.82%), but Bcl-2 positive immunoreaction was not correlated with apoptotic index (p>0.05). Besides grading, quantification of Bcl-2 antiapoptotic protein and angiogenic index can be of value to predict prognosis of prostate carcinoma. Bcl-2 immunostain can be used on TURP specimens where often grading may not be representative of the entire specimen.
KeywordsApoptotic Index, bcl-2, angiogenic index, prostate cancer.
IntroductionThe incidence of prostate adenocarcinoma has risen dramatically in the past decade, probably owing to early detection, by employing digital rectal examination, serum Prostate Specific Antigen (PSA) assay and transrectal ultrasonography. Latest estimates show that it has now become the most common form of cancer and second leading cause of cancer death in men1. This change predominantly represents an increase in the number of cancers diagnosed rather than a real increase in the number of cancers in the population. Early detection has also resulted in increased life expectancy2,3.
Molecular prognostic markers in carcinoma prostate
are not a new concept. As we know three main factors are required for tumor establishment- 1) Doubling time of tumor cells, 2) Fraction of tumor cells that are in replicative pool and 3) Rate at which cells are shed and lost in the growing lesion. One of the important pathways is inhibition of apoptosis or programmed cell death which may be involved in the pathogenesis of cancer by prolonging cell life and facilitating retention of deleterious mutation. Among the most important regulators of apoptosis and programmed cell death are that of B- cell lymphoma proteins(Bcl-2) and its related proteins. The protein encoded by this gene is a potent blocker of apoptosis. Complex interaction among the three subgroups within the Bcl-2 family controls the signaling events of apoptosis4. Over-expression of the Bcl-2 protein occurs in a wide variety of human cancers and presumably contributes to neoplastic expansion by prolonging cell survival. Bcl-2 proteins at endoplasmic reticulum also regulate autophagy, a survival pathway that limits metabolic stress, genomic instability and tumourigenesis5.
In normal prostate Bcl-2 protein is present in the androgen independent basal cells that line the basement membrane of the prostate gland but not in the differentiated luminal secretory cells that are androgen dependent and undergo apoptosis when deprived of testosterone. In our study we evaluated the correlation of apoptotic index and Bcl-2 protein expression immuno-histocamically in prostate carcinoma with known histological prognostic factors like Gleason’s grading, scoring and angiogenic index.
Material & MethodsThirty five cases of prostate adenocarcinoma were randomly selected among the Patients registered in Department of Surgery and Pathology of S.N. Medical College, Agra. Random sampling of 35 cases consisted of 23 cases of TURP, 11 cases of Radical prostatectomy and one needle biopsy specimen (table-1). Haematoxylin- eosin stained slides from each specimen were reviewed and the Gleason’s grade was assigned. Tumours were classified as high grade when the combined Gleason’s score was _8 and intermediate when score was between 5 and 7. Apoptotic index was calculated in histological tumor material. Apoptotic index was calculated by measuring apoptotic cells per 1000 tumor cells per 10high

124 Indian Journal of Public Health Research & Development. April - June, 2012, Vol. 3, No. 2
power fields6. Immuno-histochemical staining for Bcl-2 and CD-31 was performed by means of a modified labeled avidin-biotin technique, using monoclonal antibody and staining kit ( DAKO LSAB2 System, HRP).The percentage of immunopositive tumour cells were scored as follows5: 1=0 to <1%;2=1 to 25%; 3=26 to 50%; 4=51 to 75% and 5=76 to 100%. Immuno-staining intensity was rated as follows: 0(none); 1(weak); 2(moderate) and 3(intense). Specimens were considered immunopositive when >1% of the tumour cells had clear evidence of staining.Micro vessels marked with anti-CD31 in highly vascular tumour areas were counted in four adjacent high power fields. Micro vessel density was calculated per square millimeter of tumour tissue.
Statistical analysis: We categorized our sample (total specimens=35) into two groups: intermediate (13) and high grade cases (22). There were no low grade adenocarcinomas (Gleason score _ 4) in any of our specimens. After calculating apoptotic index and angiogenic index and evaluating Bcl-2, the statistical analysis was performed to draw the significance, if any,
amongst various grades of prostate adenocarcinoma. Chi-sq. test was applied to find out any correlation between apoptotic index and Bcl-2. By using student’s‘t’ test correlation was observed between the angiogenic index and apoptotic index.
ResultsThe study group consisted of 35 specimens of prostate adenocarcinoma which were categorized according to Gleason grading system. Apoptotic index was calculated using light microscopy on H&E stained sections. No statistically significant correlation was found between Gleason’s grade and apoptotic index (p>0.05): (Table-2) :(Bar diagram). Bcl-2 immunostaining demonstrated highly variable expression in the malignant epithelium (Fig-1.). On the average, 22.86% of cases were Bcl-2 positive. Bcl-2 positive percentage increased with increasing Gleason’s grade. Strong expression of Bcl-2 protein was related to high tumour category, metastatic disease, poor histological differentiation, weak infiltration of the tumour by lymphocytes. Statistically Bcl-2 and apoptotic index were not found to be significantly correlated (p=0.08). There were cases that showed apoptotic bodies and were Bcl-2 positive (Fig-2). These cases were also subjected to CD-31 staining to find out angiogenic index. It was observed that angiogenic index increased with increasing grade(Fig-3). It showed statistically significant correlation between angiogenic index and Gleason’s grade (p<0.05).
Fig. 1: Intense Bcl-2 positivity in Gleason Grade –III+IV (score-7) Adenocarcinoma (10x40).
Fig. 2: Apoptosis in Gleason Grade –III Adenocarcinoma (H& E 10 X 40)
Fig. 3: Angiogenesis in Gleason Grade 3 Adenocarcinoma (CD 31 immunostain x 40)
Bar- diagram --- Showing A. I, Bcl-2 and angiogenic activity in intermediate and high grade prostatic carcinoma.
Table 1: Case distribution of randomly sampled prostatic adenocarcinoma.
S. NO CASE OBTAINED NUMBER PERCENTAGE
1 TRUP 23 65.71
2 RADICAL PROSTATECTOMY 11 31.43
3 NEEDLE BIOPSY 1 2.86
TOTAL 35 100.00

125Indian Journal of Public Health Research & Development. April - June, 2012, Vol. 3, No. 2
DiscussionMost prostate cancers, at the time of clinical diagnosis, present as mixture of androgen dependent and androgen independent cells. A vast majority of prostate cancers respond initially to androgen ablation since the population of androgen dependent cells undergoes rapid apoptosis upon androgen withdrawal. However, androgen ablation rarely cures patients, most of whom will experience recurrence due to takeover of the tumour mass by androgen independent tumour cells as well as emergence of apoptosis- resistant clones as a result of further genetic alterations such as Bcl-2 amplification. Proteins coded by the Bcl-2 family of genes are important regulators of programmed cell death and apoptosis8. Bcl-2 is a potent antiapototic protein which help in development of neoplasm, by maintaining the longevity of cells via suppressing their programmed death. Its expression is more common in tumour with invasive behavior, high proliferation rate and abnormal cell differentiation9. We observed a significant correlation in the Bcl-2 protein expression between the different tumour grades (Table-2). The expression of Bcl-2 family in prostate cancer (gene bax, bcl-xl and mcl-1) positively correlates with Gleason’s grade7. Our results are in full agreement with those of Hering et al.10, who found positive correlation in frequency of Bcl-2 positive expression in prostate adenocarcinoma with low and high Gleason score. They concluded that over expression of Bcl-2 is significantly higher in patients with an initially elevated Gleason score8,9,10. The Bcl-2 expression probably exerts a role in the longevity of the cells submitted to hormonal therapy11. Khor et al(2007)12 observed that combination of negative Bcl-2 / normal Bax expression seemed more significantly related to reduced biochemical or any other treatment failure. In a previous analysis in prostate cancer it was suggested that the expression of Bcl-2 seems to be related to androgen independence, while in breast cancer expression of Bcl-2 is sex steroid dependent13. Accordingly, the results suggest that, along with increasing genetic instability (i.e. increased G-grade); the abnormal expression of Bcl-2 protein becomes more common in prostatic cancer. We observed that Bcl-2 positive immunoreaction did not correlate with apoptotic index (p=0.08). The relationship between inhibited apoptosis and expression of Bcl-2 protein is not clear cut; since Bcl-2 positive tumour also showed apoptosis. However, in these tumours the apoptosis rate may be reduced in relation to mitosis rate and other regulatory mechanisms, such as androgen and other growth factors may be involved. Expression of Bcl-2 protein is not a critical factor that determines the degree of apoptosis14.
In our study, we quantified apoptosis by calculating apoptotic index (A.I.) but did not find any correlation of A.I. with Gleason’s grade (p >0.05). Findings of apoptotic index in prostate cancer were in accordance with those of Amirghofran et al.15, who did not observe any correlation between apoptosis and different grades of carcinoma. They found a significant correlation between bax expression and stage of carcinoma, but not with apoptotic index, suggesting the presence of non functional bax protein or the role of other proapoptotic molecules in oncogenesis. Similarly Brown et al (1996)16 found that the pathologic stage did not correlate with cell proliferation, apoptosis or overall daily growth. Their study concluded that cell proliferation and apoptosis do not correlate with pathological stage in clinically organ confined cancer. Similarly Matushima et al. (1998)17 showed A.I. does not correlate with Gleason score nor was there any significant correlation between AI and pathologic stage. Tu et al. (1996)18 found that localized prostate cancer cells exhibited a relatively low rate of apoptosis, which was significantly lower than the apoptotic index of normal prostate glandular epithelial cells. Metastatic prostate tumor cells, however, exhibited a significantly higher apoptotic index compared with localized prostate cancer cells.
In our study we observed that angiogenic index increases with Gleason’s grade and was inversely related to apoptotic index (p<.05) Spontaneous apoptosis is related inversely to angiogenesis and positively related to proliferative activity. Quantitative micro vessel density has been shown to provide important staging and prognostic information in prostatic carcinoma. Correlation between angiogenic index and apoptotic index has been shown to be altered significantly by androgen ablation17. The increase in micro vessels from low to high grade was in accordance with the finding of Bettencourt et al.19. They found that micro vessel density count in the tumour are significantly increased with increasing Gleason’s sum and nuclear grade but did not increase significantly in adjacent benign prostate.
Thus beside grading, scoring, lymphovascular invasion, perineural invasion; quantification of bcl-2 antiapoptotic protein and angiogenic index can be of value to predict prognosis of prostate carcinoma. Bcl-2 immunostain can be used on TURP specimens where often grading and scoring may not be what is given, as radical prostatectomy is not done. Similar large scale studies are required to derive a cut-off value of bcl-2 immuno positivity which may help in predicting progression of patients and their better management. It is also seen that high Bcl-2 positivity is present at the spreading edge of
Table 2: Correlation of Gleason grade with apoptotic index (A.I.), Bcl2-immunopositive cases and angiogenic index (Ag CD-31).
S.No Gleason’s grade Cases Bcl2 positive% AgCD311 Intermediate grade (5-7) 13 0-6(2.23±1.72) 1(7.69) 109.822 High grade (8-10) 22 0-3(1.00±0.85) 7(21.82) 247.35
TOTAL 35 8(22.86) 357.17

126 Indian Journal of Public Health Research & Development. April - June, 2012, Vol. 3, No. 2
the tumour. The reason of this interesting finding could be decreased apoptosis at the spreading edge ensuring survival of cells to achieve invasiveness or it could be that malignant neoplasm has different cell kinetics in different areas according to survival/invasive need.
Of the many new molecular prognostic markers being evaluated in carcinoma prostate Bcl-2 and angiogenic index appear to have promise. There is an increase in Bcl-2 positive percentage with increasing Gleason’s grade and a significant inverse correlation (p<0.05) exists between angiogenic index and apoptotic index. These biomarkers appear useful in Radical Prostatectomy as well as TURP (Trans urethral resection of prostate) specimens.
References1. Kumar V, Cotran SR, and Robbins SL: Robbin’s Basic Pathology,
7th edn. Philadelphia, Elsevier, 2003, pp 667-669.2. Babaian RJ, Mettlin C, Kane R et al.: The relationship of
prostate-specific antigen to digital rectal examination and transrectal ultrasonography. Findings of the American Cancer Society National Prostate Cancer Detection Project. Cancer 1992; 69(5):1195-2000,
3. Cupp MR and Oesterlin JE: Prostate-specific antigen, digital rectal examination, and transrectal ultrasonography: their roles in diagnosing early prostate cancer. Mayo Clin Proc 1993; 68(3):297-306,
4. szegezdi E,Macdonald DC, Nichonghaile T et.al.:Bcl-2 family on guard at the ER. American J physiolcell physiol 2009; 296(5):c941-53.
5. Heath-Engel HM, ChangNC, ShoreGC: The endoplasmic reticulum in apoptosis and autophagy : role of the Bcl-2 protein family. Oncogene 2008; 27(50):6419-33.
6. Soini Y, Virkajarvi N, Lehto VP et al.: Hepatocellular carcinomas with a high proliferation index and a low degree of apoptosis and necrosis are associated with a shortened survival. Br. J Cancer 1996; 73: 1025-1030,
7. Krajewska M, Krajewski S et al.: Immuno histochemical analysis of bcl-2 bax, bcl and mcl-1 expression in prostate cancers. Am J Pathol 1996; 148: 1567-76,
8. Tanji N and Yokoyama M: Apoptosis in prostate adenocarcinoma; a study of relationship to ki-67 and bcl-2 protein expression. Anticancer Res 1998; 18(28): 1111-6,
9. McDonnel TJ, Troncoso P, Brisbay SM et al.: Expression of proto-oncogene bcl-2 in the prostate and its association with emergence of androgen independent prostate cancer. Cancer Res 1992; 52: 6940-6944,
10. Hering O, Lipay M, Srougi M et al.: Comparison of positivity frequency of bcl-2 expression in prostate adenocarcinoma with low and high Gleason Score. Sao Paulo Med J 2001; 119(4):138-41,
11. T. Suji M, Y. Murakami, H. Kanayama et al.: Immuno histochemical analysis of ki – 67 antigen and bcl-2 protein expression in prostate cancer: effect of neoadjuvant hormonal therapy. Br J of Urol 1998; 81: 116-121,
12. Khor LY, Moughan J,AL-saleem t, et.al: Bcl-2 and Bax expression predict prostate cancer outcome in man treated with androgen deprivation and radiotherapy on radiation therapy oncology group protocol 92-02. Clinical cancer research 2007; 13(12): 3585-90.
13. Lipponen P and Vesalainen S: Expression of the apoptosis suppressing protein bcl-2 in prostatic adenocarcinoma in related to tumor malignancy. The Prostate 1997; 32: 9-15,
14. Tanji N and Yokoyama M: Apoptosis in prostate adenocarcinoma; a study of relationship to ki-67 and bcl-2 protein expression. Anticancer Res 1998; 18 (28): 1111-6,
15. Amirghofran Z, Monabati A and Gholijani N: Apoptosis in prostate cancer: Bax correlation with stage. Int J Urol 2005; 12 (4): 340-345,
16. Brown C and Sauvageot J: Cell proliferation and apoptosis in prostate cancer- correlation with pathologic stage? Mod Pathol 1996; 9(3): 205-9,
17. Matsuhima H, Goto T, Kawabe K et al.: Correlation between proliferation, apoptosis and angiogenesis in prostate carcinoma and their relation to androgen ablation. Cancer 1999; 85(8):1822-27,
18. Tu H and Jacobs SC: Incidence of apoptosis and cell proliferation in prostate cancer relationship with TGF- beta 1 and bcl-2 expression. Int J Cancer1996; 69(5): 357-63,
19. Bettencourt MC, Bauer JJ, Sesterhenn IA et al.: CD34 immuno histochemical assessment of angiogenesis as a prognostic marker for prostate cancer recurrence after radical prostatectomy. J Urol 1998; 160(2):459-65.

127Indian Journal of Public Health Research & Development. April - June, 2012, Vol. 3, No. 2
Comparative cytomorphological profile of paediatric and adult lymphadenopathy with emphasis on smear characteristics in tuberculous lymphadenitisParul Singhal1, Sanjay Gupta2
1Assistant Professor, Pathology Department, Santosh Medical College, Ghaziabad, 2Scientist E, Division of Cytopathology, Institute of Cytology & Preventive Oncology (ICMR), New Delhi
Abstract
Aims1. To compare the cytological spectrum of pediatric
and adult lymphadenopathy.2. To analyze the differences between and
cytomorphological appearances of the aspirates from tuberculous lymph nodes in the two age groups.
Material and MethodsFine needle aspirate (FNA) smears from 500 consecutive patients with peripheral lymphadenopathy, each in paediatric (≤ 14 years) and adult (> 14 years) age groups, were retrospectively analyzed. Smear patterns in tuberculous lymphadenitis were studied in detail. The smears were air dried and stained by May Grunwald Giemsa (MGG) stain. Ziehl Neilson (ZN) staining to demonstrate acid fast bacilli (AFB) was performed where necessary.
ObservationsThe most frequent diagnosis on FNA was tuberculosis in both age groups (children 57%, adults 82 %), followed by reactive hyperplasia in children (37.8 %) and metastasis in adults (7.9%). Frequency of tuberculosis was significantly more in adults (p <0.001) while that of reactive process was significantly more in children (p<0.001). Cervical lymph nodes were involved most frequently by tubercular process (children 87%, adults 84 %). Caseous material or pus was aspirated in almost 2/3rd patients. The most frequent microscopic pattern was presence of granulomas against a lymphoid background, followed by necrosis only and the highest AFB positivity was found in necrotic smears in both age groups. Acute/mixed inflammatory response, devoid of granulomas, was observed significantly more often in children as compared to adults. (p< 0.001).
ConclusionsFNAC is a useful, minimally invasive first line investigation to evaluate lymphadenopathy. An early diagnosis on FNA allows clinicians to plan and institute appropriate treatment in most cases.
Key WordsLymph node, Fine needle aspiration cytology, tuberculous lymphadenitits
IntroductionFNAC is a well accepted diagnostic tool in adult patients.However, paediatricians and cytologists were initially hesitant in employing FNAC as a diagnostic method in children for a variety of reasons.
Cytopathologists are adapt to the procedure in adults but find it difficult in crying and squirming children. They also believed that cytomorphological features differ in paediatric lesions from those of adults and interpretation of FNAC could be inconclusive.
However, now FNAC is increasingly being applied to paediatric lesions as it permits rapid diagnosis with minimal intervention. This study evaluates the role of FNAC in paediatric lymphadenopathy with a comparative cytomorphological evaluation of lymphadenopathy in adults and children. Emphasis has been given on the comparative smear characterstics in tubercular lymphadenitis.
Superficial lymph nodes in 500 patients each of paediatric and adult age group are aspirated and subjected to microscopic evaluation regarding the diagnosis and cytomorphological assessment thereafter subjecting to comparison.
Material and MethodsFine needle aspirate smears from 500 consecutive patients with peripheral lymphadenopathy, each in paediatric ( ≤ 14 years) and adult ( > 14 years) age groups, referred to Santosh Medical College and Institute of Cytology and Preventive Oncology for routine diagnostic purpose, were retrospectively analyzed. The smears were air dried and stained by May Grunwald Giemsa (MGG) stain. Ziehl Neilson (ZN) staining was performed initially in all cases with grossly necrotic, purulent or blood mixed aspirates. In cases where granulomas were found without evidence of necrosis on MGG, ZN staining was performed later if an extra smear was available, or else after destaining an MGG stained smear. In patients with clinical suspicion of malignancy, a smear was also wet fixed for Papanicolaou staining.

128 Indian Journal of Public Health Research & Development. April - June, 2012, Vol. 3, No. 2
Demonstration of AFB was considered mandatory for diagnosis of tuberculosis. Criteria to diagnose tuberculosis included a) presence of epithelioid cell granulomas with/without necrosis and AFB +ve or b) presence of necrosis/mixed inflammatory infiltrate and AFB +ve. Cases with granulomas and /or necrosis or inflammation but without AFB positivity were labelled as ‘suggestive of tuberculosis’ and advised further investigations for confirmation.
ObservationsThe age of patients in paediatric age group ranged from 1month to14 years (mean age 7.5 years) while in adults it ranged from 15 to 78 years (mean age 52 years). The maximum number of paediatric patients (40%) were in 10-14 years age group while in adults, the maximum cases (35%) were referred in 21-30 year age group. Clinically, all patietns presented with peripheral lymphadenopathy, mostly painless, present since a duration of one week to one year. The most common lymph nodes aspirated were cervical, followed by axillary in both age groups. Submandibular, supraclavicular, submental and inguinal lymph nodes were occasionally involved. Bilateral involvement occurred in 27%(135/500) of paediatric casesand 14% (71/500)of adults cases while the right and the left sided distribution was almost equal.The lymph nodes were discrete in 342/500 (68.4%) children vs. 385/500 (77%) in adults while they were matted in 158/500 (31.6%) children and in 115/500 (23%) adults.
Out of 500 aspirates in paediatric age group, 15(3%) were unsatisfactory for evaluation while 10/500 (2%) aspirates from adults were unsatisfactory. The most frequent diagnosis on FNA was tuberculosis in both age groups (57 % in children, 82 % in adults), followed by reactive hyperplasia in children (37.8 %) and metastasis in adults (7.9%) [Table 1]. NHL was diagnosed in 10 (2.4%) adults as compared to 3 (0.63%) children. (P <0.005). Acute suppurative lymphadenitis was more frequent in paediatric age group (2.6%) as compared to the adults (1.2%). 3 cases of ‘Sinus histiocytosis with massive lymphadenopathy’ were diagnosed, all in children. Frequency of Hodgkin’s Lymphoma was similar in the two age groups.
Cervical lymph nodes were the most frequent site for metastasis, being involved in 29/39 cases.
The most common malignancy to metastasize to cervical lymph nodes was squamous cell carcinoma (25). [Primary site oropharynx in 15, larynx in 3 and esophagus in 3; primary not known in 4]. Metastatic adenocarcinoma was diagnosed in 4 cases (primary: lower end of esophagus and colon in 2 each). Axillary lymph nodes were the next common nodes to be involved in metastasis (8/ 39); the primary was breast carcinoma in all. In 2 cases, metastasis from squamous cell carcinoma of penis was diagnosed in inguinal lymph nodes.
Comparative evaluation of tuberculous lymphadenitis in paediatric and adult age groups.
The M: F ratio was 1:1 in both age groups with diagnosis of tuberculous lymphadenitis. Almost 50% of children presented in 10-14 year age group while most common age groups to be involved in adults was 21-30 years (48%) and 60-70 years (30%). Cervical lymph nodes were involved most frequently in both age groups (87% in children and 84 % in adults); next in frequency were axilllary lymph nodes (8% in children and 11% in adults). Inguinal lymph nodes were uncommon sites for tuberculosis. In children, bilateral cervical lymph node involvement was seen in 23% cases while unilateral left and right sided lymph nodes were involved 35% and 36% respectively. 5% cases showed only midline (submental) lymphoid swellings. In adults, 12% cases showed bilateral involvement, 31% left sided, 36% right sided and in 3% submental lymph nodes were involved. 54% paediatric cases presented with a solitary lymphadenopathy while 46% cases showed multiple lymph node involvement. In adults, 65% cases had solitary while 35% had multiple lymph nodes.
Gross examination of the aspirates revealed caseous material in 33%, pus in 30%, blood mixed material in 25% and turbid fluid in 12% paediatric cases while the corresponding figures were 37%, 31%, 28% and 4% respectively for adults. On microscopic examination, the most frequent pattern in paediatric tuberculous lymph nodes was presence of granulomas against a lymphoid background (30%); followed by and presence of necrosis
Table 1: Frequency of lesions on FNAC in paediatric and adult lymph nodes
Lesion Paediatric (n=485) Adult (n=490) P value
Tuberculosis or ‘suggestive of tuberculosis’ 277 (57.1%) 402 (82%) <0.001
Reactive hyperplasia 183 (37.8%) 29 (5.9%) <0.001
Acute suppurative 13 (2.6%) 5 (1.2%) >0.05
Sinus histiocytosis with
massive lymphadenoapthy 3 (0.6%) 0 >0.05
Hodgkin’s Lymphoma 6 (1.2%) 5 (1%) >0.05
Non Hodgkin’s Lymphoma 3 (0.6%) 10 (2.4%) <0.005
Metastasis 0 39 (7.9%) <0.001

129Indian Journal of Public Health Research & Development. April - June, 2012, Vol. 3, No. 2
only without granulomas (27%) and presence of acute/mixed inlammatory infiltrate without granulomas or necrosis (23%). In adults, the commonest smear pattern was presence of granulomas in a lymphoid background (30%), followed by necrosis without granulomas (27%).
The highest yield of AFB positivity was found in smears with necrosis only (devoid of granulomas) in all age groups (97% in paediatric and 93% in adult age groups). AFB positivity was also high in smears showing granulomas with necrosis or purulent background as well as in smears showing mixed inflammatory infiltrate without granulomas. In smear pattern showing granulomas without necrosis, AFB positivity was comparatively low in both age groups (57% in children vs. 64% in adults) [Table2]
Other cytomorphological features in the smears from tuberculous lymph nodes:
139/277 (50%) aspirates from children showed epithelioid cells, 131 of these had associated well defined granulomas while in 8 cases epithelioid cells were seen lying scattered singly or ill defined collections. In adults 209/402 (52%) aspirates showed epithelioid cells; 98 (49.4%) had associated granulomas while 11 had scattered / ill formed collections of epithelioid cells only. Langhan’s giant cells were observed n 53/277 (19.1%) paediatric cases and in 96/402 (23.9%) adult FNAs. Foreign body giant cells were found in 17/277 (6.1%) paediatric and 24/402 (5.9%) adult cases and were associated with granulomas in all the cases. Non epithelioid histiocytes were present in 107/277(38.6%) paediatric and 133/402 (33.1%) adult FNAs. These were also seen in association with granulomas in all cases (except 2 paediatric FNAs). Foamy macrophages were present in 44/277(15.9%) paediatric cases; 28 of these were associated with granulomas. In adult FNAs 48/402 (11.9%) cases revealed foamy macrophages, 29 of these were associated with granulomas. However, there were no significant differences between the two age groups for the presence of any of these associated features.
DiscussionThe adequacy of paediatric lymph node aspirates was found to be 97% as compared to 98%% in adults. Unsatisfactory aspirates resulted due to either lymph
nodes being too small in size or due to excessive dilution with peripheral blood. Also, the children were at times very uncooperative during the FNA procedure leading to unsatisfactory aspirates. An almost similar inadequacy rate has been reported by Annam et al1 (3.7%) while it is 4.6% in the study of U Handa et al2, and 6% by M Jain et al6.
In some other studies it is higher ( 6-12 %). This might be due to use of improper aspiration techniques or unsatisfactory handling of aspirated material in these studies, while in the present study, the pathologists themselves aspirated the lymphnodes. In the present study, the cervical lymph nodes were the most commonly aspirated nodes in both children (91.1%) as well as adults (83%). This closely corresponds to the figure of 85% in a study of 100 paediatric cases by Reddy et al3 and 84.3% in the study of Handa et al2. This is obvious as the cervical lymph nodes are most frequently involved during the course of tuberculosis as well as in acute upper respiratory tract infections. Also, the cervical lymph nodes are more easily visualised as compared to axillary and inguinal lymph nodes and therefore are more often reported by the patients.
Tuberculosis was the most frequent diagnosis in both paediatric and adult patients. However, when compared, tuberculosis was significantly less frequent (57% vs. 82%) while reactive hyperplasia significantly more frequent (38% vs. 6%) in children as compared to the adults. Reactive hyperplasia is fairly common in children, especially after pharyngitis or tonsillitis and skin infections. Also, the lymphoid tissue reacts briskly and for a longer period in children. The higher frequency of tuberculous lymphadenopathy (57%) in children in the present study contrasts with the studies of Annam et al1 and Handa et al2 and M Jain et al6 in which reactive hyperplasia was the most frequent diagnosis (58% and 63% respectively). This is probably because Annam et al and Handa et al have conducted their studies in Karnataka and Chandigarh respectively where due to lesser poverty and higher socio-economic status there is lesser prevalence of tuberculosis. In contrast, the patients in our study belonged to poor socio-economic status.
M Jain et al6 have worked in military hospital where the socioeconomic status and living conditions of attending patients are definitely better than of the subjects attending the civil hospital as in our study.
Table 2: Smear patterns correlated with AFB staining on aspirate smears from tuberculous lymph nodes in paediatric and adult age groups
Smear patternPaediatric (n=277) Adult (n=402) P value (smear
pattern; paediatric vs. adult) Frequency AFB +ve Frequency AFB +ve
Granulomas with lymphoid background (without necrosis) 82 (29.6%) 57.3% 121 (30.1%) 63.6% >0.05
Granulomas with necrosis 39 (14.1%) 94.9% 68 (16.9%) 92.6% >0.05
Granulomas with purulent background 18 (6.5%) 94.4% 20 (4.9%) 90% >0.05
Acute/mixed inflammatory infiltrate without granulomas 64 (23.1%) 96.5% 81 (20.1%) 91.3% <0.001
Necrosis without granulomas 74 (26.7%) 97.2% 112 (27.8%) 92.8% >0.05

130 Indian Journal of Public Health Research & Development. April - June, 2012, Vol. 3, No. 2
The children in present study showed a higher incidence of multiple lymph node involvement (45%) as compared to adults(35%). This is probably because of greater lymphoid tissue response and late detection of the painless swellings in children. Also, primary tuberculosis which is commoner in childhood presents as multiple lymph nodes rather than as solitary involvement. Ajali Das Gupta et al4 showed solitary lymph node involvement in only 19% of cases in their study done in 180 cases of lymphadenopathy in all age groups with special reference to tuberculosis. None of the other workers commented on this aspect.
The bilaterality in paediatric age group (27%) was seen in higher number of cases than in adults (14%) probably due to higher incidence of multiple lymph node involvement in children.
The right and left sided involvement was found to be almost same in all age groups in our study.
Annam et al 1 reported a higher incidence of left sided lymph node involvement (54%) than right sided (39.5%).
The aspirates were caseous in 33% paediatric tuberculous cases as compared to 36% in non paediatric cases. The frequency of purulent aspirates in paediatric and non paediatric cases was 30% and 31% respectively. Handa et al2 obtained caseous aspirates in 67.8% cases while Annam et al1 reported caseous aspirates in 71% cases. These authors did not categorise the purulent aspirates separately while we kept them in a separate category. If we combine the two, a figure of 63% is obtained which is consistent with that reported by other authors. M Jain et al 6 reported caseous aspirates to be 80%.
Here too,the purulent smears were not categorised separately and thus clubbed together.
In the present study, AFB positivity was kept mandatory before labelling any case as tuberculous.
Cases which had necrosis but were AFB negative were labelled as ‘suggestive of tuberculosis’ and advised other investigations to establish tuberculous etiology. The highest yield of AFB positivity was found in smears with necrosis only (devoid of granulomas) in all age groups (98%). Variable AFB positivity has been reported in other studies. Handa et al found AFB positivity of 63.1% in cases
showing necrosis only. Jain et al 6 reported this figure to be 80% while 83.3% of the caseous aspirates showed AFB positivity in the study by Das Gupta et al4 who worked on the lymphadenopathy in all age groups. Annam et al1 reported AFB positivity to be 94% in paediatric tuberculous cases. The higher AFB positivity in our study might be due to diligent screening of smears by the pathologists themselves. AFB positivity was lowest across all age groups in the smears showing granulomas but no necrosis (paediatric 57.3%; adults 63.6%). There were no significant differences between the two age groups when the smear patterns were correlated with the AFB positivity. High AFB positivity in purulent aspirates observed in our study reiterates that all cases in which pus is obtained should be subjected to AFB staining and screening in order to pick up tuberculous lesions. Well formed epithelioid cell granulomas were found in 50% and 52% of paediatric and non- paediatric aspirates respectively. There were no significant differences between the two age groups for other associated features such as the presence of Langhan’s giant cells, foreign body giant cells, non epithelioid histiocytes and foamy macrophages.
References1. Annam V, Kulkarni MH, Puranik RB. Clinico pathologic profile of
significant cervical lymphadenopathy in children aged 1 – 12 years. Acta Cytol 2009; 53(2): 174-8.
2. Handa U, Mohan H, Bal A. Role of fine needle aspiration cytology in evaluation of paediatric lymphadenopathy. Cytopatholgy 2003; 14: 66-69.
3. Reddy MP, Moorchung N, Chaudhary A. Clinico-pathological profile of paediatric lymphadenopathy. Indian J Paediatr 2002; 69: 1047-51.
4. Das Gupta et al. Fine needle aspiration cytology of cervical lymphadenopathy with special reference to tuberculosis. IMA 1993; 92: 44-46.
5. Eisenhutt CC,. King DE, Nelson WA, Olson LC, Wall RW, Glant MD. Fine needle aspiration biopsy of paediatric lesions; a three year study in outpatient biopsy clinic. Diagn Cytopathol 1996; 14: 43-50.
6. Jain M, Majumdar DD, Agarwal K, Bais AS, Chodhary M. FNAC as diagnostic tool in paediatric head and neck lesions. Indian Paediatr 1999; 36: 921-23.
7. de Schoot LV, Aronson DC, Behrendt H, Bras J. The role of fine needle aspiration cytology with persistent or suspicious lymphadenopathy. J Paediatr Surg 2001; 36: 7-11.

131Indian Journal of Public Health Research & Development. April - June, 2012, Vol. 3, No. 2
Direct observation pattern of DOTS (Directly Observed Treatment Short Course) by Alternate DOTS providers for patients treated under RNTCP in a Tertiary Care HospitalPethuru Devadason1, K R John2, Pearline Suganthi3
1Assitant Professor, Department of Community Medicine, SMIMS, Kulasekharam, T.N., 2Professor and Head, Department of Community Medicine, Christian Medical College, Vellore, T.N., 3Bio-statistician, Department of Community Medicine, Christian Medical College, Vellore, T.N.
AbstractDirect Observation of Treatment Short course (DOTS) is the proven effective in controlling TB on a mass basis around the world. Direct observation is the central and key element for the success of the DOTS strategy. In India, Multi-purpose health workers play a major role in treatment observation; where they are not available, treatment observation is done by community volunteers including anganwadi workers, traditional dais, and community and religious leaders. The choice of DOTS provider should be based on access, patient preference and availability of the DOTS providers. This study was done to find the pattern of the direct observation component of the DOTS strategy by the professional and community DOTS providers and to find out their acceptance among the patients.
Material and Method164 new sputum positive patients treated at rural and urban TB clinics of CMC Vellore from January 2001 to December 2004 were followed up during November 2005 along with their respective DOTS providers using separate structured questionnaires. The data entry and statistical analysis was done using SPSS data analysis package version 12.0. Chi2 test and t- test were used to test the significance of the data.
ResultIntensive Phase (IP) treatment was given alternate days by 94.5% of the community providers compared to 90.1% of professional providers. In Continuation Phase (CP) treatment, it was not expected by the RNTCP guidelines to give alternate days. But 34.2% of community providers had given on alternate days as in IP compared to only 4.4% of professional providers. The difference is statistically significant (p value <0.001). Patients observed by professional providers had to travel the mean distance of 0.91 Km compared to only 0.31 km with community providers (p value <0.001). The average time spent each time to get drugs from their providers in the professional arm is 27.42 minutes compared to only 14.86 minutes with community providers (p value <0.001). In the professional arm the main place was clinics/hospitals (90.1%) and in the community arm mainly either it was patients’ house (452%) or providers’ house (41.1%). In
the professional arm, the patients are cumulated in the working hours of the professional providers and they are evenly distributed regarding time in the community arm.
ConclusionThe DOTS being provided at home with less consumption of time and lesser distance to travel are significantly different in the community arm of DOTS providers as compared to the professional DOTS providers.
Key WordsDOTS providers, Community providers.
IntroductionM. tuberculosis kills more people than any other single infectious agent after HIV. About 8 million people develop active tuberculosis (TB) every year, and about 1.8 million die1. Every year 2 million Indians develop tuberculosis and half a million die, though the effective drugs for tuberculosis have been available since the 1940s2. One of the principal barriers to the elimination of tuberculosis is non-compliance. To prevent this, WHO has stressed the need for the Direct Observation of therapy, which, as implied by the name, is the central feature of the widely advocated directly observed therapy short course (DOTS) strategy3. DOTS is the only strategy which has proven effective in controlling TB on a mass basis. The DOTS strategy is in practice in more than 100 countries4.
Early WHO documents emphasized the importance of direct observation by health workers5. But later, from the experience gained in DOTS programmes around the world, it was demonstrated that trained lay people were at least as effective in observing treatment. They included community health volunteers (in Bangladesh)6, storekeepers (in South Africa)7, religious leaders, lay health workers, and community volunteers8.
In India, Multi-purpose health workers play a major role in treatment observation; where they are not available, treatment observation is done by community volunteers including anganwadi workers, traditional dais, and community and religious leaders. Observation by a family member is not acceptable in the Revised National Tuberculosis Control Programme9.

132 Indian Journal of Public Health Research & Development. April - June, 2012, Vol. 3, No. 2
Directly observed treatment (DOT) is a strategy in which a person observes as patients take their medicine. The choice of DOTS provider should be based on access, patient preference and availability of the DOTS providers. The increase in cure and completion rates of treatment may be explained in terms of the benefit of effective implementation of the diagnosis by microscopy, adequate supply of SCC drugs, accountability of the health system and the political commitment components of the DOTS strategy10.
But WHO strongly believes that direct observation is a key element for the success of the DOTS strategy11. Directly observed treatment means that every dose is administered under direct observation, and convenience to the patient is essential part for success of the DOTS strategy.
ObjectiveThis study was done to find the pattern of the direct observation component of the ‘DOTS strategy’ by the professional and community DOTS providers and to find out their acceptance among the patients.
Material and MethodThe list of all the new sputum positive pulmonary cases treated under 2 DOTS clinics (CMC- Urban & CHAD Hospital- Rural) covered by Christian Medical College, Vellore from January 2001 to December 2004 enumerated. Those who are residing in Kaniyambadi Block, Vellore town and other areas within the radius of 12 kms and also available during the follow up in the month of November 2005 were interviewed using a structured questionnaire along with their respective DOTS providers.
In CHAD Microscopy centre, the treatment supervision is implemented by a variety of professional and community DOTS providers. Professional DOTS Providers are Doctors, Nurses, Paramedical staff of the Health system and all the RNTCP staff whether they are at private or public health system. Community DOTS Providers are any providers other than the above professional category, who are members of the community and voluntary workers who had minimal training in health care.
Statistical AnalysisThe data entry and statistical analysis was done using SPSS data analysis package version 12.0. All the data were cross-tabulated and chi2 test and t- test were used to test the significance of the data.
ResultThere were 164 patients followed up. The total number of their respective DOTS providers came to 86. Table 1 shows the occupation of the DOTS providers. In the professional
arm, RNTCP Staff and private practitioners have observed more cases. In the community arm, the occupation rages fromhousewives to politicians.
Table 1: Occupation of the Dots Providers
Professional DOTS providers
Occupation Number Patients observed
Private practitioner 8 21
Doctor in Municipal Health Centre (MHC)
1 8
RNTCP staff 3 23
Maternity asst. (ANM) 8 17
Field nurse (MHC) 9 11
Nurse in CMC 4 3
Pharmacists 2 8
Total 35 91
Community DOTS providers
Occupation Number Patients observed
Attenders - CMC/CHAD 4 8
Balwadi teacher 2 2
Health aides (CHAD) 6 7
Part time Community Health Workers (CHAD)
8 10
Extension worker 1 1
Other NGOs 3 9
Community nutrition worker 1 2
Maternity Ayah 2 2
Cooley 9 13
Carpenter 1 1
Beedi worker 1 1
House wife 8 12
Milk man 1 1
Photographer 1 1
Local politician 1 1
Teacher 1 1
Tea shop 1 1
Total 51 73
Table 2 describes the direct observation pattern of DOTS by the professional and community providers. Intensive Phase (IP) treatment was given alternate days by 94.5% of the community providers compared to 90.1% of professional providers. In Continuation Phase (CP) treatment, it was not expected by the RNTCP guidelines to give alternate days. But 34.2% of community providers had given on alternate days as in IP compared to only 4.4% of professional providers. The difference is statistically significant (p value <0.001). Regarding observation more than 85% of the patients agreed that they have been fully observed during the intensive phase of DOTS. It was 85.7% in the professional arm and 87.7%

133Indian Journal of Public Health Research & Development. April - June, 2012, Vol. 3, No. 2
in the community arm. The difference is not statistically significant (p-value = 0.71).
Table 2: Direct Observation of the Treatment
Variables Professional (n=91)
Community (n=73)
Chi2 P-value
IP given alternate days
82(90.1%) 69(94.5%) 1.08 0.22
CP given alternate days
4(4.4%) 25(34.2%) 24.79 0.00*
IP fully observed
78(85.7%) 64(87.7%) 0.13 0.71
CP fully observed
52(82.4%) 65(89%) 1.42 0.23
Table 3 shows the distance traveled and time spent by the patients to receive drugs from their providers. Patients observed by professional providers had to travel the mean distance of 0.91 Km compared to only 0.31 km with community providers. The difference is statistically significant (p value <0.001). The average time spent each time to get drugs from their providers in the professional arm is 27.42 minutes compared to only 14.86 minutes with community providers. The difference is statistically significant (p value <0.001).
Table 3: Distance Travelled and Time Spent by the Patients
Variable Mean S.D. P-valueDistance travelled (Km)
Professional 0.91 1.210.00*
Community 0.31 0.54
Time Spent (Minutes)Professional 27.42 15.8
0.00*Community 14.86 17.8
Table 4 illustrates the place of DOTS being given. In the professional arm the main place was clinics/hospitals (90.1%) and in the community arm mainly either it was patients’ house (452%) or providers’ house (41.1%).
Table 4: Place of Dots for Patients Interviewed
Place of DOTS Professional Community
Patients’ house 3 (3.3%) 33 (45.2%)
Providers’ house 6 (6.6%) 30 (41.1%)
DOTS clinics/ hospital 82 (90.1%) 8 (11%)
Common place 0 2 (2.7%)
Total 91 73
Table 5 shows the timing of the provision of DOTS by the providers. In the professional arm, the patients are cumulated in the working hours of the professional providers and they are evenly distributed regarding time in the community arm.
Table 5: Timing of Dots for the Patients Interviewed (According to DOTS providers)
Timing of DOTS Professional Community
Morning 17(48.6%) 22(43.1%)
Noon 12(34.3%) 6(11.8%)
Evening 4(11.4%) 13(25.5%)
Night 2(5.7%) 10(19.6%)
Total 35 (100%) 51 (100%)Chi2: 10.11 Df:3 p-value: 0.017
DiscussionIn the professional arm while most of them are the professionals working in the public or the private health sector, 8 out of 35 (22.9%) of them are the private practitioners. This shows better awareness and acceptance of DOTS by the private practitioners. The occupation in the community arm ranges from housewives to local politician. Whatever may be the profession, the accessibility and acceptability by the patients and the accountability to the health system are the guiding principles to choose a person as a DOTS provider12.
According to the RNTCP treatment guidelines the treatment provider should observe each dose in the intensive phase (IP) which is given every alternate days for 2 months and at least the first dose in the continuation phase (CP) which is given once a week4. In this study irrespective of the intensive and continuation phase, significant numbers of the providers in the community arm continue to give DOTS on alternate days in the continuation phase. They are doing it with enthusiasm since they felt DOTS will be effective if it continued alternate days in the continuation phase also.
The distance between the patients and the health-care workers is a formidable obstacle, making regular observation of doses, even three times weekly, difficult to achieve13. The table shows that there is the significant difference in the average distance travelled by the patients and the average time spent for the each dose of DOTS including time taken for travel. The patients in the community arm are spending significantly less time for travel and less over all time for getting DOTS (p value < 0.001). But for each patient arranging a community provider is the big challenge and burden to the health system/ service provider. In practical situation, where the health facility is not available or inconvenient to the patient, the community providers are arranged.
Convenience to the patient is essential part for success of the DOTS strategy. For the success of the tuberculosis treatment, the DOTS providers must be organized based on patient’s convenience rather than the convenience of the treatment providers14. In this study, in the professional arm 90% of the patients have gone to MHCs / DOTS clinics in CHAD/CMC or to the clinics of the private practitioners. In the community arm 33 patients (45.2%) had received taken the treatment at their homes since the community providers are willing to go patients place and administer the drugs.
But opinion among the DOTS providers regarding the ideal place of DOTS varies. The place is whether the patient’s house or the provider’s house/Clinics, both have its own advantages and disadvantages. DOTS at patient’s house ensures the compliance to the schedule and is convenient for the patients. But then the responsibility of the regular intake of drugs by the patient is on the DOTS providers. As expressed by some of the DOTS

134 Indian Journal of Public Health Research & Development. April - June, 2012, Vol. 3, No. 2
providers, the regular visits to the patients’ house make the patients stigmatized in the community. Some of the DOTS providers prefer the patients’ house as the ideal place to avoid the inconvenience to schedule their time for the patients.
The timing of the DOTS observation in the professional arm is cumulated during the morning and noon because of the working hours of the professional providers. In the community arm it is evenly distributed because of their availability to the patients’ convenient time. This difference is statistically significant (p value 0.017).
ConclusionThe characteristics of the DOTS providers showed that the community DOTS providers included the different categories including house wives, carpenter, milkman, photographer, and teacher and so on. The DOTS being provided at home with less consumption of time and lesser distance to travel are significantly different in the community arm of DOTS providers as compared to the professional DOTS providers. This involves the challenge to the health system/ voluntary agencies to train, organise and supervise the community DOTS providers to make the DOTS convenient to the patients. The community DOTS providers have certain advantages like making DOTS more accessible at home level for the patients.
References1. Dye C, Scheele S, Dolin P, Pathania V, Raviglione MC. Global
burden of tuberculosis: estimated incidence, prevalence and mortality by country. J Am Med Assoc 1999; 282(7):677-86.
2. TB India 2005. RNTCP Status Report, Central TB Division
Directorate General of Health Services, Ministry of Health and Family Welfare, Nirman Bhavan, New Delhi–110011.
3. Maher D, Mikulencak M. What is DOTS? A guide to understanding the WHO recommended TB control strategy known as DOTS. Geneva: WHO Communicable Diseases Prevention and Control, 1999 (WHO/CDS/CPC/TB/99.270).
4. Revised National Tuberculosis Control Programme Introduction; Central TB Division, Directorate General of Health Services, Ministry of Health and Family Welfare, Nirman Bhavan, New Delhi–110011.
5. World Health Organization. Managing tuberculosis at the district level: a training course. Geneva, WHO, 1994 (document WHO/TB/96.211).
6. Chowdhury AMR. Control of tuberculosis by community health workers in Bangladesh. Lancet 1997; 350:169 - 72.
7. Wilkinson D, Davies GR, Connolly C. Directly observed therapy for tuberculosis in rural South Africa 1991 through 1994. American Journal of Public Health 1996; 86:1094-97.
8. Tomans Tuberculosis, case detection, treatment and monitoring - second Edition, WHO, Geneva, 2004.
9. Khatri GR. The Revised National Tuberculosis Control Programme: A Status Report on first 1,00,000 patients. Ind J Tuberc 1999;46:157.
10. Wright J, Walley J, Philip A, Pushpananthan S, Dlamini E, Newell J et al. Direct observation of treatment for tuberculosis: A randomized controlled trial of community health workers versus family members. Tropical Medicine and International Health 2004 May; 9(5) 559–65.
11. Volmink J, Garner P. Directly observed therapy [letter]. Lancet 1997;349:1399-00.
12. Sbarbaro J. What are the advantages of direct observation of treatment? In: Frieden T, editor. Toman’s tuberculosis: Case detection, treatment and monitoring – questions and answers. Second edition, Geneva: WHO, 2004:183-84.
13. Shafer J, Falzon D, Small I, Kittle D, DOTS in Aral Sea area. Correspondence. Lancet 2001 Dec 8;358;2001
14. Toman K. What are the keys to cure? In: Frieden T, editor. Toman’s tuberculosis: Case detection, treatment and monitoring – questions and answers. Second edition, Geneva: WHO, 2004:260-62.

135Indian Journal of Public Health Research & Development. April - June, 2012, Vol. 3, No. 2
Oral plasmablastic lymphoma in an HIV negative patient – A case reportPunit Chitlangia1, Samit Purohit2, Chintan Narad3, Rohan Bhise4
1Senior Resident, 2Registrar, Dept. of Medical Oncology, KMIO, 3Resident Oral Oncology, 4Registrar, Dept. of Medical Oncology, Kidwai Memorial Institute of Oncology, (KMIO), Bangalore -29, India
AbstractPlasmablastic lymphoma (PBL) is a rare variant of a diffuse B-cell lymphoma that is most commonly found in the oral cavity affecting the mucosa, and so named for its blastoid morphology and immunophenotype. Oral PBL has been treated heterogeneously and well defined treatment guidelines are still lacking. It includes chemotherapy, radiotherapy, combination of both or local excision followed by radiation. Prognosis is usually poor regardless of the site of origin. The clinical course is very aggressive with most of the patients dying in the first year after diagnosis. Here we present a case who was treated with high grade lymphoma protocol, CODOX-M alternating with IVAC followed by radiotherapy & Patient showing a good clinical response.
KeywordsOral Plasmablastic lymphoma, HIV- Negative.
Abbreviations: CODOX-M, C-cyclophosphamide, O-vinccristine, DOX-doxorubicin, M-methotrexate.
IVAC: I-ifosfamide.V-vincristine, A-cytosine arabinoside, C-cisplatin.
LCA –leucocyte common antigen.
IntroductionPlasmablastic lymphoma (PBL) is a rare variant of a diffuse B-cell lymphoma that is most commonly found in the oral cavity affecting the mucosa, and so named for its blastoid morphology and immunophenotype1,2. These tumors are found in patients with human immunodeficiency virus (HIV), affecting approximately 3% of all HIV patients3,4. It is not atypical to find non-Hodgkin’s lymphomas (NHL) associated with acquired immunodeficiency syndrome (AIDS) and in some cases its manifestation delineates an HIV-positive patient as having AIDS1. Male to female ratio is 7:1 for the disease. As a distinct subset, PBLs are noted to be rapidly progressive with a high mitotic index5. Although prognosis is usually poor, with an average survival time being approximately 6 months1,2,6.
Report of a case: A 30 year old male patient presented with a growth and pain in the right upper jaw since 2 months. Patient was a known tobacco chewer, since 10 years. Intraoral examination revealed, ulcerative lesion
approximately 4 X 3 cm in diameter at right hard palate & posterior alveolus region(Fig.a). Anterio posteriorly lesion extended from second premolar to the right tuberosity region. Neck examination revealed right level I b sub centimeter node, tender, soft to firm & mobile in nature. CT scan revealed a well defined irregular heterogeneous soft tissue attenuation of right upper alveolus region measuring in 4.6 X 2.5cm suggested of malignant neoplasm of right maxilla with multiple sub centimeter size node at level Ib & level II.(Fig.b) Complete blood count and metabolic profile presented no abnormalities.FNAC done, was inconclusive. An incisional biopsy of area was performed & submitted for examination, the report suggestive of high grade plasmablastic lymphoma.
Immunohistochemistry studies showed that tumor cells were positive for LCA, CD20. CD138 focally positive & CD3 negative. Kappa and lambda stain were not very satisfactory.
Differential diagnosis of oral PBL includes poorly differentiated carcinoma, amelanotic melanoma & other type of lymphoproliferative disease. AIDS related lymphomas that are included in differential diagnosis of PBL are DLBCL (Diffuse large B cell lymphoma), plasmacytoma & small noncleaved (Burkitt-like) lymphoma7,8,9,10.
Plasmacytoma and PBL cannot be reliably distinguished by immunohistochemistry alone as they exhibit similar immunoprofile.
TreatmentOral PBL patients have been treated heterogeneously and well defined treatment guidelines are still lacking. Treatment may consist of chemotherapy, using prednisolone, cyclophosphamide, adriamycin and/or vincristine, or local excision followed by radiation. The final course of therapy is considered on a case-by-case basis depending on the stage of the disease, the presence of systemic symptoms or the association with HIV infection12. Local radiotherapy has proven successful when only gingival lesions are present. Multi-drug chemotherapy with or without radiation treatment is generally recommended for the disseminated disease.
In this case patient was started on high grade lymphoma protocol. CODOX-M alternating with IVAC, but after

136 Indian Journal of Public Health Research & Development. April - June, 2012, Vol. 3, No. 2
second cycle patient developed cytosine arabinoside induced CNS toxicity in the form of altered sensorium and seizures. However CT scan brain revealed no abnormalities. After the recovery, patient was planned for Radiotherapy (40 Gy / 20 fractions) following which a good clinical response was seen (Fig.c).
DiscussionOral PBL is an uncommon, recently described B-cell derived lymphoma most commonly seen in patients with HIV infection. The median age at presentation is around 50 years, with a broad distribution, but mainly affecting adults .Immunodeficiency caused in the majority of cases by HIV, predisposes to the development of PBL. Other causes of immunodeficiency such as iatrogenic immunosupresion for autoimmune disease or prevention of post transplant therapy allograft rejection may also be implicated. It is characterized by a diagnostic triad of predilection for gingivo- buccal complex mucosa, classical plasmablastic morphology with the lack of neoplastic plasma cells and a limited immunohistochemical panel consisting of CD20 negativity, LCA (+/_), CD138/ VS38c diffuse positivity, light chain restriction. PBL presents most frequently as a mass in the oral cavity, but it is also encountered in other extra nodal sites – particularly mucosal sites –including the sinonasal cavity, orbit skin, bone, soft tissues and gastrointestinal tract. Computed tomography and positron emission tomography may show disseminated bone involvement.Cytoplasmic immunoglobins are expressed in 50-70% of cases, most frequently IgG and either kappa or lambda light chain. The expression of CD56 should raise suspicion for underlying plasma cell
myeloma Oral PBL has been treated heterogeneously and well defined treatment guidelines are still lacking. It includes chemotherapy, radiotherapy, combination of both or local excision followed by radiation. Prognosis is usually poor regardless of the site of origin.
The clinical course is very aggressive with most of the patients dying in the first year after diagnosis.
References1. Cioc AM, Allen C, Kalmar JR, et al: Oral plasmablastic lymphomas
in AIDS patients are associated with human herpesvirus 8.Am J Surg Pathol 28:41, 2004
2. Delecluse HJ, Anagnostopoulos F, Dallenbach M, et al: Plasmablastic lymphomas of the oral cavit: A new entity associated with the human immunodeficiency virus infection. Blood 89: 1413, 1997
3. Lester R: Improved outcome of human immunodeficiency virus-associated plasmablastic lymphoma of the oral cavity in the era of highly active antiretroviral therapy: A report of two cases. Leuk Lymphoma 45:1881, 2004
4. Kumar V, Robbins S, Cotran R: Pathologic Basis of Disease. Ed 7. Philadelphia, PA, Elsevier, 2005
5. Jaffe E, Harris N, Stein H, et al: Pathology and Genetics of Tumors of Haematopoietic and Lymphoid Tissues. Lyon, IARC Press, 2001
6. Flaitz CM, Nichols CM, Walling DM, et al: Plasmablastic lymphoma: An HIV-associated entity with primary oral manifestations. Oral Oncology 38:96, 2002.
7. Rafaniello Raviele P, Pruneri G, Maiorano E. Plasmablastic lymphoma. Oral Diseases 2009;15:38–45.
8. Delecluse HJ, Anagnostopoulos I, Dallenbach F, Hummel M, Marafioti T, Schneider U, et al. Plasmablastic lymphomas of the oral cavity: a new entity associated with the human immunodeficiency virus infection. Blood 1997;89:1413–20.
9. Carbone A, Gaidono G, Ferlito A, Rinaldo A, Stein H. AIDS-related plasmablastic lymphoma of the oral cavity and jaws: a diagnostic dilemma. Ann Otol Rhinol Laryngol 1999;108:95–9.
10. Brown RS, Campbell C, Lishman SC, Spittle MF, Miller RF. Plasmablastic lymphoma: a new subcategory of human immunodeficiency virus-related non- Hodgkin’s lymphoma. Clin Oncol 1998;10:327–9.
11. Vega F, Chang CC, Medeiros LJ, Udden MM, Cho-Vega JH, Lau CC, et al. Plasmablastic lymphomas and plasmablastic plasma cell myelomas have nearly identical immunophenotypic profiles. Mod Pathol 2005;18:806–15.
12. Scheper MA, Nikitakis NG, Fernandes R, Gocke CD, Ord RA, Sauk JJ. Plasmablastic lymphoma in an HIV-negative patient: a case report and review of literature. Oral Surg Oral Med Oral Pathol Oral Radiol Endod 2005;100:198–206.
A) At Presentation
B) CT SCAN At presentation
C) POST CT/RT
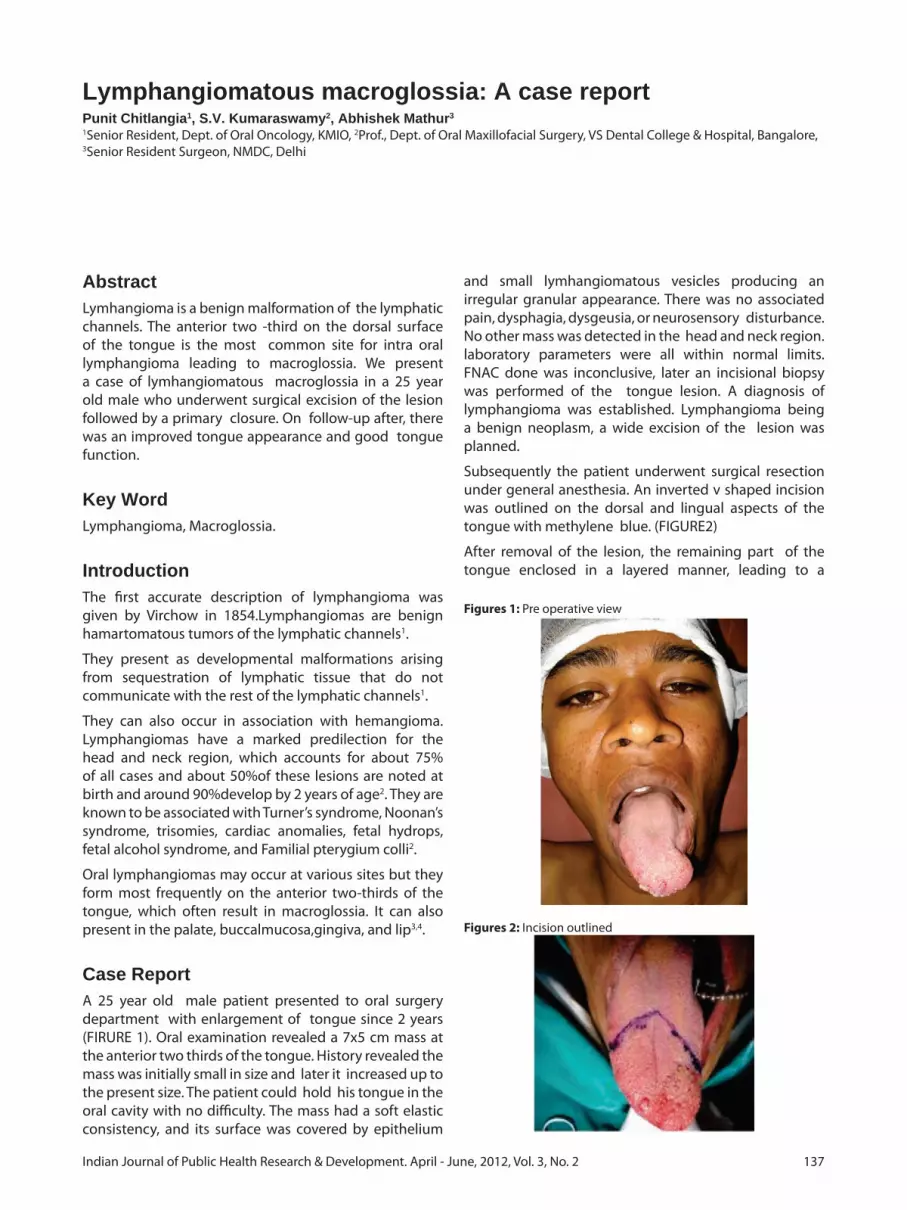
137Indian Journal of Public Health Research & Development. April - June, 2012, Vol. 3, No. 2
Lymphangiomatous macroglossia: A case reportPunit Chitlangia1, S.V. Kumaraswamy2, Abhishek Mathur3
1Senior Resident, Dept. of Oral Oncology, KMIO, 2Prof., Dept. of Oral Maxillofacial Surgery, VS Dental College & Hospital, Bangalore,3Senior Resident Surgeon, NMDC, Delhi
AbstractLymhangioma is a benign malformation of the lymphatic channels. The anterior two -third on the dorsal surface of the tongue is the most common site for intra oral lymphangioma leading to macroglossia. We present a case of lymhangiomatous macroglossia in a 25 year old male who underwent surgical excision of the lesion followed by a primary closure. On follow-up after, there was an improved tongue appearance and good tongue function.
Key WordLymphangioma, Macroglossia.
IntroductionThe first accurate description of lymphangioma was given by Virchow in 1854.Lymphangiomas are benign hamartomatous tumors of the lymphatic channels1.
They present as developmental malformations arising from sequestration of lymphatic tissue that do not communicate with the rest of the lymphatic channels1.
They can also occur in association with hemangioma. Lymphangiomas have a marked predilection for the head and neck region, which accounts for about 75% of all cases and about 50%of these lesions are noted at birth and around 90%develop by 2 years of age2. They are known to be associated with Turner’s syndrome, Noonan’s syndrome, trisomies, cardiac anomalies, fetal hydrops, fetal alcohol syndrome, and Familial pterygium colli2.
Oral lymphangiomas may occur at various sites but they form most frequently on the anterior two-thirds of the tongue, which often result in macroglossia. It can also present in the palate, buccalmucosa,gingiva, and lip3,4.
Case ReportA 25 year old male patient presented to oral surgery department with enlargement of tongue since 2 years (FIRURE 1). Oral examination revealed a 7x5 cm mass at the anterior two thirds of the tongue. History revealed the mass was initially small in size and later it increased up to the present size. The patient could hold his tongue in the oral cavity with no difficulty. The mass had a soft elastic consistency, and its surface was covered by epithelium
and small lymhangiomatous vesicles producing an irregular granular appearance. There was no associated pain, dysphagia, dysgeusia, or neurosensory disturbance. No other mass was detected in the head and neck region. laboratory parameters were all within normal limits. FNAC done was inconclusive, later an incisional biopsy was performed of the tongue lesion. A diagnosis of lymphangioma was established. Lymphangioma being a benign neoplasm, a wide excision of the lesion was planned.
Subsequently the patient underwent surgical resection under general anesthesia. An inverted v shaped incision was outlined on the dorsal and lingual aspects of the tongue with methylene blue. (FIGURE2)
After removal of the lesion, the remaining part of the tongue enclosed in a layered manner, leading to a
Figures 1: Pre operative view
Figures 2: Incision outlined

138 Indian Journal of Public Health Research & Development. April - June, 2012, Vol. 3, No. 2
relatively normal size and shaped tongue. (FIGURE3,4)
The patient was discharged after a week with a normal looking tongue and marked improvement in speech. The post surgical histopathological report indicated cavernous lymphangioma. At present patient is in regular follow up with an improved tongue appearance and function. (FIGURE 5)
DiscussionAccording to Sabin5, the lymphatic system arises from five primitive buds that develop from the venous system. This is completed by the second month of gestation. From these buds, paired jugular sacs, paired posterior sacs in proximity to the sciatic veins, and a single retroperitoneal sac are formed. Lymphangioma is generally acknowledged to be a disease of childhood during which time there is active lymphatic growth. Lymphangiomas can occur from birth up to the first 2 years of life.
The predominant site of lymphangiomas is in the head and neck region, and this may be related to the anatomic location of the embryologic sacs6.
Lymphangiomas are classified into three subtypes7: (1) lymphangioma simplex, composed of capillary-sized, thin walled lymphatic channels; (2) cavernous lymphangioma, composed of dilated lymphatic channels, often with fibrous adventitial coats; and (3) cystic lymphangioma or hygroma, composed of cysts varying
from a few millimeters to several centimeters in diameter. Clinically, the lymphangiomas that arise in the tongue show macroglossia with irregular translucent, grape-like vesicles of lymphatic origin. Most lingual lymphangiomas are simple or cavernous lymphangiomas, and affect the dorsum of the tongue.
The anterior two -third on the dorsal surface of the tongue is the most common site for intra oral lymphangioma leading to macroglossia3,4.
The various treatment modalities for lymphangioma are surgical excision, radiation therapy, cryotherapy, electrocautery, sclerotherapy, steroid administration, embolization and ligation8,9, laser surgery with ND-YAG10-12,CO213,14,and radio-frequency tissue ablation technique15.
The method used in this case is best suited for lymphangiomatous lesions in the anterior-middle portion of the tongue has the following advantages: 1) After healing, the shape resembles a normal tongue and the suture line resembles the median furrow; 2) The movements of the tongue are not impaired and so articulation is facilitated; and 3) The inverted V-shaped incision leaves normal tissue on the lateral margins of the tongue, which contains taste buds.
References1. NevilleBW, DamnDD,Allen CM. Oral and Maxillofacial
Pathology. WB Saunders: Philadelphia; 1995. p. 395.2. Jeeva Rathan J, Harsha Vardhan BG, Muthu MS, V,SaraswathyK,
Sivakumar N. Oral lymphangioma:A case report. J Indian Soc Pedod Prev Dent 2005;23:185-189.
3. ShaferWG, HineMK, LevyBM. Developmental disturbances of the tongue. textbook of Oral Pathology. 4th Edn.WB Saunders Co: 1983. p. 159-60.
4. Bernnan TD, MillerAS, Chen S. Lymphangiomas of the oral cavity:Aclinicopathologic, immunohistochemical and electron microscopic study. J Oral Maxillofac Surg 1997;55:932-5.
5. Sabin FR. The lymphatic system in human embryos, with a consideration of the morphology of the system as a whole. Am J Anat 1909: 9: 43–91.
6. Brooks JE. Cystic hygroma of the neck. Laryngoscope 1973: 83: 117–128.
7. Landing BH, Farber S. Tumors of the cardiovascular system. Atlas of Tumor Pathology, Section 3, Fascicle 7. Washington, DC: Armed Forces Institute of Pathology 1956: 1–138.
Figures 3: Intra operative view
Figures 4: Closure
Figures 5: Post - operative view

139Indian Journal of Public Health Research & Development. April - June, 2012, Vol. 3, No. 2
8. Chappius IIP. Current aspects of cystic lymphangioma in the neck. Arch De Pediatre 1995;1:186-92.
9. Hellman JR ,Myer CM, PrengerEC. Therapuetic alternatives in the treatment of life threatening vasoformative tumors.AmJOtolaryngol 1992; 13:48-53.
10. Suen J, Waner M. Treatment of oral cavity vascular malformations using theNeodymium:YAG laser. Arch Otolaryngol Head neck Surg1991;115:1329-33.
11. Tasar F, Turner TF, Sener BC, Sencift K. Lymphangioma treatment with NdYAG laser. Turk JPediatr 1995;37:253-6.
12. Dixon JA, Davis RK, Gilbertson JJ. Laser photocoagulation of vascular malformation of the tongue. Laryngoscope 1986;96:537-41.
13. Balakrishnan A, Bailey CM. Lymphangioma of the tongue. A review of pathogenesis, treatment and the use of surface laser photocoagulation. J Laryngol Otol 1991;105:924-29.
14. Barak S, Katz J, Kaplan I. The CO2 laser in surgery of vascular tumors of the oral cavity in children. J Dent Child1991;58:293-6.
15. Cable BB, Mair EA. Radiofrequency ablation of lymphangiomatous macroglossia. Laryngoscope 2001; 11:1859-61.

140 Indian Journal of Public Health Research & Development. April - June, 2012, Vol. 3, No. 2
A Study of disabilities among children (0-14 years) in rural field practice area of Rural Medical College, Loni, MaharashtraRajagopal Rao Kodali1, Chandrasekhar Ch.2
1Associate Professor, Department of Community Medicine, 2Statistician, Dr. Pinnamaneni Siddhartha Institute of Medical Sciences & Research Foundation, Chinaoutpalli, A.P.
Abstract
Objectives1. To find out the prevalence of multidisciplinary disabilities. 2. To assess the relationship between the disabilities & socio economic and cultural factors.
MethodologyThe study area comprises of 8 villages under rural field practice area of Rural Medical College, Loni. 7300 children of the age group of 0-14 yrs from the total population of 20,533 were studied by Community based Cross Sectional study. House to house survey was conducted to identify disabled children using a pre tested questionnaire by interview technique.
ResultsThe overall prevalence rate of disabilities in children was 2.25%. The prevalence rate for Hearing & Speech impairment was more(1.34%) followed by locomotor disability(0.32%), Visual impairment(0.23%), Mental retardation(0.19%) and Multiple & Miscellaneous disability(0.17%). The disability was more in boys, in higher age groups, among Muslims, children of laborers, family size of four and above and in the lower socio economic class.
Key WordsDisabilities, Prevalence, Socio-economic status.
IntroductionDisability has been defined as “any restriction or lack of ability to perform an activity in the manner or within the range considered normal for a human being”1.
According to World Health Organisation’s estimates, approximately 10% of a given population suffer from disability of one kind or other. There were no comprehensive surveys to know the exact incidence of disability in India.
Government of India Census 2001 has included disability, a separate question and revealed that 80 per cent of
the disabled children were in rural areas. The major preventable causes of disabilities are malnutrition, communicable diseases, early childhood infections and accidents at home and work place. Early detection of impairment, combined with early and effective curative care can make a significant impact in minimizing or compensating for impairment and its consequences2.
Persons with disabilities who belong to poor families are marginalized and disadvantaged by variety of factors such as lack of access to productive resources & to opportunities, and lack of information and skills which enable participation in social, economic and political process. Some groups such as women and girls are more vulnerable to disabilities. It was estimated that only 2 to 3% of disabled in the need of rehabilitation have access to the services.
Persons with disabilities frequently live in deplorable conditions, facing barriers that prevent their integration and meaningful participation in mainstream society. The basic human rights to freedom of movement, access to education and health care are often ignored. Because they suffer the additive difficulties of their disability, marginalization and invisibility, their health, especially their mental health may deteriorate even further3.
The persons with disabilities and their family members are socially, economically and emotionally affected. The negative attitudes of the abled persons in the family and in the community are the greatest obstacles to full participation and equalization of opportunities.
Society’s understanding and approach to the issues of the disabled has been fast changing for the past 30 years. Newer advances in technology, new civil rights movements, greater number of disabled people making their marks in different social, political, economic and other sectors have helped in mainstreaming of the disabled citizens4.
The establishment of Rehabilitation Council of India has been a major move for quality assurance in the education, training and management of persons with disabilities. Persons with Disabilities (Equal opportunities, Protection of rights and Full participation) Act,1995 fixes the responsibilities on central and state governments to provide services, create facilities and give up support to the people with disabilities in order to enable them to have an equal opportunity in participating as well as

141Indian Journal of Public Health Research & Development. April - June, 2012, Vol. 3, No. 2
productive and contributing citizens of the country to their fullest extent5.
A new strategy termed Community Based Rehabilitation (CBR) was evolved and found extremely useful to rehabilitate persons with disabilities in the community setting and with community participation.
Prevention, early identification, intervention, rehabilitation, integration and inclusion of all persons with disabilities are the concept of today, where by such people also have a right to their family and to a natural environment.
Material & MethodsStudy area : The study area comprises of 8 villages under rural field practice area of Rural Medical College, Loni (Maharashtra). Study population: 7,300 children in the age group of 0-14 yrs from the total population of 20,533. Study design: The data has been collected through a well designed community based cross sectional study. Sample size determination: The prevalence of disability among children in rural area was considered as 5% (P) for computation of the sample size. Keeping the confidence level as 95% and the relative result of the survey results as 10% of P i.e. 0.5%,the sample size was calculated by using the formula n=Z21-α/2(1-P)∑2P where Z=1.96(C.L=95%) P=5% ∑=0.5%(10% of P=5). The sample size has been arrived at 7229 rounded to 7300. Selection of study population / Sample survey methods : House to house survey was conducted to identify disabled children using a pre tested questionnaire. The data was collected through interview technique. Respondent was the head of the family or parent or close relative of the children in the house. Quality assurance of the data: Daily checking of the 10% of the filled questionnaire by the senior colleague in the department. Results were discussed with senior colleagues and summarised. Statistical analysis and interpretation of data: Data collected has been presented through frequency distribution tables, cross tables and graphs. Interpretation of the results were done using percentages, proportions and tests of significance – Chi square test.
ResultsTable 1: Distribution of children with disabilities by the Type & Prevalence of disability
Type of disability Number Prevalence rate per 100
Locomotor 23(14.02%) 0.32
Mental retardation 14(08.54%) 0.19
Visual impairment 17(10.36%) 0.23
Hearing & Speech 98(59.76%) 1.34
Multiple & Miscellaneous
12(07.32%) 0.17
Total 164(100%) 2.25
Table 2: Distribution of children by Age & Sex
Sex 0-4 yrs 5-9 yrs 10-14 yrs TotalMale 16 49 45 110(67%)Female 05 19 30 54(33%)Total 21 (12.81%) 68 (41.46%) 75 ( 45.73%) 164 (100%)Chi square= 3.25
D.F.= 2 P > 0.05
Table 3: Distribution of children by Religion
Religion Children 0-14yrs Children with disabilities
Hindu 6266 (85.84%) 136 (82.92%)
Christian 122 (01.67%) 01 (0.61%)
Muslim 912 (12.49%) 27 (16.47%)
Total 7300 (100%) 164 (100%)
Chi square = 3.413 D.F.=2 P value : 0.1815
Table 4: Distribution of children by Parent’s Occupation.
Occupation of head of household
Total children Children with disabilities
Farmer 3073(42.10%) 43(26.22%)
Laborer 2748(37.64%) 81(49.40%)
Business 557(07.63%) 20(12.19%)
Service 922(12.63%) 20(12.19%)
Total 7300(100%) 164(100%)
Chi square = 20.80 D.F.=3 P value : 0.0001
Table 5: Distribution of children by Family Size
No. of living children
Children (0-14yrs) Children with Disabilities
1 112(01.54%) 01(00.61%)
2 812(11.12%) 28(17.07%)
3 1211(16.59%) 37(22.56%)
4+ 516(57.75%) 98(59.76%)
Total 7300(100%) 164(100%)
Chi square = 12.75 D.F. = 3 P value : 0.0052
Table 6: Distribution of children by Socio–economic status *
Socio-economic status
Children (0-14yrs) Children with disabilities
Upper 179(0.23%) ---
Upper middle 197(02.70%) 02 (01.22%)
Lower middle 454(06.22%) 14 (08.54%)
Upper lower 1940(26.58%) 43 (26.22%)
Lower 4692(64.27%) 105 (64.02%)
Total 7300(100%) 164(100%)
*Modified B.G.Prasad’s Socio-economic status classification
Chi square = 2.811 D.F.=3 P value : 0.4217
DiscussionThe prevalence rate of disability is 2.25%. Major disability is Hearing and Speech impairment followed by Locomotor disability, Visual impairment, Mental retardation and less is Multiple disabilities. The prevalence rate of

142 Indian Journal of Public Health Research & Development. April - June, 2012, Vol. 3, No. 2
disabilities was less than the estimated figure of 10% of world population by WHO1, but was falling within the range of 2-5% of the Indian population as estimated by Rehabilitation Council of India5. The disability was more than double in boys as compared to girls as reported by Joshi & Sharma(1971)7, but reported equally by Mathur et al..8. The disability was low in lower age group than those in higher age group of children except in Cerebral Palsy which was more in lower age group.
The prevalence of disability was more among Muslim children and less in Christians. It may be because of the common practice of consanguineous marriages and large family size as reported by Vidyabhushan and Sachdeva DR(2003)9. The highest disabilities were observed among children of laborers followed by farmers and lowest among children of businessmen and service people. This may be because of low socio economic status of laborers and farmers with poor nutritional status, poor living conditions and poor utilization of health services.
The disabilities were more with the family size of four and above and less with the size of one, may be due to poor maternal factors and poor utilization of health services. The disabilities were proportionally decreasing with the increasing socio economic status clearly indicating the inverse relationship as was observed by, Mathur et al (1985)8.
ConclusionThe rural community should be made aware of consanguineous marriages and such marriages to be discouraged. The adolescents to be educated about the age at marriage as early pregnancy increases the disability risks. Ensure provision and utilization of Reproductive & Child Health services, especially safe delivery and family planning practices as the disabilities were observed more in home deliveries conducted by untrained personnel, large family size and increased birth order. Complete immunization of all the children is to be ensured. Nutritional education to be imparted. Safety education must be incorporated in the school curriculum.
AcknowledgementsThe authors are grateful to Dr.R.C.Goyal, Ex. Professor and Head, Department of Community Medicine, Rural Medical college, Loni for his constant inspiration, encouragement, expert guidance and total involvement in the study. The teaching faculty of Community Medicine and the respondents of the study are greatly acknowledged for their cooperation.
References1. WHO(1980). International Classification of Impairments,
Disabilities, Handicaps. WHO, Geneva.2. Vijay Agarwal-Disabled child, Disability India Journal, April
2003, (www.disabilityindia.org.)3. Council for Advancement of People’s Action and Rural
Technology – A strategy to promote the participation of people with disabilities in programmes for rural development, CAPART, New Delhi,2000.
4. Mathew Nampudakam – Disabled or differently abled, Health for Millions, Nov-Dec, vol 26, no.6, pp 3.
5. Rehabilitation Council of India – Manual for training of PHC Medical Officers, Ministry of Social Justice and Empowerment, Government of India, New Delhi, 2001.
6. Bajpai P K – A flower without a petal is still a flower, Social Welfare; Sept.1999.
7. Joshi & Sharma – Health of industrial workers and families; Bharat medical Journal; xi(3);1971
8. Mathur, Saroj, Bhalerao Vr, Rajesh Kumar –Partitioning of disabilities in slums and low income group of Parel village, Mumbai; Indian Journal of Community health, 1(2);pp.1-4
9. Vidyabhushan, Sachdeva DR – An introduction to sociology; Kitab mahal, Patna, 2003; pp.875-877.

143Indian Journal of Public Health Research & Development. April - June, 2012, Vol. 3, No. 2
Left unilateral super numerary renal artery- A case reportSugavasi Raju1, G.Kanchana Latha2, Anandakumar L.3
1Tutor, Department of Anatomy, 2Professor & HOD, Department of Anatomy, 3Asst. Professor, Department of Forensic Medicine, Rajiv Gandhi Institute of Medical sciences, R.I.M.S Medical College, Kadapa- 516002, A.P., India
AbstractVariations of renal arteries are considered critical issues that surgeons should have through envision and appreciation of the condition. Variations of these vessels may influences urological. renal transplantation and laparoscopic surgeries. We present a case of left side unilateral accessory renal artery with a striking pre- hilar branching pattern noticed by routine dissection. The left kidney received two renal arteries from the aorta as a 02 separate trunks to hilar region. However the right side renal artery originated from the aorta as a single trunk and then followed by two divisions supplying the right kidney. Hear we discuss embryological origin and clinical aspects of accessory renal artery.
Key WordsAnatomical variations, Renal artery, supernumerary, aberrant renal artery.
IntroductionAccessory renal arteries are present 30% of the individuals, they supply upper or lower pole of the kidney either passing through the hilum or their poles. The variation renal arteries are among the most critical arterial variations that should be meticulously addressed by vascular and transplants surgeries.
Renal arteries branch laterally from the aorta just below the origin of the superior mesenteric artery. Both crosses the corresponding crus of the diaphragm at right angle to the aorta. The right renal artery is longer and often higher, passing posterior to the inferior vena cava, right renal vein and head of pancreas. A single renal artery to each kidney is present in 70% of individuals, the artery vary in their level of origin, their Calibri, obliquity and precise. In most individuals single renal artery arising from the aorta at the level of L2 vertebral body supplies each kidney. These usually arise from the aorta or iliac arteries any where at the level of T11 to L4 or rarely from the lumbar, suprarenal, celiac trunk. Superior accessory artery is a separate apical artery and an inferior accessory artery is a separate lower segmental artery. Accessory arteries to the Polar Regions are usually smaller than the accessory hilar arteries.
Case ReportDuring the routine dissection classes for I MBBS students in the department of Anatomy at RIMS Medical College, Kadapa, AP, and India. We noticed an accessory renal artery at the left side of aorta in a 40 years Male cadaver (Fig: 01.) It was located at lateral side of aorta originated directly from the aorta running parallel to the main trunk of renal artery and reaching the hilum. The length, Calibri is equal to the main trunk then it divides into 2 segmental arteries as a pre hilar pattern and reached the hilum. The left gonadal artery is originated from the left main trunk of renal artery.
DiscussionRegarding the increasing the number of renal transplantations, vascular re construction and urological surgery the Knowledge of the variations in renal artery supply is of significance. Renal arteries are terminal vessels which necessitate the removal of that segment of the kidney supplied by accessory arteries which its ligation. Accessory renal arteries tend tom be longer and narrower than main renal arteries resulting in lower perfusion pressure and higher resistance across artery. Accessory renal arteries most often pass anterior to the ureter so that pressure causes obstruction and hydro nephrosis. Renal blood supply undergoes successive changes during embryonic development that is concomitant with migration of metanephros.
Fig. 1: Arrow showing the left side supernumerary Renal Artery

144 Indian Journal of Public Health Research & Development. April - June, 2012, Vol. 3, No. 2
References1. Sikes D (1963) the arterial supply of the human kidney with
special reference to accessory renal arteries: Br J Surg 50:368-374.
2. Anson BJ, Cauldwell EW, Pick JW, Beaton LE (1947) the blood supply of kidney, suprarenal gland, and associated structures.
Surg Gyn OBST 84:313-320.3. Grays Anatomy: 39th Ed Human Anatomy4. A.K Datta: 06th Ed Essential of human Anatomy, thorax and
abdomen.5. Khamanarong K, Prachaney P, Utraravichien A, Tong UN T
Sripaorayak (2004) Anatomy of renal arterial supply. Clin Anat 17:334-336

145Indian Journal of Public Health Research & Development. April - June, 2012, Vol. 3, No. 2
Trichobezoar – A case report and literature overviewSaila Rekha N1, Murali Mohan K.V2, Sampath Kumar K.L3, Subba Rayudu K4
1Assistant Professor of Pathology, 2Professor and HOD of Pathology, 3Associate Professor of Surgery, 4Assistant Professor of Surgery, RIMS Medical College, Kadapa
AbstractA sixteen year old girl was admitted in the hospital with a history of continuous pain and vomiting since five days. She has similar complaints intermitantly since five years. Other medical history, serum biochemistry and mental status were normal. On physical examination, a nontender mass was found in the epigastrium. Abdominal Ultrasound showed a dilated stomach filled with large ill defined mass with mixed echogenicity. Endoscopy showed a mass with entangled hair and stucked food particles. At laparotomy a large hair ball completely filling the stomach and entending to first part of duodenum is removed. The patient had a satisfactory post operative convalescence.
KeywordsVomitting, Abdominal pain, Epigastric mass, Trichobezoar.
IntroductionTrichobezeor is rare but an interesting clinical entity. Some children develop the habit of swallowing hair from their dolls, brushes or blankets1. The word bezoar probably originated from the arab word ‘bedzehr’, the Persian word Padzahr’ or the Herbian word ‘beluzzer’, all meaning antidote2. Bezoars are concretions of human or vegetable fibres that accumulate in the gastrointestinal tract of which the most common type is trichobezoar (made of hair), while the other types are made up of vegetable or fruit fibre (phytobezoars), milkcurd (lactobezoars), or any indigestible material3. Most commonly present in adolescents and during second decade of life. We present a case of trichobezoar in a 16 year old female with normal mental and physical behavior.
Case ReportA 16 year old female girl was admitted with complaints of continuous vomiting and pain abdomen since 5 days. History revealed same complaints on and off previously since five years. Examination revealed an epigastric mass extending upto left hypochondrium which was hard and nontender. Routine blood counts, serum biochemistry and anthropometric measurements were normal. No hair loss was evident. X ray of abdomen showed a dilated stomach and Ultrasound showed dilated stomach filled
with a mass of mixed echogenicity. Endoscopy showed a mass with hair and food particles stuck over it. Psychiatric examination was absolutely normal. Complementary history, gathered retrospectively revealed trichophagia. As breaking and dislodging of the mass during endoscopy failed, laparotomy was undertaken. At laparotomy a large hair ball, J shaped, filling the stomach, extending into the first part of duodenum (measuring 22/8/5 cms) was removed. It is black in colour, with stucked up food material and foul smelling odour. The post operative recovery was uneventful.
DiscussionFor centuries, bezoars have been known to occur in the form of undigested masses found in the stomach of animals and humans4. There are several different form of presentations. It may be limited to esophagus, stomach or extend upto duodenum, jejunum or to Ileum. They may also occur as complications in clinical conditions that causes stasis within the gastrointestinal tract such as motility disorders and mechanical obstruction5. They may occur in persons with normal mental status with out any bahavioural abnormality or may be associated with early childhood neglect or abuse or psychiatric disorders6. They grow slowly over many years and form a cast in the shape of the stomach, some times extending to the small bowel7. The engulfed hair which escape the peristaltic propulsion, get entrapped within the gastric mucosal folds and with increased accumulation, the hair getted matted up resulting in a ball formation due to churning action of stomach3. Halitosis may be present due to decomposition and fermentation of fats trapped in the interstices of the bezoar8,9. The acidic contents of the stomach denature the hair protein and give the bezoar it’s black colour10. Rapunzel Syndrome is arare form of trichobezoar with various descriptions in the literature. Some define it as a gastric bezoar with tail extending upto jejunum or beyond to ileocaecal junction; some define it as a bezoar of any size which can cause intestinal obstruction11,12. Most of the cases are reported in the countries where women traditionally have long hair. The patients remain asymptomatic for many years. Symptoms develop as the bezoar increase in size to the point of obstruction. The common presenting features are abdominal pain, mass and vomiting. Other manifestations include upper digestive tract bleeding,

146 Indian Journal of Public Health Research & Development. April - June, 2012, Vol. 3, No. 2
anemia and bowel intussusception4 . Though ten percent of patients have ulceration; perforating in about 30% of them, death is rare13,14,15,16,17. Traditionally, a gastric trichobezoars were removed by gastrotomy through an uppermidline laporatomy. Since the advent of minimally invasive surgery, surgeons now use laparoscopic techniques for removal of small to moderate sized bezoars18,19.
Conclusion
Even though rarely seen in digestive tract diseases, the probability of bezoar should always be remembered in patients with vomiting and abdominal mass. After the removal of bezoar, precautions should be taken against recurrence by behavioural treatment.
References 1. N.Kumar, S.Kumar, A.Parkash and K.P.S.Varma. Trichobezoar.
Indian J. Pediat. 1970; 37: 160-62.2. Ashwani K. Sood, L.Bahi, R.K.Kaushal, V.K.Sharma and N.Grover.
Childhood Trichobezoar. Indian Journal od Pediatrics, 2000, Volume 67; 390-91.
3. Gonuguntla.V, Joshi.D. Rapunzel Syndrome: A Comprehensive Review of an Unusual Case of Trichobezoar. Clin Med Res. 2009
september; 7(3):99-102.4. Lopes L, Oliveira.P, Pracucho. E, Andreollo.N. The Rapunzel
Syndrome- An Unusual Trichobezoar Presentation. Case Report Med. 2010
5. Esophageal Bezoar in a Patient with Achalasia; Case Report and Literature Review. Gut Liver,2010; 4 : 106-109.
6. Gockel I, Gaedertz C, Hain HJ, Winckelmann U, Albani MI, Lorenz D. Rapunzel syndrome; rare manifestation of a trichobezoar of uppergastrointestinal tract. J Chinurg 2003; 74: 753-756.
7. Andrus CH, Ponsky JL. Bezoar: Classification, pathophysiology and treatment. Am J Gastroenterol.1988; 83: 476-478.
8. Caglayan Kmd, Koc A MD, Isler B MD, Dogan H MD, Kutluk AC MD. Israeli Journal of Emergency Medicine. 2008; 9: 5-7.
9. Sidhu BS, Singh G, Khanna S; Trichobezoar. J Indian Med Assoc. 1993; 91: 100-101.
10. Sharma V, Sahi RP, Misra NC. Gastro- intestinal bezoars. Indian Med Asso. 1991; 89: 338-39.
11. O’Sullivan MJ, Mcgreal g, Walsh jg, Redmond HP. Trichobezoar. J R Soc Med .2001; 94: 68-70.
12. Kapar A, Deeg KH, Schmidt K, M eister R. Rapunzel syndrome, a rare form of intestinal trichobeoar. Klin Paediatr 1999; 211; 420-22.
13. Taylor TV, Torrance BH. Trichobezoar presenting as an unusual mass, J R Coll Sug Edinb. 1975; 20(2):128-130.
14. Koc. O, Yildiz FD, Narci A, Sen TA. Unusual cause of gastric perforation in childhood: trichobezoar (Rapunzel syndrome). A Case report. European journal of prdiatrics.2009; 168(4): 495-497.
15. Mohite PN, Gohil AB, Wala HB, Vaza MA. Rapunzel syndrome complicated with gastric perforation diagnosed on operation table. Journal of Gastrointestinal Surgery. 2008; 12(12): 2240-42.
16. Mateju E, Duchanova S, Kovac P, Moravansky N, Spitz DJ. Fatal case of Rapunzel syndrome in neglected child. Foensic Sci Int. 2009 sep 10; 190(1-3): e5-7.
17. Jilendar Singh G, Mitra SK. Gastric perforation secondary to recurrent trichobezoar. Indian J Pediatr. 1996; 63: 689-91.
18. Groenwald CB, Smoot RL, Farley DR. A football-sized gastric mass in a healthy teen. Contemp Surg 2006; 62: 531-34.
19. Eryilmaz R, Sahin M, Alimo glu O, Yildiz MK. A Case of Rapunzel Syndrome. Ulus Travma Acil Cerrahi Derg 2004; 10: 260-63.
Fig. 1: Trichobezoar measuring 22 / 8 / 5 cms.

147Indian Journal of Public Health Research & Development. April - June, 2012, Vol. 3, No. 2
A pilot study comparing Propofol-Thiopentone Admixture with Propofol-Ketamine Admixture for ambulatory anaesthesia at SIMS, Ghaziabad, Uttar PradeshSanjay Kumar Lal1, Ritu Goyal2, Sharad Goel2, Saurabh Goel3
1Assistant Professor, 2Associate Professor, Department of Anaesthesia, 3Assistant Professor, Department of Surgery, Saraswathi Institute of Medical Sciences, N. H.- 24 Anwarpur, Hapur, Ghaziabad, U.P.245304
AbstractIn the present study, we aimed to compare the efficacy, tolerability, cardiovascular stability and recovery profile of propofol-thiopentone admixture with propofol-ketamine admixture in patient undergoing short surgical procedures. Sixty ASA grade I and II patients, age group 20-50 years of either sex scheduled for elective ambulatory surgical procedures were included. Patients were randomly allocated in two groups. Patients in group PT(n=30) were induced with admixture containing 10 ml of 1% propofol and 10 ml of 2.5% thiopentone and in group PK(n=30) were induced with admixture containing 10 ml of 1% propofol and 10 ml of 0.5% ketamine till loss of verbal response. Top up doses for maintenance were given as 2ml aliquots of the study drug. Induction dose and total maintenance dose of the drug, pain on injection, episode of apnoea, incidence of laryngospasm, bronchospasm, cough, hiccup and emergence phenomenon were recorded. Patients were monitored for pulse rate, non-invasive systolic and diastolic blood pressure through out the procedure. Recovery and discharge time was recorded. Induction and total maintenance dose of propofol was significantly high in group PT as compare to group PK. Patients in group PK have more stable haemodynamic profile as compare to patients of group PT. Incidence of side effects like apnoea and pain on injection were more in patients of group PT. The recovery and discharge time of the patients of both groups were comparable so it was concluded that combination of propofol and ketamine gives better efficacy and tolerability in terms of dose requirement, cardiovascular stability, less frequent side effects without affecting discharge profile as compare to propofol and thiopentone admixture.
KeywordsAnaesthetics, Intravenous, Propofol, Thiopentone, Ketamine, Ambulatory anaesthesia.
IntroductionOne of the most dramatic transformations in health care delivery during the past three decades is general anaesthesia for a very short duration, which can be achieved by short acting intravenous anaesthetic agents.
This allows early ambulation and thus, is less disruptive to patients personal life; reducing separation from family and work, reduction of nosocomial infection and patient anxiety.
Propofol, a short acting intravenous inducing agent has emerged as ‘gold standard’ for day care anaesthesia but its tendency to cause apnoea, pain on injection and cardiovascular instability offsets its use. Various agents have been used in combination with propofol to make an ideal anaesthetic regime for ambulatory anaesthesia. Previously propofol has been combined with thiopentone1 or ketamine2. In this study we aimed to compare the efficacy, tolerability, cardiovascular stability and recovery profile of propofol-thiopentone admixture with propofol-ketamine admixture.
Material and MethodAfter institutional board approval 60 adult patients of age group 20-50 years, body weight between 35-80 Kg of either sex, ASA grade I and II who were scheduled for elective ambulatory surgical procedures were included in this study. A thorough pre-anaesthetic evaluation including complete history, clinical examination and investigations were done. Patients with history of hypertension, ischemic heart disease, psychiatric illness, on medication like psychotropic drugs or opioids, history of allergy to study drug were excluded. All patients were instructed for fasting of 8 hours preoperatively and each patient was thoroughly explained about the procedure and written consent was obtained. After taking patient in operation theatre base line pulse rate, blood pressure, respiratory rate and Spo2 was recorded and continued through out the surgical procedure. A good intravenous line established. Patients were premedicated with injection ondansetron 4mg five minutes before induction and were randomized in following two groups.
Group PT- Admixture containing 10 ml of 1% propofol and 10 ml of 2.5% of thiopentone.
Group PK- Admixture containing 10 ml of 1% propofol and 10 ml of 0.5% ketamine.
The admixtures were indistinguishable from propofol visually. The study drugs were prepared freshly in the operation theatre by the anaesthesiologist who was not involved in the observations. Patients and observer were

148 Indian Journal of Public Health Research & Development. April - June, 2012, Vol. 3, No. 2
kept blind about the drug administered. Patients were induced with the admixture according to their group at a rate of 4ml per 10 second till loss of verbal response and total induction dose was noted. Patients were maintained on oxygen and nitrous oxide (1:1) by Bain circuit through out the procedure. Top up doses for maintenance of anaesthesia were given as 2ml aliquots of the study drug as and when required, which was judged by lighter plane of anaesthesia (increased heart rate, tearing and movement of limbs). Total amount of drug given for maintenance was also recorded and total duration of surgery in both groups was recorded.
Pain on injection, episode of apnoea, incidence of laryngospasm, bronchospasm was noted and lungs were manually ventilated by bain circuit if episode of apnoea occurred or Spo₂ decreased to less than 90%. Recovery time was calculated from last dose of drug till patient followed verbal command. All patients were shifted to recovery room and later on discharged when they met the standard guideline for safe discharge which includes stable vital signs, return to baseline orientation, ambulation without dizziness, minimal pain and PONV and minimal bleeding at surgical site3. Data is presented as number of patients or mean±SD. Statistical analysis between groups was done by using unpaired ‘t’ test.
ResultDemographic data of patients of both groups were comparable (table-1). Preinduction baseline haemodynamic parameters were also comparable. The mean value of induction agent in group PT is significantly high (14.9±2.17ml) as compared to PK group (9.8±1.03ml). Similarly total maintenance dose of drug in group PT is significantly high (13.96±1.98ml) as compared to PK group (11.8±3.67ml) as shown in table 2. On comparison of recovery and discharge time between both groups, it was found that recovery and discharge time of patients in both groups were statistically not significant (table 3). Analysis of haemodynamic data during the procedure showed that there was highly significant fall in systolic blood pressure after induction in PT group, which
recovered at 30 minutes after induction. In PK group, systolic blood pressure showed significant fall at 5 minutes after induction and which become non significant at 10 minutes (fig. 1). In group PT fall in diastolic blood pressure at 5, 10, 15, and 20 minutes was highly significant and recovered to non significant level at 30 minutes. Similarly, fall in diastolic blood pressure in group PK at 5, 10, 15, and 20 minutes was highly significant and recovered at 25 minutes (fig.2). In group PT pulse rate showed highly significant fall at 5 minutes after induction which showed a similar pattern through out the procedure and did not return back to baseline value till the completion of surgical procedure. In group PK pulse rate decreased at 5, 10, 15, 20, minutes which was highly significant statistically but, became non significant at recovery of patient.
Incidence of pain on injection of propofol was present in eight patients in group PT as compare to no pain on injection in group PK. Episodes of apnoea was present in four patients in group PT while there was no incidence of apnoea in group PK. Incidence of cough and hiccup was found in one patient of each group whereas emergence phenomenon occurred in one patient of group PK (table-4).
Discussion Ambulatory surgeries offers a number of advantages like patient preference, lack of dependence on availability of hospital bed, greater flexibility in scheduling operations, low morbidity and mortality, lower incidence of infection, lower incidence of respiratory complications, greater
Table 1: Demographic profile
Group PT Group B P value
Age (mean±sd) 30.16±9.26 31.20±8.76 NS
Sex (M/F) 14/16 18/12
Weight(kg) mean±sd 53.16±9.52 51.24±10.4 NS
Duration of surgery(min.) mean±sd
22.24±3.82 21.46±4.31 NS
Table 2: Induction and total maintenance dose of admixtures
Group PT Group PK P value
Bolus dose(ml)(induction dose)
14.9±2.17 9.8±1.03 Significant
Total top up dose(ml) 13.96±1.98 11.8±3.67 Significant
Fig. 1: Comparison of change in systolic blood pressure from baseline among the two groups at different time intervals.
-7
-6
-5
-4
-3
-2
-1
0
5 min 10 min 15 min 20 min 25 min 30 min Recovery
Group PT
Group PK
Fig. 2: Comparison of change in diastolic blood pressure from baseline among the two groups at different time intervals.
-10
-9
-8
-7
-6
-5
-4
-3
-2
-1
0
5 min 10 min 15 min 20 min 25 min 30 min Recovery
Group PT
Group PK

149Indian Journal of Public Health Research & Development. April - June, 2012, Vol. 3, No. 2
efficiency, short surgical waiting lists and low procedure cost4. Because of this ambulatory surgeries are gaining popularity now a day. The rapid growth of ambulatory surgeries would have not been possible without the changing role of anaesthesiologist and development of more highly titrable anaesthetic drugs. The availability of rapid shorter acting anaesthetic, analgesic and muscle relaxant drugs has facilitated the recovery process, allowing more procedures to be performed under day care anaesthesia. Propofol, a newer short acting intravenous inducing agent, is preferred because of its fast recovery and minimum post operative complications. But, propofol has some potential disadvantages which can be offset by combining it with other inducing agents like thiopentone, ketamine and opioids. Admixture of thiopentone and propofol is compatible and stable5,6,7. This admixture does not support the growth of micro-organisms despite the presence of nutrients in the admixture8. Admixture of thiopentone and propofol has been previously used by Naguib M and et al1 and Jones D et al9, both authors said admixture of thiopentone and propofol results in additive hypnotic effect, a reduction in pain of injection and reduced hypotensive response while Chilvers. M et al10 said that addition of thiopentone to propofol does not delay recovery from anaesthesia and even does not increase post operative analgesic or anti emetic requirement. W.H.Wong11 also studied hypnotic effect of propofol and thiopentone and concluded that effect is additive at dose ranging for induction of anaesthesia.
Addition of ketamine to propofol in sub anaesthetic dosses has gained attention in ambulatory anaesthesia because of its analgesic properties. Psychotomimetic effects of ketamine at analgesic doses (sub hypnotic) have also been reported12,13. These psychotomimetic side effects can be minimised by administration of propofol2,14,15.
Sympathomimetic effect of ketamine can be attenuated when administered in combination with propofol. This haemodynamic stability of propofol and ketamine combination makes it more suitable for use during ambulatory anaesthesia. Respiratory depression with small doses of ketamine is very minimal.
In this study, we did a prospective randomised study of 60 patients comparing propofol- thiopentone admixture with propofol-ketamine admixture in patients undergoing short surgical procedures. In our study dose of propofol required for induction as well as total dose of propofol for maintenance was less in PK group. The hypnotic and anaesthetic action of ketamine-propofol were found to be additive. Because of lesser degree of propofol required along with ketamine, duration of recovery and discharge of the patients was not prolonged as compared to propofol-thiopentone group.
Per operative haemodynamic variable were found to be more stable in group PK, this may be because of cardio stimulant effects of ketamine counterbalanced by depressive effects of propofol which is in accordance to T.W Hue 2 and Kaushik Saha 16. The fall in blood pressure in group PT following induction appears to be due to vasodilatation and myocardial depression done by both drugs.
Pain of injection of propofol is attenuated by ketamine due to its central analgesic as well as peripheral action17. In our study, there was no incidence of pain on injection of propofol in group PK as compare to eight patients in group PT. Incidence of apnoea was absent in group PK as compared to 4 patients in PT group. Emergence phenomenon occur in only one patient of group PK while there was no significant difference in discharge time of both group patients which is more important in ambulatory anaesthesia.
In conclusion, combination of propofol and ketamine gives better efficacy and tolerability in terms of dose requirement, cardiovascular stability, less frequent side effects without affecting discharge profile as compare to propofol and thiopentone admixture.
Interest of conflict- None
References1. M. Naguib, A Sari Kouzel. Thiopentone-propofol hypnotic
synergism in patients. Br.J. Anaesth 1991; 67: 4-6.2. T.W. Hui, T G Short, W Hong, m T Suen,T Gin, J Plummer. Additive
interactions between proprofol and ketamine when used
Table 3: Recovery and discharge time.
Group PT Group PK P value
Recovery(min.) 7.45±1.59 7.87±1.97 NS
Discharge(min.) 102±22.06 103.28±14.67 NS
Table 4: Complications
Group PT Group PK
Pain on injection 8 0
Apnoea 4 0
Cough/hiccup 1 1
Emergence phenomenon 0 1
Fig. 3: Comparison of change in pulse rate from baseline among the two groups at different time intervals.
-10
-9
-8
-7
-6
-5
-4
-3
-2
-1
0
5 min 10 min 15 min 20 min 25 min 30 min Recovery
Group PT
Group PK

150 Indian Journal of Public Health Research & Development. April - June, 2012, Vol. 3, No. 2
for anaesthesia induction in female patients.Anesthesiology 1995; 82 : 641-647.
3. Chung F: Are discharge criteria changing? J clin Anesth 5: 645, 1993.
4. Miller RD, Cucchiara RFand Miller ED. Chapter 65, Page no.2213-2214, Anaesthesia. 5th edition. Churchill sssLivingstone, 2000.
5. Chernin EL, Stewart JT, Smiler B. Stability of thiopentone sodium and propofol on polypropylene syringes at 23 and 24ºc. Am J Health Syst Pharm 1996; 53: 1576-9.
6. Prankerd RJ, Jones RD. Physiochemical compatibility of propofol with thiopentone sodium. Am J Health Syst Pharm 1996; 53: 2606-10.
7. Lazar ER, Jolly DT, Tam YK, Hrazdil J, Tawfik SR, Clanachan AS. Propofol and thiopentone in a 1:1 volume mixture is chemically stable. Anesth Analg 1998; 86: 422-6.
8. Crowther J, Hrazdil J, Jolly DT, Galbraith JC, Greacen M, Grace M. Growth of micro organism in propofol, thiopental and a 1:1 mixture of propofol and thiopental. Anesth Analg 1996;82:475-8.
9. Jones D, Prankerd R, Lang C, Chilvers M, Bignell S, Short T. Propofol – thiopentone admixture – Hypnotic dose, pain on injection and effect on blood pressure. Anaesth Intensive Care 1999;27:346-56.
10. Chilvers M, Jones D, Rushmer J, Bignell S, Boots R, Prankerd R. Propofol-thiopentone admixture: recovery characteristics.
Anaesth Intensive Care 1999 ; 27: 601 - 609. 11. Wong WH, Lim TA & Lim KY. Isobolographic Analysis of the
Hypnotic Interaction Between Propofol and Thiopental. Malaysian Journal of Medicine and Health Sciences Vol. 6(1)
12. Bowdle TA, Radant AD, Cowley DS, et al. Psychedelic effects of ketamine in healthy volunteers: relationship to steady-state plasma concentrations. Anesthesiology 1998;88:82–8.
13. Krystal JH, Karper LP, Seibyl JP, et al. Subanesthetic effects of the noncompetitive NMDA antagonist, ketamine, in humans: psychotomimetic, perceptual, cognitive, and neuroendocrine responses. Arch Gen Psychiatry 1994;51:199–214.
14. Guit JBM, Koning HM, Coster ML, et al. Ketamine as analgesic for total intravenous anaesthesia with propofol. Anaesthesia 1990;46:24–7.
15. Idvall J, Ahlgren I, Aronson KF, et al. Ketamine infusions: pharmacokinetics and clinical effects. Br J Anaesth 1979;51:1167–72.
16. Kaushik Saha, M Saigopal, Rajini Sundar, M palaniappan, Anil C Mathew. Comparative evaluation of propofol- ketamine and propofl-fentanyl in minor surgery. Ind. J. Anaesth 2001;45(2): 100-103.
17. Tan CH, Onsiong MK, Kua SW. The effect of ketamine pre treatment on propofol injection pain in 100 women. Anaesthesia 1998; 53: 302-305.

151Indian Journal of Public Health Research & Development. April - June, 2012, Vol. 3, No. 2
Comparative analysis of variation in intraocular tension with vecuronium bromide and atracurium besylate: A prospective studyShailja Sharma1, Arati Srivastava2, Sharad Goel1, Vikrant Sharma3, Ashutosh Niranjan4
1Assistant Professor, 2Professor, Department of Anaesthesiology, 3Assistant Professor Ophthalmology, 4Professor, Department of Surgery, Saraswathi Institute of Medical Sciences, Hapur
AbstractIntraocular pressure is the pressure exerted by the contents of the eye against its containing wall. During general anaesthesia, the intraocular pressure can increase, rendering problems in ophthalmic surgery especially surgery on the eye bulb. Pre-treatment with non-depolarising muscle relaxant prevents fasciculation and so the intraocular pressure does not rise. This is a prospective randomized study of 100 patients divided into two equal groups, where we have compared the effect of vecuronium bromide and atracurium besylate on intraocular pressure. The intraocular pressure was measured before surgery, at the time of intubation and at every 10 minutes interval during surgery. All the data were analysed statistically using unpaired student t test. We concluded that vecuronium bromide has better control over intraocular pressure as compared to atracurium besylate.
Key WordsVecuronium bromide, Atracurium besylate, Intraocular pressure.
IntroductionRaised intraocular pressure during ophthalmic surgery may damage the contents of orbit, so it is mandatory to control the intraocular pressure during surgery. The main problems of general anaesthesia are the potential risk of coughing and straining post-operatively. There is also incidence of nausea and vomiting. These multifactorial factors may precipitate rise in I.O.P. Gold Smith reported that there is marked rise in I.O.P. following intubation with gallamine as muscle relaxant1. According to Hollyoway, the general anaesthesia for intraocular ophthalmic procedures should provide stable intraocular pressure2. It has been observed that administration of vecuronium during steady state anaesthesia was associated with significant decrease in I.O.P. during normal sequence of induction following significant reduction after thiopentone3 The effect of atracurium drug on I.O.P. was studied by Al-Albarek and Samuel and it was observed that the use of neuromuscular blocking drug without cardiovascular side effects have some advantages4-5; although James et al concluded that atracurium when administered during steady state anaesthesia had no
significant effect on intraocular pressure6. The present work has been done to compare the effect of vecuronium and atracurium on intraocular pressure, so that the better drug could be use during ophthalmic surgery.
Patients & MethodThis study had been conducted in Saraswathi Institute of Medical Sciences, Hapur after obtaining the permission from the institutional ethical committee. The study had been conducted on patients between the age group of 18-50 years of ASA grade I admitted for various routine surgical procedures from September ‘09 to September’10. The patients with raised intraocular tension were excluded from this study. This is a prospective analysis of 100 patients divided randomly in to two equal groups. All the patients underwent a thorough pre-anaesthetic assessment and ASA grade I fit patients were explained about the procedure and informed written consent taken. All the patients were given tablet diazepam 10mg orally the night before surgery and were pre-medicated with intramuscular glycopyrrolate 0.2 mg/kg and pethidine hydrochloride 1.5 mg/kg about 45 minutes before surgery. The baseline intra ocular pressure was recorded in both eyes with Schiotz tonometer on the operation table, before the induction of anaesthesia. The pressure was measured by Schiotz tonometer with 5.5 gm plunger weight after anaesthetizing each eye of the patients with 4% xylocaine 1-2 drops in both eyes 3-4 times. The patients were pre-oxygenated for 3-5 minutes with 100% oxygen and then induced with 2.5% thiopentone sodium 4-5 mg/kg intravenous after the administration of intubating dose of muscle relaxant. The group I patients received vecuronium bromide, whereas group II received atracurium besylate as muscle relaxant for intubation. The dose of vecuronium bromide was 0.1 mg/kg whereas for atracurium besylate 0.5mg/kg. The intraocular pressure was measured just after induction with thiopentone sodium, immediately after intubation, at every 10 minutes interval after intubation and after reversal. After the surgery was completed, all the patients were reversed with 0.4mg of glycopyrrolate followed by 2.5 mg neostigmine sulphate. After extubation, the patients were ventilated with 100% oxygen with the help of mask, so that increase in intraocular pressure could be prevented. All the data were analysed statistically with the help of unpaired Student t test. The aim of this study

152 Indian Journal of Public Health Research & Development. April - June, 2012, Vol. 3, No. 2
was to compare the effect of these two non-depolarising types of muscle relaxants on intraocular pressure.
ObservationOut of 50 patients receiving vecuronium bromide, 20(40%) were male and 30(60%) were female. Maximum number of the patients i.e. 14(28%) were female in the age group of 20-30 years. In case of atracurium besylate group, the male were 26(52%) and female were 24(48%) and the maximum number of patients 12(24%) were female in the age group of 31-40 years (Table-1).
Table 1: Showing Age & Sex Distribution
Vecuronium Bromide Atracurium Besylate
Age (Yrs) Male Number
(%)
Female Number
(%)
Male Number
(%)
Female Number
(%)
20-30 8(16%) 14(28%) 8(16%) 12(24%)
31-40 4(8%) 12(24%) 10(20%) 8(16%)
41-50 8(16%) 4(8%) 8(16%) 4(8%)
The maximum number of 12(24%) female patients were in the weight group of 30-45 and46-50 kgs had received vecuronium bromide, where as the higher figure(16%) in male patients was encountered in 46-50 kgs age group. In case of atracurium besylate group, the maximum female patients (24%) were in weight group of 30-45 kgs and male patients (22%) were in weight group of 51-60 kgs(Table-2).
The changes in intraocular pressure were highly significant in 5minutes after intubation in patients who had received either vecuronium bromide or atracurium besylate. Although significant values were seen after 20 minutes of intubation in vecuronium bromide group, but there was no significance in different phases of anaesthesia in both groups(Table-3).
DiscussionAn increase in intraocular pressure during general anaesthesia has been observed since long and this rise in intraocular pressure has always been a matter of anxiety for both surgeons and anesthesiologists during ophthalmic surgery. The results of ophthalmic surgery, especially when the globe is opened depend on good control of intraocular pressure. This is usually achieved with controlled ventilation and by the use of non-depolarising muscle relaxants. The patient’s age, sex and body weight had no significant effects on intraocular pressure.
The patients who were intubated with vecuronium bromide, the pre-induction mean intraocular pressure was 15.91±0.22 mm of Hg, and 5 minutes after intubation it became 18.9±0.297 which is statistically highly significant. After 10 minutes of intubation there was insignificant fall in I.O.P. but after 20 minutes of intubation there was significant fall. These findings were in accordance with Mirkhur RK et al3and Jantzaj JP et al7. In the study conducted by Mirakhur RL et al3 the effect of vecuronium on I.O.P. were investigated in doses of 0.15mg/kg as a part of rapid sequence induction with vercuronium administered prior to thiopentone sodium and intubation was done 30 seconds after induction. The I.O.P. was measured after thiopentone sodium administration, immediately after intubation 2 minutes after when the study was terminated.
Table 2: Showing Weight Wise Distribution
Vecuronium Bromide Atracurium BesylateWeight
(Kg)Male
Number (%)
Female Number
(%)
Male Number
(%)
Female Number
(%)30-45 4(8%) 12(24%) 4(8%) 12(24%)46-50 8(16%) 12(24%) 10(20%) 10(20%)51-60 7(14%) 6(12%) 11(22%) 2(4%)61-70 1(2%) 0 1(2%) 0
Table 3: Showing Changes in Variations of Intraoccular Pressure in Different Intervals
GROUP PERIOD MEAN±S.D. MEAN DIFFERENCE ‘p’ VALUE SIGNIFICANCE
VECURONIUM BROMIDE
BEFORE INDUCTIONVs 5 MINUTES AFTER INTUBATION
15.91±0.2215.91±0.22
3.6 <0.001 HIGHLY SIGNIFICANT
ATRACURIUM BESYLATE
BEFORE INDUCTIONVs 5 MINUTES AFTER INTUBATION
15.97±0.2218.90±0.297
2.93 <0.001 HIGHLY SIGNIFICANT
VECURONIUM BROMIDE
BEFORE INDUCTIONVs 10 MINUTES AFTER INTUBATION
15.91±0.2215.94±0.274
0.03 >0.05 INSIGNIFICANT
ATRACURIUM BESYLATE
BEFORE INDUCTIONVs 10 MINUTES AFTER INTUBATION
15.97±0.2216.40±0.241
0.43 >0.05 INSIGNIFICANT
VECURONIUM BROMIDE
BEFORE INDUCTIONVs 20 MINUTES AFTER INTUBATION
15.91±0.2214.77±0.420
1.14 <0.05 SIGNIFICANT
ATRACURIUM BESYLATE
BEFORE INDUCTIONVs 20 MINUTES AFTER INTUBATION
15.97±0.2215.24±0.256
0.73 >0.05 INSIGNIFICANT
VECURONIUM BROMIDE
BEFORE INDUCTIONVs 5 MINUTES AFTER REVERSAL
15.91±0.2216.32±0.272
0.42 >0.05 INSIGNIFICANT
ATRACURIUM BESYLATE
BEFORE INDUCTIONVs 5 MINUTES AFTER REVERSAL
15.97±0.22 16.35±0.274
0.38 >0.05 INSIGNIFICANT

153Indian Journal of Public Health Research & Development. April - June, 2012, Vol. 3, No. 2
Thiopentone sodium was associated with significant decrease in intraocular pressure; tracheal intubation was associated with increase I.O.P., over the next 2 minutes I.O.P. decreased significantly below the control level. Jantzaj et al7 postulated that I.O.P. decreased by 22.6% in association with neuromuscular blockade produced by vecuronium 0.1 mg/kg. This appeared to be the result of an indirect action via an effect of central venous pressure. Vecuronium would be suitable for patients undergoing eye surgery where an increase I.O.P. would be undesirable.
The patients who were intubated with atracurium besylate, the pre induction mean I.O.P. was 15.97±0.22 mm of Hg and there was a rise in mean I.O.P. of 18.90±0.297 after 5 minutes of intubation, which is statistically highly significant. Similar findings were observed by Payne et al8 and Mayer et al9. According to their study laryngoscopy and intubation can cause a significant rise in intra ocular pressure. The intraocular pressure was decreased continuously in 10 and 20 minutes after intubation, but it was statistically insignificant. These findings were similar to the findings of Maharaj RJ et al10 and Murphy DF et al11. According to Maharaj RJ et al10, the effect of atracurium on I.O.P. after pre-medication of patients with intramuscular morphine and oral diazepam 1 hour before surgery is compared with pancuronium. The anaesthesia was induced with thiopentone sodium and intubated without prior use of muscle relaxant. The I.O.P. was measured 5, 10, 15 and 20 minutes after induction, it was found that mean I.O.P. decreased 20 minutes after induction of anaesthesia and atracurium did not produce any deleterious effect on I.O.P. According to the study conducted by Murphy DF11, atracurium has significant effect on I.O.P. after intubation. He concluded that atracurium provides an acceptable choice for ophthalmic surgery.
So with vecuronium bromide, there was highly significant rise in intraocular pressure in 5 minutes after intubation. Although there was fall in I.O.P. after 10 minutes of intubation insignificantly, but after 20 minutes of intubation, the pressure was below the pre-induction level. In case of atracurium, after 5 minutes of intubation,
there was highly significant rise in I.O.P. The fall in pressure was insignificant after 10 and 20 minutes of intubation. After reversal the rise in pressure was insignificant in both groups.
ConclusionThis study reveals that both non-depolarising muscle relaxants had significant rise in intraocular pressure after intubation which gradually decreases at or below the preinduction value. We observed that vecuronium had a better control over intraocular pressure than atracurium.
Refernces1. Gold Smith E. An evolution of succinylcholine and gallamine
as muscle relaxants in relation to intraocular tension.Anaesth. Analog.1967.46:557.
2. Hollyoway KB. Control of eye during general anaesthesia for intraocular surgery. Br J Anaesth 1980,52:671
3. Mirakhur RK, Shepherd WFI, Lavery A, Elliot P. The effect of vecuronium on intraocular pressure. Anaesthesia 42.1987:944-46.
4. Al-Albarek MH, Samuel JR. Further observation on the effect of general anaesthesia on intraocular pressure in man. Br J Anaesth. 1974,46:756-59.
5. Samuel JR, Beaugie A. Effect of CO2 on intraocular pressure in man during general anaesthesia. Br. J Ophthal.1974:58:62.
6. James N, Mc Galliard, Gavin G, Lavery FFARCS, William FI, Shepherd FRCS. The effect of atracurium on intraocular pressure during steady state anaesthesia and rapid sequence induction: a comparison with succinylcholine. Can. Anaesth Soc J.1986.33(4):437-42.
7. Jantzaj JP, Hackett GH, Eradmannk, Earnshow G. Effect of vecuronium on intraocular pressure.Br J Anaesth. 1986:59:433-6.
8. Payne JP, Hugas R. Evolution of atracurium in anaesthetized man. Br J Anaesth.1981,53:45.
9. Mayer EF, Singer P, Otto A. A controlled study of the effect of succinylcholine on intraocular pressure. Anaesthesiology. 1980,53:72.
10. Maharaj RJ, Humphery D, Kaplon N. Effect of atracurium on intraocular pressure. Br J Anaesth. 1980,52:459-63.
11. Murphy DF, Eustace P, Unwin A, Magner JB. Atracuriun and intraocular pressure. 1985,69:673-75.

154 Indian Journal of Public Health Research & Development. April - June, 2012, Vol. 3, No. 2
A comparison of post operative analgesia and adverse effects produced by neostigmine and morphine when given intrathecallySharad Goel1, Sanjay Lal1, Ritu Goyal2
1Assistant Professor, 2Associate Professor, Department of Anaesthesia, Saraswathi Institute of Medical Sciences, Hapur, Ghaziabad 245304
AbstractVarious modalities had been tried for optimum duration of post operative analgesia with minimal side effects. The present study was undertaken to evaluate the duration and quality of post operative analgesia by intrathecal bupivacaine alone, intrathecal bupivacaine12.5mg (0.5% heavy) with neostigmine (50µg) or intrathecal bupivacaine12.5mg (0.5% heavy) with morphine (100µg) in spinal block. 150 patients of ASA physical status 1&2, age 20-70 years of either sex, body weight 50-100Kg were randomally assigned in three study groups. Group I - 0.5% bupivacaine (2.5ml bupivacaine+0.5ml normal saline), group II - 0.5% bupivacaine with 50µg neostigmine (2.5ml bupivacaine+0.5ml neostigmine) and group III - 0.5% bupivacaine with morphine100µg (2.5 ml bupivacaine+0.5 ml morphine). Onset of sensory and motor block of intrathecal neostigmine and intrathecal morphine group was much faster as compare to control group. Duration of post operative analgesia was also more in intrathecal neostigmine and intrathecal morphine group as compare to control group. Intrathecal neostigmine and intrathecal morphine groups were comparable in terms of onset of sensory and motor block and level of highest block. Nausea, vomiting and bradycardia were more in neostigmine group as compare to intrathecal morphine and control group. Patients in intrathecal morphine group had more incidence of pruritus. We concluded that intrathecal morphine 100µg is a better choice than intrathecal neostigmine during spinal block.
Key WordsAnaesthesia, Spinal anaesthesia, Drugs, Bupivacaine, Neostigmine, Morphine.
IntroductionPost operative pain control is essential for optimal care of surgical patients. If post operative pain is not controlled effectively it results in respiratory, cardiac, gastrointestinal, urinary and psychological adverse effects. Management of post operative pain remains a point of concern with spinal anaesthesia.
Intrathecal neostigmine inhibits the breakdown of endogenous spinal neurotransmitter acetylcholine
which augments analgesic duration of bupivacaine. But higher doses of intrathecal neostigmine is associated with increased incidence of nausea, vomiting and bradycardia1. Intrathecal morphine also increases the duration of analgesia of bupivacaine but is associated with post operative respiratory depression, pruritus and urinary retention2.
The present study was undertaken to evaluate the duration and quality of post operative analgesia by intrathecal bupivacaine alone, intrathecal bupivacaine12.5mg (0.5% heavy) with neostigmine (50µg) or intrathecal bupivacaine12.5mg (0.5% heavy) with morphine (100µg) in spinal block.
Material and MethodsAfter approval with institutional review board, 150 patients of ASA physical status 1&2, age 20-70 years of either sex, body weight 50-100Kg, scheduled for lower abdominal & lower limb surgeries were enrolled in the study. Informed consent was taken from each and every patient. Patients were randomly assigned using coded envelop to one of the three study group receiving either 0.5% bupivacaine (2.5ml bupivacaine+0.5ml normal saline) group I, 0.5% bupivacaine with 50µg neostigmine (2.5ml bupivacaine+0.5ml neostigmine) group II or 0.5% bupivacaine with morphine100µg (2.5 ml bupivacaine+0.5 ml morphine) group III in a double blind fashion. Patients with known contraindications of spinal anaesthesia, weight more than 100Kg and known allergy to study drug were excluded from the study.
Pre anaesthetic check up of all patients was done one day prior to surgery and patients were kept fasting for 8 hours prior to surgery. All patients were given tablet alprazolam 0.5 mg night before surgery. Pulse rate, arterial oxygen saturation, Non invasive Blood Pressure, E.C.G and respiratory rate were monitored with B.P.L. excelleo monitor on arrival in O.T. and continued till end of surgery. A good intravenous line established and patients were preloaded with 10ml per Kg of ringer lactate solution. Patients were placed in sitting position and under all aseptic precaution spinal anaesthesia was administered with 25G Quincke’s needle in L₂-L₃ or L₃-L₄ interspace and after obtaining free flow of C.S.F., test drug was given according to patient’s assigned group. Patient was immediately turned supine and oxygen was given by

155Indian Journal of Public Health Research & Development. April - June, 2012, Vol. 3, No. 2
face mask at 4 litre per minute.
Level of sensory block was recorded by using pin prick method and motor block was assessed by modified bromage scale.
Time of onset of block was recorded as time taken from intrathecal drug administration to loss of pin prick at T₁₀ and highest level of block was noted.
Duration of surgical analgesia was defined as the period between intrathecal injection and recovery from block, both sensory and motor. In post op period pain score was assessed by VAS every 30 minute till 4 hours and than hourly for up to the period of 12 hours. When pain score was more than 4 analgesia was supplemented by intramuscular diclofenac sodium in dose of 75mg and time of drug given was recorded.
Side effects like hypotension, bradycardia, nausea, vomiting, sweating, sedation, pruritus, increased salivation, urinary incontinence and nystagmus were recorded and treated accordingly. If the systolic B.P. decreased more than 25% from base line value or less than 90mm of Hg the injection mephentermine 6mg intravenously was given. Bradycardia (H.R. less than 55 per minute) was treated with injection atropine sulphate 0.3 to 0.6 mg intravenously. Nausea and vomiting was treated with injection ondansetron 4mg intravenously.
All data were analysed by student t test.
ResultsAll the groups were statistically comparable regarding demographic profile (Table I). Surgeries done were appendicectomy, herniorrhaphy, hernioplasty, prostectomy, vaginal hysterectomy, and all lower limb orthopaedic procedure. Mean onset time of sensory as well as motor block was faster in group II and group III as compared to group I (table 2). Onset time of sensory and motor block of both groups (group II and group III) was statistically highly significant as compared to group I. On
comparison between group II and group III, onset time of sensory and motor block was not significant.
Level of highest block of all 150 patients is shown in table 3. All patients were able to complete their surgical procedures well. Patients who received intrathecal morphine or intrathecal neostigmine had highly significant prolonged duration of analgesia as compared to control group. Time in hours from spinal anaesthesia to first analgesic requirement (VAS > 4) of all three groups is shown in table 4. Duration of analgesia of group II and group III was comparable.
In the present study there was fall in systolic and diastolic blood pressure during the study period from their base line values. Some patients required injection mephentermine also, but on comparison between the three groups the decrease in systolic and diastolic blood pressure was found to be insignificant. Pulse rate also varied in different point of time but was statistically insignificant on comparison between three groups (Table 5).
In our study side effects including nausea, vomiting and bradycardia were more in neostigmine group in comparison to control group. Incidence of nausea and vomiting in morphine group was comparable to control group. 10 patients in morphine group had pruritis, while no patient in control group and neostigmine group had pruritis. Other side effects like sweating, sedation, respiratory depression, increased salivation, urinary incontinence and nystagmus were not found in any patient of three groups (Table 6).
Table I: Demographic profile.
Groups Group I Group II Group III
Age 40±16 42±16 43±18
Sex 22/28 20/30 23/27
Weight 77±13 72±11 75±14
Table 2: Duration of onset of sensory and motor block (Mean ± SD).
Group Group I Group II Group III
Sensory block (min.) 5.64±.5834 3.45±.7223 3.24±.5850
p value(as compared to Gp I)
< .001 < .001
Motor block (min.) 6.5±.5744 4.05±.7697 3.82±.6615
p value(as compared to Gp I)
< .001 < .001
Table 3: Level of highest sensory block in all 150 patients.
Group I Group II Group III
T₆ 7 8 8
T₈ 17 20 19
T₁₀ 26 22 23
T₁₂ 0 0 0
Table 4: Mean duration of analgesia (Time in hours).
Group I Group II Group III
When VAS > 4(Mean± SD)
3.46 ± 0.3852 6.66 ±0.6724 6.68±0.5179
p value(as compared to Gp I)
< .001 < .001
Table 6: Side effects (%) in all three groups
Side effects Group I Group II Group III
NO. % NO. % NO %
Bradycardia 3 6 5 10 4 8
Nausea 4 8 22 44 4 8
Vomiting 2 4 11 22 2 4
Pruritis 0 0 0 0 10 20

156 Indian Journal of Public Health Research & Development. April - June, 2012, Vol. 3, No. 2
Discussion Spinal anaesthesia using intrathecal bupivacaine is a very safe technique of anaesthesia for lower abdominal and lower limb procedures lasting for one to two hours. Spinal anaesthesia over general anaesthesia is preferred by anaesthesiologist and surgical staff, because spinal anaesthesia is associated with less complications as compared to general anaesthesia.
Management of post –operative pain remains a point of concern with spinal anaesthesia, optimum pain relief with minimal side effects can be achieved by adding various adjuvants like opioids, clonidine, beclofen, ketamine, midazolam and neostigmine.
The present study was undertaken to asses the efficacy of intrathecal neostigmine and intrathecal morphine with heavy bupivacaine with aim of maximising analgesic duration while minimising the possibilities of potential side effects.
Intrathecal morphine has been studied by various investigators for pain control after caesarean delivery3, various orthopaedics procedures4, spinal surgeries5, cardiac surgeries6 and other surgical procedures7. Optimal dose of intrathecal morphine for pain control seems to be 100 µg with minimal side effects. Doses above 100 µg is often associated with nausea, vomiting, pruritus, urinary retention and respiratory depression8,9.
Rathnell and his team did a dose ranging study for postoperative pain control after knee and hip athroplasty and concluded that low doses of intrathecal morphine, ranging from 0.1 to 0.3 mg, provide adequate analgesia and significantly decrease in the amount of intravenous morphine that is needed during the first 24 hours following the surgery4.
Motamed and colleagues suggested that a low dose of spinal morphine combined with a low dose of bupivacaine can be a simple and trustworthy component of a multimodal approach to surgical anesthesia10.
Hood DD et al in 1995 used intrathecal neostigmine in healthy human beings1. Neostigmine, a cholinesterase inhibitor inhibits the metabolism of spinally released acetylcholine and thus enhances analgesia 11,12. Previous studies had used intrathecal neostigmine in dose ranges of 10 to 200µg13,14. Spinal cord toxicity resulting from intrathecal neostigmine has not been reported15,1.
Results of our study demonstrated that onset of sensory and motor block is enhanced by both intrathecal neostigmine and intrathecal morphine as compared to control group. Onset time of sensory and motor block of intrathecal neostigmine and intrathecal morphine was comparable.
Level of sensory block achieved in our study groups was similar in all three groups suggesting that spread of subarachnoid bupivacaine was not affected by adjuvents. All patients in our study were able to complete their procedures well.
Mean duration of analgesia in intrathecal neostigmine group was 6.66 hours and in intrathecal morphine group 6.68 hours as compared to 3.46 hours in control group, which is highly significant. Chung et al and Lauretti et al also observed statistically significant lower VAS score in the doses ranging from 25-75µg neostigmine group compared to saline group13,16.
P-H Tan et al compared intrathecal morphine (300µg) and intrathecal neostigmine (50µg) and found that intrathecal neostigmine and intrathecal morphine prolonged the effect of spinal anaesthesia but the time of first requirnment of analgesia in neostigmine group
Table 5: Showing haemodynamic variables : Pulse rate ,Systolic blood pressure and diastolic blood pressure (mean ± S.D.)
Preop 5 min 10 min 15 min 20 min 30 min 45 min 60 min 90 min
Pulse Rate Gp I 85.08± 6.754
86.68± 6.978
87.58± 6.349
87.76± 7.0491
88.42± 5.295
87.94± 5.193
87.22± 4.974
86.86± 4.186
86.38± 4.324
Gp II 84.54± 7.73
85.42± 8.10
85.06± 8.34
86.16± 8.50
87.54± 7.81
86.10± 7.92
86.38± 8.24
85.52± 8.25
85.96± 7.58
Gp III 86.10± 7.03
86.18± 7.41
87.68± 8.92
87.82± 7.74
88.12± 6.08
87.54± 6.48
87.30± 6.84
87.36± 6.39
87.68± 5.70
Systolic B.P.
Gp I 135.2± 10.21
126.44± 11.35
119.24± 10.87
117.34± 10.31
122.98± 8.52
125.3± 8.78
126.94± 8.73
128.22± 7.87
129.48± 8.42
Gp II 135.86± 9.78
128.92± 9.86
122.92± 9.44
121.5± 11.37
120.5± 10.80
125.46± 8.82
126.96± 8.06
127.92± 8.15
129.76± 7.09
Gp III 136.02± 10.30
130.44± 11.28
122.88± 10.79
120.4± 8.97
122.98± 8.38
125.3± 8.94
126.94± 7.79
129.68± 8.46
130.46± 8.39
Diastolic B.P.
Gp I 84.00± 5.74
82.88± 6.36
82.26± 5.89
81.56± 5.34
81.46± 5.29
81.92± 5.13
81.82± 6.13
82.34± 5.16
83.16± 4.73
Gp II 82.96± 5.73
82.08± 5.64
81.46± 5.68
80.36± 5.48
80.30± 5.68
81.00± 5.62
81.00± 5.45
81.00± 5.45
81.64± 5.21
Gp III 84.10± 6.44
82.06± 6.30
81.08± 6.06
80.64± 5.56
81.00± 5.28
81.68± 5.62
81.68± 5.96
82.50± 5.64
82.62± 6.02

157Indian Journal of Public Health Research & Development. April - June, 2012, Vol. 3, No. 2
was shorter than the morphine group17. The results are in accordance to our study except for prolonged analgesic effect in post operative period in intrathecal morphine group, which may be because of higher doses of morphine (300µg) used.
Almeida et al also concluded that intravenous requirnment of ketoprofen during first postoperative 24 hours was less in intrathecal morphine group as compare to intrathecal bupivacaine only9.
Chung et al and Muhammad ishaque et al also reported that 25µg of intrathecal neostigmine and 100µg of intrathecal morphine produce analgesia of almost similar duration13,18. These results are in accordance to our study. Study done by Klamt et al is also in accordance to our study19.
Intrathecal neostigmine produce nausea and vomiting in dose dependent manner, due to cephaladed migration of neostigmine to brain stem and accumulation at CTZ induces vomiting. Klamt et al, Hood et al and Tan et al reported that droperidol and metoclopropamide were not effective in controlling nausea and vomiting19,1,17. Nausea and vomiting resolved with time. In our study 44% of patients complained of nausea and 22% of patients complained of vomiting which was effectively controlled by injection ondensetron(4mg) and injection dexamethasone(8mg) simultaneously. Nausea and vomiting in intrathecal morphine group was comparable to control group. Tan et al reported that there was no significant difference between intrathecal neostigmine and intrathecal morphine groups in the incidence of nausea and vomiting which may be due to high doses of morphine (300µg)17.
Pruruitis was observed in 20 % of patients in intrathecal morphine group which was not distressing to patients and was relieved by intravenous injection of chlorpheniramine.
The serious side effect of respiratory depression was not found in any of patients in our study.
In conclusion, addition of intrathecal neostigmine or intrathecal morphine to heavy bupivacaine for spinal anaesthesia doubled the duration of requirement of rescue analgesia. Both drugs increased the duration of analgesia in post operative period on the expense of increased incidence of side effects. These side effects were effectively controlled by intravenous medications. Because of more incidence of side effects in intrathecal neostigmine group (nausea and vomiting) as compared to intrathecal morphine group (pruritis), we concluded that morphine 100 µg is a better choice than neostigmine 50µg when combined with bupivacaine (0.5%) during spinal block.
Interest of conflict- None
References1. Hood DD, Eisenach JC, Tuttle R. Phase I safety assessment
of intrathecal neostigmine methylsulfate in humans. Anaesthesiology 1995:82:331-343.2.
2. Mc Neely JK, Farber NE, Rusy LM,:Epidural analgesia improves outcome following paediatric fundoplication. Reg. Anesth. 1997, 22: (16).
3. Dahl JB, Jeppesen IS, Jørgensen H, et al. Intraoperative and postoperative analgesic efficacy and adverse effects of intrathecal opioids in patients undergoing cesarean section with spinal anesthesia. Anesthesiology 1991;91:1919 –27.
4. Rathmell JP, Pino CA, Taylor R, et al. Intrathecal morphine for postoperative analgesia: a randomized, controlled, doseranging study after hip and knee arthroplasty. Anesth Analg 2003;97:1452–7.
5. Urban MK, Jules-Elysee K, Urquhart B, et al. Reduction in postoperative pain after spinal fusion with instrumentation using intrathecal morphine. Spine 2002;27:535–7.
6. Casey WF, Wynands JE, Ralley FE. The role of intrathecal morphine in the anesthetic management of patients undergoing coronary bypass surgery. J Cardiothorac Anesth 1987;1:510–6.
7. Hamber EA, Viscomi CM. Intratheal lipophilic opioids as adjuncts to surgical spinal anesthesia. Reg Anesth Pain Med 1999;24:255– 63.
8. Murphy PM, Stack D, Kinirons B, and et al. Optimizing the Dose of Intrathecal Morphine in Older Patients Undergoing Hip Arthroplasty Anesth Analg 2003;97:1709 –15.
9. Almeida RA, Lauretti GR, Mattos AL. Antinociceptive Effect of Low-dose Intrathecal Neostigmine Combined with Intrathecal Morphine following Gynecologic Surgery. Anesthesiology: 2003;(2);495-498.
10. Motamed C, Bouaziz H, Franco Dand et al. Analgesic effect of low-dose intrathecal morphine and bupivacaine in laparoscopic cholecystectomy. Association of Anaesthetists of Great Britain & Ireland 2000;55:118-124.
11. Krukowski JA, Hood DD, Eisenach JC and et al. intrathecal neostigmine for post caesarean section analgesia: Dose response. Anesth Analg 1997; 84: 1269-75.
12. Eisenach JC, Detweiler DJ, Tong Cy and et al. Cerebrospinal fluid norepinephrine and acetylcholine concentrations during acute pain. Anesth Analg 1996; 82: 621-6.
13. Chung CJ, Kim JS, Park HS and et al. The efficacy of Intrathecal neostigmine, intrathecal morphine and their combination for post cesarean section analgesia. Anesth Analg 1998; 87: 341-6.
14. Mainvsky J.M., Renaud G., Le Corre P. Intrathecal bupivacaine in humans: effects of volume and baricity on spinal effects. Anesthesiology 1999; 91:1260-1266.
15. Eisenach JC, Hood DD, Curry R. Phase I human safety assessment of intrathecal neostigmine containing methyl- and propylparabens. Anesth Analg 1997; 85:842–6.
16. Lauretti GR, Hood DD, Eisenach JC. A multicenter study of intrathecal neostigmine for analgesia following vaginal hysterectomy. Anesthesiology 1998; 89: 913-8.
17. Tan PH, Chia YY, Lo Y and et al: Intrathecal bupivacaine with Morphine or neostigmine for postoperative analgesia after total Knee replacement surgery. Can J Anaesth, 2001; 48: 6: 551–618.
18. Ishaque M, Siddique R, Hashmi SN, Naseem A and et al;A study of post operative analgesia and adverse effects produced by intrathecal neostigmine, morphine and their combination in patients undergoing elective caessarian section under spinal anaesthesia. Pakistan Armed Force Medical Journal : 2005,(2).
19. Klamt, J. G, Garcia, L. V, Prado W A. Analgesic and adverse effects of a low dose of intrathecally administered hyperbaric neostigmine alone or combined with morphine in patients submitted to spinal anesthesia: pilot studies. Anesth 1999; 54(1): 27-31.

158 Indian Journal of Public Health Research & Development. April - June, 2012, Vol. 3, No. 2
Nasopalatal Cyst – A case reportShilpa B.J A1, Kodhandarama G.S B2, Nagarajappa D C3, Tanveer Ahmed D3, Shivshankar C E4
1Assistant Professor, 2Professor and Head, Department Oral Medicine and Radiology, S.J.M. Dental College and Hospital, Chitradurga, Karnataka, India, 3Reader, Department of Oral and Maxillofacial Surgery, S.J.M. Dental College and Hospital, Chitradurga, Karnataka, India, 4Associate Professor, Department of Oral and Maxillofacial Surgery, S.J.M. Dental College and Hospital, Chitradurga, Karnataka, India
AbstractNasopalatal cyst is rare but most common among the developmental, non- odontogenic cysts of the jaws. It is located in the incisive canal or in the anterior palate. It arises from the embryonic ducts of scrapa and stenson. It accounts for about 5-10% of the jaw cysts and 1% of the population. Majority of the cases occur between fourth to sixth decades of life. Males are more commonly affected than the females. We report case of Nasopalatal cyst in 50year old female.
KeywordsNasopalatal duct cyst: Incisive canal cyst; Non-odontogenic cyst; Cysts of the hard palate.
IntroductionNasopalatal cyst (NPC) also called as incisive canal cyst, Nasopalatal canal/duct cyst, median palatal cyst or median anterior maxillary cyst were regarded as fissural cyst in the past1. At present, according to the classification of the WHO, these lesions are developmental, epithelial, non-odontogenic cysts of the maxilla along with nasolabial cysts2. NPC was first described by Mayer in 19143. NPC are rare but most commonest among non- odontogenic developmental cysts of the oral cavity occurring about 1% of population. The cyst is believed to arise from the remnants of the Nasopalatine duct, an embryonic structure connecting the oral and nasal cavities in the area of the incisive canal4. It is one of many pathologic processes that may occur within the jawbones, but it is unique in that it develops in only a single location, in the midline anterior maxilla.
Case ReportA 50 year old female patient reported to the out patient department of Oral Medicine and radiology, S.J.M. Dental College and Hospital, Chitradurga with the chief complaint of swelling in the anterior region of palate since 4 months. Patient noticed the swelling 4 months back which has gradually increased to present size. The swelling associated with discomfort in sipping the fruits, chocolate and ice candy, sometime associated with the numbness over the anterior palate. Extra-orally there was no detectable abnormality or lymphadenopathy.
Intra-oral examination revealed a solitary, well defined, oval shaped swelling measuring about 2x1.5cms in the anterior palate in the midline. Overlying mucosa was normal. The swelling was hard, tender and non mobile (Figure-1). On the basis of history, clinical findings a provisional diagnosis of nasopalatine cyst was made and a differential diagnosis of radicular cyst was considered. Maxillary anterior teeth were vital on heat vitality test which excluded the differential diagnosis of radicular cyst in relation to maxillary anterior teeth. Fine needle aspiration cytology (F.N.A.C) was done, straw colored fluid aspirated. The cytology revealed chronic inflammatory cells with few epithelial cells and RBC’s. Maxillary occlusal radiograph revealed a solitary, well defined, ovoid radiolucency measuring about 2x1.5cms located in midline of the anterior maxilla below the roots of maxillary central incisors (Figure-2). Computed tomography (C.T) confirmed the presence of well defined, midline cystic lesion in the anterior portion of the hard palate measuring about 1.4x1.2 cms with bony expansion breaching the cortex and bulging into the oral cavity (Figure- 3 and 4). Deviated nasal septum to left side also noted
Figure 1: Intra oral photograph showing ovoid swelling over the hard palate.
Figure 2: Maxillary occlusal radiograph showing solitary, well defined, ovoid radiolucency located in midline of the anterior maxilla.

159Indian Journal of Public Health Research & Development. April - June, 2012, Vol. 3, No. 2
in the C.T. On the basis of the clinical and radiographic findings, a diagnosis of Nasopalatine cyst was made. All preliminary investigations were done and results were within normal limits. Then the cyst was enucleated under general anesthesia and the specimen was subjected for histopatholgical examination. Post operation session was uneventful. On microscopic examination, the cystic lining showing transition from columnar to cuboidal epithelium and underlying connective tissue showing chronic inflammatory cell infiltrate like lymphocytes and plasma cells (Figure- 5). The histological features were suggestive of nasopalatal cyst.
DiscussionNasopalatal cysts are the most common among the developmental, epithelial, non- odontogenic cysts of the oral cavity, representing up to 1% of all maxillary cysts.5 NPCs develop in the bony nasopalatine channel located at the anterior tip of the suture line of the palatal
apophyses of maxillary bones. Lower mammals have inside this conduit a permeable “nasopalatine duct” that acts as an ancillary olfactory organ (vomeronasal or Jacobson’s organ)6. Although NPCs were initially thought to originate from fissures, 6 they are now believed to derive from incompletely developed epithelial remnants in the embryonic nasopalatine duct7. The stimulus for cyst formation from the epithelial remnants of the nasopalatine canal is uncertain, although trauma, bacterial infection and mucin retention within the mucous gland lining are thought to have a role8. Genetic factors have also been suggested9.
Nasopalatal cyst has intra-osseous and extra-osseous variants. The extra-osseous cyst is termed as cyst of the incisive papilla. The incisive canal cyst includes median palatal cyst and anterior median maxillary cyst, although these once were thought to represent separate entities10. NPCs may develop at any age but is most common in the fourth to sixth decades of life. Men are affected more often than women with ratio 3:1.8 Most of NPCs are asymptomatic or cause such minor symptoms that they are tolerated for very long time. The most common complains are palatal swelling, upper anterior teeth displacement, sublabial swelling, and low grade pain10. The swelling usually fluctuant and blue if the cyst is near the surface. The deeper NPC is covered by normal appearing mucosa unless it is ulcerated from mastication. If cyst expands, it may penetrate the labial plate and produce swelling below the maxillary labial frenulum or to one side. The lesion also may bulge into nasal cavity and distort the nasal septum11. The swelling may be associated with burning sensation, numbness over the palatal mucosa as seen in our case as a result of pressure on nasopalatal nerves. Various combinations of swelling, discharge and pain may occur. Discharge may be mucoid in which case the patient describes a salty taste or it may be purulent and patient may complain of a foul taste12.
The definitive diagnosis of NPC is more easily made on conventional radiographs; other advanced imaging modalities are being used to differentiate this entity from other lesions. NPCs appear as a bilateral, symmetric, well defined, ovoid, round or inverted, heart shaped radiolucency with or without sclerotic borders located
Figure 3: Coronal CT showing midline cystic lesion in the anterior portion of the hard palate with bony expansion breaching the cortex and bulging into the oral cavity.
Figure 4: Axial CT showing midline radiolucent lesion in the anterior portion of the hard palate.
Figure 5: Photomicrograph showing transition from columnar (Black arrow) to cuboidal (Red arrow) epithelium in the cystic lining. [Hematoxylin and Eosin stained section under 20X magnification]

160 Indian Journal of Public Health Research & Development. April - June, 2012, Vol. 3, No. 2
in the midline of the maxilla, which is inter-radicular and apical to the roots of the maxillary central incisors. It may cause root displacement and root divergence. Occasionally it causes root resorption, expansion of labial/palatal cortex and perforation of nasal floor10,11. NPCs should be differentiated from large incisive foramen and periapical cyst/granuloma associated with maxillary incisors. Radiolucencies of the incisive canal measuring less than 0.6 cm in diameter should not be considered cystic in the absence of other symptoms13. The periapical cyst/granuloma associated with maxillary incisors can be differentiated with the presence or absence of the lamina dura and enlargement of the periodontal ligament space around the root apex of the incisors and with the help of vitality tests11. NPCs are usually treated by enucleation, in case of large cysts, marsupialization may be considered before definitive enucleation. Recurrence rate ranges from 0% to 11%7.
ConclusionNasopalatal cysts are rare but commonest among the developmental, epithelial, non- odontogenic cysts of the jaws. The lesion may be asymptomatic or manifests as swelling, pain, and discharge from the hard palate. The clinician should differentiate it from large incisive foramen and periapical pathology of maxillary incisors and should include NPC in the differential diagnosis for swelling of hard palate.
References1. Robertson H, Palacios E. Nasopalatine duct cyst. Ear Nose
Throat J. 2004 may; 83(5):313.2. Herráez-Vilas JM, Gay-Escoda C, Berini-Aytés L. Quiste del
conducto nasopalatino. Revisión de la literatura y aportación de 14 casos. Rev Eur Odonto-Estomatol. 1994 Jul-Ago; 6(4):231-6.
3. Meyer AW. A unique supernumerary Paranasal sinus directly above the superior incisors. J Anato My 1914; 48:118-29.
4. Neville BW, Damm DD, Allen CM, Bouquot JE. Oral and maxillofacial pathology. In: Developmental defects of the oral and maxillofacial region.2nd ed. Saunders; 2002. pp 27-30.
5. Ely N, Sheehy EC, McDonald F. Nasopalatine duct cyst: a case report. Int J Paediatr Dent. 2001 Mar; 11(2):135-7.
6. Albayram MS, Sciubba J, Zinreich J. Radiology Quiz case. Arch Otolaryngol Head Neck Surg. 2001; 127: 1283-5.
7. Elliott KA, Franzese CB, Pitman KT. Diagnosis and surgical management of nasopalatine duct cysts. Laryngoscope. 2004 Aug; 114(8):1336-40.
8. Regezi JA, Sciubba JJ, Jordan RCK. Oral pathology clinical pathologic correlations. In: Cysts of the jaws and neck. 4th ed. Philadelphia, Saunders; 2003. pp. 256-257.
9. Nortje CJ, Farman AG. Nasopalatine duct cyst. An aggressive condition in adolescent Negroes from South Africa? Int J Oral Surg. Apr 1978; 7(2):65-72.
10. Langlais RP, Langland OE, Norteje CJ. Diagnostic Imaging of the jaws. In Interradicular radiolucencies. Williams & Wilkins. Philadelphia. 1995. pp 266-67.
11. White SC, Pharoah MJ. Oral Radiology Principles and Interpretation. In: Cyst of jaws. 5th ed. Mosby; 2000. pp 400-01.
12. Shear M. Cysts of the oral region. In: Nasopalatine duct (incisive canal) cyst. 3rd ed. Vargheese Publishing; 1992. pp 111-23.
13. Wood NK, Goaz PW. Differential diagnosis of oral and maxillofacial lesions. In: Interradicular radiolucencies. 5th ed. Mosby; 1997. pp 303-5.

161Indian Journal of Public Health Research & Development. April - June, 2012, Vol. 3, No. 2
Feeding practices and early childhood caries - A reviewSowmya Rajshekar Anaberu1, Laxminarayan Nagesh2, Sunder Kote K3
1Assistant Professor, Department of Community Dentistry, SJM Dental College and Hospital Davangere, Karnataka, India, 2Professor and Head, Department of Community Dentistry, Bapuji Dental College and Hospital, Davangere, Karnataka, India, 3Reader, Department of Community Dentistry, Al-Ameen Dental College and Hospital, Bijapur, Karnataka, India
AbstractEarly childhood caries (ECC) is defined as the presence of 1 or more decayed (noncavitated or cavitated lesions), missing (due to caries), or filled tooth surfaces in any primary tooth in a child 71 months of age or younger. It has a debilitating effect on the development, speech, general health, and self-esteem of infants. Predisposing factors for ECC is considered to be multifactorial and is still unclear. The association between feeding practices and caries remains controversial with some studies finding no correlation, while others showing relation. ECC is a complex entity in which feeding practices alone does not play a prime role but is influenced by a myriad of cultural, behavioral, biological and microbiological factors. So, the area has conflicting reports which needs further research.
Key WordsFeeding practices, early childhood caries, breast feeding, bottle feeding, pacifiers.
IntroductionCaries remains the principal dental disease affecting preschool children. Despite the success of preventive dentistry, there is growing number of reports showing decline in the quality of very young children’s teeth. Early childhood caries (ECC), a disease characterized by rampant dental decay in the primary dentition of infants and young children, continues to pose a serious threat to child welfare.
The American Academy of Pediatric Dentistry (AAPD) recognizes ECC as a significant public health problem.1 It is particularly a virulent form of caries, beginning soon after dental eruption, developing on smooth surfaces, progressing rapidly and having a lasting detrimental impact on the dentition. Not only does ECC affect teeth, but consequences of this disease may lead to more widespread health issues. It can manifest itself in severe pain, infection, abscesses, chewing difficulty, malnutrition and gastrointestinal disorders. It leads to malocclusion by adversely affecting the correct guidance of the permanent dentition, cause poor speech articulation and low self-esteem.
ECC is a complex, multifactorial infectious disease. Feeding patterns are said to be of prime importance in
the etiology of ECC. Infant feeding practice associated with the development of caries in the primary dentition is poorly understood and somewhat controversial. Feeding behaviors most commonly implicated are the prolonged and at-will breast feeding, falling asleep while feeding, prolonged and nocturnal bottle feeding habits, nursing beyond the recommended age for weaning, bottle feeding with sweetened beverages and the use of sweetened comforters. However, recent studies call into question the association between feeding practices and ECC2,3,4.
To fully understand the problem, it is important to investigate factors that have an influence on the quality of the teeth. Thus, an attempt is made to review the various feeding practices and study the effect of breast-feeding, bottle-feeding, comforters / pacifiers on ECC.
DefinitionEarly childhood caries (ECC) is defined as the presence of 1 or more decayed (noncavitated or cavitated lesions), missing (due to caries), or filled tooth surfaces in any primary tooth in a child 71 months of age or younger5.
In children younger than 3 years of age, any sign of smooth-surface caries is indicative of severe early childhood caries (S-ECC). From ages 3 through5,1 or more cavitated, missing (due to caries), or filled smooth surfaces in primary maxillary anterior teeth, or a decayed, missing, or filled score of ≥4 (age 3), ≥5 (age 4), or ≥6 (age 5) surfaces, constitutes S-ECC.
Explanation of the Caries Pattern6
A potentially cariogenic oral habit that begins soon after the child is born will affect the primary teeth as soon as they erupt. The maxillary incisors, which are the first to erupt, will be the first to experience the cariogenic challenge and for longer duration. Continuation of the habit will ultimately involve all the other teeth in the sequence as they erupt if the habit is not discontinued before age2.
During sucking, the natural or artificial nipple rests against the palate, while the tongue lies over the lower incisors. If the liquid is consumed frequently and for prolonged periods during the day or night, milk cannot be eliminated from the oral cavity and it pools around

162 Indian Journal of Public Health Research & Development. April - June, 2012, Vol. 3, No. 2
the tooth surfaces. If the liquid contains a fermentable carbohydrate, in this stagnant acid environment, lesions can develop quickly. Thus the upper incisors are most ravaged. While the lower incisors, which are protected by the tongue and also by saliva from the mandibular salivary glands, remain unscathed. As the child alternately sleeps and sucks, a pool of stagnant liquid collects around the necks of the upper anterior teeth and the decalcification process continues. Moreover, the swallowing reflex is absent during sleep and the diminished salivary flow encourages the damage to the teeth. Continuation of the sucking habit on a daily or usually nightly basis for several months leads to the clinical picture.
Feeding Practices and ECCAll carious lesions, including those associated with ECC, result from the interaction among 3 variables : pathogenic microorganisms, fermentable carbohydrates that the microorganisms metabolize to organic acids, susceptible tooth and host. In order for the lesions to progress and to be clinically diagnosed, these 3 variables must interact over a suitable period of time.
Fermentable CarbohydratesSucrose or common table sugar is considered to be the major cariogenic food in the human diet. Other common sugars include the monosaccharides glucose and fructose, which are present in fruit and honey. A common practice is the use of a pacifier (also called a “dummy” or “comforter”), which has been dipped in a sugar solution or honey, a mixture of glucose and fructose. Another practice is the use of syrupy, sweet vitamin preparations added to nursing bottles or infant feeders.
A. Milk and caries: The only carbohydrate contained in milk is lactose. Several in vitro studies using milk suggest that this nutrient is not cariogenic. However, Vianna7, using an artificial mouth, showed that plain bovine milk produced the least decalcification, followed in order by milk formula, human milk, and milk and honey. His study strongly suggests that lactose plays a role in the decalcifying potential of milk.
1. Human milk : Compared to bovine milk, human milk contains a higher concentration of the carbohydrate lactose. There are now suggestions from case reports that prolonged and excessive breast-feeding is associated with caries prevalence. In spite of these reports, the issue of human milk being linked to ECC is complex. The calcium and phosphorus content of milk would contribute to the remineralization of enamel. Milk contains a number of proteins including casein, which could provide a protective organic coating on the enamel surface. Moreover, cariogenic bacteria may not be able to utilize lactose as an energy source as readily as sucrose8.
2. Bovine milk9: Lactose, a disaccharide sugar, is present
in bovine milk at a concentration of around 4% and in human milk at around 7%. Although the potential demineralization from fermentation of lactose has been shown in some laboratory studies, these results may have only limited clinical significance as many of these tests were done under extreme conditions, or used very high concentrations of lactose. In summary, from the literature, there is no evidence to suggest that bovine milk is cariogenic. On the contrary, there is much evidence that milk is cariostatic. This suggests that, under usual dietary conditions, milk is not very cariogenic and may be caries protective. This conclusion does not contradict the clinical evidence indicting milk in cases of ECC, because in these children exposure to the milk is frequent and prolonged, resulting in conducive environment.
3. Milk formulas: The cariogenicity of milk formula has not been well investigated. The concentrations of the constituents in baby formula are similar to that of human milk, including the lactose content. In recent investigations, Erickson and co-workers10, using in vitro methods, reported that some common milk formulas have as much cariogenic potential as sucrose. In contrast, the results of Bowen et al using desalivated rats11, suggested that all milk formulas tested caused less caries compared with sucrose.
B. Fruit juices, carbonated beverages and other sweet liquids : Many reports have indicated that the content of the nursing bottle was frequently not just plain milk, but, in fact, the milk had been sweetened with other sugars such as table sugar or honey or sweet, syrupy vitamin formulations. Fruit juices and carbonated beverages contain a sugar (fructose) and are intrinsically acidic; erosion may be the primary enamel change preceding the rampant caries12.
C. Sweetened pacifiers: Nonnutritive sucking can be just as damaging to the teeth as nutritive sucking when a pacifier is sweetened with a decay-promoting agent.
Frequency of Consumption There are now many studies which suggest that children with ECC have a high frequency of sugar consumption in the nursing bottle and also sweetened solid foods13,14. Increased frequency of eating sucrose increases the acidity of plaque, and enhances the establishment and dominance of the aciduric mutans streptococci15. The increased time sugar is in the mouth, there is inadequate time for remineralization by saliva, with the result that demineralization becomes the predominant mechanism.
Oral Clearance of Carbohydrates In infants with ECC, the sleep-time consumption of sugar is another common characteristic. The salivary flow during sleep decreases oral clearance of the sugars, slowest on the labial surfaces of the maxillary incisors

163Indian Journal of Public Health Research & Development. April - June, 2012, Vol. 3, No. 2
and the buccal surfaces of the mandibular molars which increase the length of contact time between plaque and substrates, thus increasing the cariogenicity of the substrate significantly6.
TimeTime is important in ECC in relation to the frequency and amount of exposure of the offending liquid. Most reports of ECC stress the duration of the habit, be it bottle, breast, or sweetened pacifier, beyond the normal weaning period of about 14.2 months, 23.4 months with as high as 54 months16,17.
Feeding PracticesInfant feeding practices associated with the development of caries in the primary dentition is poorly understood and somewhat controversial. To a major extent, the severity of caries attack lies with the feeding habit and not the type of feeding. Inappropriate nursing habits involving either the breast or the bottle, breast-feeding prolonged beyond the normal age of weaning, the regular use of baby bottles filled with a liquid with sugar added at bedtime and/ or during the day, falling asleep with a pacifier covered with honey or jam may have been associated with ECC.
Breastfeeding versus ECC: reasons and counterarguments
Dr. Palmer suggests, it would be “evolutionary suicide for human milk to cause decay.”
According to Gardner et al18, the lactose content of human milk alone can be cariogenic, if the milk is allowed to stagnate on the teeth for long periods especially at night. Most authors argue that ECC is associated with breastfeeding when the consumption pattern has certain characteristics such as ad libitum feeding, large number of breastfeedings a day, prolonged breastfeeding and, mainly, frequent breastfeedings during the night, resulting in accumulation of milk in the teeth, which, combined with reduced salivary flow and lack of oral hygiene, may produce tooth decay.
Alaluusua et al19 reported that breast feeding alone cannot be connected to increased or decreased caries prevalence. Furthermore, it has been stated that “population based studies do not support a definitive link between prolonged breast feeding and caries.”20 The same was observed by Valaitis et al.21 in a systematic review of 151 articles. Recent studies of Jose et al22 came to a conclusion that further investigations are needed to determine the prevalence of ECC in exclusively breast fed children.
Breast milk contains certain protective elements and continues to confer an advantage to prevent caries occurrence. Prolonged breast feeding beyond 2 years of age is associated with increased risk of developing ECC and could be due to the gradual depletion of the
protective elements in human breast milk after prolonged lactation13,16,23-25. Alternatively, mothers who breast feed beyond 12 months may be more likely to sleep with the child and breast feed ad lib (on demand) during night which is considered to be an important contributing factor for higher caries prevalence in these children18,24-26. There are also reports showing the relationship between early weaning from the breast and increased caries prevalence17,27. It seems reasonable to support that earlier weaning increases the likelihood and duration of bottle feeding, which, in turn, is related to the caries prevalence.
The fact that either never being breast fed or breast fed for shorter duration or having been breast fed for longer periods were associated with caries development. This support the theory that it is not the breast feeding per se that causes dental caries but that the breast feeding habit may have an association both with the child’s dietary habits and with the rearing practice of the family which may serve as confounding variables. Various studies have investigated the association between breastfeeding and ECC. The most important limitation of these articles is that they do not employ the internationally adopted definitions of breastfeeding or ECC, while others use multiple definitions.
Therefore, the presumable cariogenicity of breast milk is an issue of paramount importance because, along with its substitutes, it is the major nutritional source in the first years of life.
Bottle feeding and ECCProlonged or inappropriate bottle feeding has been shown to be implicated in ECC. Many investigations have found that prolonged and inappropriate bottle feeding affects caries rate16,17,23. Inappropriate feeding behaviors, such as nocturnal and prolonged use of a baby bottle during the day, the manner in which the child fell asleep were found to be associated with rampant caries13,16,23,25. They also reported that the severity of ECC increases as the number of feedings per day increases. But the reports of Wendt et al28 showed that neither the frequency of use of a feeding bottle nor the habit of nocturnal bottle feeding containing formula seems to influence the ECC prevalence.
Pacifiers/ Comforters and ECCThe positive correlation between caries and the use of sweetened comforter bottles and other types of sweetened comforters and pacifiers was found to be apparent by many studies24,26. Although the habit of dipping the pacifier in sugar is associated with early colonization by Streptococcus mutans in predentate infants29, a systematic review30 did not find any consistent correlation between the use of pacifiers and the development of ECC, regardless of the length of use of pacifiers and of the introduction of sweeteners or not.

164 Indian Journal of Public Health Research & Development. April - June, 2012, Vol. 3, No. 2
ConclusionThus, there is no scientific evidence that confirms breastmilk is associated with ECC development. This relationship is complex and contasins several other confounding variables, which turns a usually noncariogenic and potentially caries protective infant food staple into a cariogenic source. These variables need to be identified. Inappropriate feeding behaviors, such as nocturnal and prolonged use of a baby bottle were found to be associated with ECC. Hence, the association between bottle feeding and ECC needs to be strengthened by further research. Also, the practice of adding sugar or sweetening agents to milk has been clearly recognized as a risk factor for caries.
Thus, it is evident throughout the literature that ECC is a complex entity in which feeding practices alone does not play a prime role but is influenced by a myriad of cultural, behavioral, biological and microbiological factors. So, the area has conflicting reports which needs further research.
References1. Weinstein P. Public health issues in early childhood caries.
Community Dent Oral Epidemiol 1998; 26: Suppl 1: 84-90.2. Ramos-Gomez F J, Tomar S L, Ellison J, Artiga N, Sintes J and
Vicuna G. Assessment of early childhood caries and dietary habits in a population of migrant Hispanic children in Stockton, California. J Dent Child 1999; 66: 395-403.
3. King N M, Isabel IM and Tsai J S J. Caries prevalence and distribution, and oral health habits of zero-to four-year-old children in Macua, China. J Dent Child 2003; 70: 243-9.
4. Rosenblatt A and Zarzar P. Breast-feeding and early childhood caries: an assessment among Brazilian infants. Int J Pediatr Dent 2004; 14: 439-45.
5. American Academy of Pediatric Dentistry. Policy on Early Childhood Caries (ECC): Classifications, consequences, and preventive strategies. Pediatr Dent 2004-2005 Reference Manual; 13: 31-3.
6. Ripa L W. Nursing caries: a comprehensive review. Pediatr Dent 1988; 10: 268-82.
7. Vianna R. Cariogenic potential of milk [thesis]. Indiana University School of Dentistry, 1971.
8. Rugg-Gunn A J, Roberts G J and Wright W G. Effect of human milk on plaque pH in situ and enamel dissolution in vitro compared with bovine milk, lactose and sucrose. Caries Res 1985; 19: 327-34.
9. Kim Seow W. Biological mechanisms of early childhood caries. Community Dent Oral Epidemiol 1998; 26: Suppl 1: 8-27.
10. Erickson P R, McClintock K L, Green N and La Fleur J. Determination of the caries risk associated with infant formulas. Pediatr Dent (submitted).
11. Bowen W H, Pearson S K, Rosalen P L, Miguel J C and Shih A Y. Assessing the cariogenic potential of some infant formulas, milk and sugar solutions. J Am Dent Assoc 1997; 128: 865-71.
12. Frostell G. Effects of milk, fruit juices, and sweetened beverages on the pH of dental plaques. Acta Odontol Scand 1970; 28: 609-22.
13. Albert R J, Cantin R Y, Cross H G and Castaldi C R. Nursing caries in the Inuit children. J Can Dent Assoc 1988; 54: 751-8.
14. Weinstein P, Domoto P, Wohlers K and Koday M. Mexican-American parents with children at risk for baby bottle tooth decay. J Dent Child 1992; 59: 376-83.
15. Van Houte. Role of microorganisms in caries etiology. J Dent Res 1994; 73: 672-81.
16. Dilley G J, Dilley D H and Machen J B. Prolonged nursing habit: A profile of patients and their families. J Dent Child 1980; 47: 102-8.
17. Winter G B, Rule D C, Mailer G P, James P M C and Gordon P H. The prevalence of dental caries in preschool children aged 1 to 4 years. Br Dent J 1971; 139: 271-7.
18. Gardner D E, Norwood J R and Eisenson J E. At-will breast feeding and dental caries: four case reports. J Dent Child 1977; 44: 187-91.
19. Alaluusua S, Myllarniemi S, Kallio M, Salmenpera L and Tainio V M. Prevalence of caries and salivary levels of mutans streptococci in 5-year old children in relation to duration of breast feeding. Scand J Dent Res 1990; 98: 193-6.
20. Slavkin H. Streptococcus Mutans: Early Childhood Caries and New Opportunities. J Am Dent Assoc 1999; 130: 1787-92.
21. Valaitis R, Hesch R, Passarelli C, Sheehan D and Sinton J. A systematic review of the relationship between breastfeeding and early childhood caries. Can J Public Health 2000; 91: 411-7.
22. Jose B and King N M. Early childhood caries lesions in preschool children in Kerala, India. Pediatr Dent 2003; 25: 594-600.
23. Tsubouchi J, Higashi T, Shimono T, Domoto P K and Weinstein P. A study of baby bottle tooth decay and risk factors for 18-month old infants in rural Japan. J Dent Child 1994; 61: 293-8.
24. Harrison R, Wong T, Ewan C, Contreras B and Phung Y. Feeding practices and dental caries in an urban Canadian population of Vietnamese preschool children. J Dent Child 1997; 64: 112-7.
25. Hallett K B and O’Rourke P K. Early childhood caries and infant feeding practice. Community Dent Health 2002; 19: 237-42.
26. Wyne A H, Adenubi J O, Shalan T and Khan N. Feeding and socioeconomic characteristics of nursing caries children in a Saudi population. Pediatr Dent 1995; 17: 451-4.
27. Muller M. Nursing bottle syndrome: risk factors. J Dent Child 1996; 63: 42-50.
28. Wendt L K, Hallosten A L, Koch G and Birkhed D. Analysis of caries-related factors in infants and toddlers living in Sweden. Acta Odontol Scand 1996; 54: 131-7.
29. Wan A K L, Seow W K, Purdie D M, Bird P S, Walsh L J and Tudehope D I. Oral colonization of Streptococcus mutans in six-month-old predentate infants. J Dent Res 2001; 80: 2060-5.
30. Peressini S. Pacifier use and early childhood caries: an evidence-based study of the literature. J Can Dent Assoc 2003; 69: 16-9.

165Indian Journal of Public Health Research & Development. April - June, 2012, Vol. 3, No. 2
Gamma Glutamyl Transpeptidase and total cholesterol levels in smokers and congestive cardiac failure patientsSreekantha1, Vinodchandran2, Amareshwar M3, Avinash S S4, Remya5, Kodliwadmath M.V6
1Associate Professor, Department of Biochemistry, Navodaya Medical College, Raichur, Karnataka, 2Assistant Professor, Department of Biochemistry, KMC, Manipal University, Mangalore, Karnataka, 3Assistant Professor, Department of Biochemistry, VIMS, Bellary, Karnataka, 4Assistant Professor, Department of Biochemistry, FMMC, Kankanadi, Mangalore, Karnataka, 5Lecturer, Department of Anatomy, KSHEMA, Nitte University, Mangalore, Karnataka, 6Professor and HOD, Department of Biochemistry, Navodaya Medical College, Raichur, Karnataka
Abstract
Background and ObjectivesThe level of gamma glutamye transpeptidase (GGTP or GGT) is especifically increased in alcoholic liver diseases with biliary obstruction. There are many other diseases where alterations in the level of GGTP are noted. Hence, the study was aimed to estimate the level of GGTP in smokers and congestive cardiac failure (CCF) patients along with total cholesterol (TC).
Material and Methods35 each clinically diagnosed CCF patients, smokers and normal healthy male subjects were included in the study. GGTP was estimated by enzymatic colorimetric method and total cholesterol by cholesterol oxidase peroxidase method using P-800 chemistry antoanalyser. Statistical analysis was done using ANOVA.
ResultsThe GGTP and TC levels were significantly (p<0.001) increased in the both CCF patients and smokers but increase is more significant in CCF patients.
ConclusionGGTP can be used as a potential biomarker along with total cholesterol in cardiovascular diseases especially CCF because of their direct relationship with the indication of atherogenesis.
Key WordsGGTP, TC, CCF, Smokers.
IntroductionGGTP (or GGT) catalyses the transfer of a gamma – glutamyl group to an aminoacid or peptide to another substrate molecule or to water. It is an enzyme primarily present in kidney, Pancreas, Brain, Heart, Spleen, Liver and Prostate1. It is stated that GGTP participate in the transport of aminoacids into cells which accounts for its membrane bound structure. This enzyme is universally distributed in
tissue but with considerable variance in contest program of tissue2. Renal tissue has highest level of GGTP, the enzyme present in Serum appears to Originate primarily from hepatobiliary system and GGTP activity is elevated in any and all form of liver disease. It is maximally increased in intra and post heaptic biliary obstruction; especially related to alcoholic liver disease. Apart from alcoholic liver diseases, GGTP elevation occurs in renal failure, fatty liver, primary or secondary (metastatic) neoplasms, especially pancreas (if associated with hepatobiliary obstruction), drug intake like barbiturates, Phenytoin etc3,4. Reports on the levels of GGTP and TC in cardiovascular diseases and smoking are scanty. So, the present project was undertaken to estimate the levels of GGTP and TC in CCF patients and smokers.
Material and MethodsThe test group included 35 male smokers who smoke about 8-10 cigarettes per day with filter (belongs to ITC company) since 10 years, 35 Clinically diagnosed CCF patients who were admitted in ICU were selected with 35 normal healthy control subjects; all subjects of test and control group belongs to 30-60 years of age.
Exclusion CriteriaPatients suffering from acute or chronic Pancreatitis, chronic infection, chronic granulomatous disease, acute of chronic renal failure, any liver disease, organic brain diseases, cardiomyopathies, disorders of spleen and any primary or secondary malignancies were excluded.
2ml of blood was collected from median cubital vein under strict aseptic precautions and with appropriate processing, subjected to P-800 chemistry antoanalyser for estimation of GGTP levels by enzymatic colorimetric method5 and total cholesterol by cholesterol oxidase peroxidase method6.
Statistical AnalysisDone using ANOVA and comparison by Turkey HSD.
Results• The levels of GGTP and TC increased significantly
(p<0.001) in both CCF patients and smokers but

166 Indian Journal of Public Health Research & Development. April - June, 2012, Vol. 3, No. 2
more significant in CCF patients.• No significant Correlation is noted in any of
parameters between the groups.
DiscussionGGTP plays a very important role in amino acid transport and transfer of gamma- glutamyl group from peptides such as glutathione to other aminoacids. In liver diseases GGTP correlates with alkaline phosphatases levels and it is the most sensitive indicator of alcoholic liver disease. It is noted that GGTP elevations may be associated with pancreatic, renal, cardiac and pulmonary disorders7.
In present study, the levels of both total cholesterol (TC) and GGTP are increased in both smokers and CCF patients but the increase is more noted in CCF patients. GGTP is involved in glutathione metabolism transferring glutamyl moiety to variety of acceptor molecule including water and peptides having cysteine product to preserve intracellular homeostasis of oxidative stress8. In smoking, free radical damage the cellular antioxidant defense system causing oxidative stress. GGTP in vivo seems to recover cysteine from extracellular glutathione to preserve the cellular homeostasis of oxidative stress. Increase in intracellular oxidative stress may induce the enzyme GGTP. Glutathione being the important endogenous antioxidant (which is linked with GGTP in glutathione cycle), who’s homeostasis is disturbed; which might be the cause of increased levels of GGTP in smokers. Our study points the increase of GGTP in smokers which is supported by Yokoyama et al 9, they report the development of hypertension, hyperlipidemia and diabetes mellitus were associated with increased GGTP levels.
There are evidences from recent studies that GGTP likely to be associated with cardiovascular diseases (CVD)10,11. In regard to coronary heart disease, it was observed that serum GGTP levels were associated with increased risk of myocardial infarction, cardiac death and failure12,13.GGTP is having direct involvement in atherosclerotic plaque formation and its level is increased in myocardiac infraction and stroke patients14,15,16. The possible role of GGTP in atherogenic process is evidenced by increased level of oxidative stress17,18. GGTP was found to play a role in ethiopathogenesis because it was detected in atheromatous plaques of carotid and coronary arteries triggering oxidation of lipids; which is also precipitated by hypercholesteremia, resulting in complication of atherosclerosis as myocardial infraction, stroke, CCF etc16,19,20.
The link between serum GGTP levels and atheroseclerotic plaque formation is based on oxidant action of glutathione catabolites in the extracellular space21. Our reports of increased cholesterol and GGTP levels in CCF patients are supported by Nakanishi N et al22 and Lee DH et al23.
To conclude, the level of GGTP with lipid profile parameters can be considered as a potential biomarker for the indication of assessment of risk of complication of atherosclerosis like myocardial infraction, stroke and CCF patients.
References1. Goldberg DM. Structural, Functional and Chemical aspects of
GGTP. Crit Rev Clin Lab Sci 1980; 12(1): 1-58.2. Amadeo J, Pesce and Laurence A. Kaplan methods in Clinical
chemistry 1987. C. V. Mos by company Missuri, Chapter 145, 1120-1124.
3. Carl A Burtis and Edward R Ashwood. Tietz Textbook of Clinical chemistry. II edition W.B. Saunders company 1994, Philadelphia. p: 847-851.
4. Kosalki SB, Tarlow D, Raw D Plasma GGTP elevation in patients receiving enzyme including drugs. Lancet 1971; 7720: 376-77.
5. Szasz G, Persijn JP et al. GGTP estimation Zklin chem. Klin Biochem 1974; 12: 228.
6. Tietz NW. Clinical Guide to Laboratory tests, 3rd ed. Philadelphia, Pa:WB Saunders Company ,1995:130-131.
7. Isselbacher, Braumwald, Wilson, Marin, Fauci & Kasper. H.P.I Medicine, Vol II, 13th edition, Mc Graw Hill Publisher 1994: 1446.
8. Schulman JD, Goodman SI, Mace JW et al. Glutathioneria: inborn error of metabolism due to deficiency of GGT. Biochem Biophy Res Commun 1975; 65(1): 68-74.
9. Melissa Palmer M. Hepatitis and Liver disease. Penguin publishers II edition USA 2004: 228.
10. Yokoyama H. Gamma GTP in the era of metabolic syndrome Nihon Arukoru Yakubutsu Igakkai Zasshi 2007, 42(3): 110-124.
11. Pompella A, Emdin M, PassinoC, Paolicchi A. The significance of serum Glutamyl transferase in cardiovascular disease chin chem. Lab Med. 2004; 42: 1085-1091.
12. Betro MG, Oon RC, Edward JB, Gamma- Glutamyl transpeptidase and other LFTs in MI and heart failure. Am J clin pathol. 1973; 60:679-83.
13. Wannamethee G, Ebrahim S, Shaper AG. Gamma- Glutamyl transferase: determinants & association with mortality from is chemic heart disease and all cause. Am J Epidemiol 1995; 142:699- 708.
14. Emdin M, PassinoC, MichelassiC, Titta F, et al prognostic value of serum gamma- Glutamyl transferase activity after MI. Eur Heart J 2001, 22:1802-1807.
15. Jousilahti P, Ranstenyte D, Tuomilehto J. Serum gamma-glutamyl transferase, self reported alcohol drinking and the risk of stroke. Stroke 2000; 31: 1851-1855.
16. Paolicchi A, Emdin M, Ghliozeni E, Ciancia E et al Human
Table 1: Comparison of GGTP and TC levels among smokers and CCF patients compared to controls.
Sl. No Parameter Normal(Mean+ SD)
Smoking(Mean+ SD)
CCF Patients (Mean+ SD)
p-value
No of Sample - 35 35 35 -
1 Total Cholesterol(mg/dL) 96 +20.147 218.50+11.4240 223.21+14.992 <0.001
2 GGTP(U/L) 23 +8.990 74.474+8.5849 171.778+46.4207 <0.001

167Indian Journal of Public Health Research & Development. April - June, 2012, Vol. 3, No. 2
atherosclerotic Plaque contains gamma-glutamyl transpeptidase activity circulation 2004; 109:1440.
17. Hood B, Kjellstrom T, Ruter G, Kristenson H. Serum cholesterol, triglyceride, alcohol, MI & death: necessary to pay attention to serum GGT in assessment of risk of myocardial.
18. Ainsley Chalmers. Smoking and oxidative stress. Am J Clin Nutr. 1999; 69(3):572.
19. Paolicchi A, Minotti G, Tonarelli P, Tongiani R et al Gamma- glutamyl transpeptidase- dependent iron reduction and LDL oxidation: a potential mechanism in atherosclerosis. J Invest Med 1999; 47: 151-160.
20. Hedworth- White RB, Whitfield JB, Richardson RW Serum GGT activity in myocardial ischemia. Br Heart, 1967; 29: 432-438.
21. Emdin M, PassinoC C, Pompella A, Paolicchi A Serum gamma-glutamyl transpeptidase: a prognostic marker in cardiovascular diseases. Biofactors 2003; 17: 199-205.
22. Nakanishi N, Suzuki K, Tatara K. Serum-glutamyl transferase and risk of metabolic syndrome and type 2 diabetes in middle aged Japanese men. Diabetes care 2004, 27: 1427-1432.
23. Lee DH, Steffen LM, Jacobs DR. Association between serum glutamyl transferase and dietary factors: the coronary artery risk development in young adults (CARDIA) study. Am J Clin Nutr 2004; 79: 600- 605.

168 Indian Journal of Public Health Research & Development. April - June, 2012, Vol. 3, No. 2
Clinical audit in dentistry – The third eye of oral careSujatha A.1, Nagesh L.2
1Postgraduate Student, 2Professor and Head, Department of Preventive and Community Dentistry, Bapuji Dental College and Hospital, Davangere, Karnataka, India
AbstractProducing good quality goods should be the primary responsibility of the manufacturer, and ensuring good quality services is the responsibility of the government. Utilizing good quality services is the basic human right of each and every individual. Provision of efficient and effective quality health care to the public is one of the ethical principles. Assessment of quality of health care provided to the public can be done through clinical audit system. Clinical audit is a quality improvement process that seeks to improve patient care and outcomes through systematic review of care against explicit criteria, and the implementation of change. Clinical audit results in improved clinical practice, increased efficiency, better clinical outcomes or more cost-effective service. In India, there is hardly any audit system in dentistry though the concept has existed since a long time. This review is an insight on methodology of clinical audit and the need for implementation of such a system for dental practice in Indian scenario.
Key WordsClinical audit, dentistry, quality assurance, dental records.
IntroductionDentistry is both an art and science, demanding high standard of skill and competency of the operator, along with quality armamentarium for providing the best possible oral care. This distinguishes the profession of dentistry uniquely from other health professions. Professional ethics mandate that the dentist stay current with new techniques, therapeutics, and materials, and eliminate outmoded ones in the pursuit of providing the best care for his/her patient1. Providing just health care is not at all important, rather providing quality care is all that matters. Quality assessment of oral care can be done through systematic and organized clinical auditing system. Clinical audit results in improved clinical practice, increased efficiency, better clinical outcomes or more cost-effective service, all of which are a part of clinical governance2.
Despite India having 290 dental colleges and approximately 80,000 dentists3, catering to the needs of approximately 1.15 billion people4, there is hardly any clinical audit
system for quality assessment of oral care. Adequate infrastructure and resources in the form of manpower, money and materials are essential for conducting dental audit. This highlights the need of a third party system - government and/or non-governmental organization(s) and/or professional bodies to take proactive measures to carry out quality assessment in all the dental clinics and dental institutions. Sound methodology and supportive environment with minimal investment of resources is the need of the hour to carry out dental audit.
Defining Clinical AuditClinical audit is a quality improvement process that seeks to improve patient care and outcomes through systematic review of care against explicit criteria and the implementation of change. Aspects of the structure, processes, and outcomes of care are selected and systematically evaluated against explicit criteria. Where indicated, changes are implemented at an individual, team, or service level and further monitoring is used to confirm improvement in healthcare delivery. This definition is endorsed by the National Institute for Clinical Excellence5.
Types of AuditFormal and informal audit
Formal audit is often published. Informal audit may involve regular meetings to present and discuss selected cases.6
Internal and external audit
Audit may be internal where the practitioner reviews his/her own work or external where the review of work is by an outside body separated by distance, experience and values.6
Broad based and focused audit:
Audit can be broad or narrow in focus. Under the category of broad based audits, two types of audit exist – procedural and analytical audit.
Procedural audit is an assessment of adequacy of record-keeping. It answers the following questions7
a. Is the documentation of the patient care process adequate?’

169Indian Journal of Public Health Research & Development. April - June, 2012, Vol. 3, No. 2
b. Does it meet the standards of practice?c. Are there serious procedural omissions or errors that
affect the quality of care?Analytical audit is employed to determine the level of quality of care, by answering these questions7
a. Was the diagnostic information (data base) adequate to identify all significant clinical problems?
b. Was the diagnoses correct based on the information available?
c. Was the treatment plan well-founded based on the diagnostic information and statement of problems?
d. Were there avoidable errors, omissions or inadequacies in the execution of treatment, resulting in complications, compromised results, or failure?
e. Was the overall care of the patient appropriate and adequate?
Focused audits are topic-specific, focus more narrowly on some aspect of patient care. For instance, any diagnostic test or procedure or any therapeutic modality could be the subject of this type of audit. It focuses on the following questions7
a. Were the indications and contraindications for a particular therapy properly considered?
b. Was the treatment technically adequate?c. Were there complications? Were they avoidable?d. Were the short term and long term results satisfactory
based on the preoperative condition?
Stages in Clinical AuditThe methodology of clinical audit and the environment in which it operates are inter-related. If the environment is supportive but clinical audit methods are not used appropriately, there may be less improvement than expected, or no evidence that improvements have been made. Similarly, if clinical audit methods are used well but in an environment that is not supportive, the result may also be a failure to improve care and frustration among
those involved5.
Stages in Clinical AuditStage one: Preparing for audit:
Good preparation is crucial to the success of an audit project. The following issues are considered in preparation stage5
Selecting a topic:
Selecting a topic for audit needs careful thought and planning, because any clinical audit project needs a significant investment of resources. The following questions may serve as a useful guide5
a. Is the topic concerned of high cost, volume or risk to staff or users?
b. Is there evidence of a serious quality problem, for example, patient complaints or high complication rates?
c. Is good evidence available to inform standards, systematic reviews or national clinical guidelines?
d. Is the problem concerned amenable to change?e. Is the topic pertinent to national policy initiatives?
Defining the purpose
A project without clear objectives cannot achieve anything. A sense of purpose must be established before appropriate methods for audit can be considered. The following series of verbs may be useful in determining the aims of an audit8
a. To improveb. To enhancec. To ensured. To change
Providing a structure
To enhance the benefits of audit, an organization needs a structured audit programme and a team of well

170 Indian Journal of Public Health Research & Development. April - June, 2012, Vol. 3, No. 2
qualified audit staff9. The main barriers to audit reported in literature are lack of resources5. Therefore, sufficient resources are recruited before planning a clinical audit.
Audit team
Clinical service representatives and audit staff are usually involved in audit project teams. It is also important that the team includes members from all the relevant groups involved in care delivery, and not just those with clinical experience. All the team members should have a) a basic understanding of clinical audit, b) an understanding of and commitment to the plans and objectives of the project and c) an understanding of what is expected of the project team. The focus of any audit project must be those receiving care. The most common method of involving users in clinical audit is the satisfaction survey5.
Identifying and developing skills for audit projects
Lack of training and audit skills are highlighted in the review as barriers to successful audit. To be successful, a clinical audit project needs to involve the right people with the right skills from the outset. Everyone who becomes involved in an audit project needs an understanding of audit in general and the objectives of the project5.
Stage two: Selecting criteria
Within clinical audit, criteria are used to assess the quality of care provided by an individual, a team or an organization. These criteria are explicit statements that define what is being measured and represent elements of care that can be measured objectively5. Criteria can be classified into those concerned with
a. Structure (What you need)b. Process (What you do)c. Outcome of care (What you expect)
Structure criteria: Refer to resources required. It includes the number of staffs, organizational arrangements, the provision of equipment and physical space5.
Process criteria: Refer to actions and decisions taken by practitioners together with users. These actions may include communication, assessment, education, investigations, prescribing, surgical and other therapeutic interventions, evaluation and documentation5.
Outcome criteria: These are typically measures of the physical or behavioral response to an intervention, reported health status, and level of knowledge and satisfaction. Sometimes surrogate, proxy or intermediate outcome criteria are used instead5.
For criteria to be valid and lead to improvements in care, they need to be based on evidence, related to important aspects of care, and above all, measurable. Developing such criteria can be time-consuming and requires considerable expertise. Therefore, in some situations, implicit criteria have been used. This means that the review of care is undertaken by senior clinicians who rely on their own experience in judging care. Because of the
difficulties of ensuring reliability in the interpretation of information about the care that was given, this method should be avoided where possible. Benchmark criteria should be set to avoid setting unnecessarily low or unrealistically high target levels of performance5.
Stage three: Measuring level of performance
Data collection is the key step to measure the level of performance. It is always tempting to collect more data than necessary, but only the minimum amount required by the objectives of the audit should be collected.
Dental records
A well designed and properly maintained patient record is an important quality assurance tool because it documents all aspects of patient care7. It has high utility because it is an existing part of the practice, and can be used in quality assurance activities without disrupting normal office procedures.
The dental record should adequately document each of its five phases – assessment of patient’s condition, diagnoses arrived at from this assessment, the therapeutic plan which follows from the diagnoses or statement of problems, the provision of treatment, and outcomes resulting from the previous four phases of the processes7. Patient care is not a linear process with a beginning and an end. It is actually a dynamic cyclic process that repeats itself for each sequence of treatment. At each recall visit, the dentist evaluates not only the outcome of the previous course of treatment, but also any new or altered conditions of pathology and the results of patient’s self-care7.
Quality dental record keeping is recognized by the profession as a requirement of prudent and effective practice management10,11,12 Universal standards for dental record management need to be established which should include documentation of consultations by and referrals to specialists and medical professionals, authorization of treatment plans and plan modifications by faculty and patients, status and timeliness of care, radiographic services, communications with patients regarding their care, treatment provided, faculty supervision and care provider identification13. These standards form the basis of dental record audit. Unfortunately, charts in most dental practices do not meet these requirements, and therefore, are inadequate instruments for quality assessment.
Sampling users
It may not always be practical or feasible to include each and every user. In this case, a representative sample is usually chosen from which inferences about the total population can be made. Various statistical methods can be used for calculating sample sizes, depending upon the type of data. Random sampling should be used whenever possible to minimize the risk of bias5. Sometimes, two-stage sampling is done in order to improve efficiency14. A small sample is selected first, and if unequivocal

171Indian Journal of Public Health Research & Development. April - June, 2012, Vol. 3, No. 2
conclusions can be drawn, no more data are collected. If the results are ambiguous, a larger sample is selected.
Confidentiality of data
According to the requirements of Data Protection Act, 1998, these guidelines must be followed to maintain the confidentiality of the data5
a. When information is gathered directly from patients, auditors must explain why the information is needed and what will happen to it, before asking for the patient’s consent.
b. If information is obtained from medical records, either patients must consent to identifiable data being used, or a member of the healthcare team should make the information anonymous before it is used in audit.
c. If neither of these approaches is possible, it may be permissible for someone from outside the team, who is suitably trained and subject to a duty of confidentiality, to collect the data from the records and make it anonymous without seeking patient consent.
Data AnalysisThe analysis can range from a simple calculation of percentages to relatively sophisticated statistical techniques. If the results are to simulate change, the analysis must be simple enough for everyone in the care process to understand. If samples have been taken, the most appropriate calculation to perform is confidence intervals5.
Stage four: Making improvements
It would be a futile exercise of conducting dental audit without drawing conclusions from the work that has been done. Once conclusions are made, it is easy to make appropriate recommendations. An action strategy has to be designed which should make certain that the required action is planned to take account of what needs to be done, by whom and by when. The implemented change can be subjected further to re-auditing to ensure that the desired change has taken place6.
Stage five: Sustaining improvement
While improving performance is the primary goal of audit, sustaining that improvement is also essential. Systematic and continuous monitoring should be carried out to detect declining performance. Errors and adverse incidents can also be used for continued monitoring. Comments from users may be included as sources of information about performance5.
Clinical Auditing – Ongoing ProcessClinical auditing should neither be once for all nor short-term process. If this is the case, the results of audit might probably be biased because of Hawthorne effect on
the providers of the care2. Thus, auditing should be an ongoing process to sustain the quality of health care.
Barriers to Successful Clinical AuditSuccess of clinical audit depends on how well the barriers are tackled. Some of the barriers to audit include5
1. Lack of resources2. Lack of expertise in project design and analysis3. Lack of overall plan for audit4. Poor relationships between professional groups or
agencies and within teams5. Organizational problems, such as lack of supportive
relationship between clinicians and managers15
Feasibility of Implementing Dental Audit in IndiaThe concept of clinical audit for oral health care is a vision for a country like India. Such a vision would turn into reality in the near future, if the following issues are addressed.
1. Do we have adequate resources to implement audit system?
2. Who will comprise the audit team?3. Who will be the central authority for conducting
dental audit – government and/or non-governmental organization(s) and/or professional bodies like Dental Council of India (DCI), Indian Dental Association (IDA)?
4. Will the dental practitioners and concerned authorities of dental institutions extend their cooperation to carry out a systematic audit?
5. What should be the time interval required for conducting audit and how long should the process continue?
6. What is the benchmark level of dental care that needs to be set for making comparisons?
ConclusionsQuality oral health care increases the demand for seeking health care among public which in turn calls for continuous upgradability in the existing quality of health care system. This means that provision of quality health care gives immense satisfaction to the consumers; thereby convert their felt needs in to demands and build a high level of hope and anticipation to seek a much better quality of health care. Lobbying of policy-makers should be done to implement mandatory auditing by a third party for all the dental practitioners and dental institutions. If implemented, it would certainly serve as the third eye of oral care.
References1. Burakoff RP, Demby NA. Quality Assurance – Historical
Perspective and Critical Issues. Dent Clin North Am 1985; 29:
172 Indian Journal of Public Health Research & Development. April - June, 2012, Vol. 3, No. 2
427. 2. Methodologies for clinical audit in dentistry- Faulty of
Dental Surgery. January 2000. The Royal College of Surgeons of England. Available from http://www.rcseng.ac.uk/publications/docs/methodologies_dentistry.html. Accessed on 29/10/10.
3. Kohli A. Guidance toward the future of dental education in India. Dentistry India 2009; 3: Available from http://www.dentistryindia.net/article.php?id=3237. Accessed on 20/11/10.
4. India’s population 2010. Available from http://www.indiaonlinepages.com/population/india-population.html. Accessed on 25/10/10.
5. Principles for best practice in clinical audit. National Institute for Clinical Excellence. United Kingdom: Radcliffe Medical Press; 2002. Available from http://www.nice.org.uk/niceMedia/pdf/BestPracticeClinicalAudit.pdf. Accessed on 10/11/10.
6. Clinical audit. Professional Development Committee 2002. London: British Orthoptic Society. Available from www.orthoptics.org.uk/orthoptists/clinical_audit.pdf. Accessed on 19/11/10.
7. Jerge CR, Orlowski RM. Quality Assurance and the Dental Record. Dent Clin North Am 1985; 29: 483-96.
8. Buttery Y. Implementing evidence through clinical audit. In: Evidence-based healthcare. Oxford: Butterworth-Heinemann, 1998: 182-207.
9. Dickinson K, Edwards J. Clinical audit: Failure or hidden success? Journal of Clinical Excellence 1999; 1: 97-100.
10. American Dental Association. Dental practice parameters: Parameters for 12 oral health conditions. Chicago: American Dental Association, 1995.
11. Commission on Dental Accreditation. Accreditation standards for dental education programs. Chicago: American Dental Association, 1993.
12. American Dental Association. ADA principles of ethics and code of professional conduct. Chicago: American Dental Association, 1995.
13. Chasteen JE, Cameron CA, Phillips SL. An audit system for assessing dental record keeping. J Dent Edu 1996; 60: 978-86.
14. Alemi F, Moore S, Headrick L, Neuhauser D, Hekelman F, Kizys N. Rapid improvement teams. Joint Commission Journal on Quality Improvement 1998; 24: 119-29.
15. Johnston G, Crombie IK, Davies HTO, Alder EM, Millard A. Reviewing audit: Barriers and Facilitating factors for effective clinical audit. Quality in Health Care 2000; 9: 23-36.

173Indian Journal of Public Health Research & Development. April - June, 2012, Vol. 3, No. 2
Aesthetic management of malpositioned implant following extraction of endodontically failed tooth: A case report Sumit Deshpande1, D R V Kumar2, Sudhendra Deshpande3, Ajay Gaikwad1, Sharas Chandra4
1Dept. of Prosthodontics and Implantology, MIDSR Dental College, Latur, Maharastra, India, 2Dept. of Prosthodontics, Pacific Dental College, Udaipur, 3Dept. of Endodontics, HKES Dental College, Gulbarga, 4Dept. of Periodontics, MIDSR Dental College, Latur, Maharastra, India
AbstractImplant stability is attributed to its anchorage in the surrounding alveolar bone, referred to as osseo integration1,2. Proper implant placement in bone is necessary for the success of osseo integration and function3. Implant-supported single crowns have become a valid alternative to conventional fixed dental prosthesis due to their excellent clinical long-term results. Adequate bone base is a prerequisite for functionally and aesthetically optimum reconstruction of soft tissue architecture around a dental implant4. when implants are malpositioned axially, prefabricated or custom made angled abutments may be used for acceptable comfort, function and aesthetics. When implants are apico-coronally malpositioned gingival ceramics can aid in restoration of aesthetics and imitation of emergence profile of the restored tooth. However, along with good survival rates, aesthetic factors are important for success in anterior regions. Gingival harmony is an important element in the aesthetics of the smile. Clinicians need to have the essential knowledge to create an optimal soft-tissue profile around teeth and implant restorations. The following case report describes the treatment of a malpositioned osseo-integrated dental implant with an intruded axially placed implant fixture.
Key WordsMalpositioned implant, Implant aesthetics, Gingival ceramics, Endodontic failures.
IntroductionTitanium dental implants have been used in the treatment of partial or complete edentulism. The height and width of the residual alveolus and surrounding anatomical structures can determine the proper position and path of insertion of dental implants.
An ideal positioning of implant in all 3 dimensions is required for optimal aesthetic results to be secured5,6. These dimensions, i.e. mesio-distal, oro-facial and apico-coronal are described defining “comfort” and “danger” zones for proper positioning in the anterior maxilla7. Aesthetics includes both the white and red aesthetics of which much importance is given to the red aesthetics8,9.
The standard parameters for achieving aesthetic implant
prosthesis result in one that is in harmony with the perioral facial structures of patient. The aesthetic peri-implant tissues, in their health height volume, colour and contours must be in harmony with the healthy surrounding tissue. The restoration should imitate the natural appearance of the missing dental unit in colour, form, texture, size and optical properties10,11.
Case ReportA 45 year old female patient reported with a mobile segment of maxillary left lateral incisor. Radiovisiograph revealed endodotically restored fractured tooth in an irreparable condition [figure 1]. The tooth was extracted and the granulation tissue cleared. Post extraction examination showed a major labial bone deficiency [figure 2]. A GS 4x11.5mm implant fixture (Osstem) was placed to a desired and determined position considering the position of adjacent teeth and availability of bone
Figure 1
Figure 2

174 Indian Journal of Public Health Research & Development. April - June, 2012, Vol. 3, No. 2
[figure 3]. Two of the exposed threads of fixture were covered with bone graft material and GTR membrane. The labial and palatal flaps were properly approximated and sutured. The implant fixture could not be ideally positioned due to the poor quality of bone. It was observed that the implant fixture was significantly malpositioned axially and apically [figure 4].
The implant was restored at 6 months after a second stage surgery. Osstem healing abutment /gingival former was placed to reveal a healthy gingival tissue. An implant level impression was made using a GS Osstem transfer transfer coping and a custom tray with addition polyvinyl siloxane material. Implant analog was positioned in the impression and gingival replica was completed in silicone material. A definitive cast was poured in a type IV die stone.
A 150 angled abutment with a collor height of 2mm was used to correct the labial malpositioning of implant. A PFM crown with the cervical gingival shade ceramic was fabricated for the correction of gingival recession and to mask an elongated crown length.
The abutment was fixed to the implant fixture and crown was tried for the marginal integrity and aesthetics and sent for final finish.
The screw access opening was blocked using low strength temporary cement prior to the final cementation. The patient has been followed regularly for routine hygiene and implants condition and has been found to have continued to report excellent comfort, aesthetics and function.
DiscussionAmong various techniques reported to improve soft tissue deficiency are, the use of gingival-coloured acrylic resin facade, flexible silicone-based tissue-coloured material, or removable prostheses. The loss of peri-implant tissue can also be corrected by applying gingival-coloured ceramic on the cervical portion of implant-supported metal ceramic restorations, achieving harmonious mucogingival contours, as described in this clinical report. Another advantage of the described technique is the repositioning of the cement interface between the abutment and the restoration away from the tissues. When the gingival-coloured ceramic is applied to the crown, the cervical extension of porcelain toward gingival embrasure spaces may be limited by the path of insertion of the crown and adjacent teeth. In contrast, the application of gingival-coloured ceramic on a customized abutment allows a gingival embrasure space to be filled where interproximal papillae are missing and allows for the creation of a natural appearance, as well as fewer limitations from the contours of the adjacent teeth. In the situation presented, the aesthetics was also improved by creating the illusion of a tooth emerging from the soft tissue.
ConclusionHorizontal and vertical bony deficiencies may result in malpositioning of dental implants. The maximum disangulation in relation to the long axis of the implant is recommended not to exceed 300. Severe malpositions of
Figure 5
Figure 6Figure 4
Figure 3

175Indian Journal of Public Health Research & Development. April - June, 2012, Vol. 3, No. 2
implant in aesthetic zone may be solved by prosthodontist to some extent. Gingiva-coloured dental porcelain added on the abutment to replace the missing gingival tissue, further improves the aesthetic outcome of the definitive restoration.
Reference1. Smith D, Zarb G. Criteria for success of osseointegrated
endosseous implants. J Prosthet Dent 1989;62:567-72.2. Zarb GA, Schmitt A. The longitudinal clinical effectiveness of
osseointegrated dental implants: the Toronto Study, Part II: The prosthetic results. J Prosthet Dent 1990;64:53-61.
3. Van Steenberghe D. A retrospective multicenter evaluation of the survival rate of osseointegrated fixtures supporting fixed partial prostheses in the treatment of partial edentulism. J Prosthet Dent 1989;61:217-23.
4. Bahat O, fontenesi RV, preston J. Reconstruction of the hard and soft tissues for optimal placement of osseointegrated implants. Int J periodont Rest Dent 1993;13:255-75.
5. Higginbottom F, Belser U, Jones JD, Keith SE. Prosthetic management of implants in the esthetic zone. Int J Oral
Maxillofac implants 2004;19:62-72.6. Meijer HJ, Stellingsma K, Meijindert L, raghoebar GM. A new
index for aesthetics of implant supported single crowns and adjacent soft tissues – The Implant Crown Aesthetics Index. Clin Oral Implants Res 2005;16:645-9.
7. Jesen CE, Weisgold A. Presurgical treatment planning for the anterior single tooth implant restoration. Compend contin educ dent 1995;16:746-54.
8. Zarb GA, Symington JM. Oseointegrated dental implants: preliminary report on a replication study. J Prosthet Dent 1983;50:271-6.
9. Furhauser R Florescu D, Benesch T, Haas R, Mailath G, Watzek G. Evaluation of soft tissue around single tooth implant crowns: the pink aesthetics score. Clin Oral Implants res 2005;16:369-44.
10. Belser U, Martin W, Jung R, hammerle C, Schmid B, Morton D, et al. ITI Treatment Guide vol 1. In: Hammerle C, Jung R, editors. Prosthetic management of implants in the esthetic zone: general principles and scientific documentation. Berlin: quintessence pub. Co; 2007.p38
11. Nur Hersek, Hasan Onder Gumus, ferda Tasar, Mustafa Saysel. The journal of Indian prosthodontic society. 2008;vol 8, issue 4, 213-15.

176 Indian Journal of Public Health Research & Development. April - June, 2012, Vol. 3, No. 2
Biomedical waste management practices: A cross-sectional study in an urban settingSushil Dohare1, Himanshu Chauhan2, Vijay l Grover3, Shabana M. Khan2, Sunil K Dohare4, Madhu Bala5
1Associate Professor, 2Assistant Professor, 3Prof. and Head, Community Medicine, SMS & R Sharda University, Plot No. 32-34, Knowledge Park-3, Greater Noida, U.P., 4Dy. CMO, G.B. Nagar, CMO Office, District Hospital Campus, G.B.Nagar, U.P-201301, 5CMO, Mother & Child Welfare Centre Himmatpuri, Delhi
Abstract
ObjectiveTo study the biomedical waste management practices in different health facilities of Noida U.P.
Material and MethodsIt is a cross-sectional study including all medical practitioners of urban NOIDA. A modified Biomedical waste auditing questionnaire of Central Pollution Control Board was used to collect data. Data was tabulated on Microsoft Excel sheet and analyzed using Epi-Info version-6 software.
ResultsUnqualified medical practitioners which were 39.4% of the study group were not using protective gear; not segregating/labeling/disinfecting the biomedical waste. Among qualified medical practitioners, 32.5% were using mechanical devices, 65% were segregating and labeling biomedical wastes while only 6.9% were disinfecting the sharps. Conclusion: Biomedical waste management is grossly inadequately practiced and there is a need to implement present rules and regulations with renewed vigour.
Key WordsBiomedical Waste, Bio-waste Management.
IntroductionBiomedical waste is the waste generated in the diagnosis, treatment or immunization of human beings or animals, in research or in the production of testing of biological products including all categories of infected and toxic waste that is a potential threat to human beings and the environment1.
It is a major issue of concern not only for Hospitals and Nursing Homes but also equally for the Environmental and Law enforcing agencies, general public and media.
All individuals exposed to hazardous health-care waste are potentially at risk, including those within health-care
establishments that generate hazardous waste, and those outside these sources who either handle such waste or are exposed to it as a consequence of careless management. The main groups at risk are Medical doctors, nurses, health-care auxiliaries, and hospital maintenance personnel; Patients in health-care establishments or receiving home care; Visitors to health-care establishments; Workers in support services allied to health-care establishments, such as laundries, waste handling, and transportation and Workers in waste disposal facilities (such as landfills or incinerators), including scavengers2.
Material and MethodsPresent study was conducted in NOIDA city, UP. It is located in the state of Uttar Pradesh at the fringes of Delhi, the national capital. The study was carried out over a period of one year from august 2007 to October 2008. It is a cross -sectional study, institution based study. The universe consist of all the government hospitals, dispensaries and research institutes; all hospitals, nursing homes, clinics run by private sector and charitable; all dental hospitals/clinics; all laboratories and radiological diagnostic centre; all veterinary hospitals and all medical practitioners without any formal qualification (quacks) are also included. A purposive/ feasible, non-probable sampling technique was taken for the study. The entire universe was taken for this study. Superintendent/in-charge of the health care facility generating biomedical waste was interviewed to collect data. A modified Bio-medical waste auditing questionnaire of Central Pollution Control Board was used to collect data. The questionnaire was pre-tested and administered to collect information about knowledge of biomedical waste disposal, including section for observation, collection, segregation, and disposal of biomedical waste. Every health care facility of Noida, generating biomedical waste was included in the study. Health care facilities which do not cooperate or do not respond to Questionnaire or found closed at the time of collection of data were excluded from the study. Data was tabulated on Microsoft Excel sheet and analyzed using Epi-Info version-6 software.
ObservationsTable no. 1 shows distribution of various types of health care facilities generating bio medical waste studied. 56

177Indian Journal of Public Health Research & Development. April - June, 2012, Vol. 3, No. 2
centers providing Medical care, 13 Diagnostic centers and 1 Research Facility and 1 Veterinary Facility participated in the study. Table no. 1 also shows distribution of qualification among doctors working in the health care facility. Doctor with highest qualification was taken into account. The table no-1shows that a total of 43 qualified medical practitioners and 28 practitioners without any recognized medical qualification (by MCI) participated in the study. It was observed that the difference in the distribution of use of protective gears worn by health care workers while handling biomedical waste in the health care facilities of qualified medical practitioners and unqualified medical practitioners. It was observed that 65.5% of qualified medical practitioners and none of the unqualified medical practitioners were segregating waste into the designated colored container. Table no. 2 shows the difference in the distribution of labeling of biomedical waste, as practiced, among qualified and unqualified medical practitioners. None of the unqualified medical practitioners were labeling the waste; whereas 34.8% of qualified medical practitioners were labeling the waste. It was observed that the utilization of offsite treatment facility for treatment of biomedical waste by health care facilities of qualified and unqualified medical practitioners under study. 65.2% of qualified medical practitioners and none of the unqualified medical practitioners were utilizing offsite treatment facility for disposal of biomedical waste. It was observed that the classification of waste sharps in the health care facilities of qualified medical practitioners and unqualified medical practitioners. 65.1% of qualified medical practitioners had classification of waste sharps where as none of the
unqualified medical practitioners had classification of waste sharps. It was observed that distribution of methods of disinfection of waste classified as waste sharps by health care facilities of qualified medical practitioners and unqualified medical practitioners. 6.9% of health care facilities of qualified medical practitioners were disinfecting sharps before disposal where as none of health care facilities of unqualified medical practioners were doing so.
DiscussionA total 71 health care facilities generating bio medical waste participated in the study. 56 centers Medical care, 13 Diagnostic centers, 1 Research Facility and 1 Veterinary Facility formed the study group. A total of 43 qualified medical practitioners 28 practioners without any recognized medical qualification (by MCI) responded to the questionnaire. Of the 71 health care facilities under study, only 30 health care facilities were registered with State Pollution Board for biomedical waste management and 41 health care facilities were not registered. 69.7% among qualified medical practitioners and none among unqualified medical practitioners.
In the study group, health care workers of only 1.4% health care facilities was using puncture-proof gloves, 4.2% were using apron, 0% were using goggles, 2.8% were using facemask and 7.8% were using shoes, while handling biomedical waste. These findings where very less as compared to the observations of Rao et al3, most of the Safai karmacharis were using complete protective equipment like gloves, masks, shoes etc while handling waste.
39.4% of the health care facilities were segregating waste into the prescribed colored container. 65.5% of qualified medical and 0% of unqualified medical practitioners. Hemchandra4 in his paper recommends Segregation is the essence of waste management and should be done at the source of generation of bio-medical waste e.g. all patient care activity areas, diagnostic services areas, operation theatres, labour rooms, treatment rooms etc. The responsibility of segregation should be with the generator of biomedical waste i.e. doctors, nurses, technicians etc. (medical and paramedical personnel). The biomedical waste should be segregated as per categories mentioned in the rules.
It was observed in the study that 65.2% of qualified medical practitioners and 0% of unqualified medical practitioners were utilizing offsite treatment facility for disposal of biomedical waste. Central pollution Control Board recommends a Common Bio-medical Waste Treatment Facility (CBWTF), where bio-medical waste generated from a number of healthcare units, is imparted necessary treatment to reduce adverse effects that this waste may pose. The treated waste may finally be sent for disposal in a landfill or for recycling purposes5.
39.4% of health care facilities were segregating waste
Table 1: Distribution of types of health care facility and qualification of health facility in-charge.
S. No Variable Number Percent
1. Type of health facility
Research Facility 1 1.4%
Medical Facility 56 78.8%
Diagnostic Facility 13 18.3%
Veterinary Facility 1 1.4%
Total 71 100
2. Highest Qualification of Doctor Number Percent
DM/MCh 2 2.8%
MD/MS 21 29.5%
MBBS/PG Diploma 11 15.4%
BDS/BUMS/BHMS/BAMS 9 12.6%
No Medical Qualification 28 39.4%
Total 71 100
3 Qualification of Doctor Number Percent
Qualified Medical practitioner 43 60.5%
No Medical Qualification 28 39.4%
Total 71 100

178 Indian Journal of Public Health Research & Development. April - June, 2012, Vol. 3, No. 2
into waste sharps and 60.6% of health care facilities did not have classification for waste sharps. 65.1% of qualified medical practitioners had classification of waste sharps where as 0% of unqualified medical practitioners had classification of waste sharps. Hollie Shaner et al6in their Eleven Recommendations for Medical waste Management states that of the 10 percent or less portion of the waste stream that is potentially infectious or hazardous, the most immediate threat to human health (patients, workers, public) is the indiscriminate disposal of sharps (needles, syringes, lancets, and other invasive tools). Proper segregation of these materials in rigid, puncture proof containers, which are then monitored, for safe treatment and disposal is the highest priority for any health care institution. If proper sharps management were instituted in all health care facilities most of the risk of disease transmission from medical waste would be solved. This would include proper equipment and containers distributed everywhere that sharps are generated (needle cutters and needle boxes), a secure accounting and collection system for transporting the contaminated sharps for treatment and final disposal, and proper training of all hospital personnel on handling and management of sharps and personal protection.
Conclusions1.4% health care facilities was using puncture-proof gloves, 4.2% were using apron, none were using goggles, 2.8% were using facemask and 7.8% were using shoes, while handling biomedical waste. None of the staff of unqualified medical practitioners was using any protective gear.
39.4% of the health care facilities were segregating waste into the prescribed colored container. 65.5% of qualified medical practitioners and none of the unqualified medical practitioners were segregating waste into the designated colored containers.
21.1% of all health care facilities were labeling the containers of biomedical waste generated, 39.4% were not labeling the containers and 39.4% were not aware of regulation regarding labeling of biomedical waste containers. None of the unqualified practitioners was labeling the waste; where as 34.8% of qualified medical practitioners were labeling the waste.
39.4% of all health care facilities were utilizing offsite treatment facility for treatment of biomedical. 65.2% of qualified medical practitioners and none of the unqualified medical practitioners were utilizing offsite treatment facility for disposal of biomedical waste.
39.4% of health care facilities were segregating waste into waste sharps and 60.6% of health care facilities did not have classification for waste sharps. None of the health care facilities of unqualified medical practitioners had classification of waste sharps 4.2% of Health Care Facilities were disinfecting waste classified as waste sharps before disposal and 95.8% were disposing it without disinfecting it. 6.9% of Health Care Facilities of qualified medical practitioners were disinfecting sharps before disposal where as none of the health care facilities of unqualified medical practitioners were doing so.
References1. CPCB: The Biomedical Waste (Management and Handling)
Rules: 1998/20002. Government Of India implemented Biomedical Waste
Management rules: 1998, 20003. Rao SKM: Bio medical Waste Management: An Infrastructural
survey of Hospitals MJFAI-Vol.60, No.4:20044. Chandra Hem: World Environment Day: NBRI: Vol. 5 No.3: 19995. Central pollution Control Board, Guidelines For Common Bio-
Medical Waste Treatment Facility6. Hollie Shaner, R N and Glenn McRae: Eleven Recommendations
for Medical Waste Management: CGS Environmental Strategies, Inc. of Burlington, Vermont, USA

179Indian Journal of Public Health Research & Development. April - June, 2012, Vol. 3, No. 2
A study of cytomorphological patterns and their diagnostic importance in tubercular lymphadenopathyUma Tayal1, Bharat Bhushan2, A.K. Garg3, Nishant4
1Assistant Professor, Pathology, 2Demonstrator, Pathology, 3Professor of Anatomy, Sarswathi Institute of Medical Sciences, Hapur,4Final MBBS Student, MLB MC, Jhansi
AbstractTuberculosis [TB] is a specific communicable disease and is one of the most common disease in developing countries like India. There are 20-25 million cases of infectious tuberculosis in the world.In India alone there are 12-15 million cases of primary tuberculosis of which about 2 million are bacillary cases at any given period of time.[PARK & PARK 1986].Currently, more people die of tuberculosis than from any other infectious disease. Death from tuberculosis comprises 25% of all avoidable deaths in developing countries2. Every minute, a death occurs due to tuberculosis in our country. To add to the existing burden, the situation is compounded by the large scale increase of new TB cases associated with increasing HIV infection. India is estimated to have 3.5 million HIV patients, and about 1.8 million of these are co-infected with TB5. Tuberculosis usually affects lungs and the next common entity is the tubercular lymphadenopathy [TLN.]
Many a time exact diagnosis of TLN poses a great problem to the clinician.This is because of wide spread nature of the disease and consequently symptomatolgy produced is very vague. In TLN specilised investigation like ELISA test,PCR etc.are also not always diagnostic. In pulmonary cases diagnosis can be confirmed by demonstrating AFB in the sputum but the same is not true for TLN. Inabiity to demonstrate AFB in most of the patients of TLN has prompted many workers 2,4 to develop serological tests. However these attempts have not so far resulted in providing a single reliable serological test for either pulmonary or extrapulmonary TB. Open surgical biopsy is a time consuming procedure and also this facility is not available at all centres in developing country like India. Thus in the present scenario, fine needle aspiration biopsy[FNAB] is recommended for evaluation of cytomorphological pattern[CMP] and its utility in establishing the diagnosis of tuberculosis [TB].
Key WordsCytomorphological patterns, tuberculous lymphadenopathy/ lymph node, fine needle aspiratin biopsy, Tuberculosis.
AimA patient of TLN can not be treated unless and until
histopathological or bacteriological proof for the disease is available. The first one is time consuming and also risky in debilitated patients of TB. The second one is usually not positive. In view of lack of any other sensitive diagnostic method and considering the importance of early diagnosis as the disease is easily curable in its earlier stages, present study was under taken to over come all these shortcomings and to ascertain wheather there are any cellular constituents peculiar to TLN, which are useful in making the diagnosis in cases persistently negative on bacteriological examinatrion.
Material and MethodThe study was conducted on 52 FNAB material from randomly selected known patients of TLN in which treatment is not yet started. These patients were belonging to different age groups and involving lymphnodes at different sites. Out of these 38 were male and 24 were female patients. Aspiration material obtained in all these were adequate except in 3 patients where repeat aspiration was done. In the present study, technique described by Franzen et al [1968] was employed. At least 5 smears were prepared from each aspiration site. These smears were stained by----
1. Haematoylin and Eosin,2. Papanicoloau and 3. Ziehl-Neelsen [Z-N] staining for A.F.B.
After CMP evaluation these smears were divided broadly in to 2 groups.
GROUP A - Includes the smears which showed cytological features of Granulomas.
GROUP B - Includes the smears without any granulomas.
Granulomas were defined as aggregates of epitheloid cells These are the cells with tapered ends and elongated folded nuclei, having poorely defined finely vacuolated amphophilic or cyananophilic cytoplasm. These cells are
Table A: Shows Number of Cases in Each Group
Cytologic Findings No. of Cases
With Granuloma 32
Without Granuloma 20
TOTAL 52

180 Indian Journal of Public Health Research & Development. April - June, 2012, Vol. 3, No. 2
present in clusters or dispersed through out the smears. Langrhans Giant cells are present only in few cases.
Observation
Discussion The non-availability of a technically simple, reliable, reproducible and rapid test often makes the diagnosis of TLN difficult. The traditional method of mycobacterial culture, though considered as a gold standard, is less sensitive in pauci-bacillary situations like TLN. Moreover, it requires a sample from the site of lesion, which is often difficult. Methods like radiometric detection of bacterial growth, gas chromatography, DNA hybridization and PCR are technically too demanding to be widely available in developing nations6. ELISA techniques, using various mycobacterial antigens, have been employed for
the serodiagnosis of TB but these are not always reliable in TLN because of [1] the spectrum of antibodies in serum varies with genetic background of the subject as well as the stage of the infection,[2] in endemic areas antibodies would normally be present in the population and[3] these antibodies may have been induced in response to tuberculosis/environmental mycobacteria which are frequently cross-reactive.
Present study was carried out at “ SARSWATHI INSTITUTE OF MEDICAL SCIENCES” Anwarpur, Hapur. Total 52 diagnosed cases of TLN were selected. Z-N staining was used to reach the definitive diagnosis. After CMP evaluation, the cases were divided in to two groups[Theodre et al]
Group A ---- with granuloma
Group B --- without any granuloma.
Caseation in a smear showing evidence of granulomatous inflammation is suggestive of TB[Koss,1979].
Patra et al [1983] for the first time found 87.1% diagnostic accuracy in TLN by FNAB.
In our study TABLE “A” Shows that granulomas were present in 32 [54%]cases where as there were no
granuloma in 20 [46%]cases.
Smears from cases of Group A AND Group B were further analysed according to individual cell findings.
TABLE “B” shows epitheloid cells in 87% cases and Giant cells in 51% cases of Group A. In Group B caseation, fibrous strands and mixed inflammatory cells were the[100%]constant findings. Eosinophilic hyaline to granular material is suggestive of caseated debris.
TABLE “C” shows that Z-N staining was positive in about 4% of the cases and thus does not contribute much in making the diagnosis.
Summary and ConclusionThe diagnostic problem in TLN results from the frequent failure of bacteriological methods of smear-microscopy in establishing the diagnosis.One of the aim of present study was to provide an early diagnosis and there by subjecting the patient to treatment in time for a disease that is practically curable.The results obtained are highly reliable with the sensitivity achieved is 91.3% The advantages of simplicity, costeffectiveness and rapidity make FNAB and CMP IN TLN an attractive adjunct in diagnosis.
The finding of the present study can be summarized as follows—
1. Epitheloid cell and Giant cell is a characterstic feature of tuberculosis and was a persistant finding .
2. Caseous material and Histiocytes in a smear showing evidence of granulomatous inflammation is suggestive of tuberculosis.
Present study shows that CMP in TLN is very useful in making the diagnosis. The advantages of simplicity, costeffectiveness and rapidity make CMP in TLN an attractive adjunct in diagnosis. It should be employed routinely to diagnose the TBN. Early diagnosis of tuberculosis and initiating optimal treatment would not only enable a cure of an individual patient but will also curb the transmission of infection and disease to others in the community.
References1. Agrawal, P.K.; Gosh M; Wahl K.M. and Mehrotra, R.M.1977;
Indian Jour. Cancer,14:157-63.2. Chodosh, New Eng. Jour. Med.1970; 282:854-573. Claude Ellis, Franker, M.D Arch.Intern. Med. 1957; 40:532 ,647-
664. Donald D, Storey Dalad, E Dines AND Dougast T, Jour American
Medl. Assn.1998; 236: 19-225. Duke, S.C., Recent Advnces in Clinical Pathology; Churchill-
Livingstone. 2003;310-206. Farber, S.M. Wood DA,Pharr SL and Person D, Diseases of
Lymph Node, 2003;31:1-137. JIMA-Special issue on Tuberculosis-number II Oct 1996.p 390.8. Indian Journal Of Tuberculosis; Oct-2003. 9. Frable, W.J., Thin needle aspiration biopsyVol.14in series:10-13
Table B: Shows Analysis of the Two Groups
Granuloma Cytological Findings No. Of Cases
Group A Epitheloid cells 26
Granuloma present Giant cells 15
GROUP B Histiocytes 16
No granuloma Caseation 20
Fibrous strands 20
Mixed inflammatory cells 20
Table C: Results of Z-N Staining in Two Groups
Group Z-N Staining Positive Negative
A - With Granuloma 2 30
B - Without Granuloma L 20

181Indian Journal of Public Health Research & Development. April - June, 2012, Vol. 3, No. 2
10. Koss, Leopold G1979: Diagnostic cytology and its histopathological basis; 3rd editionPhiladelpha, Vol.2 p878.
11. Park J.E, Park K.P1986, Text bok of social and preventive medicine p 367
12. Theodre Bailey, Akhtar ali, 1985, Acta Cytologica 29 NO 5,731-736
13. Wig K and BawaY.S.: INDIAN JOUR. TUBER,1953-54,1:6-124.14. Progress towards tuberculosis control. India 2001. MMWR 51:
229, 2002
15. Bothamley G, UdaniPRudd R, F.F, Ivanyi J-Humoral response to defined epitopes tubercle bacilli in adult pulmonary and child tuberculosis. Eur J Clin Microbiol Infect Dis 1988;7:639-45
16. Talwar GP- Continuing challenges in tuberculosis research.Indian j.Tuberc 1992;39:67-9
17. Boklosd, Constartkis N, Tseiricast T,Acta cytologica 1974;18:118-21

182 Indian Journal of Public Health Research & Development. April - June, 2012, Vol. 3, No. 2
Knowledge of Swine Flu among Students in a University of Western Turkey: A cross-sectional studyMustafa Tozun1, Gul Arslan2, Unal Ayranci3, Alaettin Unsal4
1Specialist, Public Health Specialist, Ministry of Health, Community Health Center, 26480 Yenikent-Eskisehir/Turkey, 2Assisstant Prof., Eskisehir Health Services Vocational College, Eskisehir Osmangazi University 26480 Meselik-Eskisehir/Turkey, 3Family Practitioner, Associate Professor, Osmangazi University, Medico-Social Center 26480 Meselik-Eskisehir/Turkey, 4Professor, Eskisehir Osmangazi University, Public Health Department 26480 Meselik-Eskisehir/Turkey
Abstract
ObjectivesThe aim was to determine the level of knowledge about swine flu among a group of Turkish university students.
Methodology
This cross sectional study was conducted on 1146 students studying at some departments of Eskisehir Osmangazi University, western Turkey. The questionnaire prepared with reference to previous studies consisted of 15 questions and it was evaluated over a total of 19 points.
ResultsThe average score of knowledge level about swine flu obtained from the students was slightly above the middle level (11.75±2.19). Most respondents reported television/radio was the major sources of their information about swine flu (82.8%). The proportion of those who had knowledge about the fact that the most important and effective means for the prevention of swine flu is vaccination was only 32.0%.
ConclusionThis study concludes that accurate and complete information about the swine flu should be provided for students through the media and education when considered that the level of knowledge about the flu was not enough.
Key WordsSwine flu, students, information source, level of knowledge, vaccination
IntroductionInfluenza is a highly contagious, acute illness which has afflicted humans and animals since ancient times1,2. In April 2009, a new influenza virus of swine origin emerged in Mexico and spread rapidly around the world.3 After the case from Mexico, the first two cases of human infection with a novel influenza A (H1N1) virus were reported in the United States (US). The virus was found to be an H1N1
virus that was antigenically and genetically unrelated to human seasonal influenza viruses and genetically related to viruses known to circulate in swine. In the ensuing weeks, the swine-origin influenza virus H1N1 spread worldwide, constituting a pandemic, as defined by the World Health Organization4,5.
The first case of swine flu in Turkey was identified on a tourist coming from the US to Istanbul in May 16, 2009. After this case, in the late May and early June, 3 new cases were confirmed in Istanbul, Izmir and Ankara. With laboratory examinations, since the beginning of pandemic influenza in Turkey, the number of those who died from flu has been 627. Of these people, 41 were pregnant or within the maternity period. As of January 25, 2010, 67 people have been still treating in the specialized hospitals such as state or university; 22 cases are in intensive care services, the lives of 17 cases are maintained depending on the breathing apparatus, being monitored. Thirty five percent of the persons who lost his life were healthy people who did not have an underlying chronic disease6.
In this study, the aim was determine the knowledge level about the swine flu among a group of university students.
Material and MethodsThis cross sectional study was conducted on a group of students studying at some departments (Faculty of Arts and Sciences, Health Services Vocational High School, Faculty of Economics and Administrative Sciences, Faculty of Education) of a university in a province of western Turkey, Osmangazi University, Eskisehir, between Nov 1th and Dec., 31th 2009.
Subjects were randomly selected with a stratified sampling method. Osmangazi University is an urban, mid-sized university with six schools, all of which were included in the survey except for medical faculty. At least one class from the first, second, third and fourth years in each department were randomly selected to participate in the survey. In result, total study group consisted of 1146 students (13.8%).
The questionnaire, prepared with reference to previous studies in the literature7-10 included two parts. In the first part of the questionnaire, the students were asked to state their socio-demographic characteristics. The second part of the questionnaire evaluated information sources

183Indian Journal of Public Health Research & Development. April - June, 2012, Vol. 3, No. 2
and knowledge level about swine flu.
In the process of evaluation the questionnaires, 1 point for each correct answer and O point for each wrong answer was given. In the questionnaire for each correct answer to question 1 is, each wrong answer was given 0 points. One point for each of the questions 1., 3., 4., 5., 6., 8., 14., 15., and 6 options of the question 12 and 4 options of the question 13 was given, and the total points of knowledge were estimated over 19 points.
Permission for the study was obtained prior to collection of data, by contacting and receiving approval from the university directorship of the city involved. Participants were assured of the confidentiality of their responses and provided informed consent. All students gave their informed consent prior to their inclusion in the study.
Statistical analyses were made using the student’s t test and ANOVA variance analysis. Results were given as numbers and percentages with a 95% confidence interval (CI). A value of p<0.05 was considered statistically significant.
FindingsMost of those constituting the study group were female students (n=740, 64.6%), with 406 male students constituting less (35.4%). The average age of the participants was 20.22±1.82 years (range=17-28 years). The most students were studying at the Faculty of Arts and Sciences (34.8%),. The average level of knowledge about swine flu was slightly above the middle level (11.75±2.19; min=0, max=17).
In those studying at the Health Services Vocational High School, the average level of knowledge about swine flu were higher than those at the other schools (F=3.062; p=0.027). There was no significant relationship by gender and age groups in terms of the average levels of knowledge (p>0.05, each one). The distribution of the students’ average level of knowledge about swine flu by
their gender, age and schools are presented in Table 1.
All the students reported that they had heard of the swine flu (100.0%). Most respondents indicated that mass media (television/radio) was the major sources of their information about swine flu (82.8%), followed by newspaper (13.4%) and internet (5.6%) (Unshown data).
Table 2 shows the distribution to the answers to some epidemiological characteristics, clinical symptoms, symptoms that require to apply to emergency department, risk groups, protection methods, vaccination and treatment related questions by the students: Over 90% of the students gave correct answers to the item ‘agent of swine flu is a kind of virus’ and nearly 100.0% (97.3%) to the item ‘swine flu can be transmitted by coughing, sneezing, shaking hands and kissing from person to person.’ The most frequently known clinical symptom by the students was fever (98.6%). Nearly all of the students (96.0%) gave correct answer to the item ‘fever lasting for more than three days’ as a clinical symptom that require to be admitted to emergency services. Although 80% students knew that those with any chronic disease were at risk for swine flu, most students (about 50% or less) did not know that who were at risk. The proportion of those who knew that the item ‘the most important and effective way is to be vaccinated’ was rather low (32.0%), where as the other proportions were very high (86.0% and over), especially for the item ‘washing hands frequently with soap is useful’ (98.2%). More than half of the students (52.1% and over) gave false answers to the items related to swine flu vaccination and treatment. Only 47.9% students knew that swine flu vaccine should not be made to those who have severe egg allergy and to those who developed severe allergy previously against the flu vaccine. In similar, their 66.9% did not know that protection of swine flu vaccination begins 2 weeks after it is applied, and their 64.6% were not aware of the fact that swine flu vaccine can be made to pregnant women.
Table 1. The distribution of the students’ average level of knowledge about swine flu by their gender, age and schools
Variables Number (percentage)n (%)
1056 (100.0)
Average level of knowledge(X±SD)
20.09±3.80
Statistical analysis
Schools
Faculty of science and literature 399 (34.8) 11.66±2.08
Health services vocational college 202 (17.6) 12.13±2.30 F=3.062; 0.027
Faculty of Economics and Administrative Sciences 268 (23.4) 11.56±2.39
Education faculty 277 (24.2) 11.81±2.02
Gender
Males 406 (35.4) 11.85±2.37
Females 740 (64.6) 11.70±2.08 t=1.103; 0.270
Age groups (years)
20 and below 677 (59.1) 11.73±2.18 t=0.520; 0.603
21 and over 469 (40.9) 11.80±2.21
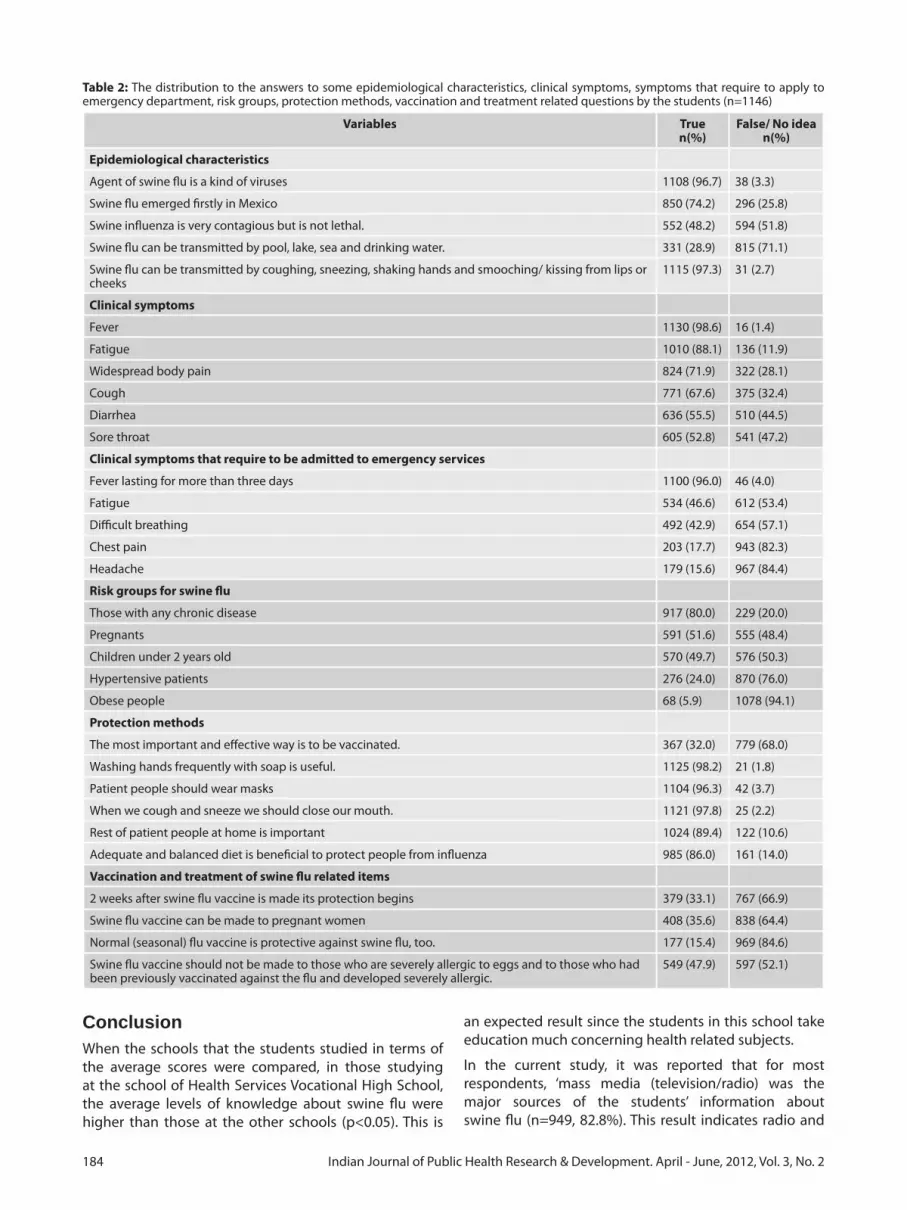
184 Indian Journal of Public Health Research & Development. April - June, 2012, Vol. 3, No. 2
ConclusionWhen the schools that the students studied in terms of the average scores were compared, in those studying at the school of Health Services Vocational High School, the average levels of knowledge about swine flu were higher than those at the other schools (p<0.05). This is
an expected result since the students in this school take education much concerning health related subjects.
In the current study, it was reported that for most respondents, ‘mass media (television/radio) was the major sources of the students’ information about swine flu (n=949, 82.8%). This result indicates radio and
Table 2: The distribution to the answers to some epidemiological characteristics, clinical symptoms, symptoms that require to apply to emergency department, risk groups, protection methods, vaccination and treatment related questions by the students (n=1146)
Variables Truen(%)
False/ No idean(%)
Epidemiological characteristics
Agent of swine flu is a kind of viruses 1108 (96.7) 38 (3.3)
Swine flu emerged firstly in Mexico 850 (74.2) 296 (25.8)
Swine influenza is very contagious but is not lethal. 552 (48.2) 594 (51.8)
Swine flu can be transmitted by pool, lake, sea and drinking water. 331 (28.9) 815 (71.1)
Swine flu can be transmitted by coughing, sneezing, shaking hands and smooching/ kissing from lips or cheeks
1115 (97.3) 31 (2.7)
Clinical symptoms
Fever 1130 (98.6) 16 (1.4)
Fatigue 1010 (88.1) 136 (11.9)
Widespread body pain 824 (71.9) 322 (28.1)
Cough 771 (67.6) 375 (32.4)
Diarrhea 636 (55.5) 510 (44.5)
Sore throat 605 (52.8) 541 (47.2)
Clinical symptoms that require to be admitted to emergency services
Fever lasting for more than three days 1100 (96.0) 46 (4.0)
Fatigue 534 (46.6) 612 (53.4)
Difficult breathing 492 (42.9) 654 (57.1)
Chest pain 203 (17.7) 943 (82.3)
Headache 179 (15.6) 967 (84.4)
Risk groups for swine flu
Those with any chronic disease 917 (80.0) 229 (20.0)
Pregnants 591 (51.6) 555 (48.4)
Children under 2 years old 570 (49.7) 576 (50.3)
Hypertensive patients 276 (24.0) 870 (76.0)
Obese people 68 (5.9) 1078 (94.1)
Protection methods
The most important and effective way is to be vaccinated. 367 (32.0) 779 (68.0)
Washing hands frequently with soap is useful. 1125 (98.2) 21 (1.8)
Patient people should wear masks 1104 (96.3) 42 (3.7)
When we cough and sneeze we should close our mouth. 1121 (97.8) 25 (2.2)
Rest of patient people at home is important 1024 (89.4) 122 (10.6)
Adequate and balanced diet is beneficial to protect people from influenza 985 (86.0) 161 (14.0)
Vaccination and treatment of swine flu related items
2 weeks after swine flu vaccine is made its protection begins 379 (33.1) 767 (66.9)
Swine flu vaccine can be made to pregnant women 408 (35.6) 838 (64.4)
Normal (seasonal) flu vaccine is protective against swine flu, too. 177 (15.4) 969 (84.6)
Swine flu vaccine should not be made to those who are severely allergic to eggs and to those who had been previously vaccinated against the flu and developed severely allergic.
549 (47.9) 597 (52.1)

185Indian Journal of Public Health Research & Development. April - June, 2012, Vol. 3, No. 2
television institutions have important tasks to raise the awareness of public about swine flu. Since swine flu is a viral disease, it has got an outbreak potential, having led to pandemia4. Therefore, it is important to know the epidemiological features of this disease. In our survey, 91.6% of the students reported that ‘the agent of swine flu is a kind of virus’ and that 95.6% reported that this ‘disease is transmitted by air’. These results indicate that the students have a quite good level of knowledge on this issue. Knowing that this disease is transmitted through the air will help to understand the reason for influenza pandemia.
In our survey, 96.7% of the students reported that ‘the agent of swine flu is a kind of viruses’ and 97.3% reported that ‘this disease is transmitted by air (cough, sneezing, handshake, kissing from person to person)’. These results indicate that the students have a quite good level of knowledge on this issue. Knowing that this disease is transmitted through the air will help to understand the reason for influenza pandemia.
Knowing the symptoms of the disease are an important situation in terms of early applies of patients to health institutions and making necessary treatment before the clinical symptoms of the disease becomes more severe.11 The study subjects gave correct answers between 52.8% and 98.6% to clinical symptoms related symptoms. Especially, that about 100 (98.6%) of the students knew that fever is one of the clinic symptoms of swine flu suggests that the students have enough information of swine flu.
The best known risk group by the students participating in our study was those who had chronic diseases (80.0%), and the proportions were lower for the other risk groups. Although these rates are not enough, it is acceptable. More than half the students reported that they did not know that pregnant women and children younger than 2 years of age were in the risk group. This may show that the university students do not deal with these people in terms of social life.
Become aware of the symptoms that require contacting the emergency services will contribute to for patients to apply earlier to doctor, and thus to decrease in morbidity and fatality of the disease. In this study, the study subjects most frequently reported that one of the symptoms that require to applying to emergency services was fever lasting more than 3 days (96.0%). However, the subjects did not know enough the other symptoms that require to apply to emergency services (50% and below). This points out that the subjects’ level of knowledge about swine flu was not enough.
In this study, just 18.7% of the subjects reported that the most effective method in protection the disease was vaccination; whereas, most students between 84.6% and 95.6% were aware of the other methods for protection. These results, as in many countries, may be a result of
the sensational news in Turkey on pandemic influenza vaccine. Thus, we may say that all training activities against the swine flu have failed. Incomplete, inaccurate and contradictory information given in the Turkish media about the vaccine caused the students to have lower level of information about the vaccination. For example, just 47.9% of the subjects could give correct answers to the item ‘swine flu vaccine should not be made to those who are severely allergic to eggs and to those who had been previously vaccinated against the flu and developed severely allergic’ when compared to the other items.
As a result of incomplete, inaccurate and contradictory information on the swine flu vaccine, the majority of the students (91.8%) expressed that they did not want to be vaccinated and that they had no idea about the vaccination, which causes all the studies conducted on getting under the control the swine flu to be qualified as unsuccessful.
More than 20% of the students (22.9%) did not know that “there is a treatment for the treatment of swine influenza” This indicates that the students have the insufficient information about how to contact health care facilities in case of illness. Considering that there is no treatment for the disease would reduce the frequency of contacting to health care facilities when clinical symptoms occur.
This survey has revealed that public health professionals should develop communication messages closely related to the epidemic situation to target the information needs from the public. When taking into consideration the students’ level of knowledge in general, swine flu is still a threat to Turkish students. Thus, comprehensive and effective measures for surveillance and prevention of the disease are needed to control its spread.
AcknowledgementsThe author wishes to thank the schools’ headmasters, teachers, and the research students for helping to collecting the data and also those participating in the study for their valuable efforts and time.
Interest of ConflictThe authors declare that he has no competing interests, and also that there is no funding organizations for this study.
References1. Alexander DJ, Brown IH. Recent zoonoses caused by influenza
A viruses. Rev Sci Tech 2000;19:197-25.2. Qi X, Lu C. Swine influenza virus: evolution mechanism and
epidemic characterization--a review. Wei Sheng Wu Xue Bao 2009;49:1138-45.
3. Vargas-Parada L. H1N1: a Mexican perspective. Cell 2009; 139:1203-5.
4. WHO. World Health Organisation. What is pandemic (H1N1) 2009? Available at http://www.who.int/csr/disease/swineflu/

186 Indian Journal of Public Health Research & Development. April - June, 2012, Vol. 3, No. 2
frequently_asked_questions/about_disease/en/index.html [accessed on 14 January 2009].
5. Hajjar LA, Schout D, Galas FR, Uip DE, Levin AS, Caiaffa Filho HH, et al. Guidelines on management of human infection with the novel virus influenza A (H1N1)--a report from the Hospital das Clínicas of the University of São Paulo. Clinics (Sao Paulo) 2009;64:1015-24.
6. Turkish Republic Health Ministry. Basın aciklamasi, 19/01/2010 Tarihli Aciklama. Saat: 18:00. Available at http://www.grip.gov.tr/index.php? option=com_content&view= ar ticle&id=853:19012010-tarihli-acklama-saat-1800-&catid=113:basin-duyurulari&Itemid=540 [accessed on 24 January 2010].
7. Republic of Turkey Ministry of Health Directorate General
of Health for Border and Coastal Areas. Domuz gribi ile ilgili merak edilenler. Available at www.hssgm.gov.tr/samsunbb/files/domuzgribi.doc. [accessed on 21 January 2010].
8. Nukiwa N, Kamigaki T, Hashimoto A, Kawamura M, Tamaki R, Oshitani H. Epidemiological study of health impact on influenza outpatients during 2008-2009 influenza season, Shonai, Yamagata. Kansenshogaku Zasshi 2010;84:52-8.
9. Sebastian MR, Lodha R, Kabra SK. Swine origin influenza (swine flu). Indian J Pediatr 2009;76:833-41.
10. Patel M, Dennis A, Flutter C, Khan Z. Pandemic (H1N1) 2009 influenza. Br J Anaesth 2010;104:128-42.
11. Narain JP, Kumar R, Bhatia R. Pandemic (H1N1) 2009: Epidemiological, clinical, and prevention aspects. Natl Med J India 2009;22:1-6.

191Indian Journal of Public Health Research & Development. April - June, 2012, Vol. 3, No. 2
Call for Papers / Article SubmissionThe editor invites scholarly articles that contribute to the development and understanding of all aspects of Public Health and all medical specialities. All manuscripts are double blind peer reviewed. If there is a requirement, medical statistician review statistical content. Invitation to submit paper: A general invitation is extended to authors to submit papers papers for publication in IJPHRD.
The following guidelines should be noted: • Thearticlemustbesubmittedbye-mailonly.Hardcopynotneeded.Sendarticleasattachmentine-mail.• Thearticleshouldbeaccompaniedbyadeclarationfromallauthorsthatitisanoriginalworkandhasnotbeen
sent to any other journal for publication.• Asapolicymatter,journalencouragesarticlesregardingnewconceptsandnewinformation.• ArticleshouldhaveaTitle• Namesofauthors• YourAffiliation(designationswithcollegeaddress)• Abstract• Keywords• Introductionorbackground• MaterialandMethods• Findings• Conclusion• Acknowledgements• Interestofconflict• ReferencesinVancouverstyle.• Pleasequotereferencesintextbysuperscripting• Wordlimit2500-3000words,MSWORDFormat,singlefile
All articles should be sent to: [email protected]
Our Contact Info:Indian Journal of Public Health Research & Development
First Floor, Punjab National Bank BuildingMain Dadri Road, Bhangel, NOIDA 201 304, UTTAR PRADESH
Tel 0120- 4222020, 09971888542Email: [email protected] • Website: www.ijphrd.com

First Floor, Punjab National Bank BuildingMain Dadri Road , Bhangel, Noida - 201 304, Uttar Pradesh
Tel: 0120-4222020, 09891098542E-mail: [email protected] • www.ijphrd.com

III

Published, Printed and Owned : Dr. R.K. SharmaDesigned and Printed : Process & SpotPublished at : First Floor, Punjab National Bank Building, Main Dadri Road, Bhangel, NOIDA - 201 304, UTTAR PRADESHEditor : Dr. R.K. Sharma, Mobile: 09891098542