Embed Size (px)
Citation preview
Phil. Trans. R. Soc. B (2005) 360, 269–288
doi:10.1098/rstb.2004.1602
Developing indicators for European birds
Published online 28 February 2005
Richard D. Gregory1,*, Arco van Strien2, Petr Vorisek3,
Adriaan W. Gmelig Meyling2, David G. Noble4, Ruud P. B. Foppen5
and David W. Gibbons6
One coextinctio
*Autho
1European Bird Census Council & The Royal Society for the Protection of Birds, The Lodge, Sandy,Bedfordshire SG19 2DL, UK
2Statistics Netherlands, PO Box 4000, 2270 JM Voorburg, The Netherlands3Czech Society for Ornithology, V Olsinach 449/41, CZ-100 00 Prague 10, Czech Republic
4British Trust for Ornithology, The Nunnery, Thetford, Norfolk IP24 2PU, UK5SOVON, Rijksstraatweg 178, 6573 DG, Beek-Ubbergen, The Netherlands
6The Royal Society for the Protection of Birds, The Lodge, Sandy, Bedfordshire SG19 2DL, UK
The global pledge to deliver ‘a significant reduction in the current rate of biodiversity loss by 2010’ isechoed in a number of regional and national level targets. There is broad consensus, however, that inthe absence of conservation action, biodiversity will continue to be lost at a rate unprecedented in therecent era. Remarkably, we lack a basic system to measure progress towards these targets and, inparticular, we lack standard measures of biodiversity and procedures to construct and assesssummary statistics. Here, we develop a simple classification of biodiversity indicators to assist theirdevelopment and clarify purpose. We use European birds, as example taxa, to show how robustindicators can be constructed and how they can be interpreted. We have developed statisticalmethods to calculate supranational, multi-species indices using population data from national annualbreeding bird surveys in Europe. Skilled volunteers using standardized field methods undertake datacollection where methods and survey designs differ slightly across countries. Survey plots tend to bewidely distributed at a national level, covering many bird species and habitats with reasonablerepresentation. National species’ indices are calculated using log-linear regression, which allows forplot turnover. Supranational species’ indices are constructed by combining the national species’indices weighted by national population sizes of each species. Supranational, multi-species indicatorsare calculated by averaging the resulting indices. We show that common farmland birds in Europehave declined steeply over the last two decades, whereas woodland birds have not. Evidenceelsewhere shows that the main driver of farmland bird declines is increased agriculturalintensification. We argue that the farmland bird indicator is a useful surrogate for trends in otherelements of biodiversity in this habitat.
Keywords: indicators; biodiversity targets; European birds; population trends; summary statistics;policy relevance
1. INTRODUCTIONGovernment representatives at the 2002 World
Summit of Sustainable Development pledged ‘a sig-
nificant reduction in the current rate of biodiversity loss
by 2010’ and similar commitments have been made at
regional and national levels. There is broad consensus,
however, that in the absence of conservation action,
biodiversity will continue to be lost at a rate unprece-
dented in the recent era, and yet we lack basic systems
to measure progress towards these objectives (Balmford
et al. 2003; Jenkins et al. 2003; Royal Society 2003;
Green et al. 2005). Furthermore, we lack agreement
on those elements of biodiversity of greatest relevance
in relation to the targets and hence on the specific set
of measures required. Numerous studies have docu-
mented biodiversity loss in ecosystems across the
269
ntribution of 19 to a Discussion Meeting Issue ‘Beyondn rates: monitoring wild nature for the 2010 target’.
r for correspondence ([email protected]).
globe; the size of these losses, measured as habitatarea lost or degraded, or population decline, isconsiderable (e.g. May et al. 1995; Pimm et al. 1995;Jenkins et al. 2003).
Of course, biodiversity is a multifaceted term,defined as the sum total of all biotic variation fromthe level of genes to ecosystems (Purvis & Hector2000). As such, it can be measured in various ways andno single metric is likely to adequately describebiodiversity as a whole. The gauntlet thrown down toecologists by the global and regional targets is todevelop summary statistics that accurately and robustlydescribe trends in components of biodiversity in such away as to communicate this information to a policyaudience. The information available on biodiversity,however, is often patchy and biased in its coverage ofspecies, habitats and regions, and synthesis is rare(Balmford et al. 2003; Jenkins et al. 2003; Royal Society2003). Taxonomic bias strongly colours our view ofbiodiversity and all the indicators we describe suffer inthis respect. The challenge in the medium term is to
q 2005 The Royal Society
50
60
70
80
90
100
110
120
1970 1974 1978 1982 1986 1990 1994 1998 2002year
popu
latio
n in
dex
(197
0 =
100)
common farmland birds (19)
all common bird species (106)
common woodland birds (33)
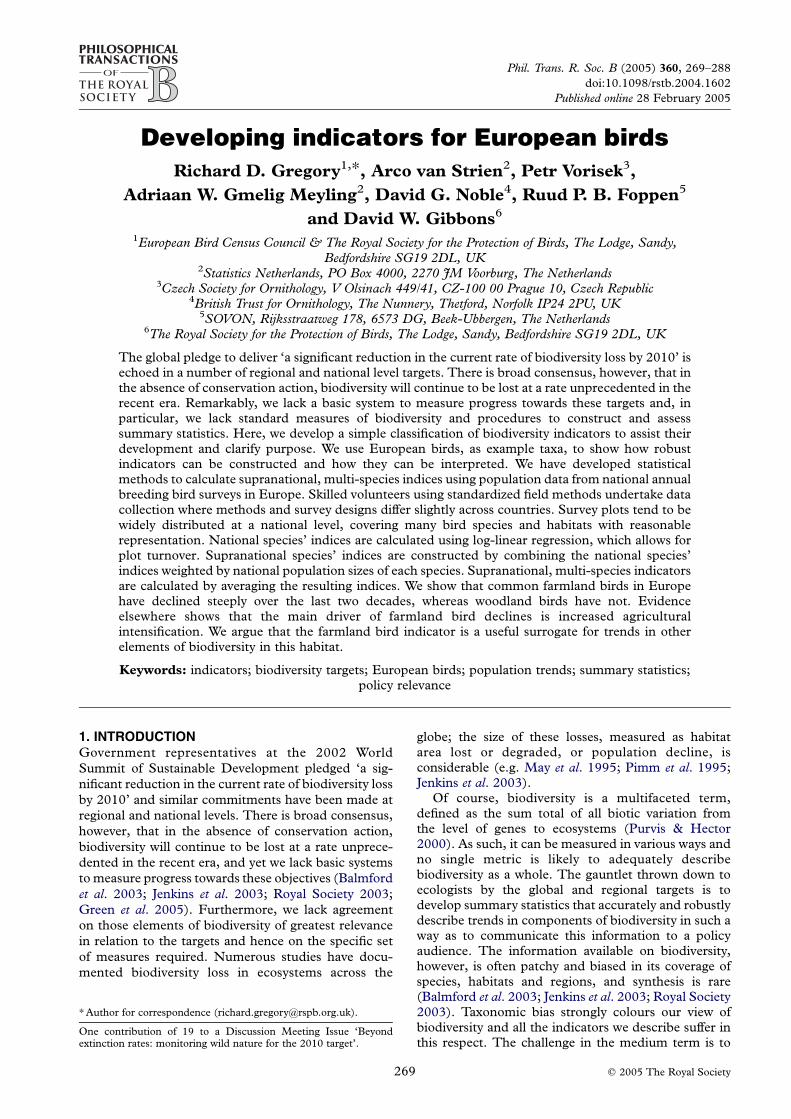
Figure 1. The UK wild bird indicator is based on the population trends of wild breeding birds. This indicator, adopted by theUK Government, is 1 of 15 headline indicators of the sustainability of lifestyles in the UK.
270 R. D. Gregory and others Developing indicators for European birds
combine in a representative way population trends andother information for multiple taxa from a range ofsites, habitats and biomes.
High-level summaries tend to focus on threatenedtaxa (e.g. IUCN 2002), or population trends gleanedfrom the literature (e.g. Loh 2002). The former isundoubtedly a useful approach in describing a keyelement of biodiversity loss, particularly in well-studiedtaxa, but because it overlooks other more commonspecies, it is not necessarily a good measure of thegeneral state of nature and how it is changing. Bydefinition, many species are considered threatenedbecause their population is declining. Any indicatorbased on trends of these species will properly capturespecies loss in this group, but may not capture otherchanges in species composition. Trends in threatenedspecies might be different from other species for avariety of reasons; for example, they live in particularplaces, differ systematically in their ecology (Kunin &Gaston 1997), or are subject to special beneficialconservation measures (Aebischer et al. 2000b). Infor-mation on threat status often accrues slowly, typicallyover a number of years, and so status can only beupdated at intervals. The rate of population changemust also be relatively large to trigger the IUCNcriteria. Average population declines of 3.5% perannum over 10 years qualify species for listing asVulnerable and 14.9% per annum for Critical, yet aspecies falling by 3.4% per annum will still have halvedin number over 20 years, but would go unnoted in thissystem. Change in threat status can also be associatedwith artefacts such as increased knowledge, increasedsampling efforts or changes in taxonomy, or acombination of these factors, rather than genuinepopulation change (Possingham et al. 2002). Somehave suggested that while extinction rate provides animportant measure of human impacts over the longterm, it is an inherently poor measure of contemporarybiodiversity loss (McKinney & Lockwood 1999;Possingham et al. 2002; Royal Society 2003; Jenkins2003; Balmford et al. 2003).
Phil. Trans. R. Soc. B (2005)
The other main method of generating summarystatistics is to use population trends and here too thereare a number of problems. Compared with threatstatus, population trends can be updated morefrequently and thus have a higher temporal resolution,but they too can suffer from bias owing to non-randomselection of species and localities. This is especially thecase when trends are extracted from the literature(e.g. Houlahan et al. 2000, 2001; Alford et al. 2001;Loh 2002), because the underlying data might comefrom published studies with inherent bias towards, forexample, well-studied localities or strongly positive ornegative trends, or towards threatened species. Missingvalues also complicate analysis of such time-series data.
An alternative approach is to extract populationtrends from existing wide-scale monitoring schemes inorder to be able to control and reduce any selectionbias. A good example of this approach at a nationalscale is the wildlife indicator in the UK, which is basedon population trends of common breeding birds and istaken to represent the state of the countryside. Thisindicator has been adopted by Government as 1 of 15headline indicators of the sustainability of lifestyles inthe UK (Anon. 2002). The indicator shows that onaverage common birds have increased by 10%, whilecommon woodland and common farmland birds havefallen by 15 and 42%, respectively, from 1970 to 2002(figure 1; Gregory 2004b). Healthy wildlife populationsare seen as a useful barometer of sustainable land usepolicies and of the general quality of life (Anon. 2002).The Government has adopted a Public Service Agree-ment to ‘care for our living heritage and preservenatural diversity by reversing the long-term decline inthe number of farmland birds by 2020, as measuredannually against underlying trends’ (Anon. 2002;Gregory et al. 2004b). With this target is a detaileddelivery plan that defines how the target is measuredand how it will be achieved. The adoption of theindicator has provided a significant impetus and focusfor research on farmland and woodland birds. At thesame time, the indicator has played a central role in

Developing indicators for European birds R. D. Gregory and others 271
wholesale change in land use policy in the UK,particularly in a shift to agricultural production thatis coupled with the needs of maintaining and restoringbiodiversity (Vickery et al. 2004). The introduction ofan Environmental Stewardship Scheme in England in2005 will see large numbers of farmers rewardedfinancially for implementing a range of managementprescriptions designed to enhance biodiversity interest,including priority birds. Similar agri-environmentschemes are being deployed in the other countries ofthe UK. The UK wild bird index is a good example ofan indicator that has turned science into policy.
The decline of once common taxa associated withlowland farmland has become one of the most pressingissues in British nature conservation (Krebs et al. 1999;Aebischer et al. 2000a; Vickery et al. 2004). There iscompelling evidence to show that the recent declinesamong farmland birds in north and west Europe havebeen driven by changes in agricultural methods andspecialization (Tucker & Heath 1994; Krebs et al. 1999;Aebischer et al. 2000a; Chamberlain et al. 2000;Pitkanen & Tiainen 2001; Donald et al. 2001; Hole etal. 2002; Vickery et al. 2004). The nature of evidencelinking farmland bird trends with increased agriculturalmodernization and intensification is of two kinds.Autoecological studies have shown how and whyindividual species have responded negatively, oroccasionally positively, to agricultural change.Broader-scale analyses and modelling have tested thehypothesis of agricultural change driving the decline offarmland birds and examined the probable mechan-isms. The level of knowledge of the interaction betweenfarmland management and biodiversity is exceptional(Aebischer et al. 2000a; Vickery et al. 2004). The mostimportant changes affecting birds have been hedgerowloss, land drainage, increased mechanization, increasedfertilizer and pesticide use, reduction of spring cultiva-tion, simplification of crop rotations, changes in cropuse and loss of farm diversity (Krebs et al. 1999;Aebischer et al. 2000a; Donald et al. 2001; Robinson &Sutherland 2002; Vickery et al. 2004). Agriculturalpractices during the nesting season are known to haveadverse effects on the breeding performance of cornbunting Miliaria calandra (Brickle et al. 2000), greypartridge Perdix perdix (Potts 1986), stone curlewBurhinus oedicnemus (Aebischer et al. 2000b), lapwingVanellus vanellus (Shrubb 1990), and corncrake Crexcrex (Green & Stowe 1993). Survival, as opposed toproductivity, is implicated as a key factor in thepopulation declines of seed-eating birds, such as cirlbunting Emberiza cirlus (Evans & Smith 1994), reedbunting Emberiza schoeniclus (Peach et al. 1999), housesparrow Passer domesticus and goldfinch Cardueliscarduelis (Siriwardena et al. 1999; Hole et al. 2002).
The decline of lowland farmland birds in the UKwas striking both in the sheer scale of changes (manybirds have more than halved in numbers over the last 30years: Gregory et al. 2004b), but also in the similarity ofpattern across species (Fuller et al. 1995; Siriwardena etal. 1998; Fewster et al. 2000). One consequence ofsevere population declines is that many widespread andstill relatively abundant birds have become priorities forconservation action in the UK (Gregory et al. 2002).
Phil. Trans. R. Soc. B (2005)
The official Red List of birds of highest conservationconcern in the UK contains 16 out of 40 species withcurrent populations in excess of 10 000 pairs (Gregoryet al. 2002). These tend to be farmland birds, but alsoinclude woodland birds whose populations are nowmuch depleted. Of course, the choice of conservationpriorities is at some point based on value judgementsand is part of a wider socio-political debate about thesort of environment people wish to live in and therelative value of biodiversity. In the UK, at least, there ispublic pressure on decision-makers to improve thequality of the countryside around them. This has beentranslated, for example, into the UK BiodiversityAction Plan (DETR 2001), which responds specificallyto the severe decline of once common species.Furthermore, even if severely declining commonspecies were to be dismissed as conservation priorities(which would seem to be a mistake), we would arguethat trends in their populations are relevant inmeasuring the sustainable use of resources, which is acentral pillar of the Convention on Biological Diversity(CBD). Plainly, the choice of conservation prioritieswill differ in different situations to reflect the threats,opportunities, legal frameworks and resourcesavailable.
Against this backcloth, in this paper we developan indicator to describe the composite populationtrends of European birds, building on previous work(Hustings 1988, 1992; Gibbons 2000; van Strien et al.2001, 2004; Gregory et al. 2003). Our aim was tomeasure the mean population change within a set ofspecies, measuring biodiversity as the number ofindividuals in a species population and determiningthe rate of change and how this rate itself was changing.In this way, the indicator describes changes in speciescomposition within a chosen habitat. We focused onchanges in the abundance of widespread and populousspecies through time, taking birds as our example.
The paper is structured as follows. First, we definewhat we mean by an indicator and consider the idealproperties of an indicator of biodiversity. Next, weintroduce a framework to help define the purpose ofdifferent kinds of indicators. Based on these principles,we have developed an indicator based on the breedingpopulations of common European birds. We go on todiscuss how this indicator can be interpreted, to whatextent it is fit for the purpose and finally discuss thedevelopment of indicators for biodiversity morebroadly.
2. DEVELOPING INDICATORS FOR BIODIVERSITY
(a) Defining the ideal indicator
At the outset, it is helpful to define what we mean by anideal indicator in this context. This is a group of specieswhose population trends, when taken together, reflectthe average behaviour of the constituent species, butalso cast light on trends in attributes of other taxa andact as a surrogate for ecosystem health (see Caro &O’Doherty 1999). Indicators are meant to quantify andcommunicate complex phenomena in a simple manner(Bibby 1999). These surrogate measures are frequentlyused as a proxy for ecosystem function and health,
Table 1. Key attributes of effective indicators of biodiversity.
attribute details
representative includes all species in a chosen taxon, or a representative group.immediate capable of regular update, ideally, at least on an annual basis.simplifying information transparent, easy to interpret and visually attractive. Complex information must be presented
simply to have impact and communicate.easily understood non-experts, from policy makers to members of the public, must be able to grasp the issues to
have any ownership of them.quantitative accurate measurement with assessment of error. Shows trends over time, measures a rate of
change and changes in the rate.responsive to change sensitive to environmental change over relatively short time-scales.timeliness allows rapid identification of trends—an early warning of issues.susceptible to analysis data can be disaggregated to help understand the underlying patterns and shed light on the
potential causes of trends.realistic to collect quantitative data are available or can be collected readily. Does not require excessive or
unrealistic financial resources.indicative representing more general components or attributes of biodiversity than just the constituent
species trends, ideally reflecting ecosystem health.user driven developed in response to the need of stakeholders.policy relevant indicators aim to provide signals to policy customers to help them develop and then review
policy measures.stability buffered from irregular, large natural fluctuations.tractable susceptible to human influence and change.
272 R. D. Gregory and others Developing indicators for European birds
because of the complexity, cost and difficulty ofmeasuring these processes directly (Hilty & Merenlen-der 2000). The purpose of indicators is to helpdecision-makers formulate policy and then to continueto review it in response to changes in the indicator. Tosome degree, indicators might be seen as a bridgebetween science and policy. In the classification of Caro& O’Doherty (1999) such an indicator is termed ahealth or population indicator, as opposed to abiodiversity indicator, which is used typically to identifyareas of high species richness across taxa. These trendindicators tend to measure aspects of ‘state’ in thepressure-state-response (PSR) and driver-pressure-state-impact-response (DPSIR) models (OECD1993; EEA 1997).
For indicators to be effective at a general level theymust meet a number of competing scientific andpractical criteria (Landres et al. 1988; Bibby 1999;Caro & O’Doherty 1999; ten Brink 2003; Gregory et al.2003; SBSTTA 2003). These include qualities such asscientific credibility, sensitivity to environmentalchange, links to drivers, clarity of message, afford-ability, ease of update and so forth (table 1).
To develop indicators of species and populationsfurther, we need statistical procedures to construct andjudge the resulting indicators, comparable, in someways, to those for the more familiar economic statistics.From a statistical viewpoint, the question is how to gettimely and unbiased information in a cost-effectivemanner. This is not only a matter of applying anappropriate sampling design and statistical method,but also a matter of defining the purpose of theindicator at the start.
(b) Purpose, fitness and practicality
Having described the qualities of an ideal indicator,next we must flesh out the specific purpose, orpurposes, of an indicator, whether the indicator is fit
Phil. Trans. R. Soc. B (2005)
to deliver that purpose, and consider the practicality of
production (table 2).
In considering purpose, it is helpful to articulate the
specific aims and limitations of an indicator—for
example, whether trends in the indicator are thought
to mirror trends in other biodiversity components or
not and whether these trends are linked to known or
suspected drivers. It is also useful to define the spatial
and temporal scales over which the indicator is
expected to react to environmental change and to
identify, at least in principle, whether such drivers are
susceptible to human influence through policy. The
speed of response to environmental change will have
important ramifications for the utility of the indicator;
inertia in a system will inevitably delay any potential
response. Under fitness, practitioners need to ask
themselves a series of questions about sampling design
and statistical treatment of data, as well as about
inferences, in order to check that their ambitions for an
indicator can be realized. A detailed ecological knowl-
edge of the species and systems in question is extremely
helpful at this stage in judging fitness for use and
reasonable inference. It is important to stress that
indicators must be capable of disaggregation (to
species’ groups, species and sample sites) in order to
better understand the underlying ecological processes
and to explore the connections between an indicator
and potential drivers (both natural and man-induced).
Indicators are not a substitute for detailed knowledge,
which is essential in assessing the causes of change and
in formulating strategies or plans in response to such
changes (Bibby 1999).
Finally, in addition to theoretical considerations the
feasibility of indicator production requires attention.
Preferably, indicators need to be developed and
updated relatively easily without considerable new
investment in analysis or data collection. It makes
sense to use the best available information, unless such
Table 2. Assessing the soundness of indicators.
1. purpose what does the indicator aim to indicate?is the aim described clearly?is the aim to indicate changes in specific taxa only? Or is the aim to indicate change in biodiversitymore generally, thus beyond its constituent parts?is the aim to show how taxa or biodiversity responds to a particular environmental driver?what spatial scale is the indicator designed for? Is the aim to indicate changes at a national scale, aregional scale or something else? Is the aim to indicate changes per ecosystem and whichecosystems are distinguished?is the indicator intended to respond rapidly to environmental change? If not immediately, then onwhat time-scale?who are the key stakeholders, policy- and decision-makers?is the driver susceptible to human influence through policy or other measures?can the indicator be disaggregated to shed light on the underlying ecological processes?
2. fit for purpose do sampling design and statistical method correspond to the purpose?are the methods of species and sample site selection sound? Do they ensure representation ofspecies groups, habitats or geographical areas? If not, can this be adjusted to reduce bias?is the statistical analysis sound? Have missing values been taken into account? Are confidencelimits around the indicator available? Failing this, can the sensitivity be measured in other ways?if the purpose is to show changes in biodiversity more generally, how can this be substantiated?if the purpose is to link changes with drivers, what is the evidence for this link? Is a positive changein the indicator associated with an improving or deteriorating situation for species/habitats in theenvironment? Could other environmental factors explain the behaviour of the indicator?
3. practicality can the indicator be constructed and updated easily?does the indicator use existing data and expertise, or require new data collection and expertise?is the indicator available immediately? If not, on what time-scale can it be produced?can the indicator be updated frequently, e.g. annually, or less frequently?what level of resource is required to produce the indicator? Is it cost-effective? Is furtherinvestment required and justified?
Developing indicators for European birds R. D. Gregory and others 273
data do not exist, or are seriously flawed. A feedbackloop may be necessary to balance purpose, fitness forpurpose and practicality. For example, weaknesses insampling design might lead you to revise down yourexpectations of the generality of an indicator and thereasonable inferences that could be drawn from it.Practical issues might lead to the conclusion that thecurrent datasets are simply inadequate for the statedpurposes, or at least require strong health warnings ontheir inference. Equally, practicality might limit thespeed with which indicators can be created andupdated to such a degree that this limits their relevanceto policy makers.
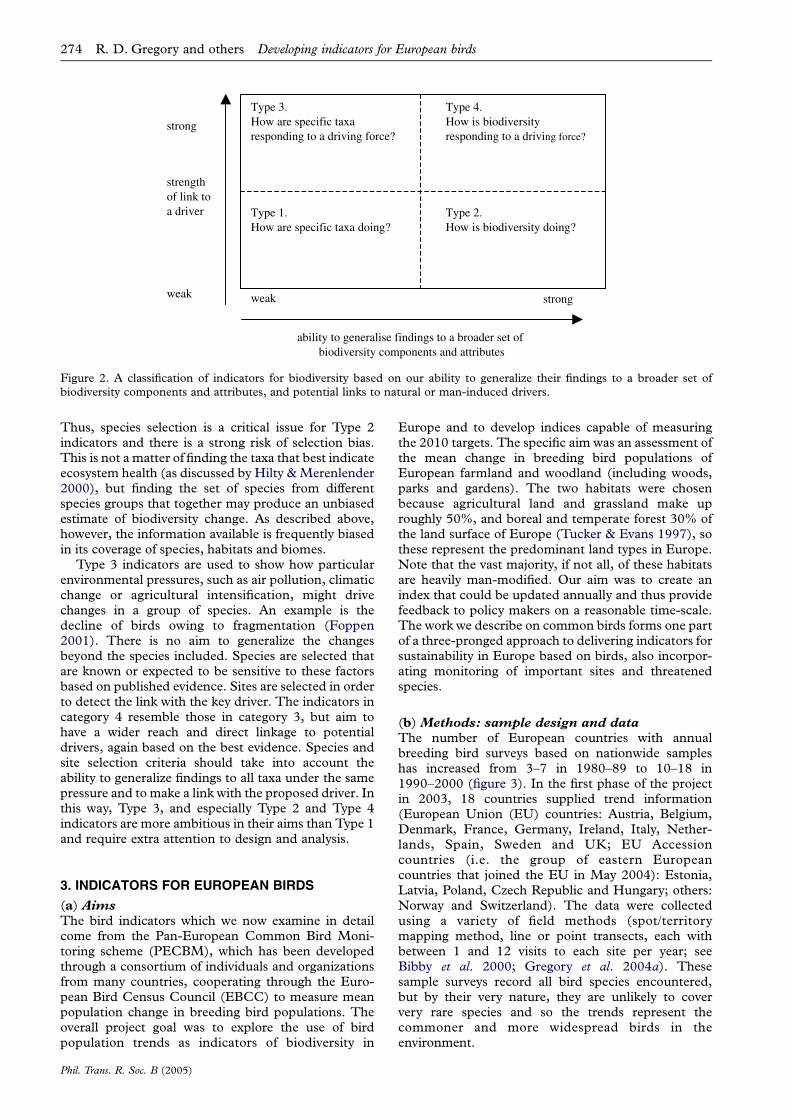
(c) A framework for indicators
In an attempt to clarify the use of indicators linked tobiodiversity trends, we have developed a simple frame-work (figure 2). We distinguish four broad types ofindicators, based on two axes: ability to generalizefindings to a broader set of biodiversity componentsand attributes, and strength of relationship with apotential driver in the environment (figure 2). Type 1indicators are designed to measure how specific taxaare faring; Type 2 consider how biodiversity is doingmore generally; Type 3 show how specific taxa areresponding to drivers; and Type 4 how biodiversity isresponding to a driver or drivers in general. In reality,many indicators are Type 1 or Type 3 indicatorsbecause they are likely to have a quite limited or specificscope. This is not a criticism, but it does limit theirbroader applicability and emphasizes the need forclarity of purpose at the beginning and for realism injudging indicators.
Phil. Trans. R. Soc. B (2005)
By default, poor indicators will be created when
measurements suffer from selection bias of species or
sites measured and when inferior statistical methods
have been applied. Further problems arise when
inferences are made about an indicator that go beyond
what may be reasonably drawn from the information
available. Our aim, of course, is to avoid poor
indicators and to ensure indicators are interpreted
appropriately. Thus, consideration should be given to
sample design and statistical analysis, in order to
produce unbiased estimates and to use statistical
methods that take into account missing values,
estimation of precision and removal of bias (see Olsen
et al. 1999). Estimation of precision helps in assessing
whether the indicator is sufficiently sensitive to detect
change.
The procedures required to select sites as well as
species (design) and to aggregate species information
and make causality plausible (analysis), differ between
the four indicator types. Type 1 indicators are chosen
where the purpose is to assess sets of species of specific
interest, such as endemic species, or amphibians, or the
species listed in a piece of legislation. The choice of
species is defined. The aim is neither to link changes
directly to causes, nor to generalize the changes beyond
the set of species. Type 2 indicators are deigned to tell us
about the general state and changes of biodiversity
(e.g. the Living Planet Index—Loh 2002). The purpose
is not to link these indicators with specific environmen-
tal factors. However, the criterion to select species from
all groups in a representative way is problematic and
there is often considerable variety of trends between
species and species groups (e.g. Thomas et al. 2004).
strong
strengthof link toa driver
weak weak strong
Type 3.How are specific taxaresponding to a driving force?
Type 4.How is biodiversityresponding to a driving force?
Type 1.How are specific taxa doing?
Type 2.How is biodiversity doing?
ability to generalise findings to a broader set of biodiversity components and attributes
Figure 2. A classification of indicators for biodiversity based on our ability to generalize their findings to a broader set ofbiodiversity components and attributes, and potential links to natural or man-induced drivers.
274 R. D. Gregory and others Developing indicators for European birds
Thus, species selection is a critical issue for Type 2indicators and there is a strong risk of selection bias.This is not a matter of finding the taxa that best indicateecosystem health (as discussed by Hilty & Merenlender2000), but finding the set of species from differentspecies groups that together may produce an unbiasedestimate of biodiversity change. As described above,however, the information available is frequently biasedin its coverage of species, habitats and biomes.
Type 3 indicators are used to show how particularenvironmental pressures, such as air pollution, climaticchange or agricultural intensification, might drivechanges in a group of species. An example is thedecline of birds owing to fragmentation (Foppen2001). There is no aim to generalize the changesbeyond the species included. Species are selected thatare known or expected to be sensitive to these factorsbased on published evidence. Sites are selected in orderto detect the link with the key driver. The indicators incategory 4 resemble those in category 3, but aim tohave a wider reach and direct linkage to potentialdrivers, again based on the best evidence. Species andsite selection criteria should take into account theability to generalize findings to all taxa under the samepressure and to make a link with the proposed driver. Inthis way, Type 3, and especially Type 2 and Type 4indicators are more ambitious in their aims than Type 1and require extra attention to design and analysis.
3. INDICATORS FOR EUROPEAN BIRDS
(a) Aims
The bird indicators which we now examine in detailcome from the Pan-European Common Bird Moni-toring scheme (PECBM), which has been developedthrough a consortium of individuals and organizationsfrom many countries, cooperating through the Euro-pean Bird Census Council (EBCC) to measure meanpopulation change in breeding bird populations. Theoverall project goal was to explore the use of birdpopulation trends as indicators of biodiversity in
Phil. Trans. R. Soc. B (2005)
Europe and to develop indices capable of measuringthe 2010 targets. The specific aim was an assessment ofthe mean change in breeding bird populations ofEuropean farmland and woodland (including woods,parks and gardens). The two habitats were chosenbecause agricultural land and grassland make uproughly 50%, and boreal and temperate forest 30% ofthe land surface of Europe (Tucker & Evans 1997), sothese represent the predominant land types in Europe.Note that the vast majority, if not all, of these habitatsare heavily man-modified. Our aim was to create anindex that could be updated annually and thus providefeedback to policy makers on a reasonable time-scale.The work we describe on common birds forms one partof a three-pronged approach to delivering indicators forsustainability in Europe based on birds, also incorpor-ating monitoring of important sites and threatenedspecies.
(b) Methods: sample design and data
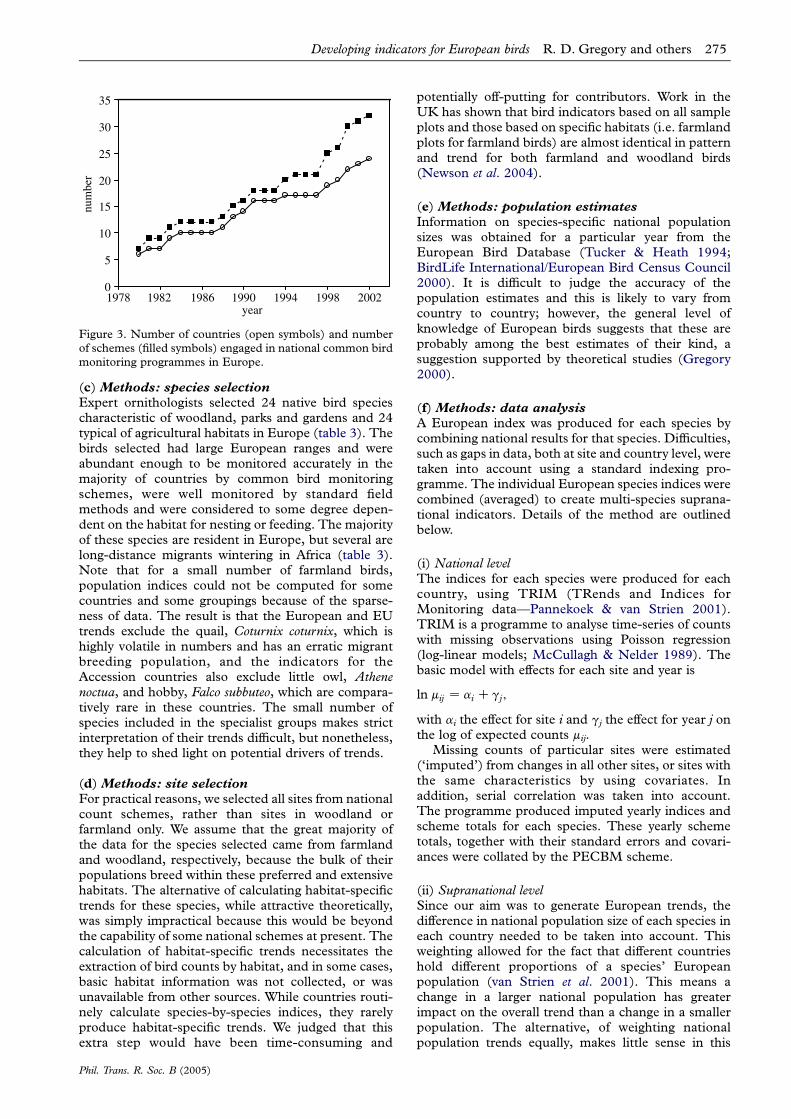
The number of European countries with annualbreeding bird surveys based on nationwide sampleshas increased from 3–7 in 1980–89 to 10–18 in1990–2000 (figure 3). In the first phase of the projectin 2003, 18 countries supplied trend information(European Union (EU) countries: Austria, Belgium,Denmark, France, Germany, Ireland, Italy, Nether-lands, Spain, Sweden and UK; EU Accessioncountries (i.e. the group of eastern Europeancountries that joined the EU in May 2004): Estonia,Latvia, Poland, Czech Republic and Hungary; others:Norway and Switzerland). The data were collectedusing a variety of field methods (spot/territorymapping method, line or point transects, each withbetween 1 and 12 visits to each site per year; seeBibby et al. 2000; Gregory et al. 2004a). Thesesample surveys record all bird species encountered,but by their very nature, they are unlikely to coververy rare species and so the trends represent thecommoner and more widespread birds in theenvironment.
0
5
10
15
20
25
30
35
1978 1982 1986 1990 1994 1998 2002year
num
ber
Figure 3. Number of countries (open symbols) and numberof schemes (filled symbols) engaged in national common birdmonitoring programmes in Europe.
Developing indicators for European birds R. D. Gregory and others 275
(c) Methods: species selection
Expert ornithologists selected 24 native bird speciescharacteristic of woodland, parks and gardens and 24typical of agricultural habitats in Europe (table 3). Thebirds selected had large European ranges and wereabundant enough to be monitored accurately in themajority of countries by common bird monitoringschemes, were well monitored by standard fieldmethods and were considered to some degree depen-dent on the habitat for nesting or feeding. The majorityof these species are resident in Europe, but several arelong-distance migrants wintering in Africa (table 3).Note that for a small number of farmland birds,population indices could not be computed for somecountries and some groupings because of the sparse-ness of data. The result is that the European and EUtrends exclude the quail, Coturnix coturnix, which ishighly volatile in numbers and has an erratic migrantbreeding population, and the indicators for theAccession countries also exclude little owl, Athenenoctua, and hobby, Falco subbuteo, which are compara-tively rare in these countries. The small number ofspecies included in the specialist groups makes strictinterpretation of their trends difficult, but nonetheless,they help to shed light on potential drivers of trends.
(d) Methods: site selection
For practical reasons, we selected all sites from nationalcount schemes, rather than sites in woodland orfarmland only. We assume that the great majority ofthe data for the species selected came from farmlandand woodland, respectively, because the bulk of theirpopulations breed within these preferred and extensivehabitats. The alternative of calculating habitat-specifictrends for these species, while attractive theoretically,was simply impractical because this would be beyondthe capability of some national schemes at present. Thecalculation of habitat-specific trends necessitates theextraction of bird counts by habitat, and in some cases,basic habitat information was not collected, or wasunavailable from other sources. While countries routi-nely calculate species-by-species indices, they rarelyproduce habitat-specific trends. We judged that thisextra step would have been time-consuming and
Phil. Trans. R. Soc. B (2005)
potentially off-putting for contributors. Work in theUK has shown that bird indicators based on all sampleplots and those based on specific habitats (i.e. farmlandplots for farmland birds) are almost identical in patternand trend for both farmland and woodland birds(Newson et al. 2004).
(e) Methods: population estimates
Information on species-specific national populationsizes was obtained for a particular year from theEuropean Bird Database (Tucker & Heath 1994;BirdLife International/European Bird Census Council2000). It is difficult to judge the accuracy of thepopulation estimates and this is likely to vary fromcountry to country; however, the general level ofknowledge of European birds suggests that these areprobably among the best estimates of their kind, asuggestion supported by theoretical studies (Gregory2000).
(f) Methods: data analysis
A European index was produced for each species bycombining national results for that species. Difficulties,such as gaps in data, both at site and country level, weretaken into account using a standard indexing pro-gramme. The individual European species indices werecombined (averaged) to create multi-species suprana-tional indicators. Details of the method are outlinedbelow.
(i) National levelThe indices for each species were produced for eachcountry, using TRIM (TRends and Indices forMonitoring data—Pannekoek & van Strien 2001).TRIM is a programme to analyse time-series of countswith missing observations using Poisson regression(log-linear models; McCullagh & Nelder 1989). Thebasic model with effects for each site and year is
ln mij Zai Cgj ;
with ai the effect for site i and gj the effect for year j onthe log of expected counts mij.
Missing counts of particular sites were estimated(‘imputed’) from changes in all other sites, or sites withthe same characteristics by using covariates. Inaddition, serial correlation was taken into account.The programme produced imputed yearly indices andscheme totals for each species. These yearly schemetotals, together with their standard errors and covari-ances were collated by the PECBM scheme.
(ii) Supranational levelSince our aim was to generate European trends, thedifference in national population size of each species ineach country needed to be taken into account. Thisweighting allowed for the fact that different countrieshold different proportions of a species’ Europeanpopulation (van Strien et al. 2001). This means achange in a larger national population has greaterimpact on the overall trend than a change in a smallerpopulation. The alternative, of weighting nationalpopulation trends equally, makes little sense in this
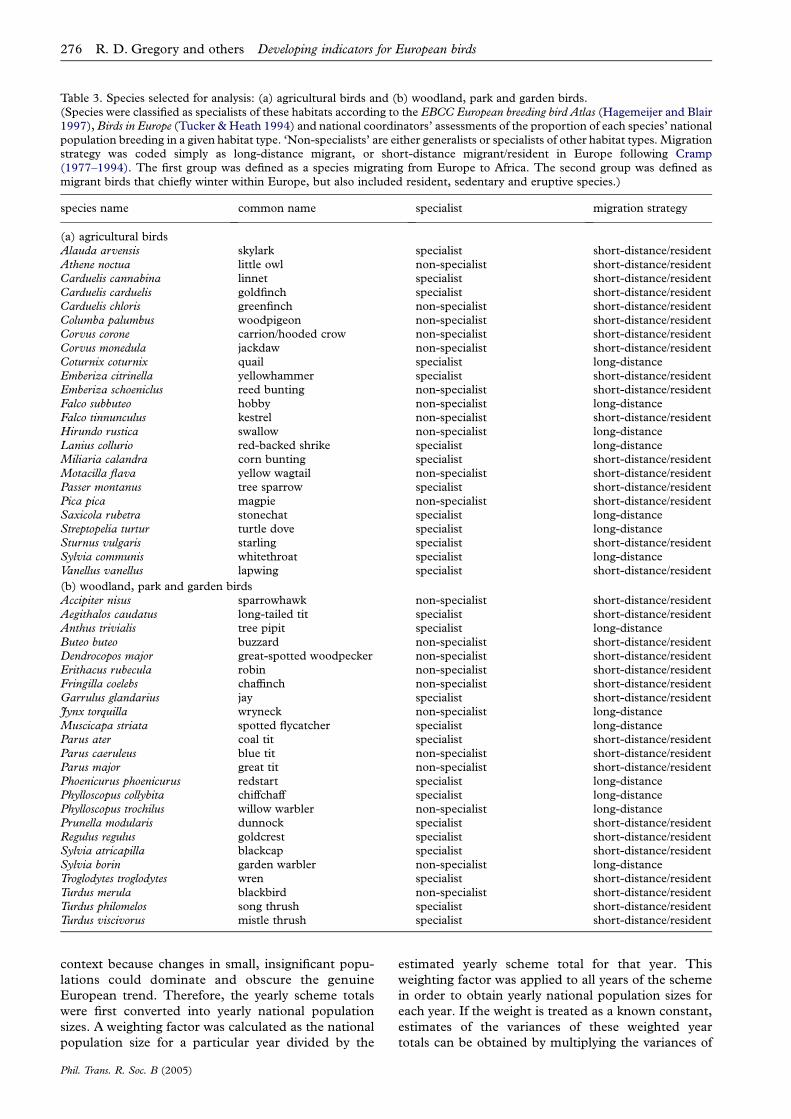
Table 3. Species selected for analysis: (a) agricultural birds and (b) woodland, park and garden birds.(Species were classified as specialists of these habitats according to the EBCC European breeding bird Atlas (Hagemeijer and Blair1997), Birds in Europe (Tucker & Heath 1994) and national coordinators’ assessments of the proportion of each species’ nationalpopulation breeding in a given habitat type. ‘Non-specialists’ are either generalists or specialists of other habitat types. Migrationstrategy was coded simply as long-distance migrant, or short-distance migrant/resident in Europe following Cramp(1977–1994). The first group was defined as a species migrating from Europe to Africa. The second group was defined asmigrant birds that chiefly winter within Europe, but also included resident, sedentary and eruptive species.)
species name common name specialist migration strategy
(a) agricultural birdsAlauda arvensis skylark specialist short-distance/residentAthene noctua little owl non-specialist short-distance/residentCarduelis cannabina linnet specialist short-distance/residentCarduelis carduelis goldfinch specialist short-distance/residentCarduelis chloris greenfinch non-specialist short-distance/residentColumba palumbus woodpigeon non-specialist short-distance/residentCorvus corone carrion/hooded crow non-specialist short-distance/residentCorvus monedula jackdaw non-specialist short-distance/residentCoturnix coturnix quail specialist long-distanceEmberiza citrinella yellowhammer specialist short-distance/residentEmberiza schoeniclus reed bunting non-specialist short-distance/residentFalco subbuteo hobby non-specialist long-distanceFalco tinnunculus kestrel non-specialist short-distance/residentHirundo rustica swallow non-specialist long-distanceLanius collurio red-backed shrike specialist long-distanceMiliaria calandra corn bunting specialist short-distance/residentMotacilla flava yellow wagtail non-specialist short-distance/residentPasser montanus tree sparrow specialist short-distance/residentPica pica magpie non-specialist short-distance/residentSaxicola rubetra stonechat specialist long-distanceStreptopelia turtur turtle dove specialist long-distanceSturnus vulgaris starling specialist short-distance/residentSylvia communis whitethroat specialist long-distanceVanellus vanellus lapwing specialist short-distance/resident
(b) woodland, park and garden birdsAccipiter nisus sparrowhawk non-specialist short-distance/residentAegithalos caudatus long-tailed tit specialist short-distance/residentAnthus trivialis tree pipit specialist long-distanceButeo buteo buzzard non-specialist short-distance/residentDendrocopos major great-spotted woodpecker non-specialist short-distance/residentErithacus rubecula robin non-specialist short-distance/residentFringilla coelebs chaffinch non-specialist short-distance/residentGarrulus glandarius jay specialist short-distance/residentJynx torquilla wryneck non-specialist long-distanceMuscicapa striata spotted flycatcher specialist long-distanceParus ater coal tit specialist short-distance/residentParus caeruleus blue tit non-specialist short-distance/residentParus major great tit non-specialist short-distance/residentPhoenicurus phoenicurus redstart specialist long-distancePhylloscopus collybita chiffchaff specialist long-distancePhylloscopus trochilus willow warbler non-specialist long-distancePrunella modularis dunnock specialist short-distance/residentRegulus regulus goldcrest specialist short-distance/residentSylvia atricapilla blackcap specialist short-distance/residentSylvia borin garden warbler non-specialist long-distanceTroglodytes troglodytes wren specialist short-distance/residentTurdus merula blackbird non-specialist short-distance/residentTurdus philomelos song thrush specialist short-distance/residentTurdus viscivorus mistle thrush specialist short-distance/resident
276 R. D. Gregory and others Developing indicators for European birds
context because changes in small, insignificant popu-
lations could dominate and obscure the genuine
European trend. Therefore, the yearly scheme totals
were first converted into yearly national population
sizes. A weighting factor was calculated as the national
population size for a particular year divided by the
Phil. Trans. R. Soc. B (2005)
estimated yearly scheme total for that year. This
weighting factor was applied to all years of the scheme
in order to obtain yearly national population sizes for
each year. If the weight is treated as a known constant,
estimates of the variances of these weighted year
totals can be obtained by multiplying the variances of
Developing indicators for European birds R. D. Gregory and others 277
the estimated unweighted year totals by the square ofthe weight.
The next step was to combine the yearly totals fromeach country. Combining total numbers acrosscountries is straightforward in cases where we restrictedthe analysis to the period for which data were availablefor all countries; we simply summed the estimatedtotals for each country. Since the estimates of the yeartotals are independent between countries, the varianceof each combined total is the sum of the variances of thecorresponding country totals. However, missing yeartotals for many countries, owing to differences in thelength of the time-series, made the combination of yeartotals more complicated. The missing year totals wereestimated by TRIM in a way equivalent to imputingmissing counts for particular sites within countries (vanStrien et al. 2001). Missing year totals of particularcountry sites were thus estimated from other countriesof the same European region, assuming that allcountries within the same region have had similarchanges in population numbers. Four regions wereidentified for this purpose alone: Central and East(Estonia, Latvia, Poland, Hungary, Czech Republicand former East Germany); North (Norway, Swedenand Denmark); South (France, Spain and Italy); andWest (Ireland, UK, Belgium, Netherlands, former WestGermany, Switzerland and Austria).
The computed indices and confidence intervals arein fact extremely similar to those that would have beencalculated had we received the raw data (van Strienet al. 2001). After estimating the year totals for theEuropean regions, these regions were then combined togenerate European indices for each species. Countrieswere also combined to assess separate EU indices andindices for the group of EU Accession countries.
(iii) Multi-species levelWe averaged indices rather than abundances in order togive each species an equal weight in the resultingindicators. When positive and negative changes ofindices are in balance, then we would expect their meanto remain stable. If more species decline than increase,the mean should go down and vice versa. Thus, theindex mean is considered a measure of biodiversitychange. We used geometric means rather than arith-metic means because we consider an index change from100 to 200 equivalent, but opposite, to a decrease from100 to 50.
We combined indices for species to produce multi-species indicators for European regions and Europe.Standard errors for geometric means were computedfrom the indices and standard errors of individualspecies (Appendix).
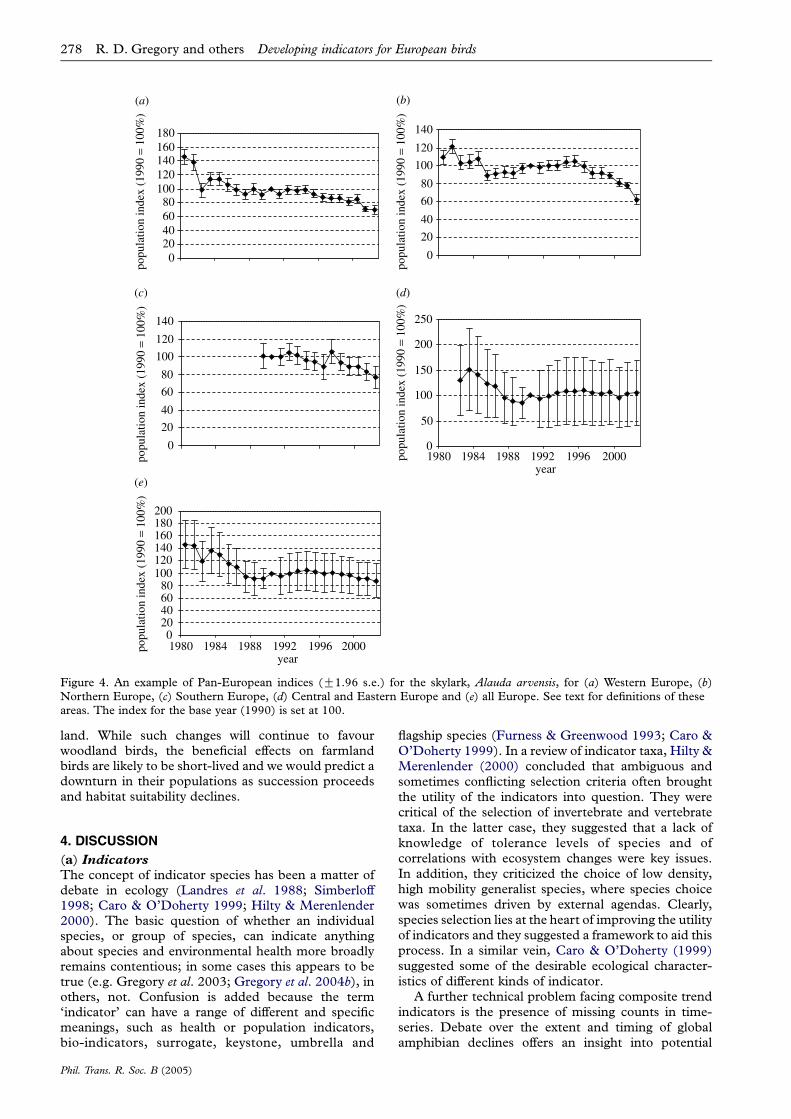
(g) Results
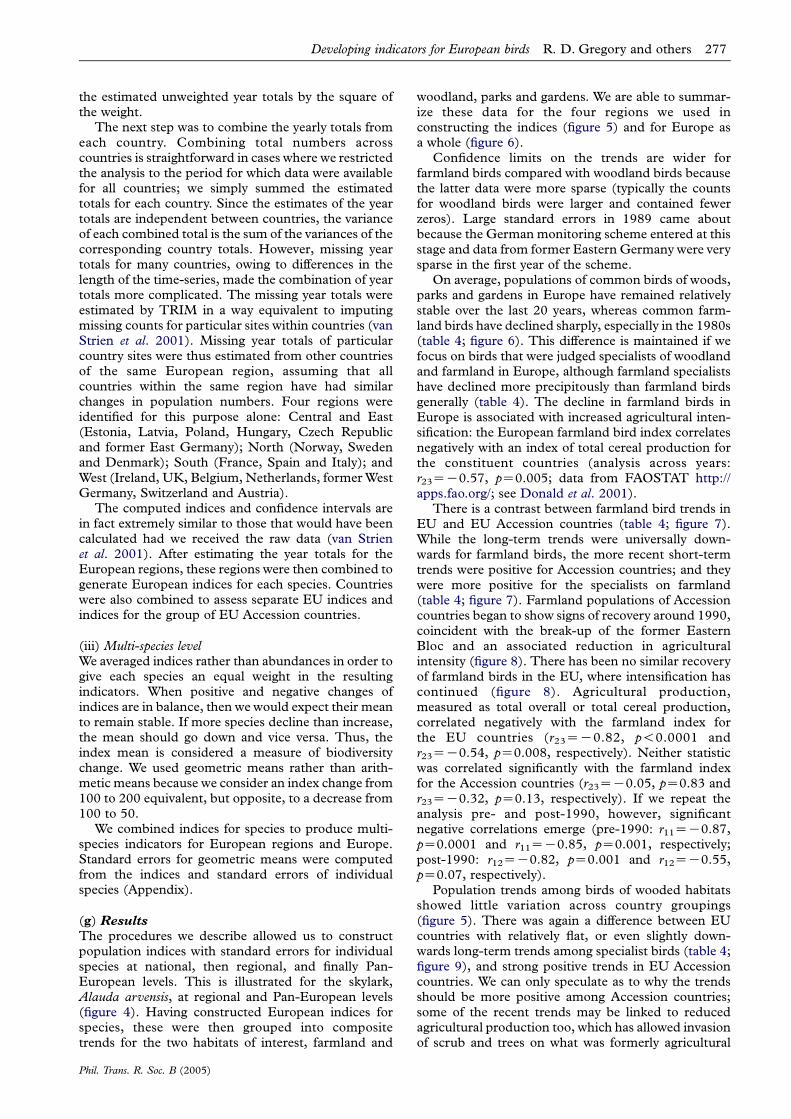
The procedures we describe allowed us to constructpopulation indices with standard errors for individualspecies at national, then regional, and finally Pan-European levels. This is illustrated for the skylark,Alauda arvensis, at regional and Pan-European levels(figure 4). Having constructed European indices forspecies, these were then grouped into compositetrends for the two habitats of interest, farmland and
Phil. Trans. R. Soc. B (2005)
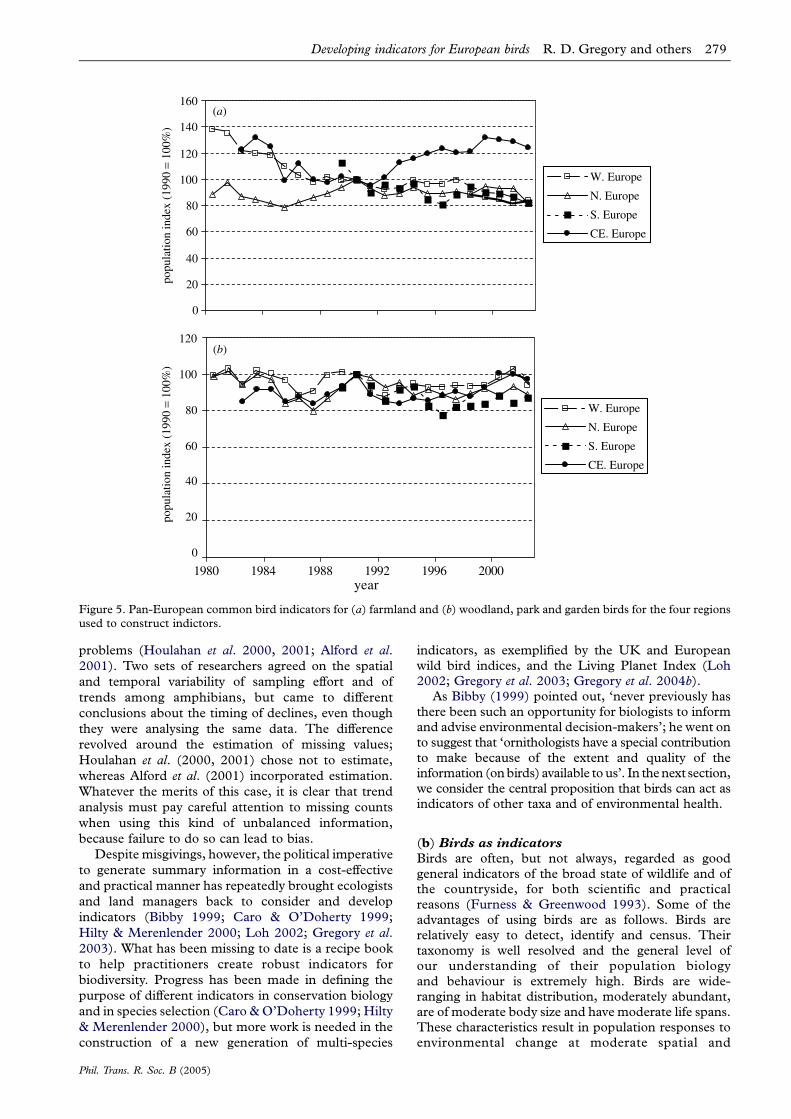
woodland, parks and gardens. We are able to summar-ize these data for the four regions we used inconstructing the indices (figure 5) and for Europe asa whole (figure 6).
Confidence limits on the trends are wider forfarmland birds compared with woodland birds becausethe latter data were more sparse (typically the countsfor woodland birds were larger and contained fewerzeros). Large standard errors in 1989 came aboutbecause the German monitoring scheme entered at thisstage and data from former Eastern Germany were verysparse in the first year of the scheme.
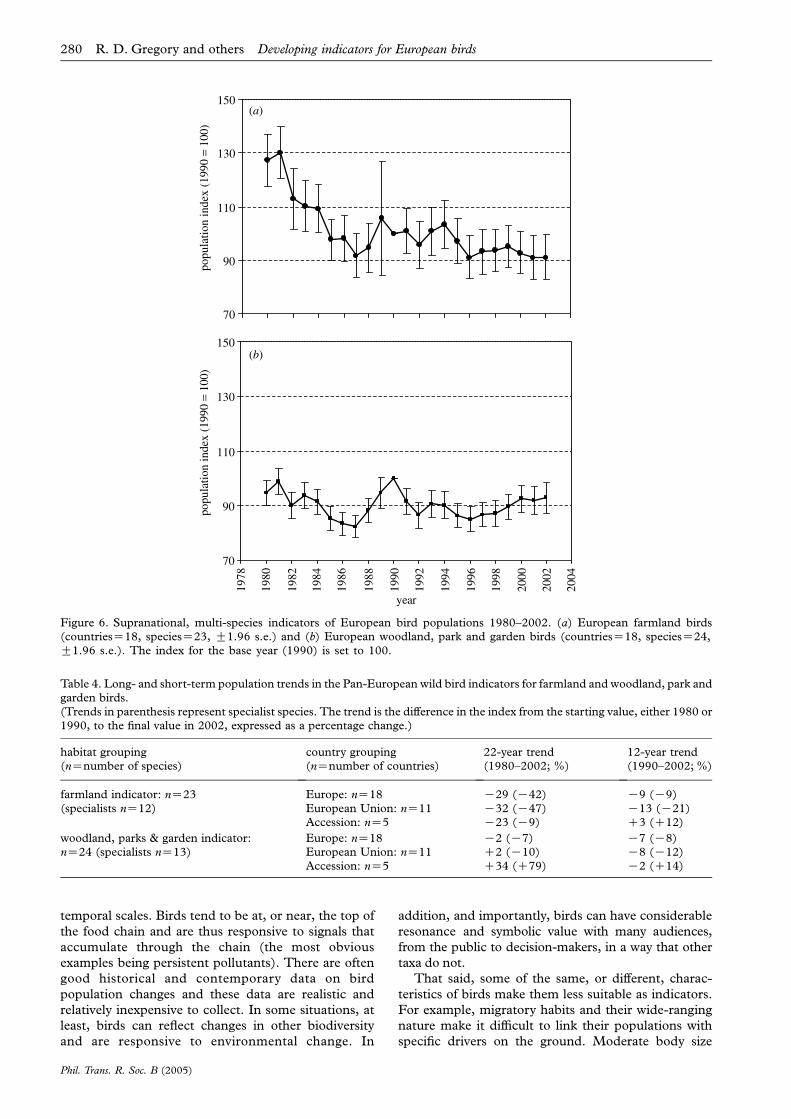
On average, populations of common birds of woods,parks and gardens in Europe have remained relativelystable over the last 20 years, whereas common farm-land birds have declined sharply, especially in the 1980s(table 4; figure 6). This difference is maintained if wefocus on birds that were judged specialists of woodlandand farmland in Europe, although farmland specialistshave declined more precipitously than farmland birdsgenerally (table 4). The decline in farmland birds inEurope is associated with increased agricultural inten-sification: the European farmland bird index correlatesnegatively with an index of total cereal production forthe constituent countries (analysis across years:r23ZK0.57, pZ0.005; data from FAOSTAT http://apps.fao.org/; see Donald et al. 2001).
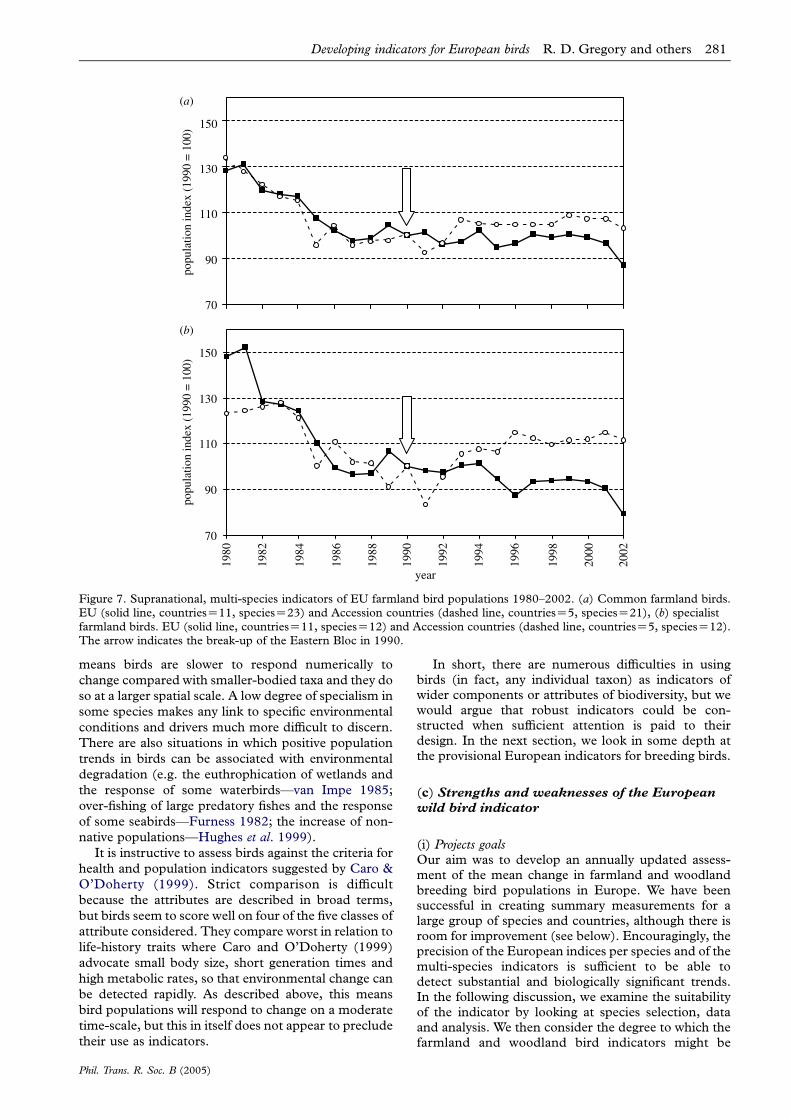
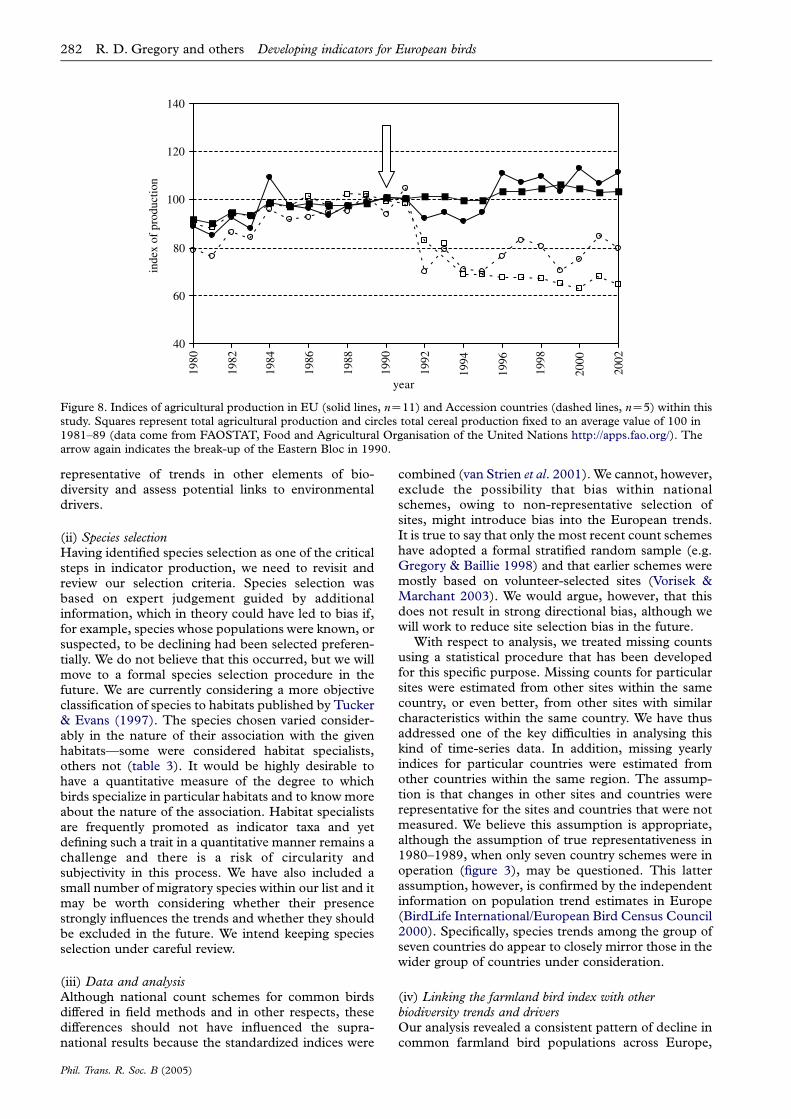
There is a contrast between farmland bird trends inEU and EU Accession countries (table 4; figure 7).While the long-term trends were universally down-wards for farmland birds, the more recent short-termtrends were positive for Accession countries; and theywere more positive for the specialists on farmland(table 4; figure 7). Farmland populations of Accessioncountries began to show signs of recovery around 1990,coincident with the break-up of the former EasternBloc and an associated reduction in agriculturalintensity (figure 8). There has been no similar recoveryof farmland birds in the EU, where intensification hascontinued (figure 8). Agricultural production,measured as total overall or total cereal production,correlated negatively with the farmland index forthe EU countries (r23ZK0.82, p!0.0001 andr23ZK0.54, pZ0.008, respectively). Neither statisticwas correlated significantly with the farmland indexfor the Accession countries (r23ZK0.05, pZ0.83 andr23ZK0.32, pZ0.13, respectively). If we repeat theanalysis pre- and post-1990, however, significantnegative correlations emerge (pre-1990: r11ZK0.87,pZ0.0001 and r11ZK0.85, pZ0.001, respectively;post-1990: r12ZK0.82, pZ0.001 and r12ZK0.55,pZ0.07, respectively).
Population trends among birds of wooded habitatsshowed little variation across country groupings(figure 5). There was again a difference between EUcountries with relatively flat, or even slightly down-wards long-term trends among specialist birds (table 4;figure 9), and strong positive trends in EU Accessioncountries. We can only speculate as to why the trendsshould be more positive among Accession countries;some of the recent trends may be linked to reducedagricultural production too, which has allowed invasionof scrub and trees on what was formerly agricultural
020406080
100120140160180
1980 1984 1988 1992 1996 2000year
1980 1984 1988 1992 1996 2000year
popu
latio
n in
dex
(199
0 =
100%
)po
pula
tion
inde
x (1
990
= 10
0%)
0
20
40
60
80
100
120
140
popu
latio
n in
dex
(199
0 =
100%
)po
pula
tion
inde
x (1
990
= 10
0%)
popu
latio
n in
dex
(199
0 =
100%
)
(a)
(c)
(e)
(d)
(b)
0
20
40
60
80
100
120
140
020406080
100120140160180200
0
50
100
150
200
250
Figure 4. An example of Pan-European indices (G1.96 s.e.) for the skylark, Alauda arvensis, for (a) Western Europe, (b)Northern Europe, (c) Southern Europe, (d) Central and Eastern Europe and (e) all Europe. See text for definitions of theseareas. The index for the base year (1990) is set at 100.
278 R. D. Gregory and others Developing indicators for European birds
land. While such changes will continue to favourwoodland birds, the beneficial effects on farmlandbirds are likely to be short-lived and we would predict adownturn in their populations as succession proceedsand habitat suitability declines.
4. DISCUSSION
(a) IndicatorsThe concept of indicator species has been a matter ofdebate in ecology (Landres et al. 1988; Simberloff1998; Caro & O’Doherty 1999; Hilty & Merenlender2000). The basic question of whether an individualspecies, or group of species, can indicate anythingabout species and environmental health more broadlyremains contentious; in some cases this appears to betrue (e.g. Gregory et al. 2003; Gregory et al. 2004b), inothers, not. Confusion is added because the term‘indicator’ can have a range of different and specificmeanings, such as health or population indicators,bio-indicators, surrogate, keystone, umbrella and
Phil. Trans. R. Soc. B (2005)
flagship species (Furness & Greenwood 1993; Caro &O’Doherty 1999). In a review of indicator taxa, Hilty &Merenlender (2000) concluded that ambiguous andsometimes conflicting selection criteria often broughtthe utility of the indicators into question. They werecritical of the selection of invertebrate and vertebratetaxa. In the latter case, they suggested that a lack ofknowledge of tolerance levels of species and ofcorrelations with ecosystem changes were key issues.In addition, they criticized the choice of low density,high mobility generalist species, where species choicewas sometimes driven by external agendas. Clearly,species selection lies at the heart of improving the utilityof indicators and they suggested a framework to aid thisprocess. In a similar vein, Caro & O’Doherty (1999)suggested some of the desirable ecological character-istics of different kinds of indicator.
A further technical problem facing composite trendindicators is the presence of missing counts in time-series. Debate over the extent and timing of globalamphibian declines offers an insight into potential
0
20
40
60
80
100
120
140
160
popu
latio
n in
dex
(199
0 =
100%
)po
pula
tion
inde
x (1
990
= 10
0%)
W. Europe
N. Europe
S. Europe
CE. Europe
0
20
40
60
80
100
120
1980 1984 1988 1992 1996 2000year
W. Europe
N. Europe
S. Europe
CE. Europe
(a)
(b)
Figure 5. Pan-European common bird indicators for (a) farmland and (b) woodland, park and garden birds for the four regionsused to construct indictors.
Developing indicators for European birds R. D. Gregory and others 279
problems (Houlahan et al. 2000, 2001; Alford et al.2001). Two sets of researchers agreed on the spatial
and temporal variability of sampling effort and of
trends among amphibians, but came to different
conclusions about the timing of declines, even though
they were analysing the same data. The difference
revolved around the estimation of missing values;
Houlahan et al. (2000, 2001) chose not to estimate,
whereas Alford et al. (2001) incorporated estimation.
Whatever the merits of this case, it is clear that trend
analysis must pay careful attention to missing counts
when using this kind of unbalanced information,
because failure to do so can lead to bias.
Despite misgivings, however, the political imperative
to generate summary information in a cost-effective
and practical manner has repeatedly brought ecologists
and land managers back to consider and develop
indicators (Bibby 1999; Caro & O’Doherty 1999;
Hilty & Merenlender 2000; Loh 2002; Gregory et al.2003). What has been missing to date is a recipe book
to help practitioners create robust indicators for
biodiversity. Progress has been made in defining the
purpose of different indicators in conservation biology
and in species selection (Caro & O’Doherty 1999; Hilty
& Merenlender 2000), but more work is needed in the
construction of a new generation of multi-species
Phil. Trans. R. Soc. B (2005)
indicators, as exemplified by the UK and Europeanwild bird indices, and the Living Planet Index (Loh2002; Gregory et al. 2003; Gregory et al. 2004b).
As Bibby (1999) pointed out, ‘never previously hasthere been such an opportunity for biologists to informand advise environmental decision-makers’; he went onto suggest that ‘ornithologists have a special contributionto make because of the extent and quality of theinformation (on birds) available to us’. In the next section,we consider the central proposition that birds can act asindicators of other taxa and of environmental health.
(b) Birds as indicators
Birds are often, but not always, regarded as goodgeneral indicators of the broad state of wildlife and ofthe countryside, for both scientific and practicalreasons (Furness & Greenwood 1993). Some of theadvantages of using birds are as follows. Birds arerelatively easy to detect, identify and census. Theirtaxonomy is well resolved and the general level ofour understanding of their population biologyand behaviour is extremely high. Birds are wide-ranging in habitat distribution, moderately abundant,are of moderate body size and have moderate life spans.These characteristics result in population responses toenvironmental change at moderate spatial and
70
90
110
130
150
popu
latio
n in
dex
(199
0 =
100)
popu
latio
n in
dex
(199
0 =
100)
70
90
110
130
150
1978
1980
1982
1984
1986
1988
1990
1992
1994
1996
1998
2000
2002
2004
year
(a)
(b)
Figure 6. Supranational, multi-species indicators of European bird populations 1980–2002. (a) European farmland birds(countriesZ18, speciesZ23, G1.96 s.e.) and (b) European woodland, park and garden birds (countriesZ18, speciesZ24,G1.96 s.e.). The index for the base year (1990) is set to 100.
Table 4. Long- and short-term population trends in the Pan-European wild bird indicators for farmland and woodland, park andgarden birds.(Trends in parenthesis represent specialist species. The trend is the difference in the index from the starting value, either 1980 or1990, to the final value in 2002, expressed as a percentage change.)
habitat grouping(nZnumber of species)
country grouping(nZnumber of countries)
22-year trend(1980–2002; %)
12-year trend(1990–2002; %)
farmland indicator: nZ23(specialists nZ12)
Europe: nZ18 K29 (K42) K9 (K9)European Union: nZ11 K32 (K47) K13 (K21)Accession: nZ5 K23 (K9) C3 (C12)
woodland, parks & garden indicator:nZ24 (specialists nZ13)
Europe: nZ18 K2 (K7) K7 (K8)European Union: nZ11 C2 (K10) K8 (K12)Accession: nZ5 C34 (C79) K2 (C14)
280 R. D. Gregory and others Developing indicators for European birds
temporal scales. Birds tend to be at, or near, the top of
the food chain and are thus responsive to signals that
accumulate through the chain (the most obvious
examples being persistent pollutants). There are often
good historical and contemporary data on bird
population changes and these data are realistic and
relatively inexpensive to collect. In some situations, at
least, birds can reflect changes in other biodiversity
and are responsive to environmental change. In
Phil. Trans. R. Soc. B (2005)
addition, and importantly, birds can have considerable
resonance and symbolic value with many audiences,
from the public to decision-makers, in a way that other
taxa do not.
That said, some of the same, or different, charac-
teristics of birds make them less suitable as indicators.
For example, migratory habits and their wide-ranging
nature make it difficult to link their populations with
specific drivers on the ground. Moderate body size
70
90
110
130
150
popu
latio
n in
dex
(199
0 =
100
)po
pula
tion
inde
x (1
990
= 1
00)
70
90
110
130
150
1980
1982
1984
1986
1988
1990
1992
1994
1996
1998
2000
2002
year
(b)
(a)
Figure 7. Supranational, multi-species indicators of EU farmland bird populations 1980–2002. (a) Common farmland birds.EU (solid line, countriesZ11, speciesZ23) and Accession countries (dashed line, countriesZ5, speciesZ21), (b) specialistfarmland birds. EU (solid line, countriesZ11, speciesZ12) and Accession countries (dashed line, countriesZ5, speciesZ12).The arrow indicates the break-up of the Eastern Bloc in 1990.
Developing indicators for European birds R. D. Gregory and others 281
means birds are slower to respond numerically to
change compared with smaller-bodied taxa and they do
so at a larger spatial scale. A low degree of specialism in
some species makes any link to specific environmental
conditions and drivers much more difficult to discern.
There are also situations in which positive population
trends in birds can be associated with environmental
degradation (e.g. the euthrophication of wetlands and
the response of some waterbirds—van Impe 1985;
over-fishing of large predatory fishes and the response
of some seabirds—Furness 1982; the increase of non-
native populations—Hughes et al. 1999).
It is instructive to assess birds against the criteria for
health and population indicators suggested by Caro &
O’Doherty (1999). Strict comparison is difficult
because the attributes are described in broad terms,
but birds seem to score well on four of the five classes of
attribute considered. They compare worst in relation to
life-history traits where Caro and O’Doherty (1999)
advocate small body size, short generation times and
high metabolic rates, so that environmental change can
be detected rapidly. As described above, this means
bird populations will respond to change on a moderate
time-scale, but this in itself does not appear to preclude
their use as indicators.
Phil. Trans. R. Soc. B (2005)
In short, there are numerous difficulties in usingbirds (in fact, any individual taxon) as indicators ofwider components or attributes of biodiversity, but wewould argue that robust indicators could be con-structed when sufficient attention is paid to theirdesign. In the next section, we look in some depth atthe provisional European indicators for breeding birds.
(c) Strengths and weaknesses of the European
wild bird indicator
(i) Projects goalsOur aim was to develop an annually updated assess-ment of the mean change in farmland and woodlandbreeding bird populations in Europe. We have beensuccessful in creating summary measurements for alarge group of species and countries, although there isroom for improvement (see below). Encouragingly, theprecision of the European indices per species and of themulti-species indicators is sufficient to be able todetect substantial and biologically significant trends.In the following discussion, we examine the suitabilityof the indicator by looking at species selection, dataand analysis. We then consider the degree to which thefarmland and woodland bird indicators might be
40
60
80
100
120
140
1980
1982
1984
1986
1988
1990
1992
1994
1996
1998
2000
2002
year
inde
x of
pro
duct
ion
Figure 8. Indices of agricultural production in EU (solid lines, nZ11) and Accession countries (dashed lines, nZ5) within thisstudy. Squares represent total agricultural production and circles total cereal production fixed to an average value of 100 in1981–89 (data come from FAOSTAT, Food and Agricultural Organisation of the United Nations http://apps.fao.org/). Thearrow again indicates the break-up of the Eastern Bloc in 1990.
282 R. D. Gregory and others Developing indicators for European birds
representative of trends in other elements of bio-diversity and assess potential links to environmentaldrivers.
(ii) Species selectionHaving identified species selection as one of the criticalsteps in indicator production, we need to revisit andreview our selection criteria. Species selection wasbased on expert judgement guided by additionalinformation, which in theory could have led to bias if,for example, species whose populations were known, orsuspected, to be declining had been selected preferen-tially. We do not believe that this occurred, but we willmove to a formal species selection procedure in thefuture. We are currently considering a more objectiveclassification of species to habitats published by Tucker& Evans (1997). The species chosen varied consider-ably in the nature of their association with the givenhabitats—some were considered habitat specialists,others not (table 3). It would be highly desirable tohave a quantitative measure of the degree to whichbirds specialize in particular habitats and to know moreabout the nature of the association. Habitat specialistsare frequently promoted as indicator taxa and yetdefining such a trait in a quantitative manner remains achallenge and there is a risk of circularity andsubjectivity in this process. We have also included asmall number of migratory species within our list and itmay be worth considering whether their presencestrongly influences the trends and whether they shouldbe excluded in the future. We intend keeping speciesselection under careful review.
(iii) Data and analysisAlthough national count schemes for common birdsdiffered in field methods and in other respects, thesedifferences should not have influenced the supra-national results because the standardized indices were
Phil. Trans. R. Soc. B (2005)
combined (van Strien et al. 2001). We cannot, however,exclude the possibility that bias within nationalschemes, owing to non-representative selection ofsites, might introduce bias into the European trends.It is true to say that only the most recent count schemeshave adopted a formal stratified random sample (e.g.Gregory & Baillie 1998) and that earlier schemes weremostly based on volunteer-selected sites (Vorisek &Marchant 2003). We would argue, however, that thisdoes not result in strong directional bias, although wewill work to reduce site selection bias in the future.
With respect to analysis, we treated missing countsusing a statistical procedure that has been developedfor this specific purpose. Missing counts for particularsites were estimated from other sites within the samecountry, or even better, from other sites with similarcharacteristics within the same country. We have thusaddressed one of the key difficulties in analysing thiskind of time-series data. In addition, missing yearlyindices for particular countries were estimated fromother countries within the same region. The assump-tion is that changes in other sites and countries wererepresentative for the sites and countries that were notmeasured. We believe this assumption is appropriate,although the assumption of true representativeness in1980–1989, when only seven country schemes were inoperation (figure 3), may be questioned. This latterassumption, however, is confirmed by the independentinformation on population trend estimates in Europe(BirdLife International/European Bird Census Council2000). Specifically, species trends among the group ofseven countries do appear to closely mirror those in thewider group of countries under consideration.
(iv) Linking the farmland bird index with otherbiodiversity trends and driversOur analysis revealed a consistent pattern of decline incommon farmland bird populations across Europe,
50
70
90
110
130
popu
latio
n in
dex
(199
0 =
100)
popu
latio
n in
dex
(199
0 =
100)
50
70
90
110
130
1980 1982 1984 1986 1988 1990 1992 1994 1996 1998 2000 2002year
(a)
(b)
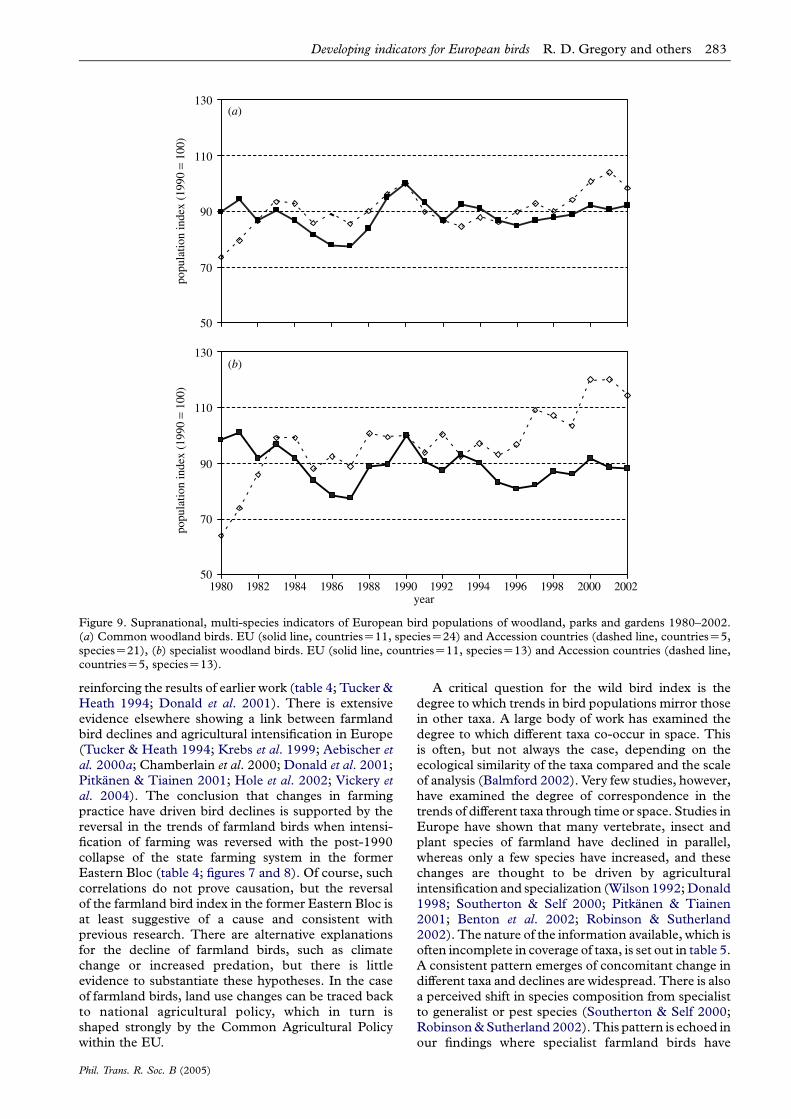
Figure 9. Supranational, multi-species indicators of European bird populations of woodland, parks and gardens 1980–2002.(a) Common woodland birds. EU (solid line, countriesZ11, speciesZ24) and Accession countries (dashed line, countriesZ5,speciesZ21), (b) specialist woodland birds. EU (solid line, countriesZ11, speciesZ13) and Accession countries (dashed line,countriesZ5, speciesZ13).
Developing indicators for European birds R. D. Gregory and others 283
reinforcing the results of earlier work (table 4; Tucker &Heath 1994; Donald et al. 2001). There is extensiveevidence elsewhere showing a link between farmlandbird declines and agricultural intensification in Europe(Tucker & Heath 1994; Krebs et al. 1999; Aebischer etal. 2000a; Chamberlain et al. 2000; Donald et al. 2001;Pitkanen & Tiainen 2001; Hole et al. 2002; Vickery etal. 2004). The conclusion that changes in farmingpractice have driven bird declines is supported by thereversal in the trends of farmland birds when intensi-fication of farming was reversed with the post-1990collapse of the state farming system in the formerEastern Bloc (table 4; figures 7 and 8). Of course, suchcorrelations do not prove causation, but the reversalof the farmland bird index in the former Eastern Bloc isat least suggestive of a cause and consistent withprevious research. There are alternative explanationsfor the decline of farmland birds, such as climatechange or increased predation, but there is littleevidence to substantiate these hypotheses. In the caseof farmland birds, land use changes can be traced backto national agricultural policy, which in turn isshaped strongly by the Common Agricultural Policywithin the EU.
Phil. Trans. R. Soc. B (2005)
A critical question for the wild bird index is thedegree to which trends in bird populations mirror thosein other taxa. A large body of work has examined thedegree to which different taxa co-occur in space. Thisis often, but not always the case, depending on theecological similarity of the taxa compared and the scaleof analysis (Balmford 2002). Very few studies, however,have examined the degree of correspondence in thetrends of different taxa through time or space. Studies inEurope have shown that many vertebrate, insect andplant species of farmland have declined in parallel,whereas only a few species have increased, and thesechanges are thought to be driven by agriculturalintensification and specialization (Wilson 1992; Donald1998; Southerton & Self 2000; Pitkanen & Tiainen2001; Benton et al. 2002; Robinson & Sutherland2002). The nature of the information available, which isoften incomplete in coverage of taxa, is set out in table 5.A consistent pattern emerges of concomitant change indifferent taxa and declines are widespread. There is alsoa perceived shift in species composition from specialistto generalist or pest species (Southerton & Self 2000;Robinson & Sutherland 2002). This pattern is echoed inour findings where specialist farmland birds have
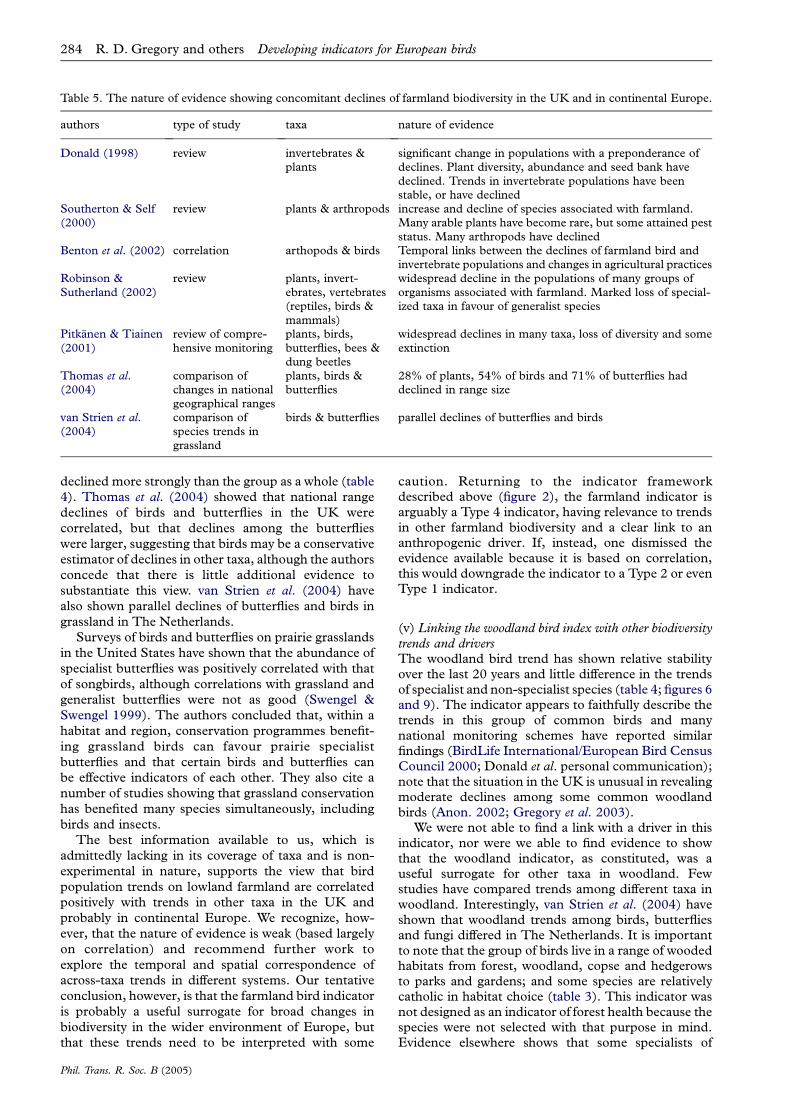
Table 5. The nature of evidence showing concomitant declines of farmland biodiversity in the UK and in continental Europe.
authors type of study taxa nature of evidence
Donald (1998) review invertebrates &plants
significant change in populations with a preponderance ofdeclines. Plant diversity, abundance and seed bank havedeclined. Trends in invertebrate populations have beenstable, or have declined
Southerton & Self(2000)
review plants & arthropods increase and decline of species associated with farmland.Many arable plants have become rare, but some attained peststatus. Many arthropods have declined
Benton et al. (2002) correlation arthopods & birds Temporal links between the declines of farmland bird andinvertebrate populations and changes in agricultural practices
Robinson &Sutherland (2002)
review plants, invert-ebrates, vertebrates(reptiles, birds &mammals)
widespread decline in the populations of many groups oforganisms associated with farmland. Marked loss of special-ized taxa in favour of generalist species
Pitkanen & Tiainen(2001)
review of compre-hensive monitoring
plants, birds,butterflies, bees &dung beetles
widespread declines in many taxa, loss of diversity and someextinction
Thomas et al.(2004)
comparison ofchanges in nationalgeographical ranges
plants, birds &butterflies
28% of plants, 54% of birds and 71% of butterflies haddeclined in range size
van Strien et al.(2004)
comparison ofspecies trends ingrassland
birds & butterflies parallel declines of butterflies and birds
284 R. D. Gregory and others Developing indicators for European birds
declined more strongly than the group as a whole (table
4). Thomas et al. (2004) showed that national range
declines of birds and butterflies in the UK were
correlated, but that declines among the butterflies
were larger, suggesting that birds may be a conservative
estimator of declines in other taxa, although the authors
concede that there is little additional evidence to
substantiate this view. van Strien et al. (2004) have
also shown parallel declines of butterflies and birds in
grassland in The Netherlands.
Surveys of birds and butterflies on prairie grasslands
in the United States have shown that the abundance of
specialist butterflies was positively correlated with that
of songbirds, although correlations with grassland and
generalist butterflies were not as good (Swengel &
Swengel 1999). The authors concluded that, within a
habitat and region, conservation programmes benefit-
ing grassland birds can favour prairie specialist
butterflies and that certain birds and butterflies can
be effective indicators of each other. They also cite a
number of studies showing that grassland conservation
has benefited many species simultaneously, including
birds and insects.
The best information available to us, which is
admittedly lacking in its coverage of taxa and is non-
experimental in nature, supports the view that bird
population trends on lowland farmland are correlated
positively with trends in other taxa in the UK and
probably in continental Europe. We recognize, how-
ever, that the nature of evidence is weak (based largely
on correlation) and recommend further work to
explore the temporal and spatial correspondence of
across-taxa trends in different systems. Our tentative
conclusion, however, is that the farmland bird indicator
is probably a useful surrogate for broad changes in
biodiversity in the wider environment of Europe, but
that these trends need to be interpreted with some
Phil. Trans. R. Soc. B (2005)
caution. Returning to the indicator frameworkdescribed above (figure 2), the farmland indicator isarguably a Type 4 indicator, having relevance to trendsin other farmland biodiversity and a clear link to ananthropogenic driver. If, instead, one dismissed theevidence available because it is based on correlation,this would downgrade the indicator to a Type 2 or evenType 1 indicator.
(v) Linking the woodland bird index with other biodiversitytrends and driversThe woodland bird trend has shown relative stabilityover the last 20 years and little difference in the trendsof specialist and non-specialist species (table 4; figures 6and 9). The indicator appears to faithfully describe thetrends in this group of common birds and manynational monitoring schemes have reported similarfindings (BirdLife International/European Bird CensusCouncil 2000; Donald et al. personal communication);note that the situation in the UK is unusual in revealingmoderate declines among some common woodlandbirds (Anon. 2002; Gregory et al. 2003).
We were not able to find a link with a driver in thisindicator, nor were we able to find evidence to showthat the woodland indicator, as constituted, was auseful surrogate for other taxa in woodland. Fewstudies have compared trends among different taxa inwoodland. Interestingly, van Strien et al. (2004) haveshown that woodland trends among birds, butterfliesand fungi differed in The Netherlands. It is importantto note that the group of birds live in a range of woodedhabitats from forest, woodland, copse and hedgerowsto parks and gardens; and some species are relativelycatholic in habitat choice (table 3). This indicator wasnot designed as an indicator of forest health because thespecies were not selected with that purpose in mind.Evidence elsewhere shows that some specialists of
Developing indicators for European birds R. D. Gregory and others 285
forest, particularly birds associated with old growthEuropean forests, have declined severely and arethreatened by modern commercial forestry practices(Virkkala 1991; Tucker & Heath 1994; Kouki &Vaananen 2000).
Returning to the indicator framework (figure 2), theevidence available to us suggests the woodland birdindicator is a Type 1 indicator, with specific, but limitedscope. The woodland indicator might be upgraded to aType 2 or Type 4 indicator by altering species selection,by combining the trends with those from other taxa, orby connecting it more clearly with a driver. It would besensible to try to combine this indicator, for example,with the information collected in the EU Forest FocusProgram and other similar programmes.
(vi) Using and developing the wild bird indicatorsThe indicators we have developed for European birdsprovide a potentially powerful tool to enable scientificinformation to be communicated to policy makers. Thedivergence in the fortunes of farmland bird populationswithin EU and Accession countries illustrates the rapidimpact political decisions can have on bird populationsand hence the relevance to policy of current biodiversitymeasurements that are capable of update. The Euro-pean wild bird indicators are already being used widelyto inform debate on biodiversity targets and sustain-ability in Europe. They have been used in: the EU’s2003 Environment Policy Review and environmentrelated indicators pamphlet; in Eurostat’s Yearbook2004; in the European Environment Agency’s (EEA)Signals 2004 report and High Nature Value Farmland2004 report; in EEA’s core biodiversity indicator set;and in the IRENA indicator set (Indicator Reporting onthe integration of ENvironmental concerns into Agri-cultural policy). Indeed, the farmland bird index hasbeen adopted as a Structural Indicator of the EuropeanUnion to represent trends in biodiversity. The wild birdindex is by far the most advanced summary statistic ofits kind available in Europe. The speed with which theindicator has been used reflects a policy need and adesire to incorporate biodiversity trends in environ-mental monitoring, prompted to a degree by the EUtarget to halt biodiversity loss by 2010.
There are important caveats attached to the wildbird indicator. For example, it covers only two broadhabitat types in Europe and the species chosen wereclassified to habitats in a simplistic fashion. There arealso temporal gaps in the data, particularly early in thetime-series, potential bias within national schemes andsignificant spatial gaps in the south and east of Europe.This indicator covers only one component of birddiversity (i.e. trends in the common and widespreadspecies) and only one small element of biodiversity. Wewould argue, however, that we have been able toproduce an indicator for an important element ofbiodiversity that is capable of meaningful measurementagainst the 2010 target in Europe. As such, this is asmall but significant step towards truly representativeindicators for biodiversity. In the future, we plan toimprove the indicator by increasing the number ofcountries contributing data, increasing the number ofspecies for which we collect data, formalizing species
Phil. Trans. R. Soc. B (2005)
selection and species grouping, streamlining data entryand analysis, and exploring the potential links betweenthe bird trends and drivers.
(d) Indicators of biodiversity trends
The pledge made by politicians at the 2002 WorldSummit of Sustainable Development was to achieve‘a significant reduction in the current rate of biodiver-sity loss by 2010’. The task for scientists therefore is todevelop effective indicators of biodiversity trends sothat progress towards the target can be measured(Balmford et al. 2003, 2005; Jenkins et al. 2003; RoyalSociety 2003; Green et al. 2005). Indicators are centralto the CBD framework to evaluate progress towards the2010 biodiversity target. Specifically, ‘trends in abun-dance and distribution of selected species’ was identifiedas an indicator for immediate testing. Indicators are alsocentral in European deliberations to assess their statedbiodiversity goals and to measure sustainability of landuse. There is an urgent need for scientists to engage fullyin the debate to develop indicators and get smarter atusing them to describe the state of biodiversity.
Composite population trend indicators, as we havedescribed in this paper, provide a tangible basis formeasuring progress towards the biodiversity targets atglobal and regional scales, and complement infor-mation on habitats and other aspects of populations(Balmford et al. 2003, 2005; Royal Society 2003). Suchindicators might provide a template for other con-tinents, taxa and biomes, and for other aspects of globalbiodiversity. The potential strength of this approach isits statistical robustness, its relative simplicity, itsefficient use of existing data, its sensitivity to environ-mental change, its ability to communicate and its easeof update, which is often practical on an annual basis.
We are fortunate in having such extensive, highquality and long-running data for birds in Europe, butmany of the principles of trend analysis and indicatorconstruction apply to other types of population data foranimals and plants. We have been able to mobilize andaccess large amounts of data collected in manycountries by cooperating within a network of nationalorganizations. Rather than asking for raw datasets,which may be difficult to obtain and politicallycontentious, we asked national contacts to provideprocessed national results, computed using standardsoftware, and we are able to combine the nationalresults as if we had the raw data at our disposal. Byusing existing data, the indicators are cost-effective andthe cost-effectiveness is even higher if the taxa inquestion are viewed as surrogates for other taxa. Themodel of data collation, analysis and cooperation wedescribe might be usefully mimicked in other placesand with other kinds of population or habitat data.Clearly, our methods are data hungry and shortage ofdata on biodiversity is the biggest limiting factor inmany areas, and especially in the tropics, where mostdiversity resides. There are, naturally, limits to thedegree to which our methods could be applied else-where, and questions about the degree to which birdtrends represent trends in other taxa.
The process of ecological change we are attemptingto capture in our indicators has been described as
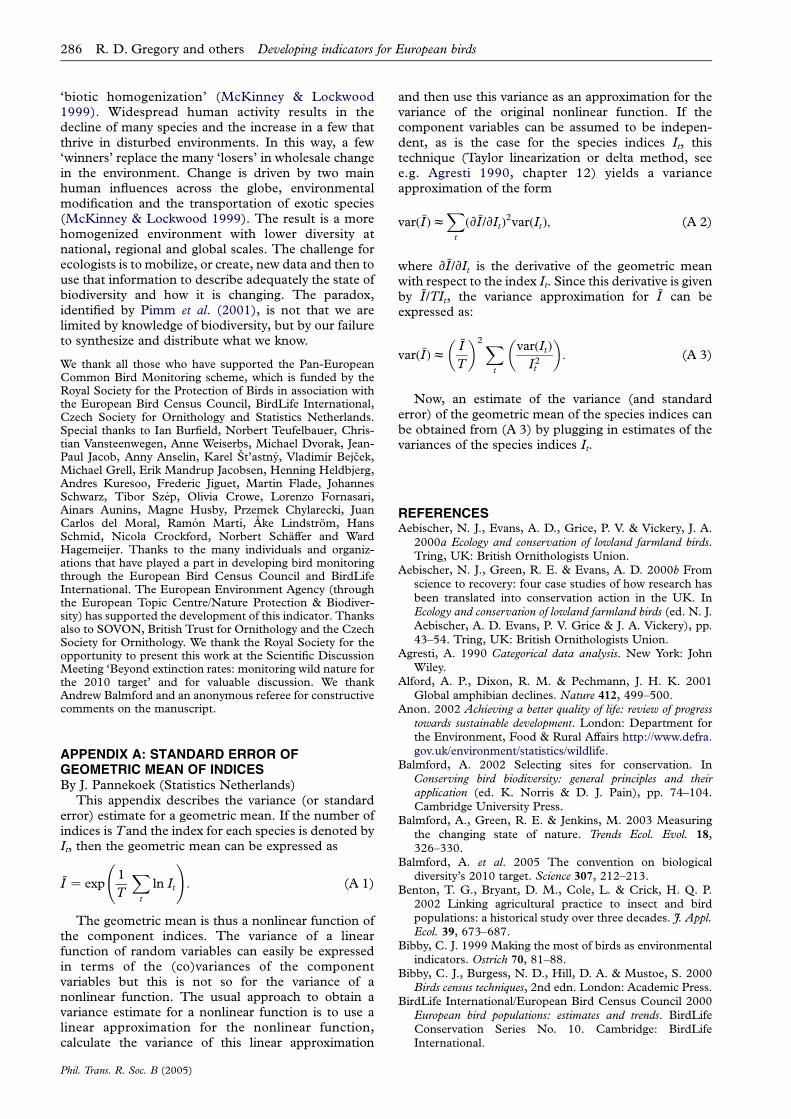
286 R. D. Gregory and others Developing indicators for European birds
‘biotic homogenization’ (McKinney & Lockwood1999). Widespread human activity results in thedecline of many species and the increase in a few thatthrive in disturbed environments. In this way, a few‘winners’ replace the many ‘losers’ in wholesale changein the environment. Change is driven by two mainhuman influences across the globe, environmentalmodification and the transportation of exotic species(McKinney & Lockwood 1999). The result is a morehomogenized environment with lower diversity atnational, regional and global scales. The challenge forecologists is to mobilize, or create, new data and then touse that information to describe adequately the state ofbiodiversity and how it is changing. The paradox,identified by Pimm et al. (2001), is not that we arelimited by knowledge of biodiversity, but by our failureto synthesize and distribute what we know.
We thank all those who have supported the Pan-EuropeanCommon Bird Monitoring scheme, which is funded by theRoyal Society for the Protection of Birds in association withthe European Bird Census Council, BirdLife International,Czech Society for Ornithology and Statistics Netherlands.Special thanks to Ian Burfield, Norbert Teufelbauer, Chris-tian Vansteenwegen, Anne Weiserbs, Michael Dvorak, Jean-Paul Jacob, Anny Anselin, Karel St’astny, Vladimır Bejcek,Michael Grell, Erik Mandrup Jacobsen, Henning Heldbjerg,Andres Kuresoo, Frederic Jiguet, Martin Flade, JohannesSchwarz, Tibor Szep, Olivia Crowe, Lorenzo Fornasari,Ainars Aunins, Magne Husby, Przemek Chylarecki, JuanCarlos del Moral, Ramon Martı, Ake Lindstrom, HansSchmid, Nicola Crockford, Norbert Schaffer and WardHagemeijer. Thanks to the many individuals and organiz-ations that have played a part in developing bird monitoringthrough the European Bird Census Council and BirdLifeInternational. The European Environment Agency (throughthe European Topic Centre/Nature Protection & Biodiver-sity) has supported the development of this indicator. Thanksalso to SOVON, British Trust for Ornithology and the CzechSociety for Ornithology. We thank the Royal Society for theopportunity to present this work at the Scientific DiscussionMeeting ‘Beyond extinction rates: monitoring wild nature forthe 2010 target’ and for valuable discussion. We thankAndrew Balmford and an anonymous referee for constructivecomments on the manuscript.
APPENDIX A: STANDARD ERROR OFGEOMETRIC MEAN OF INDICESBy J. Pannekoek (Statistics Netherlands)
This appendix describes the variance (or standarderror) estimate for a geometric mean. If the number ofindices is Tand the index for each species is denoted byIt, then the geometric mean can be expressed as
�I Z exp1
T
Xt
ln It
!: (A 1)
The geometric mean is thus a nonlinear function ofthe component indices. The variance of a linearfunction of random variables can easily be expressedin terms of the (co)variances of the componentvariables but this is not so for the variance of anonlinear function. The usual approach to obtain avariance estimate for a nonlinear function is to use alinear approximation for the nonlinear function,calculate the variance of this linear approximation
Phil. Trans. R. Soc. B (2005)
and then use this variance as an approximation for thevariance of the original nonlinear function. If thecomponent variables can be assumed to be indepen-dent, as is the case for the species indices It, thistechnique (Taylor linearization or delta method, seee.g. Agresti 1990, chapter 12) yields a varianceapproximation of the form
varð �IÞzXt
ðv �I=vItÞ2varðItÞ; (A 2)
where v �I=vIt is the derivative of the geometric meanwith respect to the index It. Since this derivative is givenby �I=TIt, the variance approximation for �I can beexpressed as:
varð �IÞz�I
T
� �2Xt
varðItÞ
I2t
� �: (A 3)
Now, an estimate of the variance (and standarderror) of the geometric mean of the species indices canbe obtained from (A 3) by plugging in estimates of thevariances of the species indices It.
REFERENCESAebischer, N. J., Evans, A. D., Grice, P. V. & Vickery, J. A.
2000a Ecology and conservation of lowland farmland birds.Tring, UK: British Ornithologists Union.
Aebischer, N. J., Green, R. E. & Evans, A. D. 2000b Fromscience to recovery: four case studies of how research hasbeen translated into conservation action in the UK. InEcology and conservation of lowland farmland birds (ed. N. J.Aebischer, A. D. Evans, P. V. Grice & J. A. Vickery), pp.43–54. Tring, UK: British Ornithologists Union.
Agresti, A. 1990 Categorical data analysis. New York: JohnWiley.
Alford, A. P., Dixon, R. M. & Pechmann, J. H. K. 2001Global amphibian declines. Nature 412, 499–500.
Anon. 2002 Achieving a better quality of life: review of progresstowards sustainable development. London: Department forthe Environment, Food & Rural Affairs http://www.defra.gov.uk/environment/statistics/wildlife.
Balmford, A. 2002 Selecting sites for conservation. InConserving bird biodiversity: general principles and theirapplication (ed. K. Norris & D. J. Pain), pp. 74–104.Cambridge University Press.
Balmford, A., Green, R. E. & Jenkins, M. 2003 Measuringthe changing state of nature. Trends Ecol. Evol. 18,326–330.
Balmford, A. et al. 2005 The convention on biologicaldiversity’s 2010 target. Science 307, 212–213.
Benton, T. G., Bryant, D. M., Cole, L. & Crick, H. Q. P.2002 Linking agricultural practice to insect and birdpopulations: a historical study over three decades. J. Appl.Ecol. 39, 673–687.
Bibby, C. J. 1999 Making the most of birds as environmentalindicators. Ostrich 70, 81–88.
Bibby, C. J., Burgess, N. D., Hill, D. A. & Mustoe, S. 2000Birds census techniques, 2nd edn. London: Academic Press.
BirdLife International/European Bird Census Council 2000European bird populations: estimates and trends. BirdLifeConservation Series No. 10. Cambridge: BirdLifeInternational.
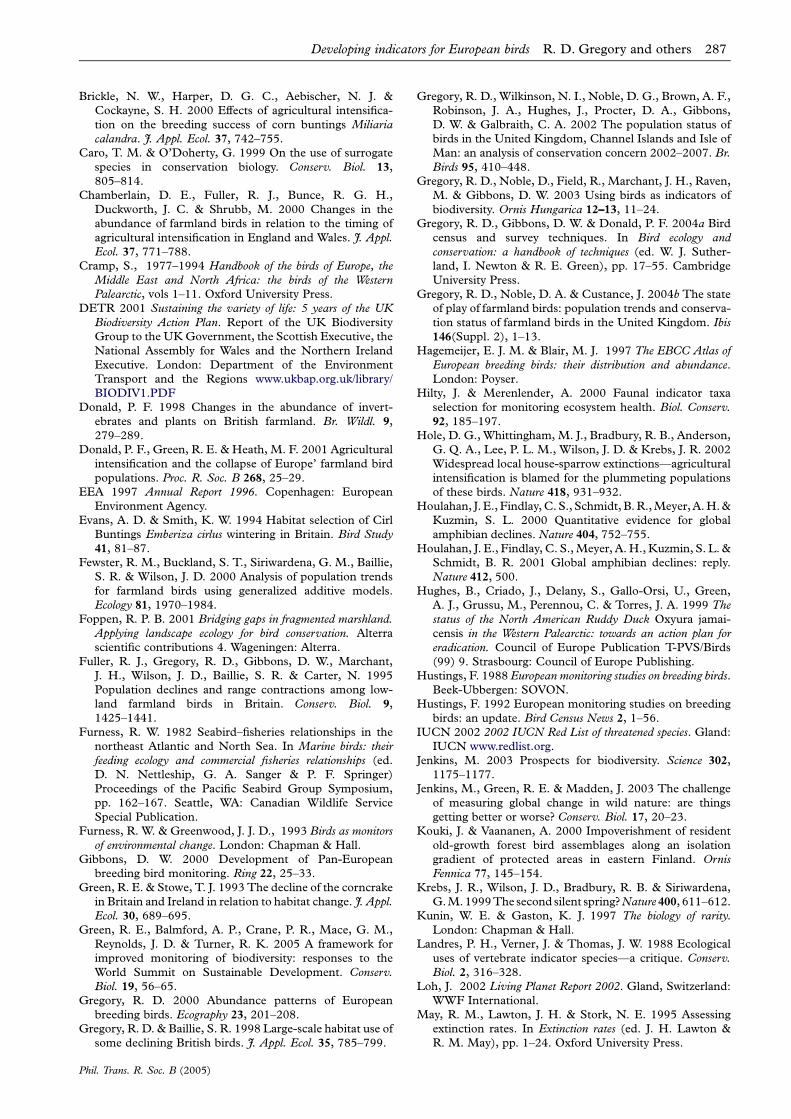
Developing indicators for European birds R. D. Gregory and others 287
Brickle, N. W., Harper, D. G. C., Aebischer, N. J. &
Cockayne, S. H. 2000 Effects of agricultural intensifica-
tion on the breeding success of corn buntings Miliariacalandra. J. Appl. Ecol. 37, 742–755.
Caro, T. M. & O’Doherty, G. 1999 On the use of surrogate
species in conservation biology. Conserv. Biol. 13,
805–814.
Chamberlain, D. E., Fuller, R. J., Bunce, R. G. H.,
Duckworth, J. C. & Shrubb, M. 2000 Changes in the
abundance of farmland birds in relation to the timing of
agricultural intensification in England and Wales. J. Appl.Ecol. 37, 771–788.
Cramp, S., 1977–1994 Handbook of the birds of Europe, the
Middle East and North Africa: the birds of the WesternPalearctic, vols 1–11. Oxford University Press.
DETR 2001 Sustaining the variety of life: 5 years of the UK
Biodiversity Action Plan. Report of the UK Biodiversity
Group to the UK Government, the Scottish Executive, the
National Assembly for Wales and the Northern Ireland
Executive. London: Department of the Environment
Transport and the Regions www.ukbap.org.uk/library/
BIODIV1.PDF
Donald, P. F. 1998 Changes in the abundance of invert-
ebrates and plants on British farmland. Br. Wildl. 9,
279–289.
Donald, P. F., Green, R. E. & Heath, M. F. 2001 Agricultural
intensification and the collapse of Europe’ farmland bird
populations. Proc. R. Soc. B 268, 25–29.
EEA 1997 Annual Report 1996. Copenhagen: European
Environment Agency.
Evans, A. D. & Smith, K. W. 1994 Habitat selection of Cirl
Buntings Emberiza cirlus wintering in Britain. Bird Study
41, 81–87.
Fewster, R. M., Buckland, S. T., Siriwardena, G. M., Baillie,
S. R. & Wilson, J. D. 2000 Analysis of population trends
for farmland birds using generalized additive models.
Ecology 81, 1970–1984.
Foppen, R. P. B. 2001 Bridging gaps in fragmented marshland.
Applying landscape ecology for bird conservation. Alterra
scientific contributions 4. Wageningen: Alterra.
Fuller, R. J., Gregory, R. D., Gibbons, D. W., Marchant,
J. H., Wilson, J. D., Baillie, S. R. & Carter, N. 1995
Population declines and range contractions among low-
land farmland birds in Britain. Conserv. Biol. 9,
1425–1441.
Furness, R. W. 1982 Seabird–fisheries relationships in the
northeast Atlantic and North Sea. In Marine birds: theirfeeding ecology and commercial fisheries relationships (ed.
D. N. Nettleship, G. A. Sanger & P. F. Springer)
Proceedings of the Pacific Seabird Group Symposium,
pp. 162–167. Seattle, WA: Canadian Wildlife Service
Special Publication.
Furness, R. W. & Greenwood, J. J. D., 1993 Birds as monitors
of environmental change. London: Chapman & Hall.
Gibbons, D. W. 2000 Development of Pan-European
breeding bird monitoring. Ring 22, 25–33.
Green, R. E. & Stowe, T. J. 1993 The decline of the corncrake
in Britain and Ireland in relation to habitat change. J. Appl.Ecol. 30, 689–695.
Green, R. E., Balmford, A. P., Crane, P. R., Mace, G. M.,
Reynolds, J. D. & Turner, R. K. 2005 A framework for
improved monitoring of biodiversity: responses to the
World Summit on Sustainable Development. Conserv.Biol. 19, 56–65.
Gregory, R. D. 2000 Abundance patterns of European
breeding birds. Ecography 23, 201–208.
Gregory, R. D. & Baillie, S. R. 1998 Large-scale habitat use of
some declining British birds. J. Appl. Ecol. 35, 785–799.
Phil. Trans. R. Soc. B (2005)
Gregory, R. D., Wilkinson, N. I., Noble, D. G., Brown, A. F.,
Robinson, J. A., Hughes, J., Procter, D. A., Gibbons,
D. W. & Galbraith, C. A. 2002 The population status of
birds in the United Kingdom, Channel Islands and Isle of
Man: an analysis of conservation concern 2002–2007. Br.
Birds 95, 410–448.
Gregory, R. D., Noble, D., Field, R., Marchant, J. H., Raven,
M. & Gibbons, D. W. 2003 Using birds as indicators of
biodiversity. Ornis Hungarica 12–13, 11–24.
Gregory, R. D., Gibbons, D. W. & Donald, P. F. 2004a Bird
census and survey techniques. In Bird ecology and
conservation: a handbook of techniques (ed. W. J. Suther-
land, I. Newton & R. E. Green), pp. 17–55. Cambridge
University Press.
Gregory, R. D., Noble, D. A. & Custance, J. 2004b The state
of play of farmland birds: population trends and conserva-
tion status of farmland birds in the United Kingdom. Ibis
146(Suppl. 2), 1–13.
Hagemeijer, E. J. M. & Blair, M. J. 1997 The EBCC Atlas of
European breeding birds: their distribution and abundance.
London: Poyser.
Hilty, J. & Merenlender, A. 2000 Faunal indicator taxa
selection for monitoring ecosystem health. Biol. Conserv.
92, 185–197.
Hole, D. G., Whittingham, M. J., Bradbury, R. B., Anderson,
G. Q. A., Lee, P. L. M., Wilson, J. D. & Krebs, J. R. 2002
Widespread local house-sparrow extinctions—agricultural
intensification is blamed for the plummeting populations
of these birds. Nature 418, 931–932.
Houlahan, J. E., Findlay, C. S., Schmidt, B. R., Meyer, A. H. &
Kuzmin, S. L. 2000 Quantitative evidence for global
amphibian declines. Nature 404, 752–755.
Houlahan, J. E., Findlay, C. S., Meyer, A. H., Kuzmin, S. L. &
Schmidt, B. R. 2001 Global amphibian declines: reply.
Nature 412, 500.
Hughes, B., Criado, J., Delany, S., Gallo-Orsi, U., Green,
A. J., Grussu, M., Perennou, C. & Torres, J. A. 1999 The
status of the North American Ruddy Duck Oxyura jamai-
censis in the Western Palearctic: towards an action plan foreradication. Council of Europe Publication T-PVS/Birds
(99) 9. Strasbourg: Council of Europe Publishing.
Hustings, F. 1988 European monitoring studies on breeding birds.Beek-Ubbergen: SOVON.
Hustings, F. 1992 European monitoring studies on breeding
birds: an update. Bird Census News 2, 1–56.
IUCN 2002 2002 IUCN Red List of threatened species. Gland:
IUCN www.redlist.org.
Jenkins, M. 2003 Prospects for biodiversity. Science 302,
1175–1177.
Jenkins, M., Green, R. E. & Madden, J. 2003 The challenge
of measuring global change in wild nature: are things
getting better or worse? Conserv. Biol. 17, 20–23.
Kouki, J. & Vaananen, A. 2000 Impoverishment of resident
old-growth forest bird assemblages along an isolation
gradient of protected areas in eastern Finland. Ornis
Fennica 77, 145–154.
Krebs, J. R., Wilson, J. D., Bradbury, R. B. & Siriwardena,
G.M. 1999 The second silent spring?Nature400, 611–612.
Kunin, W. E. & Gaston, K. J. 1997 The biology of rarity.
London: Chapman & Hall.
Landres, P. H., Verner, J. & Thomas, J. W. 1988 Ecological
uses of vertebrate indicator species—a critique. Conserv.
Biol. 2, 316–328.
Loh, J. 2002 Living Planet Report 2002. Gland, Switzerland:
WWF International.
May, R. M., Lawton, J. H. & Stork, N. E. 1995 Assessing
extinction rates. In Extinction rates (ed. J. H. Lawton &
R. M. May), pp. 1–24. Oxford University Press.
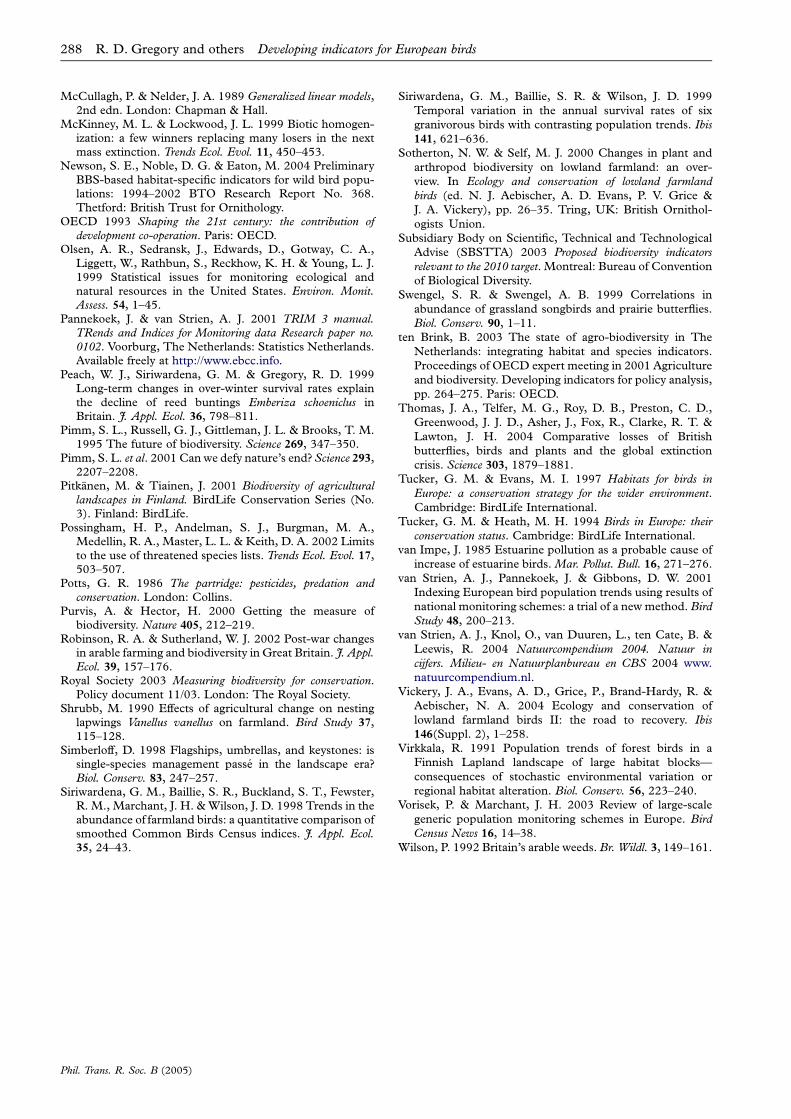
288 R. D. Gregory and others Developing indicators for European birds
McCullagh, P. & Nelder, J. A. 1989 Generalized linear models,2nd edn. London: Chapman & Hall.
McKinney, M. L. & Lockwood, J. L. 1999 Biotic homogen-ization: a few winners replacing many losers in the nextmass extinction. Trends Ecol. Evol. 11, 450–453.
Newson, S. E., Noble, D. G. & Eaton, M. 2004 PreliminaryBBS-based habitat-specific indicators for wild bird popu-lations: 1994–2002 BTO Research Report No. 368.Thetford: British Trust for Ornithology.
OECD 1993 Shaping the 21st century: the contribution ofdevelopment co-operation. Paris: OECD.
Olsen, A. R., Sedransk, J., Edwards, D., Gotway, C. A.,Liggett, W., Rathbun, S., Reckhow, K. H. & Young, L. J.1999 Statistical issues for monitoring ecological andnatural resources in the United States. Environ. Monit.Assess. 54, 1–45.
Pannekoek, J. & van Strien, A. J. 2001 TRIM 3 manual.TRends and Indices for Monitoring data Research paper no.0102. Voorburg, The Netherlands: Statistics Netherlands.Available freely at http://www.ebcc.info.
Peach, W. J., Siriwardena, G. M. & Gregory, R. D. 1999Long-term changes in over-winter survival rates explainthe decline of reed buntings Emberiza schoeniclus inBritain. J. Appl. Ecol. 36, 798–811.
Pimm, S. L., Russell, G. J., Gittleman, J. L. & Brooks, T. M.1995 The future of biodiversity. Science 269, 347–350.
Pimm, S. L. et al. 2001 Can we defy nature’s end? Science 293,2207–2208.
Pitkanen, M. & Tiainen, J. 2001 Biodiversity of agriculturallandscapes in Finland. BirdLife Conservation Series (No.3). Finland: BirdLife.
Possingham, H. P., Andelman, S. J., Burgman, M. A.,Medellin, R. A., Master, L. L. & Keith, D. A. 2002 Limitsto the use of threatened species lists. Trends Ecol. Evol. 17,503–507.
Potts, G. R. 1986 The partridge: pesticides, predation andconservation. London: Collins.
Purvis, A. & Hector, H. 2000 Getting the measure ofbiodiversity. Nature 405, 212–219.
Robinson, R. A. & Sutherland, W. J. 2002 Post-war changesin arable farming and biodiversity in Great Britain. J. Appl.Ecol. 39, 157–176.
Royal Society 2003 Measuring biodiversity for conservation.Policy document 11/03. London: The Royal Society.
Shrubb, M. 1990 Effects of agricultural change on nestinglapwings Vanellus vanellus on farmland. Bird Study 37,115–128.
Simberloff, D. 1998 Flagships, umbrellas, and keystones: issingle-species management passe in the landscape era?Biol. Conserv. 83, 247–257.
Siriwardena, G. M., Baillie, S. R., Buckland, S. T., Fewster,R. M., Marchant, J. H. & Wilson, J. D. 1998 Trends in theabundance of farmland birds: a quantitative comparison ofsmoothed Common Birds Census indices. J. Appl. Ecol.35, 24–43.
Phil. Trans. R. Soc. B (2005)
Siriwardena, G. M., Baillie, S. R. & Wilson, J. D. 1999
Temporal variation in the annual survival rates of six
granivorous birds with contrasting population trends. Ibis
141, 621–636.
Sotherton, N. W. & Self, M. J. 2000 Changes in plant and
arthropod biodiversity on lowland farmland: an over-
view. In Ecology and conservation of lowland farmland
birds (ed. N. J. Aebischer, A. D. Evans, P. V. Grice &
J. A. Vickery), pp. 26–35. Tring, UK: British Ornithol-
ogists Union.
Subsidiary Body on Scientific, Technical and Technological
Advise (SBSTTA) 2003 Proposed biodiversity indicators
relevant to the 2010 target. Montreal: Bureau of Convention
of Biological Diversity.
Swengel, S. R. & Swengel, A. B. 1999 Correlations in
abundance of grassland songbirds and prairie butterflies.
Biol. Conserv. 90, 1–11.
ten Brink, B. 2003 The state of agro-biodiversity in The
Netherlands: integrating habitat and species indicators.
Proceedings of OECD expert meeting in 2001 Agriculture
and biodiversity. Developing indicators for policy analysis,
pp. 264–275. Paris: OECD.
Thomas, J. A., Telfer, M. G., Roy, D. B., Preston, C. D.,
Greenwood, J. J. D., Asher, J., Fox, R., Clarke, R. T. &
Lawton, J. H. 2004 Comparative losses of British
butterflies, birds and plants and the global extinction
crisis. Science 303, 1879–1881.
Tucker, G. M. & Evans, M. I. 1997 Habitats for birds in
Europe: a conservation strategy for the wider environment.
Cambridge: BirdLife International.
Tucker, G. M. & Heath, M. H. 1994 Birds in Europe: their
conservation status. Cambridge: BirdLife International.
van Impe, J. 1985 Estuarine pollution as a probable cause of
increase of estuarine birds. Mar. Pollut. Bull. 16, 271–276.
van Strien, A. J., Pannekoek, J. & Gibbons, D. W. 2001
Indexing European bird population trends using results of
national monitoring schemes: a trial of a new method. Bird
Study 48, 200–213.
van Strien, A. J., Knol, O., van Duuren, L., ten Cate, B. &
Leewis, R. 2004 Natuurcompendium 2004. Natuur in
cijfers. Milieu- en Natuurplanbureau en CBS 2004 www.
natuurcompendium.nl.
Vickery, J. A., Evans, A. D., Grice, P., Brand-Hardy, R. &
Aebischer, N. A. 2004 Ecology and conservation of
lowland farmland birds II: the road to recovery. Ibis
146(Suppl. 2), 1–258.
Virkkala, R. 1991 Population trends of forest birds in a
Finnish Lapland landscape of large habitat blocks—
consequences of stochastic environmental variation or
regional habitat alteration. Biol. Conserv. 56, 223–240.
Vorisek, P. & Marchant, J. H. 2003 Review of large-scale
generic population monitoring schemes in Europe. Bird
Census News 16, 14–38.
Wilson, P. 1992 Britain’s arable weeds. Br. Wildl. 3, 149–161.


