Embed Size (px)
Citation preview

1
Developing the Knowledge Economy:
Trends and Indicators on
Regional Innovation-Based Development
and Science Parks in Europe
Anthony D’Andrea
ISSP Post-Doctoral Research Fellow, Project Coordinator
“Nomadic Work/Life in the Knowledge Economy”
Dept. Sociology, ISKS - University of Limerick
University of Limerick Sociology Seminar - April 14, 2010
Quoting is allowed - please cite author and sources
2
Developing the Knowledge Economy: Trends and Indicators on Regional Innovation-
Based Development and Science Parks in Europe
Anthony D’Andrea
Abstract: The knowledge economy is a key concept in the developmental agenda across
Europe and beyond. Meanwhile, due to EU supranational politics and global economy
processes, regions have emerged as another key unit of policy analysis and intervention. In
the meeting of innovation policy and cohesion policy, science parks have reemerged as a
catalyst tool for regional development, as indicated in the recent boom of science parks across
the developing world (China, India, Taiwan, Israel, Greece, etc.)
Based on EU policy reports, scholarship on science parks, and ethnographic research on
science parks in Ireland, this presentation provides an overview of the knowledge economy in
Ireland vis-à-vis the EU, and summarizes several national experiences with science parks.
The goal of this presentation is to identify the main factors and challenges affecting the
development of the knowledge economy at a regional level.
Keywords: smart economy, regional research-based clusters, regional innovation systems,
technology parks, RIPI
3
1. Knowledge economy in Ireland and EU
2. Regional development: integrating cohesion policy and innovation policy
3. Science parks: tools for regional (knowledge-based) development
4. Conclusion
Presentation Outline

4
Knowledge Economy
5
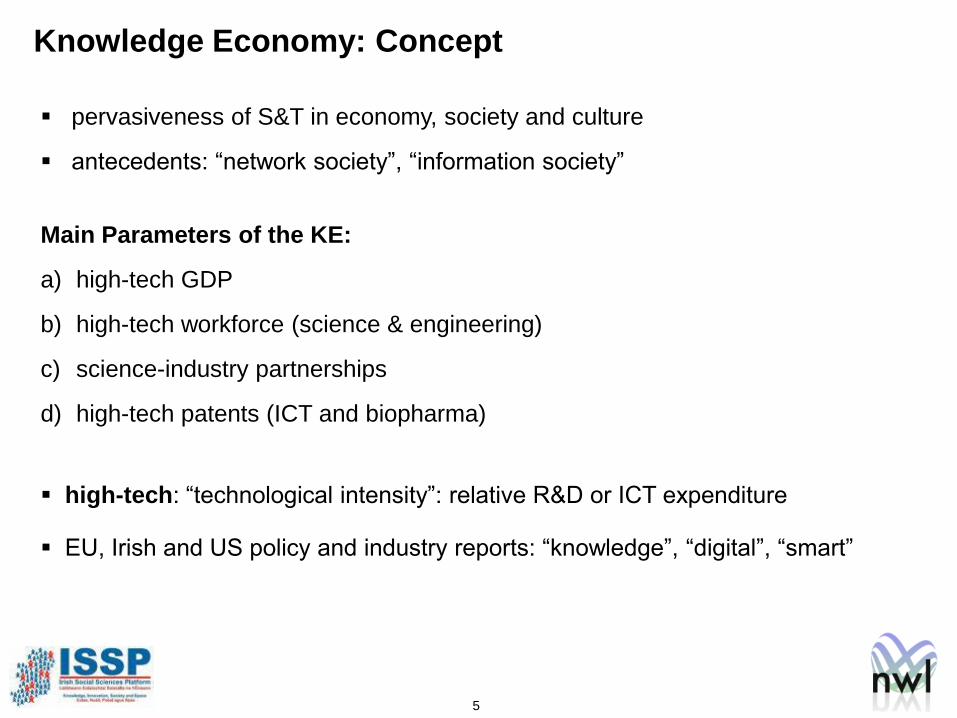
pervasiveness of S&T in economy, society and culture
antecedents: “network society”, “information society”
Main Parameters of the KE:
a) high-tech GDP
b) high-tech workforce (science & engineering)
c) science-industry partnerships
d) high-tech patents (ICT and biopharma)
high-tech: “technological intensity”: relative R&D or ICT expenditure
EU, Irish and US policy and industry reports: “knowledge”, “digital”, “smart”
Knowledge Economy: Concept
6
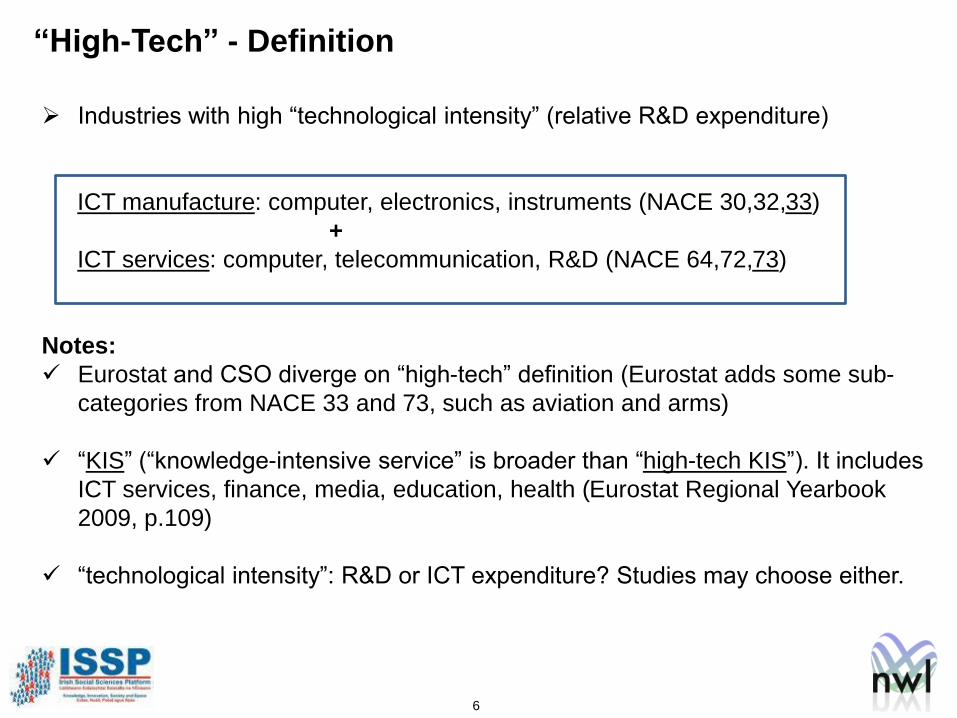
Industries with high “technological intensity” (relative R&D expenditure)
ICT manufacture: computer, electronics, instruments (NACE 30,32,33)
+
ICT services: computer, telecommunication, R&D (NACE 64,72,73)
Notes:
Eurostat and CSO diverge on “high-tech” definition (Eurostat adds some sub-
categories from NACE 33 and 73, such as aviation and arms)
“KIS” (“knowledge-intensive service” is broader than “high-tech KIS”). It includes
ICT services, finance, media, education, health (Eurostat Regional Yearbook
2009, p.109)
“technological intensity”: R&D or ICT expenditure? Studies may choose either.
“High-Tech” - Definition
7
“The Lisbon agenda is above all related to the building of a knowledge society,
in which R&D and innovation play a crucial role.”
(EU Fourth Cohesion Report, 2007, p.157)
“Europe must renew the basis of its competitiveness, (…) placing the main
emphasis on knowledge, innovation and the optimisation of human capital.”
(European Spring Council, 2005)
“Science, technology and innovation, and education, three areas of statistics
seen as key to monitoring the achievement of the goals set in the Lisbon
strategy to make Europe the most competitive and dynamic knowledge-based
economy in the world.”
(Eurostat Regional Yearbook 2009, p.10)
“turn the EU into a smart, sustainable and inclusive economy delivering high
levels of employment, productivity and social cohesion.”
(European Commission, EU 2020, Communication 3.3.2010, p.3)
Knowledge Economy in EU Policy and Discourse
8
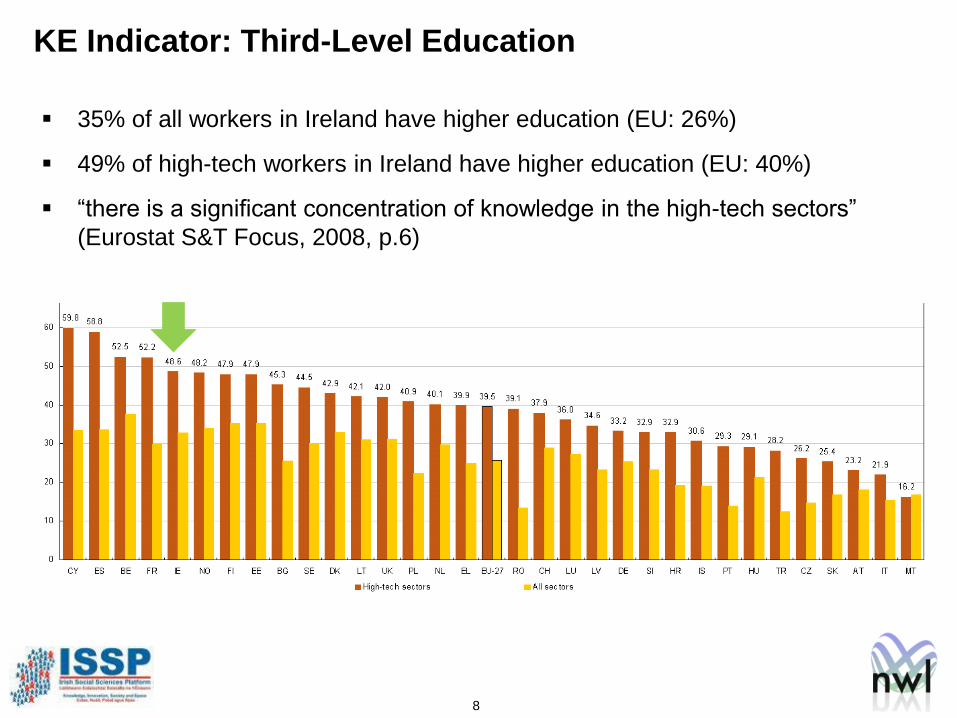
KE Indicator: Third-Level Education
35% of all workers in Ireland have higher education (EU: 26%)
49% of high-tech workers in Ireland have higher education (EU: 40%)
“there is a significant concentration of knowledge in the high-tech sectors”
(Eurostat S&T Focus, 2008, p.6)
9
57% of Irish households have internet access (2007).
54% in EU (Nederlands 82%, Sweden 79%).
54% of Irish households with internet have broadband (2007, figure doubled in
2 years). 77% in EU (Belgium and Estonia 90%).
68% of Irish firms have broadband internet (2007).
77% in EU (Finland, Spain, France, Malta over 85%)
Ireland is a top EU user of text messaging: 1060 texts/person/year.
Source: CSO, Information Society and Telecommunications 2007 Report
KE Indicator: ICT in Irish Society
10
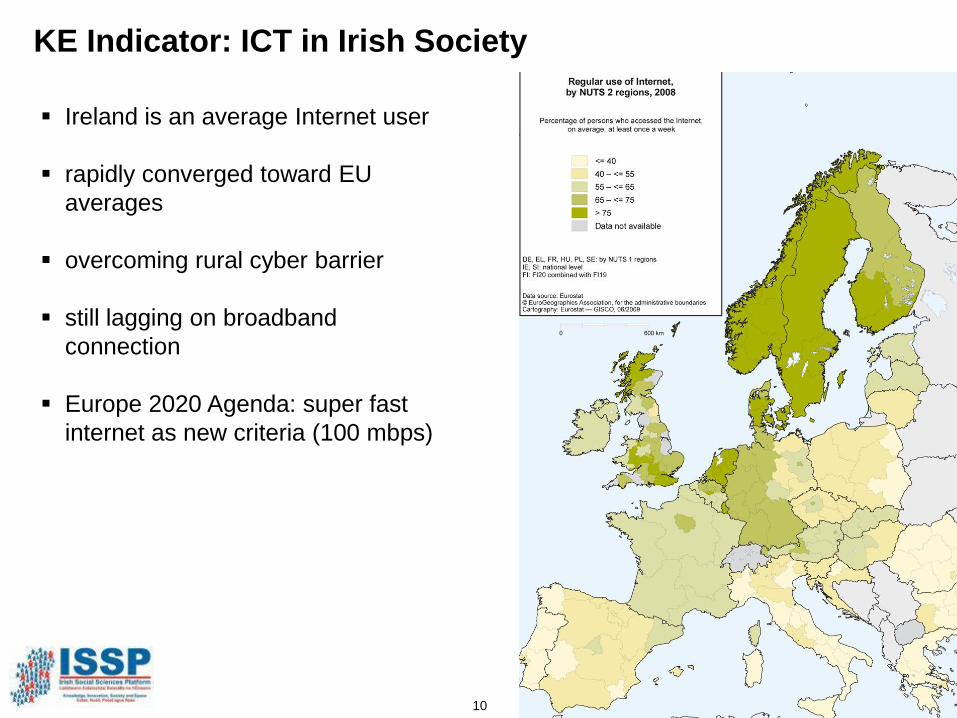
KE Indicator: ICT in Irish Society
Ireland is an average Internet user
rapidly converged toward EU
averages
overcoming rural cyber barrier
still lagging on broadband
connection
Europe 2020 Agenda: super fast
internet as new criteria (100 mbps)
11
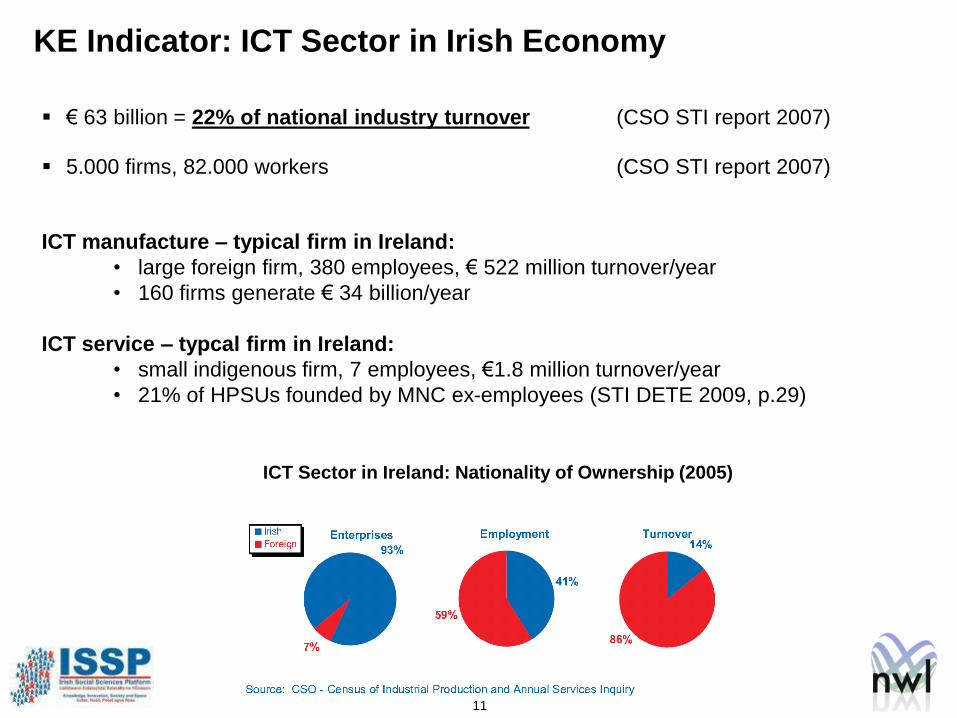
KE Indicator: ICT Sector in Irish Economy
€ 63 billion = 22% of national industry turnover (CSO STI report 2007)
5.000 firms, 82.000 workers (CSO STI report 2007)
ICT manufacture – typical firm in Ireland:
• large foreign firm, 380 employees, € 522 million turnover/year
• 160 firms generate € 34 billion/year
ICT service – typcal firm in Ireland:
• small indigenous firm, 7 employees, €1.8 million turnover/year
• 21% of HPSUs founded by MNC ex-employees (STI DETE 2009, p.29)
ICT Sector in Ireland: Nationality of Ownership (2005)
12
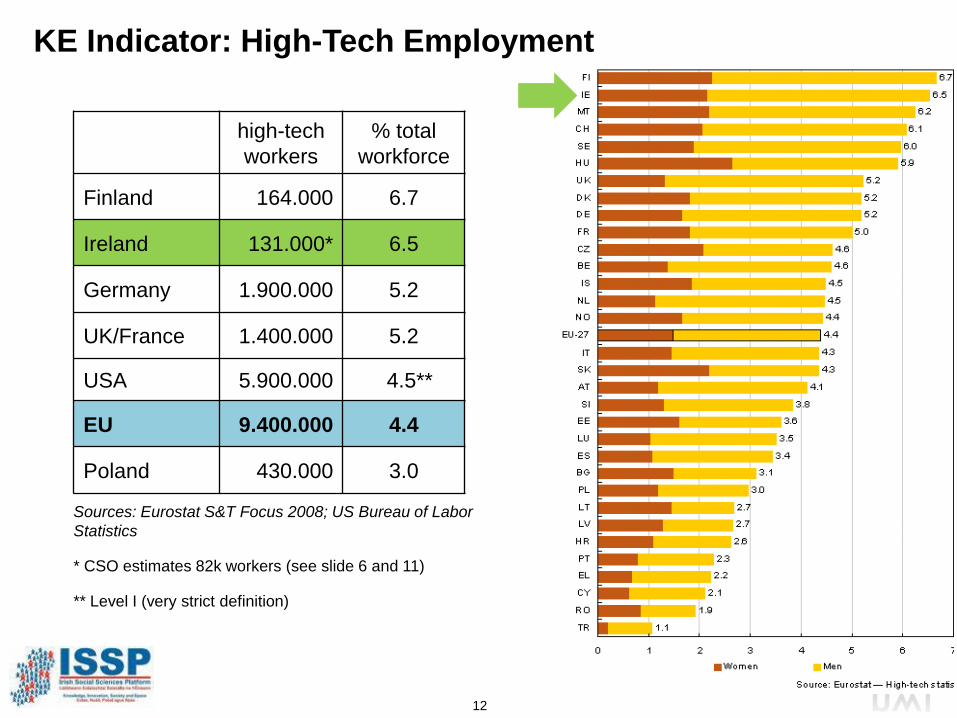
Sources: Eurostat S&T Focus 2008; US Bureau of Labor
Statistics
* CSO estimates 82k workers (see slide 6 and 11)
** Level I (very strict definition)
KE Indicator: High-Tech Employment
high-tech
workers
% total
workforce
Finland 164.000 6.7
Ireland 131.000* 6.5
Germany 1.900.000 5.2
UK/France 1.400.000 5.2
USA 5.900.000 4.5**
EU 9.400.000 4.4
Poland 430.000 3.0
13
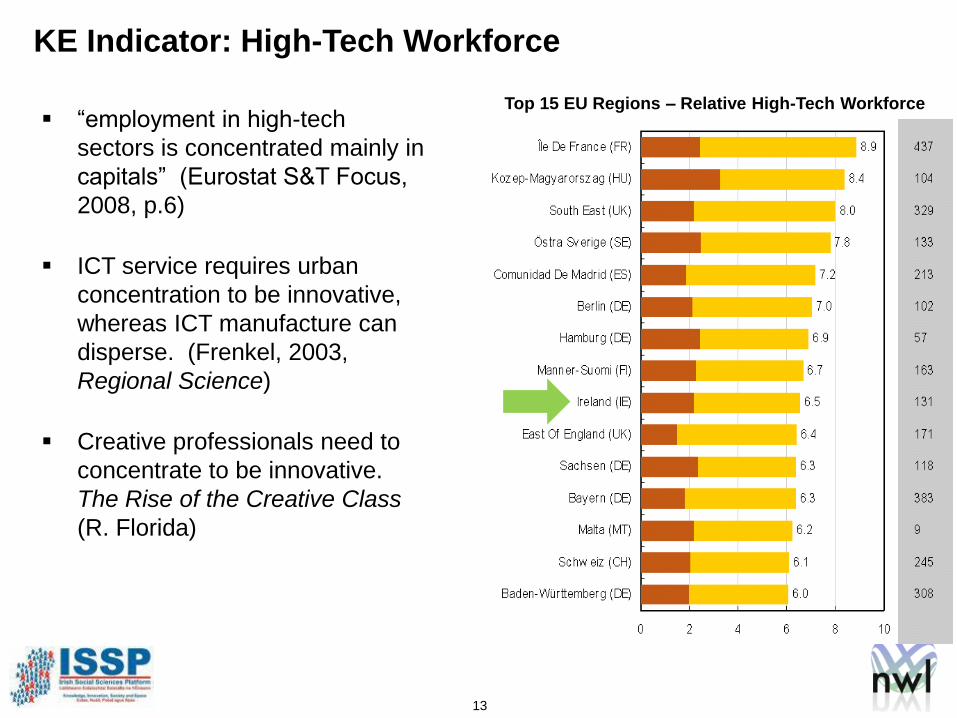
KE Indicator: High-Tech Workforce
“employment in high-tech
sectors is concentrated mainly in
capitals” (Eurostat S&T Focus,
2008, p.6)
ICT service requires urban
concentration to be innovative,
whereas ICT manufacture can
disperse. (Frenkel, 2003,
Regional Science)
Creative professionals need to
concentrate to be innovative.
The Rise of the Creative Class
(R. Florida)
Top 15 EU Regions – Relative High-Tech Workforce
14
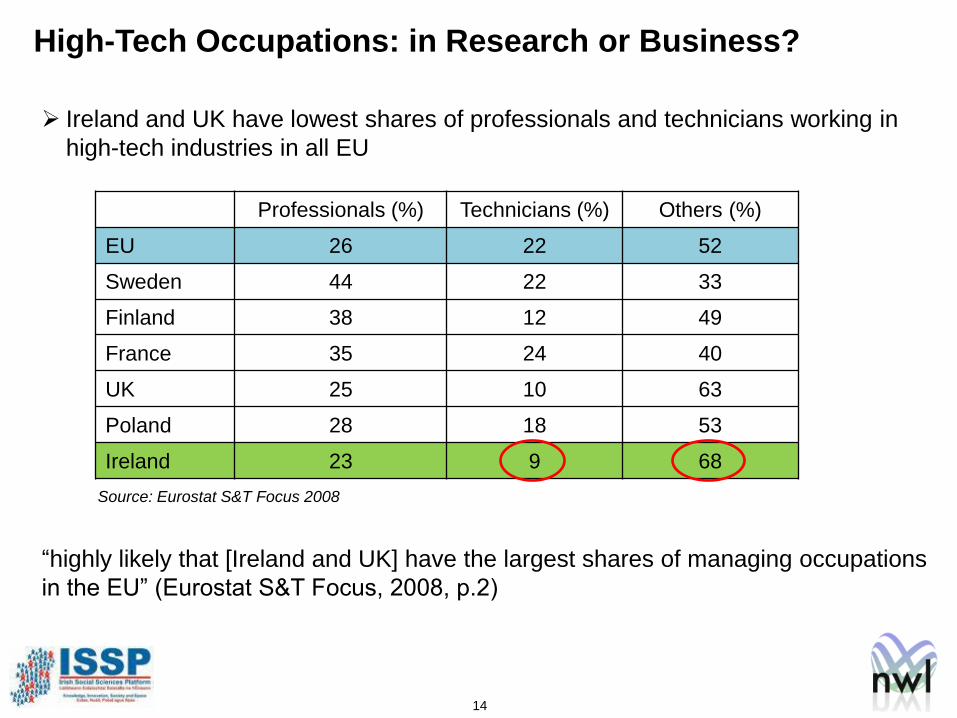
High-Tech Occupations: in Research or Business?
Professionals (%) Technicians (%) Others (%)
EU 26 22 52
Sweden 44 22 33
Finland 38 12 49
France 35 24 40
UK 25 10 63
Poland 28 18 53
Ireland 23 9 68
Ireland and UK have lowest shares of professionals and technicians working in
high-tech industries in all EU
“highly likely that [Ireland and UK] have the largest shares of managing occupations
in the EU” (Eurostat S&T Focus, 2008, p.2)
Source: Eurostat S&T Focus 2008
15
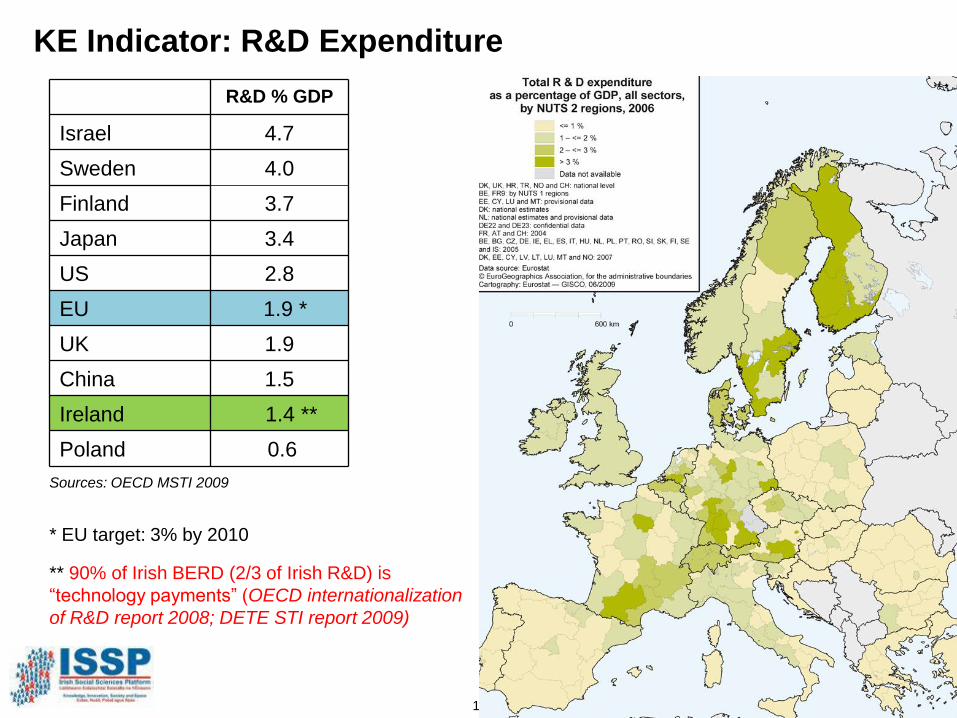
KE Indicator: R&D Expenditure
Sources: OECD MSTI 2009
* EU target: 3% by 2010
** 90% of Irish BERD (2/3 of Irish R&D) is
“technology payments” (OECD internationalization
of R&D report 2008; DETE STI report 2009)
R&D % GDP
Israel 4.7
Sweden 4.0
Finland 3.7
Japan 3.4
US 2.8
EU 1.9 *
UK 1.9
China 1.5
Ireland 1.4 **
Poland 0.6
16
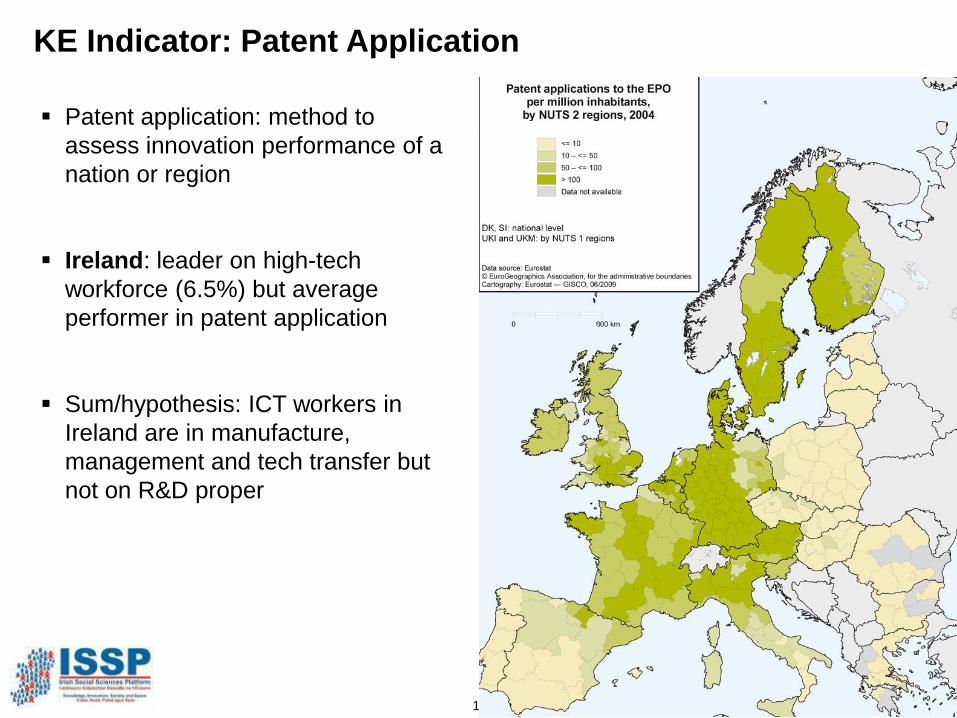
KE Indicator: Patent Application
Patent application: method to
assess innovation performance of a
nation or region
Ireland: leader on high-tech
workforce (6.5%) but average
performer in patent application
Sum/hypothesis: ICT workers in
Ireland are in manufacture,
management and tech transfer but
not on R&D proper
17
Regions
18
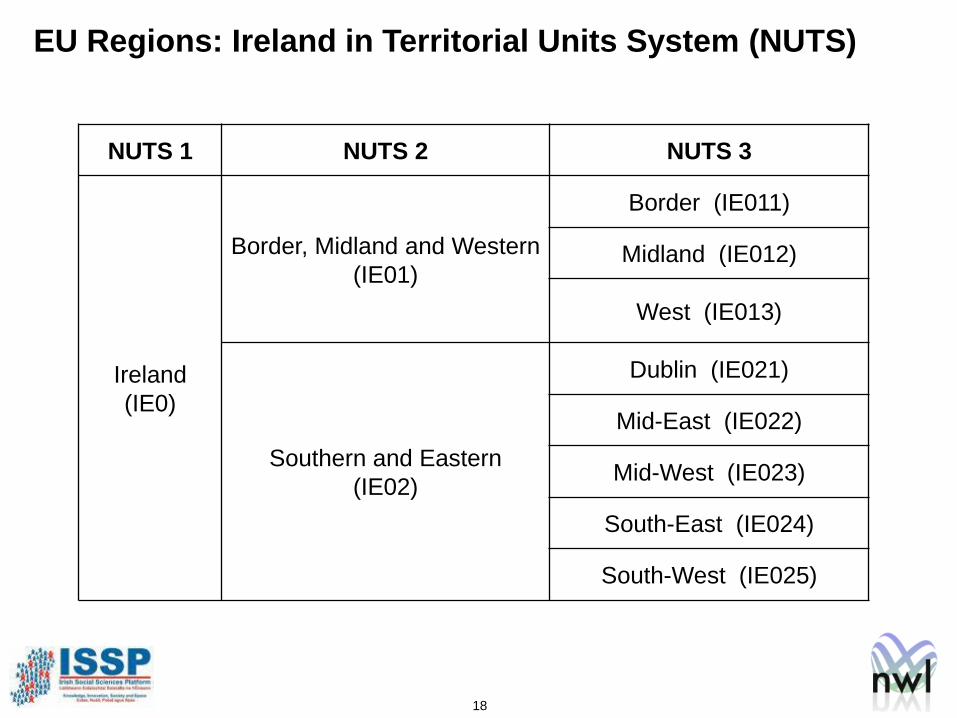
EU Regions: Ireland in Territorial Units System (NUTS)
NUTS 1 NUTS 2 NUTS 3
Ireland
(IE0)
Border, Midland and Western
(IE01)
Border (IE011)
Midland (IE012)
West (IE013)
Southern and Eastern
(IE02)
Dublin (IE021)
Mid-East (IE022)
Mid-West (IE023)
South-East (IE024)
South-West (IE025)
19
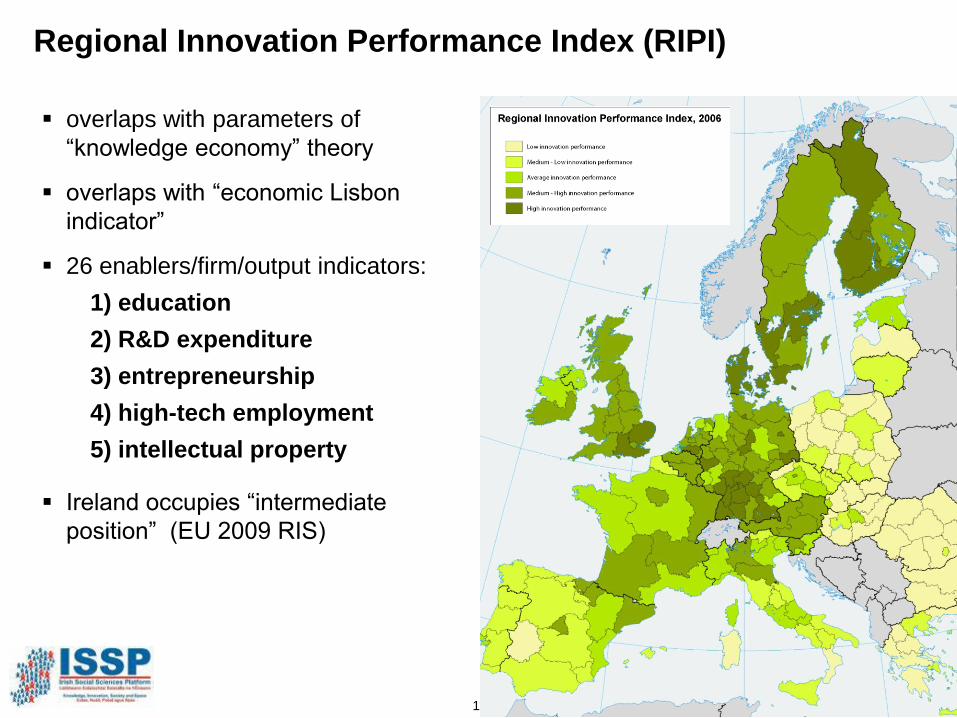
Regional Innovation Performance Index (RIPI)
overlaps with parameters of
“knowledge economy” theory
overlaps with “economic Lisbon
indicator”
26 enablers/firm/output indicators:
1) education
2) R&D expenditure
3) entrepreneurship
4) high-tech employment
5) intellectual property
Ireland occupies “intermediate
position” (EU 2009 RIS)
20
Context:
economic globalization
EU system decentralization
Regions in EU Policy:
economic growth: derives from “more weight to local level resources”
integrating Cohesion and Innovation:
• Integrating “smart” and “inclusive” growth (EU 2020 Strategy)
• “Regions should focus on the integration of R&D and innovation into regional
development strategies”
multi-level governance
Rise of Regions in the EU:
21
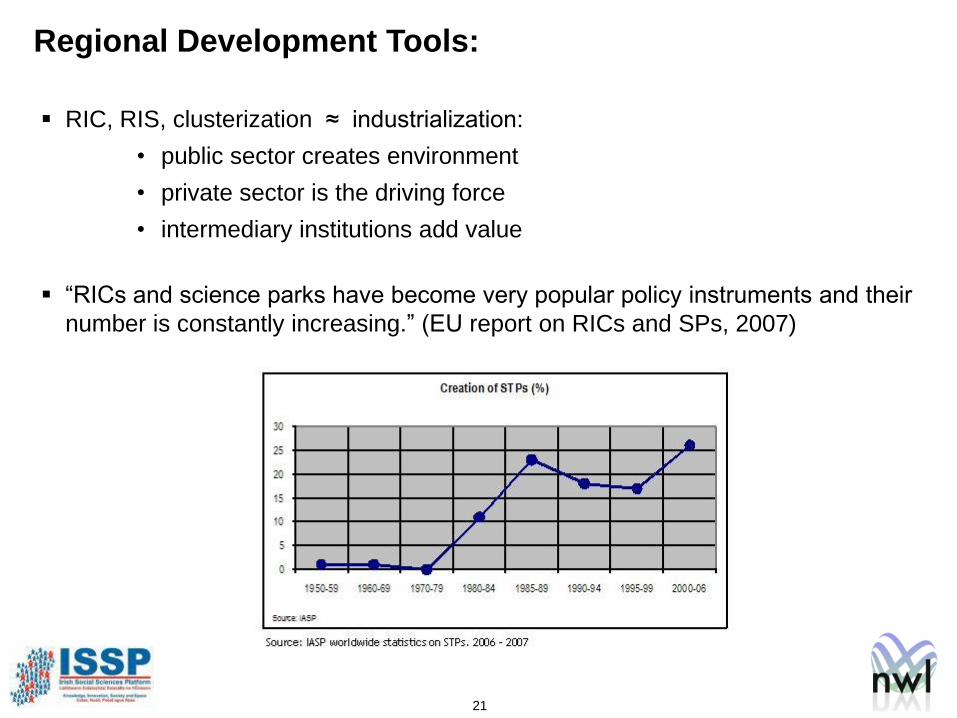
RIC, RIS, clusterization ≈ industrialization:
• public sector creates environment
• private sector is the driving force
• intermediary institutions add value
“RICs and science parks have become very popular policy instruments and their
number is constantly increasing.” (EU report on RICs and SPs, 2007)
Regional Development Tools:
22
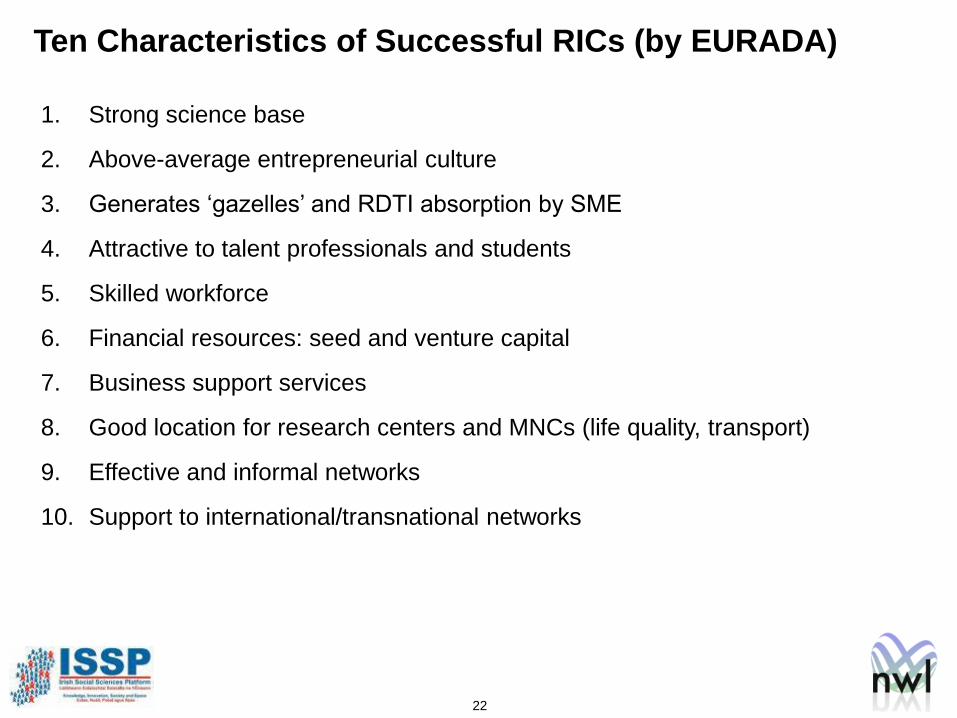
1. Strong science base
2. Above-average entrepreneurial culture
3. Generates ‘gazelles’ and RDTI absorption by SME
4. Attractive to talent professionals and students
5. Skilled workforce
6. Financial resources: seed and venture capital
7. Business support services
8. Good location for research centers and MNCs (life quality, transport)
9. Effective and informal networks
10. Support to international/transnational networks
Ten Characteristics of Successful RICs (by EURADA)
23
“Regional innovation clusters typically do not emerge in regions without science
parks.” (EU/EURADA report 2007, p.52).
terminology (misleading): “science parks” (UK), “technopoles” (France),
“technology parks” (Germany), “research parks” (USA)
“High-tech fantasy”? Lack of consensus and disappointment over SP benefits:
tangible (firm performance) vs. intangible (culture, visibility), diverse stakeholder
interests
definition (UKSPA): “business support and technology transfer initiative that…”:
• supports small businesses
• hosts international business
• links with research institutions
Science Park
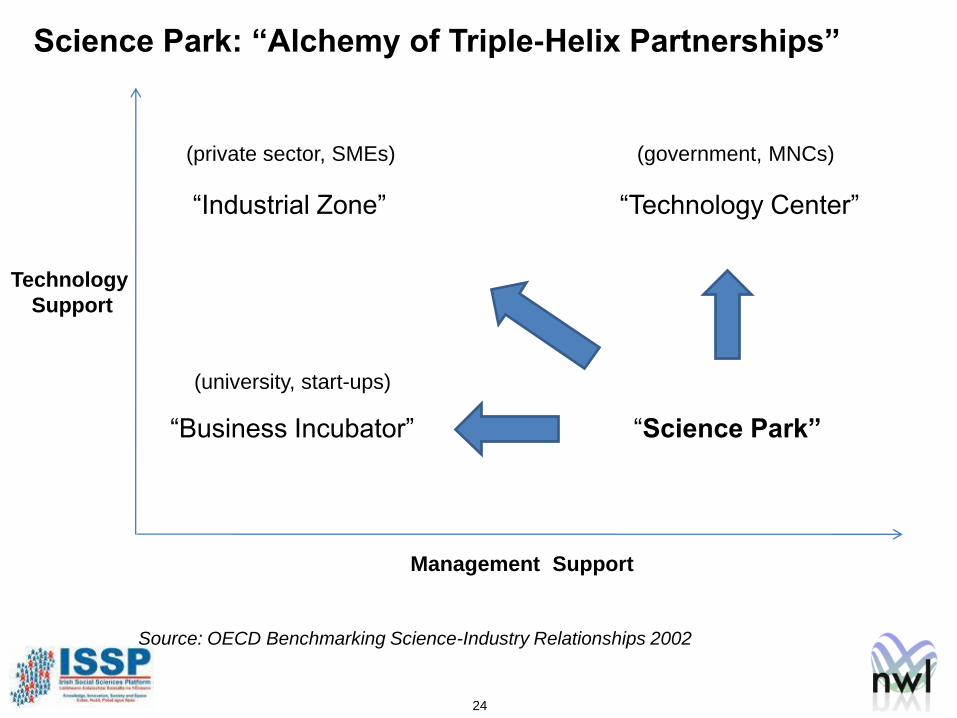
24
“Industrial Zone” “Technology Center”
Science Park: “Alchemy of Triple-Helix Partnerships”
Management Support
“Business Incubator” “Science Park”
Technology
Support
(private sector, SMEs)
(university, start-ups)
(government, MNCs)
Source: OECD Benchmarking Science-Industry Relationships 2002
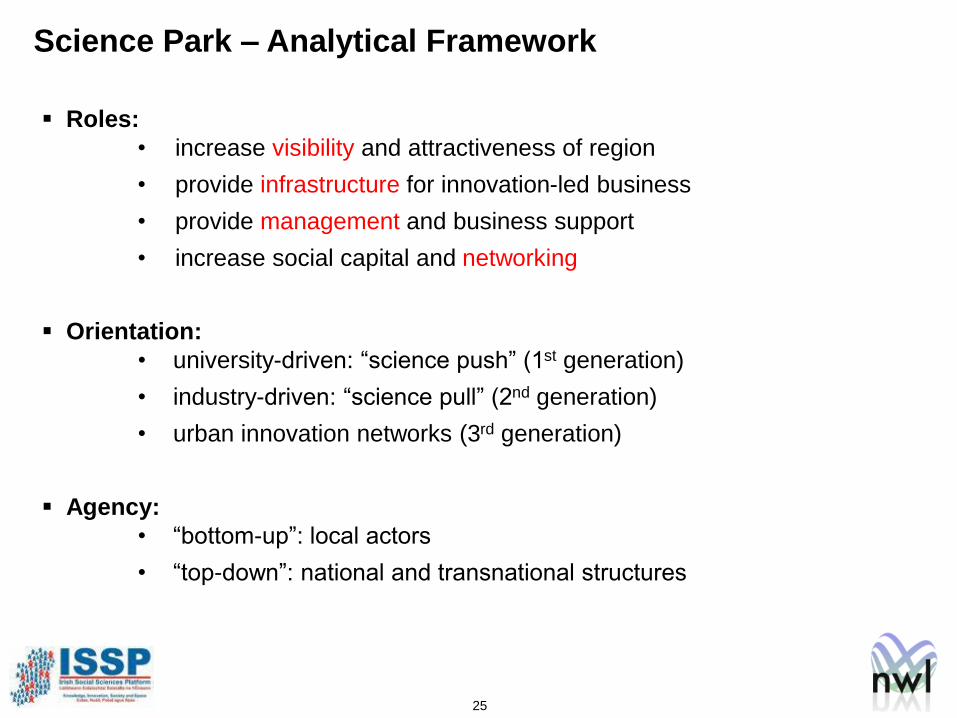
25
Roles:
• increase visibility and attractiveness of region
• provide infrastructure for innovation-led business
• provide management and business support
• increase social capital and networking
Orientation:
• university-driven: “science push” (1st generation)
• industry-driven: “science pull” (2nd generation)
• urban innovation networks (3rd generation)
Agency:
• “bottom-up”: local actors
• “top-down”: national and transnational structures
Science Park – Analytical Framework
26
Science Parks: International Cases
27
53 TPs created by central government in early 1990s
Beijing TP is the largest: 6,000 firms (vs 400 average)
TPs have slowed down regional inequalities
FDI plays a strong role in labor productivity and urban growth
Science Parks in China
28
Background: Japanese and US manufacture capital into Export Platforms
(Taiwan, S. Korea, Thailand)
Hinschu Science-Based Industrial Park (300 firms, 96.000 workers)
High level of vertical integration and internal competition: industrialization,
clusterization
Losing HR and infrastructure: investments into China: transnational connections
Science Parks in Taiwan
29
Liberalization in 1991
“Offshore Development Work” (380 MNC: TI and HP), followed by Silicon Valley
presence, and now indigenous IP rights
47 Software TPs run by Gov of India (STPI) in the 1990s: 95% of exports
Joint-venture parks between Indian MNCs and state-level governments: Int’l TP
Bangalore (Tata and Karnataka): 120 firms and 19,000 workers
Next target: to couple IT and biotech in 25 new Bio-IT parks
Science Parks in India
30
Background:
military industry: commercialization
scientific diaspora: Russian immigration
Focus: development of indigenous R&D-intensive ICT industries
Regional decentralization is costly due to urban nature of ICT service innovation
SP are small, associated with research-intensive universities and MNC high-tech
service applications
Science Parks in Israel
31
Mjardevi SP: largest SP (170 firms, 4500 workers), founded in 1983 by
municipality, connected with University of Linkoping
Background:
National military industry: SAAB and diversification in 1970s
Swedish MNC presence: Erickson
SP as local-level initiative that responds, adapts to context: national funds,
industry modernization, research decentralization
SP takes on the partnership between MNC and university (passive role)
dot.com bust unemployment: reabsoption of research staff (Nokia) vs
redundancy of manufacturing staff (Erikson)
Science Parks in Sweden
32
“SP in peripheral European country”
3 SPs: State-run and funded, connected with local universities
Limited links between SP-university-firms: little formal links, some informal links,
no inter-firm links
Limited research and innovation developments
Absence: foreign capital, critical mass, firm competition/market
Science Parks in Greece
33
Conclusions
34
Despite its ICT sector, Ireland is an average KE performer: internet, R&D,
patent
SPs re-emerge as key tool of regional development in peripheral economies
SPs are overestimated: “inconclusive” and “disappointing” results; they affect
but also reflect wider contexts/ conditions (national policy and international
capital)
SPs are more effective under strong national policy and FDI presence
“Entrepreneurial university”? Universities have played important but passive
role in regional development. Aligning “research foci” with “regional priorities”
SP function: partnering university and business. Firms with university links and
shorter time-to-market rates enjoy higher survival rate
SPs operational challenge: to assist firms to internationalize
Conclusion: