Embed Size (px)
Citation preview
DETERMINANTS OF FINANCIAL PERFORMANCE OF SMALL AND
MEDIUM SIZED ENTERPRISES IN TOURISM SECTOR IN MOMBASA
COUNTY AND ENVIRONS, KENYA
GEORGE OYUGI ONYIEGO
DOCTOR OF PHILOSOPHY
(Business Administration (Finance Option)
JOMO KENYATTA UNIVERSITY OF
AGRICULTURE AND TECHNOLOGY
2019

i
Determinants of financial performance of small and medium
sized enterprises in tourism sector in Mombasa county and
environs, Kenya
George Oyugi Onyiego
A thesis submitted in partial fulfilment for the award of the
degree of Doctor of Philosophy in Business Administration
(Finance option) in the Jomo Kenyatta University of
Agriculture and technology
2019
ii
DECLARATION
This thesis is my original work and has not been presented for award of a degree in any
other University.
Signature……………………………………………. Date…………………………
George Oyugi Onyiego
This thesis has been submitted for examination with our approval as the University
Supervisors.
Signature……………………………………………. Date…………………………
Prof Gregory Simiyu Namusonge, PhD.
JKUAT Kenya
Signature……………………………………………. Date…………………………
Dr Esther Waiganjo, PhD,
JKUAT Kenya
iii
DEDICATION
This thesis is dedicated to my dear mother Monayo, ; late father Onyiego and wife
Gesia, who cherished education so much, children Makoyo,Nyambune,Kemunto,Kerubo
and Mokeira, brothers Prof Mochoge, Gechuru, Makini and friends. Their valuable
encouragement and support morally and otherwise was instrumental in completing of
this research. I appreciate them all.

iv
ACKNOWLEDGEMENT
I wish to say thanks and appreciate my first supervisor Prof Gregory Simiyu Namusonge
who’s tireless and valuable guidance, suggestions, corrections, constructive criticisms,
encouragement and determination to keep me to schedule while writing this thesis is
most appreciated. I would also like to thank Dr Esther Waiganjo co-supervisor who
supported this research intellectually; resourcefully with passion and linking with my
main supervisor has immensely contributed to the success of this research. God bless
them abundantly.
Let me register my further appreciation and many thanks to my mother at her old age
always gave a word of encouragement and also to my brothers especially Professor
Benson mochoge PhD for their contributions and encouragement to ensure am through
with this research. To my lovely wife Gesiah, your encouragement and support is well
appreciated and also to my children who stood for me and always appreciated my going
to class even after retirement, University staff and colleagues whose contributions was
of immense help. Also many thanks go to those whose help and guidance contributed to
the success of this research, although I would not name them one by one, thanks and
may God bless you all.
v
TABLE OF CONTENT
DECLARATION ............................................................................................................. II
DEDICATION ............................................................................................................... III
ACKNOWLEDGEMENT ............................................................................................ IV
TABLE OF CONTENT .................................................................................................. V
LIST OF TABLES .......................................................................................................... X
LIST OF FIGURES ................................................................................................... XIII
LIST OFABBREVIATIONS AND ACRONYMS .................................................... XV
DEFINITION OF TERMS ....................................................................................... XVII
ABSTRACT .................................................................................................................. XX
CHAPTER ONE .............................................................................................................. 1
INTRODUCTION ............................................................................................................ 1
1.1 Background to the study........................................................................................... 1
1.1.2 Profile of tourism in Kenya ............................................................................... 13
1.2 Statement of the Problem ....................................................................................... 14
1.3 Objectives of the study ........................................................................................... 17
1.3.2 Specific objectives .......................................................................................... 17
1.4 Hypotheses of the study ......................................................................................... 17
1.5 Significance of the study ........................................................................................ 18
1.6 Scope of the study .................................................................................................. 19
1.7 Limitations ............................................................................................................. 20
CHAPTER TWO ........................................................................................................... 21
LITERATURE REVIEW .............................................................................................. 21
2.1 Introduction ............................................................................................................ 21
vi
2.2 Theoretical Framework .......................................................................................... 22
2.2.1 Modigliani and Miller Theory ............................................................................. 22
2.2.2 The pecking order theory ................................................................................ 23
2.2.3 Modern portfolio theory (MPT) ...................................................................... 25
2.2.4 Agency theory ................................................................................................. 26
2.2.5 Trade off theory ............................................................................................... 28
2.3 Conceptual framework ........................................................................................... 29
2.4 Review of Variables ............................................................................................... 31
2.4.1 Financial performance ..................................................................................... 31
2.4.2 Debt finance .................................................................................................... 33
2.4.3 Cost of debt ..................................................................................................... 36
2.4.4 Investment decisions ...................................................................................... 39
2.4.6 Empirical Review ............................................................................................ 44
2.6 Critique of existing literature relevant to the study ................................................ 48
2.7 Research gaps ......................................................................................................... 52
2.8 Summary ................................................................................................................ 54
CHAPTER THREE ....................................................................................................... 55
RESEARCH METHODOLOGY.................................................................................. 55
3.1 Introduction ............................................................................................................ 55
3.2 Research design ...................................................................................................... 55
3.3 Philosophy Research .............................................................................................. 56
3.4 Target Population ................................................................................................... 57
3.5 Sampling frame ...................................................................................................... 58
3.6 Sample and sampling technique ............................................................................. 58
3.6.1 Sampling technique ......................................................................................... 58
3.6.2 Sample size ...................................................................................................... 60
3.6 Data collection Instruments .................................................................................... 61
vii
3.7.1 Primary data .................................................................................................... 61
3.7.2 Secondary data ................................................................................................ 62
3.7 Data collection procedure ...................................................................................... 63
3.8 Pilot study .............................................................................................................. 63
3.8.1 Reliability ........................................................................................................ 64
3.8.2 Validity ............................................................................................................ 65
3.9 Data Analysis and presentation .............................................................................. 65
3.9.1 Multiple Regression Model ............................................................................. 66
3.9.2 Hypothesis Testing .......................................................................................... 67
3.11 Measurement of variables .................................................................................... 68
3.11.2 Debt finance. ................................................................................................. 69
3.11.3 Cost of debt ................................................................................................... 70
3.11.4 Investment decisions ..................................................................................... 70
3.11.5 Access to finance........................................................................................... 71
CHAPTER FOUR .......................................................................................................... 73
RESEARCH FINDINGS AND DISCUSSION ............................................................ 73
4.1 Introduction ............................................................................................................ 73
4.2 Response Rate ........................................................................................................ 73
4.3.1 Skewness and Kurtosis test for debt finance ................................................... 75
4.3.2 Skewness and Kurtosis test for cost of debt .................................................... 76
4.3.3 Skewness and Kurtosis tests for investment decisions ................................... 77
4. 3.4 Skewness and Kurtosis test for Access to finance ......................................... 78
4.3.5 Skewness and Kurtosis test for Financial Performance .................................. 79
4.3.6 Reliability Testing ........................................................................................... 80
4.6.1 Age .................................................................................................................. 84
4.6.3 Nature of business ........................................................................................... 87
4.6.6 Sources of Finance .......................................................................................... 90
viii
4.7 Descriptive findings for variables .......................................................................... 91
4.7.1 Financial performance of SMEs ...................................................................... 91
4.7.2 Factor analysis for financial performance ....................................................... 94
4.7.3. Financial performance component matrix ...................................................... 95
4.7.4 Factor analysis for debt finance ...................................................................... 99
4.7.5 Debt finance component matrix .................................................................... 100
4.7.6 ANOVA for debt finance .............................................................................. 101
4.7.7 Chi- square test for debt finance ................................................................... 102
4. 7.9 Chi- Square for cost of debt ......................................................................... 109
4.7.10 Factor analysis for investment decisions ..................................................... 112
4.7.11 Component matrix for investment decisions ............................................... 113
4.7 13 Chi- square for investment decisions .......................................................... 115
4.7.14 Effect of access to finance on financial performance ................................. 116
4.7.15 ANOVA for access to finance ..................................................................... 122
4.8 Model summary .................................................................................................... 123
4.8.1 Regression coefficient analysis for the study ................................................ 126
4.9 Correlation Coefficient analysis ........................................................................... 131
4.10 Hypotheses Testing ............................................................................................ 134
4.10.1 Hypothesis Testing 1 ................................................................................... 134
4.10.3 Hypothesis Testing 3 ................................................................................... 136
4.10.4 Hypothesis Testing 4 ................................................................................... 137
4.11 Secondary data analysis ..................................................................................... 138
4, 11.1 Trend curve for hotels ................................................................................ 138
4.11.2 Trend curve for restaurants. ........................................................................ 138
4.11.3 Trend curve for tour safaris ......................................................................... 138
4.12 Discussions of key results .................................................................................. 139
4.12.1 Financial performance ................................................................................. 139
4.12.2 Debt finance on financial performance ....................................................... 141
ix
4.12.3 Cost of debt on financial performance ........................................................ 143
4.12.4 Investment decision on financial performance ........................................... 146
4.12.5 Access to finance and financial performance .............................................. 148
CHAPTER FIVE .......................................................................................................... 152
SUMMARY, CONCLUSION AND RECOMMENDATIONS ................................ 152
5.1 Introduction .......................................................................................................... 152
5.2 Summary of key findings ..................................................................................... 152
5.2.1. Specific Objective 1 ..................................................................................... 152
5.2.2. Specific Objective 2 ..................................................................................... 153
5.2.3. Specific Objective 3 ..................................................................................... 154
5.2.4. Specific objective 4 ...................................................................................... 154
5.3 Conclusions .......................................................................................................... 155
5.4 Recommendations ................................................................................................ 157
5.5. Policy Recommendation ..................................................................................... 161
5.6 The theoretical consideration and contribution for the study ............................. 161
5.7 Areas of further research ..................................................................................... 162
REFERENCES ............................................................................................................. 163
APPENDICES .............................................................................................................. 201
78
…….
x
LIST OF TABLES
Table 3.1 Sample Size ..................................................................................................... 60
Table 3.2 Hypothesis Testing .......................................................................................... 68
Table 3.3: Measurement Of Variables ............................................................................ 71
Table 3.4: Likert Scale Measurement Observation And Attitude ................................... 72
Table 4.1 Response Rate ............................................................................................... 74
Table 4.2 Kolmogorov & Shapiro-Wilk Normality Test ................................................ 75
Table 4.3: Skewness And Kurtosis Test Foe Debt Finance ........................................... 76
Table 4.4 Skewness And Kurtosis Test For Cost Of Debt .............................................. 77
Table 4.5 Skewness And Kurtosis Test On Investment Decision ................................... 78
Table 4.6 Skewness And Kurtosis Test For Access To Finance ..................................... 79
Table 4.7 Skewness And Kurtosis Test For Financial Performance ............................... 80
Table 4.8 Reliability Statistics ......................................................................................... 81
Table 4.9 Factor Analysis For The Study ........................................................................ 82
Table 4.10 Multicollinearity ............................................................................................ 84
Table 4.11 Age ................................................................................................................ 85
Table 4.12 Level Of Education ........................................................................................ 87
Table 4.13 Nature Of Business ........................................................................................ 88
Table 4.14 Length Of Operation...................................................................................... 89
Table 4.15 Borrowing Frequency .................................................................................... 90
Table 4.16 Sources Of Finance ........................................................................................ 91
Table 4. 17. Financial Performance Of Smes .................................................................. 92
Table 4.18 Factor Analysis For Financial Performance .................................................. 95
Table 4.19 Financial Performance Component Matrix ................................................... 96
Table 4.20 Effect Of Debt Finance On Financial Performance ...................................... 97
Table 4.21 Factor Analysis For Debt Finance ............................................................... 100
Table 4.22 Debt Finance Component Matrix ................................................................ 101
xi
Table 4.23 Anova For Debt Finance ............................................................................. 102
Table 4.24 Chi- Square Test For Debt Finance ............................................................ 103
Table 4.25 Effect Of Cost Of Debt On Financial Performance Of Smes...................... 104
Table 4.26 Factor Analyses For Cost Of Debt .............................................................. 105
Table 4.27 Cost Of Debt Component Matrix ................................................................ 107
Table 4.28 Anova For Cost Of Debt ............................................................................. 108
Table 4.29 Chi-Square For Cost Debt ........................................................................... 110
Table 4.30 Effect Of Investment Decisions On Financial Performance ....................... 110
Table 4.31.Factor Analysis For Investment Decisions .................................................. 113
Table 4.32 Investment Decisions Component Matrix ................................................... 114
Table 4.33 Anova For Investment Decisions ................................................................ 115
Table 4.34 Chi- Square Test For Investment Decisions ................................................ 116
Table 4.35. Effect Of Access To Finance On Financial Performance .......................... 117
Table 4.36. Factor Analysis For Access To Finance ..................................................... 119
Table 4.37.Access To Finance Component Matrix ....................................................... 121
Table 4.38 Anova For Access To Finance .................................................................... 122
Table 4.39. Chi-Square Tests For Access To Finance ................................................. 123
Table 4.40. Model Summary ......................................................................................... 124
Table 4.41 Anova For Regression Model .................................................................. 125
Table 4.42. Regression Coefficient Model Results ...................................................... 126
Table 4.43.Correlations Coefficient Combined Effect .................................................. 132
Table 4.44. Summary Of Hypotheses Test .................................................................... 137

xii

xiii
LIST OF FIGURES
Figure 2.1 Conceptual framework ................................................................................... 30
xiv
LIST OF APPENDICES
Appendixi 1: Letter Of Introduction ............................................................................. 201
Appendix II: Research Questionnaire ........................................................................... 203
Appendix III: Interview Guide ..................................................................................... 212
Appendix IV :List Of Participants Among The Registered, Hotels, Restaurant And Tour
Safaris With Tourism Regulatory Authority ............................................. 214
Appendix V: Secondary Data Collection Schedule ...................................................... 237
Appendix VI: Secondary Data Tables ........................................................................... 243
xv
LIST OFABBREVIATIONS AND ACRONYMS
ADB African Development Bank
ANOVA Analysis of variance
BCBS Base Committee on banking supervision
CBN Central Bank of Nigeria
EBI Earnings before Interest and Tax
E U European Union
FIs Financial institutions
GDP Gross Domestic Product
GOK Government of Kenya
IFM Institute of financial Management
MDGs Millennium Development Goal
NPV Net Present value
PNDC Provisional National Defense Council
PRIDE Promotion of rural initiative and development Enterprise
Ltd
POT Pecking Order Theory
xvi
ROA Return on asset
ROI Return on investment
ROK Republic of Kenya
SACCOS Saving and credit cooperatives Organizations
SMEs Small and Medium Enterprises
SPSS Statistical Package for Social Science
UK United Kingdom
UN United Nations
UNCDF United Nations Capital Development Fun
UNDP United Nations Development Program
U S A United states of America
WEDCO Women Development Company
xvii
DEFINITION OF TERMS
Micro, Small and Medium Enterprises Micro are rated as firms employing 1to 10
employees, small are classified as firms
employing 10 to 50 employees, while medium firms are
classified as those employing 51 to 100 employee. MSMEs
include both MSEs and SMEs (Onyango, 2010)
Small and medium enterprises;: Are businesses in both
formal and non-formal sectors classified into farm and on-
farm categories employing 1-50 worker (ROK 2005)
Microfinance; Refers to small scale financial services for both credits and
deposits that provided to the people who farm or fish or herd,
operates small and micro enterprise, where goods are produced,
recycled repaired, or trade provide services work for wages or
commissions, gains income from renting out small amounts of
land, vehicles draft animals or machinery and tools and to other
individuals and locals groups in developing countries in urban
and rural areas (Robinson, 2001).
Micro finance institutions (MFIs); Are institutions established to provide assistance to the
economically active poor whose control of the modest increase
xviii
of income savings is assumed to improve their conditions of life
for themselves and their children (Asaim, 2008)
Performance; Is a general term applied to a part or to all the conducts of
activities of an organization over a period of time often with
reference to past or projected cost efficiency, management
responsibility or accountability or the like (Frsch,2009)
Capital structure; Refer to the proportion of equity to debt
used to finance a firms operation (Frank &Drake, 2007)
Cost of capital; is referred to as the price of obtaining funds/capital. It is the rate
which is paid for the use of capital. It can also be referred to as
the cost of a company’s funds, minimum rate of return a firm
must earn on its investment (Mogaji, 2011)
Profitability; This refers to the state or condition of yielding a financial profit
or gain .It is often measured by price to earnings ratio (Pandey,
2008)
Liquidity is the capacity to fulfil all payment obligations as they fall due
(Yan, 2013. Also liquidity is the ability of a bank to fund
increases in asset and meet obligations as thy come due, without
incurring unacceptable losses (BCBS, 2008)
Access to finance Is defined as availability of financial services in form demand
deposits, credit payment or insurance (Aduda & kalunda, 2012)
xix
Debt financing Is the chief component of exterior funding for companies raising
additional funds after formation (Ballaci&Ayydin (2014)
Interest rate It is the return on capital usually expressed as a percentage of
borrowed amount (Salemi, 2007)
Performance It is the ability of the firm to meet both its long term &short term
goals efficiently and effectively, measured using proxies such as
profitability, return on assets, liquidity, solvency and sales
growth(Akinyi,(2014)
xx
ABSTRACT
The study investigated the determinants of financial performance of small and medium
sized enterprises in Tourism sector in Mombasa County and environs in Kenya. The
research was guided by four specific objectives namely; the effect of debt financing, the
effect of cost of debt, the effect of investment decisions and the effect of access finance
on financial performance of SMEs. The target population of this research consisted of all
SMEs as licensed by Tourism Regulatory Authority in Mombasa County and environs
up to 2016. Stratified random sampling technique was employed in selecting the sample
size out of the target population that constituted the sample size to be interviewed for
this research. The study used both primary and secondary data. Primary data was
collected using structured questionnaires for the main purpose of the study and
secondary data was obtained from tourism regulatory authority SMEs, annual reports
and some published reports. The study adopted descriptive research design. A structured
questionnaire was designed to facilitate the relevant data collection which was used for
analysis and administered by the researcher and his assistant. Data collected from SMEs
was randomly selected using the questionnaire instrument. The questionnaire was
complimented with the interview guide method of data collection. The researcher used
qualitative approach which was essential for the study since it involves surveys, focus on
groups and interviews. Statistical tools for quantitative data analysis were used. Factor
analysis was used to assess the validity and Cronbach alpha to assess the reliability of
the questionnaire. A pilot study of 10% of the sample size was conducted to check the
reliability. Data was analyzed using descriptive statistics and inferential statistics method
with the aid of statistical package for social science (SPSS version 20), and the
hypotheses were tested at 0.05 significant level. Chi-square test, ANOVA, multivariate
analysis correlation, and multiple regression analysis tests were also applied. The
hypotheses analysis were tested within the range of 95% level confidence interval and
5% levels of significant. The regression results indicated significant relationship for
both cost of debt and access to finance and insignificant relationship with both debt
financing and investment decisions in explaining SMEs financial performance in terms
of ROA in the tourism sector. The correlation results indicated that cost of debt indicated
a positive moderate relationship with financial performance of SMEs and access to
credit had positive and high relationship with financial performance. Debt finance and
investment decisions had positive and weak relationship with SMEs financial
performance in tourism sector in Mombasa County and enviros in Kenya. Conclusions
were made that cost of debt and access to credit had significant effect whereas debt
financing and investment decisions have positive and weak relationship effect with
financial performance of SMEs in tourism sector in Mombasa County and environ
Kenya. The study recommends that the government of Kenya to be supportive in terms
of policy to improve the financing of SMEs. The study has strengthened our
understanding on the determinants on financial performance of SMEs in tourism sector
in Mombasa County and environs Kenya .
1
CHAPTER ONE
INTRODUCTION
1.1 Background to the study
Small and medium enterprises contribute to economic development by increasing
national output, creating jobs and reducing income inequality and poverty (Fanta 2015).
(Du et el 2015) state that governments, researchers and other stakeholders across the
world have developed great research interest in small and medium scale enterprises
(SMEs) financing because of significant role these small firms play in GDP growth of
various countries. China National bureau of statistics of China (2017), also states that
99% of firms in china are made up of SMEs and contribute 60% o GDP. The story is
similar in the US as 67% of private sector employment is created by SMEs and
contributes 99.7% of US employer firms (Small business administration 2015).
Unfortunately according to Newman et al (2012) SMEs around the world especially
those in developing countries such as china are unable to access the needed external
funds for growth.
According to previous empirical studies shows that SMEs in developing countries are
markedly supporter and attraction of economic prosperity (Harash, (2015), Harash,
(2014), Njogo &Safiyu (2012) and Olatunyi, (2013). Yoshino& Taghizadeh-Hesary
(2015), Yoshinos, Taghzadeh- hasary, Charoensvakom &Niiraula (2016) state that small
&medium enterprise (SMEs) form a significant portion of the commercial landscape and
2
the backbone of Asian economies. Also Kuwahara, Yoshino, Sagara&Taghizadeh-
Hesary, (2015), Yosino et al (2016) indicate that the success of SMEs has huge
implications for the growth and socioeconomic wellbeing of a country.
Baltaci and Ayadydin (2014) argue that debt financing is the chief component of exterior
funding for companies raising additional funds after formation. O’Brien and David
(2010) found that debt financing has both positive and negative impact on the growth of
corporations and for its strategic investment. (Tiang et al, 2014), compared to internal
financing, external financing is expensive and hard to obtain for small business
performance. Chadha and Sharma (2015) provide an insightful analysis of the
relationship between growth opportunities and debt financing with listed companies at
Bombay stock exchange. Fosberg (2013 argue that during crisis, researchers found short
term debt increase, while long term debt decreases.
Procenca et al (2014) states that short term debt is preferred than long term debt. Matias
& Serrasquero (2016) established that SMEs financing decisions follow (POT)
predictions in case of debt financing decision if firms don’t generate enough funds
internally. Kappert (2012) researched the determinants of capital structure of the Dutch
SMEs with regard to firm and industry characteristic and with the expanding firm
increase debt position due to high need of funds. Garcia & Martinez (2010) state that
trade credit is a delay in the payment for goods or service after they have been delivered
or provided as a result of an agreement between the supplier and the firm
3
Penman (2013) state that cost of debt is an average of all component of net financial
obligation. It can be viewed as the overall average return the firms creditors demand in
return on new borrowing, expressed as an annual percentage. Ross et al (2010) found
while a firms cost of equity can be viewed as quite ambiguous, the cost of debt can be
easily be calculated, which is simply the interest rate the firm must pay on its
outstanding debt. The simple formula to compute cost of debt is; after tax cost of
debt=Average interest paid x (1—T). Lambe (2014) found that healthiness of a firm’s
balance sheet is a key determinant of the cost of debt capital in the structure of capital of
a firm. Gabrijelaic, Herman&Lenarcic (2016) stat that leverage financing provides the
borrower with an opportunity to finance an investment on short term source at the same
time spreading the cost of capital over time so as to meet the affordability and budgetary
constraints. Jim (2015) argue that effect of a change in interest rates will depend on
several factors such as the amount that business has borrowed on what terms, the cash
balances that a business holds and whether the business operates in markets where
demand is sensitive to changes in interest rate. Degryse, de Goeij & Naqui (2011)
highlighted that the high risk fee returns attached to SMEs results into high cost of
borrowing credit.
Carraher and Van Auken(2013) argue that firms that understand what constitutes a good
quality financial statement and how to use it as part of their decision making process are
better positioned to make good decisions. Grazzi, Jacoby and Treibich (2013) carried
study to compare the effect of investment policy on the economic growth of firms in
4
France and Italy. Edelen and Kadlec (2013) examine the link between a firm investors
base, discount rates capital budgeting decision and profitability. Sheikh, Shakeel, Iqbal
and Tahiri (2012) found that when undertaking decision making in a firm, it is important
to use any available sources of financial data since an organization can analyze this data
and use it for future decision, the data could be either from the external or internal
environment. Utkabi (2012) state that decision making requires the decision executor to
have complete knowledge of all actions and all the possibilities of occurrences of these
outcomes. Utkash, (2012) State that investment decision making is one of the most
challenging organizational decision making process. Alexandra et al (2010) found that
complexity and multi-disciplinary are the characteristic in decision making literature.
Patric &Jeremy (2018) state that the importance of investment to the economy of the
country and SMEs themselves, SMEs operators need to continuously analyze the
investment decisions that make improve their financial performance.
Chan & Lin (2013) state that finance play a vital role in small business survival and
growth, and the lack of which is major cause of failure of such type of business. Bis
(2012) found in United Kingdom that 36% of SMEs could not access the finance they
needed and that the managerial competence and information market failure affected the
demand side for the business seeking finance were among the determinants of access.
Yihainan (2017) found that a firm level such as factors as life cycle profile of a firm,
gender, and educational level of the owner are important drivers of access to external
finance. He also state that life cycle stage determines small business demand for credit
5
because firms are more dependent on financial intermediaries in early periods of their
lives. Cole & Sokolyk (2016) state that the need for credit starts to wane as the firms
reach maturity stage. Comeig et al (2014) found that access to finance is determined by
collateral. Nasr (2012) found that loan officers indicated that nearly 805 of SMEs lack
collateral to secure the loans and insufficient guarantor to secure the finance in Egypt.
Nasr (2012) also indicates that in Egypt, most SMEs are inclined to use alternative
finance in the firm of trade credit. Haron et al (2013) state that in Malaysia SMEs
generally face difficulties in obtaining finance with lack of collateral and insufficient
documents to support loan application. Haron et al (2014) also found that lack of track
record is the main constraint faced by Malaysian SMEs in accessing financing. Gunto
&Alias (2014) state that Malaysian government has given priority to SMEs and has put
in place a policy and institutional framework that address their development needs.
Uddin and Boss (2013 conducted a study to determine the factors affecting the success
of SMEs in Bangladesh affected by business plans, channels of distribution,
management skills, use of technology, government support, access to capital,
personnel(HR), customer management and improved product/ services.
SMEs are generally regarded the engine of economic growth in developing economies
(Agwu& Emeti (2013). In Africa Abor and Quarley (2010) , Quarley (2017) averred that
SMEs consisted of 91% for small business entity in South Africa and contributes 52 to
57% GDP. In Ghana they asserted that SMEs contribution is more pronounced, the
sector accounts for 92 %of all formal business contributing about 70 % to GDP and offer
6
80% employment to Ghanaians. Further Chinaemerem & Anthony, (2012) states that
SMEs provide benefits such as; job creation, knowledge spillover, economic multipliers,
innovations drivers and cluster development in an economy. Empirical studies done in
both developed and developing countries reveal that most SMEs never celebrate their
fifth birth day (Faloki, 2014) Iloh et al, 2015) due to financial constraints. However the
SMEs sector is bedeviled with number of constraints with financial access being the
most critical among them.
Afande (2015), Deloitte,(2016) describe SMEs as a major income source for many
Economies especially less developed countries(LDCs). SMEs create employment
opportunity, advocates for innovation and acts as a source of revenue for government
through taxation. Although SMEs play a crucial role in economic growth and
employment, the SMEs in developing countries face a financial gap (Beck a Demirguc-
Kunt, (2006), and success. Abdesamed & Wahab (2014) argue that although 96% of
enterprises in Libya are SMEs, their contribution to gross domestic product (GDP)
growth is little at only 4%.The difficult of these enterprises is acquiring finances loan is
considered one of their main problem. Karadag, (2015) also states that Small and
medium sized enterprises (SMEs) are recognized as the drivers of social –economic
growth, both in developed and developing economies due to their significant role in
creation of new jobs, rise in GDP, entrepreneurship and innovation.
Mullineux and Murinde (2014) justify that SMEs financing is inclined to follow a
pecking order of choice from which they prefer to use debt finance to equity finance
7
because of fear of loss of control. Adesina, Nwidobie &Adesina (2015) state that the
irrelevancy theory Modigliani and Miller (MM) postulates that the value of a firm is not
affected by debt in its capital structure. Lombe (2014) examined the functions of debt
funds, this effects of capital mix and parameters that affected companies capital
selection and general impact of the company’s values in the market. Quartley et al
(2017) found out that credit financing in Africa is riskier than other continents
(Machenene et al 2014). Further studies by Kwaning et al, (2015) in Ghana identified
the following constraints by SMEs in accessing credit from commercial banks, high
interest rates on loans, short repayments periods, poor understanding of interest
calculations, inability to meet the loan approval criteria, bank requirements and defaults
payment loans. Dube (2013) did a study on the impact of debt financing on productivity
of small and medium enterprises in Zimbambwe. He also did a study in difficulties in
SMEs access to finance that undermines economic prosperity. Yoshino et al (2016)
indicate that the success of SMEs has huge implications for the growth and
socioeconomic wellbeing of a country. Tweedie (2012) points that transaction costs of
acquiring information from SMEs are very high, given the fact that they do not have
mandatory disclosure. Ayyagari et al (2008), Zarrok et al (2014) indicate that SMEs
will borrow less when transaction cost associated with finance acquis ion are very high.
Alendra, Zeljko and Dimitrios(2010) point that the success or failure of project depends
on the quality of preparation, evaluation and choice of these projects. The quality of
investment decision making is affected by a large number of factors, the most important
8
of them being the choice of the criterions applied in evaluating and choosing investment
projects, this also applies to technology investment in SMEs. Statman (2002) state that
the importance of investment decision on financial performance of firms cannot be over
emphasized since many of the factors that contribute to business failure can be addressed
using strategies and financial decisions that drive growth and the achievement of
organizational objectives. Pandey (2008) state that investment decision entails a firms
decision to invest it current asset most efficiently in the long term assets in anticipation
of an expected flow of benefits over a series of years.
Ayyagari et al (2016), Naunde& Chiweshe (2017) state that financing of small and
medium size entities (SMEs) has been a subject of debate between policy, researchers
and other stakeholders globally. The debate is fueled by the important role that SMEs
continue to play in the private sector across the globe and including employment
creation. Levy (2015) state that the importance of finance has been viewed as a critical
element for financial performance of small and medium based enterprises and that Limit
to finance hinder growth and development of these firms. Zaroorket al (2013) found that
access to debt finance among Libyan enterprises was low and that their firm age, firm
size and sector were significant determinants
Globally SME sector has been reporting difficulties in access to finance (Bebzuk, 2004,
Slotty, 2009, Balling et al, 2009, Irwing &Scott 2010 and Yongqian et al 2012). Access
to external finance to SMEs has become more costly and troublesome while their
accessibility has sharply declined. Milanzi (2012) revealed that limited access to finance
9
significantly affected the export behavior of Tanzania SMEs.. Harelimana (2017) asserts
financial performance is an indicator of the firm’s general financial conditions in a
stipulated time period and can also be employed on contrast related companies in the
same business or to contrast sectors or business in aggregate.
Ayyagari,Beck&DemirgucKunt (2012), Nyando (2014), Olalede & Olangunju(2013)
investigated the extent and determinants of access to finance by small and medium sized
enterprises. Ryan et al (2014) noted that constrained access to external finance by SMEs
with banking limiting funding to small enterprises compared to large enterprise. Odongo
(2014) in Uganda found that effective lending rate to be positively related to access to
debt finance. Kitabi &Dimoso (2016) indicate despite their importance in the economy
of the country, SMEs in Tanzania face problems such as finance and knowledge on
decision to invest which inhibit their growth.
Small and medium enterprises (SMEs) have a stake in most economies a cross the
world. Kinyua (2014) asserts that SME play a major central role in regards to
entrepreneur skills, innovation and employment. The Kenya institute of public policy
research and analysis (KIPPRA, 2012) asserts that because of the low capital
requirement in business start- up, there is potential of reducing poverty through SMEs
sector. According to Republic of Kenya (2012) the SME sector contributed 79.8% of
the new jobs created in the year 2011 in Kenya. Consequently the Kenya’s development
plans including vision 2030 have given special emphasis on the contribution of small
and micro enterprise in creation of employment in the country (ROK, 2012). However,
10
one of the most significant challenge facing SMEs is lack of access to appropriate
financing (Armyx, 2005).
Githaiga and Kabiru (2015) states that debt financing is a key source of capital in many
growing firms since their retained earnings may not be sufficient enough or may be
unavailable. Githaiga and Kabiru (2015) also state that empirical results obtained
presented enough evidence that long term debt affects SMEs financial performance in a
negative manner. Onchonga, Muturi and Atambo (2016), noted that debt financing has
been used as an instrument of filling the budget deficits both in private and public sector.
(Saad et al, 2015) states that debt financing is a financing option that is structured to
improve the owner’s rate of return on investment by producing a rate of return that is
higher than the overall cost of borrowed funds. (Onchonga, Muturi & Atambo, 2016),
noted that debt financing offers a means of satisfying financing deficits of business that
have insufficient internal resources to finance their operational activities and investment.
James (2014) concludes that interest rate is the amount paid per unit of time expressed as
a percentage of the amount borrowed. High interest charged on loans increases the cost
of loan to the borrower hence discouraging borrowing while low interest charged on
loans increases the corporative societies. Mole and Namusonge (2016) state that high
interest rates on credit may discourage SMEs from borrowing reducing the accessibility
of credit among them. Banks have often been criticized for having high interest rates
charged on loans. They also indicate that the amount of interest payable on loans depend
on interest rates charged which is driven by the base lending rate set by the central bank
11
of Kenya. Study conducted in Kenya by Wadogo,Odhuno, Kambona and Othuon(2010)
investigated key performance measures utilized by six five star hotels. The researcher
reported that most hotel managers highly monitor financial performance using measures
such as total revenues food and beverage sales, and total operating cost. The customer
perspective of performance was also actively measured through customer’s satisfaction
surveys, customer’s profitability and market share.
Onchongwa, Ongoncho, Onchonga and Njeri (2013) points that investment decision
made by cooperative management should lead to theirs increased growth, reduced risks
and high survival rate. However of critical concern to both practitioners and academic is
that the investment culture of the cooperative sector in Kenya is very low. Liagat et al
(2017) states that financing decision acts as a basis of investment decision and a
company’s financial performance is extremely influenced by proposition of mix
financing. The choice of the appropriate mix of different sources of short and long term
funds is one of the critical decision needs that have to be taken by central body of an
organization.
Loredana (2011) argue out that the decision to invest in finance is based on complex and
accurate information about need, opportunity, duration of implementation &operation
investments, the expenditure volume and financial resources, the input and output flows
of funds throughout the investment operation, the ensuring profitability & liquidity, the
recovering of invested capital. Uddin and Chowdhury (2009) observe that small business
operate in environment that do not satisfy the assumptions underlying the theory of
12
investment decision , that is many investments cannot easily be evaluated using
discounted cash flows method due to difficulties estimated future cash flows and market
determined discount rate .
Kamunge et al (2014) state that lack of access to finance is almost universally indicated
as a key problem to SMEs performance. Credit constraint operate in a variety of ways in
Kenya where undeveloped capital market forces entrepreneurs to rely on self-financing
or borrowing from friends or relatives which is not enough to enable SMEs undertake
their business activities optimally. Lack of access to long term credit for SMEs forcing
them to rely on high cost short term finance .He also state that the various challenges
facing small enterprises including high cost credit , high banking charges and fees.
Auma and Muturi (2017) in their study found that credit terms was the most important
predictor of SMEs performance and were also the most significant challenge in the
utilization of commercial banks loan since majority of the SMEs found credit terms
offered were unfavorable. The FSD (2015) citing Beck & Demigurc-Kunt (2006) opines
that when SMEs are credit constrained it severely affects their possibility to grow and
innovate. According to a survey by Omboi and Wangai (2011) it was established that
the problem of access to finance resources by small business was to some extent created
by the financial institutions themselves They also assert that unfriendly lending policies,
limits on the amount loaned to SMEs complex and bureaucratic application process
played a major role in locking out SMEs from accessing credit facilities.
13
1.1.2 Profile of tourism in Kenya
In, Kenya the tourism sector has been one of the key economic drivers generating
approximately 10% of the country’s GDP and 9 % of total formal employment. In all for
instance, the sector contributes to the country’s GDP rose by 32.8 per cent from Ksh 73
billion 1n 2010 to Ksh 97.6 billion (KNBS, 2012). Further according to world bank ,
tourism industry contributes to Kenya’s economy as a percentage of the total exports
has always stood above 15%, climaxing at 22% in the year 2007 (World bank, 2012).
The relative importance of tourism in Kenya’s economy has risen steadily over the last
40 years (Government of Kenya, 2007. In terms of revenue, it ranks third after tea and
horticulture as the major foreign exchange earner. It has also been identified as one of
the pillars in Kenya vision 2030.
Tourism is one of the leading foreign exchange earners in Kenya; indeed the sector
contributes 27% of foreign exchange of the country national domestic product (GDP)
(ROK, 2013) national tourism strategy 2013-2018, department of tourism Nairobi,
Kenya. Kenya is among the popular tourism destinations in Africa attracting millions of
tourists over the past years (Mc Clanahan et al. 2005). The country’s blueprint vision
2030, aims at making the country among the top 10 overhaul tourists destinations in the
world. The key tourist attractions along the Kenya coast include beaches, cultural
heritage and marine based habitat (Mohamed et al 2009
14
1.2 Statement of the Problem
Small and medium sized are recognized as drivers of social economic growth, both in
developed and developing economies due to their significant role in creation of new
jobs, rise in GDP, entrepreneurship and innovation ( Karadagi,2015). The Kenya
government in the vision 2030 has identified the SMEs an important priority. Despite
the potential of SMEs in Kenya to facilitate and foster growth, many studies have
indicated lack of access to finance as a major setback to its national development.
Thaimuta et al (2014) indicated that the rate of SMEs failure in developing countries as
well as developed countries is alarming 33% to 41% of new SMEs fail within the first
five years of their business operation due to lack of finances. Levy, (2015) stated that the
importance of finance has been viewed as critical element of financial performance of
small and medium sized enterprise. Limit of finance hinder growth and development of
these firms.
Chisti Ali&Sagami, (2013) indicate that financial decisions result in a given financial
structure and suboptimal financing decisions can lead to corporate failure. Globally
SME sector has been reporting difficulties in access to finance (Bebzuk, 2004, Slotty,
2009, Balling et al, 2009, Irwing&Scoii, 2010 and Yongqian et al 2012). Access to
external finance to SMEs has become more costly and troublesome while their
accessibility has sharply declined. Hahhen (2012) in the discussion of managing cash
flows as an important principle of small business the management asserts that each day
approximately a dozen U S small businesses declare bankruptcy. Majority of these
15
business failures are caused by poor cash flow management. Sunil Kumari (2013) on
investment attitude of rural investors states that all of their rural investors consider the
risk return on investment and most of them are also dependent on financial advisor
opinion because of lacking the depth knowledge of market. The ability of SMEs to
grow depends highly on the potential to invest on restructuring and innovation
(Ayyagari et a (Ayyagari et al 2011).
Ryan et al (2014) in his study noted that constrained access to external finances by
SMEs with bank limiting funding to small enterprises as compared to large enterprises.
Eniola& Entebang (2015) found out that unfavorable government policies influenced
negatively on SMEs performance with decreasing issuance of total credit by both
commercial and merchant banks to SMEs. According to Githaiga &Kabiru (2015) found
that both long term and short term loans reduce the financial performance of SMEs.
They also indicated that short term debts negatively affect SMEs performance through
ROA and liquidity. Long term debt are most preferable source of debt financing among
well-established corporate institutions mostly by virtue of their asset base collateral
requirement many deposit taking institutions. In order to achieve performance, adequate
sources of finance are needed for SMEs (Kuria, 2014).
A study by Ikapel and Kajirwa (2017) study on the effect of long term debt on financial
performance of firms revealed that a considerable negative association between long
term of borrowed funds and the financial performance. Xu,Ou and Chan (2016) explored
the impact of diversification on financing through debts and the performance of
16
operators , revealed a considerable negative effect on the operating performance of firms
and that diversification contributes a limited mediator function linking leverage
financing and operating performance. Kwaning et al (2015) examined the difficulties
SMEs face in accessing loans, difficulties financial institutions face in lending to SMEs
and the impact of loan on the profitability of SMEs and found that interest rate on loans
to SMEs is extremely high. According to Marende (2014), lending interest rate has
positive statically insignificant relatively with commercial bank lending
According to Kira (2013) debt financing by institutions is essential for the profitability
and sustainable growth of small and medium enterprises (SMEs) nationally and
internationally. Adbulsaleh (2013) determined that access to debt finance was
particularly more important for establishing smaller businesses such as retail business
for the expansion of small business into medium sized enterprise. Mwega (2014)
observes that Kenya banks have repeatedly been portrayed as using their market power
to extract high interest from business, especially SMEs. Nyanumba et al (2015) found
that there exists statistically significant negative effect of interest on the performance of
SMEs in Lurambi sub- County Kenya.
From the review of the past studies none of the locals has focused on the determinants of
financial performance of SMEs in the tourism sector in Mombasa County and environs.
It is for this reason this study sought to investigate and close the gap by providing
empirical evidence on determinants of financial performance of SMEs in tourism sector
in Mombasa County and environs Kenya.
17
1.3 Objectives of the study
The general objective of the study was to investigate the determinants of financial
performance of small and medium sized enterprises in tourism sector in Mombasa
County Kenya.
1.3.2 Specific objectives
The study was guided by the following specific objectives:-
1. To establish the effect of debt finance on the financial performance of SMEs in
Kenya
2. To establish the effect of cost of debt on the financial performance of SMEs in
Kenya
3. To examine the effect of investment decision on financial performance of SMEs in
Kenya
4. To examine the effect of access to finance on the financial performance of SMEs in
Kenya.
1.4 Hypotheses of the study
The study was guided by the following null hypotheses;
1. H01. Debt finance has no significant effect on financial performance of SMEs in
Kenya
2. H02 Cost of debt has no significant effect on financial performance of SMEs in Kenya
18
3. H03 Return on investment has no significant effect on financial performance of SMEs
in Kenya
4. H04 Access to finance has no significant effect on financial performance of SMEs in
Kenya.
1.5 Significance of the study
The study provided some significant insights that suggest that determinants of financial
performance contribute to the performance of SMEs in Kenya. Government policy
towards small firms has raised both public awareness and created political interest on
how to support them. The study is useful to the government of Kenya in implanting of
policies that govern the issuance of credit facilities to SME sector and to ensure
favorable environment to all involved in participation of SMEs sector.
The study is useful to management in understanding the needs and critical obstacles
SMEs face in accessing fiancé. And also understand about banks’ lending as the most
common source of external finance for many SMEs and entrepreneurs which are often
heavily reliant on traditional debt to fulfil their start up, cash flow and investment needs.
. Access to finance improves and ease cash flow problem which is useful to SMEs
financial performance.
The study assists managers in making informed decision and future predictions of shares
prices and investment cycles and helps investors who require investment knowledge and
manage investment. Cost of debt can be useful in evaluating company’s capital structure
19
and overall financial health of a firm. It helps understand the effective rate a company
pay its current debt. Debt finance increasing pressure on managers encourages them to
perform more efficiently, and also reduce moral hazards behavior by reducing cash flow.
For manager understand the effect of debt financing on profitability of a firm is of
considerable importance
This study has generated data and information on the determinants of financial
performance of small and medium enterprises to various interested groups including
owners of small businesses, managers, employees and the Government. In addition the
research would serve as a source of reference for other researchers or any other Kenyan
who need information on the subject. It is hoped the study contributes to the body of
knowledge for the public enlightenment on the determinants of financial performance of
the SMEs sector in Kenya. The findings challenge the owners workers, policy makers
and other who to promote the financial performance of SMEs.
1.6 Scope of the study
The study focused on determinants of the performance of SMEs in tourism sector in
Mombasa County in Kenya. The choice of Mombasa County is that it holds a large
number of formal and informal small and medium business enterprises and the most
important economic activities in terms of employment and potential to develop a more
vibrant SMEs value chain industry, from which the researcher obtained considerable
research data. Further it is also convenient to the researcher in terms of cost and
proximity to respondents for he is a resident of this County and environs. The study took
20
a cross section survey research design of selected SMEs that accessed finance and have
been in business and have obtained operating licenses for at least five years, between
2012-2016. The study was confined to only four independent objectives including debt
financing, cost of credit, investment decisions and access to finance on the financial
performance of SMEs in Mombasa County in Kenya. The target population of the study
involved SMEs registered and licensed by Tourism Regulatory Authority including
hotels, tour safaris and restaurants operating in Mombasa County and environs in Kenya.
A sample size of 330 SMEs was selected using stratified random sampling. Research
findings were generalized to other populations and SMEs in other Counties in Kenya
with similar characteristics.
1.7 Limitations
The researcher encountered a couple of limitations that may have affected this study as
discussed below. Limited and lack of adequate information as SMEs levels of
information disclosure differed where some of the SMEs did not want to disclose all the
information on financial determinants and profitability of their business, however after
explaining and assuring that the research was for academics purpose and the data
collected remain confidential they complied and filled the questionnaires. Most business
owners were reluctant to fill the questionnaires even after reading and confirmed that the
questioned were not very sensitive. They still insisted that some information about their
business profitability was their own secret. The researcher made several visits and
21
explanations that the findings were likely their business until they agreed to fill the
questionnaires.
Availability of Respondents Corporation due to their busy schedule was also a hindrance
on the information which took too long to get questionnaires back. The researcher
followed the respondents several times which was a bother however they complied after
understanding the researchers explanations. Most of the respondents were hesitant to
respond on indicators such as profitability. With the explanations they agreed to disclose
the information pertaining to such indicators of performance of SMEs. Others indicated
that information required was for their own use and not for outsiders, however they
disclosed what they felt was not sensitive, but useful to the researcher. The study only
analyzed and limited to four determinants affecting SMEs financial performance in
tourism sector. Data collection was only confined on SMEs in hotels, restaurants and
tour safaris in Mombasa County and environs Kenya
CHAPTER TWO
LITERATURE REVIEW
2.1 Introduction
This chapter reviewed an insight theoretical literature applicable to this study and
discussed theories from the previous studies related to this research. The chapter
discussed the general empirical literature which forms the basis for the conceptual
framework of the study and its completion by summarizing some of the major theories
22
and models in the area and gives the aspects of financing in other countries which have
motivated this study.
2.2 Theoretical Framework
The theoretical framework of the study is a structure that can hold or support a theory of
a research work. A good theoretical framework gives you a strong scientific research bas
and provides support for the rest of the study. It presents a theory which explains why
the problem under the study exists. Theories are formulated to explain, predict and
understand phenomena and in many cases to challenge and extend existing knowledge
within the limits of critical bounding assumptions. Theory is a formulation regarding the
cause and effect relationship between two or more variables, which may or may not have
been tested. Thus, theoretical framework is but a theory that serves as a basis for
conducting research. It helps the researcher see clearly the variables of the study,
provides him with a general framework for data analysis and is essential in preparing a
research proposal using descriptive and experimental methods (Saunders et al, 2009).
This section therefore discusses the theories that relate to determinants on financial
performance of SMEs in Kenya.
2.2.1 Modigliani and Miller Theory
. Modigliani and Miller (1958) irrelevance theory under limiting assumption of no taxes
and cost associated with transactions suggest that cost of capital have no effect on
capital structure in particular leverage, therefore no impact on the firms value Liaquat,

23
(2017). They argue that the overall capitalization rate remain unchanged for any level of
financial leverage using the net operating income approach. As a result the value of the
firm does not depend on the capital structure of a firm. M&M (1963) made two
propositions under perfect capital market condition. Their first proposition is that the
value of a firm is independent of its capital structure. Their second proposition states that
the cost of equity for a leveraged firm is equal to the cost of equity for an unleveraged
firm plus an added premium for financial risk
Modigliani- miller theorem has been criticized widely for its limitations. However
Modigliani &miller (1963) relax one of their assumptions & recognize the importance of
corporate taxes. Because interest expenses are tax deductible they introduce an interest
tax shield in their model. Due to the interest tax shield, the value of the levered firm
increases or the cost of capital decreases. Every extra dollar of debt lowers tax
payments. The theory holds under unrealistic assumptions of no taxes, transaction cost,
information asymmetry, bankruptcy costs, agency costs and costs of borrowing is the
same for companies as well as investors and no effect of debt on company earnings
before interest and taxes and an efficient market.
2.2.2 The pecking order theory
The theory of pecking order theory was established by Myers and Magluf (1984).
According to the this theory companies favor internal funding to external funding where
companies need from outside , they could favor debt over equity and only come to
equity as a last option. Myers (1984) extends this theory and states that firms will meet
24
investment and financing requirement of the firm in a hierarchical fashion, preferring
internal funds first, external debt next and external equity as a last resort. Literature
provides a number of demand-side and supply-side reasons as to why firms prefer,
internal sources of funding over external sources and Debt over equity. Stilitzand Weiss
(1981) argues that supply side constraint exist when SMEs cannot obtain the debt
financing they require at market interest rates, resulting in undercapitalization. This is
viewed as an under investment problem, where equity clears the market. Demand-side
explanation as presented by Bolton (1971) and Lecornu et al (1996) are based on the
well-established fact that SMES owners are extremely reluctant to relinquish control of
their business e.g. SMEs owners will try to meet their financing needs from pecking
order of first their own’ money, personal saving and retained earnings, second short term
borrowing, third longer term debt and preferred of all (Ciaran macan &Lucey, 2006).
Studies on small business finance have frequently suggested the problem of scarcity of
funds (Peer & Wilson, 1996, Laitinen, 1992). It is also observed that limited access to
capital markets (Gopinath, 1995) appear to confine the finance of small business to
internally generated funds. However there is a limit to which internally generated funds
can contribute to the growth of the SMEs which bring to the fore the need for alternative
source of capital for development of these enterprises.
According to Cosh & Hughes (1994) pecking order theory, with its emphasis on the
desirability of the use of funds generated within the business rather than funds raised
externally can readily be applied to SMEs. Indeed SMEs seem to face a more extreme
25
verse of the pecking order theory describe as a constraint pecking order theory by
Holmes &Kent (1999) and a modified pecking order theory by Ang (1991) because they
have less excess to external funds, debt as well as equity than to long enterprises. The
pecking order theory suggests that use of external funds is very much related to
profitability on the basis that SMEs particularly if they are not stock exchange listed will
make use of internally generated funds as first resort. ). SMEs financing decisions follow
POT prediction in case of debt financing decision if firms don’t generate enough funds
internally, Matias&Serasquero (2017). This also confirmed by Proenca (2014) that short
term debt is preferred than long term. Agrebi (2009), Matias &Serrasqueiro(2016)
established that SMEs financing decisions follow POT predictions in case of debt
financing decision if firm don’t generate enough funds internally then, Proenca et al
(2014), short term debt is preferred than long term. The theory gives good explanation
on preferences of debt financing, access to credit by SMEs compared with large firms
and difficulties in accessing debt due to information asymmetry, a problem of
considerable relevant in SMEs.
2.2.3 Modern portfolio theory (MPT)
The modern portfolio theory was proposed by Markowitz in (1952). The theory helps in
the understanding how financial management practices in an organization are
undertaken particularly the financial risk management decision. Essentially MPT is an
investment framework for the selection and construction of investment portfolio based
on the maximization of expected returns of the portfolio and the simultaneous
26
minimization of investment (Fabozzi, Gupta &Markowitz, 2002). Diversification is the
core concept of MPT and directly relies on the confectionary wisdom of never putting
eggs in one basket (Fabozzi, Gupta&Markowitz, 2002, Mc clure, 2010.& Veneeya,
2006). The theory encourages asset diversification to hedge against market risk as well
as risk that is unique to a specific organization (Omisore, Munirat&Nwufo, 2012). It
explains the risk reducing effect of spreading investment across a range of financial
assts. That means in a portfolio of mixed assets which have low correlation an expected
bad news concerning one asset will be compensated some extent by expected good news
about another asset in the portfolio.
The modern portfolio was relevant to the study as it was the basis for conceptualization
relationship between portfolio diversification and financial performance. The theory
explains that SMEs can choose a set of asset to invest in for optimization of portfolio
risk and return. According to the theory SMEs can choose a combination of assets whose
return are negatively correlated hence decrease the overall portfolio risk and enhance
returns. This is very important in the risk and uncertain retail business environ in Kenya
(Waweru&Ngugi, 2014).
2.2.4 Agency theory
The agency theory was established by Rose and Barry (1973) who were the first to
propose that agency theory can be created. The theory focuses on costs which are
created due the conflict of interests between shareholders, managers and debt holders.
The theory demonstrates the fundamental conflict of interest between managers and
27
owners of a firm (Jensen &Meckling, 1976). (Eisenhardt(1989) states that agency
theory is concern with analyzing and resolving problems that occur in the relationsip
between principals and their agents. One important issue is the conflict between interests
of shareholders and debt holders. Myers and Brealey (1977, and Myers (1996) suggests
that the agency problems are most severe for firms in financial distress and firms with
high growth opportunities. Basically the argument is that debt financing requires
managers to explain the investment details to debt providers and therefore expose
themselves to monitoring by debt the debt investors (Frank &Goyal, 2005) Agency
theory asserts that shareholders must monitor and control managers to protect their
resident claims from the excess of self-interest managers. (Base, 2013). Managers
should always act in the interest of shareholders. According to Stiglits &Weiss agency
problems such as asymmetric information and moral hazards can impact on the
accessibility of credit and hence the capital structure of SMEs. The theory suggests that
high debt financing level reduces the agency costs of outside equity and increases the
corporation value by constraining or encouraging managers to act extra hard in the
interest of shareholders (Berger &Bonaccorsi di patti, 2006)The debt financing level is
determined by agency costs which arise from conflicts of interest between the manager
and the equity shareholder (Jirapurn,Kim Kim and Kitsasunnarat, 2012).
The agency theory is important to SMEs as some of the assumptions in the agency
theory sound intuitively appealing and relevant in the small firms’ situation. For
example the high level of asymmetric information Barnea et al (1981), and the fact that
28
entrepreneurs are not motivated to disclose information due to fear that it might be
informatory impactedness Kaplan & Arkinso(1989). Also agency costs are thought to
be a major impediment to small firms in their attempts to obtain external financing
(Jensen& Meckling (1976), Petti& Singer (1985). SMEs may experience agency costs
when the principals and the managers or agents are separated and have divergent
interests. Agency cost is also a problem in SMEs since they do not disclose financial
information.
2.2.5 Trade off theory
The tradeoff theory (TOT) was proposed by Kraus&Litzenberg (1973).The theory is the
idea that a firm choses how much debt finance and how much equity fiancé use by
balancing the costs and benefits. The trade theory suggests that managers weigh the
benefit of debt financing against cost of borrowing (Karadeniz at el 2011). The cost of
borrowing includes bankruptcy costs and interest payments. The benefit of the debt
finance includes the discipline instilled on the management and the tax allowance on
interest payments. Brigham & Eurhardt (2005) note that the tradeoff theory holds that
the value of unlevered firm is equal to the value of levered firm plus the value of side
effects ,which include the expected costs due to financial distress and the tax shield.
When a firm has a zero or low levels of debt financing the like hood of bankruptcy is
low. According to Baxter (1967) the extensive use of debt increases the chances of
bankruptcy and this makes creditors to demand extra premium. Accordingly firms
should not use debt beyond a point where the cost of debt is higher than the tax
29
advantage. Therefore the tradeoff theory suggest that the optimal capital structure is the
point where the marginal tax benefit is equal to marginal costs related with bankruptcy.
According to the tradeoff theory, firms would prefer debt over equity up to the point
where probability of finance distress and bankruptcy costs overweigh the tax benefit
associated with debt (Gill et al, 2012. Trade off theory is an approach used to take
balance between merits and demerits associated with use of debt financing of a firm. The
purpose for the theory is to explain the fact that corporations usually are financed partly
with and equity and partly with equity. It states that there is an advantage to financing
with debt, the tax benefits of the debt and is a cost of financing with debt.
2.3 Conceptual framework
Based on the reviewed literature, this study proposes a conceptual framework in which
the independent variables are debt finance, cost of debt, investment decisions, and access
to finance and the dependent variable being financial performance of SMES. The
conceptual framework below was derived from the review of literature and theories
discussed above and presented in the figure 2:1 of the conceptual framework of this
study, and the purpose of the study showing the relationship between depended variable
and independent variables.
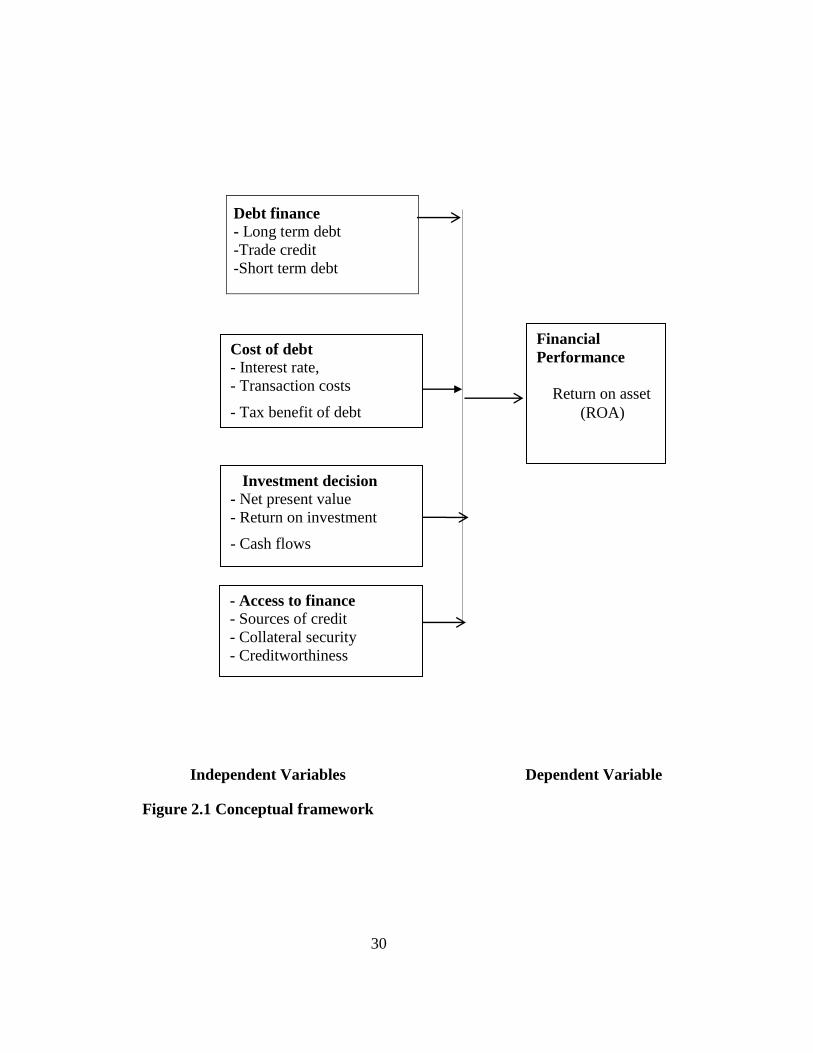
30
Debt finance
- Long term debt
-Trade credit
-Short term debt
Independent Variables Dependent Variable
Figure 2.1 Conceptual framework
Cost of debt
- Interest rate,
- Transaction costs
- Tax benefit of debt
Investment decision
- Net present value
- Return on investment
- Cash flows
- Access to finance
- Sources of credit
- Collateral security
- Creditworthiness
Financial
Performance
Return on asset
(ROA)
31
2.4 Review of Variables
A crucial element in the development of the SME sector is access to finance particularly
banking financing, given the relative importance of banking sector in serving this
segment. Access to finance and cost of credit is perceived to be greater obstacles to
SMEs than for large firms; these factors constrain SMEs performance more than the
large firms. (Demirguc-Kunt & Maksimovic, 2005, Laevens Makdimovic, 2006). These
factors and others are part of the variables disused below.
2.4.1 Financial performance
Bekana, (2012) state that financial performance measures ratios such as assets utilization
efficiency ratios, deposit mobilization, loan performance, liquidity ratio leverage
/financial efficiency ratios, profitability ratios, solvency ratios and coverage ratios to
evaluate the banks financial performance(Bekana,2011). According to Obuya (2017)
financial performance give a proper gauge on the use of firm’s resources for
maximization of wealth and profits. The fiscal financial functions are conducted
occasionally from the accounts office balance sheet or the profits and loss statements of
the firm so as to evaluate the degree of success in the business
Financial performance is an indicator of how profitable accompany is relative to its total
cost assets. It is measured by return on asset. RAO gives an idea as to how efficient
management is at using its assets to generate earnings. The return on asset is company’s
32
net income divided by its average total assets; ROA is displayed as a percentage.
Sometimes this is referred to as return on investment. The formula for return on asset is
= Net income
Total Average Asset
Return on asset formula looks at the ability of a company to utilize its assets to gain a
net profit. Kiarie (2011) observed that net income in the numerator of the ROA formula
can be found on an income statement and Average total assets to the denominator of the
ROA. A formula is found on company’s balance sheet. The average of total assets
should be used based on the period being evaluated.
Haber and Riechel, (2005) financial performance measurement generally looks at firms
financial ratios derived from financial statements, such as liquidity ratios, activity ratios,
profitability ratios and debt ratios. Non-financial performance measurement is more
subjective and may look at customer service employee satisfaction, perceived growth in
market share, perceived change in cash flow and sales. However, performance can also
be defined as the accomplishment of specific business objectives measured against
known standards completeness and cost (Davis and Cobb, 2010, Sabanci Ozer, 2012,
Sacristan-Navarro et al 2011, Thrikaawala, 2011). The performance is the result of
strategies the company employs to achieve market oriented and financial goals Harash et
al (2014). Also Korir & Mbaya (2013) have dealt and researched a wide variety of
definitions of company performance.
33
In Kenya the performance of SMEs has continued to decline over years. According to
GOK (2009) virtually most small enterprise had collapsed leading to the closure of some
of the SMEs that were producing 40% of the employment in Kenya. Other SMEs were
auctioned while some were merged or acquired signifying questionable financial
performance due to lack of proper management of debt.
2.4.2 Debt finance
Debt financing is the chief component of exterior funding for companies raising
additional funds after formation Baltacc and Ayaydini (2014). According to
Frasch,(2013) debt financing is the practice of borrowing funds from outside an
organization from such institutions as commercial banks, money lenders, microfinance
institutions, SACCOS, it includes long term debt and short term debt. Maina & Ishumail
(2014 did a study on capital structure and financial performance of firms listed at
Nairobi stock exchange and concluded that debt and equity are major determinants of
financial performance of firms listed in NSE. The study concluded that there was a
negative relationship between capital structure and financial performance and that firms
listed in NSE used more short term debt than long term debt. Osuji&Odita (2010) did a
study on impact on capital structure on financial performance of Nigeria firms using a
sample of thirty non-financial firms listed on Nigerian stock exchange during the seven
year period 2004-2010. Panel data for the selected firms were generated and amassed
using ordinary least squares (OLS) as a method of estimation. The result shows that a
firm financial measures return on assets (RAO). The study of these findings indicates
34
consistency with prior empirical studies and provides evidence in support of agency
theory.
The determination of a firms optimal financial structure is a difficult one since it
involves an analysis of several factors, key among them risk and profitability (Shubita
&Alsawalhah,2012). The decision becomes more difficult, in times when economic,
social, technological and political environment in which the firm operates exhibits high
degree of instability (Shubita &Alsawalhah, 2012). Capital structure, which also referred
to as financial leverage or gearing, it’s the proportion of a company’s long term debt and
preferential shares if any to ordinary share capital (ICAN, 2009), with this definition, it
can be described as the proportion of debt to business owners fund/Equity with regard to
SMEs, as there are the major sources of finance for SMEs. This is consistent with the
point of Nadada (2013) that the two principal sources of finance for SMEs in Nigeria are
loans/ debt and equity (owner’s investment). SME capital structure typically follows
pecking order theory behavior. However the theoretical underpinnings of the pecking
order theory are doubled in the case of SMEs as SME managers highly value financial
freedom, independence and control while the pecking order theory assumes firms desire
financial wealth and suffer severe adverse selection cost in accessing external finance
(Lopez-Garcia & Sogorb-Mira, 2008).

35
According Modiglian and Miller (1963) firms should incorporate more debt in their
capital structure in order to maximize the firm’s value which is manifested through
profits, and efficiency in management. However, Harns (2011) warns of the danger of
high amount of debt in the capital structure of firms which includes Bankruptcy,
liquidity, and costs and in some cases corporation dissolution. According to Abor (2011)
capital structure decisions are essential because of the fact that they have an impact on
the ability of a business to compete effectively. Kajananthan, (2012) emphasize that
capital structure decision is important because the profitability of a firm is directly
affected by such decisions.
The determinants of a firm’s capital structure comprise of those factors that influence its
financing decisions, namely, asset structuring profitability, firm size, growth
opportunities, uniqueness, business risk, ownership structure and control and enterprise
age. The capital structure of SMEs as a whole is therefore looked at, which involves
determining how much capital it is needed immediately over time and the combination
of equity and debt that it will use to fulfil its entire financial requirement. The
significance of asset structure underlined the importance of collateral in SMEs finance.
Reviewed questionnaires from respondents handled by previous researchers confirmed
that profitability, assets and size were important determinants of capital structure.
Profitability was found to be important to the SMEs. The survey also found that while
SMEs operated bank accounts, banks were the least preferred. Source of debt and there
36
was no relationship between capital structure and industry sector growth (Codjia, 2012,
Karadeniz, 2008).
2.4.3 Cost of debt
Cost of capital is referred to as the price of obtaining fund/ capital. It is the rate which is
paid for the use of capital. It can also be referred to as the cost of a company s fund,
minimum rate of return a firm must earn on its investment (Magaji, 2011). From the
point of a company’s, cost of capital is the rate of return that it has to offer to
compensate it investors including shareholders and bondholders for the capital they
provide (Brealey et al, 2009, Arnold, 2008). Like all other business banks incur costs to
do business, they incur costs to a business, they costs to access credit, process and
monitor loans, transaction costs directly related to profitability. The high the cost of
processing transaction the lower is the return. SMEs loans often consume time to assess,
monitor and manage. According to Zavatta, (2008) irrespective of risk profile
consideration, the handling of SMEs financing is an expensive business. According to
Dehijia et al (2012) interest rates can erode surplus generated by borrowers leaving them
with little net gain. There is also concern that high interest rates reduce the demand for
and uptake of financial services.
Cost of credit influences the availability of finance determines the financial performance
of an enterprise in a number of ways. For instance the ability of access of credit by a
small scale enterprise will determine its choices for technology, access to markets and
access to essential resources. These in turn greatly influence the financial performance
37
of small and medium enterprise (Wole, 2009). Wole (2009) further states that securing
capital for small scale business start- up or a business operation is one of the major
obstacle every entrepreneur faces particularly those in the SMEs sector. Within the
SMEs sector lack of access to credit is one of the major factors accountable for
hindering the emergence of growth of their business.
One of the major problems of SMEs is finance (Nadada,2013).While their capital
structure is a combination of funds from owners of business (owners’ equity) internal
financing which might be as a result of saving from the business owner and external
financing (debt),both type of funding have their resulting cost. The cost of both
financing is an opportunity cost of using these funds elsewhere. Most SMEs are
constrained with fear of the cost of long term financing through means such as the
capital market where opportunities are provided for emerging business to access funds
for capital.
Banks advance four main reasons for their reluctance to extend credit to small
enterprises viz high administrative costs of small scale lending, asymmetric information,
high risk perception and lack of collateral. The transaction costs associated with process
and administering loans are however fixed and banks often find that processing small
SME loans is inefficient. They lack the techniques, such as credit scoring, to increase
volume and lower costs (Malhotra et al, 2007). L,Since most of the administrative costs
of lending are fixed, that is they are independent of the size of administered loan
economies of scale a rise; the lager the loan, the lower the per unit costs of extending
38
credit. High interest rates stifle the economic growth and development of nations and
individuals alike. In the West, and in particular United States, interest rates are at all-
time lows and have been for many years (Wall street journal, 2014).
Credit constrains operate in a variety of ways in Kenya, where underdeveloped capital
market forces SMEs to rely on self-financing or borrowing from friends or relatives.
Lack of access to long term credit for small enterprises forces them to rely on high cost
short term finance. These difficulties stem from the more formal lending institutions
which tend to rate all SMEs equally as un-credit worth. However the emergence of less
formal institutions like MFLs and SACCOs do not ease this burden. These microcredit
institutions face limited expansion because of their limited funds. They are also against
the cost of refinancing through the formal banking sector and have no access to
refinancing either by the Central Bank (Wanjohi, 2012). Credit constraint can occur
when banks increase collateral for loans. As a result low interest rate borrowers
including MSEs may be removed from the list of potential customers and bank may skip
these customers (Stiglitz&Weiss, 1981, Gangata &Matarire , 20133) in their study on
challenges face MSEs in accessing finance from financial institutions found out that
very few MSEs succeeded in accessing funding from financial institutions the main
reasons being failure to meet lending requirement, chief among then being provision of
collateral security.
39
2.4.4 Investment decisions
According to Simeyo, Martin, Nyamao, Patrick & Odondo (2013), investment is an
outlay of a sum of money in an anticipation of a future return which more than
compensates for the original amount plus a premium to cover inflation, interest forgone
and risk (Simeyo, et al, 2013). According to Pandey (2008) investment decision entails
affirms decision to invest most efficiently in the long term assets in anticipation of an
expected flow of benefits over a series of years. The investment decisions require very
special attention as they influence a firm’s growth, risk and they are difficult and
irreversible and involve commitment of large volume of funds. In other words
investment decision can be described as a process which the business determines how to
invest their capital (Srivatava &Misra, 2008). This process can include decisions to
invest expand a business modernization or replacement of long term assets.
Making a capital budgeting decision is one of the most important policy decagons the
firm makes. A firm that does not invest in long term investment projects does not
maximize stakeholders’ interest, especially shareholders wealth. Optimal decision in
capital budgeting optimize a firms main objective of maximizing the shareholders
wealth and also help the firm to stay competitive as it grows and expand. These
decisions are some of the integral parts of overall corporate financial management and
corporate governance. A company grows when it invests in capital projects, such as
plant and machinery, to generate future revenues that are worth more than the initial cost
(Ross et al, 2011, shapro, 2008).
40
Avery important part of a management accountant’s job is to provide information which
will assist the making of decisions concerning the investment of capital fund. This
process is known as capital budgeting (Adeniji, 2008). According to Pandey (2002)
given scenario evaluate their finances differently, with some companies requiring
significant time and strategic processing in order to approve capital expenditure. Other
companies use simplistic analysis techniques that require nothing more than approval of
a project by several departments inside the company. Some companies evaluate capital
expenditure with capital budgeting techniques such as net present value (NPV) and
internal rate of return (IRR), while others companies use payback period and average of
return (ARR) techniques (Muhammad,2010).
The ability of firms to optimally exploit investment opportunities may crucially depend
on the level of financial constraint that they face, access to finance is commonly
identified as the key factor holding small and medium enterprises (SMEs) back from
growing at their full potential. Finance providers and the government fail to tackle this
issue effectively (Masinde, 2013). For a given decision rule, the efficient set is unique
for all investors who obey basis assumptions which underlie this rule, since in practice it
is applied objective data ,like rate of return on securities. According to an article
“making investment decisions with the net present value rule” (Steven, 2008).
Corporation determines the present value (NPV) means forecasting the cash flow of a
project and discounting them by a discount rate which cover opportunity costs of capital.
If positive NPV it shows on the results it means that the venture will create wealth.
41
According to top researchers firms have to decide to invest or not to invest, when faced
with new projects and investment (Gunasekaran, Love, Rahimi and Miele, 2001).
Investment decision rules allow for formalization of the process and specify what
conditions need be met for any projects to be accepted by looking at different investment
decisions rules.(Berk and DeMarzo,2010). At the outset, in order to maintain fair study
by project managers so as to bring in his or her prejudiced assessment into the decision
making process so as to ensure that different projects are judged without fail.
Consequently investment decision rule that is too automatic or rules are bended for
business than it is not a good rule, what is more it should be able to maximize the rule of
the firm. Projects that are suitable using this rule ought to boost the value of the firm
accommodating them. And for projects that do not meet the requirements, it would
obliterate the value, if the firm and invested in that project (Steven, 2008).
2.4.5 Access finance
Studies by Ochanda (2014), Njoroge and Gathungu (2013, Kimani (2013) and Njanja et
al 2010) also indicates that access to financial services is still a big challenge to micro
and medium enterprise in Kenya. Due to inaccessibility to bank loans and other credit,
most small business rely on own savings and reinvested profits. This makes owners and
managers of SMEs to experience a big financial gap in acquiring financial resources
since the savings and the profits are not adequate. Further challenges faced in accessing
credit from banks include inability of SMEs to provide collateral and other information
needed by the banks such un audited financial statements coupled with the high costs of
42
loan in terms of interest rates make extremely difficult to access bank loans (Vuvour &
Ackach, 2011). Hence a finance problem exists as SMEs cannot access funds from
financial institutions due to stringent credit terms, inability to pledge acceptable
collateral.
Access to finance is defined as availability of financial services in the forms of demand
deposits, credit, payments, or insurance (Beck & Honohan, 2007, Donovan, 2012,
Aduda & Kalunda, 2012,Anold &Jonhson,2012,Massa,2013).The availability of such
services can be constrained by physical access, affordability and eligibility. Barriers
such as high transaction cost, distance and minimum balance requirements can exclude
individuals and firms access to credit matters to SMEs. In particular, access to credit is
associated with positive growth, (2012, Ouma & Ramo, 2013).
Access to finance refers to the possibility that individuals or enterprises access financial
services including credit, insurance services and other risk management (Beck and
Demurguc 2006). It is the ability of affirm to get and use financial services that are
affordable, usable and meet their financial needs (Claessen, 2006). Access has four key
dimensions physical access, affordability, appropriate features that meet the users’
particular needs and appropriate terms that do not effectively exclude any category of
potential users. Access to finance services implies an absence to the use of these
services, whether that the obstacles are price or non-price barriers to finance (Demirguc-
Kunt et al, 2008).
43
In Kenya issues of constraint and uneven access have not faded away particularly in
rural areas despite recent innovations in credit markets (Aduda & Kalunda, 2012). For
example Atieno, (2001) observes that commercial banks and other formal institutions
often fail to cater for small borrowers because of their strict lending policies and
conditions. She also observes that 33% of borrowers in Kenya ranked credit constraints
as among their problems and that 68% of capital from informal sources. Lack of
adequate financial resources places a significant constraint on SME development. Cook
and Nixson (2005) observe that, notwithstanding the recognition of the role of SMEs in
development process in many developing countries, SMEs development is always
constrained by the limited availability of sources to meet a variety of operational and
investment needs. It is also confirmed that worldwide business face inadequate capital,
which is a stumbling block of potential growth of SMEs ( Mashenene &Rumanyika,
2014).
Although there has been a rapid growth in the microfinance sector over the years studies
like that of Brown and Makarius (2009) shows that 50 percent SMEs continue to have a
deteriorating performance with 3 in every 5 SMEs falling within the months of
establishment. However Mushimiyima,(2008) cited lack of collateral and high interest
rate as an impediment to access to loans from micro finance institutions. According to
Abubakar, (2009) a firms financial resource endowment is a vital determinant of the
growth and that firms inability to meet financial demands is mainly caused by market
imperfection that triggers due to information asymmetry. Atieno (2009) found that lack
44
of access to finance is a major constraint facing SMEs thus is one of the reasons for the
slow growth of SME firms in Kenya.
2.4.6 Empirical Review
This section presents some important empirical research findings from relevant literature
on the determinant of financial performance of small and medium enterprises in tourism
in Mombasa Kenya
Memba et al (2012) conducted a study to establish the impact of venture capital on
growth of SMEs in Kenya. The study used 200 SMEs that have been financed by
venture capital as the target population. The SMEs were drawn from various major
urban centers in Kenya. The SMEs were stratified according to their locality and a
random sampling was carried out by assigning numbers to each stratum. A sample of
100 firms was picked at random from which data was collected using a semi-structured
questionnaire as the main tool for data collection. Data was analyzed using descriptive
statistics with the help of SPSS computer software. The variables used to measure
growth were sale per annum, net assets, profit per annum and number of workers among
others. They were analyzed before and after the venture capital. The study established
that SMEs made significant growth after accessing the finance and recommended that
other SMEs should follow suit if the country has to achieve its vision 2030.
Chinaemerem and Anthony. (2012). Examined the impact of capital structure on
financial performance of Nigerian firms. Panel data for the selected firms were
45
generated and analyzed using ordinary least squares (OLS) as a method of estimation.
The result shows that affirms capital structure surrogated by Debt ratio has a significant
negative impact on the firm’s financial measure, return on asset (RAO) and return on
equity(ROE).
Beck et al, (2010) provide attempt to understand SME financing from the supply side.
Based on a survey of 91 banks in 45 countries, the author provide a characterization of
bank financing to SMEs and find that banks perceive the SME segment to be highly
profitable and serve it through a number of lending technologies and organizational set
ups. Data collected was analyzed using regression model. The authors observe few
differences in the extent SMEs are reached out by banks based on their private, public or
foreign-owned. However they find a significant differences across banks in developed
and developing economies and conclude that the enabling environment is more
important than size of the firm or bank ownership in sharping bank financing to SMEs.
Edelen and Kadlec, R. (2013) examined the link between a firm’s investor basic,
discount rate, capital budgeting decisions and profitability. They argue that a downward
shift in discount rates (cost of capital) associated with an expanded investor base can
account for both poor stock returns and operating performance following security
offerings. Data collected was analyzed using regression model. Their findings were that
an expansion in the firm’s investors’ base is both a necessary and sufficient condition for
46
anomalous poor performance. The study shows that a change in the capital structure can
affect performance.
Khaled and Samar (2013) studied the impact of capital financial leverage and the growth
rate of dividend on rate of return on investment .The study used multiple linear
regression analysis. The model included a number of independent variables which are
the cost of capital, financial leverage, and growth rate of dividend. The results of the
study showed that there is a positive effect and statistically significant for growth rate of
return on investment. On the other hand, the study showed no effect with statistical
significance for each of the cost of capital and finance leverage on the rate of return on
investment. This support the M&M study showing insignificant relationship between
cost of capital, financial leverage and rate of return on investment.
Muzenda (2014) investigated the conceptual model of determinants of performance of
tourism sector of SMEs in South African entrepreneur attributes, firm characteristic and
external environment are used in the study as the factors that influenced or affected SME
performance. A structured questionnaire was used as the method of data collection from
a total of one hundred and fifty one respondents randomly and the data collected was
analyzed using SPSS. Cronbach alpha shows 0.826 and Kaise –Meyer Olkin show 0.707
which indicate coefficients obtained from the chi square test. The findings indicate or
show that there is a significant association between entrepreneur attributes, firm
characteristic, external environment and SMEs performance.
47
Kinyua, (2014), identifies the factors affecting the performance of small and medium
scale enterprises in Jua kali sector in Nakuru Town of Kenya. In his study performance
of SMEs, was influenced by finance, management skills, macro- environment and
infrastructure. The research employed a survey research design and also employed a
stratified random sampling. Questionnaire was used as a primary method to collect data
from two hundred and sixty two respondents and the data collected was analyzed
descriptively and inferential and also it was presented through figures, tables and
percentages. The findings of the study indicate that access to finance had the potential to
positively affect performance of SMEs. Managerial skills were also found to positively
and significantly affect performance of SMEs, but infrastructure did not significantly
affect the performance of SMEs.
Mohamed and qamar, (2011) Studied the relationship between corporate performance
and cost of equity capital. Corporate performance was taken as an independent variable
and cost of equity was taken as a dependent variable while return on asset was taken as a
proxy to measure the corporate performance. Panel regression and Hausman test was
applied to check the effectiveness of random and fixed effect. The finding shows
insignificant relationship between corporate performance and cost of equity capital
which is consistent with Modigliani & Miller (1958) study.
Mensah and Agbekpornu (2015) analyzed the determinants of agribusiness in
Kumasi(Ghana) in accessing credit. A sample of 151 respondents was questioned. This
study classified these determinants as under social economics, management and firm
48
characteristics. Access to credit dichotomous whether one had access to credit or not and
a logit model was used to analyze the relationship between these variables. Results
indicated that 55% have never applied for loan before. Though in contrast to previous
studies most financial institutions did not strictly demand collateral security. Many
institutions focus more on the relationship and nature of transactions in the past in
granting credit. Logit model also indicated that for every increase collateral would lead
to a probability of 30& increase in credit. Financing also revealed a significant
relationship between the collateral security and access to credit.
Yazdanfar &Ohman (2014) examined the underlying link between debt financing and
firm performance. In particular this research employed panel data analysis to explore the
correlation between the variables in the Sweden context. They examined 15,897 in five
different industries for the period 2009 and 2012.They mainly focused on the effect of
maturity period od debt on profitability as measured by return on asset ratio (ROA).
They found debt financing to be negatively related to firm profitability in Sweden.
2.6 Critique of existing literature relevant to the study
Small and medium enterprises (SMEs) sector has received increased global attention
due to its growing importance in terms of income generation, labor absorption, poverty
alleviation and contributors to Gross domestic product (Aremu&Adeyemi2011,
Muhammad et al 2010, Subhan et al 2013). Macan Bhard (2010), added that the
realization of the significant economic contribution of SMEs has resulted in increased
attention focused on the sector from policy makers as well as academics. The economic
49
potential of the SMEs sector makes SMEs development as an important government
agenda and their contribution is crucial and remains as an integral part of economic
development of a country.
Globally SMEs sector has been reporting difficulties in access to finance (Bebeczuk,
2004, Sotty, 2009. Balling et al, 2009, Irwing &Scott, 2010 Yongqian et al (2012).
Access to external finance has become more costly and troublesome while their
accessibility has sharply declined. SMEs financing constraints limit their investment
opportunities and stagnant growth. Access to finance is widely perceived to be an
essential factor to firms and especially SMEs to maintain their daily business operations
as well as to achieve long term investment opportunities and development targets.
Presence of general limitations on access to capital markets, many East African firms
heavily for credit rely on the banking. Therefore a well banking sector plays an
important role in channeling resources to the best firms and investment venture.
Financing constraint crucially limit firms growth availability of productivity resources
resulting to sluggish of sector which might pose threat to the sector contribution to the
economy.
Msoka (2013) argued that business capital is the perquisite for development , hence
rising its quality and productivity is critical factor for ensuring SMEs growth and
reducing poverty levels even where microfinance institutions have come into to address
the issue of credit access , they have focused greatly on reducing poverty , instead of the
development of growth of SMEs, their loan size have therefore tended too small to
50
support growth (Stevenson,&St Onge, 2015) on the subject of supporting of investing in
innovation, in addition to challenges mentioned. Rogerso.(2015 pointed out that SMEs
are starved for finance support innovation even when they have sound business
expansion plans worthy of investment as they are considered risky because their
innovative business ideas have not been tried and tested
Cecchetti, Mohanly and Zampolly (2011) studied the effect of debt on firms and
concluded that moderate debt level improves welfare and enhances growth, but high
level can lead to a decline in growth of the firm. Ranhert and Rogoff (2009) argued that
when debt impacted positively to the growth a firm only when it is within certain levels.
When the ratio goes beyond certain levels, financial crises are very likely. The argument
is also supported by stern Stewart and company who argue that a high level of debt
increases the probability of a firm facing financial distress. Over borrowing can lead to
bankruptcy and financial ruin (Cecchetti, et al 2011). High level of debt will constrain
the firm from undertaking project that are likely to be profitable because of the inability
to attract more debt from financial institutions.
Debt financing has been used as an instrument of filling the budget deficits both in the
private and public sector (Onchonga, Muturi &Atambo,2016). Debt financing is a key
source of capital in many growing firms since their retained earnings may not be
sufficient enough or may be unavailable (Githaigo&Kabiru, 2015). By generating
incomes that may not have been gained with no extra financing external sources in firm
of equity or debt fund allows firms to improve the firm’s value which is traditionally
51
considered the vital goal of many business (Darydov, 2014). Herelimana states that the
core of debt is that the borrower will have to repay borrowed funds which are
accompanied with service charges such as loan origination fee and interest charges.
In Kenya the performance of SMEs has continued to decline over the years. According
to GOK, (2009) virtually most small enterprises had collapsed leading to the closure of
some of the SMEs that were producing 40% of the employment in Kenya .Other SMEs
were auctioned while some were merged or acquired signifying questionable financial
performance. The financial system in Kenya has grown rapidly in the last decade.
Though the largest in east Africa, it has failed to provide adequate access in banking
service to the bulk of the population and lending is skewed in favor of large private and
public enterprise in urban areas. This evidenced by distribution of bank branches at 93
percent in urban and in rural areas and 7 percent in arid and semi-arid areas
Trandafir,(2010).This demonstrate that the poor section of the society who are found in
rural and semi-arid areas have not been able to access adequately financial services. This
is despite the tangible reports on the state of financial inclusion in Kenya. Lack of
tangible security by SMEs, the limited capacity, outreach and linkages by financial
intermediaries and a holistic legal and regulatory framework for financial services are
the main constraint (GOK, 2005).
Gao and Banaji (2015) argued that owing to the existing growth appraisal systems,
SMEs pay more attention to quality growth and neglect the improvement of quality they
are kin on big, while ignoring the strong. This provides the explanation of many cases
52
where SMEs perform well today but go bankrupt tomorrow. Lavine (2004) summarizes
that, countries with better functioning banks and financial markets grow faster because it
enables the external financing constraints that impede SMEs explanation to be reduced,
and in so doing creates an environment for SMEs success or growth. Modgllian&Miller
(1958) explains the role of debt in firms profitability as one of the primary objectives of
contemporary researches for more than fifty years. However this role remains a
questionable subject which attracts the attention of many researchers such as Psillaki
(2010) and Kebewar (2012).
2.7 Research gaps
Access to SMEs financing is one of the most critical aspect of SME survival Wanjohi
(2012). Scholars like Birundu (2015), Berger et al (2009) and Mwobobia (2012) posit
that growth on any SME venture is determined by access to finance at different stages of
product and service development. (Atieno 2009) found out that lack of access to finance
is a major constraint facing SMEs in Kenya, and also being one of the reasons for the
slow growth of SME firms in Kenya. Accessibility is a big issue which is an implication
that SMEs do not have adequate funds to meet the needs at different levels of their
performance. Wanjohi (2012) also states that lack of and adequate access to credit is the
leading factor stifling the growth of small and medium enterprise. Therefore a finance
gap exists for firms starting or wishing to expand Garikai, (2011).
Evidence show that borrowers are then forced to limit their investments to retained
earnings, Iota & Wehinger (2015) thereby restricting enterprises growth and
53
development perceived as one of the main obstacles to doing business. Several studies
have shown that financing is a greater obstacle for SMEs than it is for large firms,
particularly in developing world, and that access to finance adversely affect the growth
of the SME sector more than of large companies (Osano & Laguiton,2016, Rambo 2013,
Schafer Wertwatz & Simmermann,2014). It is therefore unsurprising that international
development community has listed small and micro enterprise (SMEs) access to finance
as an important policy priority.
The successes so far of financial institutions only reach a fraction of the estimate
underlying demand owing to the problems associated with accessing alternative credit
facilities, as a large proportion of Kenyan SMEs rely more on self- financing in terms of
retained earnings. Ongolo & Awino (2013 also affirm the existence of limited access to
finance by the SMEs despite the existence of various potential institutions for SMEs in
the Kenya. The implication, therefore, is that SMEs do not have adequate credit to meet
their needs at different level of their growth. Regardless of SMEs being considered a
major driver innovation and employment as well as their potential in a country’s
economic development, recent empirical studies have found this view suggesting that
future of SMEs sector might be jeopardized due to financial constraint (Beck et al, 2005,
Aghion et al, 2007, Fatoki &Assar, 2011)
In view of the above studies this study therefore seeks to fill the gap and argued and
cited that lack of finance is one of the main reasons for SMEs poor financial
performance in most developing countries including Kenya. Lack of empirical research
54
and detailed information on the determinants of financial performance of SMEs is one
among the identified gaps, and the researcher therefore is motivated to investigating the
effect of financial determinants on financial performance of SMEs in Mombasa County
and environ in Kenya.
2.8 Summary
This study investigated the effect of financial determinants on financial performance of
SMEs in Mombasa and environs in Kenya. The literature identified four independent
variables of the study, capital structure, and cost of capital, investment decisions and
access to finance of the finance model which formed and provided the basis for the
development of a conceptual framework. The study presented theories including
Modglian &miller theory, pecking order theory, Agency theory, Trade off theory and
Modern portfolio theory. In addition the chapter provided a critic to the study which
formed the basis for identifying the research gaps for the study. This study therefore
investigated and generated data and information on the effect of financial determinants
on financial performance of small and medium enterprises in Mombasa County and the
environs in Kenya.
55
CHAPTER THREE
RESEARCH METHODOLOGY
3.1 Introduction
Research methodology is away to systematically solve the research problem
(Kothari,2009).This chapter discussed the methods and techniques employed in carrying
out this research to attain the stated objectives of the study. It covered areas of research
design, target population, sampling frame, sample size, sampling technique, data
collection procedure, pilot test, validity and reliability of questionnaires and data
analysis of the collected data.
3.2 Research design
Research design is an overall plan for the method to be used to collect and analyzes the
data of a research study (Hair et al, 2008). This study adopted a cross section survey
research design as it was suitable to describe the data at a specific point of time on
determinants of financial performance of SMEs. A cording to Kothari, (2010) cross
survey are part of descriptive studies and sought to put into perspective the views of
respondents participating in a study over a specific point in time over a given period of
time. Sekeran (2006), states that surveys are useful and powerful in finding answers to
research questions, but they could do more harm than good if not correctly targeted.
Bryman & Bell, (2011) states that a good research design depends on the purpose, skills
of the researcher, findings, and nature of the research problem such that while a
56
particular design may be good for one problem, it may not be equally good to other
problems.
The researcher used qualitative approach as it seeks to describe and analyze the
behavior and culture of humans and their groups from the point of view of those being
studied (Orodho & Kombo, 2002; Tromp, 2006). According to (Saunders et al,2009)
Qualitative research methods focus on describing and understanding the experience,
perspectives and thoughts of participants, therefore qualitative research explores
meaning and purpose or reality. Under the chosen design the study then followed a
descriptive-explanatory research purpose because in this study description is a precursor
to explanation. (Saunders, Lewis &Thornhill,2016). Qualitative research was adopted
because it enabled the researcher describe the different questions raised on the effect of
financial determinants on financial performance of SMEs. (Bryman &Bell, 2007), the
reason of choosing this design is its nature, which is to understand and interpret
financing theories in relations to financing of SMES and the problem formulated.
3.3 Philosophy Research
According to saunders et al (2009) research philosophy is the term relating to the
development of knowledge and nature of that knowledge. Depending on which research
philosophy being applied there will be different assumptions utilized which will
underpin the entire research strategy and method chosen. Both Epistemology and
Ontology are the two types of research philosophy adopted by this research as they are
some of the philosophical approaches relevant for our study as they are crucial to the
57
understanding of overall perspective from which the study is carried out. The
epistemology and ontology are closely related and interlinked in research and lead to
different approach of inquiry and help answer the research questions (Manson, 2002).
Both epistemology and ontology are philosophical approaches in research is concern
with what is constitutes acceptable knowledge in a field of study, the nature and method
of acquiring knowledge through the research process (Saunders et al,2009). The logical
position adopted is objectivism as most researchers focus on studying causal relationship
that is given meaning through empirical analysis. The research commitment is essential
in resolving the research problem. This research adopted qualitative approach which is
primality informed by the philosophical research paradigm of the problem and the fit
with the nature of the problem identified. The aim of this study is not to create new ideas
or theories, rather the theories will form the basis from which various hypotheses were
formulated to statistically test if there is a relationship between the dependent variable
and independent variables of the study.
3.4 Target Population
Kothari(2011) defines population as the total collection of elements. The target
population for this study was 1881comprised all licensed hotels, tours safaris and
restaurant as registered by Tourism regulatory Authority in Mombasa County and
environs in Kenya between 2012 and 2016. This SMEs sub sector was chosen due to its
growth potentially as compared with other sub sector in Mombasa County and environs.
Also SMEs contributes significantly to the economic and employment and creation of
58
jobs. For the purpose of this research only licensed business and licensed financial
institutions were used.
3.5 Sampling frame
The sampling frame for this research comprised list of registered hotels, restaurants and
tour safaris by Tourism Regulatory Authority Mombasa office up to 2016. This sample
was selected because it was easier and convenient layout for obtaining information and
data from the firms studied by the researcher. Sampling frame describes a complete list
of all cases in the largest population from which the research draws a sample (Saunders
et al, 2016). Also Sekran Bougie (2010) sampling frame can be described as a
representation of all items of the units of interest that constitute the population from
which a sample is selected.
3.6 Sample and sampling technique
Sampling techniques allowed the researcher to estimate the possible number of subjects
that could be included in the sample.
3.6.1 Sampling technique
Kombo and Tromp (2009) and Kothari.(2004) describes a sample as a collection of
units chosen from the universe to represent it. Lavrakas (2008) describe a sample in a
survey research context as a subset of elements drawn from a larger population.
Sampling techniques provide methods that help to reduce the amount of data needed to
be collected by considering only data from a sub-group rather than all possible cases or
59
elements Saunders et al, (2000). The method of stratified random sampling was
employed to arrive at the 330 SMEs, which the researcher believed possessed the
experience relevant to give information to the questions for this study. The reason for
using a sample rather than collecting data from the entire population, are self- evident. It
is practically impossible to collect data from or test, or examine every element. A
sample rather than the entire population is sometimes likely to produce reliable results.
Stratified random sampling procedure was used in this research study and ensured that
the sample accurately reflected the population on the basis of the criteria used for
stratification whereas random sampling ensured that each member of the target
population has an equal chance and independent chance of being selected (Oso and
Onen, 2005). According to Kothari (2012) stratified sampling is used when the
population from which a sample is to be drawn does not constitute a homogeneous
group. The method also involves dividing the population into a series of relevant strata
which implies that sample is likely to be more representatives (Saunder, et al, (2009). In
this sampling technique, we got random samples in population which was composed of
several SMEs Directors, Managers, Accountants and credit officers. From each of these
the sample size was drawn proportionately, and one or more Director (owners),
managers, accountants and credit officers as appropriate regardless of their gender were
chosen. Purposive sampling will be used to obtain desired information from the above
respondents because they are the only ones who conform to the desire set by the
researcher.
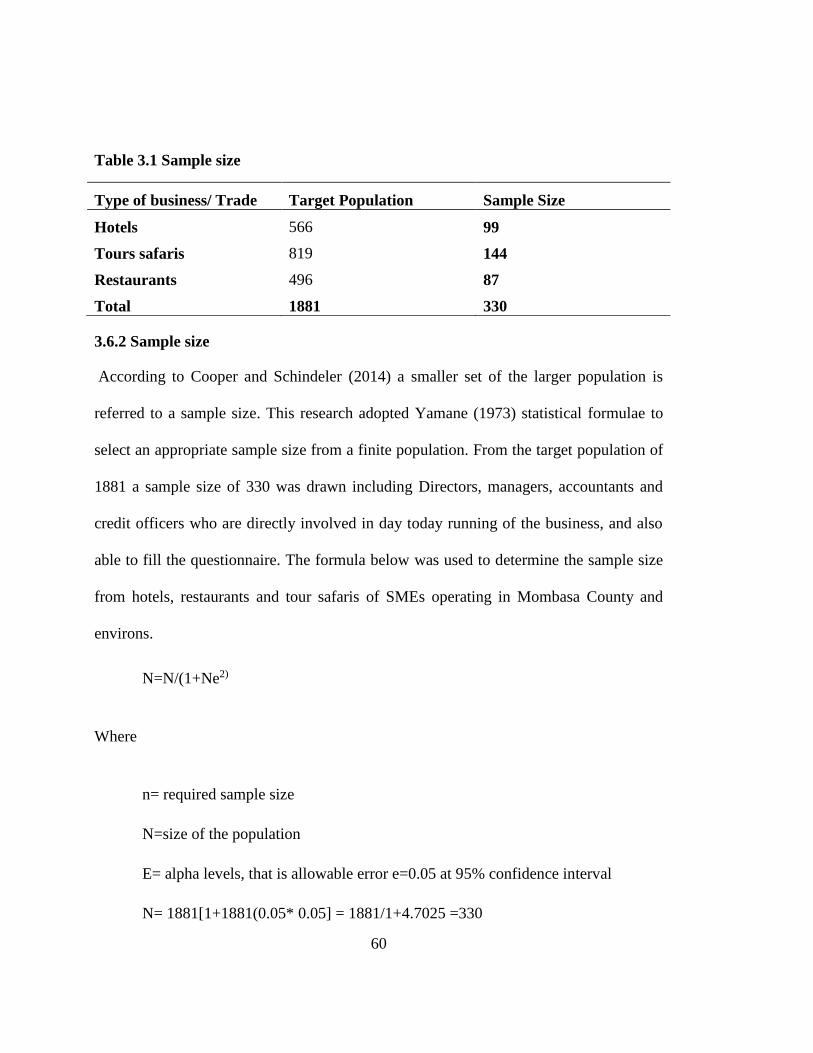
60
Table 3.1 Sample size
Type of business/ Trade Target Population Sample Size
Hotels 566 99
Tours safaris 819 144
Restaurants 496 87
Total 1881 330
3.6.2 Sample size
According to Cooper and Schindeler (2014) a smaller set of the larger population is
referred to a sample size. This research adopted Yamane (1973) statistical formulae to
select an appropriate sample size from a finite population. From the target population of
1881 a sample size of 330 was drawn including Directors, managers, accountants and
credit officers who are directly involved in day today running of the business, and also
able to fill the questionnaire. The formula below was used to determine the sample size
from hotels, restaurants and tour safaris of SMEs operating in Mombasa County and
environs.
N=N/(1+Ne2)
Where
n= required sample size
N=size of the population
E= alpha levels, that is allowable error e=0.05 at 95% confidence interval
N= 1881[1+1881(0.05* 0.05] = 1881/1+4.7025 =330
61
The study utilized a sample size of 330 as indicated above.
3.6 Data collection Instruments
The data collection instruments are the tools for data collection. They included
questionnaire, interview, observation and reading as explained below.
3.7.1 Primary data
The primary method of data collection provided first-hand information using an
interview guide designed including open ended questions. The research will comprise
of questions which were related to the participant’s perception and relevant to variables
and sub variable regarding the determinants of the financial performance. Primary data
was obtained through a standard questionnaire with the objective and structured
questions was self-administered and the use of a research assistant to Directors (owners),
managers, accountants and credit officers of selected and licensed SMEs in Mombasa
County and environs in Kenya. This was expected to elicit appropriate information from
SMEs which is assumed to have the relevant skills regarding their firms hence are able
to complete the questionnaire effectively. The questions were standard and based on the
theoretical frame work and practical application of financing of SMEs. For the purpose
of analyzing the data, the items in the questionnaire were assigned the Likert scale
scores (Likert Schuester, 1971). Likert scale was used to determine the respondents
agreement of strongly disagree, disagree, neutral, strongly agree and agree in a statement
as will be validated by my supervisors and was distributed to the respondents. The
62
researcher assured confidentiality of the survey sheets since the identities are not
important. The researcher also used the observation method, by visiting the local
financial institutions and SMEs to find out those accessed finance and how it affected
their financial performance. The observation assisted the researcher to establish whether
financing will play any role on the performance of SMEs.
3.7.2 Secondary data
The study used secondary sources from various important source documentations
including, archival records government ministries, tourism and regulatory authority,
trade and industry, department of statistics and electronic database believed to provide
access to relevant information, journal and publications related to the topic. According
to Bryman &Bell (2007) secondary data is the type of data that is readily available,
although published for reasons other than the research in context. Secondary data is
either published or unpublished and is readily available to the researcher and was
confronted with collecting it direct from the respondents. According to Saunders et al
(2009) secondary data is known to be cost effective as it is gathered from different
sources, for example textbooks, company annual reports, media sources and government
publications. Sherif (2016) illustrated numerous examples reporting outcomes of
qualitative secondary analysis with little emphasis on the process of analysis, evaluation
of data quality and sufficient and methodological challenges of the approach.
63
3.7 Data collection procedure
A structured questionnaire was used to collect data. The researcher and one trained
research assistant administered and collected completed questionnaires from the
respondents. The questions were carefully drafted to achieve the objectives and provide
satisfactory information for concluding the research. Also an interview guide was used
by the researcher, which provided face to face conversation with the respondents.
3.8 Pilot study
A pilot study tested reliability and validity of questionnaires was conducted before the
main study. Patton (2002) states that validity and reliability are two important factors
that are the qualitative research, and was concerned about designing a study, analyzing
the results and evaluating the quality of the study. According to Zikmund et al (2009)
recommend s that the questionnaire pre-test be done by personal interviews in order to
observe the respondents reaction and attitudes. The pilot testing questionnaire was
administered to 30 respondents drawn from randomly selected hotels, restaurants and
tour safaris SMEs enterprises. This is according to Saunders et al (2009) Zikmund
(2000). The finding of the pilot survey was used to improve the questionnaire and also
assist to draw a realistic work plan. Cronbach’s alpha to test reliability of data was
applied.
64
3.8.1 Reliability
Validity and Reliability are two important test of sound measurement procedures to
observe when conducting research study. Reliability refers to the ability of an instrument
to produce consistent results. Reliability testing was used to find out about data collected
and measuring instruments. Cronbach’s alpha reliability coefficient that indicates how
the items in a test are positively correlated was used. The closer the reliability coefficient
is to 1, the higher the internal consistency reliability. In general terms Cronbach of 0.7
and 0.8 is an acceptable range while if it is 0.6 and below is poor
(Sekaran,2003).Cronbach’s Alpha is a general form of the Kunder-Richardson (K-R)
formula used to asses internal consistence of an instrument based on split-half reliability
of data from all possible halves of the instrument. Kunder-Richardson (K-R) 20 is based
on the following formula provided below:-
KRO=(K) (S2-Es2)
S2 (K-1)
Where;
KR 20 Reliability coefficient of internal consistence
K- Number of items used to measure the concept
S2- Variance of all scores
S2 Variance of individuals
65
Factor analysis was carried out to test for construct validity and highlight variability
among observed variables and also to check for any correlation variables in order to
reduce redundancy in data (Hair et al, 2010)
3.8.2 Validity
Validity is the most critical criterion and indicates the degree to which an instrument
measures to reflect true differences among those being tested. Validity means the ability
to produce accurate results that reflect the true situation and condition of the
environment it is supposed to study (Sarantakos 1998). Content validity was used to
examine whether question tests were for what it was intended to test. Validity of the
instruments was obtained to determine judgment and intuitive. Validity was to determine
whether the research truly measures that which intended to measure or how truthful the
research results are. Factor analysis was used to test of validity in this study.
3.9 Data Analysis and presentation
Cooper and Schinler (2008) highlighted data analysis as inspection ,cleaning
,transforming and modeling data in order highlight useful information to draw
conclusions and support decision making. The collected data was coded and entered into
SPSS to create information that will be used for analysis. In these research two types of
data analysis was done. This study applied a multiple methods of analysis in addressing
the determinants on financial performance of SMEs by using both qualitative methods.
Quantitative analysis use statistical analysis and qualitative using SWOT analysis. Data
66
analysis involved organizing, accounting for and explaining the data, which made sense
of the data in terms of respondents’ definition noting patterns, themes categories and
regularities (Gay, 1987). Descriptive analysis was analyzed involving the evidence from
data collected. Analyzed data was presented using frequency tables to find out the
percentage of response of each category in the variable that included response rate to
questions. Quantitative data analysis was executed through descriptive statistics such as
means, standard deviations, and percentages, frequencies using the statistical package for
social science (SPSS Version 20) which has incredible capabilities of executing such
high-level analysis as of variance (ANOVA), chi-square test, multivariate analysis
correlation and multiple regression analysis, tests of statistical hypothesis. The null
hypothesis was tested at the 0.05 (5%] level of significant.
3.9.1 Multiple Regression Model
Multiple regression analysis was used for modeling the relation between the depended
variable and independent variables. Its basic aim is to build a mathematical model to
relate dependent variable to independent variables. Completed questionnaires were
edited and corded for completeness and consistency. The data then was analyzed using
SPSS version 20 which generated qualitative reports of percentages and tables. The
multiple regression analysis models on predicted level of dependent variable to the
levels of independent variables were chosen as the approach to analyze data.
Given the dependent variable the regression model was as follows;
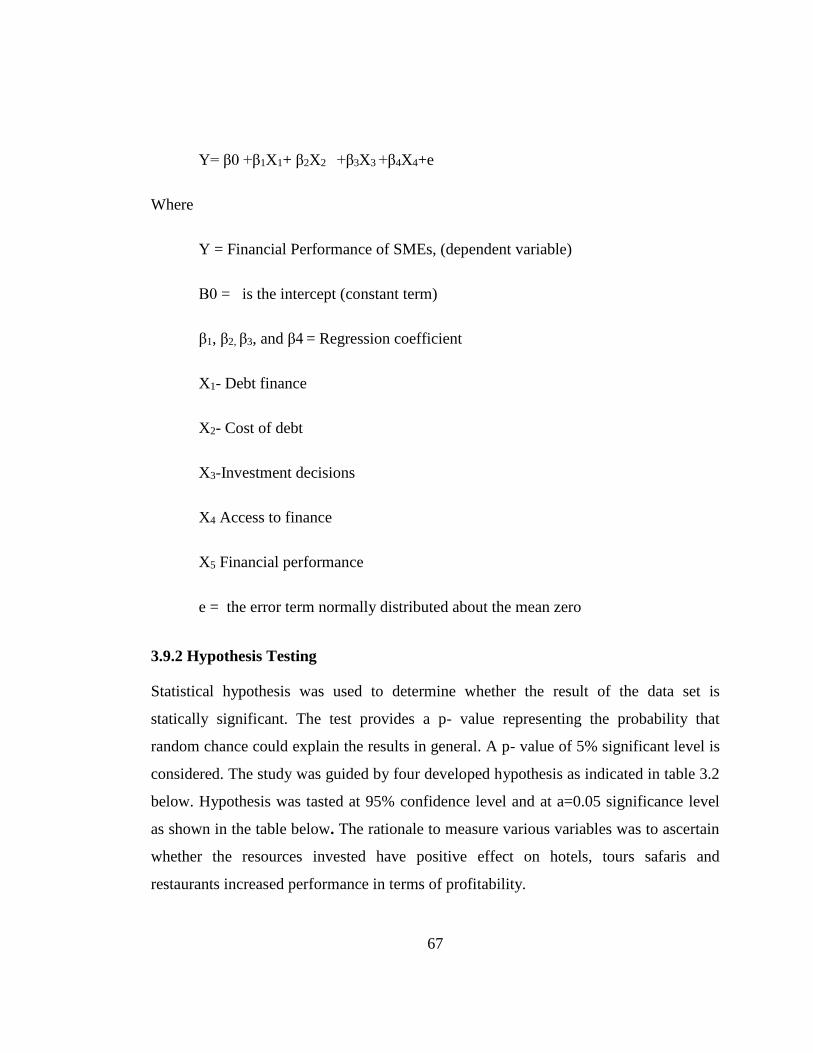
67
Y= β0 +β1X1+ β2X2 +β3X3 +β4X4+e
Where
Y = Financial Performance of SMEs, (dependent variable)
Β0 = is the intercept (constant term)
β1, β2, β3, and β4 = Regression coefficient
X1- Debt finance
X2- Cost of debt
X3-Investment decisions
X4 Access to finance
X5 Financial performance
e = the error term normally distributed about the mean zero
3.9.2 Hypothesis Testing
Statistical hypothesis was used to determine whether the result of the data set is
statically significant. The test provides a p- value representing the probability that
random chance could explain the results in general. A p- value of 5% significant level is
considered. The study was guided by four developed hypothesis as indicated in table 3.2
below. Hypothesis was tasted at 95% confidence level and at a=0.05 significance level
as shown in the table below. The rationale to measure various variables was to ascertain
whether the resources invested have positive effect on hotels, tours safaris and
restaurants increased performance in terms of profitability.
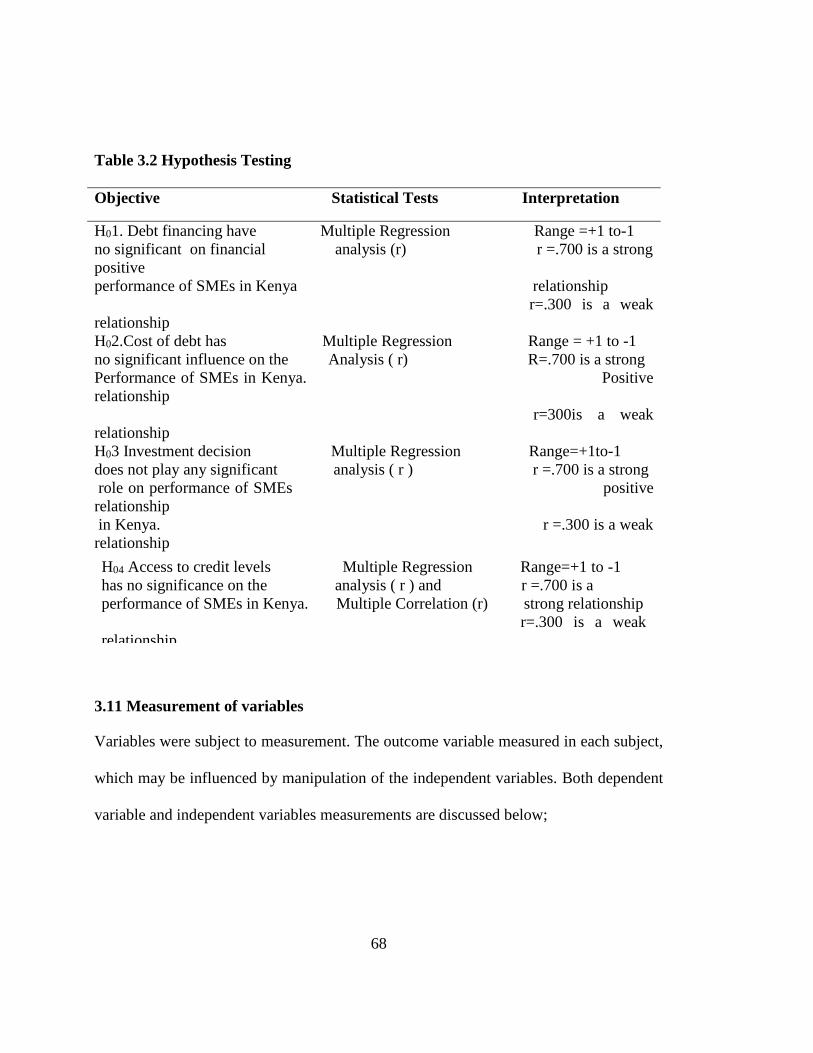
68
Table 3.2 Hypothesis Testing
3.11 Measurement of variables
Variables were subject to measurement. The outcome variable measured in each subject,
which may be influenced by manipulation of the independent variables. Both dependent
variable and independent variables measurements are discussed below;
Objective Statistical Tests Interpretation
H01. Debt financing have Multiple Regression Range =+1 to-1
no significant on financial analysis (r) r =.700 is a strong
positive
performance of SMEs in Kenya relationship
r=.300 is a weak
relationship
H02.Cost of debt has Multiple Regression Range = +1 to -1
no significant influence on the Analysis ( r) R=.700 is a strong
Performance of SMEs in Kenya. Positive
relationship
r=300is a weak
relationship
H03 Investment decision Multiple Regression Range=+1to-1
does not play any significant analysis ( r ) r =.700 is a strong
role on performance of SMEs positive
relationship
in Kenya. r =.300 is a weak
relationship
H04 Access to credit levels Multiple Regression Range=+1 to -1
has no significance on the analysis ( r ) and r =.700 is a
performance of SMEs in Kenya. Multiple Correlation (r) strong relationship
r=.300 is a weak
relationship
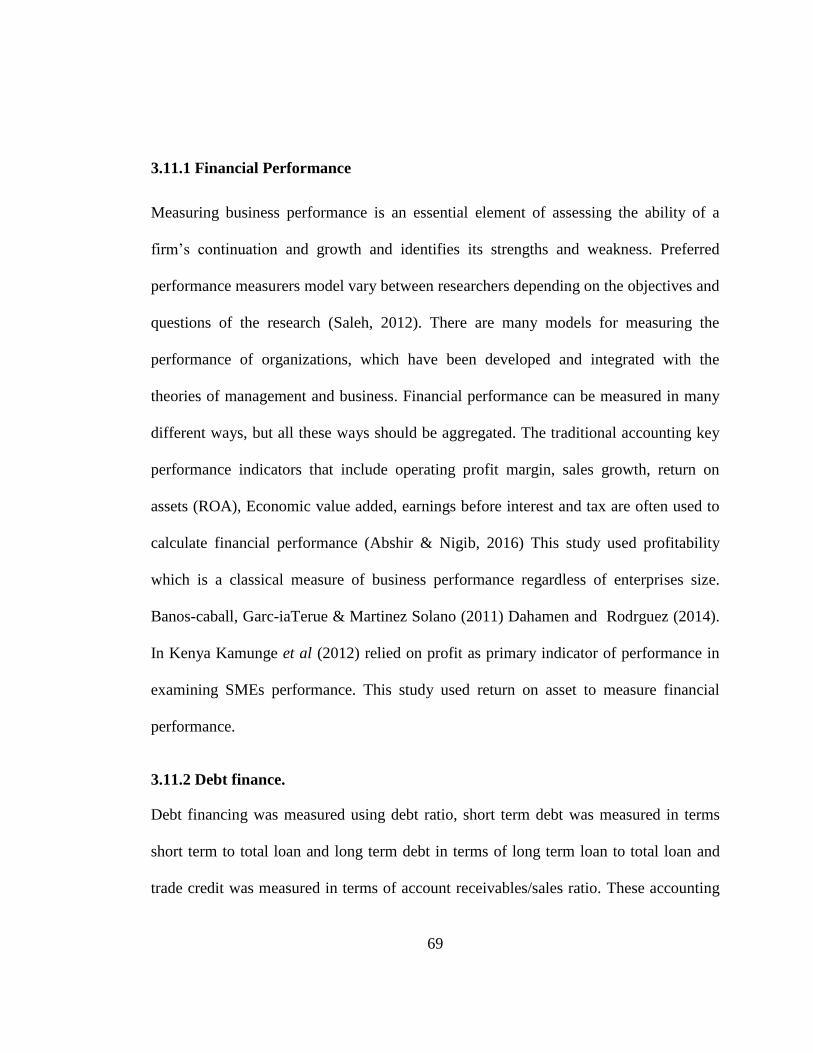
69
3.11.1 Financial Performance
Measuring business performance is an essential element of assessing the ability of a
firm’s continuation and growth and identifies its strengths and weakness. Preferred
performance measurers model vary between researchers depending on the objectives and
questions of the research (Saleh, 2012). There are many models for measuring the
performance of organizations, which have been developed and integrated with the
theories of management and business. Financial performance can be measured in many
different ways, but all these ways should be aggregated. The traditional accounting key
performance indicators that include operating profit margin, sales growth, return on
assets (ROA), Economic value added, earnings before interest and tax are often used to
calculate financial performance (Abshir & Nigib, 2016) This study used profitability
which is a classical measure of business performance regardless of enterprises size.
Banos-caball, Garc-iaTerue & Martinez Solano (2011) Dahamen and Rodrguez (2014).
In Kenya Kamunge et al (2012) relied on profit as primary indicator of performance in
examining SMEs performance. This study used return on asset to measure financial
performance.
3.11.2 Debt finance.
Debt financing was measured using debt ratio, short term debt was measured in terms
short term to total loan and long term debt in terms of long term loan to total loan and
trade credit was measured in terms of account receivables/sales ratio. These accounting
70
measures representing the financial ratios from the balance sheet and income statements
have been used by many researchers including Demset, and Lehn,(1985),Gorton and
Rosen,(1995),Mehran()1995 and Ang, Cole and line (2000).
3.11.3 Cost of debt
Interest rate spreads are hypnotized to be a function of bank specific and industry
specific variables as well as macroeconomic factors, in the line with similar studies in
the literature Chirwa & Machila,(2004), Entrop et al (2012), Bennaceur &
Goald,(2012), Siddquii (2012). The specific variables include bank size, credit risk as
measured by non-performing loans to total loans ratio and liquidity risk (ratio of banks
assets to total assets), return on average assets, operating cost as a ratio of total net
income and net interest as a ratio of total income.
3.11.4 Investment decisions
According to Berk & De-marzo (2010) there are two methods to estimate returns of
investments. Each method has two types of investment decision rules. The traditional
method which is divided into two pay back and the average rate of return and the
discounted cash flow technique is further separated into two the Net Present Value
(NPV) and Internal Rate of Return (IRR), which the researcher used to measure
investment decisions. Two of the most common investment measures are return on total
assets (ROA) and return on shareholders’ Equity (ROE). ROA is perhaps the best
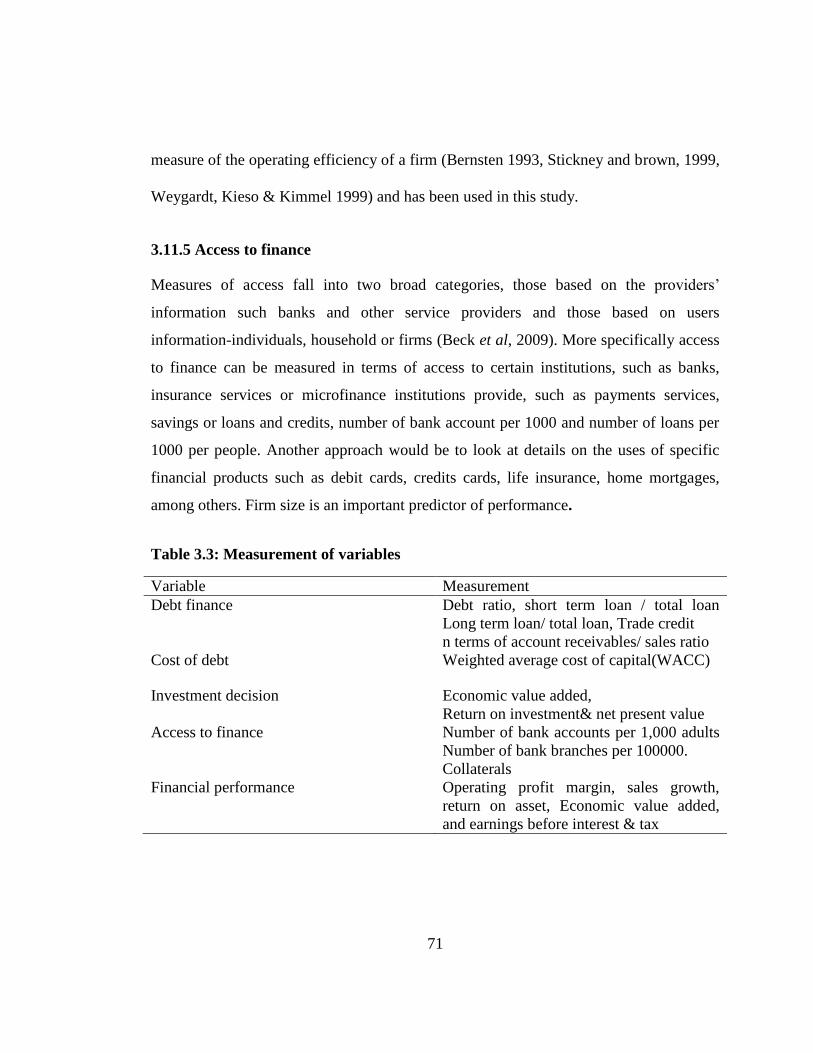
71
measure of the operating efficiency of a firm (Bernsten 1993, Stickney and brown, 1999,
Weygardt, Kieso & Kimmel 1999) and has been used in this study.
3.11.5 Access to finance
Measures of access fall into two broad categories, those based on the providers’
information such banks and other service providers and those based on users
information-individuals, household or firms (Beck et al, 2009). More specifically access
to finance can be measured in terms of access to certain institutions, such as banks,
insurance services or microfinance institutions provide, such as payments services,
savings or loans and credits, number of bank account per 1000 and number of loans per
1000 per people. Another approach would be to look at details on the uses of specific
financial products such as debit cards, credits cards, life insurance, home mortgages,
among others. Firm size is an important predictor of performance.
Table 3.3: Measurement of variables
Variable Measurement
Debt finance Debt ratio, short term loan / total loan
Long term loan/ total loan, Trade credit
n terms of account receivables/ sales ratio
Cost of debt Weighted average cost of capital(WACC)
Investment decision Economic value added,
Return on investment& net present value
Access to finance Number of bank accounts per 1,000 adults
Number of bank branches per 100000.
Collaterals
Financial performance
Operating profit margin, sales growth,
return on asset, Economic value added,
and earnings before interest & tax
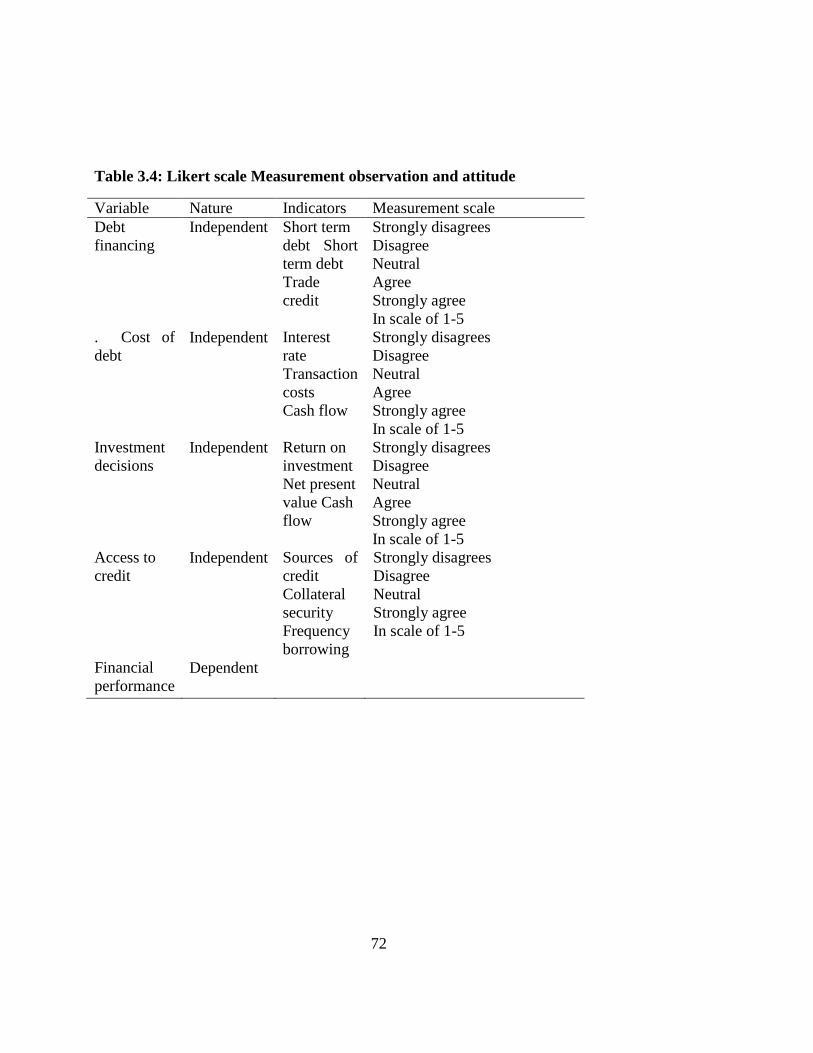
72
Table 3.4: Likert scale Measurement observation and attitude
Variable Nature Indicators Measurement scale
Debt
financing
Independent Short term
debt Short
term debt
Trade
credit
Strongly disagrees
Disagree
Neutral
Agree
Strongly agree
In scale of 1-5
. Cost of
debt
Independent Interest
rate
Transaction
costs
Cash flow
Strongly disagrees
Disagree
Neutral
Agree
Strongly agree
In scale of 1-5
Investment
decisions
Independent Return on
investment
Net present
value Cash
flow
Strongly disagrees
Disagree
Neutral
Agree
Strongly agree
In scale of 1-5
Access to
credit
Independent Sources of
credit
Collateral
security
Frequency
borrowing
Strongly disagrees
Disagree
Neutral
Strongly agree
In scale of 1-5
Financial
performance
Dependent
73
CHAPTER FOUR
RESEARCH FINDINGS AND DISCUSSION
4.1 Introduction
This chapter presents the data analysis and results of the study and discussed the
findings and interpretations of findings in consistent with the research objectives and the
results for each hypotheses reported. The general objective of the study was to
investigate the determinants of financial performance of SMEs in tourism sector in
Mombasa and environs Kenya. The quantitative data obtained was analyzed using both
descriptive; means, standard deviation variance are reported for the tested variables.
Frequency, and inferential statistics, ANOVA, chi-square were used for testing
significance levels, multiple regressions and correlation coefficient for determining
relationships, hypothesis as guided by the research objectives in reference. In all the
above SPSS software was used for data analysis.
4.2 Response Rate
The study targeted 330 respondents from the SMEs in Mombasa County and environs
who operated small and medium enterprises in the tourism sector. Out of 330
questionnaires distributed only 263 questionnaires were filled and returned .This gave a
response rate of 80%. This is inconformity with Kwankwo, (2007) who poised that
survey researchers face a challenge of low response rate that rarely goes above 50%.
They further suggest that a rate response rate of 50% is satisfactory and represents a

74
good basis for data analysis. According to Mugenda and Mugenda, (2003) a 50%
response is adequate, 60% is good and above 70% is very good. Also Kothari,(2004)
asserts that a response rate of 50% is adequate, while a response rate greater than 70%
is very good. Babbie, (2004) also asserts that return rate of 50% are acceptable to
analyze and publish 60% is good and 70 % is very good. The 80% for this study was
considered very high to the usually expected response rate of 50- 75 % according to
Saunders et al (2007), therefore the response for this study was considered to be ideal,
adequate and reliable for the research as recommended by the above researchers and as
shown in table 4.1 below
Table 4.1 Response rate
Frequency Percent
Returned 263 79. 697 %
Unreturned 66 20.303 %
Total 330 100
4.3 Normality Test
Tests of normality for variables debt finance, cost of debt, investment decision and
access to finance on financial performance of SMEs was performed. To test normality
distribution Kolmogorov-Smirnov (K-S) test and Shapiro and Wilk were computed
using SPSS to determine whether the data is normally distributed, as indicated in table
4.2 below and the result thereof. According to the results for debt finance, cost of debt,
investment decisions and access to finance on financial performance of SMEs in
Mombasa County as shown in table 4.2 above, it is clear that tests have a p- value of the
four independent variables greater than 0.05 indicating that the data is normally
distributed and adequate. The test was also non- significant therefore normally
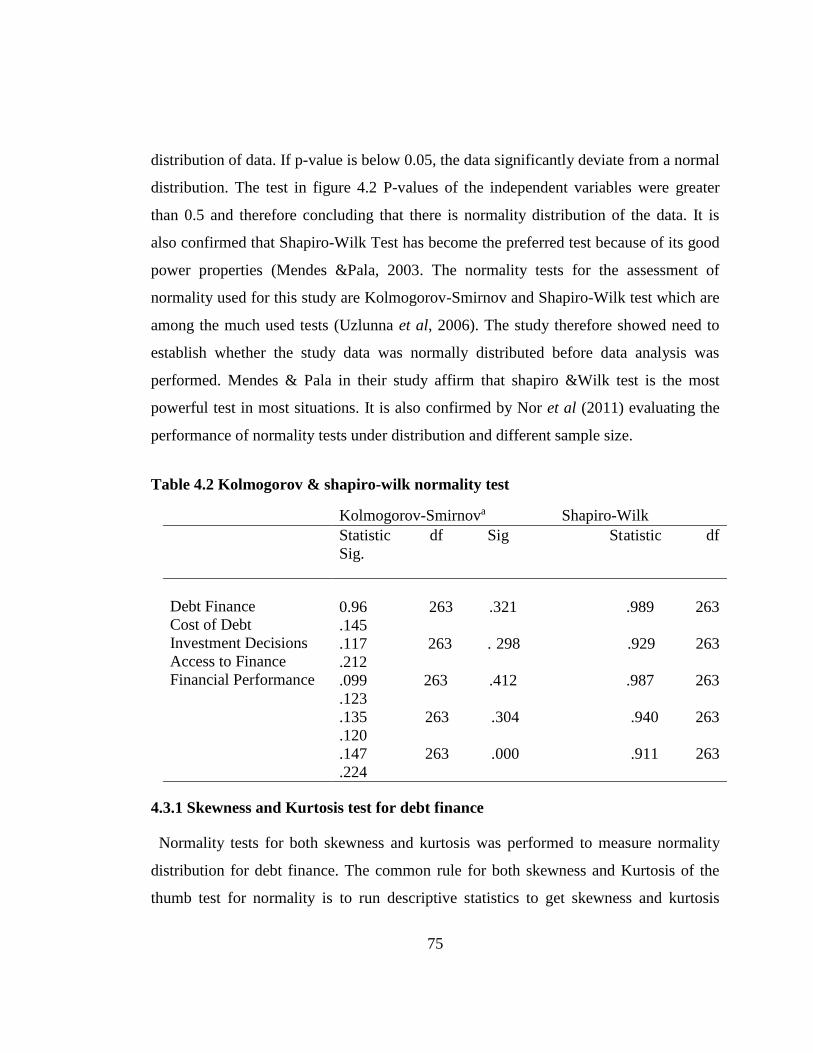
75
distribution of data. If p-value is below 0.05, the data significantly deviate from a normal
distribution. The test in figure 4.2 P-values of the independent variables were greater
than 0.5 and therefore concluding that there is normality distribution of the data. It is
also confirmed that Shapiro-Wilk Test has become the preferred test because of its good
power properties (Mendes &Pala, 2003. The normality tests for the assessment of
normality used for this study are Kolmogorov-Smirnov and Shapiro-Wilk test which are
among the much used tests (Uzlunna et al, 2006). The study therefore showed need to
establish whether the study data was normally distributed before data analysis was
performed. Mendes & Pala in their study affirm that shapiro &Wilk test is the most
powerful test in most situations. It is also confirmed by Nor et al (2011) evaluating the
performance of normality tests under distribution and different sample size.
Table 4.2 Kolmogorov & shapiro-wilk normality test
Kolmogorov-Smirnova Shapiro-Wilk
Statistic df Sig Statistic df
Sig.
Debt Finance
Cost of Debt
Investment Decisions
Access to Finance
Financial Performance
0.96 263 .321 .989 263
.145
.117 263 . 298 .929 263
.212
.099 263 .412 .987 263
.123
.135 263 .304 .940 263
.120
.147 263 .000 .911 263
.224
4.3.1 Skewness and Kurtosis test for debt finance
Normality tests for both skewness and kurtosis was performed to measure normality
distribution for debt finance. The common rule for both skewness and Kurtosis of the
thumb test for normality is to run descriptive statistics to get skewness and kurtosis
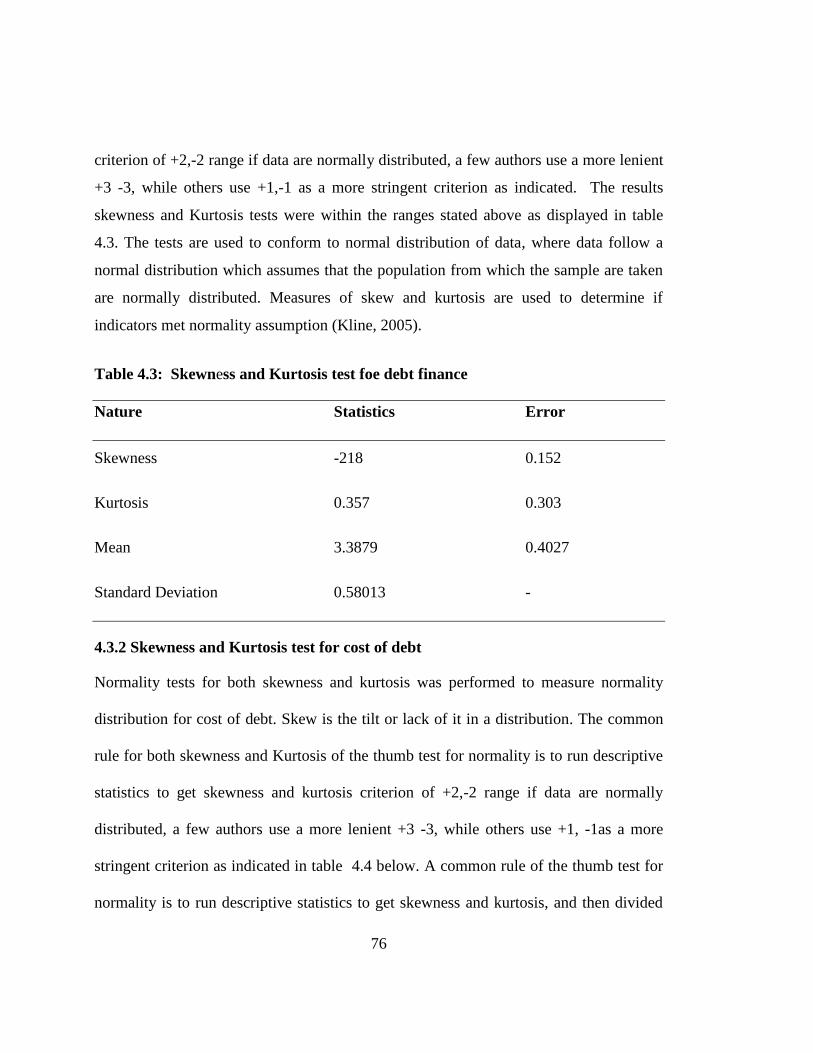
76
criterion of +2,-2 range if data are normally distributed, a few authors use a more lenient
+3 -3, while others use +1,-1 as a more stringent criterion as indicated. The results
skewness and Kurtosis tests were within the ranges stated above as displayed in table
4.3. The tests are used to conform to normal distribution of data, where data follow a
normal distribution which assumes that the population from which the sample are taken
are normally distributed. Measures of skew and kurtosis are used to determine if
indicators met normality assumption (Kline, 2005).
Table 4.3: Skewness and Kurtosis test foe debt finance
Nature Statistics Error
Skewness -218 0.152
Kurtosis 0.357 0.303
Mean 3.3879 0.4027
Standard Deviation 0.58013 -
4.3.2 Skewness and Kurtosis test for cost of debt
Normality tests for both skewness and kurtosis was performed to measure normality
distribution for cost of debt. Skew is the tilt or lack of it in a distribution. The common
rule for both skewness and Kurtosis of the thumb test for normality is to run descriptive
statistics to get skewness and kurtosis criterion of +2,-2 range if data are normally
distributed, a few authors use a more lenient +3 -3, while others use +1, -1as a more
stringent criterion as indicated in table 4.4 below. A common rule of the thumb test for
normality is to run descriptive statistics to get skewness and kurtosis, and then divided
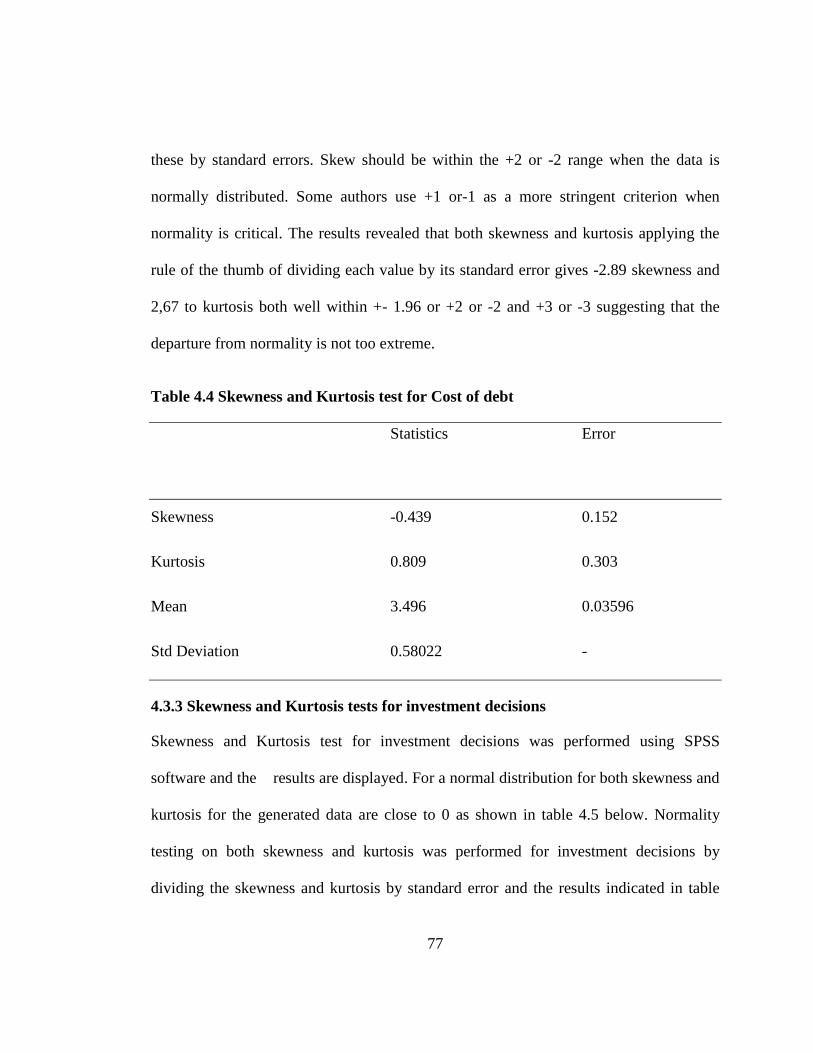
77
these by standard errors. Skew should be within the +2 or -2 range when the data is
normally distributed. Some authors use +1 or-1 as a more stringent criterion when
normality is critical. The results revealed that both skewness and kurtosis applying the
rule of the thumb of dividing each value by its standard error gives -2.89 skewness and
2,67 to kurtosis both well within +- 1.96 or +2 or -2 and +3 or -3 suggesting that the
departure from normality is not too extreme.
Table 4.4 Skewness and Kurtosis test for Cost of debt
Statistics Error
Skewness -0.439 0.152
Kurtosis 0.809 0.303
Mean 3.496 0.03596
Std Deviation 0.58022 -
4.3.3 Skewness and Kurtosis tests for investment decisions
Skewness and Kurtosis test for investment decisions was performed using SPSS
software and the results are displayed. For a normal distribution for both skewness and
kurtosis for the generated data are close to 0 as shown in table 4.5 below. Normality
testing on both skewness and kurtosis was performed for investment decisions by
dividing the skewness and kurtosis by standard error and the results indicated in table
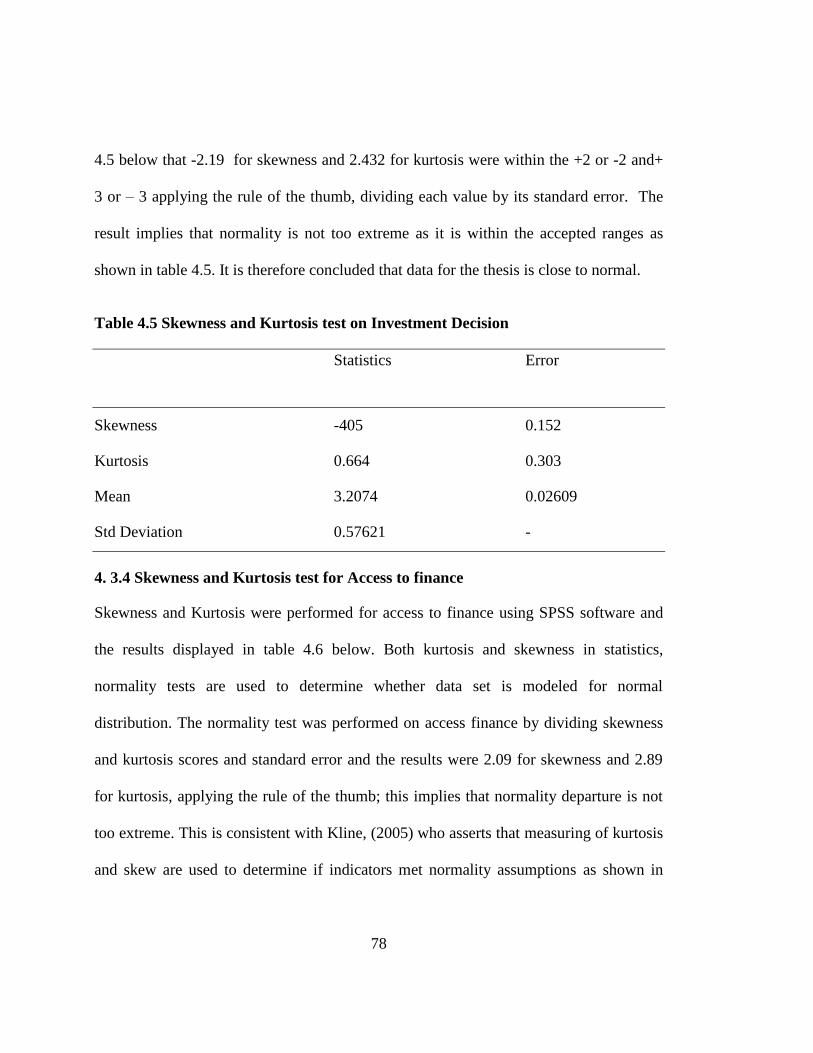
78
4.5 below that -2.19 for skewness and 2.432 for kurtosis were within the +2 or -2 and+
3 or – 3 applying the rule of the thumb, dividing each value by its standard error. The
result implies that normality is not too extreme as it is within the accepted ranges as
shown in table 4.5. It is therefore concluded that data for the thesis is close to normal.
Table 4.5 Skewness and Kurtosis test on Investment Decision
Statistics Error
Skewness -405 0.152
Kurtosis 0.664 0.303
Mean 3.2074 0.02609
Std Deviation 0.57621 -
4. 3.4 Skewness and Kurtosis test for Access to finance
Skewness and Kurtosis were performed for access to finance using SPSS software and
the results displayed in table 4.6 below. Both kurtosis and skewness in statistics,
normality tests are used to determine whether data set is modeled for normal
distribution. The normality test was performed on access finance by dividing skewness
and kurtosis scores and standard error and the results were 2.09 for skewness and 2.89
for kurtosis, applying the rule of the thumb; this implies that normality departure is not
too extreme. This is consistent with Kline, (2005) who asserts that measuring of kurtosis
and skew are used to determine if indicators met normality assumptions as shown in
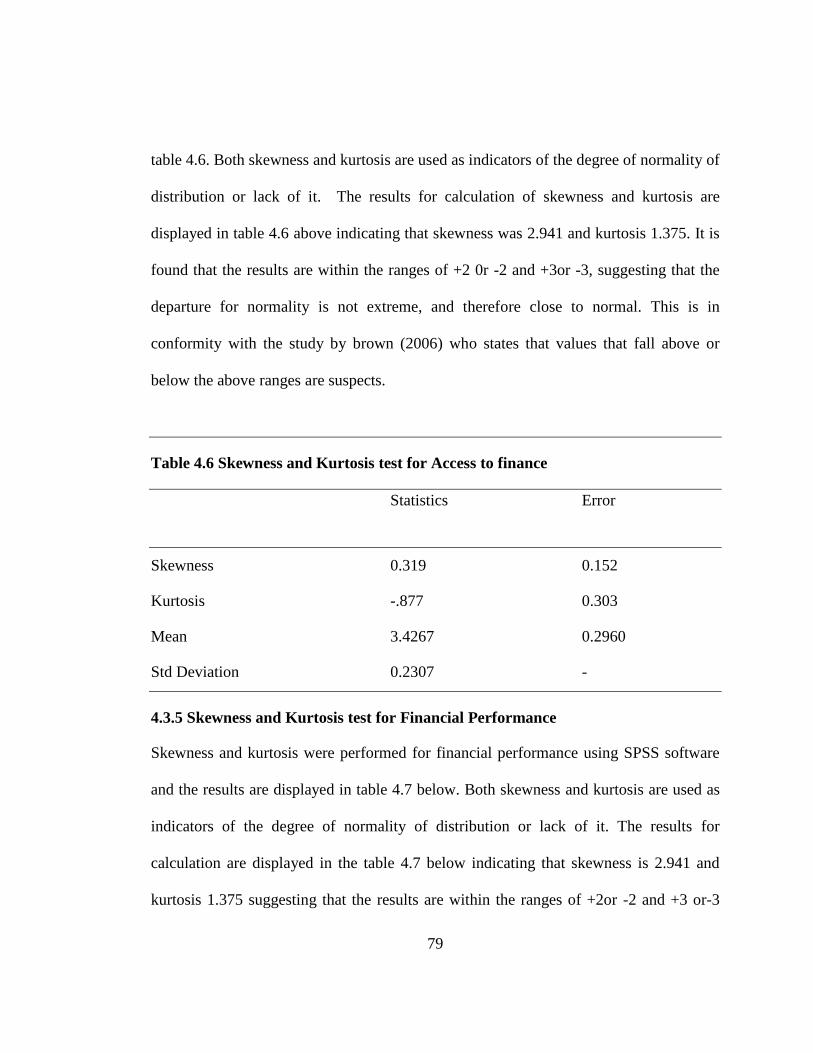
79
table 4.6. Both skewness and kurtosis are used as indicators of the degree of normality of
distribution or lack of it. The results for calculation of skewness and kurtosis are
displayed in table 4.6 above indicating that skewness was 2.941 and kurtosis 1.375. It is
found that the results are within the ranges of +2 0r -2 and +3or -3, suggesting that the
departure for normality is not extreme, and therefore close to normal. This is in
conformity with the study by brown (2006) who states that values that fall above or
below the above ranges are suspects.
Table 4.6 Skewness and Kurtosis test for Access to finance
Statistics Error
Skewness 0.319 0.152
Kurtosis -.877 0.303
Mean 3.4267 0.2960
Std Deviation 0.2307 -
4.3.5 Skewness and Kurtosis test for Financial Performance
Skewness and kurtosis were performed for financial performance using SPSS software
and the results are displayed in table 4.7 below. Both skewness and kurtosis are used as
indicators of the degree of normality of distribution or lack of it. The results for
calculation are displayed in the table 4.7 below indicating that skewness is 2.941 and
kurtosis 1.375 suggesting that the results are within the ranges of +2or -2 and +3 or-3
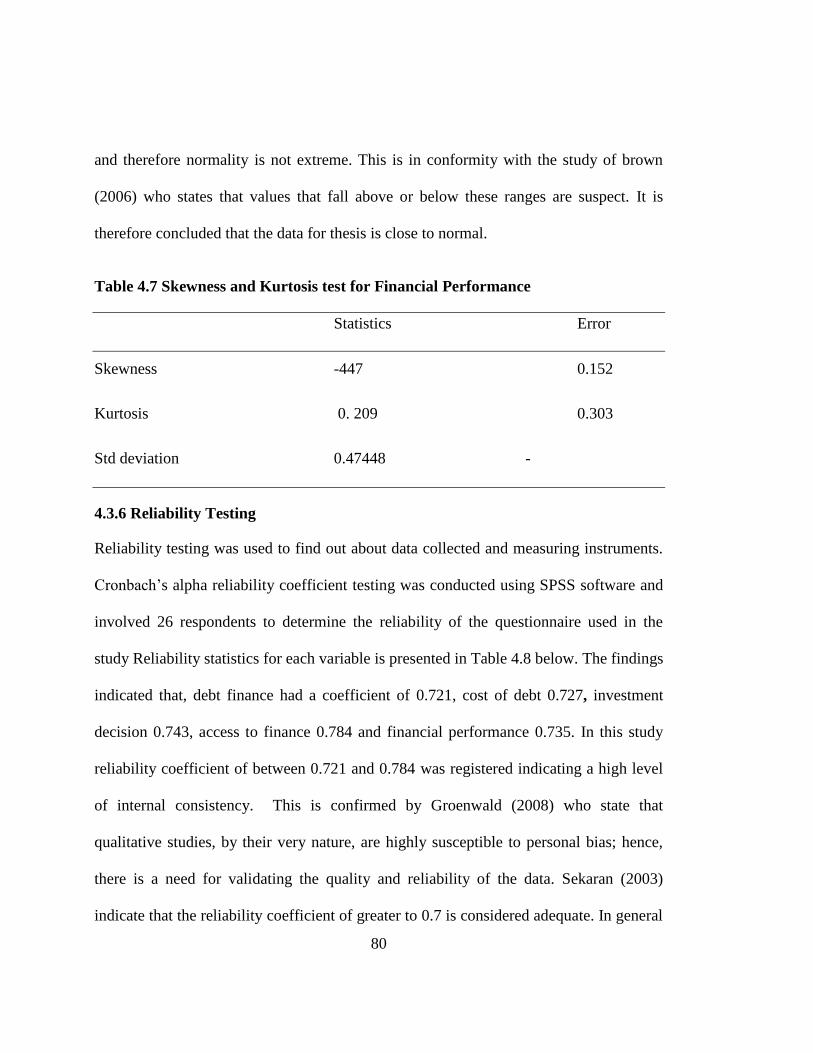
80
and therefore normality is not extreme. This is in conformity with the study of brown
(2006) who states that values that fall above or below these ranges are suspect. It is
therefore concluded that the data for thesis is close to normal.
Table 4.7 Skewness and Kurtosis test for Financial Performance
Statistics Error
Skewness -447 0.152
Kurtosis 0. 209 0.303
Std deviation 0.47448 -
4.3.6 Reliability Testing
Reliability testing was used to find out about data collected and measuring instruments.
Cronbach’s alpha reliability coefficient testing was conducted using SPSS software and
involved 26 respondents to determine the reliability of the questionnaire used in the
study Reliability statistics for each variable is presented in Table 4.8 below. The findings
indicated that, debt finance had a coefficient of 0.721, cost of debt 0.727, investment
decision 0.743, access to finance 0.784 and financial performance 0.735. In this study
reliability coefficient of between 0.721 and 0.784 was registered indicating a high level
of internal consistency. This is confirmed by Groenwald (2008) who state that
qualitative studies, by their very nature, are highly susceptible to personal bias; hence,
there is a need for validating the quality and reliability of the data. Sekaran (2003)
indicate that the reliability coefficient of greater to 0.7 is considered adequate. In general
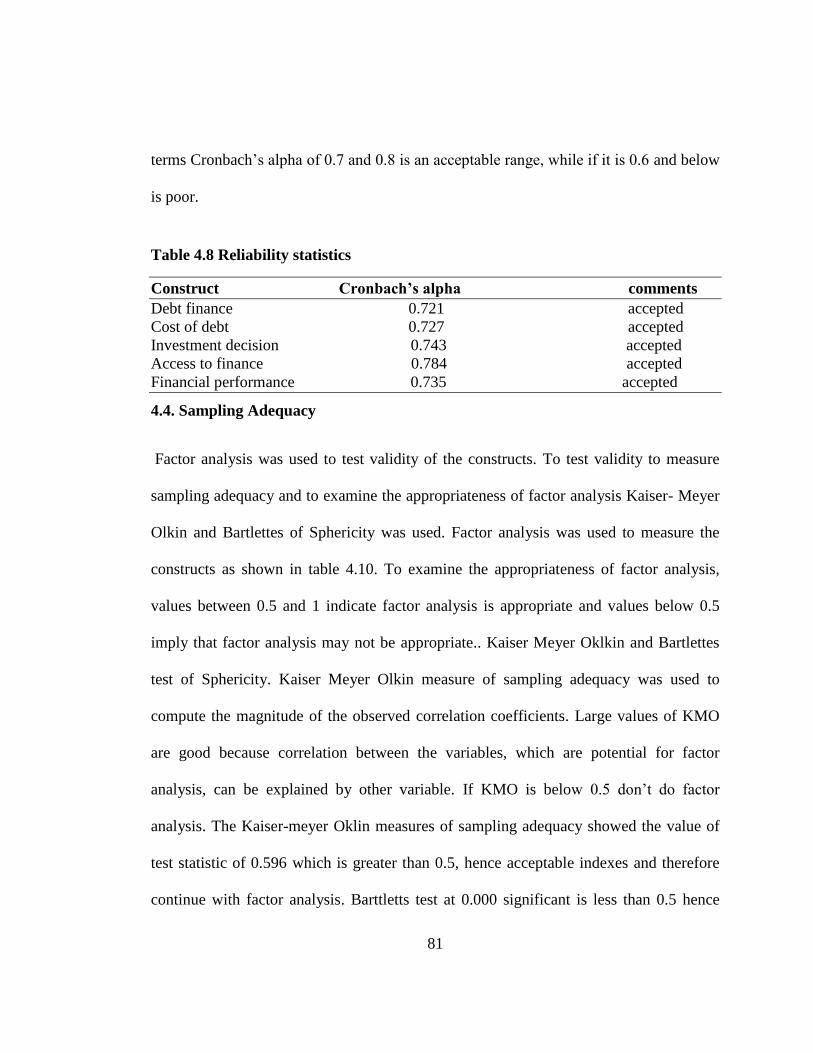
81
terms Cronbach’s alpha of 0.7 and 0.8 is an acceptable range, while if it is 0.6 and below
is poor.
Table 4.8 Reliability statistics
Construct Cronbach’s alpha comments
Debt finance 0.721 accepted
Cost of debt 0.727 accepted
Investment decision 0.743 accepted
Access to finance 0.784 accepted
Financial performance 0.735 accepted
4.4. Sampling Adequacy
Factor analysis was used to test validity of the constructs. To test validity to measure
sampling adequacy and to examine the appropriateness of factor analysis Kaiser- Meyer
Olkin and Bartlettes of Sphericity was used. Factor analysis was used to measure the
constructs as shown in table 4.10. To examine the appropriateness of factor analysis,
values between 0.5 and 1 indicate factor analysis is appropriate and values below 0.5
imply that factor analysis may not be appropriate.. Kaiser Meyer Oklkin and Bartlettes
test of Sphericity. Kaiser Meyer Olkin measure of sampling adequacy was used to
compute the magnitude of the observed correlation coefficients. Large values of KMO
are good because correlation between the variables, which are potential for factor
analysis, can be explained by other variable. If KMO is below 0.5 don’t do factor
analysis. The Kaiser-meyer Oklin measures of sampling adequacy showed the value of
test statistic of 0.596 which is greater than 0.5, hence acceptable indexes and therefore
continue with factor analysis. Barttletts test at 0.000 significant is less than 0.5 hence
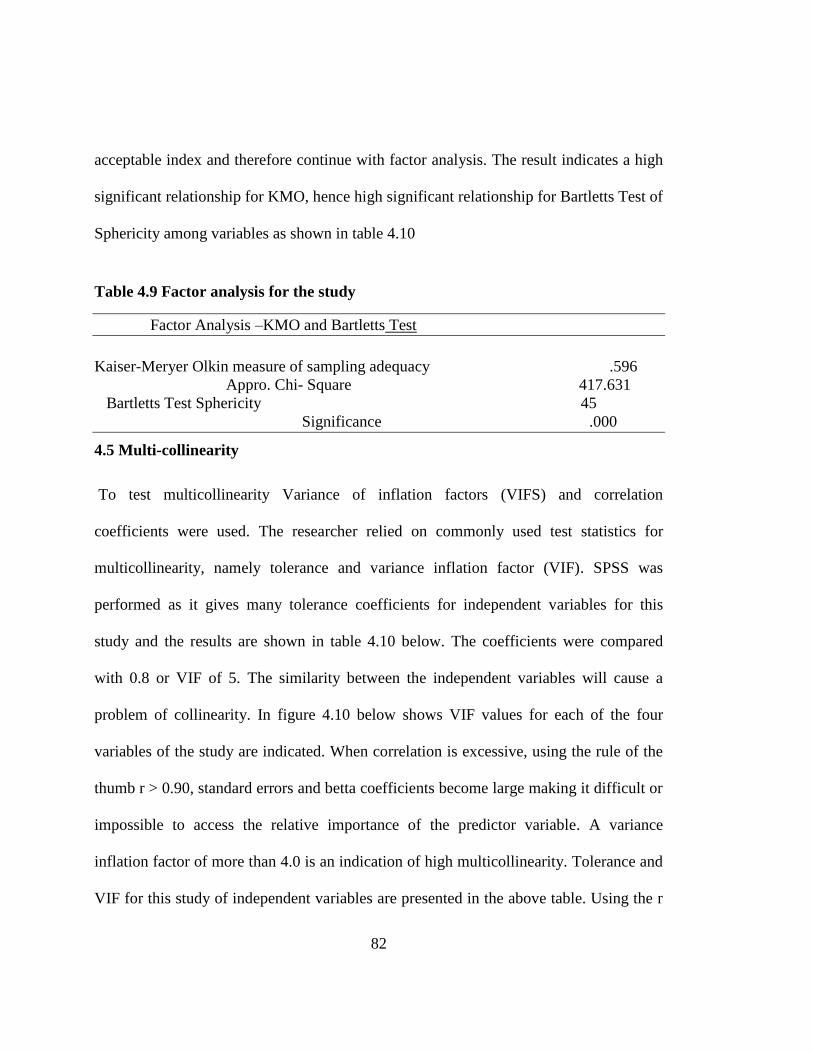
82
acceptable index and therefore continue with factor analysis. The result indicates a high
significant relationship for KMO, hence high significant relationship for Bartletts Test of
Sphericity among variables as shown in table 4.10
Table 4.9 Factor analysis for the study
Factor Analysis –KMO and Bartletts Test
Kaiser-Meryer Olkin measure of sampling adequacy .596
Appro. Chi- Square 417.631
Bartletts Test Sphericity 45
Significance .000
4.5 Multi-collinearity
To test multicollinearity Variance of inflation factors (VIFS) and correlation
coefficients were used. The researcher relied on commonly used test statistics for
multicollinearity, namely tolerance and variance inflation factor (VIF). SPSS was
performed as it gives many tolerance coefficients for independent variables for this
study and the results are shown in table 4.10 below. The coefficients were compared
with 0.8 or VIF of 5. The similarity between the independent variables will cause a
problem of collinearity. In figure 4.10 below shows VIF values for each of the four
variables of the study are indicated. When correlation is excessive, using the rule of the
thumb r > 0.90, standard errors and betta coefficients become large making it difficult or
impossible to access the relative importance of the predictor variable. A variance
inflation factor of more than 4.0 is an indication of high multicollinearity. Tolerance and
VIF for this study of independent variables are presented in the above table. Using the r
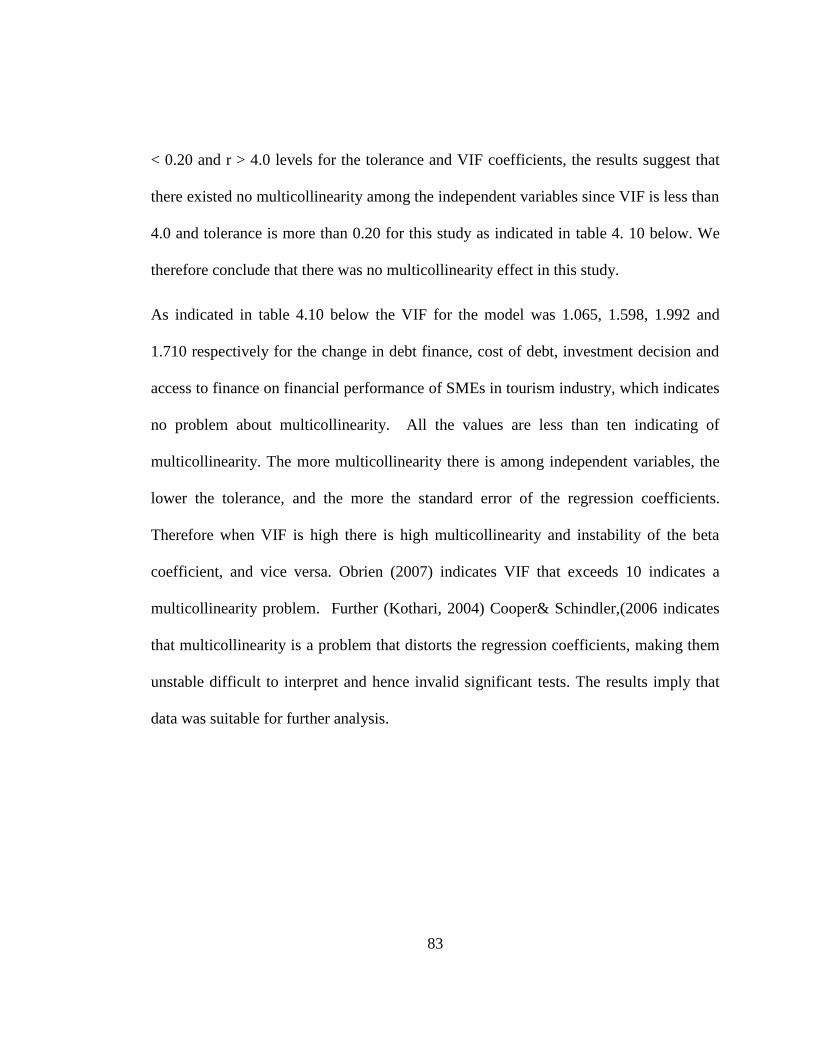
83
< 0.20 and r > 4.0 levels for the tolerance and VIF coefficients, the results suggest that
there existed no multicollinearity among the independent variables since VIF is less than
4.0 and tolerance is more than 0.20 for this study as indicated in table 4. 10 below. We
therefore conclude that there was no multicollinearity effect in this study.
As indicated in table 4.10 below the VIF for the model was 1.065, 1.598, 1.992 and
1.710 respectively for the change in debt finance, cost of debt, investment decision and
access to finance on financial performance of SMEs in tourism industry, which indicates
no problem about multicollinearity. All the values are less than ten indicating of
multicollinearity. The more multicollinearity there is among independent variables, the
lower the tolerance, and the more the standard error of the regression coefficients.
Therefore when VIF is high there is high multicollinearity and instability of the beta
coefficient, and vice versa. Obrien (2007) indicates VIF that exceeds 10 indicates a
multicollinearity problem. Further (Kothari, 2004) Cooper& Schindler,(2006 indicates
that multicollinearity is a problem that distorts the regression coefficients, making them
unstable difficult to interpret and hence invalid significant tests. The results imply that
data was suitable for further analysis.
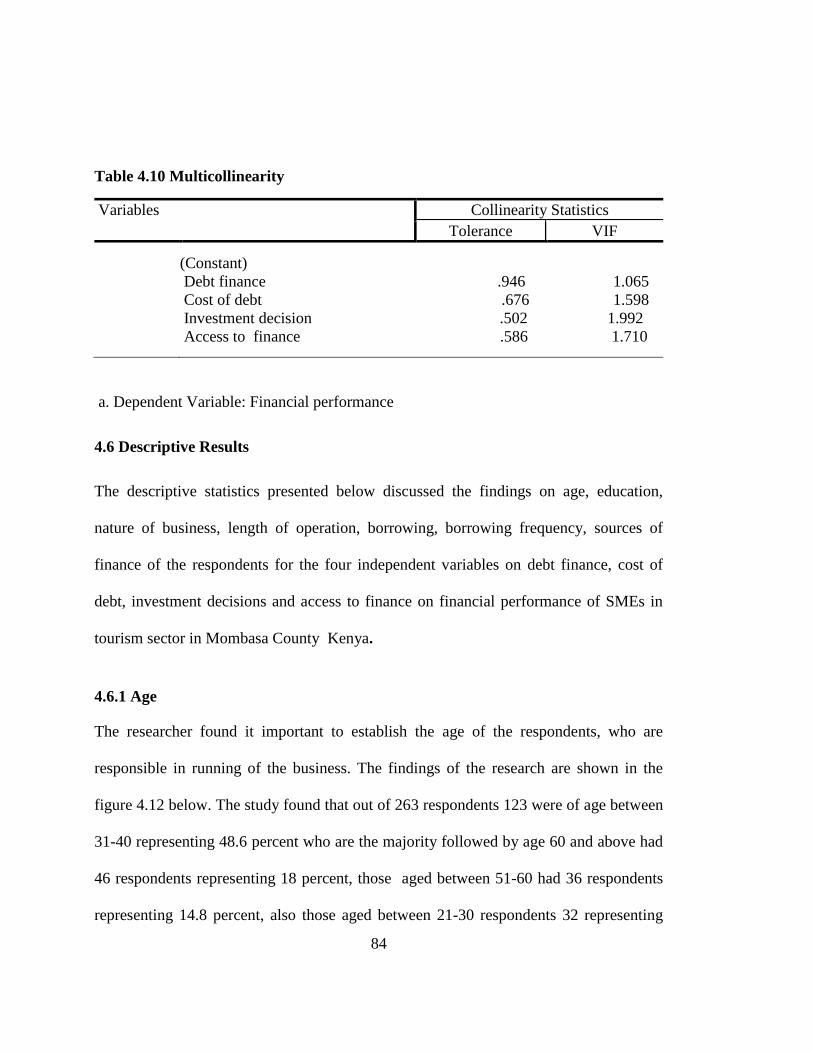
84
Table 4.10 Multicollinearity
Variables Collinearity Statistics
Tolerance VIF
(Constant)
Debt finance .946 1.065
Cost of debt .676 1.598
Investment decision .502 1.992
Access to finance .586 1.710
4.6 Descriptive Results
The descriptive statistics presented below discussed the findings on age, education,
nature of business, length of operation, borrowing, borrowing frequency, sources of
finance of the respondents for the four independent variables on debt finance, cost of
debt, investment decisions and access to finance on financial performance of SMEs in
tourism sector in Mombasa County Kenya.
4.6.1 Age
The researcher found it important to establish the age of the respondents, who are
responsible in running of the business. The findings of the research are shown in the
figure 4.12 below. The study found that out of 263 respondents 123 were of age between
31-40 representing 48.6 percent who are the majority followed by age 60 and above had
46 respondents representing 18 percent, those aged between 51-60 had 36 respondents
representing 14.8 percent, also those aged between 21-30 respondents 32 representing
a. Dependent Variable: Financial performance
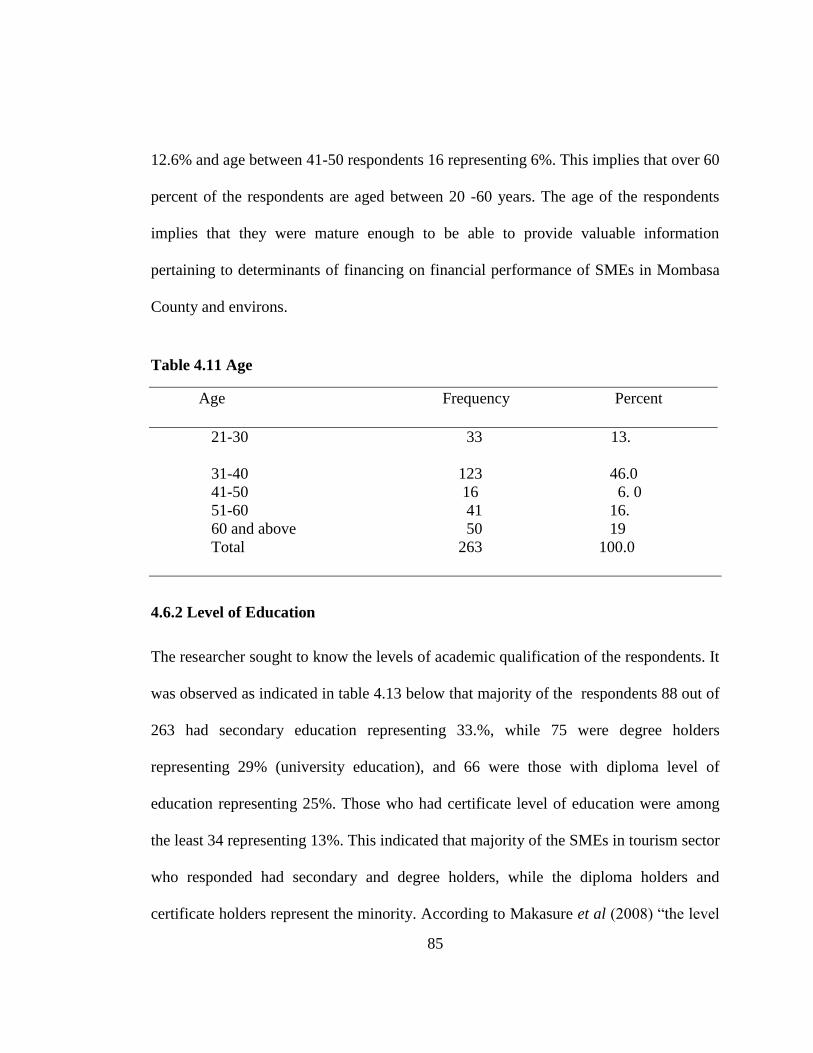
85
12.6% and age between 41-50 respondents 16 representing 6%. This implies that over 60
percent of the respondents are aged between 20 -60 years. The age of the respondents
implies that they were mature enough to be able to provide valuable information
pertaining to determinants of financing on financial performance of SMEs in Mombasa
County and environs.
Table 4.11 Age
Age Frequency Percent
21-30 33 13.
31-40 123 46.0
41-50 16 6. 0
51-60 41 16.
60 and above 50 19
Total 263 100.0
4.6.2 Level of Education
The researcher sought to know the levels of academic qualification of the respondents. It
was observed as indicated in table 4.13 below that majority of the respondents 88 out of
263 had secondary education representing 33.%, while 75 were degree holders
representing 29% (university education), and 66 were those with diploma level of
education representing 25%. Those who had certificate level of education were among
the least 34 representing 13%. This indicated that majority of the SMEs in tourism sector
who responded had secondary and degree holders, while the diploma holders and
certificate holders represent the minority. According to Makasure et al (2008) “the level
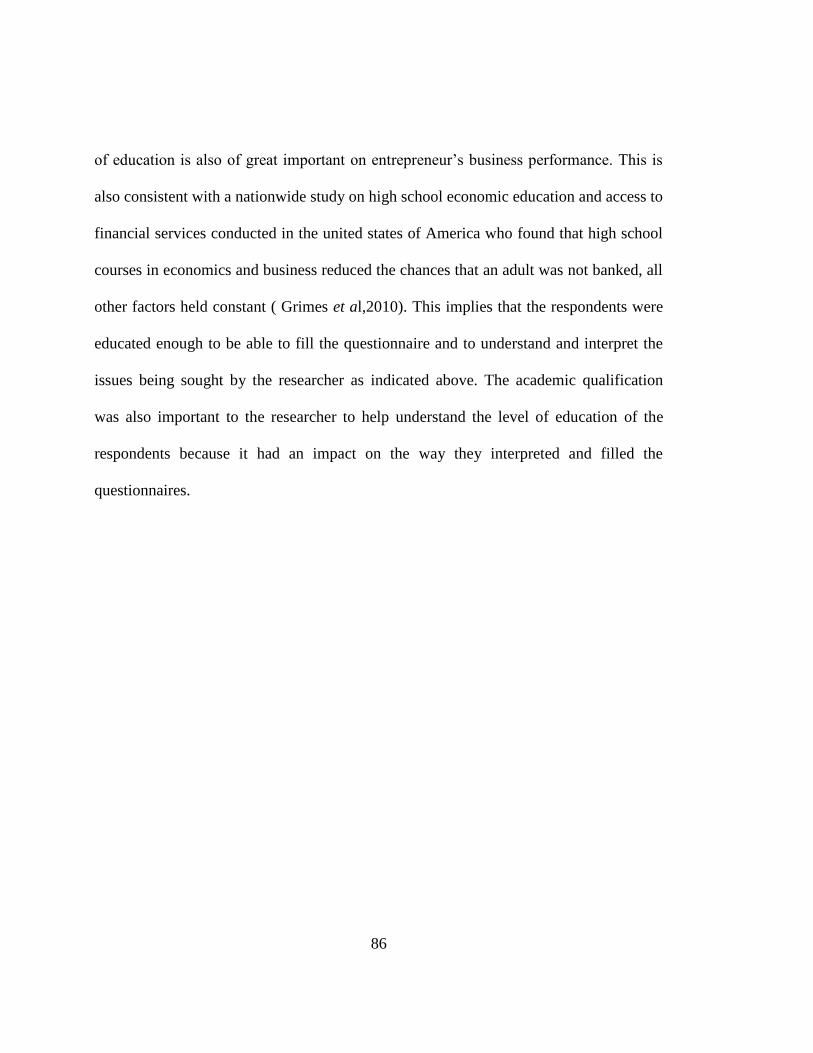
86
of education is also of great important on entrepreneur’s business performance. This is
also consistent with a nationwide study on high school economic education and access to
financial services conducted in the united states of America who found that high school
courses in economics and business reduced the chances that an adult was not banked, all
other factors held constant ( Grimes et al,2010). This implies that the respondents were
educated enough to be able to fill the questionnaire and to understand and interpret the
issues being sought by the researcher as indicated above. The academic qualification
was also important to the researcher to help understand the level of education of the
respondents because it had an impact on the way they interpreted and filled the
questionnaires.
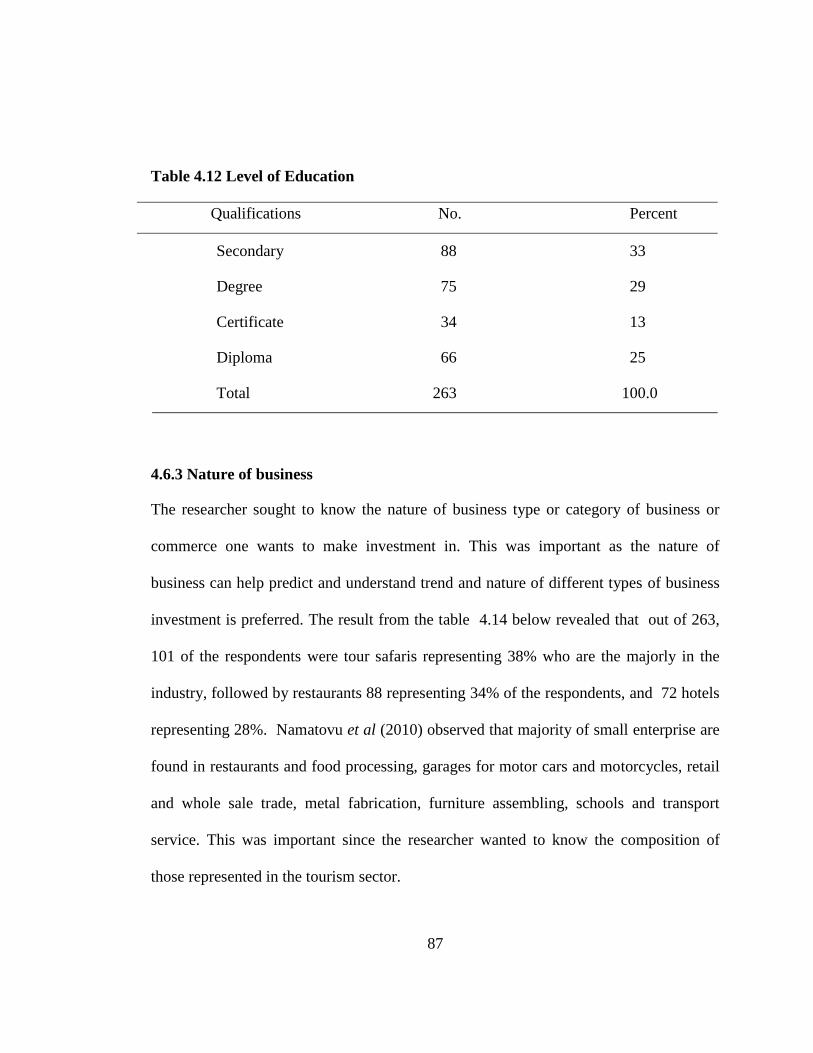
87
Table 4.12 Level of Education
Qualifications No. Percent
Secondary 88 33
Degree 75 29
Certificate 34 13
Diploma 66 25
Total 263 100.0
4.6.3 Nature of business
The researcher sought to know the nature of business type or category of business or
commerce one wants to make investment in. This was important as the nature of
business can help predict and understand trend and nature of different types of business
investment is preferred. The result from the table 4.14 below revealed that out of 263,
101 of the respondents were tour safaris representing 38% who are the majorly in the
industry, followed by restaurants 88 representing 34% of the respondents, and 72 hotels
representing 28%. Namatovu et al (2010) observed that majority of small enterprise are
found in restaurants and food processing, garages for motor cars and motorcycles, retail
and whole sale trade, metal fabrication, furniture assembling, schools and transport
service. This was important since the researcher wanted to know the composition of
those represented in the tourism sector.
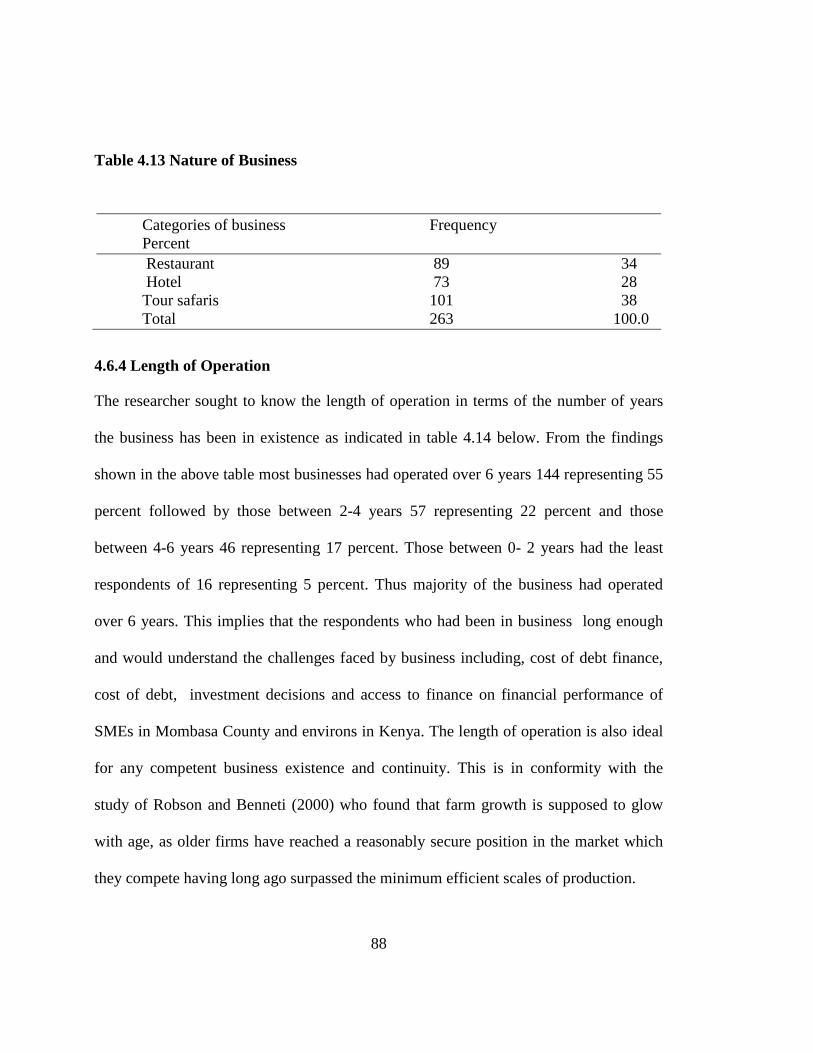
88
Table 4.13 Nature of Business
Categories of business Frequency
Percent
Restaurant 89 34
Hotel 73 28
Tour safaris 101 38
Total 263 100.0
4.6.4 Length of Operation
The researcher sought to know the length of operation in terms of the number of years
the business has been in existence as indicated in table 4.14 below. From the findings
shown in the above table most businesses had operated over 6 years 144 representing 55
percent followed by those between 2-4 years 57 representing 22 percent and those
between 4-6 years 46 representing 17 percent. Those between 0- 2 years had the least
respondents of 16 representing 5 percent. Thus majority of the business had operated
over 6 years. This implies that the respondents who had been in business long enough
and would understand the challenges faced by business including, cost of debt finance,
cost of debt, investment decisions and access to finance on financial performance of
SMEs in Mombasa County and environs in Kenya. The length of operation is also ideal
for any competent business existence and continuity. This is in conformity with the
study of Robson and Benneti (2000) who found that farm growth is supposed to glow
with age, as older firms have reached a reasonably secure position in the market which
they compete having long ago surpassed the minimum efficient scales of production.
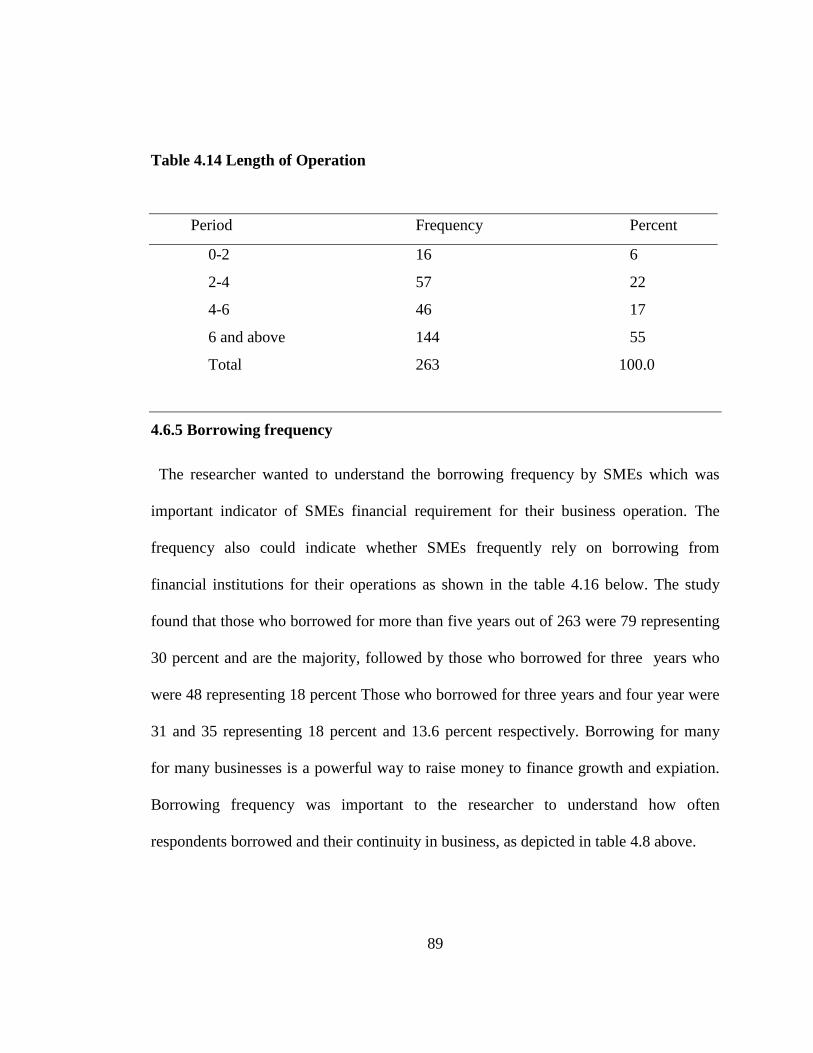
89
Table 4.14 Length of Operation
Period Frequency Percent
0-2 16 6
2-4 57 22
4-6 46 17
6 and above 144 55
Total 263 100.0
4.6.5 Borrowing frequency
The researcher wanted to understand the borrowing frequency by SMEs which was
important indicator of SMEs financial requirement for their business operation. The
frequency also could indicate whether SMEs frequently rely on borrowing from
financial institutions for their operations as shown in the table 4.16 below. The study
found that those who borrowed for more than five years out of 263 were 79 representing
30 percent and are the majority, followed by those who borrowed for three years who
were 48 representing 18 percent Those who borrowed for three years and four year were
31 and 35 representing 18 percent and 13.6 percent respectively. Borrowing for many
for many businesses is a powerful way to raise money to finance growth and expiation.
Borrowing frequency was important to the researcher to understand how often
respondents borrowed and their continuity in business, as depicted in table 4.8 above.
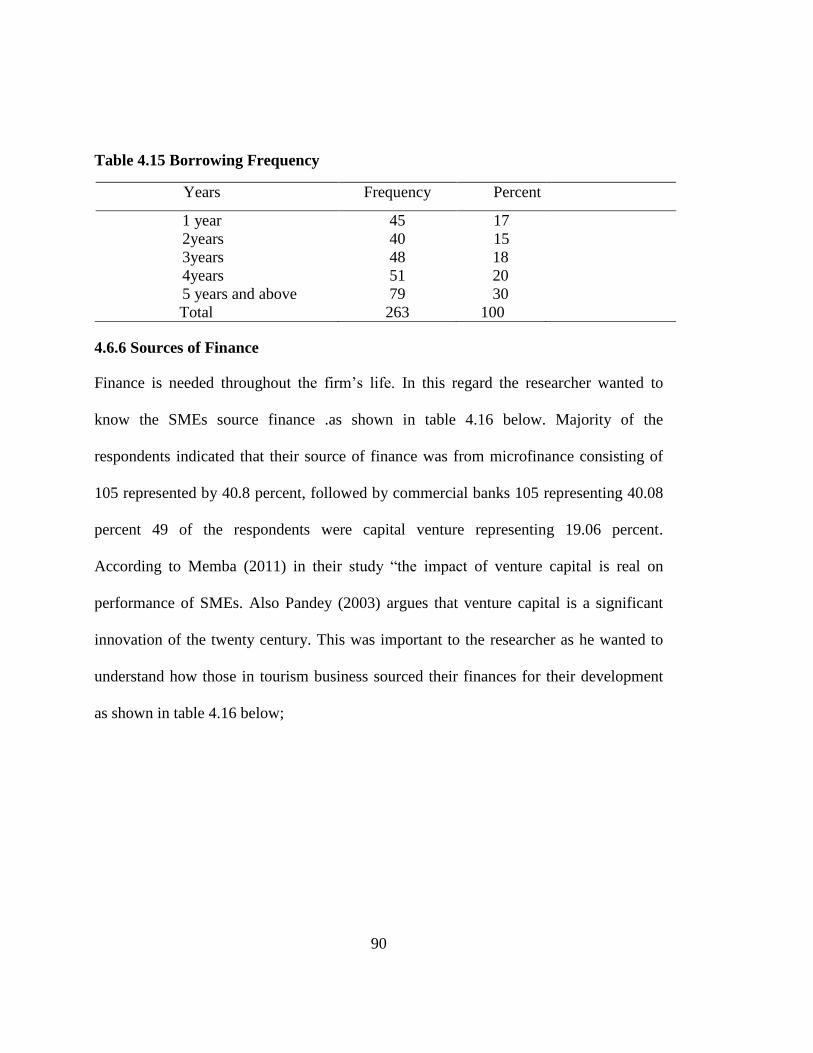
90
Table 4.15 Borrowing Frequency
Years Frequency Percent
1 year 45 17
2years 40 15
3years 48 18
4years 51 20
5 years and above 79 30
Total 263 100
4.6.6 Sources of Finance
Finance is needed throughout the firm’s life. In this regard the researcher wanted to
know the SMEs source finance .as shown in table 4.16 below. Majority of the
respondents indicated that their source of finance was from microfinance consisting of
105 represented by 40.8 percent, followed by commercial banks 105 representing 40.08
percent 49 of the respondents were capital venture representing 19.06 percent.
According to Memba (2011) in their study “the impact of venture capital is real on
performance of SMEs. Also Pandey (2003) argues that venture capital is a significant
innovation of the twenty century. This was important to the researcher as he wanted to
understand how those in tourism business sourced their finances for their development
as shown in table 4.16 below;
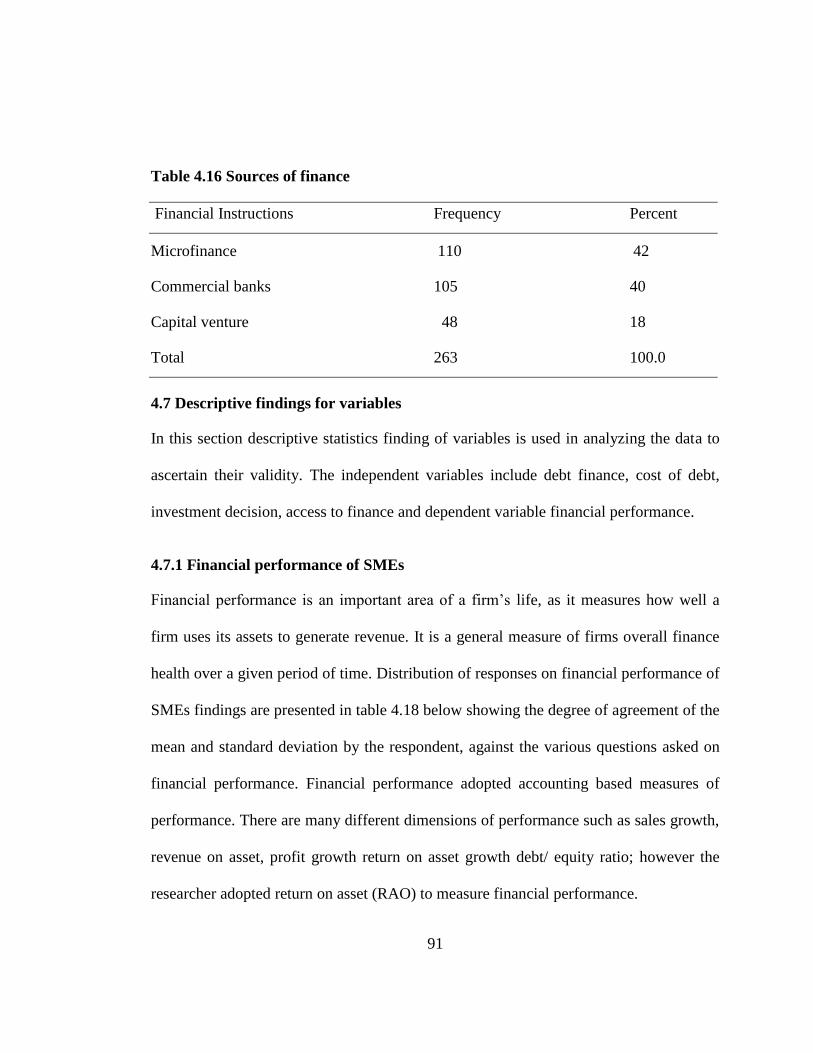
91
Table 4.16 Sources of finance
Financial Instructions Frequency Percent
Microfinance 110 42
Commercial banks 105 40
Capital venture 48 18
Total 263 100.0
4.7 Descriptive findings for variables
In this section descriptive statistics finding of variables is used in analyzing the data to
ascertain their validity. The independent variables include debt finance, cost of debt,
investment decision, access to finance and dependent variable financial performance.
4.7.1 Financial performance of SMEs
Financial performance is an important area of a firm’s life, as it measures how well a
firm uses its assets to generate revenue. It is a general measure of firms overall finance
health over a given period of time. Distribution of responses on financial performance of
SMEs findings are presented in table 4.18 below showing the degree of agreement of the
mean and standard deviation by the respondent, against the various questions asked on
financial performance. Financial performance adopted accounting based measures of
performance. There are many different dimensions of performance such as sales growth,
revenue on asset, profit growth return on asset growth debt/ equity ratio; however the
researcher adopted return on asset (RAO) to measure financial performance.
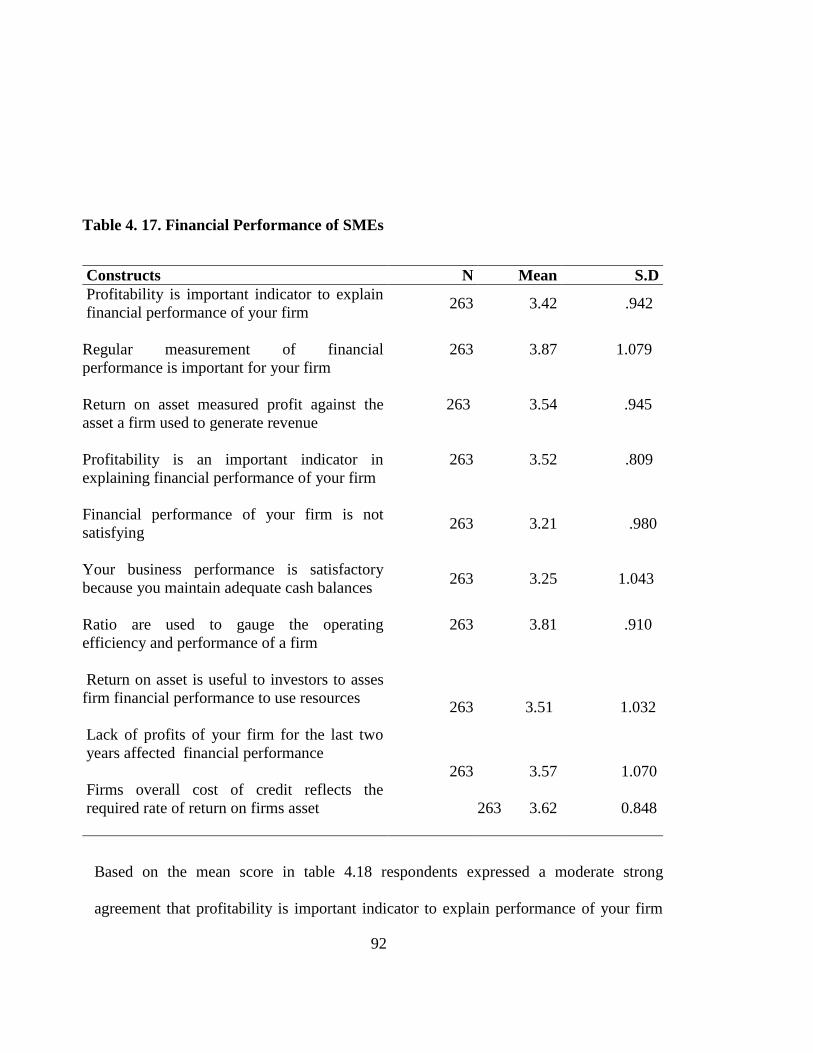
92
Table 4. 17. Financial Performance of SMEs
Constructs N Mean S.D
Profitability is important indicator to explain
financial performance of your firm 263 3.42 .942
Regular measurement of financial
performance is important for your firm
263 3.87 1.079
Return on asset measured profit against the
asset a firm used to generate revenue
263 3.54 .945
Profitability is an important indicator in
explaining financial performance of your firm
263 3.52 .809
Financial performance of your firm is not
satisfying
263 3.21 .980
Your business performance is satisfactory
because you maintain adequate cash balances 263 3.25 1.043
Ratio are used to gauge the operating
efficiency and performance of a firm
263 3.81 .910
Return on asset is useful to investors to asses
firm financial performance to use resources
Lack of profits of your firm for the last two
years affected financial performance
263 3.51 1.032
263 3.57 1.070
Firms overall cost of credit reflects the
required rate of return on firms asset
263 3.62 0.848
Based on the mean score in table 4.18 respondents expressed a moderate strong
agreement that profitability is important indicator to explain performance of your firm
93
(M 3.42 S.D 0.942). On the regular measurement of financial performance is important
for your firm with a mean score (M 3.87, S.D0.079) was revealed showing a high degree
of agreement. Respondents also expressed a moderate strong agreement that return on
asset measured profit against the asset a firm used to generate revenue, mean score value
of (M3.54, S.D0.945) More analysis in above table revealed that profitability is an
important indicator in explaining financial performance of your firm, with a mean score
of (M3.52S.D. 809) which was moderately high agreement. Financial performance of
your firm is not satisfactory result revealed a moderate mean score value of (M3.21, S.D
0.980). Your business performance is satisfactory because you maintain adequate cash
balances revealed a mean score of (M 3.25, S.D 1.043). A strong mean score of (M 3.81,
SD .910 revealed that ratios are used to gauge the operating efficiency and performance
of a firm. On return on asset is useful to investors to assess firm financial performance to
use resources a strong means score value of (M 3.51, S.D 1.032) was revealed. Further
analysis in table 4.18 revealed that your business has adequate cash balance both in hand
and bank for operations a moderate mean of (M3.57,S.D 1.070). When asked if firm is
profitable and does not have cash flow problems to meet immediate needs from
operations a strong mean score of (M3.62S.D 0.848) was revealed. The study that your
firm is profitable and does not have cash flow problems to meet its immediate needs for
operations a strong mean score of (M3.81S.D 0.910). The average mean was 3.53
indicating a high response.
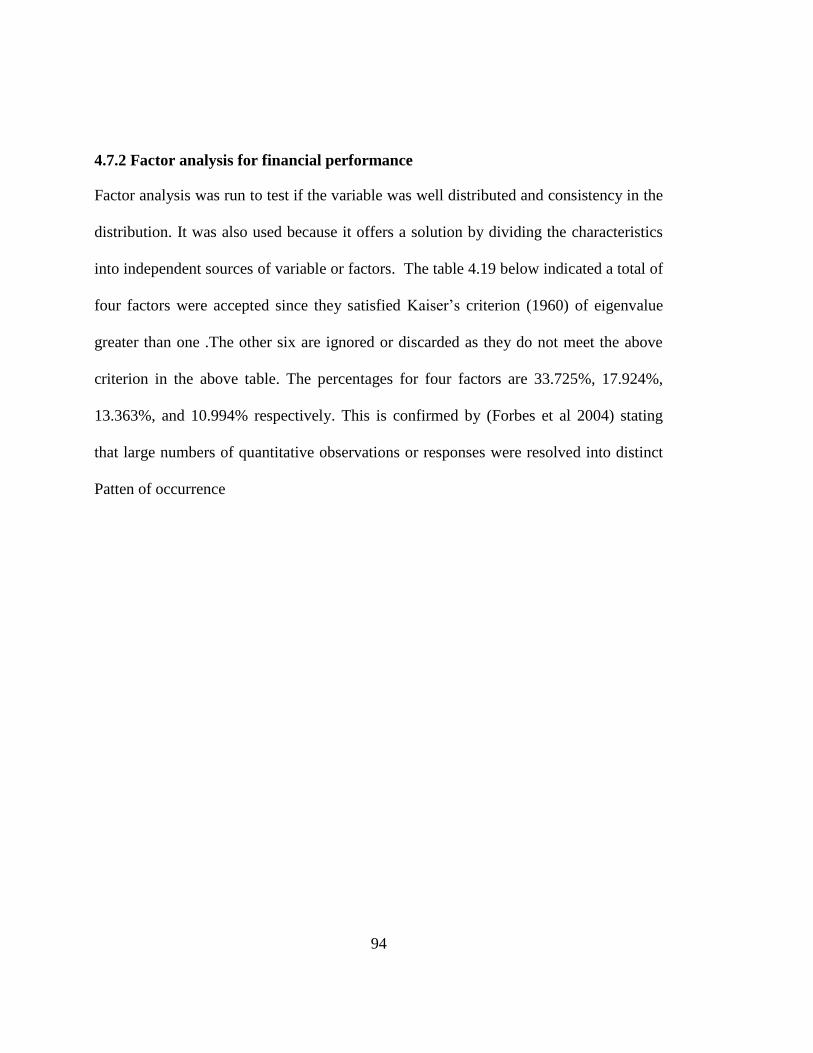
94
4.7.2 Factor analysis for financial performance
Factor analysis was run to test if the variable was well distributed and consistency in the
distribution. It was also used because it offers a solution by dividing the characteristics
into independent sources of variable or factors. The table 4.19 below indicated a total of
four factors were accepted since they satisfied Kaiser’s criterion (1960) of eigenvalue
greater than one .The other six are ignored or discarded as they do not meet the above
criterion in the above table. The percentages for four factors are 33.725%, 17.924%,
13.363%, and 10.994% respectively. This is confirmed by (Forbes et al 2004) stating
that large numbers of quantitative observations or responses were resolved into distinct
Patten of occurrence
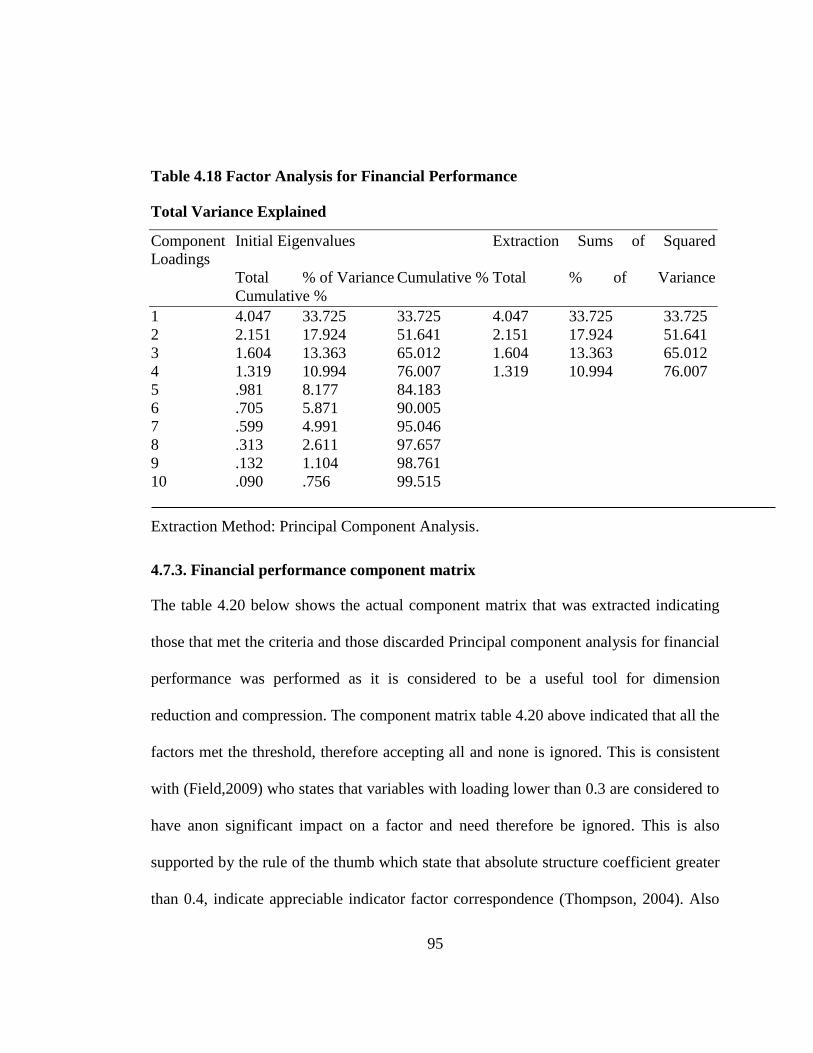
95
Table 4.18 Factor Analysis for Financial Performance
Total Variance Explained
Component Initial Eigenvalues Extraction Sums of Squared
Loadings
Total % of Variance Cumulative % Total % of Variance
Cumulative %
1 4.047 33.725 33.725 4.047 33.725 33.725
2 2.151 17.924 51.641 2.151 17.924 51.641
3 1.604 13.363 65.012 1.604 13.363 65.012
4 1.319 10.994 76.007 1.319 10.994 76.007
5 .981 8.177 84.183
6 .705 5.871 90.005
7 .599 4.991 95.046
8 .313 2.611 97.657
9 .132 1.104 98.761
10 .090 .756 99.515
Extraction Method: Principal Component Analysis.
4.7.3. Financial performance component matrix
The table 4.20 below shows the actual component matrix that was extracted indicating
those that met the criteria and those discarded Principal component analysis for financial
performance was performed as it is considered to be a useful tool for dimension
reduction and compression. The component matrix table 4.20 above indicated that all the
factors met the threshold, therefore accepting all and none is ignored. This is consistent
with (Field,2009) who states that variables with loading lower than 0.3 are considered to
have anon significant impact on a factor and need therefore be ignored. This is also
supported by the rule of the thumb which state that absolute structure coefficient greater
than 0.4, indicate appreciable indicator factor correspondence (Thompson, 2004). Also
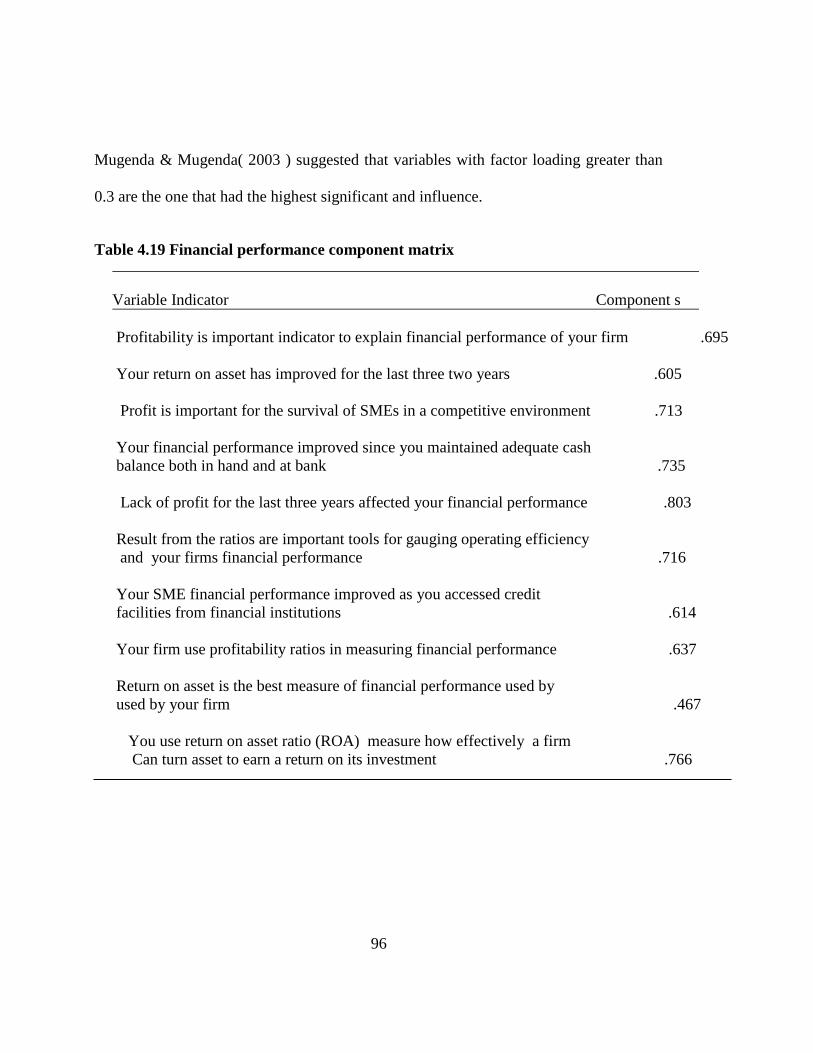
96
Mugenda & Mugenda( 2003 ) suggested that variables with factor loading greater than
0.3 are the one that had the highest significant and influence.
Table 4.19 Financial performance component matrix
Variable Indicator Component s
Profitability is important indicator to explain financial performance of your firm .695
Your return on asset has improved for the last three two years .605
Profit is important for the survival of SMEs in a competitive environment .713
Your financial performance improved since you maintained adequate cash
balance both in hand and at bank .735
Lack of profit for the last three years affected your financial performance .803
Result from the ratios are important tools for gauging operating efficiency
and your firms financial performance .716
Your SME financial performance improved as you accessed credit
facilities from financial institutions .614
Your firm use profitability ratios in measuring financial performance .637
Return on asset is the best measure of financial performance used by
used by your firm .467
You use return on asset ratio (ROA) measure how effectively a firm
Can turn asset to earn a return on its investment .766
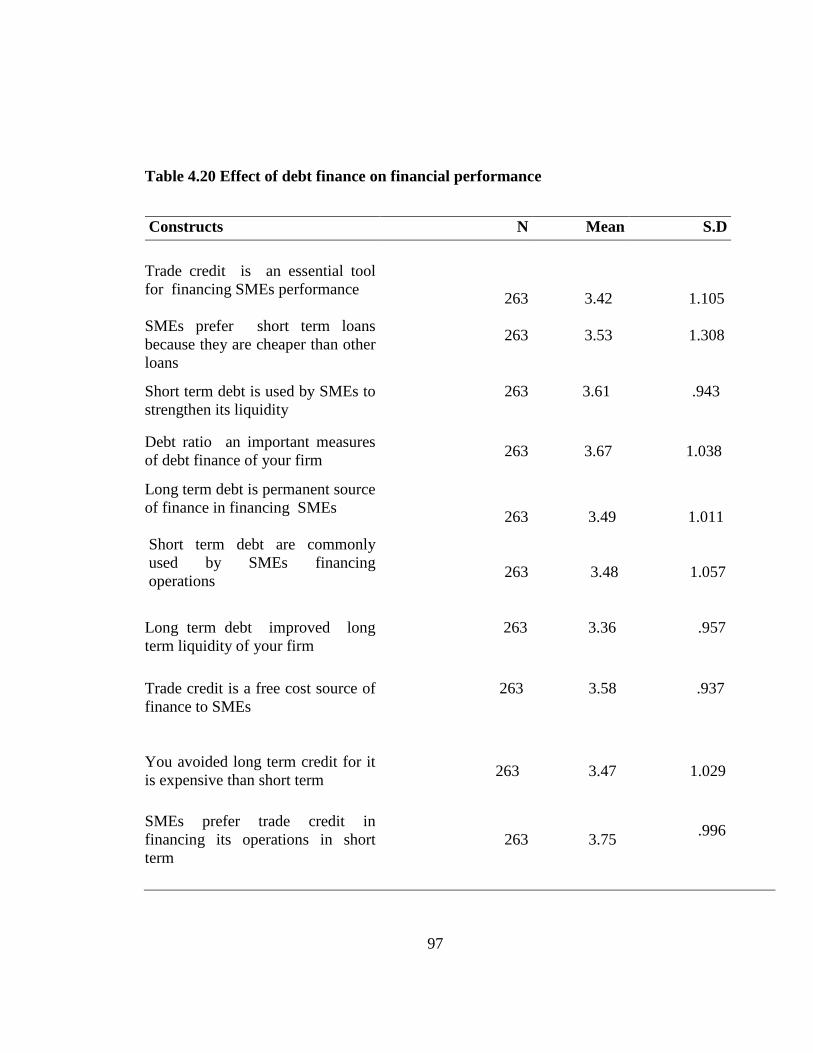
97
Table 4.20 Effect of debt finance on financial performance
Constructs N Mean S.D
Trade credit is an essential tool
for financing SMEs performance
SMEs prefer short term loans
because they are cheaper than other
loans
263
263
3.42
3.53
1.105
1.308
Short term debt is used by SMEs to
strengthen its liquidity
263
3.61
.943
Debt ratio an important measures
of debt finance of your firm 263 3.67 1.038
Long term debt is permanent source
of finance in financing SMEs
Short term debt are commonly
used by SMEs financing
operations
263
263
3.49
3.48
1.011
1.057
Long term debt improved long
term liquidity of your firm
263 3.36 .957
Trade credit is a free cost source of
finance to SMEs
263 3.58 .937
You avoided long term credit for it
is expensive than short term 263 3.47 1.029
SMEs prefer trade credit in
financing its operations in short
term
263 3.75 .996
98
The study sought to determine the effect of debt finance on financial performance of
SMEs in Mombasa County. The respondents were asked various questions to indicate on
a Likert scale of 1 to 5. Where 1 was strongly disagree, 2 disagree and 4 agree 5 strongly
agree as shown on table 4.21. On whether trade credit is an essential tool for financing
SMEs performance respondents agreed with a mean score value of (M3.42, SD 1.105)
and standard deviation. On whether SMEs prefer short term debt loans because they are
cheaper than other loans respondents agreed with a mean score value of (M 3.53,SD
1.308,) and standard deviation. On whether short term debt is used by SMEs to
strengthen its liquidity respondents agreed with a mean score value of (3.61 .943) and
standard deviation. Further respondents agreed debt ratio is an important measure of
debt finance with a mean score value of (M3.67, SD 1.038) and a standard deviation. On
whether long term debt is permanent source of finance in financing SMEs respondents
agreed with a mean score value of (M3.49, SD 1.011) and a standard deviation. On
whether short term debt is commonly used by SMEs financing operations respondents
agreed with a mean score value of (M3.48 SD 1.057) and standard deviation. Regarding
long term debt lead to improvement in long term liquidity of SMEs the respondent
agreed with a mean score value of (M 3.36 SD.957) and a standard deviation. Further
analysis in table 4.21 above trade credit is a free cost source of finance of your firm
respondents agreed with a mean score value of (M 3.58 SD.937) and a standard
deviation. On you avoided long term debt for it is expensive than short term respondents
agreed with a mean score value of (M3.47 SD 1.029) and a standard deviation. On
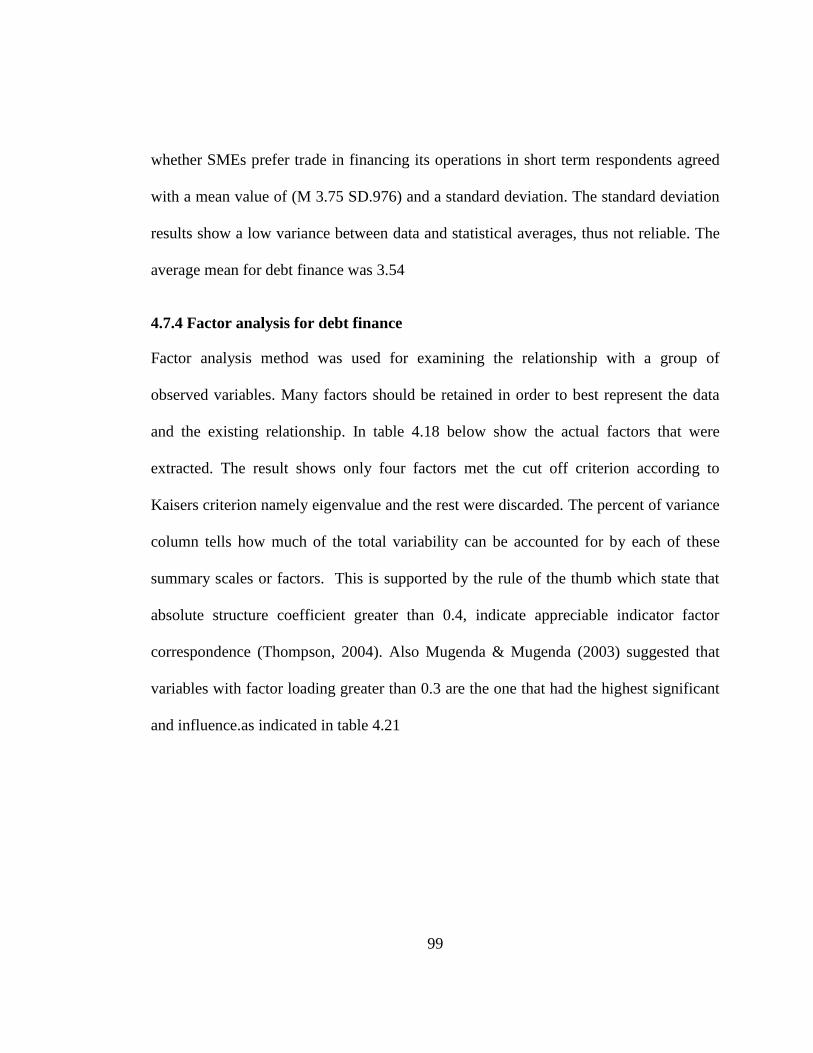
99
whether SMEs prefer trade in financing its operations in short term respondents agreed
with a mean value of (M 3.75 SD.976) and a standard deviation. The standard deviation
results show a low variance between data and statistical averages, thus not reliable. The
average mean for debt finance was 3.54
4.7.4 Factor analysis for debt finance
Factor analysis method was used for examining the relationship with a group of
observed variables. Many factors should be retained in order to best represent the data
and the existing relationship. In table 4.18 below show the actual factors that were
extracted. The result shows only four factors met the cut off criterion according to
Kaisers criterion namely eigenvalue and the rest were discarded. The percent of variance
column tells how much of the total variability can be accounted for by each of these
summary scales or factors. This is supported by the rule of the thumb which state that
absolute structure coefficient greater than 0.4, indicate appreciable indicator factor
correspondence (Thompson, 2004). Also Mugenda & Mugenda (2003) suggested that
variables with factor loading greater than 0.3 are the one that had the highest significant
and influence.as indicated in table 4.21
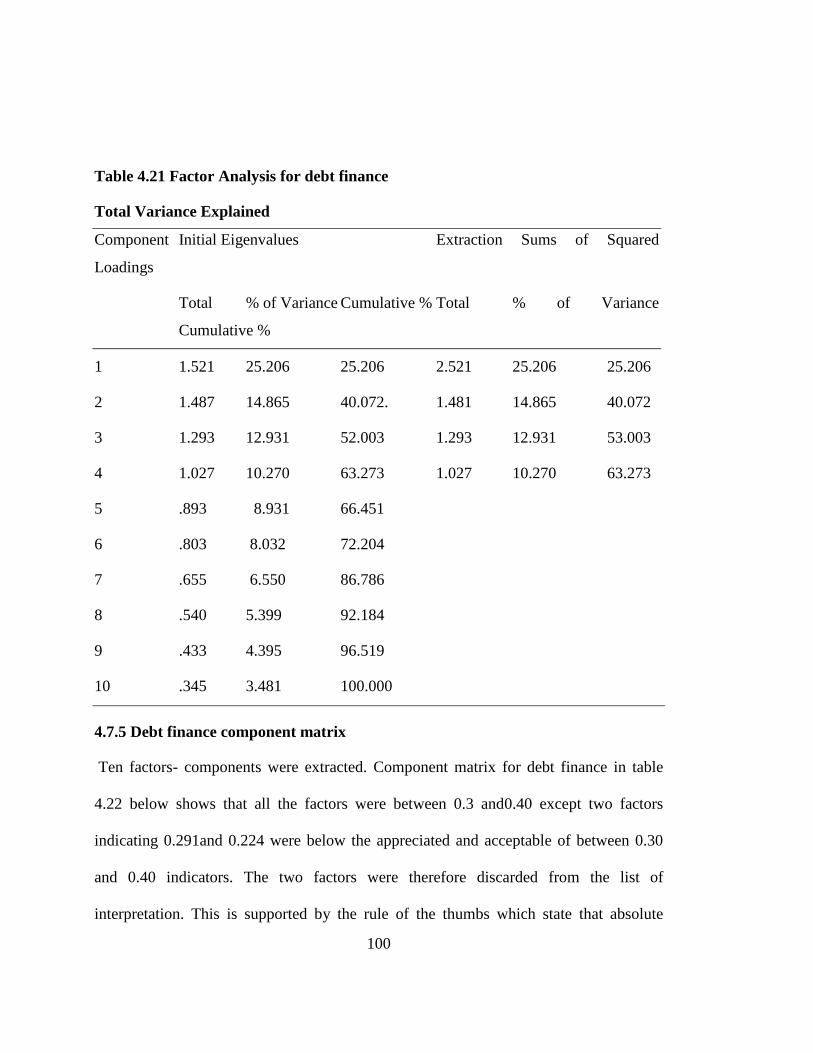
100
Table 4.21 Factor Analysis for debt finance
Total Variance Explained
Component Initial Eigenvalues Extraction Sums of Squared
Loadings
Total % of Variance Cumulative % Total % of Variance
Cumulative %
1 1.521 25.206 25.206 2.521 25.206 25.206
2 1.487 14.865 40.072. 1.481 14.865 40.072
3 1.293 12.931 52.003 1.293 12.931 53.003
4 1.027 10.270 63.273 1.027 10.270 63.273
5 .893 8.931 66.451
6 .803 8.032 72.204
7 .655 6.550 86.786
8 .540 5.399 92.184
9 .433 4.395 96.519
10 .345 3.481 100.000
4.7.5 Debt finance component matrix
Ten factors- components were extracted. Component matrix for debt finance in table
4.22 below shows that all the factors were between 0.3 and0.40 except two factors
indicating 0.291and 0.224 were below the appreciated and acceptable of between 0.30
and 0.40 indicators. The two factors were therefore discarded from the list of
interpretation. This is supported by the rule of the thumbs which state that absolute

101
structure coefficient between 0.3 and 0.4, indicate appreciable indicator factor
correspondence (Thompson, 2004). Also Mugenda & Mugenda( 2003 ) suggested that
variables with factor loading greater than 0.3 are the one that had the highest significant
and influence
Table 4.22 Debt finance component matrix
Variable Indicator Component
Trade credit is an essential tool for financing SMEs growth .675
SMEs prefer short term because they are cheaper compared to other loans .720
Short term is used by SMEs to strengthen its cash flow .531
Debt ratio is an important measure of debt financing of your SMEs .689
Long term debt is permanent source of finance in financing SMEs .647
Short term debt is commonly used by SMEs in financing operations .632
Trade credit is a free of cost source of finance to your SMEs .583
You avoided long term debt for it expensive than short term debt .423
SMEs prefer trade credit in financing its operations in the short term .471
4.7.6 ANOVA for debt finance
Analysis of variance (ANOVA) is a statistical procedure concern with comparing
means of several samples. The purpose is to test for significant between class means
and this is done by analysis of variance. ANOVA provides a statistical test whether or
not the means of several groups are equal, and therefore generates t-test to more than
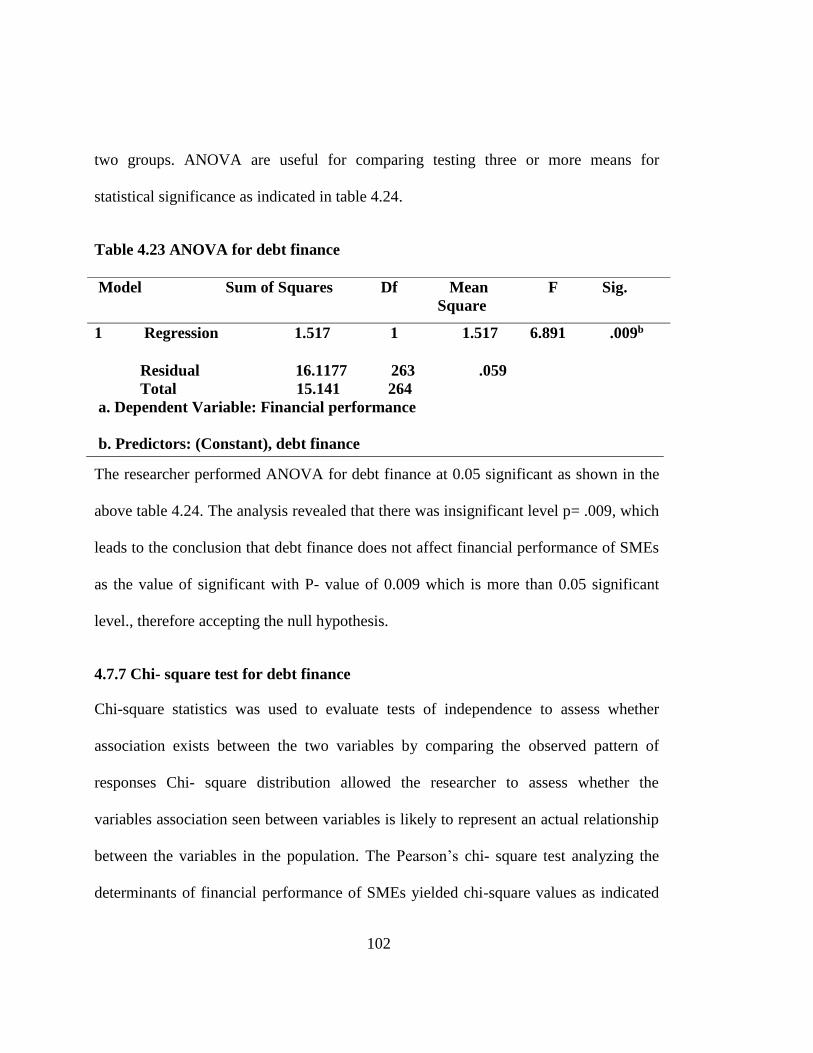
102
two groups. ANOVA are useful for comparing testing three or more means for
statistical significance as indicated in table 4.24.
Table 4.23 ANOVA for debt finance
The researcher performed ANOVA for debt finance at 0.05 significant as shown in the
above table 4.24. The analysis revealed that there was insignificant level p= .009, which
leads to the conclusion that debt finance does not affect financial performance of SMEs
as the value of significant with P- value of 0.009 which is more than 0.05 significant
level., therefore accepting the null hypothesis.
4.7.7 Chi- square test for debt finance
Chi-square statistics was used to evaluate tests of independence to assess whether
association exists between the two variables by comparing the observed pattern of
responses Chi- square distribution allowed the researcher to assess whether the
variables association seen between variables is likely to represent an actual relationship
between the variables in the population. The Pearson’s chi- square test analyzing the
determinants of financial performance of SMEs yielded chi-square values as indicated
Model Sum of Squares Df Mean F Sig.
Square
1 Regression 1.517 1 1.517 6.891 .009b
Residual 16.1177 263 .059
Total 15.141 264
a. Dependent Variable: Financial performance
b. Predictors: (Constant), debt finance
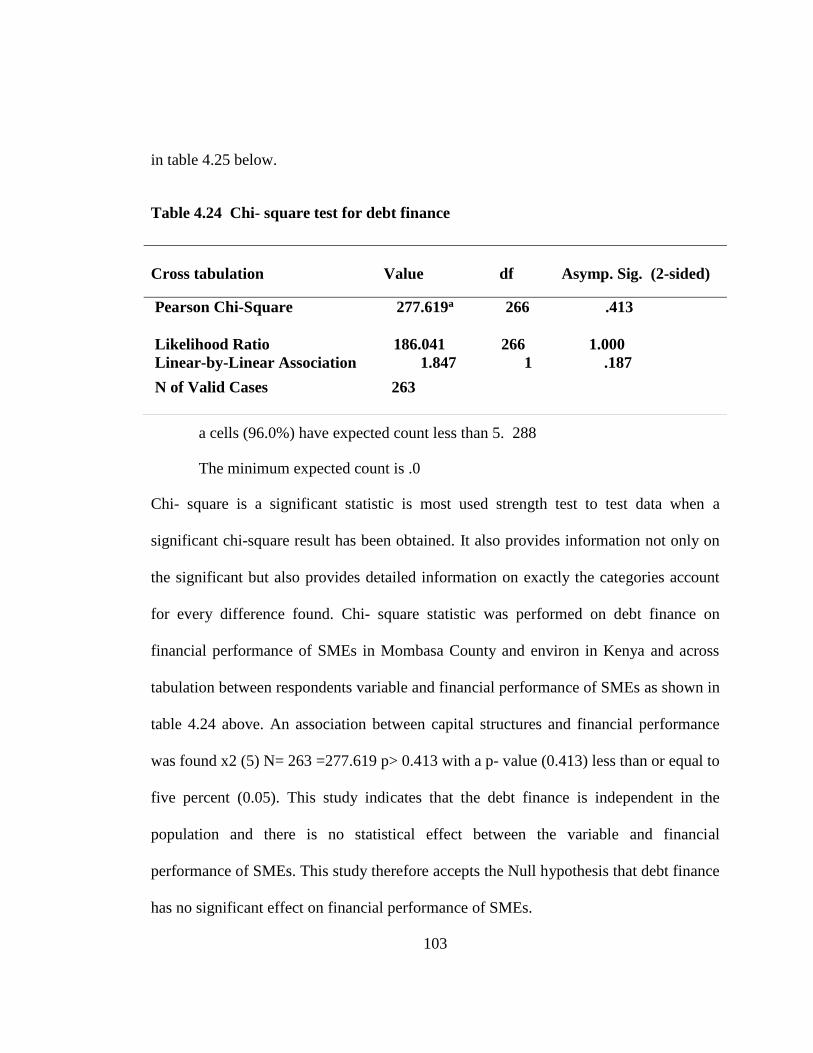
103
in table 4.25 below.
Table 4.24 Chi- square test for debt finance
a cells (96.0%) have expected count less than 5. 288
The minimum expected count is .0
Chi- square is a significant statistic is most used strength test to test data when a
significant chi-square result has been obtained. It also provides information not only on
the significant but also provides detailed information on exactly the categories account
for every difference found. Chi- square statistic was performed on debt finance on
financial performance of SMEs in Mombasa County and environ in Kenya and across
tabulation between respondents variable and financial performance of SMEs as shown in
table 4.24 above. An association between capital structures and financial performance
was found x2 (5) N= 263 =277.619 p> 0.413 with a p- value (0.413) less than or equal to
five percent (0.05). This study indicates that the debt finance is independent in the
population and there is no statistical effect between the variable and financial
performance of SMEs. This study therefore accepts the Null hypothesis that debt finance
has no significant effect on financial performance of SMEs.
Cross tabulation Value df Asymp. Sig. (2-sided)
Pearson Chi-Square 277.619a 266 .413
Likelihood Ratio 186.041 266 1.000
Linear-by-Linear Association 1.847 1 .187
N of Valid Cases 263
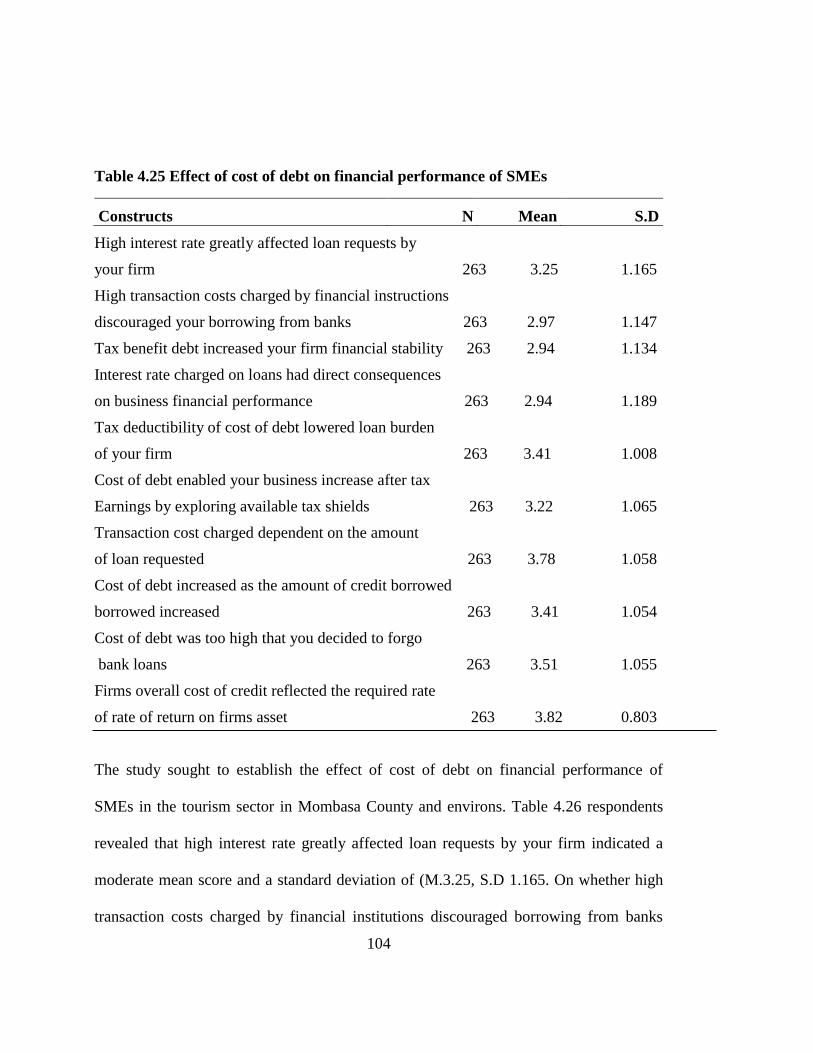
104
Table 4.25 Effect of cost of debt on financial performance of SMEs
Constructs N Mean S.D
High interest rate greatly affected loan requests by
your firm 263 3.25 1.165
High transaction costs charged by financial instructions
discouraged your borrowing from banks 263 2.97 1.147
Tax benefit debt increased your firm financial stability 263 2.94 1.134
Interest rate charged on loans had direct consequences
on business financial performance 263 2.94 1.189
Tax deductibility of cost of debt lowered loan burden
of your firm 263 3.41 1.008
Cost of debt enabled your business increase after tax
Earnings by exploring available tax shields 263 3.22 1.065
Transaction cost charged dependent on the amount
of loan requested 263 3.78 1.058
Cost of debt increased as the amount of credit borrowed
borrowed increased 263 3.41 1.054
Cost of debt was too high that you decided to forgo
bank loans 263 3.51 1.055
Firms overall cost of credit reflected the required rate
of rate of return on firms asset 263 3.82 0.803
The study sought to establish the effect of cost of debt on financial performance of
SMEs in the tourism sector in Mombasa County and environs. Table 4.26 respondents
revealed that high interest rate greatly affected loan requests by your firm indicated a
moderate mean score and a standard deviation of (M.3.25, S.D 1.165. On whether high
transaction costs charged by financial institutions discouraged borrowing from banks
105
indicated a moderate mean and standard deviation of (M 2.97 S.D1.147). Whether
benefit debt increases your firm financial stability revealed a moderated a moderate
mean score of (M 2.94, S.D) and standard deviation. On interest rate charged on loans
have direct consequences on business financial performance indicated a mean score of
(M 2.94 S.D 1.189) and standard deviation. Tax deductibility of cost of debt lowered
loan burden of your firm indicated a mean score of (M 3.41S.D1.008) and a standard
deviation.
Further on cost of debt enabled your business increase after tax earnings by exploiting
available tax shields showed a moderate mean of (M 3.22 S.D1.075) and a standard
deviation. On whether transaction costs charged depend on the amount of loan requested
showed a high mean of (M 3.78 S.D1.055) and a standard deviation of. Cost of debt
increases as the amount of credit borrowed increases indicated a slightly high mean of
(M 3.41S.D 1.054) and a standard deviation. On whether cost debt was too high that you
decided to forgo bank loan indicted a high mean of (M 3,51S.D 1.050) and standard
deviation. On whether firms overall cost of debt reflect the required rate of return on
firms’ asset indicated the highest mean of (M 3.82S.D 0.803) and a standard deviation of
0.803. All the standard deviations were below the mean as evidenced from above
descriptions. The average mean for cost of debt was 3.12
Table 4.26 Factor Analyses for Cost of debt
Total Variance Explained
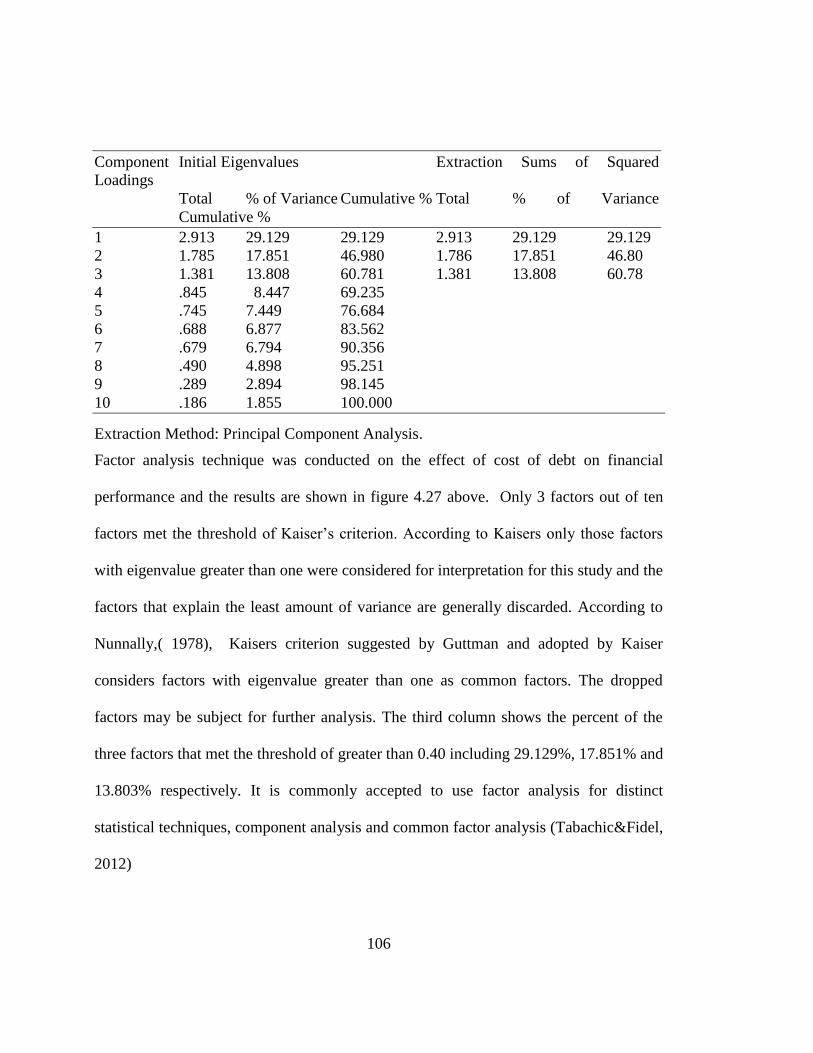
106
Component Initial Eigenvalues Extraction Sums of Squared
Loadings
Total % of Variance Cumulative % Total % of Variance
Cumulative %
1 2.913 29.129 29.129 2.913 29.129 29.129
2 1.785 17.851 46.980 1.786 17.851 46.80
3 1.381 13.808 60.781 1.381 13.808 60.78
4 .845 8.447 69.235
5 .745 7.449 76.684
6 .688 6.877 83.562
7 .679 6.794 90.356
8 .490 4.898 95.251
9 .289 2.894 98.145
10 .186 1.855 100.000
Extraction Method: Principal Component Analysis.
Factor analysis technique was conducted on the effect of cost of debt on financial
performance and the results are shown in figure 4.27 above. Only 3 factors out of ten
factors met the threshold of Kaiser’s criterion. According to Kaisers only those factors
with eigenvalue greater than one were considered for interpretation for this study and the
factors that explain the least amount of variance are generally discarded. According to
Nunnally,( 1978), Kaisers criterion suggested by Guttman and adopted by Kaiser
considers factors with eigenvalue greater than one as common factors. The dropped
factors may be subject for further analysis. The third column shows the percent of the
three factors that met the threshold of greater than 0.40 including 29.129%, 17.851% and
13.803% respectively. It is commonly accepted to use factor analysis for distinct
statistical techniques, component analysis and common factor analysis (Tabachic&Fidel,
2012)
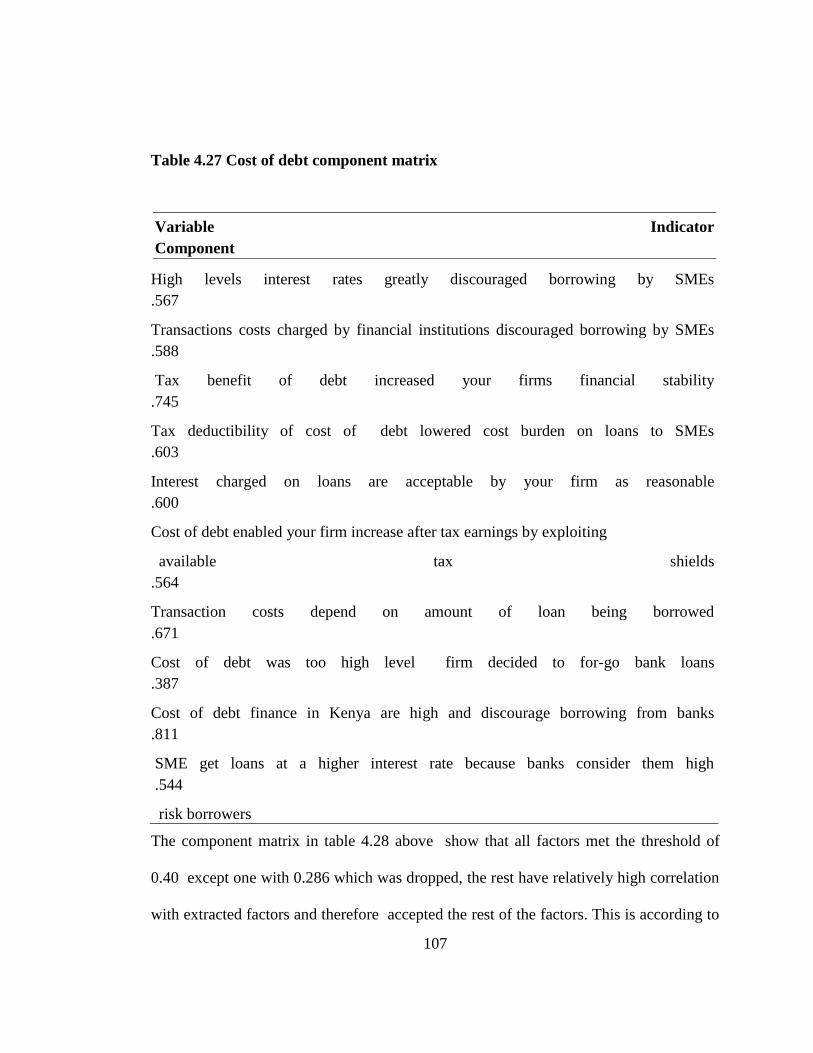
107
Table 4.27 Cost of debt component matrix
Variable Indicator
Component
High levels interest rates greatly discouraged borrowing by SMEs
.567
Transactions costs charged by financial institutions discouraged borrowing by SMEs
.588
Tax benefit of debt increased your firms financial stability
.745
Tax deductibility of cost of debt lowered cost burden on loans to SMEs
.603
Interest charged on loans are acceptable by your firm as reasonable
.600
Cost of debt enabled your firm increase after tax earnings by exploiting
available tax shields
.564
Transaction costs depend on amount of loan being borrowed
.671
Cost of debt was too high level firm decided to for-go bank loans
.387
Cost of debt finance in Kenya are high and discourage borrowing from banks
.811
SME get loans at a higher interest rate because banks consider them high
.544
risk borrowers
The component matrix in table 4.28 above show that all factors met the threshold of
0.40 except one with 0.286 which was dropped, the rest have relatively high correlation
with extracted factors and therefore accepted the rest of the factors. This is according to
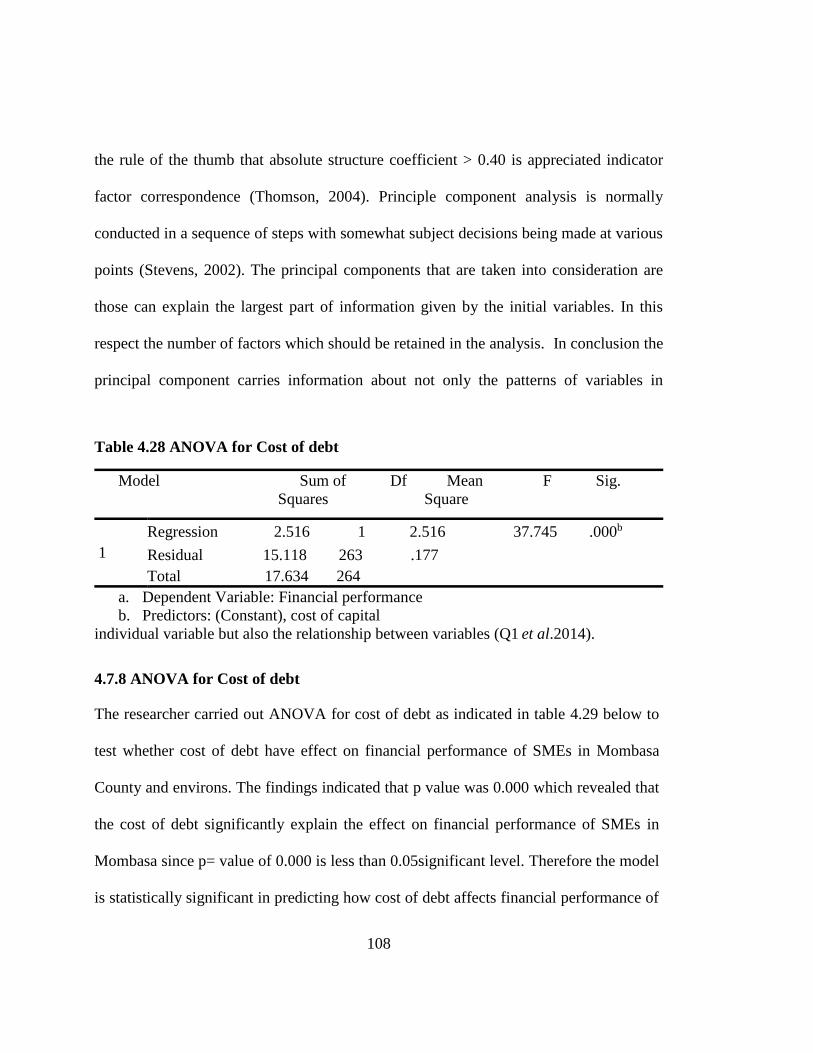
108
the rule of the thumb that absolute structure coefficient > 0.40 is appreciated indicator
factor correspondence (Thomson, 2004). Principle component analysis is normally
conducted in a sequence of steps with somewhat subject decisions being made at various
points (Stevens, 2002). The principal components that are taken into consideration are
those can explain the largest part of information given by the initial variables. In this
respect the number of factors which should be retained in the analysis. In conclusion the
principal component carries information about not only the patterns of variables in
individual variable but also the relationship between variables (Q1 et al.2014).
4.7.8 ANOVA for Cost of debt
The researcher carried out ANOVA for cost of debt as indicated in table 4.29 below to
test whether cost of debt have effect on financial performance of SMEs in Mombasa
County and environs. The findings indicated that p value was 0.000 which revealed that
the cost of debt significantly explain the effect on financial performance of SMEs in
Mombasa since p= value of 0.000 is less than 0.05significant level. Therefore the model
is statistically significant in predicting how cost of debt affects financial performance of
Table 4.28 ANOVA for Cost of debt
Model Sum of Df Mean F Sig.
Squares Square
1
Regression 2.516 1 2.516 37.745 .000b
Residual 15.118 263 .177
Total 17.634 264
a. Dependent Variable: Financial performance
b. Predictors: (Constant), cost of capital
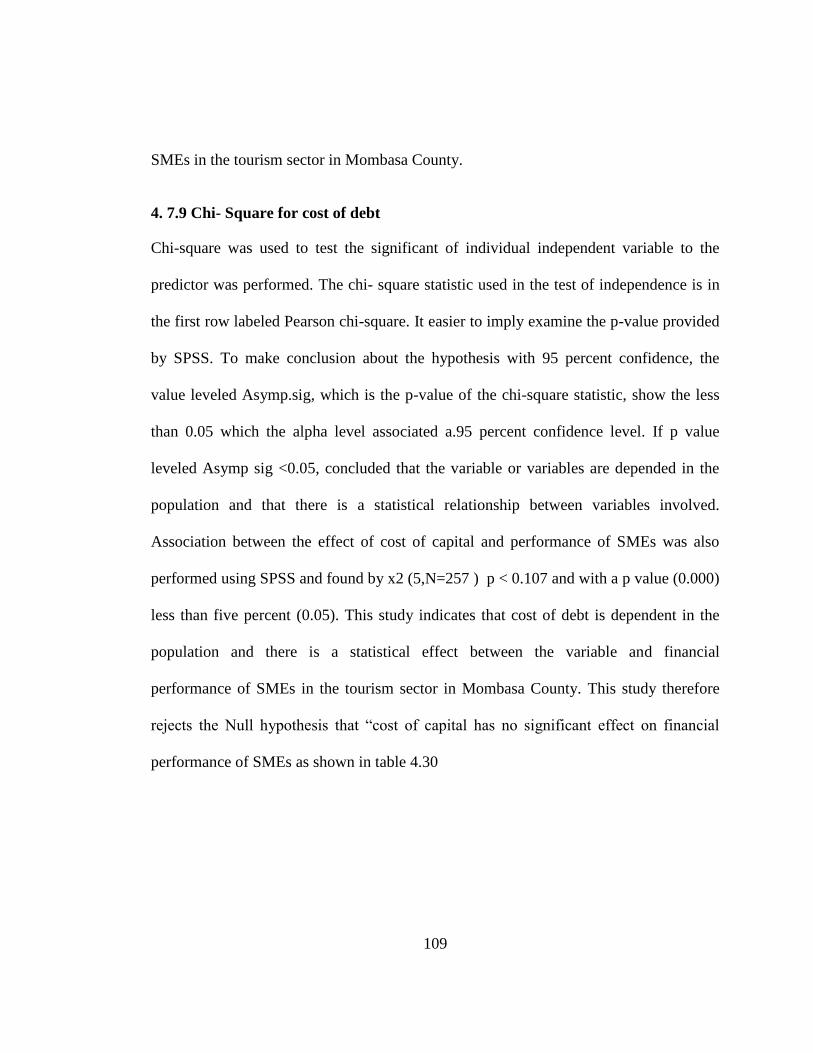
109
SMEs in the tourism sector in Mombasa County.
4. 7.9 Chi- Square for cost of debt
Chi-square was used to test the significant of individual independent variable to the
predictor was performed. The chi- square statistic used in the test of independence is in
the first row labeled Pearson chi-square. It easier to imply examine the p-value provided
by SPSS. To make conclusion about the hypothesis with 95 percent confidence, the
value leveled Asymp.sig, which is the p-value of the chi-square statistic, show the less
than 0.05 which the alpha level associated a.95 percent confidence level. If p value
leveled Asymp sig <0.05, concluded that the variable or variables are depended in the
population and that there is a statistical relationship between variables involved.
Association between the effect of cost of capital and performance of SMEs was also
performed using SPSS and found by x2 (5,N=257 ) p < 0.107 and with a p value (0.000)
less than five percent (0.05). This study indicates that cost of debt is dependent in the
population and there is a statistical effect between the variable and financial
performance of SMEs in the tourism sector in Mombasa County. This study therefore
rejects the Null hypothesis that “cost of capital has no significant effect on financial
performance of SMEs as shown in table 4.30
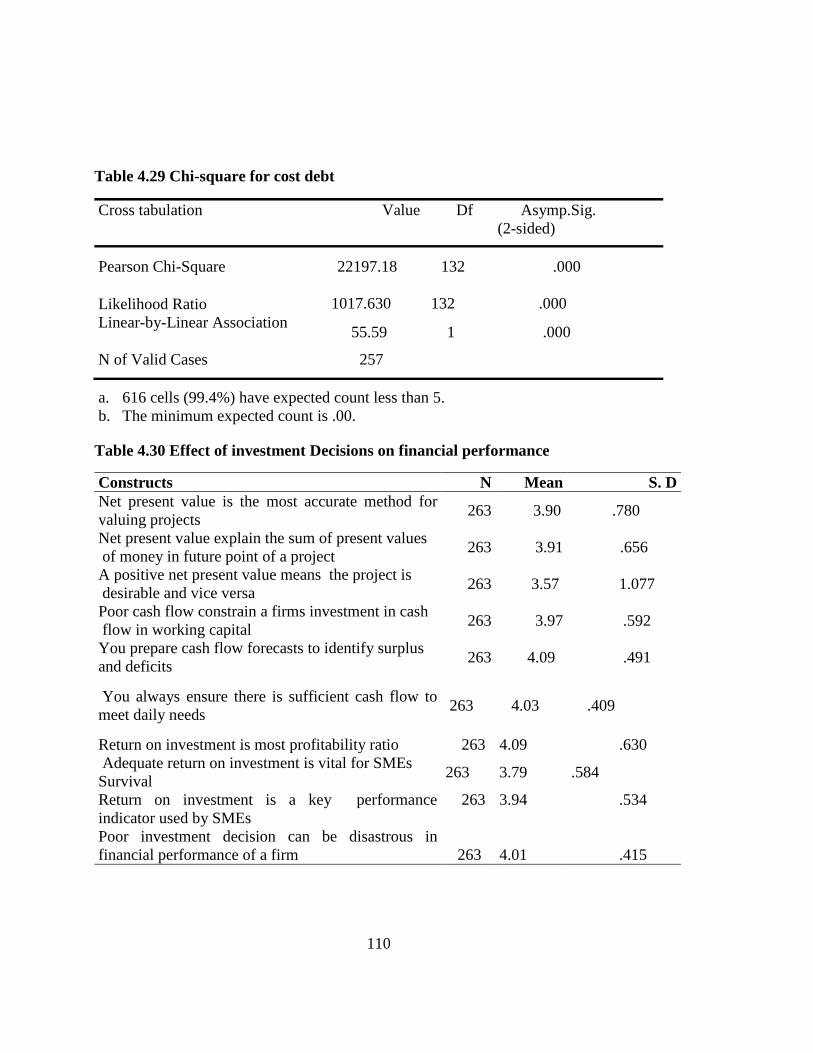
110
Table 4.29 Chi-square for cost debt
a. 616 cells (99.4%) have expected count less than 5.
b. The minimum expected count is .00.
Table 4.30 Effect of investment Decisions on financial performance
Constructs N Mean S. D
Net present value is the most accurate method for
valuing projects 263 3.90 .780
Net present value explain the sum of present values
of money in future point of a project 263 3.91 .656
A positive net present value means the project is
desirable and vice versa 263 3.57 1.077
Poor cash flow constrain a firms investment in cash
flow in working capital 263 3.97 .592
You prepare cash flow forecasts to identify surplus
and deficits 263 4.09 .491
You always ensure there is sufficient cash flow to
meet daily needs 263 4.03 .409
Return on investment is most profitability ratio 263 4.09 .630
Adequate return on investment is vital for SMEs
Survival 263 3.79 .584
Return on investment is a key performance
indicator used by SMEs
Poor investment decision can be disastrous in
financial performance of a firm
263
263
3.94
4.01
.534
.415
Cross tabulation Value Df Asymp.Sig.
(2-sided)
Pearson Chi-Square 22197.18 132 .000
Likelihood Ratio
Linear-by-Linear Association
1017.630 132 .000
55.59 1 .000
N of Valid Cases 257
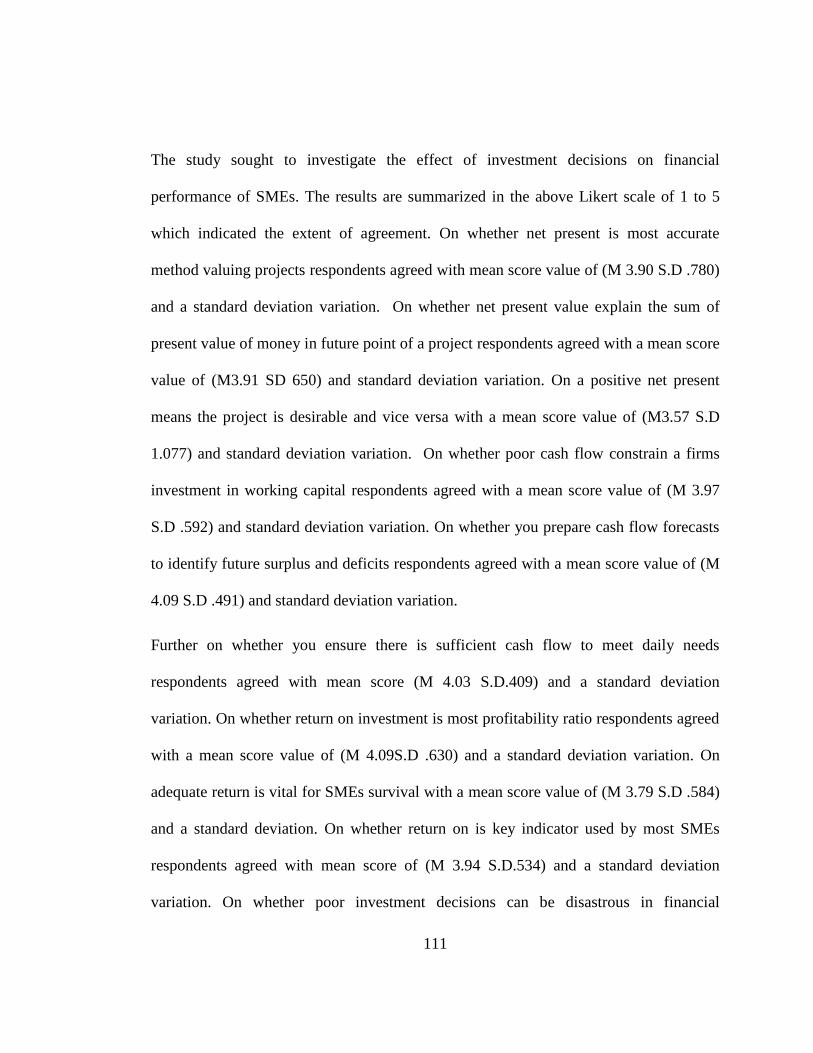
111
The study sought to investigate the effect of investment decisions on financial
performance of SMEs. The results are summarized in the above Likert scale of 1 to 5
which indicated the extent of agreement. On whether net present is most accurate
method valuing projects respondents agreed with mean score value of (M 3.90 S.D .780)
and a standard deviation variation. On whether net present value explain the sum of
present value of money in future point of a project respondents agreed with a mean score
value of (M3.91 SD 650) and standard deviation variation. On a positive net present
means the project is desirable and vice versa with a mean score value of (M3.57 S.D
1.077) and standard deviation variation. On whether poor cash flow constrain a firms
investment in working capital respondents agreed with a mean score value of (M 3.97
S.D .592) and standard deviation variation. On whether you prepare cash flow forecasts
to identify future surplus and deficits respondents agreed with a mean score value of (M
4.09 S.D .491) and standard deviation variation.
Further on whether you ensure there is sufficient cash flow to meet daily needs
respondents agreed with mean score (M 4.03 S.D.409) and a standard deviation
variation. On whether return on investment is most profitability ratio respondents agreed
with a mean score value of (M 4.09S.D .630) and a standard deviation variation. On
adequate return is vital for SMEs survival with a mean score value of (M 3.79 S.D .584)
and a standard deviation. On whether return on is key indicator used by most SMEs
respondents agreed with mean score of (M 3.94 S.D.534) and a standard deviation
variation. On whether poor investment decisions can be disastrous in financial
112
performance showed a mean score of (M4.01S.415) and standard deviation variation.
Average mean for investment decision was 3.93. Also Ravilla, Saris and Krosnick
(2014) state that agree- disagree scale cab be used to measure a wide range of constructs
and they also state that visual display of the scale is easier and quicker , since the scale
needs to be explained once to the respondents.
4.7.10 Factor analysis for investment decisions
Factor analysis was performed as indicated in table 4.32 below showing the actual
factors that were extracted and to find out the underlying dimensions within the
questionnaires. In this case only three factors load highly and met the cut off criterion of
Kaiser’s criterion having eigenvalue of great than one. Those that did not meet the
threshold were ignored. In column three the percent of variance for the six factors are
shown as 39.259%, 24.278%.19.640%, and 12.803%, respectively. The rest of the 6
factors are discarded or dropped. Factor analysis allowed the researcher to investigate
the concepts that are not easily measured directly by collapsing a large number of
variables into a few interpretable underlying factors. Devellis (2003) confirms that factor
analysis is employed to refine the number of items on a scale for the purpose of scale
development
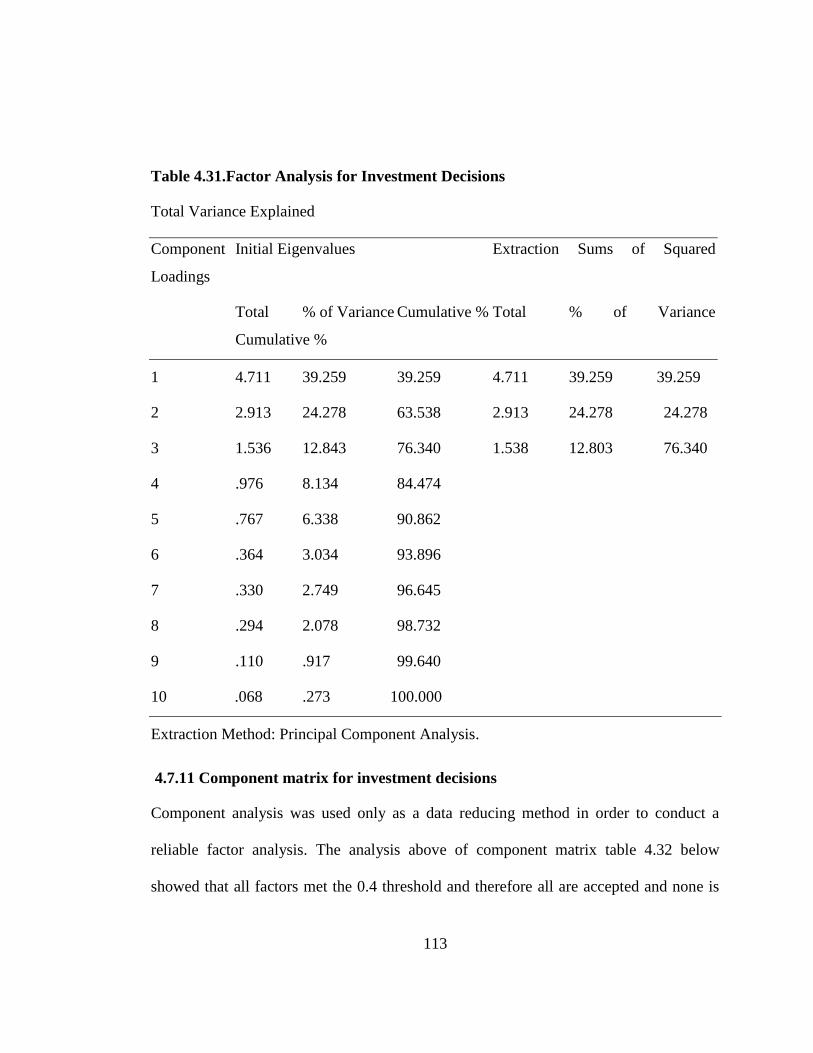
113
Table 4.31.Factor Analysis for Investment Decisions
Total Variance Explained
Component Initial Eigenvalues Extraction Sums of Squared
Loadings
Total % of Variance Cumulative % Total % of Variance
Cumulative %
1 4.711 39.259 39.259 4.711 39.259 39.259
2 2.913 24.278 63.538 2.913 24.278 24.278
3 1.536 12.843 76.340 1.538 12.803 76.340
4 .976 8.134 84.474
5 .767 6.338 90.862
6 .364 3.034 93.896
7 .330 2.749 96.645
8 .294 2.078 98.732
9 .110 .917 99.640
10 .068 .273 100.000
Extraction Method: Principal Component Analysis.
4.7.11 Component matrix for investment decisions
Component analysis was used only as a data reducing method in order to conduct a
reliable factor analysis. The analysis above of component matrix table 4.32 below
showed that all factors met the 0.4 threshold and therefore all are accepted and none is
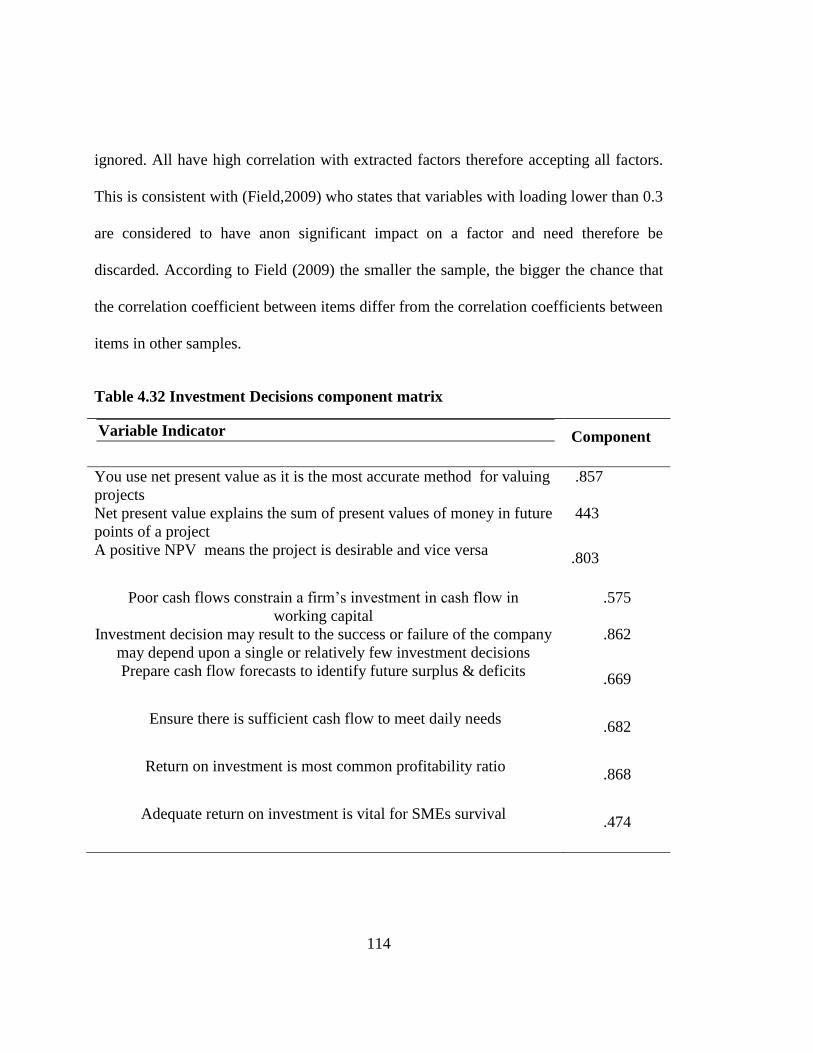
114
ignored. All have high correlation with extracted factors therefore accepting all factors.
This is consistent with (Field,2009) who states that variables with loading lower than 0.3
are considered to have anon significant impact on a factor and need therefore be
discarded. According to Field (2009) the smaller the sample, the bigger the chance that
the correlation coefficient between items differ from the correlation coefficients between
items in other samples.
Table 4.32 Investment Decisions component matrix
Variable Indicator Component
You use net present value as it is the most accurate method for valuing
projects
.857
Net present value explains the sum of present values of money in future
points of a project
443
A positive NPV means the project is desirable and vice versa .803
Poor cash flows constrain a firm’s investment in cash flow in
working capital
.575
Investment decision may result to the success or failure of the company
may depend upon a single or relatively few investment decisions
.862
Prepare cash flow forecasts to identify future surplus & deficits .669
Ensure there is sufficient cash flow to meet daily needs .682
Return on investment is most common profitability ratio .868
Adequate return on investment is vital for SMEs survival .474
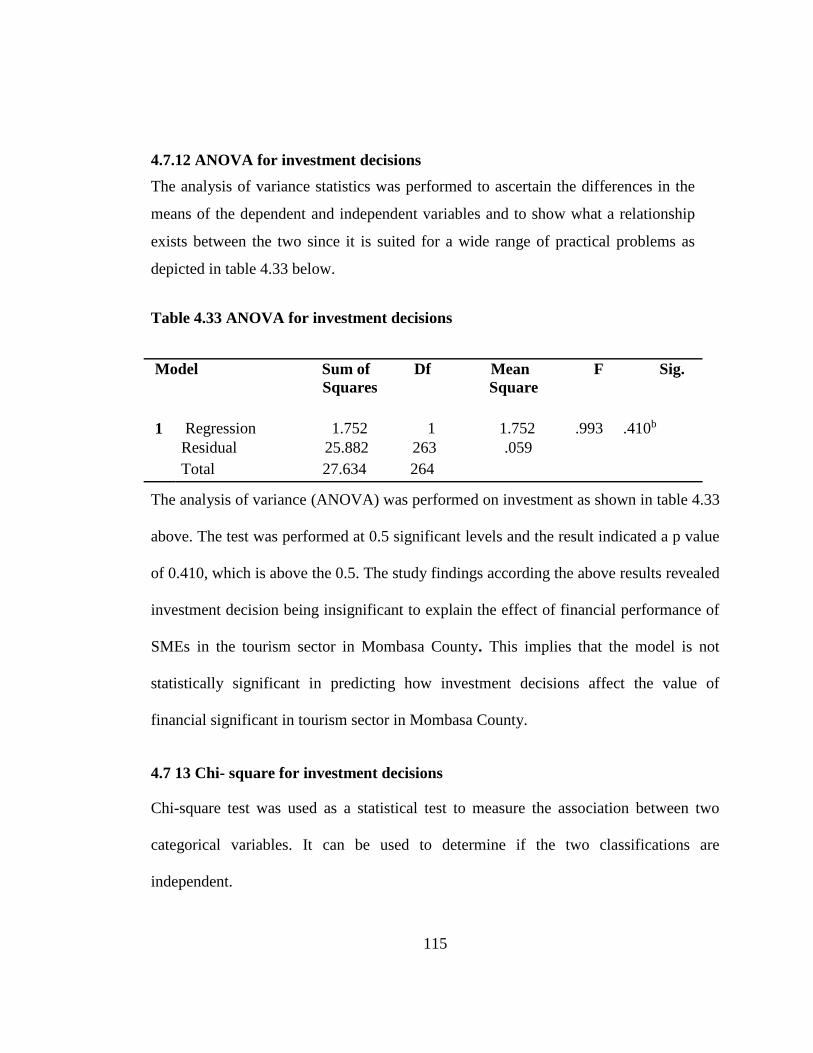
115
4.7.12 ANOVA for investment decisions
The analysis of variance statistics was performed to ascertain the differences in the
means of the dependent and independent variables and to show what a relationship
exists between the two since it is suited for a wide range of practical problems as
depicted in table 4.33 below.
Table 4.33 ANOVA for investment decisions
Model Sum of Df Mean F Sig.
Squares Square
1 Regression 1.752 1 1.752 .993 .410b
Residual 25.882 263 .059
Total 27.634 264
The analysis of variance (ANOVA) was performed on investment as shown in table 4.33
above. The test was performed at 0.5 significant levels and the result indicated a p value
of 0.410, which is above the 0.5. The study findings according the above results revealed
investment decision being insignificant to explain the effect of financial performance of
SMEs in the tourism sector in Mombasa County. This implies that the model is not
statistically significant in predicting how investment decisions affect the value of
financial significant in tourism sector in Mombasa County.
4.7 13 Chi- square for investment decisions
Chi-square test was used as a statistical test to measure the association between two
categorical variables. It can be used to determine if the two classifications are
independent.
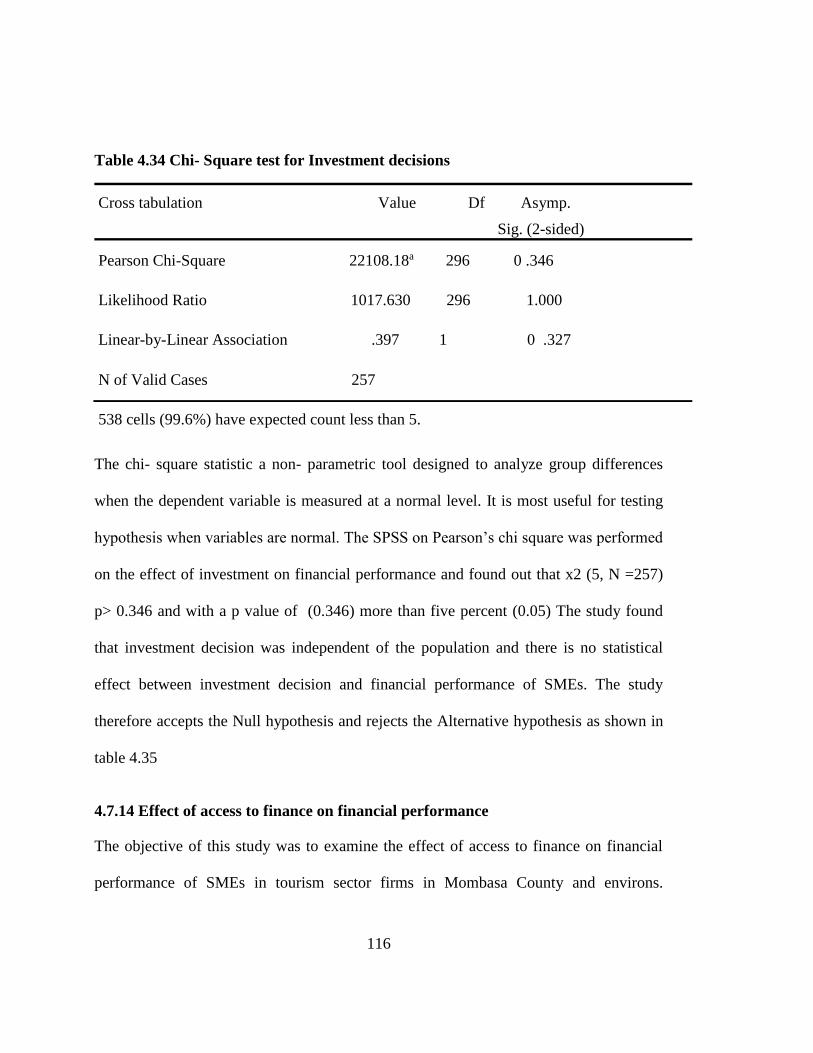
116
Table 4.34 Chi- Square test for Investment decisions
538 cells (99.6%) have expected count less than 5.
The chi- square statistic a non- parametric tool designed to analyze group differences
when the dependent variable is measured at a normal level. It is most useful for testing
hypothesis when variables are normal. The SPSS on Pearson’s chi square was performed
on the effect of investment on financial performance and found out that x2 (5, N =257)
p> 0.346 and with a p value of (0.346) more than five percent (0.05) The study found
that investment decision was independent of the population and there is no statistical
effect between investment decision and financial performance of SMEs. The study
therefore accepts the Null hypothesis and rejects the Alternative hypothesis as shown in
table 4.35
4.7.14 Effect of access to finance on financial performance
The objective of this study was to examine the effect of access to finance on financial
performance of SMEs in tourism sector firms in Mombasa County and environs.
Cross tabulation Value Df Asymp.
Sig. (2-sided)
Pearson Chi-Square 22108.18a 296 0 .346
Likelihood Ratio 1017.630 296 1.000
Linear-by-Linear Association .397 1 0 .327
N of Valid Cases 257
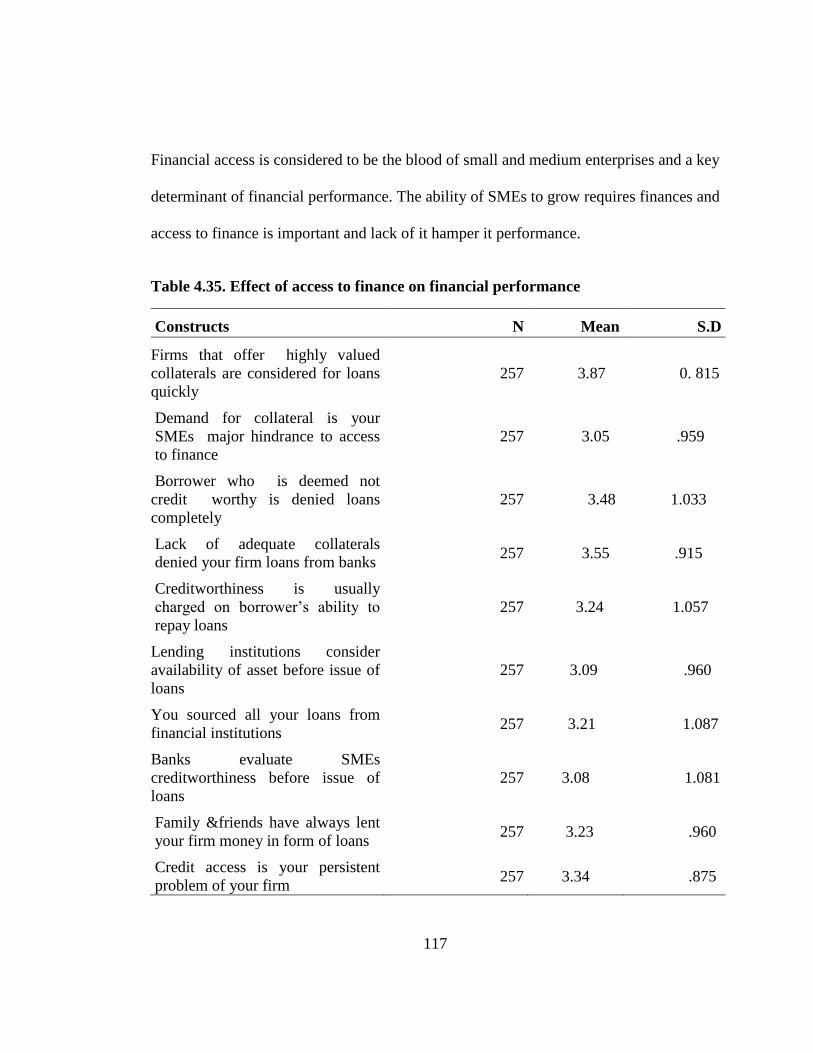
117
Financial access is considered to be the blood of small and medium enterprises and a key
determinant of financial performance. The ability of SMEs to grow requires finances and
access to finance is important and lack of it hamper it performance.
Table 4.35. Effect of access to finance on financial performance
Constructs N Mean S.D
Firms that offer highly valued
collaterals are considered for loans
quickly
257 3.87 0. 815
Demand for collateral is your
SMEs major hindrance to access
to finance
257 3.05 .959
Borrower who is deemed not
credit worthy is denied loans
completely
257 3.48 1.033
Lack of adequate collaterals
denied your firm loans from banks 257 3.55 .915
Creditworthiness is usually
charged on borrower’s ability to
repay loans
257 3.24 1.057
Lending institutions consider
availability of asset before issue of
loans
257 3.09 .960
You sourced all your loans from
financial institutions 257 3.21 1.087
Banks evaluate SMEs
creditworthiness before issue of
loans
257 3.08 1.081
Family &friends have always lent
your firm money in form of loans 257 3.23 .960
Credit access is your persistent
problem of your firm 257 3.34 .875
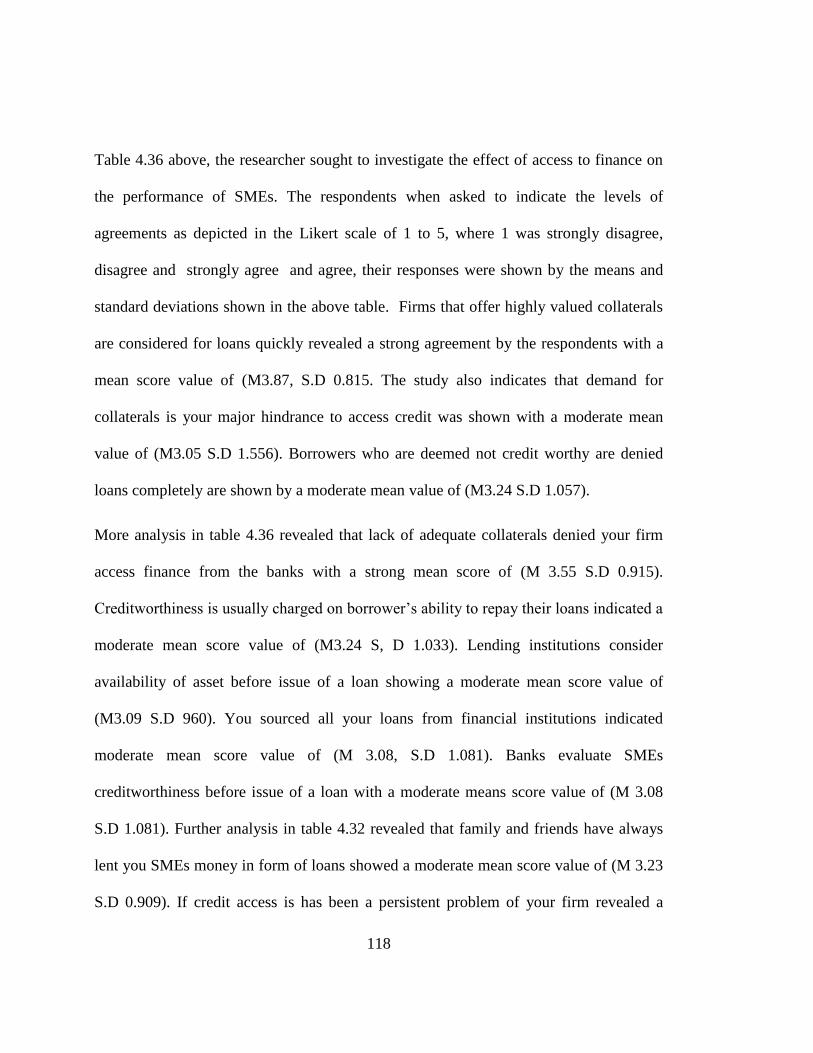
118
Table 4.36 above, the researcher sought to investigate the effect of access to finance on
the performance of SMEs. The respondents when asked to indicate the levels of
agreements as depicted in the Likert scale of 1 to 5, where 1 was strongly disagree,
disagree and strongly agree and agree, their responses were shown by the means and
standard deviations shown in the above table. Firms that offer highly valued collaterals
are considered for loans quickly revealed a strong agreement by the respondents with a
mean score value of (M3.87, S.D 0.815. The study also indicates that demand for
collaterals is your major hindrance to access credit was shown with a moderate mean
value of (M3.05 S.D 1.556). Borrowers who are deemed not credit worthy are denied
loans completely are shown by a moderate mean value of (M3.24 S.D 1.057).
More analysis in table 4.36 revealed that lack of adequate collaterals denied your firm
access finance from the banks with a strong mean score of (M 3.55 S.D 0.915).
Creditworthiness is usually charged on borrower’s ability to repay their loans indicated a
moderate mean score value of (M3.24 S, D 1.033). Lending institutions consider
availability of asset before issue of a loan showing a moderate mean score value of
(M3.09 S.D 960). You sourced all your loans from financial institutions indicated
moderate mean score value of (M 3.08, S.D 1.081). Banks evaluate SMEs
creditworthiness before issue of a loan with a moderate means score value of (M 3.08
S.D 1.081). Further analysis in table 4.32 revealed that family and friends have always
lent you SMEs money in form of loans showed a moderate mean score value of (M 3.23
S.D 0.909). If credit access is has been a persistent problem of your firm revealed a
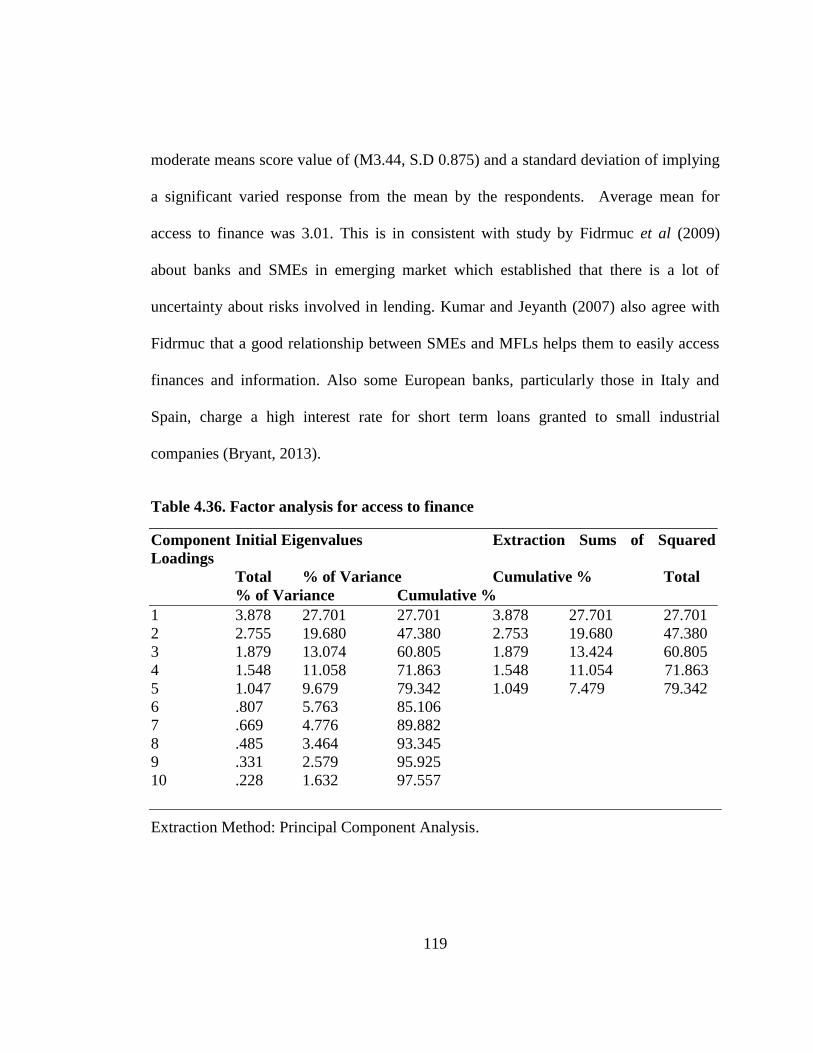
119
moderate means score value of (M3.44, S.D 0.875) and a standard deviation of implying
a significant varied response from the mean by the respondents. Average mean for
access to finance was 3.01. This is in consistent with study by Fidrmuc et al (2009)
about banks and SMEs in emerging market which established that there is a lot of
uncertainty about risks involved in lending. Kumar and Jeyanth (2007) also agree with
Fidrmuc that a good relationship between SMEs and MFLs helps them to easily access
finances and information. Also some European banks, particularly those in Italy and
Spain, charge a high interest rate for short term loans granted to small industrial
companies (Bryant, 2013).
Table 4.36. Factor analysis for access to finance
Component Initial Eigenvalues Extraction Sums of Squared
Loadings
Total % of Variance Cumulative % Total
% of Variance Cumulative %
1 3.878 27.701 27.701 3.878 27.701 27.701
2 2.755 19.680 47.380 2.753 19.680 47.380
3 1.879 13.074 60.805 1.879 13.424 60.805
4 1.548 11.058 71.863 1.548 11.054 71.863
5 1.047 9.679 79.342 1.049 7.479 79.342
6 .807 5.763 85.106
7 .669 4.776 89.882
8 .485 3.464 93.345
9 .331 2.579 95.925
10 .228 1.632 97.557
Extraction Method: Principal Component Analysis.
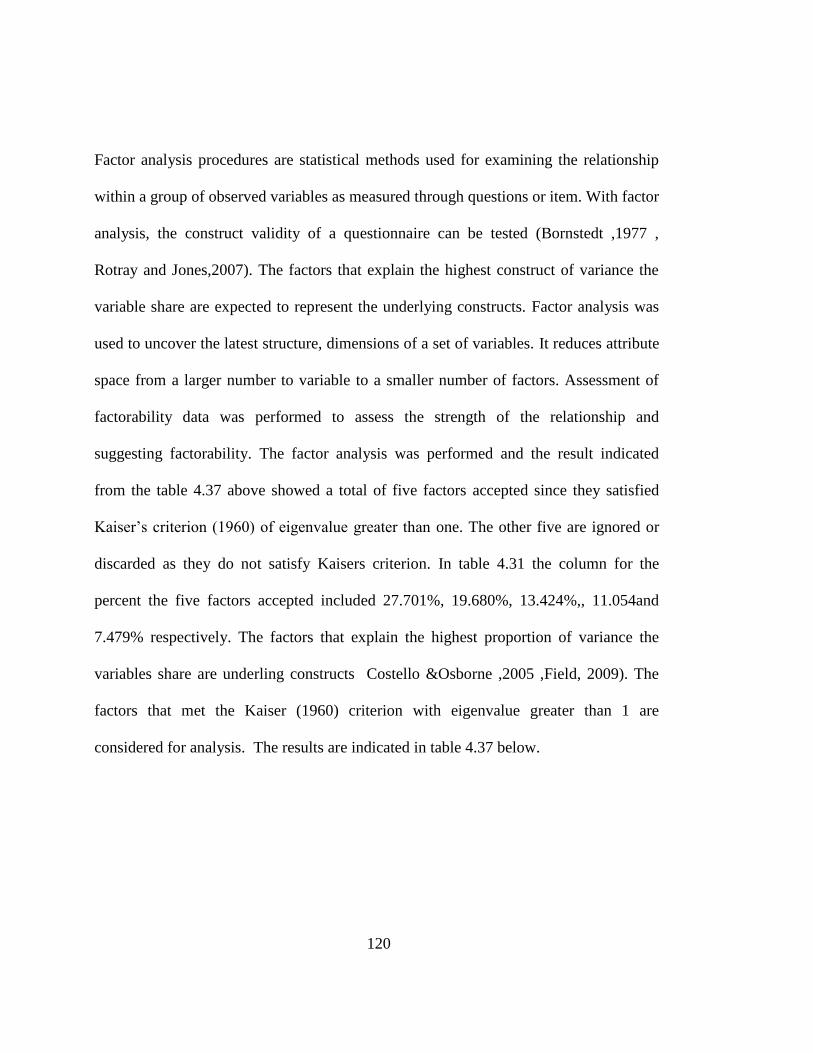
120
Factor analysis procedures are statistical methods used for examining the relationship
within a group of observed variables as measured through questions or item. With factor
analysis, the construct validity of a questionnaire can be tested (Bornstedt ,1977 ,
Rotray and Jones,2007). The factors that explain the highest construct of variance the
variable share are expected to represent the underlying constructs. Factor analysis was
used to uncover the latest structure, dimensions of a set of variables. It reduces attribute
space from a larger number to variable to a smaller number of factors. Assessment of
factorability data was performed to assess the strength of the relationship and
suggesting factorability. The factor analysis was performed and the result indicated
from the table 4.37 above showed a total of five factors accepted since they satisfied
Kaiser’s criterion (1960) of eigenvalue greater than one. The other five are ignored or
discarded as they do not satisfy Kaisers criterion. In table 4.31 the column for the
percent the five factors accepted included 27.701%, 19.680%, 13.424%,, 11.054and
7.479% respectively. The factors that explain the highest proportion of variance the
variables share are underling constructs Costello &Osborne ,2005 ,Field, 2009). The
factors that met the Kaiser (1960) criterion with eigenvalue greater than 1 are
considered for analysis. The results are indicated in table 4.37 below.
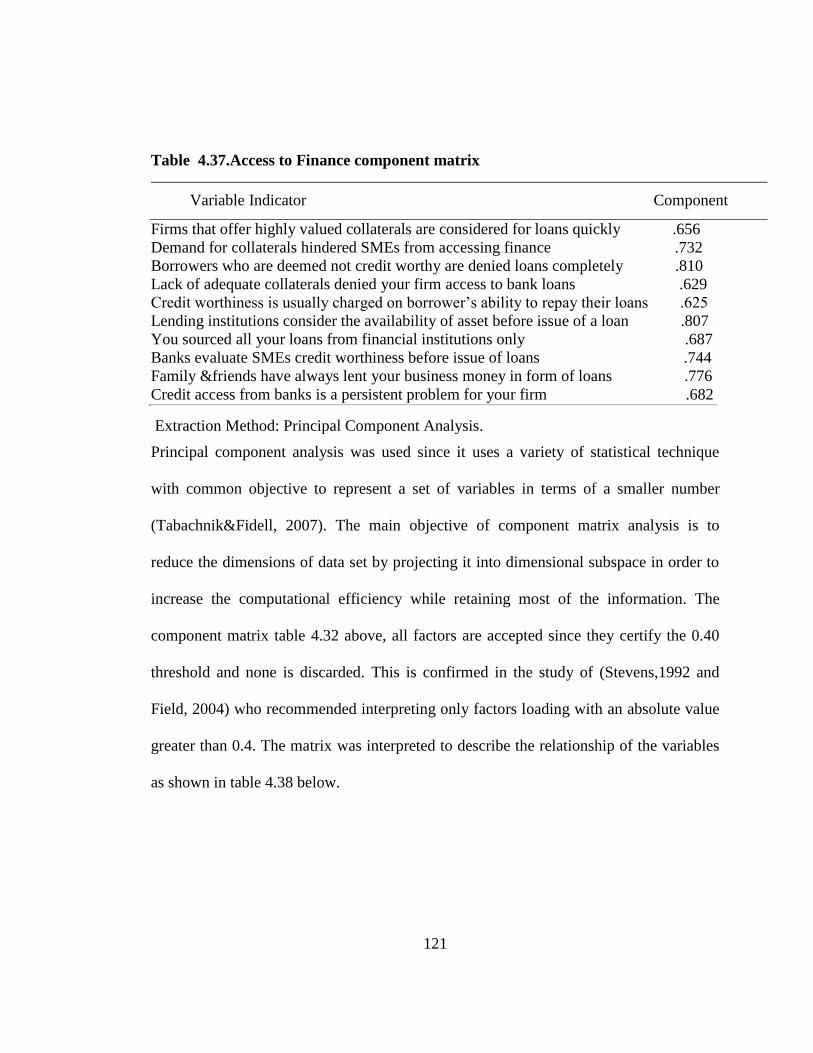
121
Table 4.37.Access to Finance component matrix
Variable Indicator Component
Firms that offer highly valued collaterals are considered for loans quickly .656
Demand for collaterals hindered SMEs from accessing finance .732
Borrowers who are deemed not credit worthy are denied loans completely .810
Lack of adequate collaterals denied your firm access to bank loans .629
Credit worthiness is usually charged on borrower’s ability to repay their loans .625
Lending institutions consider the availability of asset before issue of a loan .807
You sourced all your loans from financial institutions only .687
Banks evaluate SMEs credit worthiness before issue of loans .744
Family &friends have always lent your business money in form of loans .776
Credit access from banks is a persistent problem for your firm .682
Extraction Method: Principal Component Analysis.
Principal component analysis was used since it uses a variety of statistical technique
with common objective to represent a set of variables in terms of a smaller number
(Tabachnik&Fidell, 2007). The main objective of component matrix analysis is to
reduce the dimensions of data set by projecting it into dimensional subspace in order to
increase the computational efficiency while retaining most of the information. The
component matrix table 4.32 above, all factors are accepted since they certify the 0.40
threshold and none is discarded. This is confirmed in the study of (Stevens,1992 and
Field, 2004) who recommended interpreting only factors loading with an absolute value
greater than 0.4. The matrix was interpreted to describe the relationship of the variables
as shown in table 4.38 below.

122
Table 4.38 ANOVA for Access to Finance
a. Dependent Variable: Financial performance
b. Predictors: (Constant), Access Finance
4.7.15 ANOVA for access to finance
The analysis of variance (ANOVA) test was performed to test the effect of access to
finance on financial performance of SMEs. The findings from the above table indicated
that there was statistical significant in explaining the effect of access to finance on
financial performance of SMEs in Mombasa County and environs, since p=0.000 which
less than 0.05. This indicated that there is significant in SMEs financial performance,
inferring that access to finance affects financial performance of SMEs in Mombasa
County and environs. The results show that access to finance matter in SMEs
performance as shown in table 4.39as shown in table 4.39above.
Model Sum of Df Mean F Sig.
Squares Square
1
Regression 1.719 1 3.871 33.468 .000b
Residual 23.367 258 .093
Total 25.638 259
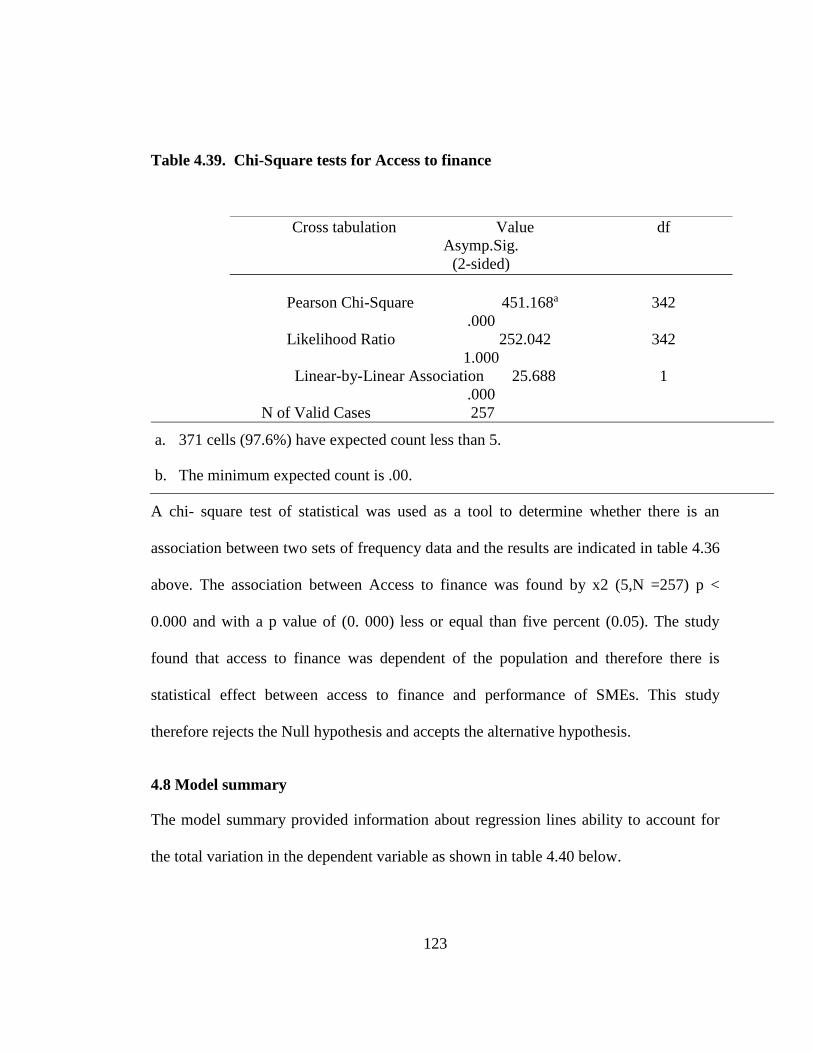
123
Table 4.39. Chi-Square tests for Access to finance
a. 371 cells (97.6%) have expected count less than 5.
b. The minimum expected count is .00.
A chi- square test of statistical was used as a tool to determine whether there is an
association between two sets of frequency data and the results are indicated in table 4.36
above. The association between Access to finance was found by x2 (5,N =257) p <
0.000 and with a p value of (0. 000) less or equal than five percent (0.05). The study
found that access to finance was dependent of the population and therefore there is
statistical effect between access to finance and performance of SMEs. This study
therefore rejects the Null hypothesis and accepts the alternative hypothesis.
4.8 Model summary
The model summary provided information about regression lines ability to account for
the total variation in the dependent variable as shown in table 4.40 below.
Cross tabulation Value df
Asymp.Sig.
(2-sided)
Pearson Chi-Square 451.168a 342
.000
Likelihood Ratio 252.042 342
1.000
Linear-by-Linear Association 25.688 1
.000
N of Valid Cases 257
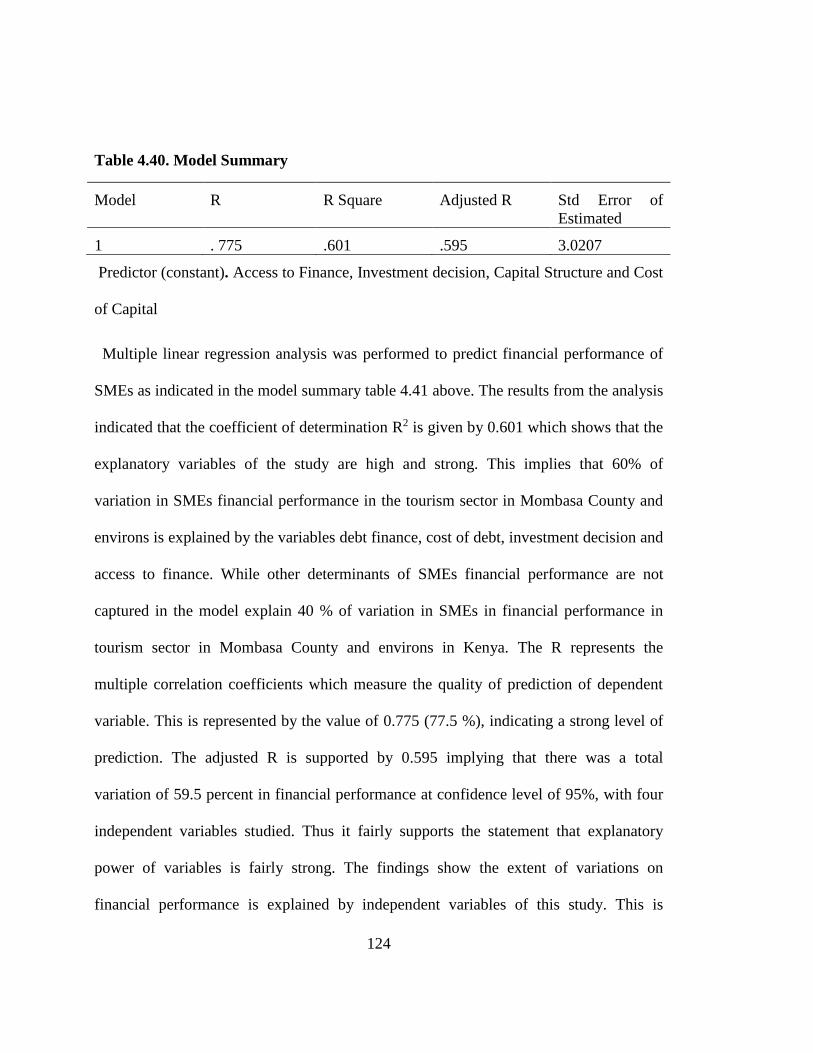
124
Table 4.40. Model Summary
Model R R Square Adjusted R Std Error of
Estimated
1 . 775 .601 .595 3.0207
Predictor (constant). Access to Finance, Investment decision, Capital Structure and Cost
of Capital
Multiple linear regression analysis was performed to predict financial performance of
SMEs as indicated in the model summary table 4.41 above. The results from the analysis
indicated that the coefficient of determination R2 is given by 0.601 which shows that the
explanatory variables of the study are high and strong. This implies that 60% of
variation in SMEs financial performance in the tourism sector in Mombasa County and
environs is explained by the variables debt finance, cost of debt, investment decision and
access to finance. While other determinants of SMEs financial performance are not
captured in the model explain 40 % of variation in SMEs in financial performance in
tourism sector in Mombasa County and environs in Kenya. The R represents the
multiple correlation coefficients which measure the quality of prediction of dependent
variable. This is represented by the value of 0.775 (77.5 %), indicating a strong level of
prediction. The adjusted R is supported by 0.595 implying that there was a total
variation of 59.5 percent in financial performance at confidence level of 95%, with four
independent variables studied. Thus it fairly supports the statement that explanatory
power of variables is fairly strong. The findings show the extent of variations on
financial performance is explained by independent variables of this study. This is
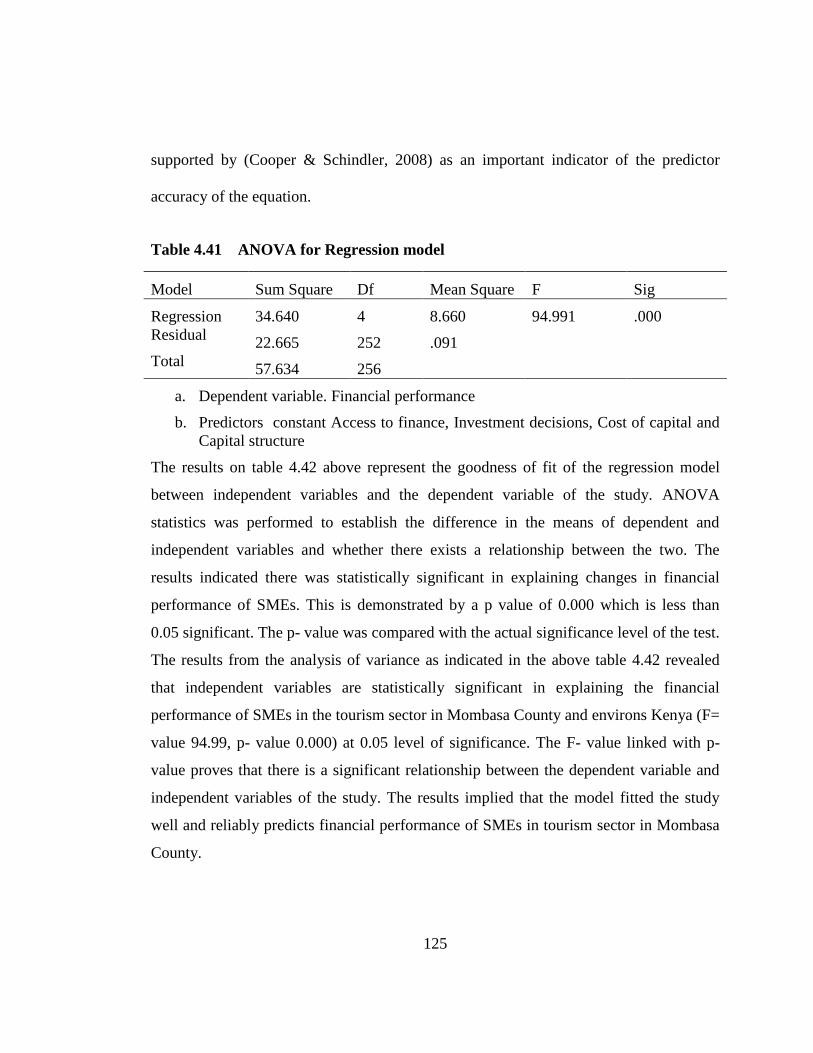
125
supported by (Cooper & Schindler, 2008) as an important indicator of the predictor
accuracy of the equation.
Table 4.41 ANOVA for Regression model
Model Sum Square Df Mean Square F Sig
Regression
Residual
Total
34.640
22.665
57.634
4
252
256
8.660
.091
94.991 .000
a. Dependent variable. Financial performance
b. Predictors constant Access to finance, Investment decisions, Cost of capital and
Capital structure
The results on table 4.42 above represent the goodness of fit of the regression model
between independent variables and the dependent variable of the study. ANOVA
statistics was performed to establish the difference in the means of dependent and
independent variables and whether there exists a relationship between the two. The
results indicated there was statistically significant in explaining changes in financial
performance of SMEs. This is demonstrated by a p value of 0.000 which is less than
0.05 significant. The p- value was compared with the actual significance level of the test.
The results from the analysis of variance as indicated in the above table 4.42 revealed
that independent variables are statistically significant in explaining the financial
performance of SMEs in the tourism sector in Mombasa County and environs Kenya (F=
value 94.99, p- value 0.000) at 0.05 level of significance. The F- value linked with p-
value proves that there is a significant relationship between the dependent variable and
independent variables of the study. The results implied that the model fitted the study
well and reliably predicts financial performance of SMEs in tourism sector in Mombasa
County.
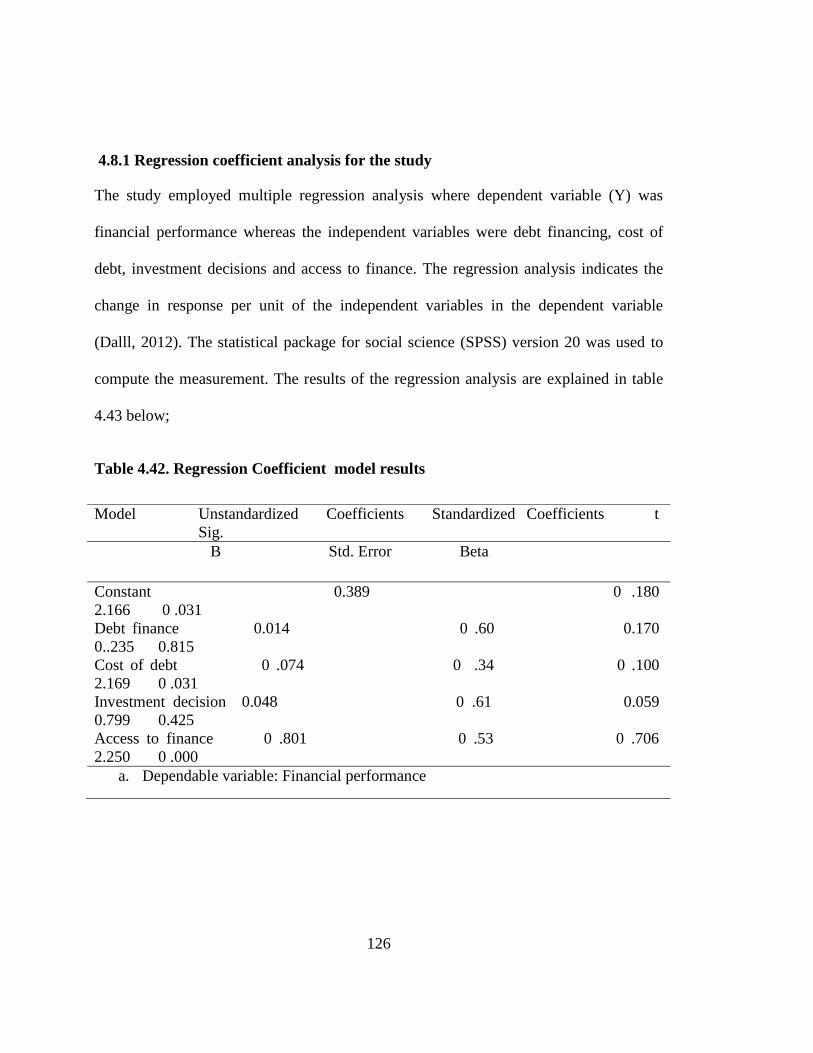
126
4.8.1 Regression coefficient analysis for the study
The study employed multiple regression analysis where dependent variable (Y) was
financial performance whereas the independent variables were debt financing, cost of
debt, investment decisions and access to finance. The regression analysis indicates the
change in response per unit of the independent variables in the dependent variable
(Dalll, 2012). The statistical package for social science (SPSS) version 20 was used to
compute the measurement. The results of the regression analysis are explained in table
4.43 below;
Table 4.42. Regression Coefficient model results
Model Unstandardized Coefficients Standardized Coefficients t
Sig.
B Std. Error Beta
Constant 0.389 0 .180
2.166 0 .031
Debt finance 0.014 0 .60 0.170
0..235 0.815
Cost of debt 0 .074 0 .34 0 .100
2.169 0 .031
Investment decision 0.048 0 .61 0.059
0.799 0.425
Access to finance 0 .801 0 .53 0 .706
2.250 0 .000
a. Dependable variable: Financial performance
127
A multiple linear regression model for this study was conducted to predict the
relationship between the dependent variable and the related independent variables, as
expressed by the model
Y= β0 +β1X1+β2X2+β3X3+β4X4+e, which is translated by Y=0.389 +0.014x1 + 0.74x2+
0.48x3 + 0.801x4. Where the Y= Financial performance, Xi = debt finance, X2 = Cost of
debt, X3=Investment decision and X4 =Access to finance.
The results in table 4.43 above indicate that on average the financial performance of
SMEs amount to 0.389 units holding other factors constant at zero. Debt financing
0.014x1 indicating a positive and not significant effect of 0.815 at 0.05 significant value.
It also indicated a beta of 0.170. Financial performance could be Y= 0.389. X1 0.014 on
debt financing. It shows that one unit change in debt financing results in 0.014 units
increase in SMEs financial performance. The regression result indicates that debt
finance had a positive and insignificant effect on financial performance of SMEs in the
tourism sector in Mombasa County in Kenya (beta=-0.017 p- value= 0.815).Therefore
accepting the null hypothesis and rejecting the alternative hypothesis and conclude that
debt finance has no significant effect on financial performance of SMEs in tourism
sector in Mombasa County and environs. Also the t- test for debt financing is shown by
0.235 which implies that the effect of debt financing surpasses that of error by over than
two times. The study therefore provides empirical evidence that debt finance has a
positive insignificant effect on financial performance of SMEs. A big t value and a small
P value suggest that independent variables will have a large effect on dependent value
128
which is not the case for this study as indicated in table 4.43 above. This is consistent
with the finds of Jordan et al (2005) and Fu et al (2002) who conducted a survey on
SMEs in England and Taiwan The findings also conform to Carpenter (2006) who
researched on 243 firms in Canada and a review by Kyereboah- Cleman(2007) on micro
finance institution in Ghana that short term debt and long term financing are not
significant to business finance
Cost of debt was 0.074x2 positively and significantly affects financial performance of
SMEs as indicated by the beta value of 0. 031 and significant p-value of 0.000 which is
less than the 0.05 significant level. Financial performance could be Y=0.389.X2 0.074 p-
value 0.031 shows that one unit change in cost of debt results in 0.74 units increase in
SMEs financial performance. Regression results indicate that cost of debt had a positive
and significant relationship with a beta=0.100, p value 0.0.31. Hence the researcher
rejects the null hypothesis for cost of debt and accepts the alternative hypothesis and
concluding that cost of debt has significant effect on financial performance in tourism
sector in Mombasa County and environs. Also the effect of cost of debt was stated by
the t-test value of 2.169 which implies that the standard error associated with the
parameter is less than effect of the parameter by more than four times. The study is
consistent with the findings of Robson and Obeng (2008) findings that entrepreneurs
perceived their challenges to be inflation, high interest rates and the depreciation of local
currency. The findings also reflected the study of Wole (2009) who found that cost of
credit which influences the availability of finance determines the financial performance
129
of an enterprise in a number of ways, for instance the ability of access to credit by small
scale enterprise will determine its choices for technology, access to market and access
the essential resources. Also the results support the findings of the study conducted by
Kinyanju,i (2006) where some entrepreneurs felt that it was difficult to obtain loans as
they had to show credit records and they did not fully understand the requirement of
getting and paying loans. This finding reflected those of a study carried by Mwangi and
Bwisa (2013) on challenges facing entrepreneurs in accessing credit, due to high cost of
credit. The study therefore provides empirical evidence that cost of debt has positive and
significant effect on financial performance of SMEs.
Investment decision 0.048x3 positively and insignificantly affects financial performance
of SMEs as indicated by the beta value of .059 and insignificant p- value of 0.475 which
is greater than 0.05 significant levels. Financial performance could be Y=2.381. X3
0.048 shows that one unit of change in investment decision results in 0.048 units
increase in financial performance of SMEs The regression results indicate that
investment decision had a positive and insignificant effect with a beta = -0.59, p- value
0.425. Hence accepting the null hypothesis and rejecting the alternative hypothesis and
concluding that investment decision has no significant effect on financial performance
on Mombasa County and environs. The t- test for investment decisions is shown by
0.799 which implies that the effect of investment decision surpasses that of error by less
than one. Capital budgeting theory generally assumes that the primary goals of firm’s
shareholders are to maximize the firm’s value. In addition, the firm is assumed to have
130
access to perfect financial markets, allowing it to finance all value enhancing projects
when those assumptions are met, firms can separate investment and finance decision
and should invest in all positive net value projects (Bbrealey and Myers,2010).
According to previous research, clearly the most common investment evaluation
methods are payback, net present value and internal rate of return (,Sandal and
Sjogren,2003Tuomaala&Virtanen, 2011). Companies feel that the complexity of
measuring energy efficiency investments future savings makes payback period an
adequate method for financial investment evaluation (Jackson, 2010). The study
therefore provides empirical evidence that investment decisions have negative and
significant effect on financial performance of SMEs.
Access to credit was 0.801x4 has positive and significantly effect on financial
performance of SMEs as indicated by the beta value of 0.706 and significant value of
0.000 which is less than 0.05 significant levels. Financial performance could be Y=
2.381. X4 0.801 shows that one unit change in access to finance results 0.801 in
increases in SMEs financial performance. The regression result of access to finance had
a positive and significant effect with beta=0.706, p- value 0.000 on financial
performance of SMEs. Hence the null hypothesis was rejected and accepting alternative
hypothesis and concludes that access to finance has significant effect with financial
performance of SMEs in tourism sector Mombasa County and environs. Consequently t-
test for access to finance is shown by 2.250 which imply that the effect of access to
finance is less that of standard error by over fifteen times. This is confirmed by
131
Nkurunziza, (2005) that firms without access to bank funding are more vulnerable to
external shock. Also the study is consistent with Schiffer and Weder (2001) that firms
with credit constraint grow more slowly compared to those with easy access to credit.
This is consistent with the study by (Kayunula &Quarley,2000, Muhammed et al 2010,
Subhan et al 2013) that banks in many cases enforce several lending conditions in a
loan contract before granting the loan to SMEs. Such conditions include obtaining
personal commitments and adequate tangible assets as collateral, Typically , the value of
the collateral is higher than the value of the granted loan and can be in case of payment
default. The study therefore provides empirical evidence that access to finance have
positive and significant effect on financial performance of SMEs in Mombasa County
and environs in Kenya.
4.9 Correlation Coefficient analysis
The Pearson correlation coefficient (r) was computed to establish the strength and
relationship between independent variables and dependent variable as shown in the table
4.44 below. The Pearson correlation coefficient r, can take a range of values from +1 to -
1. A value of 0 indicates that there is no association between two variables. The stronger
the correlation the closer the coefficient is to +1,-1. If the coefficient is positive number
the variable are directly relate
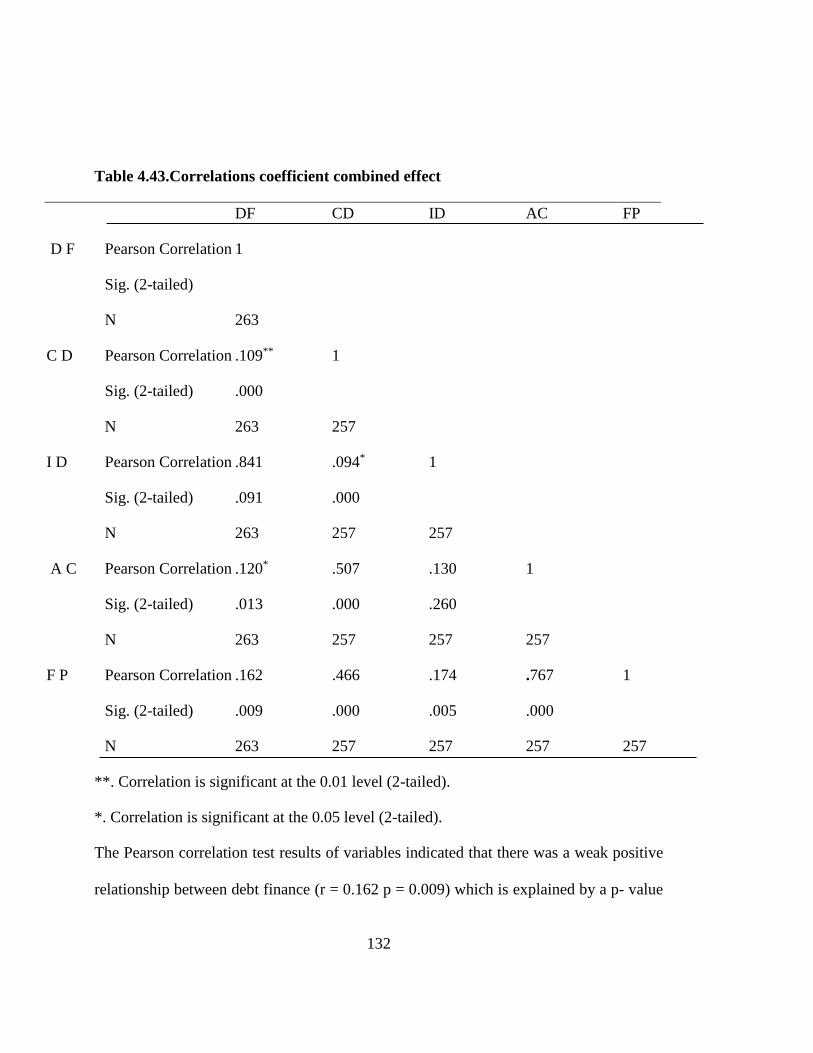
132
Table 4.43.Correlations coefficient combined effect
DF CD ID AC FP
D F Pearson Correlation 1
Sig. (2-tailed)
N 263
C D Pearson Correlation .109** 1
Sig. (2-tailed) .000
N 263 257
I D Pearson Correlation .841 .094* 1
Sig. (2-tailed) .091 .000
N 263 257 257
A C Pearson Correlation .120* .507 .130 1
Sig. (2-tailed) .013 .000 .260
N 263 257 257 257
F P Pearson Correlation .162 .466 .174 .767 1
Sig. (2-tailed) .009 .000 .005 .000
N 263 257 257 257 257
**. Correlation is significant at the 0.01 level (2-tailed).
*. Correlation is significant at the 0.05 level (2-tailed).
The Pearson correlation test results of variables indicated that there was a weak positive
relationship between debt finance (r = 0.162 p = 0.009) which is explained by a p- value
133
of 9% at a correlation significant of 0.05 level on financial performance of SMEs. This
result implies that with 1% increase in the positive effect of debt finance there is 16.2%
increase indicating a weak positive relationship with financial performance of SMEs in
tourism sector Mombasa and environs Kenya. It was also found to be insignificant at 5%
since p- value was 0.009. This is consistent with Maritala (2012) on optimal level of
capital structure which enables a firm to increase its financial performance. This is also
in compliance with the study of Cohens (1988) conventions to interpret effect size. A
Correlation coefficient of 0.10 is thought be weak or small association, correlation
coefficient of 0.30 is considered a moderate correction and coefficient of 0.50 or larger
to represent a strong or large correlation. The coefficient correlation between cost of
debt and financial performance was found to be 0.466. This reflects a moderate positive
relationship between cost of debt and financial performance of SMEs. It was also found
(r =0.466, p =0.000) to be statistically significant at 5% level of significant. This result
imply that with 1% increase in positive effect of cost of debt there is 46.6% increase
indicating a moderate positive relationship with financial performance of SMEs.
The correlation coefficient between investment decision and financial performance was
found to be 0.174. This reflected a weak positive relationship between investment
decision and financial performance of SMEs. It was also found that (r = 0.174 p= 0.005)
to be statistically significant at 5% level of significant. This implies that 17.4% increase
in financial performance of SMEs with 1% increase in financial performance of SMEs,
which is a weak positive relationship with financial performance of SMEs. It was also
134
found to be statistically significant at 5% level significant. Correlation coefficient results
between access to finance and financial performance of SMEs indicated r = 0.767 p
value =.0.000) at correlation significant of 0.05 level. This implies that 76.7% increase
in performance of SMEs with 1% increase in financial performance of SMEs, which is a
strong positive and significant relationship between access to finance and performance
of SMEs. It was also found to be statistically significant at 5% level of significant.
All the above four independent variables are interpreted according to Evans (1996),
correlation is an effect size and so we can verbally desecrate the strength of correlation
using the guide that suggest that absolute value of r 00- 0.19 very weak, 0.20-39
weak,0.40-059 moderate, 0.60-0.79 strong and 0.80-1.0 very strong.
4.10 Hypotheses Testing
Multiple regression analysis was conducted to test the research hypothesis on four
predicting variables including debt financing, cost of debt, investment decisions, access
to credit and financial performance as the dependent variables. The results for each of
the four variables are shown below.
4.10.1 Hypothesis Testing 1
HO1. Debt financing has no significance effect on financial performance of SMEs in
Kenya.
HA1. Debt financing has significant effect on financial performance of SMEs in Kenya
135
Research finding show that debt finance had a coefficient of significant based on B1=
0.061 p-value = 0.815 which is greater than 0.05, implying that we accept the null
hypothesis stating that debt finance has no significant effect on financial performance
and reject the alternative hypothesis which states that debt finance has significant effect
on financial performance of SMEs. Hence conclude that debt finance has no significant
effect on financial performance of SMEs. Further the effect of debt financing on
financial performance of SMEs was stated by the Chi square value p-value of 0.313
which is more than the 0.05 value, therefore accepting the hypothesis and rejecting the
alternative hypothesis, which states that’ debt financing has significant effect on
financial performance of SMEs in Kenya. The rationale to measure various variables
was to ascertain whether the resources invested have positive effect on hotels, tours
safaris and restaurants increased performance in terms of profitability (ROA). In this
literature of financing of hotel industry was to identify the efficiency of enterprise on
debt finance, cost of capital, investment decisions and access to finance as determinants
of improved financial performance as conceptualized in figure 1 above
4.10.2 Hypothesis Testing 2
HO2 Cost of debt has no significant effect on financial performance of SMEs in Kenya.
HA2 Cost of debt has significant effect on financial performance of SMEs in Kenya
The findings showed that cost of credit had a coefficient of estimate B2 =0.0.074, p-
value of 0.031 which is less than 0.05 hence reject the null hypothesis which states that

136
cost of debt has no significant on financial performance of SMEs and accept the
alternative hypothesis which states that cost of debt has significant effect on financial
performance of SMEs. Hence conclude that cost of debt has significant effect on SMEs
financial performance. Also a chi- square was performed as shown by a chi-square of
0.00 is lower than 0.05 therefore rejecting the null hypothesis and accepting alternative
hypothesis
4.10.3 Hypothesis Testing 3
An HO3 Investment decision has no significant effect on financial performance of SMEs
in Kenya.
HA3 Investment decision has significant effect on financial performance of SMEs in
Kenya
The null hypothesis postulated that investment decision has no significant effect on
financial performance of SMEs in Kenya. The study findings showed a coefficient of
estimated significant of 0.048 p- value of 0.425 which is more than the 0.05 hence
accept the null hypothesis and reject the alternative hypothesis, concluding that
investment decision has no significant effect on financial performance of SMEs in
Mombasa County. Chi-square indicate a no significant with financial performance of
SMEs.
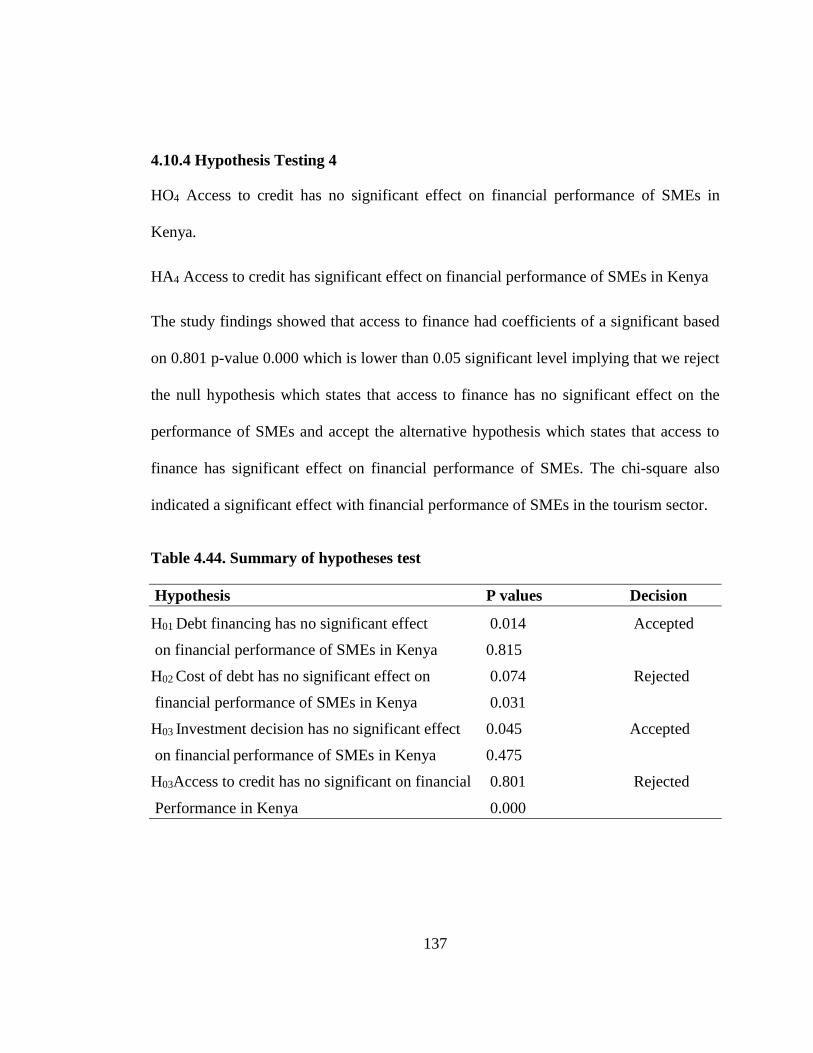
137
4.10.4 Hypothesis Testing 4
HO4 Access to credit has no significant effect on financial performance of SMEs in
Kenya.
HA4 Access to credit has significant effect on financial performance of SMEs in Kenya
The study findings showed that access to finance had coefficients of a significant based
on 0.801 p-value 0.000 which is lower than 0.05 significant level implying that we reject
the null hypothesis which states that access to finance has no significant effect on the
performance of SMEs and accept the alternative hypothesis which states that access to
finance has significant effect on financial performance of SMEs. The chi-square also
indicated a significant effect with financial performance of SMEs in the tourism sector.
Table 4.44. Summary of hypotheses test
Hypothesis P values Decision
H01 Debt financing has no significant effect 0.014 Accepted
on financial performance of SMEs in Kenya 0.815
H02 Cost of debt has no significant effect on 0.074 Rejected
financial performance of SMEs in Kenya 0.031
H03 Investment decision has no significant effect 0.045 Accepted
on financial performance of SMEs in Kenya 0.475
H03Access to credit has no significant on financial 0.801 Rejected
Performance in Kenya 0.000
138
4.11 Secondary data analysis
In this section trend analysis for secondary data was presented for financial performance
in terms of profitability for hotels, restaurants and tour safaris using excel to analyze
data.
4, 11.1 Trend curve for hotels
The study sought to establish the trends of financial performance of SMEs in terms of
ROA for hotels in Mombasa County between 2012 and 2016. The results indicated a
mean of 2700 and constant between 2012 and 2013 and falling to 1100 in2015 and again
rising to 2007 mean as shown in appendix vi
4.11.2 Trend curve for restaurants.
The study sought to establish the trend of financial performance of SMEs in terms of
ROA for restaurants in Mombasa County and environs between 2012 and 2016. The
results indicate a mean of 3600 in 2012 decreasing in 2013and falling further to 1100 in
2015 and again rising to 2007 in2016 as shown in appendix vi
4.11.3 Trend curve for tour safaris
The study sought to establish the trends of financial performance of SMEs in terms of
RAO between 2012 and 2016. The results in the figure indicated that ROA had
increasing trend from 2009 to 3300 in 2016.The highest recorded ROA 2300 in 2016
appendix vi
139
4.12 Discussions of key results
The key objective of the study was to investigate determinants on financial performance
of SMEs in Mombasa County and environs in Kenya. The findings of the study as
analyzed in chapter four was summarized below as per the objectives of the study. The
four variables for this study included debt finance, cost of debt, investment decisions and
access to finance on financial performance, which are discussed below;
4.12.1 Financial performance
The respondents indicated a mean score response of 3.53 in agreement based on 5 point
Likert scale. The Cronbach’s alpha findings for financial performance were 0.735. The
respondents indicated that they use tools of financial ratios analysis like profitability
ratios to determine the firms return to its investment. They also confirmed that
profitability measures are important to managers and owners of the firm for they show
overall performance of the business. They further indicated that they calculate
profitability ratios. Whether their business had any liquidity problems, they indicated
that financial problems are always there especially cash to meet their short term
obligations. The findings are supported by Mido (2006) who indicated that there are
many ways to measure firm’s performance, but all measures should be taken in
aggregate. Line items such as revenue from operators, operating income or cash flows
from operators can be used, as well as total unit sales. Furthermore, the analysis or the
investor may wish to look deep into financial statements and seek out margin growth or
any declining debt.
140
Most of the respondent indicated they had knowledge of the financial ratios, with a few
indicating that they have no knowledge of the financial ratios, and also indicated they
use ratios although not so often and others indicated they do not use ratios at all. When
asked to indicate the ratios they use from the list provided they indicated gross profit
50%, net profit margin 63%, return on capital employed 33%, earning per share 47 %
current ratio 65%, quick/acid test ratio 56% and return on asset 36%. The results are
consistent with those of Abdel &Luther, (2006), Waweru &Sprakman (2012 and Naude
(2007), who found that most business prepared and used performance measurement
reports
Respondents were also asked to indicate on the most used ratios and how ratios are
useful to business performance. They indicated, current ratios, quick/ acid test ratios, net
working capital, earning per share, gross profit margin and net profit margin, net
operating profit margin and return on asset were most used ratios. They also indicated
that financial ratios are useful the performance of their business and also stated that
results from the ratios analysis is good measure of financial performance of a firm. This
is consistent to Mewse (2011), who encourages business owners to monitor their
business performance continuously so that problems can be addressed as they arise. He
proposes the use of a number of key ratios to help managers identify and rectify
problems before the business enters a decline; Managers should keep an eye on expenses
versus income, cash flow and working ratios. This is consistent with Nyabwanga et al
(2012) that cash management as the process of planning and controlling cash flows into
141
and out an enterprise as well as balance held at a specific point in time. The objective of
cash flow management has been stated as the determinant of an optimal cash position
that would allow a business to meet its ongoing obligations while maintain exposures
(Mazzavol, 2014).
4.12.2 Debt finance on financial performance
The first objective sought to determine the effect of debt finance on financial
performance of SMEs in tourism sector in Mombasa County Kenya. The descriptive
analysis for debt finance indicated mean score of 3.54. The normality test for both
Kolmogorov-smirnov and Shapiro and wilk indicated that the data for the study was
normally distributed. The Cronbach’s alpha for debt finance was 0.721 indicating a high
level of consistency. Collinearity coefficient table indicates that debt finance had no
collinearity problem exists. The ANOVA results indicated insignificant relationship
between debt financing and financial performance of SMEs. P-value of 0.009 at 0.005
significant level. The regression analysis indicates a positive and insignificant
relationship with financial performance of SMEs p- value 0.815 which is more than the
level of significance of 0.05 levels. The study accepted the null hypothesis and rejected
the alternative hypothesis. Achi-square was also performed and the result indicated that
there was no statistical effect between debt finance and financial performance 0.413 at
0.005 significance level. The person’s result correlation indicated a weak positive
relationship r=0.162 p value 0.009 with financial performance of SMEs. This is
inconsistent with the study of Gleason et al (2000) who found that total debt to be
142
negatively related to return on asset. The study findings were also supported by Abor,
(2007) who investigated the effect of capital structure on financial performance of
SMEs, where the study reveals that long- term debt and gross profit margin (GPM) are
positively related, whereas short term debt has significant and negative relationship with
gross profit margin a Ghanaian and South Africa perspective. Pearson’s correlation
coefficient results indicated that there was a weak positive relationship between capital
structure and financial performance of SMEs.
The respondents also indicated that firms use short term debt in addition to share capital
in order to increase its earnings, which also has an effect on the return on equity. They
also noted that firms employ certain level of debt. The respondents retaliated that firms
should use debt up to a specific level in order to increase their return on assets. This is
consistent with the theory which defines capital structure levels and how much debt and
equity finance should be chosen by the company to use by balancing the costs and
benefits (Frank& Goyal, 2005)
They also stated that optimal debt capital is good for the SMEs. This is in conformity
with Abdul (2012) research to determine the relationship between capital structure
decisions and the performance of firms in Pakistan who found that leverage has a
significant negative relationship with the firm’s performance measured by return on
assets (ROA). Also this is consistent with the study by Maina &Kondongo (2013) who
evaluated the relationship between leverage and the financial performance of listed firms
143
in Kenya, and found a significantly negative relationship between debt and profitability
but no effect on firm value.
4.12.3 Cost of debt on financial performance
The second objective was to determine the effect of cost of debt on financial
performance. The descriptive analysis indicated a mean of 3.12. Reliability Cronbach’s
alpha was 0.727. Kolmogovor- Simirnor indicated normal distribution. Shapiro &wilk
test indicated that cost of debt was significant, showing that data was normally
distributed. Collinearity coefficient results for cost of debt indicated no collinearity.
Both skewness and kurtosis indicated normality is not too extreme. The results for
multiple regression model indicated that cost of debt had a positive significant effect on
finance performance of SMEs p- value 0.031 which is less than 0.005 significant leve.
The study therefore rejected the null hypothesis and accepted the alternative hypothesis.
The Pearson’s correlation coefficient revealed a moderate positive relationship with cost
of debt on financial performance of SMEs as explained by r= 0.466 p- value 0.000 with
financial performance of SMEs. This is consistent with (Angelini and Gerale, 2008) who
state that financially constrained firms are likely to face higher cost of debt which
inhibits them from investing and building up their capital stock. When sources of
external financing are limited, firms are forced to rely on internal funds for financing
their investment expenditure. However, the maximum amount of internal funds a firm
can mobilize is limited by the profits it can generate. The results showed that small sized
firms’ apparent make small profit will underinvestment and remain small size.
144
The respondents also indicated that interest rates payments reduce funds available to be
invested to the business. This interest rate also covers the risk by the lenders. When
interest rates are high borrowers do not want to take loans out from the bank because it
is more difficult to pay loans back. They retaliated that access to loans and credit
facilities has been a major problem for the SMEs due to high interest rate charged by
financial institutions. This is supported by Mwenda and Muuka (2004) who found that
lending institutions charge different interest rate according to market conditions, degree
of risks and institutions objectives. These include simple interest which is calculated
only on that portion of the principal amount which remains unpaid, compounded interest
where borrower is charged interest on previous interest. This has led to increase in the
cost of acquiring loans by small scale enterprise. Further Kimuyu&Omiti (2000)
indicate that financial performance of small and medium scale enterprise are largely
determined by the general cost of credit in any given regime and also argue that the cost
of credit is major factor that determines the financial performance of the enterprise.
The respondents on whether cost of debt can be a limitation to use a given source of
finance indicated that debt is always desirable if a firm achieves relatively high profits as
its results in high returns to shareholders, which warrants the payment of given interest
rates. The use of debt is expected to enhance a firm’s finance to improve performance.
This is supported by Cecchetti et al, (2011) study on the effect if debt in firms and
concluded that moderate debt level improves welfare and enhances growth, but high
level can lead to a decline in growth of the firm. Further Rainhart and Rogoff (2009)
145
argue that when debt impacted positively to the growth of a firm only when is within
certain levels and when ration goes beyond certain levels financial crises is very likely.
This is also supported by Stewart et al (2011) which argue that high level of debt
increases profitability of a firm facing financial distress. Also that over borrowing can
lead to bankruptcy and financial ruin. High levels debt will constrain the firm from
undertaking project that are more likely to be profitable because of the inability to attract
more debt from financial institutions.
The respondents also indicated that, because of restrictive requirements of financial
institutions top among them being interest rates and risks associated with small business,
banks have always a risk adverse stance towards small business. This is supported by the
study by (Vuvor &Ackak, 2011) on the challenges faced by small and medium
enterprises in obtaining credit in Ghana. They indicated that SMEs in Ghana like most
SMEs in other countries are faced with challenges in accessing credit. The challenges
include, the inability of SMEs to provide collaterals and other information needed by the
banks such as audited financial statements, coupled with the high cost of loan in terms of
interest rates make it extremely difficult to access bank loans. Also Mensah (2004)
indicates that lack of institutional and legal structures that facilitates the management of
SMEs lending risk, high cost of borrowing and rigidity of interest rates as factors
adduced for lack of finance to SMEs.
146
4.12.4 Investment decision on financial performance
The third objective was to determine the effect of investment decisions on financial
performance of SMEs. The descriptive generally showed a positive average mean of
3.93. The Cronbach’s alpha for investment decisions was 0.743. Kolmogorov-Smirnor
showed that data was normally distributed. Shapiro &Wilk indicated investment
decision was significant implying data was normally distributed. Collinearity
coefficients test showed no collinearity problem exists. Multiple regression results
showed investment decision had a positive and insignificant effect on financial
performance of SMEs p- value 0.425 which is more than 0.05 significant levels. This
implies that investment decisions is not significant and has negative relationship with
financial performance of SMEs. The ANOVA findings indicated a statistically
insignificant in predicting the effect of investment decision on financial performance of
SMEs p-value 0.410 at 0.05 significant levels. The study therefore accepted the null
hypothesis and rejected the alternative hypothesis. Achi- square was also performed and
the results indicated insignificant results of p- value of 0.346 at 0.005 significance level.
The Pearson’s correlation coefficient revealed a weak positive relationship between
investment decision r= 0.174 p-value 0.032 which is insignificant with financial
performance of SMEs in tourism sector.
Respondents also indicated that they are familiar with various methods of project
appraisal. They also indicated that payback was most preferred method for SMEs
followed by NPV method. However some indicated that their business are small and do
147
not make use of the sophisticated method of investment appraisal techniques and that
they do not understand the investment decision methods. This is supported by Ogiji
&Ejembe (2007) who indicated that it is worthwhile to note that many people do not
have adequate knowledge of basic investment concepts required to make prudent
investment decisions. This is also supported by Van Horn (2006) who states that
payback period is considered one of the most popular and widely used traditional
method of evaluating investment opportunities. Any investment with a payback period
less than the payback standard is accepted. It gives an insight of the liquidity of the
investment.
Respondents also indicated that profitability of an investment project is determined by
evaluating its estimated cash flows. They indicated that the absence of a profit
eventually has a decline on the cash flow and the profit is more important to their
business. This consistent with Pandey (2008) who stated that the most crucial
information for capital investment decision is the forecast cash flow. A multinational
capital budgeting analysis focus on cash flow, show that it easily measures the impact
upon the firms wealth, profit and loss in financial statement do not always represent the
net increase or decrease in cash flows, cash flows occur at different times and these
times are easily identifiable, the time of flows particularly important for capital
budgeting analysis and, cash flows can provide existing data forecasting project and cash
flows will change the firms overall cash flows a direct result of decision to be accepted.
This is also consistence with Stephen et al (2013) that financial manager should be

148
educated and acquainted with capital budgeting techniques so as to shield the
organization from financial turbulence.
4.12.5 Access to finance and financial performance
The fourth objective was to determine effect of access to finance on financial
performance of SMEs. The descriptive analysis for this variable showed a positive and
average mean of 3.01, indicating a significant effect of the variable and financial
performance of SMEs in tourism sector in Mombasa County and environs Kenya. The
Cronbach’s alpha for access to finance was 0.784. Kolmogorov Smirnov test indicated
data was normally distributed. Shapiro& Wilk test indicated access to finance was
significant indicting data was normally distributed. Cronbach’s Alpha for access of
finance indicated a value of 0.735 which greater than the 50-70 acceptance level.
Collinearity test indicated VIF of 1.259 which less than 10 point and 0.794 which is
more than 0.2 lowest level limit, showing that no collinearity exist. Skewness &Kurtosis
both indicated that normality is not too extreme. Regression analysis indicates a positive
and significant relationship with financial performance of SMEs in the tourism sector p-
value 0.000 significant levels therefore rejecting null hypothesis and accepting the
alternative hypothesis. ANOVA results indicated that there was statistical significant
effect on financial performance of SMEs r=0.317, p= 0.000. The study therefore rejected
the null hypothesis and accepted the alternative hypothesis. The chi- square test also
indicates significant results with p value of 0.000 which is less than 0.005.
149
Pearson’s correlation coefficients results showed a moderate positive relationship
between access to finance r=317 p-0.000 with financial performance of SMEs. This is
inconsistent with the World Bank report (2010) established that SMEs are constrained
financially and that access to finance is an important ingredient to the financial
performance of SMEs. Also the World Bank report suggests that one of the major causes
of SMEs failure is limited access to external finance. Also Agnew (2003) observe that
finance is the life blood of any business enterprise and no enterprise no matter how well
managed, can survive without enough funds for working capital, fixed assets,
investment, and employment. Thus access to finance is essential to the survival and
performance of any business enterprise, which also agrees with Shas (2006) findings,
who in his research on the factors influencing the survival and performance of SMEs,
found that business performance is influenced by access to debt finance should perform
better than those without access to finance.
Also this study supports that lack of access to credit facilities is almost universally
indicated as key problem for small and micro enterprises. In most cases even where
credit is available mainly
through banks, the entrepreneur may lack freedom of choice because the banks’ lending
conditions may force the purchase of having innumerable equipment that can serve as
collateral for the bank credit constraint operate in variety of ways in Kenya, why
underdeveloped capital market forces entrepreneurs to rely self- financing or borrows
from friends and relatives. Lack of access to long term credit for micro, small and
150
medium enterprise forces then rely on high cost short term financing (Wanjohi &
Mugure, 2008)
Respondents confirmed that SMEs are restricted to credit because they cannot provide
financial information and collaterals and also risk and have high failure rate compared
with large firms compared with large firms. The result was also supported by Kira and
He (2012), Artola and Genre (2011), Fatoki and Assah (2011) who confirmed that
significantly financing constraint suffered severely to younger firms than large firms.
The study findings also revealed that SMEs source of finance comprised owners’
contribution, personal savings, donations, family, friends and relatives contributions,
venture capital, SACCOS, and debt comprised money borrowed from financial
institutions including commercial banks, microfinance and friends, which formed part of
debt. Equity was contributions from owner’s capital. This supported by Krishnan,(2010)
before the turn to external formal financing sources business angels, different funds or
banks entrepreneurs should try to collect their initial funds from those people who are
closest and familiar before they turn to external investment such as business angels,
various funds or banks.
Respondents also indicated among others why they did not source funds from financial
institutions because the process being cumbersome and did not bother. They also
indicated that very high interest was charged. Those who applied for the loans indicated
that they did so for either for startup or for expansion. Also collateral requirement
151
featured with most respondents as a limit to fund accessibility. It was also indicated that
financial institutions that lent loans to SMEs strictly asked for collateral, including title
deeds (property, house) and log books. This is consistence with Ono and Usesugi (2009)
who found that appositive relationship exist between the use of collateral and the
strength of the borrower lender lending relationship results in easier SME access to
external sources of finance. A similar conclusion was reached by Ordit and Gobardhn
(2011) when examining the factors determining the use of financial leverage by SMEs in
Mauritius .They concluded that access to debt finance is affected by the positive
association between the debt ratio and asset structure. Furthermore they revealed that
SMEs with a lower portion of tangible assets in their total assets are more likely to
encounter difficulties in applying for outside finance because of the inability to provide
the collateral required.
The respondents also indicated that SMEs access to finance has received a lot of
attention from financial institutions, and lenders mistrust to SMEs has made SMEs to
disclose their records to enable evaluate creditworthiness to ensure that only credit worth
SMEs are granted credit. They also indicated that granting credit by lenders depend on
the confidence that borrower’s ability and willingness to pay is guaranteed
152
CHAPTER FIVE
SUMMARY, CONCLUSION AND RECOMMENDATIONS
5.1 Introduction
This chapter summarized the main findings, highlighting the entire assessment of the
study. The study focused on the SMEs in hotel sector namely Hotels, Restaurants and
Tour safaris. In tourism sector. The conclusions and recommendations were done and
drawn from the research objectives of the study to establish the relationship between
financial determinants and financial performance using both descriptive and inferential
statistical analysis in Mombasa County and environs in Kenya for each objective of the
study. This chapter also covers the summary, conclusions, recommendations and
suggestions for further research.
5.2 Summary of key findings
The findings of the study have been summarized under each of the objectives. The study
employed both descriptive and inferential statistics.
5.2.1. Specific Objective 1
The first objective sought to establish the effect of debt finance on financial performance
of SMEs in Mombasa County and environs, Kenya. The indicators for debt finance
considered were long term debt, short term debt and trade credit, while measure of
financial performance was profitability. Descriptive statistical method was used to reach
the results where majority respondents agreed with an average mean score of 3.54 that
153
debt finance had a moderate effect on financial performance. The results indicated that
ANOVA for debt finance had no significant effect with financial performance of SMEs
in tourism sector in Mombasa and environs Kenya. Pearson’s correlation analysis results
indicated a weak and positive relationship between debt finance and financial
performance of SMEs. Regression analysis results indicated a positive and insignificant
relationship between debt finance and financial performance of SMEs. Based on the
results the study accepted the null hypothesis and established that debt finance has no
significant effect on the financial performance of SMEs in tourism sector in Mombasa
County and environs.
5.2.2. Specific Objective 2
The second objective study sought to determine the effect of cost of debt on financial
performance of SMEs in Mombasa County Kenya. The indicators for cost of debt
included interest rates, transaction cost and tax benefit of debt. The descriptive results
indicated a moderate positive average mean score of 33.12. The regression analysis
results indicated a positive and significant effect on financial performance of SMEs. The
correlation analysis indicated a weak positive relationship between cost of debt and
financial performance of SMEs. The ANOVA analysis results also indicated that cost of
debt was statistically significant in explaining the financial performance of SME in the
tourism sector. Chi square results confirmed and indicated that cost of debt had
statistical effect on financial performance of SMEs. Based on the results the study
154
rejected the null hypothesis and established that cost of debt had significant effect on
financial performance of SMEs in tourism sector in Mombasa and environs.
5.2.3. Specific Objective 3
The study sought to determine the effect of investment decisions on financial
performance of SMEs. The descriptive indicate a high positive agreement on the mean
score of 3.93. Reliability test results were significant. The regression analysis results
indicated a positive and insignificant relationship with financial performance of SMEs
on investment decisions. The correlation analysis showed a weak and positive
relationship with financial performance of SMEs in the tourism sector in Mombasa
County and environs Kenya. The ANOVA analysis results indicated there was
insignificant effect on financial performance of SMEs in tourism sector in Mombasa
County in Kenya. Further the chi- square results indicated a statistical insignificant
effect on financial performance of SMEs. Therefore accepting null hypothesis and
rejecting alternative analysis. The result indicates that investment decisions have
insignificant effect on financial performance of SMEs in the tourism sector in Mombasa
County and environs.
5.2.4. Specific objective 4
The study sought to determine the effect of access to finance on financial performance
of SMEs in tourism sector in Mombasa County Kenya. There was a general agreement
by the respondents with the average mean score of 3.01. The regression analysis result
155
revealed that access to finance positively and significantly affects financial performance
of SMEs. ANOVA analysis results show that there was statistical significant in
explaining the effect of access to finance on financial performance, hence the null
hypothesis was rejected and alternative hypothesis was accepted. Further correlation
coefficient results showed that access to finance had a strong positive relationship with
financial performance of SMEs. The chi- square results indicated that there was
statistical effect with financial performance of SMEs. Access to finance was found to be
key determinant on financial performance of SMEs in the tourism sector in Mombasa
County Kenya, as indicated from the respondents responses who agreed on the
statements.
5.3 Conclusions
The study investigated the determinants of financial performance of SMEs in tourism
sector Mombasa County and environs Kenya. From the findings of the study a number
of conclusions were made according to the objectives of the study. The study provided a
wide evidence to support the factors. Descriptive studies indeed identified the
instruments to measure financial performance. Reliability analysis also provided good
support for internal consistence on the factors. The study found that all the factors either
positively or negatively affects financial performance of SMEs as indicated in chapter
four above
The First objective of the study was to establish effect of debt finance on financial
performance of SMEs in Kenya. The evidence supported the hypothesis that debt
156
finance has no significant effect of SMEs in Kenya. This implied that debt financing was
statistically insignificant in explaining the effect on financial performance of SMEs.
ANOVA findings also indicated that there was no correlation between debt finance and
financial performance of SMEs in tourism sector in Mombasa County Kenya. The
results also indicated a positive correlation between debt finance and financial
performance.
The second objective of this study was to establish the effect of cost of debt on financial
of SMEs in Kenya. The result revealed that cost of debt positively and significantly
affect financial performance of SMEs in tourism sector in Mombasa County and
environs Kenya. The study rejected the null hypothesis and accepted the alternative
hypothesis and established that cost of debt have significant effect on financial
performance of SMEs in the tourism sector. It is therefore concluded that cost of debt
was statistically significantly to explain the effect of financial performance of SMEs.
ANOVA findings also indicated there was correlation between cost of debt and financial
performance of SMEs in Mombasa County Kenya. Correlation results indicated that
there was strong positive relationship between cost of debt and financial performance of
SMEs in Kenya.
The third objective of this study was to examine the effect of investment decision of
financial performance of SMEs in Kenya. The evidence supported the hypothesis
investment decisions has no significant effect on financial performance of SMEs in
tourism sector in Mombasa County and environs Kenya. The study accepted the null
157
hypothesis and rejected alternative hypothesis, concluding that investment decisions
insignificantly explain the effect of financial performance of SMEs. This implies that
investment decision was statistically insignificant in explaining the effect of financial
performance of SMEs in Mombasa County and environs Kenya. ANOVA findings also
indicated that there was no correlation between investment decision and financial
performance of SMEs. Correlation results indicated a weak positive insignificant
relationship between investment decisions and financial performance of SMEs.
The fourth objective was to examine the effect of access to finance on financial
performance in Kenya. The results revealed that access to finance has a positive and
significant effect on financial performance of SMEs in tourism sector in Mombasa
County and environs Kenya. The study rejected the null hypothesis and accepted the
alternative hypothesis, implying that access to finance significantly and statistically
explain the effect of financial performance of SMEs in the tourism sector in Mombasa
County. It was also confirmed that access to finance is a key determinant factor on
financial performance. ANOVA findings also indicated that there was positive
correlation between access finance and financial performance of SMEs. Correlation
results indicated there exists a strong positive relationship between access to finance and
financial performance of SME.
5.4 Recommendations
SME sector is one of the most important sectors in the Kenya’s economy because it
significantly contributes to job creation and employment; it also contributes to
158
innovations and poverty alleviation. The study revealed that that most SMEs face
difficulties in accessing finance from financial institutions due reasons not limited to
high interest rates, and collaterals requirements, others include risks associated to SMEs.
Recommendations were based on the objectives of the study that affected the financial
performance of SMEs in Kenya.
Debt finance is the way firms finance business by combining short term debt and long
term debt. Managers must take responsibility for the management and decisions on
optimal capital structure for without which firms may be affected by high values of debt
which may lead to decrease in stock price. Firms must consider using optimal capital
structure in order to maximize profit. An appropriate mix of capital structure is essential.
The management should make prudent financial decisions in order to maintain
profitable, as a high level of debt, profits tend to decline. debt finance decision is vital
for any business firm. On the basis of funding short term debt has a significant positive
relationship with profitability, which suggests that short term debt tend to be less
expensive and therefore increase levels of profitability.
Cost of credit is an impediment in terms of high interest rates and other transactions
costs. Financial institutions should relax and reduce interest rates to enable SMEs
borrow funds required at affordable rates for their growth and investment. Financial
institutions should simplify and relax their lending requirements by providing tailored
packages that fit SMEs requirements. Credit to SMEs is still bottom low and therefore
needs both government and banks to review their policies to become friendly to SMEs in
159
financing this sector. Financial institutions must relax borrowing conditions to do
business with SMEs. Financially constrained SMEs are likely to face high costs of debt,
which may prevent them from expanding their business.
Investment decision is a required managerial tool through which investment decisions
are based. The importance of investment decision to financial performance is vital to
firms including SMEs in assessing their effectiveness in investment decision they make,
which is also critical to future success and survival. The results indicated that although
SMEs managers are conversant with the existent of investment techniques, they do not
make use of these investment appraisal techniques. It is therefore recommended that
financial manager and others who have interest in the management of the business be
well versed and acquire investment decisions knowledge in investment decision
techniques to help them make good decisions for their organizations. The SME
managers should be trained on financial investment decisions techniques in order to
acquire adequate knowledge of basic investment concepts required to make prudent
investment decisions. Also knowledge and awareness be created through training
programs on investment decision issues for SMEs involving the stakeholders including
the government to foster the performance of SMEs, which is important for the economy
of the country.
The government has to play a big role in enabling SMEs obtains cheap finance from
financial institutions and putting policies in place in enhancing credit guaranties to
SMEs who find it costly for their business. Also the government should recognize SMEs

160
potential and support those financial channels that support financing of SMEs either
directly or indirectly by formulating policies and framework of financing. Finance
accessibility should be flexible in terms of collaterals asked by financial institutions
since most SMEs are still small and unable to satisfy financial institutions credit granting
requirements. The researcher recommends that government agencies to collaborate with
financial institutions to establish several points and avenues to easy difficulties in
accessing finance in terms of high interest rate from MFLs to spur their financial
performance. Hotel industry should improve their internal financing to keep a breast
with the current world of competition. Therefore access to finance is essential to the
survival and performance of SMEs. The results indicated collateral requirement is a
significant constraint to the financial performance of many SMEs who want to access
credit from banks. The study therefore recommends that the government and financial
institutions should come up with policies to make it easy for SMEs to access funds.
From the findings of this study it was established that determinants of financial
performance positively affect financial performance of SMEs in Kenya. The SMEs
especially for this study in the hotel industry is one of most important sector in Kenya,
because it significantly contributes to job creation and economic growth. This study
revealed that most SMEs owners, managers and accountants face difficulties of
accessing finance. This is seen from reluctance of financial institutions in providing
funds for SMEs growth and investment, due to reasons of and not limited to insufficient
161
collaterals and poor financial performance. Therefore this study made the following
recommendations in order to help develop SMEs in hotel industry in Kenya.
5.5. Policy Recommendation
The study would be of great importance in assisting managers in the determinants of
financial performance of their SMEs firms. The government to attach great importance
in SMEs development to foster entrepreneurship and innovations. The government of
Kenya has great responsibility of ensuring that financial institutions facilitate SMEs to
achieve their potential and financial performance, hence create more jobs and
employment. The government should establish better financial environment for SMEs
financing by guarantying credit needs of SMEs. The policy implication of the findings
is substantial for the government of Kenya’s policy makers based on financial
institutions to support SMEs. The government to come up with relevant policies which
will ensure SMEs survival and continual to survive, in order to create jobs and enhance
small scale industries and innovations. Banking reforms have to be established through
the government of Kenya initiative in enhancing credit accessibility to SMEs financial
performance. The reforms should ensure financial stability to effect financial
performance of SMEs by encouraging banks to play a critical role on financing SMEs.
5.6 The theoretical consideration and contribution for the study
The study was guided by four variables including debt finance, cost of debt, investment
decision and access to finance. The study findings have contributed to stock of other
162
existing studies on determinants of financial performance of SMEs in Kenya. The study
also found that the theories for the study are relevant to the study and that the study
provided empirical contribution to the determinants of financial performance on SMEs
in tourism sector in Mombasa and environs, Kenya
5.7 Areas of further research
This study only concentrated on the SMEs in hotel industry (Hotels, Restaurant and
Tour safaris) in Mombasa county and environs, which may not be representative to all
the SMEs in other sectors and industries. Only four independent variables including debt
finance, cost of debt, investment decisions and access to finance were used and one
dependent sub variable of profitability(return on asset) on financial performance. This
indicates other many factors affecting SMEs financial performance have not been
considered, and therefore further research in this area is important. Further studies can
be conducted in other sectors of SMEs including that of multiple industries to enhance
validity and generalization of the research findings. Similar studies research can also be
conducted in other Counties not covered in this study. It is also important to undertake
similar studies on large scope in other sectors of the SMEs on the effect of financial
determinants on financial performance of SMEs.
There are other financial factors or variables not covered in this study to be researched.
It is important to monitor a wide range of financial performance indicators in the SMEs
sector, including enhancing internal financial base, long term financing of equity, bank
interest rates, financial intermediation, and bank credit and bank lending rates. Similarly
163
study to be done to monitor a wide range of financial performance indicators in the
SMEs sector.
There is also need for further research to be undertaken on the other financial factors
affecting performance of SMEs in Kenya. It also suggested that research be conducted
on the effectiveness of financial institutions financing of SMEs in Kenya. Further
research could also be done using other financing determinants on financial performance
of SMEs. The study should be conducted in other cities and rural areas where there is
need of financing to understand the challenges facing SMEs.
It is important to carry out similar study among large enterprises in order to find the
effect of financial determinants on financial performance.
REFERENCES
Abdel- Kader M & Luther R (2006), management Accountant practice in British food
and drinks industry, British food journal, 1008(5), 336-357
Abdul G, K (2012). The relationship of capital structure decisions with firms
performance. A study of the Engineering sector of Pakistan. International
journal accounting &financial Reporting 2(1), 2162-3082
164
Abesamed, H.K. & Wahab , A.K., (2014) Financing of small and medium enterprises
(SMEs); Determinants of bank loan application African journal of business
management 8(17) , 717-727
Abdulsaleh, A.M &Worthington, C.A (2013), Small and medium enterprises Financing;
A review of literature. International journal of business management 8(14) 1833-
3850
Abor,J.&Bieke N (2007). Debt policy and performance of SMEs. The journal of risk
finance, Emerald group publishing Ltd, 6(5), 438-445
Abor , J (2005) The effect of capital structure on profitability an empirical analysis of
listed firms in Ghana, Journal of Risk finance ,Emerald group publishing Ltd,
vol. 6(5), 438-445
Abouzeedah, A (2003). Financing Swedish small and medium size enterprises .Methods
problems and impact. Paper presented at the 43 European Congress of Regional
science Association Jyvaskyla Finland
Adesina,J.B, Nwidobie B.M. & Adesina O.O.(2015).Capital structure and financial
performance in Nigeria. International journal of business and social research
5(2), 21-31
Aduda J & Kalunda, E (2012). Financial inclusion and financial sector stability with
reference to Kenya. A review of literature, Journal of applied finance and baking
2 (6), 95-120
Afande F.(2015) . Factors influencing growth of small and micro enterprises in Nairobi
central district. Journal of poverty investment and development 9, 104-137
165
Aghion P, Fally,T & Scapetter, S. (2007). Credit constraints as a barrier to the entry and
post entry growth of firms. Economics policy 22,731-729 htt;/dx doi.
Org/10.1111/j 1464 -0327.2007.00190x
Agnew,p (2003). Financing bright ideas; Primer on venture capital in Maine Augusta
Akinruwa, T. E, Awolusi, O.D & Ibojo B.O.(2013) Determinants of small &medium
enterprises (SMEs) performance in ekiti state Nigeria. A business survey
approach. European journal of humanities and social sciences 27(1),
Akinyi, R (2001). Formal and informal institutions. Lending policies and Access to
credit by small scale enterprise in Kenya. An empirical assessment AERC.
Research paper 111 Nairobi November 2011
Akinyi, R. (2009). Formal and informal institutional lending policies and access to credit
by small scale enterprises in Kenya: An empirical assessment Nairobi Kenya.
African Economic Research consortium Philippines.
Akintoye, I, R.(2008). Effect of capital structure on firms performance the Nigerian
experience. European journal of economics. Finance and administration science
Alexandra,T.ZeljkosS.&Dimilrios,M (2010) Decisions making process under risk and
uncertainty the role of managerial optimism. A theoretical approach Journal of
finance 514-524
Amyx, C (2005), Small business challenges .The perception problem size doesn’t
matter. Business journal Washington
Asim, S. (2008). Evaluating the impact of microcredit on SMEs. Empowerment in
Parkistan JEL classifications, C52 D19, G21,R22
166
Althouse L, A, Ware W,B and Ferron J,M (1998) . Detecting departure from normality.
A Monte Carlo simulation of anew omnibus test based on moments. Paper
presented at annual meeting of American educational research association San
Diego CA
Atieno, R.(2009) Linkages, access to finance and the performance of small scale
enterprises in Kenya. Journal of Accounting and Business research 3(1),33-48
Atieno, R. (2001). Formal and informal institutions lending policies and access to credit
by small scale enterprises in Kenya. An empirical Assessment AERC Research
paper II.
Arnold, S. & Johnson, S. (2012). Inclusive Financial markets. Is transformation under
way in Kenya? Development policy Review, 30(6), 719-745
Arnold, G. (2008). Corporate finance management 4th ed Harlow prentice Hall
Armstrong A. (2013). Evaluating changes in Bank lending to Uk SMEs over 2001-2012-
ongoing right credit National institute of Economics and social Research:
London
Artiola C&Genre V(2011) Euro areas SMEs under financial constraints belief or
reality?. European central Bank, Kalserstrasse 29, D-60311 Frankfurt, German.
Retrieved from www. Ecb,int/pub/pdffother/ financialst ability review 2011 oben
odf
Atieno, R.(2009). Linkage access to finance and the performance of small scale
enterprise in Kenya ,a rsearch paper No 2009/06 UNU. World institute for
Development Economics Research (UNU-Wider)
167
Auma,L. A & Muturi ,W(2017) .On factors affecting the effectiveness of bank credit
inenhancing the performance of small & medium enterprises in Kenya. A case
study of Kisumu city. International journal of economics, commerce and
management 5 may 2017 ISSSN 2348- 0386
Ayyagari M .Beck T. & Demirguc KuntA (2012) Small and medium enterprise across
the globe Small business economics
Ayyagari,M, Demirguc-Kunt A, & Maksimovic V(2008) How important are financing
constraints ?The role of finance in the business environment. World Bank
economic review 22 pp 483-516
Aziz,A.T & Berg ,G (2012) Financing small and medium sized enterprise in Rwanda.
World Bank Washington Dc
Bakans, S. (2011) Measurement of financial performance. Islamabad Pakistan institute
and development Economics
Balanda, K.P & Macgillirray ,H.L(1988) Kurtosis: Acritical review. The American
statistian,42, 111-119
Baltaci,N & Ayaydin, H.(2014) Firm, country & macro-economic development of
capital structure. Evidence from Turkish banking sector, EMAJ. Emerging
market journal 3(3), 47-58
Balling, M. Barnet, B & Gnan,(2009). Financing SMEs in Europe. Four papers by Rym
Ayadi , Beat Bernet and Simon Westerfild,Tom Frank and Nancy Huyghesact
Vitor Gaspar simona Borha-Padilla & Reinhidde Veugeter. SUERF. The
168
European money and finance forum Viena. Retrieved from http:// www suert.org
/down load studies /study 20093.pdf
Barter,N. (1967) Leverage ,risk of ruin and the cost of capital ,The journal of
finance,22,395-403
Banejee, A. V, Duffo, E ,Glennersfer, R & Kinnan,C (2009). Multivariate Analyses
method; Eine anwendungs orient .Cambridge.MA. .
Base Committee on banking supervision, (2008). Base III. International framework for
liquidity risk measurement, standard and monitory, Bank for International
settlement, December, 2010
Beaglehole, R,Bonita, R & Kjellstrom, R. ( 2006). Basic epidemiology (2nd ed). Geneva,
WHO publications
Bebczuk, R. N. (2004). What determines the access to credit by SMEs in
Argentina?. Documentos de Trabajo.
Beck,T & Dimiguc-Kunt, A. (2006) small and medium size enterprises, Access to
finance as a growth constraint, Journal of Banking and finance, 30 (11), 2931-
Beck T, Demirguc-Kunt A, Laeven & Maksimovic V(2006).Financial and legal
constraints to growth ,does firm size matter ?. Journal of finance, 60(1), 137-177
http;//dxdoi.org/10.1111 1540-6261.2005.00727x
Beck T. & Fuchs, M. (2004), structural issues in Kenya, Financial system world Bank
policy Research working paper 3363 July
Beck,T.K. & Demurguc,A. & Honohan, P. (2009) Access to financial services,
measurement impact & policies. World Bank Research observer, 24 (1), 119-14
169
Beck,T & Honohan P,(2007).Making Finance work for Africa. Washington DC,World
Bank
Beck,T.K. Demurguc A. & Honohan.P,(2009). Access to finance services:
Measurement impact and policies. World Bank research observer, 24(1), 119-
145.
Berk, J & DeMazo, P. (2010) Corporate Finance (2nd Ed.). London: Prentice Hall
Bhunia, A. (2002) A trend analysis of liquidity management efficiency in selection
private sector Indian steel industry. International journal of reserve in commerce
and management, 1(5), 9-20
Bellone F. Musso P. Nesta L & Schlaro S.(2010) Financial constraint and firm export
behavior. The world economy 33(3), 347-377
Bilitci, U.S, Nudurupati, S.S,Turner, T.Y & Creightons (2002), Web enabled
performance systems; Management International, Journal of operations and
production management 22 (11), 1273-87
Bis (2012) SMEs access to external finance. Economic paper no 16[ sqw consulting
http;/www bisgov.uk files 53949.doc
Boodhoo, R. (2009) Capital structure and ownership, a review of literature, the journal
of on line education January edition
Bougheas. S,P. Mizen & Yalcin. C,2005. Access to external finance. Theory and
evidence on the impact of monetary policy and firm-specific characteristic.
Journal of Banking and Finance, 30 (1), 199-227.
170
Bourne,M. Mills.J. Wicon, M, Neely,A & Platts,K,(2002). Designing implementing
andupdating performance measurement system. International, journal of
operations and production management, 20 (7), 754-71
Brealey R, A Myers S,C, & Allen, F. (2009) Principles of corporate finance Boston:
MC Graw, Hill
Brealey, R, A & Myers’s (2010). Principles of corporate finance, Irwin MC Grew, Hill
Bryman, B, & Bell E. (2007). Business Research methods (2nd Ed), Oxford: Oxford
University press
Bryman, B, & Bell E. (2011). Business Research methods, (3rd Ed). Oxford: Oxford
University press
Chinaemerem, O.C. & Anthon O. (2012). Impact of capital structure on the financial
performance of Nigerian firms. Arabian journal of business and management
review 12, .139- 195
Cassa.G. (2004). The financing of Business startups. Journal of business venturing, 19
(2), 261-283
Chisti K, A Ali K & Sangmi M I.D (2013) Impact of capital structure on profitability of
listed company (Evidance from India. The USV Annals of economics public
Administration 13(17), 183-191
Copestake, J. (2002) Inequality and the polarizing impact of microcredit; Evidence from
Zambia copper belt .Journal of International Development 14,743-755
Chirwa, S.& Bhupersh K.S. (2002) Impact of working capital management policies on
corporate performance, An empirical study ,Global Business Review 8, 267
171
Cracknell, D. (2012). Policy innovations to improve access to financial services in
developing countries: Learning from case studies in Kenya. Centre for global
development.
Chadha S & Sharma A.(2015) Determinants of capital structure .An empirical evaluation
from India, journal of advance in management research 12(1), 3-14
Chandler, J.G. (2009). Marketing tactics of selected small firms in the east London. cdb
area, South African. University of South Africa.
Chelagat, L. J., & Ruto, M. J. (2014). Determinants of performance of small firms
within four peri-urban centres of Eldoret Town. European Journal of Business
and Management, 6, 148-158.
Chijoriga, M. M. (2000). The performance and sustainability of micro finance institution
in Tanzania. Unpublished manuscript..
China (2017. National business of statistics of china
Cracknell, D. (2012). Policy innovations to improve access to financial services in
developing countries: Learning from case studies in Kenya. Centre for global
development.
Cohen, M. (2002). Making microfinance more client‐led. Journal of International
Development, 14(3), 335-350.
Cohen, J. (1988). Statistics power analysis for the behavioral sciences (2nd ed) Hills
dale,NJ : Lawrence Earlbaum Associates
Cole,R,..& Sokolyk, T,. (2016). who needs credit and who gets credit. Evidence from
the survey of small business finance, Journal of finance stability 24, 40-60
172
Comerg, I.B, Delbrio, E & Fenandez, O Blanco, M (20140 Financing successful small
business projects. Management decision 52(2), 365-377
Cooper, C. & Schindler, P. (2008). Business Research Methods (10th ed).Boston Mc
Graw -Hall
Cook,P.& Nixson,(2005). Finance and small and medium sized enterprise Development,
Finance and development .Working paper series p.4 University of Manchester
Cooper, D.R.& Scheduler, P.S. (2003). Business Research Methods. (8 ed) New York:
Tata Mc Graw-Hill Inlc,
Cooper,D.R.&schindler,P.S. (2006). Business Research Methods. (9th Ed). NewDelhi –
India : MC Graw –Hill publishing co.Ltd
Cressy, R.& Nixson, C .(1997) European SMEs Financing. An overview of small
business economics.
Cron, W, L Bruton, G, D &Slocum L,W(2006).Professional serving venture
performance and gender effect. Journal of leadership & Organizational studies
12, 53-67
Crowley, S. (2007) Interest rate spread. Cambridge mass, National Bureau of economic
research
Davis, G. F., & Adam Cobb, J. (2010). Chapter 2 Resource dependence theory: Past and
future. In Stanford's organization theory renaissance, 1970–2000 (pp. 21-42).
Emerald Group Publishing Limited.
De Aghion. B.A. & Morduch. J. (2010). Finance against poverty. Massachusetts: The
MIT Press
173
Dehejia, R., Montgomery, H., & Morduch, J. (2012). Do interest rates matter? Credit demand in
the Dhaka slums. Journal of Development Economics, 97(2), 437-449.
Degryse, D.de Gveji P, & Kappert (2012). The impact of firm and industry
characteristics on small firms capital structure, Small business economics 38,
431-447
Deloof, M. (2003). Does working capital management affect profitability of Belgian
firms? Journal of Business finance and Accounting 30(3), 573-587
Demurguc,A.(2006). Small and medium sized enterprises. Access to finance as a
growth constraint, Journal of Banking and Finance, 30 (11), 2931-2943’
Demirguc-Kunt, Beck, T. & Phnohan, (2008). Finance for a 117 policies and pct. falls in
expanding Access .World bank policy Research Report Washington World bank
(http://go.worldbank; org/HNKL9Zh050
Demirgüç-Kunt, A., Klapper, L., & van Oudheusden, P. (2015). Financial Inclusion in
Africa. The Oxford Handbook of Africa and Economics: Volume 2: Policies and
Practices, 388.
Ding, C., & Li, T. (2007, June). Adaptive dimension reduction using discriminant
analysis and k-means clustering. In Proceedings of the 24th international
conference on Machine learning (pp. 521-528). ACM.
Dormann, C. F., Elith, J., Bacher, S., Buchmann, C., Carl, G., Carré, G. ... &
Münkemüller, T. (2013). Collinearity: a review of methods to deal with it and a
simulation study evaluating their performance. Ecography, 36(1), 27-46.
174
Donovan, K. (2012). Mobile money for financial inclusion. Information and
Communications for development, 61(1), 61-73.
Dube, H. (2013). The impact of debt financing on productivity of small and medium
scale enterprises (SMEs): A case study of SMEs in Masvingo
urban. International Journal of Economics, Business and Finance, 1(10), 371-
381.
Dziuban, C. D., & Shirkey, E. C. (1974). When is a correlation matrix appropriate for
factor analysis? Some decision rules. Psychological bulletin, 81(6), 358..
Edelene, R.M. & Kadlec , G.B.(2013) Investor base. Cost of capital and financial
performance. The case post issuance anomalies seminar presented to Hong.
Kong University of science and technology
Elliot A,C. & Woodward W,A (2007). Statistical analysis quick reference guided with
SPSS examples. London: Sage publications
Everitt, B. S., & Dunn, G. (2001). Applied multivariate data analysis (Vol. 2). London:
Arnold.
He, W., & Baker, H. K. (2007). Small business financing: survey evidence in West
Texas. The Journal of Entrepreneurial Finance, 12(1), 27-54.
Cerny, B. A., & Kaiser, H. F. (1977). A study of a measure of sampling adequacy for
factor-analytic correlation matrices. Multivariate behavioral research, 12(1), 43-
47.
Evans, J. D. (1996). Straightforward statistics for the behavioral sciences, ISBN-13:
978-0534231002, ISBN-10: 0534231004, Pacific Grove, CA: Brooks.
175
Ezeoha, A., & Botha, F. (2012). Firm age, collateral value, and access to debt financing
in an emerging economy: evidence from South Africa. South African Journal of
Economic and Management Sciences, 15(1), 55-71.
Eriotis, N., Vasiliou, D., & Ventoura-Neokosmidi, Z. (2007). How firm characteristics
affect capital structure: an empirical study. Managerial Finance, 33(5), 321-331.
Fanta, A. B. (2015). Exploring the economic significance of small and medium
enterprises. Dear readers!, 4(1), 27.
Fatoki, O. O., & Asah, F. (2011). The impact of firm and entrepreneurial characteristics
on access to debt finance by SMEs in King Williams’ Town, South
Africa. International Journal of Business and Management, 6(8), 170.
Field, A. (2000). Discovering statistics using SPSS for Windows, London: Sage
publications.
Financial Department and Efficiency in Kenya (2005), world bank Development
indicators. Geneva: WHO
Fitzgerald, S. M., Rumrill Jr, P. D., & Schenker, J. D. (2004). Correlational designs in
rehabilitation research. Journal of Vocational Rehabilitation, 20(2), 143-150.
Fodor, I. K. (2002). A survey of dimension reduction techniques. Center for Applied
Scientific Computing, Lawrence Livermore National Laboratory, 9, 1-18.
Fosberg, R. H. (2013). Short-term debt financing during the financial
crisis. International Journal of Business and Social Science, 4(8), 1-5
Frank J, & Drake,p, (2007). Capital markets financial management & investment
management. New York: John Wiley & Sons
176
Frasch, R.(2013) Debt financing for your start-up . USA: forbes
Harris, P. R., & Harris, K. G. (1996). Managing effectively through teams. Team
Performance Management: An International Journal, 2(3), 23-36.
Miller, C. A., & Frisch, M. B. (2009). Creating your best life: The ultimate life list
guide. Sterling Publishing Company, Inc..
Frenkel, J. A., & Razin, A. (1984). Budget Deficits and Rates of Interest in the World
Economy (No. 1354). National Bureau of Economic Research, Inc.
Gall, M. D., Borg, W. R., & Gall, J. P. (1996). Educational research: An introduction.
Longman Publishing.
Gangata, K., & Matavire, E. H. M. (2013). Challenges facing SMEs in accessing finance
from financial institutions: The case of Bulawayo, Zimbabwe. International
Journal of Applied Research and Studies, 2(7), 1-10.
García-Teruel, P. J., & Martínez-Solano, P. (2007). Short-term debt in Spanish
SMEs. International Small Business Journal, 25(6), 579-602.
Gill, A., Biger, N., M &, H. S., & Shah, C. (2012). Corporate governance and capital
structure of small business service firms in India. International Journal of
Economics and Finance, 4(8), 83.
Githaigo, P. N., & Kabiru, C. G. (2015). Debt Financing and Financial Performance of
Small and Medium Size Enterprises: Evidence from Kenya. Journal of
Economics Finance and Accounting, 2(3), 473-481
177
Gleason, K. C., Mathur, L. K., & Mathur, I. (2000). The interrelationship between
culture, capital structure, and performance: evidence from European
retailers. Journal of business research, 50(2), 185-191.
Goldsmith, R. W. (1969). Financial structure and development(No. HG174 G57).
Government of Keya (2007) vision 2030 economic report, Nairobi: Government of
Kenya printers
Government of Kenya (2006). Microfinance Act of 2006 Nairobi: Government of Kenya
printers
Government of Kenya, (2012) Economic survey. Nairobi: Government of Kenya
printers
Goverment of Kenya (2008). Economic Servy. Nairobi Central Bureau of Statistics
Ministry of Planning and National Development. Nairobi: Government of Kenya
printers
Goverment of Kenya, (2005). Development of micro and small enterprise creation of
poverty, Reduction and wealth creation. Nairobi Government printers.
Grimes P, Rogers, K & Smith R.( 2010) High school economic Education and access to
financial services. The journal of consumer Affairs 44(2), 317-335
Gujarati, S. (2003). Basic Econometrics (4th ed). New York M C Graw Hill
Gul,S. Khan, M, B. Rehman S,U. Khan M,,T. & Khan,W. (2013). Working capital
management and performance of SMEs sector European journal of business
and management, 5(1), 60- 68
178
Gunawan,G, Chadwick, K. .M. (2008). “An empirical study of the uptake ofperformance
measurement by internet retailer. Journal of internet Research, 18(4), 361-381.
Gupta, S. (2008). Microfinance in Africa: Harnessing the potential of a
continent. Microfinance Insight, 1-3.
Griffith-Jones, S., & Karwowski, E. (2013). Finance and Growth in Sub-Saharan Africa:
Policy and Research Challenges. In Working Papers. Africa Task Force Meeting.
Yokohama and New York: JICA and Initiative for Policy Dialogue (pp. 139-132).
Gorton, G., & Rosen, R. (1995). Corporate control, portfolio choice, and the decline of
banking. The Journal of Finance, 50(5), 1377-1420.
Gunasekaran, A., Love, P. E., Rahimi, F., & Miele, R. (2001). A model for investment
justification in information technology projects. International Journal of
Information Management, 21(5), 349-364.
Haber, S., & Reichel, A. (2005). Identifying performance measures of small ventures—
the case of the tourism industry. Journal of Small Business Management, 43(3),
257-286.
Hallberg, K. (2000). A market-oriented strategy for small and medium scale enterprises.
The World Bank.
Bahar, H., & Bank, B. (2001, November). Financing for micro-enterprises, small,
medium-sized and cottage industries: Bangladesh perspective. In ESCAP-ADB
Joint Workshop on Mobilizing Domestic Finance for Development:
Reassessment of Bank Finance and DebtMarkets in Asia and the Pacific held in
Bangkok (pp. 22-23).
179
Bahar, H., & Bank, B. (2001, November). Financing for micro-enterprises, small,
medium-sized and cottage industries: Bangladesh perspective. In ESCAP-ADB
Joint Workshop on Mobilizing Domestic Finance for Development:
Reassessment of Bank Finance and DebtMarkets in Asia and the Pacific held in
Bangkok (pp. 22-23).
Harash, E., Al-Tamimi, K., & Al-Timimi, S. (2014). The relationship between
government policy and financial performance: A study on the SMEs in
Iraq. China-USA Business Review, 13(4).
Harash E, A-Timini K & Alsaadi J (2014). Effect of financing on performance of small
&medium enterprises (SMEs) International journal of management (IIJM)2(10)
1-9
Harash, E. (2015). The Role of Environmental Uncertainty in the Link between
Accounting Information System and Performance Small and Medium Enterprises
in Iraq. Global Journal of Management and Business Research. Retrieved from
https://journalofbusiness.org/index.php/GJMBR/article/view/1718/1620
Haron, H., Said, S. B., Jayaraman, K., & Ismail, I. (2013). Factors influencing small
medium enterprises (SMES) in obtaining loan. International Journal of Business
and Social Science, 4(15), 112-162
Herelimana, J. B. (2017). Effect of debt financing on business performance : a
comparative study between I&M Bank and Bank of Kigali, Rwanda. Global
journal of management &business research, 17(2), 37-45
Holelling, H.C (1933). Analysis of complex of statistical variables into principal
component; Journal of educational psychology 24. 417
180
Hospes, O., Musinga, M., & Ong'ayo, M. (2002). An Evaluation of Micro-Finance
Programmes in Kenya as Supported through the Dutch Co-Financing
Programme. Steering Committee for the Evaluation of the Netherlands' Co-
financing Programme.
Huang, G. (2006). The determinants of capital structure: Evidence from China. China
economic review, 17(1), 14-36.
Huygherbaet, N & Van de Gucht L.M (2007). The determinants of financial structure,
New insight from Business startups European Financial management 13 (20),
1001-133
Ikapel, O.F & Kajirwa I.(2017)Analysis of long term debt and financial performance of
state owned sugar firms in Kenya. International journal of commerce and
management research 3(2)108-111
IIo, J.Chiolce, N. (2015). Commercial bank credit availability to small and medium scale
enterprises (SMEs) in Nigeria 3rd international conference on business law and
corporate social responsibility (ICBLCSR15) May 5-6n2015v Bali
Indonesia: ICBLC
Irwing, D & Scott, J.M (2010), Barriers faced by SMEs in raising bank finance.
International journal of entrepreneurial behavior & research 16(3), 245-259
Jackson J (2010). Promoting efficiency investment with risk management decision tools,
Energy policy 38, 3865-3873
James, M. M. (2014) Factors influencing financial performance of saving credit
corporative societies UNO repository, Kenya
181
Jay, X, (2010). Competent manager, Hand book of management, London: Evans
publishing company
Khaled, A.M.A & Samar, F.O (2013). Impact of cost of cost of capital, financial
leverage and the growth rate of dividend on return on investment. An empirical
study of Amman stock Exchange. International journal of academic research in
economic &management science 2(4), 59-69
Kaisers H,F (1960). The application of electronic computer factor analysis; Education
and psychological measurement 20, 141-151doi 10.117/0013 644 600 200016
Kaiser, H. F. (1970). A second generation little jiffy. Psychometrica, 35, 401-415
Kamunge, M.S Njeru, A & Tirimba, O.I. (2014) Factors affecting the performance of
small µ enterprises in Limuru town market of Kiambu County,
International journal of scientific &research publication 4(12), 2250-3153
Kamunge, M.S,Njeru, A. &Tirimba, O.I(2014), Factors affecting the performance of
small &micr enterprises in Limuru town market of kiambu County,
International journal of scientific&research publicatiom 4(12), 2250-3153
Karadeniz,e,Kandirs S, Iskenderoderoglu, O & Onal, Y (2011) Firms size and Capital
structure Decisions Evidence from Turkish lodging Companies international
journal of Economies and Finance issues I,1-11
Kaplan, R.S. & Norton,D. P.(1996). The Balanced score card-Measures that drive
performance, Harvard Business Review.
Karadag, H. (2015) Finncial management challenge in small and medium sized
enterprises, a strategic management approach .Emerging markets journal 5(1),
115-119
182
Karlan, D & Zinman. (2010). expanding credit Access; using Randomised supply
decisions to estimate the impacts .Review of Financial studies, 23(1) 433-464.
Kayanula, D & Quarley P(2000),. The policy environment for promoting small and
medium sized enterprises in Ghana and Malawi /DPM, University of
Manchester, UK
Kebewar, S.A (2012). The effect of debt on corporate finance services sector, MPRA
paper 43304 University library of Munich
Kenya national of bureau of statistics (KNBS) (2010), Statistical abstracts 2010.Nairobi
government printers
Keskin,, S, (2006). Comparison of several univariate normality tests regarding type 1
error rate and power of the test in simulation based small samples. Journal of
Applied science research 2 (5), 296- 300
Kimuya P, K & Omiti J (2000) Institutional impediments to access to credit by micro
and small scale enterprises in Kenya. Macmillan publishers, Nairobi Kenya
Kimuyu & Omit. (2000). institutional impediment to access to credit by micro and small
enterprises in Kenya. Institute of Policy analysis and research. Decision paper
series
Kinyanjui, M, N,(2006) Overcome barriers to enterprise growth. The experience of
SMEs in Rural Central Kenya
Kinyua, A.N. (2014).Factors affecting the performance of small and medium enterprises
in the Jua kali sector in Nakuru Town in Kenya
183
KIPPRA, (2012) Kenya economic report 2012; Imperative for reducing the cost of ling
in Kenya
Kira A,R & He, Z (2013) The impact of firm characteristic in access of finance by small
and medium sized enterprises in Tanzania. International journal of
BusinessManagement 7(24), 108-119 htt;/dx doi.org/10555/ijbm.v7n 24p 108
Kothari, C.R,(2009) Research methodology .Methods &Techniques 2nd edition, ed. New
Age International
Kothari, C (2012) Research methodology methods &Techniques, New Delhi
International publishers
Kothari, C. (2004). Research methodology methods and Techniques ( 2nd ed,) New
Delhi; New Age International
Korir, J. & Imbaya,B (2013) Measuring performance of minor event management
ventures in Kenya. Developing country studies,3(3), 86-93
Kwaning,C.O , Nyantakyia, K & Kyereh, B(2015). The challenges behind SMEs in
GhanaianFinancial market. International journal of small business &
Entrepreneurship Research 3 (2), (6-30)
Kothari,C.R. (2004). Research methodology, Methods and techniques, New Delhi Wiley
Eastern.
Mbogo, M. K., & Muturi, W. (2014). The Effect of MFI Credit on Revenue of SMEs, a
survey of Small Medium Entreprises in Nakuru Town. International Journal of
Science and Research (IJSR), 3(6), 112-119
184
Lambe, I. (2014) corporate capital structure and firms, market value in Nigeria
.Research journal of finance &accounting 5, 12-16
Liagat,I, Saddique, S. Bbagh, T, Khan, M.M Naseem, M. & Khan, M.A, (2017). Capital
structure as a driving force of financial performance, a case of energy and fuel
sector of Pakistan. International journal of accounting &financial reporting 7(1),
86-101
Liaquat , L. Sadd, Q. Bagh T Khan, M.A & Nasser,M.(2017) Capital structure as a
driving force of financial performance , case of energy anf fuel sector of
Pakistan, International journal of accounting and financial reporting 7(1), 86-
101
Likert, R. (1971). Analyzing social data, Boston Houghton Mifflin Co
Likert, R. (1932) Technique for measurement of attitude .Archives of psychology, 140,
1-150
Leedy, P. D., & Ormrod, J. E. (2005). Practical research. Pearson Custom.
Loredana , P, (2011) Approaches for evaluating &financing investment projects. Lev ET
Scientia economic series LESIJ NR XVIII, Vol 2/2011
Longenecker, J.G,Pelly, C,W.Moore, J.W. & Palich L.E. (2006). Small Business
Management.An entrepreneurial emphasis. London.Thomson south
western.Macan Bhard, C. (2010) The Modigliani-Miller proportion after fifty
years and its entrepreneurial finance strategic change 19-28
Mc clanahan T. Mwanguni, S. & Muthiga N.A (2005). Management of Kenya coast
ocean coast manage 48.901-931
185
Machenene,R.G Machaj,G.L & Donge, L (2014) Social- cultural determinants &
enterprise Financial sources among the Chagga and Sukuma small and medium
enterprises in Tanzania. International Review of Research in emerging markets
and the Global. Economy (IRREM) 1(J), 265-283.
Maina L, & Kondongo, O (2013) Capital structure & financial performance in Kenya.
Evidence from firm listed at the Nairobi security exchange. Paper presented at
Jomo Kenyatta University conference, Kenya
Malende, M. (2014). Determinants of commercial banks’ lending. Evidence from
Ethiopian commercial banks. European journal of business &management 6(20),
109-117
Mashenene R,G, &Rmanyika,J (2014) Business constraints and potential Growth of
small and medium enterprises in Tanzania. A review. European journal of
business and management 6 (32), 72-79
Mateev,N & Anastasov,Y, (2010). Determinants of small and medium sized fast
growing enterprises, in Central and Eastern Europe. A panel Data Financial
theory and practice 34 (3),269-295
Malhotra, M.Y, Chan,A Criscuolo,Q,Hamel,F. I & Sarchanko,Y, (2007). Expanding
Access finance: Good practice and policies for micro, small and medium
enterprises
Makasure ,O. Granfield,J & Henson, S. The financial performance of non-farm micro
enterprise in Ghana. World Development,36 (12) 2733-2762
Luo R .(2014). Sparse principal component analysis in Hilbert space in Scandinavian
journal of statistics doi 10.1111/sjos, 12106
186
Maizura, H., Masilamani, R., & Aris, T. (2009). Reliability (internal consistency) of the
job content questionnaire on job stress among office workers of a multinational
company in Kuala Lumpur. Asia Pacific Journal of Public Health, 21(2), 216-
222.
Masinde, J. (2013). Table banking helps women fight poverty. Daily Nation.
Massa, I. (2013). DFLs support to financial inclusion in Africa. Triki, T& Faye, I (Eds
Financial inclusion in Arica (P. 116-129) Tunis AFDB.
Matias, F., & Serrasqueiro, Z. (2017). Are there reliable determinant factors of capital
structure decisions? Empirical study of SMEs in different regions of
Portugal. Research in International Business and Finance, 40, 19-33.
Mazur, K. (2007). The determinants of capital structure choice: evidence from Polish
companies. International Advances in Economic Research, 13(4), 495-514.
Mazzarol, T. (2014). Research review: A review of the latest research in the field of
small business and entrepreneurship: Financial management in SMEs. Small
Enterprise Research, 21(1), 2-13.
Mehran, H. (1995). Executive compensation structure, ownership, and firm
performance. Journal of financial economics, 38(2), 163-184.
Mendes, M, & Pala A,(2003).Type 1 error rate and power of three normally tests.
Pakistan journal of information and Technology 2(2), 135-139
Memba, S.F,Gakure.R.W. & Karanja, K. (2012). Venture capital (VC) its impact on
growth of small and medium enterprise in Kenya. International journal of
Business and social science, 7, 35-40.
187
Mendes M,& Pala A,(2003). Type I rate and power of thee normality test; Pakistan
journal of information and technology 2(2), 135-39
Mensah, S. (2004, March). A review of SME financing schemes in Ghana. In UNIDO
regional workshop of financing small and medium scale enterprises, Accra,
Ghana (Vol. 3, No. 2, pp. 369-281).
Mewse D, (2011), Keeping an eye on the health of your business. South African
pharmaceutical journal 18(10), 13-15
Mohamed, M. O. S., Neukermans, G., Kairo, J. G., Dahdouh-Guebas, F., & Koedam, N.
(2009). Mangrove forests in a peri-urban setting: the case of Mombasa
(Kenya). Wetlands Ecology and Management, 17(3), 243-255.
Modigliani, F., & Miller, M. H. (1958). The cost of capital, corporation finance and the
theory of investment. The American economic review, 48(3), 261-297.
Mohd Shariff, M. N., Peou, C., & Ali, J. (2010). Moderating effect of government policy
on entrepreneurship and growth performance of small-medium enterprises in
Cambodia. International Journal of Business and Management Science, 3(1), 57.
Shariff, M. N. M., & Peou, C. (2008). The relationship of entrepreneurial values, firm
financing and the management and growth performance of small-medium
enterprises in Cambodia. Problems and Perspectives in Management, 6(4), 55-
64.
Akhabonje, S. M., & Namusonge, G. S. (2016). Factors affecting access to credit by
small and medium enterprises: A case of Kitale town. International Journal of
Social Sciences and Humanities Invention, 3(10), 2904-17.
188
Moya , M (2008). Worldwide business startup, http; // www moyak com/researcher
/resume/paper/ business startups.
Mugenda,O, &Mugenda,, G,, (2003). Research Methods Qualitative and quantitative
approaches Nairobi Acts Press
Mullineux,A.W & MarindeV (2014) financial sector policies for enterprise,
development.Review of development financial 4 (2), 66-72
Muritala, T. A. (2018). An empirical analysis of capital structure on firms’ performance
in Nigeria. International journal of advance in management and Economics
IJAME.
Muzenda, A. (2014). A Conceptual Model of the Determinants of Performance of
Tourism Sector Small and Medium Enterprises (SMEs). International Journal of
Business and Management Invention, 3(1), 30-35.
Myers S-C (1984). The capital structure puzzle. Journal of finance 39, 525-592
Mwega, F. M. (2016). Financial Regulation in Kenya: Balancing inclusive growth with
financial stability. In Achieving Financial Stability and Growth in Africa (pp. 99-
122). Routledge.
Nadada,M.U (2013). Emerging business growing from small to large. The role of
SMEDAN Presentation at the launch of the alternative securities market
(ASEM)
Namatovu R,W (2010). Global entrepreneurship monitor .GEM Uganda 2010 Exacutive
Report GEM Uganda
189
Namusonge.G.S. (2006). Entrepreneurial Finance and micro small and medium
enterprises (MSMEs). Innovation in Kenya, Technological and
industrialization conference, JKUAT, Nairobi.
Nanyondo M.Tauringana V.Kamukam N. and Nkunda S (2014). Quality of finance
statement information asymmetry, perceived risk and access to finance by
Uganda SMEs. International journal of management practice 7(4), 324-
340
Narender V,Abhinor,S (2006). Determinants of capital structure in public enterprises,
ICFAI. Journal of applied finance 12(7) pp14-28
Nawaiseh, A.I(2015). Do profitability and size affect financial leverage of Jordanian
industrial listed companies? European journal of business anf innovation
research, 3(5), 1-12
Newman,A Gunesse,S and Hilton,B (2012). Applicability of financial theories of capital
structure to the Chinese culture contex. A study of privately owned SMEs,
International small business journal 30 (1),65-83
Ngoc,T. B. T. Le & Guyen T.B ( 2009). The impact of networking on bank financing.
The case ofsmall and medium enterprises in Vietnam, Entrepreneurship Theory
and practice, 33(4), 867-887.
Njogo, B.O&Safinyu ,A.M,(2012 Impact of small and medium scale enterprises in the
generation of employment in Lagos state. Kuwait chapter of Arabian journal of
business and management and business research 1 (11), 107-141
190
Niresh J,A,(2012) Working capital management &Financial performance of
manufacturing sector in Sri Lanka. International journal of
managerial and Financial Accounting, 4(15), 23-31
Nor A,A Teh S Y, Abdul R,O & Che R, Y (2011). Sensitivity of normality tests to non –
normal data Sains Malaysian 40(6), 637- 641
Nkurunziza, J. (2005). The effects of credit on growth and convergence og firm in
Kenyan manufacturing .CSAE Working paper series 2005-01 Oxford. Centre for
the study of African Economics
Nunnally J,C(1978) Psychometric theory (2nd ed.). New York : McGraw=Hill
Nyabwanga, R,N. (2012) Effect of working capital management practices on financial
performance. A study of small scale enterprise in Kisii South District, Kenya.
African journal of Business management 6(18) 5807-5817
Nyanumba ,E.O & Muganda, M, Musega,D. Masinde ,S .W. (2015) Loan interest rate &
performance of small and medium enterprises.IJMRR/OC.2015 volume 5/ issue
10/Article No 1/712- 728.International journal of management reseach &review
Obamuyi,T,M (2007), An exploratory study on loan delinquency among small and
medium enterprises (SMEs) in oudo state of Nigeria. African journal of Business
management ,2(x), 195-200
Obuya, D.O(2017). Debt financing option and financial performance of micro and small
enterprises. A critical literature review. International business of business
management 12(12), 221-235
O’Brien R,M (2007) A caution regarding rules of thumb for variance inflation factor
Qual ,Quality 41, 473-690
191
Ololade, R. A., & Olagunju, F. I. (2013). Determinants of access to credit among rural
farmers in Oyo State, Nigeria. Global Journal of Science Frontier Research
Agriculture and Veterinary Sciences, 13(2), 16-22.
Omboi B.M & Wangai, P. N. (2013). Factors that influence demand for credit among
small-scale investors: A case study of Meru central District (Doctoral
dissertation).
Onchanwa G.A, Ongoncho S, Ochonga D.M &Njeri (2013) Influence of cooperatives
policy framework on members investment in Kenya, International journal of
social sciences & entrepreneurship 1(7)564-570
Onchonga, E. N Muturi, W &Atambo, W (2016), Effect of debt financing on business
firms financial performance. International journal of social science &
informationtechnology 2(5), 723-737
Olatunyi, T.E,(2013) The impact of accounting system on the performance of small and
medium enterprises in Nigeria , a survey of SMEs in oyo state Nigeria.
International journal of business and management invention 2(9), 13-17
Olu..C & Haynes G.W. (2006) Acquisition of additional equity capital by small firms –
Findings from the national survey of small business finances. Small Business
Economics 27(2), 157-168
Ongolo ,D & Awino,S (2013) Challenges affecting small and medium Development of
government system. CUTS Centre for international Trade economics and
environment
Ono A, & Uesugi I,(2009). Role of collateral and personal Guarant in
relationshiplending.Evidence from Japans SMEs loan market. Journal of money,
192
credit and banking, 41(5), 935-960 http:/ dx doi.org/ 10.1007/s11187-006-
0009=8
Onyango, J (2010). Credit Bureau to open fund for SMEs retrieved from from
http;/www business daily
africa.com/company%20industry/credit%20bureau%20to%open520fund%20taps
%20for%20S MEs/-/539550/892900/-/106d1II/-/index.htm/5,april
Ordit, M,P& Gobardhum Y,D(2011).The determinant of financial leverage of SMEs
inMauritius. The international business and economics research journal
10(3),115
Ouma, C. O., & Rambo, C. M. (2013). The Impact Of Microcredit On Womenowned
Small And Medium Enterprises: Evidence From Kenya. Global Journal of
Business Research, 7(5), 57-69.
Oztunna D,E &,, A,H,Turcca, E. Investigation of four different normality tests in terms
of type I error rate and power under different distributions. Turkish journal of
medical science 36,(3), 171-6
Pandey I,M,(2003) Financial management India, Vikas Publishing House PVT Ltd
Pandey, M (2008) Financial Management (9th ed ). New Dehli Vikas Publishing House
PVT Ltd
Park J, Lim B &Loo J (2008). Developing capital market to identify and diversify SMEs
financing. The Korean experience Korean institute of finance
Patric, M. &Jeremy,K.(2018) Investment appraisal techniques and financial performance
of small and medium enterprises in Nairobi County, Kenya. International
journal of current aspects in finance (IJCAF) 1(2), 89-110
193
Peek J. &Eric,S R, (2000) Collateral Damage effects of the Japanese Bank crises on real
activityin the united states, “The American Economic Review 90 (1), 30-45
Qasim, S., & Ramiz, R. (2011). Impacts of liquidity ratios on
profitability. Interdisciplinary Journal of Research in Business, 1(7), 95-98.
Quartey, p,.Turkso, F AborJ,.Idris, A.(2017) Financing the growth of SMEs in Africa.
What are the constraints to the SME financing within ECOWAS? of development
financing htt;//dxdoi.org/10.1016/jrdf201703.001
Rarpernter, R.E. and Perterson B.C. (2002). Is the growth of small firms constrained by
internal finance? The review of Economics and statistics
Republic of Kenya (2005) Economic survey. Nairobi Government printer
Republic of Kenya (2006), Economic survey. Nairobi Government printer
Republic of Kenya (2009), Economic survey. Nairobi Government printer
Revilla, M.A Saris, W.E &Krosnick, J.A(2014) Choosing the number of categories in
agree disagree scales, sociological methods &research 43(1) 73-97 doi 10
1177/0049124113509605
Rottray, J.C & Jones, M.C. (2007) Essential elements of questionnaire design
&development. Journal of clinical nursing, 16, 234-243
Republic of Kenya (2007) Government printers
Robinson. M. S. (2001). The micro finance Revolution. Sustainable finance for the poor
Washinton D.C World bank
194
Robins, A & Obeng, A.(2008) The Barriers to performance in Ghana small Business
and economic S, 30 (4) 385-4003
Robson P,J,A& Benneti ,R,J (2000). SME Growth the relationship with business advice
and external collaboration. Small business Economics 15, 193-208
Robson,A.&Obeng (2008). The barriers to performancein Ghana small business
Economic S 30(4) ,385-4003
Ross, S. A, Wester field R.W & Jaffee J. (2005). Corporate finance Irwin and MC
Rawttill-Boston
Ross S.A, Westefield R.W &Jordan B.D (2010) Fundamentals of corporate finance 9
edition. New York MC Graw-Hill/Jrwin
Ryan, R.O, Toole, C & Cann, F (2014), Does bank market power affect SMEs financing
constraints? Journal of banking &finance 49, 495-5005
Saad R,M (2010) Corporate Governance compliance and effect to capital structure .
International journal of Economics & finance, 2 (1), 105-114
Saad, R.M Ghani, M.D.A.H.A., Ahmad, S.,&Salim, S.M.N.S(2015). Effects of equity
and debt financing on SME performance in Malaysia University Urta
Malaysia
Sabanci Ozer,H.( 2012). The Role of family control on financial performance of family
Business in Gebze. International Review of management and marketing 2 (2),
75-82
195
Sacristan-Navarro, M. Gomez-Avison S.and Cabeza-Garcia, L (2011).Family ownership
and control, the presence of other large shareholders and firm performance.
Further evidence. Family Business Review, 24(1), 71 93
Saeed A, and Mahmood I. (2011) capital structure and firm performance .Evidence from
Iranian companies. International Research Journal of finance and Economics
70, 20-29
Sakaran, U. (2009). Research methods for business. A skill Building Approach. (4th Ed)
New Delhi; Wiley India private Ltd
Salazar, L.A, Solo C, R and Mosqueda E.R (2012) the impact of financing Decisions
and Strategy on small business competitiveness, Global journal of Business
Research, 6 (2), 93-1003
Saleh A, A (2012). Exploring strategies for small and medium enterprise in Saudi
Arabia paper presented to them RIBM Doctoral Symposium 14-15 march 2012,
Manchester metropolitan University
Sandahl G & Sjogrens (2003). Capital budgeting methods among Sweden’s largest
groups of companies. The state of the art and as a comparison with earlier
studies. International journal of production Economics, volume 84 number 11,
51-69
Saunders, M Lewis, P& Thornhill, A, (2009) Research methods for business students
(5th Ed) New Jersey prentice - Hall
Schiffer, M, &Weder, B. (2001). Firm size and the business environment worldwide
survey results. University of Ireland. IFC Discussion paper 43
196
Sekaran, U and Bougie, R (2010) Research methods for business. A skill Building
Approach (5th Ed). Sussex: John Wiley & Sons Ltd
Sekaran.U, (.2006). Research Methods for Business. New Delhi: John Wiley.
Sheikh, J., Ahmed, W. A., Iqbal, W., & Masood, M. M. (2012). Pecking at pecking
order theory: Evidence from Pakistan’s non-financial sector. Journal of
Competitiveness, 4(4), 86-95
Sha, S (2006).An investigation into problem facing small to medium sized enterprise in
achieving Growth in eastern Cape. Enhancing the strategy for developing small
Growth potential firms in the Eastern Cape
Shapiro, S, S, & Wilk M, B (1965). An analysis of variance test for normality complete
samples Blometrika 53 (3/4), 591-611
Shubita, M, F., & Alsawalhah, J (2012). The effect of capital structure and profitability,
International Journal of Business &social science 3(16), 106-116
Sherif, V. (2018, March). Evaluating Preexisting Qualitative Research Data for
Secondary Analysis. In Forum Qualitative Sozialforschung/Forum: Qualitative
Social Research (Vol. 19, No. 2).
Slotty, C. F. (2009). Financial constraints and the decision to lease–Evidence from
German SME (No. 205). Department of Finance, Goethe University Frankfurt
am Main.
Simeyo, O., Martin, L., Nyamao, N. R., Patrick, O., & Odondo, A. J. (2013). Effect of
provision of micro-finance on the performance of micro-enterprises: A study of
youth micro-enterprises under Kenya Rural Enterprise Program (K-REP), Kisii
County, Kenya. African Journal of Business Management, 5(20), 8290-8300.
197
Srivastava, R, & Misra, A. (2008). Financial management India. Oxford: Oxford
University press
Slotty.C.F (2009) financial constraints and decision to lease .Evidence from German
SMEs, Goethe University Frankfurt, and House of finance German
Statman M. (2002) A century. Financial analysis journal may/ June 5(3), (202) 5259
Steven, G. (2008) Making investment decision with the net present value.09-30
Stevens, J. P (1992). Applied multivariate statistics for the social science (2nd Ed.). N J
Erlbaum : Hills dale
Subhan, Q, A. Mehmood, M, R & Satter D, AA (2013). Innovation in small and medium
enterprise (SMEs) and its impact on economic development in Pakistan. Paper
presented to the 6th International Business and social science Research
conference 3-4 January 2013 Dubai
Thaimuta, J M & Moronge, M (2014) Factors affecting the performance of matatu
paratransit venture in small and medium enterprises in Nairobi County.
International journal of current Business and social sciences I (2) 1-17
Tuomaala M, and Virtan T (2011) Energialehokkuuden mittaamisen hasteet Johlamisen
nakulmast prossit collisuudessa.Discussion, the Finnish journal of business
Thomson B, (2004) Explanatory and confirmatory factor analysis Washington D.C.
America psychological Association.
Tweedi, D (2012) International financial reporting standards and accounting quality,
London: IFRS
198
Uddin, M. M., & Chowdhury, A. Z. M. R. (2009). Do We Need to Think More about
Small Business Capital Budgeting?. International Journal of Business and
Management. 4(1), 112-1161
Utkash, N.K (2012) Valuing investment in technology under uncertainty. Areal option
approach (Graduate school of the University of Minnesota USA)
Van Horn, C, J. (2006) financial management and policy. 12th Edition Stanford
University New Delhi: prentice- Hall of India
Vishnani, S., & Shah, B. K. (2007). Impact of working capital management policies on
corporate performance—an empirical study. Global Business Review, 8(2), 267-
281.
Vuvor S & Achah J (2011). The challenges faced by small and medium enterprise
(SMEs) in obtaining credit in Ghana. School of management. (Master’s Thesis in
Business Administration, Blekinge Tenesika).
Wadongo, B. Odhuno E, Kambona O &Othuon C (2010)Key performance indicators in
the Kenyan hospitality industry; a managerial perspective benchmarking. An
international journal 17 (6), 858-875
Wall Street journal (2014) Money rates. Retrieved from the wall street journal website.
http;// www,wsj com/mdc/public/page/ money rate. ht
Wanjohi, M. A. (2012). Challenges Facing SMEs in Kenya and the efforts in
progress. Nairobi: Kenya Projects Organization.
Wanjohi, A. & Mugure, A. (2008). Factors affecting the growth of MSEs in rural areas
of Kenya: A case of ICT firms in Kiserian Township, Kajiado District of Kenya.
199
Unpublished. Watson, D. Head A, (2008). Corporate: finance principles &
practice, Upper Saddle River, New Jersey, prentice Hall, Hrlow
Waweru, N & Sprakman G (2016). The use of performance measure, case studies from
microfinance sector in Kenya, Qualitative Research in Accountants management
9(1), 44-65
Wole, N (2009). How availability of finance determines the capacity of an enterprise.
Duibusrg
World Bank (2013) Kenya economic update Reinvigorating growth with a dynamic
Banking sector. Washington, D.C: World Bank
World Bank (2012), World development indicators 2012. Washington, D.C: World
Bank Retrieved from http; // data world bank. Org/sites/default files wdi
2012-ebook.pdf
WU, J Song, J & Zeng, Z (2008) An empirical evidence of small business financing in
China, Management research News, 31 (12), 959-979
Xu, G. Ou X & Chan (2016), Research on the relationship between debt financing and
operating performance based on mediation of diversification. Technology
&investment 7(03), 66-75
Yan, M. (2013). An assessment of UK banking liquidity regulation and
supervision (Doctoral dissertation, Loughborough University).
Yiha Ylhäinen, I. (2017). Life-cycle effects in small business finance. Journal of
Banking & Finance, 77(C), 176-196.
200
Yongqiang, L. I., Armstrong, A., & Clarke, A. (2012). An Instrument Variable Model of
the Impact of Financing Decisions on Performance of Small Businesses in
Australia's Pre-global Financial Crisis. Journal of Modern Accounting and
Auditing, 8(7), 1052.
Zarook, T., Rahman, M. M., & Khanam, R. (2013). The impact of demographic factors
on accessing finance in Libya’s SMEs. International Journal of Business and
Management, 8(14), 55.
Zeller,A. & Lapen. F.(2010). Enhancing micro-finance performance amidst human
capital. , Journal of micro finance,.2 (2) 15-20
Zeitun, R., & Tian, G. G. (2007). Capital Structure and Corporate Performance&58;
Evidence from Jordan. Australasian Accounting, 1(4), 40-61.
Zikmund, W. BabiN, J. Carr, C.Griffin, M (2009) Research methods (8th Ed) London:
South Wester college publishing
Zikmund, W.G (2000) Research methods (sixth edition) (6th Ed.). Orlando Florida. The
Dryden press
Zhang, D. Hua, Z.Z, Song can, C. (2008). Semi-supervised dimensionality reduction 7th
SIAM international conference on data mining [doe>10 1.1 102 798
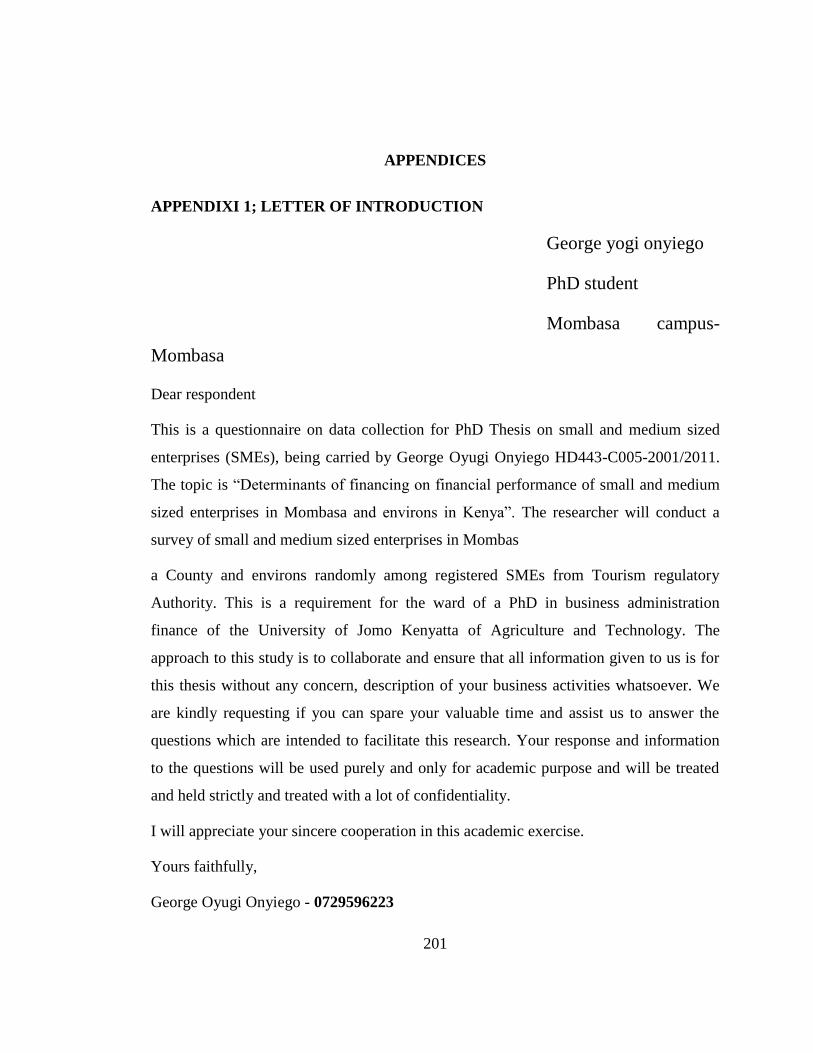
201
APPENDICES
APPENDIXI 1; LETTER OF INTRODUCTION
George yogi onyiego
PhD student
Mombasa campus-
Mombasa
Dear respondent
This is a questionnaire on data collection for PhD Thesis on small and medium sized
enterprises (SMEs), being carried by George Oyugi Onyiego HD443-C005-2001/2011.
The topic is “Determinants of financing on financial performance of small and medium
sized enterprises in Mombasa and environs in Kenya”. The researcher will conduct a
survey of small and medium sized enterprises in Mombas
a County and environs randomly among registered SMEs from Tourism regulatory
Authority. This is a requirement for the ward of a PhD in business administration
finance of the University of Jomo Kenyatta of Agriculture and Technology. The
approach to this study is to collaborate and ensure that all information given to us is for
this thesis without any concern, description of your business activities whatsoever. We
are kindly requesting if you can spare your valuable time and assist us to answer the
questions which are intended to facilitate this research. Your response and information
to the questions will be used purely and only for academic purpose and will be treated
and held strictly and treated with a lot of confidentiality.
I will appreciate your sincere cooperation in this academic exercise.
Yours faithfully,
George Oyugi Onyiego - 0729596223
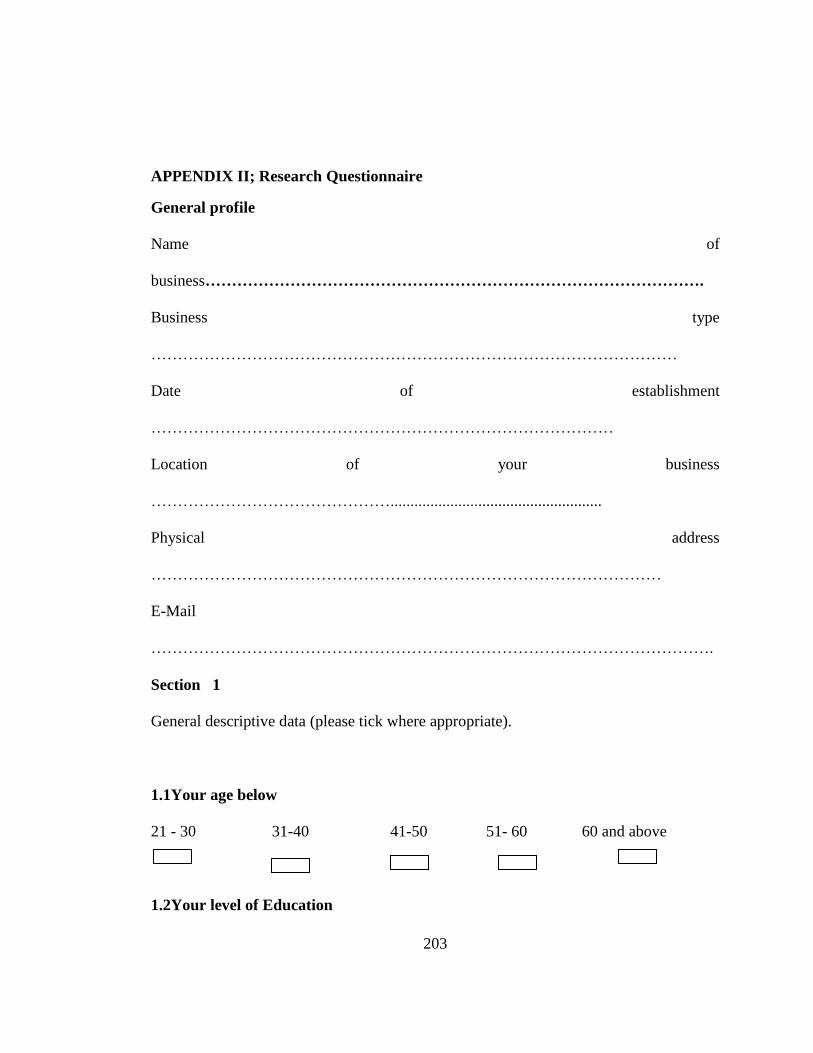
203
APPENDIX II; Research Questionnaire
General profile
Name of
business………………………………………………………………………………….
Business type
………………………………………………………………………………………
Date of establishment
……………………………………………………………………………
Location of your business
……………………………………….....................................................
Physical address
……………………………………………………………………………………
…………………………………………………………………………………………….
Section 1
General descriptive data (please tick where appropriate).
1.1Your age below
21 - 30 31-40 41-50 51- 60 60 and above
1.2Your level of Education
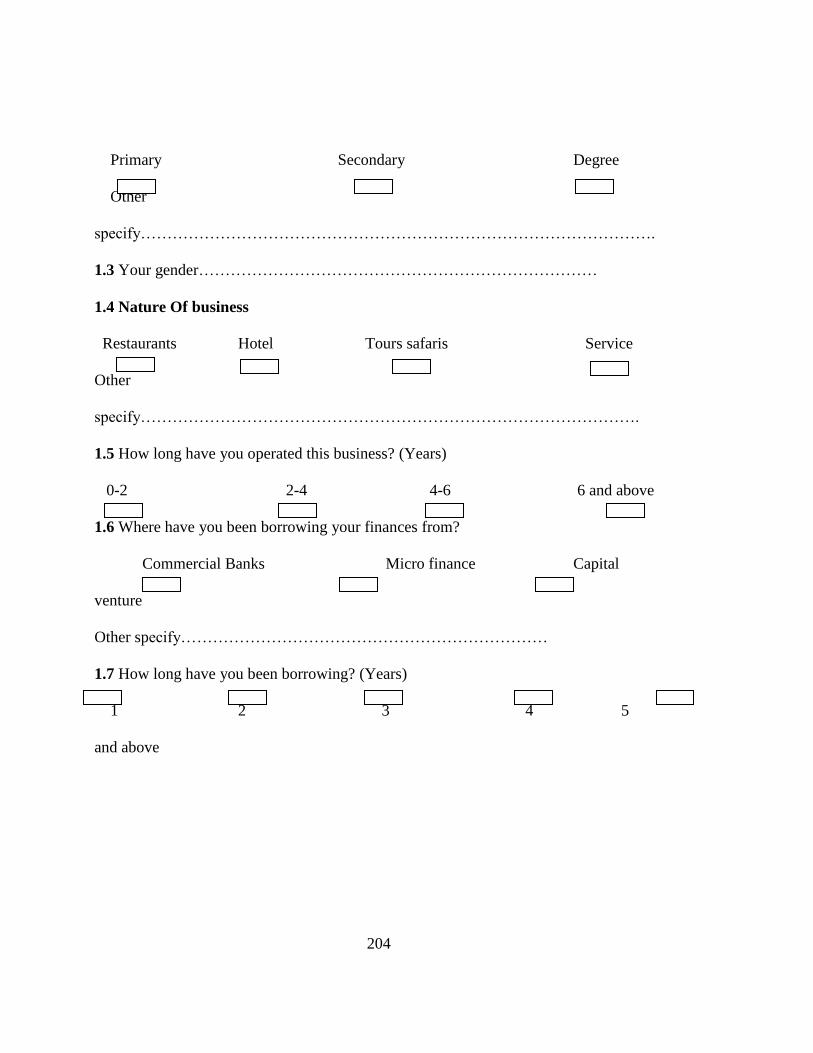
204
Primary Secondary Degree
Other
specify…………………………………………………………………………………….
1.3 Your gender…………………………………………………………………
1.4 Nature Of business
Restaurants Hotel Tours safaris Service
Other
specify………………………………………………………………………………….
1.5 How long have you operated this business? (Years)
0-2 2-4 4-6 6 and above
1.6 Where have you been borrowing your finances from?
Commercial Banks Micro finance Capital
venture
Other specify……………………………………………………………
1.7 How long have you been borrowing? (Years)
1 2 3 4 5
and above
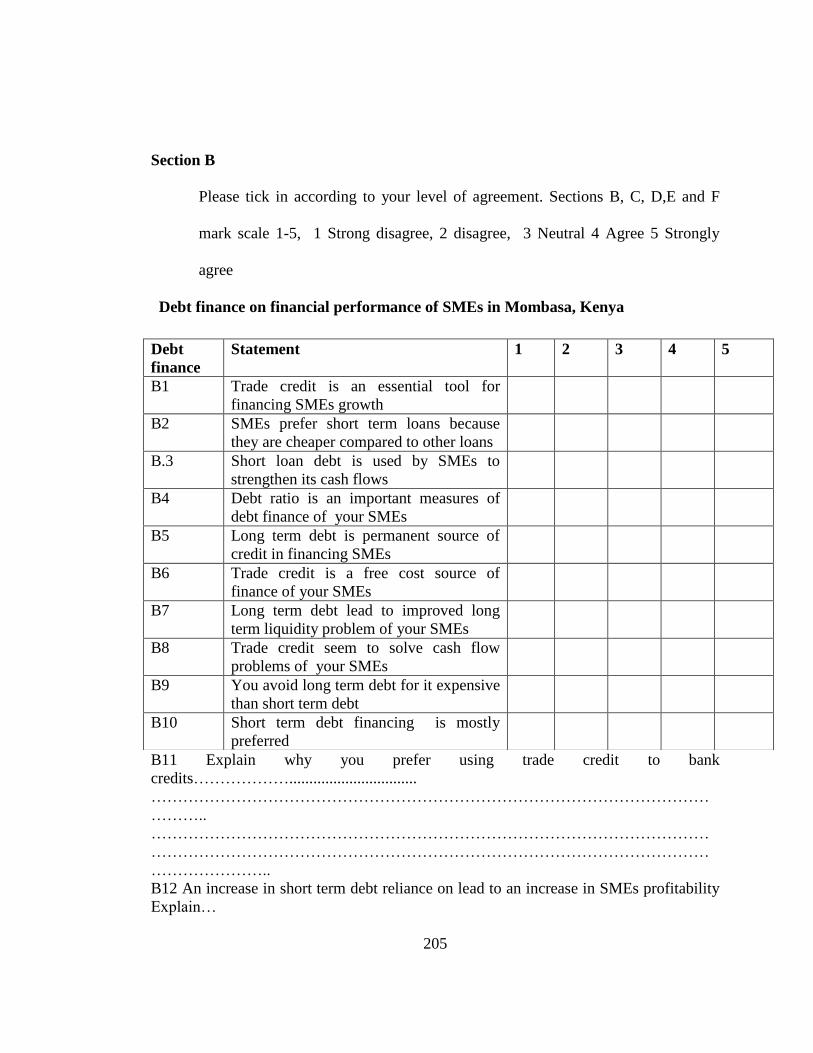
205
Section B
Please tick in according to your level of agreement. Sections B, C, D,E and F
mark scale 1-5, 1 Strong disagree, 2 disagree, 3 Neutral 4 Agree 5 Strongly
agree
Debt finance on financial performance of SMEs in Mombasa, Kenya
B11 Explain why you prefer using trade credit to bank
credits………………................................
……………………………………………………………………………………………
………..
……………………………………………………………………………………………
……………………………………………………………………………………………
…………………..
B12 An increase in short term debt reliance on lead to an increase in SMEs profitability
Explain…
Debt
finance
Statement 1 2 3 4 5
B1 Trade credit is an essential tool for
financing SMEs growth
B2 SMEs prefer short term loans because
they are cheaper compared to other loans
B.3 Short loan debt is used by SMEs to
strengthen its cash flows
B4 Debt ratio is an important measures of
debt finance of your SMEs
B5 Long term debt is permanent source of
credit in financing SMEs
B6 Trade credit is a free cost source of
finance of your SMEs
B7 Long term debt lead to improved long
term liquidity problem of your SMEs
B8 Trade credit seem to solve cash flow
problems of your SMEs
B9 You avoid long term debt for it expensive
than short term debt
B10 Short term debt financing is mostly
preferred
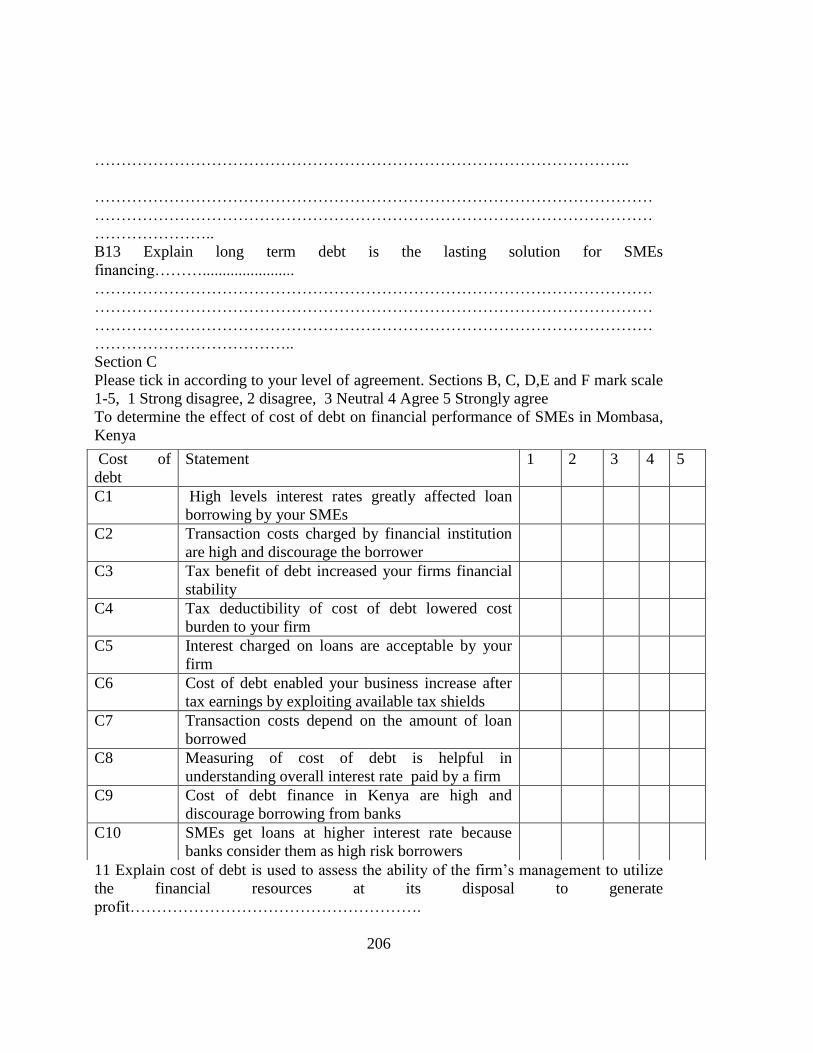
206
………………………………………………………………………………………..
……………………………………………………………………………………………
……………………………………………………………………………………………
…………………..
B13 Explain long term debt is the lasting solution for SMEs
financing……….......................
……………………………………………………………………………………………
……………………………………………………………………………………………
……………………………………………………………………………………………
………………………………..
Section C
Please tick in according to your level of agreement. Sections B, C, D,E and F mark scale
1-5, 1 Strong disagree, 2 disagree, 3 Neutral 4 Agree 5 Strongly agree
To determine the effect of cost of debt on financial performance of SMEs in Mombasa,
Kenya
11 Explain cost of debt is used to assess the ability of the firm’s management to utilize
the financial resources at its disposal to generate
profit……………………………………………….
Cost of
debt
Statement 1 2 3 4 5
C1 High levels interest rates greatly affected loan
borrowing by your SMEs
C2 Transaction costs charged by financial institution
are high and discourage the borrower
C3 Tax benefit of debt increased your firms financial
stability
C4 Tax deductibility of cost of debt lowered cost
burden to your firm
C5 Interest charged on loans are acceptable by your
firm
C6 Cost of debt enabled your business increase after
tax earnings by exploiting available tax shields
C7 Transaction costs depend on the amount of loan
borrowed
C8 Measuring of cost of debt is helpful in
understanding overall interest rate paid by a firm
C9 Cost of debt finance in Kenya are high and
discourage borrowing from banks
C10 SMEs get loans at higher interest rate because
banks consider them as high risk borrowers

207
……………………………………………………………………………………………
…………
……………………………………………………………………………………………
……………………………………………………………………………………………
…………………….
C12 Explain the relationship between cost debt and value of a firm?
........................................
……………………………………………………………………………………………
………
……………………………………………………………………………………………
……………………………………………………………………………………………
……………………
C13 Explain if cost of finance can be a limitation to use of a given source of
finance…………….
……………………………………………………………………………………………
……………………………………………………………………………………………
……………………………………………………………………………………………
……………………………….
Section D
Please tick in according to your level of agreement. Sections B, C, D,E and F mark
scale 1-5, 1 Strong disagree, 2 disagree, 3 Neutral 4 Agree 5 Strongly agree
Effect of investment decisions on financial performance of SMEs in Mombasa Kenya
Investment
decisions
InvestDe
Statement
1 2 3 4 5
D1 Net present value is the most accurate
method for valuing projects
D2 Positive cash flows is critical live blood
of SMEs to sustain g performance
D3 Negative cash flow crippled your
business profitability over time
D4 Strong cash flow put your business in a
better position to negotiate more attractive
financing terms
D5 Your calculated net present value is
always positive
D6 You monitor return on investment to
compare gains in terms of profitability
trends of the firm
D7 Your firm use return on investment to
evaluate efficiency of investment
performance
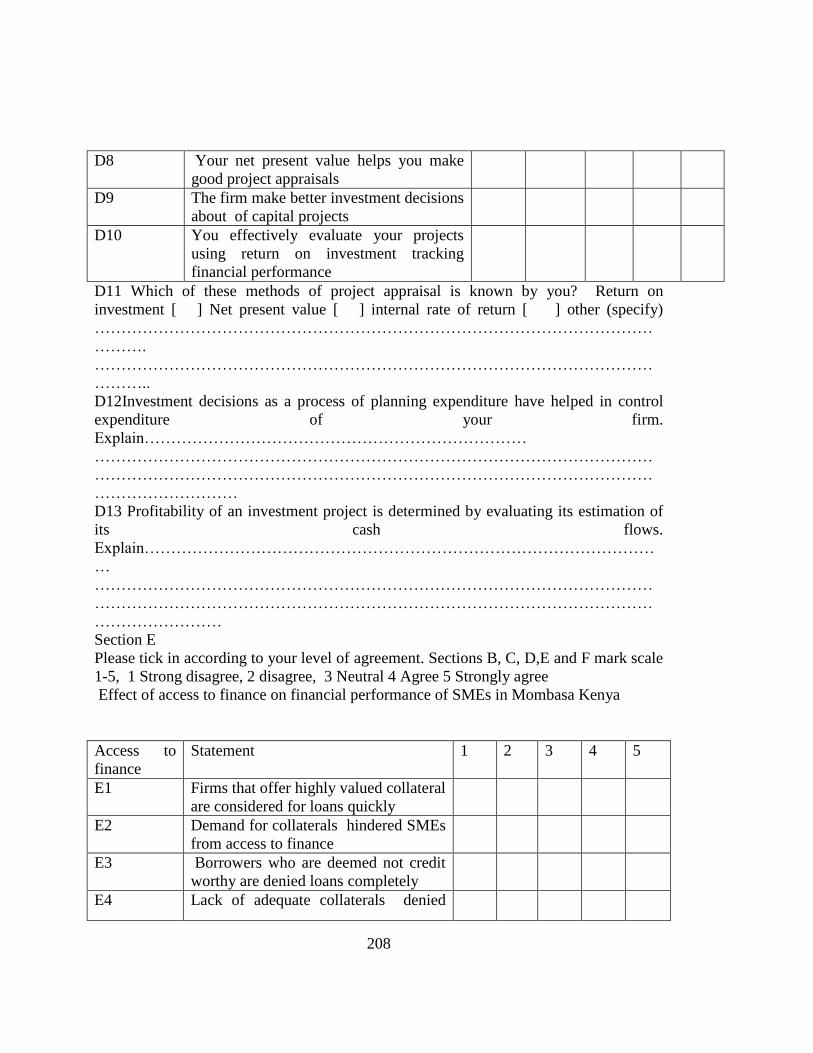
208
D8 Your net present value helps you make
good project appraisals
D9 The firm make better investment decisions
about of capital projects
D10 You effectively evaluate your projects
using return on investment tracking
financial performance
D11 Which of these methods of project appraisal is known by you? Return on
investment [ ] Net present value [ ] internal rate of return [ ] other (specify)
……………………………………………………………………………………………
……….
……………………………………………………………………………………………
………..
D12Investment decisions as a process of planning expenditure have helped in control
expenditure of your firm.
Explain………………………………………………………………
……………………………………………………………………………………………
……………………………………………………………………………………………
………………………
D13 Profitability of an investment project is determined by evaluating its estimation of
its cash flows.
Explain……………………………………………………………………………………
…
……………………………………………………………………………………………
……………………………………………………………………………………………
……………………
Section E
Please tick in according to your level of agreement. Sections B, C, D,E and F mark scale
1-5, 1 Strong disagree, 2 disagree, 3 Neutral 4 Agree 5 Strongly agree
Effect of access to finance on financial performance of SMEs in Mombasa Kenya
Access to
finance
Statement 1 2 3 4 5
E1 Firms that offer highly valued collateral
are considered for loans quickly
E2 Demand for collaterals hindered SMEs
from access to finance
E3 Borrowers who are deemed not credit
worthy are denied loans completely
E4 Lack of adequate collaterals denied
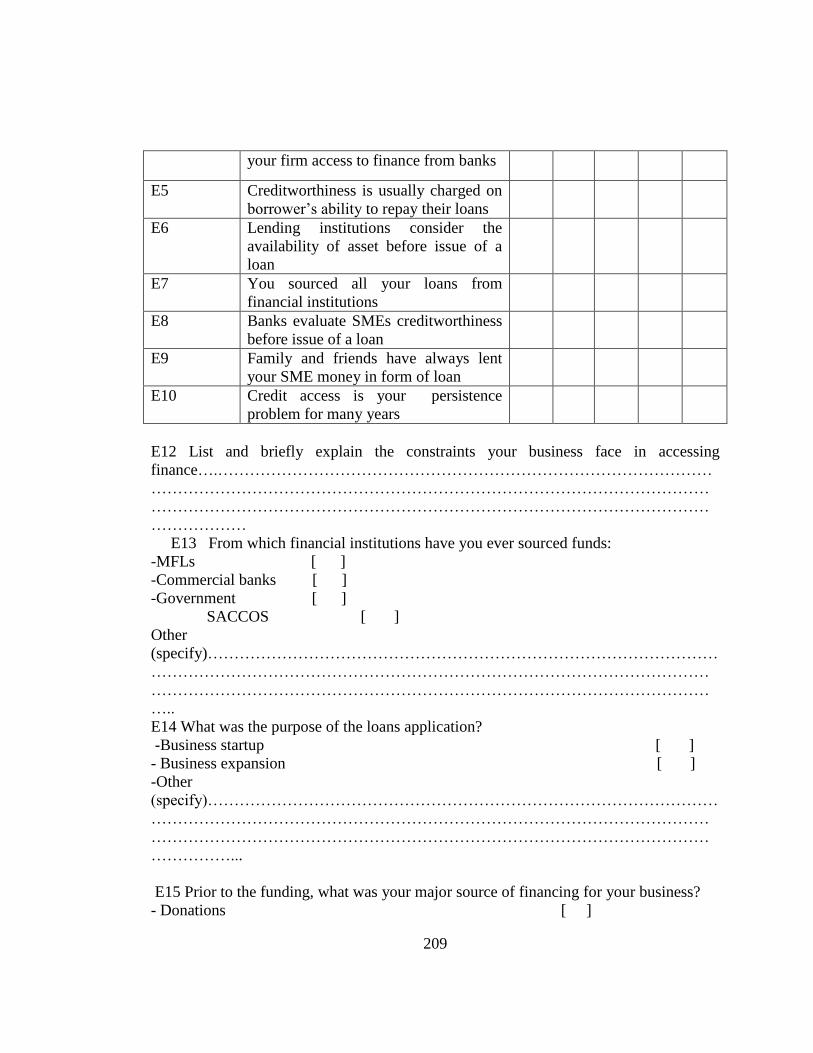
209
your firm access to finance from banks
E5 Creditworthiness is usually charged on
borrower’s ability to repay their loans
E6 Lending institutions consider the
availability of asset before issue of a
loan
E7 You sourced all your loans from
financial institutions
E8 Banks evaluate SMEs creditworthiness
before issue of a loan
E9 Family and friends have always lent
your SME money in form of loan
E10 Credit access is your persistence
problem for many years
E12 List and briefly explain the constraints your business face in accessing
finance….…………………………………………………………………………………
……………………………………………………………………………………………
……………………………………………………………………………………………
………………
E13 From which financial institutions have you ever sourced funds:
-MFLs [ ]
-Commercial banks [ ]
-Government [ ]
SACCOS [ ]
Other
(specify)……………………………………………………………………………………
……………………………………………………………………………………………
……………………………………………………………………………………………
…..
E14 What was the purpose of the loans application?
-Business startup [ ]
- Business expansion [ ]
-Other
(specify)……………………………………………………………………………………
……………………………………………………………………………………………
……………………………………………………………………………………………
……………...
E15 Prior to the funding, what was your major source of financing for your business?
- Donations [ ]
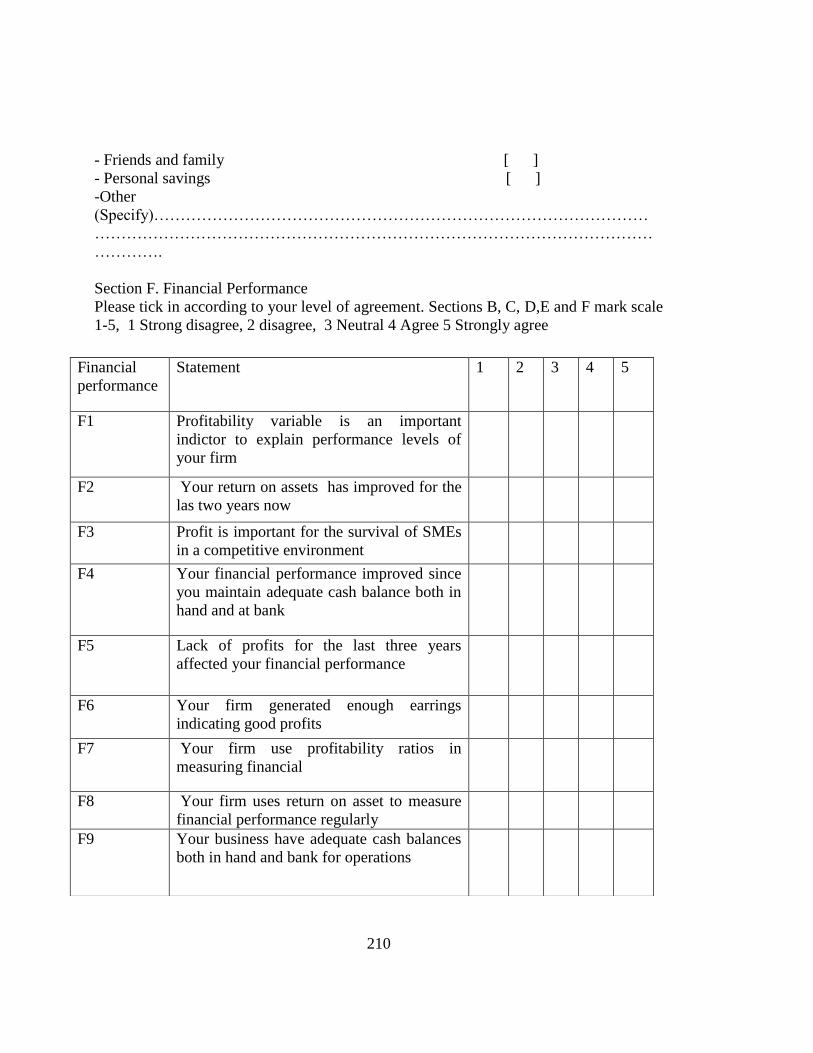
210
- Friends and family [ ]
- Personal savings [ ]
-Other
(Specify)…………………………………………………………………………………
……………………………………………………………………………………………
………….
Section F. Financial Performance
Please tick in according to your level of agreement. Sections B, C, D,E and F mark scale
1-5, 1 Strong disagree, 2 disagree, 3 Neutral 4 Agree 5 Strongly agree
Financial
performance
Statement 1 2 3 4 5
F1 Profitability variable is an important
indictor to explain performance levels of
your firm
F2 Your return on assets has improved for the
las two years now
F3 Profit is important for the survival of SMEs
in a competitive environment
F4 Your financial performance improved since
you maintain adequate cash balance both in
hand and at bank
F5 Lack of profits for the last three years
affected your financial performance
F6 Your firm generated enough earrings
indicating good profits
F7 Your firm use profitability ratios in
measuring financial
F8 Your firm uses return on asset to measure
financial performance regularly
F9 Your business have adequate cash balances
both in hand and bank for operations
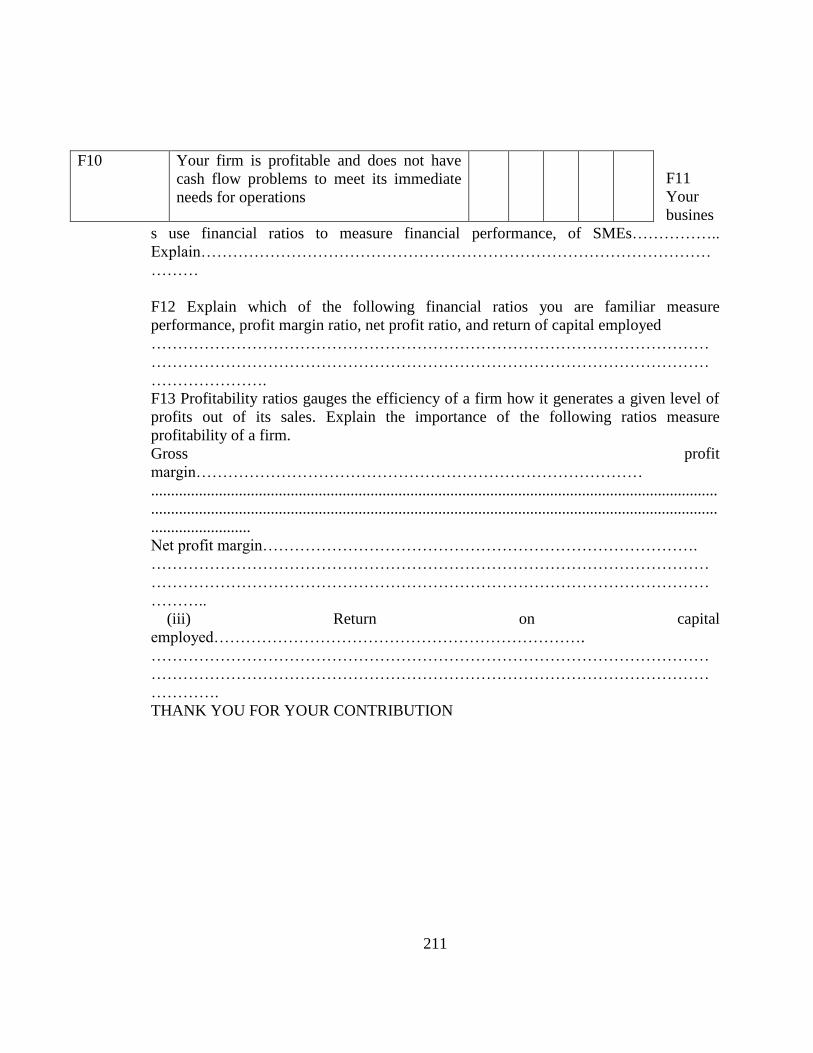
211
F11
Your
busines
s use financial ratios to measure financial performance, of SMEs……………..
Explain……………………………………………………………………………………
………
F12 Explain which of the following financial ratios you are familiar measure
performance, profit margin ratio, net profit ratio, and return of capital employed
……………………………………………………………………………………………
……………………………………………………………………………………………
………………….
F13 Profitability ratios gauges the efficiency of a firm how it generates a given level of
profits out of its sales. Explain the importance of the following ratios measure
profitability of a firm.
Gross profit
margin…………………………………………………………………………
..............................................................................................................................................
..............................................................................................................................................
.........................
Net profit margin……………………………………………………………………….
……………………………………………………………………………………………
……………………………………………………………………………………………
………..
(iii) Return on capital
employed…………………………………………………………….
……………………………………………………………………………………………
……………………………………………………………………………………………
………….
THANK YOU FOR YOUR CONTRIBUTION
F10 Your firm is profitable and does not have
cash flow problems to meet its immediate
needs for operations
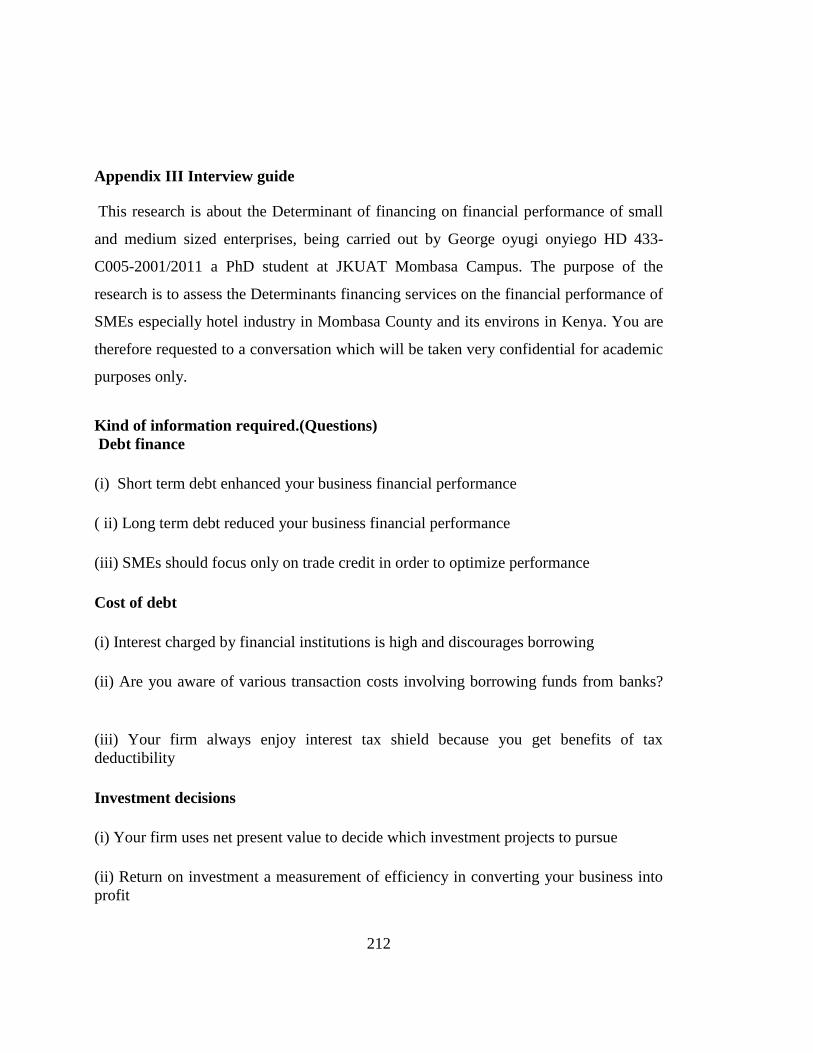
212
Appendix III Interview guide
This research is about the Determinant of financing on financial performance of small
and medium sized enterprises, being carried out by George oyugi onyiego HD 433-
C005-2001/2011 a PhD student at JKUAT Mombasa Campus. The purpose of the
research is to assess the Determinants financing services on the financial performance of
SMEs especially hotel industry in Mombasa County and its environs in Kenya. You are
therefore requested to a conversation which will be taken very confidential for academic
purposes only.
Kind of information required.(Questions)
Debt finance
(i) Short term debt enhanced your business financial performance
( ii) Long term debt reduced your business financial performance
(iii) SMEs should focus only on trade credit in order to optimize performance
Cost of debt
(i) Interest charged by financial institutions is high and discourages borrowing
(ii) Are you aware of various transaction costs involving borrowing funds from banks?
(iii) Your firm always enjoy interest tax shield because you get benefits of tax
deductibility
Investment decisions
(i) Your firm uses net present value to decide which investment projects to pursue
(ii) Return on investment a measurement of efficiency in converting your business into
profit
213
(iii) Negative cash flow made your SMEs struggle to pay bills
Access to finance
(i) Credit worthiness played a major role in having your loan application approved
(ii) Where do you source all your finance for your financial performance?
(ii) Lack of collateral affected your firm from accessing funds from banks
Financial performance
(i) Measurement of financial performance is an important part of a running a growing
business
(i) Your firm uses accounting ratios to measure financial performance

214
Appendix IV List of participants among the registered, Hotels, Restaurant and tour
safaris with Tourism regulatory authority
NAME OF THE COMPANY ADDRESS
HOTELS
1. A Nassar Hotel P.O Box 610 -80100
Mombasa
2. Bahari beach hotel P.O Box 86693 Mombasa
3. Bandari hotel P.O Box 83924 Mombasa
3. Blue bubble hotel 0723879261 Baroda
Mombasa
4. Brooklyne hotel. PO Box 83836 Mombasa
5. Beaumont Resort hotel 0723388407 Mtwapa
6. Club grew hotel P.O Box 725-80400 Ukunda
7. Coast pride hotel P.O Box85585 Mombasa
8.Dian beach hotel P.O Box (040)
3202479,330105,
0700999999
9.Danpark hotel [email protected]
10. Fine Breeze hotel P.O Box 78 Voi
11.Flaingo hotel Mombasa
flamingo@[email protected]
m
215
12.Darajan hotel P.O Box 43086 -80100
Mombasa
13..Ganjoni Wanainchi Hotel P.O Box 40604 Mombasa
14.Grills café and restaurant 0722415151 Vescon
Mombasa
15.Georgiab hotel P.O Mtwapa
16.Hotel dorte Elkana [email protected]
17. Hotel Dorse 0770050116 Mombasa
18. Intercontinental beach hotel Mombasa
19..Jambo paradise hotel P.O Box 5121-80100
Mombasa
20. Habibu Swahil dishes restaurant Vescon II Bamburi
Info,[email protected]
21.Kimson Café & Hotel P.O Box 93204 Mombasa
22.Kendas arcade hotel [email protected]
Mtwapa
23.Kemdas village hotel Judith@ yahoo.com
24.Kahama hotel P.O Box Mombasa
25. Katimo enteprises P.O Box 41 80300 Voi

216
26.Kaither café P.O Box 97163 Mombasa
27.Kivulini Bahari hotel P.O Box 83935-80100
Mombasa
28. Kenda hotel P.O Mtwapa
29 Kenya bay beach hotel P.O Box 767 Mombasa
30.Josleejim Hotel Ltd P.O Box 80094 Mombasa
31.Liwaza hotel P.O Box 1254 Mombasa
32.Lambada hotel P.O Box Mtwapa
33.Lavender hotels P. O Box 125 Wundanyi
Lavender
garden.hotel@yahoo
34.Lotus hotel P.O. Box 90193 Mombasa
35.Mama tony café & restaurant P.O Box 41121-80100
Mombasa
36.Milele beach hotel P.O Box 10119 Mombasa
37 Midview Central Hotel P.O Box 34306 Mombasa
38.Matshi fast foods hotel P.O Box 34592 Mombasa
Abdulrama @gmail
39. Mombasa backpackers’ hotel P.O Box Mombasa
0787929345

217
40. Mombasa beach hotel P.O Box Mombasa
41. Mgange Hotels P.O Box 821-80300 Voi
43.Mikindani west sunset hotel P.O Box 41987-80100
Mombasa
44.Monalisa Hotel P.O Mtwapa
45.Magongo Inn Guest house P.O Box 40604 Mombasa
46. Minalove hotel restaurant
[email protected] Beach
47.Merny villa hotel [email protected]
48Neptune paradise hotel P.O Box 83125 Mombasa.
49.Nyali beach hotel P.O Box 1874 80100 Mombasa
50. Pundamillia Paradise Hotel P.O Box 2487 Mombasa
51..Peal Beach Hotels Ltd P.O Box 90521 Mombasa
52..Pancoffee hotel and restaurant 0727469626 Mombasa
(CBD)
53. Pawezi hotel & restaurant P.O Box 10205 Mtwapa
Pawezi hotel yahoo.com
54Papillion (Fontana hotel) P.O Box 8629 Mombasa
55.Panaroma Gardens hotel P.O Box 88723 80100
Mombasa

218
56. Royal comfort hotel P.O Box 968 Mombasa
57.Royal court hotel P.O Box 41247 Mombasa
58.Mwanyaisio Guardian motel P.O Box 81226 Mombasa
59.Rosewood hotel&gril P.O Box621 Voi
60 Summerink Hotel P.O Box 99716 Mombasa
61.Shanzu Beach homes P.O Box 4121-80100
Shanzu
62..Sai Rock Beach hotel P.O Box 83063 Mombasa.
63Tsavo lodge P.O Box 244 80300 Voi
tsavolodges
64. Rongai Quality meat & restaurant 0725880224 Mtwapa
65..Swahili Beach hotel P.O Ukunda
66.Tsavo autopoints Ltd P.O Box 130 Voi
68.Midview central hotel P.O Box 34306
Mombasa
219
69.Ziwa Beach Resort P.O Box Mombasa
gonganjambi@ya
70. Regency Park Hotel P.O.Box 58527 Mombasa
71.Valence inn hotel P.O Box 192 800100
Mombasa
72.Windsor Apartment Hotel P.O Box 40654 Mombasa
73.Taita rocks hotels P.O Box 1086 Voi
74.Third café P.O Box 42039 Mombasa
Soup [email protected]
75.Travelers Beach hotel P.O Box 87649 Mombasa
76.Tudor water sports hotel Mombasa
77.Tamutamu Dishes Hotel P.O Box 2918 Mombasa
78.Mama tony café &restaurant Mombasa
79.Atoshi Guest house st Thomas maternity hospital
80.Annex fast food P.O Box 3112-80100
Mombasa8

220
81.Abdulahi café P.O Box 801 80100
Mombasa
82.Ack Guest House P.O Box 96170 -80100
Mombasa
83African lodges ltd P.O Box 610 80300 Voi
Infoafrkalodges.co.ke
84.Baxton leisure lodge P.O Box 71432- 800
Mombasa
85.Bamburi corner guest house P.O Box 1662-80100
Mombasa
86..Chiken Inn P.O Box-7857 -80100
Mombasa
87 Dodoma Serena Hotel P.O Box 90 278 Mombasa 4.
88.Surfside villas P.O Box90330 -80100
Mombasa
89.Sunner link hotel P.O Box99716 Mombasa
90.White castle hotel P.O Box 42290 Mombasa
91.Dodoma Serena hotel P.O. Box 90278 Mombasa
92. Cast gate hotel P.O Box 93367 Mombasa
93. Royal comfort hotel P.O. Box 968 Mombasa
94. Peal Beach hotels Ltd P.O Box90521 Mombasa
95.Darajani hotel P.O Box 43086 Mombasa
221
96. Mombasa Beach hotel P.O Box 90414 Mombasa
97. White sands hotel P.O. Box 87306 Mombasa
98. White castle Hotel P.O Box42290 Mombasa
99. Yomoke Hotel P.O Box 90535 Mombasa
RESUARANT
1.Ali Baba cave Restaurant P.O Box 8040Ukunda
2. Athus Bar and Restaurant P.O Box 97768 Mombasa
3. Aisha restaurant P.O Box 247-80100
Mombasa
4 . Babu juice palour & restaurant P.O Box 8242 80100
Mombasa
5.B.B restaurant B B restaurant @yahoo.com
6..Blecars restaurant Mombasa
7 .Bobs Bar & Restaurant Mombasa
8.Brazuca bar & restaurant P.O Box1634 80100
Mombasa
9. Bahnof Inn Restaurant Nyali
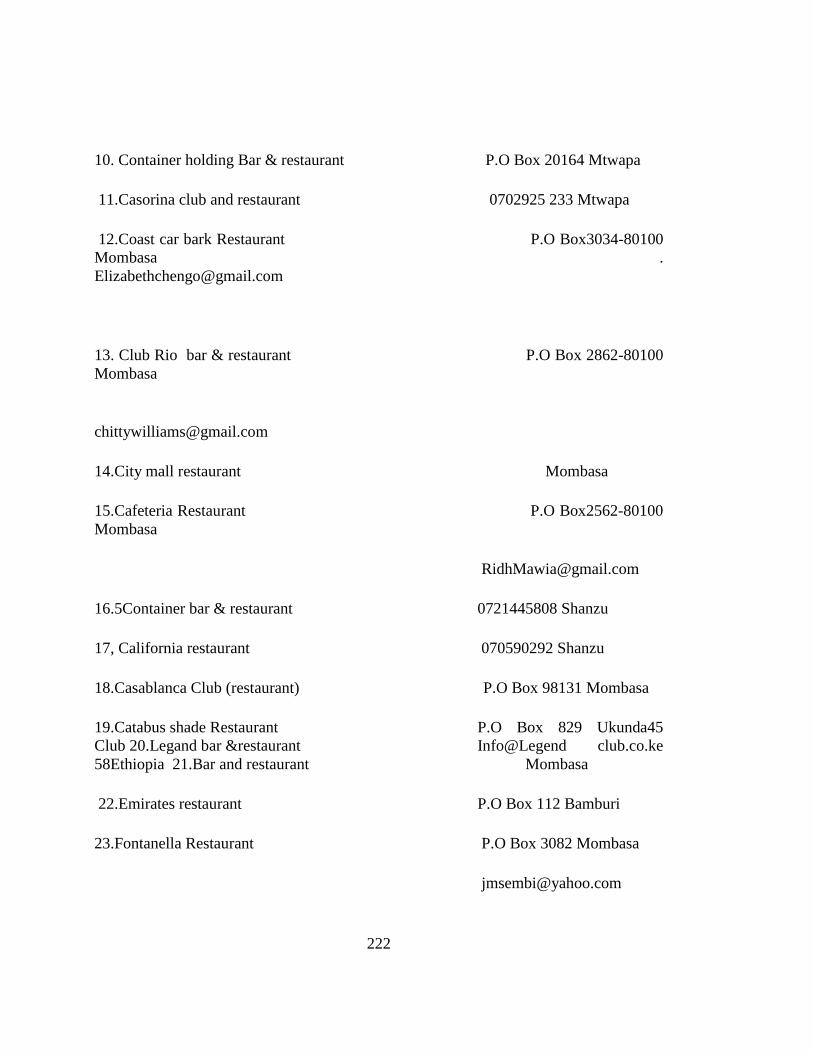
222
10. Container holding Bar & restaurant P.O Box 20164 Mtwapa
11.Casorina club and restaurant 0702925 233 Mtwapa
12.Coast car bark Restaurant P.O Box3034-80100
Mombasa .
13. Club Rio bar & restaurant P.O Box 2862-80100
Mombasa
14.City mall restaurant Mombasa
15.Cafeteria Restaurant P.O Box2562-80100
Mombasa
16.5Container bar & restaurant 0721445808 Shanzu
17, California restaurant 070590292 Shanzu
18.Casablanca Club (restaurant) P.O Box 98131 Mombasa
19.Catabus shade Restaurant P.O Box 829 Ukunda45
Club 20.Legand bar &restaurant Info@Legend club.co.ke
58Ethiopia 21.Bar and restaurant Mombasa
22.Emirates restaurant P.O Box 112 Bamburi
23.Fontanella Restaurant P.O Box 3082 Mombasa

223
24..Funzi keys restaurant P.O Box 5555 Ukunda
25.Fantanus restaurant 0735951834
26.Havaca bar &restaurant P.O Box 80400 –Ukunda
Info@havano .co.ke
27Inland restaurant P.O Box4592-80400 Likoni
Mombasa
28.Happy moments restaurant P.O Box 2245 -80100
Mombasa
.29 Indiana Restaurant P.O Box 648-80100
Mombasa
30..Indiana Restaurant P.O Box 2782-80100
Mombasa
31.Ibrahims Restaurant [email protected] Mombasa
32..Kens chicK restaurant Mombasa
33. Kens chic Restaurant P.O Box 7045-80100
Mombasa
34 Kariuku restaurant P.O Box7452-80100
Mombasa
35.Lollipop Grill Restaurant [email protected]
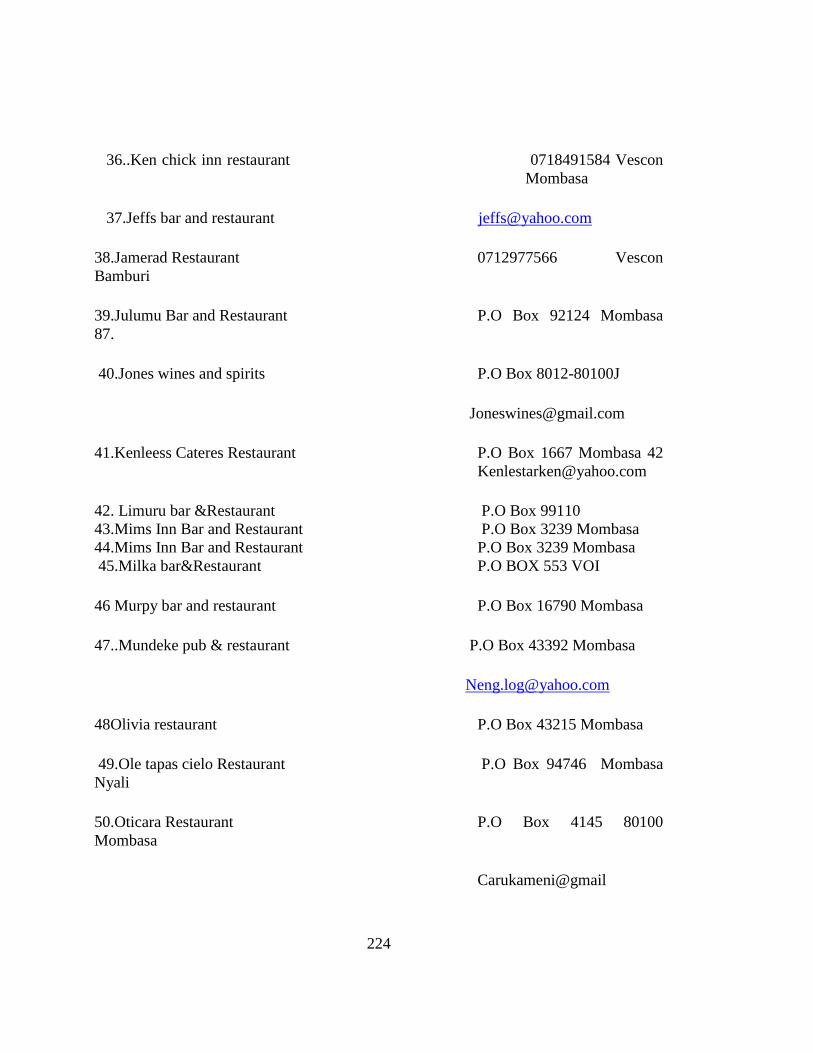
224
36..Ken chick inn restaurant 0718491584 Vescon
Mombasa
37.Jeffs bar and restaurant [email protected]
38.Jamerad Restaurant 0712977566 Vescon
Bamburi
39.Julumu Bar and Restaurant P.O Box 92124 Mombasa
87.
40.Jones wines and spirits P.O Box 8012-80100J
41.Kenleess Cateres Restaurant P.O Box 1667 Mombasa 42
42. Limuru bar &Restaurant P.O Box 99110
43.Mims Inn Bar and Restaurant P.O Box 3239 Mombasa
44.Mims Inn Bar and Restaurant P.O Box 3239 Mombasa
45.Milka bar&Restaurant P.O BOX 553 VOI
46 Murpy bar and restaurant P.O Box 16790 Mombasa
47..Mundeke pub & restaurant P.O Box 43392 Mombasa
48Olivia restaurant P.O Box 43215 Mombasa
49.Ole tapas cielo Restaurant P.O Box 94746 Mombasa
Nyali
50.Oticara Restaurant P.O Box 4145 80100
Mombasa
Carukameni@gmail
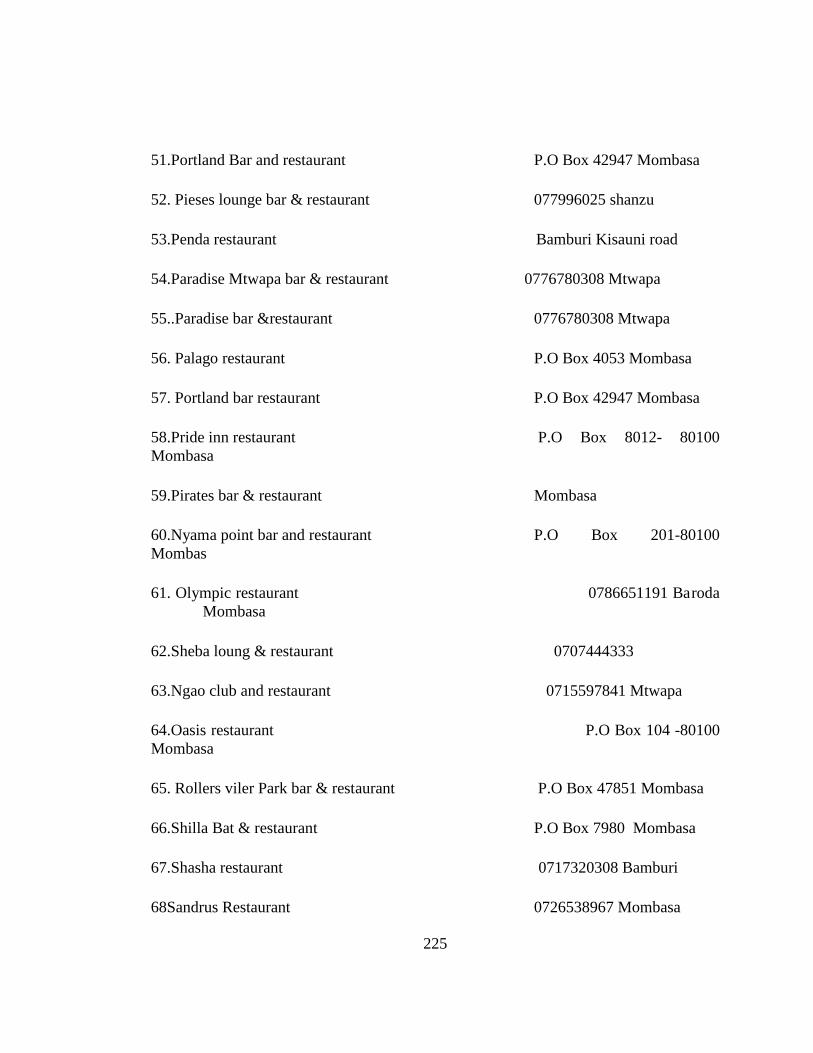
225
51.Portland Bar and restaurant P.O Box 42947 Mombasa
52. Pieses lounge bar & restaurant 077996025 shanzu
53.Penda restaurant Bamburi Kisauni road
54.Paradise Mtwapa bar & restaurant 0776780308 Mtwapa
55..Paradise bar &restaurant 0776780308 Mtwapa
56. Palago restaurant P.O Box 4053 Mombasa
57. Portland bar restaurant P.O Box 42947 Mombasa
58.Pride inn restaurant P.O Box 8012- 80100
Mombasa
59.Pirates bar & restaurant Mombasa
60.Nyama point bar and restaurant P.O Box 201-80100
Mombas
61. Olympic restaurant 0786651191 Baroda
Mombasa
62.Sheba loung & restaurant 0707444333
63.Ngao club and restaurant 0715597841 Mtwapa
64.Oasis restaurant P.O Box 104 -80100
Mombasa
65. Rollers viler Park bar & restaurant P.O Box 47851 Mombasa
66.Shilla Bat & restaurant P.O Box 7980 Mombasa
67.Shasha restaurant 0717320308 Bamburi
68Sandrus Restaurant 0726538967 Mombasa
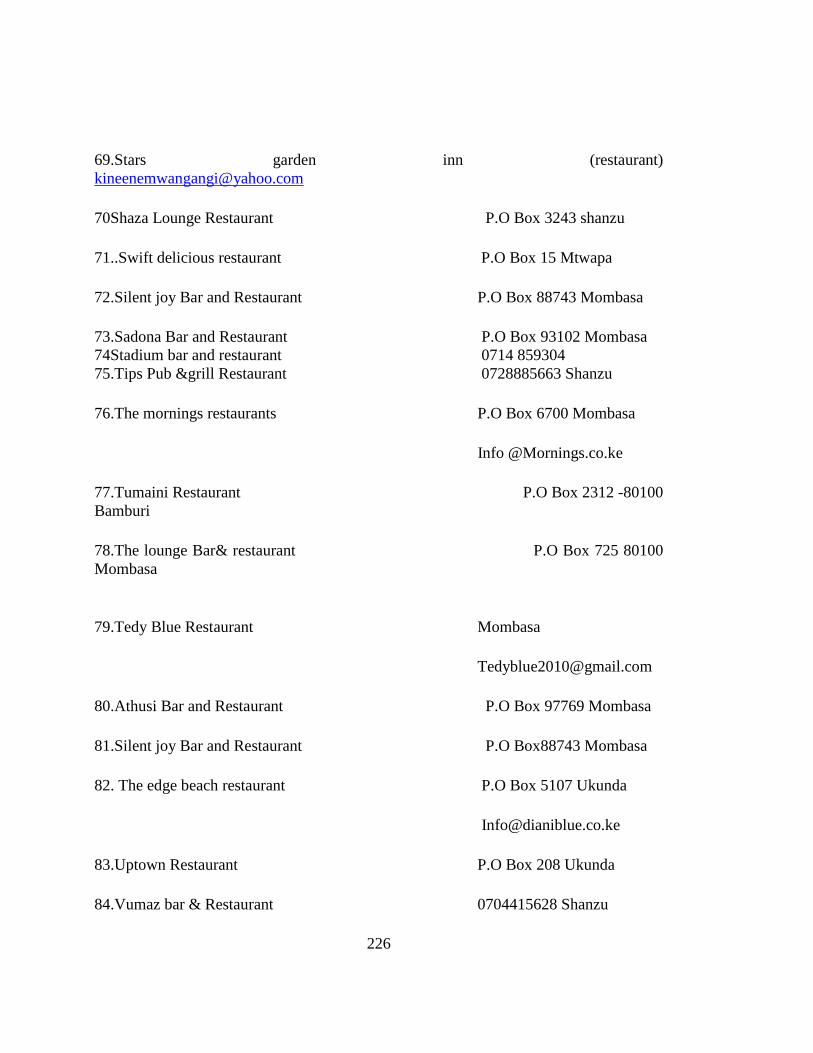
226
69.Stars garden inn (restaurant)
70Shaza Lounge Restaurant P.O Box 3243 shanzu
71..Swift delicious restaurant P.O Box 15 Mtwapa
72.Silent joy Bar and Restaurant P.O Box 88743 Mombasa
73.Sadona Bar and Restaurant P.O Box 93102 Mombasa
74Stadium bar and restaurant 0714 859304
75.Tips Pub &grill Restaurant 0728885663 Shanzu
76.The mornings restaurants P.O Box 6700 Mombasa
Info @Mornings.co.ke
77.Tumaini Restaurant P.O Box 2312 -80100
Bamburi
78.The lounge Bar& restaurant P.O Box 725 80100
Mombasa
79.Tedy Blue Restaurant Mombasa
80.Athusi Bar and Restaurant P.O Box 97769 Mombasa
81.Silent joy Bar and Restaurant P.O Box88743 Mombasa
82. The edge beach restaurant P.O Box 5107 Ukunda
83.Uptown Restaurant P.O Box 208 Ukunda
84.Vumaz bar & Restaurant 0704415628 Shanzu

227
Cave@alibarbours,co,ke
85.Wimby restaurant P.O Box 041
2229815Mombasa
86 Sadona Bar &Restaurant P.OBox 93102 Mombasa
87.Sonia Hotel& Restaurant P.O.Box 83573 Mombasa
.TOUR SAFARIS
1.Adventure Adrenalin Afrik LTD P.O Box 5638 Dian
2. African Safari Diani Adventure LTD P.O. Box 5664 Diani
3.Aquarium LTD P.O. Box 10286 Bamburi
4.Around & About African Safaris P.O. Box 16681 Mombasa
5. AL-Ubeid Agencies P.O. Box 2398 Mombasa
6.Aktive Safaris(tours) P.O Box 5769 Ukunda
Info@akitive safaris .com
7.Around the world Tours &Safaris P.O Box 85223 -80100
Mombasa
8.Across Africa Safaris P.O Box 82139-80100
Mombasa
9.Amani tours P.O Box 3216 Ukunda
10. African route safaris P.O Box 41112 Mombasa
11.Atlantis Travel international LTD P.O Box 1297 Mombasa
12.Big six Kenya safaris P.O Box 108-80400
Ukunda

228
13.Beach air tour safaris P.O Box 5017 Diani
14. Blue wines and spirits P.O Box 2412-80100
Mombasa
15 Bahari Tours & Safaris CO.LTD P.O Box 154 Ukunda
16.Big five safaris tours P.O Box184 Ukunda
17. Breeze tours& safaris P.O Box 3606 Mombasa
18. Bentes tours& safaris P.O Box 5293 Diani
19. Eastern vacations tour& safaris P.O Box 3243 Mombasa
20 Coastal car rentals P.O Box 99160 Mombasa
21. Chirat tours& safaris P.O Box 321 Ukunda
22 Coast Africa car rentals LTD P.O Box 99160 Mombasa
23. Cannon tours P.O Box 1695-80100
Mombasa
24.Coral sprit Tours LTD P.O Box 122 Ukunda
25. Coast prestige tours &safaris LTD P.O Box 90 237 Mombasa
26.Colorint Crab wasini P.O Box 5102 Diani
27.Diani tours & safaris P.O Box 5490-80401
Ukunda

229
28.Dliria tours P.O Box 309-80400 Ukunda
29. Destiny tours& travel P.O Box 1008 Mombasa
30.Diani tours and travels P.O Box 5102-80400 Ukunda
31.Destiny tours P.O Box 904-80400 Ukunda
32. Dominion holiday& safaris P.O Box 83177 Mombasa
33.Demetrus tours LTD P.O Box 81297 Mombasa
34Zinjanthropus safaris &adventures P.O Box 1539 Ukunda
35.Elgat tours and safaris P.O Box 43019 Mombasa
36. Explore Africa LTD P.O Box 5480 Dian
37.Evarest Africa safari P.O Box 43 426 Mombasa
38. East coast tours P.O Box 304-
80400,Ukunda
39. Eagle travel services P.O Box 80700 Mombasa
40. Eastern trails tour& safaris P.O Box 92682 Mombasa
41.Explore Africa safaris LTD P.O Box 5480 Diani
230
42. Fred link company LTD P.O Box8597Mombasa
44. Farmtech enterprise (tours & taxis) 0721122112 Kiembeni-
Bamburi
45. Fast town tours P.O Box 1105 80400
Ukunda
46.Farid Kings tours& safari P.O Box 99156 Mombasa
47.Fixus tour safaris P.O Box 907 97 Mombasa.
49. Fidex Car hire P.O Box 88068 Mombasa
50.Goafrica safaris & travel LTD P.O Box 5410
Diani51.Guide to 51.Africa safaris LTD P.O
Box 3206 Nyari
52.Gulf connections LTD P.O Box 87854 Mombasa
53. Gibran safaris LTD P.O Box1438 Ukunda
54.Global wild tours P.O Box 40161 Mombasa
55. Ikovio tours 0734046800 Ukunda
56..Islaners wines and spirit 0722531453 Vescon
Rehemamwabosa yahoo.om
47.
57.Impala safari lodge P.O Box 185 80300 Voi
231
58. Jean petit tours &safaris P.O Box 1511 Ukunda
59.Juletabi African adventure LTD P.O Box 442 Ukunda
60.Jonathan tours & safaris P.O Box 5648 Diani Beach
Ukunda
Info@Jonathan tours.Com
61. Kenya one tours LTD P.O Box 2831 Mombasa
62. Kuldips Tours 0733486494 Bamburi
63.Keittee tours and safaris P.O Box 490 Ukunda
64. Kenya real tours and safaris P.O Box 86683 Mombasa
65.Kenya wonders tours travel LTD P.O Box 10023 -80100
Mombasa
66.Lorika adventure P.O Box 99868 Mombasa
67.Monica tours and safaris Box 989 Ukunda
Info@monicatours,org
68 Milele tour guide 077528155 Serena beach
hotel
69. Marcapolo safaris .com P.O Box 733-80401 Dian
Beach
Inf@ marcapolo safaris.com
70.Mweca Travells tour safaris P.O Box 41231 Mombasa

232
72.Merab universal safaris P.O Box 80 357
Mombasa
73. Mafat travel LTD P.O Box 5100 Mombasa
74.Millele sunshine tours &safaris P.O Box 878 Mtwapa
75.Melmax tours P.O Box 41231ukunda
76.Mideast travel Kenya LTD P.O Box 85 830
77.Magot tour Africa LTD P.O Box 40178 Mombasa
78. Mombasa African safaris LTD P.O Box 10501 Bamburi
79. Noor Travel LTD P.O Box 81268 Mombasa
80. Nakim tours & safaris LTD P.O Box 43358 Mombasa
81. Netherken safaris &tours P. O Box 41987 Mombasa
82. Natural World Mombasa safaris P. O Box 89946 Mombasa
83.Neslo tours &safaris P.O Box 98 824 Mombasa
85.Nimbus tours& travel P.O Box 12395 Mombasa
84.Oliver tours LTD P.O Box 830 Ukunda
85.Oscapo (E.A) tours &safaris P.O Box 2297 Mombasa
86.Okologistic company LTD P.O Box 3199 Mombasa
87.Orange exclusive safaris LTD P.O Box 1679 Ukunda
233
88. Pwani tours safaris P.O Box 16568 Mombasa
89. Paola safaris P.O Box 5613 Diani
90..Pitia African tours P.O Box 105- 80400
Ukunda
91.Paws Africa safaris P.O Box 88540 Mombasa
93. Pradan Car hire P.O Box90448 Mombasa
95 Preasure ride tours &hire LTD P.O Box 262 Mmbasa
96.Park adventure tours safaris P.O Box 40693 Shanzu
97.Regal tours and safaris Ltd Mombasa
98.Rytheme tours P.O box 125-80400 Ukunda
99.Sand R.Safaris (tours) info @steveandrichard.com
100. Salama marinesafaris LTD P.O Box 1693 Ukunda
101. Sensational tours &safaris P.O Box 95826 Mombasa
102.Suluman tours and safaris P.O Box 972 Kilifi
103. South coast adventure &safaris P.O Box 1472 Diani
104 Sek Tours &safaris P.O Box 83035 Mombasa
105.Severine Air safaris LTD P.O Box90653 Mombasa
106. Satao Ele rai LTD P.O BOX 994456 Mombasa
107Sunflower safaris Mombasa LTD P.O Box 84853 Mombasa
108. Sunset Kenya tours& safaris P.O Box 42740 Mombasa
234
109. Sunbreak Tours7& safaris P.O Box 10533 Mombasa
110. Stemo tours safaris P.O Box 5706 Mombasa
111.Severine sea Lodge tours P.O Box 82169 Mombasa
112Smile Kenya tours &travel LTD P.O Box 288 mtwapa
113.Lafrika tours &safaris P.O Box 88540 Mombasa
114Shani tours &safaris P.O Box 1648 Ukunda
115.Tellus tours &safaris P.O Box 539 Ukunda
116.Tanke tours safaris P.O Box 5042-80400
Diani
117. Travel Africa safaris P.O Box 508
Mombasa
118. Stefan’s tours safaris P.O Box 85223
Mombasa
119.Tanke wild adventure tours &safaris P.O Box1446 Ukunda
120. Three Star tours &safaris P.O Box 191 Mtwapa
121. Tsavo tours& safaris P.O Box 99852
Mombasa
122.Travelnet tours safaris LTD P.O Box 93
954Mombasa
123.Trory coast wines &spirits P.O Box 3749-80100
Mombasa
124. Timken tours &travel P.O Box 100 Ukunda

235
125.Travel Africa safarisLTD P.O Box 508 Mombasa
126.. Tanke tours & safaris P.O Box 5769-80401
Ukunda
Info@ tanke tours.Com
Tyson Tours
127. Tanken tours & safaris P.O Box 5769-80401 Ukunda
Info@ tankentours.com
128.Trans African safaris P.O Box 87078 Mombasa
129.Unik car hire &safaris P.O Box 89200 Mombasa
130.Ukunda adventure tours &travel P.O BOX 786 Ukunda
131. Viva Kenya tours &travel LTD P.O Box 400 mtwapa
122.Vumbi jeep Safaris P.O Box 17 Ukunda
Info.@vumbijeep safaris.com
133Viwan tours & safaris P.O Box 97 992 Mombasa
134.Voyager tours P.O Box 405-80400
Ukunda
135. Wayland tours &safaris P.O Box 10066 Mombasa
136. Wildlife Bush adventures P.O Box 5356 Diani
137.Wilmarine tours and safari P.O Box 93 491Mombasa
138.White sands tours P.O Box 011-80100 Mombasa

236
139.WT Safaris P.O Box 5648-8040 Diani
140.Waisons safaris LTD P.O Box 93131 Mombasa
141.Xpedite solutions P.O Box 2335 Mombasa
142. Yuda tours &safaris P.O Box 1329 Ukunda
143.Zainabu tours & safaris P.O Box 98138 Mombasa
144. Zaras travel P.O Box 82018 Mombasa
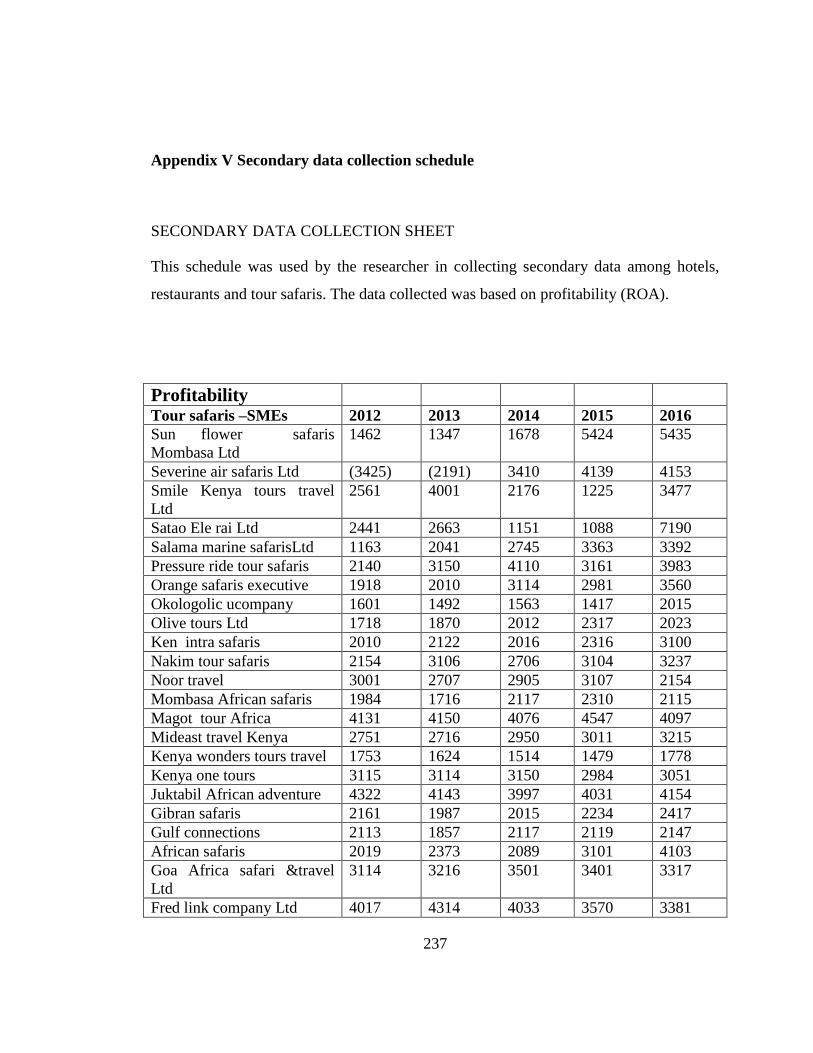
237
Appendix V Secondary data collection schedule
SECONDARY DATA COLLECTION SHEET
This schedule was used by the researcher in collecting secondary data among hotels,
restaurants and tour safaris. The data collected was based on profitability (ROA).
Profitability
Tour safaris –SMEs 2012 2013 2014 2015 2016
Sun flower safaris
Mombasa Ltd
1462 1347 1678 5424 5435
Severine air safaris Ltd (3425) (2191) 3410 4139 4153
Smile Kenya tours travel
Ltd
2561 4001 2176 1225 3477
Satao Ele rai Ltd 2441 2663 1151 1088 7190
Salama marine safarisLtd 1163 2041 2745 3363 3392
Pressure ride tour safaris 2140 3150 4110 3161 3983
Orange safaris executive 1918 2010 3114 2981 3560
Okologolic ucompany 1601 1492 1563 1417 2015
Olive tours Ltd 1718 1870 2012 2317 2023
Ken intra safaris 2010 2122 2016 2316 3100
Nakim tour safaris 2154 3106 2706 3104 3237
Noor travel 3001 2707 2905 3107 2154
Mombasa African safaris 1984 1716 2117 2310 2115
Magot tour Africa 4131 4150 4076 4547 4097
Mideast travel Kenya 2751 2716 2950 3011 3215
Kenya wonders tours travel 1753 1624 1514 1479 1778
Kenya one tours 3115 3114 3150 2984 3051
Juktabil African adventure 4322 4143 3997 4031 4154
Gibran safaris 2161 1987 2015 2234 2417
Gulf connections 2113 1857 2117 2119 2147
African safaris 2019 2373 2089 3101 4103
Goa Africa safari &travel
Ltd
3114 3216 3501 3401 3317
Fred link company Ltd 4017 4314 4033 3570 3381
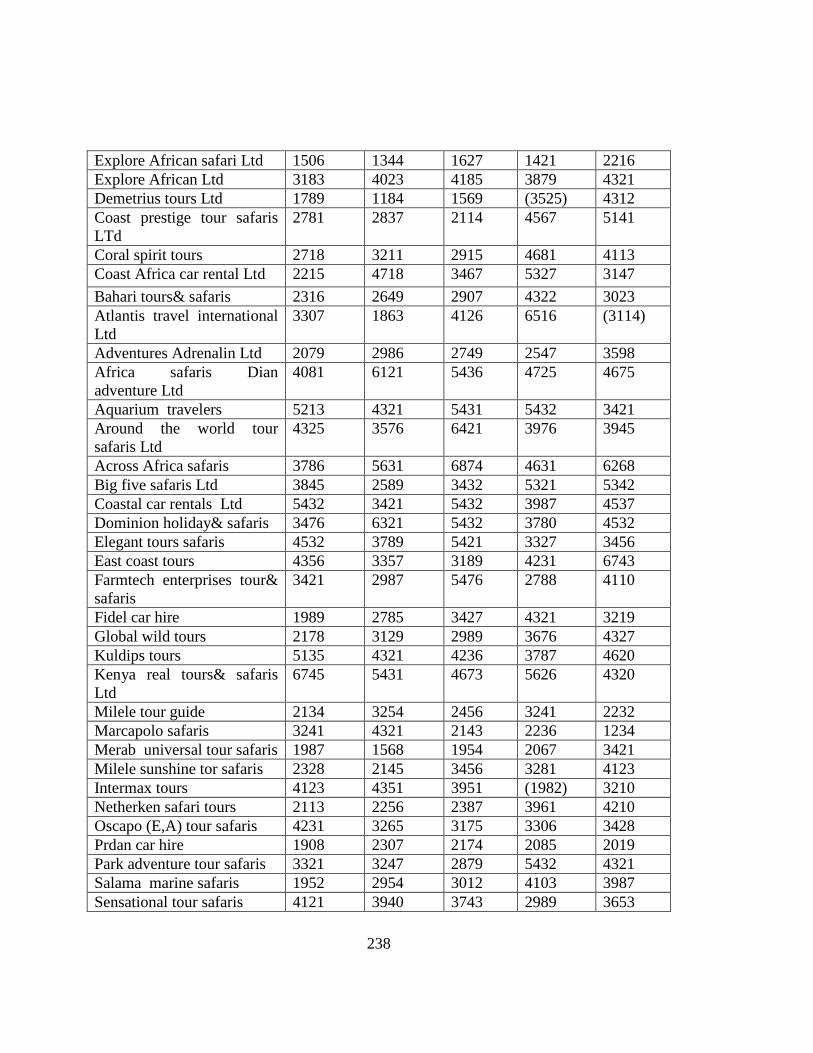
238
Explore African safari Ltd 1506 1344 1627 1421 2216
Explore African Ltd 3183 4023 4185 3879 4321
Demetrius tours Ltd 1789 1184 1569 (3525) 4312
Coast prestige tour safaris
LTd
2781 2837 2114 4567 5141
Coral spirit tours 2718 3211 2915 4681 4113
Coast Africa car rental Ltd 2215 4718 3467 5327 3147
Bahari tours& safaris 2316 2649 2907 4322 3023
Atlantis travel international
Ltd
3307 1863 4126 6516 (3114)
Adventures Adrenalin Ltd 2079 2986 2749 2547 3598
Africa safaris Dian
adventure Ltd
4081 6121 5436 4725 4675
Aquarium travelers 5213 4321 5431 5432 3421
Around the world tour
safaris Ltd
4325 3576 6421 3976 3945
Across Africa safaris 3786 5631 6874 4631 6268
Big five safaris Ltd 3845 2589 3432 5321 5342
Coastal car rentals Ltd 5432 3421 5432 3987 4537
Dominion holiday& safaris 3476 6321 5432 3780 4532
Elegant tours safaris 4532 3789 5421 3327 3456
East coast tours 4356 3357 3189 4231 6743
Farmtech enterprises tour&
safaris
3421 2987 5476 2788 4110
Fidel car hire 1989 2785 3427 4321 3219
Global wild tours 2178 3129 2989 3676 4327
Kuldips tours 5135 4321 4236 3787 4620
Kenya real tours& safaris
Ltd
6745 5431 4673 5626 4320
Milele tour guide 2134 3254 2456 3241 2232
Marcapolo safaris 3241 4321 2143 2236 1234
Merab universal tour safaris 1987 1568 1954 2067 3421
Milele sunshine tor safaris 2328 2145 3456 3281 4123
Intermax tours 4123 4351 3951 (1982) 3210
Netherken safari tours 2113 2256 2387 3961 4210
Oscapo (E,A) tour safaris 4231 3265 3175 3306 3428
Prdan car hire 1908 2307 2174 2085 2019
Park adventure tour safaris 3321 3247 2879 5432 4321
Salama marine safaris 1952 2954 3012 4103 3987
Sensational tour safaris 4121 3940 3743 2989 3653
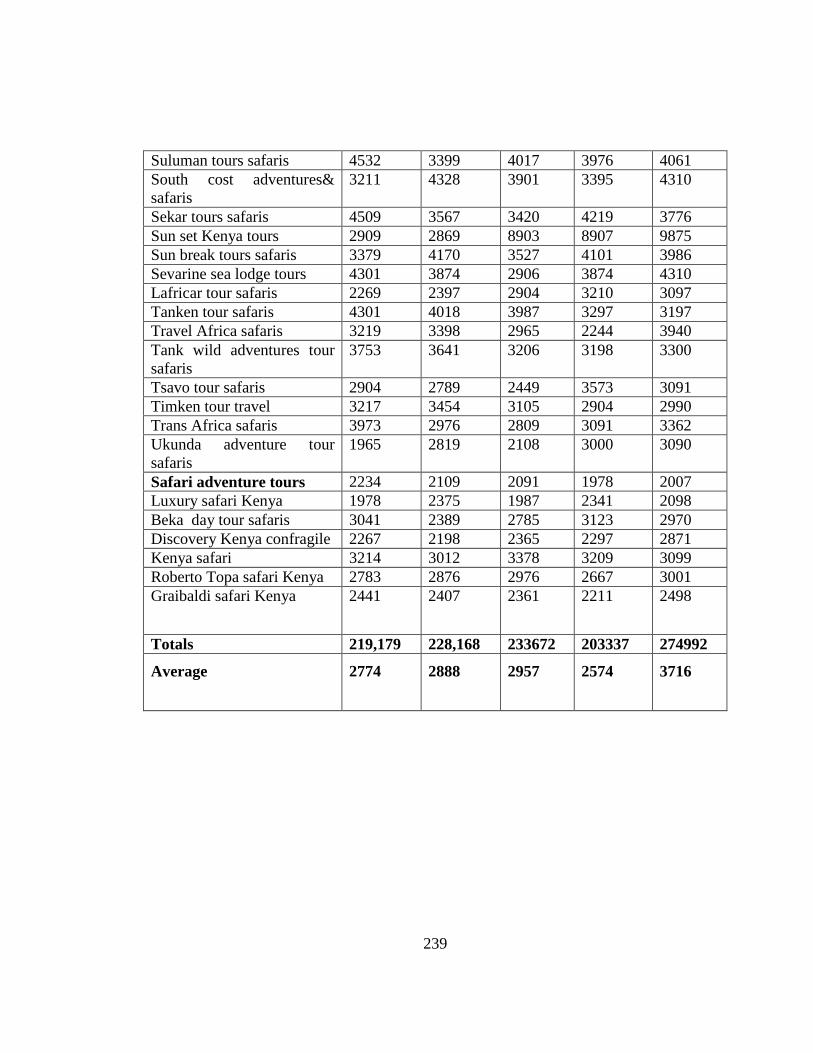
239
Suluman tours safaris 4532 3399 4017 3976 4061
South cost adventures&
safaris
3211 4328 3901 3395 4310
Sekar tours safaris 4509 3567 3420 4219 3776
Sun set Kenya tours 2909 2869 8903 8907 9875
Sun break tours safaris 3379 4170 3527 4101 3986
Sevarine sea lodge tours 4301 3874 2906 3874 4310
Lafricar tour safaris 2269 2397 2904 3210 3097
Tanken tour safaris 4301 4018 3987 3297 3197
Travel Africa safaris 3219 3398 2965 2244 3940
Tank wild adventures tour
safaris
3753 3641 3206 3198 3300
Tsavo tour safaris 2904 2789 2449 3573 3091
Timken tour travel 3217 3454 3105 2904 2990
Trans Africa safaris 3973 2976 2809 3091 3362
Ukunda adventure tour
safaris
1965 2819 2108 3000 3090
Safari adventure tours 2234 2109 2091 1978 2007
Luxury safari Kenya 1978 2375 1987 2341 2098
Beka day tour safaris 3041 2389 2785 3123 2970
Discovery Kenya confragile 2267 2198 2365 2297 2871
Kenya safari 3214 3012 3378 3209 3099
Roberto Topa safari Kenya 2783 2876 2976 2667 3001
Graibaldi safari Kenya 2441 2407 2361 2211 2498
Totals 219,179 228,168 233672 203337 274992
Average 2774 2888 2957 2574 3716
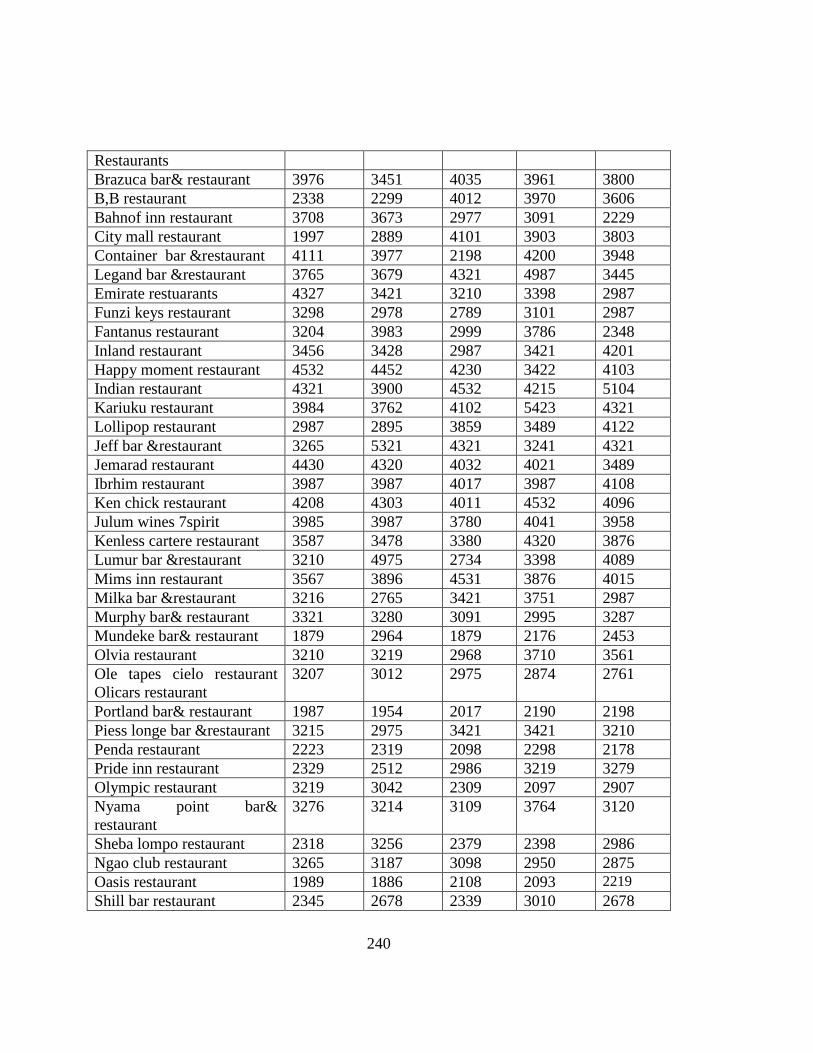
240
Restaurants
Brazuca bar& restaurant 3976 3451 4035 3961 3800
B,B restaurant 2338 2299 4012 3970 3606
Bahnof inn restaurant 3708 3673 2977 3091 2229
City mall restaurant 1997 2889 4101 3903 3803
Container bar &restaurant 4111 3977 2198 4200 3948
Legand bar &restaurant 3765 3679 4321 4987 3445
Emirate restuarants 4327 3421 3210 3398 2987
Funzi keys restaurant 3298 2978 2789 3101 2987
Fantanus restaurant 3204 3983 2999 3786 2348
Inland restaurant 3456 3428 2987 3421 4201
Happy moment restaurant 4532 4452 4230 3422 4103
Indian restaurant 4321 3900 4532 4215 5104
Kariuku restaurant 3984 3762 4102 5423 4321
Lollipop restaurant 2987 2895 3859 3489 4122
Jeff bar &restaurant 3265 5321 4321 3241 4321
Jemarad restaurant 4430 4320 4032 4021 3489
Ibrhim restaurant 3987 3987 4017 3987 4108
Ken chick restaurant 4208 4303 4011 4532 4096
Julum wines 7spirit 3985 3987 3780 4041 3958
Kenless cartere restaurant 3587 3478 3380 4320 3876
Lumur bar &restaurant 3210 4975 2734 3398 4089
Mims inn restaurant 3567 3896 4531 3876 4015
Milka bar &restaurant 3216 2765 3421 3751 2987
Murphy bar& restaurant 3321 3280 3091 2995 3287
Mundeke bar& restaurant 1879 2964 1879 2176 2453
Olvia restaurant 3210 3219 2968 3710 3561
Ole tapes cielo restaurant
Olicars restaurant
3207 3012 2975 2874 2761
Portland bar& restaurant 1987 1954 2017 2190 2198
Piess longe bar &restaurant 3215 2975 3421 3421 3210
Penda restaurant 2223 2319 2098 2298 2178
Pride inn restaurant 2329 2512 2986 3219 3279
Olympic restaurant 3219 3042 2309 2097 2907
Nyama point bar&
restaurant
3276 3214 3109 3764 3120
Sheba lompo restaurant 2318 3256 2379 2398 2986
Ngao club restaurant 3265 3187 3098 2950 2875
Oasis restaurant 1989 1886 2108 2093 2219
Shill bar restaurant 2345 2678 2339 3010 2678
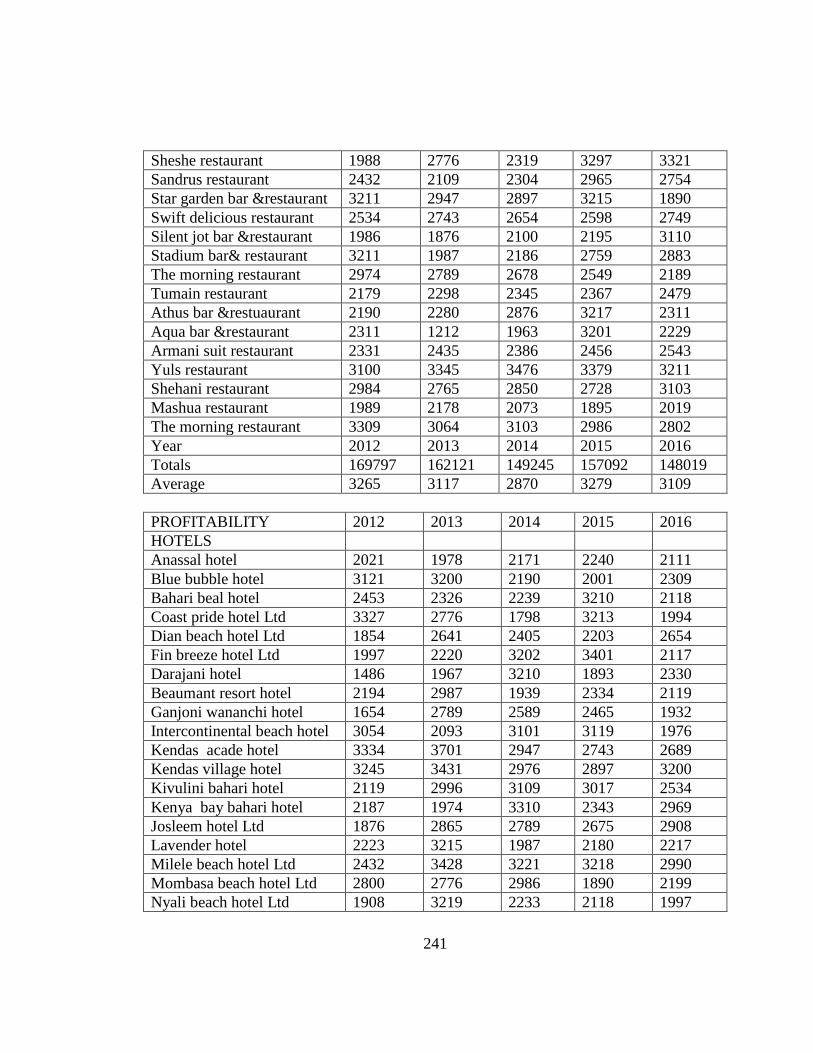
241
Sheshe restaurant 1988 2776 2319 3297 3321
Sandrus restaurant 2432 2109 2304 2965 2754
Star garden bar &restaurant 3211 2947 2897 3215 1890
Swift delicious restaurant 2534 2743 2654 2598 2749
Silent jot bar &restaurant 1986 1876 2100 2195 3110
Stadium bar& restaurant 3211 1987 2186 2759 2883
The morning restaurant 2974 2789 2678 2549 2189
Tumain restaurant 2179 2298 2345 2367 2479
Athus bar &restuaurant 2190 2280 2876 3217 2311
Aqua bar &restaurant 2311 1212 1963 3201 2229
Armani suit restaurant 2331 2435 2386 2456 2543
Yuls restaurant 3100 3345 3476 3379 3211
Shehani restaurant 2984 2765 2850 2728 3103
Mashua restaurant 1989 2178 2073 1895 2019
The morning restaurant 3309 3064 3103 2986 2802
Year 2012 2013 2014 2015 2016
Totals 169797 162121 149245 157092 148019
Average 3265 3117 2870 3279 3109
PROFITABILITY 2012 2013 2014 2015 2016
HOTELS
Anassal hotel 2021 1978 2171 2240 2111
Blue bubble hotel 3121 3200 2190 2001 2309
Bahari beal hotel 2453 2326 2239 3210 2118
Coast pride hotel Ltd 3327 2776 1798 3213 1994
Dian beach hotel Ltd 1854 2641 2405 2203 2654
Fin breeze hotel Ltd 1997 2220 3202 3401 2117
Darajani hotel 1486 1967 3210 1893 2330
Beaumant resort hotel 2194 2987 1939 2334 2119
Ganjoni wananchi hotel 1654 2789 2589 2465 1932
Intercontinental beach hotel 3054 2093 3101 3119 1976
Kendas acade hotel 3334 3701 2947 2743 2689
Kendas village hotel 3245 3431 2976 2897 3200
Kivulini bahari hotel 2119 2996 3109 3017 2534
Kenya bay bahari hotel 2187 1974 3310 2343 2969
Josleem hotel Ltd 1876 2865 2789 2675 2908
Lavender hotel 2223 3215 1987 2180 2217
Milele beach hotel Ltd 2432 3428 3221 3218 2990
Mombasa beach hotel Ltd 2800 2776 2986 1890 2199
Nyali beach hotel Ltd 1908 3219 2233 2118 1997
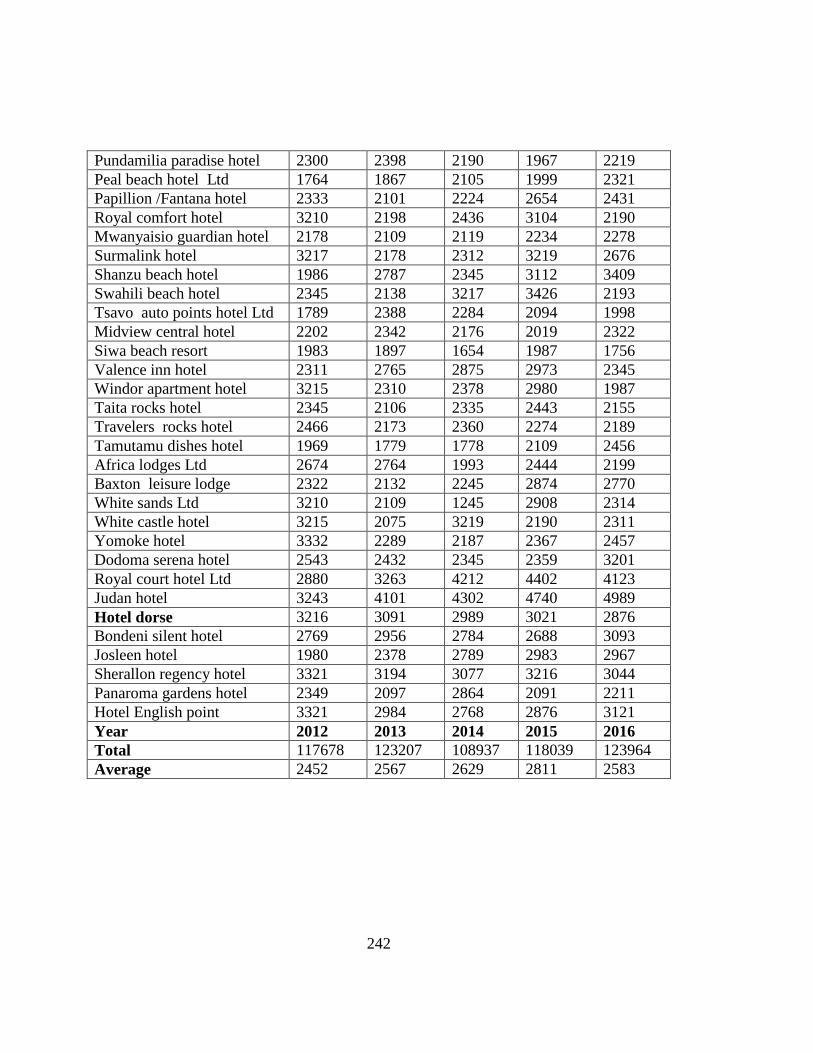
242
Pundamilia paradise hotel 2300 2398 2190 1967 2219
Peal beach hotel Ltd 1764 1867 2105 1999 2321
Papillion /Fantana hotel 2333 2101 2224 2654 2431
Royal comfort hotel 3210 2198 2436 3104 2190
Mwanyaisio guardian hotel 2178 2109 2119 2234 2278
Surmalink hotel 3217 2178 2312 3219 2676
Shanzu beach hotel 1986 2787 2345 3112 3409
Swahili beach hotel 2345 2138 3217 3426 2193
Tsavo auto points hotel Ltd 1789 2388 2284 2094 1998
Midview central hotel 2202 2342 2176 2019 2322
Siwa beach resort 1983 1897 1654 1987 1756
Valence inn hotel 2311 2765 2875 2973 2345
Windor apartment hotel 3215 2310 2378 2980 1987
Taita rocks hotel 2345 2106 2335 2443 2155
Travelers rocks hotel 2466 2173 2360 2274 2189
Tamutamu dishes hotel 1969 1779 1778 2109 2456
Africa lodges Ltd 2674 2764 1993 2444 2199
Baxton leisure lodge 2322 2132 2245 2874 2770
White sands Ltd 3210 2109 1245 2908 2314
White castle hotel 3215 2075 3219 2190 2311
Yomoke hotel 3332 2289 2187 2367 2457
Dodoma serena hotel 2543 2432 2345 2359 3201
Royal court hotel Ltd 2880 3263 4212 4402 4123
Judan hotel 3243 4101 4302 4740 4989
Hotel dorse 3216 3091 2989 3021 2876
Bondeni silent hotel 2769 2956 2784 2688 3093
Josleen hotel 1980 2378 2789 2983 2967
Sherallon regency hotel 3321 3194 3077 3216 3044
Panaroma gardens hotel 2349 2097 2864 2091 2211
Hotel English point 3321 2984 2768 2876 3121
Year 2012 2013 2014 2015 2016
Total 117678 123207 108937 118039 123964
Average 2452 2567 2629 2811 2583
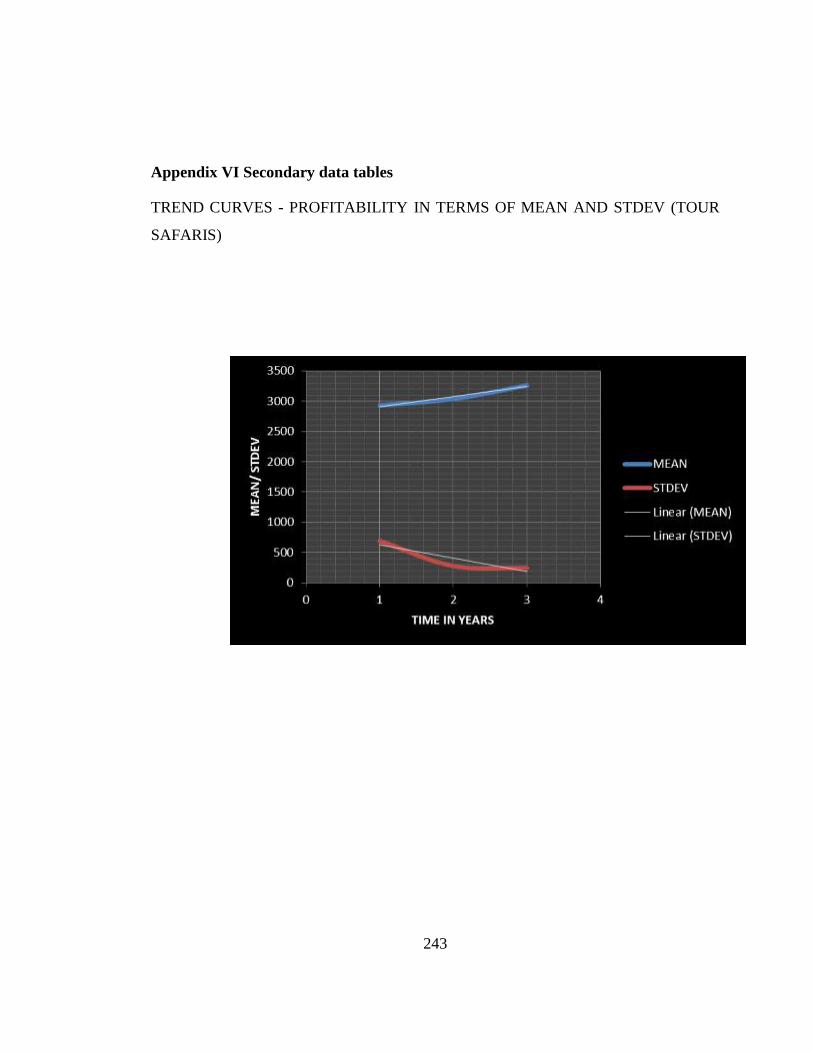
243
Appendix VI Secondary data tables
TREND CURVES - PROFITABILITY IN TERMS OF MEAN AND STDEV (TOUR
SAFARIS)
YEAR MEAN STDEV
YR1 2929.37 692.25
YR2 3035.83 278.6
YR3 3258.37 245.366
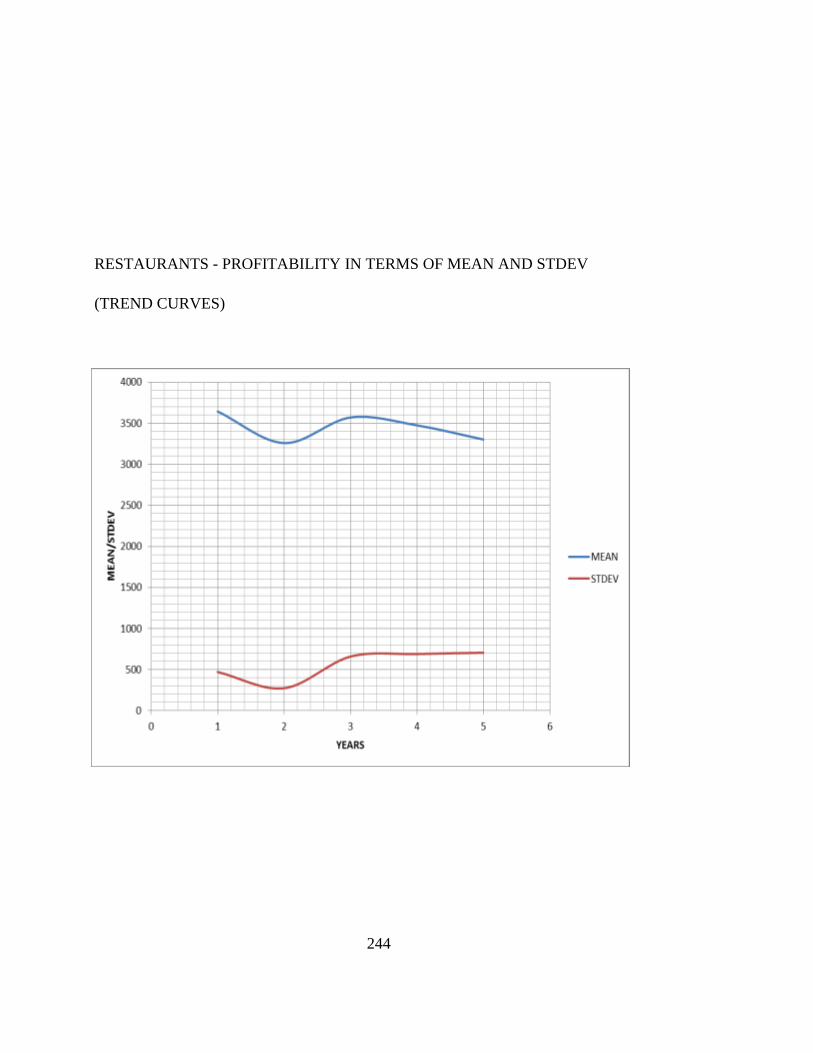
244
RESTAURANTS - PROFITABILITY IN TERMS OF MEAN AND STDEV
(TREND CURVES)
TREND CURVES -
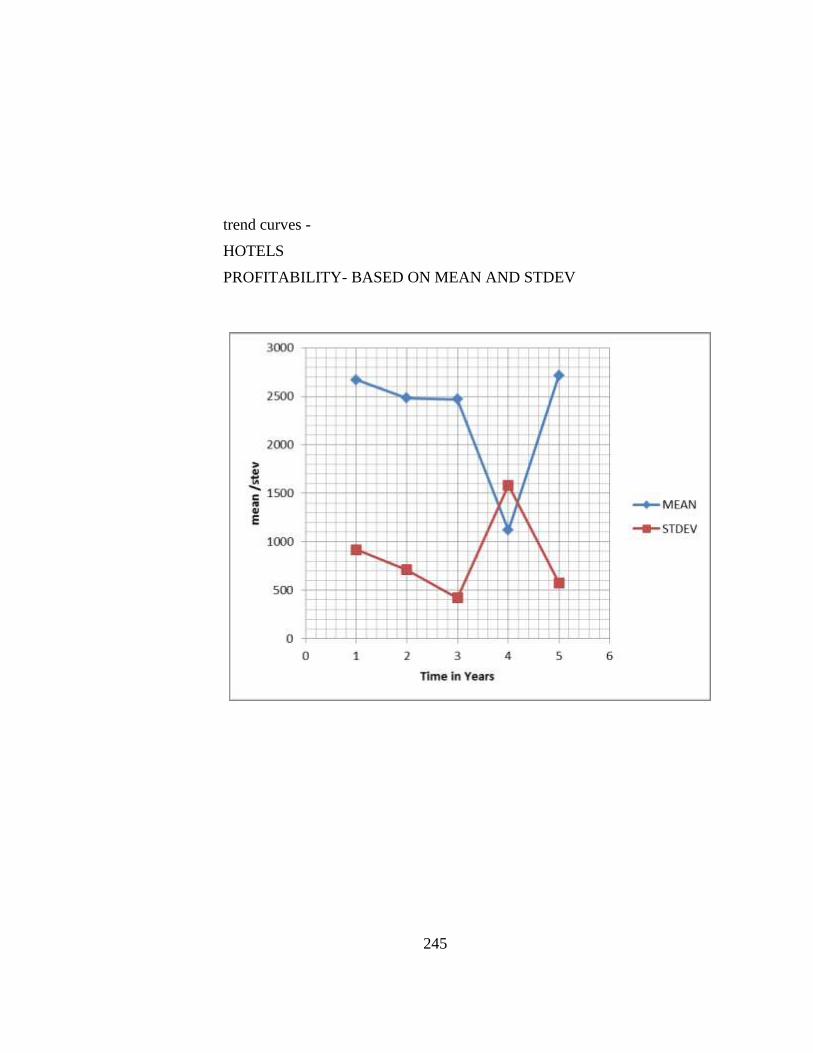
245
trend curves -
HOTELS
PROFITABILITY- BASED ON MEAN AND STDEV