Embed Size (px)
Citation preview

253
Dinarès-Turell, J., Pujalte, V., Stoykova, K. y Elorza, J. 2013. Detailed correlation and astronomical forcing within the Upper Maastrichtian succession in the Basque Basin. Boletín Geológico y Minero, 124 (2): 253-282ISSN: 0366-0176
Detailed correlation and astronomical forcing within the Upper Maastrichtian succession
in the Basque BasinJ. Dinarès-Turell(1), V. Pujalte(2), K. Stoykova(3) y J. Elorza(4)
(1) Istituto Nazionale di Geofisica e Vulcanologia, Via di Vigna Murata 605, I-00143 Rome, Italy(2) Department of Stratigraphy and Paleontology, Fac. Science and Technology, University of the Basque Country UPV/EHU,
PO Box 644, E-48080 Bilbao, Spain(3) Department of Paleontology and Stratigraphy, Geological Institute, Bulgarian Academy of Science, BG-1113 Sofia, Bulgaria
(4) Department of Mineralogy and Petrology, Fac. Science and Technology, University of the Basque Country UPV/EHU, PO Box 644, E-48080 Bilbao, Spain
ABSTRACT
We have undertaken a comprehensive, integrated, cyclo-magnetostratigraphic analysis and study of the cal-careous nannofossils of the Upper Maastrichtian hemipelagic succession in three sections of the Basque Basin (Zumaia, Sopelana and Hendaia). The sections were correlated at bed-by-bed scale through careful analysis of the lithological stacking pattern and significant sedimentary features. For spectral analysis we used an available high-resolution carbonate proxy record spanning 64 m of section below the K/Pg (Cretaceous/Palaeogene) boundary at Zumaia containing 72 precession-related limestone-marl couplets. The continuous wavelet spectrum helped to determine and visualize the orbital forcing at both the short (~100-ky) and long (405-ky) eccentricity band. We applied bandpass Gaussian filters to the carbonate record to extract the rel-evant periodicities and provide a cycle-numbering scheme starting at the K/Pg boundary. The full hierarchy of precession cycles and eccentricity-related bundles is then extended toward the base of the section in question, which contains a total of 33 short eccentricity-related bundles, thus spanning more than 3 Ma. The chron C31r/C31n boundary (estimated to occur at ~3.08 Ma below the K/Pg boundary) in the lower part of the succession was determined unambiguously in all three sections studied although the C30n/C29r reversal could not be determined due to a pervasive reverse magnetization acting on the purplish lithologies in the upper part of the succession. Relevant calcareous plankton bioevents could be accurately placed on the cyclo-magnetostrati-graphic template. The cyclostratigraphic framework also allowed us to estimate the duration of previously defined sea-level-related 3rd-order depositional sequences in the basin, which appear to be strongly paced by the long-term 1.2 My obliquity amplitude modulating cycle. This is an outstanding feature in the Maastrichtian greenhouse period, during which continental ice sheets are expected to be either ephemeral or non-existent. This is a matter that deserves further attention.
Key words: calcareous nannofossils, cyclostratigraphy, depositional sequences, Milankovitch, magnetostrati-graphy
Correlación detallada y control orbital de la sucesión del Maastrichtiense Superior de la Cuenca Vasca
RESUMEN
Se presenta un estudio exhaustivo ciclo-magnetostratigráfico y de nanofósiles calcáreos de tres secciones de la sucesión hemipelágica del Maastrichtiense Superior de la Cuenca Vasca (Zumaia, Sopelana y Hendaia). La correlación entre secciones se realiza capa a capa mediante un análisis minucioso del patrón del apilamiento litológico y detalles sedimentarios. Para el análisis espectral se utiliza un registro de carbonato de alta resolu-ción de un intervalo de 64 m debajo del límite K/Pg (Cretácico/Paleógeno), disponible en Zumaia, que contine 72 pares marga-caliza relacionados con el ciclo de precesión. El espectro continuo de ondas pequeñas ayuda a determinar y visualizar el control orbital en las bandas de la excentricidad corta (~100-ka) y larga (405-ka). Se han usado filtros gausianos pasabanda sobre el registro de carbonato para extraer las periodicidades relevan-tes y se aporta un esquema de numeración de ciclos que se inicia en el límite K/Pg. A continuación, la jerarquía

254
Dinarès-Turell, J. et al. 2013. Detailed correlation and astronomical forcing within the Upper… Boletín Geológico y Minero, 124 (2): 253-282
completa de ciclos de precesión y paquetes de la excentricidad se ha extendido hacia la base de la sucesión estudiada, que contiene un total de 33 paquetes relacionados con la excentricidad corta y en consecuencia una duración superior a los 3 Ma. El límite de cron C31r/C31n (posición estimada a ~3.08 Ma debajo del K/Pg) se ha determinado de forma inequívoca en la parte inferior de la sucesión en las tres secciones estudiadas, pero no ha sido posible determinar el límite de cron C30n/C29r debido a una remagnetización inversa gene-ralizada en las litologías rojizas de la parte superior de la sucesión. Los bioeventos relevantes del plankton calcáreo pueden posicionarse con precisión en el modelo ciclo-magnetostratigráfico. Además, la plantilla ciclostratigráfica permite estimar la duración de las secuencias deposicionales de 3er-orden relacionadas con variaciones del nivel del mar que han sido definidas con anterioridad en la cuenca, y que parecen gobernadas por el ciclo de 1.2 Ma de la oblicuidad de modulación de la amplitud. Esto representa un hecho destacado para el periodo invernadero del Maastrichtiense en el que se cree que los casquetes glaciares continentales fueron efímeros o no existentes, y es un aspecto que necesita ser estudiado con más profundidad.
Palabras clave: ciclostratigrafía, Milankovitch, magnetostratigrafía, nanofósiles calcareos, secuencias deposi-cionales
VERSION ABREVIADA EN CASTELLANO
Introducción y metodología
La correlación astronómica o “tuning” de secuencias que presentan ciclos litológicos con soluciones orbitales proporcionadas por los astrónomos ha conducido a una resolución y precisión sin precedentes en el registro geológico a lo largo de gran parte del Cenozoico. Para el Paleógeno, la correlación astronómica resulta com-plicada a pesar de la existencia de soluciones numéricas modernas para el Sistema Solar (Varadi et al., 2003; Laskar et al., 2004), debido a imprecisiones y limitaciones inherentes al comportamiento caótico del Sistema Solar y a un pobre control con edades radiométricas. Las sucesiones hemipelágicas paleocenas de la Cuenca Vasca han contribuido a un vivo debate sobre la extensión de la calibración astronómica para esta época que aún no ha sido resuelta satisfactoriamente (Dinarès-Turell et al., 2003, 2007, 2010, 2012; Westerhold et al., 2008, 2011; Kuiper et al., 2008; Hilgen et al., 2010). Los primeros intentos de correlación astronómica para el Cretácico considerando el límite K/Pg y algunos crones magnéticos se basaron en duraciones relativas (e.g. Herbert et al. 1995, Herbert, 1999). Solo recientemente el Maastrichtiense ha sido calibrado astronómicamente usando soluciones modernas (Husson et al., 2011; Thibault et al., 2012). En este trabajo presentamos el primer estudio detallado integrado ciclo- magnetostratigráfico y de nanofósiles calcáreos para la sucesión del Maas-trichtiense Superior de la Cuenca Vasca.
El Maastrichtiense de la Cuenca Vasca está expuesto en diferentes afloramientos a lo largo de la costa que han sido clásicamente estudiados principalmente por su contenido biostratigráfico (Fig. 1). El origen orbital de las alternancias marga-caliza también ha sido estudiado con anterioridad (Mount and Ward, 1986; Ten Kate and Sprenger, 1993). Recientemente un estudio integrado de plankton calcáreo y magnetostratigrafía ha sido publicado para la sección de Zumaia aunque no presenta un log litológico detallado ni se ha abordado la ci-clicidad (Pérez-Rodríguez et al., 2012). La mayor parte del Maastrichtiense de la Cuenca Vasca consiste en una alternancia de margas y carbonatos hemipelágicos, y en algunas secciones, turbiditas finas/medias (cm a dm de espesor). Atendiendo la proporción variable de esas litologías, se hizo una subdivisión litoestratigráfica formal en miembros (Miembros I a V de Ward, 1988; Ward y Kennedy, 1993) y una informal más detallada en unidades (unidades 2 a 12 de Wiedmann, 1988) (Fig. 2). Las variaciones litológicas de escala mayor a lo largo de la sucesión también han sido interpretadas por autores más recientes en términos de estratigrafía secuen-cial (Pujalte et al., 1995; Baceta et al., 2004), que han reconocido 3 secuencias deposicionales de 3er orden. En este trabajo las tres secuencias deposicionales se han renombrado de más antigua a más moderna como UMa-1, UMa-2 and Ma-Da respectivamente (Fig. 2).
Este trabajo se centra en el intervalo que comprende las unidades 6–12, que engloba el Maastrichtiense Superior, a lo largo de tres secciones (Zumaia, Sopelana I y Hendaia) (Fig. 1, Fig. 3). Un análisis cuidadoso en las secciones ha posibilitado una correlación capa a capa que ha permitido establecer una cronología astronómica para el intervalo estudiado. Un registro de carbonato de alta resolución para las unidades 10-12 en Zumaia (Ten Kate and Sprenger, 1993) se ha utilizado para nuevos análisis espectrales y determinar las periodicidades, las fases y la correlación astronómica correspondientes. La arquitectura deposicional y el contaje de los pares marga-caliza atribuidos a la precesión astronómica (~21 ka) y los ciclos de excentricidad (~100 ka) (grupos de 4–6 pares marga-caliza) se han establecido para todo el interval estudiado. El anclaje con la solución astronómica se ha basado en la presencia de los ciclos de excentricidad de 405 ka y la edad del límite K/Pg. Asimismo se ha realizado un estudio magnetostratigráfico para intervalos seleccionados en Zumaia y Sopelana I y hemos realizado un estudio de alta resolución de nanofósiles calcáreos en Sopelana I que no disponía de estos datos.

255
Dinarès-Turell, J. et al. 2013. Detailed correlation and astronomical forcing within the Upper… Boletín Geológico y Minero, 124 (2): 253-282
Para el estudio magnetostratigráfico se han seleccionado las partes relevantes en las diversas secciones estudiadas (Fig. 2). El muestreo se ha realizado a una resolución mínima de una muestra por par litológico e incluye la inversión del cron C30n/29r alrededor del límite de las unidades 11/12 en las secciones de Zumaia (16 capas), Sopelana I (43 capas) y Hendaia (9 capas), y la inversión C31r/C31n en la unidad 6 en Zumaia (33 capas), Sopelana I (13 capas) y Hendaia (10 capas). Para el estudio de los nanofósiles de la sección de Sopela-na I se han analizado 76 muestras desde el límite K/Pg hasta la parte inferior de la Unidad 6 (~67 m de espesor) y se ha adoptado el esquema de biozonas UC de Burnett (1998) (Fig. 4).
Resultados y discusión
A continuación se describen los resultados integrados para las secciones principales de Zumaia y Sopelana I en orden estratigráfico inverso siguiendo las unidades de Wiedmann (1988) y separadamente al final los resultados de la sección de Hendaia.
Las unidades 12–10 afloran en condiciones excepcionales en los acantilados de Punta Aitzgorri en Zumaia (Fig. 5). Se reconocen un total de 72 ciclos con un espesor aproximado de 0.9 m en el intervalo considerado. Un estudio previo de alta resolución sobre el registro de carbonato cálcico demostró que efectivamente los pares litológicos en el Maastrichtiense representan ciclos astronómicos de precisión de ~21-ka de duración. El registro de carbonato de Ten Kate and Sprenger ( 1993) se ha usado para extraer las periodicidades de los ci-clos de excentricidad corta (~100-ka) y larga (~405-ka) a través del análisis espectral. En el diagrama de Fourier standard se reconocen tres periodicidades (Fig. 6). Una banda con periodos de 0.7-0.95 m está asociada al par litólogico relacionado con la precesión. Un periodo a 4.1 m se relaciona con la excentricidad corta de 100-ka mientras que el periodo a 17 m se puede asociar a la excentricidad larga de 405-ka. La Figura 7a muestra los ciclos de precesión (ciclos Pk1 to Pk72) y la distribución de los ciclos de excentricidad corta y larga extraídos a partir de filtros gaussianos correspondientes. Los ciclos de 405-ka se han nombrado Ma4051, Ma4052 y Ma4053 mientras que los 17 ciclos de excentricidad de 100-ka deducidos a lo largo de las unidades 10–12 se han nom-brado E1-E17. El estudio magnetostratigráfico (Fig. 8) realizado en la Unidad 11 demuestra que las llitologías rojizas de este intervalo presentan una remagnetización compleja por lo que no es posible establecer la posi-ción de la inversión de crones C20n/C29r.
Los ciclos PK1 a PK72 también pueden distinguirse en la sección de Sopelana I tras resolver algunas fallas (Fig. 9). Los resultados magnetostratigráficos en la parte superior de la sección a lo largo de las unidades 12–10 indican que también existe una remagnetización generalizada (Fig. 10) por lo que no ha sido posible re-producir los resultados de estudios anteriores (Mary et al., 1991; Moreau et al. 1994). El estudio de nanofósiles de la sección de Sopelana indica que estos son abundantes y representados por asociaciones muy diversifi-cadas con una preservación de buena a muy buena (Plate I). Los bioeventos más importantes se representan en la Fig. 10 y la totalidad de los datos en la Tabla 1.
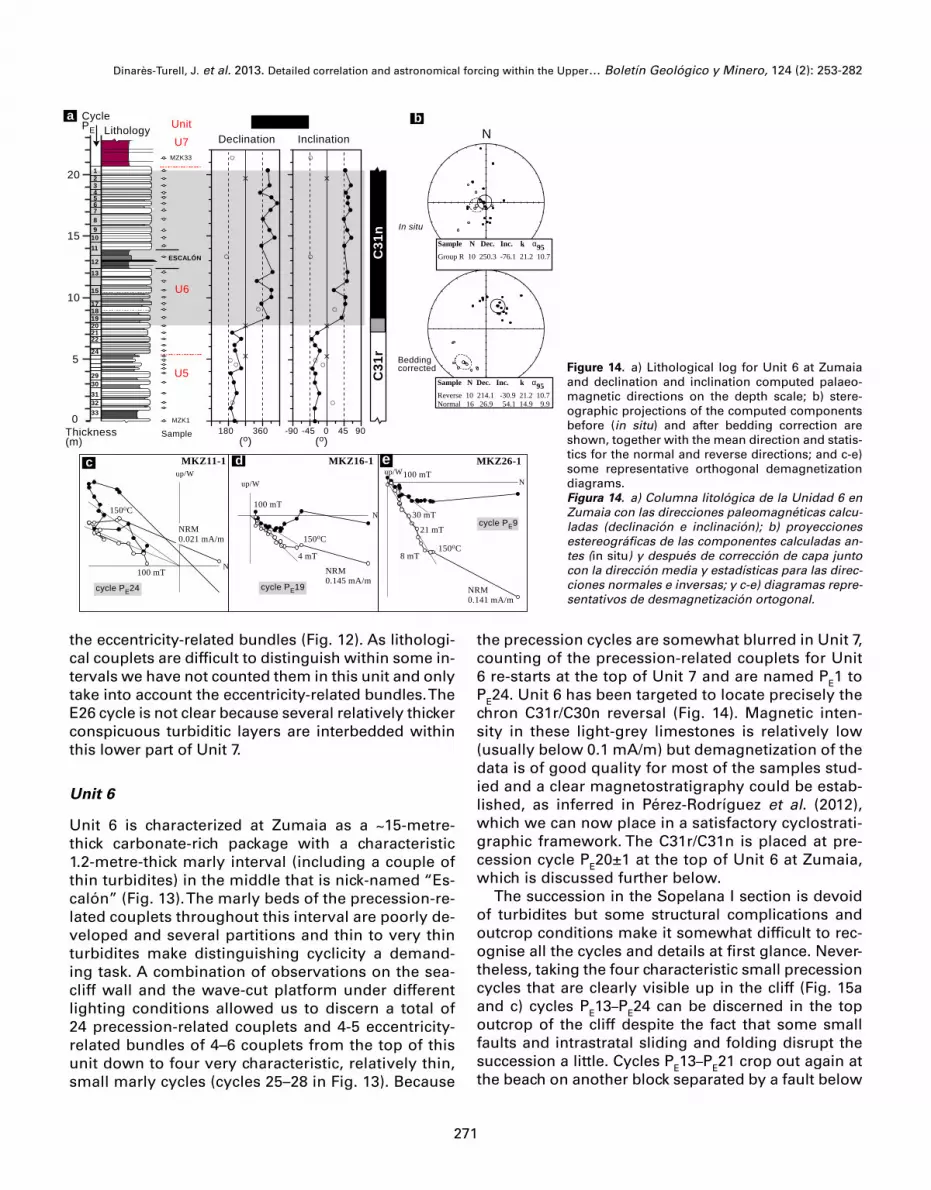
El contaje de ciclos para las unidades 9–8 es relativamente fácil. La Fig. 11 ilustra este intervalo en las secciones de Zumaia y Sopelana I. Se observan 32 pares litológicos (ciclos de precesión PK73 to PK104) que comprenden 6 ciclos relacionados con la excentriciadad nombrados E18 a E23.La Unidad 7 es relativamente margosa y está mejor expuesta en Zumaia (Fig. 12). La observación de los ciclos de excentricidad se realiza sin problemas aunque el ciclo E26 es menos claro. La Unidad 6 se caracteriza por un tramo carbonatado de unos 15 m de espesor con un intervalo margoso pronunciado de 1.2 m hacia la mitad que se ha denominado con el apelativo coloquial “Escalón” (Fig. 13). Aunque las capas margosas del par litológico no estén muy desarrollados se han podido contar 24 ciclos de precesión y 4-5 ciclos de excentricidad en la Unidad 6. El es-tudio magnetostratigráfico de esta unidad (Fig. 14) ha permitido localizar la inversión C31r/C30n en el ciclo de precisión PE20±1. En Sopelana I, también es posible observar los 24 pares litólogicos y localizar la inversión C31r/C30n aunque existe una falla que separa dos bloques (Fig. 15).
En Hendaia la sucesión del Cretácico Superior aflora a lo largo de la Pointe Sainte-Anne en diversos blo-ques separados por fallas (Fig. 16) y se han podido distinguir todas las unidades litológicas 6–12. El estudio magnetostratigráfico en las unidades 11–12 indica una magnetización secundaria que no permite establecer la magnetostratigrafia al igual que en Zumaia y Sopelana (Fig. 17). En cambio, la Unidad 6 que se ha estu-diado en las secciones denominadas Hendaia E y Hendaia W (Fig. 18 y 19) permite observar y contar sin am-bigüedades los ciclos de precesión de esta unidad y confirmar la localización de la inversión C31r/C31n.
El límite de cron C31r/C31n (posición estimada a ~3.08 Ma debajo del K/Pg) se ha determinado de forma inequívoca en la parte inferior de la sucesión en las tres secciones estudiadas, pero no ha sido posible deter-minar el límite de cron C30n/C29r debido a una remagnetización inversa generalizada en las litologías rojizas de la parte superior de la sucesión. Los bioeventos relevantes del plankton calcáreo pueden posicionarse con precisión en el modelo ciclo-magnetostratigráfico. Además, la plantilla ciclostratigráfica (Fig. 20) permite esti-mar la duración de las secuencias deposicionales de 3er-orden relacionadas con variaciones del nivel del mar que han sido definidas con anterioridad en la cuenca, y que parecen gobernadas por el ciclo de 1.2 Ma de la oblicuidad de modulación de la amplitud.

Dinarès-Turell, J. et al. 2013. Detailed correlation and astronomical forcing within the Upper… Boletín Geológico y Minero, 124 (2): 253-282
Introduction
The study of rhythmic sedimentary successions from deep-sea records and on-land outcrops, where a full hi-erarchy of cyclic stacking patterns has been shown to have originated from astronomical climate forcing on the sedimentary depositional environment, has been central to the development of the modern Geological Time Scale. Astronomical tuning of these sequences to accurate orbital solutions provided by astronomers has led to unprecedented accuracy, resolution and stability in the geological record throughout the earliest part of the Cenozoic, which has benefited from methodological enhancements and improved astronomical models in recent years. Milankovitch climate cyclicity tied to mag-netic polarity stratigraphy is the backbone of the recent geological past (Kent, 1999). A notable achievement of this integrated effort was the completion of an astro-nomical time scale for the Neogene (Astronomically Tuned Neogene Time Scale, ATNTS2004; Lourens et al., 2004), which was incorporated into the GTS2004 Geo-logical Time Scale (Gradstein et al., 2004). Tuning the Palaeogene has become more challenging despite new complete numerical solutions for the solar system (Var-adi et al., 2003; Laskar et al., 2004) due to uncertainties and limitations inherent to the chaotic behaviour of the solar system and poor radiometric age control. The Pa-laeocene hemipelagic successions in the Basque Basin, in particular at Zumaia, has contributed to a heated de-bate as to the extent of the astronomical time scale for this epoch (Dinarès-Turell, et al., 2003, 2007, 2010, 2012; Westerhold et al., 2008; Kuiper et al., 2008; Hilgen et al., 2010), which is still not fully resolved. This is mainly due to the existence of the so-called Eocene gap in the astro-
nomical time scale, implying that different options had to be proposed for the Palaeocene, the inconsistencies in cycle recognition through the studied records (Hilgen et al., 2010) and the limitations of the orbital solutions. Recent efforts on cyclic deep-sea records (Westerhold et al., 2012) have shed some controversial light on the calibration of the early Palaeogene. In any case it has become clear that very long geological records are needed to overcome some of the limitations inherent in astronomical solutions for geological time intervals older than ~54 Ma, which could potentially provide cru-cial information for astronomers. Previous attempts to arrive at orbital correlations between Cretaceous suc-cessions linked to a time framework including the K/Pg boundary and some magnetic chrons have focused mostly on elapsed time (cf. Herbert et al. 1995; Herbert, 1999). Only recently has the entire Maastrichtian been tuned to modern astronomical solutions (Husson et al., 2011, Thibault et al., 2012) from the evidence of deep-sea records. We offer here the results of a first comprehen-sive integrated cyclo- and magnetostratigraphic analy-sis and study of the calcareous nannofossils within the Upper Maastrichtian succession in the Basque Basin.
Materials and Methods
Studied sections and previous works
The Basque Basin was a deep-water interplate trough (flysch trough) flanked by shallow shelf areas to the north (Aquitania), south (Iberia) and east, and open-ing westward into the Bay of Biscay (Fig. 1). Through-out the Late Maastrichtian and Palaeocene the sea
Figure 1. Simplified geological map show-ing the location of the sections studied in the Basque Basin. The inset is a palaeogeo-graphic sketch of the Pyrenean area show-ing the distribution of the different depo-sitional settings during the Maastrichtian (modified from Plaziat, 1981).Figura 1. Mapa geológico simplificado que muestra la ubicación de las secciones estu-diadas en la Cuenca Vasca. El recuadro es un bosquejo paleogeográfico de la zona pirenaica, mostrando la distribución de los ambientes deposicionales durante el Maas-trichtiense (modificado de Plaziat, 1981).
v
vv v v v
v
vvv
v v
v
vv
0 10 20 km
Paleogene
Upper Cretaceous
Triassic-Lower Cretaceous
Paleozoic
Bilbao
Gernika
Hendaia
S. Sebastian
BidartB a y o f B i s c a y
Zumaia
Sopelana
N
Bilbao Pau
Bordeaux
Sopelana
ZumaiaHendaiaBidart
Present daycoastline
Pamplona
N
200 km
Deep basinMarine platform Alluvial
Marine platform emerged during Late Maastrichtian
Sopelana I
Zumaia
Hendaia
studied section

257
Dinarès-Turell, J. et al. 2013. Detailed correlation and astronomical forcing within the Upper… Boletín Geológico y Minero, 124 (2): 253-282
transgressed the shallow flanking areas, leading to the development of extensive ramps, or carbonate platforms (Plaziat, 1981; Pujalte et al., 1994; Baceta et al., 2004). This wholesale transgression also made it difficult for coarse-grained siliciclastic deposits to reach the deep trough, which became the site of a hemipelagic limestone/marl type of sedimentation, with turbidites being mainly restricted to the base of the slope area (Fig. 1).
The Maastrichtian succession from the Basque Ba-sin crops out best along different coastal exposures (i.e. Zumaia and Sopelana, separated by about 70 km ), which have usually been studied mainly for their biostratigraphic content, such as ammonites, inocer-amids and calcareous plankton (Herm, 1963; Lamolda, 1985; Ward et al., 1986, 1991; Wiedmann, 1988; Ma-cLeod and Orr, 1993; Ward and Kennedy, 1993; Burnett et al., 1992; MacLeod, 1994; Lamolda and Gorostidi, 1994; von Hillebrandt, 1965; Arz and Molina, 2002). Other studies include carbon and oxygen stable iso-topes (Mount and Ward, 1986; Gómez-Alday et al., 2004, 2008; Paul and Lamolda, 2007). The orbital origin of the limestone/marl alternations has also been ex-plored (Mount and Ward, 1986; Ten Kate and Sprenger, 1993). Magnetostratigraphy for the Upper Maastrich-tian had only been published for the Sopelana section (Mary et al., 1991). More recently a multidisciplinary calcareous plankton and magnetostratigraphic study of the Maastrichtian in the Zumaia section was un-dertaken (Pérez-Rodríguez et al., 2012) but no detailed lithological log or cycle counting was provided.
The bulk of the Maastrichtian strata correspond to the Zumaia-Algorri Formation (Mathey, 1982) and consist of alternations of hemipelagic limestones and marls and subordinate clay-shales, and in some sec-tions thin- to medium-bedded (cm to dm thick) tur-bidites. On the basis of the varying proportions of these lithologies, a lithostratigraphic subdivision into formal members (Member I to V of Ward, 1988; Ward and Kennedy, 1993) and more detailed informal litho-logical units (Units 2 to 12 of Wiedmann, 1988) have been commonly used (Fig. 2). These lithological units can generally be recognised in widely separate sec-tions, from Sopelana in the west to Bidart in the east (Fig. 1), although individual unit thickness, rock colour and number and the thicknesses of the turbidite beds are variable. At about 240 m the Maastrichtian succes-sion at Zumaia is the thickest (Fig. 2) and can be taken as representative. The oldest member corresponds to pale-grey, limestone-marl alternations (Member I) and has been subdivided into 4 units (Units 2 to 5) based on their relative carbonate content, thickness and frequency of turbidite beds, and overall erosion expression in the field. Member II (Unit 6) is domi-
nated by pale limestones containing a conspicuously darker metre-scale marl bed in the middle that has been colloquially termed “Escalón” (= step or inden-tation). According to the most recent study of the integrated calcareous nannoplankton and magneto-stratigraphic in the Zumaia section (Pérez-Rodríguez et al., 2012) the Lower/Upper Maastrichtian boundary interval is located in Unit 6. Member II is overlain by a marlstone unit (Member III), distinctive because of its reddish to chocolate-brown colour. The overlying unit (Member IV) is formed by limestone-marlstone rhyth-mites and is subdivided into 4 subunits: relatively car-bonate-rich pale gray Units 8-9, followed by reddish marly-rich Unit 10 and relatively carbonate-rich Unit 11. The last Maastrichtian Member (V) is a deep-pur-plish marly unit (Unit 12). Later authors interpreted these large-scale alternations in terms of sequence stratigraphy, recognizing 3 successive 3rd-order depo-sitional sequences in the upper Maastrichtian-lowest Danian interval (Fig. 2). Thus, Pujalte et al. (1995), on the basis of the classic model of Posamentier and Vail (1988), attributed the marl-dominated units to the low-stand fan system tract (LSF) and the limestone-marl rhythmic units to the low-stand wedge and high-stand system tracts (LSW + HST) within the 3rd-order deposi-tional sequence (DS-1, DS-2.1 and DS-2.2, from older to younger). Baceta et al. (2004), although agreeing in their characterization, renamed these sequences Ma-1, Ma-2 and Ma-Da and, following a more conser-vative approach, did not subdivide them into system tracts. We have renamed these sequences, inverting the numbering (UMa-2, UMa-1 and UMa-Da, from older to younger), thus allowing for potential exten-sion into older ages and trying to reconcile previous interpretations by simply using low- and high-stand system tracts (Fig. 2). Despite the different terminol-ogy the rationale for both interpretations is similar. In brief, marl-dominated units were assigned to periods of relatively low sea-level, based upon the argument that during these intervals the shoreline would be nearer, making it easier for fine-grained clastic depos-its to reach the deep basin (see Units 7, 10 and 12 in Fig. 2). Conversely, a high sea-level would hinder the arrival of clastic sediments and facilitate the accumu-lation of the hemipelagic limestones that characterize Units 9-8, and 11, and also the lower part of the Da-nian succession (Fig. 2).
In this study we have focused on the interval com-prising Units 6 to 12, which encompass 3 sections of the Upper Maastrichtian: Zumaia, Sopelana I, and Hen-daia (Fig. 1). The Upper Maastrichtian Zumaia (base of section 43o17’56.31”N/2o16’09.03”W) and the Sopelana I (base 43o23’19.06”N/2o59’39.29”W) coastal-cliff sec-tions constitute the primary sections studied (Fig. 3).

258
Dinarès-Turell, J. et al. 2013. Detailed correlation and astronomical forcing within the Upper… Boletín Geológico y Minero, 124 (2): 253-282
The Upper Maastrichtian at Zumaia (Units 6–12, ~150 m) is comprised of limestone-marl alternations, in-cluding hundreds of thinly bedded turbidites. The Up-per Maastrichtian succession at Sopelana I (~70 m) has the advantage that it lacks interbedded turbidites. This succession is, on the other hand, relatively tecton-ized and not straightforward to follow in detail at first glance, despite the fact that main lithological units can be identified (Fig. 3b). Nevertheless, careful observa-tions and resolution of some complex faults lead to a proper recognition and a bed-by-bed correlation with the precession cycles identified at Zumaia (see below). Zumaia, besides being the thickest section, represents a key area in the stratigraphic analysis of the Upper
Cretaceous and Palaeocene. Extensive, integrated, high-resolution chronostratigraphic studies, including astronomical tuning, have been undertaken for the Pa-laeocene part (Dinarès-Turell et al., 2002, 2003, 2007, 2010, 2012; Kuiper et al., 2008) and the section hosts the two internal Palaeocene Global Standards Section and Points (GSSPs) at the base of the Thanetian and Selan-dian stages (Schmitz et al., 2011) and an auxiliary K/Pg boundary (Molina et al., 2009). Moreover, a high-res-olution carbonate record for the Upper Maastrichtian Units 10–12 had been published previously and analy-sed for astronomical purposes (Ten Kate and Sprenger, 1993). Therefore it seemed rational to extend the as-tronomical observations to older ages and potentially
Figure 2. Synthetic stratigraphic log of the Maastrichtian succession (based on the Zumaia section) in the Basque Basin. The lithological Units U5–U12 of Wiedmann (1988) and Members I–V of Ward (1988) are indicated. The most recent calcareous plankton biostratigraphy and magnetostratigraphic results at Zumaia are depicted (Pérez-Rodríguez et al., 2012).Figura 2. Columna estratigráfica sintética de la sucesión Maastrichtiense (basada en la sección de Zumaia) en la Cuenca Vasca. Se indican las unidades litológicas U5–U12 de Wiedmann (1988) y los miembros I–V de Ward (1988). Se representan los resultados biostratigráficos publicados más recientes de plancton calcáreo y magnetostratigrafía de Zumaia (Pérez-Rodríguez et al., 2012).
12
11
10
9
8
7
6
5
4
3
2
V
IV
III
II
I
LOW
ER
MA
AS
TRIC
HTI
AN
U. CAMP.
Lith
o.un
itM
embe
rS
ubst
age
FAULT
Thic
knes
s(m
)
P.ha
riae
nsis
A.m
ayar
oens
is
R.fruct.
P.ac
ervu
linoi
des
P.pa
lpeb
raR.
rotu
ndat
a
R.sc
otti
C.c
ontu
saR.
pove
lliP.
inte
rmed
ia
Pla
nkto
nic
fora
min
ifera
K/Pgboundary
turbidite
UMa-1
HST
LST
Ma-Da
HST
LST
HST
LST
UMa-2
Depositionalsequences
UMa-3 ?
UC20dTP
UC20cTP
UC20bTP
UC20aTP
UC19
UC18UC17UC16
UC15eTP?
M. prinsii
M. kamptneri
M. murus
L. quadratus
Petrarhabdus spp.
A. maastrichtiana
C. echinusR. levisZ. bicrescentricusA. scotusT. orionatusB.p. constricta
E. eximius &?U. trifidus
Mag
netic
pola
rity
Cal
care
ous
nann
ofos
ils
C31
rCC
3311nn
noda
tano
data
remagnetizedreverse polarity
240
220
200
180
160
140
120
100
80
60
40
20
0
BOTO
limestone-marllimestone
greyred marl grey
reddish LST: low-stand system tractHST: high-stand system tract
Lithology
Zum
aia
spec
tral
anal
ysis
Sope
lana
Inan
nofo
ssils
“ESCALÓN”
Mag
neto
stra
tigra
phy
Zum
aia
Sope
lana
IH
enda
ia
Zum
aia
Sope
lana
IH
enda
ia
STU
DIE
D IN
TER
VAL
UP
PE
R M
AA
STR
ICH
TIA
N

259
Dinarès-Turell, J. et al. 2013. Detailed correlation and astronomical forcing within the Upper… Boletín Geológico y Minero, 124 (2): 253-282
achieve a long, complete astronomical tuning from land-based sections comprising the Maastrichtian that has also recently been astronomically tuned from deep-sea records (Husson et al., 2011, Thibault et al., 2012). We used the bulk carbonate record from Units 10 to 12 at Zumaia taken from Ten Kate and Sprenger (1993) to conduct a new spectral analysis. Magnetostratigraphic data from Zumaia had not been available until recently, but with limited success due to a pervasive remagne-tization in the reddish lithologies (Pérez-Rodríguez et al., 2012), whereas an apparent reasonable magneto-stratigraphy down to chron C31r had been established in the Sopelana I section (Mary et al., 1991), although complex magnetization mechanisms were invoked for the section (Moreau et al., 1994). Consequently we un-dertook a palaeomagnetic study at Sopelana I and Zu-maia to reproduce the earlier magnetostratigraphy on a suitable cyclostratigraphic framework. Furthermore, we have produced an extensive, high-resolution, cal-careous nannofossil biostratigraphy for the first time throughout the Sopelana I section.
We also explored other Upper Maastrichtian sec-tions at Hendaia that present certain lithological peculiarities. After recognising the standard litho-
logical units and identifying the cycles we targeted relevant intervals within the Maastrichtian outcrops along the coastal-cliffs of Pointe Sainte-Anne near Hendaia for magnetostratigraphic purposes. Three nearby outcrops were examined: the Hendaia E section (3o22’56.36”N/0o45’16.97”W) for the C31r/C31n reversal in Unit 6 and the Hendaia N section (43o23’03.00”N/1o45’09.64”) for the chron C30n/C29r reversal close to the contact between Units 11 and 12. Some additional observations were made in Unit 6 in the Hendaia W outcrop.
Magnetostratigraphy
Hand-samples for palaeomagnetic analysis where tak-en and oriented in situ with a magnetic compass before cutting standard cubic specimens in the laboratory for analysis. We aimed at a high-resolution chronostrati-graphic framework so sampling was done at a litho-logical couplet level (~21 ky resolution). Only relevant intervals within the studied sections were sampled for magnetostratigraphic purposes. These included the chron C30n/29r reversal around the boundary of Units
Figure 3. Panoramic views of the Upper Maastrichtian strata from the coastal-cliff exposures at Zumaia (a) and Sopelana I (b). The lithologi-cal units of Wiedmann (1988) and the location of several figures are indicated.Figura 3. Vistas panorámicas de la sucesión del Maastrichtiense Superior en los acantilados costeros de Zumaia (a) y Sopelana (b). Se indican las unidades litológicas de Wiedmann (1988) y la ubicación de varias figuras.
U10U11U12
DANIAN UPPER MAASTRICHTIAN
U8U7
K/Pgboundary
U6U5
ESCA
LÓN
Fig. 5 Fig. 12Fig. 11d
Fig. 14
Sopelana I
Zumaiaa
b K/PgUPPER MAASTRICHTIAN
U12U11
U10
U10
U10U8-9U7U6
U7U6
U5
Fig. 15a Fig. 11a-c
boundary DANIANFig. 9b
U9
Fig. 9a

260
Dinarès-Turell, J. et al. 2013. Detailed correlation and astronomical forcing within the Upper… Boletín Geológico y Minero, 124 (2): 253-282
11/12 at Zumaia (16 beds), Sopelana I (43 beds) and Hendaia (9 beds), and the C31r/C31n reversal in Unit 6 at Zumaia (33 beds), Sopelana I (13 beds) and Hendaia (10 beds). Natural remanent magnetization (NRM) and remanence through demagnetization were measured on a 2G Enterprises DC SQUID high-resolution pass-through cryogenic magnetometer (manufacturer noise level of 10-12 Am2) operated in a shielded room at the Istituto Nazionale di Geofisica e Vulcanologia in Rome, Italy. A Pyrox oven in the shielded room was used for thermal demagnetization and alternating field (AF) de-magnetization was done with three orthogonal coils installed in line with the cryogenic magnetometer. Pro-gressive stepwise AF demagnetization was routinely used and applied after a single heating step to 150°C. AF demagnetization included 14 steps (4, 8, 13, 17, 21, 25, 30, 35, 40, 45, 50, 60, 80, 100 mT). Samples that did not fully demagnetize after this protocol were further demagnetized thermally and a number of samples were demagnetized using thermal treatment alone. Charac-teristic remanent magnetizations (ChRM) were com-puted by least-squares fitting (Kirschvink, 1980) on the orthogonal demagnetization plots (Zijderveld, 1967).
Calcareous nannofossils
The nannofossil content of 76 samples was analysed within the Upper Maastrichtian of the Sopelana I sec-tion from the K/Pg boundary down to the lower part of Unit 6 (~67 m total thickness). No samples were collected in Unit 7 as it is tectonized and most prob-ably incomplete. The sampling resolution strategy was aimed at obtaining complete nannofossil data for ev-ery marl-limestone couplet to pinpoint precisely the main Upper Maastrichtian nannofossil biohorizons. A
small chip of the rock sample was processed and fixed on a smear slide following the standard preparation technique (Bown and Young, 1998) in order to preserve the original species composition. The nannofossil was studied under a Zeiss Axioscop 40 microscope at magnification 1250 X. Photographs were taken with a ProgRes GT3 camera and its corresponding software. Three long traverses were logged on each slide and the relative abundance of nannofossils was recorded semi-quantitatively using standard categories: Common (C), 1–10 specimens per field of view (fov), Frequent/Few, 1 specimen <20 fov; Rare, 1 specimen >20 fov.
The calcareous nannofossil biozonation for the Up-per Maastrichtian used here is primarily based on the UC scheme of Burnett (1998), but the previous CC biozo-nation of Sissingh (1977) and Roth (1978), as emended by Perch-Nielsen (1985), is also taken into account (Fig. 4). The taxonomic concepts generally follow those of Perch-Nielsen (1985) and Burnett (1998), but some recent emendations are also applied (Lees and Bown, 2005; Lees, 2007; Thibault, 2010). The taxonomic characteriza-tion of all species can be found at www.nannotax.org.
Spectral analysis and orbital solutions
The Zumaia bulk carbonate record for Units 10, 11 and 12 according to Ten Kate and Sprenger (1993) was used for spectral analysis. The original dataset was collected at intervals of 10 cm throughout the 63.7 m succession, in which many thin bedded turbidites ranging from 0.1 to 12 cm interbedded within the rhythmic hemipe-lagic marl-limestone couplets can be recognised. The published record was digitized and resampled at 10 cm intervals prior to spectral analysis. Ten Kate and Sprenger (1993) followed a strategy to tune the record
Figure 4. Upper Maastrichtian cal-careous nannofossil zonations through the GTS2012 (Gradstein et al., 2012).Figura 4. Zonaciones de nan-nofósiles calcáreos para el Maas-trichtiense Superior a través de la GTS2012 (Gradstein et al., 2012).
CC 24
NC 21
NC 22
NC 23
UC 18
UC 19
UC 20
CC 25
CC 26
R. levis R. levisL. praequa-dratus
L. quadratus L. quadratus
M. murusM. murus
N. frequensC. kamptneri
M. prinsii M. prinsii
N. frequens,C. kamptneri
M. murus,N. frequens
L. quadratus
a
a
ab
b d
bc
c
Sissingh, 1977, 1978;Perch-Nielsen, 1979,
1983, 1985Roth, 1978
Burnett, 1998“Tethyan-intermediate” TP
extinctionCret. taxa C. daniae
(oldest possible)
GTS
12
LATE
MAA
STR
ICH
TIAN
EAR
LYM
AAST
.
C30
n
C29r
C31
rC
31n
C30r
66
67
68
69
70
71
Ma

261
Dinarès-Turell, J. et al. 2013. Detailed correlation and astronomical forcing within the Upper… Boletín Geológico y Minero, 124 (2): 253-282
to the theoretical eccentricity curve available at the time (Berger, 1978), extrapolated to 65 Ma. The proce-dure started with a strong smoothing of the carbonate record using a weighted three-point moving average a number of times on a 2.5 cm interpolated spline curve fitted though the original data points. It proceeded by making firstly a visual correlation of the minima in the record and the target curve. Correlation was sub-sequently refined by the assessment of other smaller scale features. Spectral analysis was then performed on the time domain to conclude that the carbonate rhythmicity is indeed orbitally controlled as power on the precession and eccentricity bands was observed. The authors recognised that extrapolating the Berger’s equation to 65 Ma was unacceptable because of inaccu-racies in the solution that could amount to 0.4 Ma and therefore any absolute chronological constraints had to be flawed. We also note that correlating the eccen-tricity minima to low carbonate minima clashes with the observed details of cycle pattern recognition that suggests an opposite phase. In fact, as has been ob-served for the Palaeocene interval, precession-related cycles are less well developed in the limestone-domi-nated intervals of eccentricity-related cycles, indicating that these beds do indeed correspond to eccentricity minima because eccentricity modulates the precession signal’s amplitude (Dinarès-Turell et al., 2003, 2010, 2012; Kuiper et al., 2008). Consequently, the approach we have followed to analyse the carbonate record from Zumaia is different. We first conducted spectral analy-sis in the depth domain and inferred the astronomical frequencies and periods. Subsequently, we extracted the orbital cycles from the record by using bandpass Gaussian filters centred on the significant periodicities. The standard (Fourier) spectra was calculated using the software package “AnalySeries” (Paillard et al., 1996), which was also been employed for filtering purposes. The Continuous Wavelet Transform (hereafter CWT) (Torrence and Compo, 1998), which has been divided by its scales to account for a bias in the power spec-trum (Liu et al., 2007), was also applied to analyse the time evolution of the spectral power and to visualize better the eccentricity amplitude modulations on the precession.
Modern astronomical solutions that include a direct numerical integration of planetary orbits and the pre-cession of the Earth’s spin axis include the orbital so-lutions Va03_R7, published by Varadi et al. (2003), and La2004, by Laskar et al. (2004). The Va03_R7 solution was first used to tune the Danian portion of the Zumaia section (Dinarès-Turell et al., 2003) whereas the La2004 solution has since predominated in the literature and been used to tune the Neogene (Lourens et al., 2004) in the GTS2004 geological time scale (Gradstein et al.,
2004). Due to the chaotic behaviour of the solar system the orbital solution cannot be accurately calculated be-yond 40 Ma (Laskar et al., 2004), and therefore only the stable 405-ky eccentricity cycles can be used for tuning purposes. In an effort to improve the accuracy of the astronomical solution beyond 40 Ma a new solution (La2010) has recently been put forward (Laskar et al., 2011a) that makes use of a new high-precision plane-tary ephemeris called INPOP. In fact four solutions have been proposed, La2010a, b, c, d, which are adjusted in a different manner with the scope to assess the long-term precision of the solutions, which still maintained only limited accuracy beyond ~60 Ma (Laskar et al., 2011a). Further developments in ephemeris precision and methodological computations have led to yet another solution, La2011 (Laskar et al., 2011b), which provides slight refinements to the previous solutions. Nevertheless, Laskar et al. (2011b) demonstrate that the motion of Ceres and Vesta is very chaotic. As a con-sequence, a precise calculation of Earth’s eccentricity beyond 60 Ma is at present impossible, and probably never will be (cf. Westerhold et al., 2012 for additional details). A stability test on the La2010 and La2011 or-bital solutions carried out by Westerhold et al. (2012) suggests that only the La2010d and La2011 solutions should be used beyond ~47 Ma. In conclusion, it re-mains clear that for the Maastrichtian an accurate tun-ing for the short eccentricity is not possible and only the 405-ky beat can be used for that purpose. Only con-tinuous, very long, astronomically forced geological records could shed light on the orbital configuration at these older time scales. Our scope in this paper is not to look in detail at the tuning options but just to present a cyclostratigraphic template among the different Up-per Maastrichtian sections from the Basque Basin for further future developments.
Results
The integrated cyclostratigraphic, magnetostrati-graphic and biostratigraphic results are presented for both the Zumaia and Sopelana I main sections in inverse stratigraphic order following the lithological units of Wiedmann (1988) from younger Units 12–10 to older Units 9–7. The results from the accessory Hendaia section are presented separately at the end.
Units 12–10
Units 12–10 are magnificently exposed at the coastal-cliff of Punta Aitzgorri in Zumaia (Figs. 5a-c), which is reachable on foot at low-tides. The succession is also

262
Dinarès-Turell, J. et al. 2013. Detailed correlation and astronomical forcing within the Upper… Boletín Geológico y Minero, 124 (2): 253-282
exposed on the wave-cut platform during very low tides (Figs. 5d, e) and the marl-limestone couplets are relatively easy to recognise with the exception of the couplets within Unit 12 below the K/Pg boundary due to their generally more marly character and the pres-ence of very thin interbedded turbidites. In a good light at low tide the couplets can clearly be distinguished. The lithological couplets have been numbered from
the K/Pg downward and consist of a marly layer at the bottom and a carbonate-rich bed at the top. A total of 72 basic couplets with an average thickness of around 0.9 m have been recognised throughout the interval under consideration. The first three couplets (1–3) just below the K/Pg are relatively thick and carbonate rich. Cou-plets 6 and 9–10 also are carbonate-rich. Couplets 11–13 are somewhat more difficult to recognise because
Figure 5. Field photographs of Maastrichtian Units 10–12 at the coastal-cliff (a-c) and major wave-cut platform (d-e) exposures at Zumaia, in which individual precession-related couplets have been numbered (see PK1 to PK72 in text).Figura 5. Fotografías de campo de las Unidades 10–12 del Maastrichtiense en los acantilados costeros (a-c) y afloramientos de la rasa mareal (d-e) en Zumaia, donde los pares litológicos relacionados con la precesión han sido numerados (ver PK1 a PK72 en el texto).
a
cb
d e
6677 88 99
1100
11114444
1144
4411 22 33 55
1166 1188 1199 2200 2222 2244 2266 2288 2299
2299 3300 3311 3322 3333 3344 3355 33773388 3399 4411 4422443344444455
4466 4488 44995500
5511
5511 5522
5533 5544
55555577 5599
660066116622 6633 6644 66556666 6688
6699 7700 7711
66556644 6633 662266116600
7722 7711 7700 6699 6688 6677 6666
5599 5555
4444
5522
44114488 3366
3355 3333
3322
33002277
2244
prominent marlK/Pgboundary
U12 U11
U10
K/Pg
U12
U11U10U10U8 U9
lloolliittww
aammpp uuddee
llppoo
lliiwwaammttuuddee
llppoo
lliiwwaammttuuddee
Fig. 10d

263
Dinarès-Turell, J. et al. 2013. Detailed correlation and astronomical forcing within the Upper… Boletín Geológico y Minero, 124 (2): 253-282
they are thin and relatively homogeneous. Then, a very characteristic prominent marl bed is found in couplet 14. Below this level the couplets are easy to recognisedown to the base of Unit 10 and open bundles of about 5 couplets can eventually be observed. Furthermore, some intervals of relatively low-amplitude limestone-marl couplets seem to be visible (intervals of cycles 35–39 and 55–60) (Figs. 5b, c).
A high-resolution carbonate record had previously been produced and analysed to evaluate astronomical forcing in Units 10–12 (Ten Kate and Sprenger, 1993),
demonstrating that indeed the lithological couplets in the Maastrichtian also represent precession cycles of ~21-ky duration. Here we take the same record and perform the spectral analysis in the depth domain in order to extract the precession and the short (~100-ky) and long (~405-ky) eccentricity-related periodicities. Three distinct periodicities can be distinguished on the standard Fourier periodogram (Fig. 6a) and Blackman-Tukey spectrum (Fig. 6b). A band of significant frequen-cies with periods at 0.7-0.95 m is associated with the couplet and related to precession. A period at 4.1 m is related to the short eccentricity whilst a narrow pe-riod at 17 m, which appears blurred on the Blackman-Tukey spectrum, can be associated to the 405-ky long eccentricity. Figure 7a shows the distribution of the precession cycles (i.e. the 72 marl-limestone couplets named Pk1 to Pk72), and the short and long eccentricity cycles through Units 12–10 at Zumaia. The CWT spec-trum (Fig. 7b) allows us to visualize the spacial evolu-tion of these periodicities, which also emerge on the global spectrum. It appears clear that the precession band within the lower stratigraphic interval (52–64 m) is shifted to slightly higher periods due to the presence of relatively thicker couplets in this interval (Fig. 5d). Another advantage of the CWT spectra is the ability to display variations in the overall amplitude within a cer-tain band. As it is known that eccentricity modulates precession the CWT spectra become a useful tool for unravelling this scenario, since the overall significance of the eccentricity power in the standard spectra may be depleted under a strong precession forcing on the sedimentary record (cf. Dinarès-Turell et al., 2012). The precession band on the CWT spectrum (Fig. 7b) shows three zones of relatively lower amplitude. They are clearly associated to the 405-ky long eccentricity minima that we have named Ma4051, Ma4052 and Ma4053 from the K/Pg boundary downward, following the ter-minology used by Westerhold et al. (2008) and Husson et al. (2011), although these authors numbered the ec-centricity maxima instead. Gaussian bandpass filters centred at the retrieved periods have been used to ex-tract the orbital cycles from the carbonate record (Fig. 7a). The ~100 ky eccentricity minima have also been numbered from the K/Pg downward. A total of 17 short eccentricity cycles have been recognised through the interval comprising Units 10–12 (named E1 to E17). It should be noted, however, that cycles E3 and E4 are less well defined whereas cycles E16 and E17 appear to contain less than the usual 4–6 precession cycles, which may be an artefact of the higher sedimentation rate during this interval, and consequently the number of eccentricity cycles might be overestimated.
No magnetostratigraphic results for the Maastrich-tian Units 12–10 at Zumaia have ever been published
Figure 6. Spectral analysis of the carbonate data series of the Zu-maia section comprising Units10–12. a) Periodogram using a Barlett window; and b) Blackman-Tukey power spectra with a Barlett win-dow carried out with the AnalySeries v.2 software package (Paillard et al., 1996). Significant peaks or bands are labelled or marked by shaded bands; the period in m is also given. Inferred Milankovitch components are represented by E2 (long eccentricity, ~405-ky), E1 (short eccentricity, ~100-ky), and precession band (~19-23 ky).Figura 6. Análisis espectral de la serie de datos de carbonato de la sección de Zumaia que comprende las Unidades 10–12. a) Peri-odograma utilizando una ventana de Barlett; y b) espectros Black-man-Tukey y una ventana de Barlett llevados a cabo con el software AnalySeries v.2 (Paillard et al., 1996). Picos y bandas significativas se han etiquetado o marcado con sombreados; también se indica el período en m. Los componentes de Milankovitch deducidos están representados por E2 (excentricidad larga, ~ 405-ka), E1 (excentrici-dad corta, ~ 100-ka) y la banda de la precesión (~ 19-23 ka).
0 0.4 0.8 1.2 1.6 2Frequency (cycles/m)
0 0.4 0.8 1.2 1.6 2
0
0.4
0.8
1
0.1
0.01
0.001
b
Pow
erN
orm
.Pow
er
aPrecession
bandE1
E2
0.93 m4.1 m
17 m
0.71 m
Band Width = 0.0781250.625316 < DP( 80.0 % ) / P < 2.056868
Frequency (cycles/m)
E1 Precessionband

264
Dinarès-Turell, J. et al. 2013. Detailed correlation and astronomical forcing within the Upper… Boletín Geológico y Minero, 124 (2): 253-282
despite several attempts by different researchers (Ten Kate and Sprenger, 1993; Verosub, personal commu-nication 2000). In fact, Ten Kate and Sprenger (1993) quote an unsubstantiated layer by layer correlation of the Zumaia and Sopelana successions, for which the available magnetostratigraphic study at Sopelana (Mary et al., 1991) was used to infer the position of the chron reversal “C30R/C31N” (as it is quoted original-ly) at “12.3 m below the sampled interval” at Zumaia (one should understand in Unit 9). This depth seems to have been used to place the C30n/C29r position at
Zumaia by Westerhold et al. (2008) (and probably Her-bert et al., 1995), whilst it is clear that Ten Kate and Sprenger were referring to a reversal translated at 74.75 m below the K/Pg boundary at Zumaia (see their Table 1). Overall, this is quite confusing because Her-bert et al. (1995) depict the Zumaia carbonate record of Ten Kate and Sprenger (1993) along with the in-ferred/translated magnetostratigraphy from Sopelana and claim to count 18 precession cycles for the Maas-trichtian part of chron C29r, which is close to their in-ferences for South Atlantic deep-sea records of 18.5
Figure 7. a) Detailed lithological log for Units 10–12 from Zumaia and the corresponding carbonate (CaCO3) record of Ten Kate and Sprenger (1993). The filter output of Gaussian filters centred at 0.93 m (blue line, 1.074±0.5 bandpass), 4.1 m (solid green line, 0.244±0.06 bandpass; dashed green line, 0.244±0.02) and 17 m (red line, 0.058±0.015 bandpass) are also shown. The precession-related lithological couplets are numbered from the K/Pg boundary downward throughout the log (PK1 to PK72). The green numbers indicate lithological bundles corresponding to the short-eccentricity (100 ky) mini-ma and the black labels indicate the long eccentricity (405 ky) minima (Ma405) relative to the K/Pg boundary. b) Wavelet and global power spectrum with a lag-1 red-noise estimate and respective 80% and 95% significance levels.Figura 7. a) Columna litológica detallada para las Unidades 10–12 de Zumaia y el correspondiente registro de carbonato (CaCO3) de Ten Kate y Sprenger (1993). Se muestra también el resultado de filtros Gaussianos centrados en 0.93 m (línea azul, pasabanda de 1.074±0.5), 4.1 m (línea verde continua, pa-sabanda 0.244±0.06; línea verde discontinua, 0.244±0.02) y 17 m (línea roja, pasabanda de 0.058±0.015). Los pares litológicos se numeran desde el límite K/Pg hacia abajo a lo largo de la sucesión (PK1 a PK72). Los números verdes indican paquetes li-tológicos correspondientes a mínimos de la excentricidad corta (100 ka) y las etiquetas negras indican mínimos de la excent-ricidad larga (405 ka) (Ma405) en relación con el límite K/Pg. b) Espectro continuo de ondas y espectro de energía global con una estimación lag-1 del ruido rojo y niveles respectivos de sig-nificancia del 80% y 95%.
+
-
Power
0.512481632Period (m)% CaCO3
30 40 50 60
18
192021
22
23
24
25
26
27
28
29
30
31
32333435363738
39404142
43
44
45
46
47
48
49
505152
53
54
55
5756
58
59
6061
62
63
65
60
55
50
45
40
35
30
25
20
15
10
5
0
Thic
knes
s(m
)
1
23
4
5
6
7
8
9
10
111213
14
1516
17
694
685
676
667
658
649
721
730
712
Ma4051
Ma4052
Ma4053
1
2
3
4
6
7
8
9
10
11
12
13
14
15
17
E100E405 Precession
filter outputK/Pg
boundary
Zumaia(units 10–12)
Pow
er
Unit 12
Unit 11
Unit 10
5
16
0.93 m
a b0.9 m
4.1 m17 m
4.1 mmarllimestone
darklimestonemarl
light
turbidite

265
Dinarès-Turell, J. et al. 2013. Detailed correlation and astronomical forcing within the Upper… Boletín Geológico y Minero, 124 (2): 253-282
cycles. In any case, Herbert et al. (1995) and Herbert (1999) indicate that the C30n/C29r reversal appears to be located close to a node of low-amplitude preces-sion cycles related to the 405-ky eccentricity minima. This was also deduced by Westerhold et al. (2008), who infer it close to the minimum between their Ma100-4 and Ma100-3 short eccentricity cycles, although the inferences by these authors concerning Zumaia-Sopelana may be flawed in detail. Mary et al. (1991) did not report any reference to cyclicity counting at Sopelana and they only report the C30n/C29r chron boundary at 8 m below the K/Pg boundary. While we report here in our study a comprehensive bed-by-bed correlation and cycle counting between Zumaia and Sopelana, we have revisited and report new magne-tostratigraphic data aimed at reproducing the original data from Sopelana. Recent palaeomagnetic data by Pérez-Rodríguez et al. (2012) from the lower part of Unit 10 at Zumaia has confirmed the earlier notion on the difficulty of retrieving a primary useful mag-netic signal there. Here we provide demagnetization data from Unit 11 throughout the stratigraphic interval where the C30n/C29r boundary should be placed (Fig. 8). In essence, our combined thermal and AF demag-netization protocol leads us to infer a somewhat com-plex scenario of a reversed remagnetization present in both the magnetite and hematite fractions. In par-ticular, the hematite unblocks at relatively low-tem-peratures (from 300°C to about 640°C), suggesting a secondary chemical origin. Samples from precession cycles PK14 (Fig. 8b) and PK16 (Fig. 8e) display a nor-
mal component blocked on hematite and magnetite respectively but the majority of samples only present a pervasive reverse component retaining secondary remagnetization, as was inferred for Unit 10 by Pérez-Rodríguez et al. (2012).
Careful observations have been made at the Sopela-na I section in Units 12–10 below the K/Pg boundary that were facilitated by the dismantling of some build-ings that partly obstructed the cliff outcrops. Some complex faults render it difficult at first glance to fol-low the cyclic pattern, but we have been able to recon-struct a continuous section that expands Units 12–10 through two partly overlapping faulted blocks (Fig. 9) and to recognise the 72 marl-limestone couplets (i.e. precession cycles PK1 to PK72) first seen at Zumaia, including all the lithological particularities and the cyclostratigraphic stacking pattern (e.g. relatively car-bonate-rich cycles PK6, and PK9–10 and the prominent marl at cycle PK14, among others). It is noteworthy that the Maastrichtian succession at Sopelana I lacks turbidites.
A thorough magnetostratigraphic study of Units 12–10 has been done, focusing particularly on Unit 11 with the aim of relocating precisely the C30n/C29r chron boundary. We also conducted for the first time a high-resolution survey of the calcareous nannofossils in this section (Fig. 10). Palaeomagnetic results very much resemble our findings at Zumaia. A pervasive reverse overprint seems to be present throughout the studied interval, blocked either in magnetite and/or he-matite, as deduced from the combined thermal/AF de-
Figure 8. Examples of representative orthogonal demagnetization diagrams in bedding-corrected co-ordinates of Unit 11 at Zumaia (open and solid sym-bols denote projections onto the vertical and horizontal planes respectively). The precession cycle (PK), the NRM intensity and some demagnetization steps are indicated.Figura 8. Ejemplos representativos de dia gramas de desmagnetización orto-gonal después de la corrección de capa de la Unidad 11 en Zumaia (símbolos vacíos o rellenos denotan proyecciones sobre los planos vertical u horizontal respectivamente). Se indican el ciclo de precesión (PK), la intensidad de la NRM y algunos pasos de desmagnetización.
a KZ2-1
N
up/W KZ4-2
Nup/W
KZ5-1
N
up/W
KZ6-1
N
up/W KZ8-2
N
up/W
KZ14-1
N
up/W
NRM1.35 mA/m
150oC
4 mT
100 mT
640oC
500oC
cycle PK14limestone
b c
d e f
cycle PK14marl
cycle PK15limestone
cycle PK15marl
NRM1.03 mA/m
NRM1.26 mA/m
NRM1.2 mA/m
NRM3.46 mA/m NRM
2.13 mA/m
600oC
150oC
100 mT17 mT
640oC
400oC
150oC
150oC
150oC
640oC
150oC
300oC
400oC
500oC
640oC
640oC 640oC
600oC
30 mT
300oC
25 mT
100 mT
100 mT300oC
60 mT
cycle PK16limestone cycle PK23
limestone

266
Dinarès-Turell, J. et al. 2013. Detailed correlation and astronomical forcing within the Upper… Boletín Geológico y Minero, 124 (2): 253-282
magnetization protocol (samples SM5A, SJ69-1A, Fig. 10b). It is noted that thermal demagnetization only on a sister sample (sample SJ69-1B, Fig. 10b), does retrieve what seems to be a spurious component, most prob-ably due to an overlap of the unblocking temperatures of the two components, clearly seen on the combined protocol (sample SJ69-1A, Fig. 10b). This provides evi-dence of the intricate nature of the magnetization of these reddish rocks and may explain some of the re-sults reported in Mary et al. (1991) and Moreau et al. (1994). Strikingly, a narrow zone of normal polarity (e.g. sister samples SO-2A and SO-2B, Fig. 10) is found within cycles PK4–PK6 that seems to coincide with some awkward directions reported by Mary et al. (1991) at 2–5 m below the K/Pg boundary, which they related to plasticity and deformation in these marly lithologies. Although isolated samples with normal polarity have been measured within Unit 11 (see the declination and inclination log, Fig. 10a), no clear picture regarding an unambiguous definition of chron C30n and hence of the C30n/C29r chron boundary could be established.
Collectively, the dataset from Zumaia and Sopelana casts some doubts on the earlier interpretations and we regard the magnetization of the reddish lithologies from the Maastrichtian succession to be too complex and unsuitable for magnetostratigraphic purposes.
Calcareous nannofossils are abundant throughout the studied Upper Maastrichtian succession and rep-resented by highly diverse associations showing good to very good preservation. The first occurrence (FO) of Micula murus (Plate I, 12) is found in Sopelana at precession cycle Pk41 below the K/Pg boundary (~861 ky below; Fig. 10) (see Table 1 for a full account of bio-events). It is interesting to point out that this primary biotic datum is recorded just 5 m (11 precession cycles = ~231 ky) below the FO of M. prinsii. The acme of M. murus is observed up-section, within the M. prinsii zone. Calibration of these two biohorizons to the mag-netic polarity scale and constraining the accurate age by integrated cyclostratigraphy is very important to an evaluation of their biostratigraphic potential, bear-ing in mind that previous studies have clearly shown
Figure 9. Field photographs for Maastrichtian Units 10–12 at the Sopelana I section. Marl-lime-stone couplets (i.e. precession cycles, Pk1 to Pk72) and some bundles (i.e. short eccentricity cycles E1–E3) are indicated. Figura 9. Fotografías de campo de las Unidades 10–12 en la sección de Sopelana I. Se indican los pares marga-caliza (ciclos de precesión, Pk1 a Pk72) y algunos paquetes (ciclos de excentrici-dad corta E1–E3).
11
Sopelana I
UUnniitt 1122
EE11
UUnniitt 1111 22334455
6677
88991100
1111
11221144 1133
1155
prominentmarl
EE22
EE33
DDaanniiaann
KK//PPgg
UUnniitt 1100
UUnniitt 99
UUnniitt 1111
UUnniitt 1122
main fault
faultplane
pprroommiinneennttmmaarrll
UUnniitt 1100
1144
2200
2211
2299
22661166
22667722
6699
3344
a
bhanging wallblock
foot wallblock

267
Dinarès-Turell, J. et al. 2013. Detailed correlation and astronomical forcing within the Upper… Boletín Geológico y Minero, 124 (2): 253-282
a latitudinal diachroneity of this datum between the low- and mid-latitude records (Thibault et al., 2010).
The occurrence of Ceratolithoides kamptneri is not recorded in the Upper Maastrichtian at Sopelana, thus making it impossible to distinguish the UC 20c sub-zone (Fig. 4). It does however occur occasionally at some points in many other low-latitude sections (Gar-din et al., 2012).
The FO of Cribrosphaerella daniae (cycle PK39, Plate I, 20) is a clearly expressed bioevent following the FO of M. murus (cycle PK41, sample S12-6; Fig. 10). This datum is used as a subzonal marker in the Upper Maastrichtian “tethyan-intermediate” province -North Germany and the Indian Ocean by Burnet (1998). In Sopelana it falls in a position that should correspond to the upper part of C30n. It has, however, been reported close to the C31r/C31n boundary in Hole 1258A (Equatorial Atlantic) by
Husson et al. (2011). This provides some concern about the isochrony of the datum and therefore its biostrati-graphic potential needs to be better assessed.
The FO of Micula prinsii in Sopelana (sample SOP-29 in cycle PK29, Plate I, 14-16; Fig. 10) is recorded relatively low in the succession as this biovent has usually been placed close to the C30n/C29r boundary (cf. Herbert et al., 1995; Westerhold et al., 2008). It is a primary biostratigraphic marker for the uppermost part of the Maastrichtian, identifying subzones UC 20dTP and CC 26b in low-latitude sites (Fig. 4), where it is usually reported near the base of C29r. Neverthe-less, some recent studies have recorded it at the top of C30n (Self-Trail, 2001; J. Lees, unpublished data). At Sopelana, the FO of Micula prinsii is a distinct un-ambiguous biohorizon the record of which may have been favoured by the predominantly marly litholo-
Figure 10. a) Lithological log for Units 10–12 at Sopelana I and declination and inclination computed palaeomagnetic directions on the depth scale through key calcareous nannofossil bioevents; b) some representative orthogonal demagnetization diagrams; and c) stereographic projections of the computed components before (in situ) and after bedding correction are shown (open and solid symbols indicate projections onto the upper and lower hemisphere respectively), together with the mean direction and statistics for the secondary reverse directions only. Figura 10. a) Columna litológica de las Uni-dades 10–12 en Sopelana I con las direcciones paleomagnéticas calcula-das (declinación e inclinación) y bioeventos de nannofósiles clave; b) algunos diagramas representativos de desmagnetización ortogonal; y c) proyec-ciones estereográficas de las componentes calculadas antes (in situ) y después de la corrección de capa (símbolos vacíos o rellenos indican proyecciones en el hemisferio superior o inferior respectivamente), junto con la dirección media y parámetros estadísticos solo para las direcciones inversas secundarias.
Samplepmagnannos
181920
1176
212223242526272829
123456789
1011
1415
LithologyCyclePK
10
5
Sopelana IK/Pg
footwallblock
hangingwall block
majorfault
26272829303132333435
37
394041424344
38
36
4546474849
535554
5657585960616263646566676869707172
30
25
20
15
N Nc180 360 -90 -45 0 45 90
Declination Inclination
(o) (o)
Unit 12
SO-2A
N
up/W
SO-2B
N
up/W
SJ69-1A
N
up/W SJ69-1B
N
up/W
SM5A
N
up/W
cycle PK52
150oC
NRM1.43 mA/m
100 mT
4 mT
300oC
640oC
9.45 mcycle PK52
9.45 mNRM0.91 mA/m
150oC
300oC
640oC
500oC550oC600oC
NRM4.09 mA/m
150oC
17 mT
80 mT
30 mT
cycle PK2024.07 m
a b
cycle PK530.68 m
NRM6.91 mA/m
NRM12.09 mA/m cycle PK5
30.68 m
150oC
580oC610oC640oC
150oC30 mT
640oC
Unit 11
Unit 10
Unit 9
FRO N. frequens
FO M. prinsiiCC26a/26b =UC20c/20d
FO M. murus
FRO M. murus
ab
cd
b
c
a
d
N Dec. Inc. k α9544 201.6 10.4 5.7 9.9
In situbeddingcorrected
N Dec. Inc. k α9544 201.2 -42.4 6.7 9.0
marllimestone
dark
marllimestone
light
Thic
knes
s(m
)
0
35

268
Dinarès-Turell, J. et al. 2013. Detailed correlation and astronomical forcing within the Upper… Boletín Geológico y Minero, 124 (2): 253-282
Plate I. Main calcareous nannofossil markers from the Upper Maastrichtian of the Sopelana I section. 1-2 - Lithraphidites quadratus, sample B-SO-H. 3-4 - Lithraphidites quadratus, sample SM 7. 3 - NL, 4 - XPL. 5 - 6. Micula praemurus, sample B-SO-I. 7 - Micula praemurus, sample B-SO-F. 8 - Micula swastica, transitional form to M. murus, sample B-SO-I. 9 - Micula mu-rus, sample SM 5. 10 - Micula murus, sample SM 7. 11 - Micula murus, sample SM 6. 12 - Micula murus, FO in sample S12-6. 13 - Micula prinsii, sample C-SO-16. 14 - Micula prinsii, sample SM 15. 15-16 - Micula prinsii, sample SM 3. 17 - Nephrolithus frequens, sample C-SO-14. 18 - Prediscosphaera majungae, sample SM 9. 19 - Prediscosphaera majungae, sample SM 12. 20 - Cribrosphaera daniae, sample SM 4. Scale bar 10 mm. Plate I. Principales marcadores de nanofósiles calcáreos del Maastrichtiense superior de la sección Sopelana I. 1-2 - Lithraphidites quadratus, muestra B-SO-H. 3-4 - Lithraphidites quadratus, muestra SM 7. 3 - NL, 4 - XPL. 5 - 6. Micula praemu-rus, muestra B-SO-I. 7 - Micula praemurus, muestra B-SO-F. 8 - Micula swastica, froma transicional a M. murus, muestra B-SO-I. 9 - Micula murus, muestra SM 5. 10 - Micula murus, muestra SM 7. 11 - Micula murus, muestra SM 6. 12 - Micula murus, FO in muestra S12-6. 13 - Micula prinsii, muestra C-SO-16. 14 - Micula prinsii, muestra SM 15. 15-16 - Micula prinsii, muestra SM 3. 17 - Nephrolithus frequens, muestra C-SO-14. 18 - Pre-discosphaera majungae, muestra SM 9. 19 - Prediscosphaera majungae, muestra SM 12. 20 - Cribrosphaera daniae, muestra SM 4. Escala 10 mm.
Nannofossil bio-events Stratigraphic interval SamplePrecession cycle code
FRO Nephrolithus frequens Upper Maastrichtian C-SO-14 PK26FO Micula prinsii Upper Maastrichtian SO-29 PK29FRO Micula prinsii Upper Maastrichtian SO-30 PK30FO Cribrosphaerella daniae Upper Maastrichtian S12-8 PK39FO Micula murus Upper Maastrichtian S12-6 PK41FRO Micula murus Upper Maastrichtian S12-4 PK43FRO Cribrosphaerella daniae Upper Maastrichtian S12-4 PK43FO Micula praemurus Upper Maastrichtian B-SO-I PE1FO Prediscosphaera majungae Upper Maastrichtian B-SO-H PE2FO Lithraphidites charactozorro Upper Maastrichtian B-SO-H PE2FRO Micula praemurus Upper Maastrichtian B-SO-G PE4-5FO Lithraphidites quadratus Upper Maastrichtian B-SO-F PE6Local acme of Braarudosphaera bigelowii
Upper Maastrichtian B-SO-C PE8
FRO Lithraphidites quadratus Upper Maastrichtian B-SO-B PE9FO Lithraphidites praequadratus
Lower Maastrichtian SM101 PE18
FRO Lithraphidites praequadratus
Lower Maastrichtian SM100 PE19
Table 1. Position of calcareous nannofossil bioevents in the Sopelana I section with respect to the identified precession cycle (PKn, precession cycle counting from the K/Pg boundary; PEn, precession counting cycle from the top of Unit 6 or “top Escalón”)Tabla 1. Posición de los bioeventos de nanofósiles calcáreos en la sección de Sopelana I en relación con el ciclo de precesión en que se identifican (PKn, ciclo de precesión contando desde el límite K/Pg; PEn, ciclos de precesión contando desde la parte superior de la Unidad 6 o “top Escalón “)

269
Dinarès-Turell, J. et al. 2013. Detailed correlation and astronomical forcing within the Upper… Boletín Geológico y Minero, 124 (2): 253-282
gies deposited in a setting devoid of turbidites. In this study the calibration of this datum at about 609 ky below the K/Pg boundary, within chron C30n, may imply either diachrony or the erroneous calibration of the existing biostratigraphic data. For example, at Zu-maia, situated just some 70 km from Sopelana, it has been documented close to the K/Pg boundary in C29r (Lees in Pérez-Rodríguez et al., 2012) (Fig. 2), although the reported poor preservation there may have some significance. Furthermore, Thibault et al. (2012), in his integrated study on ODP Hole 762C from the Indian Ocean, have calibrated the bioevent at 390±70 ky be-low the K/Pg boundary. Nevertheless, we note that this bioevent has already been shifted to an older age in the GTS2012 time scale (Gradstein et al., 2012) (Fig. 4), although no explanation is provided.
The First Rare Occurrence (FRO) of Nephrolithus frequens (sample C-SO-14 in cycle PK26, Plate I, 20) is observed in the uppermost part of the succession (Fig. 10). It has been used to define the base of CC 26a (Fig. 4), but then it has been proved to be time-transgressive toward the equator in high southern latitudes (Pospichal et al., 1992). In Sopelana its occur-rence is rare but consistent throughout the uppermost part of the Maastrichtian UC20dTP zone.
Units 9–7
Determining the cyclic stacking pattern for Units 9–8 and counting precession cycle (i.e. marl-limestone couplets) and eccentricity-related bundles is relatively straightforward. The field photographs from Figure 11 illustrate this interval both at Zumaia and Sopelana I. A total of 32 precession-related couplets can be recog-nised (cycles PK73 to PK104) comprising 6 eccentricity-related cycles, which we have denominated E18 to E23 (following the 17 eccentricity cycles from Units 12–10). These 100-ky eccentricity cycles are made evident by a series of two or three consecutive basic couplets containing relatively well developed marly layers that must correlate with eccentricity maxima, while the eccentricity minima are marked by one or two low-amplitude couplets containing less developed marly interlayers, which are clearer in the images at Sopela-na (Figs. 11a-c).
The relatively marly reddish Unit 7 is better ex-posed at Zumaia (Fig. 12) whereas it appears tecton-ized and possibly truncated/reduced at Sopelana (Fig. 3). A close examination of Unit 7 at Zumaia under good lighting conditions reveals the same stacking pattern observed in the overlying units, particularly
Figure 11. Field photographs of Units 8–9 from cliffs at Sopelana I (a-c) and the Zumaia wave-cut platform at low tide seen from the cliff (d). The numbering of the precession cou-plets PK73–PK104 and the eccentricity-related bundles E18–E23 descends from the overly-ing Units 11–12. Relatively pronounced marly layers are marked in black whereas less con-trasted marly interlayers are marked in green (see text for discussion). Figura 11. Fotografías de campo de las Unida-des 8–9 de los acantilados en Sopelana I (a-c) y rasa mareal de Zumaia en baja marea desde el acantilado (d). La numeración de los pares de precesión PK73–PK104 y los paquetes de ex-centricidad E18–E23 desciende desde las Uni-dades 11–12 sobreyacentes. Capas de marga relativamente marcadas están señaladas en negro, mientras que capas de marga menos contrastadas están marcadas en verde (véase el texto para la discusión).
7733
8800
88228899
88227766
8888
990099449999
9999
9999
110044 EE1188
EE1199
EE2200
EE2200EE2211
EE2222
EE2233
U10
77668811
8822
8833
884488889944
9955
99009922 8866
7788
9988110000
110022110044
110044
110000
110000
EE2222
EE2233
EE2211 EE2200
EE1199 EE1188
Sopelana IU10
Zumaia
U7
U8-9
UU88--99
UUnniitt 1100UUnniitt 88--99
UUnniitt 77
a b c
d
UU88--99

270
Dinarès-Turell, J. et al. 2013. Detailed correlation and astronomical forcing within the Upper… Boletín Geológico y Minero, 124 (2): 253-282
Figure 12. Field photograph of Unit 7 at Zumaia, on which ec-centricity cycles are numbered (E24–E29).Figura 12. Fotografía de campo de la Unidad 7 en Zumaia, en la que se han numerado los ciclos de excentricidad (E24–E29).
Figure 13. Field photographs of Unit 6 showing the conspicuous marly Escalón at the sea-cliff (a-c) and Zumaia wave-cut platform (d) ex-posures. Individual couplets are numbered from the top of this unit downward.Figura 13. Fotografías de campo de la Unidad 6, mostrando el llamativo Escalón margoso visible en el acantilado (a-c) y en afloramientos de la rasa mareal (d) de Zumaia. Los pares están numerados desde la parte superior de la unidad hacia abajo.
110044
EE2233Zumaia
UUnniitt 88
UUnniitt 77
UUnniitt 66
9944 9966 9988 110000 110022
EE2244 EE2255
EE2266 EE2277 EE2288??
EE2299
1155 1199
2200 2211 22222233
2244
EESSCCAALLÓÓNN
2299
c
44 ssmmaallllccyycclleess
EE3322
1133
11441155 1166
1177 1188 1199
EESSCCAALLÓÓNNb
EESSCCAA
LLÓÓNN
1111
11 2233 44 55 66
88
a
EE3300 EE3311
EESSCCAALLÓÓ
NN
113311551199
1122
111155
44 11
88
1100
d
EE3300EE3311
271
Dinarès-Turell, J. et al. 2013. Detailed correlation and astronomical forcing within the Upper… Boletín Geológico y Minero, 124 (2): 253-282
the eccentricity-related bundles (Fig. 12). As lithologi-cal couplets are difficult to distinguish within some in-tervals we have not counted them in this unit and only take into account the eccentricity-related bundles. The E26 cycle is not clear because several relatively thicker conspicuous turbiditic layers are interbedded within this lower part of Unit 7.
Unit 6
Unit 6 is characterized at Zumaia as a ~15-metre-thick carbonate-rich package with a characteristic 1.2-metre-thick marly interval (including a couple of thin turbidites) in the middle that is nick-named “Es-calón” (Fig. 13). The marly beds of the precession-re-lated couplets throughout this interval are poorly de-veloped and several partitions and thin to very thin turbidites make distinguishing cyclicity a demand-ing task. A combination of observations on the sea-cliff wall and the wave-cut platform under different lighting conditions allowed us to discern a total of 24 precession-related couplets and 4-5 eccentricity-related bundles of 4–6 couplets from the top of this unit down to four very characteristic, relatively thin, small marly cycles (cycles 25–28 in Fig. 13). Because
the precession cycles are somewhat blurred in Unit 7, counting of the precession-related couplets for Unit 6 re-starts at the top of Unit 7 and are named PE1 to PE24. Unit 6 has been targeted to locate precisely the chron C31r/C30n reversal (Fig. 14). Magnetic inten-sity in these light-grey limestones is relatively low (usually below 0.1 mA/m) but demagnetization of the data is of good quality for most of the samples stud-ied and a clear magnetostratigraphy could be estab-lished, as inferred in Pérez-Rodríguez et al. (2012), which we can now place in a satisfactory cyclostrati-graphic framework. The C31r/C31n is placed at pre-cession cycle PE20±1 at the top of Unit 6 at Zumaia, which is discussed further below.
The succession in the Sopelana I section is devoid of turbidites but some structural complications and outcrop conditions make it somewhat difficult to rec-ognise all the cycles and details at first glance. Never-theless, taking the four characteristic small precession cycles that are clearly visible up in the cliff (Fig. 15a and c) cycles PE13–PE24 can be discerned in the top outcrop of the cliff despite the fact that some small faults and intrastratal sliding and folding disrupt the succession a little. Cycles PE13–PE21 crop out again at the beach on another block separated by a fault below
Figure 14. a) Lithological log for Unit 6 at Zumaia and declination and inclination computed palaeo-magnetic directions on the depth scale; b) stere-ographic projections of the computed components before (in situ) and after bedding correction are shown, together with the mean direction and statis-tics for the normal and reverse directions; and c-e) some representative orthogonal demagnetization diagrams.Figura 14. a) Columna litológica de la Unidad 6 en Zumaia con las direcciones paleomagnéticas calcu-ladas (declinación e inclinación); b) proyecciones estereográficas de las componentes calculadas an-tes (in situ) y después de corrección de capa junto con la dirección media y estadísticas para las direc-ciones normales e inversas; y c-e) diagramas repre-sentativos de desmagnetización ortogonal.
20
15
10
5
0
123456789
1011
1213
15
171819202122
24
2930313233
C31
nC
31r
ZumaiaDeclination Inclination
180 360(o)
-90 -45 0 45 90(o)
MZK1
MZK33
LithologyCyclePE
Beddingcorrected
N
In situ
Sample N Dec. Inc. k α95Reverse 10 214.1 -30.9 21.2 10.7Normal 16 26.9 54.1 14.9 9.9
Sample N Dec. Inc. k α95Group R 10 250.3 -76.1 21.2 10.7
e
N
up/W
N
up/W
c MKZ11-1 MKZ16-1
cycle PE24 cycle PE19
NRM0.021 mA/m
150oC
100 mT NRM0.145 mA/m
150oC
4 mT
100 mT
Nup/W
d MKZ26-1
cycle PE9
NRM0.141 mA/m
150oC
100 mT
8 mT
21 mT
30 mT
Sample
U6
U5
U7Unit
ESCALÓN
ba
Thickness(m)

272
Dinarès-Turell, J. et al. 2013. Detailed correlation and astronomical forcing within the Upper… Boletín Geológico y Minero, 124 (2): 253-282
the poorly exposed Escalón (Fig. 15d). Cycles PE1–PE11 above the Escalón outcrop on the same block at the beach although some of the cycles are difficult to rec-ognise due to the predominantly carbonate nature of the interval and to some minor disruptions and parti-tions. Palaeomagnetic sampling through this interval (Fig. 15b) indicates that the C31r/C31n chron boundary must be located between the marly layer of cycle PE20 and the marly layer of cycle PE18 (the sample from cycle PE19 did not provide any interpretable results).
The survey of calcareous nannofossils within this interval indicated the FO of several taxa (see Table 1
for full details). The FO of Lithraphidites quadratus (Plate I, 1–4), an important low-latitude biohorizon, is recorded in cycle PE6 at the top of the unit and cycles PE12–PE13 (252–273 ka) above the base of chron C31n. Its position at Sopelana is consistent with the previ-ously reported position in the Umbria-Marche pelagic sections (Gardin et al., 2012) and at Zumaia (Lees in Pérez-Rodríguez et al., 2012). Some previous research-ers have considered this biohorizon to be potential marker for the placement of the lower-upper Maas-trichtian boundary (Paul and Lamolda, 2007). The spe-cies is reported to have wide geographic distribution
Figure 15. Field photographs (a, c-d) and lithological log (b) for Unit 6 at Sopelana I and declination and inclination computed palaeomag-netic directions on the depth scale through key calcareous nannofossil bioevents, e-g) some representative orthogonal demagnetization diagrams.Figura 15. Fotografías de campo (a, c-d) y columna litológica (b) de la unidad 6 en Sopelana I con las direcciones paleomagnéticas calcula-das (declinación e inclinación) y bioeventos de nannofósiles clave, c-e-g) diagramas representativos de desmagnetización ortogonal.
C31
n
C31r
Declination
180 360(o)
Inclination
-90 -45 0 45 90(o)
LithologyCycle PESopelana I
U6
U7Unit
ESCALÓNno outcrop
E2
N
up/W
E16
N
up/W E21
N
up/W
no outcropon beach
10
5
0 m
12
3-567
1112
1415
1718192021
10
13
a
fault
U7
EESSCCAALLÓÓNN U6
EESSCCAALLÓÓNN
16
c d
e f g
EESSCCAALLÓÓNN
Fig. 15c
Fig. 15d
cycle PE20
8 mT
150oC
NRM0.249 mA/m
13 mT
50 mT NRM0.065 mA/m
150oC 60 mT100 mT
NRM0.162 mA/m
150oC4 mT
100 mT
cycle PE13
cycle PE9
1133
44 ssmmaallllccyycclleesstthhiicckk
mmaarrll
b
1166
2211
1188
2244 2222
113311553333 3322 3311 3300 2299
FO F. praemurusFO P. manjugaeFO L. charctozorro
efg
FO L. quadratusCC25a/25b =UC19/20FO L. praequad.
h
i
h
f ge
i
pmagnannos

273
Dinarès-Turell, J. et al. 2013. Detailed correlation and astronomical forcing within the Upper… Boletín Geológico y Minero, 124 (2): 253-282
in low-latitude sections and thus can be used as a reli-able correlation biohorizon there.
The Hendaia section
It has been seen above that despite some lithological differences between the Zumaia and Sopelana I sec-tions (i.e. lack of turbidites in the second) the previ-ously defined lithological Units 6 to 12 and marl and limestones beds can be correlated bed-by-bed be-tween these two sections some 70 km apart. The ori-gin of these main differences is probably related to the particular depositional setting of each section within the deep-water trough. In order to explore further and substantiate the findings at Zumaia-Sopelana I, addi-tional research has been undertaken in other Basque sections. Here, we only provide the results from the
less well known Hendaia locality at the Pointe Sainte-Anne because it provides some better clues for the cy-clic details of Unit 6 and the position of the C31r/C31n reversal. Also, an attempt to document the location of the C30n/C29r chron reversal has been undertaken.
The Upper Maastrichtian succession crops out in a series of spectacular coastal-cliffs around the Pointe Sainte-Anne near Hendaia, which are difficult to access and only partly accessible at low tide (Fig. 16). Although bedding is subhorizontal or gently dipping, the area is cross-cut with several small-scale and also some more important faults and peculiar contacts. Nevertheless, the general lithostratigraphic units can be recognised (see sketch in Fig. 16). The upper part of the Maastrich-tian at the contact between Units 11–12 has been stud-ied at the northern end of the cape (Hendaia N section) (Fig. 17). Palaeomagnetic measurements in 13 samples from 10 consecutive cycles spanning cycles PK8–PK19
Figure 16. Aerial view of the Pointe Sainte-Anne near Hendaia (from BingMaps) and a sketch show-ing the main faults and blocks and the classical lithological Units U6–U12 of Wiedmann (1988). The sections studied and the locations of other figures are indicated.Figura 16. Vista aérea de la Pointe Sainte-Anne, cerca de Hendaia (de BingMaps) y un dibujo que muestra las principales fallas y bloques y las uni-dades litológicas clásicas U6–U12 de Wiedmann (1988). Se indican las secciones estudiadas y la ubi-cación de otras figuras.
K/Pg
PPaalleeoocceenneeK/Pg boundary
Unit 12Unit 11Unit 10Units 8-9Unit 7eUsncital6on
U.M
aastrichtian
U12
U11
U10 U8-9
U6
HHEENNDDAAIIAA EE
HHEENNDDAAIIAA WW
fault
fault
Section
Fig. 18
Fig. 17
Fig. 19b
HHEENNDDAAIIAA NN

274
Dinarès-Turell, J. et al. 2013. Detailed correlation and astronomical forcing within the Upper… Boletín Geológico y Minero, 124 (2): 253-282
within the expected interval for the C30n/C29r bound-ary only indicate reverse polarities (Figs. 17b–d), which can be put down to a secondary pervasive overprint in those lithologies, much in the line with the observa-tions made at Zumaia and Sopelana. Consequently, we were unable to locate this chron boundary in any of the sections investigated in the Basque Basin.
Unit 6 was studied in the central area of the Pointe Sainte Anne outcrop, along a section we have named Hendaia E. Within this outcrop Unit 6 is less carbonate than in Zumaia-Sopelana I and outstanding precession cycles are obvious (Fig. 18), with the conspicuous Es-calón showing up clearly, especially when a weathered profile is seen (Fig. 18b and Fig. 19a). Magnetostratigra-phy through cycles PE14–PE23 below the top of the unit confirms and substantiates that the C31r/C31n bound-ary occurs at cycle PE20 (8 cycles below the Escalón, Fig. 18c). Figure 19 displays views of Unit 6 at Hendaia E and Hendaia W, which is located not far on the other side of the bay (Fig. 16) and also at Zumaia. Despite the short distance the two Hendaia outcrops display slight-
ly different characteristics, Hendaia E having some red-dish colouring through the lower interval, but other-wise all the precession cycles and particularities match bed-by-bed among the three sections. In particular the four small cycles below cycle PE24, the prominent marl below cycle PE33 and the two relatively well developed marls in cycles PE29 and PE30 are clearly seen (see also this interval at Sopelana I in Fig. 15c).
Discussion
Much controversy has been generated about the ab-solute age of the K/Pg boundary, which seems to jump as much as 1 My even in the most recent Geological Time Scales. An age of 65 Ma was reported by Berg-gren et al. (1995) whereas 65.5 Ma was adopted in the GTS2004 (Gradstein et al., 2004) without incorporating cyclostratigraphic constraints. Using the first modern astronomical solution, Va03_R7, by Varadi et al. (2003) we tuned the K/Pg boundary at Zumaia to an age of
Figure 17. (a) Field photograph of the Hendaia N section with main fault and lithological Units U9–U12 indicated; (b-c) representative orthogonal demagnetization plots; and (d) stereographic projections of the computed components before (in situ) and after bedding cor-rection together with the mean direction and statistics for the secondary reverse directions.Figura 17. (a) Fotografía de campo de la sección de Hendaia N donde se señalan la falla principal y las Unidades litológicas U9–U12; (b-c) diagramas ortogonales de desmagnetización representativos; y (d) proyecciones estereográficas de las componentes calculadas antes (in situ) y después de la corrección de capa junto con la dirección media y parámetros estadísticos para las direcciones inversas secundarias.
HHEENNDDAAIIAA NN
UUnniitt 1122
a
UUnniitt 1111
UUnniitt 99
UUnniitt 1111
UU1100
UU1100UU1100
DDaanniiaann marl
K/Pg
main fault
sseeccttiioonn
Hendaiatown
HD4-1A
N
up/WHD6-2A
N
up/W
11441155
K/Pg
N Nd
In situ
beddingcorrected
N Dec. Inc. k α9513 199.3 -43.7 14.3 11.3
N Dec. Inc. k α9513 190.0 -46.6 10.6 13.3
cb 13 mT
NRM3.21 mA/m
150oC150oC
NRM7.71 mA/m
610oC
80 mT
100 mT
400oC
500oC540oC
580oC
610oC

275
Dinarès-Turell, J. et al. 2013. Detailed correlation and astronomical forcing within the Upper… Boletín Geológico y Minero, 124 (2): 253-282
65.83 Ma (Dinarès-Turell et al., 2003) by using as first anchoring point the expression of a node in the very long eccentricity cycle in the upper part of the Dani-an, and then tuning consecutive short eccentricity-related bundles and precession cycles down to the K/Pg boundary, which is less accurate than tuning the 405-ky eccentricity cycle for these older ages but still a good metronome. The Palaeocene tuning at Zumaia was revisited by Westerhold et al. (2008), Kuiper et al. (2008) and Hilgen et al. (2010) in the light of a newly available solution (the La2004 solution, Laskar et al., 2004) and basing the tuning on the more stable 405-ky eccentricity cycle and some reinterpretation of cycle identification. Due to uncertainties in the radioisotope monitor standards these authors provided several op-tions by offsetting tuning to consecutive 405-ky cycles,
thus attaining different ages for the K/Pg boundary. The favoured tuning option to La2004 in Kuiper et al. (2008) and Hilgen et al. (2010), following the 405-ky tuning strategy, placed the K/Pg boundary at 65.95 Ma, which is basically the same as in Dinarès-Turell et al. (2003) (the difference arising from the interpretation of an ad-ditional 100-ky eccentricity cycle in the Zumaia record), an age that was in accord with the authors’ new re-evaluation of the Fish Canyon Sanidine (FCS) monitor standard, at 28.20 Ma. The three tuning options for the K/Pg boundary provided in Westerhold et al. (2008), 65.28 Ma, 65.68 Ma and 66.08 Ma respectively, have been looked upon both favourably and disfavourably, while the most recent calibration via the earliest Pa-laeogene, which is independent of the radioisotope ages and uses the La2011 orbital solution (Westerhold
Figure 18. Field photographs (a-b) and lithological log (c) for Unit 6 at Hendaia E and declination and inclination computed palaeomag-netic directions on the depth scale; (d-e) some representative orthogo-nal demagnetization diagrams; and (f) stereographic projections of the computed components before (in situ) and after bedding correction, together with the mean direction and statistics for the normal and re-verse directions.Figura 18. Fotografías de campo (a-b) y columna litológica (c) de la Unidad 6 en Hendaia E con las di-recciones paleomagnéticas calcu-ladas (declinación e inclinación); (d-e) diagramas de desmagnetiza-ción ortogonal representativos; y (f) proyecciones estereográficas de las componentes calculadas antes (in situ) y después de la corrección, junto con la dirección media y pará-metros estadísticos para las direc-ciones normales e inversas.
LithologyCycle PE
ESCALÓN
10
5
456
8
1112
1415
1718192021
10
13
16
c123
7
9
2223240 m
ESCALÓN ESCALÓN
HHEENNDDAAIIAA EE
UUnniitt 1100
UUnniitt 99
UUnniitt 88--99
UUnniitt 66
DDaanniiaann
section UUnniitt 66
EESSCCAALLÓÓNN
a
b
HD11-1A
N
up/WHD16-1A
N
up/W
180 360 -90 0 90
DDeeclcliinnaattiioonn Inclination
(o) (o)
C31
rP
olar
ity
HENDAIA E
C31
nd
cycle PE22
35 mT
150oC
NRM0.242 mA/m
e
150oC
NRM5.42 mA/m
cycle PE18
f N
Sample N Dec. Inc. k α95Group R 6 187.2 -39.8 16.1 17.2Group N 7 16.2 54.6 27.0 11.8
Sample N Dec. Inc. k α95Reverse 6 191.7 -37.7 15.8 17.4Normal 7 16.2 54.6 27.0 11.8
17 mT
100 mT
100 mT
tectoniccontact

276
Dinarès-Turell, J. et al. 2013. Detailed correlation and astronomical forcing within the Upper… Boletín Geológico y Minero, 124 (2): 253-282
et al., 2012), controversially indirectly recalibrates the FCS at 27.89 Ma and puts the K/Pg at 65 250 Ma, which is close to their earliest option 1. Other inferences on tuned Maastrichtian deep-sea records by Husson et al. (2011) that seem to have been incorporated into the last Geological Time Scale (Gradstein et al., 2012) favour the estimate of the K/Pg boundary at about 66 Ma, close to a 405-ky minimum around that age. It is out of the scope in this paper to further scrutinise the
Palaeocene orbital tuning and absolute age of the K/Pg boundary, and for practical reasons we have adopted the age of ~66 Ma for the K/Pg and used the La2010d orbital solution as a template for our Upper Maastrich-tian framework whilst acknowledging that this solution can only be taken as tentative and only valid for the 405-ky eccentricity cycle.
A direct cycle counting and bandpass filtering out-put is the basis of our cyclostratigraphic framework for
Figure 19. Field photographs of Unit 6 at the Hendaia E (a), Hendaia W (b) and Zumaia (c) sections, showing the numbered precession-related couplets, the recovered magnetostra-tigraphy and some peculiar features including the Escalón, four consecutive small cycles and a prominent marl bed below cycle 33 (Fig. 15c for the same features at Sopelana I).Figura 19. Fotografías de campo de la Unidad 6 en las secciones de Hendaia E (a), Hendaia W (b) y Zumaia (c), mostrando los pares de precesión numerados, la magnetoestratigrafía medida y algunas características peculiares como el Escalón, cuatro ciclos pequeños consecutivos y un nivel de marga prominente bajo el ciclo ciclo 33 (ver Fig. 15C para las mismas particularidades en Sopelana I).
EESSCCAALLÓÓNN
EESSCCAALLÓÓNN
EESSCCAALLÓÓ
NN
small cycles
11111100
9988
77
11221133
11441155
116611771188
44 ccyyss ccllmm ee
aa ssllll
1133
2244
pprroommiinneenntt mmaarrll
2299
3333
11441155
11881199
22002211
22222233
1111 ccyycclleess
pprroomm
iinneenn
tt mmaarr
ll2244
22002299
3333
4 sll
mmeaasllll
cc4
yyscc es
a HENDAIA E
b
a
HENDAIA W
ZUMAIA
C31n
C31r
EE3322
EE3300
EE3311EE3322
C31n
C31r

277
Dinarès-Turell, J. et al. 2013. Detailed correlation and astronomical forcing within the Upper… Boletín Geológico y Minero, 124 (2): 253-282
the Upper Maastrichtian in the Basque Basin. Figure 20 displays the salient features of this framework, taking Zumaia as the master section. Bearing in mind the posi-tion of the K/Pg boundary as outlined above, the Zuma-ia record can be tuned to the La2010d orbital solution (Laskar et al., 2011b) in accordance with the 405-ky cy-cle. Therefore, the three consecutive eccentricity-related cycles, Ma4051 to Ma4053, can be tuned to successive ec-centricity minima of that cycle in the orbital solution. Note that we code the eccentricity minima rather than the maxima, as has been the practice of other authors (cf. Westerhold et al, 2008, Husson et al., 2011, Thibault et al., 2012), because we feel it more useful and practi-cal in those land-based sections where carbonate-rich or low-amplitude intervals are usually prominent and stand out in the field. For lithological Units 8-9 we pro-vide direct counting of individual precession-related couplets or Pk cycles and 100-ky eccentricity cycles (Fig. 20b). For marly Unit 7, for which individual precession cycles are somewhat blurred, we only provide eccen-tricity counting. Consequently, counting the precession-related couplets for the underlying Unit 6 starts at the
top of this unit, referred to as ”top Escalón” (PE cycles). The exact genetic nature and significance of the two conspicuous marly couplets constituting the Escalón remains unclear. We put them down to an eccentricity maximum but the possibility that may represent a local/regional tectonically driven sea-level or climatic event deserves further attention. Under this cyclostratigraph-ic scheme, chron C31r/C31n occurs slightly below the eccentricity maximum between cycles E32-E33 (20 pre-cession cycles below the top of the unit at PE20), (Fig. 20 and discussion above). In the Maastrichtian astronomi-cal calibration of Husson et al. (2011), ODP Site 525A in the South Atlantic is chosen to calibrate this reversal boundary. In their option 2, which takes the K/Pg bound-ary to occur at about 66 Ma, the C31r/C30n boundary is calibrated at 69.22±0.07 Ma (i.e. 3.22 Ma older than the K/Pg boundary), and close to their eccentricity maxi-mum labelled 32, which would correspond exactly to the maximum between our E32-E33 cycles. This is fairly consistent with our calculation but it is not clear how Husson et al. (2011) reached the figure of 3.22 My re-ported in their Table 3 for the position of C31r/C31n rela-
Figure 20. (a) Eccentricity orbital solution La2010d (Laskar et al., 2011b) with the extracted 405-ky long eccentricity for the Late Maas-trichtian interval. The K/Pg boundary is located at about 66 Ma, close to a long eccentricity minimum; (c) Zumaia inferred and measured magnetostratigraphy, carbonate record for Units 10–12 (Ten Kate and Sprenger, 1993), and derived filters to extract the short (E green) and long (M400 red) eccentricity cycles that are numbered at their minima. The number of the precession-related cycles (PK cycles in blue) and short eccentricity cycles (E cycles in green) for some intervals is indicated. (c) Synthetic lithological log with the lithostratigraphic units and depositional sequences (DS) (see text for discussion).Figura 20. (a) Solución orbital de la excentricidad La2010d (Laskar et al., 2011b) con la excentricidad larga de 405-ka extraída para el inter-valo Maastrichtiense final. El límite K/Pg está situado a unos 66 Ma, cerca de un mínimo de la excentricidad larga; (c) magnetostratigrafía medida y deducida en Zumaia y registro de carbonato para las Unidades 10–12 (Ten Kate y Sprenger, 1993) y filtros derivados para extraer los ciclos de la excentricidad corta (E verde) y larga (M400 rojo) que se numeran en sus mínimos. Está indicado el número de los ciclos de precesión (ciclos PK en azul) y ciclos de excentricidad corta (E ciclos en verde) para algunos intervalos. (c) columna litológica sintética con las unidades litoestratigráficas y secuencias deposicionales (DS) (véase el texto para la discusión).
66 67 68 69
12 11 10 9 8 7 6Ma-Da UMa1 UMa2
1 23 4 5 6 7 8 9 10 11 12 13 14
15 16 17
Ma4051 Ma4052 Ma4053
Age Ma
La2010d
Ecce
ntric
ity
+
-17
10
UnitDS
1
K/Pg
CaCO3
2 34 5
6 7 89
11 1213 14
15
1618
19 20 2122
2324
25
2627
28
2930
3132
33 34
Pk12-Pk72
C29r C30n C31n C31rE32 E33
E18-E29E24-E29E18-E23
Pk73-Pk104
~1.282 Ma ~1.164-1.205 Ma
Thickness (m)
a
b
c
0 50 100 150
~ 69.08 Ma

278
Dinarès-Turell, J. et al. 2013. Detailed correlation and astronomical forcing within the Upper… Boletín Geológico y Minero, 124 (2): 253-282
tive to the K/Pg boundary. It looks as though they have added the duration of the Maastrichtian part of chron C29r (0.3 My), C30n (1.9 My), C30r (~0.12 My) and C31n (~0.9 My), which combine data from sites 1267B and 525A, as they report in Table 1, although it still remains unclear which orbital cycles they base their counting and duration estimates upon. Anyway, we could take the absolute age of the eccentricity maximum between cycles E32 and E33 in the La2010d solution (69 027 Ma) and add two precession cycles to account for the in-ferred position at cycle PE20, just below the eccentricity maximum, to reach a figure of ~69.08 Ma or ~3.08 My from the K/Pg boundary (Fig. 20).
Furthermore, the cyclostratigraphic framework al-lows us to estimate the duration of the 3rd-order depo-sitional sequences, which have been interpreted as controlled by sea-level variations (see Introduction). It is obvious that a rate of close to 1.2 My seems to be valid for the two late Maastrichtian depositional sequences UMa-1 and UMa-2 (Fig. 20). The duration of 1.28 My estimated for UMa-1 comes directly from counting precession-related couplets for Units 10-11 (61 cycles, PK12–PK72) and taking an average duration of ~21 ka (Fig. 20). The estimate of 1 164–1 205 Ma for UMa-2 derives from the use of two slightly different calculations. One (1 205 Ma) relies on the addition of 32 precession cycles plus 5.5 short eccentricity cycles with an estimated duration of 97 ky (Maastrichtian mean duration calculated from the La2010d solution). The second (1 164 Ma) is based on an estimation of 12 short eccentricity cycles for the interval compris-ing Units 7–9 (Fig. 20). We also note that the Ma-Da depositional sequence fits the same pattern and dura-tion as it comprises 8 (possibly 9) eccentricity cycles in the Danian (cf. Dinarès-Turell et al., 2003) and 2-3 in the Maastrichtian part. The sea-level drop at the base of UMa-2 close to the Lower/Upper Maastrichtian boundary may be a causal factor in the mid-Maas-trichtian extinction which affected the Inoceramidae, rudist bivalves and other molluscs, as well as a sharp decline in the ammonites (cf. Ward et al., 1991; Ward and Kennedy, 1993). Stable isotope data from inocer-amid shells throughout the latest Lower Maastrich-tian in the Basque Basin, which have undergone the diagenetic effects of burial processes, still preserve the trends of palaeo-environmental signals (Gómez-Alday et al., 2004). These authors have inferred a cool-ing trend following a decline in abundance and diver-sity before the final inoceramid extinction. The record of the boreal inoceramid Spyridoceramus tegulatus, which coincides with the positive d18O excursion in their defined stage, E2, throughout the upper part of lithological Unit 5 and Unit 6 , suggests the entry of deep, cold, oxygenated waters arriving from the North
Atlantic. These observations confirm the modification of the thermocline and the onset of climatic cooling close to the Early/Late Maastrichtian boundary.
The clear imprint of sea-level fluctuation, as evi-denced by the Upper Maastrichtian 3rd-order deposi-tional sequences, with a rhythm of about 1.2 My, is thus consistent with a long-period obliquity influence on sea level. Such type of scenario during the Oligo-cene has been shown to be related to carbon-cycle events and glacial periodicity. Possible drivers for this long-period linkage between orbital cycles, sea level and the carbon cycle during the Cretaceous green-house, a time during which continental ice sheets are presumed to have been either ephemeral or non-ex-istent, have been considered (Wendler et al., 2011). In a study of the Cenomanian-Turonian carbonate plat-forms in Jordan, these authors postulate that system-atic changes in weathering patterns consistent with variable freshwater transport between the ocean and land, support the hypothesis that freshwater storage in aquifers played an important role in modulating eustasy. We believe that the Campanian-Maastrichtian succession in the Basque Basin can in the near future not only contribute towards an improvement of the general chronostratigraphy and a new generation of the Geological Time Scale, but also shed light upon many intriguing palaeoclimatic trends and features in response to orbital forcing.
Conclusions
1) A bed-by-bed comprehensive correlation hasbeen established for the Upper Maastrichtianhemipelagic succession in the Basque Basin atZumaia, Sopelana I and Hendaia, comprisingthe classical lithological Units 6–12 describedby Wiedmann (1988) which span about 150 m ofstratigraphic thickness at Zumaia, equal to ~3.1My time.
2) An available carbonate proxy record for the up-permost Units 10–12 throughout 64 m of a sec-tion containing 72 marl-limestone couplets atZumaia is used for spectral analysis to recoverthe full hierarchy of orbital cycles that include,besides the precession-related couplets of 21ky mean duration, the short (~100 ky) and long(405 ka) eccentricity cycles. Cycle counting andthe stacking of eccentricity-related bundles isfollowed downsection and correlated among thestudied sections.
3) Strategic palaeomagnetic sampling was con-ducted to delineate the two main reversals with-in the Upper Maastrichtian, the C31r/C31n and

279
Dinarès-Turell, J. et al. 2013. Detailed correlation and astronomical forcing within the Upper… Boletín Geológico y Minero, 124 (2): 253-282
C30n/C29r chron boundaries. The dataset for the upper reddish Units 11–12 at Sopelana I, Zumaia and Hendaia, which should contain C30n/C29r, indicates that those lithologies have been re-magnetized by a relatively complex mechanism and appear useless for magnetostratigraphic purposes, casting some doubt on earlier results at Sopelana that we have not been able to repro-duce. Instead, the grey lithologies from Unit 6 host a weak but primary magnetization, allowing the unambiguous identification of the C31r/C30n reversal boundary at the three studied sections, which can be placed in a solid cyclostratigraphic template, superseding previous studies.
4) An integrated high-resolution calcareous nanno-fossil biostratigraphy is established for the entire Upper Maastrichtian, which can now be placed in the cyclo-magnetostratigraphic framework. The succession of the main documented nannofossil bioevents/biohorizons includes: (1) First occur-rence (FO) of Lithraphidites quadratus; (2) FO of Micula murus; (3) FO of Micula prinsii. Further-more, there are two additional bioevents, con-sidered to be of secondary importance, which complement the nannofossil biostratigraphic record. These are the FO of Cribrosphaerella da-niae and the FRO of Nephrolithus frequens in the uppermost part of the section.
5) The solid orbital chronostratigraphic frameworkindicates that previously established 3rd-order depositional sequences in the Upper Maastrich-tian reflect sea-level variations that seem to fol-low a strong 1.2 My periodicity, reflecting the long obliquity amplitude modulation cycle.
6) The cycle duration estimate relative to the K/Pgboundary for the position of the base of chron C31n, which we propose as an alternative to de-fine the Early/Late Maastrichtian boundary, is 3.08 My (69.08 My with the option of the K/Pg at about 66 My). This is in line with current calibra-tions of this chron from deep-sea records (Hus-son et al., 2011; Thibault et al., 2012).
7) Together with earlier work in the Palaeocene,the extension of the cyclostratigraphic frame-work into the Maastrichtian, as suggested here, positions the hemipelagic succession in the Basque Basin in a potentially primary role as a geological aid for critical developments of the astronomical solutions that are inaccurate in these older times and also to answer key ques-tions regarding the palaeoclimatic evolution of the Mesozoic greenhouse period in response to orbital forcing.
Acknowledgements
Funding for this research was provided by project CGL2011-23770 of the Spanish Ministerio de Econo-mia y Competividad. JDT acknowledges a sabbatical grant from the Spanish Ministerio de Educación by means of el Programa Nacional de Movilidad de Re-cursos Humanos del Plan Nacional de I-D+i 2008-2011. Beatriz Bádenas, Lluís Cabrera and an anonymous reviewer are thanked for numerous suggestions that have improved the clarity of the paper. Asier Hilario (Scientific coordinator of the Deba-Zumaia biotope/Basque Coast Geopark) is thanked for the never fail-ing warmth of his welcome at the Zumaia outcrops.
References
Arz, J.A. and Molina, E. 2002. Bioestratigrafía y Cro-noestratigrafía con foraminíferos planctónicos del Cam-paniense superior y Maastrichtiense de latitudes temp-ladas y subtropicales (España, Francia y Tunicia). Neues Jahrbuch für Geologie und Paläntologie. Monatshefte, 224, 161–195.
Baceta, J.I., Pujalte, V., Serra-Kiel, J., Robador, A. and Orue-Etxebarria, X. 2004. El Maastrichtiense final, Paleoceno e Ilerdiense inferior de la Cordillera Pirenaica. In: Vera, J.A., (ed.), Geología de España. Sociedad Geológica de España, Instituto Geológico y Minero de España, Madrid, 308–313.
Berger, A. 1978. A simple algorithm to compute long term variations of daily or monthly insolation. Contribution de l’institut d’astronomie et géophysique G. Lemaitre, 18, Université catholique, Louvain-la-Neuve.
Berggren, W.A., Kent, D.V., Swisher C.C. and Aubry M.-P. 1995. A revised Cenozoic geochronology and chronos-tratigraphy. In: W.A. Berggren, D.V. Kent, M.-P. Aubry, J. Hardenbol (eds.), Geochronology Time Scales and Global Stratigraphic Correlation Special. Publication., 54, SEPM, Tulsa, OK, 129–212.
Bown P.R and Young J.R. 1998. Techniques. In: Bown P.R. (ed.) Calcareous Nannofossil Biostratigraphy. British Mi-cropalaeontology Society Series. Chapman and Hall/Klu-wer Academic Publishers, London, 16–28.
Burnett, J.A., (with contributions from Gallagher, L.T., and Hampton, M.J.), 1998. Upper Cretaceous. In: Bown, P.R. (ed.), Calcareous Nannofossil Biostratigraphy. British Micropalaeontological Society Publications Series. Chap-man and Hall/Kluwer Academic Publishers, London, 132–199.
Burnett, J.A., Kennedy, W.J. and Ward, P.D. 1992. Maastrich-tian nannofossil biostratigraphy in the Biscay region (south–western France, northern Spain). Newsletters on Stratigraphy, 26, 145–155.
Dinarès-Turell, J., Baceta, J.I., Pujalte, V., Orue-Etxebarria, X. and Bernaola, G. 2002. Magnetostratigraphic and cy-clostratigraphic calibration of a prospective Paleocene/

280
Dinarès-Turell, J. et al. 2013. Detailed correlation and astronomical forcing within the Upper… Boletín Geológico y Minero, 124 (2): 253-282
Eocene stratotype at Zumaia (Basque basin, Northern Spain). Terra Nova, 14, 371–378.
Dinarès-Turell, J., Baceta, J.I., Pujalte, V., Orue-Etxebarria, X., Bernaola, G. and Lorito, S. 2003. Untangling the Pa-leocene climatic rhythm; an astronomically calibrated early Paleocene magnetostratigraphy and biostratigra-phy at Zumaia (Basque Basin, northern Spain). Earth and Planetary Science Letters, 216, 483–500.
Dinarès-Turell, J., Baceta, J.I., Bernaola, G., Orue-Etxebarria, X. and Pujalte, V. 2007. Closing the Mid-Paleocene gap: to-ward a complete astronomically tuned Paleocene Epoch and Selandian and Thanetian GSSPs at Zumaia (Basque Basin, W Pyrenees). Earth and Planetary Science Letters, 262, 450–467.
Dinarès-Turell, J., Stoykova, K., Baceta, J.I., Ivanov M. and Pujalte, V. 2010. High-resolution intra- and interbasinal correlation of the Danian-Selandian transition (Early Pa-leocene): the Bjala section (Bulgaria) and the Selandian GSSP at Zumaia (Spain). Palaeogeography, Palaeoclima-tology, Palaeocology, 297, 511–533.
Dinarès-Turell, J., V. Pujalte, Stoykova, K., Baceta, J.I., and Ivanov M. 2012. The Paleocene “top chron C27n” tran-sient greenhouse episode: evidences from marine pe-lagic Atlantic and peri-Tethyan sections. Terra Nova. doi: 10.1111/j.1365-3121.2012.01086.x
Gardin, S., Galbrun, B., Thibault, N., Coccioni, R., Premoli Silva, I. 2012. Biomagnetochronology for the upper Cam-panian - Maastrichtian from the Gubbio area, Italy: new results from the Contessa Highway and Bottaccione sec-tions. Newsletters on Stratigraphy 45. doi:10.1127/0078-0421/2012/0014.
Gómez-Alday, J.J., López, G. and Elorza, J. 2004. Evidence of climatic cooling at the Early/Late Maastrichtian bound-ary from inoceramid distribution and isotopes: Sopelana sections, Basque Country, Spain. Cretaceous Research, 25, 649–668.
Gómez-Alday, J.J., Zuluaga, M.C., and Elorza, J. 2008. 87Sr/86Sr ratios in inoceramids (Bivalvia) and carbonate matrix as indicators of differential diagenesis during burial. Early Maastrichtian Bay of Biscay sections (Spain and France). Potential use for chemostratigraphy?. Creta-ceous Research, 29, 1–14.
Gradstein, F., Ogg, J. and Smith, A.2004. A Geological Tim-escale 2004, Cambridge Univ. Press, Cambridge, U. K., doi:10.4095/215638.
Gradstein, F.M., Ogg, J.G., Schmitz, M.D. and Ogg, G.M. 2012. The Geological Time Scale 2012. Elsevier, 1176 pp.
Herbert, T.D. 1999. Towards a composite orbital chronology for the Late Cretaceous and Early Paleogene GPTS. In: Shackleton, N.J., McCave, I.N., Weedon, G.P. (eds.), Philo-sophical Transactions of the Royal Society of London. A, 1891–1905.
Herbert, T.D., Premoli-Silva, I., Erba, E., Fischer, A.G. 1995. Orbital Chronology of Cretaceous–Paleocene Marine Sed-iments. In: Berggren, W.A., Kent, D.V., Aubry, M.P., Hard-enbol, J. (eds.), Geochronology, Time Scales and Global Stratigraphic Correlation. Spec. Publ., SEPM, 81–93.
Herm, D. 1963. Mikropaläontologisch-stratigraphische un-tersuchungen im Kreideflisch zwischen Deva und Zu-
maya (prov. Guipúzcoa, Nordspanien). Zeitschrift der Deutschen Geologischen Gesellschaft, 15, 277–348.
Husson, D., Galbrun, B., Laskar, J., Hinnov, L., Thibault, N., Gardin, S. and Locklair, R.E. 2011. Astronomical calibra-tion of the Maastrichtian (late Cretaceous). Earth and Planetary Science Letters 305, 328–340.
Hilgen, F. J., Kuiper, K. F. and Lourens L. J. 2010. Evaluation of the astronomical time scale for the Paleocene and ear-liest Eocene. Earth and Planetary Science Letters, 300, 139–151, doi:10.1016/j.epsl.2010.09.044.
Kent, D.V. 1999. Orbital tuning of geomagnetic polarity time-scales. Phil. Transactions Royal Society London, 357, 1995-2007.
Kirschvink J.L. 1980. The least-squares line and plane and the analysis of palaeomagnetic data. Geophys. Geo-physical Journal of the Royal Astronomical Society, 62, 699–718.
Kuiper, K.F., Deino, A., Hilgen, F.J., Krijgsman, W., Renne, P.R. and Wijbrans, J.R. 2008. Synchronizing rock clocks of Earth history. Science, 320, 500–504.
Lamolda, M.A. 1985. Biostratigraphie du Maastrichtien bas-co-cantabrique: ses foraminifères planctoniques. Géolo-gie Méditerranéenne 10 (for 1983), 121–126.
Lamolda, M.A. and Gorostidi, A. 1994. Nanoflora y acon-tecimientos del tránsito Cretácico–Tercia rio. Una visión desde la región Vascocantábrica. Revista de la Sociedad Mexicana de Paleontología, 7, 54–58.
Laskar, J., Robutel, P., Joutel, F., Gastineau, M., Correia, A.C.M. and Levrard, B. 2004. A long-term numerical so-lution for the insolation quantities of the Earth. Astron. Astrophys., 428, 261–285.
Laskar, J., Gastineau, M., Delisle, J.B., Farrés, A. and Fienga, A. 2011a. Strong chaos induced by close encounters with Ceres and Vesta. A&A, 532, L4.
Laskar, J., Fienga, A., Gastineau, M. and Manche, H. 2011b. La2010: A new orbital solution for the long term motion of the Earth. A&A, 532, A89.
Lees, J. A. 2007. New and rarely reported calcareous nanno-fossils from the Late Cretaceous of coastal Tanzania: out-crop samples and Tanzania Drilling Project Sites 5, 9 and 15. Journal of Nannoplankton Research, 29, 39-65.
Lees, J.A., Bown, P.R. 2005. Upper Cretaceous calcareous nannofossil biostratigraphy, ODP Leg 198 (Shatsky Rise, northwest Pacific Ocean). Proceedings of the Ocean Drill-ing Program, Scientific Results 198, 1–60. doi:10.2973/odp.proc.sr.198.114.2005.
Liu, Y., Liang, X.S. and Weisberg, R.H. 2007. Rectification of the bias in the wavelet power spectrum. Journal of Atmo-spheric and Oceanic Technology, 24, 2093–2102.
Lourens, L. J., Hilgen, F. J., Laskar, J., Shackleton, N. J. and Wilson, D. 2004. The Neogene Period. In: F. Gradstein, J. Ogg, and A. Smith (eds.), A Geological Timescale 2004, Cambridge Univ. Press, Cambridge, U. K., 409–440.
MacLeod, K.G. 1994. Extinction of inoceramid bivalves in Maastrichtian strata of the Bay of Biscay region of France and Spain. Journal of Paleontology, 68, 1048-1066.
MacLeod, K.G. and Orr, W.N. 1993. The taphonomy of Maas-trichtian inoceramids in the Basque Region of France and Spain and the pattern of their decline and disappearance. Paleobiology, 19, 235–250.

281
Dinarès-Turell, J. et al. 2013. Detailed correlation and astronomical forcing within the Upper… Boletín Geológico y Minero, 124 (2): 253-282
Mary, C., Moreau, M.G., Orue-Etxebarria, X., Apellaniz, E. and Courtillot, V. 1991. Biostratigraphy and magneto-stratigraphy of the Cretaceous/Tertiary Sopelana section (Basque Country). Earth and Planetary Science Letters, 106, 133–150.
Mathey, B., 1982. El Cretácico del Arco Vasco. In: García, E. (ed.), El Cretácico de España. Universidad Complutense de Madrid, 111–135.
Molina, E., Alegret, L., Arenillas, I., Arz, J.A., Gallala, N., Gra-jalese Nishimura, M., Murilloe Muñetón, G., Zaghbibe Turki, D. 2009. The Global Boundary Stratotype Section and Point for the base of the Danian Stage (Paleocene, Paleogene, “Tertiary”, Cenozoic): auxiliary sections and correlation. Episodes, 32, 84–95.
Moreau, M.G., Cojan, I., Ory, J. 1994. Mechanisms of rema-nent magnetization in marl and limestone alternations. Case study: Upper Cretaceous (Chron 31–30), Sopelana, Basque Country. Earth and Planetary Science Letters 123, 15–37
Mount, J.J., Ward, P.D. 1986. Origin of limestone/marl alter-nations in the Upper Maastrichtian of Zumaya, Spain. Journal of Sedimentary Petrology, 56, 228–236.
Paillard, D., Labeyrie, L. and Yiou, P. 1996. Macintosh pro-gram performs time-series analysis, EOS Trans. AGU, 77, 339.
Paul, C.R.C. and Lamolda, M.A. 2007. Carbon and oxygen stable isotopes in the Maastrichtian of the Basque Coun-try, N. Spain. Cretaceous Research, 28, 812–820.
Perch-Nielsen, K. 1985. Mesozoic calcareous nannofos-sils. In: Bolli, H.M., Saunders, J.B., and Perch-Nielsen, K. (eds.), Plankton Stratigraphy. Cambridge Univ. Press, Cambridge, 329–426.
Plaziat, J.C. 1981. Late Cretaceous to Late Eocene pa-laeogeographic evolution of southwest Europe. Pa-laeogeography, Palaeoclimatology, Palaeoecology, 36, 263–293.
Posamentier, H. W. and Vail, P. R. 1988. Eustatic control on clastic deposition II- Sequence and System Tract mod-els. In: Wilgus C.K. et al., (eds.), Sea-Level Changes: an integrated approach. SEPM (Society of Economic Pale-ontologists and Mineralogists) Special Publication, 42, 125–154.
Pujalte, V., Baceta, J.I., Payros, A., Orue-Etxebarria, X. and Serra-Kiel, J. 1994. Late Cretaceous-Middle Eocene Se-quence Stratigraphy and Biostratigraphy of the SW. and W. Pyrenees (Pamplona and Basque Basins, Spain), 118 pp., GEP /IGCP 286 Field Seminar Guide-Book, Basque Country Univ., Bilbao.
Pujalte, V., Baceta, J.I., Dinarès-Turell, J., Orue-Etxebarria, X. Parès, J.M. and Payros, A. 1995. Biostratigraphic and magnetostratigraphic intercalibration of late Maastrich-tian and Paleocene depositional sequences from the deep-water Basque basin, W Pyrenees, Spain. Earth and Planetary Science Letters, 136, 17–30.
Roth, P. H. 1978. Cretaceous nannoplankton biostratigraphy and oceanography of northwestern Atlantic Ocean. Initial Reports of the DSDP, 44, 731-760.
Schmitz, B., Pujalte, V., Molina, E., Monechi, S., Orue-Etxe-barria, X., Speijer, R.P., Alegret, L., Apellaniz, E., Arenil-las, I., Aubry, M-P, Baceta J.I., Berggren, W.A., Bernaola,
G., Caballero, F., Clemmensen, A., Dinarès-Turell, J., Du-puis, C., Heilmann-Clausen, C., Hilario Orús, A., Knox, R., Martín-Rubio, M., Ortiz, S., Payros, A., Petrizzo, M.R., Sprong, J., Steurbaut, E. and Thomsen, E. 2011. The global stratotype sections and points for the bases of the Selandian (Middle Paleocene) and Thanetian (Up-per Paleocene) stages at Zumaia, Spain. Episodes, 34, 220–243.
Sissingh, W. 1977. Biostratigraphy of Cretaceous calcareous nannoplankton. Geologie en Mijnbouw, 56, 37-65.
Ten Kate, W.G. and Sprenger, A. 1993. Orbital cyclicities above and below the Cretaceous/Paleogene boundary at Zumaya (N Spain), Agost and Relleu (SE Spain). Sedi-mentary Geology, 87, 69–101.
Thibault, N. 2010. Calcareous nannofossils from the boreal Upper Campanian-Maastrichtian chalk of Denmark. Jour-nal of Nannoplankton Research, 31, 1, 39-56.
Thibault, N., Gardin, S., Galbrun, B. 2010. Latitudinal migra-tion of calcareous nannofossil Micula murus in the Maas-trichtian: Implications for global climate change. Geol-ogy, 38, 203–206.
Thibault, N., Husson, D., Harlou, R., Gardin, S., Galbrun, B., Huret, E. and Minoletti, F. 2012. Astronomical calibration of upper Campanian-Maastrichtian carbon isotope events and calcareous plankton biostratigraphy in the Indian Ocean (ODP Hole 762C): implication for the age of the Campanian-Maastrichtian boundary. Palaeogeography, Palaeoclimatology, Palaeoecology, 337-338, 52-71.
Torrence, C. and Compo, G.P. 1998. A practical guide to wavelet analysis. Bulletin American Meteorological So-ciety, 79, 61–78.
von Hillebrandt, A. 1965. Foraminiferen-Stratigraphie im Alt-tertiär von Zumaia (prov. Guipuzcoa, NW Spanien) und ein Vergleich mit anderen Tethys-Gebieten. Abh. Kön. Bay, Akad. Wiss. München, 123, 1–63.
Varadi, F., Runnegar, B. and Ghil, M. 2003. Successive re-finements in long-term integrations of planetary orbits. Astrophysical Journal, 592, 620–630.
Ward, P.D., Wiedmann, J. and Mount, J.J. 1986. Maastrich-tian molluscan biostratigraphy and extinction patterns in a Cretaceous/Tertiary boundary section exposed at Zu-maya, Spain. Geology, 14, 899–903.
Ward, P. D. 1988. Maastrichtian ammonite and Inocer-amid ranges from the bay of Biscay Cretaceous-Tertiary boundary sections. Revista Española de Paleontología, nº Extraordinario, Paleontology and Evolution: Extinction Events, 119–126.
Ward, P.D., Kennedy,W.J., MacLeod, K.G. and Mount, J.F. 1991. Ammonite and inoceramid bivalve extinction pat-terns in Cretaceous/Tertiary boundary sections of the Bis-cay region (southwestern France, northern Spain). Geol-ogy 19, 1181–1184
Ward, P.D. and Kennedy, W.J. 1993. Maastrichtian ammo-nites from the Biscay Region (France, Spain). Journal of Paleontology Memoir , 34, 1–58.
Wendler, J.E., Meyers, S.R., Wendler, I., Vogt, C., Kuss, J. 2011. Drivers of Cyclic Sea Level Change During the Cre-taceous Greenhouse: A new Perspective from the Levant Platform (Jordan), Geological Society of America, Ab-stracts with Programs, 43(5), 376.

282
Dinarès-Turell, J. et al. 2013. Detailed correlation and astronomical forcing within the Upper… Boletín Geológico y Minero, 124 (2): 253-282
Westerhold, T., Roehl, U., Raffi, I., Forniaciari, E., Monechi, S., Reale, V., Bowles, J. and Evans, H.F. 2008. Astronomi-cal calibration of the Paleocene time. Palaeogeography, Palaeoclimatology, Palaeocology, 257, 377–403.
Westerhold, T., Röhl, U., Donner, B., McCarren, H.K. and Zachos, J.C. 2011. A complete high-resolution Paleo-cene benthic stable isotope record for the central Pa-cific (ODP Site 1209). Paleoceanography, 26, PA2216, doi:10.1029/2010PA002092.
Westerhold, T., Röhl, U. and Laskar, J. 2012. Time scale con-troversy: Accurate orbital calibration of the early Paleo-
gene, Geochemistry Geophysics Geosystems, 13, Q06015, doi:10.1029/2012GC004096.
Wiedmann, J. 1988. The Basque coastal sections of the K/T boundary –a key to understanding “mass extinctions” in the fossil record. No. Extraordinario. In: Lamolda, M.A., Kauffman, E.G.,Walliser, O.H. (eds.), Paleontology and Evolution: Extinction Events. Revista Española de Pale-ontología, 127–140.
Zijderveld, J.D.A. 1967. AC demagnetisation of rock: analysis of results. In: D.W. Collinson and others (eds.), Methods in palaeomagnetism. Elsevier, Amsterdam, 254–286.
Recibido: noviembre 2012Revisado: diciembre 2012Aceptado: enero 2013Publicado: junio 2013