Embed Size (px)
Citation preview
Clim. Past, 17, 2393–2425, 2021https://doi.org/10.5194/cp-17-2393-2021© Author(s) 2021. This work is distributed underthe Creative Commons Attribution 4.0 License.
Maastrichtian–Rupelian paleoclimates in the southwest Pacific –a critical re-evaluation of biomarker paleothermometry anddinoflagellate cyst paleoecology at Ocean DrillingProgram Site 1172Peter K. Bijl1, Joost Frieling1,a, Margot J. Cramwinckel1,b, Christine Boschman1, Appy Sluijs1, and Francien Peterse1
1Department of Earth Sciences, Utrecht University, Utrecht, the Netherlandsanow at: Department of Earth Sciences, University of Oxford, South Parks Road OX1 3AN, Oxford, UKbnow at: School of Ocean and Earth Science, National Oceanography Centre Southampton,University of Southampton, Southampton, UK
Correspondence: Peter K. Bijl ([email protected])
Received: 24 February 2021 – Discussion started: 11 March 2021Revised: 27 September 2021 – Accepted: 4 October 2021 – Published: 25 November 2021
Abstract. Sea surface temperature (SST) reconstructionsbased on isoprenoid glycerol dialkyl glycerol tetraether(isoGDGT) distributions from the Eocene southwest (SW)Pacific Ocean are unequivocally warmer than can be rec-onciled with state-of-the-art fully coupled climate models.However, the SST signal preserved in sedimentary archivescan be affected by contributions of additional isoGDGTsources. Methods now exist to identify and possibly correctfor overprinting effects on the isoGDGT distribution in ma-rine sediments. Here, we use the current proxy insights to(re-)assess the reliability of the isoGDGT-based SST signalin 69 newly analyzed and 242 reanalyzed sediments at OceanDrilling Program (ODP) Site 1172 (East Tasman Plateau,Australia) following state-of-the-art chromatographic tech-niques. We compare our results with paleoenvironmentaland paleoclimatologic reconstructions based on dinoflagel-late cysts. The resulting ∼ 130 kyr resolution Maastrichtian–Oligocene SST record based on the TetraEther indeX oftetraethers with 86 carbon atoms (TEX86) confirms previ-ous conclusions of anomalous warmth in the early EoceneSW Pacific and remarkably cool conditions during the mid-Paleocene. Dinocyst diversity and assemblages show a strongresponse to the local SST evolution, supporting the robust-ness of the TEX86 record. Soil-derived branched GDGTsstored in the same sediments are used to reconstruct meanannual air temperature (MAAT) of the nearby land using theMethylation index of Branched Tetraethers with 5-methyl
bonds (MBT’5me) proxy. MAAT is consistently lower thanSST during the early Eocene, independent of the calibrationchosen. General trends in SST and MAAT are similar, ex-cept for (1) an enigmatic absence of MAAT rise during thePaleocene–Eocene Thermal Maximum and Middle EoceneClimatic Optimum, and (2) a subdued middle–late EoceneMAAT cooling relative to SST. Both dinocysts and GDGTsignals suggest a mid-shelf depositional environment withstrong river runoff during the Paleocene–early Eocene pro-gressively becoming more marine thereafter. This trend re-flects gradual subsidence and more pronounced wet/dry sea-sons in the northward-drifting Australian hinterland, whichmay also explain the subdued middle Eocene MAAT cool-ing relative to that of SST. The overall correlation be-tween dinocyst assemblages, marine biodiversity and SSTchanges suggests that temperature exerted a strong influ-ence on the surface-water ecosystem. Finally, we find sup-port for a potential temperature control on compositionalchanges of branched glycerol monoalkyl glycerol tetraethers(brGMGTs) in marine sediments. It is encouraging that a crit-ical evaluation of the GDGT signals confirms that most of thegenerated data are reliable. However, this also implies thatthe high TEX86-based SSTs for the Eocene SW Pacific andthe systematic offset between absolute TEX86-based SSTand MBT’5me-based MAAT estimates remain without defini-tive explanation.
Published by Copernicus Publications on behalf of the European Geosciences Union.
2394 P. K. Bijl et al.: Maastrichtian–Rupelian paleoclimates in the southwest Pacific
1 Introduction
1.1 The Paleogene southwest Pacific Ocean
Reconstructions of deep-sea (Westerhold et al., 2020) and seasurface temperature (Bijl et al., 2009, 2013a; Hollis et al.,2012, 2019; Frieling et al., 2014; Inglis et al., 2015; O’Brienet al., 2017; Evans et al., 2018; Cramwinckel et al., 2018;O’Connor et al., 2019; Sluijs et al., 2020) have revealedan overall cool climate in the Maastrichtian and Paleocene,long-term warming towards the early Eocene Climatic Op-timum (EECO; 53.4–49.2 Ma) and subsequent cooling dur-ing the middle and late Eocene (48.6–33.6 Ma). The EECOstands out as particularly warm, with ice-free polar regions(Hollis et al., 2009, 2012; Pross et al., 2012; Bijl et al., 2013a;Frieling et al., 2014; Hines et al., 2017). Certain southernhigh-latitude regions retain warm–temperate conditions intothe late Eocene (Bijl et al., 2009; Liu et al., 2009; Houbenet al., 2019) and, despite ample evidence for pronouncedAntarctic glacial expansion across the Eocene–Oligocenetransition (EOT) (Salamy and Zachos, 1999; Bohaty et al.,2012), even into the early Oligocene (Passchier et al., 2013,2017; Hartman et al., 2018; O’Brien et al., 2020). Varia-tions in atmospheric CO2 concentrations (Anagnostou et al.,2016, 2020; Foster et al., 2017) are likely the primary driverof these multi-million-year climatic trends (Cramwinckel etal., 2018). While equatorial proxy-based sea surface temper-atures (SSTs) and deep-sea temperatures, assumed to reflecthigh-latitude SSTs, show good correspondence with numer-ical model simulations under Eocene boundary conditionsand with varying CO2 forcing (Cramwinckel et al., 2018),proxy-based SST reconstructions of the southwest (SW) Pa-cific remain warmer than those from model simulations (Bijlet al., 2009; Cramwinckel et al., 2018; Hollis et al., 2019;Crouch et al., 2020; Lunt et al., 2021), despite proposed zonalheterogeneity (Douglas et al., 2014). Specifically, numericalclimate models are currently unable to simulate a paleocli-mate in which the annual SST difference between the equa-torial Atlantic Ocean (Cramwinckel et al., 2018) and the SWPacific Ocean (Hollis et al., 2012; Bijl et al., 2013a) is assmall as the proxy data suggest. Mechanisms explaining thismismatch might be found in the geographic boundary con-ditions and spatial resolution of the numerical models, andthe limitations of the proxies to reflect absolute temperatures.The absolute SST estimates for the SW Pacific are closer tothose from the equatorial regions than they are to the deepsea (Cramwinckel et al., 2018), which is implausible giventhat the South Pacific is inferred to have been the dominantregion of deep-water formation during the Eocene (Huberand Thomas, 2010; Thomas et al., 2003, 2014). Without thismodel–data mismatch resolved, it remains unclear to whatextent climate models properly simulate polar amplificationor, alternatively, if the current proxies properly reflect high-latitude temperatures under greenhouse conditions (Lunt etal., 2012).
Proxy evidence for warmth in the Eocene derives from asuite of organic and calcite-based proxies for marine or ter-restrial temperature. SST reconstructions of the SW PacificOcean have primarily relied on organic geochemical prox-ies, mainly the TetraEther indeX of tetraethers with 86 car-bon atoms (TEX86) (Sluijs et al., 2011; Hollis et al., 2009,2012; Bijl et al., 2009, 2013a; Cramwinckel et al., 2020;Crouch et al., 2020). Although absolute temperatures havesignificant uncertainties, they have been broadly confirmedby robust oxygen isotope ratios (δ18O) and trace element ra-tios (Mg/Ca) from well-preserved planktonic foraminiferafrom Eocene sections in New Zealand (Hollis et al., 2009,2012; Creech et al., 2010; Hines et al., 2017; Crouch et al.,2020). These proxies require assumptions regarding seawa-ter chemistry (Mg/Ca, δ18O seawater, pH) that also carrysignificant uncertainty (e.g., Evans et al., 2018; Kozdon etal., 2020), and these uncertainties may affect trends in multi-million-year carbonate-based reconstructions. The applica-tion of clumped isotope paleothermometry can reduce someof the uncertainties surrounding carbonate-based proxies andprovide additional SST constraints (Evans et al., 2018), ashas been demonstrated in work on Seymour Island (Douglaset al., 2014).
Pollen-based vegetation reconstructions from NewZealand, Tasmania and Wilkes Land (Carpenter et al., 2012;Pross et al., 2012; Contreras et al., 2013, 2014; Huurdemanet al., 2020) present mean annual air temperature (MAAT)reconstructions which confirm the warm conditions fromSST proxies. Here, uncertainties on absolute temperaturesare dependent on the diversity of the pollen assemblage,and the temperature tolerances of nearest living relatives(NLRs). Uncertainties increase when evolutionary distancesto NLRs are large. In general, vegetation-based recon-structions arguably deliver the best constraints on wintertemperatures. This is because of fundamental physiologicalrestrictions in individual tolerances of plants (e.g., Reichgeltet al., 2018), whereas MAAT exerts much less controlon the standing vegetation than seasonal temperature and(seasonal) hydrological extremes. Absolute air temperaturereconstructions from soil-derived lipid biomarkers (e.g.,using brGDGT-based paleothermometry; e.g., Weijers et al.,2007a; De Jonge et al., 2014a) have also yielded MAATreconstructions for the Eocene (Pancost et al., 2013; Bijl etal., 2013a; Huurdeman et al., 2020; Lauretano et al., 2021).The resulting MAAT records are more in line with numericalmodel simulations (Lunt et al., 2021) but considerablycolder than the SSTs from the same sections. This is difficultto reconcile in a coastal climate setting, where SST andadjacent air temperature should be broadly consistent.
These uncertainties in lipid-based absolute temperature re-constructions have been put forward as the underlying rea-son for the data–model mismatch in past climate reconstruc-tions. This sparked major research efforts to improve under-standing of proxy functioning and potential confounding fac-tors, ultimately to improve the accuracy of biomarker-derived
Clim. Past, 17, 2393–2425, 2021 https://doi.org/10.5194/cp-17-2393-2021
P. K. Bijl et al.: Maastrichtian–Rupelian paleoclimates in the southwest Pacific 2395
temperature estimates, and to resolve the mismatch betweenmodel simulations and proxy data.
1.2 Advances in GDGT paleothermometry
TEX86 utilizes the correspondence of proportionally highernumbers of cyclopentane rings in sedimentary archaealmembrane lipids, the isoprenoid glycerol dialkyl glyceroltetraethers (isoGDGTs), with higher SST (Schouten et al.,2002). This relationship is attributed to a viscoelastic adap-tation of the membrane of pelagic Thaumarchaeota, thedominant source organisms of isoGDGTs, to temperature(Schouten et al., 2002, 2013). For some periods in geolog-ical deep time, including the Paleocene and Eocene, TEX86calibrations based on GDGTs in core-top sediments need tobe extrapolated above the modern SST range (∼ 30 ◦C) toestimate SST. It remains unclear if the relationship betweenSST and TEX86 is linear or exponential beyond the high endof the core-top calibration (e.g., Cramwinckel et al., 2018;Hollis et al., 2019). It is therefore recommended that bothlinear and exponential calibrations are presented, which typ-ically lead to higher and lower SST estimates, respectively(Hollis et al., 2019). Yet, as the absolute TEX86 values ofmany Eocene sediments exceed those observed for moderncore tops, even the most conservative calibrations yield SSTs> 30 ◦C in the warmest intervals. Increasingly, such temper-atures are corroborated by estimates from other SST proxies(e.g., Bijl et al., 2010; Douglas et al., 2014; Hines et al., 2017;Crouch et al., 2020).
Along with calibration uncertainties, a number of con-founding factors have been identified since the first pub-lication of the isoGDGT-based SST records from the SWPacific. These are related to a suite of pre-, syn- and post-depositional processes that might alter the pelagic isoGDGTsignal in marine sediments. In addition to the pelagic con-tribution, isoGDGT assemblages may include contributionsfrom methanogenic (Blaga et al., 2009) and methanotrophic(Weijers et al., 2011; Zhang et al., 2011) archaea, deep-dwelling archaea (Taylor et al., 2013) and terrestrial sources(Hopmans et al., 2004; Weijers et al., 2006). Various ap-proaches have been developed to recognize these contribu-tions, leading to more reliable SST reconstructions. How-ever, the influence of growth phase (Elling et al., 2014), andenvironmental ammonium and oxygen concentrations (Qinet al., 2015; Hurley et al., 2016) on sedimentary isoGDGTdistributions is still poorly constrained.
Branched GDGTs (brGDGTs) produced by soil bacteriacan be used to reconstruct MAAT. The Methylation indexof Branched Tetraethers with 5-methyl bonds (MBT’5me)(De Jonge et al., 2014a; Naafs et al., 2019; DearingCrampton-Flood et al., 2020) represents the degree of methy-lation of the 5-methyl brGDGTs which strongly respondsto MAAT. Studies on brGDGTs in marine sediments revealthat the MAAT evolution of Australian–New Zealand landmasses followed the trends in deep- and surface-ocean tem-
perature remarkably well but with lower absolute values thanSST (Bijl et al., 2013a; Pancost et al., 2013). With improvedanalytical techniques (Hopmans et al., 2016), brGDGT iso-mers with a methylation on the “5” or the “6” position of thealkyl chain can now be separated and quantified (De Jongeet al., 2013). With this separation, the pH co-dependence ofthe brGDGT signal can be removed by only considering 5-methyl brGDGTs that only respond to temperature (De Jongeet al., 2014a; Naafs et al., 2017a). The separation of brGDGTisomers also allows the recognition and correction of po-tential contributions of aquatic brGDGTs to the soil-derivedbrGDGT signal stored in marine sediments that complicatethe use of brGDGTs as continental paleothermometer in con-tinental margin sediments (Peterse et al., 2009; Tierney andRussell, 2009; Zell et al., 2013; De Jonge et al., 2014b, 2015;Sinninghe Damsté, 2016; Dearing Crampton-Flood et al.,2018).
Lipids from a related biomarker family, the branched glyc-erol monoalkyl glycerol tetraethers (brGMGTs), were iden-tified in the marine realm in core-top sediments (Liu et al.,2012), oxygen minimum zones (Xie et al., 2014) and Paleo-gene sediments (Sluijs et al., 2020). In the terrestrial realm,they were described in peats (Naafs et al., 2018a) and EastAfrican lake sediments (Baxter et al 2019), the latter iden-tifying seven individual brGMGTs. The brGMGTs containa covalent bond connecting the two alkyl chains, which isthought to enhance membrane stability at higher tempera-tures (Morii et al., 1998). The abundance of brGMGTs rela-tive to that of brGDGTs, as well as the relative distributionof brGMGT isomers, seems to vary with temperature in boththe terrestrial (Naafs et al., 2018a; Baxter et al., 2019; Tanget al., 2021) and marine realms (Sluijs et al., 2020), althoughthis is thus far only based on empirical relationships. The ex-act sources of these compounds in sedimentary archives andtheir temperature relation are as yet not fully understood. Forexample, brGMGTs in Paleogene Arctic Ocean sedimentsseem to be produced in a marine system with a strong oxy-gen minimum zone and substantial input of penecontempo-raneous terrestrial matter (Sluijs et al., 2020). Similar to thetemperature response of 5-methyl brGDGTs, the degree ofmethylation of acyclic brGMGTs (HMBTacyclic) follows theTEX86 in the Paleogene Arctic record. However, the index ofbrGMGTI, which was empirically calibrated to temperatureusing a suite of East African lake sediments (Baxter et al.,2019), does not (Sluijs et al., 2020).
1.3 Revisiting GDGTs and investigating brGMGTs atSite 1172
From the new insights about the GDGT-based proxies, it isclear that assessing the reliability of previously publishedGDGT-based temperature reconstructions requires a detailedreview of the depositional conditions. Moreover, the pres-ence and proxy potential of brGMGTs in the early PaleogeneSW Pacific has not yet been studied. To this end, we have
https://doi.org/10.5194/cp-17-2393-2021 Clim. Past, 17, 2393–2425, 2021
2396 P. K. Bijl et al.: Maastrichtian–Rupelian paleoclimates in the southwest Pacific
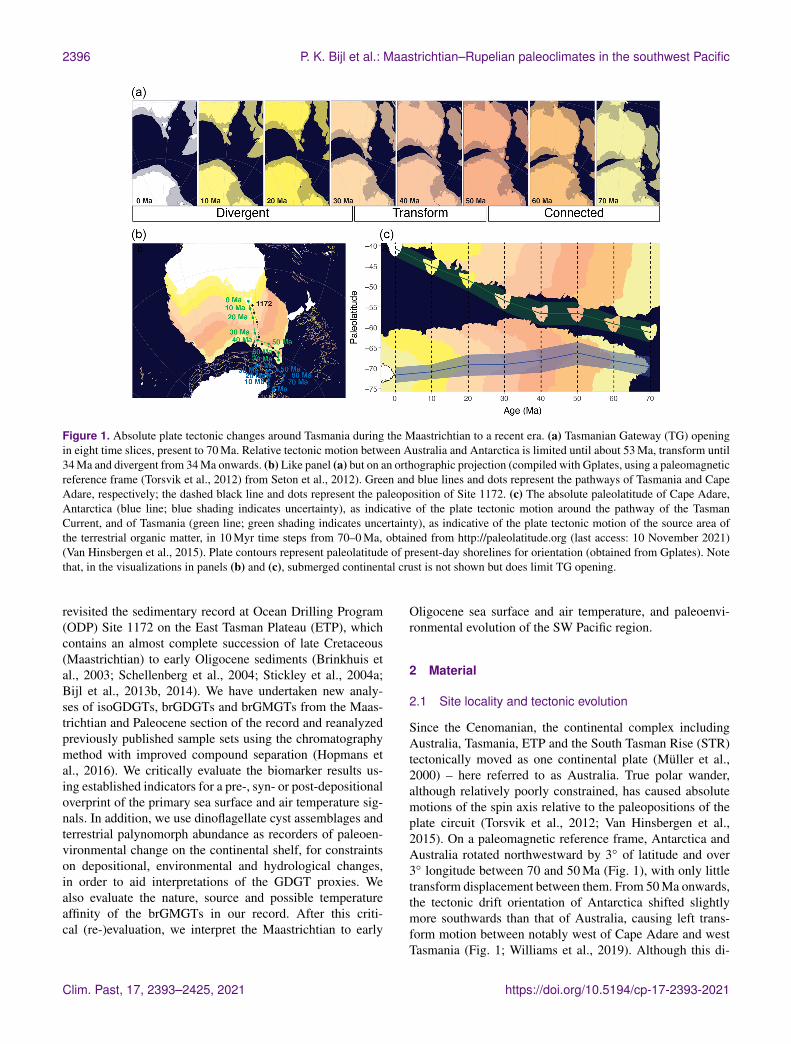
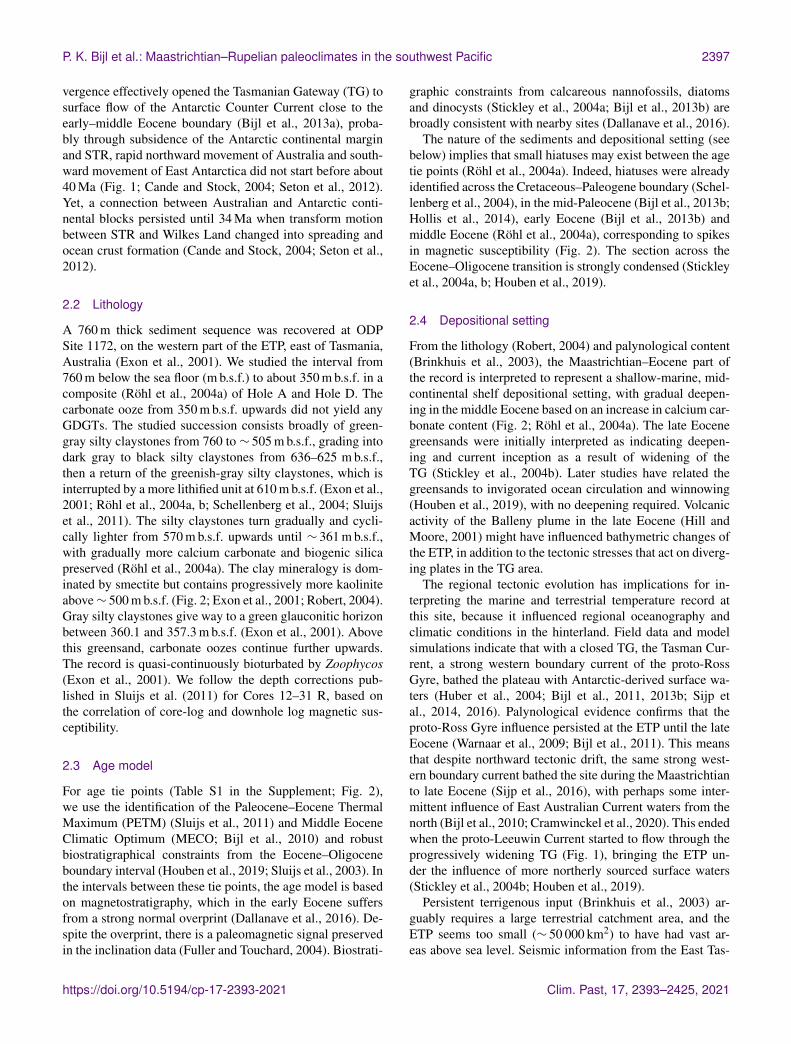
Figure 1. Absolute plate tectonic changes around Tasmania during the Maastrichtian to a recent era. (a) Tasmanian Gateway (TG) openingin eight time slices, present to 70 Ma. Relative tectonic motion between Australia and Antarctica is limited until about 53 Ma, transform until34 Ma and divergent from 34 Ma onwards. (b) Like panel (a) but on an orthographic projection (compiled with Gplates, using a paleomagneticreference frame (Torsvik et al., 2012) from Seton et al., 2012). Green and blue lines and dots represent the pathways of Tasmania and CapeAdare, respectively; the dashed black line and dots represent the paleoposition of Site 1172. (c) The absolute paleolatitude of Cape Adare,Antarctica (blue line; blue shading indicates uncertainty), as indicative of the plate tectonic motion around the pathway of the TasmanCurrent, and of Tasmania (green line; green shading indicates uncertainty), as indicative of the plate tectonic motion of the source area ofthe terrestrial organic matter, in 10 Myr time steps from 70–0 Ma, obtained from http://paleolatitude.org (last access: 10 November 2021)(Van Hinsbergen et al., 2015). Plate contours represent paleolatitude of present-day shorelines for orientation (obtained from Gplates). Notethat, in the visualizations in panels (b) and (c), submerged continental crust is not shown but does limit TG opening.
revisited the sedimentary record at Ocean Drilling Program(ODP) Site 1172 on the East Tasman Plateau (ETP), whichcontains an almost complete succession of late Cretaceous(Maastrichtian) to early Oligocene sediments (Brinkhuis etal., 2003; Schellenberg et al., 2004; Stickley et al., 2004a;Bijl et al., 2013b, 2014). We have undertaken new analy-ses of isoGDGTs, brGDGTs and brGMGTs from the Maas-trichtian and Paleocene section of the record and reanalyzedpreviously published sample sets using the chromatographymethod with improved compound separation (Hopmans etal., 2016). We critically evaluate the biomarker results us-ing established indicators for a pre-, syn- or post-depositionaloverprint of the primary sea surface and air temperature sig-nals. In addition, we use dinoflagellate cyst assemblages andterrestrial palynomorph abundance as recorders of paleoen-vironmental change on the continental shelf, for constraintson depositional, environmental and hydrological changes,in order to aid interpretations of the GDGT proxies. Wealso evaluate the nature, source and possible temperatureaffinity of the brGMGTs in our record. After this criti-cal (re-)evaluation, we interpret the Maastrichtian to early
Oligocene sea surface and air temperature, and paleoenvi-ronmental evolution of the SW Pacific region.
2 Material
2.1 Site locality and tectonic evolution
Since the Cenomanian, the continental complex includingAustralia, Tasmania, ETP and the South Tasman Rise (STR)tectonically moved as one continental plate (Müller et al.,2000) – here referred to as Australia. True polar wander,although relatively poorly constrained, has caused absolutemotions of the spin axis relative to the paleopositions of theplate circuit (Torsvik et al., 2012; Van Hinsbergen et al.,2015). On a paleomagnetic reference frame, Antarctica andAustralia rotated northwestward by 3◦ of latitude and over3◦ longitude between 70 and 50 Ma (Fig. 1), with only littletransform displacement between them. From 50 Ma onwards,the tectonic drift orientation of Antarctica shifted slightlymore southwards than that of Australia, causing left trans-form motion between notably west of Cape Adare and westTasmania (Fig. 1; Williams et al., 2019). Although this di-
Clim. Past, 17, 2393–2425, 2021 https://doi.org/10.5194/cp-17-2393-2021
P. K. Bijl et al.: Maastrichtian–Rupelian paleoclimates in the southwest Pacific 2397
vergence effectively opened the Tasmanian Gateway (TG) tosurface flow of the Antarctic Counter Current close to theearly–middle Eocene boundary (Bijl et al., 2013a), proba-bly through subsidence of the Antarctic continental marginand STR, rapid northward movement of Australia and south-ward movement of East Antarctica did not start before about40 Ma (Fig. 1; Cande and Stock, 2004; Seton et al., 2012).Yet, a connection between Australian and Antarctic conti-nental blocks persisted until 34 Ma when transform motionbetween STR and Wilkes Land changed into spreading andocean crust formation (Cande and Stock, 2004; Seton et al.,2012).
2.2 Lithology
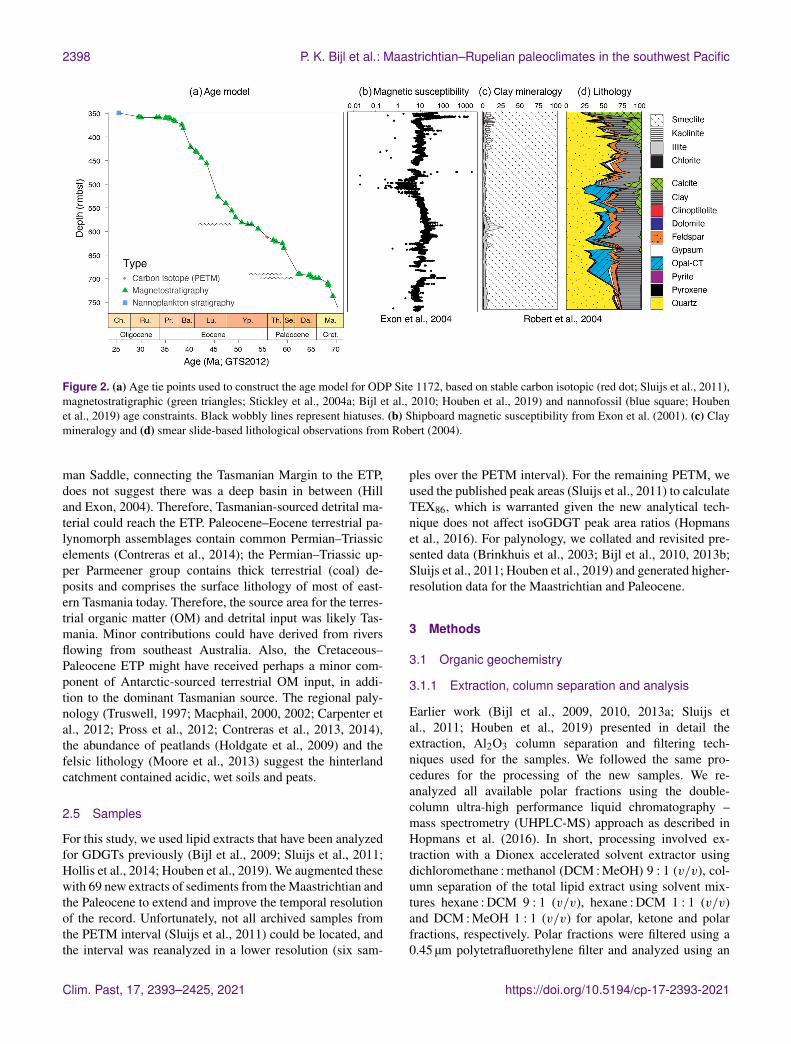
A 760 m thick sediment sequence was recovered at ODPSite 1172, on the western part of the ETP, east of Tasmania,Australia (Exon et al., 2001). We studied the interval from760 m below the sea floor (m b.s.f.) to about 350 m b.s.f. in acomposite (Röhl et al., 2004a) of Hole A and Hole D. Thecarbonate ooze from 350 m b.s.f. upwards did not yield anyGDGTs. The studied succession consists broadly of green-gray silty claystones from 760 to ∼ 505 m b.s.f., grading intodark gray to black silty claystones from 636–625 m b.s.f.,then a return of the greenish-gray silty claystones, which isinterrupted by a more lithified unit at 610 m b.s.f. (Exon et al.,2001; Röhl et al., 2004a, b; Schellenberg et al., 2004; Sluijset al., 2011). The silty claystones turn gradually and cycli-cally lighter from 570 m b.s.f. upwards until ∼ 361 m b.s.f.,with gradually more calcium carbonate and biogenic silicapreserved (Röhl et al., 2004a). The clay mineralogy is dom-inated by smectite but contains progressively more kaoliniteabove∼ 500 m b.s.f. (Fig. 2; Exon et al., 2001; Robert, 2004).Gray silty claystones give way to a green glauconitic horizonbetween 360.1 and 357.3 m b.s.f. (Exon et al., 2001). Abovethis greensand, carbonate oozes continue further upwards.The record is quasi-continuously bioturbated by Zoophycos(Exon et al., 2001). We follow the depth corrections pub-lished in Sluijs et al. (2011) for Cores 12–31 R, based onthe correlation of core-log and downhole log magnetic sus-ceptibility.
2.3 Age model
For age tie points (Table S1 in the Supplement; Fig. 2),we use the identification of the Paleocene–Eocene ThermalMaximum (PETM) (Sluijs et al., 2011) and Middle EoceneClimatic Optimum (MECO; Bijl et al., 2010) and robustbiostratigraphical constraints from the Eocene–Oligoceneboundary interval (Houben et al., 2019; Sluijs et al., 2003). Inthe intervals between these tie points, the age model is basedon magnetostratigraphy, which in the early Eocene suffersfrom a strong normal overprint (Dallanave et al., 2016). De-spite the overprint, there is a paleomagnetic signal preservedin the inclination data (Fuller and Touchard, 2004). Biostrati-
graphic constraints from calcareous nannofossils, diatomsand dinocysts (Stickley et al., 2004a; Bijl et al., 2013b) arebroadly consistent with nearby sites (Dallanave et al., 2016).
The nature of the sediments and depositional setting (seebelow) implies that small hiatuses may exist between the agetie points (Röhl et al., 2004a). Indeed, hiatuses were alreadyidentified across the Cretaceous–Paleogene boundary (Schel-lenberg et al., 2004), in the mid-Paleocene (Bijl et al., 2013b;Hollis et al., 2014), early Eocene (Bijl et al., 2013b) andmiddle Eocene (Röhl et al., 2004a), corresponding to spikesin magnetic susceptibility (Fig. 2). The section across theEocene–Oligocene transition is strongly condensed (Stickleyet al., 2004a, b; Houben et al., 2019).
2.4 Depositional setting
From the lithology (Robert, 2004) and palynological content(Brinkhuis et al., 2003), the Maastrichtian–Eocene part ofthe record is interpreted to represent a shallow-marine, mid-continental shelf depositional setting, with gradual deepen-ing in the middle Eocene based on an increase in calcium car-bonate content (Fig. 2; Röhl et al., 2004a). The late Eocenegreensands were initially interpreted as indicating deepen-ing and current inception as a result of widening of theTG (Stickley et al., 2004b). Later studies have related thegreensands to invigorated ocean circulation and winnowing(Houben et al., 2019), with no deepening required. Volcanicactivity of the Balleny plume in the late Eocene (Hill andMoore, 2001) might have influenced bathymetric changes ofthe ETP, in addition to the tectonic stresses that act on diverg-ing plates in the TG area.
The regional tectonic evolution has implications for in-terpreting the marine and terrestrial temperature record atthis site, because it influenced regional oceanography andclimatic conditions in the hinterland. Field data and modelsimulations indicate that with a closed TG, the Tasman Cur-rent, a strong western boundary current of the proto-RossGyre, bathed the plateau with Antarctic-derived surface wa-ters (Huber et al., 2004; Bijl et al., 2011, 2013b; Sijp etal., 2014, 2016). Palynological evidence confirms that theproto-Ross Gyre influence persisted at the ETP until the lateEocene (Warnaar et al., 2009; Bijl et al., 2011). This meansthat despite northward tectonic drift, the same strong west-ern boundary current bathed the site during the Maastrichtianto late Eocene (Sijp et al., 2016), with perhaps some inter-mittent influence of East Australian Current waters from thenorth (Bijl et al., 2010; Cramwinckel et al., 2020). This endedwhen the proto-Leeuwin Current started to flow through theprogressively widening TG (Fig. 1), bringing the ETP un-der the influence of more northerly sourced surface waters(Stickley et al., 2004b; Houben et al., 2019).
Persistent terrigenous input (Brinkhuis et al., 2003) ar-guably requires a large terrestrial catchment area, and theETP seems too small (∼ 50 000 km2) to have had vast ar-eas above sea level. Seismic information from the East Tas-
https://doi.org/10.5194/cp-17-2393-2021 Clim. Past, 17, 2393–2425, 2021
2398 P. K. Bijl et al.: Maastrichtian–Rupelian paleoclimates in the southwest Pacific
Figure 2. (a) Age tie points used to construct the age model for ODP Site 1172, based on stable carbon isotopic (red dot; Sluijs et al., 2011),magnetostratigraphic (green triangles; Stickley et al., 2004a; Bijl et al., 2010; Houben et al., 2019) and nannofossil (blue square; Houbenet al., 2019) age constraints. Black wobbly lines represent hiatuses. (b) Shipboard magnetic susceptibility from Exon et al. (2001). (c) Claymineralogy and (d) smear slide-based lithological observations from Robert (2004).
man Saddle, connecting the Tasmanian Margin to the ETP,does not suggest there was a deep basin in between (Hilland Exon, 2004). Therefore, Tasmanian-sourced detrital ma-terial could reach the ETP. Paleocene–Eocene terrestrial pa-lynomorph assemblages contain common Permian–Triassicelements (Contreras et al., 2014); the Permian–Triassic up-per Parmeener group contains thick terrestrial (coal) de-posits and comprises the surface lithology of most of east-ern Tasmania today. Therefore, the source area for the terres-trial organic matter (OM) and detrital input was likely Tas-mania. Minor contributions could have derived from riversflowing from southeast Australia. Also, the Cretaceous–Paleocene ETP might have received perhaps a minor com-ponent of Antarctic-sourced terrestrial OM input, in addi-tion to the dominant Tasmanian source. The regional paly-nology (Truswell, 1997; Macphail, 2000, 2002; Carpenter etal., 2012; Pross et al., 2012; Contreras et al., 2013, 2014),the abundance of peatlands (Holdgate et al., 2009) and thefelsic lithology (Moore et al., 2013) suggest the hinterlandcatchment contained acidic, wet soils and peats.
2.5 Samples
For this study, we used lipid extracts that have been analyzedfor GDGTs previously (Bijl et al., 2009; Sluijs et al., 2011;Hollis et al., 2014; Houben et al., 2019). We augmented thesewith 69 new extracts of sediments from the Maastrichtian andthe Paleocene to extend and improve the temporal resolutionof the record. Unfortunately, not all archived samples fromthe PETM interval (Sluijs et al., 2011) could be located, andthe interval was reanalyzed in a lower resolution (six sam-
ples over the PETM interval). For the remaining PETM, weused the published peak areas (Sluijs et al., 2011) to calculateTEX86, which is warranted given the new analytical tech-nique does not affect isoGDGT peak area ratios (Hopmanset al., 2016). For palynology, we collated and revisited pre-sented data (Brinkhuis et al., 2003; Bijl et al., 2010, 2013b;Sluijs et al., 2011; Houben et al., 2019) and generated higher-resolution data for the Maastrichtian and Paleocene.
3 Methods
3.1 Organic geochemistry
3.1.1 Extraction, column separation and analysis
Earlier work (Bijl et al., 2009, 2010, 2013a; Sluijs etal., 2011; Houben et al., 2019) presented in detail theextraction, Al2O3 column separation and filtering tech-niques used for the samples. We followed the same pro-cedures for the processing of the new samples. We re-analyzed all available polar fractions using the double-column ultra-high performance liquid chromatography –mass spectrometry (UHPLC-MS) approach as described inHopmans et al. (2016). In short, processing involved ex-traction with a Dionex accelerated solvent extractor usingdichloromethane :methanol (DCM :MeOH) 9 : 1 (v/v), col-umn separation of the total lipid extract using solvent mix-tures hexane :DCM 9 : 1 (v/v), hexane :DCM 1 : 1 (v/v)and DCM :MeOH 1 : 1 (v/v) for apolar, ketone and polarfractions, respectively. Polar fractions were filtered using a0.45 µm polytetrafluorethylene filter and analyzed using an
Clim. Past, 17, 2393–2425, 2021 https://doi.org/10.5194/cp-17-2393-2021
P. K. Bijl et al.: Maastrichtian–Rupelian paleoclimates in the southwest Pacific 2399
Agilent 1260 Infinity series HPLC system coupled to an Ag-ilent 6130 single-quadrupole mass spectrometer.
3.1.2 Data analysis: indices, overprints
Since the discovery of isoGDGTs as a proxy for SST (seeSchouten et al. (2013) for a review), several non-SST ef-fects have been identified that may affect the distribution ofisoGDGTs in the sediment. Several indices have been de-veloped to identify most of the known sources of overprints(Table 1). As well as identifying potential overprints, theseindices can provide additional paleoenvironmental informa-tion.
All of the ratios that signal biases express the influence ofthis bias relative to modern “normal” or idealized composi-tions. For the branched and isoprenoid tetraether (BIT) index,it was proposed that the closed sum ratio between brGDGTs,which were thought to derive exclusively from soils, and theisoGDGT crenarchaeol, which was thought to be producedexclusively by marine archaea, could be an indicator for therelative contribution of soil organic matter (OM) into ma-rine sediments (Hopmans et al., 2004). However, it was sub-sequently shown that crenarchaeol, but critically also otherisoGDGTs, is also produced on land (Weijers et al., 2006),and that a large contribution of soil OM to marine sedimentscan cause a bias in TEX86. Weijers et al. (2006) used an end-member model to calculate the potential bias in TEX86-basedSST reconstructions in the Congo Fan, and this shows signif-icant bias (> 2 ◦C) for BIT above 0.3. However, it is ratherarbitrary to assign a cutoff for BIT based on the magnitudeof the SST bias alone, as this bias depends primarily on thedifference between the isoGDGT composition of the soil andmarine endmembers. As a consequence, there is no uniformvalue for BIT index above which TEX86 should be discarded.Secondly, because the BIT index is a closed sum, the indexis equally affected by increased production of crenarchaeolas it is by the input of brGDGTs. Although this could be ver-ified with absolute concentrations of GDGTs, these are notalways presented. Third, brGDGTs are produced in situ inthe marine realm (Peterse et al., 2009; Sinninghe Damsté,2016). The corollary of this is that the cutoff value for BIT toinfer an overprint in the isoGDGT-based SST signal shouldbe assumed to differ per environmental setting and perhapsalso through time if the setting changes significantly (e.g.,Sluijs et al., 2020). As a result, cutoffs have been set higher(e.g., 0.4; Bijl et al., 2013a) when no relationship betweenTEX86 and BIT index values is detected. This approach isalso not without complications, because the abundance andcomposition of isoGDGTs (including crenarchaeol) in soilmaterial varies (Weijers et al., 2006; De Jonge et al., 2015,2016; Naafs et al., 2019; Sluijs et al., 2020). This impliesthat for samples with intermediate to high BIT (Weijers etal., 2006), a terrestrially derived isoGDGT contribution witha variable isoGDGT composition or a TEX86 signature closeto the original pelagic isoGDGT signal would become un-
detectable in a TEX86–BIT index cross plot. In some pa-leoenvironmental settings that evidently lack high input ofsoil OM, BIT index values are high (Leutert et al., 2020).For reasons given above, this could either mean very lowcrenarchaeol production in the marine realm or in situ pro-duction of brGDGTs. These two scenarios make for a com-pletely different paleoenvironmental interpretation and failto indicate whether the brGDGTs can be used to recon-struct MAAT of the hinterland, or whether isoGDGTs canbe used for reliable paleothermometry. For that, it is impor-tant to assess the sources of brGDGTs, as brGDGTs pro-duced in rivers (Zell et al., 2013; De Jonge et al., 2014b) orthe (coastal) marine environment (Peterse et al., 2009; Sin-ninghe Damsté, 2016) may contribute and thereby bias theinitial soil-derived brGDGT signal, affecting the reliability ofMAAT reconstructions. Fortunately, production of brGDGTsin the marine realm can be recognized based on the weighednumber of rings of the tetramethylated brGDGTs, quantifiedin the #ringstetra, where values > 0.7 indicate a purely ma-rine source of the brGDGTs (Sinninghe Damsté, 2016). The#ringstetra in coastal marine sediments can subsequently beused to determine and correct for the contribution of ma-rine brGDGTs to the temperature signal of the soil-derivedbrGDGTs (Dearing Crampton-Flood et al., 2018). Similarly,brGDGTs that are produced in rivers are characterized by arelatively high abundance of the 6-methyl brGDGTs relativeto the 5-methyl brGDGTs, expressed as the isomerization ra-tio (IR; De Jonge et al., 2014b).
For the other indices for overprints, cutoff values may notbe as uniformly applicable to all depositional settings either.Leutert et al. (2020) showed that modern samples exceedingcutoff values for the GDGT2/3 ratio and methanogenesis in-dex do not have anomalous TEX86 index values in the mod-ern core-top dataset based on the Ring Index. This suggeststhat the TEX86 index value is not equally influenced by non-thermal contributions in all depositional settings. As a result,evaluating non-thermal contributions on TEX86 index valuesshould consider the depositional and environmental settingalong with the cutoff values.
3.1.3 Calibrations for TEX86 and MBT’5me
Several calibrations have been proposed to convert TEX86index values to sea surface temperatures. For higher temper-atures, it remains uncertain if the TEX86–SST relationship islinear or exponential for values above the modern calibration(O’Brien et al., 2017; Tierney et al., 2017; Cramwinckel etal., 2018; Hollis et al., 2019). Following recent recommenda-tions (Hollis et al., 2019), we here apply several calibrationsto convert our TEX86 values to SSTs. We apply an expo-nential calibration (Kim et al., 2010), even though it suffersfrom a regression dilution bias (Tierney and Tingley, 2015),and two linear calibrations: one on the warm part (> 15 ◦C)of the core-top dataset (O’Brien et al., 2017) and one usingBayesian statistics (BAYSPAR; Tierney and Tingley, 2015)
https://doi.org/10.5194/cp-17-2393-2021 Clim. Past, 17, 2393–2425, 2021
2400 P. K. Bijl et al.: Maastrichtian–Rupelian paleoclimates in the southwest Pacific
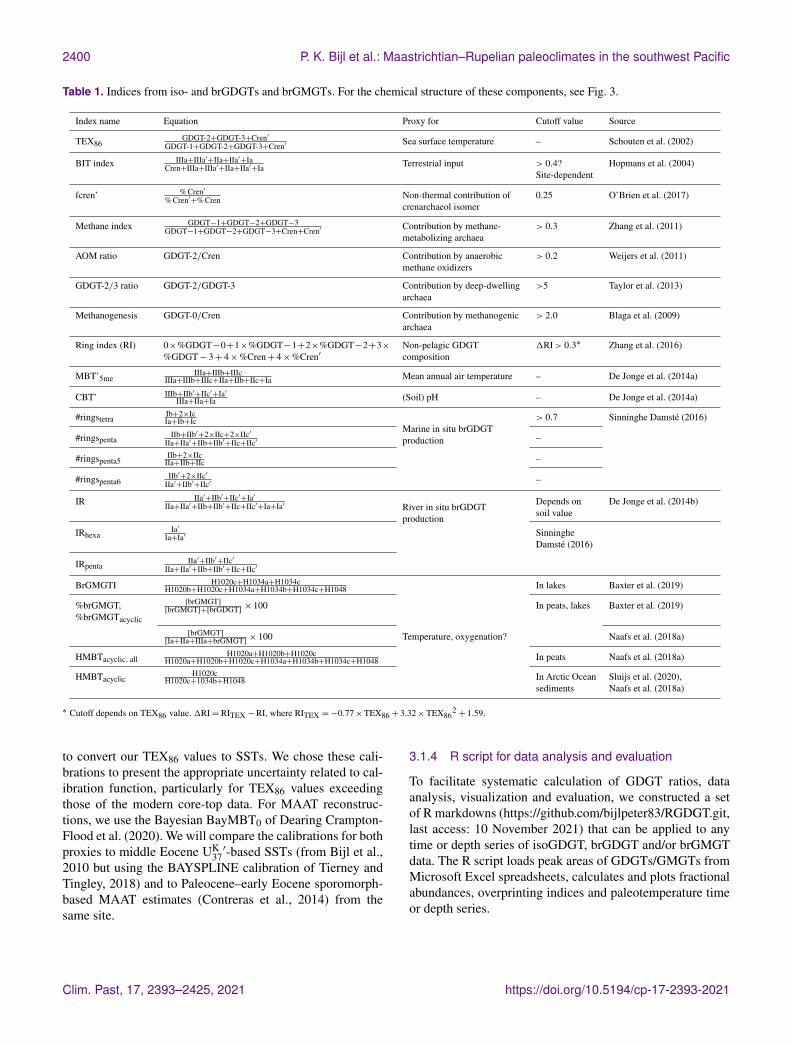
Table 1. Indices from iso- and brGDGTs and brGMGTs. For the chemical structure of these components, see Fig. 3.
Index name Equation Proxy for Cutoff value Source
TEX86GDGT-2+GDGT-3+Cren′
GDGT-1+GDGT-2+GDGT-3+Cren′ Sea surface temperature – Schouten et al. (2002)
BIT index IIIa+IIIa′+IIa+IIa′+IaCren+IIIa+IIIa′+IIa+IIa′+Ia Terrestrial input > 0.4?
Site-dependentHopmans et al. (2004)
fcren’ % Cren′% Cren′+% Cren Non-thermal contribution of
crenarchaeol isomer0.25 O’Brien et al. (2017)
Methane index GDGT−1+GDGT−2+GDGT−3GDGT−1+GDGT−2+GDGT−3+Cren+Cren′ Contribution by methane-
metabolizing archaea> 0.3 Zhang et al. (2011)
AOM ratio GDGT-2/Cren Contribution by anaerobicmethane oxidizers
> 0.2 Weijers et al. (2011)
GDGT-2/3 ratio GDGT-2/GDGT-3 Contribution by deep-dwellingarchaea
>5 Taylor et al. (2013)
Methanogenesis GDGT-0/Cren Contribution by methanogenicarchaea
> 2.0 Blaga et al. (2009)
Ring index (RI) 0×%GDGT−0+1×%GDGT−1+2×%GDGT−2+3×%GDGT− 3+ 4×%Cren+ 4×%Cren′
Non-pelagic GDGTcomposition
1RI> 0.3∗ Zhang et al. (2016)
MBT’5meIIIa+IIIb+IIIc
IIIa+IIIb+IIIc+IIa+IIb+IIc+Ia Mean annual air temperature – De Jonge et al. (2014a)
CBT’ IIIb+IIb′+IIc′+Ia′IIIa+IIa+Ia (Soil) pH – De Jonge et al. (2014a)
#ringstetraIb+2×IcIa+Ib+Ic
Marine in situ brGDGTproduction
> 0.7 Sinninghe Damsté (2016)
#ringspentaIIb+IIb′+2×IIc+2×IIc′
IIa+IIa′+IIb+IIb′+IIc+IIc′ –
#ringspenta5IIb+2×IIc
IIa+IIb+IIc –
#ringspenta6IIb′+2×IIc′
IIa′+IIb′+IIc′ –
IR IIa′+IIb′+IIc′+Ia′IIa+IIa′+IIb+IIb′+IIc+IIc′+Ia+Ia′ River in situ brGDGT
production
Depends onsoil value
De Jonge et al. (2014b)
IRhexaIa′
Ia+Ia′ SinningheDamsté (2016)
IRpentaIIa′+IIb′+IIc′
IIa+IIa′+IIb+IIb′+IIc+IIc′
BrGMGTI H1020c+H1034a+H1034cH1020b+H1020c+H1034a+H1034b+H1034c+H1048 In lakes Baxter et al. (2019)
%brGMGT,%brGMGTacyclic
[brGMGT][brGMGT]+[brGDGT] × 100 In peats, lakes Baxter et al. (2019)
[brGMGT][Ia+IIa+IIIa+brGMGT] × 100 Temperature, oxygenation? Naafs et al. (2018a)
HMBTacyclic, allH1020a+H1020b+H1020c
H1020a+H1020b+H1020c+H1034a+H1034b+H1034c+H1048 In peats Naafs et al. (2018a)
HMBTacyclicH1020c
H1020c+1034b+H1048 In Arctic Oceansediments
Sluijs et al. (2020),Naafs et al. (2018a)
∗ Cutoff depends on TEX86 value. 1RI= RITEX −RI, where RITEX =−0.77×TEX86 + 3.32×TEX862+ 1.59.
to convert our TEX86 values to SSTs. We chose these cali-brations to present the appropriate uncertainty related to cal-ibration function, particularly for TEX86 values exceedingthose of the modern core-top data. For MAAT reconstruc-tions, we use the Bayesian BayMBT0 of Dearing Crampton-Flood et al. (2020). We will compare the calibrations for bothproxies to middle Eocene UK
37′-based SSTs (from Bijl et al.,
2010 but using the BAYSPLINE calibration of Tierney andTingley, 2018) and to Paleocene–early Eocene sporomorph-based MAAT estimates (Contreras et al., 2014) from thesame site.
3.1.4 R script for data analysis and evaluation
To facilitate systematic calculation of GDGT ratios, dataanalysis, visualization and evaluation, we constructed a setof R markdowns (https://github.com/bijlpeter83/RGDGT.git,last access: 10 November 2021) that can be applied to anytime or depth series of isoGDGT, brGDGT and/or brGMGTdata. The R script loads peak areas of GDGTs/GMGTs fromMicrosoft Excel spreadsheets, calculates and plots fractionalabundances, overprinting indices and paleotemperature timeor depth series.
Clim. Past, 17, 2393–2425, 2021 https://doi.org/10.5194/cp-17-2393-2021
P. K. Bijl et al.: Maastrichtian–Rupelian paleoclimates in the southwest Pacific 2401
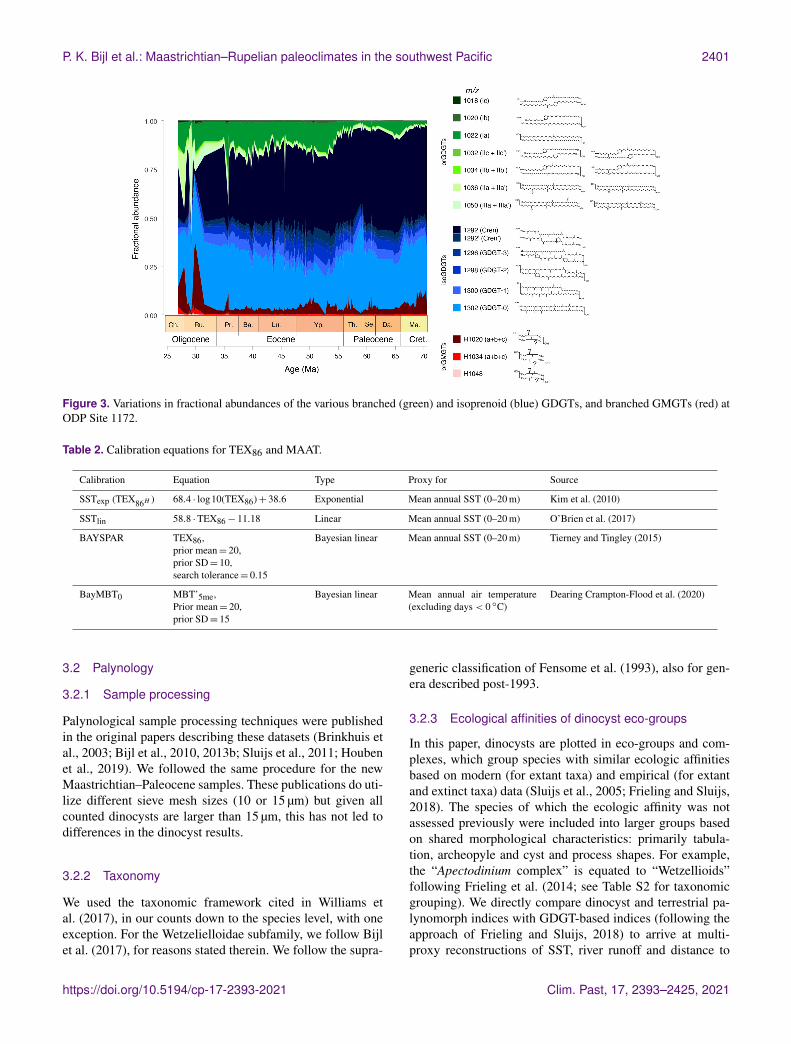
Figure 3. Variations in fractional abundances of the various branched (green) and isoprenoid (blue) GDGTs, and branched GMGTs (red) atODP Site 1172.
Table 2. Calibration equations for TEX86 and MAAT.
Calibration Equation Type Proxy for Source
SSTexp (TEX86H ) 68.4 · log10(TEX86)+ 38.6 Exponential Mean annual SST (0–20 m) Kim et al. (2010)
SSTlin 58.8 ·TEX86− 11.18 Linear Mean annual SST (0–20 m) O’Brien et al. (2017)
BAYSPAR TEX86,prior mean= 20,prior SD= 10,search tolerance= 0.15
Bayesian linear Mean annual SST (0–20 m) Tierney and Tingley (2015)
BayMBT0 MBT’5me,Prior mean= 20,prior SD= 15
Bayesian linear Mean annual air temperature(excluding days < 0 ◦C)
Dearing Crampton-Flood et al. (2020)
3.2 Palynology
3.2.1 Sample processing
Palynological sample processing techniques were publishedin the original papers describing these datasets (Brinkhuis etal., 2003; Bijl et al., 2010, 2013b; Sluijs et al., 2011; Houbenet al., 2019). We followed the same procedure for the newMaastrichtian–Paleocene samples. These publications do uti-lize different sieve mesh sizes (10 or 15 µm) but given allcounted dinocysts are larger than 15 µm, this has not led todifferences in the dinocyst results.
3.2.2 Taxonomy
We used the taxonomic framework cited in Williams etal. (2017), in our counts down to the species level, with oneexception. For the Wetzelielloidae subfamily, we follow Bijlet al. (2017), for reasons stated therein. We follow the supra-
generic classification of Fensome et al. (1993), also for gen-era described post-1993.
3.2.3 Ecological affinities of dinocyst eco-groups
In this paper, dinocysts are plotted in eco-groups and com-plexes, which group species with similar ecologic affinitiesbased on modern (for extant taxa) and empirical (for extantand extinct taxa) data (Sluijs et al., 2005; Frieling and Sluijs,2018). The species of which the ecologic affinity was notassessed previously were included into larger groups basedon shared morphological characteristics: primarily tabula-tion, archeopyle and cyst and process shapes. For example,the “Apectodinium complex” is equated to “Wetzellioids”following Frieling et al. (2014; see Table S2 for taxonomicgrouping). We directly compare dinocyst and terrestrial pa-lynomorph indices with GDGT-based indices (following theapproach of Frieling and Sluijs, 2018) to arrive at multi-proxy reconstructions of SST, river runoff and distance to
https://doi.org/10.5194/cp-17-2393-2021 Clim. Past, 17, 2393–2425, 2021
2402 P. K. Bijl et al.: Maastrichtian–Rupelian paleoclimates in the southwest Pacific
shore (Table 3). For this, we resampled and binned GDGT-based indices to the sample resolution of the dinocyst data.Some dinocyst groups have affinities for multiple environ-mental parameters, due to the strong covariance of environ-mental gradients on an inshore-to-offshore transect. There-fore, the complete dinocyst assemblage (including absence ofpresence) and knowledge of the geographic setting is used toreconstruct changes in paleoenvironmental conditions fromdinocysts.
3.2.4 Diversity and variability indices
To gain insight into the diversity and variability of thedinocyst assemblage through time, we employ several in-dices (Table 4), and compare their results at species and eco-group level. We note that diversity in dinocyst taxonomyis complicated because dinocysts are dominantly producedduring the hypnozygotic phase of the dinoflagellate life cy-cle following sexual reproduction. Only ∼ 15 % of moderndinoflagellates have this cyst stage (Fensome et al., 1993).This leaves a large proportion of the biological group unrep-resented in the fossil record, including, for example, coraland foraminifer symbionts, but also many free-swimmingtaxa. Dinocyst diversity is therefore a biased indicator forplankton diversity. As a further complication, taxonomic di-visions of cysts, although strongly related to dinoflagellatemorphology and taxonomy, is fully based on the morphol-ogy of dinocysts. Even modern dinoflagellate–dinocyst re-lationships are often ambiguous. Some dinoflagellate speciesproduce various cyst morphologies (Rochon et al., 2008) thatrepresent multiple cyst genera or species. Some of these cystmorphological variations are the result of ecology (Mertenset al., 2011). This complicates comparing cyst datasets onthe species level and affects assessing biological diversitybased on cysts. On the genus level, taxonomic division ofcysts is in most cases based on plate tabulation, which is themorphologic feature that has the closest relationship to di-noflagellate biological diversity (Fensome et al., 1993). How-ever, ecologic or biogeographic affinities have been estab-lished for some dinocysts on a species level (e.g., Frielingand Sluijs, 2018), which does suggest subtle morphologicalfeatures may have biologic and ecologic significance. Theeco-groups we use here are the result of extensive reviews ofempirical data. These groups combine dinocyst genera andspecies with fundamentally similar plate tabulations and thusprobably group cysts of closely affiliated biological dinoflag-ellate species and, as such, also ecologic affinities. For ourdiversity calculations, we use both the ungrouped data onspecies level and the diversity in dinocyst eco-groups.
As the simplest approximation of biological diversity, therichness (R) sums dinocyst taxa. Furthermore, several diver-sity measures were calculated using the R package Vegan(Oksanen et al., 2015): Fisher’s alpha (α), Shannon index(H ′) and Simpson index (D). Finally, we employed the 6CVmetric (Gibbs et al., 2012), which we here dub the “Gibbs
index”, which provides a measure for assemblage variability.Together, these metrics give insight into changing stabilityand diversity of these regional dinocyst assemblages over theMaastrichtian to early Oligocene.
3.3 Comparison of GDGT and dinocyst assemblagedata
Both dinocyst eco-groups and GDGT indices bear informa-tion on SST, runoff (∼ salinity), nutrients and marine pri-mary productivity, and relative distance to shore (Table 4).As dinocyst and GDGT analyses were performed on partlyseparate datasets, the highest resolution dataset (dinocysts)was linearly resampled to the depth intervals of the GDGTdata to facilitate intercomparison.
4 Results
4.1 GDGTs
The resulting dataset has an average temporal resolu-tion of ∼ 130 kyr for the time interval between 70 and30 Ma. IsoGDGTs dominate the pool of GDGTs (particu-larly GDGT-0 and crenarchaeol), with a gradual increasingrelative abundance of brGDGTs (particularly Ia) throughoutthe record (Fig. 3). BrGMGTs are in low (< 10 %) relativeabundance, except in the Oligocene, where they account forup to 30 % of the total pool of tetraether lipids.
4.1.1 Isoprenoidal GDGTs
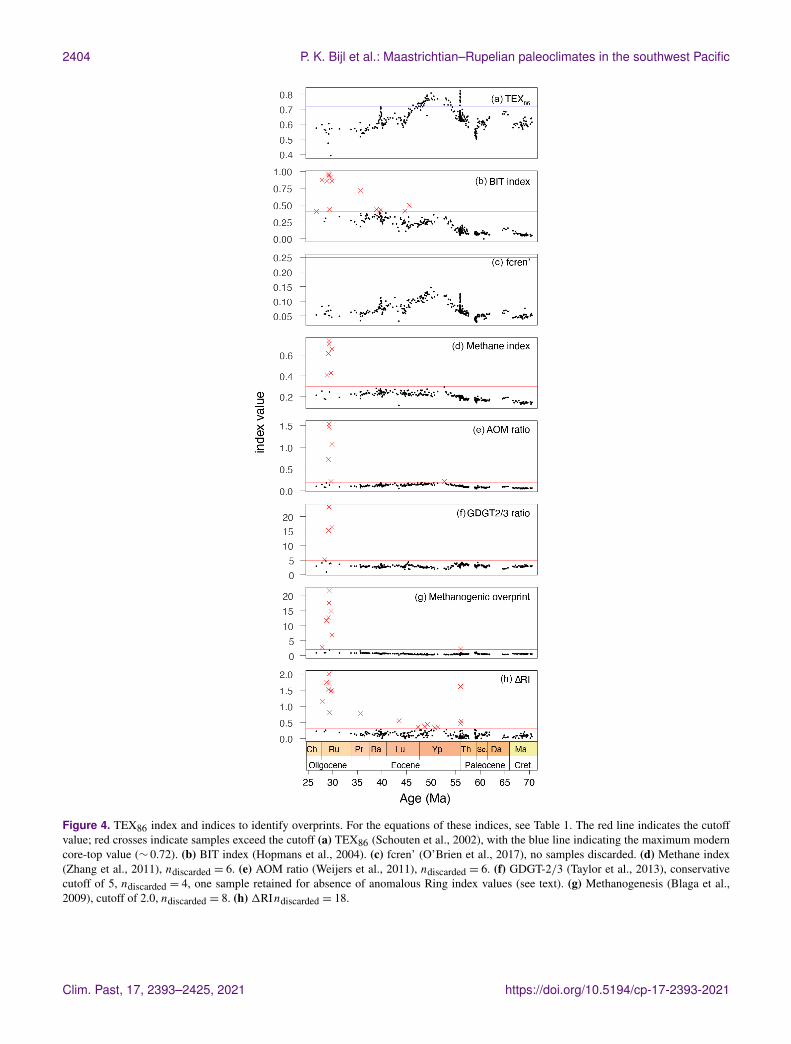
Before the TEX86 index results (Fig. 4a) can be interpretedin terms of SST, we assess whether the isoGDGTs are pri-marily derived from the sea surface or have received con-tributions from non-pelagic sources. Across the Ypresian,the BIT index (Fig. 4b) increases from values around 0.1 inthe underlying sediments to values at times exceeding 0.4.Most EECO and middle Eocene values, however, have BITindex values between 0.2 and 0.35. The remaining sedimentshave BIT index values of around 0.3, with the exception ofsome upper Eocene and Oligocene sediments that occasion-ally have values around 0.75. There is no correlation betweenTEX86 and BIT index in our entire dataset (R2
= 0.0067;p = 0.15). None of the samples have fcren’ (Fig. 4c) valuesabove the cutoff of 0.25, which excludes non-thermal con-tributions of the crenarchaeol isomer to the isoGDGTs. Infact, the consistent trend in fcren’ and the TEX86 (Fig. 4)demonstrates the temperature sensitivity of cren’. With theexception of six samples in the Oligocene, all samples havemethane index values below the conservative cutoff valueof 0.3 (Fig. 4d), although in the early and middle Eocene,methane index values do approach the cutoff. AOM ratio val-ues suggest an overprint from anaerobic methane oxidizers inone sample in the early Eocene that also has a high BIT in-dex and five samples from the Oligocene where isoGDGTs
Clim. Past, 17, 2393–2425, 2021 https://doi.org/10.5194/cp-17-2393-2021
P. K. Bijl et al.: Maastrichtian–Rupelian paleoclimates in the southwest Pacific 2403
Table 3. Environmental parameters, and their corresponding GDGT indices and dinocyst eco-groups, based on Sluijs et al. (2005), Frielingand Sluijs (2018) and Sluijs and Brinkhuis (2009).
Environmental parameter GDGT index Dinocyst eco-group
Sea surface temperature TEX86 %Thermophiles (Wetzelielloidae, Hafniasphaera spp.,Florentinia reichartii, Polysphaeridium spp., Homotry-blium spp., Heteraulacacysta spp., Eocladopyxis spp.,Dinopterygium spp.)
Runoff, freshwater, salinity IR, BIT %Senegalinium cpx., %Phthanoperidinium spp., %Ter-restrial palynomorphs
Distance to shore BIT, #ringstetra %Open marine (Apectodinium spp., Impagidinium spp.,Operculodinium spp., Spiniferites spp.), %Glaphyro-cysta cpx., %Epicystal Goniodomids (Polysphaeridiumspp, Homotryblium spp., Heteraulacacysta spp., Eo-cladopyxis spp., Dinopterygium spp.), %Terrestrial pa-lynomorphs
Table 4. Diversity and variability indices for (fossil) assemblages. In the Shannon and Simpson indices, pi represents the proportionalabundance of the ith taxon of the total amount of taxa R. The Gibbs index summates the coefficients of variation (SD/mean) of all taxa (i toR) over a certain rolling window t1→ t2. In Fisher’s alpha, the α parameter is estimated from the dataset in which S is the expected numberof species with an abundance of n. x represents a nuisance parameter estimated from the dataset, generally between 0.9 and 1. While theGibbs index is calculated over a rolling window, the other indices are calculated per sample.
Index Equation Source
Shannon index (H ′) H ′ =R∑i=1
pi × lnpi Shannon (1948)
Simpson index (D) D =R∑i=1
p2i
Simpson (1949)
Gibbs index (6CV) 6CV =R∑i=1
( SDi,t1→t2meani,t1→t2
)Gibbs et al. (2012)
Fisher’s alpha (α) Sn =αxn
n Fisher et al. (1943)
supposedly received a contribution of anaerobic methane ox-idizers (Fig. 4e). As a result, these samples were not used forSST reconstruction.
Values signalling a deeper water column overprint(GDGT-2/3 ratio) fall below 5 for most of the data (Fig. 4f),which was expected given the depositional setting on a con-tinental shelf. A total of five samples have GDGT-2/3 val-ues exceeding 5, four of which also had other indicationsof overprinted isoGDGT signals. We discard eight TEX86data points because GDGT-0/crenarchaeol ratios are above2 (Fig. 4g). One of these is from the PETM, with a value justabove the cutoff. The others represent Oligocene samples.
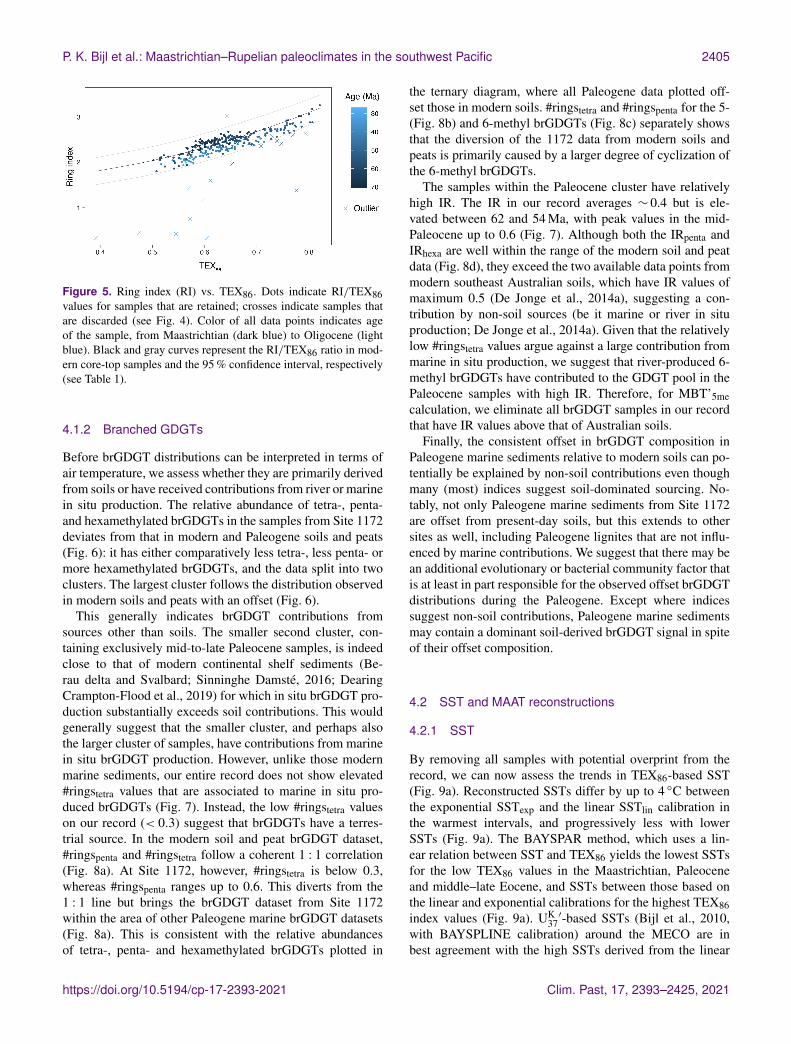
In total, 18 samples fall outside the range of RI values thatcharacterize modern pelagic-derived isoGDGT compositions(1RI> 0.3; Fig. 4h, or 95 % confidence interval; Fig. 5).Nine of these 18 come from the interval> 43 Ma and have noother indications of overprints. These samples fall just out-side the 95 % confidence interval limits (Fig. 5) and do fol-
low the overall RI/TEX86 trend, but here we discard them tobe conservative. The other nine samples with too-high 1RIcome from the late Eocene–Oligocene and have BIT indexvalues over 0.4. Two of these samples have no other overprintindication; the other seven have multiple other overprints.One sample has RI values above the range of modern sam-ples (with no other overprinting indications); the others havetoo-low RI values. Eight samples with normal RI values dohave overprints based on the other indices: BIT index valuesslightly over 0.4 (six samples), GDGT-2/3 ratio values over 5(one sample), and AOM ratio over 0.2 (one sample). Follow-ing Leutert et al. (2020), we retained the samples with normalRI values and high BIT or GDGT-2/3 ratio values. After con-sidering all these potential biases, and retaining those withnormal isoGDGT distributions, we discard a total of 19 sam-ples. Most discarded samples are from the Oligocene and areexcluded based on multiple overprint criteria.
https://doi.org/10.5194/cp-17-2393-2021 Clim. Past, 17, 2393–2425, 2021
2404 P. K. Bijl et al.: Maastrichtian–Rupelian paleoclimates in the southwest Pacific
Figure 4. TEX86 index and indices to identify overprints. For the equations of these indices, see Table 1. The red line indicates the cutoffvalue; red crosses indicate samples exceed the cutoff (a) TEX86 (Schouten et al., 2002), with the blue line indicating the maximum moderncore-top value (∼ 0.72). (b) BIT index (Hopmans et al., 2004). (c) fcren’ (O’Brien et al., 2017), no samples discarded. (d) Methane index(Zhang et al., 2011), ndiscarded = 6. (e) AOM ratio (Weijers et al., 2011), ndiscarded = 6. (f) GDGT-2/3 (Taylor et al., 2013), conservativecutoff of 5, ndiscarded = 4, one sample retained for absence of anomalous Ring index values (see text). (g) Methanogenesis (Blaga et al.,2009), cutoff of 2.0, ndiscarded = 8. (h) 1RIndiscarded = 18.
Clim. Past, 17, 2393–2425, 2021 https://doi.org/10.5194/cp-17-2393-2021
P. K. Bijl et al.: Maastrichtian–Rupelian paleoclimates in the southwest Pacific 2405
Figure 5. Ring index (RI) vs. TEX86. Dots indicate RI/TEX86values for samples that are retained; crosses indicate samples thatare discarded (see Fig. 4). Color of all data points indicates ageof the sample, from Maastrichtian (dark blue) to Oligocene (lightblue). Black and gray curves represent the RI/TEX86 ratio in mod-ern core-top samples and the 95 % confidence interval, respectively(see Table 1).
4.1.2 Branched GDGTs
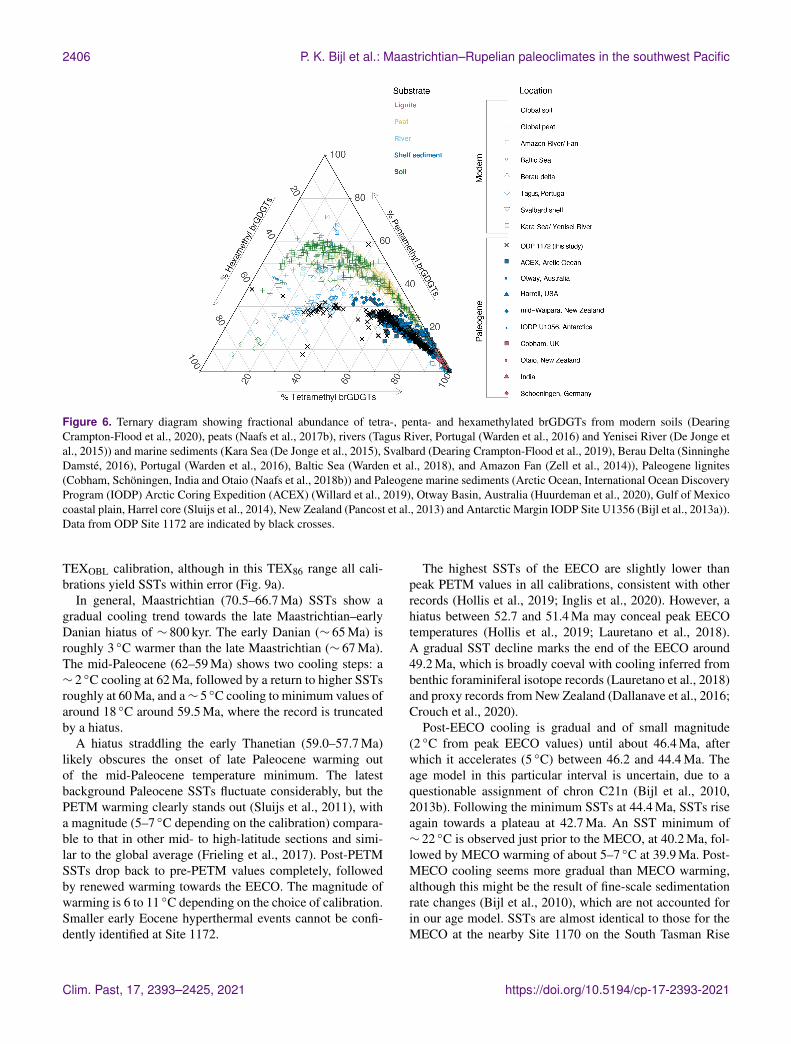
Before brGDGT distributions can be interpreted in terms ofair temperature, we assess whether they are primarily derivedfrom soils or have received contributions from river or marinein situ production. The relative abundance of tetra-, penta-and hexamethylated brGDGTs in the samples from Site 1172deviates from that in modern and Paleogene soils and peats(Fig. 6): it has either comparatively less tetra-, less penta- ormore hexamethylated brGDGTs, and the data split into twoclusters. The largest cluster follows the distribution observedin modern soils and peats with an offset (Fig. 6).
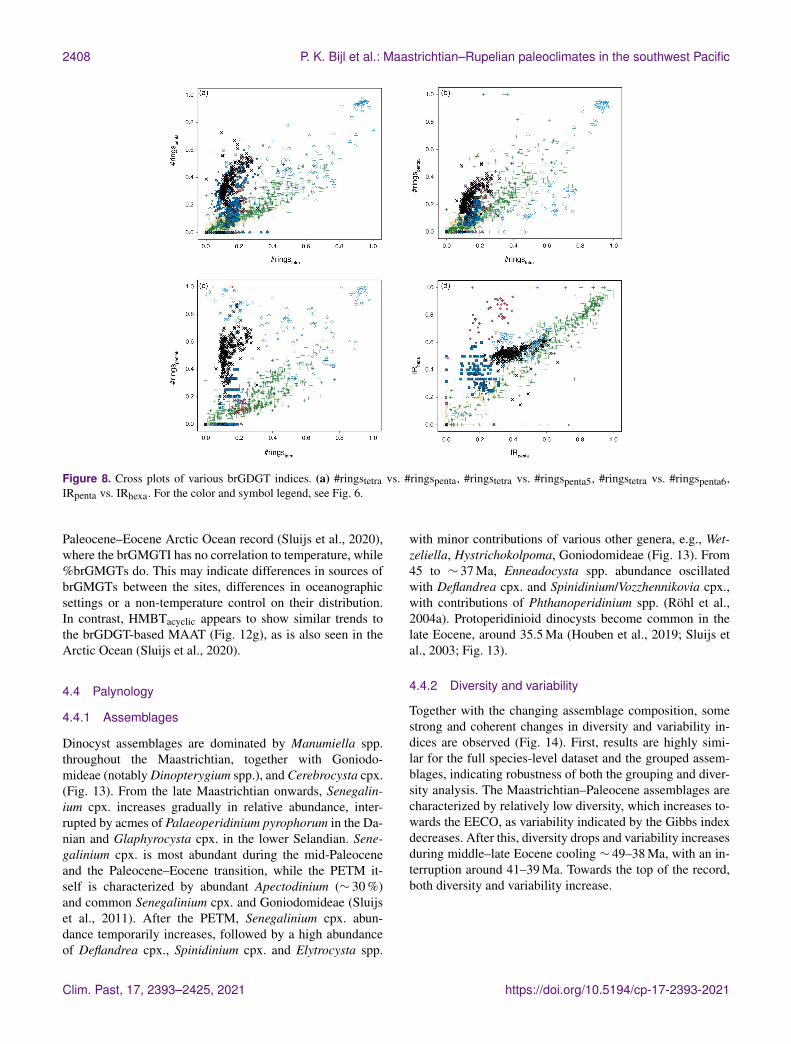
This generally indicates brGDGT contributions fromsources other than soils. The smaller second cluster, con-taining exclusively mid-to-late Paleocene samples, is indeedclose to that of modern continental shelf sediments (Be-rau delta and Svalbard; Sinninghe Damsté, 2016; DearingCrampton-Flood et al., 2019) for which in situ brGDGT pro-duction substantially exceeds soil contributions. This wouldgenerally suggest that the smaller cluster, and perhaps alsothe larger cluster of samples, have contributions from marinein situ brGDGT production. However, unlike those modernmarine sediments, our entire record does not show elevated#ringstetra values that are associated to marine in situ pro-duced brGDGTs (Fig. 7). Instead, the low #ringstetra valueson our record (< 0.3) suggest that brGDGTs have a terres-trial source. In the modern soil and peat brGDGT dataset,#ringspenta and #ringstetra follow a coherent 1 : 1 correlation(Fig. 8a). At Site 1172, however, #ringstetra is below 0.3,whereas #ringspenta ranges up to 0.6. This diverts from the1 : 1 line but brings the brGDGT dataset from Site 1172within the area of other Paleogene marine brGDGT datasets(Fig. 8a). This is consistent with the relative abundancesof tetra-, penta- and hexamethylated brGDGTs plotted in
the ternary diagram, where all Paleogene data plotted off-set those in modern soils. #ringstetra and #ringspenta for the 5-(Fig. 8b) and 6-methyl brGDGTs (Fig. 8c) separately showsthat the diversion of the 1172 data from modern soils andpeats is primarily caused by a larger degree of cyclization ofthe 6-methyl brGDGTs.
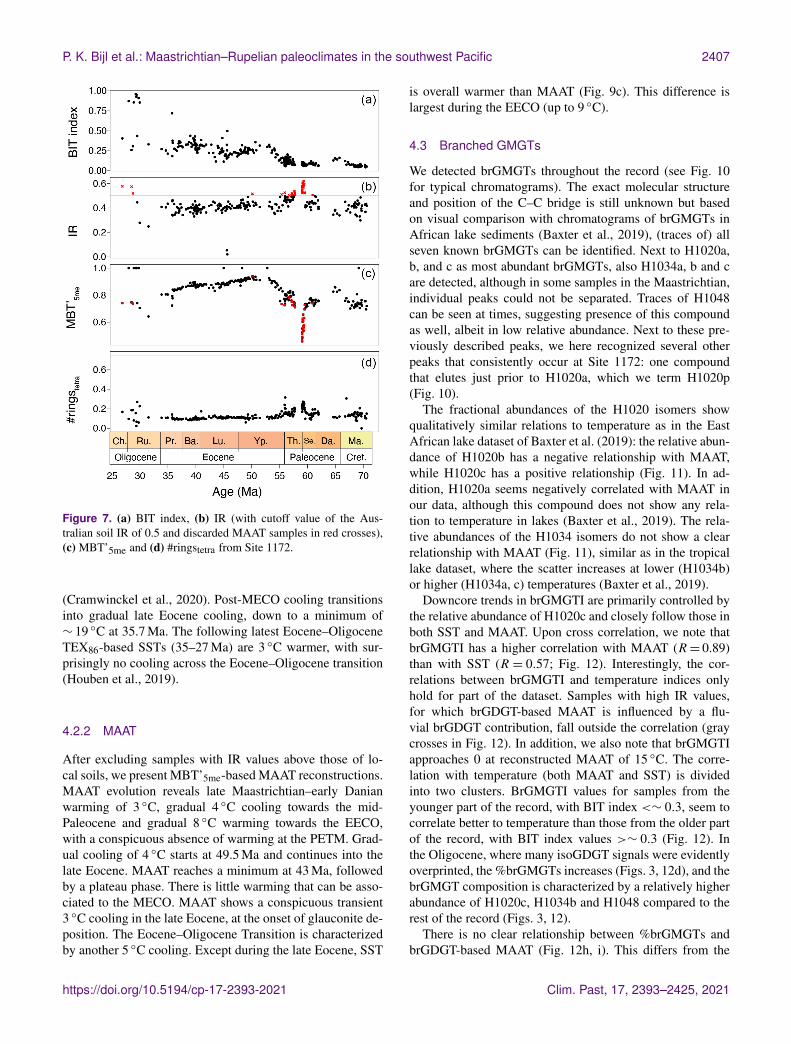
The samples within the Paleocene cluster have relativelyhigh IR. The IR in our record averages ∼ 0.4 but is ele-vated between 62 and 54 Ma, with peak values in the mid-Paleocene up to 0.6 (Fig. 7). Although both the IRpenta andIRhexa are well within the range of the modern soil and peatdata (Fig. 8d), they exceed the two available data points frommodern southeast Australian soils, which have IR values ofmaximum 0.5 (De Jonge et al., 2014a), suggesting a con-tribution by non-soil sources (be it marine or river in situproduction; De Jonge et al., 2014a). Given that the relativelylow #ringstetra values argue against a large contribution frommarine in situ production, we suggest that river-produced 6-methyl brGDGTs have contributed to the GDGT pool in thePaleocene samples with high IR. Therefore, for MBT’5mecalculation, we eliminate all brGDGT samples in our recordthat have IR values above that of Australian soils.
Finally, the consistent offset in brGDGT composition inPaleogene marine sediments relative to modern soils can po-tentially be explained by non-soil contributions even thoughmany (most) indices suggest soil-dominated sourcing. No-tably, not only Paleogene marine sediments from Site 1172are offset from present-day soils, but this extends to othersites as well, including Paleogene lignites that are not influ-enced by marine contributions. We suggest that there may bean additional evolutionary or bacterial community factor thatis at least in part responsible for the observed offset brGDGTdistributions during the Paleogene. Except where indicessuggest non-soil contributions, Paleogene marine sedimentsmay contain a dominant soil-derived brGDGT signal in spiteof their offset composition.
4.2 SST and MAAT reconstructions
4.2.1 SST
By removing all samples with potential overprint from therecord, we can now assess the trends in TEX86-based SST(Fig. 9a). Reconstructed SSTs differ by up to 4 ◦C betweenthe exponential SSTexp and the linear SSTlin calibration inthe warmest intervals, and progressively less with lowerSSTs (Fig. 9a). The BAYSPAR method, which uses a lin-ear relation between SST and TEX86 yields the lowest SSTsfor the low TEX86 values in the Maastrichtian, Paleoceneand middle–late Eocene, and SSTs between those based onthe linear and exponential calibrations for the highest TEX86index values (Fig. 9a). UK
37′-based SSTs (Bijl et al., 2010,
with BAYSPLINE calibration) around the MECO are inbest agreement with the high SSTs derived from the linear
https://doi.org/10.5194/cp-17-2393-2021 Clim. Past, 17, 2393–2425, 2021
2406 P. K. Bijl et al.: Maastrichtian–Rupelian paleoclimates in the southwest Pacific
Figure 6. Ternary diagram showing fractional abundance of tetra-, penta- and hexamethylated brGDGTs from modern soils (DearingCrampton-Flood et al., 2020), peats (Naafs et al., 2017b), rivers (Tagus River, Portugal (Warden et al., 2016) and Yenisei River (De Jonge etal., 2015)) and marine sediments (Kara Sea (De Jonge et al., 2015), Svalbard (Dearing Crampton-Flood et al., 2019), Berau Delta (SinningheDamsté, 2016), Portugal (Warden et al., 2016), Baltic Sea (Warden et al., 2018), and Amazon Fan (Zell et al., 2014)), Paleogene lignites(Cobham, Schöningen, India and Otaio (Naafs et al., 2018b)) and Paleogene marine sediments (Arctic Ocean, International Ocean DiscoveryProgram (IODP) Arctic Coring Expedition (ACEX) (Willard et al., 2019), Otway Basin, Australia (Huurdeman et al., 2020), Gulf of Mexicocoastal plain, Harrel core (Sluijs et al., 2014), New Zealand (Pancost et al., 2013) and Antarctic Margin IODP Site U1356 (Bijl et al., 2013a)).Data from ODP Site 1172 are indicated by black crosses.
TEXOBL calibration, although in this TEX86 range all cali-brations yield SSTs within error (Fig. 9a).
In general, Maastrichtian (70.5–66.7 Ma) SSTs show agradual cooling trend towards the late Maastrichtian–earlyDanian hiatus of ∼ 800 kyr. The early Danian (∼ 65 Ma) isroughly 3 ◦C warmer than the late Maastrichtian (∼ 67 Ma).The mid-Paleocene (62–59 Ma) shows two cooling steps: a∼ 2 ◦C cooling at 62 Ma, followed by a return to higher SSTsroughly at 60 Ma, and a∼ 5 ◦C cooling to minimum values ofaround 18 ◦C around 59.5 Ma, where the record is truncatedby a hiatus.
A hiatus straddling the early Thanetian (59.0–57.7 Ma)likely obscures the onset of late Paleocene warming outof the mid-Paleocene temperature minimum. The latestbackground Paleocene SSTs fluctuate considerably, but thePETM warming clearly stands out (Sluijs et al., 2011), witha magnitude (5–7 ◦C depending on the calibration) compara-ble to that in other mid- to high-latitude sections and simi-lar to the global average (Frieling et al., 2017). Post-PETMSSTs drop back to pre-PETM values completely, followedby renewed warming towards the EECO. The magnitude ofwarming is 6 to 11 ◦C depending on the choice of calibration.Smaller early Eocene hyperthermal events cannot be confi-dently identified at Site 1172.
The highest SSTs of the EECO are slightly lower thanpeak PETM values in all calibrations, consistent with otherrecords (Hollis et al., 2019; Inglis et al., 2020). However, ahiatus between 52.7 and 51.4 Ma may conceal peak EECOtemperatures (Hollis et al., 2019; Lauretano et al., 2018).A gradual SST decline marks the end of the EECO around49.2 Ma, which is broadly coeval with cooling inferred frombenthic foraminiferal isotope records (Lauretano et al., 2018)and proxy records from New Zealand (Dallanave et al., 2016;Crouch et al., 2020).
Post-EECO cooling is gradual and of small magnitude(2 ◦C from peak EECO values) until about 46.4 Ma, afterwhich it accelerates (5 ◦C) between 46.2 and 44.4 Ma. Theage model in this particular interval is uncertain, due to aquestionable assignment of chron C21n (Bijl et al., 2010,2013b). Following the minimum SSTs at 44.4 Ma, SSTs riseagain towards a plateau at 42.7 Ma. An SST minimum of∼ 22 ◦C is observed just prior to the MECO, at 40.2 Ma, fol-lowed by MECO warming of about 5–7 ◦C at 39.9 Ma. Post-MECO cooling seems more gradual than MECO warming,although this might be the result of fine-scale sedimentationrate changes (Bijl et al., 2010), which are not accounted forin our age model. SSTs are almost identical to those for theMECO at the nearby Site 1170 on the South Tasman Rise
Clim. Past, 17, 2393–2425, 2021 https://doi.org/10.5194/cp-17-2393-2021
P. K. Bijl et al.: Maastrichtian–Rupelian paleoclimates in the southwest Pacific 2407
Figure 7. (a) BIT index, (b) IR (with cutoff value of the Aus-tralian soil IR of 0.5 and discarded MAAT samples in red crosses),(c) MBT’5me and (d) #ringstetra from Site 1172.
(Cramwinckel et al., 2020). Post-MECO cooling transitionsinto gradual late Eocene cooling, down to a minimum of∼ 19 ◦C at 35.7 Ma. The following latest Eocene–OligoceneTEX86-based SSTs (35–27 Ma) are 3 ◦C warmer, with sur-prisingly no cooling across the Eocene–Oligocene transition(Houben et al., 2019).
4.2.2 MAAT
After excluding samples with IR values above those of lo-cal soils, we present MBT’5me-based MAAT reconstructions.MAAT evolution reveals late Maastrichtian–early Danianwarming of 3 ◦C, gradual 4 ◦C cooling towards the mid-Paleocene and gradual 8 ◦C warming towards the EECO,with a conspicuous absence of warming at the PETM. Grad-ual cooling of 4 ◦C starts at 49.5 Ma and continues into thelate Eocene. MAAT reaches a minimum at 43 Ma, followedby a plateau phase. There is little warming that can be asso-ciated to the MECO. MAAT shows a conspicuous transient3 ◦C cooling in the late Eocene, at the onset of glauconite de-position. The Eocene–Oligocene Transition is characterizedby another 5 ◦C cooling. Except during the late Eocene, SST
is overall warmer than MAAT (Fig. 9c). This difference islargest during the EECO (up to 9 ◦C).
4.3 Branched GMGTs
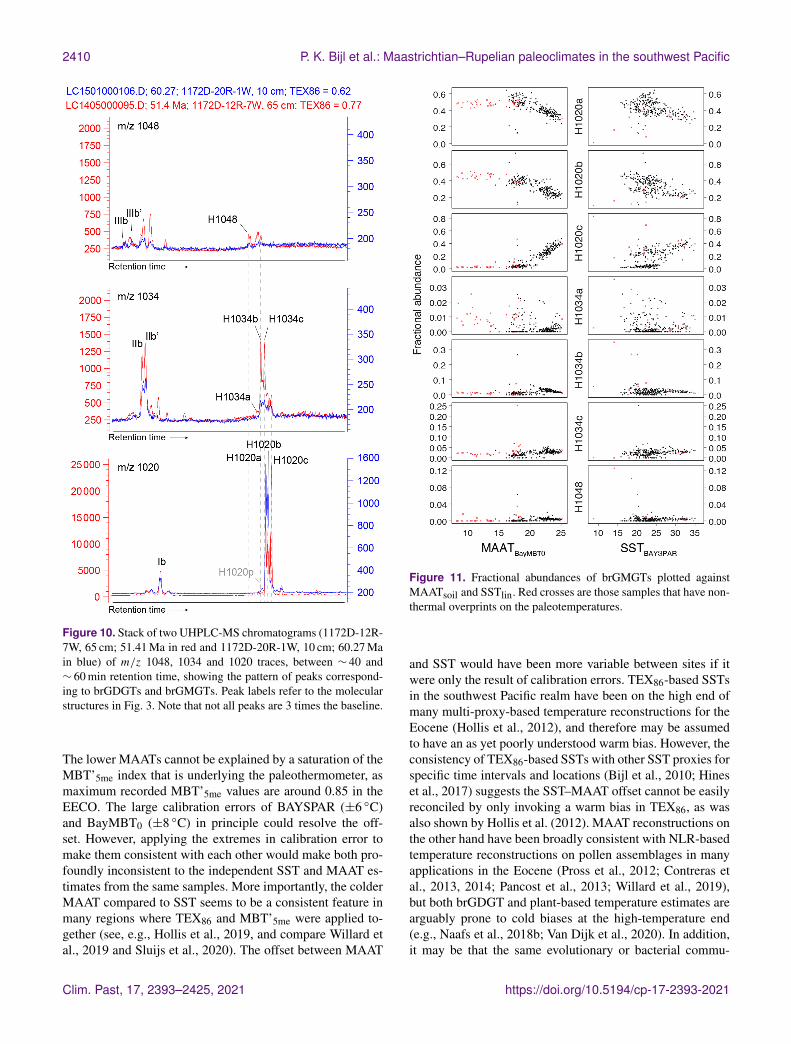
We detected brGMGTs throughout the record (see Fig. 10for typical chromatograms). The exact molecular structureand position of the C–C bridge is still unknown but basedon visual comparison with chromatograms of brGMGTs inAfrican lake sediments (Baxter et al., 2019), (traces of) allseven known brGMGTs can be identified. Next to H1020a,b, and c as most abundant brGMGTs, also H1034a, b and care detected, although in some samples in the Maastrichtian,individual peaks could not be separated. Traces of H1048can be seen at times, suggesting presence of this compoundas well, albeit in low relative abundance. Next to these pre-viously described peaks, we here recognized several otherpeaks that consistently occur at Site 1172: one compoundthat elutes just prior to H1020a, which we term H1020p(Fig. 10).
The fractional abundances of the H1020 isomers showqualitatively similar relations to temperature as in the EastAfrican lake dataset of Baxter et al. (2019): the relative abun-dance of H1020b has a negative relationship with MAAT,while H1020c has a positive relationship (Fig. 11). In ad-dition, H1020a seems negatively correlated with MAAT inour data, although this compound does not show any rela-tion to temperature in lakes (Baxter et al., 2019). The rela-tive abundances of the H1034 isomers do not show a clearrelationship with MAAT (Fig. 11), similar as in the tropicallake dataset, where the scatter increases at lower (H1034b)or higher (H1034a, c) temperatures (Baxter et al., 2019).
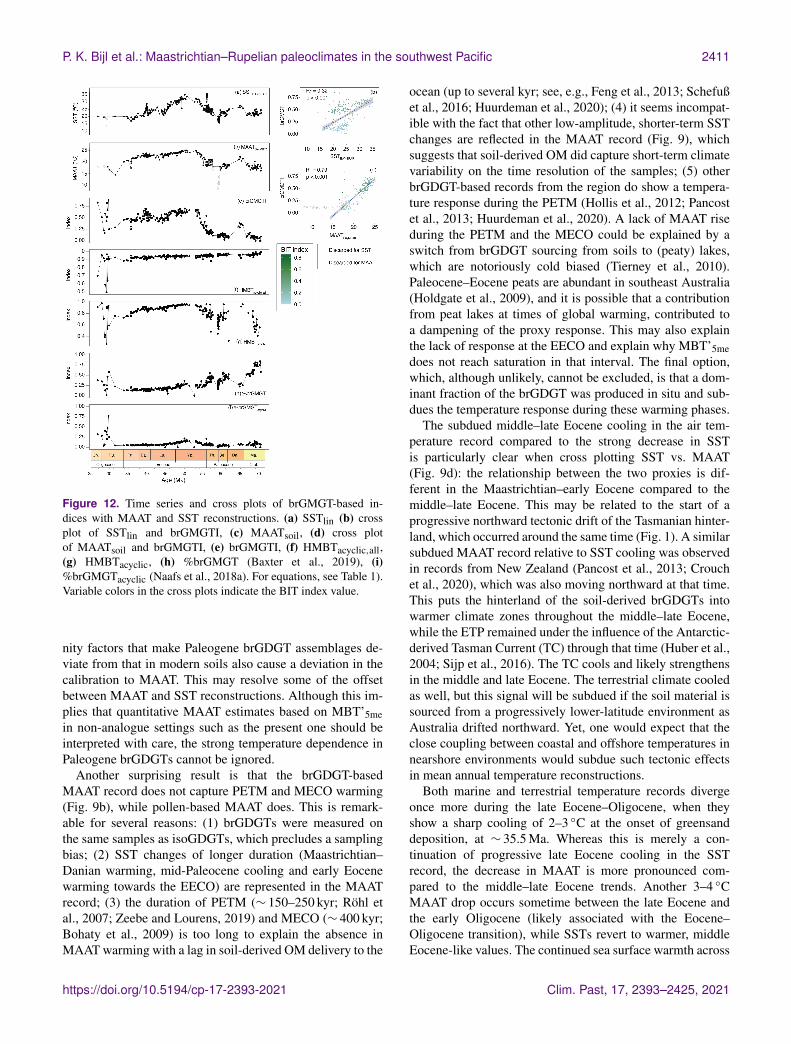
Downcore trends in brGMGTI are primarily controlled bythe relative abundance of H1020c and closely follow those inboth SST and MAAT. Upon cross correlation, we note thatbrGMGTI has a higher correlation with MAAT (R= 0.89)than with SST (R = 0.57; Fig. 12). Interestingly, the cor-relations between brGMGTI and temperature indices onlyhold for part of the dataset. Samples with high IR values,for which brGDGT-based MAAT is influenced by a flu-vial brGDGT contribution, fall outside the correlation (graycrosses in Fig. 12). In addition, we also note that brGMGTIapproaches 0 at reconstructed MAAT of 15 ◦C. The corre-lation with temperature (both MAAT and SST) is dividedinto two clusters. BrGMGTI values for samples from theyounger part of the record, with BIT index <∼ 0.3, seem tocorrelate better to temperature than those from the older partof the record, with BIT index values >∼ 0.3 (Fig. 12). Inthe Oligocene, where many isoGDGT signals were evidentlyoverprinted, the %brGMGTs increases (Figs. 3, 12d), and thebrGMGT composition is characterized by a relatively higherabundance of H1020c, H1034b and H1048 compared to therest of the record (Figs. 3, 12).
There is no clear relationship between %brGMGTs andbrGDGT-based MAAT (Fig. 12h, i). This differs from the
https://doi.org/10.5194/cp-17-2393-2021 Clim. Past, 17, 2393–2425, 2021
2408 P. K. Bijl et al.: Maastrichtian–Rupelian paleoclimates in the southwest Pacific
Figure 8. Cross plots of various brGDGT indices. (a) #ringstetra vs. #ringspenta, #ringstetra vs. #ringspenta5, #ringstetra vs. #ringspenta6,IRpenta vs. IRhexa. For the color and symbol legend, see Fig. 6.
Paleocene–Eocene Arctic Ocean record (Sluijs et al., 2020),where the brGMGTI has no correlation to temperature, while%brGMGTs do. This may indicate differences in sources ofbrGMGTs between the sites, differences in oceanographicsettings or a non-temperature control on their distribution.In contrast, HMBTacyclic appears to show similar trends tothe brGDGT-based MAAT (Fig. 12g), as is also seen in theArctic Ocean (Sluijs et al., 2020).
4.4 Palynology
4.4.1 Assemblages
Dinocyst assemblages are dominated by Manumiella spp.throughout the Maastrichtian, together with Goniodo-mideae (notably Dinopterygium spp.), and Cerebrocysta cpx.(Fig. 13). From the late Maastrichtian onwards, Senegalin-ium cpx. increases gradually in relative abundance, inter-rupted by acmes of Palaeoperidinium pyrophorum in the Da-nian and Glaphyrocysta cpx. in the lower Selandian. Sene-galinium cpx. is most abundant during the mid-Paleoceneand the Paleocene–Eocene transition, while the PETM it-self is characterized by abundant Apectodinium (∼ 30 %)and common Senegalinium cpx. and Goniodomideae (Sluijset al., 2011). After the PETM, Senegalinium cpx. abun-dance temporarily increases, followed by a high abundanceof Deflandrea cpx., Spinidinium cpx. and Elytrocysta spp.
with minor contributions of various other genera, e.g., Wet-zeliella, Hystrichokolpoma, Goniodomideae (Fig. 13). From45 to ∼ 37 Ma, Enneadocysta spp. abundance oscillatedwith Deflandrea cpx. and Spinidinium/Vozzhennikovia cpx.,with contributions of Phthanoperidinium spp. (Röhl et al.,2004a). Protoperidinioid dinocysts become common in thelate Eocene, around 35.5 Ma (Houben et al., 2019; Sluijs etal., 2003; Fig. 13).
4.4.2 Diversity and variability
Together with the changing assemblage composition, somestrong and coherent changes in diversity and variability in-dices are observed (Fig. 14). First, results are highly simi-lar for the full species-level dataset and the grouped assem-blages, indicating robustness of both the grouping and diver-sity analysis. The Maastrichtian–Paleocene assemblages arecharacterized by relatively low diversity, which increases to-wards the EECO, as variability indicated by the Gibbs indexdecreases. After this, diversity drops and variability increasesduring middle–late Eocene cooling ∼ 49–38 Ma, with an in-terruption around 41–39 Ma. Towards the top of the record,both diversity and variability increase.
Clim. Past, 17, 2393–2425, 2021 https://doi.org/10.5194/cp-17-2393-2021
P. K. Bijl et al.: Maastrichtian–Rupelian paleoclimates in the southwest Pacific 2409
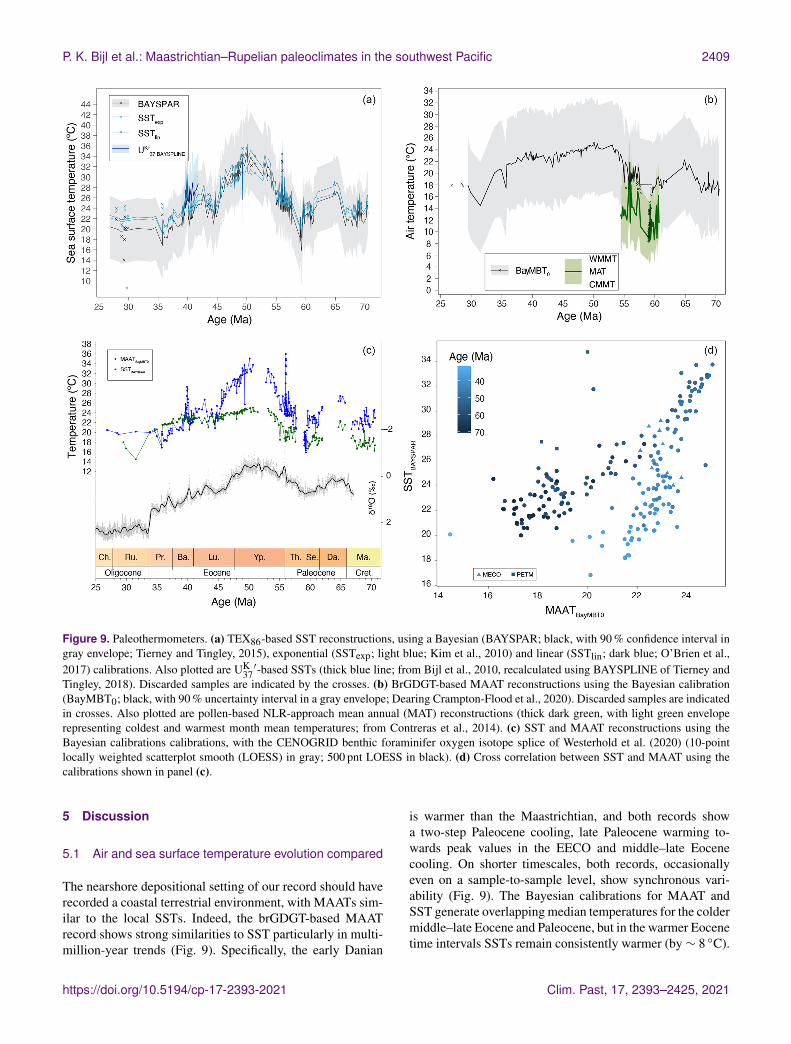
Figure 9. Paleothermometers. (a) TEX86-based SST reconstructions, using a Bayesian (BAYSPAR; black, with 90 % confidence interval ingray envelope; Tierney and Tingley, 2015), exponential (SSTexp; light blue; Kim et al., 2010) and linear (SSTlin; dark blue; O’Brien et al.,2017) calibrations. Also plotted are UK
37′-based SSTs (thick blue line; from Bijl et al., 2010, recalculated using BAYSPLINE of Tierney and
Tingley, 2018). Discarded samples are indicated by the crosses. (b) BrGDGT-based MAAT reconstructions using the Bayesian calibration(BayMBT0; black, with 90 % uncertainty interval in a gray envelope; Dearing Crampton-Flood et al., 2020). Discarded samples are indicatedin crosses. Also plotted are pollen-based NLR-approach mean annual (MAT) reconstructions (thick dark green, with light green enveloperepresenting coldest and warmest month mean temperatures; from Contreras et al., 2014). (c) SST and MAAT reconstructions using theBayesian calibrations calibrations, with the CENOGRID benthic foraminifer oxygen isotope splice of Westerhold et al. (2020) (10-pointlocally weighted scatterplot smooth (LOESS) in gray; 500 pnt LOESS in black). (d) Cross correlation between SST and MAAT using thecalibrations shown in panel (c).
5 Discussion
5.1 Air and sea surface temperature evolution compared
The nearshore depositional setting of our record should haverecorded a coastal terrestrial environment, with MAATs sim-ilar to the local SSTs. Indeed, the brGDGT-based MAATrecord shows strong similarities to SST particularly in multi-million-year trends (Fig. 9). Specifically, the early Danian
is warmer than the Maastrichtian, and both records showa two-step Paleocene cooling, late Paleocene warming to-wards peak values in the EECO and middle–late Eocenecooling. On shorter timescales, both records, occasionallyeven on a sample-to-sample level, show synchronous vari-ability (Fig. 9). The Bayesian calibrations for MAAT andSST generate overlapping median temperatures for the coldermiddle–late Eocene and Paleocene, but in the warmer Eocenetime intervals SSTs remain consistently warmer (by∼ 8 ◦C).
https://doi.org/10.5194/cp-17-2393-2021 Clim. Past, 17, 2393–2425, 2021
2410 P. K. Bijl et al.: Maastrichtian–Rupelian paleoclimates in the southwest Pacific
Figure 10. Stack of two UHPLC-MS chromatograms (1172D-12R-7W, 65 cm; 51.41 Ma in red and 1172D-20R-1W, 10 cm; 60.27 Main blue) of m/z 1048, 1034 and 1020 traces, between ∼ 40 and∼ 60 min retention time, showing the pattern of peaks correspond-ing to brGDGTs and brGMGTs. Peak labels refer to the molecularstructures in Fig. 3. Note that not all peaks are 3 times the baseline.
The lower MAATs cannot be explained by a saturation of theMBT’5me index that is underlying the paleothermometer, asmaximum recorded MBT’5me values are around 0.85 in theEECO. The large calibration errors of BAYSPAR (±6 ◦C)and BayMBT0 (±8 ◦C) in principle could resolve the off-set. However, applying the extremes in calibration error tomake them consistent with each other would make both pro-foundly inconsistent to the independent SST and MAAT es-timates from the same samples. More importantly, the colderMAAT compared to SST seems to be a consistent feature inmany regions where TEX86 and MBT’5me were applied to-gether (see, e.g., Hollis et al., 2019, and compare Willard etal., 2019 and Sluijs et al., 2020). The offset between MAAT
Figure 11. Fractional abundances of brGMGTs plotted againstMAATsoil and SSTlin. Red crosses are those samples that have non-thermal overprints on the paleotemperatures.
and SST would have been more variable between sites if itwere only the result of calibration errors. TEX86-based SSTsin the southwest Pacific realm have been on the high end ofmany multi-proxy-based temperature reconstructions for theEocene (Hollis et al., 2012), and therefore may be assumedto have an as yet poorly understood warm bias. However, theconsistency of TEX86-based SSTs with other SST proxies forspecific time intervals and locations (Bijl et al., 2010; Hineset al., 2017) suggests the SST–MAAT offset cannot be easilyreconciled by only invoking a warm bias in TEX86, as wasalso shown by Hollis et al. (2012). MAAT reconstructions onthe other hand have been broadly consistent with NLR-basedtemperature reconstructions on pollen assemblages in manyapplications in the Eocene (Pross et al., 2012; Contreras etal., 2013, 2014; Pancost et al., 2013; Willard et al., 2019),but both brGDGT and plant-based temperature estimates arearguably prone to cold biases at the high-temperature end(e.g., Naafs et al., 2018b; Van Dijk et al., 2020). In addition,it may be that the same evolutionary or bacterial commu-
Clim. Past, 17, 2393–2425, 2021 https://doi.org/10.5194/cp-17-2393-2021
P. K. Bijl et al.: Maastrichtian–Rupelian paleoclimates in the southwest Pacific 2411
Figure 12. Time series and cross plots of brGMGT-based in-dices with MAAT and SST reconstructions. (a) SSTlin (b) crossplot of SSTlin and brGMGTI, (c) MAATsoil, (d) cross plotof MAATsoil and brGMGTI, (e) brGMGTI, (f) HMBTacyclic,all,(g) HMBTacyclic, (h) %brGMGT (Baxter et al., 2019), (i)%brGMGTacyclic (Naafs et al., 2018a). For equations, see Table 1).Variable colors in the cross plots indicate the BIT index value.
nity factors that make Paleogene brGDGT assemblages de-viate from that in modern soils also cause a deviation in thecalibration to MAAT. This may resolve some of the offsetbetween MAAT and SST reconstructions. Although this im-plies that quantitative MAAT estimates based on MBT’5mein non-analogue settings such as the present one should beinterpreted with care, the strong temperature dependence inPaleogene brGDGTs cannot be ignored.
Another surprising result is that the brGDGT-basedMAAT record does not capture PETM and MECO warming(Fig. 9b), while pollen-based MAAT does. This is remark-able for several reasons: (1) brGDGTs were measured onthe same samples as isoGDGTs, which precludes a samplingbias; (2) SST changes of longer duration (Maastrichtian–Danian warming, mid-Paleocene cooling and early Eocenewarming towards the EECO) are represented in the MAATrecord; (3) the duration of PETM (∼ 150–250 kyr; Röhl etal., 2007; Zeebe and Lourens, 2019) and MECO (∼ 400 kyr;Bohaty et al., 2009) is too long to explain the absence inMAAT warming with a lag in soil-derived OM delivery to the
ocean (up to several kyr; see, e.g., Feng et al., 2013; Schefußet al., 2016; Huurdeman et al., 2020); (4) it seems incompat-ible with the fact that other low-amplitude, shorter-term SSTchanges are reflected in the MAAT record (Fig. 9), whichsuggests that soil-derived OM did capture short-term climatevariability on the time resolution of the samples; (5) otherbrGDGT-based records from the region do show a tempera-ture response during the PETM (Hollis et al., 2012; Pancostet al., 2013; Huurdeman et al., 2020). A lack of MAAT riseduring the PETM and the MECO could be explained by aswitch from brGDGT sourcing from soils to (peaty) lakes,which are notoriously cold biased (Tierney et al., 2010).Paleocene–Eocene peats are abundant in southeast Australia(Holdgate et al., 2009), and it is possible that a contributionfrom peat lakes at times of global warming, contributed toa dampening of the proxy response. This may also explainthe lack of response at the EECO and explain why MBT’5medoes not reach saturation in that interval. The final option,which, although unlikely, cannot be excluded, is that a dom-inant fraction of the brGDGT was produced in situ and sub-dues the temperature response during these warming phases.
The subdued middle–late Eocene cooling in the air tem-perature record compared to the strong decrease in SSTis particularly clear when cross plotting SST vs. MAAT(Fig. 9d): the relationship between the two proxies is dif-ferent in the Maastrichtian–early Eocene compared to themiddle–late Eocene. This may be related to the start of aprogressive northward tectonic drift of the Tasmanian hinter-land, which occurred around the same time (Fig. 1). A similarsubdued MAAT record relative to SST cooling was observedin records from New Zealand (Pancost et al., 2013; Crouchet al., 2020), which was also moving northward at that time.This puts the hinterland of the soil-derived brGDGTs intowarmer climate zones throughout the middle–late Eocene,while the ETP remained under the influence of the Antarctic-derived Tasman Current (TC) through that time (Huber et al.,2004; Sijp et al., 2016). The TC cools and likely strengthensin the middle and late Eocene. The terrestrial climate cooledas well, but this signal will be subdued if the soil material issourced from a progressively lower-latitude environment asAustralia drifted northward. Yet, one would expect that theclose coupling between coastal and offshore temperatures innearshore environments would subdue such tectonic effectsin mean annual temperature reconstructions.
Both marine and terrestrial temperature records divergeonce more during the late Eocene–Oligocene, when theyshow a sharp cooling of 2–3 ◦C at the onset of greensanddeposition, at ∼ 35.5 Ma. Whereas this is merely a con-tinuation of progressive late Eocene cooling in the SSTrecord, the decrease in MAAT is more pronounced com-pared to the middle–late Eocene trends. Another 3–4 ◦CMAAT drop occurs sometime between the late Eocene andthe early Oligocene (likely associated with the Eocene–Oligocene transition), while SSTs revert to warmer, middleEocene-like values. The continued sea surface warmth across
https://doi.org/10.5194/cp-17-2393-2021 Clim. Past, 17, 2393–2425, 2021
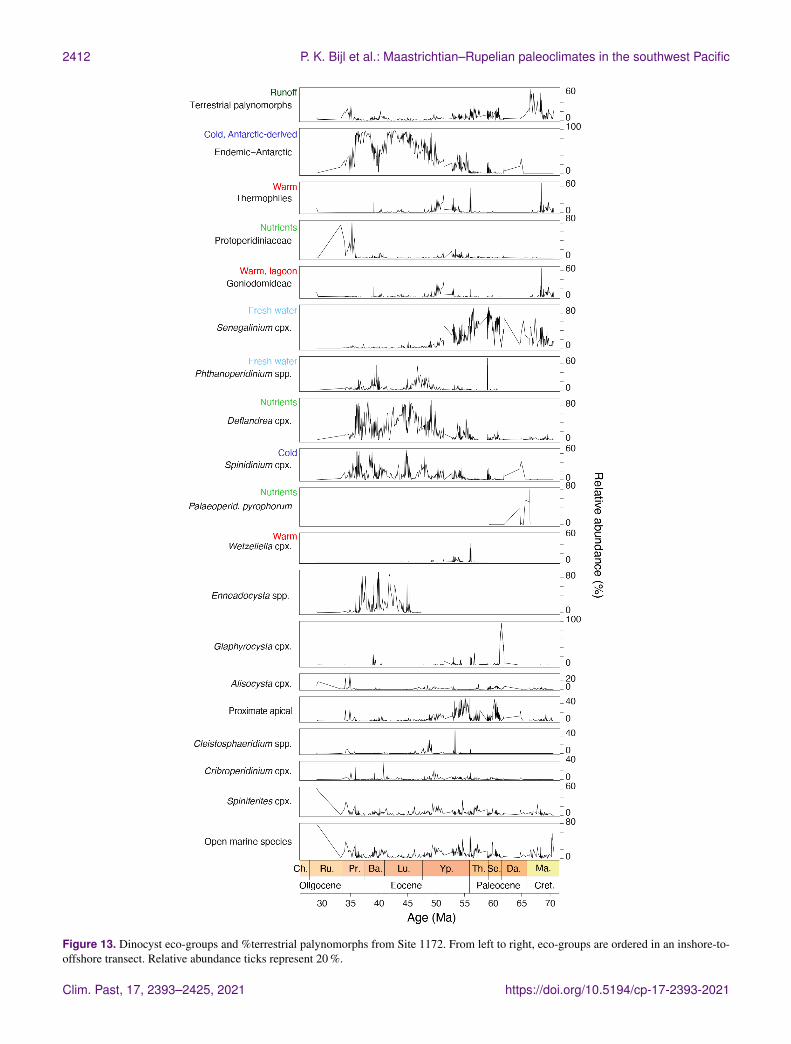
2412 P. K. Bijl et al.: Maastrichtian–Rupelian paleoclimates in the southwest Pacific
Figure 13. Dinocyst eco-groups and %terrestrial palynomorphs from Site 1172. From left to right, eco-groups are ordered in an inshore-to-offshore transect. Relative abundance ticks represent 20 %.
Clim. Past, 17, 2393–2425, 2021 https://doi.org/10.5194/cp-17-2393-2021
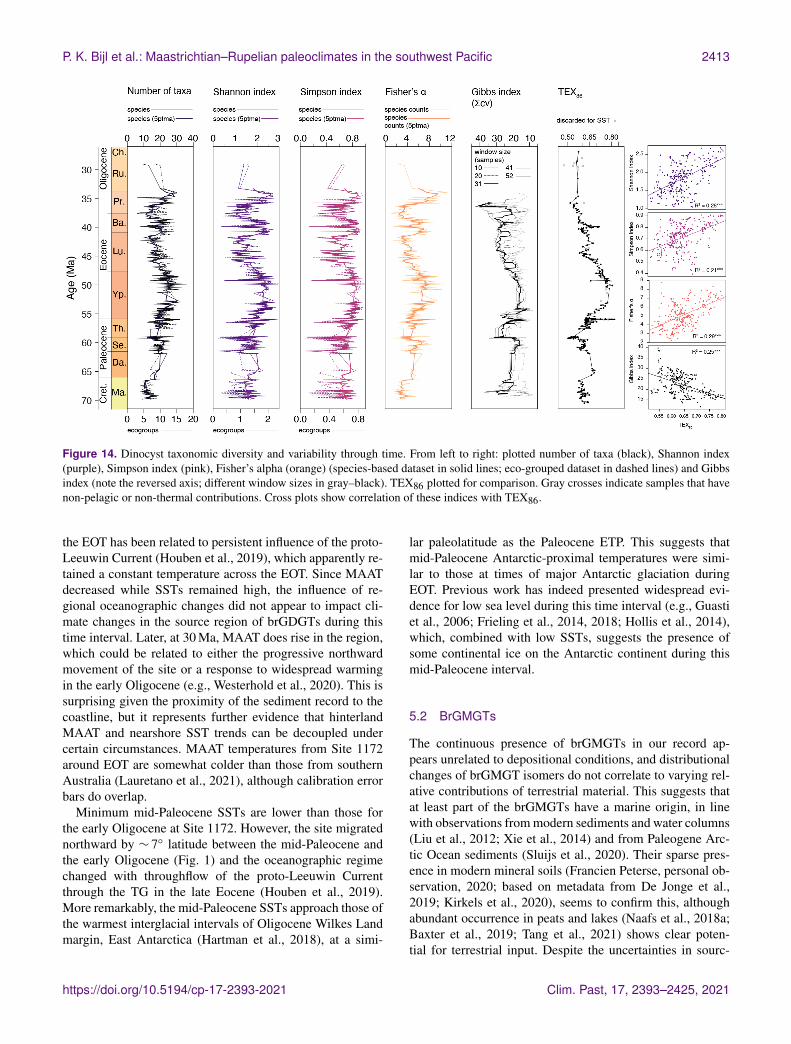
P. K. Bijl et al.: Maastrichtian–Rupelian paleoclimates in the southwest Pacific 2413
Figure 14. Dinocyst taxonomic diversity and variability through time. From left to right: plotted number of taxa (black), Shannon index(purple), Simpson index (pink), Fisher’s alpha (orange) (species-based dataset in solid lines; eco-grouped dataset in dashed lines) and Gibbsindex (note the reversed axis; different window sizes in gray–black). TEX86 plotted for comparison. Gray crosses indicate samples that havenon-pelagic or non-thermal contributions. Cross plots show correlation of these indices with TEX86.
the EOT has been related to persistent influence of the proto-Leeuwin Current (Houben et al., 2019), which apparently re-tained a constant temperature across the EOT. Since MAATdecreased while SSTs remained high, the influence of re-gional oceanographic changes did not appear to impact cli-mate changes in the source region of brGDGTs during thistime interval. Later, at 30 Ma, MAAT does rise in the region,which could be related to either the progressive northwardmovement of the site or a response to widespread warmingin the early Oligocene (e.g., Westerhold et al., 2020). This issurprising given the proximity of the sediment record to thecoastline, but it represents further evidence that hinterlandMAAT and nearshore SST trends can be decoupled undercertain circumstances. MAAT temperatures from Site 1172around EOT are somewhat colder than those from southernAustralia (Lauretano et al., 2021), although calibration errorbars do overlap.
Minimum mid-Paleocene SSTs are lower than those forthe early Oligocene at Site 1172. However, the site migratednorthward by ∼ 7◦ latitude between the mid-Paleocene andthe early Oligocene (Fig. 1) and the oceanographic regimechanged with throughflow of the proto-Leeuwin Currentthrough the TG in the late Eocene (Houben et al., 2019).More remarkably, the mid-Paleocene SSTs approach those ofthe warmest interglacial intervals of Oligocene Wilkes Landmargin, East Antarctica (Hartman et al., 2018), at a simi-
lar paleolatitude as the Paleocene ETP. This suggests thatmid-Paleocene Antarctic-proximal temperatures were simi-lar to those at times of major Antarctic glaciation duringEOT. Previous work has indeed presented widespread evi-dence for low sea level during this time interval (e.g., Guastiet al., 2006; Frieling et al., 2014, 2018; Hollis et al., 2014),which, combined with low SSTs, suggests the presence ofsome continental ice on the Antarctic continent during thismid-Paleocene interval.
5.2 BrGMGTs
The continuous presence of brGMGTs in our record ap-pears unrelated to depositional conditions, and distributionalchanges of brGMGT isomers do not correlate to varying rel-ative contributions of terrestrial material. This suggests thatat least part of the brGMGTs have a marine origin, in linewith observations from modern sediments and water columns(Liu et al., 2012; Xie et al., 2014) and from Paleogene Arc-tic Ocean sediments (Sluijs et al., 2020). Their sparse pres-ence in modern mineral soils (Francien Peterse, personal ob-servation, 2020; based on metadata from De Jonge et al.,2019; Kirkels et al., 2020), seems to confirm this, althoughabundant occurrence in peats and lakes (Naafs et al., 2018a;Baxter et al., 2019; Tang et al., 2021) shows clear poten-tial for terrestrial input. Despite the uncertainties in sourc-
https://doi.org/10.5194/cp-17-2393-2021 Clim. Past, 17, 2393–2425, 2021
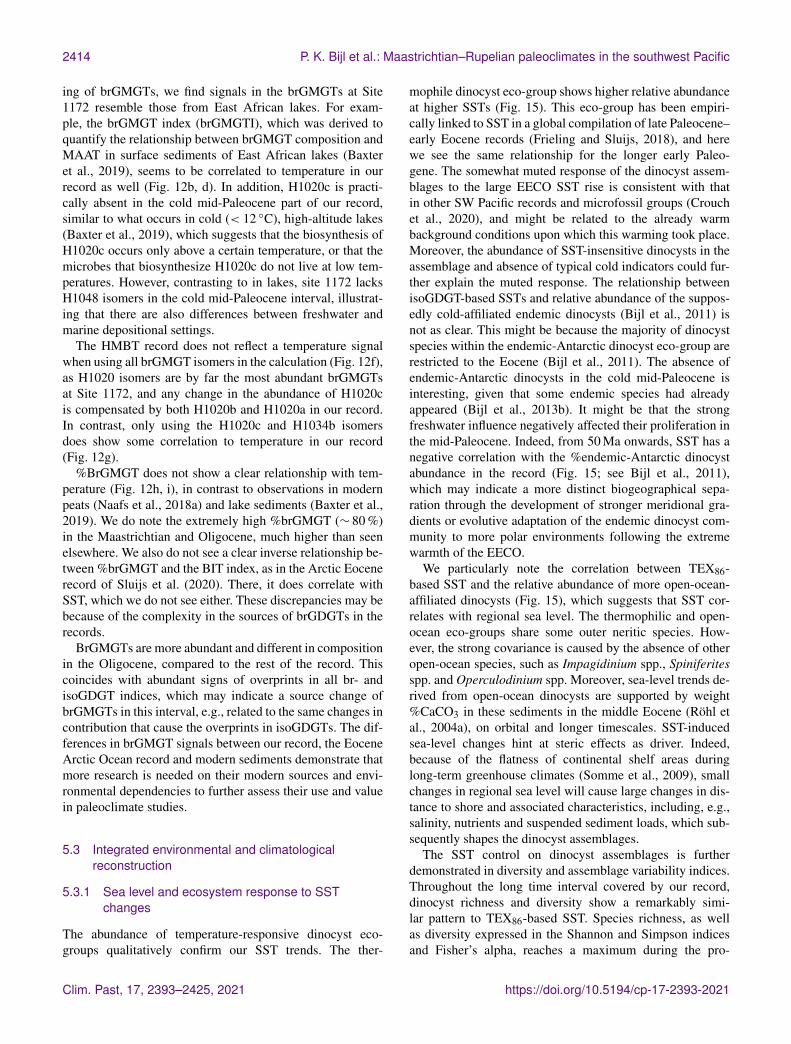
2414 P. K. Bijl et al.: Maastrichtian–Rupelian paleoclimates in the southwest Pacific
ing of brGMGTs, we find signals in the brGMGTs at Site1172 resemble those from East African lakes. For exam-ple, the brGMGT index (brGMGTI), which was derived toquantify the relationship between brGMGT composition andMAAT in surface sediments of East African lakes (Baxteret al., 2019), seems to be correlated to temperature in ourrecord as well (Fig. 12b, d). In addition, H1020c is practi-cally absent in the cold mid-Paleocene part of our record,similar to what occurs in cold (< 12 ◦C), high-altitude lakes(Baxter et al., 2019), which suggests that the biosynthesis ofH1020c occurs only above a certain temperature, or that themicrobes that biosynthesize H1020c do not live at low tem-peratures. However, contrasting to in lakes, site 1172 lacksH1048 isomers in the cold mid-Paleocene interval, illustrat-ing that there are also differences between freshwater andmarine depositional settings.
The HMBT record does not reflect a temperature signalwhen using all brGMGT isomers in the calculation (Fig. 12f),as H1020 isomers are by far the most abundant brGMGTsat Site 1172, and any change in the abundance of H1020cis compensated by both H1020b and H1020a in our record.In contrast, only using the H1020c and H1034b isomersdoes show some correlation to temperature in our record(Fig. 12g).
%BrGMGT does not show a clear relationship with tem-perature (Fig. 12h, i), in contrast to observations in modernpeats (Naafs et al., 2018a) and lake sediments (Baxter et al.,2019). We do note the extremely high %brGMGT (∼ 80 %)in the Maastrichtian and Oligocene, much higher than seenelsewhere. We also do not see a clear inverse relationship be-tween %brGMGT and the BIT index, as in the Arctic Eocenerecord of Sluijs et al. (2020). There, it does correlate withSST, which we do not see either. These discrepancies may bebecause of the complexity in the sources of brGDGTs in therecords.
BrGMGTs are more abundant and different in compositionin the Oligocene, compared to the rest of the record. Thiscoincides with abundant signs of overprints in all br- andisoGDGT indices, which may indicate a source change ofbrGMGTs in this interval, e.g., related to the same changes incontribution that cause the overprints in isoGDGTs. The dif-ferences in brGMGT signals between our record, the EoceneArctic Ocean record and modern sediments demonstrate thatmore research is needed on their modern sources and envi-ronmental dependencies to further assess their use and valuein paleoclimate studies.
5.3 Integrated environmental and climatologicalreconstruction
5.3.1 Sea level and ecosystem response to SSTchanges
The abundance of temperature-responsive dinocyst eco-groups qualitatively confirm our SST trends. The ther-
mophile dinocyst eco-group shows higher relative abundanceat higher SSTs (Fig. 15). This eco-group has been empiri-cally linked to SST in a global compilation of late Paleocene–early Eocene records (Frieling and Sluijs, 2018), and herewe see the same relationship for the longer early Paleo-gene. The somewhat muted response of the dinocyst assem-blages to the large EECO SST rise is consistent with thatin other SW Pacific records and microfossil groups (Crouchet al., 2020), and might be related to the already warmbackground conditions upon which this warming took place.Moreover, the abundance of SST-insensitive dinocysts in theassemblage and absence of typical cold indicators could fur-ther explain the muted response. The relationship betweenisoGDGT-based SSTs and relative abundance of the suppos-edly cold-affiliated endemic dinocysts (Bijl et al., 2011) isnot as clear. This might be because the majority of dinocystspecies within the endemic-Antarctic dinocyst eco-group arerestricted to the Eocene (Bijl et al., 2011). The absence ofendemic-Antarctic dinocysts in the cold mid-Paleocene isinteresting, given that some endemic species had alreadyappeared (Bijl et al., 2013b). It might be that the strongfreshwater influence negatively affected their proliferation inthe mid-Paleocene. Indeed, from 50 Ma onwards, SST has anegative correlation with the %endemic-Antarctic dinocystabundance in the record (Fig. 15; see Bijl et al., 2011),which may indicate a more distinct biogeographical sepa-ration through the development of stronger meridional gra-dients or evolutive adaptation of the endemic dinocyst com-munity to more polar environments following the extremewarmth of the EECO.
We particularly note the correlation between TEX86-based SST and the relative abundance of more open-ocean-affiliated dinocysts (Fig. 15), which suggests that SST cor-relates with regional sea level. The thermophilic and open-ocean eco-groups share some outer neritic species. How-ever, the strong covariance is caused by the absence of otheropen-ocean species, such as Impagidinium spp., Spiniferitesspp. and Operculodinium spp. Moreover, sea-level trends de-rived from open-ocean dinocysts are supported by weight%CaCO3 in these sediments in the middle Eocene (Röhl etal., 2004a), on orbital and longer timescales. SST-inducedsea-level changes hint at steric effects as driver. Indeed,because of the flatness of continental shelf areas duringlong-term greenhouse climates (Somme et al., 2009), smallchanges in regional sea level will cause large changes in dis-tance to shore and associated characteristics, including, e.g.,salinity, nutrients and suspended sediment loads, which sub-sequently shapes the dinocyst assemblages.
The SST control on dinocyst assemblages is furtherdemonstrated in diversity and assemblage variability indices.Throughout the long time interval covered by our record,dinocyst richness and diversity show a remarkably simi-lar pattern to TEX86-based SST. Species richness, as wellas diversity expressed in the Shannon and Simpson indicesand Fisher’s alpha, reaches a maximum during the pro-
Clim. Past, 17, 2393–2425, 2021 https://doi.org/10.5194/cp-17-2393-2021
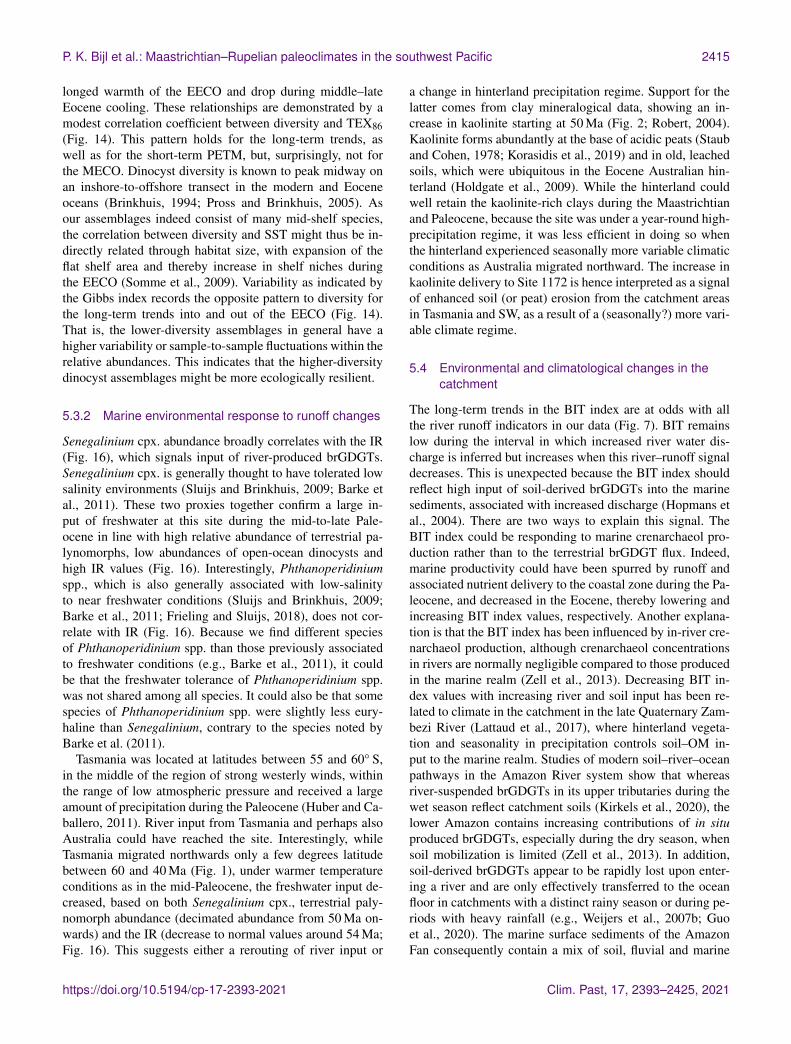
P. K. Bijl et al.: Maastrichtian–Rupelian paleoclimates in the southwest Pacific 2415
longed warmth of the EECO and drop during middle–lateEocene cooling. These relationships are demonstrated by amodest correlation coefficient between diversity and TEX86(Fig. 14). This pattern holds for the long-term trends, aswell as for the short-term PETM, but, surprisingly, not forthe MECO. Dinocyst diversity is known to peak midway onan inshore-to-offshore transect in the modern and Eoceneoceans (Brinkhuis, 1994; Pross and Brinkhuis, 2005). Asour assemblages indeed consist of many mid-shelf species,the correlation between diversity and SST might thus be in-directly related through habitat size, with expansion of theflat shelf area and thereby increase in shelf niches duringthe EECO (Somme et al., 2009). Variability as indicated bythe Gibbs index records the opposite pattern to diversity forthe long-term trends into and out of the EECO (Fig. 14).That is, the lower-diversity assemblages in general have ahigher variability or sample-to-sample fluctuations within therelative abundances. This indicates that the higher-diversitydinocyst assemblages might be more ecologically resilient.
5.3.2 Marine environmental response to runoff changes
Senegalinium cpx. abundance broadly correlates with the IR(Fig. 16), which signals input of river-produced brGDGTs.Senegalinium cpx. is generally thought to have tolerated lowsalinity environments (Sluijs and Brinkhuis, 2009; Barke etal., 2011). These two proxies together confirm a large in-put of freshwater at this site during the mid-to-late Pale-ocene in line with high relative abundance of terrestrial pa-lynomorphs, low abundances of open-ocean dinocysts andhigh IR values (Fig. 16). Interestingly, Phthanoperidiniumspp., which is also generally associated with low-salinityto near freshwater conditions (Sluijs and Brinkhuis, 2009;Barke et al., 2011; Frieling and Sluijs, 2018), does not cor-relate with IR (Fig. 16). Because we find different speciesof Phthanoperidinium spp. than those previously associatedto freshwater conditions (e.g., Barke et al., 2011), it couldbe that the freshwater tolerance of Phthanoperidinium spp.was not shared among all species. It could also be that somespecies of Phthanoperidinium spp. were slightly less eury-haline than Senegalinium, contrary to the species noted byBarke et al. (2011).
Tasmania was located at latitudes between 55 and 60◦ S,in the middle of the region of strong westerly winds, withinthe range of low atmospheric pressure and received a largeamount of precipitation during the Paleocene (Huber and Ca-ballero, 2011). River input from Tasmania and perhaps alsoAustralia could have reached the site. Interestingly, whileTasmania migrated northwards only a few degrees latitudebetween 60 and 40 Ma (Fig. 1), under warmer temperatureconditions as in the mid-Paleocene, the freshwater input de-creased, based on both Senegalinium cpx., terrestrial paly-nomorph abundance (decimated abundance from 50 Ma on-wards) and the IR (decrease to normal values around 54 Ma;Fig. 16). This suggests either a rerouting of river input or
a change in hinterland precipitation regime. Support for thelatter comes from clay mineralogical data, showing an in-crease in kaolinite starting at 50 Ma (Fig. 2; Robert, 2004).Kaolinite forms abundantly at the base of acidic peats (Stauband Cohen, 1978; Korasidis et al., 2019) and in old, leachedsoils, which were ubiquitous in the Eocene Australian hin-terland (Holdgate et al., 2009). While the hinterland couldwell retain the kaolinite-rich clays during the Maastrichtianand Paleocene, because the site was under a year-round high-precipitation regime, it was less efficient in doing so whenthe hinterland experienced seasonally more variable climaticconditions as Australia migrated northward. The increase inkaolinite delivery to Site 1172 is hence interpreted as a signalof enhanced soil (or peat) erosion from the catchment areasin Tasmania and SW, as a result of a (seasonally?) more vari-able climate regime.
5.4 Environmental and climatological changes in thecatchment
The long-term trends in the BIT index are at odds with allthe river runoff indicators in our data (Fig. 7). BIT remainslow during the interval in which increased river water dis-charge is inferred but increases when this river–runoff signaldecreases. This is unexpected because the BIT index shouldreflect high input of soil-derived brGDGTs into the marinesediments, associated with increased discharge (Hopmans etal., 2004). There are two ways to explain this signal. TheBIT index could be responding to marine crenarchaeol pro-duction rather than to the terrestrial brGDGT flux. Indeed,marine productivity could have been spurred by runoff andassociated nutrient delivery to the coastal zone during the Pa-leocene, and decreased in the Eocene, thereby lowering andincreasing BIT index values, respectively. Another explana-tion is that the BIT index has been influenced by in-river cre-narchaeol production, although crenarchaeol concentrationsin rivers are normally negligible compared to those producedin the marine realm (Zell et al., 2013). Decreasing BIT in-dex values with increasing river and soil input has been re-lated to climate in the catchment in the late Quaternary Zam-bezi River (Lattaud et al., 2017), where hinterland vegeta-tion and seasonality in precipitation controls soil–OM in-put to the marine realm. Studies of modern soil–river–oceanpathways in the Amazon River system show that whereasriver-suspended brGDGTs in its upper tributaries during thewet season reflect catchment soils (Kirkels et al., 2020), thelower Amazon contains increasing contributions of in situproduced brGDGTs, especially during the dry season, whensoil mobilization is limited (Zell et al., 2013). In addition,soil-derived brGDGTs appear to be rapidly lost upon enter-ing a river and are only effectively transferred to the oceanfloor in catchments with a distinct rainy season or during pe-riods with heavy rainfall (e.g., Weijers et al., 2007b; Guoet al., 2020). The marine surface sediments of the AmazonFan consequently contain a mix of soil, fluvial and marine
https://doi.org/10.5194/cp-17-2393-2021 Clim. Past, 17, 2393–2425, 2021
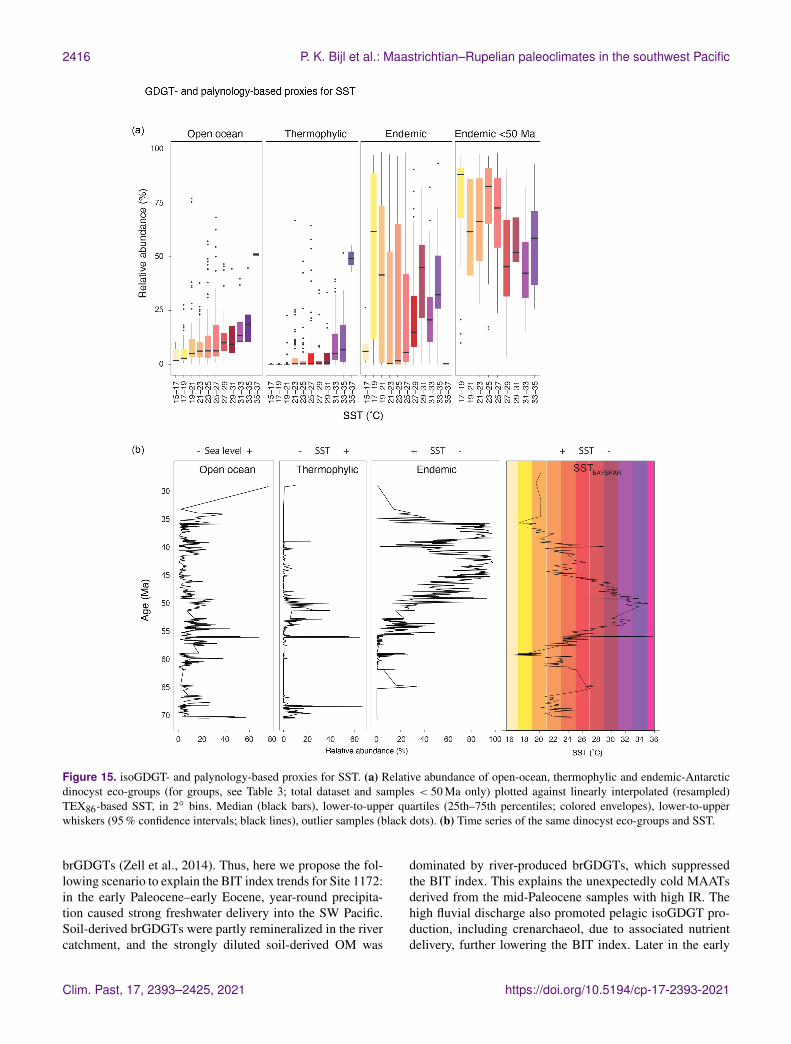
2416 P. K. Bijl et al.: Maastrichtian–Rupelian paleoclimates in the southwest Pacific
Figure 15. isoGDGT- and palynology-based proxies for SST. (a) Relative abundance of open-ocean, thermophylic and endemic-Antarcticdinocyst eco-groups (for groups, see Table 3; total dataset and samples < 50 Ma only) plotted against linearly interpolated (resampled)TEX86-based SST, in 2◦ bins. Median (black bars), lower-to-upper quartiles (25th–75th percentiles; colored envelopes), lower-to-upperwhiskers (95 % confidence intervals; black lines), outlier samples (black dots). (b) Time series of the same dinocyst eco-groups and SST.
brGDGTs (Zell et al., 2014). Thus, here we propose the fol-lowing scenario to explain the BIT index trends for Site 1172:in the early Paleocene–early Eocene, year-round precipita-tion caused strong freshwater delivery into the SW Pacific.Soil-derived brGDGTs were partly remineralized in the rivercatchment, and the strongly diluted soil-derived OM was
dominated by river-produced brGDGTs, which suppressedthe BIT index. This explains the unexpectedly cold MAATsderived from the mid-Paleocene samples with high IR. Thehigh fluvial discharge also promoted pelagic isoGDGT pro-duction, including crenarchaeol, due to associated nutrientdelivery, further lowering the BIT index. Later in the early
Clim. Past, 17, 2393–2425, 2021 https://doi.org/10.5194/cp-17-2393-2021
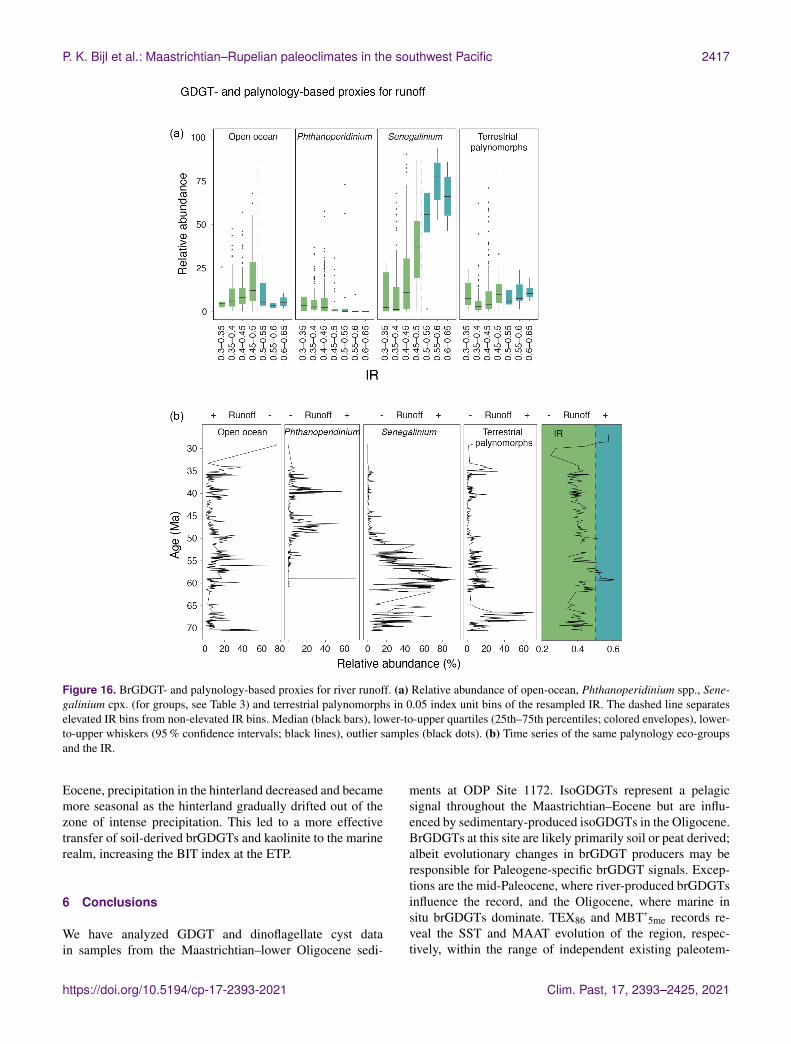
P. K. Bijl et al.: Maastrichtian–Rupelian paleoclimates in the southwest Pacific 2417
Figure 16. BrGDGT- and palynology-based proxies for river runoff. (a) Relative abundance of open-ocean, Phthanoperidinium spp., Sene-galinium cpx. (for groups, see Table 3) and terrestrial palynomorphs in 0.05 index unit bins of the resampled IR. The dashed line separateselevated IR bins from non-elevated IR bins. Median (black bars), lower-to-upper quartiles (25th–75th percentiles; colored envelopes), lower-to-upper whiskers (95 % confidence intervals; black lines), outlier samples (black dots). (b) Time series of the same palynology eco-groupsand the IR.
Eocene, precipitation in the hinterland decreased and becamemore seasonal as the hinterland gradually drifted out of thezone of intense precipitation. This led to a more effectivetransfer of soil-derived brGDGTs and kaolinite to the marinerealm, increasing the BIT index at the ETP.
6 Conclusions
We have analyzed GDGT and dinoflagellate cyst datain samples from the Maastrichtian–lower Oligocene sedi-
ments at ODP Site 1172. IsoGDGTs represent a pelagicsignal throughout the Maastrichtian–Eocene but are influ-enced by sedimentary-produced isoGDGTs in the Oligocene.BrGDGTs at this site are likely primarily soil or peat derived;albeit evolutionary changes in brGDGT producers may beresponsible for Paleogene-specific brGDGT signals. Excep-tions are the mid-Paleocene, where river-produced brGDGTsinfluence the record, and the Oligocene, where marine insitu brGDGTs dominate. TEX86 and MBT’5me records re-veal the SST and MAAT evolution of the region, respec-tively, within the range of independent existing paleotem-
https://doi.org/10.5194/cp-17-2393-2021 Clim. Past, 17, 2393–2425, 2021
2418 P. K. Bijl et al.: Maastrichtian–Rupelian paleoclimates in the southwest Pacific
perature reconstructions from the same samples. A temper-ature offset between the SST and MAAT proxies remainspoorly reconciled with the coastal proximity of the site but islikely a combined effect of evolutionary trends in MBT’5me–MAAT relationships and a disparate integration of climatesignals by both proxies. The subdued air temperature cool-ing in the middle Eocene compared to the SST cooling couldin part reflect progressive northward tectonic drift of the hin-terland, while SSTs responded to stronger progressive cool-ing of southern-sourced surface waters. Strong MAAT cool-ing occurred stepwise at 35.5 Ma and around the Eocene–Oligocene transition. The absence of SST cooling around theEocene–Oligocene transition seems to suggest some discon-nection between oceanographic reorganizations and regionalMAAT changes. The absence of a MAAT response at thePETM and MECO remains unresolved but might be relatedto shifting sources of brGDGTs during these warm phases.
The relatively high IR and low #ringstetra confirm infer-ences from dinocyst assemblages of an inner mid-shelf de-positional setting. We reconstruct strong river runoff in themid-Paleocene–earliest Eocene at this site and normal open-marine conditions thereafter. The latter reflects increasedseasonality in precipitation in the catchment as the conti-nent tectonically migrates northwards during the middle andlate Eocene, out of the region of year-round precipitation.The correlation between SST changes, dinoflagellate cystassemblages and biodiversity metrics suggests temperature-controlled sea-level changes influenced the site, probablythrough steric effects. We find corroborating evidence for atemperature signal in brGMGT assemblages, further demon-strating the potential to develop novel proxies with more ex-tensive studies of modern distributions.
Data availability. Raw GDGT/GMGT and palynologi-cal data presented in this paper, as well as R markdowncode for data analysis and visualization, can be found onGitHub (https://github.com/bijlpeter83/RGDGT.git, last access:8 November 2021). Data were deposited on Zenodo underhttps://doi.org/10.5281/zenodo.4471204 (Bijl, 2021).
Supplement. The supplement related to this article is availableonline at: https://doi.org/10.5194/cp-17-2393-2021-supplement.
Author contributions. AS (PETM) and PKB (part) preparedsamples for GDGT analyses. PKB (part), AS (PETM) and CB (part)integrated UHPLC-MS results. AS (PETM) and PKB (part) ana-lyzed palynological samples. All authors contributed to the interpre-tation of the organic results, and PKB, AS, JF and MC interpreteddinocyst results. PKB wrote the R script for data analyses and visu-alization, drafted the figures and wrote the paper with input from allauthors.
Competing interests. The authors declare that they have no con-flict of interest.
Disclaimer. Publisher’s note: Copernicus Publications remainsneutral with regard to jurisdictional claims in published maps andinstitutional affiliations.
Acknowledgements. This research used samples from the OceanDrilling Program, which was funded through US National Sci-ence foundation under the management of Joint OceanographicInstitutions, Inc. We thank Klaas Nierop, Desmond Eefting,Bregje van der Bolt, and Natasja Welters for technical/analyticalsupport. We thank Chris Hollis and an anonymous reviewer for con-structive, critical reviews which greatly improved the paper.
Financial support. Peter K. Bijl acknowledges funding throughNWO Vernieuwingsimpuls Veni (grant no. 863.13.002). This workwas carried out under the program of the Netherlands Earth SystemScience Centre (NESSC), financially supported by the Dutch Min-istry of Education, Culture and Science. Margot J. Cramwinckeland Appy Sluijs acknowledge the Ammodo Foundation for fund-ing unfettered research of laureate Appy Sluijs. Peter K. Bijl andAppy Sluijs thank the European Research Council for startinggrant no. 802835 (OceaNice) and consolidator grant no. 771497(SPANC), respectively.
Review statement. This paper was edited by Erin McClymontand reviewed by Chris Hollis and one anonymous referee.
References
Anagnostou, E., John, E. H., Edgar, K. M., Foster, G. L., Ridg-well, A., Inglis, G. N., Pancost, R. D., Lunt, D. J., and Pear-son, P. N.: Changing atmospheric CO2 concentration was theprimary driver of early Cenozoic climate, Nature, 533, 380–384,https://doi.org/10.1038/nature17423, 2016.
Anagnostou, E., John, E. H., Babila, T. L., Sexton, P. F., Ridg-well, A., Lunt, D. J., Pearson, P. N., Chalk, T. B., Pancost, R.D., Foster, G. L.: Proxy evidence for state-dependence of climatesensitivity in the Eocene greenhouse, Nat. Commun., 11, 4436,https://doi.org/10.1038/s41467-020-17887-x, 2020.
Barke, J., Abels, H. A., Sangiorgi, F., Greenwood, D. R., Sweet,A. R., Donders, T., Reichart, G. J., Lotter, A. F., and Brinkhuis,H.: Orbitally forced Azolla blooms and middle Eocene Arc-tic hydrology: Clues from palynology, Geology, 39, 427–430,https://doi.org/10.1130/G31640.1, 2011.
Baxter, A. J., Hopmans, E. C., Russell, J. M., and Sin-ninghe Damsté, J. S.: Bacterial GMGTs in east africanlake sediments: Their potential as palaeotemperature in-dicators, Geochim. Cosmochim. Acta, 259, 155–169,https://doi.org/10.1016/j.gca.2019.05.039, 2019.
Bijl, P.: bijlpeter83/DINOSTRAT: Release DINOSTRATV1 for peer review process (1.0), Zenodo [data set],https://doi.org/10.5281/zenodo.4471204, 2021.
Clim. Past, 17, 2393–2425, 2021 https://doi.org/10.5194/cp-17-2393-2021
P. K. Bijl et al.: Maastrichtian–Rupelian paleoclimates in the southwest Pacific 2419
Bijl, P. K., Schouten, S., Brinkhuis, H., Sluijs, A., Reichart, G. J.,and Zachos, J. C.: Early Palaeogene temperature evolution of thesouthwest Pacific Ocean, Nature, 461, 776–779, 2009.
Bijl, P. K., Houben, A. J. P., Schouten, S., Bohaty, S. M.,Sluijs, A., Reichart, G.-J., Sinninghe Damsté, J. S., andBrinkhuis, H.: Transient middle Eocene atmospheric carbondioxide and temperature variations, Science, 330, 819–821,https://doi.org/10.1126/science.1193654, 2010.
Bijl, P. K., Pross, J., Warnaar, J., Stickley, C. E., Huber, M.,Guerstein, R., Houben, A. J. P., Sluijs, A., Visscher, H., andBrinkhuis, H.: Environmental forcings of Paleogene South-ern Ocean dinoflagellate biogeography, Paleoceanography, 26,PA1202, https://doi.org/10.1029/2009PA001905, 2011.
Bijl, P. K., Bendle, J. A. P., Bohaty, S. M., Pross, J.,Schouten, S., Tauxe, L., Stickley, C. E., McKay, R. M.,Röhl, U., Olney, M., Sluijs, A., Escutia, C., and Brinkhuis,H.: Eocene cooling linked to early flow across the Tasma-nian Gateway, P. Natl. Acad. Sci. USA, 110, 9645–9650,https://doi.org/10.1073/pnas.1220872110, 2013a.
Bijl, P. K., Sluijs, A., and Brinkhuis, H.: A magneto- chemo-stratigraphically calibrated dinoflagellate cyst zonation of theearly Paleogene South Pacific Ocean, Earth-Sci. Rev., 124, 1–31,2013b.
Bijl, P. K., Sluijs, A., and Brinkhuis, H.: Erratum to ”A magneto-and chemostratigraphically calibrated dinoflagellate cyst zona-tion of the early Paleogene South Pacific Ocean” [Earth-Sci. Rev., 124 (2013) 1–31], Earth-Sci. Rev., 134, 160–163,https://doi.org/10.1016/j.earscirev.2014.03.010, 2014.
Bijl, P. K., Brinkhuis, H., Egger, L. M., Eldrett, J. S., Frieling, J.,Grothe, A., Houben, A. J. P., Pross, J., Sliwinska, K. K., andSluijs, A.: Comment on “Wetzeliella and its allies–the “hole”story: A taxonomic revision of the Paleogene dinoflagellate sub-family Wetzelielloideae” by Williams et al. (2015), Palynology,41, 423–429. https://doi.org/10.1080/01916122.2016.1235056,2017.
Blaga, C. I., Reichart, G.-J., Heiri, O., and Sinninghe Damsté,J. S.: Tetraether membrane lipid distributions in water-columnparticulate matter and sediments: A study of 47 Europeanlakes along a north-south transect, J. Paleolimnol., 41, 523–540,https://doi.org/10.1007/s10933-008-9242-2, 2009.
Bohaty, S. M., Zachos, J. C., Florindo, F., and Delaney, M.L.: Coupled greenhouse warming and deep-sea acidifica-tion in the middle Eocene, Paleoceanography, 24, PA001676,https://doi.org/10.1029/2008PA001676, 2009.
Bohaty, S. M., Zachos, J. C., and Delaney, M. L.: ForaminiferalMg/Ca evidence for Southern Ocean cooling across the Eocene–Oligocene transition, Earth Planet. Sc. Lett., 317–318, 251–261,https://doi.org/10.1016/j.epsl.2011.11.037, 2012.
Brinkhuis, H.: Late Eocene to early Oligocene dinoflagellate cystsfrom the Priabonian type-area (northeast Italy); biostratigraphyand palaeoenvironmental interpretation, Palaeogeogr. Palaeocl.,107, 121–163, 1994.
Brinkhuis, H., Sengers, S., Sluijs, A., Warnaar, J., and Williams,G. L.: Latest Cretaceous to earliest Oligocene, and Qua-ternary dinoflagellates from ODP site 1172, East TasmanPlateau, in: Proceedings of the Ocean Drilling Program, sci-entific results, edited by: Exon, N. and Kennett, J. P., U.S.Government Printing Office, College Station, Texas, USA,https://doi.org/10.2973/odp.proc.sr.189.106.2003, 2003.
Cande, S. C., and Stock, J. M.: Cenozoic reconstructions of theAustralia-new Zealand-south Pacific sector of antarctica, in: TheCenozoic Southern Ocean: Tectonics, sedimentation and climatechange between australia and Antarctica, edited by: Exon, N. F.,Kennett, P., and Malone, M., Geophys. Monogr. Ser., AmericanGeophysical Union, 5–18, 2004.
Carpenter, R. J., Jordan, G. J., Macphail, M. K., and Hill, R.S.: Near-tropical early Eocene terrestrial temperatures at theAustralo-Antarctic margin, western Tasmania, Geology, 40, 267–270, https://doi.org/10.1130/G32584.1, 2012.
Contreras, L., Pross, J., Bijl, P. K., Koutsodendris, A., Raine,J. I., van de Schootbrugge, B., and Brinkhuis, H.: Earlyto middle Eocene vegetation dynamics at the Wilkes LandMargin (Antarctica), Rev. Palaeobot. Palynol., 197, 119–142,https://doi.org/10.1016/j.revpalbo.2013.05.009, 2013.
Contreras, L., Pross, J., Bijl, P. K., O’Hara, R. B., Raine, J. I., Sluijs,A., and Brinkhuis, H.: Southern high-latitude terrestrial climatechange during the Palaeocene–Eocene derived from a marinepollen record (ODP Site 1172, East Tasman Plateau), Clim. Past,10, 1401–1420, https://doi.org/10.5194/cp-10-1401-2014, 2014.
Cramwinckel, M. J., Huber, M., Kocken, I. J., Agnini, C., Bijl, P. K.,Bohaty, S. M., Frieling, J., Goldner, A., Hilgen, F. J., Kip, E. L.,Peterse, F., Van Der Ploeg, R., Röhl, U., Schouten, S., and Sluijs,A.: Synchronous tropical and deep ocean temperature evolutionin the Eocene, Nature, 559, 382–386, 2018.
Cramwinckel, M. J., Woelders, L., Huurdeman, E. P., Peterse, F.,Gallagher, S. J., Pross, J., Burgess, C. E., Reichart, G.-J., Sluijs,A., and Bijl, P. K.: Surface-circulation change in the southwestPacific Ocean across the Middle Eocene Climatic Optimum: in-ferences from dinoflagellate cysts and biomarker paleothermom-etry, Clim. Past, 16, 1667–1689, https://doi.org/10.5194/cp-16-1667-2020, 2020.
Creech, J. B., Baker, J. A., Hollis, C. J., Morgans, H. E. G., andSmith, E. G. C.: Eocene sea temperatures for the mid-latitudesouthwest Pacific from Mg/Ca ratios in planktonic and benthicforaminifera, Earth Planet. Sc. Lett., 299, 483–495, 2010.
Crouch, E. M., Shepherd, C. L., Morgans, H. E. G., Naafs, B.D. A., Dallanave, E., Phillips, A., Hollis, C. J., and Pan-cost, R. D.: Climatic and environmental changes across theEarly Eocene Climatic Optimum at mid-Waipara River, Can-terbury Basin, New Zealand, Earth-Sci. Rev., 200, 102961,https://doi.org/10.1016/j.earscirev.2019.102961, 2020.
Dallanave, E., Bachtadse, V., Crouch, E. M., Tauxe, L., Shepherd,C. L., Morgans, H. E. G., Hollis, C. J., Hines, B. R., and Sugisaki,S.: Constraining early to middle Eocene climate evolution of thesouthwest Pacific and Southern Ocean, Earth Planet. Sc. Lett.,433, 380–392. https://doi.org/10.1016/j.epsl.2015.11.010, 2016.
Dearing Crampton-Flood, E., Peterse, F., Munsterman, D., and Sin-ninghe Damsté, J. S.: Using tetraether lipids archived in NorthSea Basin sediments to extract North Western European Pliocenecontinental air temperatures, Earth Planet. Sc. Lett., 490, 193–205, 2018.
Dearing Crampton-Flood, E., Peterse, F., and Sinninghe Damsté,J. S.: Production of branched tetraethers in the marine realm:Svalbard fjord sediments revisited, Org. Gochem., 138, 103907,https://doi.org/10.1016/j.orggeochem.2019.103907, 2019.
Dearing Crampton-Flood, E., Tierney, J. E., Peterse, F., Kirkels, F.M. S. A., and Sinninghe Damsté, J. S.: BayMBT: A bayesian cal-ibration model for branched glycerol dialkyl glycerol tetraethers
https://doi.org/10.5194/cp-17-2393-2021 Clim. Past, 17, 2393–2425, 2021
2420 P. K. Bijl et al.: Maastrichtian–Rupelian paleoclimates in the southwest Pacific
in soils and peats, Geochim. Cosmochim. Ac., 268, 142–159,https://doi.org/10.1016/j.gca.2019.09.043, 2020.
De Jonge, C., Hopmans, E. C., Stadnitskaia, A., Rijpstra, W. I.C., Hofland, R., Tegelaar, E., and Sinninghe Damsté, J. S.:Identification of novel penta- and hexamethylated branchedglycerol dialkyl glycerol tetraethers in peat using HPLC-MS2, GC-MS and GC-SMB-MS, Org. Geochem., 54, 78–82,https://doi.org/10.1016/j.orggeochem.2012.10.004, 2013.
De Jonge, C., Hopmans, E. C., Zell, C. I., Kim, J.-H., Schouten,S., and Sinninghe Damsté, J. S.: Occurrence and abun-dance of 6-methyl branched glycerol dialkyl glyceroltetraethers in soils: Implications for palaeoclimate re-construction, Geochim. Cosmochim. Ac., 141, 97–112,https://doi.org/10.1016/j.gca.2014.06.013, 2014a.
De Jonge, C., Stadnitskaia, A., Hopmans, E. C., Cherkashov,G., Fedotov, A., and Sinninghe Damsté, J. S.: In situproduced branched glycerol dialkyl glycerol tetraethers insuspended particulate matter from the Yenisei River, east-ern Siberia, Geochim. Cosmochim. Ac., 125, 476–491,https://doi.org/10.1016/j.gca.2013.10.031, 2014b.
De Jonge, C., Stadnitskaia, A., Hopmans, E. C., Cherkashov,G., Fedotov, A., Streletskaya, I. D., Vasiliev, A. A., andSinninghe Damsté, J. S.: Drastic changes in the distributionof branched tetraether lipids in suspended matter and sedi-ments from the Yenisei River and Kara Sea (Siberia): Im-plications for the use of brGDGT-based proxies in coastalmarine sediments, Geochim. Cosmochim. Ac., 165, 200–225,https://doi.org/10.1016/j.gca.2015.05.044, 2015.
De Jonge, C., Stadnitskaia, A., Cherkashov, G., and Sin-ninghe Damsté, J. S.: Branched glycerol dialkyl glyc-erol tetraethers and crenarchaeol record post-glacial sealevel rise and shift in source of terrigenous brGDGTs inthe Kara Sea (Arctic Ocean), Org. Geochem., 92, 42–54,https://doi.org/10.1016/j.orggeochem.2015.11.009, 2016.
De Jonge, C., Radujkovic, D., Sigurdsson, B. D., Weedon, J. T.,Janssens, I., and Peterse, F.: Lipid biomarker temperature proxyresponds to abrupt shift in the bacterial community compositionin geothermally heated soils, Org. Geochem., 137, 894 103897,https://doi.org/10.1016/j.orggeochem.2019.07.006, 2019.
Douglas, P. M. J., Affek, H. P., Ivany, L. C., Houben, A. J. P., Sijp,W. P., Sluijs, A., Schouten, S., and Pagani, M.: Pronounced zonalheterogeneity in Eocene southern high latitude sea surface tem-peratures, P. Natl. A. Sci., 111, 6582–6587, 2014.
Elling, F. J., Könneke, M., Lipp, J. S., Becker, K. W., Gagen, E. J.,and Hinrichs, K.-U.: Effects of growth phase on the membranelipid composition of the thaumarchaeon Nitrosopumilus mar-itimus and their implications for archaeal lipid distributions inthe marine environment, Geochim. Cosmochim. Ac., 141, 579–597, https://doi.org/10.1016/j.gca.2014.07.005, 2014.
Evans, D., Sagoo, N., Renema, W., Cotton, L. J., Müller, W.,Todd, J. A., Saraswati, P. K., Stassen, P., Ziegler, M., Pear-son, P. N., Valdes, P. J., and Affek, H. P.: Eocene green-house climate revealed by coupled clumped isotope-Mg/Cathermometry, P. Natl. Acad. Sci. USA, 115, 1174–1179,https://doi.org/10.1073/pnas.1714744115, 2018.
Exon, N. F., Kennett, J. P., and Malone, M.: Proceedings of theOcean Drilling Program, initial reports, 189, US GovernmentPrinting Office, College Station, Texas, USA, 2001.
Feng, X., Vonk, J. E., van Dongen, B. E., Gustafsson, Ö., Semiletov,I. P., Dudarev, O. V., Wang, Z., Montluçon, D. B., Wacker, L.,and Eglinton, T. I.: Differential mobilization of terrestrial carbonpools in Eurasian Arctic river basins, P. Natl. Acad. Sci., 110,14168–14173, https://doi.org/10.1073/pnas.1307031110, 2013.
Fensome, R. A., Taylor, F. J. R., Norris, G., Sarjeant, W. A. S.,Wharton, D. I., and Williams, G. L.: A classification of modernand fossil dinoflagellates, in: Micropalaeontology, Special pub-lication no. 7, edited by: Dinkins, G., Sheridan Press, Hanover,Pennsylvania, USA, 351 pp., 1993.
Fisher, R. A., Corbet, A. S., and Williams, C. B.: The relation be-tween the number of species and the number of individuals ina random sample of an animal population, J. Anim. Ecol., 12,42–58, https://doi.org/10.2307/1411, 1943.
Foster, G. L., Royer, D. L., and Lunt, D. J.: Future climate forc-ing potentially without precedent in the last 420 million years,Nat. Commun., 8, 14845, https://doi.org/10.1038/ncomms14845,2017.
Frieling, J., and Sluijs, A.: Towards quantitative environ-mental reconstructions from ancient non-analogue micro-fossil assemblages: Ecological preferences of Paleocene– Eocene dinoflagellates, Earth-Sci. Rev., 185, 956–973,https://doi.org/10.1016/j.earscirev.2018.08.014, 2018.
Frieling, J., Iakovleva, A. I., Reichart, G.-J., Aleksandrova,G. N., Gnibidenko, Z. N., Schouten, S., and Sluijs, A.:Paleocene–Eocene warming and biotic response in theepicontinental west Siberian Sea, Geology, 42, 767–770,https://doi.org/10.1130/G35724.1, 2014.
Frieling, J., Gebhardt, H., Huber, M., Adekeye, O. A., Akande, S.O., Reichart, G.-J., Middelburg, J. J., Schouten, S., and Sluijs,A.: Extreme warmth and heat-stressed plankton in the tropicsduring the Paleocene-Eocene Thermal Maximum, Sci. Adv., 3,e1600891, https://doi.org/10.1126/sciadv.1600891, 2017.
Frieling, J., Huurdeman, E. P., Rem, C. C. M., Donders, T. H., Pross,J., Bohaty, S. M., Holdgate, G. R., Gallagher, S. J., McGowran,B., and Bijl, P. K.: Identification of the Paleocene-Eocene bound-ary in coastal strata in the Otway Basin, Victoria, Australia,J. Micropalaeontol., 37, 317–339, https://doi.org/10.5194/jm-37-317-2018, 2018.
Fuller, M. and Touchard, Y.: On the magnetostratigraphy of the EastTasman Plateau, timing of the opening of the Tasmanian Gate-way and paleoenvironmental changes, in: The Cenozoic South-ern Ocean. tectonics, sedimentation and climate change betweenAustralia and Antarctica, edited by: Exon, N., Kennett, J. P.,and Malone, M., American Geophysical Union (AGU), Geoph.Monog. Series, Washington, USA, 127–151, 2004.
Gibbs, S. J., Bown, P. R., Murphy, B. H., Sluijs, A., Edgar, K. M.,Pälike, H., Bolton, C. T., and Zachos, J. C.: Scaled biotic disrup-tion during early Eocene global warming events, Biogeosciences,9, 4679–4688, https://doi.org/10.5194/bg-9-4679-2012, 2012.
Guasti, E., Speijer, R. P., Brinkhuis, H., Smit, J., and Steurbaut, E.:Paleoenvironmental change at the Danian-Selandian transitionin Tunisia: Foraminifera, organic-walled dinoflagellate cyst andcalcareous nannofossil records, Mar. Micropaleontol., 59, 210–229, 2006.
Guo, J., Glendell, M., Meersmans, J., Kirkels, F., Middelburg,J. J., and Peterse, F.: Assessing branched tetraether lipids astracers of soil organic carbon transport through the Carmi-
Clim. Past, 17, 2393–2425, 2021 https://doi.org/10.5194/cp-17-2393-2021
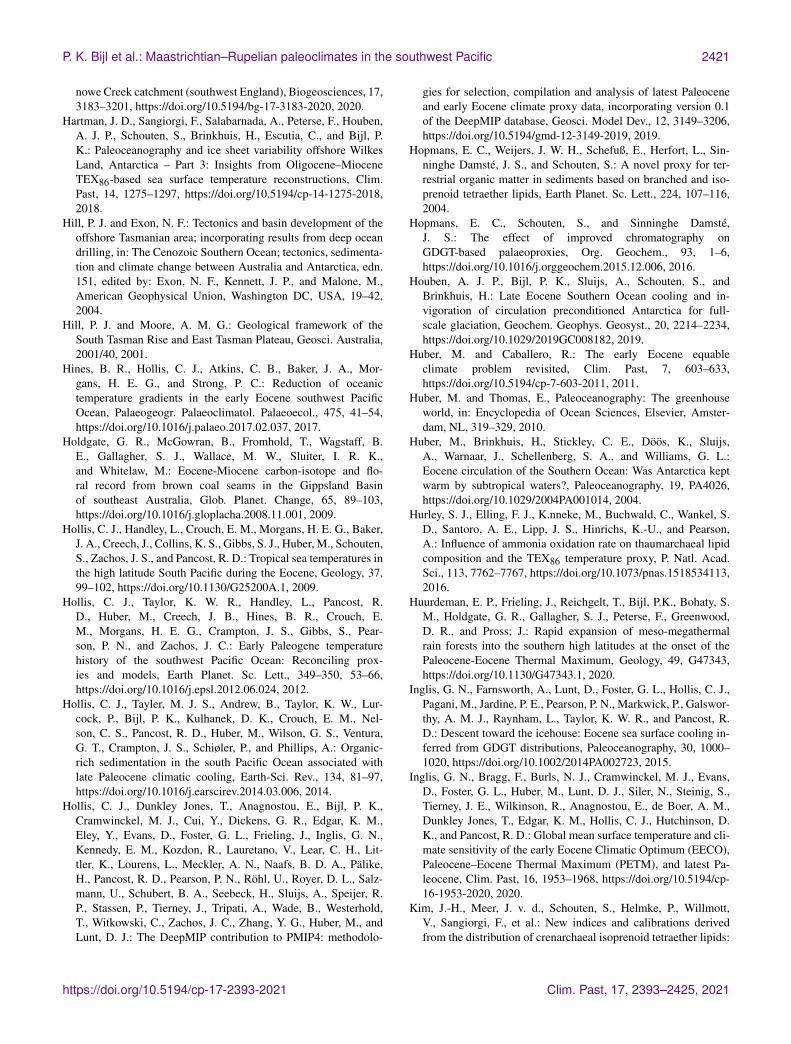
P. K. Bijl et al.: Maastrichtian–Rupelian paleoclimates in the southwest Pacific 2421
nowe Creek catchment (southwest England), Biogeosciences, 17,3183–3201, https://doi.org/10.5194/bg-17-3183-2020, 2020.
Hartman, J. D., Sangiorgi, F., Salabarnada, A., Peterse, F., Houben,A. J. P., Schouten, S., Brinkhuis, H., Escutia, C., and Bijl, P.K.: Paleoceanography and ice sheet variability offshore WilkesLand, Antarctica – Part 3: Insights from Oligocene–MioceneTEX86-based sea surface temperature reconstructions, Clim.Past, 14, 1275–1297, https://doi.org/10.5194/cp-14-1275-2018,2018.
Hill, P. J. and Exon, N. F.: Tectonics and basin development of theoffshore Tasmanian area; incorporating results from deep oceandrilling, in: The Cenozoic Southern Ocean; tectonics, sedimenta-tion and climate change between Australia and Antarctica, edn.151, edited by: Exon, N. F., Kennett, J. P., and Malone, M.,American Geophysical Union, Washington DC, USA, 19–42,2004.
Hill, P. J. and Moore, A. M. G.: Geological framework of theSouth Tasman Rise and East Tasman Plateau, Geosci. Australia,2001/40, 2001.
Hines, B. R., Hollis, C. J., Atkins, C. B., Baker, J. A., Mor-gans, H. E. G., and Strong, P. C.: Reduction of oceanictemperature gradients in the early Eocene southwest PacificOcean, Palaeogeogr. Palaeoclimatol. Palaeoecol., 475, 41–54,https://doi.org/10.1016/j.palaeo.2017.02.037, 2017.
Holdgate, G. R., McGowran, B., Fromhold, T., Wagstaff, B.E., Gallagher, S. J., Wallace, M. W., Sluiter, I. R. K.,and Whitelaw, M.: Eocene-Miocene carbon-isotope and flo-ral record from brown coal seams in the Gippsland Basinof southeast Australia, Glob. Planet. Change, 65, 89–103,https://doi.org/10.1016/j.gloplacha.2008.11.001, 2009.
Hollis, C. J., Handley, L., Crouch, E. M., Morgans, H. E. G., Baker,J. A., Creech, J., Collins, K. S., Gibbs, S. J., Huber, M., Schouten,S., Zachos, J. S., and Pancost, R. D.: Tropical sea temperatures inthe high latitude South Pacific during the Eocene, Geology, 37,99–102, https://doi.org/10.1130/G25200A.1, 2009.
Hollis, C. J., Taylor, K. W. R., Handley, L., Pancost, R.D., Huber, M., Creech, J. B., Hines, B. R., Crouch, E.M., Morgans, H. E. G., Crampton, J. S., Gibbs, S., Pear-son, P. N., and Zachos, J. C.: Early Paleogene temperaturehistory of the southwest Pacific Ocean: Reconciling prox-ies and models, Earth Planet. Sc. Lett., 349–350, 53–66,https://doi.org/10.1016/j.epsl.2012.06.024, 2012.
Hollis, C. J., Tayler, M. J. S., Andrew, B., Taylor, K. W., Lur-cock, P., Bijl, P. K., Kulhanek, D. K., Crouch, E. M., Nel-son, C. S., Pancost, R. D., Huber, M., Wilson, G. S., Ventura,G. T., Crampton, J. S., Schiøler, P., and Phillips, A.: Organic-rich sedimentation in the south Pacific Ocean associated withlate Paleocene climatic cooling, Earth-Sci. Rev., 134, 81–97,https://doi.org/10.1016/j.earscirev.2014.03.006, 2014.
Hollis, C. J., Dunkley Jones, T., Anagnostou, E., Bijl, P. K.,Cramwinckel, M. J., Cui, Y., Dickens, G. R., Edgar, K. M.,Eley, Y., Evans, D., Foster, G. L., Frieling, J., Inglis, G. N.,Kennedy, E. M., Kozdon, R., Lauretano, V., Lear, C. H., Lit-tler, K., Lourens, L., Meckler, A. N., Naafs, B. D. A., Pälike,H., Pancost, R. D., Pearson, P. N., Röhl, U., Royer, D. L., Salz-mann, U., Schubert, B. A., Seebeck, H., Sluijs, A., Speijer, R.P., Stassen, P., Tierney, J., Tripati, A., Wade, B., Westerhold,T., Witkowski, C., Zachos, J. C., Zhang, Y. G., Huber, M., andLunt, D. J.: The DeepMIP contribution to PMIP4: methodolo-
gies for selection, compilation and analysis of latest Paleoceneand early Eocene climate proxy data, incorporating version 0.1of the DeepMIP database, Geosci. Model Dev., 12, 3149–3206,https://doi.org/10.5194/gmd-12-3149-2019, 2019.
Hopmans, E. C., Weijers, J. W. H., Schefuß, E., Herfort, L., Sin-ninghe Damsté, J. S., and Schouten, S.: A novel proxy for ter-restrial organic matter in sediments based on branched and iso-prenoid tetraether lipids, Earth Planet. Sc. Lett., 224, 107–116,2004.
Hopmans, E. C., Schouten, S., and Sinninghe Damsté,J. S.: The effect of improved chromatography onGDGT-based palaeoproxies, Org. Geochem., 93, 1–6,https://doi.org/10.1016/j.orggeochem.2015.12.006, 2016.
Houben, A. J. P., Bijl, P. K., Sluijs, A., Schouten, S., andBrinkhuis, H.: Late Eocene Southern Ocean cooling and in-vigoration of circulation preconditioned Antarctica for full-scale glaciation, Geochem. Geophys. Geosyst., 20, 2214–2234,https://doi.org/10.1029/2019GC008182, 2019.
Huber, M. and Caballero, R.: The early Eocene equableclimate problem revisited, Clim. Past, 7, 603–633,https://doi.org/10.5194/cp-7-603-2011, 2011.
Huber, M. and Thomas, E., Paleoceanography: The greenhouseworld, in: Encyclopedia of Ocean Sciences, Elsevier, Amster-dam, NL, 319–329, 2010.
Huber, M., Brinkhuis, H., Stickley, C. E., Döös, K., Sluijs,A., Warnaar, J., Schellenberg, S. A., and Williams, G. L.:Eocene circulation of the Southern Ocean: Was Antarctica keptwarm by subtropical waters?, Paleoceanography, 19, PA4026,https://doi.org/10.1029/2004PA001014, 2004.
Hurley, S. J., Elling, F. J., K.nneke, M., Buchwald, C., Wankel, S.D., Santoro, A. E., Lipp, J. S., Hinrichs, K.-U., and Pearson,A.: Influence of ammonia oxidation rate on thaumarchaeal lipidcomposition and the TEX86 temperature proxy, P. Natl. Acad.Sci., 113, 7762–7767, https://doi.org/10.1073/pnas.1518534113,2016.
Huurdeman, E. P., Frieling, J., Reichgelt, T., Bijl, P.K., Bohaty, S.M., Holdgate, G. R., Gallagher, S. J., Peterse, F., Greenwood,D. R., and Pross; J.: Rapid expansion of meso-megathermalrain forests into the southern high latitudes at the onset of thePaleocene-Eocene Thermal Maximum, Geology, 49, G47343,https://doi.org/10.1130/G47343.1, 2020.
Inglis, G. N., Farnsworth, A., Lunt, D., Foster, G. L., Hollis, C. J.,Pagani, M., Jardine, P. E., Pearson, P. N., Markwick, P., Galswor-thy, A. M. J., Raynham, L., Taylor, K. W. R., and Pancost, R.D.: Descent toward the icehouse: Eocene sea surface cooling in-ferred from GDGT distributions, Paleoceanography, 30, 1000–1020, https://doi.org/10.1002/2014PA002723, 2015.
Inglis, G. N., Bragg, F., Burls, N. J., Cramwinckel, M. J., Evans,D., Foster, G. L., Huber, M., Lunt, D. J., Siler, N., Steinig, S.,Tierney, J. E., Wilkinson, R., Anagnostou, E., de Boer, A. M.,Dunkley Jones, T., Edgar, K. M., Hollis, C. J., Hutchinson, D.K., and Pancost, R. D.: Global mean surface temperature and cli-mate sensitivity of the early Eocene Climatic Optimum (EECO),Paleocene–Eocene Thermal Maximum (PETM), and latest Pa-leocene, Clim. Past, 16, 1953–1968, https://doi.org/10.5194/cp-16-1953-2020, 2020.
Kim, J.-H., Meer, J. v. d., Schouten, S., Helmke, P., Willmott,V., Sangiorgi, F., et al.: New indices and calibrations derivedfrom the distribution of crenarchaeal isoprenoid tetraether lipids:
https://doi.org/10.5194/cp-17-2393-2021 Clim. Past, 17, 2393–2425, 2021
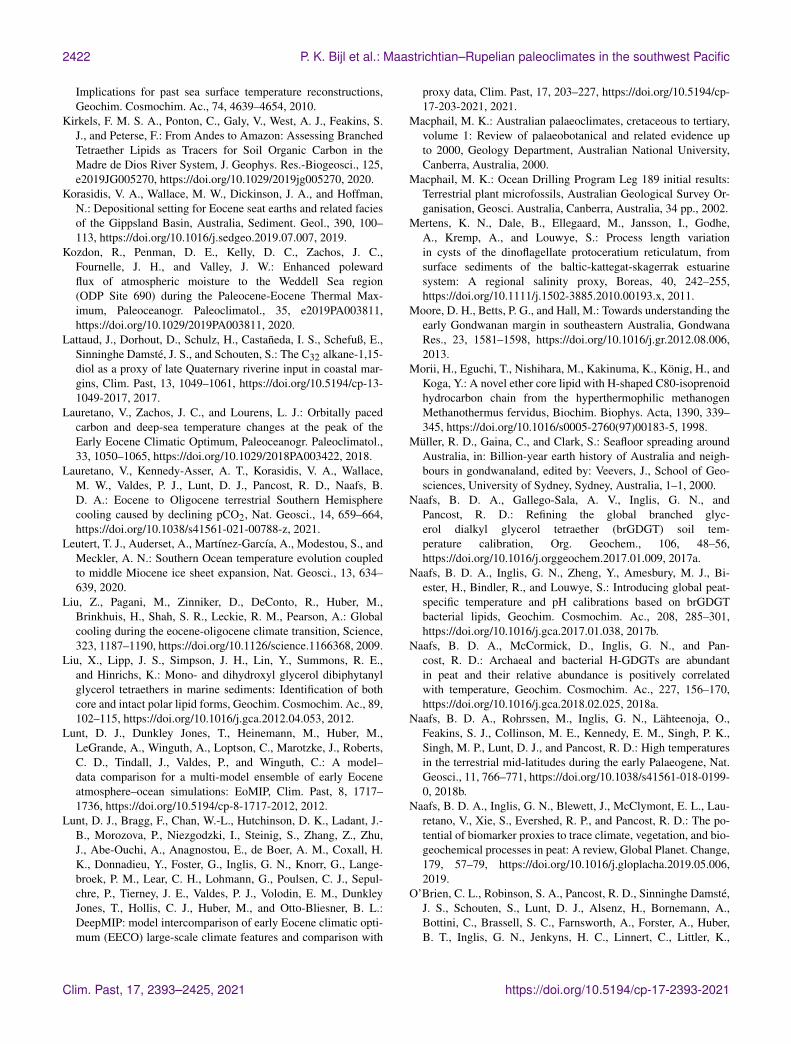
2422 P. K. Bijl et al.: Maastrichtian–Rupelian paleoclimates in the southwest Pacific
Implications for past sea surface temperature reconstructions,Geochim. Cosmochim. Ac., 74, 4639–4654, 2010.
Kirkels, F. M. S. A., Ponton, C., Galy, V., West, A. J., Feakins, S.J., and Peterse, F.: From Andes to Amazon: Assessing BranchedTetraether Lipids as Tracers for Soil Organic Carbon in theMadre de Dios River System, J. Geophys. Res.-Biogeosci., 125,e2019JG005270, https://doi.org/10.1029/2019jg005270, 2020.
Korasidis, V. A., Wallace, M. W., Dickinson, J. A., and Hoffman,N.: Depositional setting for Eocene seat earths and related faciesof the Gippsland Basin, Australia, Sediment. Geol., 390, 100–113, https://doi.org/10.1016/j.sedgeo.2019.07.007, 2019.
Kozdon, R., Penman, D. E., Kelly, D. C., Zachos, J. C.,Fournelle, J. H., and Valley, J. W.: Enhanced polewardflux of atmospheric moisture to the Weddell Sea region(ODP Site 690) during the Paleocene-Eocene Thermal Max-imum, Paleoceanogr. Paleoclimatol., 35, e2019PA003811,https://doi.org/10.1029/2019PA003811, 2020.
Lattaud, J., Dorhout, D., Schulz, H., Castañeda, I. S., Schefuß, E.,Sinninghe Damsté, J. S., and Schouten, S.: The C32 alkane-1,15-diol as a proxy of late Quaternary riverine input in coastal mar-gins, Clim. Past, 13, 1049–1061, https://doi.org/10.5194/cp-13-1049-2017, 2017.
Lauretano, V., Zachos, J. C., and Lourens, L. J.: Orbitally pacedcarbon and deep-sea temperature changes at the peak of theEarly Eocene Climatic Optimum, Paleoceanogr. Paleoclimatol.,33, 1050–1065, https://doi.org/10.1029/2018PA003422, 2018.
Lauretano, V., Kennedy-Asser, A. T., Korasidis, V. A., Wallace,M. W., Valdes, P. J., Lunt, D. J., Pancost, R. D., Naafs, B.D. A.: Eocene to Oligocene terrestrial Southern Hemispherecooling caused by declining pCO2, Nat. Geosci., 14, 659–664,https://doi.org/10.1038/s41561-021-00788-z, 2021.
Leutert, T. J., Auderset, A., Martínez-García, A., Modestou, S., andMeckler, A. N.: Southern Ocean temperature evolution coupledto middle Miocene ice sheet expansion, Nat. Geosci., 13, 634–639, 2020.
Liu, Z., Pagani, M., Zinniker, D., DeConto, R., Huber, M.,Brinkhuis, H., Shah, S. R., Leckie, R. M., Pearson, A.: Globalcooling during the eocene-oligocene climate transition, Science,323, 1187–1190, https://doi.org/10.1126/science.1166368, 2009.
Liu, X., Lipp, J. S., Simpson, J. H., Lin, Y., Summons, R. E.,and Hinrichs, K.: Mono- and dihydroxyl glycerol dibiphytanylglycerol tetraethers in marine sediments: Identification of bothcore and intact polar lipid forms, Geochim. Cosmochim. Ac., 89,102–115, https://doi.org/10.1016/j.gca.2012.04.053, 2012.
Lunt, D. J., Dunkley Jones, T., Heinemann, M., Huber, M.,LeGrande, A., Winguth, A., Loptson, C., Marotzke, J., Roberts,C. D., Tindall, J., Valdes, P., and Winguth, C.: A model–data comparison for a multi-model ensemble of early Eoceneatmosphere–ocean simulations: EoMIP, Clim. Past, 8, 1717–1736, https://doi.org/10.5194/cp-8-1717-2012, 2012.
Lunt, D. J., Bragg, F., Chan, W.-L., Hutchinson, D. K., Ladant, J.-B., Morozova, P., Niezgodzki, I., Steinig, S., Zhang, Z., Zhu,J., Abe-Ouchi, A., Anagnostou, E., de Boer, A. M., Coxall, H.K., Donnadieu, Y., Foster, G., Inglis, G. N., Knorr, G., Lange-broek, P. M., Lear, C. H., Lohmann, G., Poulsen, C. J., Sepul-chre, P., Tierney, J. E., Valdes, P. J., Volodin, E. M., DunkleyJones, T., Hollis, C. J., Huber, M., and Otto-Bliesner, B. L.:DeepMIP: model intercomparison of early Eocene climatic opti-mum (EECO) large-scale climate features and comparison with
proxy data, Clim. Past, 17, 203–227, https://doi.org/10.5194/cp-17-203-2021, 2021.
Macphail, M. K.: Australian palaeoclimates, cretaceous to tertiary,volume 1: Review of palaeobotanical and related evidence upto 2000, Geology Department, Australian National University,Canberra, Australia, 2000.
Macphail, M. K.: Ocean Drilling Program Leg 189 initial results:Terrestrial plant microfossils, Australian Geological Survey Or-ganisation, Geosci. Australia, Canberra, Australia, 34 pp., 2002.
Mertens, K. N., Dale, B., Ellegaard, M., Jansson, I., Godhe,A., Kremp, A., and Louwye, S.: Process length variationin cysts of the dinoflagellate protoceratium reticulatum, fromsurface sediments of the baltic-kattegat-skagerrak estuarinesystem: A regional salinity proxy, Boreas, 40, 242–255,https://doi.org/10.1111/j.1502-3885.2010.00193.x, 2011.
Moore, D. H., Betts, P. G., and Hall, M.: Towards understanding theearly Gondwanan margin in southeastern Australia, GondwanaRes., 23, 1581–1598, https://doi.org/10.1016/j.gr.2012.08.006,2013.
Morii, H., Eguchi, T., Nishihara, M., Kakinuma, K., König, H., andKoga, Y.: A novel ether core lipid with H-shaped C80-isoprenoidhydrocarbon chain from the hyperthermophilic methanogenMethanothermus fervidus, Biochim. Biophys. Acta, 1390, 339–345, https://doi.org/10.1016/s0005-2760(97)00183-5, 1998.
Müller, R. D., Gaina, C., and Clark, S.: Seafloor spreading aroundAustralia, in: Billion-year earth history of Australia and neigh-bours in gondwanaland, edited by: Veevers, J., School of Geo-sciences, University of Sydney, Sydney, Australia, 1–1, 2000.
Naafs, B. D. A., Gallego-Sala, A. V., Inglis, G. N., andPancost, R. D.: Refining the global branched glyc-erol dialkyl glycerol tetraether (brGDGT) soil tem-perature calibration, Org. Geochem., 106, 48–56,https://doi.org/10.1016/j.orggeochem.2017.01.009, 2017a.
Naafs, B. D. A., Inglis, G. N., Zheng, Y., Amesbury, M. J., Bi-ester, H., Bindler, R., and Louwye, S.: Introducing global peat-specific temperature and pH calibrations based on brGDGTbacterial lipids, Geochim. Cosmochim. Ac., 208, 285–301,https://doi.org/10.1016/j.gca.2017.01.038, 2017b.
Naafs, B. D. A., McCormick, D., Inglis, G. N., and Pan-cost, R. D.: Archaeal and bacterial H-GDGTs are abundantin peat and their relative abundance is positively correlatedwith temperature, Geochim. Cosmochim. Ac., 227, 156–170,https://doi.org/10.1016/j.gca.2018.02.025, 2018a.
Naafs, B. D. A., Rohrssen, M., Inglis, G. N., Lähteenoja, O.,Feakins, S. J., Collinson, M. E., Kennedy, E. M., Singh, P. K.,Singh, M. P., Lunt, D. J., and Pancost, R. D.: High temperaturesin the terrestrial mid-latitudes during the early Palaeogene, Nat.Geosci., 11, 766–771, https://doi.org/10.1038/s41561-018-0199-0, 2018b.
Naafs, B. D. A., Inglis, G. N., Blewett, J., McClymont, E. L., Lau-retano, V., Xie, S., Evershed, R. P., and Pancost, R. D.: The po-tential of biomarker proxies to trace climate, vegetation, and bio-geochemical processes in peat: A review, Global Planet. Change,179, 57–79, https://doi.org/10.1016/j.gloplacha.2019.05.006,2019.
O’Brien, C. L., Robinson, S. A., Pancost, R. D., Sinninghe Damsté,J. S., Schouten, S., Lunt, D. J., Alsenz, H., Bornemann, A.,Bottini, C., Brassell, S. C., Farnsworth, A., Forster, A., Huber,B. T., Inglis, G. N., Jenkyns, H. C., Linnert, C., Littler, K.,
Clim. Past, 17, 2393–2425, 2021 https://doi.org/10.5194/cp-17-2393-2021
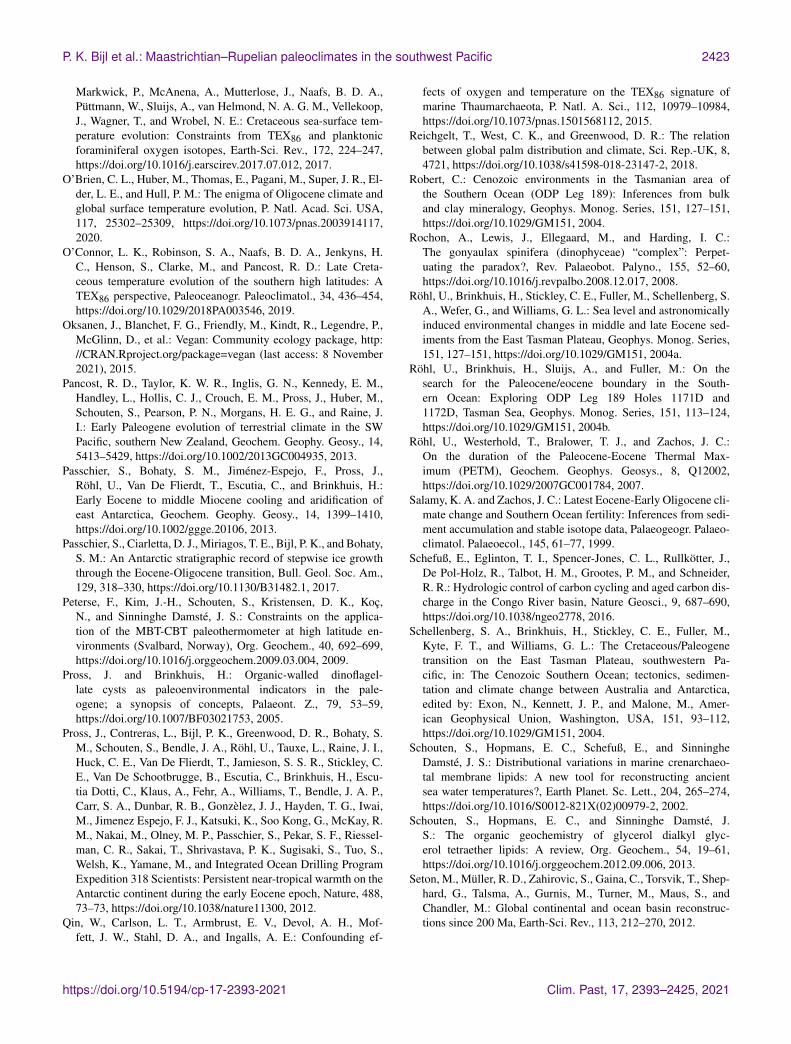
P. K. Bijl et al.: Maastrichtian–Rupelian paleoclimates in the southwest Pacific 2423
Markwick, P., McAnena, A., Mutterlose, J., Naafs, B. D. A.,Püttmann, W., Sluijs, A., van Helmond, N. A. G. M., Vellekoop,J., Wagner, T., and Wrobel, N. E.: Cretaceous sea-surface tem-perature evolution: Constraints from TEX86 and planktonicforaminiferal oxygen isotopes, Earth-Sci. Rev., 172, 224–247,https://doi.org/10.1016/j.earscirev.2017.07.012, 2017.
O’Brien, C. L., Huber, M., Thomas, E., Pagani, M., Super, J. R., El-der, L. E., and Hull, P. M.: The enigma of Oligocene climate andglobal surface temperature evolution, P. Natl. Acad. Sci. USA,117, 25302–25309, https://doi.org/10.1073/pnas.2003914117,2020.
O’Connor, L. K., Robinson, S. A., Naafs, B. D. A., Jenkyns, H.C., Henson, S., Clarke, M., and Pancost, R. D.: Late Creta-ceous temperature evolution of the southern high latitudes: ATEX86 perspective, Paleoceanogr. Paleoclimatol., 34, 436–454,https://doi.org/10.1029/2018PA003546, 2019.
Oksanen, J., Blanchet, F. G., Friendly, M., Kindt, R., Legendre, P.,McGlinn, D., et al.: Vegan: Community ecology package, http://CRAN.Rproject.org/package=vegan (last access: 8 November2021), 2015.
Pancost, R. D., Taylor, K. W. R., Inglis, G. N., Kennedy, E. M.,Handley, L., Hollis, C. J., Crouch, E. M., Pross, J., Huber, M.,Schouten, S., Pearson, P. N., Morgans, H. E. G., and Raine, J.I.: Early Paleogene evolution of terrestrial climate in the SWPacific, southern New Zealand, Geochem. Geophy. Geosy., 14,5413–5429, https://doi.org/10.1002/2013GC004935, 2013.
Passchier, S., Bohaty, S. M., Jiménez-Espejo, F., Pross, J.,Röhl, U., Van De Flierdt, T., Escutia, C., and Brinkhuis, H.:Early Eocene to middle Miocene cooling and aridification ofeast Antarctica, Geochem. Geophy. Geosy., 14, 1399–1410,https://doi.org/10.1002/ggge.20106, 2013.
Passchier, S., Ciarletta, D. J., Miriagos, T. E., Bijl, P. K., and Bohaty,S. M.: An Antarctic stratigraphic record of stepwise ice growththrough the Eocene-Oligocene transition, Bull. Geol. Soc. Am.,129, 318–330, https://doi.org/10.1130/B31482.1, 2017.
Peterse, F., Kim, J.-H., Schouten, S., Kristensen, D. K., Koç,N., and Sinninghe Damsté, J. S.: Constraints on the applica-tion of the MBT-CBT paleothermometer at high latitude en-vironments (Svalbard, Norway), Org. Geochem., 40, 692–699,https://doi.org/10.1016/j.orggeochem.2009.03.004, 2009.
Pross, J. and Brinkhuis, H.: Organic-walled dinoflagel-late cysts as paleoenvironmental indicators in the pale-ogene; a synopsis of concepts, Palaeont. Z., 79, 53–59,https://doi.org/10.1007/BF03021753, 2005.
Pross, J., Contreras, L., Bijl, P. K., Greenwood, D. R., Bohaty, S.M., Schouten, S., Bendle, J. A., Röhl, U., Tauxe, L., Raine, J. I.,Huck, C. E., Van De Flierdt, T., Jamieson, S. S. R., Stickley, C.E., Van De Schootbrugge, B., Escutia, C., Brinkhuis, H., Escu-tia Dotti, C., Klaus, A., Fehr, A., Williams, T., Bendle, J. A. P.,Carr, S. A., Dunbar, R. B., Gonzèlez, J. J., Hayden, T. G., Iwai,M., Jimenez Espejo, F. J., Katsuki, K., Soo Kong, G., McKay, R.M., Nakai, M., Olney, M. P., Passchier, S., Pekar, S. F., Riessel-man, C. R., Sakai, T., Shrivastava, P. K., Sugisaki, S., Tuo, S.,Welsh, K., Yamane, M., and Integrated Ocean Drilling ProgramExpedition 318 Scientists: Persistent near-tropical warmth on theAntarctic continent during the early Eocene epoch, Nature, 488,73–73, https://doi.org/10.1038/nature11300, 2012.
Qin, W., Carlson, L. T., Armbrust, E. V., Devol, A. H., Mof-fett, J. W., Stahl, D. A., and Ingalls, A. E.: Confounding ef-
fects of oxygen and temperature on the TEX86 signature ofmarine Thaumarchaeota, P. Natl. A. Sci., 112, 10979–10984,https://doi.org/10.1073/pnas.1501568112, 2015.
Reichgelt, T., West, C. K., and Greenwood, D. R.: The relationbetween global palm distribution and climate, Sci. Rep.-UK, 8,4721, https://doi.org/10.1038/s41598-018-23147-2, 2018.
Robert, C.: Cenozoic environments in the Tasmanian area ofthe Southern Ocean (ODP Leg 189): Inferences from bulkand clay mineralogy, Geophys. Monog. Series, 151, 127–151,https://doi.org/10.1029/GM151, 2004.
Rochon, A., Lewis, J., Ellegaard, M., and Harding, I. C.:The gonyaulax spinifera (dinophyceae) “complex”: Perpet-uating the paradox?, Rev. Palaeobot. Palyno., 155, 52–60,https://doi.org/10.1016/j.revpalbo.2008.12.017, 2008.
Röhl, U., Brinkhuis, H., Stickley, C. E., Fuller, M., Schellenberg, S.A., Wefer, G., and Williams, G. L.: Sea level and astronomicallyinduced environmental changes in middle and late Eocene sed-iments from the East Tasman Plateau, Geophys. Monog. Series,151, 127–151, https://doi.org/10.1029/GM151, 2004a.
Röhl, U., Brinkhuis, H., Sluijs, A., and Fuller, M.: On thesearch for the Paleocene/eocene boundary in the South-ern Ocean: Exploring ODP Leg 189 Holes 1171D and1172D, Tasman Sea, Geophys. Monog. Series, 151, 113–124,https://doi.org/10.1029/GM151, 2004b.
Röhl, U., Westerhold, T., Bralower, T. J., and Zachos, J. C.:On the duration of the Paleocene-Eocene Thermal Max-imum (PETM), Geochem. Geophys. Geosys., 8, Q12002,https://doi.org/10.1029/2007GC001784, 2007.
Salamy, K. A. and Zachos, J. C.: Latest Eocene-Early Oligocene cli-mate change and Southern Ocean fertility: Inferences from sedi-ment accumulation and stable isotope data, Palaeogeogr. Palaeo-climatol. Palaeoecol., 145, 61–77, 1999.
Schefuß, E., Eglinton, T. I., Spencer-Jones, C. L., Rullkötter, J.,De Pol-Holz, R., Talbot, H. M., Grootes, P. M., and Schneider,R. R.: Hydrologic control of carbon cycling and aged carbon dis-charge in the Congo River basin, Nature Geosci., 9, 687–690,https://doi.org/10.1038/ngeo2778, 2016.
Schellenberg, S. A., Brinkhuis, H., Stickley, C. E., Fuller, M.,Kyte, F. T., and Williams, G. L.: The Cretaceous/Paleogenetransition on the East Tasman Plateau, southwestern Pa-cific, in: The Cenozoic Southern Ocean; tectonics, sedimen-tation and climate change between Australia and Antarctica,edited by: Exon, N., Kennett, J. P., and Malone, M., Amer-ican Geophysical Union, Washington, USA, 151, 93–112,https://doi.org/10.1029/GM151, 2004.
Schouten, S., Hopmans, E. C., Schefuß, E., and SinningheDamsté, J. S.: Distributional variations in marine crenarchaeo-tal membrane lipids: A new tool for reconstructing ancientsea water temperatures?, Earth Planet. Sc. Lett., 204, 265–274,https://doi.org/10.1016/S0012-821X(02)00979-2, 2002.
Schouten, S., Hopmans, E. C., and Sinninghe Damsté, J.S.: The organic geochemistry of glycerol dialkyl glyc-erol tetraether lipids: A review, Org. Geochem., 54, 19–61,https://doi.org/10.1016/j.orggeochem.2012.09.006, 2013.
Seton, M., Müller, R. D., Zahirovic, S., Gaina, C., Torsvik, T., Shep-hard, G., Talsma, A., Gurnis, M., Turner, M., Maus, S., andChandler, M.: Global continental and ocean basin reconstruc-tions since 200 Ma, Earth-Sci. Rev., 113, 212–270, 2012.
https://doi.org/10.5194/cp-17-2393-2021 Clim. Past, 17, 2393–2425, 2021
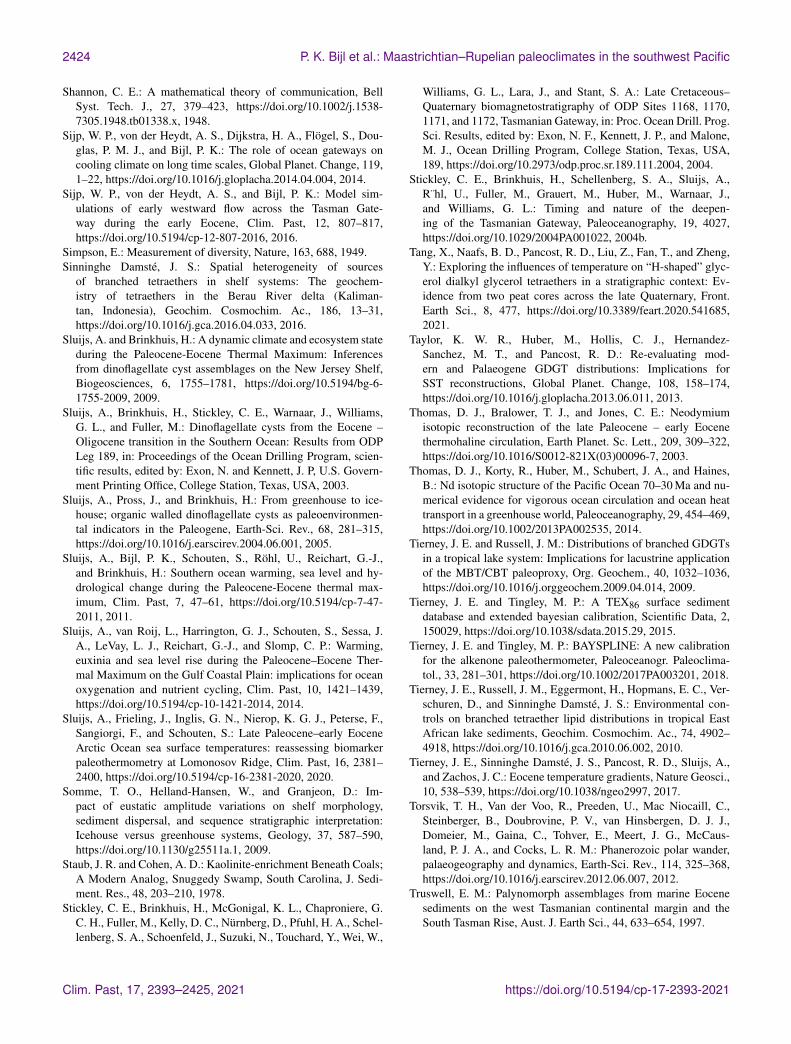
2424 P. K. Bijl et al.: Maastrichtian–Rupelian paleoclimates in the southwest Pacific
Shannon, C. E.: A mathematical theory of communication, BellSyst. Tech. J., 27, 379–423, https://doi.org/10.1002/j.1538-7305.1948.tb01338.x, 1948.
Sijp, W. P., von der Heydt, A. S., Dijkstra, H. A., Flögel, S., Dou-glas, P. M. J., and Bijl, P. K.: The role of ocean gateways oncooling climate on long time scales, Global Planet. Change, 119,1–22, https://doi.org/10.1016/j.gloplacha.2014.04.004, 2014.
Sijp, W. P., von der Heydt, A. S., and Bijl, P. K.: Model sim-ulations of early westward flow across the Tasman Gate-way during the early Eocene, Clim. Past, 12, 807–817,https://doi.org/10.5194/cp-12-807-2016, 2016.
Simpson, E.: Measurement of diversity, Nature, 163, 688, 1949.Sinninghe Damsté, J. S.: Spatial heterogeneity of sources
of branched tetraethers in shelf systems: The geochem-istry of tetraethers in the Berau River delta (Kaliman-tan, Indonesia), Geochim. Cosmochim. Ac., 186, 13–31,https://doi.org/10.1016/j.gca.2016.04.033, 2016.
Sluijs, A. and Brinkhuis, H.: A dynamic climate and ecosystem stateduring the Paleocene-Eocene Thermal Maximum: Inferencesfrom dinoflagellate cyst assemblages on the New Jersey Shelf,Biogeosciences, 6, 1755–1781, https://doi.org/10.5194/bg-6-1755-2009, 2009.
Sluijs, A., Brinkhuis, H., Stickley, C. E., Warnaar, J., Williams,G. L., and Fuller, M.: Dinoflagellate cysts from the Eocene –Oligocene transition in the Southern Ocean: Results from ODPLeg 189, in: Proceedings of the Ocean Drilling Program, scien-tific results, edited by: Exon, N. and Kennett, J. P, U.S. Govern-ment Printing Office, College Station, Texas, USA, 2003.
Sluijs, A., Pross, J., and Brinkhuis, H.: From greenhouse to ice-house; organic walled dinoflagellate cysts as paleoenvironmen-tal indicators in the Paleogene, Earth-Sci. Rev., 68, 281–315,https://doi.org/10.1016/j.earscirev.2004.06.001, 2005.
Sluijs, A., Bijl, P. K., Schouten, S., Röhl, U., Reichart, G.-J.,and Brinkhuis, H.: Southern ocean warming, sea level and hy-drological change during the Paleocene-Eocene thermal max-imum, Clim. Past, 7, 47–61, https://doi.org/10.5194/cp-7-47-2011, 2011.
Sluijs, A., van Roij, L., Harrington, G. J., Schouten, S., Sessa, J.A., LeVay, L. J., Reichart, G.-J., and Slomp, C. P.: Warming,euxinia and sea level rise during the Paleocene–Eocene Ther-mal Maximum on the Gulf Coastal Plain: implications for oceanoxygenation and nutrient cycling, Clim. Past, 10, 1421–1439,https://doi.org/10.5194/cp-10-1421-2014, 2014.
Sluijs, A., Frieling, J., Inglis, G. N., Nierop, K. G. J., Peterse, F.,Sangiorgi, F., and Schouten, S.: Late Paleocene–early EoceneArctic Ocean sea surface temperatures: reassessing biomarkerpaleothermometry at Lomonosov Ridge, Clim. Past, 16, 2381–2400, https://doi.org/10.5194/cp-16-2381-2020, 2020.
Somme, T. O., Helland-Hansen, W., and Granjeon, D.: Im-pact of eustatic amplitude variations on shelf morphology,sediment dispersal, and sequence stratigraphic interpretation:Icehouse versus greenhouse systems, Geology, 37, 587–590,https://doi.org/10.1130/g25511a.1, 2009.
Staub, J. R. and Cohen, A. D.: Kaolinite-enrichment Beneath Coals;A Modern Analog, Snuggedy Swamp, South Carolina, J. Sedi-ment. Res., 48, 203–210, 1978.
Stickley, C. E., Brinkhuis, H., McGonigal, K. L., Chaproniere, G.C. H., Fuller, M., Kelly, D. C., Nürnberg, D., Pfuhl, H. A., Schel-lenberg, S. A., Schoenfeld, J., Suzuki, N., Touchard, Y., Wei, W.,
Williams, G. L., Lara, J., and Stant, S. A.: Late Cretaceous–Quaternary biomagnetostratigraphy of ODP Sites 1168, 1170,1171, and 1172, Tasmanian Gateway, in: Proc. Ocean Drill. Prog.Sci. Results, edited by: Exon, N. F., Kennett, J. P., and Malone,M. J., Ocean Drilling Program, College Station, Texas, USA,189, https://doi.org/10.2973/odp.proc.sr.189.111.2004, 2004.
Stickley, C. E., Brinkhuis, H., Schellenberg, S. A., Sluijs, A.,R¨hl, U., Fuller, M., Grauert, M., Huber, M., Warnaar, J.,and Williams, G. L.: Timing and nature of the deepen-ing of the Tasmanian Gateway, Paleoceanography, 19, 4027,https://doi.org/10.1029/2004PA001022, 2004b.
Tang, X., Naafs, B. D., Pancost, R. D., Liu, Z., Fan, T., and Zheng,Y.: Exploring the influences of temperature on “H-shaped” glyc-erol dialkyl glycerol tetraethers in a stratigraphic context: Ev-idence from two peat cores across the late Quaternary, Front.Earth Sci., 8, 477, https://doi.org/10.3389/feart.2020.541685,2021.
Taylor, K. W. R., Huber, M., Hollis, C. J., Hernandez-Sanchez, M. T., and Pancost, R. D.: Re-evaluating mod-ern and Palaeogene GDGT distributions: Implications forSST reconstructions, Global Planet. Change, 108, 158–174,https://doi.org/10.1016/j.gloplacha.2013.06.011, 2013.
Thomas, D. J., Bralower, T. J., and Jones, C. E.: Neodymiumisotopic reconstruction of the late Paleocene – early Eocenethermohaline circulation, Earth Planet. Sc. Lett., 209, 309–322,https://doi.org/10.1016/S0012-821X(03)00096-7, 2003.
Thomas, D. J., Korty, R., Huber, M., Schubert, J. A., and Haines,B.: Nd isotopic structure of the Pacific Ocean 70–30 Ma and nu-merical evidence for vigorous ocean circulation and ocean heattransport in a greenhouse world, Paleoceanography, 29, 454–469,https://doi.org/10.1002/2013PA002535, 2014.
Tierney, J. E. and Russell, J. M.: Distributions of branched GDGTsin a tropical lake system: Implications for lacustrine applicationof the MBT/CBT paleoproxy, Org. Geochem., 40, 1032–1036,https://doi.org/10.1016/j.orggeochem.2009.04.014, 2009.
Tierney, J. E. and Tingley, M. P.: A TEX86 surface sedimentdatabase and extended bayesian calibration, Scientific Data, 2,150029, https://doi.org/10.1038/sdata.2015.29, 2015.
Tierney, J. E. and Tingley, M. P.: BAYSPLINE: A new calibrationfor the alkenone paleothermometer, Paleoceanogr. Paleoclima-tol., 33, 281–301, https://doi.org/10.1002/2017PA003201, 2018.
Tierney, J. E., Russell, J. M., Eggermont, H., Hopmans, E. C., Ver-schuren, D., and Sinninghe Damsté, J. S.: Environmental con-trols on branched tetraether lipid distributions in tropical EastAfrican lake sediments, Geochim. Cosmochim. Ac., 74, 4902–4918, https://doi.org/10.1016/j.gca.2010.06.002, 2010.
Tierney, J. E., Sinninghe Damsté, J. S., Pancost, R. D., Sluijs, A.,and Zachos, J. C.: Eocene temperature gradients, Nature Geosci.,10, 538–539, https://doi.org/10.1038/ngeo2997, 2017.
Torsvik, T. H., Van der Voo, R., Preeden, U., Mac Niocaill, C.,Steinberger, B., Doubrovine, P. V., van Hinsbergen, D. J. J.,Domeier, M., Gaina, C., Tohver, E., Meert, J. G., McCaus-land, P. J. A., and Cocks, L. R. M.: Phanerozoic polar wander,palaeogeography and dynamics, Earth-Sci. Rev., 114, 325–368,https://doi.org/10.1016/j.earscirev.2012.06.007, 2012.
Truswell, E. M.: Palynomorph assemblages from marine Eocenesediments on the west Tasmanian continental margin and theSouth Tasman Rise, Aust. J. Earth Sci., 44, 633–654, 1997.
Clim. Past, 17, 2393–2425, 2021 https://doi.org/10.5194/cp-17-2393-2021
P. K. Bijl et al.: Maastrichtian–Rupelian paleoclimates in the southwest Pacific 2425
Van Dijk, J., Fernandez, A., Bernasconi, S. M., Caves Rugenstein,J. K., Passey, S. R., and White, T.: Spatial pattern of super-greenhouse warmth controlled by elevated specific humidity, Na-ture Geosci., 13, 739–744, https://doi.org/10.1038/s41561-020-00648-2, 2020.
Van Hinsbergen, D. J. J., De Groot, L. V., Van Schaik, S. J., Spak-man, W., Bijl, P. K., Sluijs, A., Langereis, C. G., and Brinkhuis,H.: A paleolatitude calculator for paleoclimate studies, Plos One,10, e0126946, https://doi.org/10.1371/journal.pone.0126946,2015.
Warden, L., Kim, J.-H., Zell, C., Vis, G.-J., de Stigter, H., Bon-nin, J., and Sinninghe Damsté, J. S.: Examining the provenanceof branched GDGTs in the Tagus River drainage basin and itsoutflow into the Atlantic Ocean over the Holocene to determinetheir usefulness for paleoclimate applications, Biogeosciences,13, 5719–5738, https://doi.org/10.5194/bg-13-5719-2016, 2016.
Warden, L., Moros, M., Weber, Y., and Sinninghe Damsté, J. S.:Change in provenance of branched glycerol dialkyl glyceroltetraethers over the Holocene in the Baltic Sea and its impacton continental climate reconstruction, Org. Geochem., 121, 138–154, https://doi.org/10.1016/j.orggeochem.2018.03.007, 2018.
Warnaar, J., Bijl, P. K., Huber, M., Sloan, L., Brinkhuis,H., Röhl, U., Sriver, R., and Visscher, H.: Orbitally forcedclimate changes in the Tasman sector during the middleEocene, Palaeogeogr. Palaeoclimatol. Palaeoecol., 280, 361–370, https://doi.org/10.1016/j.palaeo.2009.06.023, 2009.
Weijers, J. W. H., Schouten, S., Spaargaren, O. C., and SinningheDamste, J. S.: Occurrence and distribution of tetraether mem-brane lipids in soils: Implications for the use of the TEX86proxy and the BIT index, Org. Geochem., 37, 1680–1693,https://doi.org/10.1016/j.orggeochem.2006.07.018, 2006.
Weijers, J. W. H., Schouten, S., van den Donker, J. C., Hopmans, E.C., and Sinninghe Damsté, J. S.: Environmental controls on bac-terial tetraether membrane lipid distribution in soils, Geochim.Cosmochim. Ac., 71, 703–713, 2007a.
Weijers, J. W. H., Schefuß, E., Schouten, S., Damsté, J. S. S., Cou-pled thermal and hydrological evolution of tropical Africa overthe last deglaciation, Science, 315, 1701–1704, 2007b.
Weijers, J. W. H., Lim, K. L. H., Aquilina, A., Damsté, J. S. S.,and Pancost, R. D.: Biogeochemical controls on glycerol dialkylglycerol tetraether lipid distributions in sediments characterizedby diffusive methane flux, Geochem. Geophys. Geosyst., 12,GC003724, https://doi.org/10.1029/2011GC003724, 2011.
Westerhold, T., Marwan, N., Drury, A. J., Liebrand, D., Agnini,C., Anagnostou, E., Barnet, J. S. K., Bohaty, S. M.,De Vleeschouwer, D., Florindo, F., Frederichs, T., Hodell,D. A., Holbourn, A. E., Kroon, D., Lauretano, V., Littler,K., Lourens, L. J., Lyle, M., Pälike, H., Röhl, U., Tian, J.,Wilkens, R. H., Wilson, P. A., and Zachos, J. C.: An astro-nomically dated record of earth’s climate and its predictabil-ity over the last 66 million years, Science, 369, 1383–1387,https://doi.org/10.1126/science.aba6853, 2020.
Willard, D. A., Donders, T. H., Reichgelt, T., Greenwood,D. R., Sangiorgi, F., Peterse, F., Nierop, K. G. J., Friel-ing, J., Schouten, S., and Sluijs, A.: Arctic vegetation,temperature, and hydrology during early Eocene transientglobal warming events, Global Planet. Change, 178, 139–152,https://doi.org/10.1016/j.gloplacha.2019.04.012, 2019.
Williams, G. L., Fensome, R. A., and MacRae, R. A.: Dinoflaj3,American Association of Stratigraphic Palynologists, Data Se-ries, 2, ISSN 0160-8843, 2017.
Williams, S. E., Whittaker, J. M., Halpin, J. A., and Müller, R. D.:Australian-Antarctic breakup and seafloor spreading: Balancinggeological and geophysical constraints, Earth-Sci. Rev., 188, 41–58, https://doi.org/10.1016/j.earscirev.2018.10.011, 2019.
Xie, S., Liu, X., Schubotz, F., Wakeham, S. G., and Hinrichs, K.:Distribution of glycerol ether lipids in the oxygen minimum zoneof the eastern tropical north pacific ocean, Org. Geochem., 71,60–71, https://doi.org/10.1016/j.orggeochem.2014.04.006, 2014.
Zeebe, R. E. and Lourens, L. J.: Solar System chaosand the Paleocene–Eocene boundary age constrainedby geology and astronomy, Science, 365, 926–929,https://doi.org/10.1126/science.aax0612, 2019.
Zell, C., Kim, J.-H., Moreira-Turcq, P., Abril, G., Hopmans, E.C., Bonnet, M.-P., Lima Sobrinho, R., and Sinninghe Damsté,J. S. : Disentangling the origins of branched tetraether lipidsand crenarchaeol in the lower Amazon River: Implicationsfor GDGT-based proxies, Limnol. Oceanogr., 58, 343–353,https://doi.org/10.4319/lo.2013.58.1.0343, 2013.
Zell, C., Kim, J.-H., Hollander, D., Lorenzoni, L., Baker, P., Silva,C. G., Nittrouer, C., and Sinninghe Damsté, J. S.: Sources anddistributions of branched and isoprenoid tetraether lipids on theAmazon shelf and fan: Implications for the use of GDGT-basedproxies in marine sediments, Geochim. Cosmochim. Ac., 139,293–312, https://doi.org/10.1016/j.gca.2014.04.038, 2014.
Zhang, Y. G., Zhang, C. L., Liu, X.-L., Li, L., Hinrichs, K.-U., and Noakes, J. E.: Methane index: A tetraether archaeallipid biomarker indicator for detecting the instability of ma-rine gas hydrates, Earth Planet. Sc. Lett., 307, 525–534,https://doi.org/10.1016/j.epsl.2011.05.031, 2011.
Zhang, Y. G., Pagani, M., and Wang, Z.: Ring index: A new strategyto evaluate the integrity of TEX86, Paleoceanogr. Paleoclimatol.,31, 220–232, https://doi.org/10.1002/2015PA002848, 2016.
https://doi.org/10.5194/cp-17-2393-2021 Clim. Past, 17, 2393–2425, 2021


