Embed Size (px)
Citation preview
HAL Id: tel-02043534https://tel.archives-ouvertes.fr/tel-02043534
Submitted on 21 Feb 2019
HAL is a multi-disciplinary open accessarchive for the deposit and dissemination of sci-entific research documents, whether they are pub-lished or not. The documents may come fromteaching and research institutions in France orabroad, or from public or private research centers.
L’archive ouverte pluridisciplinaire HAL, estdestinée au dépôt et à la diffusion de documentsscientifiques de niveau recherche, publiés ou non,émanant des établissements d’enseignement et derecherche français ou étrangers, des laboratoirespublics ou privés.
Designing for Urban Mobility - Modeling the travelerexperience
Ouail Al Maghraoui
To cite this version:Ouail Al Maghraoui. Designing for Urban Mobility - Modeling the traveler experience. Businessadministration. Université Paris Saclay (COmUE), 2019. English. �NNT : 2019SACLC006�. �tel-02043534�
1
NN
T :
2019
SA
CLC
006
Designing for urban mobility: Modeling the traveler experience
Thèse de doctorat de l'Université Paris-Saclay préparée à CentraleSupélec
École doctorale n°573 : interfaces : approches interdisciplinaires, fondements, applications et innovation (Interfaces)
Spécialité : sciences et technologies industrielles
Thèse présentée et soutenue à Gif-sur-Yvette, le 29 Janvier 2019, par
Ouail Al Maghraoui Composition du Jury :
Stéphanie Buisine Rapporteur Professeur, Groupe CESI Laboratoire d'Innovation Numérique pour les Entreprises, les Apprentissages et la Compétitivité des Territoires
Cristina Pronello Rapporteur Professeur, Université de Technologie de Compiègne Département Génie des systèmes urbains Isabelle Nicolaï Examinateur Professeur, Université Paris Saclay Laboratoire Génie Industriel
Alexandra Millonig Examinateur Docteur, Austrian Institute of Technology Dynamic Transportation Systems
Fabien Leurent Président Professeur, Université Paris Est Laboratoire Ville Mobilité Transport
Jakob Puchinger Directeur de thèse Professeur, Université Paris Saclay Laboratoire Génie Industriel & IRT SystemX
Bernard Yannou Co-Directeur de thèse Professeur, Université Paris Saclay Laboratoire Génie Industriel
Flore Vallet Co-Directeur de thèse Docteur, Université Paris Saclay Laboratoire Génie Industriel & IRT SystemX

2
To my dear parents
To my beloved wife
To my dear brother and my big family
To all my dear friends and comrades
To all those whom I love and who believe in me
In memory of my grandfather
To my dear teachers
To anyone working for the good of humanity
3
Acknowledgements - Remerciements
I first would like to warmly thank the jury members of this PhD thesis: Stéphanie Buisine from CESI
Group and Crisitna Pronello from University of Technology of Compiègne, for accepting to review this
work. The reports were rich in useful advice and information for the continuation of my work. I thank
professor Fabien Leurent from Paris-Est University, Alexandra Millonig from the Austrian Institute of
Technology and Isabelle Nicolaï from Paris-Saclay University for accepting to evaluate this work as
examiners. It is a great honor to have my work assessed by you. The exchanges in the defense allowed
me to accentuate my perspective on this work, and I hope that we will still have the opportunity to
exchange in the future.
Mon voyage pendant ces trois années de thèse n’aurait pas été agréable sans la présence et le soutien de plusieurs personnes.
Tout d’abord, mes trois encadrants Flore Vallet, Jakob Puchinger, et Bernard Yannou, qui m’ont accompagné dans mon cheminement de chercheur en herbe, du premier jour jusqu’à ma soutenance. Flore, pour m’avoir assisté dans les plus petits détails de mes activités de recherche et pour son
engagement sans égal. Jakob, pour ses commentaires constructifs et sa bienveillance. Bernard, pour ses
recommandations clairvoyantes et pour les différentes opportunités qu’il m’a offertes.
Je remercie les différents interlocuteurs des partenaires industriels de la Chaire Anthropolis qui m’ont éclairé sur leurs enjeux et leurs attentes, puis pour leurs retours très constructifs qui m’ont permis d’améliorer les résultats de ma recherche.
Je suis également reconnaissant aux personnes qui ont accepté de participer à mes interviews et focus
groups : la grande famille des doctorants et plus particulièrement Tasneem Adeeb Bani Mustafa,
Hichame Benbitour, Selmen Boubaker, Haythem Selmi, Fabio Antonialli et Shaohua Yu. Puis mes amis
e l’IRT SystemX : Danya Bachir, Omar Dib, Joseph Kamel, Nada Essaouini, Hanane Fadiaw, Niezi
Mharsi, Mohamed Zayani, Rim Kaddah, Farah Haidar, Nabil El Fadli et Alam Mahabub.
Une mention spéciale pour mes deux compagnons et frères Abood Mourad et Reza Vosooghi sans qui
ces années de thèse auraient été ennuyeuses et mon manuscrit sans cinquième chapitre.
Je suis également reconnaissant aux piliers du Laboratoire de Génie Industriel pour les merveilleux
moments passés à leurs côtés, pour leur soutien et leur amitié : Delphine Martin, Sylvie Guillemain,
Corinne Ollivier, et Carole Stoll. Je tiens à remercier Jean-Claude Bocquet qui a été le premier à
m’accompagner dans mon cheminement au sein de la chaire.
Je tiens à remercier chaleureusement mes amis du LGI et de l’IRT SystemX Alexandre Bekhradi, Sonia
Ben Hamida, Islam Abdin, Guillaume Lamé, Youssef Dammak, Lara Qasim, Naouress Fatfouta, Tim
Sissoko, Diya Moubdi, Sarra Fakhfakh, Rodrigo Gandia, Bruna Habib Cavazza, Hoang-Phuong
Nguyen, Amira Ben Hamida, Fereshteh Asgari.
Un grand merci à mes professeurs et collègues François Cluzel, Vicent Mousseau, Yann Leroy, Marija
Jankovic, Ludovic-Alexandre Vidal, Franck Marle, Asma Ghaffari et Julie Le Cardinal pour tout ce
qu’ils m’ont appris durant ces années.
Finalement, pour le meilleur et pour le pire, l’amour de mes proches était toujours là pour moi. Ma famille : Mes parents Naziha et Belkacem, qui n’ont jamais cessé de me soutenir et de me pousser vers
l’avant, qui ont fait le voyage du Maroc pour assister à ma soutenance, je leur dédie ce travail. Ma tante
Souad et son mari Majid qui sont venu de Dijon pour m’encourager, puis mon très cher ami Omar
Fadlaoui pour s’être libéré un jour de la semaine et avoir été présent. Mes amis depuis des années en
France ou au Maroc. Une pensée particulière à mes deux meilleurs amis Anass Mekouar et Abderrahim
Boujida. Enfin, merci à ma femme Amina pour ses encouragements et son support pendant mes derniers
mois de thèse qui ne sont que le début d’un chemin plein d’Amour et de projets pour l’humanité.
4
Abstract A user of urban mobility systems interacts with many products and services while heading to some
destination. However, the design of urban mobility systems does not usually rely on a door-to-door
representation of the traveler experience. Human-centered design represents a relevant way to bring
together the views of urban mobility stakeholders in designing integrated mobility systems that meet
travelers wants and needs. However, generic human-centered models and methods are not adapted to
urban mobility specificities and do not integrate the door-to-door product and service experience of a
traveler including his/her activities within a city. This has repercussions on design practice such as
sampling, scaling, setting performance indicators, gathering and analyzing qualitative data, involving
stakeholders, and setting the boundaries of the system to be designed. For designers and transport
operators, these are not obvious to set when it comes to design complex systems, at the scale of a city,
which are anchored in the urban life. This thesis aims at developing a model of traveler experience to
assist the diagnosis of travel problems in urban mobility systems. Combining the views of user-
experience (UX) design and transportation, it addresses the following research questions:
Q1: How can traveler experience be modeled to feed travel problems diagnosis? Q2: What are the problems travelers experience using urban mobility systems?
Q3: What is the effect of a traveler-centered stimulus on travel problem generation effectiveness? Q4: How can specific traveler attributes improve transport modeling and simulation?
A conceptual model is first proposed based on human-centered and transportation literature,
observations of four urban areas, six interviews, and three workshops. It describes and analyzes different
facets of traveler experience and proposes a conceptual setting for problems that travelers face when
they interact with an urban mobility system. The model illustrates how the traveler interacts, at different
scales with mobility technical systems, and how situations from the urban context can provoke a shift
from an expected to a real travel scenario. A case study is conducted to illustrate the use of the conceptual
model in identifying travel problems for a demand-responsive transport service. It shows a need for pre-
defined categories of problems when identifying causation of problems declared by users. A taxonomy
of travel problems is then proposed to complete the missing categories in the conceptual model. It is
based on a grounded theory approach using interview scripts from three metropolises and codes them
into twenty-two categories of travel problems. Moreover, it proposes a definition of travel problems that
synthesizes the views of interviewees and a causality scheme that connects the travel problems
categories. The categories cover both objective and subjective dimensions of how problems are
perceived by travelers. A case study shows the value of having pre-defined problem categories in
bringing deeper insight into mobility systems diagnosis. However, the conceptual model needed
validation in a design activity. It was therefore simplified to fit the focus group format of travel problem
generation. A textual stimulus is designed to help travelers generate varied and novel travel problems.
An experiment is conducted with two control groups as a baseline for non-stimulated problem generation
and two experimental groups that are provided with a traveler-centered stimulus. Results show that the
stimulated groups generate novel problems with a greater variety than the non-stimulated ones, covering
most of the traveler experience dimensions. These dimensions are translated into traveler specific
attributes to enhance the accuracy of the determinants of modal shift. Finally, an online survey (457
responses) is conducted for the greater Paris region to estimate the population that is more likely to shift
towards using shared autonomous transport services. Results show that, in addition to cost and value of
time, the subjective satisfaction criteria play an important role in estimating a potential transport mode
shift. Moreover, these criteria brought more accuracy to agent-based simulation of the population that
could use autonomous vehicles (AVs) and better profiling to AVs-riders optimization models. The
conceptual model has allowed to deepen traveler experience and travel problems understanding. Its
different uses have allowed insightful diagnostics of several urban mobility systems. This was
recognized by the industrial partners involved in this thesis’ research project. Keywords: urban mobility, traveler experience, travel problems, problem generation, human-centered
design, grounded theory.
5
Résumé En voyageant vers une destination donnée, l’utilisateur des systèmes de mobilité urbaine interagit avec de nombreux produits et services. Cependant, la conception des systèmes de mobilité urbaine ne repose
généralement pas sur une représentation porte-à-porte de l'expérience-voyageur. La conception centrée
sur l'humain représente un moyen pertinent de rassembler les points de vue des acteurs de la mobilité
urbaine pour concevoir des systèmes de mobilité intégrés qui répondent aux souhaits et aux besoins des
voyageurs. Toutefois, les modèles et méthodes génériques centrés sur l'humain ne sont pas adaptés aux
spécificités de la mobilité urbaine et n'intègrent pas l'expérience porte-à-porte d’un voyageur en matière de produits et de services, y compris ses activités dans une ville. Cela a des répercussions sur les
pratiques de conception, telles que l'échantillonnage, la mise à l'échelle, la définition d'indicateurs de
performance, la collecte et l'analyse de données qualitatives, la participation des parties prenantes et la
définition des limites du système à concevoir. Pour un industriel ou un opérateur de transport, il n'est
pas aisé de mettre en œuvre ces pratiques lorsqu'il s'agit de concevoir des systèmes complexes, à l'échelle
d'une ville, qui sont ancrés dans la vie urbaine. Cette thèse vise à développer un modèle de l’expérience-
voyageur pour faciliter le diagnostic des problèmes de voyage dans les systèmes de mobilité urbaine.
Combinant les points de vue de la conception de l’expérience utilisateur (UX) et du transport, elle aborde
les questions de recherche suivantes :
Q1 : Comment peut-on modéliser l'expérience-voyageur pour alimenter le diagnostic des problèmes de voyage ? Q2 : Quels sont les problèmes rencontrés par les voyageurs lors de l’utilisation de systèmes de mobilité urbaine ? Q3 : Quel est l'effet d'un stimulus centré sur le voyageur sur l'efficacité de la génération de problèmes de voyage ? Q4 : Comment des attributs propres au voyageur peuvent-ils améliorer la modélisation et la simulation du transport ?
Un modèle conceptuel est d'abord proposé sur la base d'une littérature du transport centré sur l'humain,
d'observations de quatre zones urbaines, de six entretiens et de trois ateliers. Il décrit et analyse
différentes facettes de l'expérience-voyageur et propose un cadre conceptuel pour les problèmes
auxquels les voyageurs sont confrontés lorsqu'ils interagissent avec un système de mobilité urbaine. Le
modèle illustre les interactions du voyageur, à différentes échelles, avec les systèmes techniques de
mobilité, et indique comment des situations provenant du contexte urbain peuvent provoquer le passage
d'un scénario de voyage attendu à un scénario réel. Une étude de cas est menée pour illustrer l'utilisation
du modèle conceptuel dans l'identification des problèmes de voyage pour un service de transport à la
demande. Cela montre la nécessité de définir des catégories de problèmes prédéfinies lors de
l'identification des causes des problèmes déclarés par les utilisateurs. Une taxonomie des problèmes de
voyage vient compléter les catégories manquantes du modèle conceptuel. La taxonomie repose sur une
approche théorique ancrée dans les scripts d'interview dans trois métropoles et les code en vingt-deux
catégories de problèmes. De plus, un schéma de causalité reliant les différentes catégories de problèmes
de voyage est proposé. Les catégories couvrent à la fois les dimensions objectives et subjectives de la
perception des problèmes par les voyageurs. Une étude de cas montre l’intérêt de disposer de catégories
de problèmes prédéfinies pour mieux approfondir le diagnostic des systèmes de mobilité. Cependant, le
modèle conceptuel devait être validé dans le cadre d’une activité de conception. Il a donc été simplifié
pour s’adapter à la configuration en focus-group pour la génération de problèmes de voyage. Un stimulus
au format textuel a été conçu pour aider les voyageurs à générer des problèmes variés et nouveaux. Une
expérience a été menée avec deux groupes de contrôle servant de base à la génération de problèmes non
stimulés et à deux groupes expérimentaux dotés du stimulus. Les résultats montrent que les groupes
stimulés génèrent de nouveaux problèmes d'une plus grande variété que sans stimulus, couvrant la
plupart des dimensions de l'expérience-voyageur. Ces dimensions sont traduites en attributs propres au
voyageur afin d’améliorer la précision des déterminants du transfert modal. Enfin, une enquête en ligne
(457 réponses) a été réalisée pour la région parisienne afin d’estimer la population la plus susceptible de s’orienter vers l’utilisation de services de transport autonomes partagés. Les résultats montrent que, outre le coût et la valeur du temps, les critères de satisfaction subjectifs jouent un rôle important dans

6
l'estimation du transfert modal. De plus, ces critères ont apporté plus de précision à la simulation à base
d'agents de la population pouvant utiliser des véhicules autonomes (AV) et un meilleur profilage des
voyageurs pour les modèles d'optimisation. Le modèle conceptuel a permis d'approfondir la
compréhension de l'expérience-voyageur et des problèmes de voyage. Ses différentes utilisations ont
permis un diagnostic pertinent de plusieurs systèmes de mobilité urbaine. Ceci a été reconnu par les
partenaires industriels impliqués dans le projet de recherche de cette thèse.
Mots-clés : mobilité urbaine, expérience-voyageur, problèmes de voyage, génération de problèmes,
conception centrée sur l'humain, théorie ancrée.
7
List of Figures
Figure 1. Urban and rural population of the world, 1950-2050 (UNDESA, 2014) ............................... 16
Figure 2. Decision-based design process (Simon, 1960)....................................................................... 20
Figure 3. Systems Engineering model of an ITS (Denis & Janin, 2010) .............................................. 22
Figure 4. Urban mobility markets (WBCSD, 2015) .............................................................................. 22
Figure 5. A framework to study the transport system (Auvinen & Tuominen, 2014)........................... 24
Figure 6. An overview of Urban Mobility ............................................................................................. 26
Figure 7. Stairs bottleneck at La Defense (Paris) .................................................................................. 28
Figure 8. Crowd at Denfert-Rochereau (Paris) ...................................................................................... 28
Figure 9. Misused bike sharing system ................................................................................................. 28
Figure 10. Automaton out of order ........................................................................................................ 29
Figure 11. Angry driver (HVSL, 2017) ................................................................................................. 29
Figure 12. Bad weather conditions [Vienna] ......................................................................................... 29
Figure 13. Human Factors Hexagon (Woodcock et al., 2013) .............................................................. 32
Figure 14. Ethnographic information of a metro line commuters (Pontis, 2013) .................................. 34
Figure 15. Uber asking customer feedback (Drift, 2016) ...................................................................... 37
Figure 16. Bus wheelchair lift (ADA, 2012) ......................................................................................... 37
Figure 17. SNCF Transilien Train ......................................................................................................... 38
Figure 18. City repair art (CityRepair, 2016) ........................................................................................ 38
Figure 19. Stockhom Metro Tunnel ...................................................................................................... 38
Figure 20. Paris metro station ................................................................................................................ 38
Figure 21. Manual gear shifter .............................................................................................................. 38
Figure 22. Semi-automatic gear shifter (TRCG, 2015) ......................................................................... 38
Figure 23. The right exit (MSP, 2016) .................................................................................................. 39
Figure 24. The right door (PungApps, 2016) ........................................................................................ 39
Figure 25. Original safety instructions .................................................................................................. 40
Figure 26. Hacked safety instructions ................................................................................................... 40
Figure 27. Urban mobility and human centered approaches ................................................................. 41
Figure 28. Design research methodology framing of the thesis ............................................................ 44
Figure 29. Thesis research framework .................................................................................................. 46
Figure 30. Action research process for designing the conceptual model .............................................. 52
Figure 31. Traveler eXperience Conceptual Model diagram ................................................................ 55
Figure 32. The vehicle used in the DRT service ................................................................................... 57
Figure 33. Barely visible bus stop ......................................................................................................... 57
Figure 34. TXCM on the DRT service problem example ..................................................................... 58
8
Figure 35. Problem causality network of the DRT service ................................................................... 60
Figure 36. Research methodology stages .............................................................................................. 65
Figure 37. Travel problems causality scheme ....................................................................................... 69
Figure 38. Reformulated causality network of problem P1 ................................................................... 71
Figure 39. Reformulated and enriched causality network of problem P2 ............................................. 72
Figure 40. Expected effects of the traveler-centered stimulus on travel problem generation ............... 79
Figure 41. Stimulus construction phases ............................................................................................... 80
Figure 42. Experimental procedure ....................................................................................................... 83
Figure 43. Setting of the experiment ..................................................................................................... 83
Figure 44. Comparison of the evolution of travel problems in the different sets for G1 & G3 ............ 90
Figure 45. Travel problems distribution through the eleven pre-defined categories ............................. 92
Figure 46. Research methodology ......................................................................................................... 99
Figure 47. A Screenshot of the criteria scoring page of the questionnaire .......................................... 102
Figure 48. Distribution of the surveyed population ............................................................................. 103
Figure 49. Acceptance rates of an AV technology .............................................................................. 103
Figure 50. Distributions of answers a priori ........................................................................................ 104
Figure 51. AV acceptance regression tree ........................................................................................... 105
Figure 52. Rates of willingness-to-use a shared autonomous vehicle service ..................................... 105
Figure 53. Willingness-to-use criteria average scores ......................................................................... 106
Figure 54. Willingness-to-use a SAVS regression tree ....................................................................... 106
Figure 55. Unwillingness-to-use a SAVS regression tree ................................................................... 107
Figure 56. Hourly SAVS in-service rate with and without considering traveler AVs acceptance ...... 109
Figure 57- Ride-sharing with Meeting Points - Distance Savings ...................................................... 110
Figure 58. The position of the thesis in design and transportation research communities .................. 115
Figure 59. Anthropolis research axes .................................................................................................. 123
9
List of Tables
Table 1. Challenges confronting cities (Van Audenhove et al., 2014) .................................................. 16
Table 2. Characteristics and factors of a smart city (Giffinger, 2007) .................................................. 17
Table 3. Mobility through three dimensions ......................................................................................... 21
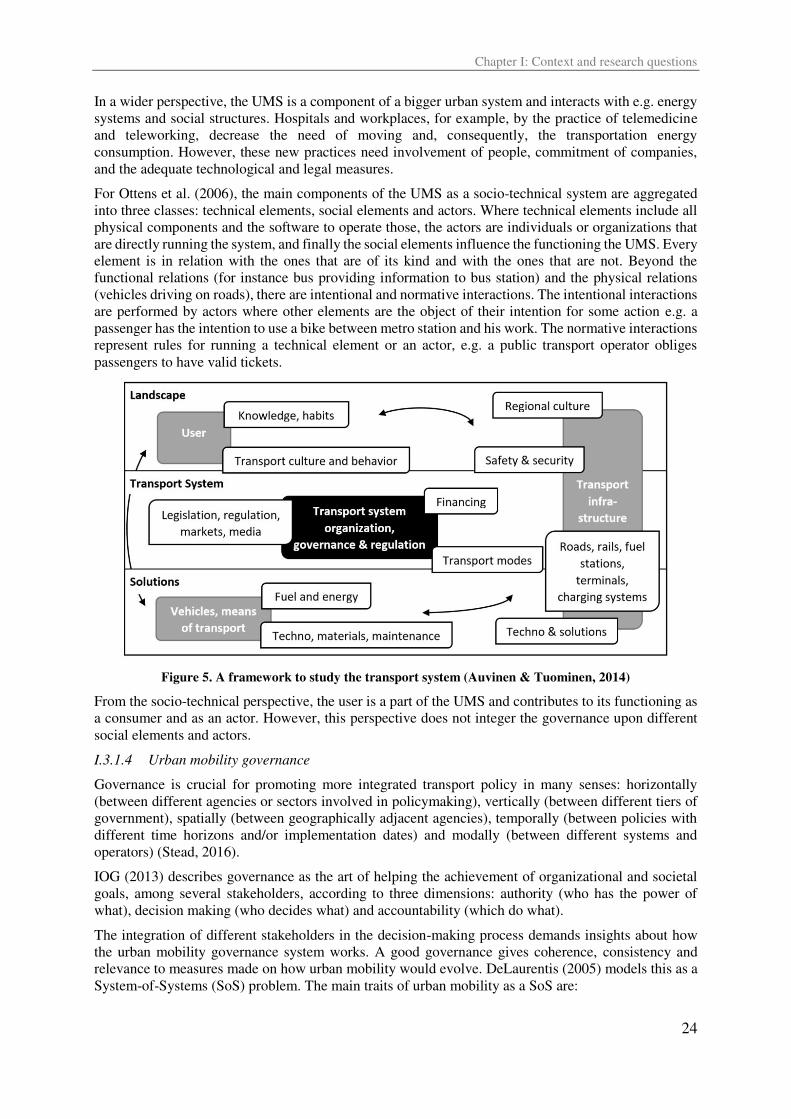
Table 4. Transportation SoS-Lexicon Matrix with Order Estimates (DeLaurentis, 2005) ................... 25
Table 5. Complexity factors of an urban mobility system .................................................................... 27
Table 6. Subjective vs objective well-being .......................................................................................... 31
Table 7. Human centered urban mobility perspectives ......................................................................... 36
Table 8. Alternative knowledge claim positions (Creswell, 2009) ....................................................... 41
Table 9. Research techniques involved in the thesis ............................................................................. 43
Table 10. Traveler eXperience Conceptual Model concept definitions ................................................ 55
Table 11. Travel problems through real vs. expected travel scenarios .................................................. 58
Table 12. Causes and consequences of travel problems of the DRT service ........................................ 59
Table 13. Travel problems taxonomy .................................................................................................... 68
Table 14. Causes and consequences induced for problem P1 ............................................................... 70
Table 15. Causes and consequences induced for problem P2 ............................................................... 71
Table 16. Pilot test stimulus for potential sources of travel problems .................................................. 80
Table 17. Refinements of the experimental protocol learned from the pilot experiment ...................... 81
Table 18. Traveler experience stimulus: traveler -centered sources of travel problems ....................... 82
Table 19. Composition of the four focus groups related to dependent variables .................................. 84
Table 20. Summary of the experimental setup ...................................................................................... 85
Table 21. Travel problem quantities as recorded .................................................................................. 88
Table 22. Examples of travel problems in the eleven pre-defined categories ....................................... 89
Table 23. Variety in travel problems generated .................................................................................... 89
Table 24. Category coverage of travel problems generated .................................................................. 90
Table 25. Travel problem categories novelty per group ........................................................................ 91
Table 26. Roll-up of values for the hypotheses variables from the mobility expertise perspective ...... 93
Table 27. Roll-up of values for the hypotheses variables from the stimulus use perspective ............... 94
Table 28. Roll-up of values for the hypotheses variables comparing expertise and stimulus effects ... 94
Table 29. SAVS alternative calculation of total travel time ................................................................ 101
Table 30. Example of a car user alternative trip with SAVS .............................................................. 101
Table 31. Average scores of willingness-to-use criteria per mode of transport .................................. 107
Table 32. AVs acceptance impact on SAVS user rate among each socio-professional category ...... 109
Table 33. Instance Characteristics and Parameters ............................................................................. 111
Table 34. Research validation methods of the thesis ........................................................................... 118
Contents
10
Contents
List of Figures ......................................................................................................................................... 7
List of Tables ........................................................................................................................................... 9
General introduction .............................................................................................................................. 13
Chapter I: Context and research questions ............................................................................................ 15
I.1 General context .................................................................................................................... 16
I.1.1 Urban challenges ......................................................................................................... 16
I.1.2 Sustainable and smart city ........................................................................................... 17
I.2 The Anthropolis research chair ............................................................................................ 18
I.2.1 The context of the chair ............................................................................................... 18
I.2.2 Innovation challenges of the chair’s partners .............................................................. 19
I.3 Research context .................................................................................................................. 20
I.3.1 Perspectives on urban mobility ................................................................................... 20
I.3.2 Perspectives of urban mobility at the scale of travelers .............................................. 27
I.3.3 Challenges in designing urban mobility ...................................................................... 29
I.3.4 Approaches of Human-centered urban mobility ......................................................... 30
I.3.5 Embedding human-centered approaches in mobility solutions ................................... 36
I.3.6 Summary and research question .................................................................................. 40
I.4 Research methodology ......................................................................................................... 41
I.4.1 Action research protocol and research questions ........................................................ 42
I.4.2 Research methodology in design research .................................................................. 43
I.5 Structure of the Manuscript.................................................................................................. 44
Chapter II: Modeling traveler experience for designing urban mobility systems ................................. 47
II.1 Introduction .......................................................................................................................... 48
II.2 Urban mobility systems ....................................................................................................... 49
II.2.1 Technical perspective .................................................................................................. 49
II.2.2 Market perspective ...................................................................................................... 49
II.2.3 Socio-technical perspective ......................................................................................... 49
II.3 Traveler experience .............................................................................................................. 50
II.3.1 Journey through time and space .................................................................................. 50
II.3.2 User experience journey .............................................................................................. 51
II.4 Research method .................................................................................................................. 52
II.4.1 Desk research .............................................................................................................. 52
II.4.2 Observations ................................................................................................................ 53
II.4.3 Workshops and interviews .......................................................................................... 53
II.4.4 Case studies ................................................................................................................. 53
Contents
11
II.5 Proposition of a Traveler eXperience Conceptual Model .................................................... 53
II.5.1 Assumptions ................................................................................................................ 54
II.5.2 Model .......................................................................................................................... 54
II.6 Case study: TXCM on a demand-responsive transport service ........................................... 56
II.7 Discussion ............................................................................................................................ 60
II.7.1 Travel problem projections on traveler experience ..................................................... 60
II.7.2 Travel problems between causes and consequences ................................................... 61
II.7.3 Nature of travel problems ............................................................................................ 61
II.7.4 Travel problem identification ...................................................................................... 61
II.8 Conclusion ........................................................................................................................... 62
Chapter III: Understanding urban travel problems: A grounded theory approach ................................ 63
III.1 Introduction .......................................................................................................................... 64
III.2 Research method .................................................................................................................. 65
III.2.1 Initial sampling and interviewing ................................................................................ 65
III.2.2 Initial and focused coding ........................................................................................... 65
III.2.3 Coding refinement ....................................................................................................... 66
III.2.4 Categories saturation and theoretical coding ............................................................... 66
III.3 Results .................................................................................................................................. 67
III.3.1 Travel problems taxonomy .......................................................................................... 67
III.3.2 Travel problems causality scheme .............................................................................. 69
III.3.3 Definitions of travel problems ..................................................................................... 69
III.4 Enrichment of travel problems: illustrations ........................................................................ 70
III.4.1 Reformulation of a problem ........................................................................................ 70
III.4.2 Enriching a problem .................................................................................................... 71
III.5 Discussion and conclusion ................................................................................................... 72
Chapter IV: Stimulating usage problem generation: An urban mobility case study ............................. 75
IV.1 Introduction .......................................................................................................................... 76
IV.2 Background and related research ......................................................................................... 77
IV.2.1 Identification of travel problems ................................................................................. 77
IV.2.2 Effectiveness of travel problems ideation ................................................................... 78
IV.3 Research method .................................................................................................................. 79
IV.3.1 Pilot test ....................................................................................................................... 79
IV.3.2 Experiment design ....................................................................................................... 82
IV.4 Results .................................................................................................................................. 87
IV.4.1 Effect on the quantity of travel problems .................................................................... 87
IV.4.2 Effect on the variety of travel problems ...................................................................... 88
IV.4.3 Effect on the novelty of travel problems ..................................................................... 90
Contents
12
IV.4.4 Qualitative insights ...................................................................................................... 92
IV.5 Discussion ............................................................................................................................ 93
IV.5.1 Evaluation of the hypotheses ....................................................................................... 93
IV.5.2 The value of the stimulus ............................................................................................ 94
IV.6 Conclusion and perspectives ................................................................................................ 95
Chapter V: Using traveler specific attributes in transport modeling and simulation of AVs ................ 97
V.1 Introduction .......................................................................................................................... 98
V.2 Material and method ............................................................................................................ 99
V.2.1 Setting the traveler specific attributes ....................................................................... 100
V.2.2 The first part of the questionnaire ............................................................................. 100
V.2.3 The SAVS model ...................................................................................................... 100
V.2.4 The second part of the questionnaire ......................................................................... 101
V.3 AVs acceptance and SAVS willingness-to-use.................................................................. 102
V.3.1 Prior acceptance of an autonomous vehicle technology ............................................ 103
V.3.2 Willingness-to-use a shared autonomous vehicle service a posteriori ...................... 105
V.4 Using traveler specific attributes in modeling and simulation of AVs .............................. 108
V.4.1 Agent-based simulation accuracy enhancement ........................................................ 108
V.4.2 Introducing traveler satisfaction in shared mobility optimization models ................ 110
V.5 Conclusion ......................................................................................................................... 111
General discussion ............................................................................................................................... 113
Summary of the results ................................................................................................................... 114
Contributions ................................................................................................................................... 115
Theoretical contribution .............................................................................................................. 115
Practical contribution .................................................................................................................. 116
Methodological contribution ...................................................................................................... 117
Research validation ......................................................................................................................... 118
Case studies ................................................................................................................................ 118
Empirical studies ........................................................................................................................ 119
Industrial studies ......................................................................................................................... 119
Limitations and further research ..................................................................................................... 120
Measuring the performance of an urban mobility system .......................................................... 120
Travel problem diagnosis ........................................................................................................... 121
Research evaluation with usability tests ..................................................................................... 122
Summary for the Anthropolis research chair .............................................................................. 122
References ........................................................................................................................................... 125
Appendices .......................................................................................................................................... 139
Personal publications ........................................................................................................................... 159
General introduction
13
General introduction
General introduction
In one of the workshops of the International Transport Forum entitled “designing cities for people” (OECD, 2014), it was pointed out that the world's population is increasingly concentrated in cities
causing problems of inequality and accessibility. This poses a risk for the quality of life. To avoid such
a future, urban planning will need to adopt approaches that focus on the diversity of citizens and their
needs, thus encouraging the development of new approaches to observe travelers and ensure their quality
of life.
The citizen, user of transportation systems, has always been one of the centers of interest of urban
mobility actors, since, directly - for the car manufacturers, for example - or indirectly - for train
manufacturers – he/she is the customer, as for the public authorities he/she is the finality. However,
through the evolution of the paradigm of urban mobility (Jones, 2014), the conceptualization of the user
has changed. Indeed, during a first step, the user was reduced to a simple constraint, the mass in
kilograms for example for civil engineering. The second stage, on the other hand, represented travelers
as a physical flow whose circulation must be optimized. Finally, faced with the failure of these models
(Boy & Narkevicius, 2014) to be able to solve evolving problems of mobility (Priester et al., 2014), the
user has become a much richer concept. We are now talking about a corporate employee, a father, a
businessman, a student, taking into account the dimensions that make of a user a particular citizen
performing urban activities within a city (Nielsen, 2014).
Furthermore, a user of urban mobility systems interacts with many products and services while heading
to some destination, while these systems are not designed and not operating together to offer him/her a
seamless experience (Preston, 2012).
In this perspective, human-centered design appears as a relevant answer to initiate the shift from passive
“end” user towards an active contributor to all system’s design phases (Talbert, 1997). The
comprehension of users’ needs and wants is a matter that concerns every stakeholder of urban mobility
and a powerful way to bring together their views in designing integrated mobility systems.
However, the human-centered approaches remain often too generic to urban mobility issues and do not
integrate the door-to-door multi-products and services experience of a traveler including his/her
activities within a city. This is why this PhD thesis focuses on the development of a model that integrates
urban mobility complexity factors, having the traveler in the center.

General introduction
14
General introduction
15
Chapter I: Context and research questions
Chapter I
Context and research questions
Challenges cities are facing nowadays are impacting the practice of urban mobility of both travelers and transport industry. The traveler is challenged by daily travel problems. Urban mobility actors, therefore, are given opportunities to innovate and create new products and services responding to the evolving wants and needs of travelers. Human-centered design research, as a scientific driver for this change, contains a rich literature on models that consider the human in the center. They lack however consideration of some important aspects of urban mobility complexity factors. This chapter discusses these matters and proposes research questions for this thesis and a general methodology through which they will be answered.
Chapter I: Context and research questions
16
I.1 General context
The urban challenges cities are facing in our era have an impact on urban mobility. A city is invented
every day. It is imagined and formed by many people at the same time (Kempf 2009, p.2). On the one
hand, decision makers, such as local authorities or transport operators and manufacturers, have to make
decisions about the future of urban mobility. On the other hand, citizens are consulted for questions
regarding democracy, acceptance, and quality of urban mobility systems. Therefore, along with the city,
urban mobility has to evolve to meet the challenges of the future smart and sustainable city.
I.1.1 Urban challenges
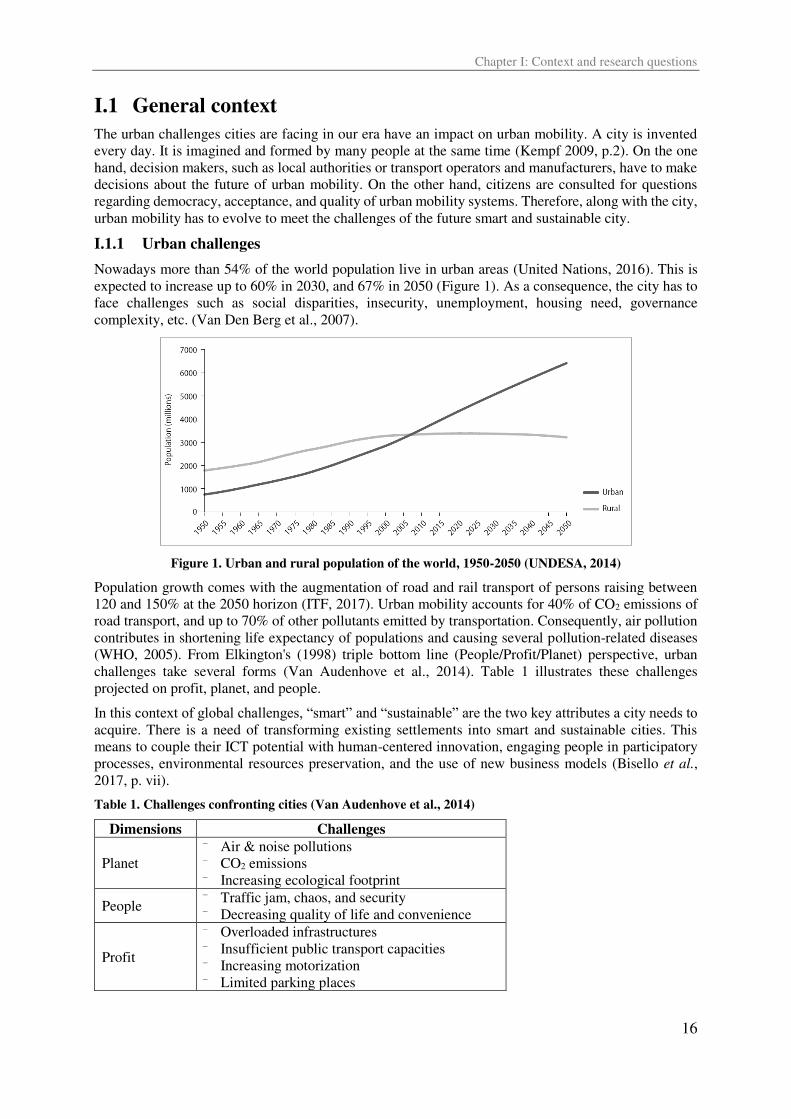
Nowadays more than 54% of the world population live in urban areas (United Nations, 2016). This is
expected to increase up to 60% in 2030, and 67% in 2050 (Figure 1). As a consequence, the city has to
face challenges such as social disparities, insecurity, unemployment, housing need, governance
complexity, etc. (Van Den Berg et al., 2007).
Figure 1. Urban and rural population of the world, 1950-2050 (UNDESA, 2014)
Population growth comes with the augmentation of road and rail transport of persons raising between
120 and 150% at the 2050 horizon (ITF, 2017). Urban mobility accounts for 40% of CO2 emissions of
road transport, and up to 70% of other pollutants emitted by transportation. Consequently, air pollution
contributes in shortening life expectancy of populations and causing several pollution-related diseases
(WHO, 2005). From Elkington's (1998) triple bottom line (People/Profit/Planet) perspective, urban
challenges take several forms (Van Audenhove et al., 2014). Table 1 illustrates these challenges
projected on profit, planet, and people.
In this context of global challenges, “smart” and “sustainable” are the two key attributes a city needs to acquire. There is a need of transforming existing settlements into smart and sustainable cities. This
means to couple their ICT potential with human-centered innovation, engaging people in participatory
processes, environmental resources preservation, and the use of new business models (Bisello et al., 2017, p. vii).
Table 1. Challenges confronting cities (Van Audenhove et al., 2014)
Dimensions Challenges
Planet
⁻ Air & noise pollutions
⁻ CO2 emissions
⁻ Increasing ecological footprint
People ⁻ Traffic jam, chaos, and security
⁻ Decreasing quality of life and convenience
Profit
⁻ Overloaded infrastructures
⁻ Insufficient public transport capacities
⁻ Increasing motorization
⁻ Limited parking places
Chapter I: Context and research questions
17
I.1.2 Sustainable and smart city
If urbanization remains the way it is practiced now, it will aggravate the unsustainability of cities (Bibri,
2018). Indeed, urbanization as a clustering of people and buildings forces the limited urban resources,
exposes the city to climate driven-natural disasters and climate change, increases the vulnerability of the
poor, and deepens inequality of access to urban services (K.-G. Kim, 2018). Hence the need of a
sustainable city is exposed.
The buzz concept of “smart cities”, as an answer to the cities’ sustainability challenges, gives most of the time the sense of technology-laden projects using Internet-of-things, green energy, artificial
intelligence, or autonomous vehicles (Lehr, 2018). However, a smart city is a twofold concept indeed
(Kitchin, 2013). On the one hand, it uses technology in the form of digital devices and infrastructures
that enable real time analysis of the city life through modeling and prediction of processes. On the other
hand, a smart city must enhance human capital, education, economic development and governance. In
other words, a smart city is also sustainable insofar as it offers a pleasant healthy way of life, accessible
to every citizen by conducting a responsible management of its transport networks, urbanism, energy,
and resources consumption. Indeed, beyond the improvement of abiotic and biotic aspects of urban life,
urban sustainability is about people’s satisfaction, experiences and quality of the daily environments (Chiesura, 2004).
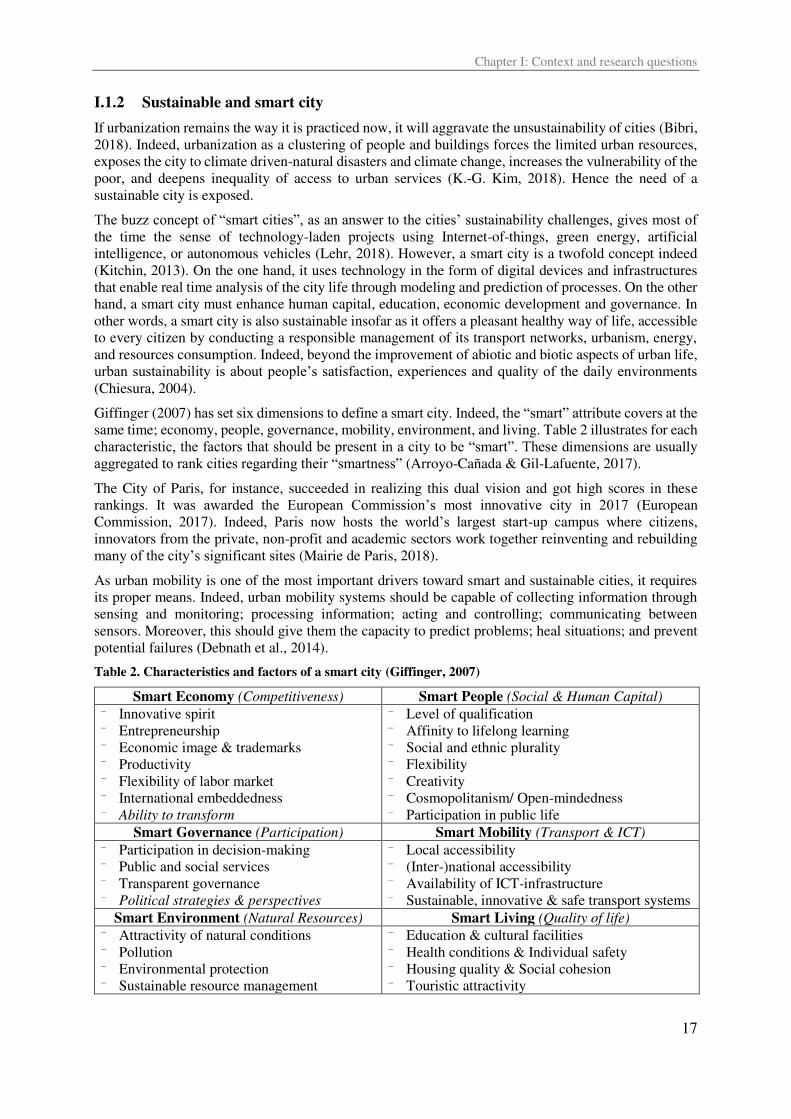
Giffinger (2007) has set six dimensions to define a smart city. Indeed, the “smart” attribute covers at the same time; economy, people, governance, mobility, environment, and living. Table 2 illustrates for each
characteristic, the factors that should be present in a city to be “smart”. These dimensions are usually
aggregated to rank cities regarding their “smartness” (Arroyo-Cañada & Gil-Lafuente, 2017).
The City of Paris, for instance, succeeded in realizing this dual vision and got high scores in these
rankings. It was awarded the European Commission’s most innovative city in 2017 (European
Commission, 2017). Indeed, Paris now hosts the world’s largest start-up campus where citizens,
innovators from the private, non-profit and academic sectors work together reinventing and rebuilding
many of the city’s significant sites (Mairie de Paris, 2018).
As urban mobility is one of the most important drivers toward smart and sustainable cities, it requires
its proper means. Indeed, urban mobility systems should be capable of collecting information through
sensing and monitoring; processing information; acting and controlling; communicating between
sensors. Moreover, this should give them the capacity to predict problems; heal situations; and prevent
potential failures (Debnath et al., 2014).
Table 2. Characteristics and factors of a smart city (Giffinger, 2007)
Smart Economy (Competitiveness) Smart People (Social & Human Capital) ⁻ Innovative spirit
⁻ Entrepreneurship
⁻ Economic image & trademarks
⁻ Productivity
⁻ Flexibility of labor market
⁻ International embeddedness
⁻ Ability to transform
⁻ Level of qualification
⁻ Affinity to lifelong learning
⁻ Social and ethnic plurality
⁻ Flexibility
⁻ Creativity
⁻ Cosmopolitanism/ Open-mindedness
⁻ Participation in public life
Smart Governance (Participation) Smart Mobility (Transport & ICT) ⁻ Participation in decision-making
⁻ Public and social services
⁻ Transparent governance
⁻ Political strategies & perspectives
⁻ Local accessibility
⁻ (Inter-)national accessibility
⁻ Availability of ICT-infrastructure
⁻ Sustainable, innovative & safe transport systems
Smart Environment (Natural Resources) Smart Living (Quality of life) ⁻ Attractivity of natural conditions
⁻ Pollution
⁻ Environmental protection
⁻ Sustainable resource management
⁻ Education & cultural facilities
⁻ Health conditions & Individual safety
⁻ Housing quality & Social cohesion
⁻ Touristic attractivity
Chapter I: Context and research questions
18
Urban mobility plays a central role in shaping the future of the smart and sustainable city. Indeed, it
shapes together infrastructure, urban planning, and quality of life of individuals (Lopatnikov, 2017).
Therefore, challenges facing cities impact urban mobility and the way it is designed. Urban mobility
actors have to evolve in order to meet the new requirements of the new mobility paradigm that places,
today, the traveler in the center (Banister, 2008).
I.2 The Anthropolis research chair
This thesis is conducted as part of the research chair Anthropolis (Anthropolis, 2018). It is a research
project that aims at making engineering approaches of urban mobility more human-centered. The thesis
focuses on design engineering approaches and tries to enrich them in both urban mobility
contextualization and human-centered ways.
The industrial partners of Anthropolis are actors of urban mobility in the greater Paris region and they
face several challenges related to innovation as part of urban mobility transformation to meet the
evolving wants and needs of travelers.
I.2.1 The context of the chair
The Anthropolis research chair is the fruit of a partnership between the Institute for Technological
Research (IRT) SystemX and the Industrial Engineering Laboratory (LGI) of Ecole CentraleSupélec. It
is partially funded by industrial partners which are ALSTOM, ENGIE, Renault Group, RATP and
SNCF.
The LGI develops models, methods and tools for the diagnosis, design, development, manufacture,
launching, operation, recycling of socio-technical systems, such as urban mobility systems. This thesis
is at the crossroads of the design engineering team works and the urban mobility research axis of the
lab. SystemX, on the other hand, is one of eight institutes for technological research that have been
established by the Government to enhance the country’s attractiveness. It is specialized in digital engineering of complex systems, meeting industries and territories’ technological and scientific challenges through open and collective applied research. The Anthropolis research chair is a part of
Smart territories program of the institute.
The Anthropolis partners are motivated to work together, being aware of the fruits of R&D collaboration
between urban mobility actors. Therefore, in setting the goal of the chair, the LGI has proposed that its
research should be centered on the Human, arguing in this way:
“Innovation is born more and more of individual initiatives or spontaneous groups. Thus, it must be cultivated with a better understanding of the current evolution of the increasingly digital society, operating in networks and where sociotechnical interactivity has become a necessity. It is necessary to move continuously from the individual needs of each (of the user) to the systems of systems to satisfy them by integrating the concepts (systems, services, uses, etc.), with the management of the different interacting urban flows.”
This point of view is supported by the International Transport Forum (OECD, 2014, p:16). Indeed, in a
workshop entitled "Designing Cities for People", it was pointed out that urban planning will need to
adopt approaches that focus on the diversity of citizens and their needs, thus encouraging the
development of new approaches to observe users and their quality of life.
To Sharon (2012, p:35), this kind of research projects generates value for its stakeholders when it helps:
• Uncover the needs of the user, different profiles of users, their situations of discomfort, identify
the appropriate value to propose when it comes to developing a new product.
• Understand what works well and what does not work and how to improve it and see in
competing offers when it comes to a new version of the product.
• Develop metrics to identify the success of use when the product is about to enter the market.
• Propose research questions to improve even more when the product is a success.
• Identify the problems of use and propose solutions when the product is a failure.
Chapter I: Context and research questions
19
The "product" boundaries quickly become difficult to define once we start talking about urban mobility.
Indeed, urban mobility includes several products and services which directly result a multitude of uses.
The private car is driven in a high-traffic road network during peak hours, the bus to go to the suburban
train station, the application that provides information on the journey to take to get from point A to point
B, the self-service bike for a touristic hike, the trip in a tunnel with a hundred corridors to take a
connection between the metro and the suburban train ... There will always be, in a system as complex
as that of urban mobility, new products to design, others to improve, services to adapt, practices to
reform, networks to optimize, etc. Anthropolis therefore tries to provide answers to questions that focus
on travelers, users of urban mobility systems through three research axes: (1) User research: a traveler -
centered approach of urban mobility issues. (2) Disruptive technologies and innovation: a technological
watch of urban mobility. (3) Impact assessment: a measure of the impact of new solutions on business
models and urban systems. As part of the first research axis, this thesis aims at bringing new insights
that would help urban mobility actors to tackle the innovation challenges they are facing and target more
human-centered solutions.
I.2.2 Innovation challenges of the chair’s partners
The five industrial partners of the Anthropolis chair are big companies that have decades of history in
doing and excelling at developing urban mobility solutions. After interviewing them we discovered that,
today, these companies feel the urge to move their businesses towards new paths that they never
mastered before. Therefore, they need to acquire and adopt practices and approaches of innovation
which are about going beyond their initial core business.
For B2B companies among our partners, it is hard to know the problems of the final user of the systems
they design (e.g. a train). To develop their offer, they are constrained by technical specifications and do
not have direct access to the raw user material collected by their business client. Therefore, today, they
are developing their own knowledge about the final users of their products and services. For instance,
ALSTOM has its own approach of digital mobility experience of passengers of its trains (ALSTOM,
2018). Moreover, the traveler knowledge becomes even harder to acquire and master when the
company’s core business is not urban mobility but an energy provider. Indeed, the variety of sectors that
a B2B energy company has to deal with is big. Therefore, it needs to have this knowledge on the traveler
experience for its mobility solutions. ENGIE develops solutions for public transport, for example,
among which there are passenger information systems and car sharing (ENGIE, 2018).
The core knowledge of the automotive industry is on driving a car, not on using the car as a mode of
transport that interchanges with other modes in a door-to-door mobility experience. Therefore, car
manufacturers who want to evolve toward a more integrated business with other urban mobility systems
are acquiring the knowledge on these systems and position their offer as a system among systems.
Moreover, the marketing practice of these actors is also evolving towards knowing better other mobility
dimensions in a traveler experience perspective. For instance, RENAULT is now developing shared
mobility solutions for the autonomous future of mobility (RENAULT, 2018).
For transport operators, in the context of the greater Paris region, the challenge is to assure a seamless,
door-to-door experience of passengers using public transport. Beyond the operational performance such
as reliability, safety and availability, transport operators have to provide cleanliness, comfort,
information, and the right services for different profiles of travelers. Moreover, new shared mobility
solutions such as ride-sharing or electric-scooters are becoming a part of public transport and need to be
mastered by the operators. RATP and SNCF are already in the move of considering a door-to-door
(RATP, 2018) and sustainable (SNCF, 2018) experience of public transport users and not only the
aggregate of the line they operate.
When it comes to develop new solutions, urban mobility actors need to reflect on their previous projects.
Moreover, a new solution when integrated in the market does generate changes in existing mobility
systems. Therefore, it needs to be simulated to forecast the behavior of users and the global
transportation system. However, the future behaviors and attitudes of travelers are not well known today.
Anthropolis industrial partners are facing new challenges when thinking of the future of their respective
businesses. Therefore, this thesis is set to help the Anthropolis partners to tackle some of them.
Chapter I: Context and research questions
20
I.3 Research context
This thesis aims at being a bridge between design and transportation research fields. However, its core
discipline is design research. For this reason, it will be positioned in the design research scope where its
design object is urban mobility and its users are the travelers.
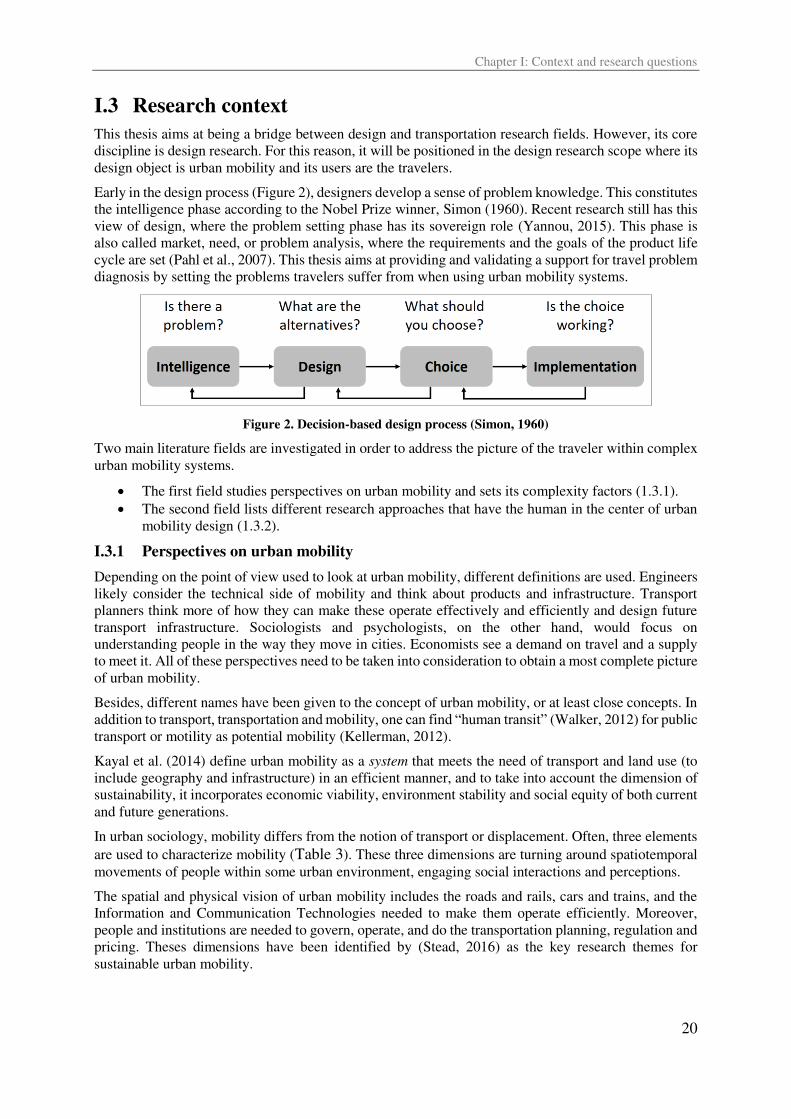
Early in the design process (Figure 2), designers develop a sense of problem knowledge. This constitutes
the intelligence phase according to the Nobel Prize winner, Simon (1960). Recent research still has this
view of design, where the problem setting phase has its sovereign role (Yannou, 2015). This phase is
also called market, need, or problem analysis, where the requirements and the goals of the product life
cycle are set (Pahl et al., 2007). This thesis aims at providing and validating a support for travel problem
diagnosis by setting the problems travelers suffer from when using urban mobility systems.
Figure 2. Decision-based design process (Simon, 1960)
Two main literature fields are investigated in order to address the picture of the traveler within complex
urban mobility systems.
• The first field studies perspectives on urban mobility and sets its complexity factors (1.3.1).
• The second field lists different research approaches that have the human in the center of urban
mobility design (1.3.2).
I.3.1 Perspectives on urban mobility
Depending on the point of view used to look at urban mobility, different definitions are used. Engineers
likely consider the technical side of mobility and think about products and infrastructure. Transport
planners think more of how they can make these operate effectively and efficiently and design future
transport infrastructure. Sociologists and psychologists, on the other hand, would focus on
understanding people in the way they move in cities. Economists see a demand on travel and a supply
to meet it. All of these perspectives need to be taken into consideration to obtain a most complete picture
of urban mobility.
Besides, different names have been given to the concept of urban mobility, or at least close concepts. In
addition to transport, transportation and mobility, one can find “human transit” (Walker, 2012) for public
transport or motility as potential mobility (Kellerman, 2012).
Kayal et al. (2014) define urban mobility as a system that meets the need of transport and land use (to
include geography and infrastructure) in an efficient manner, and to take into account the dimension of
sustainability, it incorporates economic viability, environment stability and social equity of both current
and future generations.
In urban sociology, mobility differs from the notion of transport or displacement. Often, three elements
are used to characterize mobility (Table 3). These three dimensions are turning around spatiotemporal
movements of people within some urban environment, engaging social interactions and perceptions.
The spatial and physical vision of urban mobility includes the roads and rails, cars and trains, and the
Information and Communication Technologies needed to make them operate efficiently. Moreover,
people and institutions are needed to govern, operate, and do the transportation planning, regulation and
pricing. Theses dimensions have been identified by (Stead, 2016) as the key research themes for
sustainable urban mobility.
Chapter I: Context and research questions
21
Table 3. Mobility through three dimensions
Dimension 1 Dimension 2 Dimension 3 Reference
Space Time Context (Kakihara & Sørensen, 2001)
Physical settings,
material spaces &
design
Embodied
performance
Social
interactions (Jensen 2013, p.6).
Networks,
infrastructures &
accessibility
conditions
Displacements
realized in time and
space, from origin to
destination
Capacity to be
mobile in social
& geographic
spaces
(Kaufmann et al., 2004)
(Kaufmann, 2011)
Following these dimensions, we will present first the technical side of urban mobility, then we will
introduce the social, the market and the governance dimensions.
I.3.1.1 Technical urban mobility
Roads, rail, fuel stations, train stations, bridges, energy network, terminals and facilities etc. on one
hand, buses, cars, trains, trucks, boats, trams etc. one the other hand, constitute the technical physical
components of urban mobility. To complete that, Information and Communications Technology (ICT)
(GPS, Internet of Things, mobile networks…) play an important role to foster the qualities of this technical system (safety, usefulness, fluidity…).
However, the aggregation of infrastructure, vehicles and ICT is not giving us the whole picture of the
technical urban mobility system. In fact, trip-chaining (Primerano et al., 2008) connects each of both the
elements of infrastructure and vehicles together. It brings out the necessity to have a global
understanding that takes multi-modality into account and think of a global performance rather than those
of a single bus line, highway, or hub separately. For instance, bus lines that are feeding a regional rail
line may operate with good performance indicators (e.g. schedule respect, good frequency) but if they
arrive all at the same time at the train station they would cause a congestion and deteriorate the train’s performance indicators. The combined set of bus lines and regional train would then operate with a bad
multi-modality efficiency indicator.
Nevertheless, studying multi-modality is not sufficient to complete the whole technical view of urban
mobility. Actually, there are other urban systems connected to it such as households, industries, or
workplaces (Wegener, 2013). Consequently, in urban planning, these are designed together with
transportation infrastructure. Furthermore, the energy consumption of a city depends hardly on its
transportation system. For instance, transportation represents more than 60% of the world’s consumption of oil (IEA & OECD, 2015).
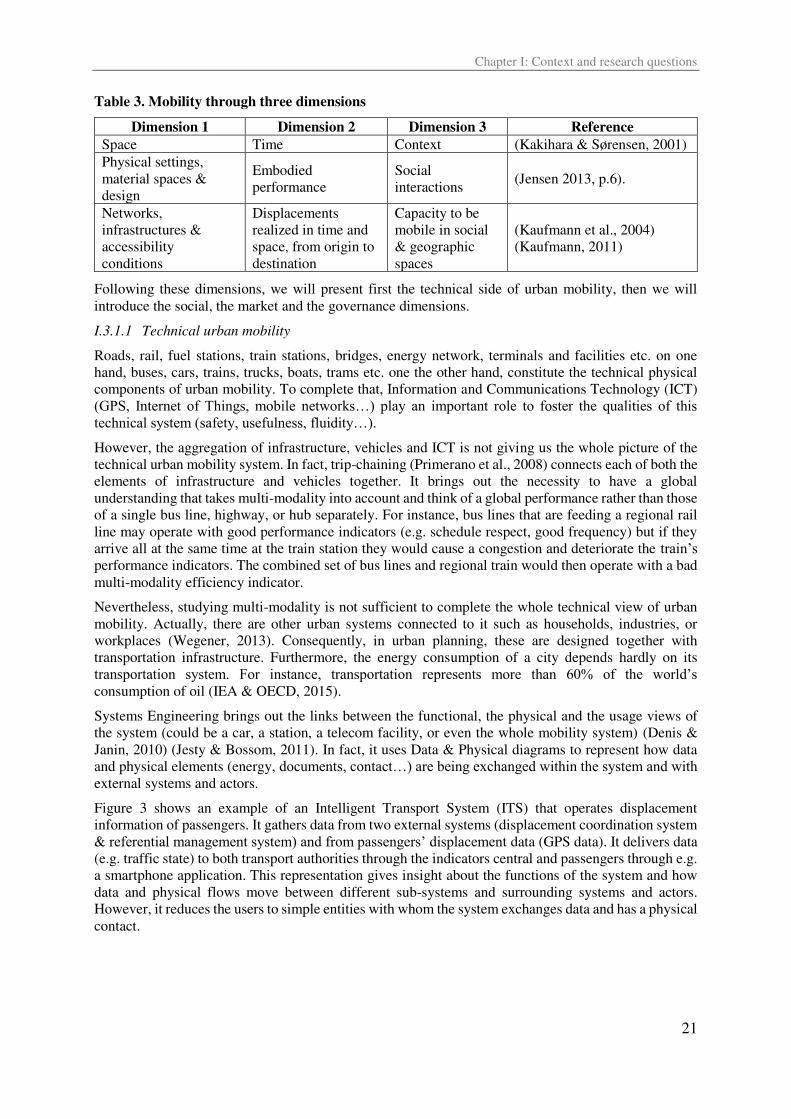
Systems Engineering brings out the links between the functional, the physical and the usage views of
the system (could be a car, a station, a telecom facility, or even the whole mobility system) (Denis &
Janin, 2010) (Jesty & Bossom, 2011). In fact, it uses Data & Physical diagrams to represent how data
and physical elements (energy, documents, contact…) are being exchanged within the system and with external systems and actors.
Figure 3 shows an example of an Intelligent Transport System (ITS) that operates displacement
information of passengers. It gathers data from two external systems (displacement coordination system
& referential management system) and from passengers’ displacement data (GPS data). It delivers data
(e.g. traffic state) to both transport authorities through the indicators central and passengers through e.g.
a smartphone application. This representation gives insight about the functions of the system and how
data and physical flows move between different sub-systems and surrounding systems and actors.
However, it reduces the users to simple entities with whom the system exchanges data and has a physical
contact.
Chapter I: Context and research questions
22
Figure 3. Systems Engineering model of an ITS (Denis & Janin, 2010)
I.3.1.2 Urban mobility market
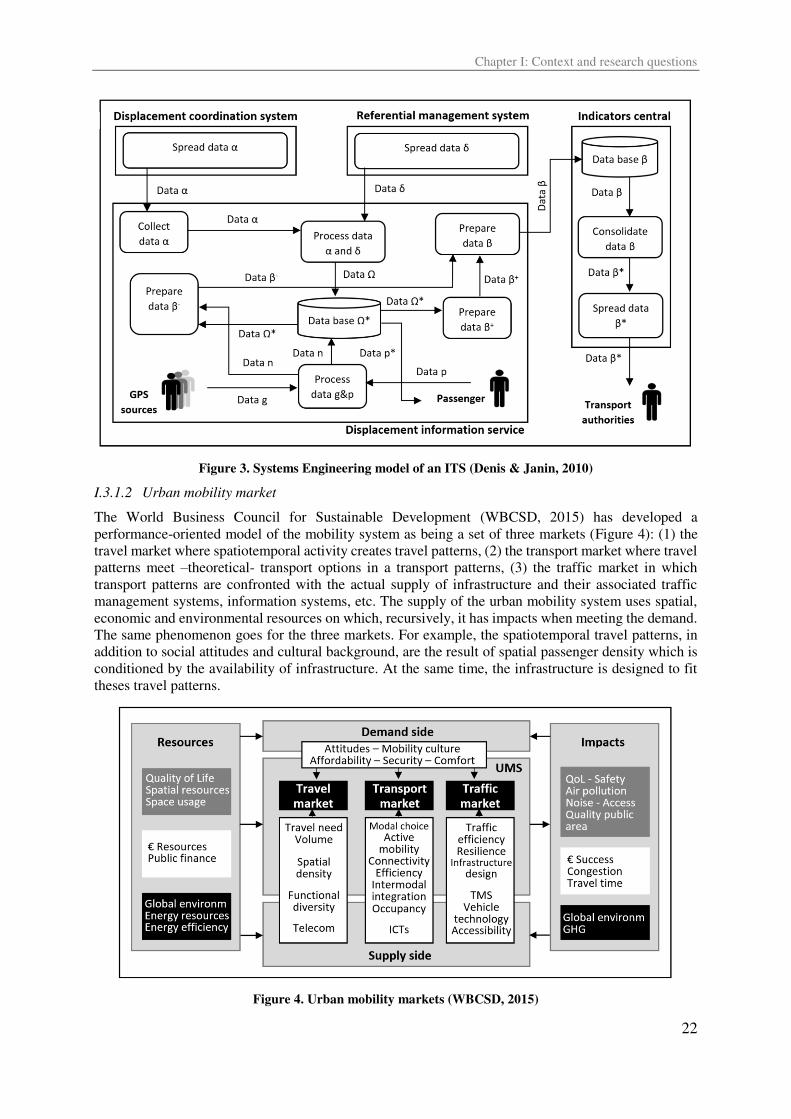
The World Business Council for Sustainable Development (WBCSD, 2015) has developed a
performance-oriented model of the mobility system as being a set of three markets (Figure 4): (1) the
travel market where spatiotemporal activity creates travel patterns, (2) the transport market where travel
patterns meet –theoretical- transport options in a transport patterns, (3) the traffic market in which
transport patterns are confronted with the actual supply of infrastructure and their associated traffic
management systems, information systems, etc. The supply of the urban mobility system uses spatial,
economic and environmental resources on which, recursively, it has impacts when meeting the demand.
The same phenomenon goes for the three markets. For example, the spatiotemporal travel patterns, in
addition to social attitudes and cultural background, are the result of spatial passenger density which is
conditioned by the availability of infrastructure. At the same time, the infrastructure is designed to fit
theses travel patterns.
Figure 4. Urban mobility markets (WBCSD, 2015)
Chapter I: Context and research questions
23
(Cascetta, 2009) defines the transportation system as a set of elements. The interactions between these
elements produces both the demand for travel within a given area and the provision of transportation
services to satisfy this demand.
There are many interactions between the components within the transportation system and between the
activity system (the set of individual, social, and economic behaviors and interactions that give rise to
travel demand) and transportation systems. For example, the level and spatial distribution of travel
demand is defined, inter alia, by the location of both households and economic activities. On the other
hand, the set of these interactions generates feedback cycles. For example, travelers who choose the
most efficient (fast and cheap) path within the available means might congest it and thereby deteriorate
this efficiency (transportation service performance).
(Gonzalez et al., 2008a) and (Hasan et al., 2013) gave more attention to the travel demand in its spatial
aspect. Their approach covers all population displacement in the physical space, regardless of the
duration and distance of travel, the means used, their causes and consequences. Taken in this way,
mobility becomes a map of passenger concentration in an urban space (mobility patterns) (Gao, 2015).
It gives insight of the most frequented places by profiles of people (e.g. using cars or public transport)
or of all citizens together. Furthermore, these mobility patterns can be combined to actual city maps and
give some hints to the reasons of the noticed concentrations.
Moreover, (Bassand & Brulhardt, 1981) identified three systemic properties in spatial mobility:
• The first one is totality; the spatial mobility as a whole is a totality carrying out specific functions
that are distinct from those conducted by the various types of spatial mobility that compose it.
For example, using the bus to get to the train station has for function catching the next train
while the travel between home and work aims to get to work on time.
• The second property is the positive/negative or the reinforcing/balancing feedback. It is a
distinction and decomposition of the feedback loops mentioned by Cascetta. For example, when
an alternative itinerary to avoid congestion is announced, this could be a balancing feedback to
balance the traffic jam in the road network. A reinforcing feedback occurs when congestion
causes delays and delays accumulates travelers in the metro station which causes congestion,
for example.
• The third principle is the diachronic functioning of mobility which generates itself over time.
For example, if a traveler /commuter moves from home to work, he generates the need to move
from work to home.
In summary, demand is characterized by attitudes and cultural background of users on one hand, and,
by spatial distribution of socio-economic activities on the other hand.
Considering the supply and demand separately in representing the urban mobility has given us some
information about how they interact. However, this perspective does not take into account neither the
effect of legal and political dimensions nor the role of individuals and institutions in operating urban
mobility.
I.3.1.3 Socio-technical urban mobility
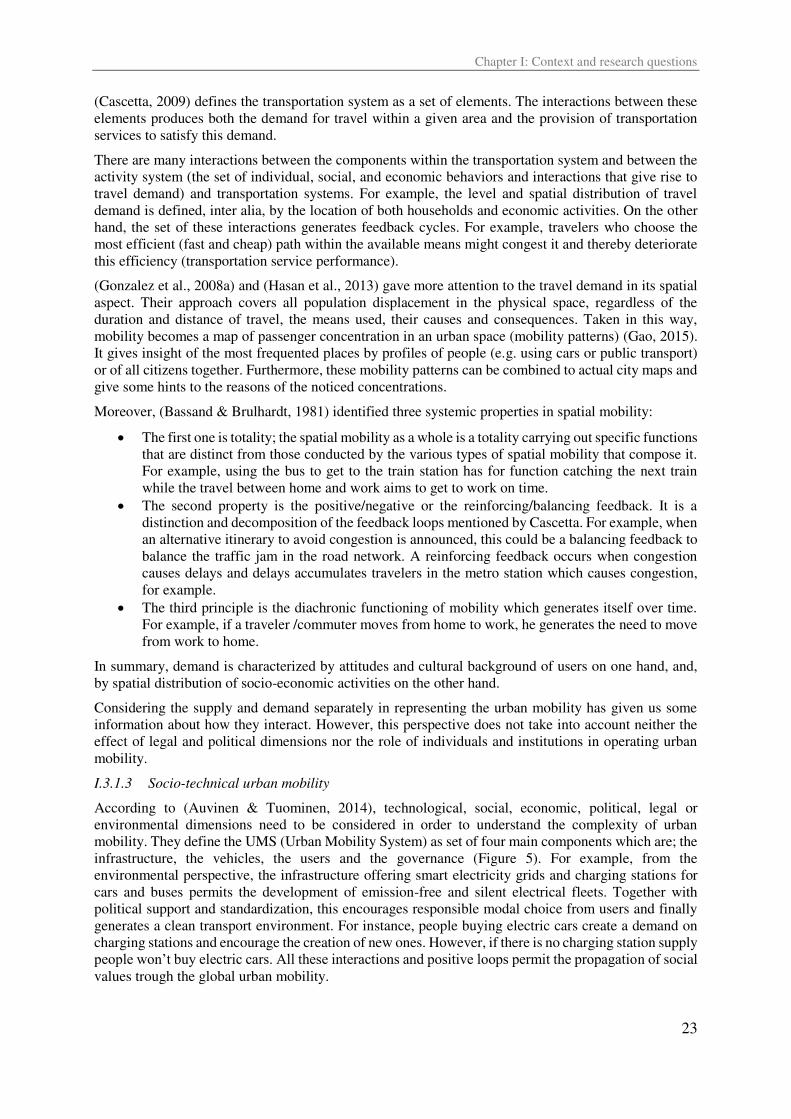
According to (Auvinen & Tuominen, 2014), technological, social, economic, political, legal or
environmental dimensions need to be considered in order to understand the complexity of urban
mobility. They define the UMS (Urban Mobility System) as set of four main components which are; the
infrastructure, the vehicles, the users and the governance (Figure 5). For example, from the
environmental perspective, the infrastructure offering smart electricity grids and charging stations for
cars and buses permits the development of emission-free and silent electrical fleets. Together with
political support and standardization, this encourages responsible modal choice from users and finally
generates a clean transport environment. For instance, people buying electric cars create a demand on
charging stations and encourage the creation of new ones. However, if there is no charging station supply
people won’t buy electric cars. All these interactions and positive loops permit the propagation of social
values trough the global urban mobility.
Chapter I: Context and research questions
24
In a wider perspective, the UMS is a component of a bigger urban system and interacts with e.g. energy
systems and social structures. Hospitals and workplaces, for example, by the practice of telemedicine
and teleworking, decrease the need of moving and, consequently, the transportation energy
consumption. However, these new practices need involvement of people, commitment of companies,
and the adequate technological and legal measures.
For Ottens et al. (2006), the main components of the UMS as a socio-technical system are aggregated
into three classes: technical elements, social elements and actors. Where technical elements include all
physical components and the software to operate those, the actors are individuals or organizations that
are directly running the system, and finally the social elements influence the functioning the UMS. Every
element is in relation with the ones that are of its kind and with the ones that are not. Beyond the
functional relations (for instance bus providing information to bus station) and the physical relations
(vehicles driving on roads), there are intentional and normative interactions. The intentional interactions
are performed by actors where other elements are the object of their intention for some action e.g. a
passenger has the intention to use a bike between metro station and his work. The normative interactions
represent rules for running a technical element or an actor, e.g. a public transport operator obliges
passengers to have valid tickets.
Figure 5. A framework to study the transport system (Auvinen & Tuominen, 2014)
From the socio-technical perspective, the user is a part of the UMS and contributes to its functioning as
a consumer and as an actor. However, this perspective does not integer the governance upon different
social elements and actors.
I.3.1.4 Urban mobility governance
Governance is crucial for promoting more integrated transport policy in many senses: horizontally
(between different agencies or sectors involved in policymaking), vertically (between different tiers of
government), spatially (between geographically adjacent agencies), temporally (between policies with
different time horizons and/or implementation dates) and modally (between different systems and
operators) (Stead, 2016).
IOG (2013) describes governance as the art of helping the achievement of organizational and societal
goals, among several stakeholders, according to three dimensions: authority (who has the power of
what), decision making (who decides what) and accountability (which do what).
The integration of different stakeholders in the decision-making process demands insights about how
the urban mobility governance system works. A good governance gives coherence, consistency and
relevance to measures made on how urban mobility would evolve. DeLaurentis (2005) models this as a
System-of-Systems (SoS) problem. The main traits of urban mobility as a SoS are:
Chapter I: Context and research questions
25
• Operational and managerial coordinated independence; e.g. a bus operates on a schedule
dictated by the transport operator but must coordinate with other buses.
• Geographic distribution which is inherent to transportation systems.
• Evolutionary behavior; Measures of effectiveness for transportation are dynamic in nature, due
primarily to delayed response to major inputs as well as inherent feedback mechanisms.
• Emergent behavior; e.g. in hubs, which is the connection between two modes or more, queues
are emergent phenomena.
• Heterogeneity; institutions, users, vehicles, infrastructure etc. are different entities that
composes urban mobility.
• Networks; e.g. road networks, hubs networks, car-sharing networks… • Trans-domain; involving economy, sociology, psychology, geography, policy …
In order to visualize the different layers and dimensions representing the problem, DeLaurentis proposes
the SoS-Lexicon Matrix (Table 4) where: (1) Resources are entities (systems) that give physical
manifestation to the system-of-systems. (2) Economics are non-physical entities that give intent to the
SoS operation. (3) Operations; application of intent to direct the activity of physical& non-physical
entities. (4) Policies; external forcing functions that impact the operation of physical & non-physical
entities.
Table 4. Transportation SoS-Lexicon Matrix with Order Estimates (DeLaurentis, 2005)
Size Resources Operations Economics Policies
(106)
Vehicles &
Infrastructure (e.g.
train, truck, runway)
Operating a Resource (car,
bus, etc.)
Economics of
building/operating/buying/
selling/leasing a single
resource
Policies relating to single
resource use (e.g. type
certification, license, etc.)
(104)
Collection of resources
for a common function
(a train station, etc.)
Operating resource
networks for common
function (e.g. transport
operator)
Economics of
operating/buying/selling/le
asing resource networks
Policies relating to multiple
vehicle use (e.g. road traffic
management, noise
policies, etc.)
(102)
Resources in a
Transport Sector (e.g.
rail transportation)
Operating collection of
resource networks (e.g.;
public transport authority)
Economics of a Business
sector (e.g. Automotive
Industry)
Policies relating to sectors
using multiple vehicles.
(Safety, accessibility, etc.)
(101)
Multiple, interwoven
sectors (resources for a
national transportation
system)
Operations of Multiple
Business Sectors (i.e.
Operators of total national
transportation system)
Economics of total
national transportation
system (All Transportation
Companies)
Policies relating national
transportation policy
(100)
Global transportation
system
Global Operations in the
world transportation system
Global Economics of the
world transportation
system
Policies relating to the
global transportation
system
Parker (2010) gives an example of SoS spatial application on establishing networks between hubs to
identify interfaces an apply standards to permit seamless connections between modes. That presupposes
the presence of multiple transport means customized to specific situations. Therefore, sufficient
information is needed for the correct decision between several options in real time (especially with the
support of mobile technology). Ultimately it would drive a change in social habits and behaviors
(Spickermann et al., 2013).
Sussman et al. (2005) consider, from the Regional Strategic Transportation Planning (RSTP)
perspective, transportation system as a Complex Large-Scale Integrated Open System (CLIOS) focusing
on both physical and institutional dimensions of complexity. They give higher importance to the
involvement of stakeholders all along the design process. Indeed, setting the system’s goals, representing its structure (subsystems and components) and giving it performance indicators define how the system
would operate. For instance, the omission of some small private stakeholders – knowing they are
developing new technologies shaping the UMS use, like new apps- may induce the lack of understanding
change in the UMS behavior and its users depending on technology, and consequently distort the system
modeling and performance setting. Indeed, (Schwanen, 2013) states that the urban mobility governance
is ambiguous and generates the most complicated problems.
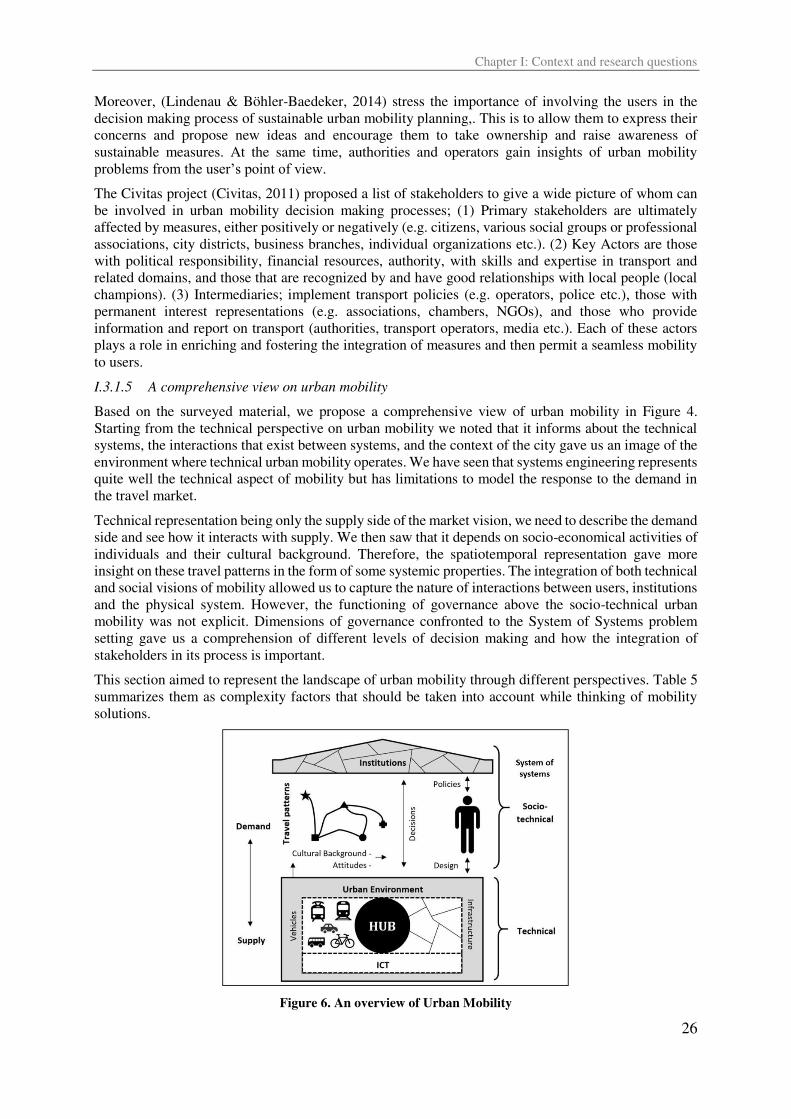
Chapter I: Context and research questions
26
Moreover, (Lindenau & Böhler-Baedeker, 2014) stress the importance of involving the users in the
decision making process of sustainable urban mobility planning,. This is to allow them to express their
concerns and propose new ideas and encourage them to take ownership and raise awareness of
sustainable measures. At the same time, authorities and operators gain insights of urban mobility
problems from the user’s point of view. The Civitas project (Civitas, 2011) proposed a list of stakeholders to give a wide picture of whom can
be involved in urban mobility decision making processes; (1) Primary stakeholders are ultimately
affected by measures, either positively or negatively (e.g. citizens, various social groups or professional
associations, city districts, business branches, individual organizations etc.). (2) Key Actors are those
with political responsibility, financial resources, authority, with skills and expertise in transport and
related domains, and those that are recognized by and have good relationships with local people (local
champions). (3) Intermediaries; implement transport policies (e.g. operators, police etc.), those with
permanent interest representations (e.g. associations, chambers, NGOs), and those who provide
information and report on transport (authorities, transport operators, media etc.). Each of these actors
plays a role in enriching and fostering the integration of measures and then permit a seamless mobility
to users.
I.3.1.5 A comprehensive view on urban mobility
Based on the surveyed material, we propose a comprehensive view of urban mobility in Figure 4.
Starting from the technical perspective on urban mobility we noted that it informs about the technical
systems, the interactions that exist between systems, and the context of the city gave us an image of the
environment where technical urban mobility operates. We have seen that systems engineering represents
quite well the technical aspect of mobility but has limitations to model the response to the demand in
the travel market.
Technical representation being only the supply side of the market vision, we need to describe the demand
side and see how it interacts with supply. We then saw that it depends on socio-economical activities of
individuals and their cultural background. Therefore, the spatiotemporal representation gave more
insight on these travel patterns in the form of some systemic properties. The integration of both technical
and social visions of mobility allowed us to capture the nature of interactions between users, institutions
and the physical system. However, the functioning of governance above the socio-technical urban
mobility was not explicit. Dimensions of governance confronted to the System of Systems problem
setting gave us a comprehension of different levels of decision making and how the integration of
stakeholders in its process is important.
This section aimed to represent the landscape of urban mobility through different perspectives. Table 5
summarizes them as complexity factors that should be taken into account while thinking of mobility
solutions.
Figure 6. An overview of Urban Mobility
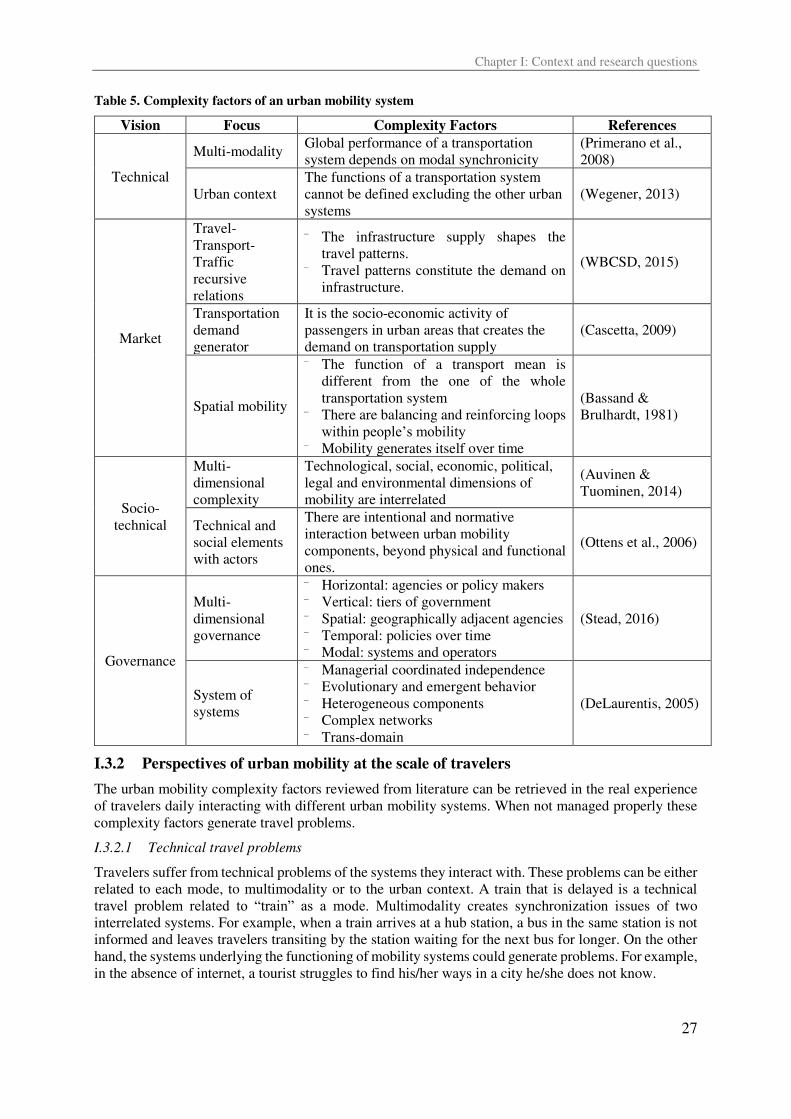
Chapter I: Context and research questions
27
Table 5. Complexity factors of an urban mobility system
Vision Focus Complexity Factors References
Technical
Multi-modality Global performance of a transportation
system depends on modal synchronicity
(Primerano et al.,
2008)
Urban context
The functions of a transportation system
cannot be defined excluding the other urban
systems
(Wegener, 2013)
Market
Travel-
Transport-
Traffic
recursive
relations
⁻ The infrastructure supply shapes the
travel patterns.
⁻ Travel patterns constitute the demand on
infrastructure.
(WBCSD, 2015)
Transportation
demand
generator
It is the socio-economic activity of
passengers in urban areas that creates the
demand on transportation supply
(Cascetta, 2009)
Spatial mobility
⁻ The function of a transport mean is
different from the one of the whole
transportation system
⁻ There are balancing and reinforcing loops
within people’s mobility
⁻ Mobility generates itself over time
(Bassand &
Brulhardt, 1981)
Socio-
technical
Multi-
dimensional
complexity
Technological, social, economic, political,
legal and environmental dimensions of
mobility are interrelated
(Auvinen &
Tuominen, 2014)
Technical and
social elements
with actors
There are intentional and normative
interaction between urban mobility
components, beyond physical and functional
ones.
(Ottens et al., 2006)
Governance
Multi-
dimensional
governance
⁻ Horizontal: agencies or policy makers
⁻ Vertical: tiers of government
⁻ Spatial: geographically adjacent agencies
⁻ Temporal: policies over time
⁻ Modal: systems and operators
(Stead, 2016)
System of
systems
⁻ Managerial coordinated independence
⁻ Evolutionary and emergent behavior
⁻ Heterogeneous components
⁻ Complex networks
⁻ Trans-domain
(DeLaurentis, 2005)
I.3.2 Perspectives of urban mobility at the scale of travelers
The urban mobility complexity factors reviewed from literature can be retrieved in the real experience
of travelers daily interacting with different urban mobility systems. When not managed properly these
complexity factors generate travel problems.
I.3.2.1 Technical travel problems
Travelers suffer from technical problems of the systems they interact with. These problems can be either
related to each mode, to multimodality or to the urban context. A train that is delayed is a technical
travel problem related to “train” as a mode. Multimodality creates synchronization issues of two
interrelated systems. For example, when a train arrives at a hub station, a bus in the same station is not
informed and leaves travelers transiting by the station waiting for the next bus for longer. On the other
hand, the systems underlying the functioning of mobility systems could generate problems. For example,
in the absence of internet, a tourist struggles to find his/her ways in a city he/she does not know.
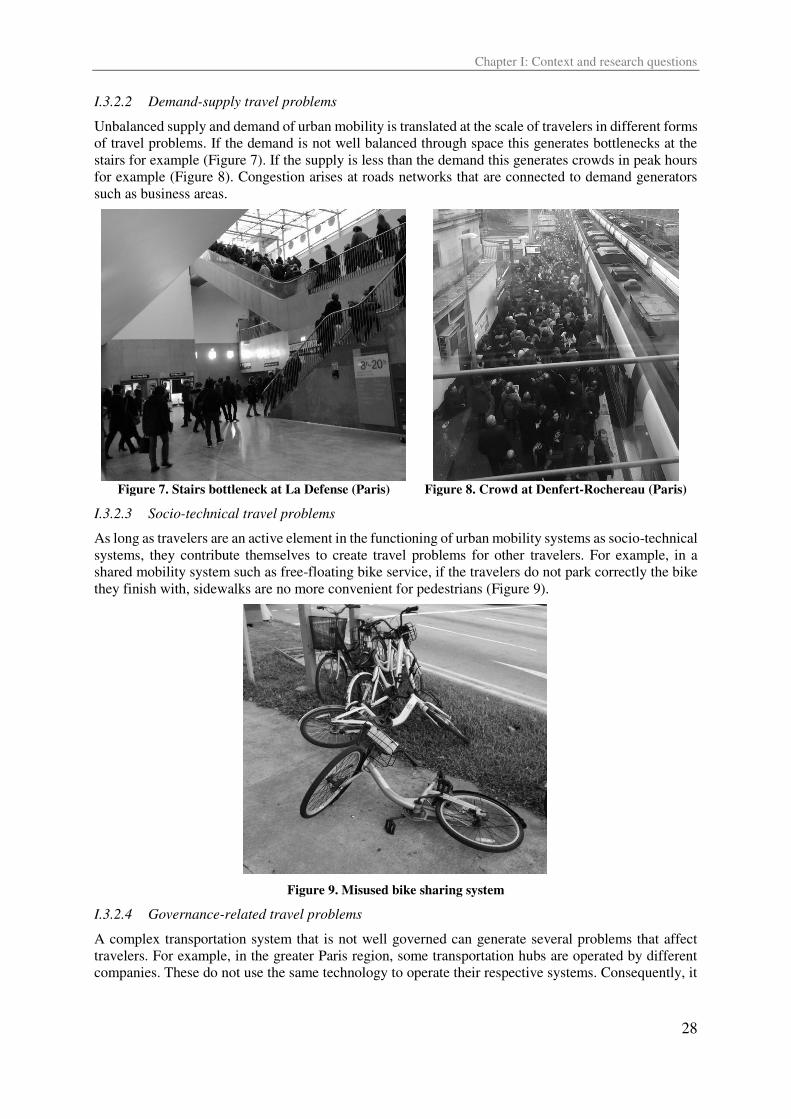
Chapter I: Context and research questions
28
I.3.2.2 Demand-supply travel problems
Unbalanced supply and demand of urban mobility is translated at the scale of travelers in different forms
of travel problems. If the demand is not well balanced through space this generates bottlenecks at the
stairs for example (Figure 7). If the supply is less than the demand this generates crowds in peak hours
for example (Figure 8). Congestion arises at roads networks that are connected to demand generators
such as business areas.
Figure 7. Stairs bottleneck at La Defense (Paris)
Figure 8. Crowd at Denfert-Rochereau (Paris)
I.3.2.3 Socio-technical travel problems
As long as travelers are an active element in the functioning of urban mobility systems as socio-technical
systems, they contribute themselves to create travel problems for other travelers. For example, in a
shared mobility system such as free-floating bike service, if the travelers do not park correctly the bike
they finish with, sidewalks are no more convenient for pedestrians (Figure 9).
Figure 9. Misused bike sharing system
I.3.2.4 Governance-related travel problems
A complex transportation system that is not well governed can generate several problems that affect
travelers. For example, in the greater Paris region, some transportation hubs are operated by different
companies. These do not use the same technology to operate their respective systems. Consequently, it
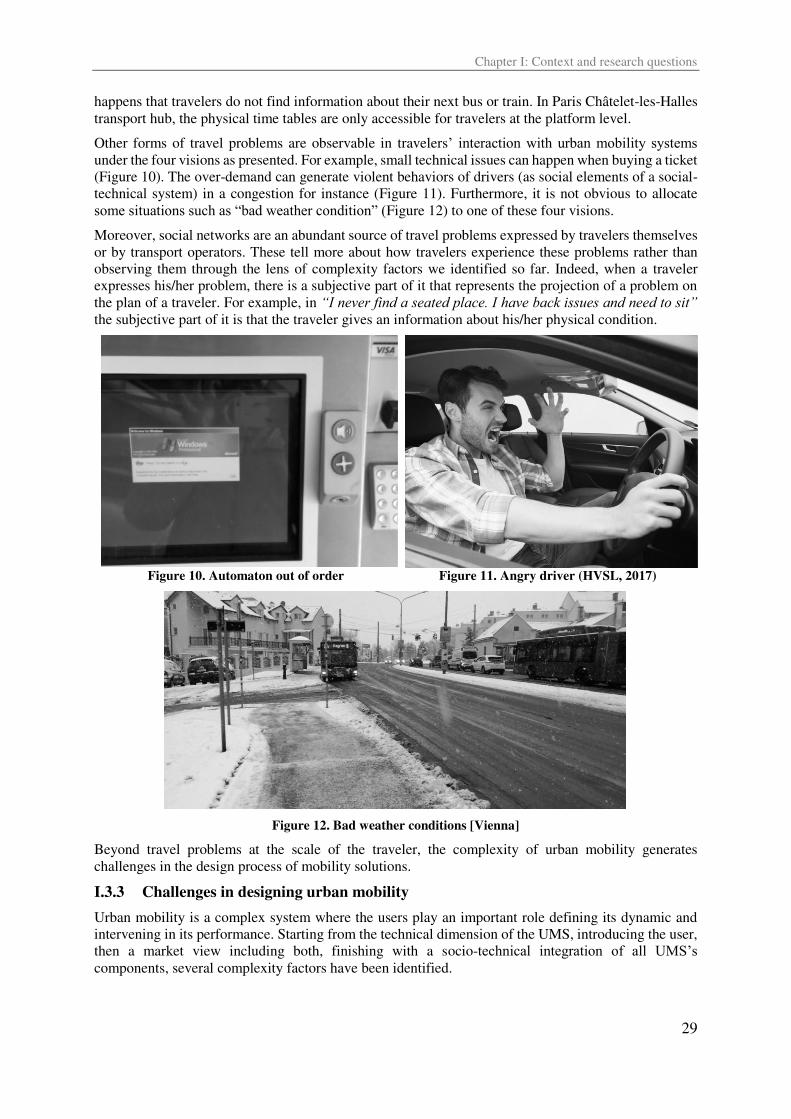
Chapter I: Context and research questions
29
happens that travelers do not find information about their next bus or train. In Paris Châtelet-les-Halles
transport hub, the physical time tables are only accessible for travelers at the platform level.
Other forms of travel problems are observable in travelers’ interaction with urban mobility systems under the four visions as presented. For example, small technical issues can happen when buying a ticket
(Figure 10). The over-demand can generate violent behaviors of drivers (as social elements of a social-
technical system) in a congestion for instance (Figure 11). Furthermore, it is not obvious to allocate
some situations such as “bad weather condition” (Figure 12) to one of these four visions.
Moreover, social networks are an abundant source of travel problems expressed by travelers themselves
or by transport operators. These tell more about how travelers experience these problems rather than
observing them through the lens of complexity factors we identified so far. Indeed, when a traveler
expresses his/her problem, there is a subjective part of it that represents the projection of a problem on
the plan of a traveler. For example, in “I never find a seated place. I have back issues and need to sit” the subjective part of it is that the traveler gives an information about his/her physical condition.
Figure 10. Automaton out of order Figure 11. Angry driver (HVSL, 2017)
Figure 12. Bad weather conditions [Vienna]
Beyond travel problems at the scale of the traveler, the complexity of urban mobility generates
challenges in the design process of mobility solutions.
I.3.3 Challenges in designing urban mobility
Urban mobility is a complex system where the users play an important role defining its dynamic and
intervening in its performance. Starting from the technical dimension of the UMS, introducing the user,
then a market view including both, finishing with a socio-technical integration of all UMS’s components, several complexity factors have been identified.
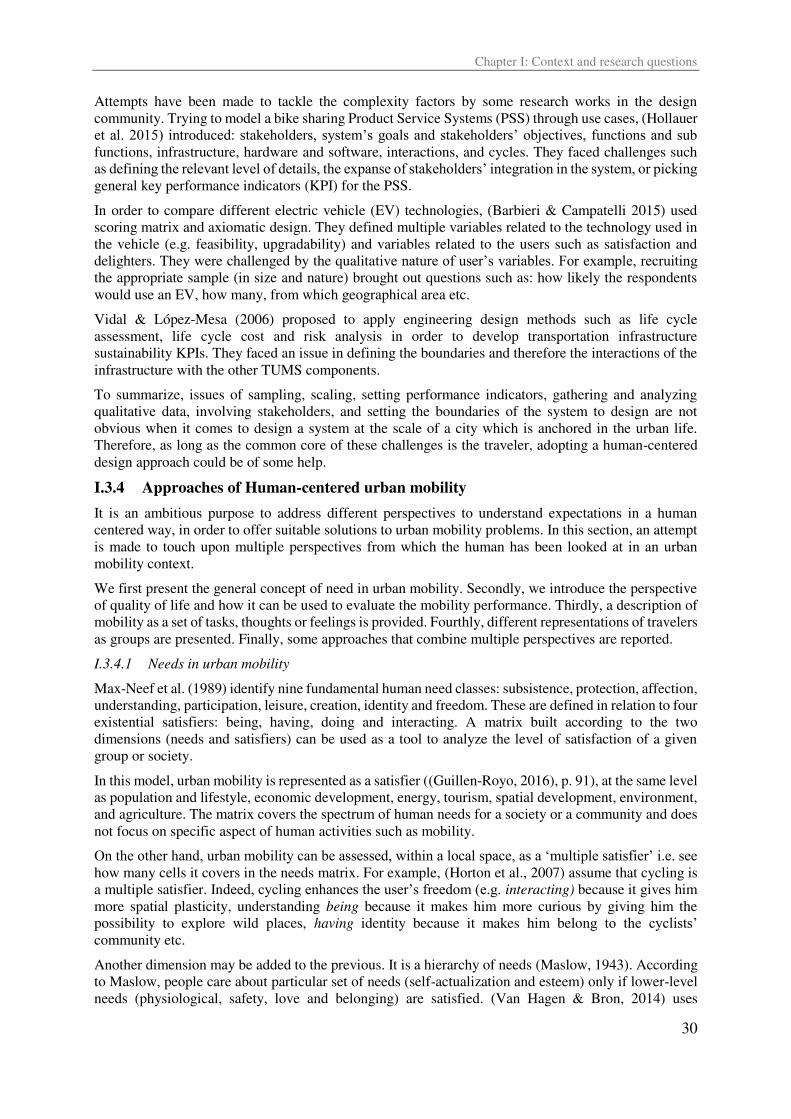
Chapter I: Context and research questions
30
Attempts have been made to tackle the complexity factors by some research works in the design
community. Trying to model a bike sharing Product Service Systems (PSS) through use cases, (Hollauer
et al. 2015) introduced: stakeholders, system’s goals and stakeholders’ objectives, functions and sub functions, infrastructure, hardware and software, interactions, and cycles. They faced challenges such
as defining the relevant level of details, the expanse of stakeholders’ integration in the system, or picking general key performance indicators (KPI) for the PSS.
In order to compare different electric vehicle (EV) technologies, (Barbieri & Campatelli 2015) used
scoring matrix and axiomatic design. They defined multiple variables related to the technology used in
the vehicle (e.g. feasibility, upgradability) and variables related to the users such as satisfaction and
delighters. They were challenged by the qualitative nature of user’s variables. For example, recruiting the appropriate sample (in size and nature) brought out questions such as: how likely the respondents
would use an EV, how many, from which geographical area etc.
Vidal & López-Mesa (2006) proposed to apply engineering design methods such as life cycle
assessment, life cycle cost and risk analysis in order to develop transportation infrastructure
sustainability KPIs. They faced an issue in defining the boundaries and therefore the interactions of the
infrastructure with the other TUMS components.
To summarize, issues of sampling, scaling, setting performance indicators, gathering and analyzing
qualitative data, involving stakeholders, and setting the boundaries of the system to design are not
obvious when it comes to design a system at the scale of a city which is anchored in the urban life.
Therefore, as long as the common core of these challenges is the traveler, adopting a human-centered
design approach could be of some help.
I.3.4 Approaches of Human-centered urban mobility
It is an ambitious purpose to address different perspectives to understand expectations in a human
centered way, in order to offer suitable solutions to urban mobility problems. In this section, an attempt
is made to touch upon multiple perspectives from which the human has been looked at in an urban
mobility context.
We first present the general concept of need in urban mobility. Secondly, we introduce the perspective
of quality of life and how it can be used to evaluate the mobility performance. Thirdly, a description of
mobility as a set of tasks, thoughts or feelings is provided. Fourthly, different representations of travelers
as groups are presented. Finally, some approaches that combine multiple perspectives are reported.
I.3.4.1 Needs in urban mobility
Max-Neef et al. (1989) identify nine fundamental human need classes: subsistence, protection, affection,
understanding, participation, leisure, creation, identity and freedom. These are defined in relation to four
existential satisfiers: being, having, doing and interacting. A matrix built according to the two
dimensions (needs and satisfiers) can be used as a tool to analyze the level of satisfaction of a given
group or society.
In this model, urban mobility is represented as a satisfier ((Guillen-Royo, 2016), p. 91), at the same level
as population and lifestyle, economic development, energy, tourism, spatial development, environment,
and agriculture. The matrix covers the spectrum of human needs for a society or a community and does
not focus on specific aspect of human activities such as mobility.
On the other hand, urban mobility can be assessed, within a local space, as a ‘multiple satisfier’ i.e. see how many cells it covers in the needs matrix. For example, (Horton et al., 2007) assume that cycling is
a multiple satisfier. Indeed, cycling enhances the user’s freedom (e.g. interacting) because it gives him
more spatial plasticity, understanding being because it makes him more curious by giving him the
possibility to explore wild places, having identity because it makes him belong to the cyclists’ community etc.
Another dimension may be added to the previous. It is a hierarchy of needs (Maslow, 1943). According
to Maslow, people care about particular set of needs (self-actualization and esteem) only if lower-level
needs (physiological, safety, love and belonging) are satisfied. (Van Hagen & Bron, 2014) uses
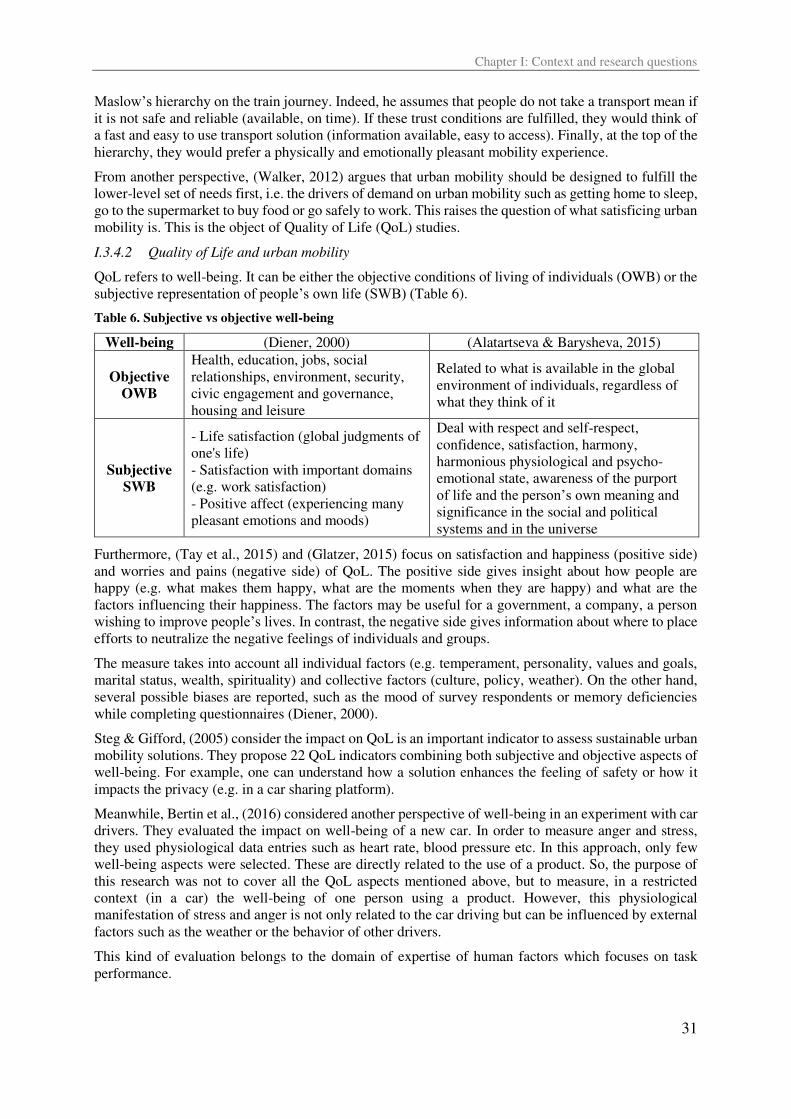
Chapter I: Context and research questions
31
Maslow’s hierarchy on the train journey. Indeed, he assumes that people do not take a transport mean if
it is not safe and reliable (available, on time). If these trust conditions are fulfilled, they would think of
a fast and easy to use transport solution (information available, easy to access). Finally, at the top of the
hierarchy, they would prefer a physically and emotionally pleasant mobility experience.
From another perspective, (Walker, 2012) argues that urban mobility should be designed to fulfill the
lower-level set of needs first, i.e. the drivers of demand on urban mobility such as getting home to sleep,
go to the supermarket to buy food or go safely to work. This raises the question of what satisficing urban
mobility is. This is the object of Quality of Life (QoL) studies.
I.3.4.2 Quality of Life and urban mobility
QoL refers to well-being. It can be either the objective conditions of living of individuals (OWB) or the
subjective representation of people’s own life (SWB) (Table 6).
Table 6. Subjective vs objective well-being
Well-being (Diener, 2000) (Alatartseva & Barysheva, 2015)
Objective OWB
Health, education, jobs, social
relationships, environment, security,
civic engagement and governance,
housing and leisure
Related to what is available in the global
environment of individuals, regardless of
what they think of it
Subjective SWB
- Life satisfaction (global judgments of
one's life)
- Satisfaction with important domains
(e.g. work satisfaction)
- Positive affect (experiencing many
pleasant emotions and moods)
Deal with respect and self-respect,
confidence, satisfaction, harmony,
harmonious physiological and psycho-
emotional state, awareness of the purport
of life and the person’s own meaning and significance in the social and political
systems and in the universe
Furthermore, (Tay et al., 2015) and (Glatzer, 2015) focus on satisfaction and happiness (positive side)
and worries and pains (negative side) of QoL. The positive side gives insight about how people are
happy (e.g. what makes them happy, what are the moments when they are happy) and what are the
factors influencing their happiness. The factors may be useful for a government, a company, a person
wishing to improve people’s lives. In contrast, the negative side gives information about where to place
efforts to neutralize the negative feelings of individuals and groups.
The measure takes into account all individual factors (e.g. temperament, personality, values and goals,
marital status, wealth, spirituality) and collective factors (culture, policy, weather). On the other hand,
several possible biases are reported, such as the mood of survey respondents or memory deficiencies
while completing questionnaires (Diener, 2000).
Steg & Gifford, (2005) consider the impact on QoL is an important indicator to assess sustainable urban
mobility solutions. They propose 22 QoL indicators combining both subjective and objective aspects of
well-being. For example, one can understand how a solution enhances the feeling of safety or how it
impacts the privacy (e.g. in a car sharing platform).
Meanwhile, Bertin et al., (2016) considered another perspective of well-being in an experiment with car
drivers. They evaluated the impact on well-being of a new car. In order to measure anger and stress,
they used physiological data entries such as heart rate, blood pressure etc. In this approach, only few
well-being aspects were selected. These are directly related to the use of a product. So, the purpose of
this research was not to cover all the QoL aspects mentioned above, but to measure, in a restricted
context (in a car) the well-being of one person using a product. However, this physiological
manifestation of stress and anger is not only related to the car driving but can be influenced by external
factors such as the weather or the behavior of other drivers.
This kind of evaluation belongs to the domain of expertise of human factors which focuses on task
performance.
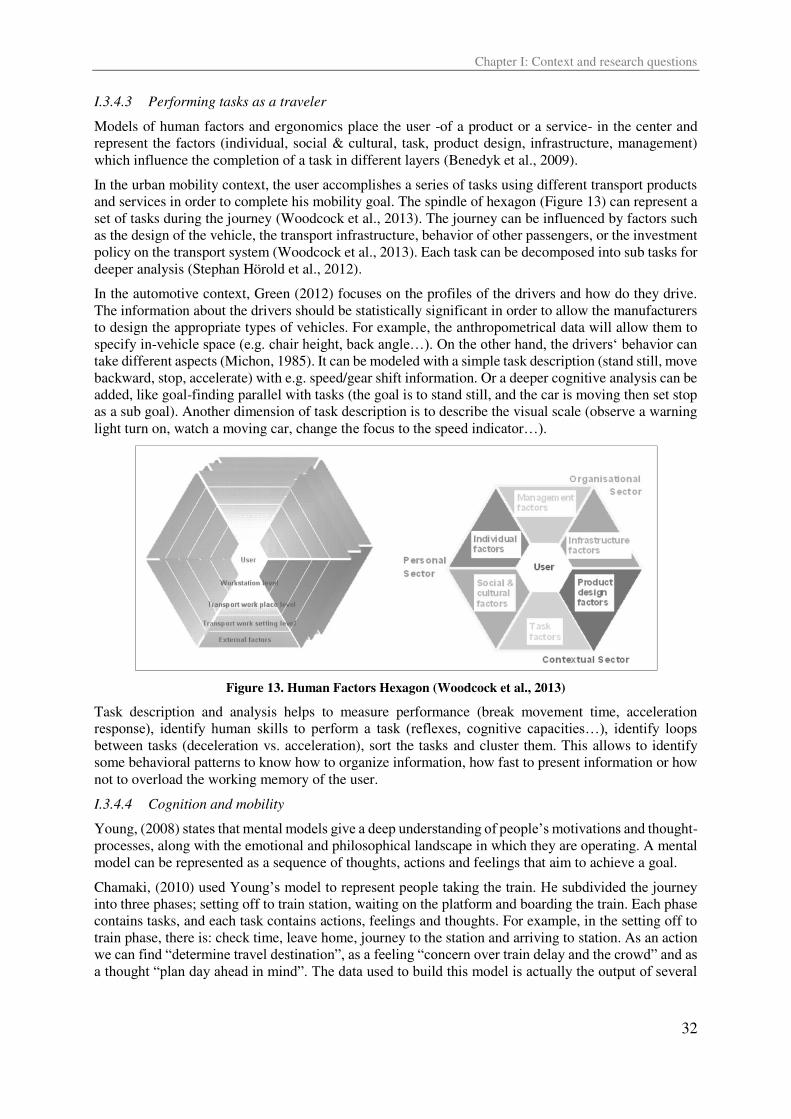
Chapter I: Context and research questions
32
I.3.4.3 Performing tasks as a traveler
Models of human factors and ergonomics place the user -of a product or a service- in the center and
represent the factors (individual, social & cultural, task, product design, infrastructure, management)
which influence the completion of a task in different layers (Benedyk et al., 2009).
In the urban mobility context, the user accomplishes a series of tasks using different transport products
and services in order to complete his mobility goal. The spindle of hexagon (Figure 13) can represent a
set of tasks during the journey (Woodcock et al., 2013). The journey can be influenced by factors such
as the design of the vehicle, the transport infrastructure, behavior of other passengers, or the investment
policy on the transport system (Woodcock et al., 2013). Each task can be decomposed into sub tasks for
deeper analysis (Stephan Hörold et al., 2012).
In the automotive context, Green (2012) focuses on the profiles of the drivers and how do they drive.
The information about the drivers should be statistically significant in order to allow the manufacturers
to design the appropriate types of vehicles. For example, the anthropometrical data will allow them to
specify in-vehicle space (e.g. chair height, back angle…). On the other hand, the drivers‘ behavior can take different aspects (Michon, 1985). It can be modeled with a simple task description (stand still, move
backward, stop, accelerate) with e.g. speed/gear shift information. Or a deeper cognitive analysis can be
added, like goal-finding parallel with tasks (the goal is to stand still, and the car is moving then set stop
as a sub goal). Another dimension of task description is to describe the visual scale (observe a warning
light turn on, watch a moving car, change the focus to the speed indicator…).
Figure 13. Human Factors Hexagon (Woodcock et al., 2013)
Task description and analysis helps to measure performance (break movement time, acceleration
response), identify human skills to perform a task (reflexes, cognitive capacities…), identify loops between tasks (deceleration vs. acceleration), sort the tasks and cluster them. This allows to identify
some behavioral patterns to know how to organize information, how fast to present information or how
not to overload the working memory of the user.
I.3.4.4 Cognition and mobility
Young, (2008) states that mental models give a deep understanding of people’s motivations and thought-processes, along with the emotional and philosophical landscape in which they are operating. A mental
model can be represented as a sequence of thoughts, actions and feelings that aim to achieve a goal.
Chamaki, (2010) used Young’s model to represent people taking the train. He subdivided the journey into three phases; setting off to train station, waiting on the platform and boarding the train. Each phase
contains tasks, and each task contains actions, feelings and thoughts. For example, in the setting off to
train phase, there is: check time, leave home, journey to the station and arriving to station. As an action
we can find “determine travel destination”, as a feeling “concern over train delay and the crowd” and as a thought “plan day ahead in mind”. The data used to build this model is actually the output of several
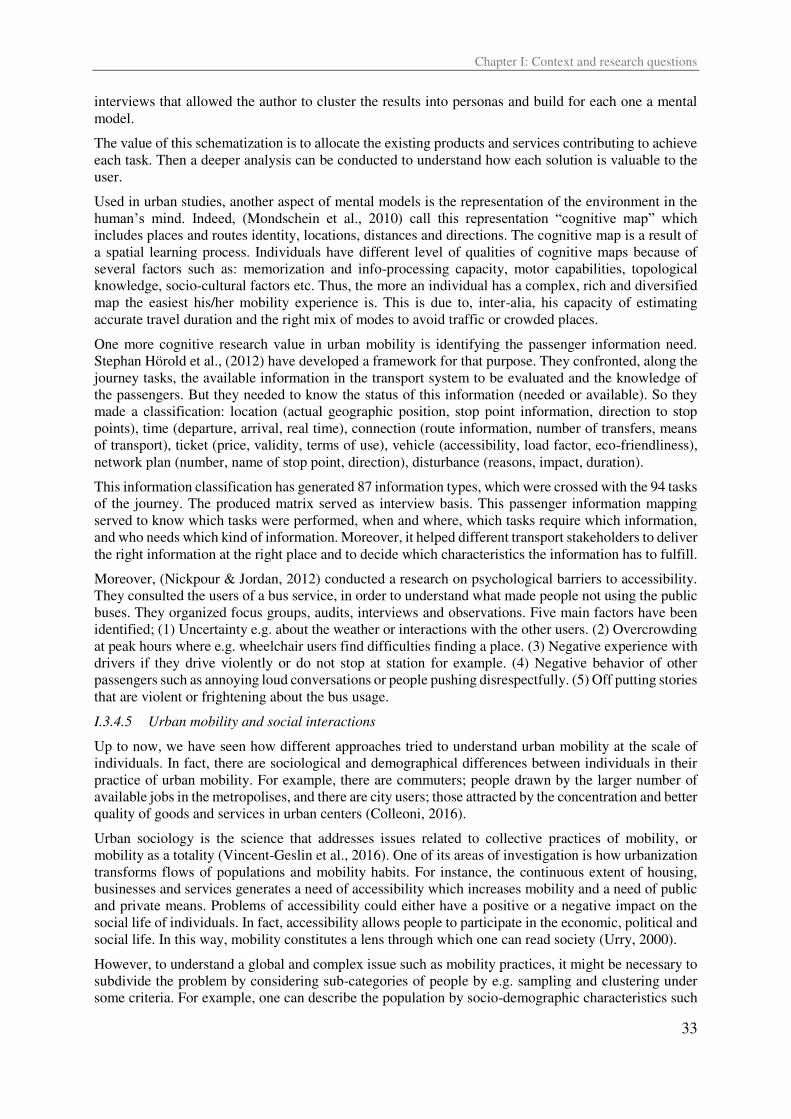
Chapter I: Context and research questions
33
interviews that allowed the author to cluster the results into personas and build for each one a mental
model.
The value of this schematization is to allocate the existing products and services contributing to achieve
each task. Then a deeper analysis can be conducted to understand how each solution is valuable to the
user.
Used in urban studies, another aspect of mental models is the representation of the environment in the
human’s mind. Indeed, (Mondschein et al., 2010) call this representation “cognitive map” which includes places and routes identity, locations, distances and directions. The cognitive map is a result of
a spatial learning process. Individuals have different level of qualities of cognitive maps because of
several factors such as: memorization and info-processing capacity, motor capabilities, topological
knowledge, socio-cultural factors etc. Thus, the more an individual has a complex, rich and diversified
map the easiest his/her mobility experience is. This is due to, inter-alia, his capacity of estimating
accurate travel duration and the right mix of modes to avoid traffic or crowded places.
One more cognitive research value in urban mobility is identifying the passenger information need.
Stephan Hörold et al., (2012) have developed a framework for that purpose. They confronted, along the
journey tasks, the available information in the transport system to be evaluated and the knowledge of
the passengers. But they needed to know the status of this information (needed or available). So they
made a classification: location (actual geographic position, stop point information, direction to stop
points), time (departure, arrival, real time), connection (route information, number of transfers, means
of transport), ticket (price, validity, terms of use), vehicle (accessibility, load factor, eco-friendliness),
network plan (number, name of stop point, direction), disturbance (reasons, impact, duration).
This information classification has generated 87 information types, which were crossed with the 94 tasks
of the journey. The produced matrix served as interview basis. This passenger information mapping
served to know which tasks were performed, when and where, which tasks require which information,
and who needs which kind of information. Moreover, it helped different transport stakeholders to deliver
the right information at the right place and to decide which characteristics the information has to fulfill.
Moreover, (Nickpour & Jordan, 2012) conducted a research on psychological barriers to accessibility.
They consulted the users of a bus service, in order to understand what made people not using the public
buses. They organized focus groups, audits, interviews and observations. Five main factors have been
identified; (1) Uncertainty e.g. about the weather or interactions with the other users. (2) Overcrowding
at peak hours where e.g. wheelchair users find difficulties finding a place. (3) Negative experience with
drivers if they drive violently or do not stop at station for example. (4) Negative behavior of other
passengers such as annoying loud conversations or people pushing disrespectfully. (5) Off putting stories
that are violent or frightening about the bus usage.
I.3.4.5 Urban mobility and social interactions
Up to now, we have seen how different approaches tried to understand urban mobility at the scale of
individuals. In fact, there are sociological and demographical differences between individuals in their
practice of urban mobility. For example, there are commuters; people drawn by the larger number of
available jobs in the metropolises, and there are city users; those attracted by the concentration and better
quality of goods and services in urban centers (Colleoni, 2016).
Urban sociology is the science that addresses issues related to collective practices of mobility, or
mobility as a totality (Vincent-Geslin et al., 2016). One of its areas of investigation is how urbanization
transforms flows of populations and mobility habits. For instance, the continuous extent of housing,
businesses and services generates a need of accessibility which increases mobility and a need of public
and private means. Problems of accessibility could either have a positive or a negative impact on the
social life of individuals. In fact, accessibility allows people to participate in the economic, political and
social life. In this way, mobility constitutes a lens through which one can read society (Urry, 2000).
However, to understand a global and complex issue such as mobility practices, it might be necessary to
subdivide the problem by considering sub-categories of people by e.g. sampling and clustering under
some criteria. For example, one can describe the population by socio-demographic characteristics such
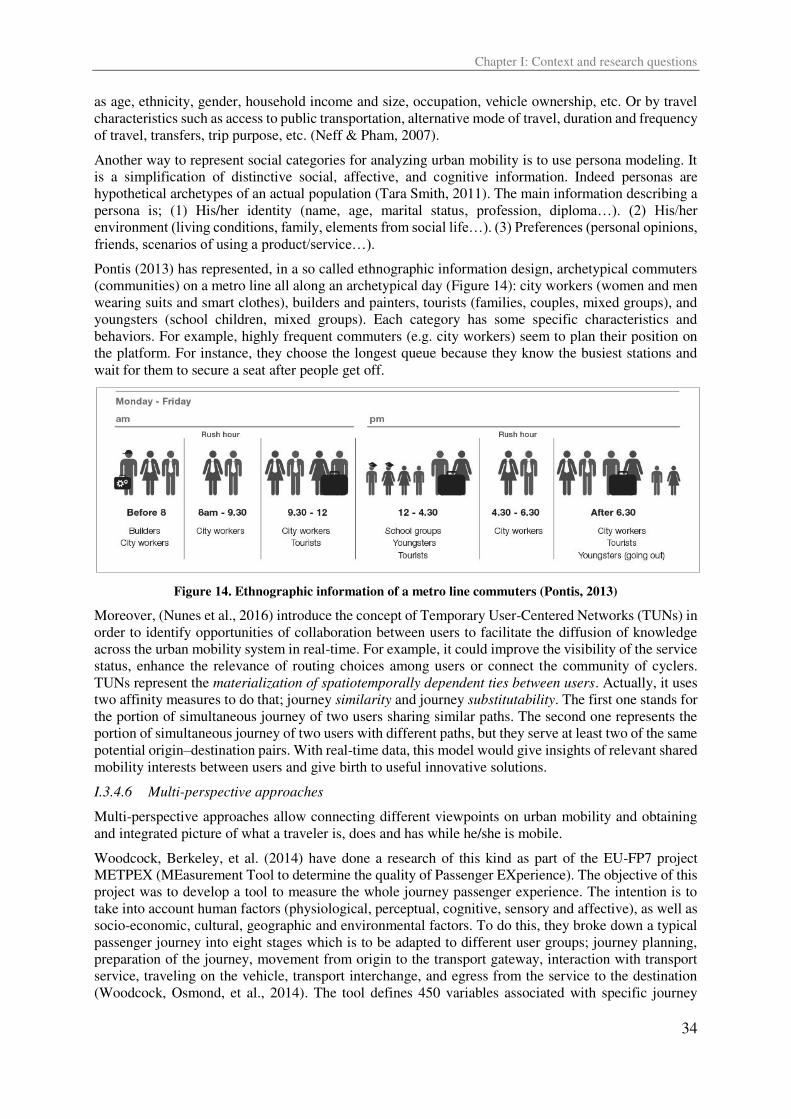
Chapter I: Context and research questions
34
as age, ethnicity, gender, household income and size, occupation, vehicle ownership, etc. Or by travel
characteristics such as access to public transportation, alternative mode of travel, duration and frequency
of travel, transfers, trip purpose, etc. (Neff & Pham, 2007).
Another way to represent social categories for analyzing urban mobility is to use persona modeling. It
is a simplification of distinctive social, affective, and cognitive information. Indeed personas are
hypothetical archetypes of an actual population (Tara Smith, 2011). The main information describing a
persona is; (1) His/her identity (name, age, marital status, profession, diploma…). (2) His/her environment (living conditions, family, elements from social life…). (3) Preferences (personal opinions, friends, scenarios of using a product/service…). Pontis (2013) has represented, in a so called ethnographic information design, archetypical commuters
(communities) on a metro line all along an archetypical day (Figure 14): city workers (women and men
wearing suits and smart clothes), builders and painters, tourists (families, couples, mixed groups), and
youngsters (school children, mixed groups). Each category has some specific characteristics and
behaviors. For example, highly frequent commuters (e.g. city workers) seem to plan their position on
the platform. For instance, they choose the longest queue because they know the busiest stations and
wait for them to secure a seat after people get off.
Figure 14. Ethnographic information of a metro line commuters (Pontis, 2013)
Moreover, (Nunes et al., 2016) introduce the concept of Temporary User-Centered Networks (TUNs) in
order to identify opportunities of collaboration between users to facilitate the diffusion of knowledge
across the urban mobility system in real-time. For example, it could improve the visibility of the service
status, enhance the relevance of routing choices among users or connect the community of cyclers.
TUNs represent the materialization of spatiotemporally dependent ties between users. Actually, it uses
two affinity measures to do that; journey similarity and journey substitutability. The first one stands for
the portion of simultaneous journey of two users sharing similar paths. The second one represents the
portion of simultaneous journey of two users with different paths, but they serve at least two of the same
potential origin–destination pairs. With real-time data, this model would give insights of relevant shared
mobility interests between users and give birth to useful innovative solutions.
I.3.4.6 Multi-perspective approaches
Multi-perspective approaches allow connecting different viewpoints on urban mobility and obtaining
and integrated picture of what a traveler is, does and has while he/she is mobile.
Woodcock, Berkeley, et al. (2014) have done a research of this kind as part of the EU-FP7 project
METPEX (MEasurement Tool to determine the quality of Passenger EXperience). The objective of this
project was to develop a tool to measure the whole journey passenger experience. The intention is to
take into account human factors (physiological, perceptual, cognitive, sensory and affective), as well as
socio-economic, cultural, geographic and environmental factors. To do this, they broke down a typical
passenger journey into eight stages which is to be adapted to different user groups; journey planning,
preparation of the journey, movement from origin to the transport gateway, interaction with transport
service, traveling on the vehicle, transport interchange, and egress from the service to the destination
(Woodcock, Osmond, et al., 2014). The tool defines 450 variables associated with specific journey
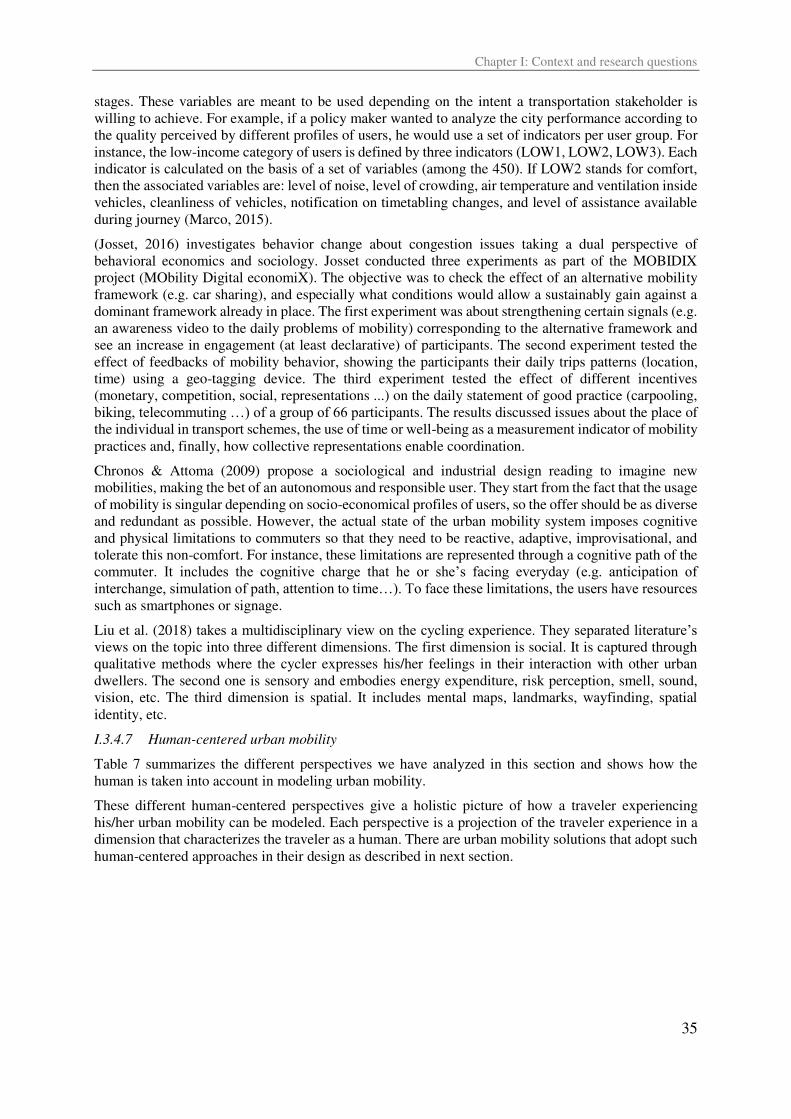
Chapter I: Context and research questions
35
stages. These variables are meant to be used depending on the intent a transportation stakeholder is
willing to achieve. For example, if a policy maker wanted to analyze the city performance according to
the quality perceived by different profiles of users, he would use a set of indicators per user group. For
instance, the low-income category of users is defined by three indicators (LOW1, LOW2, LOW3). Each
indicator is calculated on the basis of a set of variables (among the 450). If LOW2 stands for comfort,
then the associated variables are: level of noise, level of crowding, air temperature and ventilation inside
vehicles, cleanliness of vehicles, notification on timetabling changes, and level of assistance available
during journey (Marco, 2015).
(Josset, 2016) investigates behavior change about congestion issues taking a dual perspective of
behavioral economics and sociology. Josset conducted three experiments as part of the MOBIDIX
project (MObility Digital economiX). The objective was to check the effect of an alternative mobility
framework (e.g. car sharing), and especially what conditions would allow a sustainably gain against a
dominant framework already in place. The first experiment was about strengthening certain signals (e.g.
an awareness video to the daily problems of mobility) corresponding to the alternative framework and
see an increase in engagement (at least declarative) of participants. The second experiment tested the
effect of feedbacks of mobility behavior, showing the participants their daily trips patterns (location,
time) using a geo-tagging device. The third experiment tested the effect of different incentives
(monetary, competition, social, representations ...) on the daily statement of good practice (carpooling,
biking, telecommuting …) of a group of 66 participants. The results discussed issues about the place of
the individual in transport schemes, the use of time or well-being as a measurement indicator of mobility
practices and, finally, how collective representations enable coordination.
Chronos & Attoma (2009) propose a sociological and industrial design reading to imagine new
mobilities, making the bet of an autonomous and responsible user. They start from the fact that the usage
of mobility is singular depending on socio-economical profiles of users, so the offer should be as diverse
and redundant as possible. However, the actual state of the urban mobility system imposes cognitive
and physical limitations to commuters so that they need to be reactive, adaptive, improvisational, and
tolerate this non-comfort. For instance, these limitations are represented through a cognitive path of the
commuter. It includes the cognitive charge that he or she’s facing everyday (e.g. anticipation of interchange, simulation of path, attention to time…). To face these limitations, the users have resources such as smartphones or signage.
Liu et al. (2018) takes a multidisciplinary view on the cycling experience. They separated literature’s views on the topic into three different dimensions. The first dimension is social. It is captured through
qualitative methods where the cycler expresses his/her feelings in their interaction with other urban
dwellers. The second one is sensory and embodies energy expenditure, risk perception, smell, sound,
vision, etc. The third dimension is spatial. It includes mental maps, landmarks, wayfinding, spatial
identity, etc.
I.3.4.7 Human-centered urban mobility
Table 7 summarizes the different perspectives we have analyzed in this section and shows how the
human is taken into account in modeling urban mobility.
These different human-centered perspectives give a holistic picture of how a traveler experiencing
his/her urban mobility can be modeled. Each perspective is a projection of the traveler experience in a
dimension that characterizes the traveler as a human. There are urban mobility solutions that adopt such
human-centered approaches in their design as described in next section.
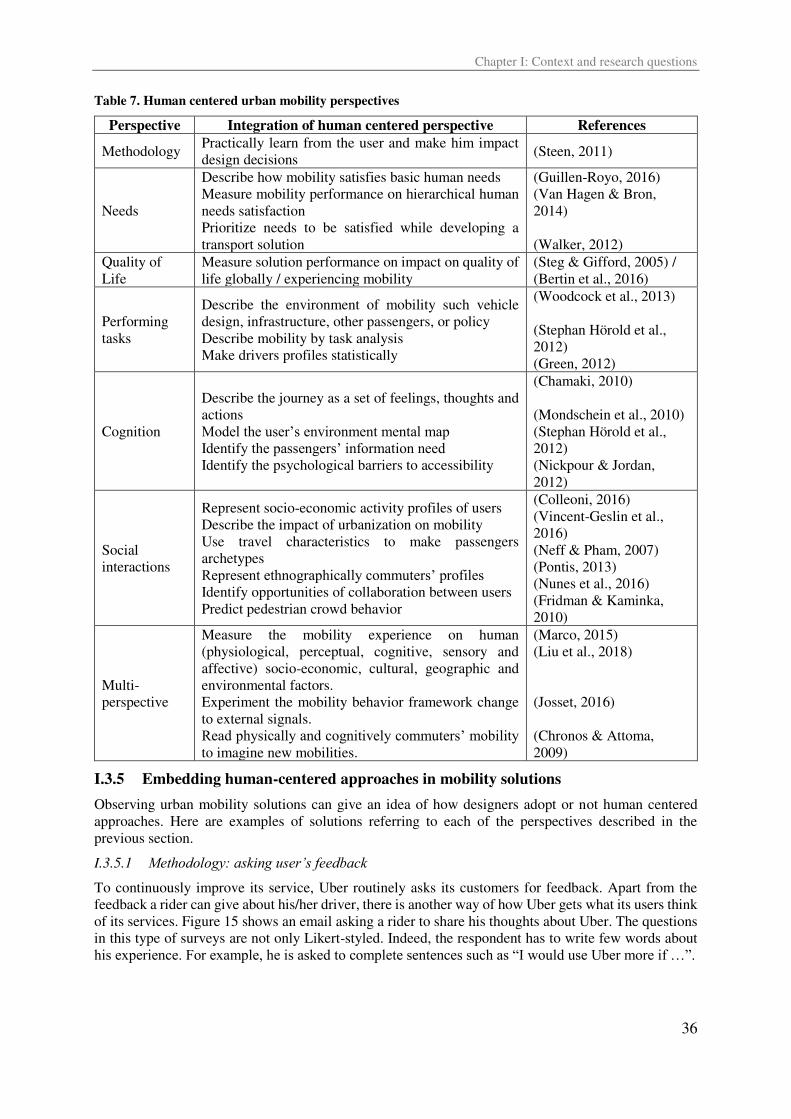
Chapter I: Context and research questions
36
Table 7. Human centered urban mobility perspectives
Perspective Integration of human centered perspective References
Methodology Practically learn from the user and make him impact
design decisions (Steen, 2011)
Needs
Describe how mobility satisfies basic human needs
Measure mobility performance on hierarchical human
needs satisfaction
Prioritize needs to be satisfied while developing a
transport solution
(Guillen-Royo, 2016)
(Van Hagen & Bron,
2014)
(Walker, 2012)
Quality of
Life
Measure solution performance on impact on quality of
life globally / experiencing mobility
(Steg & Gifford, 2005) /
(Bertin et al., 2016)
Performing
tasks
Describe the environment of mobility such vehicle
design, infrastructure, other passengers, or policy
Describe mobility by task analysis
Make drivers profiles statistically
(Woodcock et al., 2013)
(Stephan Hörold et al.,
2012)
(Green, 2012)
Cognition
Describe the journey as a set of feelings, thoughts and
actions
Model the user’s environment mental map
Identify the passengers’ information need
Identify the psychological barriers to accessibility
(Chamaki, 2010)
(Mondschein et al., 2010)
(Stephan Hörold et al.,
2012)
(Nickpour & Jordan,
2012)
Social
interactions
Represent socio-economic activity profiles of users
Describe the impact of urbanization on mobility
Use travel characteristics to make passengers
archetypes
Represent ethnographically commuters’ profiles
Identify opportunities of collaboration between users
Predict pedestrian crowd behavior
(Colleoni, 2016)
(Vincent-Geslin et al.,
2016)
(Neff & Pham, 2007)
(Pontis, 2013)
(Nunes et al., 2016)
(Fridman & Kaminka,
2010)
Multi-
perspective
Measure the mobility experience on human
(physiological, perceptual, cognitive, sensory and
affective) socio-economic, cultural, geographic and
environmental factors.
Experiment the mobility behavior framework change
to external signals.
Read physically and cognitively commuters’ mobility to imagine new mobilities.
(Marco, 2015)
(Liu et al., 2018)
(Josset, 2016)
(Chronos & Attoma,
2009)
I.3.5 Embedding human-centered approaches in mobility solutions
Observing urban mobility solutions can give an idea of how designers adopt or not human centered
approaches. Here are examples of solutions referring to each of the perspectives described in the
previous section.
I.3.5.1 Methodology: asking user’s feedback
To continuously improve its service, Uber routinely asks its customers for feedback. Apart from the
feedback a rider can give about his/her driver, there is another way of how Uber gets what its users think
of its services. Figure 15 shows an email asking a rider to share his thoughts about Uber. The questions
in this type of surveys are not only Likert-styled. Indeed, the respondent has to write few words about
his experience. For example, he is asked to complete sentences such as “I would use Uber more if …”.
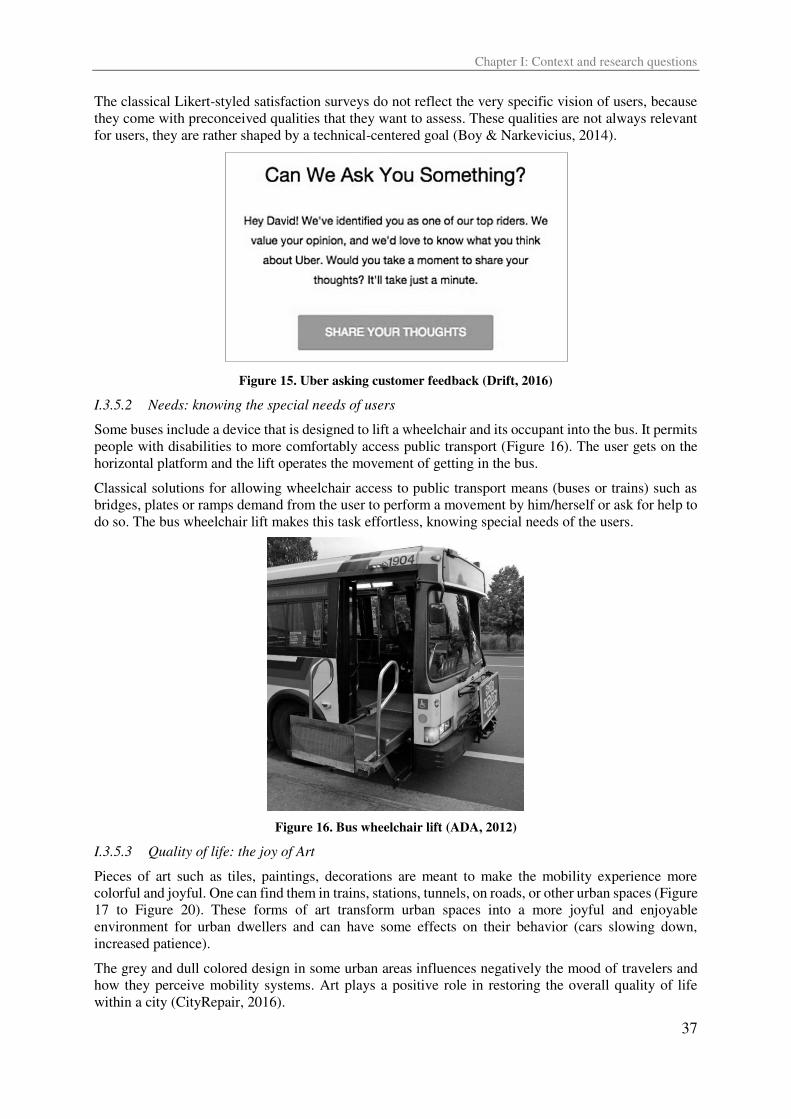
Chapter I: Context and research questions
37
The classical Likert-styled satisfaction surveys do not reflect the very specific vision of users, because
they come with preconceived qualities that they want to assess. These qualities are not always relevant
for users, they are rather shaped by a technical-centered goal (Boy & Narkevicius, 2014).
Figure 15. Uber asking customer feedback (Drift, 2016)
I.3.5.2 Needs: knowing the special needs of users
Some buses include a device that is designed to lift a wheelchair and its occupant into the bus. It permits
people with disabilities to more comfortably access public transport (Figure 16). The user gets on the
horizontal platform and the lift operates the movement of getting in the bus.
Classical solutions for allowing wheelchair access to public transport means (buses or trains) such as
bridges, plates or ramps demand from the user to perform a movement by him/herself or ask for help to
do so. The bus wheelchair lift makes this task effortless, knowing special needs of the users.
Figure 16. Bus wheelchair lift (ADA, 2012)
I.3.5.3 Quality of life: the joy of Art
Pieces of art such as tiles, paintings, decorations are meant to make the mobility experience more
colorful and joyful. One can find them in trains, stations, tunnels, on roads, or other urban spaces (Figure
17 to Figure 20). These forms of art transform urban spaces into a more joyful and enjoyable
environment for urban dwellers and can have some effects on their behavior (cars slowing down,
increased patience).
The grey and dull colored design in some urban areas influences negatively the mood of travelers and
how they perceive mobility systems. Art plays a positive role in restoring the overall quality of life
within a city (CityRepair, 2016).
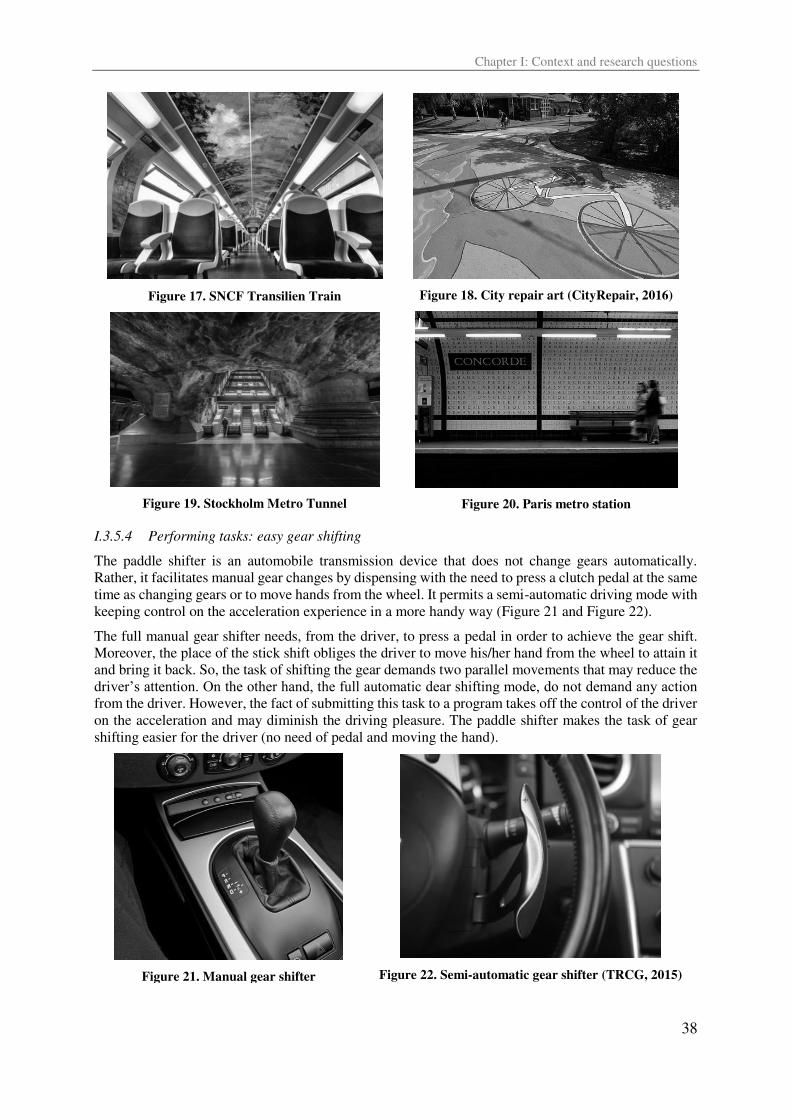
Chapter I: Context and research questions
38
Figure 17. SNCF Transilien Train
Figure 18. City repair art (CityRepair, 2016)
Figure 19. Stockholm Metro Tunnel
Figure 20. Paris metro station
I.3.5.4 Performing tasks: easy gear shifting
The paddle shifter is an automobile transmission device that does not change gears automatically.
Rather, it facilitates manual gear changes by dispensing with the need to press a clutch pedal at the same
time as changing gears or to move hands from the wheel. It permits a semi-automatic driving mode with
keeping control on the acceleration experience in a more handy way (Figure 21 and Figure 22).
The full manual gear shifter needs, from the driver, to press a pedal in order to achieve the gear shift.
Moreover, the place of the stick shift obliges the driver to move his/her hand from the wheel to attain it
and bring it back. So, the task of shifting the gear demands two parallel movements that may reduce the
driver’s attention. On the other hand, the full automatic dear shifting mode, do not demand any action from the driver. However, the fact of submitting this task to a program takes off the control of the driver
on the acceleration and may diminish the driving pleasure. The paddle shifter makes the task of gear
shifting easier for the driver (no need of pedal and moving the hand).
Figure 21. Manual gear shifter
Figure 22. Semi-automatic gear shifter (TRCG, 2015)
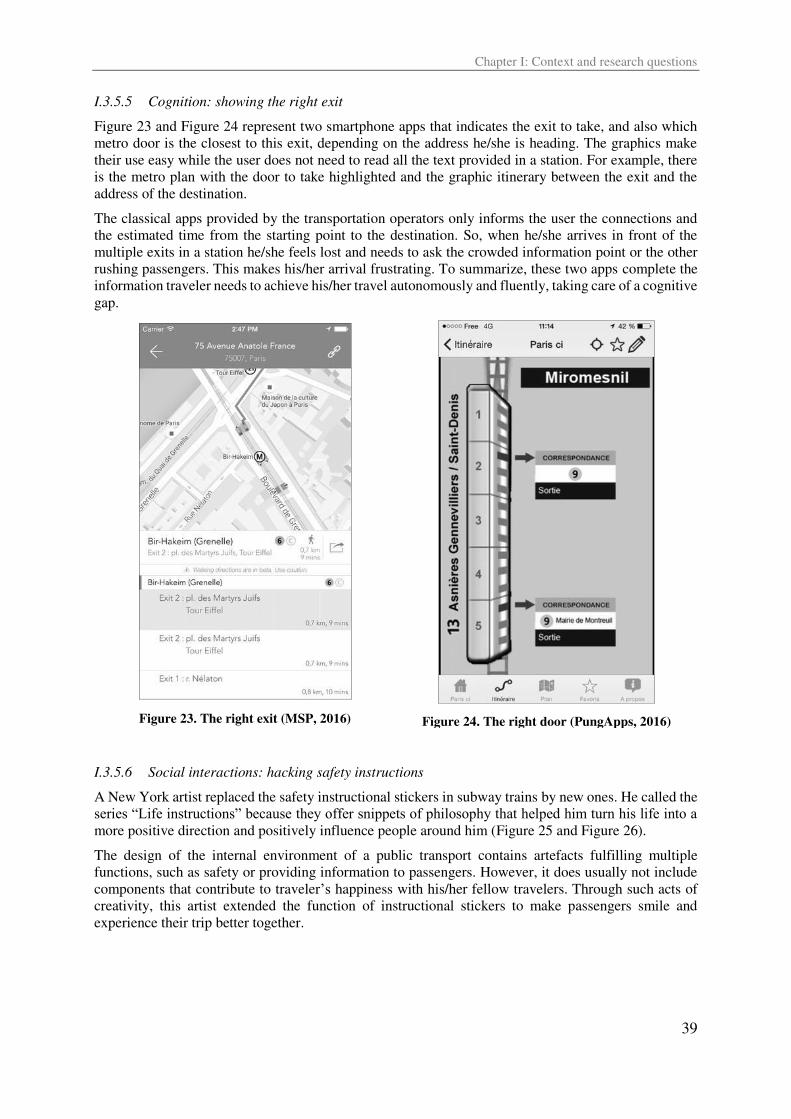
Chapter I: Context and research questions
39
I.3.5.5 Cognition: showing the right exit
Figure 23 and Figure 24 represent two smartphone apps that indicates the exit to take, and also which
metro door is the closest to this exit, depending on the address he/she is heading. The graphics make
their use easy while the user does not need to read all the text provided in a station. For example, there
is the metro plan with the door to take highlighted and the graphic itinerary between the exit and the
address of the destination.
The classical apps provided by the transportation operators only informs the user the connections and
the estimated time from the starting point to the destination. So, when he/she arrives in front of the
multiple exits in a station he/she feels lost and needs to ask the crowded information point or the other
rushing passengers. This makes his/her arrival frustrating. To summarize, these two apps complete the
information traveler needs to achieve his/her travel autonomously and fluently, taking care of a cognitive
gap.
Figure 23. The right exit (MSP, 2016)
Figure 24. The right door (PungApps, 2016)
I.3.5.6 Social interactions: hacking safety instructions
A New York artist replaced the safety instructional stickers in subway trains by new ones. He called the
series “Life instructions” because they offer snippets of philosophy that helped him turn his life into a more positive direction and positively influence people around him (Figure 25 and Figure 26).
The design of the internal environment of a public transport contains artefacts fulfilling multiple
functions, such as safety or providing information to passengers. However, it does usually not include
components that contribute to traveler’s happiness with his/her fellow travelers. Through such acts of
creativity, this artist extended the function of instructional stickers to make passengers smile and
experience their trip better together.
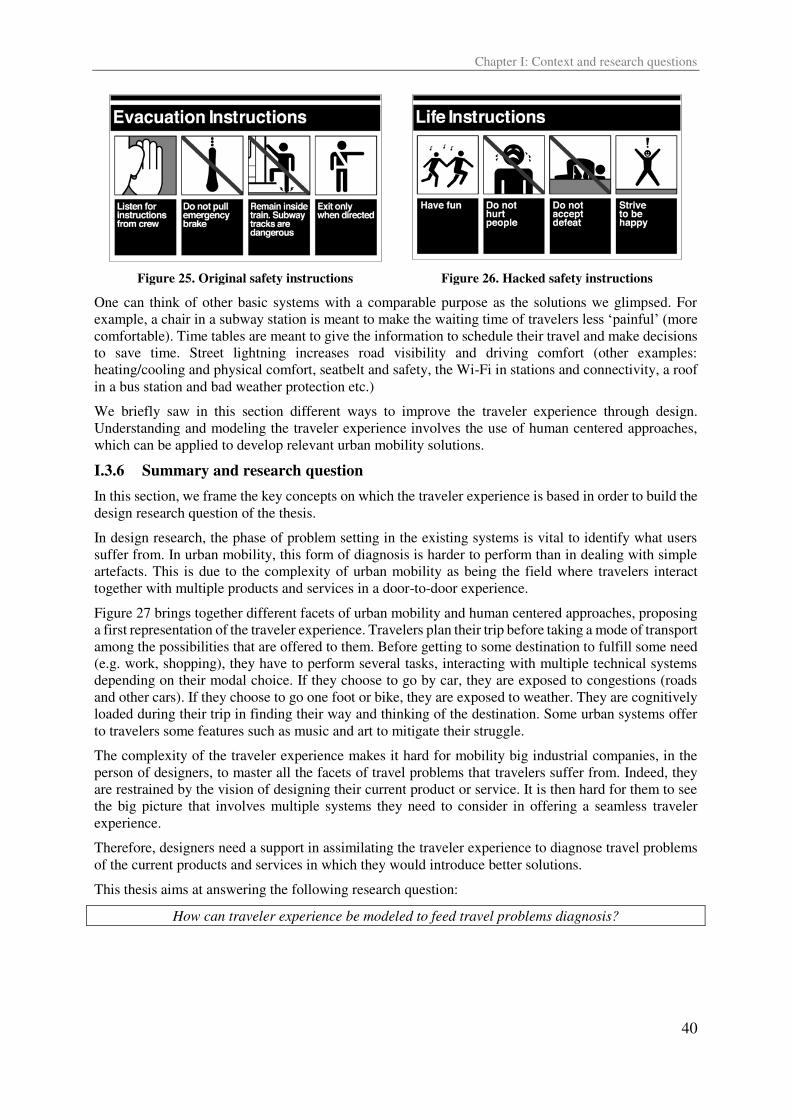
Chapter I: Context and research questions
40
Figure 25. Original safety instructions
Figure 26. Hacked safety instructions
One can think of other basic systems with a comparable purpose as the solutions we glimpsed. For
example, a chair in a subway station is meant to make the waiting time of travelers less ‘painful’ (more comfortable). Time tables are meant to give the information to schedule their travel and make decisions
to save time. Street lightning increases road visibility and driving comfort (other examples:
heating/cooling and physical comfort, seatbelt and safety, the Wi-Fi in stations and connectivity, a roof
in a bus station and bad weather protection etc.)
We briefly saw in this section different ways to improve the traveler experience through design.
Understanding and modeling the traveler experience involves the use of human centered approaches,
which can be applied to develop relevant urban mobility solutions.
I.3.6 Summary and research question
In this section, we frame the key concepts on which the traveler experience is based in order to build the
design research question of the thesis.
In design research, the phase of problem setting in the existing systems is vital to identify what users
suffer from. In urban mobility, this form of diagnosis is harder to perform than in dealing with simple
artefacts. This is due to the complexity of urban mobility as being the field where travelers interact
together with multiple products and services in a door-to-door experience.
Figure 27 brings together different facets of urban mobility and human centered approaches, proposing
a first representation of the traveler experience. Travelers plan their trip before taking a mode of transport
among the possibilities that are offered to them. Before getting to some destination to fulfill some need
(e.g. work, shopping), they have to perform several tasks, interacting with multiple technical systems
depending on their modal choice. If they choose to go by car, they are exposed to congestions (roads
and other cars). If they choose to go one foot or bike, they are exposed to weather. They are cognitively
loaded during their trip in finding their way and thinking of the destination. Some urban systems offer
to travelers some features such as music and art to mitigate their struggle.
The complexity of the traveler experience makes it hard for mobility big industrial companies, in the
person of designers, to master all the facets of travel problems that travelers suffer from. Indeed, they
are restrained by the vision of designing their current product or service. It is then hard for them to see
the big picture that involves multiple systems they need to consider in offering a seamless traveler
experience.
Therefore, designers need a support in assimilating the traveler experience to diagnose travel problems
of the current products and services in which they would introduce better solutions.
This thesis aims at answering the following research question:
How can traveler experience be modeled to feed travel problems diagnosis?
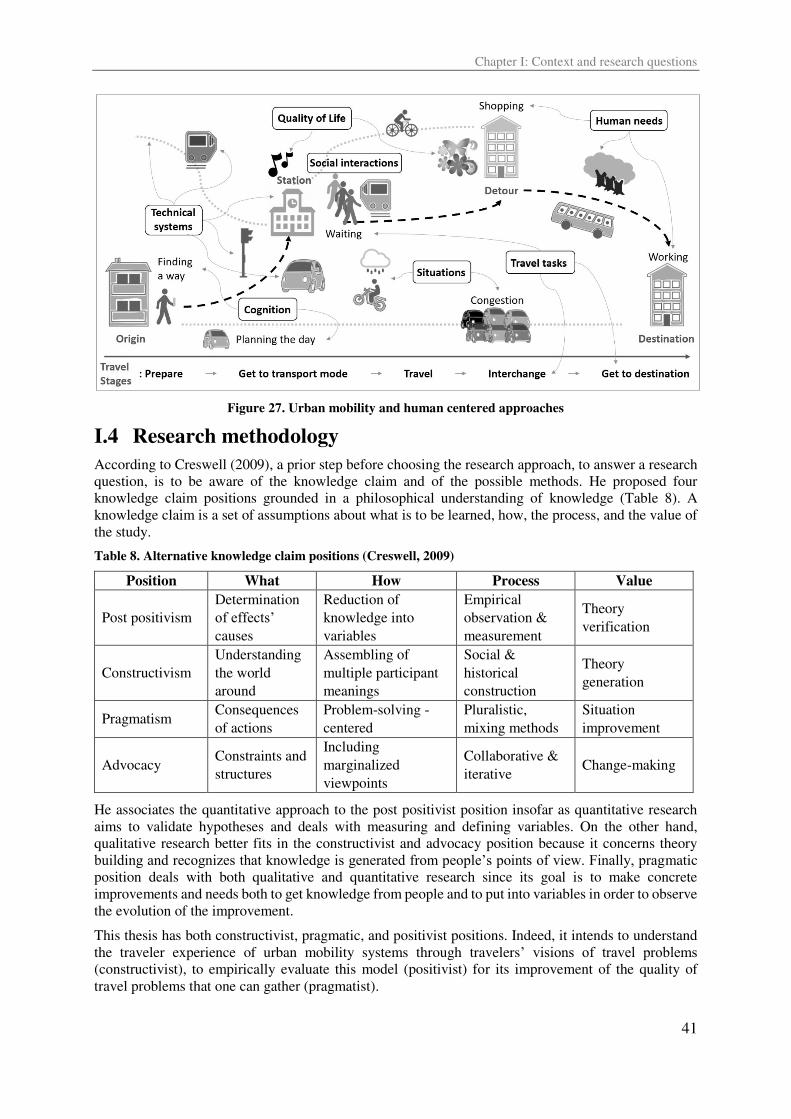
Chapter I: Context and research questions
41
Figure 27. Urban mobility and human centered approaches
I.4 Research methodology
According to Creswell (2009), a prior step before choosing the research approach, to answer a research
question, is to be aware of the knowledge claim and of the possible methods. He proposed four
knowledge claim positions grounded in a philosophical understanding of knowledge (Table 8). A
knowledge claim is a set of assumptions about what is to be learned, how, the process, and the value of
the study.
Table 8. Alternative knowledge claim positions (Creswell, 2009)
Position What How Process Value
Post positivism
Determination
of effects’ causes
Reduction of
knowledge into
variables
Empirical
observation &
measurement
Theory
verification
Constructivism
Understanding
the world
around
Assembling of
multiple participant
meanings
Social &
historical
construction
Theory
generation
Pragmatism Consequences
of actions
Problem-solving -
centered
Pluralistic,
mixing methods
Situation
improvement
Advocacy Constraints and
structures
Including
marginalized
viewpoints
Collaborative &
iterative Change-making
He associates the quantitative approach to the post positivist position insofar as quantitative research
aims to validate hypotheses and deals with measuring and defining variables. On the other hand,
qualitative research better fits in the constructivist and advocacy position because it concerns theory
building and recognizes that knowledge is generated from people’s points of view. Finally, pragmatic
position deals with both qualitative and quantitative research since its goal is to make concrete
improvements and needs both to get knowledge from people and to put into variables in order to observe
the evolution of the improvement.
This thesis has both constructivist, pragmatic, and positivist positions. Indeed, it intends to understand
the traveler experience of urban mobility systems through travelers’ visions of travel problems (constructivist), to empirically evaluate this model (positivist) for its improvement of the quality of
travel problems that one can gather (pragmatist).
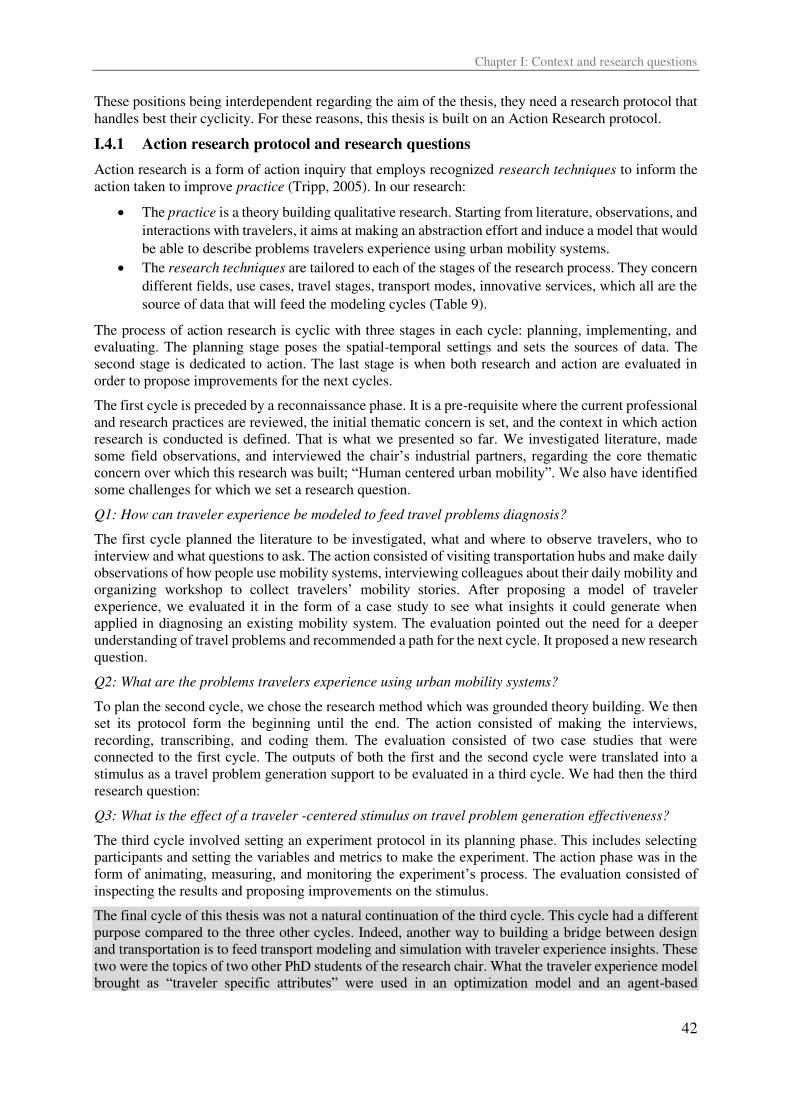
Chapter I: Context and research questions
42
These positions being interdependent regarding the aim of the thesis, they need a research protocol that
handles best their cyclicity. For these reasons, this thesis is built on an Action Research protocol.
I.4.1 Action research protocol and research questions
Action research is a form of action inquiry that employs recognized research techniques to inform the
action taken to improve practice (Tripp, 2005). In our research:
• The practice is a theory building qualitative research. Starting from literature, observations, and
interactions with travelers, it aims at making an abstraction effort and induce a model that would
be able to describe problems travelers experience using urban mobility systems.
• The research techniques are tailored to each of the stages of the research process. They concern
different fields, use cases, travel stages, transport modes, innovative services, which all are the
source of data that will feed the modeling cycles (Table 9).
The process of action research is cyclic with three stages in each cycle: planning, implementing, and
evaluating. The planning stage poses the spatial-temporal settings and sets the sources of data. The
second stage is dedicated to action. The last stage is when both research and action are evaluated in
order to propose improvements for the next cycles.
The first cycle is preceded by a reconnaissance phase. It is a pre-requisite where the current professional
and research practices are reviewed, the initial thematic concern is set, and the context in which action
research is conducted is defined. That is what we presented so far. We investigated literature, made
some field observations, and interviewed the chair’s industrial partners, regarding the core thematic concern over which this research was built; “Human centered urban mobility”. We also have identified some challenges for which we set a research question.
Q1: How can traveler experience be modeled to feed travel problems diagnosis?
The first cycle planned the literature to be investigated, what and where to observe travelers, who to
interview and what questions to ask. The action consisted of visiting transportation hubs and make daily
observations of how people use mobility systems, interviewing colleagues about their daily mobility and
organizing workshop to collect travelers’ mobility stories. After proposing a model of traveler
experience, we evaluated it in the form of a case study to see what insights it could generate when
applied in diagnosing an existing mobility system. The evaluation pointed out the need for a deeper
understanding of travel problems and recommended a path for the next cycle. It proposed a new research
question.
Q2: What are the problems travelers experience using urban mobility systems?
To plan the second cycle, we chose the research method which was grounded theory building. We then
set its protocol form the beginning until the end. The action consisted of making the interviews,
recording, transcribing, and coding them. The evaluation consisted of two case studies that were
connected to the first cycle. The outputs of both the first and the second cycle were translated into a
stimulus as a travel problem generation support to be evaluated in a third cycle. We had then the third
research question:
Q3: What is the effect of a traveler -centered stimulus on travel problem generation effectiveness?
The third cycle involved setting an experiment protocol in its planning phase. This includes selecting
participants and setting the variables and metrics to make the experiment. The action phase was in the
form of animating, measuring, and monitoring the experiment’s process. The evaluation consisted of inspecting the results and proposing improvements on the stimulus.
The final cycle of this thesis was not a natural continuation of the third cycle. This cycle had a different
purpose compared to the three other cycles. Indeed, another way to building a bridge between design
and transportation is to feed transport modeling and simulation with traveler experience insights. These
two were the topics of two other PhD students of the research chair. What the traveler experience model
brought as “traveler specific attributes” were used in an optimization model and an agent-based
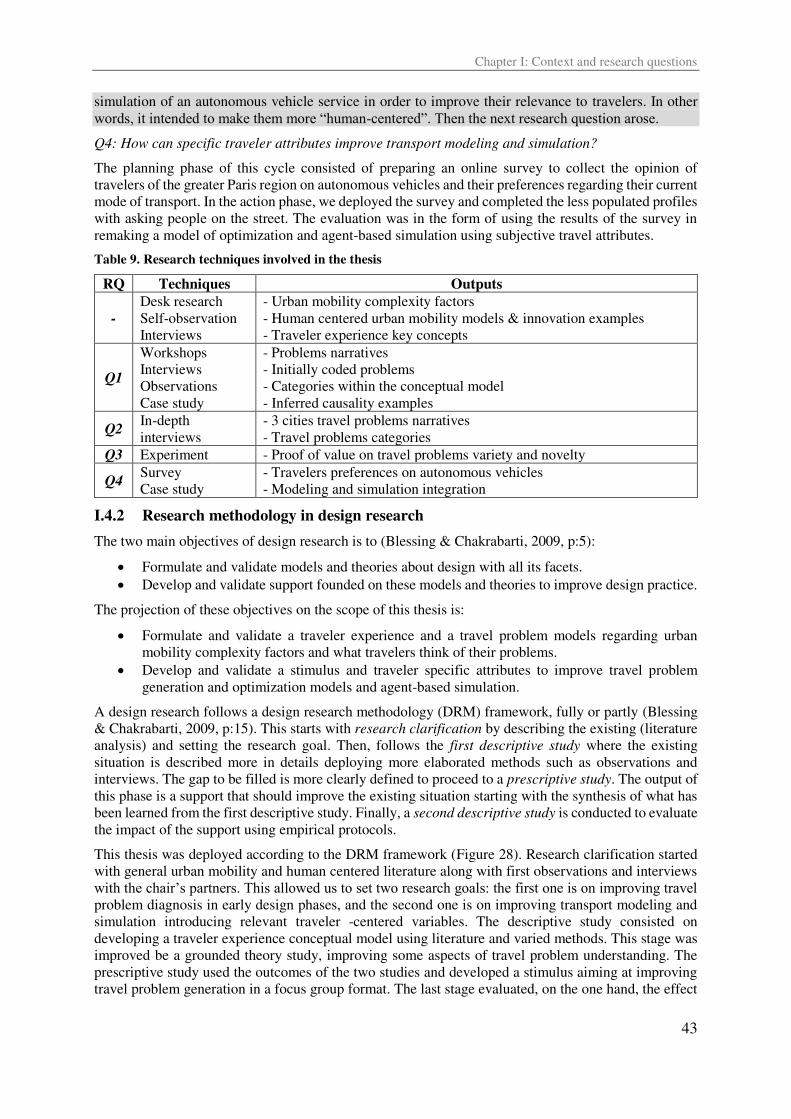
Chapter I: Context and research questions
43
simulation of an autonomous vehicle service in order to improve their relevance to travelers. In other
words, it intended to make them more “human-centered”. Then the next research question arose.
Q4: How can specific traveler attributes improve transport modeling and simulation?
The planning phase of this cycle consisted of preparing an online survey to collect the opinion of
travelers of the greater Paris region on autonomous vehicles and their preferences regarding their current
mode of transport. In the action phase, we deployed the survey and completed the less populated profiles
with asking people on the street. The evaluation was in the form of using the results of the survey in
remaking a model of optimization and agent-based simulation using subjective travel attributes.
Table 9. Research techniques involved in the thesis
RQ Techniques Outputs
-
Desk research
Self-observation
Interviews
- Urban mobility complexity factors
- Human centered urban mobility models & innovation examples
- Traveler experience key concepts
Q1
Workshops
Interviews
Observations
Case study
- Problems narratives
- Initially coded problems
- Categories within the conceptual model
- Inferred causality examples
Q2 In-depth
interviews
- 3 cities travel problems narratives
- Travel problems categories
Q3 Experiment - Proof of value on travel problems variety and novelty
Q4 Survey
Case study
- Travelers preferences on autonomous vehicles
- Modeling and simulation integration
I.4.2 Research methodology in design research
The two main objectives of design research is to (Blessing & Chakrabarti, 2009, p:5):
• Formulate and validate models and theories about design with all its facets.
• Develop and validate support founded on these models and theories to improve design practice.
The projection of these objectives on the scope of this thesis is:
• Formulate and validate a traveler experience and a travel problem models regarding urban
mobility complexity factors and what travelers think of their problems.
• Develop and validate a stimulus and traveler specific attributes to improve travel problem
generation and optimization models and agent-based simulation.
A design research follows a design research methodology (DRM) framework, fully or partly (Blessing
& Chakrabarti, 2009, p:15). This starts with research clarification by describing the existing (literature
analysis) and setting the research goal. Then, follows the first descriptive study where the existing
situation is described more in details deploying more elaborated methods such as observations and
interviews. The gap to be filled is more clearly defined to proceed to a prescriptive study. The output of
this phase is a support that should improve the existing situation starting with the synthesis of what has
been learned from the first descriptive study. Finally, a second descriptive study is conducted to evaluate
the impact of the support using empirical protocols.
This thesis was deployed according to the DRM framework (Figure 28). Research clarification started
with general urban mobility and human centered literature along with first observations and interviews
with the chair’s partners. This allowed us to set two research goals: the first one is on improving travel problem diagnosis in early design phases, and the second one is on improving transport modeling and
simulation introducing relevant traveler -centered variables. The descriptive study consisted on
developing a traveler experience conceptual model using literature and varied methods. This stage was
improved be a grounded theory study, improving some aspects of travel problem understanding. The
prescriptive study used the outcomes of the two studies and developed a stimulus aiming at improving
travel problem generation in a focus group format. The last stage evaluated, on the one hand, the effect
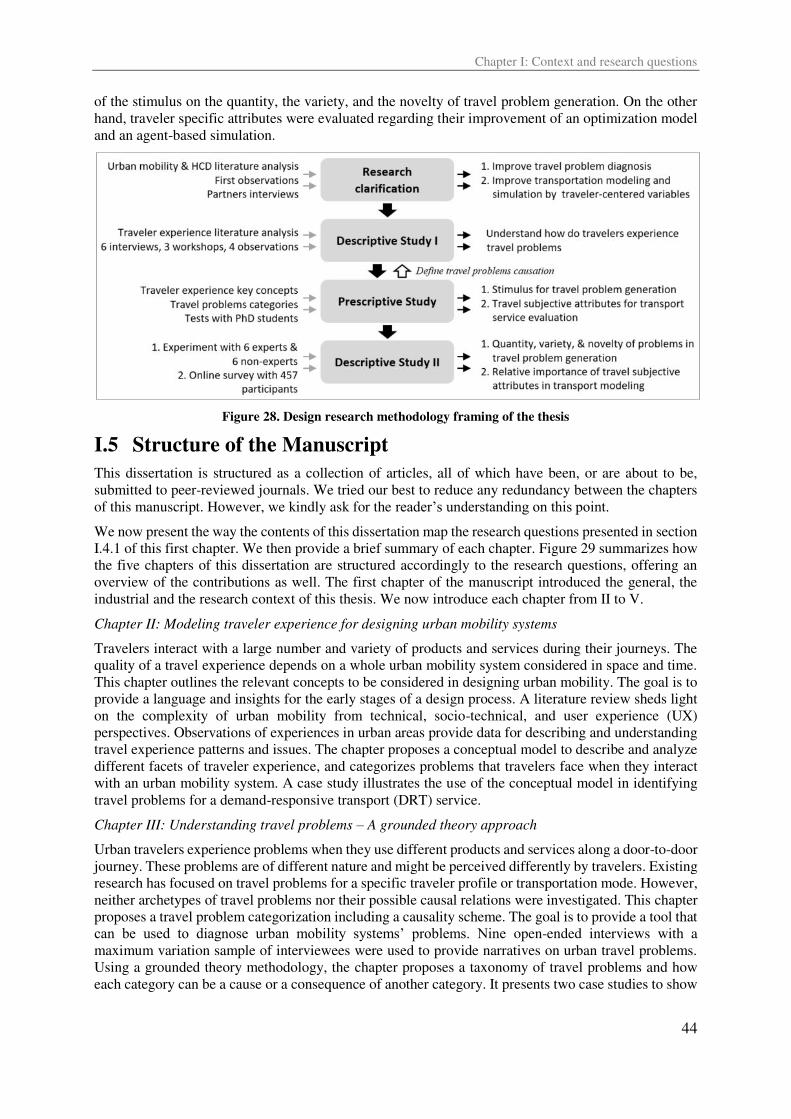
Chapter I: Context and research questions
44
of the stimulus on the quantity, the variety, and the novelty of travel problem generation. On the other
hand, traveler specific attributes were evaluated regarding their improvement of an optimization model
and an agent-based simulation.
Figure 28. Design research methodology framing of the thesis
I.5 Structure of the Manuscript
This dissertation is structured as a collection of articles, all of which have been, or are about to be,
submitted to peer-reviewed journals. We tried our best to reduce any redundancy between the chapters
of this manuscript. However, we kindly ask for the reader’s understanding on this point.
We now present the way the contents of this dissertation map the research questions presented in section
I.4.1 of this first chapter. We then provide a brief summary of each chapter. Figure 29 summarizes how
the five chapters of this dissertation are structured accordingly to the research questions, offering an
overview of the contributions as well. The first chapter of the manuscript introduced the general, the
industrial and the research context of this thesis. We now introduce each chapter from II to V.
Chapter II: Modeling traveler experience for designing urban mobility systems
Travelers interact with a large number and variety of products and services during their journeys. The
quality of a travel experience depends on a whole urban mobility system considered in space and time.
This chapter outlines the relevant concepts to be considered in designing urban mobility. The goal is to
provide a language and insights for the early stages of a design process. A literature review sheds light
on the complexity of urban mobility from technical, socio-technical, and user experience (UX)
perspectives. Observations of experiences in urban areas provide data for describing and understanding
travel experience patterns and issues. The chapter proposes a conceptual model to describe and analyze
different facets of traveler experience, and categorizes problems that travelers face when they interact
with an urban mobility system. A case study illustrates the use of the conceptual model in identifying
travel problems for a demand-responsive transport (DRT) service.
Chapter III: Understanding travel problems – A grounded theory approach
Urban travelers experience problems when they use different products and services along a door-to-door
journey. These problems are of different nature and might be perceived differently by travelers. Existing
research has focused on travel problems for a specific traveler profile or transportation mode. However,
neither archetypes of travel problems nor their possible causal relations were investigated. This chapter
proposes a travel problem categorization including a causality scheme. The goal is to provide a tool that
can be used to diagnose urban mobility systems’ problems. Nine open-ended interviews with a
maximum variation sample of interviewees were used to provide narratives on urban travel problems.
Using a grounded theory methodology, the chapter proposes a taxonomy of travel problems and how
each category can be a cause or a consequence of another category. It presents two case studies to show
Chapter I: Context and research questions
45
how the proposed tool can be used in decomposing a complex travel problem statement and enriching a
simple one.
Chapter IV: Simulating travel usage problem generation – An urban mobility case study
Designers improve urban mobility solutions by investigating archetypal usage problems in existing
mobility systems. User-centered design methods help accomplish this task, but lack effectiveness when
not supported by appropriate tools. Here we posit that the use of a traveler -centered stimulus improves
the effectiveness of travel problem generation. To test this hypothesis, an experiment is conducted with
two control groups as a baseline for non-stimulated problem generation and two experimental groups
that are provided with a traveler -centered stimulus. The two sets are composed of one group of urban
mobility experts and one group of non-experts. Results show that stimulated groups generate novel ideas
with a greater variety covering most of the traveler experience dimensions than non-stimulated groups.
Chapter V: Traveler specific attributes in transport modeling and simulation of AVs
Modeling transport systems is usually based on variables that are projected on time and space. For
instance, simulation and optimization models rarely go beyond cost, time and space as determinants
when analyzing travelers’ choice regarding their transport mode. This chapter shows how the knowledge
of traveler experience helps to determine relevant variables that subtend travelers’ willingness-to-use a
mobility service. We exemplify the approach for a shared autonomous vehicle service. An online survey
was carried to collect data on travelers of the greater Paris region and their position regarding
autonomous vehicles. On the one hand, the chapter identifies profiles of travelers that are more likely to
accept autonomous vehicle technology. On the other hand, it identifies subjective criteria of travelers
behind their willingness-to-use a shared autonomous vehicle service depending on their current mode
of transport. The chapter shows how traveler specific attributes are relevant to studying a mobility
system and how these can enhance the accuracy of agent-based models and the traveler preference
dimension in optimization models.
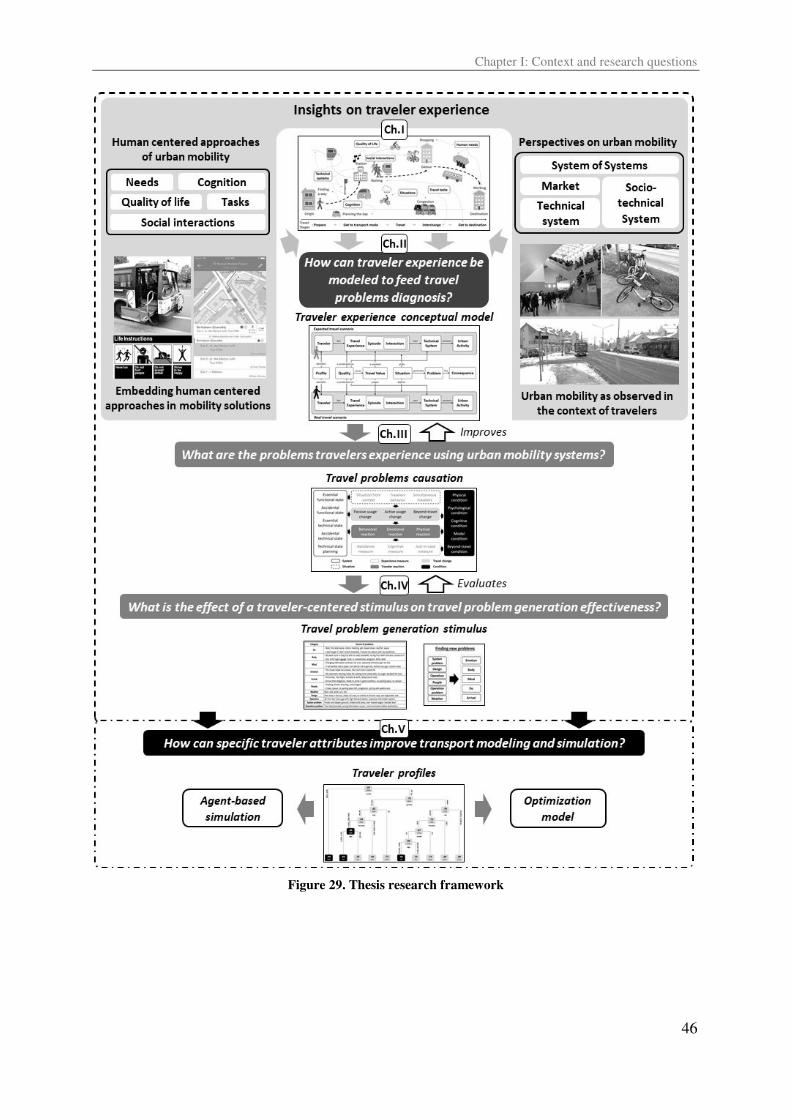
Chapter I: Context and research questions
46
Figure 29. Thesis research framework
Chapter II: Modeling traveler experience for designing urban mobility systems
47
Chapter II: Modeling traveler experience for designing urban mobility systems
Chapter II
Modeling traveler experience for designing urban
mobility systems
Travelers interact with a large number and variety of products and services during their journeys. The quality of a travel experience depends on a whole urban mobility system considered in space and time. This chapter outlines the relevant concepts to be considered in designing urban mobility. The goal is to provide a language and insights for the early stages of a design process. A literature review sheds light on the complexity of urban mobility from technical, socio-technical, and user experience (UX) perspectives. Observations of experiences in urban areas provide data for describing and understanding travel experience patterns and issues. The chapter proposes a conceptual model to describe and analyze different facets of traveler experience, and categorizes problems that travelers face when they interact with an urban mobility system. A case study illustrates the use of the conceptual model in identifying travel problems for a demand-responsive transport (DRT) service.
Keywords – System design, traveler experience, travel problems, service
A modified version of this chapter has been accepted in “Design Science” Journal
Chapter II: Modeling traveler experience for designing urban mobility systems
48
II.1 Introduction
The proportion of people living in the world’s urban areas is expected to rise in the coming decades, to reach 66% by 2050 (UNDESA, 2014). This growth generates increasingly challenging situations for urban travelers, such as traffic chaos, insecurity, poorer quality of life, limited parking space, air pollution, and noise. An urban mobility system is a solution that satisfies the derived demand of people who need to perform an activity at some destination (Banister, 2008). The way in which this need is met is how travelers experience their door-to-door journey (Susilo & Cats, 2014).
Urban mobility systems (UMSs) are still designed as aggregations of products and services that are not operating in traveler -centered harmony to offer a seamless mobility experience (Preston, 2012). For example, in the Paris area, there are several transportation operators for different lines. At the exit of a train station, it is frequent to find information about one operator’s bus lines but not others. One of the reasons why such problems persist is that each line is designed and operated separately from the others (Al Maghraoui et al., 2017a). The same problem arises for the interchange between private cars and public transportation (e.g. park-and-ride facilities), or the need to have different smartphone apps for planning and monitoring a single trip (e.g. one for bus real-time schedule and one for multimodal transfers). The complexity of urban mobility systems poses challenges in their design process, models, knowledge or expertise (Sussman et al., 2005). There is therefore a need for a common approach for stakeholders involved in the design process of such systems to operate in designing a satisfactory traveler experience (Civitas, 2011). Consequently, companies adopting such an approach are more likely to have a better innovation performance (Faems et al., 2005). Moreover, design practice comes with an amount of complexity related to the information available on the problem to be solved, users’ wants and needs, context evolution and, above all, the decisions a designer has to make among design possibilities (Stolterman, 2008). Thus what makes the situation even more challenging for urban mobility designers is that they must handle design complexity in addition to UMSs. For example, if we want to identify user profiles for metro lines within an urban area, the users to be studied are all the people transiting by these lines plus the urban dwellers using the metro stations, and maybe also those affected by its noise and vibrations in adjoining neighborhoods. A model proposed by Simmons (2005) handles some of this complexity by using the concept of usage, which encompasses information on the user and the interaction between the system and the user, and information on the environment in which this takes place. Furthermore, it can move from detailed interaction, at the scale of a task (e.g. pushing a button to open a train door) to abstract levels (e.g. using a bike-sharing service). On the other hand, the diversity of interactions a traveler might have with a UMS is contained within the concept of usage scenarios and use cases drawn from Universal Modeling Language (UML) (D’Souza & Wills, 1999). A traveler interacts with many products and services while heading to some destination: the traveler may be the user of a smartphone application to program the journey or check the schedule of a bus, for example. He/she enters the metro station and interacts with the ticket machine, then boards the metro train. He/she reads information panels at the station’s exit. In this chapter, the point of view is focused on the user to include all products and services used throughout a journey. This chapter addresses the following research question: How can traveler experience be modeled to feed travel problems diagnosis?
Firstly, a literature review is made on different perspectives of urban mobility systems and traveler
experience. Second, a conceptual model is proposed as a model of traveler experience to help identify
travel problems within an urban mobility system. Third, to test the potential of the conceptual model, a
case study on a demand-responsive transport (DRT) service is illustrated. Finally, a discussion and
perspectives for the design of urban mobility systems are included.
Chapter II: Modeling traveler experience for designing urban mobility systems
49
II.2 Urban mobility systems
The complexity of an urban mobility system (UMS) encompasses different factors in several dimensions. A UMS comprises a large number of diverse, evolving stakeholders, physical components, information, and travelers, all interacting with each other in an urban context. Another form of complexity stems from the diversity of use combinations: UMSs serve throughout the day and night in a shared form of use. To represent these forms of complexity, the technical aspect of urban mobility is first presented as a technical UMS (TUMS). It is followed by the market perspective, considering a TUMS as a supply responding to and generating a travel demand. The socio-technical perspective of urban mobility is then introduced to merge the supply and the demand into one system.
II.2.1 Technical perspective
The technical physical components of urban mobility are composed of infrastructures: roads, rails, fuel stations, train stations, bridges, energy and communication networks, terminals and facilities, etc., and vehicles: buses, cars, trains, trucks, boats, trams, etc. Information and communications technology (ICT) (GPS, Internet of Things, mobile networks, etc.) also play an important role in ensuring the qualities (safety, usefulness, fluidity, etc.) of these technical physical systems (Kitchin, 2013). Travelers taking multimodal trips connect the elements of infrastructure, vehicles and ICT (Gallotti & Barthelemy, 2014): this brings out the need for a global understanding taking multi-modality into account and considering global performance rather than that of a single bus line, highway, or hub. For instance, bus lines feeding a regional rail line may operate with good performance indicators (e.g. good timekeeping, good frequency), but if the buses all arrive at the same time at the train station they will cause congestion. The TUMS including bus lines and the regional train will then operate with a bad multi-modal efficiency indicator.
Travelers may chain multiple trips during the day (Primerano et al., 2008) connecting the TUMSs to other urban systems, such as households, industries, or workplaces (Wegener, 2013). Thus it is the activities that travelers pursue in these systems – the origins and destinations of travel – that generate the demand on TUMSs (Banister, 2008). Whence the usefulness of studying the market perspective of urban mobility.
II.2.2 Market perspective
The World Business Council for Sustainable Development has proposed a model of UMSs as a set of three markets (WBCSD, 2015): (i) the travel market represents the spatial-temporal presence of travelers in urban systems performing their activities, which generates travel patterns, (ii) the transport market is where travel patterns meet the supply of vehicles and transport solutions (including cycling and walking), which generates transport patterns, and (iii) the traffic market is where transport patterns meet the supply of infrastructure, its information and management systems. Within these patterns, some recursive phenomena occur (Cascetta, 2009). For example, travelers who individually choose the most efficient (fastest and cheapest) UMSs might collectively congest them and thereby deteriorate the very two criteria on which they chose them in the first place.
These mobility patterns (Gonzalez et al., 2008), superimposed on actual city maps and sociodemographic data, attitudes, preferences, etc. (Lucas, 2013), can explain some of collective travelers’ behaviors (e.g. reasons underlying traveler distributions within a geographic area). In summary, demand is characterized by both spatial distribution of social and economic activities, and by attitudes and cultural backgrounds of travelers.
Considering the supply and demand separately in representing urban mobility explains how they interact. However, this perspective does not consider either the effect of legal and political dimensions, or the role of individuals and institutions in operating urban mobility.
II.2.3 Socio-technical perspective
According to Auvinen & Tuominen (2014), technological, social, economic, political, legal and environmental dimensions need to be considered to understand the complexity of urban mobility. They
Chapter II: Modeling traveler experience for designing urban mobility systems
50
define a UMS as a set of four main components: infrastructure, vehicles, travelers and governance. For instance, from the environmental perspective, the infrastructure offering smart electricity grids and charging stations for cars and buses permits the development of emission-free, silent electrical fleets. Together with political support and standardization, this encourages responsible modal choice by travelers, and ultimately generates a clean transport environment. For instance, people buying electric cars create a demand at charging stations and encourage the creation of new ones. These loops permit the propagation of social values through global urban mobility. In a wider perspective, UMSs are components of the system of the city, and interact, for example, with energy systems and social structures. Hospitals and workplaces, through the practice of telemedicine and teleworking, decrease the need for mobility, and consequently transportation energy consumption. However, these new practices need the involvement of people, the commitment of companies, and adequate technological and legal measures. For Ottens et al. (2006), the components of a UMS as a socio-technical system are: technical elements, social elements and actors. Technical elements include all physical components and the software to operate them, actors are individuals or organizations that are directly operating the system, and social elements influence the functioning of the UMS. Beyond functional relations (e.g. buses providing information at a bus station) and physical relations (vehicles driving on roads), there are intentional and normative interactions between these components. Intentional interactions are performed by actors where other elements are the object of their intention to take an action (e.g. a traveler has the intention to use a bike between metro station and work). Normative interactions represent rules for governing a technical element or an actor, e.g. a public transport operator obliges travelers to have valid tickets. Thus, from the socio-technical perspective, the traveler is a part of the UMS, and is involved in its operation as a customer and as an actor.
The dimensions listed above show how diverse are the interactions a traveler might have with UMSs while living his/her urban life, traveling from activity to activity. A closer look at how the traveler experiences his/her trip at an individual scale uncovers new aspects.
II.3 Traveler experience
The traveler experience of UMSs is not only about describing how travelers interact with the different components: the spatio-temporal dimension of the journey also induces some dynamics on the traveler’s emotional, cognitive, and physical state.
II.3.1 Journey through time and space
UMSs are designed for different travelers who interact with their components, individually or collectively, or at different times of day, and with different itineraries. The EU-FP7 project METPEX (MEasurement Tool to determine the quality of Passenger EXperience), describes the ‘traveler experience’ by decomposing the journey into different typical stages (Woodcock, Osmond, et al. 2014). The journey is decomposed into (i) assessment of the need for mobility; (ii) planning stage (time, modes, routes, etc.) and the gathering of the artefacts needed during the journey (tickets/car papers, entertainment artefacts, etc.); (iii) movement from the origin to the transport gateway/car; (iv) interaction with the transport service (payment, ingress, etc.); (v) traveling in the vehicle; (vi) interchanges, which include finding the location of the next means of transport, schedule information, buying new tickets, etc. Finally, egress from the service at the destination concludes the journey. Along their journeys, travelers value different things. Stradling et al. (2007), Woodcock, Berkeley, et al. (2014), and Susilo & Cats (2014) identified from travelers themselves: price, journey and service speed, protection against weather while waiting and traveling, reliability (punctuality and regularity), availability (frequency and stop locations), physical environment, vehicle quality, cleanliness both at stations and on board, quality on board, fellow travelers’ behavior, seat availability, seat comfort, crowding both at stops and on board, station facilities, information accessibility, safety and security (at stops and on-board), ticket use and purchase simplicity, and connectivity (network and easy transfer). Joewono and Kubota (2007) identified from literature similar groups of criteria set as a mean to evaluate
Chapter II: Modeling traveler experience for designing urban mobility systems
51
user satisfaction broken down into 54 attributes. At this level of detail, some attributes overlap with others such as level of emission and air quality, where level of emission is more an environmental technical attribute that should be calculated rather than evaluated by a transportation service user.
To analyze the journey experience, Susilo et al. (2015) consider three variables for each activity based on an activity representation of travel as already seen. The first one is personal doing, such as packing belongings, exiting home, walking to station, or crossing the street for some preparatory activity, for example. The second one is personal thinking, such as thinking over the day’s schedule, observing people waiting, or wondering about waiting time. The last one is personal feeling, such as being worried about hygiene in a bus, bothered by the noise of a train arriving, or anxious about the weather. These three personal dimensions vary over time: depending on the travel stage and the circumstances of travel, the traveler experience is never stationary. For instance, Van Hagen & Bron (2014) set an emotional curve over different train travel stages. Each level of pleasantness takes a value over time and according to some emotional instance (e.g. enthusiasm, stress, annoyance, rest, freedom, uncertainty, etc.). Lancée et al. (2017) introduced commuting mood as a metric of happiness variation throughout different travel means. Abenoza et al. (2018) linked overall satisfaction with a door-to-door experience to the stage by stage satisfaction through the lens of duration.
II.3.2 User experience journey
The International Organization for Standardization (2010) defines user experience as a “person's perceptions and responses that result from the use or anticipated use of a product, system or service”. This definition considers the essence of UX as the subjective perception of the user. Hassenzahl & Tractinsky (2006), on the other hand, see in UX a subjective, situated, complex and dynamic encounter between the user and the designed system. Subjectivity here plays only the role of instantiating the interaction. It is not only a user’s perception but also usage elements including the system to be designed and the context of interaction.
Law et al. (2009) also include in the experience framework what happens before and after the interaction. Furthermore, they insist that what is to be designed is not only an artefact or a service but a system that includes everything the user interacts with. In this respect, the scope of a traveler experience with a UMS can take multiple forms. The system’s boundaries can be set according to several dimensions such as time, space, travelers, or as a set of artefacts/services and the connections between them. One important subjective dimension is emotions. Jokinen (2015) points out the importance of task performance on a user’s emotions and vice versa. How the experience happens affect a user’s emotions, but the emotional state of the user also affects the experience. Recursively, Desmet (2012) further details this reciprocation between the user’s experience and emotional state by breaking down the sources of emotions. These are: the system, the meaning of the system to the user, the interaction, the activity facilitated by this interaction, the effect that the system has on the user, and other people involved in the interaction. What has been identified as travel value categories in the METPEX project are the locus where a solution is most likely to be successful. Different names are given to this concept, such as jobs to be done, needs (Johnson et al., 2008), blue ocean (W. C. Kim & Mauborgne, 2004), or value buckets (Yannou et al., 2013). For instance, if many travelers value cleanliness, then an opportunity to achieve market success will be to improve cleanliness in UMSs if they are dirty. As a result, the travelers will be satisfied in that respect.
In a holistic approach, Kremer et al. (2017) consider UX as a process that flows over time, called UX journey, of which a designer can grasp multiple facets. This includes questions that the user asks, physical and cognitive interactions, system components, alternative interactions for special-needs users, emotional curve (positive and negative), problems, possible measurements, context aspects, and innovation potential.
Urban mobility systems have a considerable number of complexity factors. Different issues emerge from perspectives in the literature centering the vision on the traveler . The technical standpoint shows the variety of physical components a traveler might interact with during a single trip, and how these components are interrelated. The market vision brings out the recursive interaction between supply
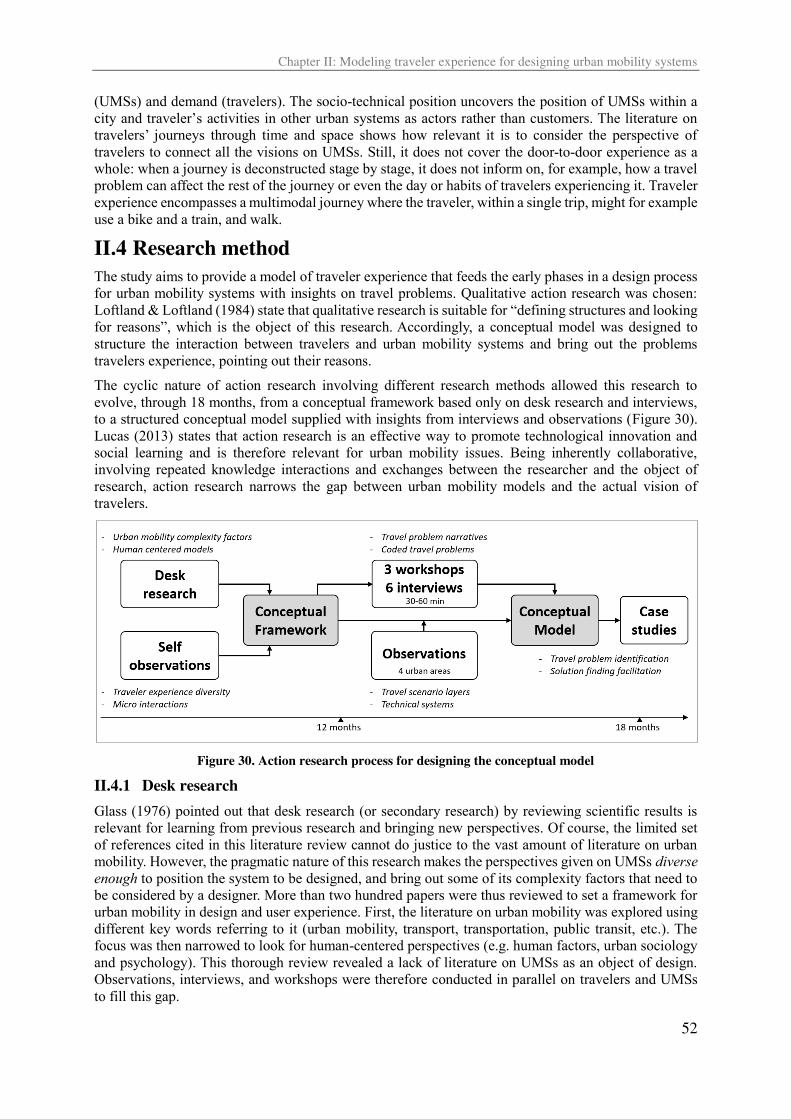
Chapter II: Modeling traveler experience for designing urban mobility systems
52
(UMSs) and demand (travelers). The socio-technical position uncovers the position of UMSs within a city and traveler’s activities in other urban systems as actors rather than customers. The literature on travelers’ journeys through time and space shows how relevant it is to consider the perspective of travelers to connect all the visions on UMSs. Still, it does not cover the door-to-door experience as a whole: when a journey is deconstructed stage by stage, it does not inform on, for example, how a travel problem can affect the rest of the journey or even the day or habits of travelers experiencing it. Traveler experience encompasses a multimodal journey where the traveler, within a single trip, might for example use a bike and a train, and walk.
II.4 Research method
The study aims to provide a model of traveler experience that feeds the early phases in a design process for urban mobility systems with insights on travel problems. Qualitative action research was chosen: Loftland & Loftland (1984) state that qualitative research is suitable for “defining structures and looking for reasons”, which is the object of this research. Accordingly, a conceptual model was designed to structure the interaction between travelers and urban mobility systems and bring out the problems travelers experience, pointing out their reasons. The cyclic nature of action research involving different research methods allowed this research to evolve, through 18 months, from a conceptual framework based only on desk research and interviews, to a structured conceptual model supplied with insights from interviews and observations (Figure 30). Lucas (2013) states that action research is an effective way to promote technological innovation and social learning and is therefore relevant for urban mobility issues. Being inherently collaborative, involving repeated knowledge interactions and exchanges between the researcher and the object of research, action research narrows the gap between urban mobility models and the actual vision of travelers.
Figure 30. Action research process for designing the conceptual model
II.4.1 Desk research
Glass (1976) pointed out that desk research (or secondary research) by reviewing scientific results is relevant for learning from previous research and bringing new perspectives. Of course, the limited set of references cited in this literature review cannot do justice to the vast amount of literature on urban mobility. However, the pragmatic nature of this research makes the perspectives given on UMSs diverse enough to position the system to be designed, and bring out some of its complexity factors that need to be considered by a designer. More than two hundred papers were thus reviewed to set a framework for urban mobility in design and user experience. First, the literature on urban mobility was explored using different key words referring to it (urban mobility, transport, transportation, public transit, etc.). The focus was then narrowed to look for human-centered perspectives (e.g. human factors, urban sociology and psychology). This thorough review revealed a lack of literature on UMSs as an object of design. Observations, interviews, and workshops were therefore conducted in parallel on travelers and UMSs to fill this gap.
Chapter II: Modeling traveler experience for designing urban mobility systems
53
II.4.2 Observations
Observations are relevant for generating data on human behavior in some contexts (Sanoff, 2016, p.77-89). Interaction of travelers with UMSs and their environment was accordingly captured by this method. First, self-observations were recorded in the form of diaries and photos where different travel episodes, UMSs, and activities are related. This provided a dynamic picture of travel flow over time and uncovered the hidden micro-interactions of traveler experience concerning not only physical artefacts, but also interactions with fellow travelers, activities during the trip, planning the activity to be done after the journey, etc. More localized observations in four different transport hubs in the Paris area provided data on subsystems forming a multimodal physical space, identifying artefacts, crowd phenomena, travelers’ actions and reactions, and situations a traveler may face in his/her travel routine in such places. A form of participant observation (Atkinson & Hammersley, 1994) was also conducted, traveling in different means of transport and relating travelers’ issues in vehicles. Observing travelers, UMSs, and their interactions enabled us to detail the conceptual framework induced from desk research by creating new entities in the conceptual model, and to break down others. For instance, gathering different artefacts and interactions from different contexts enabled us to create different layers of travel scenarios (interaction, episode, and travel experience) to grasp the diversity of the variables without losing the abstraction that links travelers to UMSs. However, the projection of the journey on travelers’ minds could not be captured without interviewing the travelers and asking them to express their experience using their own vocabulary.
II.4.3 Workshops and interviews
To grasp the perspective of a subject living an experience, interviews are needed (Kvale & Brinkmann, 2009). Thus, as the traveler was at the center of this research focus, to complete the picture, six semi-structured and in-depth interviews (30min - 60min) and three workshops were conducted. Participants were asked to talk freely about their experiences and recount problems they faced in their daily commute and/or in weekend trips. The goal was to capture concepts and predicates they use in their narratives. In the structured parts of the interviews and workshops, participants were also asked specific questions aiming at uncovering why the situations they described were problematic, and their narratives were coded within the conceptual framework. This form of inquiry enabled us to create the travel problem conceptual model entity, and to describe it using the pattern identified in participants’ narratives.
II.4.4 Case studies
To evaluate the performance of the conceptual model in addressing the research question, several case studies were carried out. Two dimensions were chosen among all the performance variables a conceptual model could be evaluated for (Vrande et al., 2010).
1. Travel problem identification: the capacity to provide multi-perspective insights on the
problems travelers experience interacting with UMSs.
2. Solution-finding facilitation: the capacity to transform the problem formulation into solutions
(in the form of functions, for example).
The case study that was chosen for this chapter was an on-demand bus service operated by a public transport operator of Paris Metropolis. It is a service that allows a traveler to book a bus for an itinerary within an interval of time. The conceptual model is applied partly (using some of its concepts) to diagnose some of the service’s problems. The data were collected from observations and by interviewing a bus driver who was the oldest agent and knew most of the users. The interview lasted 3 hours, and 5 rides were observed between 7 bus stops.
II.5 Proposition of a Traveler eXperience Conceptual Model
Based on the perspectives on urban mobility and user experience from the literature, observations, and interviews, a traveler experience conceptual model (TXCM) was designed. A first conceptual framework was set as basis for conceptualization (Author, 2017). Core concepts for the conceptual model were identified, namely: the traveler, the system, the interaction, the situation, and the value the traveler expects from the system. In this sense, the conceptual model goes further than these core concepts by
Chapter II: Modeling traveler experience for designing urban mobility systems
54
detailing them, and by adding new concepts to clarify the big picture. Table 1 shows the definitions of each concept in the conceptual model, and Figure 2 illustrates how they are interrelated.
II.5.1 Assumptions
The conceptual model is one answer to the research question of design support and is based on various assumptions that delimit its scope and capacity.
• The conceptual model is not the pure subjective projection of traveler’s interactions with
technical systems: the subjective dimension only appears in the expected travel scenario, the
scoring of travel value, and the predicates of quality.
• The conceptual model does not allow measurements such as travel problem severity or technical
system performance. Instead it proposes concepts and variables that can be used to create
measurements.
• The conceptual model is based on the literature, observations, and interviews with travelers.
Hence its capacity to feed early design phases of UMSs was not captured from designers
themselves. It is based on identifying gaps in the literature and real problems experienced by
travelers.
It is up to the user of the conceptual model to set the boundaries of the system to be modeled and the travelers to be considered. The scaling of the system is also set by the user. For example, he/she can focus, at the elementary level of interaction, on how a stair of an escalator is climbed, and consider as a travel episode the whole escalator climb, which would be one episode in a metro station travel experience. An alternative is to consider the whole escalator climb as an interaction, the metro station transition as an episode, and the travel experience all three episodes metro-station-bus combined. The episodes occurring after and before these three can be included in the scope of the travel scenario. In this way, the details described by the conceptual model will depend on how the user handles the scoping. Likewise, if the user takes the scoping from the spatial dimension, the technical system can be a simple artefact such as a bus ticket, or a train station with all the subsystems it contains. Broader than a station, a technical system can also be a whole geographical area.
II.5.2 Model
The concepts in the conceptual model are described by a definition (Table 10) and the connections it has with the other concepts (Figure 31 illustrates some of the connections). The output of the conceptual model as it appears in Figure 31 is the contrast between the two scenarios (expected and real). However, from a methodological point of view, the problem narrative is the input to the conceptual model. Put this way, the travel problem formatted through the conceptual model is a consequence of a situation that shifts a travel scenario from expected to real. We can therefore understand the manifestation of the problem through the other concepts. In this way, insights on the causes of travel problems can be identified, so facilitating solution finding.
Summarily, a traveler experience is a process that happens in time and space when a traveler moves from one urban activity to another using different technical systems. It can happen through different travel scenarios. When a situation happens, it shifts a travel scenario from what the traveler expects to what happens for real, and this may generate a travel problem if the outcome is perceived as negative. In the TXCM, a real travel scenario happens to the traveler in his/her real experience of traveling. It can be once in time and space, or an average scenario that describes what often happens in the daily commute, for instance. An expected travel scenario, on the other hand, is how a traveler expects his/her journey to happen. For example, if the traveler expects to arrive at work at 8:00 am for a meeting at 8:10 and the train he/she takes is 20 minutes late, then the problem will be that he/she arrives 10 minutes late for the meeting without having had any time to prepare it. Another example is when a traveler expects to arrive on time for a date, but before boarding the bus realizes that he/she has forgotten his/her transport pass and needs to go back home to retrieve it because he/she needs to take a metro after the bus, or else decides to pay for the tickets.
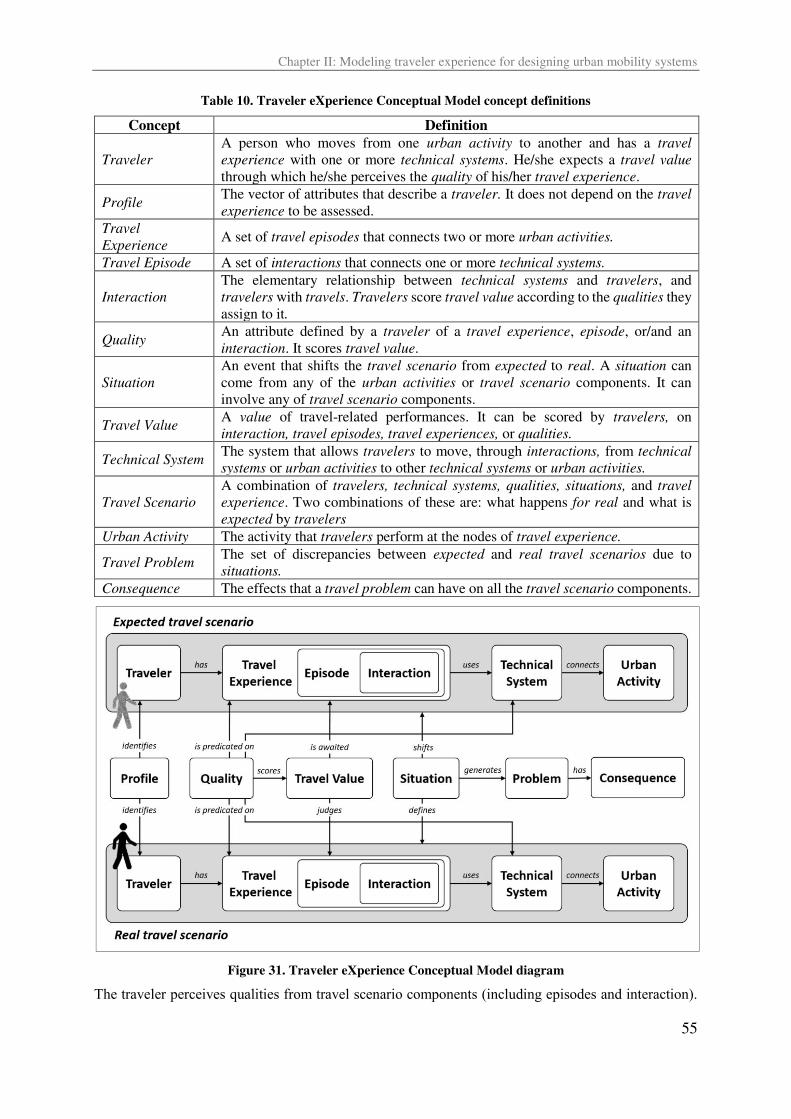
Chapter II: Modeling traveler experience for designing urban mobility systems
55
Table 10. Traveler eXperience Conceptual Model concept definitions
Concept Definition
Traveler A person who moves from one urban activity to another and has a travel experience with one or more technical systems. He/she expects a travel value
through which he/she perceives the quality of his/her travel experience.
Profile The vector of attributes that describe a traveler. It does not depend on the travel experience to be assessed.
Travel Experience
A set of travel episodes that connects two or more urban activities.
Travel Episode A set of interactions that connects one or more technical systems.
Interaction The elementary relationship between technical systems and travelers, and
travelers with travels. Travelers score travel value according to the qualities they
assign to it.
Quality An attribute defined by a traveler of a travel experience, episode, or/and an
interaction. It scores travel value.
Situation An event that shifts the travel scenario from expected to real. A situation can
come from any of the urban activities or travel scenario components. It can
involve any of travel scenario components.
Travel Value A value of travel-related performances. It can be scored by travelers, on interaction, travel episodes, travel experiences, or qualities.
Technical System The system that allows travelers to move, through interactions, from technical systems or urban activities to other technical systems or urban activities.
Travel Scenario A combination of travelers, technical systems, qualities, situations, and travel experience. Two combinations of these are: what happens for real and what is
expected by travelers
Urban Activity The activity that travelers perform at the nodes of travel experience.
Travel Problem The set of discrepancies between expected and real travel scenarios due to
situations. Consequence The effects that a travel problem can have on all the travel scenario components.
Figure 31. Traveler eXperience Conceptual Model diagram
The traveler perceives qualities from travel scenario components (including episodes and interaction).
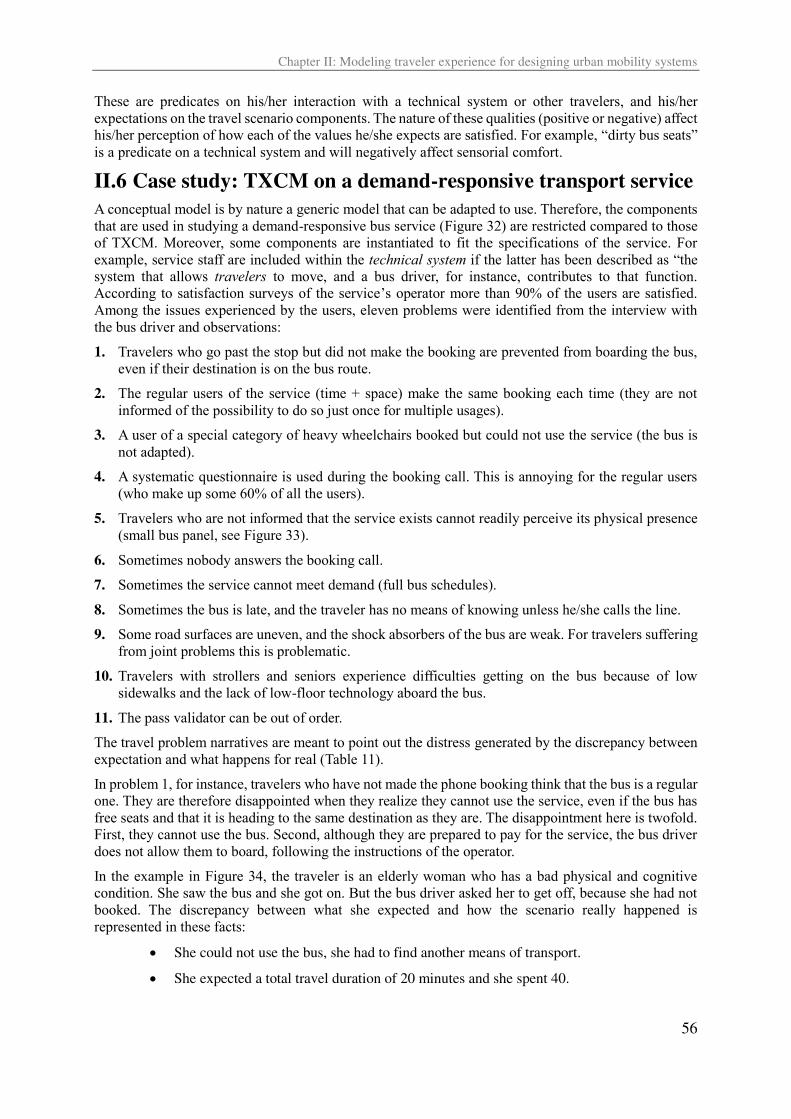
Chapter II: Modeling traveler experience for designing urban mobility systems
56
These are predicates on his/her interaction with a technical system or other travelers, and his/her expectations on the travel scenario components. The nature of these qualities (positive or negative) affect his/her perception of how each of the values he/she expects are satisfied. For example, “dirty bus seats” is a predicate on a technical system and will negatively affect sensorial comfort.
II.6 Case study: TXCM on a demand-responsive transport service
A conceptual model is by nature a generic model that can be adapted to use. Therefore, the components that are used in studying a demand-responsive bus service (Figure 32) are restricted compared to those of TXCM. Moreover, some components are instantiated to fit the specifications of the service. For example, service staff are included within the technical system if the latter has been described as “the system that allows travelers to move, and a bus driver, for instance, contributes to that function. According to satisfaction surveys of the service’s operator more than 90% of the users are satisfied. Among the issues experienced by the users, eleven problems were identified from the interview with the bus driver and observations:
1. Travelers who go past the stop but did not make the booking are prevented from boarding the bus, even if their destination is on the bus route.
2. The regular users of the service (time + space) make the same booking each time (they are not informed of the possibility to do so just once for multiple usages).
3. A user of a special category of heavy wheelchairs booked but could not use the service (the bus is not adapted).
4. A systematic questionnaire is used during the booking call. This is annoying for the regular users (who make up some 60% of all the users).
5. Travelers who are not informed that the service exists cannot readily perceive its physical presence (small bus panel, see Figure 33).
6. Sometimes nobody answers the booking call.
7. Sometimes the service cannot meet demand (full bus schedules).
8. Sometimes the bus is late, and the traveler has no means of knowing unless he/she calls the line. 9. Some road surfaces are uneven, and the shock absorbers of the bus are weak. For travelers suffering
from joint problems this is problematic.
10. Travelers with strollers and seniors experience difficulties getting on the bus because of low sidewalks and the lack of low-floor technology aboard the bus.
11. The pass validator can be out of order. The travel problem narratives are meant to point out the distress generated by the discrepancy between expectation and what happens for real (Table 11).
In problem 1, for instance, travelers who have not made the phone booking think that the bus is a regular one. They are therefore disappointed when they realize they cannot use the service, even if the bus has free seats and that it is heading to the same destination as they are. The disappointment here is twofold. First, they cannot use the bus. Second, although they are prepared to pay for the service, the bus driver does not allow them to board, following the instructions of the operator.
In the example in Figure 34, the traveler is an elderly woman who has a bad physical and cognitive condition. She saw the bus and she got on. But the bus driver asked her to get off, because she had not booked. The discrepancy between what she expected and how the scenario really happened is represented in these facts:
• She could not use the bus, she had to find another means of transport.
• She expected a total travel duration of 20 minutes and she spent 40.
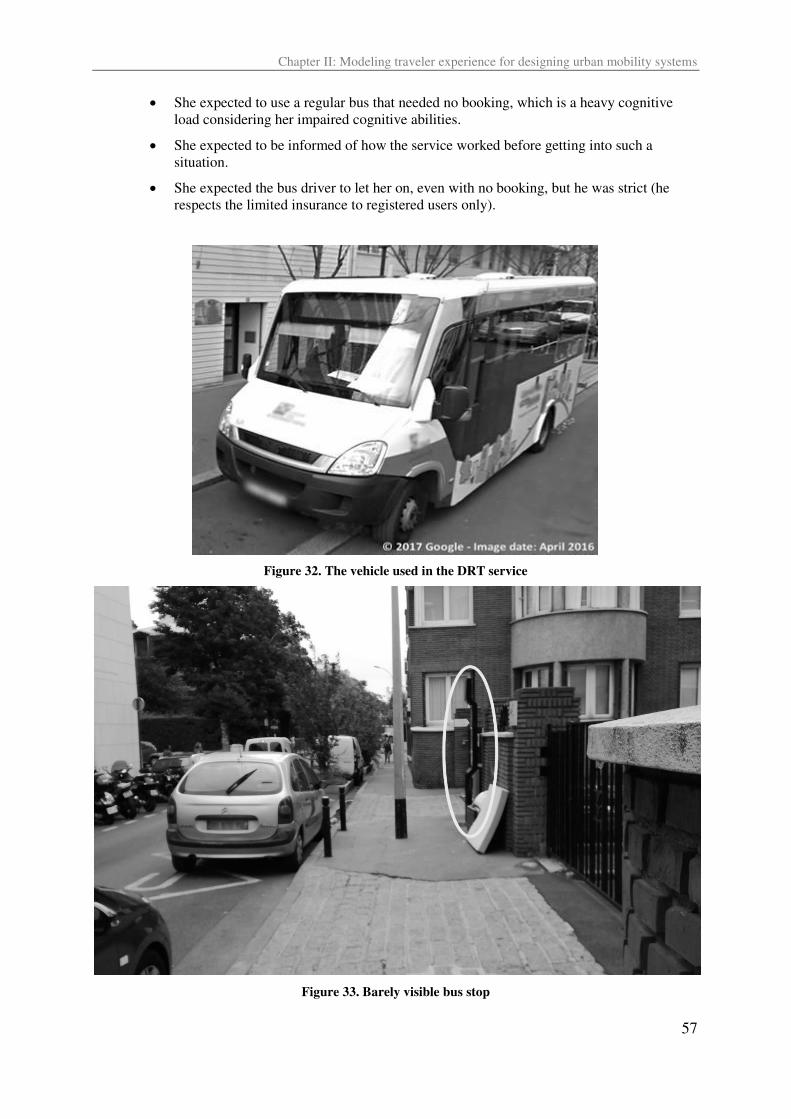
Chapter II: Modeling traveler experience for designing urban mobility systems
57
• She expected to use a regular bus that needed no booking, which is a heavy cognitive
load considering her impaired cognitive abilities.
• She expected to be informed of how the service worked before getting into such a
situation.
• She expected the bus driver to let her on, even with no booking, but he was strict (he
respects the limited insurance to registered users only).
Figure 32. The vehicle used in the DRT service
Figure 33. Barely visible bus stop
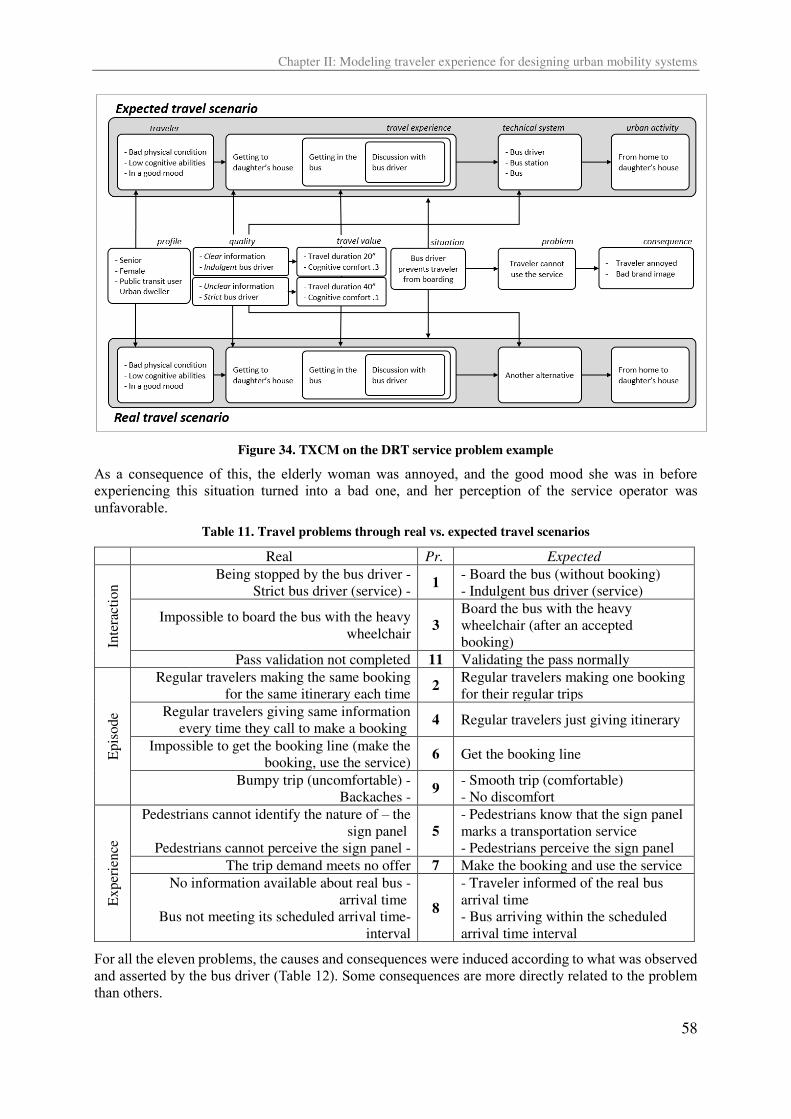
Chapter II: Modeling traveler experience for designing urban mobility systems
58
Figure 34. TXCM on the DRT service problem example
As a consequence of this, the elderly woman was annoyed, and the good mood she was in before experiencing this situation turned into a bad one, and her perception of the service operator was unfavorable.
Table 11. Travel problems through real vs. expected travel scenarios
Real Pr. Expected
Inte
ract
ion Being stopped by the bus driver -
Strict bus driver (service) - 1
- Board the bus (without booking)
- Indulgent bus driver (service)
Impossible to board the bus with the heavy
wheelchair 3
Board the bus with the heavy
wheelchair (after an accepted
booking)
Pass validation not completed 11 Validating the pass normally
Epis
ode
Regular travelers making the same booking
for the same itinerary each time 2
Regular travelers making one booking
for their regular trips
Regular travelers giving same information
every time they call to make a booking 4 Regular travelers just giving itinerary
Impossible to get the booking line (make the
booking, use the service) 6 Get the booking line
Bumpy trip (uncomfortable) -
Backaches - 9
- Smooth trip (comfortable)
- No discomfort
Ex
per
ien
ce
Pedestrians cannot identify the nature of – the
sign panel
Pedestrians cannot perceive the sign panel -
5
- Pedestrians know that the sign panel
marks a transportation service
- Pedestrians perceive the sign panel
The trip demand meets no offer 7 Make the booking and use the service
No information available about real bus -
arrival time
Bus not meeting its scheduled arrival time-
interval
8
- Traveler informed of the real bus
arrival time
- Bus arriving within the scheduled
arrival time interval
For all the eleven problems, the causes and consequences were induced according to what was observed and asserted by the bus driver (Table 12). Some consequences are more directly related to the problem than others.
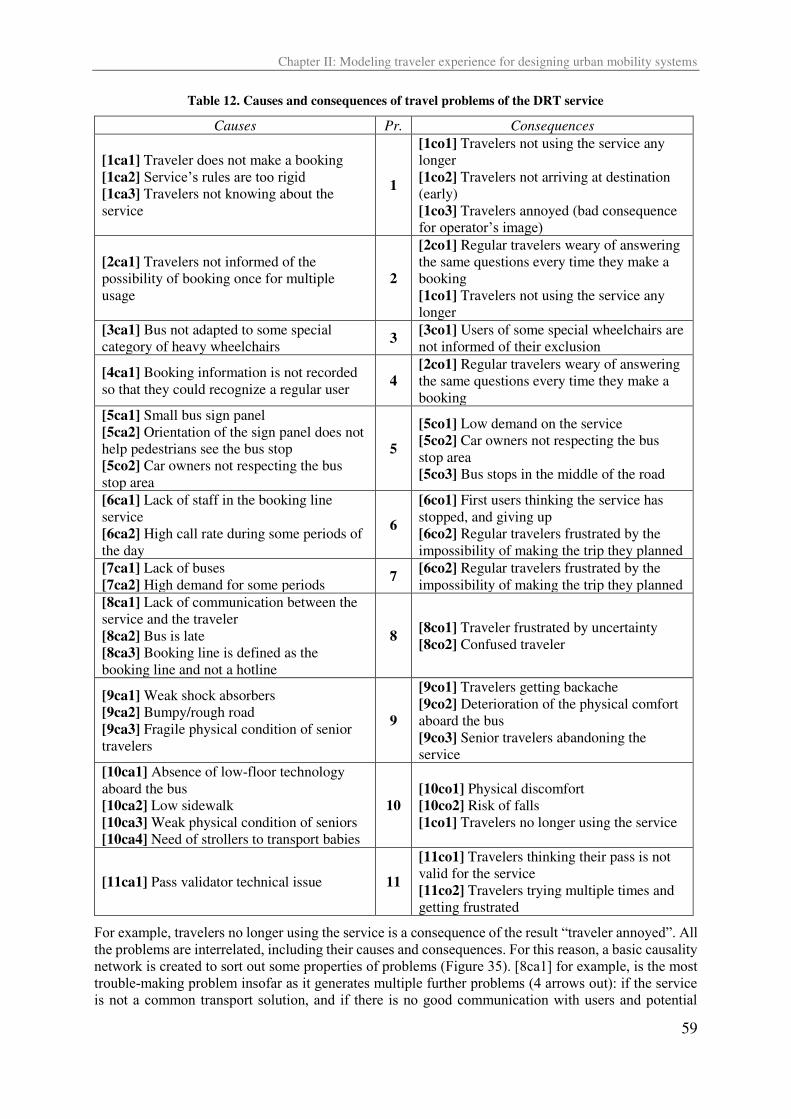
Chapter II: Modeling traveler experience for designing urban mobility systems
59
Table 12. Causes and consequences of travel problems of the DRT service
Causes Pr. Consequences
[1ca1] Traveler does not make a booking
[1ca2] Service’s rules are too rigid
[1ca3] Travelers not knowing about the
service
1
[1co1] Travelers not using the service any
longer
[1co2] Travelers not arriving at destination
(early)
[1co3] Travelers annoyed (bad consequence
for operator’s image)
[2ca1] Travelers not informed of the
possibility of booking once for multiple
usage
2
[2co1] Regular travelers weary of answering
the same questions every time they make a
booking
[1co1] Travelers not using the service any
longer
[3ca1] Bus not adapted to some special
category of heavy wheelchairs 3
[3co1] Users of some special wheelchairs are
not informed of their exclusion
[4ca1] Booking information is not recorded
so that they could recognize a regular user 4
[2co1] Regular travelers weary of answering
the same questions every time they make a
booking
[5ca1] Small bus sign panel
[5ca2] Orientation of the sign panel does not
help pedestrians see the bus stop
[5co2] Car owners not respecting the bus
stop area
5
[5co1] Low demand on the service
[5co2] Car owners not respecting the bus
stop area
[5co3] Bus stops in the middle of the road
[6ca1] Lack of staff in the booking line
service
[6ca2] High call rate during some periods of
the day
6
[6co1] First users thinking the service has
stopped, and giving up
[6co2] Regular travelers frustrated by the
impossibility of making the trip they planned
[7ca1] Lack of buses
[7ca2] High demand for some periods 7
[6co2] Regular travelers frustrated by the
impossibility of making the trip they planned
[8ca1] Lack of communication between the
service and the traveler
[8ca2] Bus is late
[8ca3] Booking line is defined as the
booking line and not a hotline
8 [8co1] Traveler frustrated by uncertainty
[8co2] Confused traveler
[9ca1] Weak shock absorbers
[9ca2] Bumpy/rough road
[9ca3] Fragile physical condition of senior
travelers
9
[9co1] Travelers getting backache
[9co2] Deterioration of the physical comfort
aboard the bus
[9co3] Senior travelers abandoning the
service
[10ca1] Absence of low-floor technology
aboard the bus
[10ca2] Low sidewalk
[10ca3] Weak physical condition of seniors
[10ca4] Need of strollers to transport babies
10 [10co1] Physical discomfort
[10co2] Risk of falls
[1co1] Travelers no longer using the service
[11ca1] Pass validator technical issue 11
[11co1] Travelers thinking their pass is not
valid for the service
[11co2] Travelers trying multiple times and
getting frustrated
For example, travelers no longer using the service is a consequence of the result “traveler annoyed”. All the problems are interrelated, including their causes and consequences. For this reason, a basic causality network is created to sort out some properties of problems (Figure 35). [8ca1] for example, is the most trouble-making problem insofar as it generates multiple further problems (4 arrows out): if the service is not a common transport solution, and if there is no good communication with users and potential
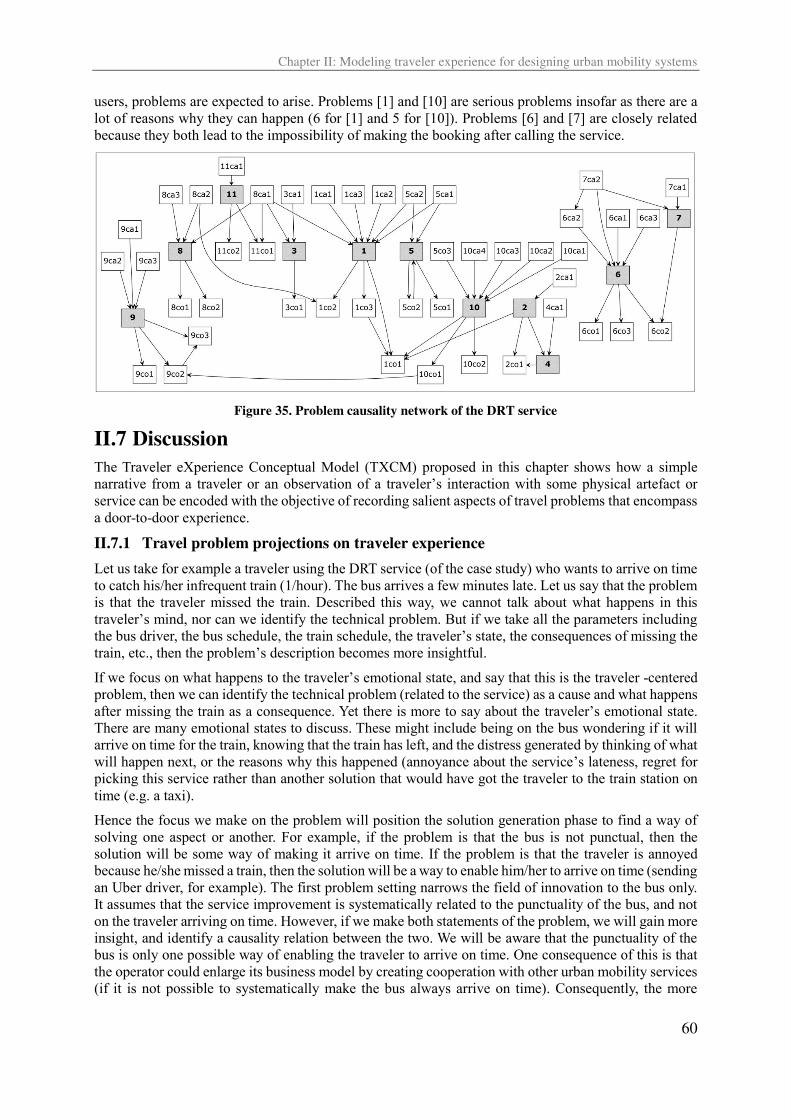
Chapter II: Modeling traveler experience for designing urban mobility systems
60
users, problems are expected to arise. Problems [1] and [10] are serious problems insofar as there are a lot of reasons why they can happen (6 for [1] and 5 for [10]). Problems [6] and [7] are closely related because they both lead to the impossibility of making the booking after calling the service.
Figure 35. Problem causality network of the DRT service
II.7 Discussion
The Traveler eXperience Conceptual Model (TXCM) proposed in this chapter shows how a simple narrative from a traveler or an observation of a traveler’s interaction with some physical artefact or service can be encoded with the objective of recording salient aspects of travel problems that encompass a door-to-door experience.
II.7.1 Travel problem projections on traveler experience
Let us take for example a traveler using the DRT service (of the case study) who wants to arrive on time to catch his/her infrequent train (1/hour). The bus arrives a few minutes late. Let us say that the problem is that the traveler missed the train. Described this way, we cannot talk about what happens in this traveler’s mind, nor can we identify the technical problem. But if we take all the parameters including the bus driver, the bus schedule, the train schedule, the traveler’s state, the consequences of missing the train, etc., then the problem’s description becomes more insightful.
If we focus on what happens to the traveler’s emotional state, and say that this is the traveler -centered problem, then we can identify the technical problem (related to the service) as a cause and what happens after missing the train as a consequence. Yet there is more to say about the traveler’s emotional state. There are many emotional states to discuss. These might include being on the bus wondering if it will arrive on time for the train, knowing that the train has left, and the distress generated by thinking of what will happen next, or the reasons why this happened (annoyance about the service’s lateness, regret for picking this service rather than another solution that would have got the traveler to the train station on time (e.g. a taxi). Hence the focus we make on the problem will position the solution generation phase to find a way of solving one aspect or another. For example, if the problem is that the bus is not punctual, then the solution will be some way of making it arrive on time. If the problem is that the traveler is annoyed because he/she missed a train, then the solution will be a way to enable him/her to arrive on time (sending an Uber driver, for example). The first problem setting narrows the field of innovation to the bus only. It assumes that the service improvement is systematically related to the punctuality of the bus, and not on the traveler arriving on time. However, if we make both statements of the problem, we will gain more insight, and identify a causality relation between the two. We will be aware that the punctuality of the bus is only one possible way of enabling the traveler to arrive on time. One consequence of this is that the operator could enlarge its business model by creating cooperation with other urban mobility services (if it is not possible to systematically make the bus always arrive on time). Consequently, the more
Chapter II: Modeling traveler experience for designing urban mobility systems
61
perspectives we have of traveler experience of the problem, the more readily we can improve the system.
II.7.2 Travel problems between causes and consequences
A travel problem covers not only what the traveler expresses when interviewed, or what is observed, but also the causes and consequences of the central identified problem: the consequences that a problem can generate are also problematic for the traveler. The example of the elderly woman illustrates this fact well. Extending the causes and consequences will bring out more insights into the deepest origins and the farthest consequences where, for each layer, a solution can be proposed.
The problem causality network allowed us to uncover the relationships between problems and opened the possibility of hierarchizing them. It can be further developed using graph theory measures such as betweenness and closeness centrality (Freeman, 1977). This will allow a more accurate and relevant problem hierarchy. Some causes can be combined to obtain a more insightful one. For example, the combined causes of problem 7 (high demand and lack of buses) emphasize the temporality of these two phenomena: addressing each separately (increasing the number of buses and/or diminishing the demand) does not consider the possibility of fluctuation of both, and that at some other times the buses ride empty. To specify the travel problems, it would be relevant to link the expected scenario to the traveler it concerns. In this way, even the number of travelers it concerns would be captured and so make the travel problem hierarchy more accurate. Some of the identified problems can be a strategic design choice. For example, the lack of communication with potential users, if solved, can generate more demand that the service cannot handle. Therefore, it is important to have different stakeholders together to have a better understanding of travel problems.
II.7.3 Nature of travel problems
The solution generation phase is conditioned by the distinction between essential and accidental situations (Gorman, 2005): the predicates related to a component’s nature (essential attributes) need a new design when those related to their accidental attributes can be solved by a change in how the UMS works. For example, if it is only one booking line agent who asks indiscreet questions (accidental), then correcting his/her behavior would solve the problem. Conversely, if it is the fact of asking travelers personal questions that is problematic, then the whole staff will be affected, and the process and databases will need a structural change.
II.7.4 Travel problem identification
Along the design process of an urban mobility system, the traveler’s perspective should be considered; defining performance indicators and identifying the problems to be solved. A problem can be identified just by studying technical systems and thinking of the negative affordances (Maier et al., 2009) it permits. This insight is obtained by making observations or by reviewing technical documents of UMS components, such as architectural plans or specification documents. Of course, deeper insights are obtained by asking the travelers about their experience with specific components that are identified as negative affordance holders. Nonetheless, this way of performing a UMS diagnosis starts and ends with the system to be designed. The final loop does not enable us to assess whether the value expected by travelers is fulfilled, but only how well the solution fits the specifications it was made for in the first place. The traveler’s point of view is included in the considerations of what is problematic with his/her experience with urban mobility systems. However, the designer loses travelers’ perception of the qualities of the UMS, and how close the value it delivers is to the one expected by travelers. For example, a transportation operator uses indicators such as technical efficiency, intensity of use or service coverage to monitor the performance of its lines (Diana & Daraio, 2010). The traveler appears as a unit in ratios such as line length per inhabitant or persons per seat. The traveler’s viewpoint is considered in measuring quality indicators like regularity of schedule, frequency, area coverage, modal preference, speed, walking time and transfers. These indicators are relevant to a holistic assessment of a service with diverse metrics. However, they do not provide answers on how far each traveler is satisfied with his/her experience using
Chapter II: Modeling traveler experience for designing urban mobility systems
62
the service, and the reasons for his/her dissatisfaction with the service’s qualities related to traveler experience dimensions.
II.8 Conclusion
The chapter starts from different perspectives on urban mobility systems to show how complex it is to consider such systems as objects of design. We then stress the relevance of the UX approach for modeling traveler experience of UMSs, insofar as the chapter illustrates possible interactions between travelers and artefacts during a door-to-door journey. For that reason, UX was adopted for designing the conceptual model and adapted to match UMS complexity factors (multimodality, connection with other urban systems, supply-demand recursion, etc.). Observations uncovered the diversity of situations, technical system varieties, and contextualized micro-interactions. Workshops and interviews with travelers brought out problems of dichotomy between real and expected travel scenarios. Finally, case studies showed how travel problems can be identified from travelers’ narratives, and how they affect the solution generation phase in the design process. The conceptual model allows scaling from elementary interactions to travel episodes. This has the capacity to bring out the repercussion of the problems that arise at the interaction scale for the whole travel experience, including what happens to the urban activities the traveler expects to exercise. Yet the conceptual model, in its current form, does not enable us to extract qualitative information from the traveler experience. For example, the travel value vector (e.g. sensory comfort, travel speed, punctuality, price, infotainment, etc.) can be used as a metric to evaluate travel problems, by asking travelers to score each performance. Also, using a set of travel scenarios both expected and real lets us measure the performance of a UMS. On the other hand, if the focus is a traveler profile, the different scenarios can be a basis for measuring the traveler’s satisfaction with a UMS or even at the scale of a city.
These traveler -centered performances can be compared to those a transport operator sets to monitor its UMSs as a stakeholder of traveler experience: the traveler can be considered as a stakeholder at the same level as a transport operator. Both expect value from the UMSs (Lindenau & Böhler-Baedeker, 2014). The comparison will tell us how far a transportation operator is considering the concerns of travelers regarding the performance of the UMSs it is responsible for.
Future research will take an extensively developed quantitative approach to evaluate travel problems using the travel value indicators, for example. Hierarchy will also be developed using the causality network to systematically identify the problems to be solved as a priority. Consequently, the solution generation phase will produce solutions for prioritized problems, and allow the solution to cover all the issues brought out to define the problem. This is a natural consequence, since the problem cannot be fully understood in isolation from consideration of the solution (Eastman et al., 2001).
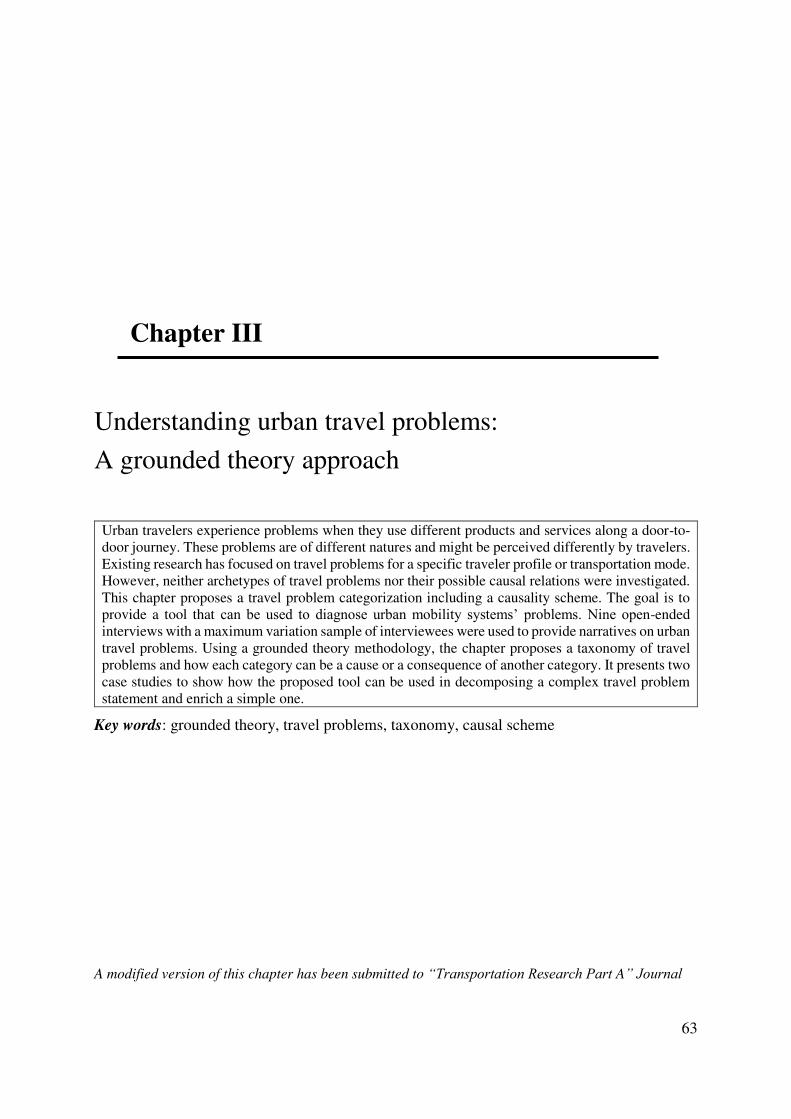
Chapter II: Modeling traveler experience for designing urban mobility systems
63
Chapter III: Understanding urban travel problems: A grounded theory approach
Chapter III
Understanding urban travel problems:
A grounded theory approach
Urban travelers experience problems when they use different products and services along a door-to-
door journey. These problems are of different natures and might be perceived differently by travelers.
Existing research has focused on travel problems for a specific traveler profile or transportation mode.
However, neither archetypes of travel problems nor their possible causal relations were investigated.
This chapter proposes a travel problem categorization including a causality scheme. The goal is to
provide a tool that can be used to diagnose urban mobility systems’ problems. Nine open-ended
interviews with a maximum variation sample of interviewees were used to provide narratives on urban
travel problems. Using a grounded theory methodology, the chapter proposes a taxonomy of travel
problems and how each category can be a cause or a consequence of another category. It presents two
case studies to show how the proposed tool can be used in decomposing a complex travel problem
statement and enrich a simple one.
Key words: grounded theory, travel problems, taxonomy, causal scheme
A modified version of this chapter has been submitted to “Transportation Research Part A” Journal
Chapter III: Understanding urban travel problems: A grounded theory approach
64
III.1 Introduction
Urban mobility challenges lie in three interrelated dimensions: (1) the physical city and region, its
infrastructures and technology, (2) policies and planning strategies and (3) how citizens live their
everyday life moving in the city (Jensen & Lassen, 2011). These issues need multidisciplinary
approaches to propose relevant and sustainable solutions (Pucci, 2016), placing people in the heart of
their construction (Mitchell et al., 2016).
At the scale of urban dwellers, these challenges are experienced, inter alia, in the form of travel
problems. Indeed, travelers use multiple products and services along with a door-to-door journey
(Woodcock et al., 2014). During this journey, they experience difficulties, issues, challenges, or
problems that need a relevant solution design. Indeed, in design practice, getting more about usage
problems gives the designer the knowledge to design more relevant solutions for the users (Osterwalder
et al., 2014, p.14). Research studying travel problems is sparse and uses multiple names to talk about
the negative aspects of a traveler experience.
Indeed, transit-related research covers a bigger scope than traveler experience. It includes supply-
demand balancing (Mcdermott, 1978) and policy related issues (Hook et al., 2014). The traveler is
involved in representing the voice of the citizen in a wide range of transit-problems (Schachter & Liu,
2005) (Gaber & Gaber, 1999). Commuter/passenger needs/issues mostly describe problems related to a
specific system. This could be a transport service (Sutton, 1987), an information system (Spyridakis et
al., 1991), or an institutional small geographic area (Miller, 1986). Transportation and transport, in turn,
cover different scales of problems or needs. These can be very precise such as seatbelt issues (Linden et
al., 1996), or global such as accessibility and safety (Porter, 2010). On the other hand, they are either
specific to a mode of transport (Gatersleben & Uzzell, 2003) (Katzev, 2003) or to a traveler profile
(Knight et al., 2007) (Sammer et al., 2012) (Hjorthol, 2013).
Even though these studies involve travelers in defining their travel problems through surveys or focus
groups, they lack abstraction in proposing archetypal categories of problems that might apply to all types
of urban mobility systems, at different scales, and to all traveler profiles. Moreover, these studies are
restrained by the preconceived views of the researchers on travel problems. Indeed, they are classified
in pre-defined sets such as “cost, stress, time, and fatigue” (Talbot et al., 2016) or “cost, time, insecurity, discomfort, impact on communities” (Raymundo & Reis, 2017). Delbosc & Currie (2011b) brought out
the causality between the traveler’s condition and travel problems. However, the proposed travel
problems were considered independently, not taking into account how the condition of a traveler could
have an impact on the experience itself and not considering possible causalities between the encountered
problems. Morin (2014) has observed a dialogic pattern in defining complex problems and points out
the importance of considering non-intuitive causation directions, where a problem can be the cause
and/or the consequence of another one. Al Maghraoui et al. (2017) infer travel problem causes and
consequences considering them as problems. However, the causation possibilities between travel
problems still need a repository of potential travel problems on which the inference can be done.
Summarily, no existing study seems to propose an archetypal modeling of travel problems and how
travelers experience these in combination. Design communities, however, propose archetypal models
and definitions. For instance, Osterwalder et al. (2014, p.14) use the concept of pain which describes all
that annoys the user before, during, and after trying to reach his/her goal using a product or service. By
explicating the pains, solutions would naturally appear as pain relievers. However, such abstract
concepts need the right tailoring to the context in which they are applied. For instance, Pronello &
Camusso (2017) illustrates how the concept of “value proposition” applies on travelers’ needs for information.
This chapter addresses the following research question: What are the problems travelers experience using urban mobility systems?
Firstly, the grounded theory methodology is introduced and used in generating the taxonomy and its
causality scheme. Second, the categories of travel problems and their inter-causation are exposed and
Chapter III: Understanding urban travel problems: A grounded theory approach
65
discussed. Finally, a case study is used to illustrate how the taxonomy and its network can be used to
diagnose travel problems of an urban mobility system.
III.2 Research method
The research methodology has been adopted from grounded theory literature (Charmaz, 2014). It starts
from narratives and ends with a theory on the research question of interest. This research is intended to
draw the perspective of travelers on travel problems with minimal literature bias. However, grounded
theory is frequently performed by one researcher, which is the case for this research. Consequently, the
modeler bias will still be there.
Four interviews, as an initial sample, have passed through a three-stage coding process (Figure 36)
leading to an initial model as a set of categories. Saturation tests have then been operated on this model
in order to add missing categories and enrich category definition.
Figure 36. Research methodology stages
III.2.1 Initial sampling and interviewing
To cover most of the transportation modes with a minimal sample, the maximum variation sampling
(Patton, 2005) has been chosen for four modes; walk, car, bike, and public transport. The four
interviewees have been selected based on their modal choice for urban mobility to cover a large spectrum
of travel problems in the dimension of the used technical systems: one exclusive cycler, one exclusive
pedestrian, one exclusive public transport user, and one exclusive car/motorcycle driver. Three of them
work as researchers at the Austrian Institute of Technology (at the same location) and one studies at the
University of Vienna. Each of them spends less than 45 minutes to commute.
The questions were asked in an open-ended interview format. Some clarification questions were added
to clarify some answers or to draw attention on unanswered aspects of the question. The interviewees
were asked to freely talk about their travel experience. They were then asked to talk about their travel
problems and relate their causes and consequences afterward. Finally, they were invited to think of what
is problematic in the problems they identified and propose a definition of a “travel problem”.
III.2.2 Initial and focused coding
The narratives of the interviews have been transcribed and coded interview by interview. The coding
method was sentence by sentence and sometimes two or three sentences. The initial coding consisted of
removing from the narratives the grammatical structure and mark down only the items that are linked to
the question. For example, “I am a scientist in the area of transportation, mathematician. I do like to cycle since we talk about mobility. That's my main transport for a long time now. I lived all over the world and used it wherever I was. Even when no one cycles there”. Is coded as Mathematician, exclusive cycler since always, cosmopolitan. However, causative connectors such as “so”, “because”, or “that’s why” are recorded in the form of arrows that define causal links. The arrows are kept when categories are created. They consequently connect the categories and not only the instances.
Chapter III: Understanding urban travel problems: A grounded theory approach
66
The initial codes are abstracted into concepts that regroup these first codes as instances (focused coding).
For example, “mathematician”, “urban sociologist”, “student” are instances of work nature concepts. Each of the categories that are identified from theoretical coding is allocated to a definition, following
the logic of abstraction of codes.
III.2.3 Coding refinement
Thirty categories have been obtained from the focused coding (Appendix 1). These are refined according
to the following criteria:
• A category that is embedded into another one is integrated into it. For example, “technical system capacity” is integrated into “essential technical state”.
• Precisions are added in a category that is likely to be integrated into another one. For example,
in “situation from travelers”, “travelers” are assumed included in “context” to be included in the category “situation from context”.
• A category that is too abstract and contains too many instances compared to the others, is split
into two or more categories. For example, “altered usage” contains 16 instances. It is split into “passive usage change” and “active usage change”.
• A name or a definition of a category is changed when it does not reflect the instances. For
example, “Physical feeling” is changed into “Physical reaction” since it contains “sweat” and “get cold” as instances.
• Categories are organized in a way that facilitates theoretical coding. For example, categories
that concern the state of the system are put together with a specific color (Appendix 2).
III.2.4 Categories saturation and theoretical coding
The model given by the initial sample is tested regarding its data and theoretical saturations (Saunders
et al., 2018). Data (or code) saturation is assumed to be reached when no new category is created or a
category is split (Hennink et al., 2017). On the other hand, theoretical saturation is assumed to be reached
when no new properties are added to category definition (Morse, 1995).
To achieve the data saturation test, narratives from three other interviews (two from the greater Paris
metropolitan area and one from Singapore) are used. The two Parisian interviewees are exclusive public
transport users. The Singaporean one uses mostly public transport and car from time to time. The
Viennese, Parisian, and Singaporean environments are assumed to have similar urban mobility
problems. One by one, the codes from each interview are integrated into the Viennese theoretical model
(Appendix 1). The instances that fit within the initial theoretical model are added. Whenever they do not
fit, a new category is created. No new category was created while adding instances from the three
interviews. Therefore, data saturation was assumed achieved by the fourth interview from the initial
sampling.
To achieve the theoretical saturation test, a theoretical sampling is conducted (Coyne, 1997) to detail
(1) categories lacking distinctive insights from the other categories; (2) categories containing few
instances that do not reflect directly and clearly the definition. For example, some instances could fit
within more than one category such as “no seated place available” that can fit in either “simultaneous use” or “number of users” in the taxonomy of Appendix 3. Two interviews are conducted to clarify some
of the categories and generate more instances for some others. This led to displace some instances and
modify some categories. Interviewees are researchers who have an expertise regarding urban mobility
usage problems.
Theoretical coding is the last modeling phase. It is based on saturated categories after the theoretical
sampling. In the travel problems model, categories are linked to each other forming both a taxonomy
and a causality scheme. The organized categories are represented in the form of a diagram (Strauss and
Corbin, 1998, p.153).
Chapter III: Understanding urban travel problems: A grounded theory approach
67
III.3 Results
From interview transcription to theoretical coding, the different stages of the grounded theory approach
allowed proposing a taxonomy of travel problems in the usage of urban mobility systems. Moreover, it
allowed linking different travel problem categories in a causality scheme. The answers given by different
interviewees on how they define travel problems allowed proposing a travel problem definition.
III.3.1 Travel problems taxonomy
Travel problems, as perceived by travelers, are of different natures. They concern different facets of
how a traveler experiences his/her usage of an urban mobility system. There are six kinds (blocks) of
travel problems (Table 13).
1. The state of the system: How the system is designed, operated, and planned can be a problem for the
traveler. This is in both essential and accidental forms of design and operation. For example, a bus can
be scheduled to have a frequency of one per hour (essential functional state), if a traveler misses it he/she
needs to wait for one hour. It may have a delay or may be canceled (accidental functional state) and
delay all the day’s schedule of its users. The population density in the area where it operates grows and the frequency remains the same (technical state planning). The bus may serve an intercity train station,
where travelers carry big luggage, and yet may have no bag-racks (essential technical state). It is a hot
summer day; the bus has an air conditioner, but it is out of order (accidental technical state).
2. Situations: What happens around the traveler, apart from how the system is designed and operated,
can be a problem for the traveler? A situation can come from traveler’s surroundings, the behavior of
other travelers, or because of multiple travelers using the same system. Without an umbrella, if it starts
raining, it is a problem (a situation from context). If a traveler wants to read a book during his journey
and there is someone playing rap-music in his phone (traveler’s behavior), it is a problem. A traveler
who has back issues, not finding a seated place in a crowded bus (simultaneous travelers) is a problem.
3. Travel change: If the course of the travel or its consequences does not meet the expectations of the
traveler, it is a problem. This shift from what is expected to what happens for real can take different
forms. A traveler can miss his/her train to go to work (passive change) after a run to arrive at the station.
He/she can then find an alternative if he/she does not want to wait for the next one (active change).
He/she probably, therefore, arrives late at his/her morning important meeting (beyond-travel change).
4. Experience measure: What constraints the traveler depending on his/her prior travel experiences can
be a problem. The measure can be taken either to avoid a situation, to protect oneself from a situation if
it happens, or just to remain aware of what happens around. If a cycler has to spend 20 more minutes
just to avoid a tram rail where he/she slipped once (avoidance measure), it could be a problem. If one
has a big umbrella and needs to carry it all the time because it could rain anytime (just-in-case measure),
it is a problem. An information system that shows the wrong information frequently needs double
checking each time (cognitive measure) one wants to schedule his/her journey, which can be irritating.
5. Traveler reaction: How the traveler reacts to a state of the system, a situation, a travel change, or an
experience measure, can be a problem. A reaction can be behavioral, emotional, or physical. If a traveler
uses a line where nobody respects the queue, he/she will in turn not respect it (behavioral reaction). If a
traveler has a headache and gets in a wagon full of teenagers making noise, he/she would be irritated
(emotional reaction). If a traveler runs on a sunny day to get his train, he/she would sweat (physical
reaction).
6. Condition: What conditions the travel and the traveler as a person. It is the ground on which a state
of the system, a situation, a travel change, an experience measure, or a traveler reaction become
problematic. A condition can be either psychological, physical, cognitive, related to the transport mode,
or comes from before and after the travel. Someone who has been educated to be punctual (psychological
condition) suffers a lot (embarrassed) if he/she arrives late at a meeting. A traveler who uses a wheelchair
(physical condition) is more challenged than a regular person (not needing a wheel chair) when using
public transport. Someone who does not have a driving license cannot use a car (modal condition).
He/she is constrained to use public transport or a bike for example. Someone who does not have a shower
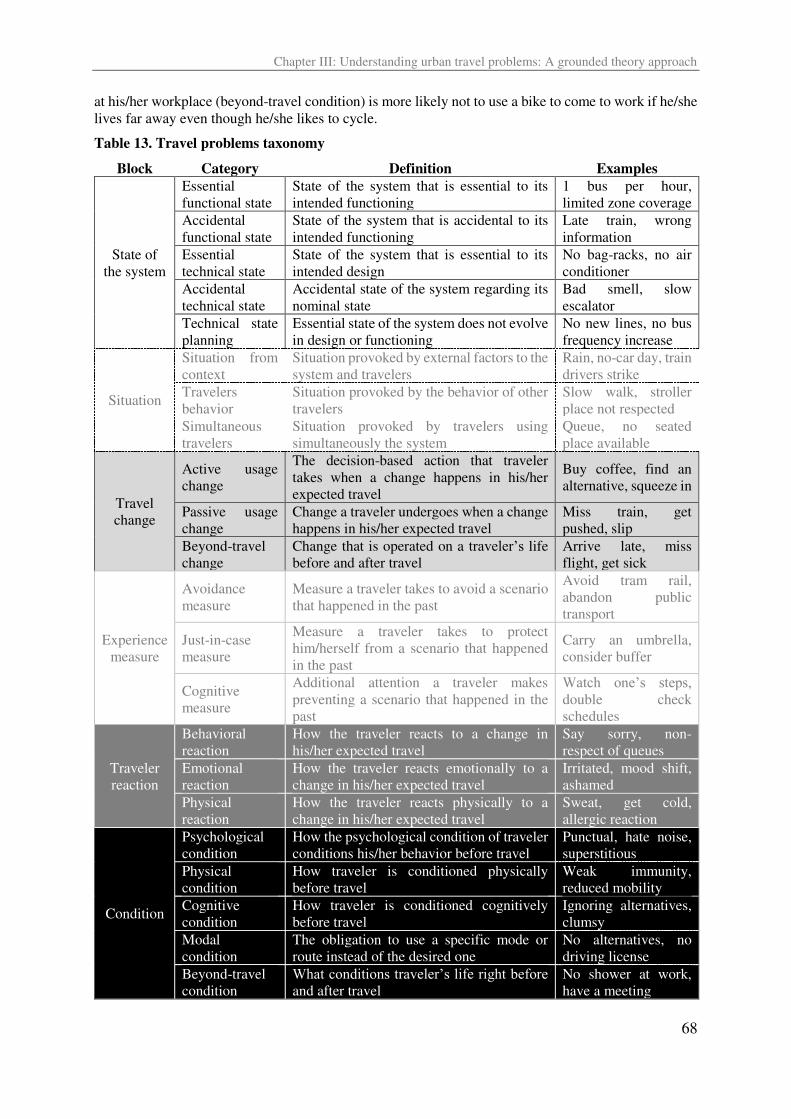
Chapter III: Understanding urban travel problems: A grounded theory approach
68
at his/her workplace (beyond-travel condition) is more likely not to use a bike to come to work if he/she
lives far away even though he/she likes to cycle.
Table 13. Travel problems taxonomy
Block Category Definition Examples
State of
the system
Essential
functional state
State of the system that is essential to its
intended functioning
1 bus per hour,
limited zone coverage
Accidental
functional state
State of the system that is accidental to its
intended functioning
Late train, wrong
information
Essential
technical state
State of the system that is essential to its
intended design
No bag-racks, no air
conditioner
Accidental
technical state
Accidental state of the system regarding its
nominal state
Bad smell, slow
escalator
Technical state
planning
Essential state of the system does not evolve
in design or functioning
No new lines, no bus
frequency increase
Situation
Situation from
context
Situation provoked by external factors to the
system and travelers
Rain, no-car day, train
drivers strike
Travelers
behavior
Situation provoked by the behavior of other
travelers
Slow walk, stroller
place not respected
Simultaneous
travelers
Situation provoked by travelers using
simultaneously the system
Queue, no seated
place available
Travel
change
Active usage
change
The decision-based action that traveler
takes when a change happens in his/her
expected travel
Buy coffee, find an
alternative, squeeze in
Passive usage
change
Change a traveler undergoes when a change
happens in his/her expected travel
Miss train, get
pushed, slip
Beyond-travel
change
Change that is operated on a traveler’s life
before and after travel
Arrive late, miss
flight, get sick
Experience
measure
Avoidance
measure
Measure a traveler takes to avoid a scenario
that happened in the past
Avoid tram rail,
abandon public
transport
Just-in-case
measure
Measure a traveler takes to protect
him/herself from a scenario that happened
in the past
Carry an umbrella,
consider buffer
Cognitive
measure
Additional attention a traveler makes
preventing a scenario that happened in the
past
Watch one’s steps, double check
schedules
Traveler
reaction
Behavioral
reaction
How the traveler reacts to a change in
his/her expected travel
Say sorry, non-
respect of queues
Emotional
reaction
How the traveler reacts emotionally to a
change in his/her expected travel
Irritated, mood shift,
ashamed
Physical
reaction
How the traveler reacts physically to a
change in his/her expected travel
Sweat, get cold,
allergic reaction
Condition
Psychological
condition
How the psychological condition of traveler
conditions his/her behavior before travel
Punctual, hate noise,
superstitious
Physical
condition
How traveler is conditioned physically
before travel
Weak immunity,
reduced mobility
Cognitive
condition
How traveler is conditioned cognitively
before travel
Ignoring alternatives,
clumsy
Modal
condition
The obligation to use a specific mode or
route instead of the desired one
No alternatives, no
driving license
Beyond-travel
condition
What conditions traveler’s life right before and after travel
No shower at work,
have a meeting
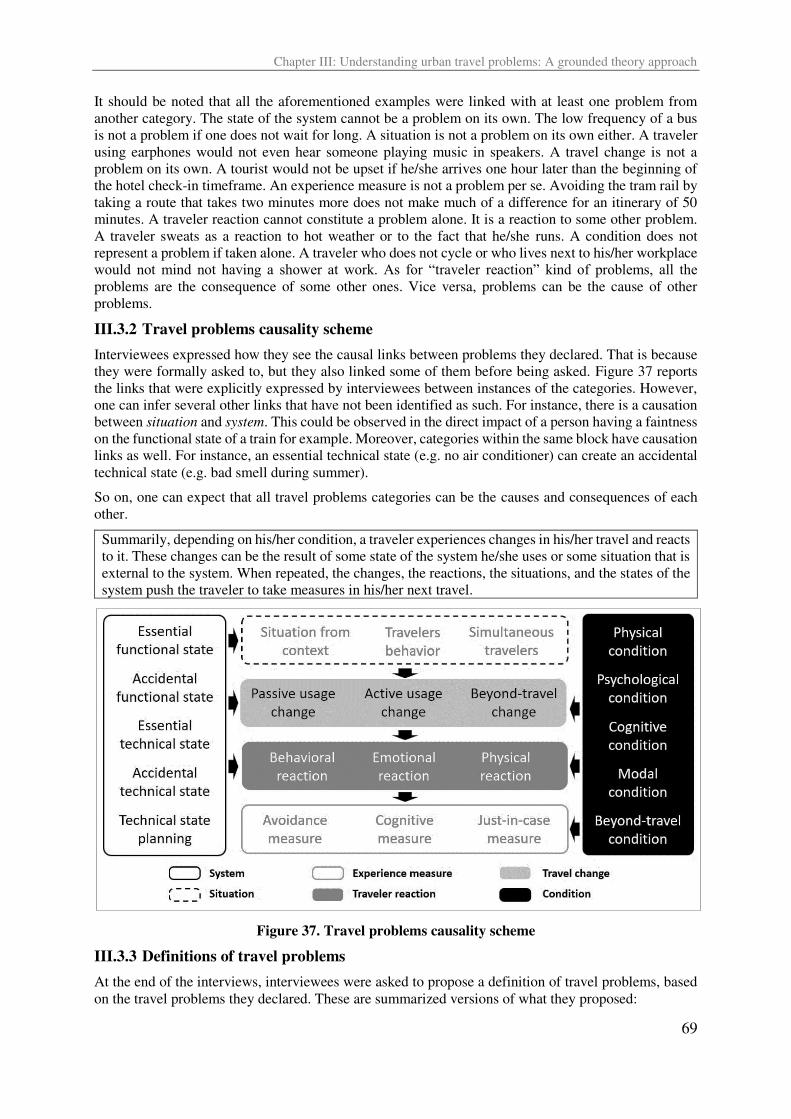
Chapter III: Understanding urban travel problems: A grounded theory approach
69
It should be noted that all the aforementioned examples were linked with at least one problem from
another category. The state of the system cannot be a problem on its own. The low frequency of a bus
is not a problem if one does not wait for long. A situation is not a problem on its own either. A traveler
using earphones would not even hear someone playing music in speakers. A travel change is not a
problem on its own. A tourist would not be upset if he/she arrives one hour later than the beginning of
the hotel check-in timeframe. An experience measure is not a problem per se. Avoiding the tram rail by
taking a route that takes two minutes more does not make much of a difference for an itinerary of 50
minutes. A traveler reaction cannot constitute a problem alone. It is a reaction to some other problem.
A traveler sweats as a reaction to hot weather or to the fact that he/she runs. A condition does not
represent a problem if taken alone. A traveler who does not cycle or who lives next to his/her workplace
would not mind not having a shower at work. As for “traveler reaction” kind of problems, all the problems are the consequence of some other ones. Vice versa, problems can be the cause of other
problems.
III.3.2 Travel problems causality scheme
Interviewees expressed how they see the causal links between problems they declared. That is because
they were formally asked to, but they also linked some of them before being asked. Figure 37 reports
the links that were explicitly expressed by interviewees between instances of the categories. However,
one can infer several other links that have not been identified as such. For instance, there is a causation
between situation and system. This could be observed in the direct impact of a person having a faintness
on the functional state of a train for example. Moreover, categories within the same block have causation
links as well. For instance, an essential technical state (e.g. no air conditioner) can create an accidental
technical state (e.g. bad smell during summer).
So on, one can expect that all travel problems categories can be the causes and consequences of each
other.
Summarily, depending on his/her condition, a traveler experiences changes in his/her travel and reacts
to it. These changes can be the result of some state of the system he/she uses or some situation that is
external to the system. When repeated, the changes, the reactions, the situations, and the states of the
system push the traveler to take measures in his/her next travel.
Figure 37. Travel problems causality scheme
III.3.3 Definitions of travel problems
At the end of the interviews, interviewees were asked to propose a definition of travel problems, based
on the travel problems they declared. These are summarized versions of what they proposed:
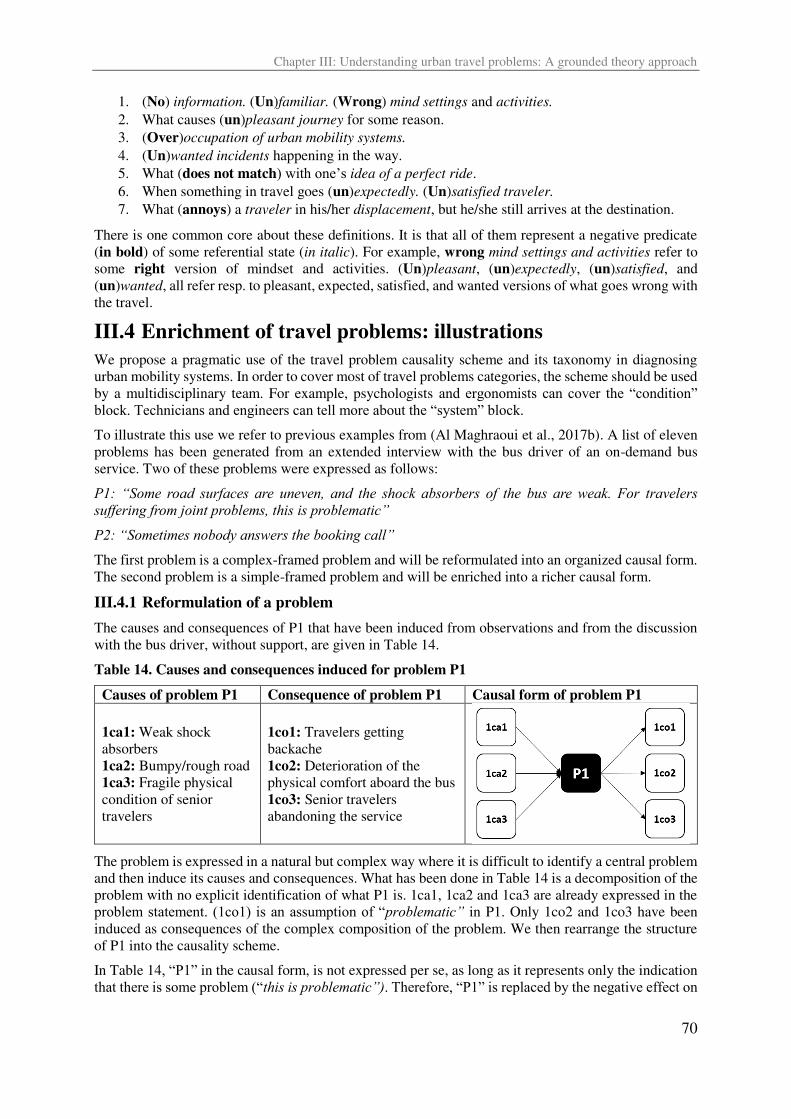
Chapter III: Understanding urban travel problems: A grounded theory approach
70
1. (No) information. (Un)familiar. (Wrong) mind settings and activities. 2. What causes (un)pleasant journey for some reason.
3. (Over)occupation of urban mobility systems. 4. (Un)wanted incidents happening in the way.
5. What (does not match) with one’s idea of a perfect ride.
6. When something in travel goes (un)expectedly. (Un)satisfied traveler. 7. What (annoys) a traveler in his/her displacement, but he/she still arrives at the destination.
There is one common core about these definitions. It is that all of them represent a negative predicate
(in bold) of some referential state (in italic). For example, wrong mind settings and activities refer to
some right version of mindset and activities. (Un)pleasant, (un)expectedly, (un)satisfied, and
(un)wanted, all refer resp. to pleasant, expected, satisfied, and wanted versions of what goes wrong with
the travel.
III.4 Enrichment of travel problems: illustrations
We propose a pragmatic use of the travel problem causality scheme and its taxonomy in diagnosing
urban mobility systems. In order to cover most of travel problems categories, the scheme should be used
by a multidisciplinary team. For example, psychologists and ergonomists can cover the “condition” block. Technicians and engineers can tell more about the “system” block. To illustrate this use we refer to previous examples from (Al Maghraoui et al., 2017b). A list of eleven
problems has been generated from an extended interview with the bus driver of an on-demand bus
service. Two of these problems were expressed as follows:
P1: “Some road surfaces are uneven, and the shock absorbers of the bus are weak. For travelers suffering from joint problems, this is problematic”
P2: “Sometimes nobody answers the booking call”
The first problem is a complex-framed problem and will be reformulated into an organized causal form.
The second problem is a simple-framed problem and will be enriched into a richer causal form.
III.4.1 Reformulation of a problem
The causes and consequences of P1 that have been induced from observations and from the discussion
with the bus driver, without support, are given in Table 14.
Table 14. Causes and consequences induced for problem P1
Causes of problem P1 Consequence of problem P1 Causal form of problem P1
1ca1: Weak shock
absorbers
1ca2: Bumpy/rough road
1ca3: Fragile physical
condition of senior
travelers
1co1: Travelers getting
backache
1co2: Deterioration of the
physical comfort aboard the bus
1co3: Senior travelers
abandoning the service
The problem is expressed in a natural but complex way where it is difficult to identify a central problem
and then induce its causes and consequences. What has been done in Table 14 is a decomposition of the
problem with no explicit identification of what P1 is. 1ca1, 1ca2 and 1ca3 are already expressed in the
problem statement. (1co1) is an assumption of “problematic” in P1. Only 1co2 and 1co3 have been
induced as consequences of the complex composition of the problem. We then rearrange the structure
of P1 into the causality scheme.
In Table 14, “P1” in the causal form, is not expressed per se, as long as it represents only the indication
that there is some problem (“this is problematic”). Therefore, “P1” is replaced by the negative effect on
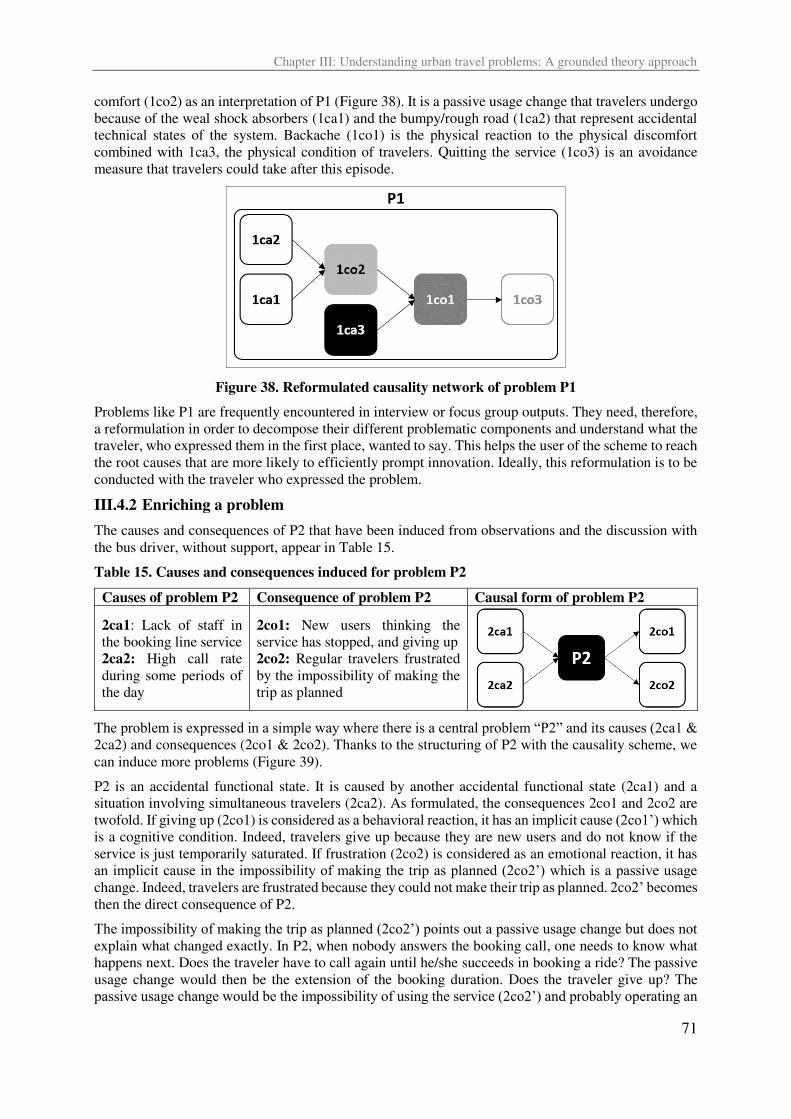
Chapter III: Understanding urban travel problems: A grounded theory approach
71
comfort (1co2) as an interpretation of P1 (Figure 38). It is a passive usage change that travelers undergo
because of the weal shock absorbers (1ca1) and the bumpy/rough road (1ca2) that represent accidental
technical states of the system. Backache (1co1) is the physical reaction to the physical discomfort
combined with 1ca3, the physical condition of travelers. Quitting the service (1co3) is an avoidance
measure that travelers could take after this episode.
Figure 38. Reformulated causality network of problem P1
Problems like P1 are frequently encountered in interview or focus group outputs. They need, therefore,
a reformulation in order to decompose their different problematic components and understand what the
traveler, who expressed them in the first place, wanted to say. This helps the user of the scheme to reach
the root causes that are more likely to efficiently prompt innovation. Ideally, this reformulation is to be
conducted with the traveler who expressed the problem.
III.4.2 Enriching a problem
The causes and consequences of P2 that have been induced from observations and the discussion with
the bus driver, without support, appear in Table 15.
Table 15. Causes and consequences induced for problem P2
Causes of problem P2 Consequence of problem P2 Causal form of problem P2
2ca1: Lack of staff in
the booking line service
2ca2: High call rate
during some periods of
the day
2co1: New users thinking the
service has stopped, and giving up
2co2: Regular travelers frustrated
by the impossibility of making the
trip as planned
The problem is expressed in a simple way where there is a central problem “P2” and its causes (2ca1 & 2ca2) and consequences (2co1 & 2co2). Thanks to the structuring of P2 with the causality scheme, we
can induce more problems (Figure 39).
P2 is an accidental functional state. It is caused by another accidental functional state (2ca1) and a
situation involving simultaneous travelers (2ca2). As formulated, the consequences 2co1 and 2co2 are
twofold. If giving up (2co1) is considered as a behavioral reaction, it has an implicit cause (2co1’) which is a cognitive condition. Indeed, travelers give up because they are new users and do not know if the
service is just temporarily saturated. If frustration (2co2) is considered as an emotional reaction, it has
an implicit cause in the impossibility of making the trip as planned (2co2’) which is a passive usage change. Indeed, travelers are frustrated because they could not make their trip as planned. 2co2’ becomes then the direct consequence of P2.
The impossibility of making the trip as planned (2co2’) points out a passive usage change but does not explain what changed exactly. In P2, when nobody answers the booking call, one needs to know what
happens next. Does the traveler have to call again until he/she succeeds in booking a ride? The passive
usage change would then be the extension of the booking duration. Does the traveler give up? The
passive usage change would be the impossibility of using the service (2co2’) and probably operating an
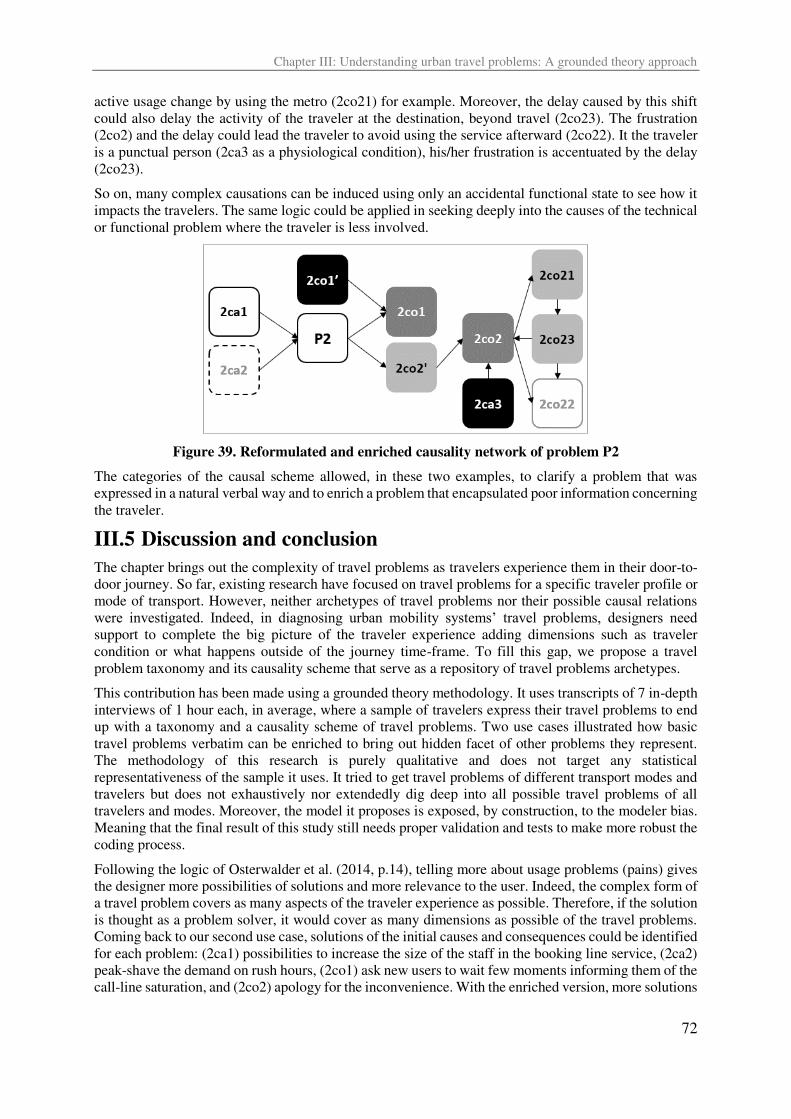
Chapter III: Understanding urban travel problems: A grounded theory approach
72
active usage change by using the metro (2co21) for example. Moreover, the delay caused by this shift
could also delay the activity of the traveler at the destination, beyond travel (2co23). The frustration
(2co2) and the delay could lead the traveler to avoid using the service afterward (2co22). It the traveler
is a punctual person (2ca3 as a physiological condition), his/her frustration is accentuated by the delay
(2co23).
So on, many complex causations can be induced using only an accidental functional state to see how it
impacts the travelers. The same logic could be applied in seeking deeply into the causes of the technical
or functional problem where the traveler is less involved.
Figure 39. Reformulated and enriched causality network of problem P2
The categories of the causal scheme allowed, in these two examples, to clarify a problem that was
expressed in a natural verbal way and to enrich a problem that encapsulated poor information concerning
the traveler.
III.5 Discussion and conclusion
The chapter brings out the complexity of travel problems as travelers experience them in their door-to-
door journey. So far, existing research have focused on travel problems for a specific traveler profile or
mode of transport. However, neither archetypes of travel problems nor their possible causal relations
were investigated. Indeed, in diagnosing urban mobility systems’ travel problems, designers need support to complete the big picture of the traveler experience adding dimensions such as traveler
condition or what happens outside of the journey time-frame. To fill this gap, we propose a travel
problem taxonomy and its causality scheme that serve as a repository of travel problems archetypes.
This contribution has been made using a grounded theory methodology. It uses transcripts of 7 in-depth
interviews of 1 hour each, in average, where a sample of travelers express their travel problems to end
up with a taxonomy and a causality scheme of travel problems. Two use cases illustrated how basic
travel problems verbatim can be enriched to bring out hidden facet of other problems they represent.
The methodology of this research is purely qualitative and does not target any statistical
representativeness of the sample it uses. It tried to get travel problems of different transport modes and
travelers but does not exhaustively nor extendedly dig deep into all possible travel problems of all
travelers and modes. Moreover, the model it proposes is exposed, by construction, to the modeler bias.
Meaning that the final result of this study still needs proper validation and tests to make more robust the
coding process.
Following the logic of Osterwalder et al. (2014, p.14), telling more about usage problems (pains) gives
the designer more possibilities of solutions and more relevance to the user. Indeed, the complex form of
a travel problem covers as many aspects of the traveler experience as possible. Therefore, if the solution
is thought as a problem solver, it would cover as many dimensions as possible of the travel problems.
Coming back to our second use case, solutions of the initial causes and consequences could be identified
for each problem: (2ca1) possibilities to increase the size of the staff in the booking line service, (2ca2)
peak-shave the demand on rush hours, (2co1) ask new users to wait few moments informing them of the
call-line saturation, and (2co2) apology for the inconvenience. With the enriched version, more solutions
Chapter III: Understanding urban travel problems: A grounded theory approach
73
can be considered; (2ca3) communicate the recognition of the importance of being on time, (2co21)
offering regular travelers alternatives, (2co22) offering free rides to bring back the frustrated users, and
(2co23) offering a discounted (or free) taxi ride to help the traveler arrive on time.
The different categories of travel problems that were identified in this study resonate in the literature in
different contexts.
Most of the studies that relate travel problems, take a specific condition of travelers and identify the
problems that are a direct source of this condition. For example, Musselwhite & Haddad (2008),
Rosenbloom (2009) and Talbot et al. (2016) study how psychological and physical condition of seniors
impacts their door-to-door mobility. Rosenbloom et al. (2004) and Wachs (2011) did the same for
women, and Ullman & Schroeder (2014) and Karacaoglu et al. (2015) for disabled travelers. Harris &
Tapsas (2006) and Sammer et al. (2012) investigated the travel problems as the combination of
disadvantaged physical, psychological, cognitive, and modal conditions and essential/accidental states
of the transportation system.
Depending on which scale one is positioned, the functional and technical state of a system changes.
These works have a macroscopic vision of the concept of “state”; Sdoukopoulos et al. (2016) evaluate
the performance of infrastructure and transport modes of Mediterranean countries. Olayinka (2016)
studies travel characteristics in a poor country. Bocarejo S. & Oviedo H. (2012) investigate properties
of a geographical area regarding accessibility. Other works have a microscopic vision of the state of an
urban mobility system; Diana & Daraio (2010) consider for example headways, commercial speed,
vehicle load factors or line capacities as state variables. Hüging et al. (2014) sets CO2 emissions, noise,
or maintenance costs as attributes to evaluate the state of a bus line.
What we called “beyond travel” problems are also the object of some studies. Likins (1986) studies the
effect of a transportation system of the life of students in a campus. Gustafson (2014) mentions the
negative effect of traveling on private and family lives. Fortney et al. (1995) study avoidance measures
travelers take as a factor for low health aftercare.
Some studies consider the recursive causation between travel problems. For instance, Kim & Gallent
(1998) investigate the causation between financial condition of travelers and essential functional state
of bus service (e.g. crowd, delays). Punpuing & Ross (2001) map the many relations between essential
functional states (e.g. traffic, road travel speed) traveler behavior (e.g. commuting time) and traveler
measures (e.g. route change, mode change).
With no explicit causation, some studies have a large coverage of travel problems. Edwards & Smith
(2008) and Zavitsas et al. (2010), for instance, identify at the same time, beyond travel condition (e.g.
population growth), technical state planning (infrastructure flexibility), travel situations (congestion,
pollution peak), travel changes (accidents), essential states (e.g. intermodal facilities) and traveler
measures (modal shift).
The main challenge with using a set of travel problem archetypes is that one has to choose a direction
to investigate. Indeed, the exhaustivity of problems cannot be fully obtained given the time and effort
this might take to a designer. This direction will depend on one’s design intent. If it is to bring more customization of the mobility solution, then the direction would be to investigate the traveler different
conditions. If it is to know how travel problems impact travelers, then the direction would be to
investigate the changes, the reactions, and the measures. If the design intent is to upgrade the technical
solution, then the direction would be the “system” and “situation” dimensions.
Future research would develop extensively the properties of the nodes in the causality networks. This
would allow to put scores on problems and tackles the ones of higher priority depending on the design
intent.

Chapter III: Understanding urban travel problems: A grounded theory approach
74
Chapter IV: Stimulating usage problem generation: An urban mobility case study
75
Chapter IV: Stimulating usage problem generation: An urban mobility case study
Chapter IV
Stimulating usage problem generation:
An urban mobility case study
Designers improve urban mobility solutions by investigating archetypal usage problems in existing
mobility systems. User-centered design methods help accomplish this task, but lack effectiveness
when not supported by appropriate tools. Here we posit that the use of a traveler -centered stimulus
improves the effectiveness of travel problem generation. To test this hypothesis, an experiment is
conducted with two control groups as a baseline for non-stimulated problem generation and two
experimental groups that are provided with a traveler -centered stimulus. The two sets of groups are
composed of one group of urban mobility experts and one group of non-experts. Results show that
stimulated groups generate novel ideas with a greater variety covering most of the traveler experience
dimensions than non-stimulated groups.
Keywords: User centered design, user participation, design problem(s), case study, stimulation
A modified version of this chapter is under revision in “Design Studies” Journal
Chapter IV: Stimulating usage problem generation: An urban mobility case study
76
IV.1 Introduction
Framing problems in design practice can be a hard task if designers are not familiar with the problem
they are dealing with (Dorst, 2011). This is why designers systematically take time to first accumulate
and order the knowledge they need to assimilate the problem at hand (Lawson, 2005: p 34). A large
domain of knowledge in most design methodologies (Tomiyama et al., 2009) concerns the users of the
system to be designed and their archetypal usage patterns (Yannou et al., 2016).
The wider this knowledge, the more successful the user-centered innovation is likely to be, as the system
designed will be made to meet users’ wants and needs rather than manufacturer-centric goals (von
Hippel, 2005). Involving users in the design process is consequently vital to any user-centered design
endeavor (Abras et al., 2004).
User-centered design practice involves users in different ways and forms (Hanington, 2003). Most user-
centered methods involve users in more than just usability-testing (Vredenburg et al., 2002) and also
include diagnosing existing systems, where users are asked to express the problems they experience
using these systems, typically in the form of interviews or focus groups (Céret et al., 2013). However,
diagnosing an existing system remains a technically-centered process that uses the knowledge of the
users as an input to improve technical solutions or solve technical problems (Gasson, 2003).
Human-centered design aims to meet users’ goals and interests (Boy & Narkevicius, 2014). Designers
then become facilitators, setting the design framework where users can co-create with them (Sanders &
Stappers, 2008). This human-systems integration process designing social-technical systems rather than
purely technical ones involves the natural design ability that all users have (Boy & Narkevicius, 2014;
Norman et al., 2016; Cross, 1999). However, for this participatory design practice to be successful,
appropriate tools should be used in order to catalyze user voice (Sanders, 2002). In ideation sessions,
for instance, users are supported with stimuli to unlock broader exploration of different areas of their
knowledge network (Santanen et al., 2004).
This chapter is a part of a research project dealing with human-centered innovation in the context of
urban mobility. Urban mobility has recently gained increased attention from design communities, as it
poses challenges when it comes to designing mobility systems as a simple set of products and services
(Wartzack et al., 2017), and from manufacturers and transport operators as they seek to shift towards a
more traveler -centered vision of urban mobility systems design (OECD, 2014).
People travel from A to B within a geographical area using multiple transportation means and services,
and these systems are produced and operated by different providers (Mitchell et al., 2016), which leads
to travelers experiencing multiple problems when using a combination of these systems in a door-to-
door travel experience. Consequently, the process, models, knowledge, and expertise used in design
need to take into account the complexity of urban mobility systems (Sussman et al., 2005).
Regarding problem identification (Morgan, 1997: p 13), focus groups bring out the global view that
users have concerning a system that they use collectively, such as an urban mobility system (Grosvenor,
2000). However, transportation design research rarely considers travel problems identification as an
design knowledge output (Coughlin, 2001; Kerschner & Aizenberg, 2004; Cunningham et al., 2000).
Even when travelers are asked to express the problems they encounter, they are not supported to open
up and tell more about their traveler experience. Without a traveler -centered stimulus, they end up
expressing a handful of problems that cover a narrow range of dimensions of the traveler experience.
The research question we address in this chapter is: What is the effect of a traveler -centered stimulus on the effectiveness travel problems generation?
To answer this question, an experiment is conducted with four different groups: two control groups are
used as a baseline for a non-stimulated focus group, and two experimental groups are provided with a
model adapted from TXCM—a Traveler eXperience Conceptual Model (Al Maghraoui et al., 2017b).
Working out from four main sources of problems (technical, personal, contextual, and activity-related),
eleven categories are developed as archetypal perceived travel problems.
Chapter IV: Stimulating usage problem generation: An urban mobility case study
77
Section 2 examines the transportation research using user-centered methods to identify usage problems
of urban mobility systems. It then reviews ideation effectiveness metrics to set a basis for evaluating
travel problem generation. Section 3 discusses testing such a design tool in the form of an experiment.
The traveler -centered design tool is then presented as the stimulus that focus group participants use for
travel problem generation. The experimental setup shows how different ideation metrics are evaluated
from the four focus groups. Section 4 analyses the results to uncover how each of the selected ideation
effectiveness metrics is affected by the use of the traveler -centered design tool. This analysis then goes
on to discuss the merits of involving users in developing design tools and how this practice can be
improved for usage problem identification (sections 5 and 6).
IV.2 Background and related research
The knowledge that designers obtain from users can be acquired through the whole design process (Buur
& Matthews, 2008). The ideas that designers get from users through design methods are not only about
the solution but can encompass every single basic element of thought contributing to advancing design
knowledge (Jonson, 2005). Good ideas need appropriate ideation components for users to produce the
targeted knowledge (Hernandez et al., 2010).
Reviewing of the transportation research dealing with the identification of travel problems highlights
how considering the point of view of travelers is crucial to diagnosing urban mobility systems.
Reviewing selected metrics for assessing problems ideation sets a basis for evaluating travel problems
as ideas.
IV.2.1 Identification of travel problems
Using user-centered methods in transport systems research helps emerge insightful problems that
travelers may experience during their use of urban mobility systems.
In diagnosing public transportation systems for users with cognitive disabilities, Fischer & Sullivan Jr.
(2002) involved university researchers, assistive technology specialists, transportation planners, and
technology developers. Traveler input came from answers to surveys and feedback from interviews
with an assistive care community group. Sammer et al. (2012) led a more in-depth analysis of the specific
needs and experiences of impaired-mobility travelers. In addition to surveys, they used face-to-face
interviews to collect information about trips and personal attitudes to social and transport issues with
their impairments, and thus set up a typology of problems based on respondents’ answers.
Katzev (2003) approached transportation problems from the perspective of urban communities. In
demonstrating how car-sharing could be a good solution for environmental and social issues, he studied
car-sharing and car-owning communities through the lens of their mobility behavior. The main metrics
for trip behavior were miles and frequencies. No substantial qualitative material about this behavior was
gathered other than the reasons people had for joining car-sharing communities. A deeper behavior
analysis was conducted by Sopjani et al.(2016) who canvassed new users of an electric carpooling
system for their views and thoughts on how their habits have changed. This allowed them to create user
profiles including variables such as lifestyle, perceived newness, and awareness.
Splitting service quality into different attributes, the trip into different stages, and users into different
profiles, Woodcock et al.(2013) and Ettema et al. (2016) led productive investigations on user
satisfaction with intermodal trips. Differentiation of service quality attributes allowed them to evaluate
overall satisfaction regarding each travel stage and to set each quality attribute. However, they did not
elicit the problems that contribute to travelers’ dissatisfaction nor the causality between different travel stages (e.g. the effect of a bus delay on satisfaction with waiting time at the next transport mode).
The same limitations remerge when designing user-oriented information for transportation systems (S
Hörold et al., 2013). When the trip is modelled as a set of tasks and the information is designed on that
basis, its loses fluidity through the whole journey, especially when travelers are not familiar with using
the online smartphone platforms (Beul-Leusmann et al., 2013). Kremer et al. (2017) proposed a holistic
view of user experience journeys in a bike-sharing system to tackle this lack of through-trip fluidity.
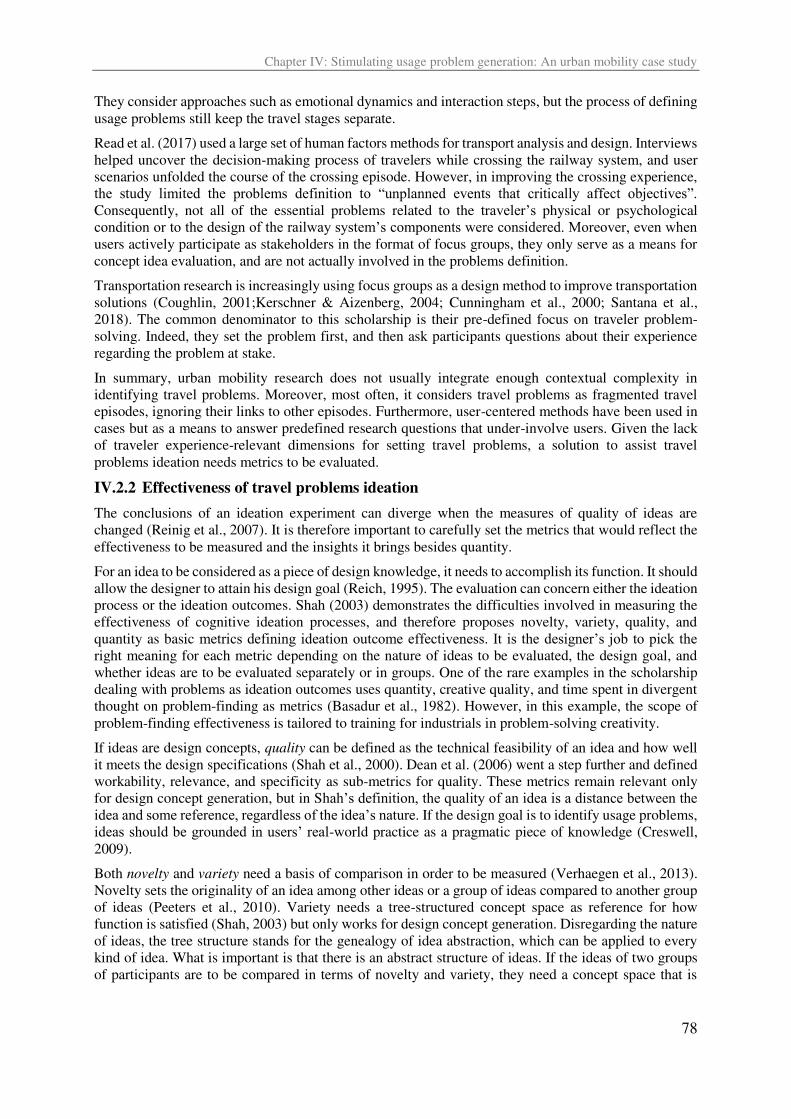
Chapter IV: Stimulating usage problem generation: An urban mobility case study
78
They consider approaches such as emotional dynamics and interaction steps, but the process of defining
usage problems still keep the travel stages separate.
Read et al. (2017) used a large set of human factors methods for transport analysis and design. Interviews
helped uncover the decision-making process of travelers while crossing the railway system, and user
scenarios unfolded the course of the crossing episode. However, in improving the crossing experience,
the study limited the problems definition to “unplanned events that critically affect objectives”. Consequently, not all of the essential problems related to the traveler’s physical or psychological
condition or to the design of the railway system’s components were considered. Moreover, even when users actively participate as stakeholders in the format of focus groups, they only serve as a means for
concept idea evaluation, and are not actually involved in the problems definition.
Transportation research is increasingly using focus groups as a design method to improve transportation
solutions (Coughlin, 2001;Kerschner & Aizenberg, 2004; Cunningham et al., 2000; Santana et al.,
2018). The common denominator to this scholarship is their pre-defined focus on traveler problem-
solving. Indeed, they set the problem first, and then ask participants questions about their experience
regarding the problem at stake.
In summary, urban mobility research does not usually integrate enough contextual complexity in
identifying travel problems. Moreover, most often, it considers travel problems as fragmented travel
episodes, ignoring their links to other episodes. Furthermore, user-centered methods have been used in
cases but as a means to answer predefined research questions that under-involve users. Given the lack
of traveler experience-relevant dimensions for setting travel problems, a solution to assist travel
problems ideation needs metrics to be evaluated.
IV.2.2 Effectiveness of travel problems ideation
The conclusions of an ideation experiment can diverge when the measures of quality of ideas are
changed (Reinig et al., 2007). It is therefore important to carefully set the metrics that would reflect the
effectiveness to be measured and the insights it brings besides quantity.
For an idea to be considered as a piece of design knowledge, it needs to accomplish its function. It should
allow the designer to attain his design goal (Reich, 1995). The evaluation can concern either the ideation
process or the ideation outcomes. Shah (2003) demonstrates the difficulties involved in measuring the
effectiveness of cognitive ideation processes, and therefore proposes novelty, variety, quality, and
quantity as basic metrics defining ideation outcome effectiveness. It is the designer’s job to pick the right meaning for each metric depending on the nature of ideas to be evaluated, the design goal, and
whether ideas are to be evaluated separately or in groups. One of the rare examples in the scholarship
dealing with problems as ideation outcomes uses quantity, creative quality, and time spent in divergent
thought on problem-finding as metrics (Basadur et al., 1982). However, in this example, the scope of
problem-finding effectiveness is tailored to training for industrials in problem-solving creativity.
If ideas are design concepts, quality can be defined as the technical feasibility of an idea and how well
it meets the design specifications (Shah et al., 2000). Dean et al. (2006) went a step further and defined
workability, relevance, and specificity as sub-metrics for quality. These metrics remain relevant only
for design concept generation, but in Shah’s definition, the quality of an idea is a distance between the idea and some reference, regardless of the idea’s nature. If the design goal is to identify usage problems,
ideas should be grounded in users’ real-world practice as a pragmatic piece of knowledge (Creswell,
2009).
Both novelty and variety need a basis of comparison in order to be measured (Verhaegen et al., 2013).
Novelty sets the originality of an idea among other ideas or a group of ideas compared to another group
of ideas (Peeters et al., 2010). Variety needs a tree-structured concept space as reference for how
function is satisfied (Shah, 2003) but only works for design concept generation. Disregarding the nature
of ideas, the tree structure stands for the genealogy of idea abstraction, which can be applied to every
kind of idea. What is important is that there is an abstract structure of ideas. If the ideas of two groups
of participants are to be compared in terms of novelty and variety, they need a concept space that is
Chapter IV: Stimulating usage problem generation: An urban mobility case study
79
embedded in the reality of the problems. The genealogy of the problem space should reflect the diversity
of usage reality and not just physical and working principles as for technical solution ideas.
Quantity is a generic metric that can be applied to any kind of ideas by counting. However, when the
design tool to be evaluated uses examples, it becomes vital to consider design fixation (Jansson & Smith,
1991) in setting quantity metrics. As quantity sub-metrics for design fixation concerns, Atilola et al.
(2016) set quantity of non-redundant ideas, number of repeated example features, and percentage of
example features used. If travel problems are related to each other, then no redundant problem will be
identified as long as each problem is a cause or consequence of a previous one. Moreover, ideation flow
would be sustained by the emergence of new problems that would themselves be used in generating
other ones.
The scholarship considering usage problems as ideas fails to consider the effectiveness of framing usage
problems as an ideation process and problems as ideation outcomes. Therefore, to answer the research
question of this chapter, an experiment is set up with metrics tailored to measure the effect of using a
stimulus on the effectiveness of problem framing.
IV.3 Research method
Identifying usage problems in urban mobility systems starts with an exploratory problem identification
study, for which small-sized focus groups are a suitable ideation format (Morgan, 1997, p 13; Tang &
Davis, 1995). The participants must be made to interact while responding to the facilitator’s questions, because urban mobility problems are mostly experienced collectively. This study is therefore a small-
scale design experiment that needs to be rigorously set (Cash et al., 2012).
Based on the problem framing (as ideation) effectiveness metrics in section 1.2, this chapter evaluates a
stimulus (a design tool) for emerging the travel problems (as ideation outcomes) generated in traveler
focus groups. Quality of the outcomes is assumed as taken for granted, as the travelers themselves
generate the ideas. In comparison with no stimulus, quantity (H1) and variety (H2) are hypothesized to
improve, given the fact that the stimulus takes into account the complexity and travel stages in urban
mobility. Novelty (H3) is assumed to be positive (Figure 40. .
Figure 40. Expected effects of the traveler-centered stimulus on travel problem generation
First, the treatment (the stimulus) is set (Nemeth, 2004, p.299). Then, the experimental procedure,
variables, data collection, and analysis are presented.
IV.3.1 Pilot test
The stimulus went through several iterations before being used in the experiment as the treatment. A
conceptual model of traveler experience built upon travelers’ observations, interviews, and the urban mobility literature (Al Maghraoui et al., 2017) generated a travel problems taxonomy. Subjective
dimensions and travel-problem sources were identified from lead user interviews (Von Hippel, 1986)
and generated a travel-problem sources network. Finally, eleven problematic sources were extracted to
form the so-called “stimulus” used in the experiment (Table 1 and Appendix 5). A pilot experiment was
conducted to test the format of the stimulus and define a logic for coding problems (Figure 2). The
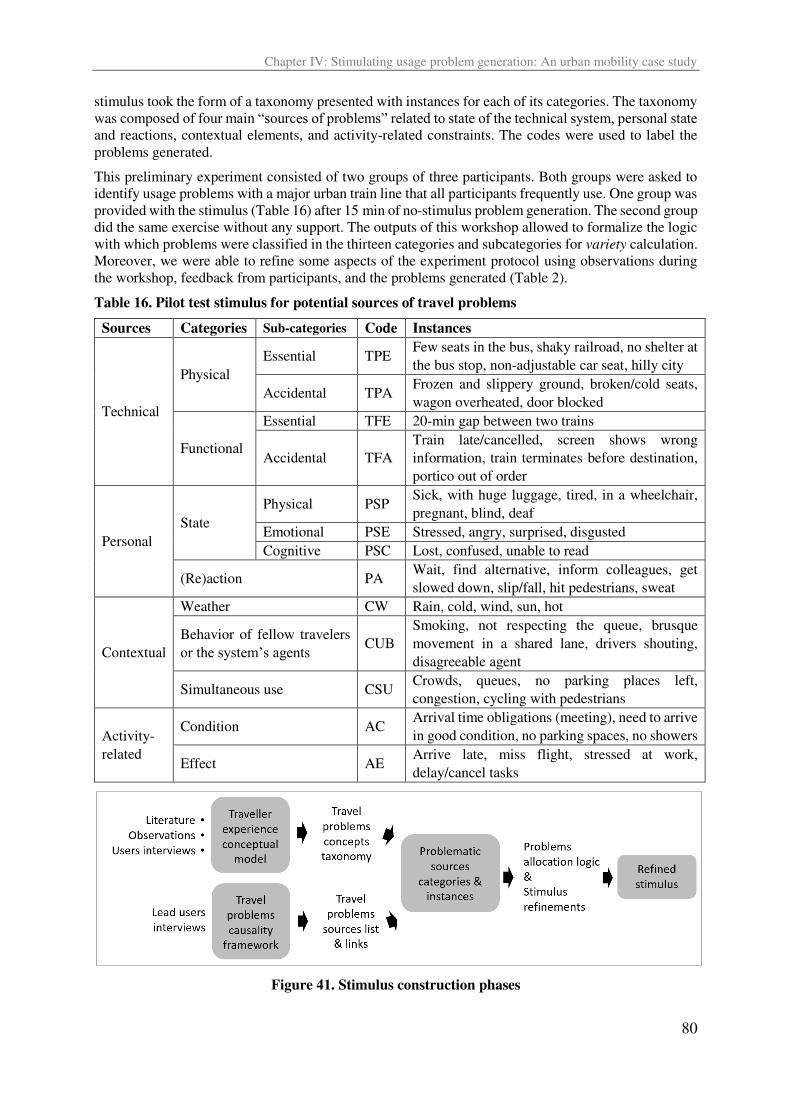
Chapter IV: Stimulating usage problem generation: An urban mobility case study
80
stimulus took the form of a taxonomy presented with instances for each of its categories. The taxonomy
was composed of four main “sources of problems” related to state of the technical system, personal state and reactions, contextual elements, and activity-related constraints. The codes were used to label the
problems generated.
This preliminary experiment consisted of two groups of three participants. Both groups were asked to
identify usage problems with a major urban train line that all participants frequently use. One group was
provided with the stimulus (Table 16) after 15 min of no-stimulus problem generation. The second group
did the same exercise without any support. The outputs of this workshop allowed to formalize the logic
with which problems were classified in the thirteen categories and subcategories for variety calculation.
Moreover, we were able to refine some aspects of the experiment protocol using observations during
the workshop, feedback from participants, and the problems generated (Table 2).
Table 16. Pilot test stimulus for potential sources of travel problems
Sources Categories Sub-categories Code Instances
Technical
Physical
Essential TPE Few seats in the bus, shaky railroad, no shelter at
the bus stop, non-adjustable car seat, hilly city
Accidental TPA Frozen and slippery ground, broken/cold seats,
wagon overheated, door blocked
Functional
Essential TFE 20-min gap between two trains
Accidental TFA
Train late/cancelled, screen shows wrong
information, train terminates before destination,
portico out of order
Personal
State
Physical PSP Sick, with huge luggage, tired, in a wheelchair,
pregnant, blind, deaf
Emotional PSE Stressed, angry, surprised, disgusted
Cognitive PSC Lost, confused, unable to read
(Re)action PA Wait, find alternative, inform colleagues, get
slowed down, slip/fall, hit pedestrians, sweat
Contextual
Weather CW Rain, cold, wind, sun, hot
Behavior of fellow travelers
or the system’s agents CUB
Smoking, not respecting the queue, brusque
movement in a shared lane, drivers shouting,
disagreeable agent
Simultaneous use CSU Crowds, queues, no parking places left,
congestion, cycling with pedestrians
Activity-
related
Condition AC Arrival time obligations (meeting), need to arrive
in good condition, no parking spaces, no showers
Effect AE Arrive late, miss flight, stressed at work,
delay/cancel tasks
Figure 41. Stimulus construction phases
Chapter IV: Stimulating usage problem generation: An urban mobility case study
81
Table 17. Refinements of the experimental protocol learned from the pilot experiment
Pilot experiment issue Proposed modification
The limit between accidental and essential problems is not clear
Define accidental problems as problems that are
not connected to the design of the system
The group with stimulus has less time because
of the explanation phase
Propose a coffee break for the two other groups
with a discussion topic far divorced from the
transport problems
Several problem categories were not or only
poorly covered by both groups
Highlight these categories as consequences or
causes of the problems from other categories
Abstract categories confuse participants Remove the taxonomy and leave only a list of
eleven categories (some were merged)
Scholarly vocabulary confuses participants Use regular language for labelling categories
Examples alter the preciseness and originality
of the generated problems
Explain the categories textually and give examples
that are not related to the system to be diagnosed
verbally
Written examples given to participants with the
stimulus caused fixation
Replace written examples with a simple
description and give verbal examples
Both groups failed to identify emotion, body, mind, do, and arrival problems
Emphasize them as consequences of the
commonly-identified categories
Participants with stimulus did not use the
connections between categories
Replace the connections by an arrow that goes
from categories commonly identified to the non-
identified ones
Participants with stimulus continued generating
problems until the end of the session whereas
the other groups stop earlier
Use the evolution of problem generation as a
dependent variable to evaluate impact of the
stimulus on ideation dynamics (as in Tyl et al.
(2014)
Participants said more than they wrote Give the instruction: if someone wants to speak,
they need to write down his/her idea as a problem
Some problems had a complex formulation that
places them in more than one category Set the problems labelling logic
The final stimulus consists of eleven categories of travel problems. They are presented to participants
as potential archetypal sources of travel problems to stimulate their memory of using the urban mobility
system under study. Each category is explained by a name and a description (Appendix 6). Category
blocks are presented as two sets. ‘Design’, ‘operation’, ‘system problem’, ‘operation problem’, ‘weather’, and ‘people’ represent the “objective” categories recognized by the pilot experiment participants from both groups, while ‘do’, ‘body’, ‘mind’, ‘emotion’, and ‘arrival’ represent the “subjective” categories where no problem was identified by either group (Table 3). There is a causality that operates between the two sets, which participants are invited to think through.
Because some problems were formulated in a complex way, they fit into more than one category. For
example, “Last week we waited inside the train for more than 30 min” is labelled both “Do” and “Op problem” as the participants expressed what they did in the train that had an operational problem.
Other kinds of problem labels were not clearly identifiable, especially operation problems. For example,
“the headways are not well planned. Sometimes two trains arrive within 4min when other times there a
20 min gap is, even at the same point of the day” is an operational problem insofar as it talks about a train that is behind or ahead of its schedule. On the other hand, it is an observation of a fault in the global
train line system’s operations. As the problem is formulated explicitly as “not well planned” and the delay issue is labelled both “operation” and “Op problem”, there is no room for interpretation on labelling. If a problem is not explicitly formulated, it is not labelled.
Less identifiable labels are found in problems formulated with the word “problem” without further explanation. For example, “problems with suspicious luggage” can be classified in almost all the categories. Indeed, it depends the meaning projected for the word “problem”: if we are talking about the
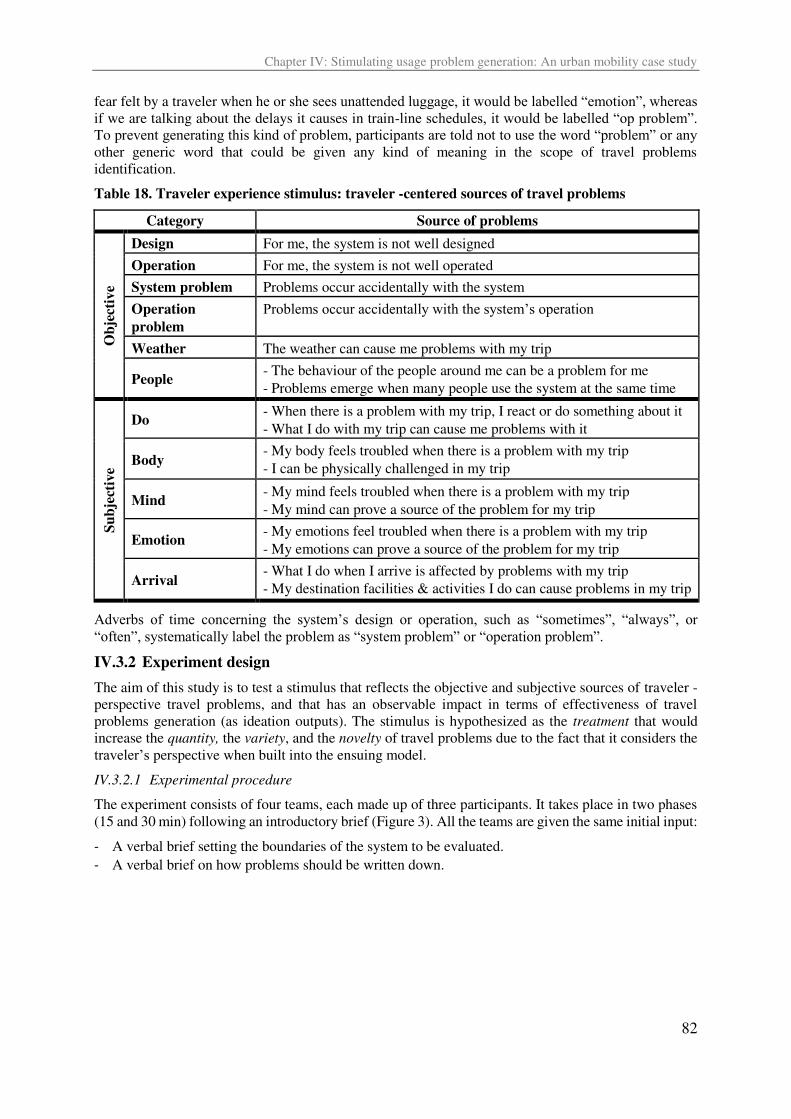
Chapter IV: Stimulating usage problem generation: An urban mobility case study
82
fear felt by a traveler when he or she sees unattended luggage, it would be labelled “emotion”, whereas if we are talking about the delays it causes in train-line schedules, it would be labelled “op problem”. To prevent generating this kind of problem, participants are told not to use the word “problem” or any other generic word that could be given any kind of meaning in the scope of travel problems
identification.
Table 18. Traveler experience stimulus: traveler -centered sources of travel problems
Category Source of problems
Ob
ject
ive
Design For me, the system is not well designed
Operation For me, the system is not well operated
System problem Problems occur accidentally with the system
Operation
problem
Problems occur accidentally with the system’s operation
Weather The weather can cause me problems with my trip
People - The behaviour of the people around me can be a problem for me
- Problems emerge when many people use the system at the same time
Su
bje
ctiv
e
Do - When there is a problem with my trip, I react or do something about it
- What I do with my trip can cause me problems with it
Body - My body feels troubled when there is a problem with my trip
- I can be physically challenged in my trip
Mind - My mind feels troubled when there is a problem with my trip
- My mind can prove a source of the problem for my trip
Emotion - My emotions feel troubled when there is a problem with my trip
- My emotions can prove a source of the problem for my trip
Arrival - What I do when I arrive is affected by problems with my trip
- My destination facilities & activities I do can cause problems in my trip
Adverbs of time concerning the system’s design or operation, such as “sometimes”, “always”, or “often”, systematically label the problem as “system problem” or “operation problem”.
IV.3.2 Experiment design
The aim of this study is to test a stimulus that reflects the objective and subjective sources of traveler -
perspective travel problems, and that has an observable impact in terms of effectiveness of travel
problems generation (as ideation outputs). The stimulus is hypothesized as the treatment that would
increase the quantity, the variety, and the novelty of travel problems due to the fact that it considers the
traveler’s perspective when built into the ensuing model.
IV.3.2.1 Experimental procedure
The experiment consists of four teams, each made up of three participants. It takes place in two phases
(15 and 30 min) following an introductory brief (Figure 3). All the teams are given the same initial input:
- A verbal brief setting the boundaries of the system to be evaluated.
- A verbal brief on how problems should be written down.
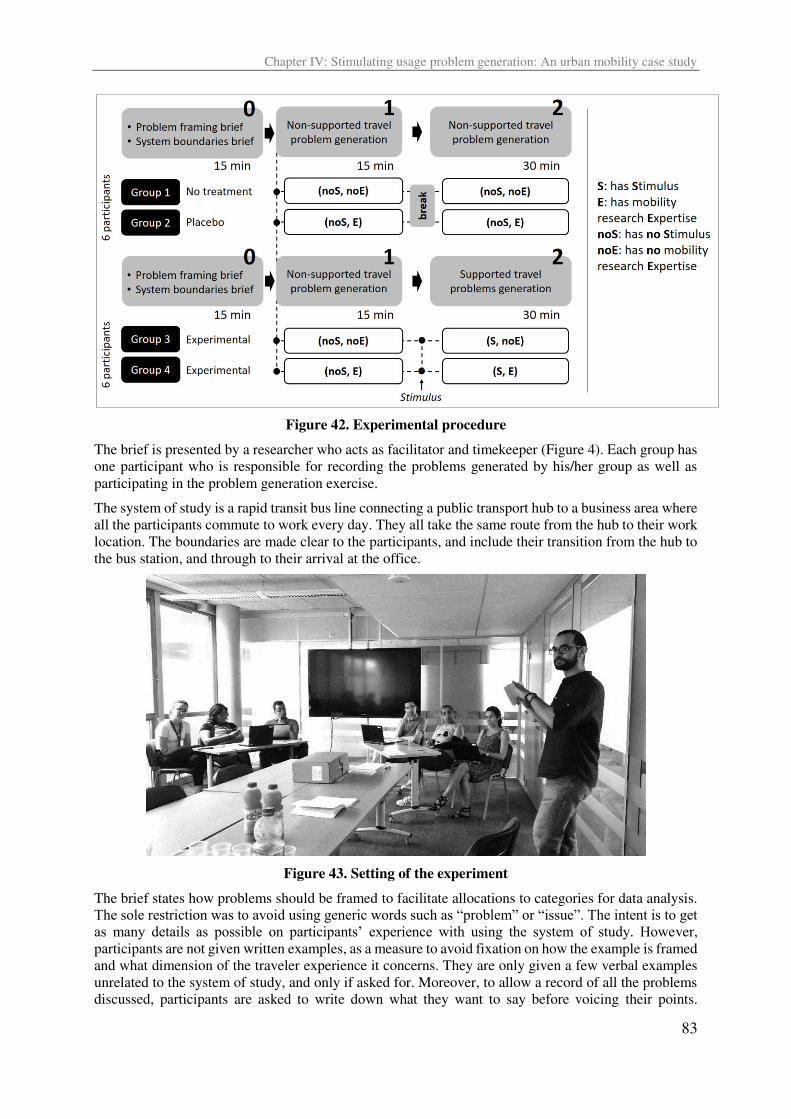
Chapter IV: Stimulating usage problem generation: An urban mobility case study
83
Figure 42. Experimental procedure
The brief is presented by a researcher who acts as facilitator and timekeeper (Figure 4). Each group has
one participant who is responsible for recording the problems generated by his/her group as well as
participating in the problem generation exercise.
The system of study is a rapid transit bus line connecting a public transport hub to a business area where
all the participants commute to work every day. They all take the same route from the hub to their work
location. The boundaries are made clear to the participants, and include their transition from the hub to
the bus station, and through to their arrival at the office.
Figure 43. Setting of the experiment
The brief states how problems should be framed to facilitate allocations to categories for data analysis.
The sole restriction was to avoid using generic words such as “problem” or “issue”. The intent is to get as many details as possible on participants’ experience with using the system of study. However,
participants are not given written examples, as a measure to avoid fixation on how the example is framed
and what dimension of the traveler experience it concerns. They are only given a few verbal examples
unrelated to the system of study, and only if asked for. Moreover, to allow a record of all the problems
discussed, participants are asked to write down what they want to say before voicing their points.
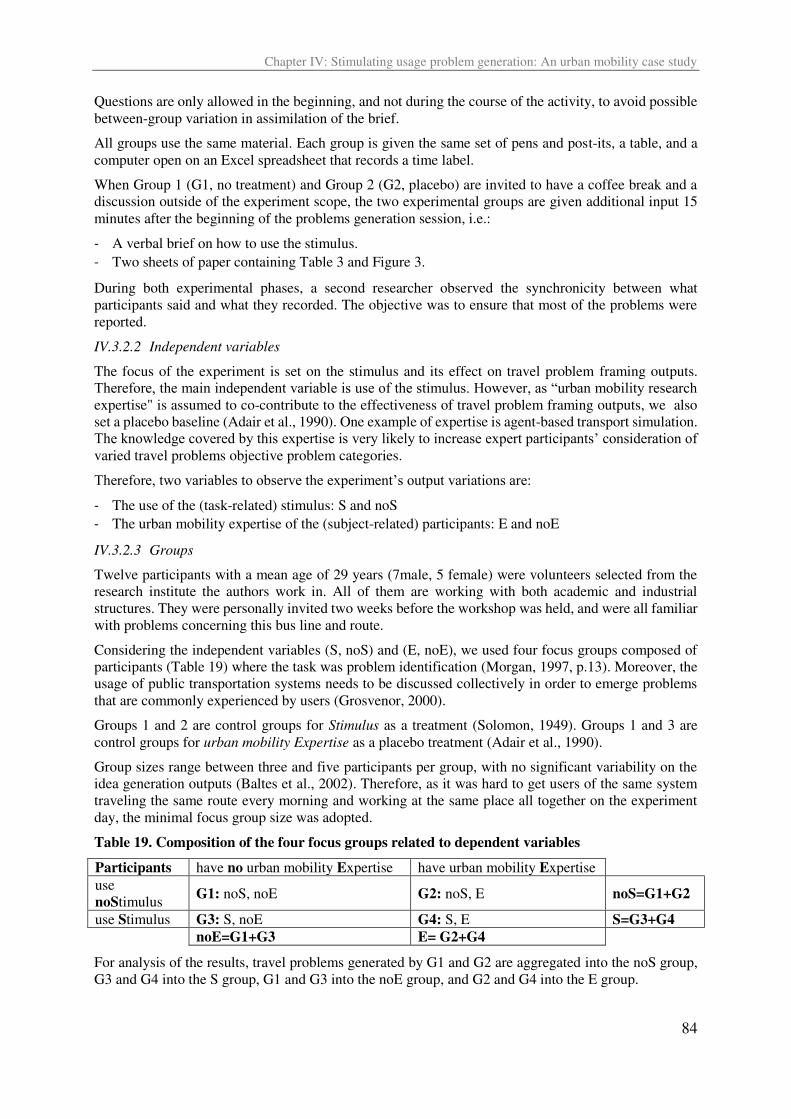
Chapter IV: Stimulating usage problem generation: An urban mobility case study
84
Questions are only allowed in the beginning, and not during the course of the activity, to avoid possible
between-group variation in assimilation of the brief.
All groups use the same material. Each group is given the same set of pens and post-its, a table, and a
computer open on an Excel spreadsheet that records a time label.
When Group 1 (G1, no treatment) and Group 2 (G2, placebo) are invited to have a coffee break and a
discussion outside of the experiment scope, the two experimental groups are given additional input 15
minutes after the beginning of the problems generation session, i.e.:
- A verbal brief on how to use the stimulus.
- Two sheets of paper containing Table 3 and Figure 3.
During both experimental phases, a second researcher observed the synchronicity between what
participants said and what they recorded. The objective was to ensure that most of the problems were
reported.
IV.3.2.2 Independent variables
The focus of the experiment is set on the stimulus and its effect on travel problem framing outputs.
Therefore, the main independent variable is use of the stimulus. However, as “urban mobility research expertise" is assumed to co-contribute to the effectiveness of travel problem framing outputs, we also
set a placebo baseline (Adair et al., 1990). One example of expertise is agent-based transport simulation.
The knowledge covered by this expertise is very likely to increase expert participants’ consideration of varied travel problems objective problem categories.
Therefore, two variables to observe the experiment’s output variations are:
- The use of the (task-related) stimulus: S and noS
- The urban mobility expertise of the (subject-related) participants: E and noE
IV.3.2.3 Groups
Twelve participants with a mean age of 29 years (7male, 5 female) were volunteers selected from the
research institute the authors work in. All of them are working with both academic and industrial
structures. They were personally invited two weeks before the workshop was held, and were all familiar
with problems concerning this bus line and route.
Considering the independent variables (S, noS) and (E, noE), we used four focus groups composed of
participants (Table 19) where the task was problem identification (Morgan, 1997, p.13). Moreover, the
usage of public transportation systems needs to be discussed collectively in order to emerge problems
that are commonly experienced by users (Grosvenor, 2000).
Groups 1 and 2 are control groups for Stimulus as a treatment (Solomon, 1949). Groups 1 and 3 are
control groups for urban mobility Expertise as a placebo treatment (Adair et al., 1990).
Group sizes range between three and five participants per group, with no significant variability on the
idea generation outputs (Baltes et al., 2002). Therefore, as it was hard to get users of the same system
traveling the same route every morning and working at the same place all together on the experiment
day, the minimal focus group size was adopted.
Table 19. Composition of the four focus groups related to dependent variables
Participants have no urban mobility Expertise have urban mobility Expertise
use
noStimulus G1: noS, noE G2: noS, E noS=G1+G2
use Stimulus G3: S, noE G4: S, E S=G3+G4
noE=G1+G3 E= G2+G4
For analysis of the results, travel problems generated by G1 and G2 are aggregated into the noS group,
G3 and G4 into the S group, G1 and G3 into the noE group, and G2 and G4 into the E group.
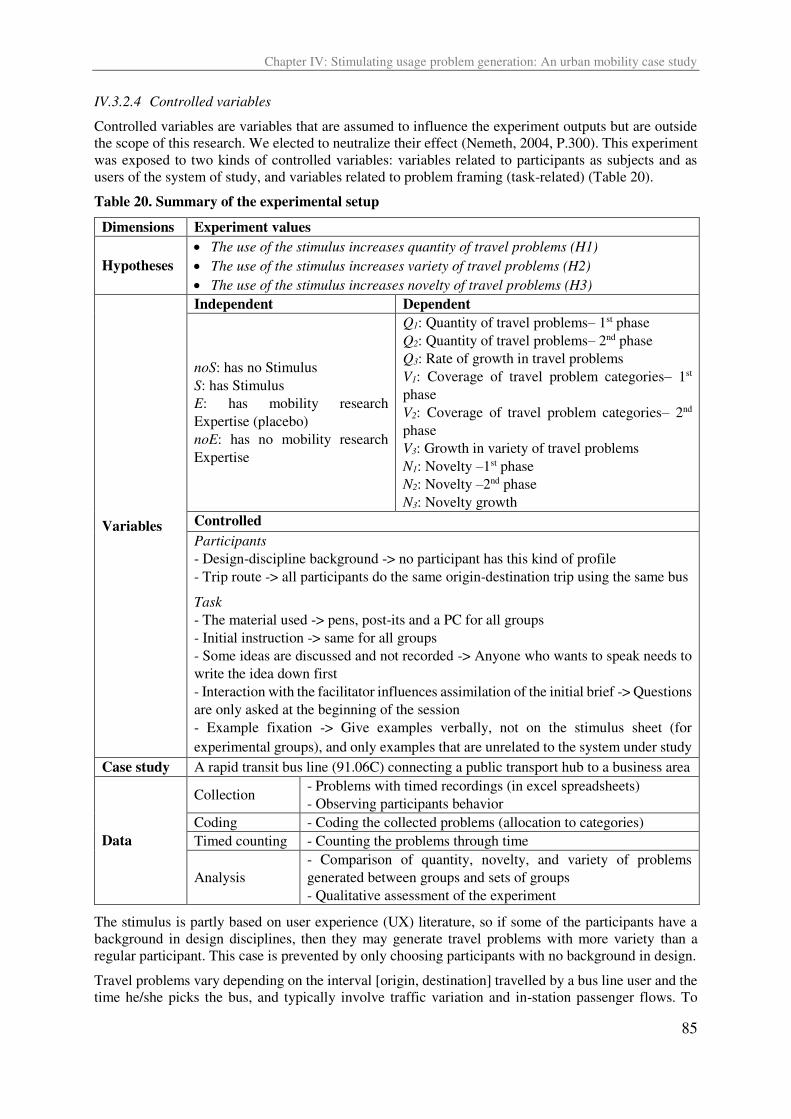
Chapter IV: Stimulating usage problem generation: An urban mobility case study
85
IV.3.2.4 Controlled variables
Controlled variables are variables that are assumed to influence the experiment outputs but are outside
the scope of this research. We elected to neutralize their effect (Nemeth, 2004, P.300). This experiment
was exposed to two kinds of controlled variables: variables related to participants as subjects and as
users of the system of study, and variables related to problem framing (task-related) (Table 20).
Table 20. Summary of the experimental setup
Dimensions Experiment values
Hypotheses
• The use of the stimulus increases quantity of travel problems (H1) • The use of the stimulus increases variety of travel problems (H2) • The use of the stimulus increases novelty of travel problems (H3)
Variables
Independent Dependent
noS: has no Stimulus
S: has Stimulus
E: has mobility research
Expertise (placebo)
noE: has no mobility research
Expertise
Q1: Quantity of travel problems– 1st phase
Q2: Quantity of travel problems– 2nd phase
Q3: Rate of growth in travel problems
V1: Coverage of travel problem categories– 1st
phase
V2: Coverage of travel problem categories– 2nd
phase
V3: Growth in variety of travel problems
N1: Novelty –1st phase
N2: Novelty –2nd phase
N3: Novelty growth
Controlled
Participants - Design-discipline background -> no participant has this kind of profile
- Trip route -> all participants do the same origin-destination trip using the same bus
Task - The material used -> pens, post-its and a PC for all groups
- Initial instruction -> same for all groups
- Some ideas are discussed and not recorded -> Anyone who wants to speak needs to
write the idea down first
- Interaction with the facilitator influences assimilation of the initial brief -> Questions
are only asked at the beginning of the session
- Example fixation -> Give examples verbally, not on the stimulus sheet (for
experimental groups), and only examples that are unrelated to the system under study
Case study A rapid transit bus line (91.06C) connecting a public transport hub to a business area
Data
Collection - Problems with timed recordings (in excel spreadsheets)
- Observing participants behavior
Coding - Coding the collected problems (allocation to categories)
Timed counting - Counting the problems through time
Analysis
- Comparison of quantity, novelty, and variety of problems
generated between groups and sets of groups
- Qualitative assessment of the experiment
The stimulus is partly based on user experience (UX) literature, so if some of the participants have a
background in design disciplines, then they may generate travel problems with more variety than a
regular participant. This case is prevented by only choosing participants with no background in design.
Travel problems vary depending on the interval [origin, destination] travelled by a bus line user and the
time he/she picks the bus, and typically involve traffic variation and in-station passenger flows. To
Chapter IV: Stimulating usage problem generation: An urban mobility case study
86
control this variable, all participants do the same origin-destination route using the same bus-line at the
same times in a day as in regular use.
The material that is used to support travel problem generation, apart from a stimulus, could influence
ideation effectiveness. All groups are therefore given the same material: pens, post-its, and a PC. The
ideation instructions are also the same. All groups are given the same instructions at the same time for
the first ideation phase. Groups 3 and 4 are also given the same instructions for the second phase.
Observation in the pilot experiment found that participants verbalize some ideas that they forget to
record. To control this variable, participants were instructed to write down every idea that comes into
their mind before sharing it with the group. This is a strategy to reduce the gap between spoken and
written ideas.
Moreover, any interaction with the session facilitator could influence how a participant assimilates the
first collective instruction that should be communicated the same way to all participants. To avoid this,
participants were instructed to ask their questions before the ideation phase, so that every participant
can benefit from the facilitator’s answer.
Finally, for all groups, and S groups in particular, example fixation was controlled by providing all
participants with verbal examples that are not directly related to the system under study.
IV.3.2.5 Dependent variables
To test the three parts of the experiment’s hypothesis, dependent variables were selected for each part, as follows.
The use of the stimulus increases the quantity of travel problems (H1).
• Quantity of travel problems in the 1st phase (Q1): the number of problems generated in the first
phase of the experiment.
• Quantity of travel problems in the 2nd phase (Q2): the number of problems generated in the
second phase of the experiment. All ideas are counted as recorded on the excel tables.
• Rate of growth in quantity of travel problems (Q3): � − �� , the growth ratio of travel problems
between the two experiment phases (knowing that the second phase lasts twice as long as the
first phase).
The use of the stimulus increases the variety of travel problems (H2).
Allocation to problem categories was performed by two independent researchers with a high enough
inter-research Pearson’s correlation rate (r=0.82) to fulfil the experiment conditions (Clark-Carter,
1997). Each problem was assigned from one to four labels out of the eleven pre-defined categories. Final
category allocations were approved by the two researchers (Appendix 7).
• Coverage of travel problem categories in the 1st phase (V1): percent coverage of travel problems
among the predefined categories in the first phase of the experiment.
• Coverage of travel problem categories in the n the 2nd phase (V2): percent coverage of travel
problems among the predefined categories in the second phase of the experiment.
• Growth in travel problem variety (V3): � − � ,: the growth in variety of travel problems
between the two phases of the experiment.
The use of the stimulus increases the novelty of travel problems (H3).
Novelty only applies in categories that contain at least one problem for the group that it concerns.
Novelty � in phase of the experiment, in group , proportionally to the total number of problems
dispatched through the eleven categories � , is equal to 1 if the problem is unique to its category k
(Equation 1(a)), equal to 0 if the problem is repeated four times or more in its category k (Equation 1(b)).
Otherwise it is calculated as in Equation 1(c) (inspired from (Peeters et al., 2010) and (Linsey et al.,
2011));
Chapter IV: Stimulating usage problem generation: An urban mobility case study
87
� ={ , � , �
× . − × � −�� , � < < � ; ∀ ∊ { , }; ∀ ∊ [ , ]; ∀ ∊ [ , ](1)
is the number of problems in phase i, in group j, per category k. � is the total number of problems
generated in phase i, by group j, through all eleven categories.
For example, � = in phase 2, in Group 4, for the eighth category “body”. Indeed, = , which
is less than ( as maximal value to score a novelty of 1.
In phase 2, in Group 1, for the fourth category “operation”, � = × ( . − ( × − )) = .
• Novelty in the 1st phase (N1)
• Novelty in the 2nd phase (N2)
• Novelty growth (N3): � − � , the growth in novelty of travel problems between the two phases
of the experiment.
IV.4 Results
The results of the experiment consider the sum of the two experimental groups (G3 and G4) as a single
experimental group (S group). The sum of the placebo group (G2) and the no treatment group (G1) is
analyzed to gauge the influence of mobility expertise on the results (NoS group).
First, quantity is examined by counting the problems generated between groups and over the two phases
of the experiment. Then, variety is studied for each group, calculating the coverage of problems in each
of the pre-defined categories. Finally, novelty is calculated for each group.
IV.4.1 Effect on the quantity of travel problems
Table 21 presents the number of travel problems generated throughout the experiment (with 5-min
intervals), and between phase 1 and phase 2 of the experiment for the four groups and per set of two
groups. The groups together scored a total of 111 problems during the 50 minutes of the experiment.
The stimulus is designed to help participants dig deeper into their memory to generate more problems
than the situations they would spontaneously remember. Therefore, it was hypothesized that the quantity
of problems generated would be more for the S groups compared to noS group and would increase from
the first phase to the second phase. However, there was no increase in quantity of travel problems from
phase 1 to phase 2 nor from noS to S in phase 2. Indeed, the noS groups together generated 10 more
problems than the S groups together, and scored better on quantity growth rate: -5% for NoS compared
to -25% for S.
During the initial phase, S and noS groups generated a comparable amount of travel problems (resp. 20
and 21), while E and noE scored a relatively different amount of problems (resp. 18 and 23). This
difference was created between G1 and G2 (resp. 13 and 8). Indeed, G2 was late at typing down the
problems generated and spent most of the first phase discussing and taking notes on post-its.
Three out of four groups experienced a decrease in problem quantity, which would be explained by
cognitive inertia in ideation (Briggs & Reinig, 2010). However, G2 showed a different growth rate
compared to the other groups. Indeed, at the beginning of the second experiment phase, the group voiced
its ambition to score the highest among all the groups, which was noticeable in the 25–40 min interval
of the experiment. So, if we exclude the atypical group (G2) from E-group analysis, it could be said that
the non-expert group G3 profited more from the stimulus by generating two more problems than the
expert group G4 (resp. 16 and 14).
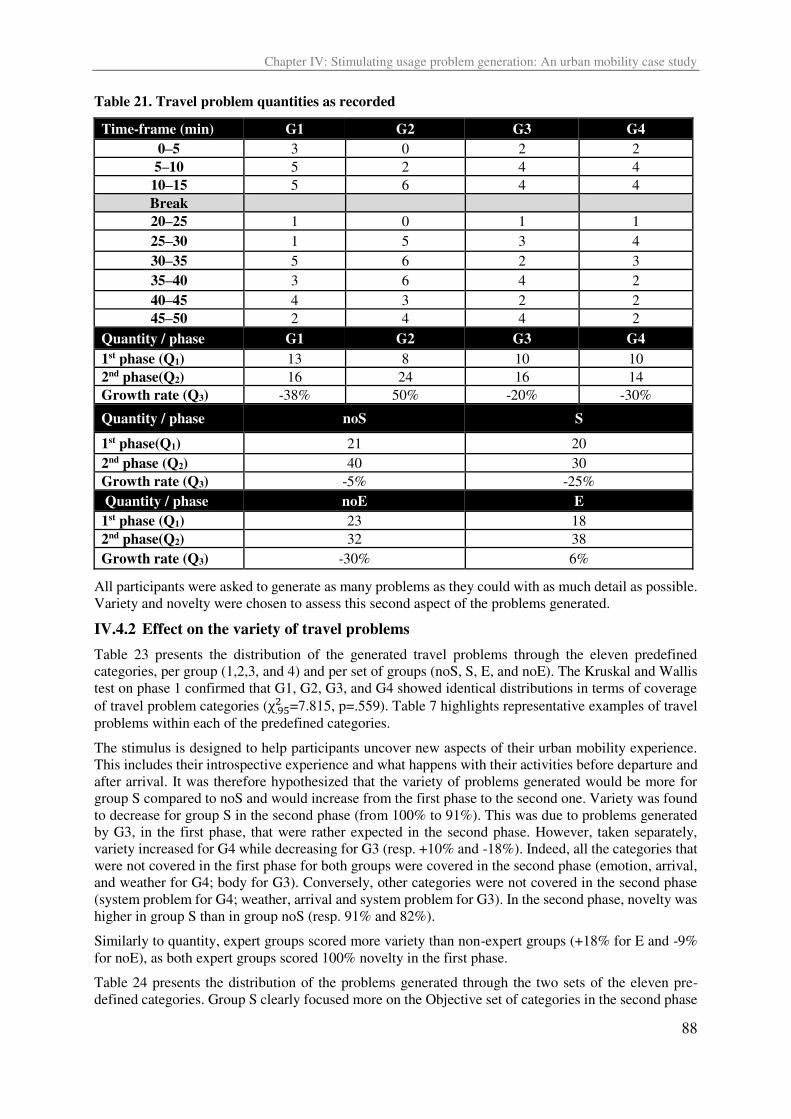
Chapter IV: Stimulating usage problem generation: An urban mobility case study
88
Table 21. Travel problem quantities as recorded
Time-frame (min) G1 G2 G3 G4
0–5 3 0 2 2
5–10 5 2 4 4
10–15 5 6 4 4
Break
20–25 1 0 1 1
25–30 1 5 3 4
30–35 5 6 2 3
35–40 3 6 4 2
40–45 4 3 2 2
45–50 2 4 4 2
Quantity / phase G1 G2 G3 G4
1st phase (Q1) 13 8 10 10
2nd phase(Q2) 16 24 16 14
Growth rate (Q3) -38% 50% -20% -30%
Quantity / phase noS S
1st phase(Q1) 21 20
2nd phase (Q2) 40 30
Growth rate (Q3) -5% -25%
Quantity / phase noE E
1st phase (Q1) 23 18
2nd phase(Q2) 32 38
Growth rate (Q3) -30% 6%
All participants were asked to generate as many problems as they could with as much detail as possible.
Variety and novelty were chosen to assess this second aspect of the problems generated.
IV.4.2 Effect on the variety of travel problems
Table 23 presents the distribution of the generated travel problems through the eleven predefined
categories, per group (1,2,3, and 4) and per set of groups (noS, S, E, and noE). The Kruskal and Wallis
test on phase 1 confirmed that G1, G2, G3, and G4 showed identical distributions in terms of coverage
of travel problem categories (χ. =7.815, p=.559). Table 7 highlights representative examples of travel
problems within each of the predefined categories.
The stimulus is designed to help participants uncover new aspects of their urban mobility experience.
This includes their introspective experience and what happens with their activities before departure and
after arrival. It was therefore hypothesized that the variety of problems generated would be more for
group S compared to noS and would increase from the first phase to the second one. Variety was found
to decrease for group S in the second phase (from 100% to 91%). This was due to problems generated
by G3, in the first phase, that were rather expected in the second phase. However, taken separately,
variety increased for G4 while decreasing for G3 (resp. +10% and -18%). Indeed, all the categories that
were not covered in the first phase for both groups were covered in the second phase (emotion, arrival,
and weather for G4; body for G3). Conversely, other categories were not covered in the second phase
(system problem for G4; weather, arrival and system problem for G3). In the second phase, novelty was
higher in group S than in group noS (resp. 91% and 82%).
Similarly to quantity, expert groups scored more variety than non-expert groups (+18% for E and -9%
for noE), as both expert groups scored 100% novelty in the first phase.
Table 24 presents the distribution of the problems generated through the two sets of the eleven pre-
defined categories. Group S clearly focused more on the Objective set of categories in the second phase
Chapter IV: Stimulating usage problem generation: An urban mobility case study
89
than group noS did (46% for S and 15% for noS). On the other hand, this set of categories increased
more for group S than group noS (resp. +17% and +6%). Moreover, the non-expert group (G3) used the
stimulus more than the expert group (G4) (resp. +34% and -3%). For instance, Figure 5 shows the
difference in evolution of travel problems in objective and subjective sets of categories for G1 and G3.
The categories that were not covered by the noS groups through the two phases together (i.e. scoring a
total of three or less) were body, mind, emotion, and arrival. The only different category was “do” where G2 scored 6 problems at the second phase, as seen in the second-phase subjective categories score (22%
compared to 4% for G1).
Table 22. Examples of travel problems in the eleven pre-defined categories
Category Example from groups Gr
Design Signage problem: lack of visibility G1
Operation Low frequency after 19:00h G2
Sys problem Sometimes the display is blank G2
Op problem Buses cancelled at the end of the day without warning G1
People Many people waiting for the bus -> full bus G4
Weather Bus windows are not tinted, which amplifies the effect of the heat from the sun G2
Do Often people run from the train station to catch the bus, or from the bus to the
train station, and that may cause panic for some users G2
Body Body aches and dizziness from fatigue or having to stand on the way G3
Mind The logic of opening the doors is not clear (the back doors are not always open) G3
Emotion When the bus is full, attitudes of a few people can be disturbing (sometimes
people do not even say sorry when they push you ...) G3
Arrival If we have a lot of stuff, then the bus is not at all a good choice (bringing my
lunch to work) G4
Table 23. Variety in travel problems generated
Phase 1 G1 G2 G3 G4 noS S noE E All
People 5 3 3 2 8 5 8 5 13
Weather 1 0 1 0 1 1 2 0 2
Design 4 1 3 2 5 5 7 3 10
Operation 5 5 1 3 10 4 6 8 14
Sys problem 1 0 1 2 1 3 2 2 4
Op problem 2 2 6 1 4 7 8 3 11
Do 0 0 1 2 0 3 1 2 3
Body 2 0 0 1 2 1 2 1 3
Mind 0 0 1 3 0 4 1 3 4
Emotion 0 1 1 0 1 1 1 1 2
Arrival 0 0 1 0 0 1 1 0 1
Total 20 12 19 16 32 35 39 28 67
Variety (V1) 64% 45% 91% 73% 73% 100% 100% 82% 100%
Phase 2 G1 G2 G3 G4 noS S noE E All
People 4 4 4 4 8 8 8 8 16
Weather 2 5 0 2 7 2 2 7 9
Design 4 9 4 5 13 9 8 14 22
Operation 8 6 3 3 14 6 11 9 20
Sys problem 1 3 0 0 4 0 1 3 4
Op problem 6 5 4 3 11 7 10 8 18
Do 0 6 5 3 6 8 5 9 14
Body 0 1 3 1 1 4 3 2 5
Chapter IV: Stimulating usage problem generation: An urban mobility case study
90
Mind 1 2 4 1 3 5 5 3 8
Emotion 0 0 6 2 0 8 6 2 8
Arrival 0 0 0 2 0 2 0 2 2
Total 26 41 33 26 67 59 59 67 126
Variety (V2) 64% 82% 73% 91% 82% 91% 91% 100% 100%
V growth (V3) 0% +36% -18% +10% +9% -9% -9% +18% na
Table 24. Category coverage of travel problems generated
Phase 1 G1 G2 G3 G4 noS S noE E
Objective 90% 92% 79% 62% 91% 71% 85% 75%
Subjective 10% 8% 21% 38% 9% 29% 15% 25%
Phase 2 G1 G2 G3 G4 noS S noE E
Objective set 96% 78% 45% 65% 85% 54% 68% 73%
Subjective set 4% 22% 55% 35% 15% 46% 32% 27%
Subjective set
growth -6% +14% +34% -3% +6% +17% +17% +2%
Figure 44. Comparison of the evolution of travel problems in the different sets for G1 & G3
IV.4.3 Effect on the novelty of travel problems
Table 25 presents the novelty of travel problems in each of the pre-defined categories, per group (1,2,3,
and 4) and per set of groups (noS, S, E, and noE).
The model underlying the stimulus assumes that each of the traveler experience aspects (translated into
travel problem categories) are important for describing a traveler experience problem. This is why it
was hypothesized that the stimulus would increase travel problem category novelty by showing
participants new aspects of their traveler experience. Indeed, average novelty in the second phase was
higher in teh S group than the noS group (resp. 94.8% and 91.8%). However, average novelty remained
constant for the S group yet increased by 5% in the noS group. Once again, this was related to G2 that
0
5
10
15
20
25
30
35
40
45
0:00:00 0:05:00 0:10:00 0:15:00 0:20:00 0:25:00 0:30:00 0:35:00 0:40:00 0:45:00 0:50:00
G1_Objective G1_Subjective
G3_Objective G3_Subjective
Bre
ak
Chapter IV: Stimulating usage problem generation: An urban mobility case study
91
scored an increase of 17%, which is higher than all the other groups together, although it had the lowest
novelty score in the first phase (75.3%). Group E and noE scored very similar on average novelty (resp.
94.5% and 94%) and growth in average novelty (resp. +2.6% and +1.6%).
The lowest novelty scores—scoring under 75%—, as highlighted in grey, were found mainly in the
objective set of categories in both the first and the second phases of the experiment. Moreover, in the
second phase, only G1 and G2 (noS groups) scored low on novelty. Group E scored low on novelty in
the design category and group noS score low on novelty in the operation category. Figure 6 shows how
the problems are distributed through the eleven pre-defined categories comparing S to noS groups
(SD(S)=3.01, SD(noS)=5.03).
Table 25. Travel problem categories novelty per group
Phase 1 G1 (%) G2 (%) G3 (%) G4 (%) noS (%) S (%) noE (%) E (%)
People 65 65 85.3 92.5 65 88.6 74.9 80.7
Weather 100 na 100 na 100 100 100 na
Design 76 100 85.3 92.5 85.6 88.6 80.5 96.4
Operation 65 28.3 100 78.8 51.3 94.9 86.2 57.1
Sys problem 100 na 100 92.5 100 100 100 100
Op problem 98 83.3 50.5 100 92.5 76.0 74.9 96.4
Do na na 100 92.5 na 100 100 100
Body 98 na na 100 100 100 100 100
Mind na na 100 78.8 na 94.9 100 96.4
Emotion na 100 100 na 100 100 100 100
Arrival na na 100 na na 100 100 na
Novelty (N1) 86 75.3 92.1 90.9 86.8 94.8 92.4 91.9
Phase 2 G1 (%) G2 (%) G3 (%) G4 (%) noS (%) S (%) noE (%) E (%)
People 86.2 98.5 93.3 86.2 93.7 90.2 90.2 93.7
Weather 100 93.2 na 100 97 100 100 97
Design 86.2 71.7 93.3 77.7 77.3 86.4 90.2 74
Operation 52.3 87.8 100 94.6 74 97.6 79 90.4
Sys problem 100 100 na na 100 na 100 100
Op problem 69.2 93.2 93.3 94.6 83.9 93.9 82.7 93.7
Do na 87.8 86.7 94.6 100 90.2 100 90.4
Body na 100 100 100 100 100 100 100
Mind 100 100 93.3 100 100 100 100 100
Emotion na na 80 100 na 90.2 97.6 100
Arrival na na na 100 na 100 na 100
Novelty (N2) 84.8 92.5 92.5 94.8 91.8 94.8 94 94.5
N growth (N3) -1.2 +17.1 -0.4 +3.8 +5 0 +1.6 +2.6
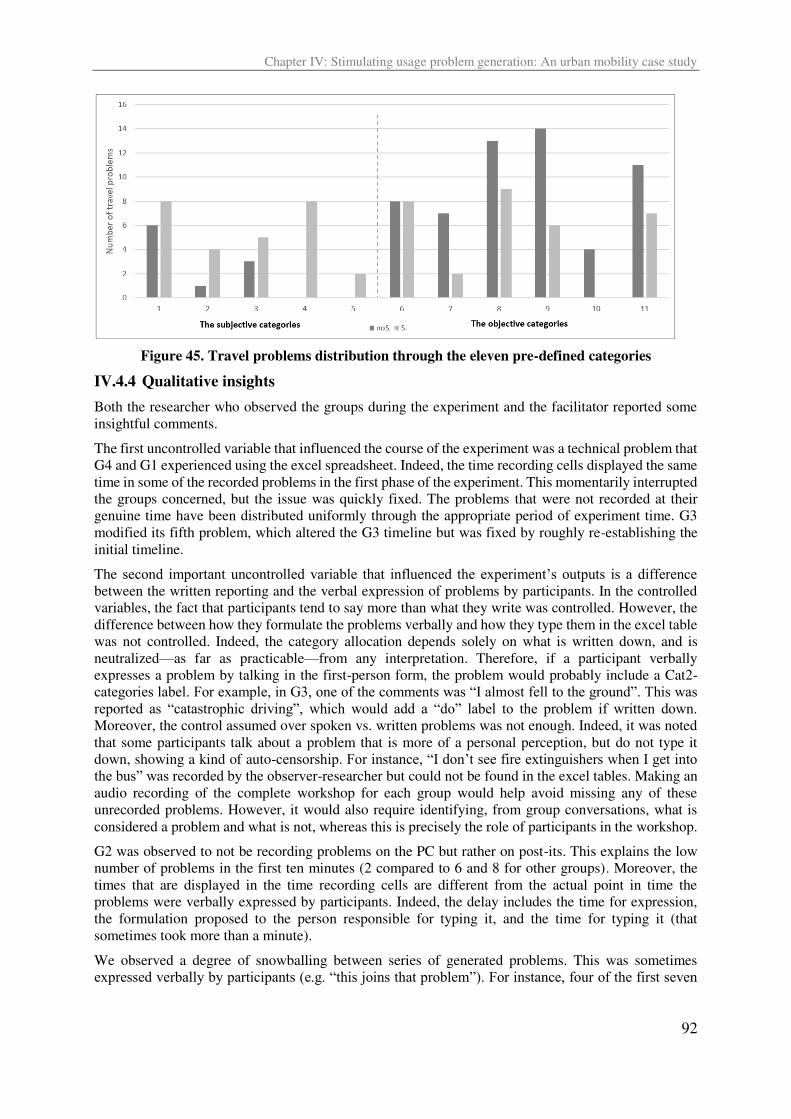
Chapter IV: Stimulating usage problem generation: An urban mobility case study
92
Figure 45. Travel problems distribution through the eleven pre-defined categories
IV.4.4 Qualitative insights
Both the researcher who observed the groups during the experiment and the facilitator reported some
insightful comments.
The first uncontrolled variable that influenced the course of the experiment was a technical problem that
G4 and G1 experienced using the excel spreadsheet. Indeed, the time recording cells displayed the same
time in some of the recorded problems in the first phase of the experiment. This momentarily interrupted
the groups concerned, but the issue was quickly fixed. The problems that were not recorded at their
genuine time have been distributed uniformly through the appropriate period of experiment time. G3
modified its fifth problem, which altered the G3 timeline but was fixed by roughly re-establishing the
initial timeline.
The second important uncontrolled variable that influenced the experiment’s outputs is a difference between the written reporting and the verbal expression of problems by participants. In the controlled
variables, the fact that participants tend to say more than what they write was controlled. However, the
difference between how they formulate the problems verbally and how they type them in the excel table
was not controlled. Indeed, the category allocation depends solely on what is written down, and is
neutralized—as far as practicable—from any interpretation. Therefore, if a participant verbally
expresses a problem by talking in the first-person form, the problem would probably include a Cat2-
categories label. For example, in G3, one of the comments was “I almost fell to the ground”. This was reported as “catastrophic driving”, which would add a “do” label to the problem if written down. Moreover, the control assumed over spoken vs. written problems was not enough. Indeed, it was noted
that some participants talk about a problem that is more of a personal perception, but do not type it
down, showing a kind of auto-censorship. For instance, “I don’t see fire extinguishers when I get into the bus” was recorded by the observer-researcher but could not be found in the excel tables. Making an
audio recording of the complete workshop for each group would help avoid missing any of these
unrecorded problems. However, it would also require identifying, from group conversations, what is
considered a problem and what is not, whereas this is precisely the role of participants in the workshop.
G2 was observed to not be recording problems on the PC but rather on post-its. This explains the low
number of problems in the first ten minutes (2 compared to 6 and 8 for other groups). Moreover, the
times that are displayed in the time recording cells are different from the actual point in time the
problems were verbally expressed by participants. Indeed, the delay includes the time for expression,
the formulation proposed to the person responsible for typing it, and the time for typing it (that
sometimes took more than a minute).
We observed a degree of snowballing between series of generated problems. This was sometimes
expressed verbally by participants (e.g. “this joins that problem”). For instance, four of the first seven
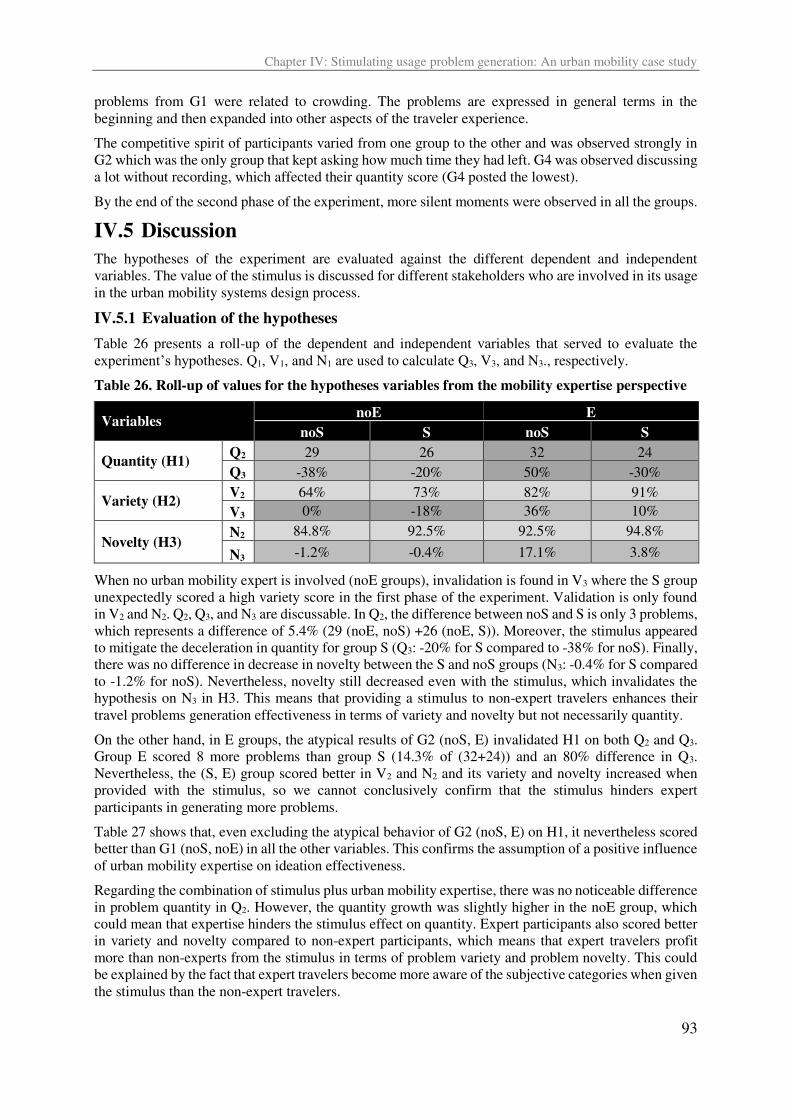
Chapter IV: Stimulating usage problem generation: An urban mobility case study
93
problems from G1 were related to crowding. The problems are expressed in general terms in the
beginning and then expanded into other aspects of the traveler experience.
The competitive spirit of participants varied from one group to the other and was observed strongly in
G2 which was the only group that kept asking how much time they had left. G4 was observed discussing
a lot without recording, which affected their quantity score (G4 posted the lowest).
By the end of the second phase of the experiment, more silent moments were observed in all the groups.
IV.5 Discussion
The hypotheses of the experiment are evaluated against the different dependent and independent
variables. The value of the stimulus is discussed for different stakeholders who are involved in its usage
in the urban mobility systems design process.
IV.5.1 Evaluation of the hypotheses
Table 26 presents a roll-up of the dependent and independent variables that served to evaluate the
experiment’s hypotheses. Q1, V1, and N1 are used to calculate Q3, V3, and N3., respectively.
Table 26. Roll-up of values for the hypotheses variables from the mobility expertise perspective
Variables noE E
noS S noS S
Quantity (H1) Q2 29 26 32 24
Q3 -38% -20% 50% -30%
Variety (H2) V2 64% 73% 82% 91%
V3 0% -18% 36% 10%
Novelty (H3) N2 84.8% 92.5% 92.5% 94.8%
N3 -1.2% -0.4% 17.1% 3.8%
When no urban mobility expert is involved (noE groups), invalidation is found in V3 where the S group
unexpectedly scored a high variety score in the first phase of the experiment. Validation is only found
in V2 and N2. Q2, Q3, and N3 are discussable. In Q2, the difference between noS and S is only 3 problems,
which represents a difference of 5.4% (29 (noE, noS) +26 (noE, S)). Moreover, the stimulus appeared
to mitigate the deceleration in quantity for group S (Q3: -20% for S compared to -38% for noS). Finally,
there was no difference in decrease in novelty between the S and noS groups (N3: -0.4% for S compared
to -1.2% for noS). Nevertheless, novelty still decreased even with the stimulus, which invalidates the
hypothesis on N3 in H3. This means that providing a stimulus to non-expert travelers enhances their
travel problems generation effectiveness in terms of variety and novelty but not necessarily quantity.
On the other hand, in E groups, the atypical results of G2 (noS, E) invalidated H1 on both Q2 and Q3.
Group E scored 8 more problems than group S (14.3% of (32+24)) and an 80% difference in Q3.
Nevertheless, the (S, E) group scored better in V2 and N2 and its variety and novelty increased when
provided with the stimulus, so we cannot conclusively confirm that the stimulus hinders expert
participants in generating more problems.
Table 27 shows that, even excluding the atypical behavior of G2 (noS, E) on H1, it nevertheless scored
better than G1 (noS, noE) in all the other variables. This confirms the assumption of a positive influence
of urban mobility expertise on ideation effectiveness.
Regarding the combination of stimulus plus urban mobility expertise, there was no noticeable difference
in problem quantity in Q2. However, the quantity growth was slightly higher in the noE group, which
could mean that expertise hinders the stimulus effect on quantity. Expert participants also scored better
in variety and novelty compared to non-expert participants, which means that expert travelers profit
more than non-experts from the stimulus in terms of problem variety and problem novelty. This could
be explained by the fact that expert travelers become more aware of the subjective categories when given
the stimulus than the non-expert travelers.
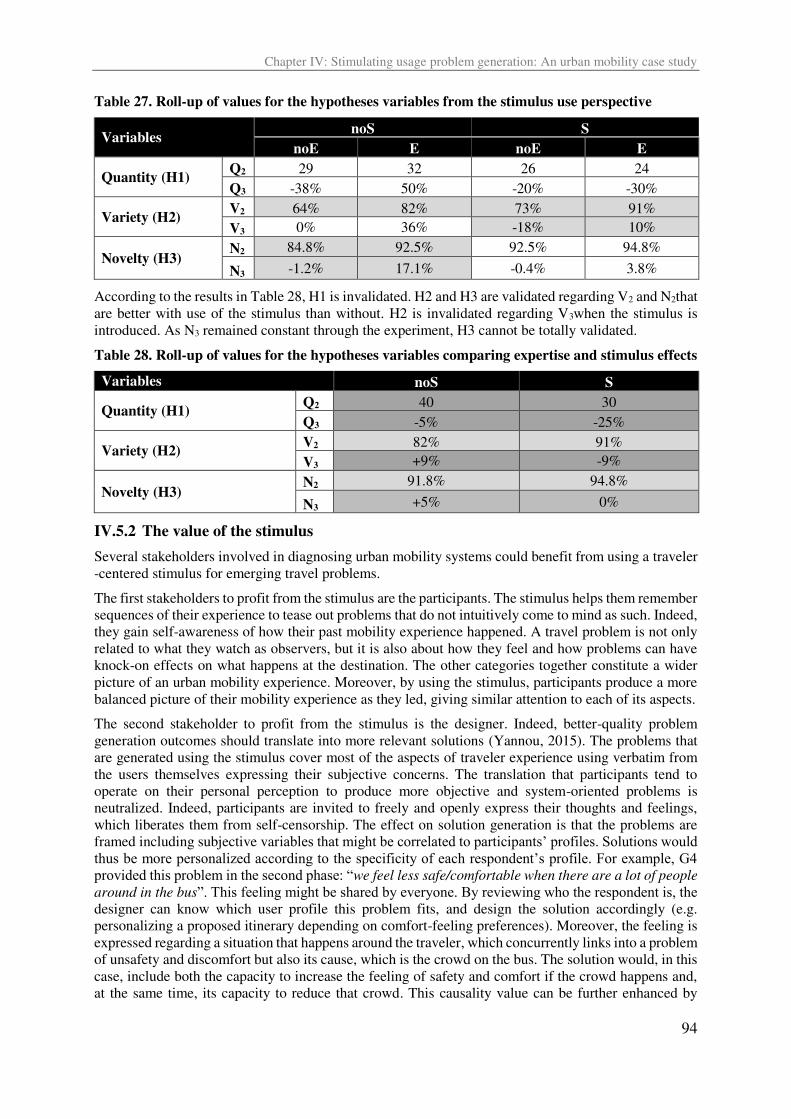
Chapter IV: Stimulating usage problem generation: An urban mobility case study
94
Table 27. Roll-up of values for the hypotheses variables from the stimulus use perspective
Variables noS S
noE E noE E
Quantity (H1) Q2 29 32 26 24
Q3 -38% 50% -20% -30%
Variety (H2) V2 64% 82% 73% 91%
V3 0% 36% -18% 10%
Novelty (H3) N2 84.8% 92.5% 92.5% 94.8%
N3 -1.2% 17.1% -0.4% 3.8%
According to the results in Table 28, H1 is invalidated. H2 and H3 are validated regarding V2 and N2that
are better with use of the stimulus than without. H2 is invalidated regarding V3when the stimulus is
introduced. As N3 remained constant through the experiment, H3 cannot be totally validated.
Table 28. Roll-up of values for the hypotheses variables comparing expertise and stimulus effects
Variables noS S
Quantity (H1) Q2 40 30
Q3 -5% -25%
Variety (H2) V2 82% 91%
V3 +9% -9%
Novelty (H3) N2 91.8% 94.8%
N3 +5% 0%
IV.5.2 The value of the stimulus
Several stakeholders involved in diagnosing urban mobility systems could benefit from using a traveler
-centered stimulus for emerging travel problems.
The first stakeholders to profit from the stimulus are the participants. The stimulus helps them remember
sequences of their experience to tease out problems that do not intuitively come to mind as such. Indeed,
they gain self-awareness of how their past mobility experience happened. A travel problem is not only
related to what they watch as observers, but it is also about how they feel and how problems can have
knock-on effects on what happens at the destination. The other categories together constitute a wider
picture of an urban mobility experience. Moreover, by using the stimulus, participants produce a more
balanced picture of their mobility experience as they led, giving similar attention to each of its aspects.
The second stakeholder to profit from the stimulus is the designer. Indeed, better-quality problem
generation outcomes should translate into more relevant solutions (Yannou, 2015). The problems that
are generated using the stimulus cover most of the aspects of traveler experience using verbatim from
the users themselves expressing their subjective concerns. The translation that participants tend to
operate on their personal perception to produce more objective and system-oriented problems is
neutralized. Indeed, participants are invited to freely and openly express their thoughts and feelings,
which liberates them from self-censorship. The effect on solution generation is that the problems are
framed including subjective variables that might be correlated to participants’ profiles. Solutions would thus be more personalized according to the specificity of each respondent’s profile. For example, G4 provided this problem in the second phase: “we feel less safe/comfortable when there are a lot of people around in the bus”. This feeling might be shared by everyone. By reviewing who the respondent is, the designer can know which user profile this problem fits, and design the solution accordingly (e.g.
personalizing a proposed itinerary depending on comfort-feeling preferences). Moreover, the feeling is
expressed regarding a situation that happens around the traveler, which concurrently links into a problem
of unsafety and discomfort but also its cause, which is the crowd on the bus. The solution would, in this
case, include both the capacity to increase the feeling of safety and comfort if the crowd happens and,
at the same time, its capacity to reduce that crowd. This causality value can be further enhanced by
Chapter IV: Stimulating usage problem generation: An urban mobility case study
95
proposing an ideation session that pushes participants to identify the links between problems they have
and think of new consequences and causes as new problems to be reported.
The insights that a designer gains from travel problems can be exploited by a transportation operator
when the data are quantitatively significant. Indeed, tailored surveys can be designed in response to
outputs from focus groups conducted with specific samples of travelers. Having more detailed
preferences matching with travelers’ profiles would allow operators to add more human-centric
performance indicators. The diagnosis of the mobility system they operate would then show them flaws
that directly impact traveler satisfaction and connect these flaws to their original technical problems.
The two metrics that represent variety and novelty are meant to fill the gap left in ideation outputs
evaluation by quantity alone. Indeed, Briggs & Reinig (2010) show that value in idea-quantity is
insufficient to establish gains in idea-quality. Therefore, in asking travelers to state the problems they
experience using some urban mobility solution, a support is needed so that they can generate problems
that most reflect their experience. Classical design tools that are not tailored to the nature of the system
to be diagnosed fail to produce problems that cover relevant dimensions of the user experience related
to the system of study. For instance, Kremer et al.(2017), even with a user-centered approach, still lacks
travel stages integration and considers a segmented evaluation of the experience without taking into
account the destination as part of the experience nor the causality between subjective and technical
problems.
For these reasons, this experiment highlights that it is vital to involve users (of the system to be
diagnosed) in the design of stimuli for problem identification, not just design concepts generation.
The groups that did not receive the stimulus represented the classical way participants in focus groups
are asked to generate problems. Results showed that these groups score less in variety of problems and
novelty than groups that receive a traveler -centered stimulus.
The results of this experiment would be more reliable if the experiment was repeated several times over.
This would allow to test whether G2 would confirm its (atypical) behavior —especially for Q3.
Moreover, it would consolidate the conclusions made on novelty and variety. It is, however, difficult to
recruit participants who are using a system on the same route and find a time-slot where everyone is
available for the experiment.
IV.6 Conclusion and perspectives
The chapter evaluates the effects of a traveler -centered stimulus on the effectiveness of travel problem
generation. So far, user-centered methods have served to uncover different aspects of problems that
users experience when interacting with products and services. However, they are used in isolated -off
as a means to answer predefined research questions that under-involve users. Consequently, they miss
unspoken usage problems that users and designers do not think of alone. In urban mobility, given the
lack of traveler experience-relevant dimensions for setting travel problems, a proposed solution to tackle
this issue needs metrics to measure travel problem generation effectiveness.
This study shows that using a traveler -experience based stimulus in travel problem generation helps
participants generate problems covering the traveler experience dimensions. The stimulus is a textual
description of two broad categories of problems, which are: (a) Objective problems related to Design,
Operation, Weather, People; (b) Subjective problems broken down into Do, Body, Mind, Emotion and
Arrival classes.
Participants tend to intuitively generate objective problems that are related to the system of study and to
its usage-environment surroundings. The stimulus improves their ability to remember and frame more
subjective problems related to what they do and how they react to their surroundings. Moreover, while
increasing the variety and novelty of problems, using a stimulus for problem generation also decreases
the number of problems generated. Mobility expertise, in turn, has a positive influence on problem
generation effectiveness. On the other hand, expert participants benefit more from the stimulus than the
non-experts in terms of variety and novelty, since they better exploit the subjective categories.
Chapter IV: Stimulating usage problem generation: An urban mobility case study
96
Subjective traveler experience dimensions give an additional lever to travel problem generation in
aligning travel solutions with traveler concerns. It gives solutions a better potential to satisfy traveler
expectations on the quality of their experience using actual urban mobility systems. For instance, if a
traveler expresses his/her dissatisfaction with dispassionate announcements of delays, then a solution
would propose to add apologies to the announcement or advise the announcer to adopt a more
compassionate tone. In addition, subjective problems, being causes and consequences of technical
objective problems, emerge causality between the technical performance of urban mobility systems and
its impact on traveler satisfaction.
The metrics that were used to evaluate such stimulus do not consider travel problem causality links.
Since participants do use a snowballing logic in generating problems, it would be relevant to add a
metric that refines novelty in considering causality. This would reflect the dynamics of problem
generation and help participants become aware of how they move from one problem to another and
consciously orient their problem generation process (Santanen et al., 2004). Moreover, to expand the
relevance of the experimental hypothesis to usage problem framing with different systems beyond urban
mobility, the stimulus needs to be adapted by design to each system of study.
This research intends to help designers stimulate users to express more of their usage problems. It can
also help decision-makers to link the technical performances of the systems they manage to the
satisfaction of the final users. Furthermore, this article considers the limits of design practice when it
comes to designing large-scale complex systems such as urban mobility systems. Indeed, traveler
experience involves more diverse issues than a user experience with a simple artefact in a private
environment. Here we also encompass the social interactions between users and considers the
importance of what comes after the usage time-frame, which therefore broadens the boundaries of the
system of study to all the elements that users effectively consider as usage problems.
Causality should systematically be considered in further research into helping participants generate
usage problems and how these can be exploited in conducting combined user satisfaction–system
diagnosis surveys.
Chapter V: Using traveler specific attributes in transport modeling and simulation of AVs
97
Chapter V: Using traveler specific attributes in transport modeling and simulation of AVs
Chapter V
Traveler specific attributes in transport modeling and
simulation:
The case of a new shared autonomous vehicle service
Modeling transport systems is usually based on variables that are projected on time and space. For instance, simulation and optimization models rarely go beyond cost, time and space as determinants when analyzing travelers’ choice regarding their transport mode. This chapter shows how the knowledge of traveler experience helps to determine relevant variables that subtend travelers’ willingness-to-use a mobility service. We exemplify the approach for a shared autonomous vehicle service. An online survey was carried to collect data on travelers of the greater Paris region and their position regarding autonomous vehicles. On the one hand, the chapter identifies profiles of travelers that are more likely to accept autonomous vehicle technology. On the other hand, it identifies subjective criteria of travelers behind their willingness-to-use a shared autonomous vehicle service depending on their current mode of transport. The chapter shows how traveler specific attributes are relevant to studying a mobility system and how these can enhance the accuracy of agent-based models and the traveler preference dimension in optimization models.
Keywords: Traveler specific attributes, modal shift estimation, acceptance, willingness-to-use
A modified version of this chapter has been submitted to the Euro Working Group on Transportation 2019
Chapter V: Using traveler specific attributes in transport modeling and simulation of AVs
98
V.1 Introduction
In designing urban mobility systems, transport operators and industrial actors are challenged by issues
of sampling, scaling, setting performance indicators, gathering and analyzing qualitative data, involving
stakeholders, and setting the boundaries of the system to be designed (Al Maghraoui et al., 2017a). One
of the reasons why these challenges are persisting is that, at the scale of a city, urban mobility systems
are anchored in the urban life of travelers which is evolving with technology.
Travelers are invited to participate in the design of urban mobility systems because they have valuable
knowledge of their experience as users of these systems (Webb et al., 2018). Transport operators and
industrials collect this knowledge using different methods. Satisfaction and stated preference (SP)
surveys are one way of doing so (Bradley & Kroes, 1992). Surveys are designed to measure the level of
satisfaction and preferences of travelers regarding a mobility system. However, they often miss most of
what travelers have to say about their mobility experience and choices because they come with
preconceived ideas of what utility and preferences are (Jiao et al., 2012), especially for a service that
does not exist yet; Autonomous Vehicles (AVs).
This technology has a big potential of disrupting the behavior of travelers and their preferences regarding
the transport mode choices that will be offered to them (Le Vine et al., 2015). Moreover, the high
heterogeneity of travelers suggests that the use of simplistic models would not allow sufficient
discrimination of potential AVs use (Krueger et al., 2016).
In recent years, the variables behind travel choice has been shifting from pure economic and spatio-
temporal components towards a more complex set of parameters including quality of life and social
dimensions of urban activities (Jones, 2014). In investigating public opinion on AVs, in addition to cost,
Bansal et al. (2016) and Howard & Dai (2014) identified safety as being one of the most important
factors for choosing or not choosing to use an AV. Analyzing online forums discussions, Fraedrich &
Lenz (2014) added comfort and flexibility as perceived positive feature of AVs that could push people
to use them.
Haboucha et al. (2017) considered some traveler specific attributes such as environmental concern or
joy of driving which they called “attitudinal variables” along with socio-demographic attributes such as
gender and age in estimating AVs adoption in the future. However, this study only concerned a
population of drivers and the list of attitudinal variables was based on literature with no feedback from
the participating drivers.
In transport models, the most frequently used variables are either spatial or temporal, and sometimes
economic (Cascetta, 2009) (Ortuzar & Willumsen, 2011). In the specific case of AVs, agent based and
optimization models for instance use variables of the same nature but rarely include traveler specific
attributes.
For agent-based models, in (Auld et al., 2017) the value of travel time in AVs is attributed uniformly to
the agents without considering to which real travelers they correspond. In (Azevedo et al., 2016) and
(Martinez & Viegas, 2017), preferences of agents for AVs and destination choice are based on available
traveler data of existing modes without considering what could change in travelers’ opinion due to vehicle automation. In (Boesch et al., 2016), the demand is estimated to be “highly detailed” but this was only spatial and temporal with no particular attention to traveler diversity. Even in “microscopic travel demand” modeling, Heilig et al. (2017) represent travelers for a scenario with AVs with no private
cars, using data of traveler preferences for today’s transport situation. Hörl (2017) uses only time,
distance, and cost in scoring trip possibilities including AVs, assuming that these are the main
explicative variables that underlie transport mode choice.
In optimization models, travelers are often considered having uniform preferences and behavior. Besides
the optimization objectives are either temporal, spatial, or economic. For instance, considering shared
AVs as a user-centric service, Alonso-Mora et al. (2017) developed a dynamic assignment model that
has for sole traveler-centric variable the location of travelers. Travelers are often modeled as a demand
that is randomly generated through time and space (Levin et al., 2016). The objective of optimization
models is often operation-centered like minimizing the number of stops an AV performs (Pimenta et
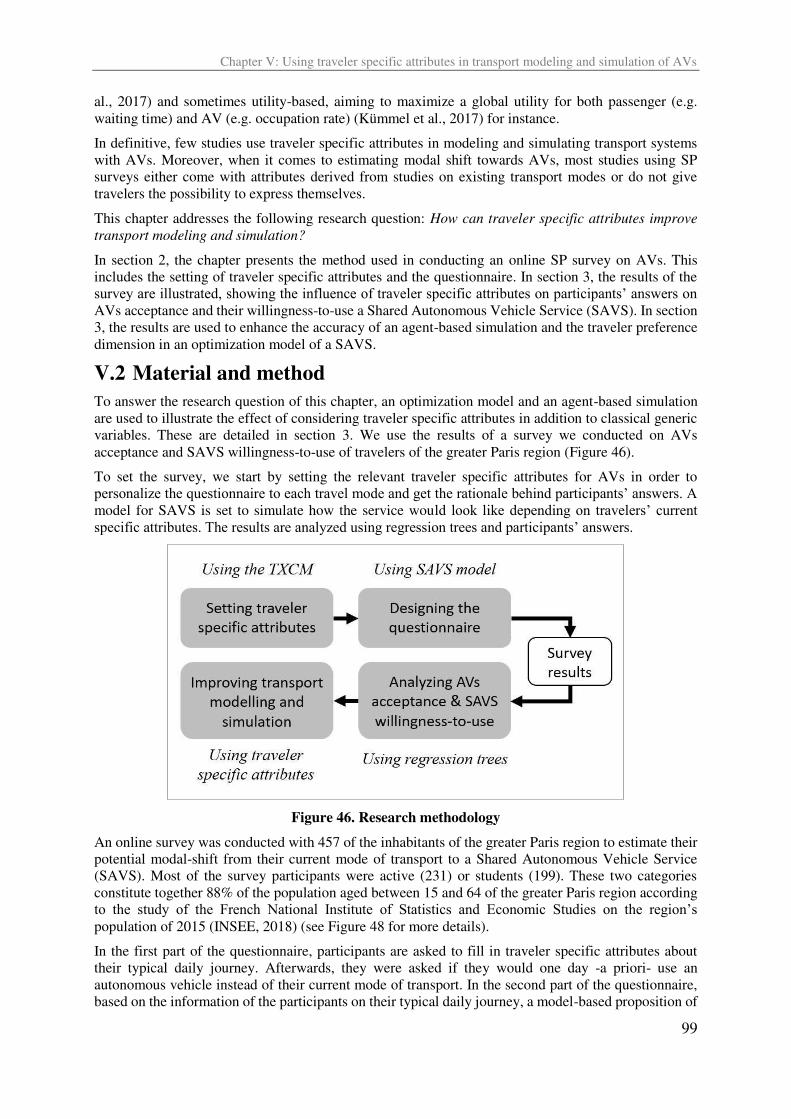
Chapter V: Using traveler specific attributes in transport modeling and simulation of AVs
99
al., 2017) and sometimes utility-based, aiming to maximize a global utility for both passenger (e.g.
waiting time) and AV (e.g. occupation rate) (Kümmel et al., 2017) for instance.
In definitive, few studies use traveler specific attributes in modeling and simulating transport systems
with AVs. Moreover, when it comes to estimating modal shift towards AVs, most studies using SP
surveys either come with attributes derived from studies on existing transport modes or do not give
travelers the possibility to express themselves.
This chapter addresses the following research question: How can traveler specific attributes improve transport modeling and simulation?
In section 2, the chapter presents the method used in conducting an online SP survey on AVs. This
includes the setting of traveler specific attributes and the questionnaire. In section 3, the results of the
survey are illustrated, showing the influence of traveler specific attributes on participants’ answers on AVs acceptance and their willingness-to-use a Shared Autonomous Vehicle Service (SAVS). In section
3, the results are used to enhance the accuracy of an agent-based simulation and the traveler preference
dimension in an optimization model of a SAVS.
V.2 Material and method
To answer the research question of this chapter, an optimization model and an agent-based simulation
are used to illustrate the effect of considering traveler specific attributes in addition to classical generic
variables. These are detailed in section 3. We use the results of a survey we conducted on AVs
acceptance and SAVS willingness-to-use of travelers of the greater Paris region (Figure 46).
To set the survey, we start by setting the relevant traveler specific attributes for AVs in order to
personalize the questionnaire to each travel mode and get the rationale behind participants’ answers. A model for SAVS is set to simulate how the service would look like depending on travelers’ current specific attributes. The results are analyzed using regression trees and participants’ answers.
Figure 46. Research methodology
An online survey was conducted with 457 of the inhabitants of the greater Paris region to estimate their
potential modal-shift from their current mode of transport to a Shared Autonomous Vehicle Service
(SAVS). Most of the survey participants were active (231) or students (199). These two categories
constitute together 88% of the population aged between 15 and 64 of the greater Paris region according
to the study of the French National Institute of Statistics and Economic Studies on the region’s population of 2015 (INSEE, 2018) (see Figure 48 for more details).
In the first part of the questionnaire, participants are asked to fill in traveler specific attributes about
their typical daily journey. Afterwards, they were asked if they would one day -a priori- use an
autonomous vehicle instead of their current mode of transport. In the second part of the questionnaire,
based on the information of the participants on their typical daily journey, a model-based proposition of
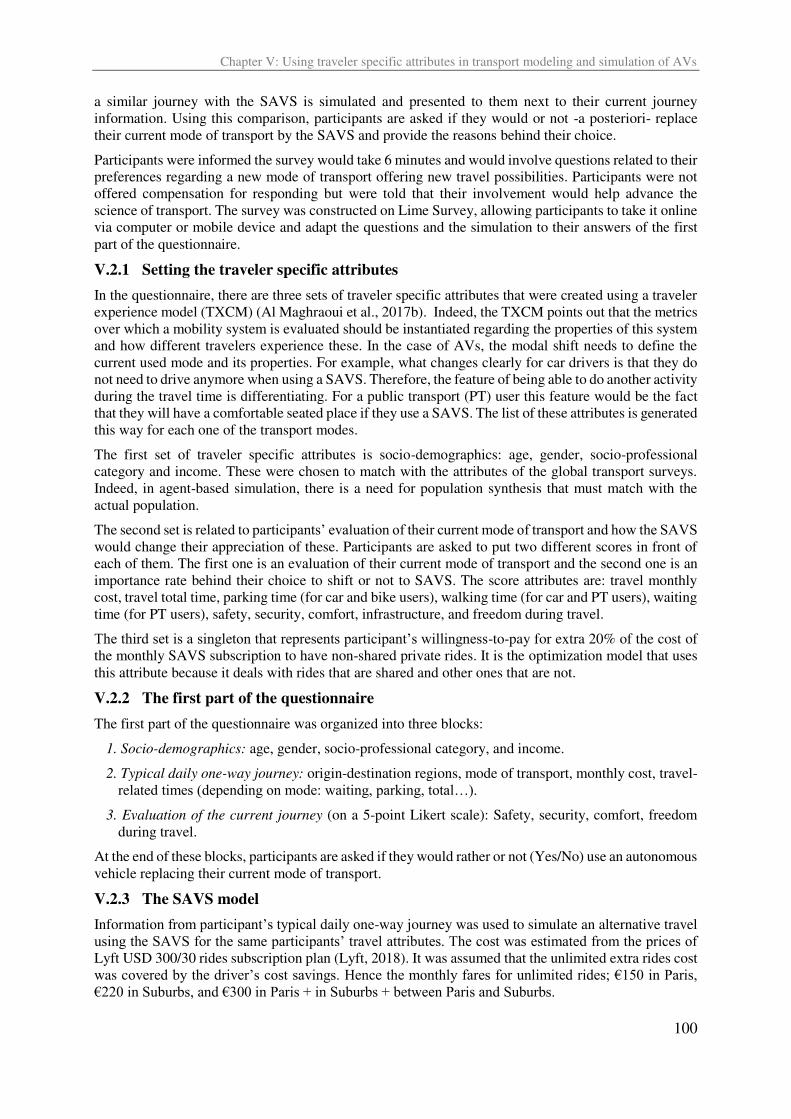
Chapter V: Using traveler specific attributes in transport modeling and simulation of AVs
100
a similar journey with the SAVS is simulated and presented to them next to their current journey
information. Using this comparison, participants are asked if they would or not -a posteriori- replace
their current mode of transport by the SAVS and provide the reasons behind their choice.
Participants were informed the survey would take 6 minutes and would involve questions related to their
preferences regarding a new mode of transport offering new travel possibilities. Participants were not
offered compensation for responding but were told that their involvement would help advance the
science of transport. The survey was constructed on Lime Survey, allowing participants to take it online
via computer or mobile device and adapt the questions and the simulation to their answers of the first
part of the questionnaire.
V.2.1 Setting the traveler specific attributes
In the questionnaire, there are three sets of traveler specific attributes that were created using a traveler
experience model (TXCM) (Al Maghraoui et al., 2017b). Indeed, the TXCM points out that the metrics
over which a mobility system is evaluated should be instantiated regarding the properties of this system
and how different travelers experience these. In the case of AVs, the modal shift needs to define the
current used mode and its properties. For example, what changes clearly for car drivers is that they do
not need to drive anymore when using a SAVS. Therefore, the feature of being able to do another activity
during the travel time is differentiating. For a public transport (PT) user this feature would be the fact
that they will have a comfortable seated place if they use a SAVS. The list of these attributes is generated
this way for each one of the transport modes.
The first set of traveler specific attributes is socio-demographics: age, gender, socio-professional
category and income. These were chosen to match with the attributes of the global transport surveys.
Indeed, in agent-based simulation, there is a need for population synthesis that must match with the
actual population.
The second set is related to participants’ evaluation of their current mode of transport and how the SAVS would change their appreciation of these. Participants are asked to put two different scores in front of
each of them. The first one is an evaluation of their current mode of transport and the second one is an
importance rate behind their choice to shift or not to SAVS. The score attributes are: travel monthly
cost, travel total time, parking time (for car and bike users), walking time (for car and PT users), waiting
time (for PT users), safety, security, comfort, infrastructure, and freedom during travel.
The third set is a singleton that represents participant’s willingness-to-pay for extra 20% of the cost of
the monthly SAVS subscription to have non-shared private rides. It is the optimization model that uses
this attribute because it deals with rides that are shared and other ones that are not.
V.2.2 The first part of the questionnaire
The first part of the questionnaire was organized into three blocks:
1. Socio-demographics: age, gender, socio-professional category, and income.
2. Typical daily one-way journey: origin-destination regions, mode of transport, monthly cost, travel-
related times (depending on mode: waiting, parking, total…).
3. Evaluation of the current journey (on a 5-point Likert scale): Safety, security, comfort, freedom
during travel.
At the end of these blocks, participants are asked if they would rather or not (Yes/No) use an autonomous
vehicle replacing their current mode of transport.
V.2.3 The SAVS model
Information from participant’s typical daily one-way journey was used to simulate an alternative travel
using the SAVS for the same participants’ travel attributes. The cost was estimated from the prices of Lyft USD 300/30 rides subscription plan (Lyft, 2018). It was assumed that the unlimited extra rides cost
was covered by the driver’s cost savings. Hence the monthly fares for unlimited rides; €150 in Paris, €220 in Suburbs, and €300 in Paris + in Suburbs + between Paris and Suburbs.
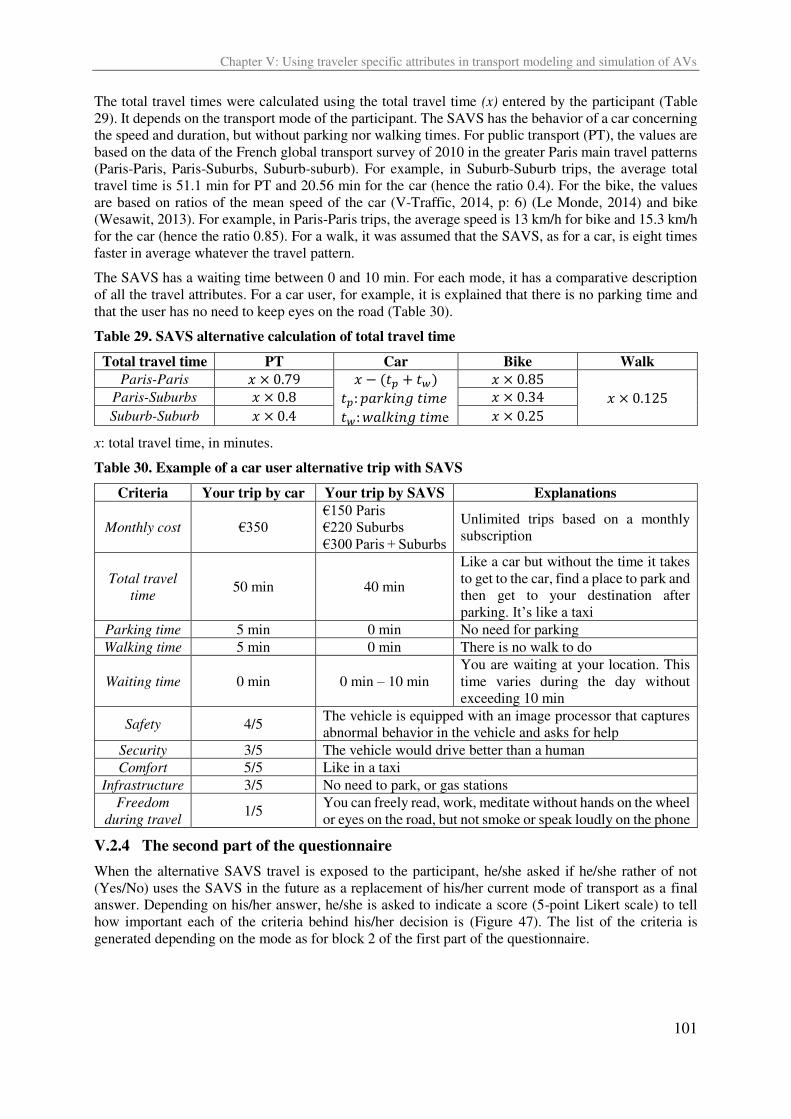
Chapter V: Using traveler specific attributes in transport modeling and simulation of AVs
101
The total travel times were calculated using the total travel time (x) entered by the participant (Table
29). It depends on the transport mode of the participant. The SAVS has the behavior of a car concerning
the speed and duration, but without parking nor walking times. For public transport (PT), the values are
based on the data of the French global transport survey of 2010 in the greater Paris main travel patterns
(Paris-Paris, Paris-Suburbs, Suburb-suburb). For example, in Suburb-Suburb trips, the average total
travel time is 51.1 min for PT and 20.56 min for the car (hence the ratio 0.4). For the bike, the values
are based on ratios of the mean speed of the car (V-Traffic, 2014, p: 6) (Le Monde, 2014) and bike
(Wesawit, 2013). For example, in Paris-Paris trips, the average speed is 13 km/h for bike and 15.3 km/h
for the car (hence the ratio 0.85). For a walk, it was assumed that the SAVS, as for a car, is eight times
faster in average whatever the travel pattern.
The SAVS has a waiting time between 0 and 10 min. For each mode, it has a comparative description
of all the travel attributes. For a car user, for example, it is explained that there is no parking time and
that the user has no need to keep eyes on the road (Table 30).
Table 29. SAVS alternative calculation of total travel time
Total travel time PT Car Bike Walk
Paris-Paris × . − �� + �� ��: � � � � � ��: � � e
× . × . Paris-Suburbs × . × .
Suburb-Suburb × . × .
x: total travel time, in minutes.
Table 30. Example of a car user alternative trip with SAVS
Criteria Your trip by car Your trip by SAVS Explanations
Monthly cost €350
€150 Paris
€220 Suburbs
€300 Paris + Suburbs
Unlimited trips based on a monthly
subscription
Total travel time
50 min 40 min
Like a car but without the time it takes
to get to the car, find a place to park and
then get to your destination after
parking. It’s like a taxi Parking time 5 min 0 min No need for parking
Walking time 5 min 0 min There is no walk to do
Waiting time 0 min 0 min – 10 min
You are waiting at your location. This
time varies during the day without
exceeding 10 min
Safety 4/5 The vehicle is equipped with an image processor that captures
abnormal behavior in the vehicle and asks for help
Security 3/5 The vehicle would drive better than a human
Comfort 5/5 Like in a taxi
Infrastructure 3/5 No need to park, or gas stations
Freedom during travel
1/5 You can freely read, work, meditate without hands on the wheel
or eyes on the road, but not smoke or speak loudly on the phone
V.2.4 The second part of the questionnaire
When the alternative SAVS travel is exposed to the participant, he/she asked if he/she rather of not
(Yes/No) uses the SAVS in the future as a replacement of his/her current mode of transport as a final
answer. Depending on his/her answer, he/she is asked to indicate a score (5-point Likert scale) to tell
how important each of the criteria behind his/her decision is (Figure 47). The list of the criteria is
generated depending on the mode as for block 2 of the first part of the questionnaire.
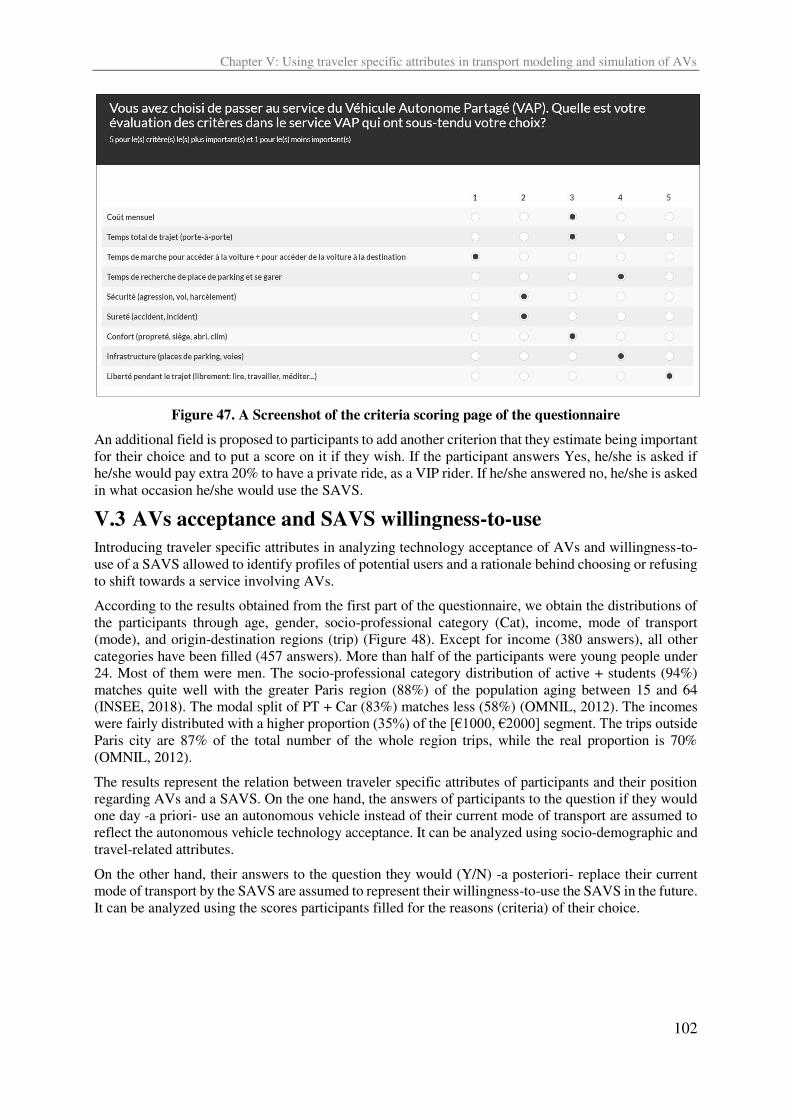
Chapter V: Using traveler specific attributes in transport modeling and simulation of AVs
102
Figure 47. A Screenshot of the criteria scoring page of the questionnaire
An additional field is proposed to participants to add another criterion that they estimate being important
for their choice and to put a score on it if they wish. If the participant answers Yes, he/she is asked if
he/she would pay extra 20% to have a private ride, as a VIP rider. If he/she answered no, he/she is asked
in what occasion he/she would use the SAVS.
V.3 AVs acceptance and SAVS willingness-to-use
Introducing traveler specific attributes in analyzing technology acceptance of AVs and willingness-to-
use of a SAVS allowed to identify profiles of potential users and a rationale behind choosing or refusing
to shift towards a service involving AVs.
According to the results obtained from the first part of the questionnaire, we obtain the distributions of
the participants through age, gender, socio-professional category (Cat), income, mode of transport
(mode), and origin-destination regions (trip) (Figure 48). Except for income (380 answers), all other
categories have been filled (457 answers). More than half of the participants were young people under
24. Most of them were men. The socio-professional category distribution of active + students (94%)
matches quite well with the greater Paris region (88%) of the population aging between 15 and 64
(INSEE, 2018). The modal split of PT + Car (83%) matches less (58%) (OMNIL, 2012). The incomes
were fairly distributed with a higher proportion (35%) of the [€1000, €2000] segment. The trips outside Paris city are 87% of the total number of the whole region trips, while the real proportion is 70%
(OMNIL, 2012).
The results represent the relation between traveler specific attributes of participants and their position
regarding AVs and a SAVS. On the one hand, the answers of participants to the question if they would
one day -a priori- use an autonomous vehicle instead of their current mode of transport are assumed to
reflect the autonomous vehicle technology acceptance. It can be analyzed using socio-demographic and
travel-related attributes.
On the other hand, their answers to the question they would (Y/N) -a posteriori- replace their current
mode of transport by the SAVS are assumed to represent their willingness-to-use the SAVS in the future.
It can be analyzed using the scores participants filled for the reasons (criteria) of their choice.
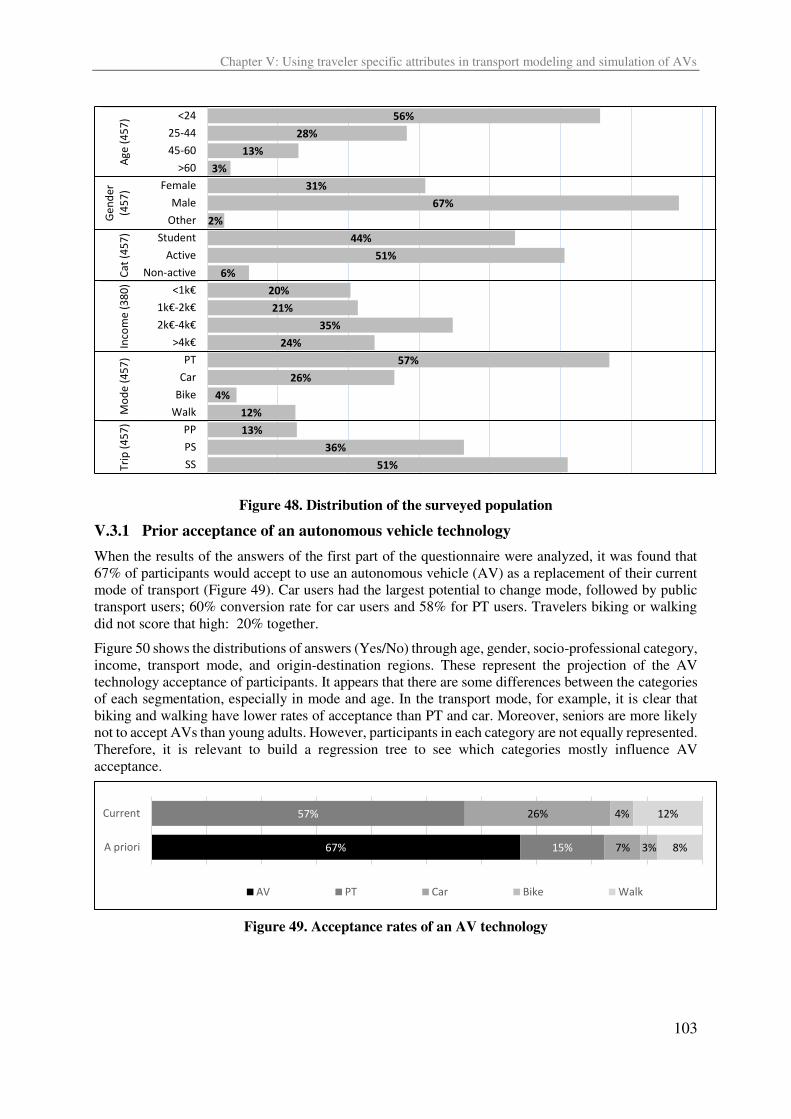
Chapter V: Using traveler specific attributes in transport modeling and simulation of AVs
103
Figure 48. Distribution of the surveyed population
V.3.1 Prior acceptance of an autonomous vehicle technology
When the results of the answers of the first part of the questionnaire were analyzed, it was found that
67% of participants would accept to use an autonomous vehicle (AV) as a replacement of their current
mode of transport (Figure 49). Car users had the largest potential to change mode, followed by public
transport users; 60% conversion rate for car users and 58% for PT users. Travelers biking or walking
did not score that high: 20% together.
Figure 50 shows the distributions of answers (Yes/No) through age, gender, socio-professional category,
income, transport mode, and origin-destination regions. These represent the projection of the AV
technology acceptance of participants. It appears that there are some differences between the categories
of each segmentation, especially in mode and age. In the transport mode, for example, it is clear that
biking and walking have lower rates of acceptance than PT and car. Moreover, seniors are more likely
not to accept AVs than young adults. However, participants in each category are not equally represented.
Therefore, it is relevant to build a regression tree to see which categories mostly influence AV
acceptance.
Figure 49. Acceptance rates of an AV technology
56%
28%
13%
3%
31%
67%
2%
44%
51%
6%
20%
21%
35%
24%
57%
26%
4%
12%
13%
36%
51%
<24
25-44
45-60
>60
Female
Male
Other
Student
Active
Non-active
< k€k€- k€k€-4k€>4k€
PT
Car
Bike
Walk
PP
PS
SS
Ag
e (
45
7)
Ge
nd
er
(45
7)
Ca
t (4
57
)In
com
e (
38
0)
Mo
de
(4
57
)T
rip
(4
57
)
67%
57%
15%
26%
7%
4%
3%
12%
8%
Current
A priori
AV PT Car Bike Walk
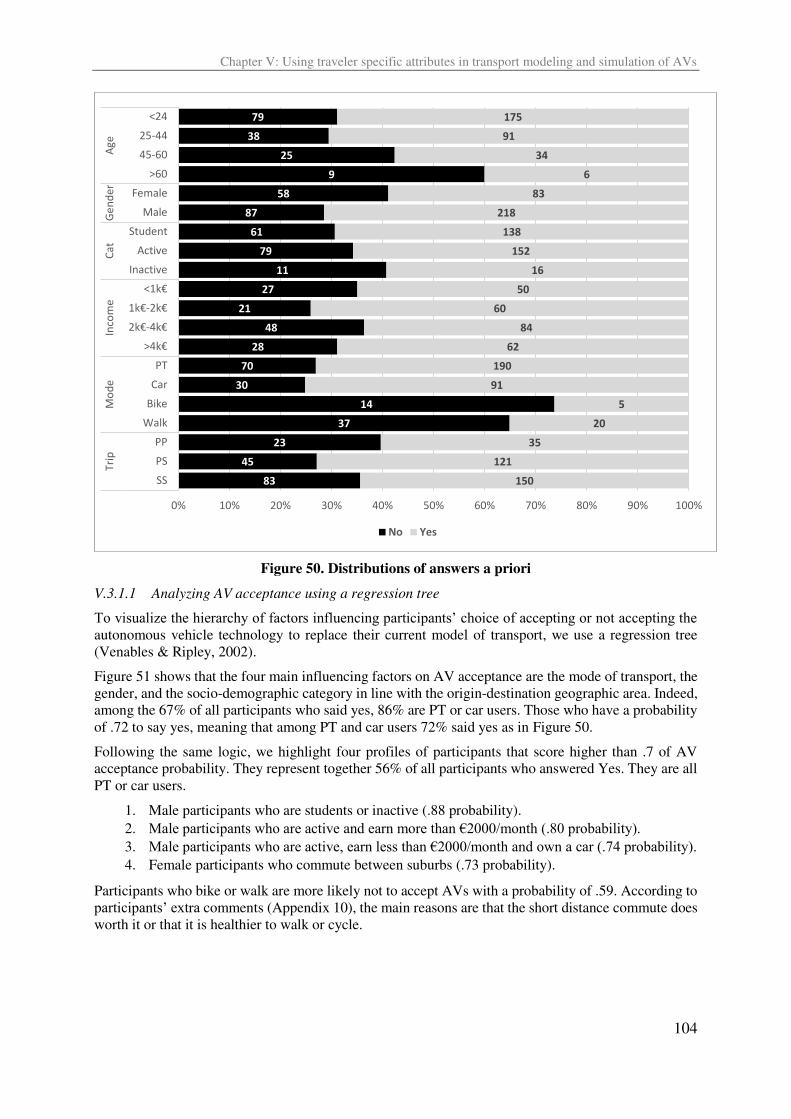
Chapter V: Using traveler specific attributes in transport modeling and simulation of AVs
104
Figure 50. Distributions of answers a priori
V.3.1.1 Analyzing AV acceptance using a regression tree
To visualize the hierarchy of factors influencing participants’ choice of accepting or not accepting the autonomous vehicle technology to replace their current model of transport, we use a regression tree
(Venables & Ripley, 2002).
Figure 51 shows that the four main influencing factors on AV acceptance are the mode of transport, the
gender, and the socio-demographic category in line with the origin-destination geographic area. Indeed,
among the 67% of all participants who said yes, 86% are PT or car users. Those who have a probability
of .72 to say yes, meaning that among PT and car users 72% said yes as in Figure 50.
Following the same logic, we highlight four profiles of participants that score higher than .7 of AV
acceptance probability. They represent together 56% of all participants who answered Yes. They are all
PT or car users.
1. Male participants who are students or inactive (.88 probability).
2. Male participants who are active and earn more than €2000/month (.80 probability). 3. Male participants who are active, earn less than €2000/month and own a car (.74 probability). 4. Female participants who commute between suburbs (.73 probability).
Participants who bike or walk are more likely not to accept AVs with a probability of .59. According to
participants’ extra comments (Appendix 10), the main reasons are that the short distance commute does
worth it or that it is healthier to walk or cycle.
79
38
25
9
58
87
61
79
11
27
21
48
28
70
30
14
37
23
45
83
175
91
34
6
83
218
138
152
16
50
60
84
62
190
91
5
20
35
121
150
0% 10% 20% 30% 40% 50% 60% 70% 80% 90% 100%
<24
25-44
45-60
>60
Female
Male
Student
Active
Inactive
< k€k€- k€k€-4k€>4k€
PT
Car
Bike
Walk
PP
PS
SS
Ag
eG
en
de
rC
at
Inco
me
Mo
de
Tri
p
No Yes
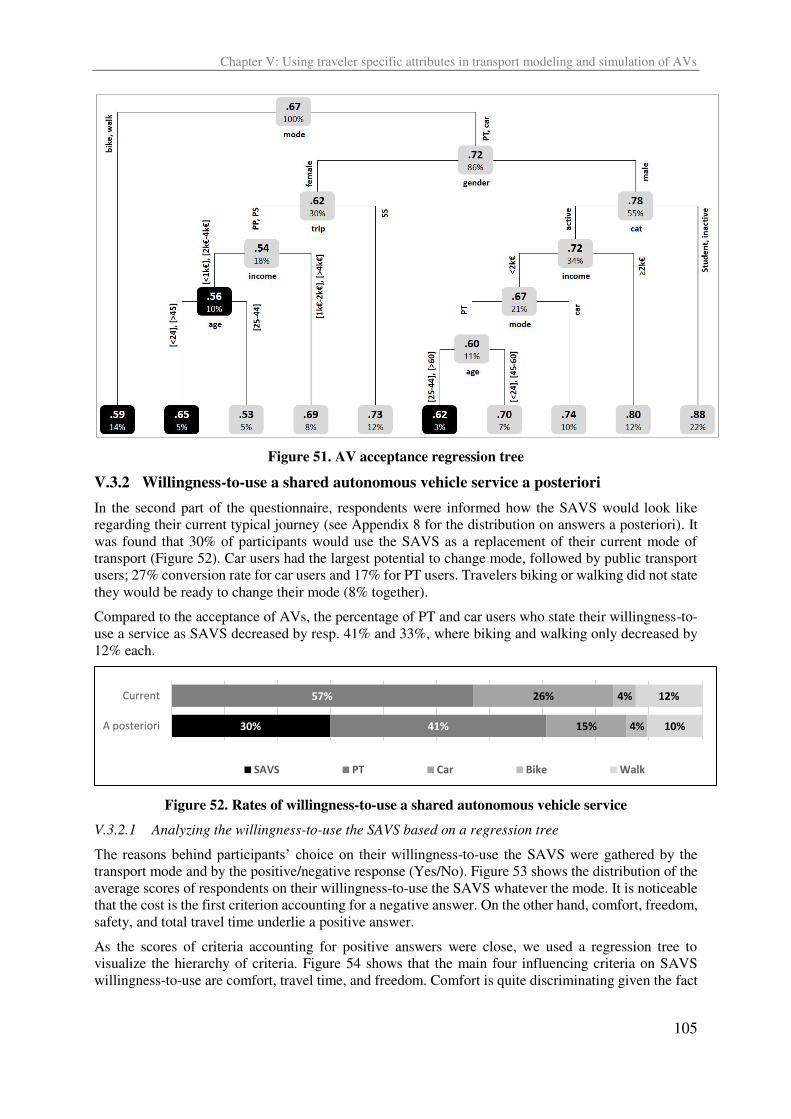
Chapter V: Using traveler specific attributes in transport modeling and simulation of AVs
105
Figure 51. AV acceptance regression tree
V.3.2 Willingness-to-use a shared autonomous vehicle service a posteriori
In the second part of the questionnaire, respondents were informed how the SAVS would look like
regarding their current typical journey (see Appendix 8 for the distribution on answers a posteriori). It
was found that 30% of participants would use the SAVS as a replacement of their current mode of
transport (Figure 52). Car users had the largest potential to change mode, followed by public transport
users; 27% conversion rate for car users and 17% for PT users. Travelers biking or walking did not state
they would be ready to change their mode (8% together).
Compared to the acceptance of AVs, the percentage of PT and car users who state their willingness-to-
use a service as SAVS decreased by resp. 41% and 33%, where biking and walking only decreased by
12% each.
Figure 52. Rates of willingness-to-use a shared autonomous vehicle service
V.3.2.1 Analyzing the willingness-to-use the SAVS based on a regression tree
The reasons behind participants’ choice on their willingness-to-use the SAVS were gathered by the
transport mode and by the positive/negative response (Yes/No). Figure 53 shows the distribution of the
average scores of respondents on their willingness-to-use the SAVS whatever the mode. It is noticeable
that the cost is the first criterion accounting for a negative answer. On the other hand, comfort, freedom,
safety, and total travel time underlie a positive answer.
As the scores of criteria accounting for positive answers were close, we used a regression tree to
visualize the hierarchy of criteria. Figure 54 shows that the main four influencing criteria on SAVS
willingness-to-use are comfort, travel time, and freedom. Comfort is quite discriminating given the fact
30%
57%
41%
26%
15%
4%
4%
12%
10%
Current
A posteriori
SAVS PT Car Bike Walk
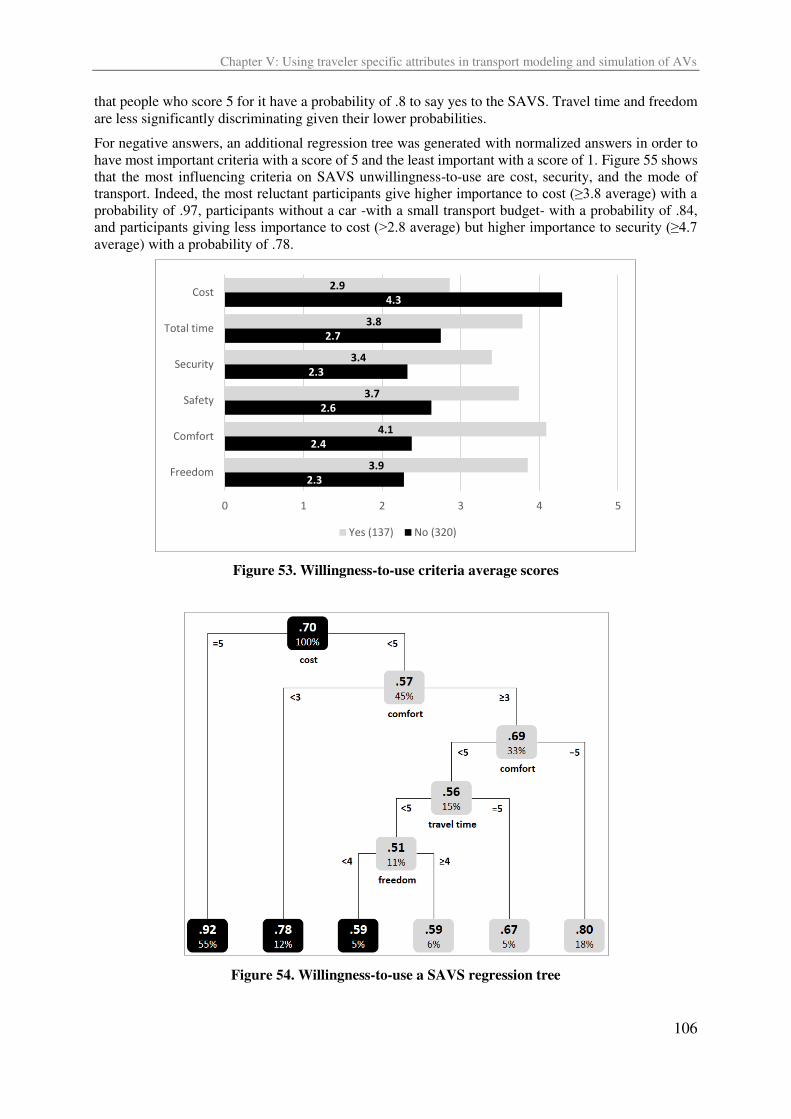
Chapter V: Using traveler specific attributes in transport modeling and simulation of AVs
106
that people who score 5 for it have a probability of .8 to say yes to the SAVS. Travel time and freedom
are less significantly discriminating given their lower probabilities.
For negative answers, an additional regression tree was generated with normalized answers in order to
have most important criteria with a score of 5 and the least important with a score of 1. Figure 55 shows
that the most influencing criteria on SAVS unwillingness-to-use are cost, security, and the mode of
transport. Indeed, the most reluctant participants give higher importance to cost (≥3.8 average) with a probability of .97, participants without a car -with a small transport budget- with a probability of .84,
and participants giving less importance to cost (>2.8 average) but higher importance to security (≥4.7 average) with a probability of .78.
Figure 53. Willingness-to-use criteria average scores
Figure 54. Willingness-to-use a SAVS regression tree
2.9
3.8
3.4
3.7
4.1
3.9
4.3
2.7
2.3
2.6
2.4
2.3
0 1 2 3 4 5
Cost
Total time
Security
Safety
Comfort
Freedom
Yes (137) No (320)
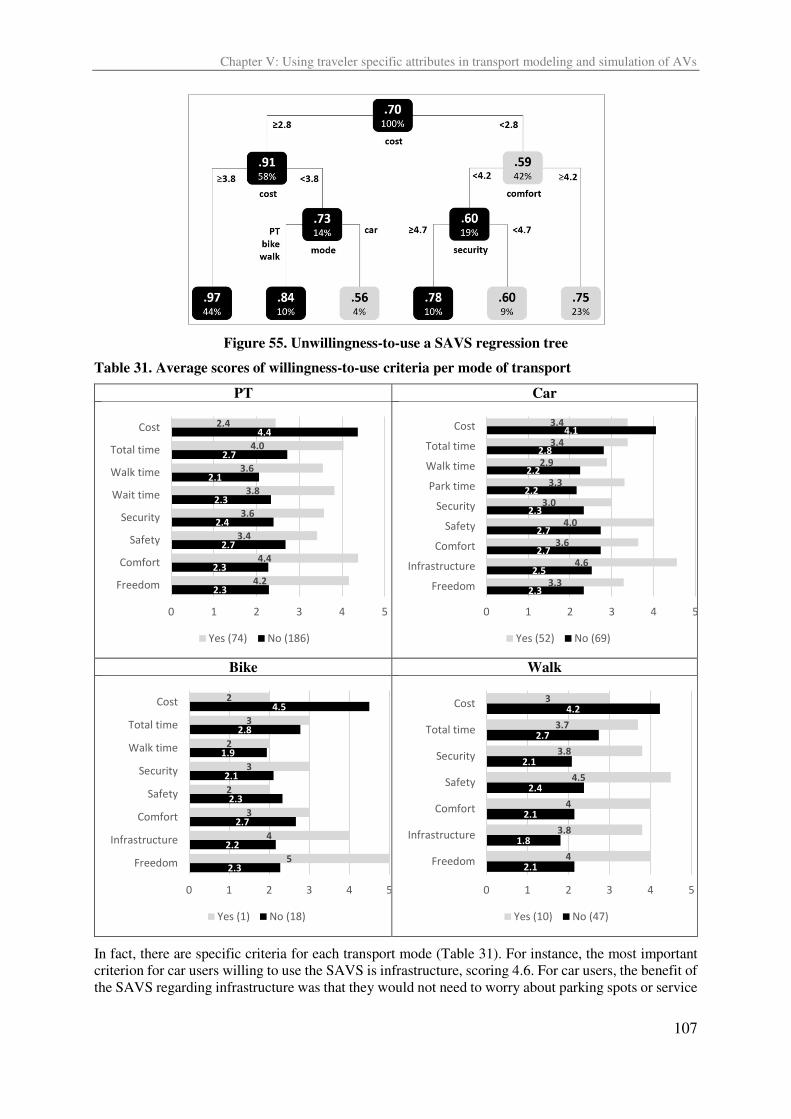
Chapter V: Using traveler specific attributes in transport modeling and simulation of AVs
107
Figure 55. Unwillingness-to-use a SAVS regression tree
Table 31. Average scores of willingness-to-use criteria per mode of transport
PT Car
Bike Walk
In fact, there are specific criteria for each transport mode (Table 31). For instance, the most important
criterion for car users willing to use the SAVS is infrastructure, scoring 4.6. For car users, the benefit of
the SAVS regarding infrastructure was that they would not need to worry about parking spots or service
2.4
4.0
3.6
3.8
3.6
3.4
4.4
4.2
4.4
2.7
2.1
2.3
2.4
2.7
2.3
2.3
0 1 2 3 4 5
Cost
Total time
Walk time
Wait time
Security
Safety
Comfort
Freedom
Yes (74) No (186)
3.4
3.4
2.9
3.3
3.0
4.0
3.6
4.6
3.3
4.1
2.8
2.2
2.2
2.3
2.7
2.7
2.5
2.3
0 1 2 3 4 5
Cost
Total time
Walk time
Park time
Security
Safety
Comfort
Infrastructure
Freedom
Yes (52) No (69)
2
3
2
3
2
3
4
5
4.5
2.8
1.9
2.1
2.3
2.7
2.2
2.3
0 1 2 3 4 5
Cost
Total time
Walk time
Security
Safety
Comfort
Infrastructure
Freedom
Yes (1) No (18)
3
3.7
3.8
4.5
4
3.8
4
4.2
2.7
2.1
2.4
2.1
1.8
2.1
0 1 2 3 4 5
Cost
Total time
Security
Safety
Comfort
Infrastructure
Freedom
Yes (10) No (47)
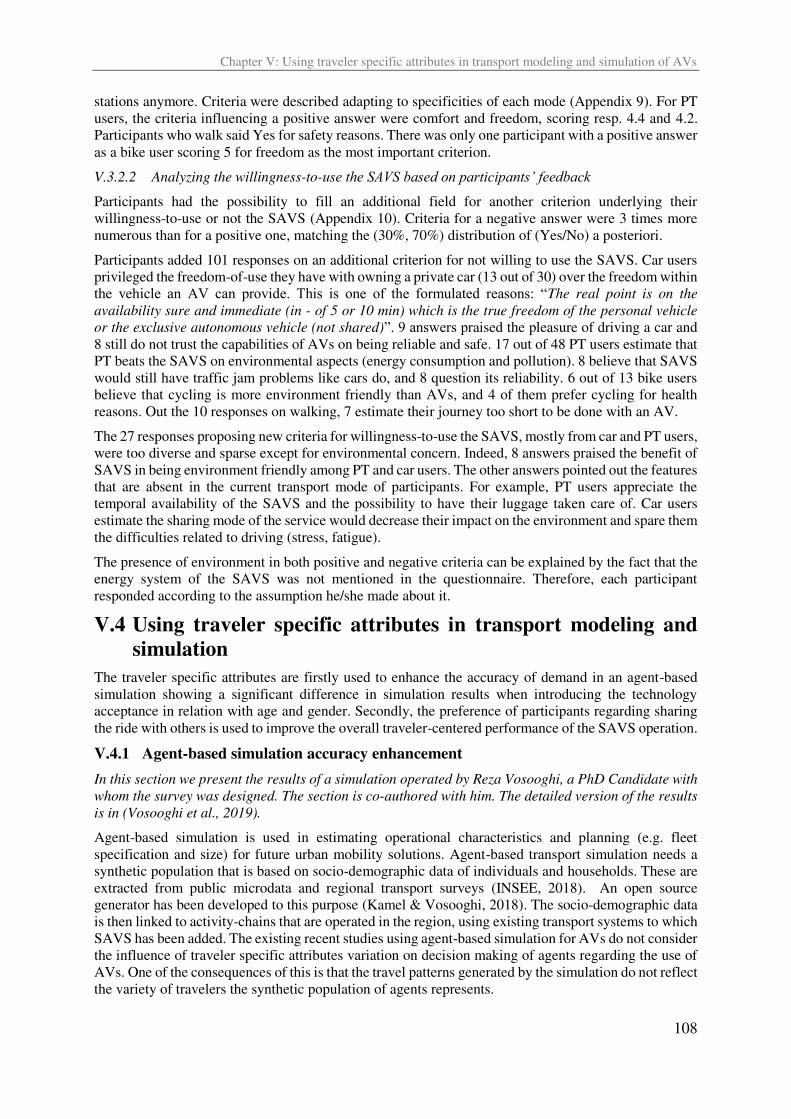
Chapter V: Using traveler specific attributes in transport modeling and simulation of AVs
108
stations anymore. Criteria were described adapting to specificities of each mode (Appendix 9). For PT
users, the criteria influencing a positive answer were comfort and freedom, scoring resp. 4.4 and 4.2.
Participants who walk said Yes for safety reasons. There was only one participant with a positive answer
as a bike user scoring 5 for freedom as the most important criterion.
V.3.2.2 Analyzing the willingness-to-use the SAVS based on participants’ feedback
Participants had the possibility to fill an additional field for another criterion underlying their
willingness-to-use or not the SAVS (Appendix 10). Criteria for a negative answer were 3 times more
numerous than for a positive one, matching the (30%, 70%) distribution of (Yes/No) a posteriori.
Participants added 101 responses on an additional criterion for not willing to use the SAVS. Car users
privileged the freedom-of-use they have with owning a private car (13 out of 30) over the freedom within
the vehicle an AV can provide. This is one of the formulated reasons: “The real point is on the availability sure and immediate (in - of 5 or 10 min) which is the true freedom of the personal vehicle or the exclusive autonomous vehicle (not shared)”. 9 answers praised the pleasure of driving a car and
8 still do not trust the capabilities of AVs on being reliable and safe. 17 out of 48 PT users estimate that
PT beats the SAVS on environmental aspects (energy consumption and pollution). 8 believe that SAVS
would still have traffic jam problems like cars do, and 8 question its reliability. 6 out of 13 bike users
believe that cycling is more environment friendly than AVs, and 4 of them prefer cycling for health
reasons. Out the 10 responses on walking, 7 estimate their journey too short to be done with an AV.
The 27 responses proposing new criteria for willingness-to-use the SAVS, mostly from car and PT users,
were too diverse and sparse except for environmental concern. Indeed, 8 answers praised the benefit of
SAVS in being environment friendly among PT and car users. The other answers pointed out the features
that are absent in the current transport mode of participants. For example, PT users appreciate the
temporal availability of the SAVS and the possibility to have their luggage taken care of. Car users
estimate the sharing mode of the service would decrease their impact on the environment and spare them
the difficulties related to driving (stress, fatigue).
The presence of environment in both positive and negative criteria can be explained by the fact that the
energy system of the SAVS was not mentioned in the questionnaire. Therefore, each participant
responded according to the assumption he/she made about it.
V.4 Using traveler specific attributes in transport modeling and
simulation
The traveler specific attributes are firstly used to enhance the accuracy of demand in an agent-based
simulation showing a significant difference in simulation results when introducing the technology
acceptance in relation with age and gender. Secondly, the preference of participants regarding sharing
the ride with others is used to improve the overall traveler-centered performance of the SAVS operation.
V.4.1 Agent-based simulation accuracy enhancement
In this section we present the results of a simulation operated by Reza Vosooghi, a PhD Candidate with whom the survey was designed. The section is co-authored with him. The detailed version of the results is in (Vosooghi et al., 2019).
Agent-based simulation is used in estimating operational characteristics and planning (e.g. fleet
specification and size) for future urban mobility solutions. Agent-based transport simulation needs a
synthetic population that is based on socio-demographic data of individuals and households. These are
extracted from public microdata and regional transport surveys (INSEE, 2018). An open source
generator has been developed to this purpose (Kamel & Vosooghi, 2018). The socio-demographic data
is then linked to activity-chains that are operated in the region, using existing transport systems to which
SAVS has been added. The existing recent studies using agent-based simulation for AVs do not consider
the influence of traveler specific attributes variation on decision making of agents regarding the use of
AVs. One of the consequences of this is that the travel patterns generated by the simulation do not reflect
the variety of travelers the synthetic population of agents represents.
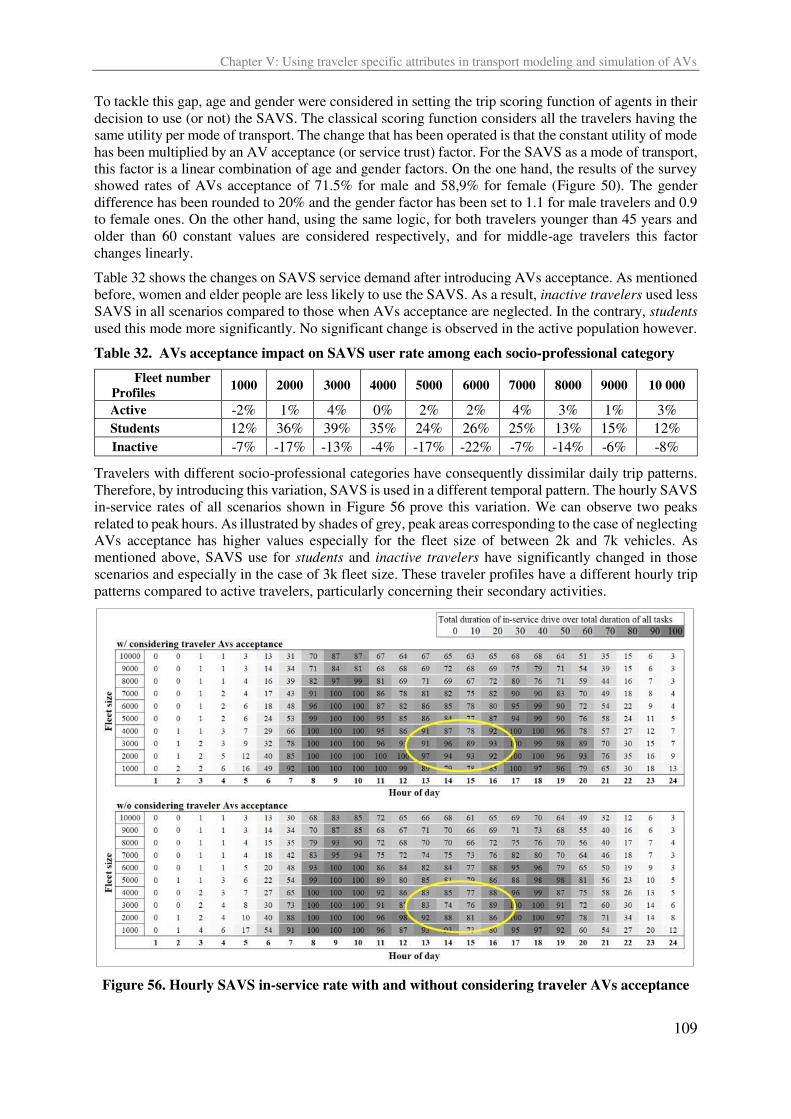
Chapter V: Using traveler specific attributes in transport modeling and simulation of AVs
109
To tackle this gap, age and gender were considered in setting the trip scoring function of agents in their
decision to use (or not) the SAVS. The classical scoring function considers all the travelers having the
same utility per mode of transport. The change that has been operated is that the constant utility of mode
has been multiplied by an AV acceptance (or service trust) factor. For the SAVS as a mode of transport,
this factor is a linear combination of age and gender factors. On the one hand, the results of the survey
showed rates of AVs acceptance of 71.5% for male and 58,9% for female (Figure 50). The gender
difference has been rounded to 20% and the gender factor has been set to 1.1 for male travelers and 0.9
to female ones. On the other hand, using the same logic, for both travelers younger than 45 years and
older than 60 constant values are considered respectively, and for middle-age travelers this factor
changes linearly.
Table 32 shows the changes on SAVS service demand after introducing AVs acceptance. As mentioned
before, women and elder people are less likely to use the SAVS. As a result, inactive travelers used less
SAVS in all scenarios compared to those when AVs acceptance are neglected. In the contrary, students
used this mode more significantly. No significant change is observed in the active population however.
Table 32. AVs acceptance impact on SAVS user rate among each socio-professional category
Fleet number Profiles
1000 2000 3000 4000 5000 6000 7000 8000 9000 10 000
Active -2% 1% 4% 0% 2% 2% 4% 3% 1% 3%
Students 12% 36% 39% 35% 24% 26% 25% 13% 15% 12%
Inactive -7% -17% -13% -4% -17% -22% -7% -14% -6% -8%
Travelers with different socio-professional categories have consequently dissimilar daily trip patterns.
Therefore, by introducing this variation, SAVS is used in a different temporal pattern. The hourly SAVS
in-service rates of all scenarios shown in Figure 56 prove this variation. We can observe two peaks
related to peak hours. As illustrated by shades of grey, peak areas corresponding to the case of neglecting
AVs acceptance has higher values especially for the fleet size of between 2k and 7k vehicles. As
mentioned above, SAVS use for students and inactive travelers have significantly changed in those
scenarios and especially in the case of 3k fleet size. These traveler profiles have a different hourly trip
patterns compared to active travelers, particularly concerning their secondary activities.
Figure 56. Hourly SAVS in-service rate with and without considering traveler AVs acceptance
Chapter V: Using traveler specific attributes in transport modeling and simulation of AVs
110
These results showed that by introducing the influence of age and gender on AVs acceptance, we could
simulate more accurate SAVS demand and in-service rate.
V.4.2 Introducing traveler satisfaction in shared mobility optimization models
In this section we present the outputs of the optimization model operated by Abood Mourad, a PhD Candidate with whom the survey was designed. The section is co-authored with him. More details of the optimization model are illustrated in (Mourad et al., 2018).
We introduce traveler profiles into an optimization model that is used to operate the SAVS. In order to
match travelers in ride-share trips, the model uses the concept of meeting points. Thus, riders can be
picked up at their origin locations or at a pickup meeting point, and dropped off at their destination
locations or at a drop-off meeting point. These meeting points are usually located at feasible walking
distances from traveler origin and destination locations. The main advantage of using meeting points is
that they can lead to shorter detours compared to the case where travelers are only picked up/dropped
off at their origin and destination locations (Stiglic et al., 2015) (Figure 57).
Figure 57- Ride-sharing with Meeting Points - Distance Savings
We start by defining the set of feasible matches (shared rides) between different travelers (phase-1). A
feasible match respects the time constraints (time windows) of its participants, the capacity of the
vehicle, and achieves a distance saving. The distance saving is obtained by comparing the distance of
the shared trip with the sum of distances of individual trips (i.e. when no sharing is done and every
traveler travels alone from his/her origin to his/her destination location) (see the example in Figure 57).
Then, a matching optimization problem selects the best matches among the ones generated in phase-1
such that the number of matched travelers and the corresponding distance savings are maximized.
In the original model (Mourad et al., 2018), all traveler demands are assumed to be homogeneous, i.e.
no traveler profiles are considered. Now, we introduce the concept of “VIP” travelers into the model and we analyze its impact on the operator revenues as well as the quality of the service provided. VIP
travelers are those who are willing to pay extra 20% of their travel expenses in order to have a private
on-demand AV (no sharing with others). The survey showed that 40% of participants who are willing
to use the SAVS, are ready to pay extra 20% of the shared trips price.
In order to test the proposed model, taxicab trips from New York City are used to generate traveler trips
(TLC, 2017). These trips correspond to short trips around city center with an average travel time of 9.04
mins. AVs are assumed to be homogeneous with a capacity of 4 places and 24 km/h speed. The
maximum walking distance that travelers could accept to reach a meeting point is set to be 500 m. The
AV transport cost per km is set to be 0.2 €/km based on (Cortright, 2017). In addition, the travel cost
per km for non-VIP travelers is considered to be 0.2 €/km and for VIP travelers 0.24 €/km (20% more than the normal fee, reference to our survey) (Table 33). The 0.2 €/km fee is calculated using the same average monthly subscription price (220€) as presented to the surveys’ participants. The average daily kilometrage is assumed at 36 km.
When tested over different instances of more than 3000 travelers, the results indicate that the service
operator general benefit might decrease by up to 4% when 40% of the travelers are assumed to be
inscribed to the VIP service. Although VIP travelers pay extra charges for the service, the operator will
Chapter V: Using traveler specific attributes in transport modeling and simulation of AVs
111
also have some additional cost. These additional costs are related to AV cost per kilometer. More
precisely, an AV that was able to serve 2 or 3 travelers in the original case, might have to serve only a
VIP traveler in the second case which might increase the system-wide AV-miles and thus increase the
operational cost for the operator.
However, introducing traveler profiles into the system has the potential to enhance the quality of the
service provided. First, for VIPs, they will have a more comfortable and relatively shorter travel times,
as they will be transported directly from their origins to their destinations. In addition, for the non-VIP
travelers, the results indicate that their average detour time will decrease by 11% (0.326 min) and that
their average waiting time (at meeting points) will decrease by 5.5% (0.204 min).
Table 33. Instance Characteristics and Parameters
Trip pattern: short trips around city center Parameters
Average number of travelers 3042
Average trip distance for traveler 3.64 km
Average trip time for traveler 9.04 mins
Max walking distance to meeting point 0.5 km
Walking speed 4 ft/s
Vehicle speed 24 km/h
AV capacity 4
AV cost per km 0.2 €/km
Traveler fee per km 0.2 €/km
VIP traveler fee per km 0.24 €/km
Summarily, by considering traveler profiles the SAVS operator invests 4% of its profit to increase
overall traveler satisfaction. Indeed, the private ride preference of VIP riders is satisfied and generate a
positive effect on the non-VIP riders who have shorter rides and less waiting time.
V.5 Conclusion
This chapter starts by relating the lack of consideration of traveler specific attributes in modelling and
simulating transport systems. In the case of forecasting either traveler would adopt AVs in the future or
not, it suggests a set of traveler specific attributes as explanatory assets to know who are travelers that
are the most likely to use AVs. Introducing traveler specific attributes in analyzing technology
acceptance of AVs and willingness-to-use of a SAVS allowed to identify profiles of potential users and
a rationale behind choosing or refusing to shift towards a service involving AVs.
Moreover, an optimization model and an agent-based simulation have been proven to benefit from
introducing these traveler specific attributes among their generic ones. Indeed, the accuracy of the
demand on SAVS in the agent-based simulation has been improved and the temporal in-service rate has
been altered, reflecting the heterogeneity of travelers. The optimization model considered traveler
preference for riding privately the SAVS and showed that the overall satisfaction of traveler increases
by doing so.
The outputs of the survey that has been used in this chapter produced different contributions. The first
one is that it allowed to identify who are the travelers most accepting the AV technology regarding their
socio-demographics. The second one is that it allowed to hierarchize the reasons for willing (or not) to
use the SAVS for each mode of transport. The third one is that it identified the percentage of travelers
who accept to pay extra for private rides among those willing-to-use the SAVS. The fourth contribution
is that it allowed to identify additional reasons behind travelers’ willingness (or not) to use the SAVS.
Besides, the survey confirms similar studies that have been conducted during the last five years on AVs
acceptance and willingness-to-use. All of them consider high income as a positive influential factor as
it represents the capacity to use a service that would be costly (Zmud et al., 2016) (Bansal et al., 2016)
(Haboucha et al., 2017). Exceptionally, Kyriakidis et al. (2015) alone found out that higher income
societies are more concerned by the technology and relate it to their awareness of its non-maturity. Male
and young participants are always the most likely to accept AVs as a replacement mobility solution
Chapter V: Using traveler specific attributes in transport modeling and simulation of AVs
112
(Haboucha et al., 2017) (Hohenberger et al., 2016) (Bansal et al., 2016) (Kyriakidis et al., 2015) (Payre,
2015) (Schoettle & Sivak, 2014) (Power J.D., 2012). The influence of the mode is not widely considered
in these studies. However, PT users are often the closest to AVs acceptance (Zmud et al., 2016) (Krueger
et al., 2016) (Haboucha et al., 2017).
Cost is widely recognized as the most important barrier participants consider in their willingness-to-use
AVs in all their forms (shared or non-shared) (Howard & Dai, 2014) (Bansal et al., 2016) (Caldwell,
2014) (Krueger et al., 2016) (Fraedrich & Lenz, 2014). Comfort and security are given less importance
as most of the surveys sample car drivers only. Time saving was considered also a positive factor by
Accenture (2011) and KPMG (2013). Criteria that participants added were also present in literature.
Participants who enjoy driving (Kyriakidis et al., 2015) , who are concerned by environmental
friendliness (Howard & Dai, 2014) and safety (Bansal et al., 2016) are more likely not to use AVs.
Safety is also believed to improve in AVs and therefore is a positive influential factor, like in (Fraedrich
& Lenz, 2014).
The use of traveler specific attributes in the two transport model examples that have been shown in this
chapter, relates an important observation. Indeed, transport operators and industrials attribute more
importance to technical-centered variables in evaluating or forecasting transport systems. This way, they
neglect the human-centered indicators that concern the satisfaction and the specificity of travelers. This
chapter prove that they would win more by combining both traveler (specific) and technical (generic)
variables, especially for transport systems that are not existing yet.

General discussion
113
General discussion General discussion
General discussion
114
In section I.3.6, we state that our main research question is; “How can traveler experience be modeled to feed travel problems diagnosis?”. We answered it by designing a traveler experience model (object
of the Chapter II) from which we derived two other research questions that made the object of Chapters
III and IV; “What are the problems travelers experience using urban mobility systems?” and “What is the effect of a traveler -centered stimulus on travel problem generation effectiveness?”.
The last chapter proposed an answer to the research question that is a trial to bridge design and
transportation research; “How can specific traveler attributes improve transport modeling and simulation of autonomous vehicles?”. We presented each chapter with its own discussion. Now we
present the general discussion of the thesis, integrating the chapters together.
Summary of the results
In this thesis, we have used an action research methodology with a design research purpose. Combining
different methods, the objective was to improve the outputs of travel problem diagnosis and the
performance of transport modeling and simulation regarding traveler-centered variables.
We started with a literature review bridging human-centered design and transportation. We then
identified some challenges facing the practice of designing urban mobility systems related to their
complexity. This helped us formulate our main research questions and set a research action protocol.
In the literature, we identified some limitations for modeling the traveler experience. Combining
observations, interviews, and workshops, we set a conceptual model of the traveler experience that takes
into account most of the complexity factors of urban mobility. The model included the concept of travel
scenarios and defined a travel problem as being the difference between real and expected travel
scenarios. This first version of the model was experimented on a case study of an on-demand bus service
in Paris suburban area. We showed that travel problems are more than what travelers say and a more
complete framework is needed to identify most of the problems travelers could express. This way the
second research question was formulated aiming at identifying travel problems as perceived by travelers.
We have not found any papers modeling archetypes of travel problems that can be used by a designer
to capture what travelers can say about their travel problems. We built a grounded theory of travel
problems in the form of a taxonomy and a causal scheme. The grounded theory methodology used
interviews from 6 urban mobility experts as lead-users to inform us about their travel problems. The
taxonomy serves as a reference framework that represents the big picture of travel problems and the
causal scheme to link all the identifiable problems and generate more. Together with the traveler
experience conceptual model this contribution served to design a stimulus that is meant to help travelers,
in a focus group, express better their problems. This was tested for cycling, walking, driving, and using
public transport experiences in Paris, Singapore and Vienna.
We proposed an experiment in order to evaluate the impact of the stimulus on a travel problem
generation session. We used quantity, variety and novelty of generated travel problems as the metrics to
evaluate the impact of the stimulus. Two control groups were used as a baseline for non-stimulated
problem generation and two experimental groups were provided with the stimulus. All groups
participants were regular users of the same bus shuttle. Results showed that stimulated groups generate
novel ideas with a greater variety covering most of the traveler experience dimensions than non-
stimulated groups.
Coming back to our last research question, we conducted a survey. We used its results to add variations
in travelers’ profiles in transportation modeling and simulation. On the one hand, we identified profiles
of travelers that are more likely to accept autonomous vehicle technology. On the other hand, we
identified subjective criteria of travelers behind their willingness to use a shared autonomous vehicle
service depending on their current mode of transport. We then showed the relevance of subjective travel
attributes with regards to studying a mobility system and how these attributes can enhance the accuracy
of agent-based models and the traveler preference dimension in optimization models.
After reviewing the results, we now translate these into both theoretical and practical contributions.
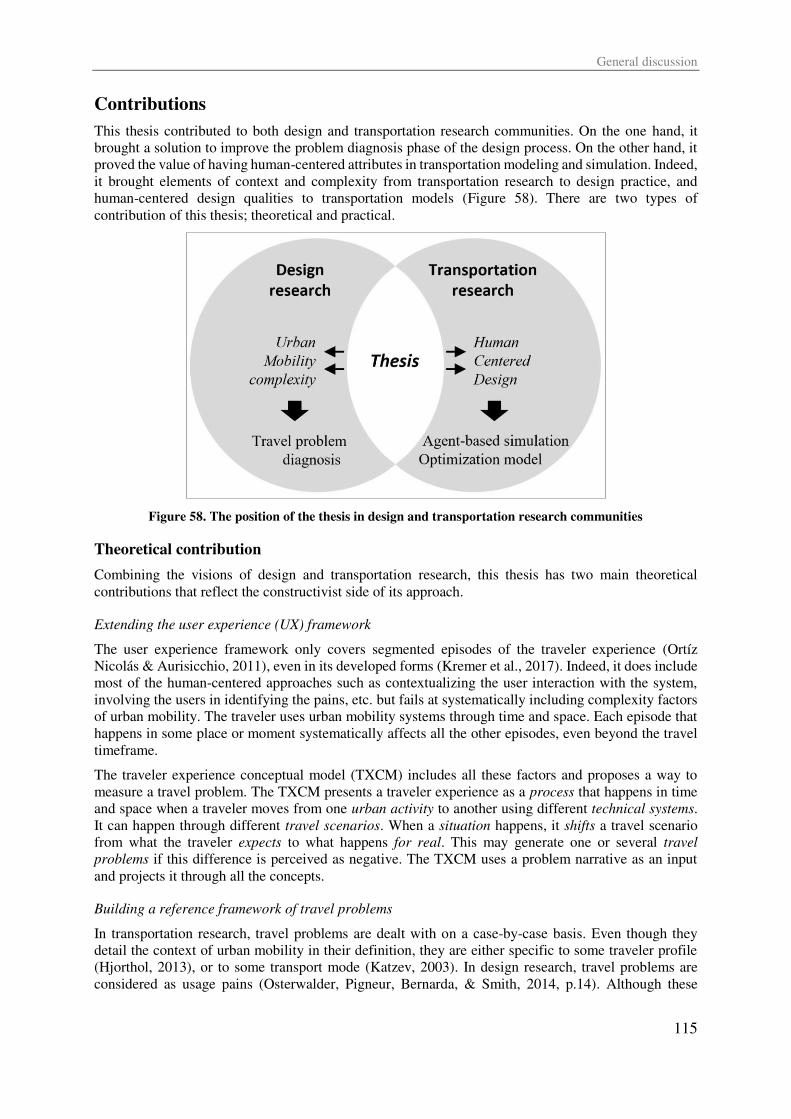
General discussion
115
Contributions
This thesis contributed to both design and transportation research communities. On the one hand, it
brought a solution to improve the problem diagnosis phase of the design process. On the other hand, it
proved the value of having human-centered attributes in transportation modeling and simulation. Indeed,
it brought elements of context and complexity from transportation research to design practice, and
human-centered design qualities to transportation models (Figure 58). There are two types of
contribution of this thesis; theoretical and practical.
Figure 58. The position of the thesis in design and transportation research communities
Theoretical contribution
Combining the visions of design and transportation research, this thesis has two main theoretical
contributions that reflect the constructivist side of its approach.
Extending the user experience (UX) framework
The user experience framework only covers segmented episodes of the traveler experience (Ortíz
Nicolás & Aurisicchio, 2011), even in its developed forms (Kremer et al., 2017). Indeed, it does include
most of the human-centered approaches such as contextualizing the user interaction with the system,
involving the users in identifying the pains, etc. but fails at systematically including complexity factors
of urban mobility. The traveler uses urban mobility systems through time and space. Each episode that
happens in some place or moment systematically affects all the other episodes, even beyond the travel
timeframe.
The traveler experience conceptual model (TXCM) includes all these factors and proposes a way to
measure a travel problem. The TXCM presents a traveler experience as a process that happens in time
and space when a traveler moves from one urban activity to another using different technical systems.
It can happen through different travel scenarios. When a situation happens, it shifts a travel scenario
from what the traveler expects to what happens for real. This may generate one or several travel problems if this difference is perceived as negative. The TXCM uses a problem narrative as an input
and projects it through all the concepts.
Building a reference framework of travel problems
In transportation research, travel problems are dealt with on a case-by-case basis. Even though they
detail the context of urban mobility in their definition, they are either specific to some traveler profile
(Hjorthol, 2013), or to some transport mode (Katzev, 2003). In design research, travel problems are
considered as usage pains (Osterwalder, Pigneur, Bernarda, & Smith, 2014, p.14). Although these
General discussion
116
consider different human-centered dimensions, they need the right tailoring to the complexity of urban
mobility.
The travel problem taxonomy and causal scheme we proposed combines both urban mobility complexity
and human-centered dimensions of the traveler experience. Using interview transcripts of lead users, the
model breaks down twenty-two travel problem categories, organized in six blocks.
This can be expressed as: Depending on his/her [1. condition], a traveler experiences [2. changes] in
his/her travel and [3. reacts] to it. These changes can be the result of some [4. state of the system] he/she
uses or some [5. situation] that is external to the system. When repeated, the changes, the reactions, the
situations, and the states of the system push the traveler to take [6. measures] with regards to his/her
next trip.
Practical contribution
To fulfil our pragmatic knowledge claim, we proposed a practical use of the theoretical contributions to
support travel problem diagnosis and to improve the accuracy of transportation modeling and simulation
regarding traveler profiles. The first ready-to-use contribution is a stimulus that can be handed to
travelers, in a focus group, to help them think of varied and rich problems. The second one is more of
an add-on that is plugged in transportation models to allow them to consider travel subjective attributes,
improving consequently their accuracy.
The two contributions target two different populations; engineering or innovation designers and
transportation researchers or engineers.
A stimulus for travel problem generation (TPGS)
When travelers are asked to talk about their problems about urban mobility, they usually point out the
technical problems around them (Read et al., 2017) or the behavior of other travelers (Fischer & Sullivan
Jr., 2002). However, they know a lot more than this. They indeed need a support to dig deeper in their
memory to tell how they feel and why they feel bad when a problem occurs.
To capture the knowledge of travelers about their travel problems, we designed a stimulus that uncovers
aspects of the traveler-experience they do not think of intuitively. After testing it with two groups of 6
PhD students, we used it with 6 transport experts and 6 non-experts groups of travelers. Results showed
that the stimulus allowed both of them generate varied and novel travel problems than the groups that
generate problems without any support. As a consequence, the stimulated groups help designers think
of urban mobility solutions that cover most of their travel problems.
An add-on to transportation modeling and simulation
The outputs of most transportation models and simulations do not reflect the subjective dimensions of
the trip they represent. Rather, they target variables that are directly projected on time, space, and cost
(Cascetta, 2009) (Ortuzar & Willumsen, 2011). They miss accuracy regarding variables that represent
the travelers. In the case of future transportation systems such as Automated Vehicles, the preferences
of travelers are unknown. Therefore, they need to be predicted using stated preference surveys for
example.
To fill this gap, we introduced traveler specific attributes which are socio-demographics, evaluation
scoring and private ride preference. We propose two ways of introducing these in transportation models.
By using the results of a stated preference survey, we have identified profiles of travelers who are most
likely to adopt an autonomous vehicle service (SAVS) in the future.
The first use of these profiles was in an agent-based simulation. In the scoring function, we added a
preference factor related to age and gender reflecting their influence on the willingness-to-use the SAVS.
The results of the simulation showed that the SAVS is used more outside peak hours than when no
traveler preference variation is considered.
General discussion
117
The second use of traveler profiles was in an optimization model. The survey showed that 40% of pro-
AVs travelers are willing to pay extra to have a private ride. In maximizing the total number of served
riders, the results always show several rides that are performed with one rider in vehicle. By matching
these rides with the travelers willing to pay extra, the operator could increase its incomes.
Methodological contribution
User/human-centered design research suggests that including the user/human in the design loops as early
as possible increases the likeliness of the designed solutions in meeting the wants and needs of their
users (Abras et al., 2004) (Boy, 2013, p.44). Transportation research community, in turn, emphasizes
the urge of integrating the travelers in designing transportation systems (OECD, 2014, p:16). However,
both communities do not fully exploit the potential of travelers in bringing valuable insight to the early
stages of the design process of urban mobility systems. We propose a triple integration of travelers-in-
the-loop;
Travelers as a provider of data
In transportation research, travelers are also used as a source of data. The most frequent way of doing
so is to consider travelers as points in space and time. This informs on the modes use, spatial density,
travel time, and all the related variables that can be extracted from spatio-temporal variables of travelers.
Moreover, travelers are also asked to evaluate their experience using different transport systems in the
form of satisfaction or preference surveys (Bradley & Kroes, 1992). These lack, however, asking for
detailed feedback about what travelers feel and suggest on the problems they face. Even when they do
so, the feedback is not exploited the way travelers are expecting.
We suggest that travelers can also help designers in setting the evaluation criteria under which an urban
mobility system can be evaluated. Therefore, travelers should have the opportunity to express
themselves about their problems and these should not be neglected. We showed (Chapter V) that even
in a stated preference (SP) survey, travelers can add new relevant criteria to evaluate a future mobility
system.
Travelers as a source of knowledge
Von Hippel (1986) emphasized early enough the importance of the users as creative consumers that can
bring ideas and enlighten designers about their hidden needs. However, the lead-user method is rather
focused on developing solutions for pre-defined problems and involves lead users in developing the
solution rather than defining the problem (Von Hippel, 1986).
In Chapter III, we interviewed 6 lead users who are urban mobility experts who assumed to tell more
about their travel problems than a regular traveler can. We used the insights on their traveler experience
to design a taxonomy of archetypal travel problems that served as a support for getting more from regular
travelers. This proved travelers can be a source of knowledge and not only a source of data in pre-defined
data-structures.
Travelers as stakeholders
Lindenau & Böhler-Baedeker (2014) suggest that it is important to consider travelers as a stakeholders
in identifying mobility problems, proposing, evaluating, and implementing solutions that go with a co-
constructed vision of the city. Dietz & Stern (2008) suggests that the lack of expertise of travelers may
sometimes alter the quality of the decisions that are made with them. However, in user-experience
research, this is not a barrier that should prevent a designer from getting the best from users (Sharon,
2012).
We propose a way of overcoming this issue by using the knowledge gained from lead travelers in guiding
regular travelers to stimulate their memory and tell more about their experience. This way, we involved
travelers not only by using what they say but also by giving them appropriate means to become an active
stakeholder whose lack of expertise is not a problem anymore.
General discussion
118
Research validation
The scientific quality of a research activity can be evaluated and validated regarding several criteria.
Ben Ahmed et al. (2010) identified twenty-six of them to evaluate a model, classified into four blocks;
(1) model ontology: the concepts and their formalism; (2) model functioning: the interaction of the
model with its users, and with normal and abnormal conditions; (3) model teleology, i.e. how far does
the model fulfill its users’ needs/goals; (4) model evolution: how far and well the model can evolve.
To fulfil each of the evaluation dimensions, appropriate protocols need to be set and executed. Moreover,
most of the research objects of this thesis are qualitative in nature, which makes them even harder to
validate (Noble & Smith, 2015). Therefore, what has been done in the time frame of this thesis only
covers some of the validation dimensions.
Evolving through the action research cyclic process, the validation of this thesis took three different
forms; case study, empirical, and industrial (Table 34). Each of the validation methods covered several
research objects. Covering the ontological dimension, the Traveler eXperience Conceptual Model
(TXCM) and the Travel Problem Taxonomy (TPT) were validated using one case study on a demand-
responsive transport service. To evaluate the functioning of the Travel Problem Generation Stimulus
(TPGS) and the Travel Subjective Attributes (TSA) respectively, we conducted a focus group
experiment and a model modification trial as empirical protocols. Each of them was respectively applied
on a bus shuttle service and a shared autonomous vehicle service. The teleological dimension
represented by the TXCM and the TSA was evaluated with the industrial partners of Anthropolis using
semi-opened interviews.
Table 34. Research validation methods of the thesis
Dimension Model ontology Model functioning Model teleology Model evolution
Research
object
- TXCM
- TPT
- TPGS
- TSA
- TXCM
- TSA
All research
objects
Validation
method Case study
- Experiment
- Case study
Interview with
chair’s partners Action research
Case studies
Case studies served both as an illustration and a validation method of the use of the research objects of
this thesis. Following the main research question of thesis and the last one, two case studies cover
respectively the diagnosis of an urban mobility system and the use of traveler specific attributes in
forecasting a future urban mobility system.
Diagnosing a demand-responsive transport service
The input material used in this case study was a list of eleven travel problems reported by the most
experienced bus driver in the service in the Paris area. By depicting these problems through the TXCM,
we concluded that:
• The more perspectives we have of travel problems the more readily we can improve the urban
mobility system.
• It is vital to have different stakeholders of an urban mobility system together to have a better
understanding of travel problems.
• There is a need for archetypes of travel problems in urban mobility systems diagnosis.
This last conclusion generated a research question that we answered through the grounded theory
building of a travel problem taxonomy and a causal scheme. We prove, using two of the eleven
problems, that by having a repository of travel problem archetypes we obtain a better understanding of
naturally formulated travel problems. Indeed, we can either clarify a complex-framed problem or enrich
a simple-framed one.
General discussion
119
Forecasting the demand on a shared autonomous vehicle service
We conducted an online survey with over 400 inhabitants of the greater Paris region. It served at
estimating their willingness-to-use of a shared autonomous vehicle service (SAVS). We used the results
of the survey to add subjective travel attributes to an optimization model and an agent-based simulation.
Regression trees allowed us to identify profiles of travelers that are most likely, and other ones that are
most unlikely to use the SAVS. Moreover, we were able to hierarchize the reasons behind each of the
two choices. Participants had also the possibility to freely identify other reasons apart from the ones
proposed to them. This allowed us to identify new important factors that were not expected, such as
environmental concern and freedom to drive.
Empirical studies
To prove the value of the research objects that arose from our understanding of the traveler experience
and travel problems, we conducted two empirical studies.
The experiment of problem generation stimulation
Relatively to the other validation forms, we chose to concentrate our efforts on evaluating the stimulus
supporting travel problem generation (TPGS) because it represents the “design support” as a research object to answer our first research question “How can traveler experience be modeled to feed travel problems diagnosis?”.
We designed an experiment with four groups, all using the same urban mobility system, a bus line in
this case, in the same route, every day. Two control groups are the baseline for non-stimulated problem
generation and two experimental groups are provided with the stimulus. The two sets of groups are
composed of one group of urban mobility experts and one group of non-experts. We adapted three
metrics from the literature on ideation outputs effectiveness to use them in evaluating the stimulus. We
compared the quantity, the variety and the novelty of the generated travel problems in each group.
Variety represented the number of dimensions of the traveler experience covering the generated
problems in each group. Novelty represented how new the additional generated problems in each
traveler experience dimension are regarding the other dimensions.
The groups that did not receive the stimulus represented the classical way participants in focus groups
are asked to generate problems. Results showed that these groups score less in variety and novelty of
problems than the stimulated groups.
The trial of model modification
Our representation of the traveler experience has been translated into travel subjective attributes as
relevant variables to forecast the behavior of a new urban mobility system (the SAVS). These encompass
in addition to socio-demographics, the motives of a person to adopt or not an autonomous vehicle
solution in the future.
Considering some socio-demographics (age, gender, income) correlations with AVs acceptance, among
the agents allowed us to uncover a higher demand in the simulation during off-peak hours. This reflected
an actual activity of some travelers who do not need to use transport modes during peak-hours. In the
optimization model, we introduced traveler preference regarding sharing or not sharing the ride with
other travelers. This allowed us to acknowledge a shortfall for SAVS operator in satisfying overall (ride-
sharing users) and specific needs (VIP users) of the users of its service.
Industrial studies
The potential users of the research objects of the thesis are professionals either in an industrial context
such as in the companies of the Anthropolis research chair or anyone who has an interest in knowing
more about how well urban mobility systems perform regarding the perception of travelers. For this
thesis we relied on two populations to evaluate some of its outputs. The first population is composed of
7 professionals working in the R&D, marketing, or innovation services of urban mobility companies
General discussion
120
that are partners of Anthropolis. The second population is a mix of design students and professionals
from a big French energy company (3 students and 3 professionals), in the context of a X-month
innovation project.
With urban mobility professionals
We interviewed representatives of the 5 industrial partners after introducing them to the different uses
that can be made over the research object of the thesis. We asked them to give free feedback on the
TXCM model and the causality network uses, then they reacted on how this could be applied to in their
future projects.
The positive feedback was:
• Propose a value for the users that is embedded in the reality of their problems (like Uber did for
taxi users).
• Allows to systematically identify travel problems and learn from existing solutions to avoid
repeating the same mistakes in next generations of solutions.
• Gives the possibility to zoom in and out to uncover more problems.
The negative feedback was:
• The traveler experience is so personalized that it could generate negative overall results when
deployed in the solutions (recommended to see the case of IDZen/Zap (SNCF, 2013)).
• The final objective of introducing a new dimension to some industrial context should be deeply
studied and discussed with the professionals.
The different interlocutors proposed some of the projects they work on or know about, on which the
model could be applied and tailored. Some of these projects were:
• Autonomous vehicle experimentation with groups of travelers.
• Satisfaction surveys with users of suburban trains.
• Sensorial comfort of travelers in tramway wagons.
• Carsharing mobile application for collaborators.
With energy professionals and students
On a different domain from mobility, we used the travel problem taxonomy as an inspiration to generate
more problems related to the indoor air quality of houses. The causal scheme of the taxonomy was
presented to participants of a focus group with some adaptations to the context of the study. For example,
beyond travel change was replaced by outdoor change. The participants were considered as lead users
because of their expertise on the topic. They were given two inputs; a list of six classes of problems and
the causal scheme. Each participant was asked to generate as much problems as he could, using his
knowledge on indoor air quality and the different problem categories of the taxonomy. Besides the fact
that the list of problems has multiplied by 4, the professionals of the participants expressed their interest
in the capacity of the causal scheme to account for the combination of the condition of the user and the
failure of the system to accomplish a function. This focus group exercise showed somehow that the
concept of travel problems as modeled can be also generalized to other contexts besides urban mobility.
Limitations and further research
Several limitations can be identified about this thesis on both the methodology and the research objects.
These limitations allowed us to think of future improvements and evolutions.
Measuring the performance of an urban mobility system
The performance of urban mobility systems can have different meanings in the literature. Indeed, each
research sets its own definition for “performance” depending on the research focus and purpose.
General discussion
121
Satisfaction as performance
We used a satisfaction scale when asking participants of the survey score each satisfaction criterion.
However, these criteria were too generic and not mature enough regarding the systems to be evaluated
and their relation to AVs. For instance, car drivers had an important criterion for not willing to use an
AVs which was the joy of driving. Our diagnosis of car driving as a mode of transport was not accurate
enough to put it among the criteria participants had to score. As action research is an open cyclic process,
taking into account the additional criteria participants proposed will allow a more accurate next version
of the survey.
A list or even a network of travel problems gives an overview of how an urban mobility system fails at
satisfying its users. However, the cost and time constraints professionals face in designing new mobility
solutions need a method to systematically prioritize these problems. Therefore, there is still a need for
the virtues of network theory such as betweenness and closeness centrality (Freeman, 1977) in setting
this hierarchization metrics for the causality network of travel problems, beyond the scores that travelers
can put for each problem as a node of the network.
Connections with techno-centered indicators
To make sense for transport operators and urban mobility professionals in general, the traveler
satisfaction criteria or travel problems metrics need to be connected with their daily practice. What we
defined in this thesis is the value the traveler is expecting from an urban mobility system. In the big
picture, both travelers and professionals expect value from an urban mobility system (Lindenau &
Böhler-Baedeker, 2014).
Although we tried to connect (in Chapter V) the technical-economic variables in optimization and agent-
based models to traveler-centered variables we still miss the meaning of this connection at the level of
the traveler experience. For example, we do not know for which traveler a time saving of 11% over a
trip of 10 minutes is of value. Therefore, there is a need for verification with travelers of what we assume
being a traveler-centered approach to transportation models.
Travel problem diagnosis
The proposed design support is used in focus group format of travel problem generation and attempts to
enrich transportation models with travel subjective attributes. We demonstrated the value of doing so.
However, the diagnosis of urban mobility systems that are used by millions of travelers that have
different expectations and perception of travel problems need even more systematic methods. Focus
groups work well with small samples to produce knowledge on travel problems but cannot produce
reports of diagnosis for large samples. Moreover, to profit from existing data of national transport
surveys that have dozens of thousands of participants, it is vital to create the right connections between
travel problems and the attributes used in these surveys.
Automation of travel problem identification and causation
The travel problem archetypes proposed in Chapter III are a first version of an ontology that can be
automatized with natural language processing. Indeed, the travel problems raw format is a text.
Therefore, there is a possibility for automatic semantic detection using the database of travel problems
that we linked to each travel problem archetype. With machine learning algorithms, it would be possible
to set the travel problem causation network for an urban mobility system using only what travelers write
on social media comments for example like in (Kanakaraj & Guddeti, 2015).
Using existing traveler data
For optimization and agent-based models, we proposed to use the existing variables and data such as
travel distance, cost, activity-chains, or socio-professional categories. We linked these to our travel
subjective attributes to gain more traveler-centered insights. However, we did not propose a way to
project these insights on the travel problem level. For example, we used correlation between age, gender,
and socio-professional categories to set a different behavior of agent in non-peak hours. This does not
General discussion
122
inform about travel problems at the scale of travelers. Travel problems can be set as categorical variables
and be linked to the existing variables (e.g. socio-demographics, modes of transport, operational
performance) through a correspondence analysis for example like in (Diana & Pronello, 2010).
Research evaluation with usability tests
The validation methods we used to evaluate the research objects accounted for scientific arguments.
However, in the industrial context, even if a model proves its scientific value, it is not systematically
valued among professionals who are meant to be the users of this model. One of the reasons behind this
mismatch is that design support material produced long-term effects and that the use of the support is
operated in an environment that has multiple uncontrolled variables (Blessing & Chakrabarti, 2009,
p.213).
The experiment we conducted in a focus group format proves the value of the stimulus under the set
conditions. This means that with different experimental conditions, more uncontrolled variables would
arise and modify the results. These experimental conditions are what should be identified from real
practice of professionals when they conduct focus groups. Moreover, it could be checked if focus group
activities are a common practice for the Anthropolis industrial partners and how important they are for
their travel problem diagnosis activities.
Even though we asked for feedback from urban mobility professionals among the industrial partners of
Anthropolis, the natural continuity of the cycles of the action-research methodology is to conduct
usability tests with professionals (Marcus et al., 2011). The research objects should be evaluated in real-
world conditions and profit from their users’ expertise. Indeed, a learning process should be established in diagnosing the practices of professionals and determining the gaps that our research object could fill.
Then, these should be adapted and tested with real industrial projects such as those identified in the
industrial research validation section.
An ongoing collaboration of Anthropolis is established with TUM CREATE, the joint research program
between Technische Universität München in Germany and Nanyang Technological University. They
are working on an autonomous shuttle in a multidisciplinary team. It is an adapted environment to test
the research objects of this thesis in future works of the chair and develop approaches to anticipating
AVs use like in (Nelson et al., 2013).
Summary for the Anthropolis research chair
We have directly contributed to 8 deliverables dealing with the state-of-the-art of human-centered urban
mobility, user research, and impact assessment. These are mainly related to its first axis (Figure 59) and
some of the third one.
All this thesis’ choices for observation, experimentation, and interviews sampling were made
accordingly to Anthropolis partners consensus.
The survey in Chapter V, is a joined work and contribution common to three PhD students of the
Anthropolis Chair, making sense to link engineering design, simulation and optimization issues.
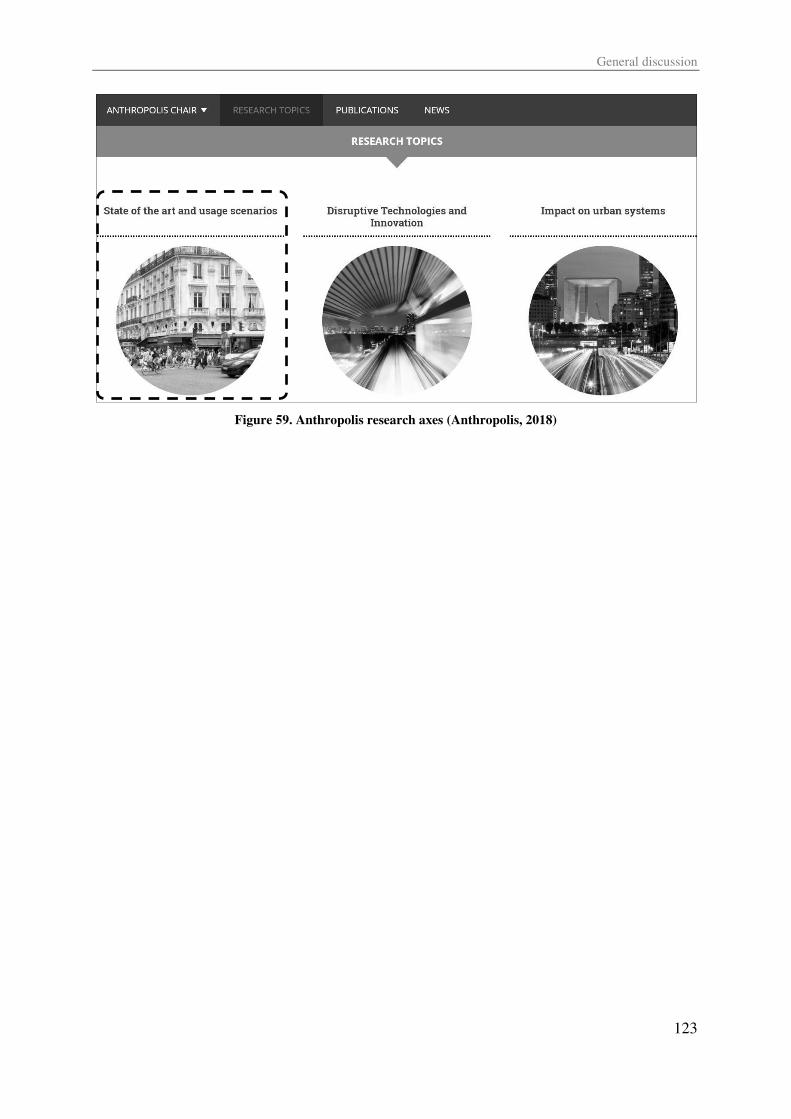
General discussion
123
Figure 59. Anthropolis research axes (Anthropolis, 2018)

References
124

References
125
References
References
References
126
Abenoza, R. F., Cats, O., & Susilo, Y. O. (2018). How does travel satisfaction sum up? An exploratory
analysis in decomposing the door-to-door experience for multimodal trips. Transportation, 1–28.
Abras, C., Maloney-Krichmar, D., & Preece, J. (2004). User-centered design. In William Sims
Bainbridge (Ed.), Berkshire Encyclopedia of Human-Computer Interaction (Vol. 37, pp. 445–456). Massachusetts: Berkshire Publishing Group LLC.
Accenture. (2011). Consumers in US and UK frusterated with intelligent devices that frequently crash.
ADA. (2012). Lift- or Ramp-Equipped Transit Buses.
Adair, J. G., Sharpe, D., & Huynh, C. L. (1990). The Placebo Control Group. The Journal of Experimental Education, 59(1), 67–86.
Al Maghraoui, O., Vallet, F., Puchinger, J., & Yannou, B. (2017a). Framing key concepts to design a
human centered urban mobility system. In International Conference on Engineering Design (Vol.
3, pp. 91–100). Vancouver, Canada.
Al Maghraoui, O., Vallet, F., Puchinger, J., & Yannou, B. (2017b). Modeling traveler experience for designing urban mobility systems. (Manuscript submitted for publication); Available at:
https://www.dropbox.com/s/ir4dj9abulw5qlz/Citation.pdf?dl=0.
Alatartseva, E., & Barysheva, G. (2015). Well-being: Subjective and Objective Aspects. Procedia - Social and Behavioral Sciences, 166, 36–42.
Alonso-Mora, J., Samaranayake, S., Wallar, A., Frazzoli, E., & Rus, D. (2017). On-demand high-
capacity ride-sharing via dynamic trip-vehicle assignment. Proceedings of the National Academy of Sciences, 201611675.
ALSTOM. (2018). Enhancing the passenger experience.
Anthropolis. (2018). Research topics (chaire-anthropolis.fr).
Arroyo-Cañada, F.-J., & Gil-Lafuente, J. (2017). Multidimensional Positioning of a Set of European
Smart Cities. In Sustainable Smart Cities: Innovation, Technology, and Knowledge management (pp. 49–63).
Atilola, O., Tomko, M., & Linsey, J. S. (2016). The effects of representation on idea generation and
design fixation: A study comparing sketches and function trees. Design Studies, 42, 110–136.
Atkinson, P., & Hammersley, M. (1994). Ethnography and Participant Observation. Handbook of Qualitative Research, 1(23), 248–261.
Auld, J., Sokolov, V., & Stephens, T. S. (2017). Analysis of the Effects of Connected–Automated
Vehicle Technologies on Travel Demand. Transportation Research Record: Journal of the Transportation Research Board, 2625(630), 1–8.
Auvinen, H., & Tuominen, A. (2014). Future transport systems: Long-term visions and socio-technical
transitions. European Transport Research Review, 6(3), 343–354.
Azevedo, C. L., Marczuk, K., Raveau, S., Soh, H., Adnan, M., Basak, K., … Ben-Akiva, M. (2016).
Microsimulation of Demand and Supply of Autonomous Mobility On Demand. Transportation Research Record: Journal of the Transportation Research Board, 2564(16–5455), 21–30.
Baltes, B. B., Dickson, M. W., Sherman, M. P., Bauer, C. C., & LaGanke, J. S. (2002). Computer-
mediated communication and group decision making: A meta-analysis. Organizational Behavior and Human Decision Processes, 87(1), 156–179.
Banister, D. (2008). The sustainable mobility paradigm. Transport Policy, 15(2), 73–80.
Bansal, P., Kockelman, K. M., & Singh, A. (2016). Assessing public opinions of and interest in new
vehicle technologies: An Austin perspective. Transportation Research Part C: Emerging Technologies, 67, 1–14.
Basadur, M. S., Graen, G. B., & Green, S. G. (1982). Training in creative problem solving in an
References
127
industrial research organization. Organizational Behavior and Human Performance, 30, 41–70.
Bassand, M., & Brulhardt, M.-C. (1981). La mobilité spatiale en tant que système. Journal of Economics and Statistics, (5).
Ben Ahmed, W., Mekhilef, M., Yannou, B., & Bigand, M. (2010). Evaluation framework for the design
of an engineering model. Artificial Intelligence for Engineering Design, Analysis and Manufacturing, 24(01), 107.
Benedyk, R., Woodcock, A., & Harder, A. (2009). The Hexagon-Spindle Model for educational
ergonomics. Work (Reading, Mass.), 32(3), 237–48.
Bertin, M., Bluntzer, J., Roger, M., Sagot, J., & Fabbro, L. Del. (2016). Integration of the well-being in
the early phases of the automotive design process : First approach and contribution of physiological measures. In INTERNATIONAL DESIGN CONFERENCE - DESIGN (pp. 1697–1706).
Dubrovnik.
Beul-Leusmann, S., Jakobs, E. M., & Ziefle, M. (2013). User-centered design of passenger information
systems. IEEE International Professional Communication Conference.
Bibri, S. E. (2018). The Rise of Sustainability, ICT, and Urbanization and the Materialization of Smart
Sustainable Cities. In Smart Sustainable Cities of the Future (The Urban, pp. 1–38). Springer
International Publishing.
Bisello, A., Vettorato, D., Stephenes, R., & Elisei, P. (2017). Smart and Sustainable Planning for Cities and Regions. Green Energy and Technology (Results of). Cham: Springer International Publishing.
Blessing, L. T. M., & Chakrabarti, A. (2009). DRM, a Design Research Methodology (Springer).
London.
Bocarejo S., J. P., & Oviedo H., D. R. (2012). Transport accessibility and social inequities: a tool for
identification of mobility needs and evaluation of transport investments. Journal of Transport Geography, 24, 142–154.
Boesch, P. M., Ciari, F., & Axhausen, K. W. (2016). Autonomous Vehicle Fleet Sizes Required to Serve
Different Levels of Demand. Journal of the Transportation Research Board, 2542, 111–119.
Boy, G. (2013). Orchestrating Human-Centered Design. Springer London.
Boy, G., & Narkevicius, J. (2014). Unifying Human Centered Design and Systems Engineering for
Human Systems Integration. Complex Systems Design & Management, 151–162.
Bradley, M. A., & Kroes, E. P. (1992). Forecasting issues in stated preference survey research. In
Selected readings in transport survey methodology: Edited proceedings of the 3rd International Conference on Survey Methods in Transportation (pp. 89–107). Washington, D.C.
Briggs, R. O., & Reinig, B. A. (2010). Bounded Ideation Theory. Journal of Management Information Systems, 27(1), 123–144.
Buur, J., & Matthews, B. (2008). Participatory innovation. International Journal of Innovation Management, 12(3), 255–273.
Caldwell, P. (2014). Autonomous cars: will drivers buy them?
Cascetta, E. (2009). Transportation systems analysis. (D. Ding-Zhu, Ed.), Transportation Research
(Vol. 10). Dallas: Springer Optimization and Its Applications.
Cash, P., Elias, E., Dekoninck, E., & Culley, S. (2012). Methodological insights from a rigorous small
scale design experiment. Design Studies, 33(2), 208–235.
Céret, E. ., Dupuy-Chessa, S. ., Calvary, G. ., Front, A. ., & Rieu, D. . (2013). A taxonomy of design
methods process models. Information and Software Technology, 55(5), 795–821.
Chamaki, F. (2010). NSW City Rail Mental Model.
References
128
Charmaz, K. (2014). Constructing grounded theory. Sage.
Chiesura, A. (2004). The role of urban parks for the sustainable city. Landscape and Urban Planning.
Chronos, & Attoma. (2009). Nouvelles Mobilités - Des mobilités libres, durables et responsables: un discours, des outils.
CityRepair. (2016). The City Repair Project.
Civitas. (2011). Involving Stakeholders : Toolkit on Organising Successful Consultations.
Clark-Carter, D. (1997). Doing quantitative psychological research: from design to report (Psychology). UK: Taylor & Francis.
Colleoni, M. (2016). A Social Science Approach to the Study of Mobility: An Introduction.
Understanding Mobilities for Designing Contemporary Cities, 23–33.
Cortright, J. (2017). What price for autonomous vehicles?
Coughlin, J. (2001). Transportation and older persons : Perceptions and Preferences. Washington DC.
Coyne, I. (1997). Sampling in qualitative research. Purposeful and theoretical sampling; merging or
clear boundaries? Journal of Advanced Nursing, 26(3), 623–630.
Creswell, J. (2009). Research Design: Qualitative, Quantitative and Mixed Methods Approaches.
Journal of Chemical Information and Modeling, 53(9), 1689–1699.
Cross, N. (1999). Natural intelligence in design. Design Studies, 20(1), 25–39.
Cunningham, L., Young, C., & Lee, M. (2000). Methodological Triangulation in Measuring Public
Transportation Service Quality. Transportation Journal, 40(1), 35–47.
D’Souza, D. F., & Wills, A. C. (1999). Objects, components, and frameworks with UML : the catalysis approach. Addison-Wesley.
Dean, D. L., Hender, J. M., Rodgers, T. L., & Santanen, E. L. (2006). Identifying Quality, Novel, and
Creative Ideas: Constructs and Scales for Idea Evaluation. Journal of the Association for Information Systems, 7(10), 646–698.
Debnath, A., Chin, H., Haque, M. M., & Yuen, B. (2014). A methodological framework for benchmarking smart transport cities. Cities (Vol. 37).
DeLaurentis, D. (2005). Understanding transportation as a system-of-systems design problem. 43rd AIAA Aerospace Sciences Meeting and Exhibit, (January), 1–14.
Delbosc, A., & Currie, G. (2011). Transport problems that matter - social and psychological links to
transport disadvantage. Journal of Transport Geography, 19(1), 170–178.
Denis, Y., & Janin, J.-F. (2010). ACTIF – the Framework Architecture for ITS in France for making it
closer to user expectations. ITS WORLD CONGRESS Busan.
Desmet, P. M. A. (2012). Faces of product pleasure: 25 positive emotions in human-product interactions.
International Journal of Design, 6(2), 1–29.
Diana, M., & Daraio, C. (2010). Performance Indicators for Urban Public Transport Systems With a
Focus on Transport Policy Effectiveness Issues. 12th WC, 1–25.
Diana, M., & Pronello, C. (2010). Traveler segmentation strategy with nominal variables through
correspondence analysis. Transport Policy, 17(3), 183–190.
Diener, E. (2000). Subjective well-being. The science of happiness and a proposal for a national index.
The American Psychologist, 55(1), 34–43.
Dietz, T., & Stern, P. C. (2008). Public Participation in Environmental Assessment and Decision Making. Washington DC: The National Academies Press.
Dorst, K. (2011). The core of “design thinking” and its application. Design Studies, 32(6), 521–532.
References
129
Drift. (2016). How Uber gets Customer Feddback.
Eastman, C., Mccracken, M., Newstetter, W., & Cross, N. (2001). Design Cognition: Results From
Protocol And Other Empirical Studies Of Design Activity. In Design knowing and learning: cognition in design education (pp. 79–103). Oxford.
Edwards, T., & Smith, S. (2008). Transport Problems Facing Large Cities. NSW Parliamentary Library Briefing Paper, (6).
Elkington, J. (1998). Partnerships from cannibals with forks: The triple bottom line of 21st-century
business. Environmental Quality Management.
ENGIE. (2018). Public Transport.
Ettema, D. F., Abenoza, R. F., & Susilo, Y. O. (2016). Satisfaction with intermodal trips in Stockholm:
How do service attributes influence satisfaction with the main mode and with the journey as a
whole? Transportation Research Board 95th Annual Meeting. No. 16-2247, 46(January), 1–16.
European Commission. (2017). Commission awards Paris as most innovative European city in 2017.
Lisbon: European Commission.
Faems, D., Van Looy, B., & Debackere, K. (2005). Interorganizational collaboration and innovation:
Toward a portfolio approach. Journal of Product Innovation Management, 22(3), 238–250.
Fischer, G., & Sullivan Jr., J. F. (2002). Human-centered public transportation systems for persons with
cognitive disabilities: Challenges and insights for participatory design. Participatory Design Conference (PDC’02), 194–198.
Fortney, J. C., Booth, B. M., Blow, F. C., Bunn, J. Y., & Loveland Cook, C. A. (1995). The effects of
travel barriers and age on the utilization of alcoholism treatment aftercare. American Journal of Drug and Alcohol Abuse, 21(3), 391–406.
Fraedrich, E., & Lenz, B. (2014). Automated Driving - Individual and Societal Aspects entering the
debate. In 93rd Annual Meeting of the Transportation Research Board. Washington, D.C.
Freeman, L. C. (1977). A Set of Measures of Centrality Based on Betweenness. Sociometry, 40(1), 35–41.
Fridman, N., & Kaminka, G. a. (2010). Modeling pedestrian crowd behavior based on a cognitive model
of social comparison theory. Computational and Mathematical Organization Theory, 16(4), 348–372.
Gaber, S. L., & Gaber, J. (1999). QUALITATIVE ASSESSMENT OF TRANSIT NEEDS: THE
NEBRASKA CASE. JOURNAL OF URBAN PLANNING AND DEVELOPMENT, 125(2), 59–67.
Gallotti, R., & Barthelemy, M. (2014). Anatomy and efficiency of urban multimodal mobility. Scientific Reports, 4, 6911.
Gao, S. (2015). Spatio-Temporal Analytics for Exploring Human Mobility Patterns and Urban
Dynamics in the Mobile Age. Spatial Cognition & Computation, 15(2), 86–114.
Gasson, S. (2003). Human-Centered Vs. User-Centered approaches to information system design.
JITTA: Journal of Information Technology Theory and Application, 5(2), 29–46.
Gatersleben, B., & Uzzell, D. (2003). Local transport problems and possible solutions: Comparing
perceptions of residents, elected members, officers and organisations. Local Environment, 8(4),
387–405.
Giffinger, R. (2007). Smart cities Ranking of European medium-sized cities. smart-cities.eu. Vienna.
Glass, G. V. (1976). Primary, Secondary, and Meta-Analysis of Research. Educational Researcher,
5(10), 3–8.
Glatzer, W. (2015). Global Handbook of Quality of Life: Exploration of Well-Being of Nations and
Continents. In W. Glatzer, L. Camfield, V. Møller, & M. Rojas (Eds.) (pp. 855–868). Dordrecht:
References
130
Springer Netherlands.
Gonzalez, M. C., Hidalgo, C. A., & Barabasi, A.-L. (2008a). Understanding individual human mobility
patterns. Nature, 453(7196), 779–782.
Gonzalez, M. C., Hidalgo, C. A., & Barabasi, A.-L. (2008b). Understanding individual human mobility
patterns. Nature, 453(7196), 779–782.
Gorman, M. (2005). The Essential and the Accidental. Ratio, 18(3), 276–289.
Green, P. A. (2012). Human Factors and Ergonomics in Motor Vehicle Transportation. In Handbook of Human Factors and Ergonomics (pp. 1596–1614). John Wiley & Sons, Inc.
Grosvenor, T. (2000). Qualitative Research in the Transport Sector. TRB Transportation Research Circular E-C008, 1–20.
Guillen-Royo, M. (2016). Sustainability and Well-Being: Human-scale development in practice.
Development (Routledge, Vol. 2004). Oslo: earthscan.
Gustafson, P. (2014). Business Travel from the Traveller’s Perspective: Stress, Stimulation and Normalization. Mobilities, 9(1), 63–83.
Haboucha, C. J., Ishaq, R., & Shiftan, Y. (2017). User preferences regarding autonomous vehicles.
Transportation Research Part C: Emerging Technologies, 78, 37–49.
Hanington, B. (2003). Methods in the Making: A Perspective on the State of Human Research in Design.
Design Issues.
Harris, A., & Tapsas, D. (2006). Transport and Mobility: Challenges, innovations and improvements.
Hasan, S., Schneider, C. M., Ukkusuri, S. V., & González, M. C. (2013). Spatiotemporal Patterns of
Urban Human Mobility. Journal of Statistical Physics, 151(1–2), 304–318.
Hassenzahl, M., & Tractinsky, N. (2006). User experience - a research agenda. Behaviour & Information Technology, 25(2), 91–97.
Heilig, M., Hilgert, T., Mallig, N., Kagerbauer, M., & Vortisch, P. (2017). Potentials of Autonomous
Vehicles in a Changing Private Transportation System - A Case Study in the Stuttgart Region.
Transportation Research Procedia, 26(2016), 13–21.
Hennink, M. M., Kaiser, B. N., & Marconi, V. C. (2017). Code Saturation Versus Meaning Saturation:
How Many Interviews Are Enough? Qualitative Health Research, 27(4), 591–608.
Hernandez, N. V., Shah, J. J., & Smith, S. M. (2010). Understanding design ideation mechanisms
through multilevel aligned empirical studies. Design Studies, 31(4), 382–410.
Hjorthol, R. (2013). Transport resources, mobility and unmet transport needs in old age. Ageing and Society, 33(7), 1190–1211.
Hohenberger, C., Spörrle, M., & Welpe, I. M. (2016). How and why do men and women differ in their
willingness to use automated cars? The influence of emotions across different age groups.
Transportation Research Part A: Policy and Practice, 94, 374–385.
Hook, W., Hughes, C., & Mason, J. (2014). Evaluating country performance in meeting the transit needs
of urban populations. Best Practice in National Support for Urban Transportation, 1, 2–16.
Hörl, S. (2017). Agent-based simulation of autonomous taxi services with dynamic demand responses.
Procedia Computer Science, 109(June), 899–904.
Hörold, S., Mayas, C., & Krömker, H. (2012). Identifying the information needs of users in public
transport. Advances in Human Aspects of Road and Rail Transportation, (April 2016), 331–340.
Hörold, S., Mayas, C., & Krömker, H. (2013). User-oriented information systems in public transport.
Contemporary Ergonomics and Human Factors 2013, 160–167.
Horton, D., Rosen, P., & Cox, P. (2007). Cycling and society. Cycling and Society. ASHGATE.
References
131
Howard, D., & Dai, D. (2014). Public Perceptions of Self-driving Cars: The Case of Berkeley,
California. In 93rd Annual Meeting of the Transportation Research Board.
Hüging, H., Glensor, K., & Lah, O. (2014). Need for a Holistic Assessment of Urban Mobility Measures
– Review of Existing Methods and Design of a Simplified Approach. Transportation Research Procedia, 4, 3–13.
HVSL. (2017). What makes us angry drivers.
IEA, & OECD. (2015). Key World Energy Statistics. Statistics, 82.
INSEE. (2018). Dossier complet Ile-de-France. Paris.
International Organization for Standardization. (2010). ISO 9241-210: Ergonomics of human–system
interaction - Human-centred design for interactive systems. International Organization for Standardization.
IOG. (2013). Defining Governance.
ITF. (2017). ITF Transport Outlook 2017. OECD.
Jansson, D. G., & Smith, S. M. (1991). Design fixation. Design Studies, 12(1), 3–11.
Jensen, O. B. (2013). Staging Mobilities (1st ed.). Abington, Oxon: Routledge.
Jensen, O. B., & Lassen, C. (2011). Mobility Challenges. Danish Journal of Geoinformatics and Land Management, 46(1), 9–21.
Jesty, P. H., & Bossom, R. A. P. (2011). Using the FRAME Architecture for planning integrated
Intelligent Transport Systems. 2011 IEEE Forum on Integrated and Sustainable Transportation Systems, FISTS 2011, (224383), 370–375.
Jiao, W., Yang, C., & He, S. (2012). Improved SP-off-RP Survey Method and Its Application to Mode
Choice Model. In CICTP 2012 (pp. 317–328). Reston, VA: American Society of Civil Engineers.
Joewono, T. B., & Kubota, H. (2007). User satisfaction with paratransit in competition with motorization
in indonesia: Anticipation of future implications. Transportation, 34(3), 337–354.
Johnson, M. W., Christensen, C. M., & Kagermann, H. (2008). Reinventing your business model.
Harvard Business Review.
Jokinen, J. P. P. (2015). Emotional user experience: Traits, events, and states. International Journal of Human Computer Studies, 76.
Jones, P. (2014). The evolution of urban mobility: The interplay of academic and policy perspectives.
IATSS Research, 38(1), 7–13.
Jonson, B. (2005). Design ideation: The conceptual sketch in the digital age. Design Studies, 26(6), 613–624.
Josset, J.-M. (2016). Une approche comportementale de la congestion urbaine Illustration par plusieurs expériences de terrain sur les pratiques de mobilité durable. Paris Saclay.
Kakihara, M., & Sørensen, C. (2001). Expanding the “mobility” concept. ACM SIGGROUP Bulletin,
22(3), 33–37.
Kamel, J., & Vosooghi, R. (2018). Synthetic Population Generator for France.
Kanakaraj, M., & Guddeti, R. M. R. (2015). NLP based sentiment analysis on Twitter data using
ensemble classifiers. In 2015 3rd International Conference on Signal Processing, Communication and Networking (ICSCN) (pp. 1–5). IEEE.
Karacaoglu, S., Yolal, M., & Gursoy, D. (2015). Examining the Perceptions of Mobility-Impaired
Travelers: an Analysis of Service Expectations, Evaluations, and Travel Barriers. Tourism Review International, 19(1), 19–30.
References
132
Katzev, R. (2003). Car Sharing: A New Approach to Urban Transportation Problems. Analyses of Social Issues and Public Policy, 3(1), 65–86.
Kaufmann, V. (2011). Les paradoxes de la mobilité - Bouger, s’enraciner. (L. savoir Suisse, Ed.) (2nd
ed.). Lausanne: PPUR.
Kaufmann, V., Bergman, M. M., & Joye, D. (2004). Motility: mobility as capital. International Journal of Urban and Regional Research, 28(4), 745–756.
Kayal, M. P., Singh, R., & Kumar, M. M. (2014). Defining Sustainable Urban Mobility.
Kellerman, A. (2012). Potential Mobilities. Mobilities, 7(1), 171–183.
Kempf, P. (2009). You are the City: Observation, Organization, and Transformation of Urban Settings.
Lars Müller Publishers.
Kerschner, H., & Aizenberg, R. (2004). Focus group participants reflect on transportation. In 27th Proceedings of Transportation in an Aging Society (Vol. 27, pp. 293–301). TRB.
Kim, K.-G. (2018). Evolution of Climate Resilience and Low-Carbon Smart City Planning: A Process.
In Low-Carbon Smart Cities (The Urban, pp. 1–76). Springer International Publishing.
Kim, K. S., & Gallent, N. (1998). Transport issues and policies in seoul: An exploration. Transport Reviews, 18(1), 83–99.
Kim, W. C., & Mauborgne, R. (2004). Blue ocean strategy. Harvard Business Review, 69–80.
Kitchin, R. (2013). The Real Time City. ‘Smart Urbanism: Utopian Vision or False Dawn’ Workshop at the University of Durham, 20-21 June 2013., (June 2013), 20.
Knight, T., Dixon, J., Warrener, M., & Webster, S. (2007). Understanding the travel needs , behaviour and aspirations of people in later life.
KPMG. (2013). Self-Driving Cars : Are we ready?
Kremer, S., Krahl, T., & Lindemann, U. (2017). User Experience Journeys. In 21st International Conference on Engineering Design (ICED17) (Vol. 4, pp. 483–492). Vancouver, Canada,.
Krueger, R., Rashidi, T. H., & Rose, J. M. (2016). Preferences for shared autonomous vehicles.
Transportation Research Part C: Emerging Technologies, 69, 343–355.
Kümmel, M., Busch, F., & Wang, D. Z. W. (2017). Framework for automated taxi operation: The family
model. Transportation Research Procedia, 22(2016), 529–540.
Kvale, S., & Brinkmann, S. (2009). Epistemological Issues of Interviewing. InterViews: Learning the Craft of Qualitative Research Interviewing.
Kyriakidis, M., Happee, R., & de Winter, J. C. F. (2015). Public opinion on automated driving: Results
of an international questionnaire among 5000 respondents. Transportation Research Part F: Traffic Psychology and Behaviour, 32, 127–140.
Lancée, S., Veenhoven, R., & Burger, M. (2017). Mood during commute in the Netherlands: What way
of travel feels best for what kind of people? Transportation Research Part A: Policy and Practice,
104, 195–208.
Law, E. L.-C., Roto, V., Hassenzahl, M., Vermeeren, A. P. O. S., & Kort, J. (2009). Understanding,
scoping and defining user experience. Proceedings of the 27th International Conference on Human Factors in Computing Systems - CHI 09, 719.
Lawson, B. (2005). How Designers Think: The Design Process Demystified (4th ed.). UK: Architectural
Press is an imprint of Elsevier.
Le Monde. (2014). Métro, circulation : les chiffres qui confirment que Paris est en vacances.
Le Vine, S., Zolfaghari, A., & Polak, J. (2015). Autonomous cars: The tension between occupant
experience and intersection capacity. Transportation Research Part C: Emerging Technologies,
References
133
52, 1–14.
Lehr, T. (2018). Smart Cities: Vision on-the-Ground. In Smart Cities (pp. 3–15). Cham: Springer
International Publishing.
Levin, M. W., Li, T., Boyles, S. D., & Kockelman, K. M. (2016). A general framework for modeling
shared autonomous vehicles with dynamic network-loading and dynamic ride-sharing application.
95th Annual Meeting of the Transportation Research Board, 64(January), 1–23.
Likins, J. M. (1986). Developing the Commuter Perspective. NASPA Journal, 24(1), 11–16.
Linden, M. A., Kamper, D. G., Reger, S. I., & Adams, T. C. (1996). Transportation needs - Survey of
individuals with disabilities. In RESNA 96’ - Exploring new Horizons... Pioneering the 21st Century (pp. 66–68). Salt Lake City - Utah.
Lindenau, M., & Böhler-Baedeker, S. (2014). Citizen and Stakeholder Involvement: A Precondition for
Sustainable Urban Mobility. Transportation Research Procedia, 4, 347–360.
Linsey, J. S., Clauss, E. F., Kurtoglu, T., Murphy, J. T., Wood, K. L., & Markman, A. B. (2011). An
Experimental Study of Group Idea Generation Techniques: Understanding the Roles of Idea
Representation and Viewing Methods. Journal of Mechanical Design, 133(3), 031008.
Liu, G., Krishnamurthy, S., & van Wesemael, P. (2018). Conceptualizing cycling experience in urban
design research: a systematic literature review. Applied Mobilities, 00(00), 1–17.
Loftland, J., & Loftland, L. H. (1984). Analyzing social settings: A Guide to Qualitative Observation and Analysis (2nd ed.). Wadsworth Publishing Company.
Lopatnikov, D. (2017). Smart Urban Mobility from Expert Stakeholders’ Narratives. In E. Alba, F. Chicano, & G. Luque (Eds.), Second International Conference, Smart-CT 2017 (Vol. 10268, pp.
137–143). Cham: Springer International Publishing.
Lucas, K. (2013). Qualitative methods in transport research : the ‘ action research ’ approach. In Transport Survey Methods: Best Practice for decision making. Emerald.
Lyft. (2018). Lyft Pass.
Maier, J. R. A., Fadel, G. M., & Battisto, D. G. (2009). An affordance-based approach to architectural
theory, design, and practice. Design Studies, 30(4), 393–414.
Mairie de Paris. (2018). reinventer.paris: The subterranean secrets of Paris.
Marco, D. (2015). A comprehensive set of quality and accessibility indicators for transport services.
METPEX, 5.2, 10.
Marcus, A., Kim, S. W., Jo, H. K., & Ha, D. Y. (2011). Design, user experience and usability: theory, methods, tools and practice. Lecture Notes in Computer Science.
Martinez, L. M., & Viegas, J. M. (2017). Assessing the impacts of deploying a shared self-driving urban
mobility system: An agent-based model applied to the city of Lisbon, Portugal. International Journal of Transportation Science and Technology, 6(1), 13–27.
Maslow, A. H. (1943). A Theory of Human Motivation. Psychological Review, 50(4), 370–396.
Max-Neef, M. A., Elizalde, A., & Hopenhayn, M. (1989). Development and Human Needs. In Human scale development: conception, application and further reflections (p. 18). New York.
Mcdermott, R. (1978). Mass Transit Issues Perspective from a Marketing. Transportation Journal, 18(1), 28–35.
Michon, J. A. (1985). A Critical View of Driver Behavior Models: What Do We Know, What Should
We Do? In L. Evans & R. C. Schwing (Eds.), Human Behavior and Traffic Safety (pp. 485–524).
Boston, MA: Springer US.
Miller, T. E. (1986). Commuter Issues at Small Institutions. NASPA Journal, 1(24), 43–47.
References
134
Mitchell, D., Claris, S., & Edge, D. (2016). Human-Centered Mobility: A New Approach to Designing
and Improving Our Urban Transport Infrastructure. Engineering, 2(1), 33–36.
Mondschein, a., Blumenberg, E., & Taylor, B. (2010). Accessibility and Cognition: The Effect of
Transport Mode on Spatial Knowledge. Urban Studies, 47(4), 845–866.
Morgan, D. (1997). The focus group guidebook (Vol. 1). Sage publications.
Morin, E. (2014). Complex Thinking for a Complex World - About Reductionism, Disjunction and
Systemism. Systema, 2(1), 14–22.
Morse, J. M. (1995). The Significance of Saturation. Qualitative Health Research, 5(2), 147–149.
Mourad, A., Puchinger, J., & Chu, C. (2018). Owning or sharing autonomous vehicles : comparing
different ownership and usage scenarios. Manuscript Submitted for Publication, 1–13.
Musselwhite, C., & Haddad, H. (2008). A grounded theory exploration into the driving and travel needs
of older people. UTSG, 1–12.
Neff, J., & Pham, L. (2007). A Profile of Public Transport Passenger Demographics and Travel
Characteristics Reported in On-Board Survey. American Public Transportation Association,
(May).
Nelson, J., Buisine, S., & Améziane, A. (2013). Assisting Designers in the Anticipation of Future
Product Use. AIJSTPME, 2(3), 25–39.
Nemeth, C. (2004). Human Factors Methods for Design - Making systems Human centered.
Nickpour, F., & Jordan, P. (2012). Accessibility in public transport A psychosocial approach. In
Advances in Human Aspects of Road and Rail Transportation (pp. 341–350). CRC Press.
Nielsen, L. (2014). Personas.
Noble, H., & Smith, J. (2015). Issues of validity and reliability in qualitative research. Evidence Based Nursing, 18(2), 34–35.
Norman, D. A., Stappers, P. J., Donald, C. A., & Norman, A. (2016). DesignX: Complex Sociotechnical
Systems, 83–106.
Nunes, A. A., Galvão Dias, T., Zegras, C., & Falcão e Cunha, J. (2016). Temporary user-centred
networks for transport systems. Transportation Research Part C: Emerging Technologies, 62, 55–69.
OECD. (2014). Transport for a changing World. International Transport Forum Annual Summit.
Olayinka, P. K. (2016). Travel Disadvantage in Selected Rural Border Communities of Oyo State,
Nigeria. Academic Journal of Interdisciplinary Studies, 5(2), 123–130.
OMNIL. (2012). Enquête globale transport - La mobilité en Île-de-France. Paris.
Ortíz Nicolás, J. C., & Aurisicchio, M. (2011). A Scenario of User Experience. Proceedings of the 20th International Conference on Engineering Design (ICED 11), (August), 1–12.
Ortuzar, J. de D., & Willumsen, L. G. (2011). Modelling Transport. Modelling Transport.
Osterwalder, A., Pigneur, Y., Bernarda, G., & Smith, A. (2014). Value Proposition Design. Wiley (Vol.
1). New Jersey.
Ottens, M., Franssen, M., Kroes, P., & Van de Poel, I. (2006). Modelling infrastructures as socio-
technical systems. Int. J. Critical Infrastructures, 2(2), 133–145.
Pahl, G., Beitz, W., Feldhusen, J., & Grote, K.-H. (2007). Product development process. In K. Wallace
& L. Blessing (Eds.), Engineering Design - A systamtic Approach (3rd ed.). Springer Berlin
Heidelberg.
Parker, J. M. (2010). Applying a System of Systems Approach for Improved Transportation.
References
135
S.a.P.I.En.S, 3(3.2).
Patton, M. . (2005). Qualitative Research. Encyclopedia of Statistics in Behavioral Science, 3, 1633–1636.
Payre, W. (2015). Conduite complètement automatisée : acceptabilité , confiance et apprentissage de la reprise de contrôle manuel.
Peeters, J., Verhaegen, P., Vandevenne, D., & Duflou, J. R. (2010). Refined Metrics for Measuring
Novelty in Ideation. Proceedings of IDMME - Virtual Concept 2010, (January), 1–4.
Pimenta, V., Quilliot, A., Toussaint, H., & Vigo, D. (2017). Models and algorithms for reliability-
oriented Dial-a-Ride with autonomous electric vehicles. European Journal of Operational Research, 257(2), 601–613.
Pontis, S. (2013). An Ethnographic Information Design Approach.
Porter, G. (2010). Transport planning in sub-Saharan Africa III : The challenges of meeting children and young people’s mobility. Progress in Development Studies, 2(October 2007), 169–180.
Power J.D. (2012). Vehicle Owners Show Willingness to Spend on Automotive Infotainment Features.
Westlake Village.
Preston, J. (2012). Integration for Seamless Transport. Oecd / Itf, ITF Discus, 34.
Priester, R., Miramontes, M., & Wulfhorst, G. (2014). A generic code of urban mobility : how can cities drive future sustainable development ? Transportation Research Procedia, 4(89), 90–102.
Primerano, F., Taylor, M. A. P., Pitaksringkarn, L., & Tisato, P. (2008). Defining and understanding trip
chaining behaviour. Transportation, 35(1), 55–72.
Pronello, C., & Camusso, C. (2017). Users’ needs and business models for a sustainable mobility information network in the Alpine Space. Transportation Research Procedia, 25(November),
3594–3609.
Pucci, P. (2016). Mobility Practices as a Knowledge and Design Tool for Urban Policy. In P. Pucci &
M. Colleoni (Eds.), Understanding Mobilities for Designing Contemporary Cities (pp. 3–21).
Cham: Springer International Publishing.
Punpuing, S., & Ross, H. (2001). Commuting: The human side of Bangkok’s transport problems. Cities,
18(1), 43–50.
RATP. (2018). Pour l’excellence au service des voyageurs. Raymundo, H., & Reis, J. G. M. (2017). Passenger Transport Drawbacks: An Analysis of Its
“Disutilities” Applying the AHP Approach in a Case Study in Tokyo, Japan. In Advances in Production Management Systems. The Path to Intelligent, Collaborative and Sustainable Manufacturing (Vol. 514, pp. 545–552).
Read, G. J. M., Beanland, V., Lenne, M. G., Stanton, N. A., & Salmon, P. M. (2017). Integrating Human Factors Methods and Systems Thingking for Transport Analysis and Design. Loughborough
University: CRC Press.
Reich, Y. (1995). Measuring the value of knowledge. International Journal of Human-Computer Studies, 42(1), 3–30.
Reinig, B., Briggs, R., & Nunamaker, J. (2007). On the Measurement of Ideation Quality. Journal of Management Information Systems, 23(4), 143–161.
RENAULT. (2018). Renault EZ-ULTIMO: A robo-vehicle for a premium mobility service experience.
Rosenbloom, S. (2009). Meeting Transportation Needs in an Aging-Friendly Community.
GENERATIONS – Journal of the American Society on Aging, 33(2), 33–43.
Rosenbloom, S., Srinivasan, S., Li, H., Gossen, R., Dau, M. T., Krizek, K. J., … McGuckin, N. (2004).
References
136
Understanding Travel Issues. In Research on Women’s Issues in Transportation (Vol. 2, pp. 3–58).
Sammer, G., Uhlmann, T., Unbehaun, W., Millonig, A., Mandl, B., Dangschat, J., & Mayr, R. (2012).
Identification of Mobility-Impaired Persons and Analysis of Their Travel Behavior and Needs.
Transportation Research Record: Journal of the Transportation Research Board, 2320(2320), 46–54.
Sanders, E. (2002). From user-centered to participatory design approaches. In J. Frascara (Ed.), Design and the Social Sciences Making connections (pp. 1–8). London: Taylor & Francis.
Sanders, E., & Stappers, P. J. (2008). Co-creation and the new landscapes of design. CoDesign, 4(1), 5–18.
Sanoff, H. (2016). Visual research methods in design. New York: Routledge.
Santana, F. E., Cardoso, C. C., Ferreira, M. G. G., Catapan, M. F., Montanha, I. R., & Forcellini, F. A.
(2018). Towards a more inclusive service development process for the wider population. Design Studies, 55, 146–173.
Santanen, E. L., Briggs, R. O., & Vreede, G.-J. DE. (2004). Causal Relationships in Creative Problem
Solving: Comparing Facilitation Interventions for Ideation. Journal of Management Information Systems, 20(4), 167–198.
Saunders, B., Sim, J., Kingstone, T., Baker, S., Waterfield, J., Bartlam, B., … Jinks, C. (2018). Saturation in qualitative research: exploring its conceptualization and operationalization. Quality and Quantity, 52(4), 1893–1907.
Schachter, H. L., & Liu, R. (2005). Policy development and new immigrant communities: A case study
of citizen input in defining transit problems. Public Administration Review, 65(5), 614–621.
Schoettle, B., & Sivak, M. (2014). A survey of public opinion about autonomous and self-driving vehicles in the U.S., the U.K., and Australia. Michigan.
Schwanen, T. (2013). Sociotechnical transition in the transport system. In Moving Towards Low Carbon Mobility (pp. 231–254).
Sdoukopoulos, E., Kose, P., Gal-Tzur, A., Mezghani, M., Boile, M., Sheety, E., & Mitropoulos, L.
(2016). Assessment of Urban Mobility Needs, Gaps and Priorities in Mediterranean Partner
Countries. Transportation Research Procedia, 14, 1211–1220.
Shah, J. (2003). Metrics for measuring ideation effectiveness. Design Studies, 24(2), 111–134.
Shah, J., Kulkarni, S., & Vargas-Hernandez, N. (2000). Evaluation of Idea Generation Methods for
Conceptual Design: Effectiveness Metrics and Design of Experiments. Journal of Mechanical Design.
Sharon, T. (2012). It’s Our Research - Getting Stakeholder buy-in for user-experience research projects.
It’s Our Research. Elsevier.
Simmons, E. (2005). The usage model a structure for richly describing product usage during design and
development. IEEE Xplore.
Simon, A. H. (1960). The new science of management decision. (Harper and Row, Ed.). New York, NY.
SNCF. (2013). IDZen & IDZap.
SNCF. (2018). Pour une mobilité durable.
Solomon, R. L. (1949). An extension of control group design. Psychological Bulletin, 46(2), 137–150.
Sopjani, L., Stier, J. J., & Ritzén, S. (2016). User involvement in disruptive innovation – A study on
users of a light electric vehicle sharing system. Proceedings of the 23rd Innovation and Product Development Management Conference. Glasgow, UK, (July 2017).
References
137
Spickermann, A., Grienitz, V., & von der Gracht, H. a. (2013). Heading towards a multimodal city of
the future?. Multi-stakeholder scenarios for urban mobility. Technological Forecasting and Social Change, 89, 201–221.
Spyridakis, J., Goble, B., Garner, M., Haselkorn, M., & Barfield, W. (1991). Designing and
implementing a PC-based, graphical, interactive, real-time advanced traveler information system
that meets commuter needs. In Vehicle Navigation and Information Systems Conference (pp.
1045–1048).
Stead, D. (2016). Identifying Key Research Themes for Sustainable Urban Mobility. International Journal of Sustainable Transportation, 8318(February), 10:1, 1-8.
Steen, M. (2011). Tensions in human-centred design. CoDesign, 7(1), 45–60.
Steg, L., & Gifford, R. (2005). Sustainable transportation and quality of life. Journal of Transport Geography, 13(1 SPEC. ISS.), 59–69.
Stiglic, M., Agatz, N., Savelsbergh, M., & Gradisar, M. (2015). The benefits of meeting points in ride-
sharing systems. Transportation Research Part B: Methodological, 82, 36–53.
Stolterman, E. (2008). The nature of design practice and implications for interaction design research.
International Journal of Design, 2(1), 55–65.
Stradling, S. G., Anable, J., & Carreno, M. (2007). Performance, importance and user disgruntlement:
A six-step method for measuring satisfaction with travel modes. Transportation Research Part A: Policy and Practice, 41(1), 98–106.
Strauss, A., & Corbin, J. (1998). Basics of Qualitative Research: Techniques and Procedures for Developing Grounded Theory. Second Edition (Vol. 2). Sage publications.
Susilo, Y. O., & Cats, O. (2014). Exploring key determinants of travel satisfaction for multi-modal trips
by different traveler groups. Transportation Research Part A: Policy and Practice, 67, 366–380.
Susilo, Y. O., Cats, O., Diana, M., Hrin, G. R., & Woodcock, A. (2015). Implementing a Behavioural
Pilot Survey for the Stage-based Study of the whole Journey Traveller Experience. Transportation Research Procedia, 11, 172–184.
Sussman, J., Sgouridis, S., & Ward, J. (2005). New Approach to Transportation Planning for the 21st
Century: Regional Strategic Transportation Planning as a Complex Large-Scale Integrated Open
System. Transportation Research Record: Journal of the Transportation Research Board,
1931(1), 89–98.
Sutton, J. C. (1987). Transport innovation and passenger needs — changing perspectives on the role of
dial-a-ride systems: Foreign summaries. Transport Reviews, 7(2), 167–182.
Talbert, N. (1997). Toward human-centered systems. IEEE Computer Graphics and Applications, 17(4),
21–28.
Talbot, R., Rackliff, L., Nicolle, C., Maguire, M., & Mallaband, R. (2016). Journey to work: Exploring
difficulties, solutions, and the impact of aging. International Journal of Sustainable Transportation, 10(6), 541–551.
Tang, K. C., & Davis, a. (1995). Critical factors in the determination of focus group size. Family Practice, 12(4), 474–475.
Tara Smith, K. (2011). Needs Analysis: Or, How Do You Capture, Represent, and Validate User
Requirements in a Formal Manner/ Notation before Design. In Human Factors and Ergonomics in Consumer Product Design (pp. 415–427).
Tay, L., Kuykendall, L., & Diener, E. (2015). Global Handbook of Quality of Life: Exploration of Well-
Being of Nations and Continents. In W. Glatzer, L. Camfield, V. Møller, & M. Rojas (Eds.) (pp.
839–853). Dordrecht: Springer Netherlands.
TLC. (2017). Taxicab trip records of NYC taxi and limousine.
References
138
Tomiyama, T., Gu, P., Jin, Y., Lutters, D., Kind, C., & Kimura, F. (2009). Design methodologies:
Industrial and educational applications. CIRP Annals - Manufacturing Technology, 58(2), 543–565.
TRCG. (2015). Types of Transmissions and How They Work.
Tyl, B., Legardeur, J., Millet, D., & Vallet, F. (2014). A comparative study of ideation mechanisms used
in eco-innovation tools. Journal of Engineering Design, 25(10–12), 325–345.
Ullman, G., & Schroeder, J. (2014). Mitigating Work Zone Safety and Mobility Challenges through
Intelligent Transportation Systems - Case studies. Federal Highway Administration Office of Operations (HOP), FHWA-HOP-1.
UNDESA. (2014). World Urbanization Prospects. United Nations - Department of Economic & Social Affairs.
United Nations. (2016). The World’s Cities in 2016 - Data Booklet.
Urry, J. (2000). Sociology Beyond Societies: Mobilities for the twenty-first century. Journal of Aging Studies (Vol. 23).
V-Traffic. (2014). L’état du trafic en Ile-de-France.
Van Audenhove, F.-J., Koriichuk, O., Dauby, L., & Pourbarx, J. (2014). The Future of Urban Mobility
2.0: Imperatives to Shape Extended Mobility Ecosystems of Tomorrow. Arthur D. Little; International Association of Public Transport (UITP), (January), 1–72.
Van Den Berg, L., Braun, E., & Van Der Meer, J. (2007). National Policy Responses to Urban Challenges in Europe. Rotterdam: Ashgate Publishing, Ltd.
Van Hagen, M., & Bron, P. (2014). Enhancing the Experience of the Train Journey: Changing the Focus
from Satisfaction to Emotional Experience of Customers. Transportation Research Procedia, 1(1),
253–263.
Venables, W. N., & Ripley, B. D. (2002). Tree-Based Methods. In Modern Applied Statistics with S (pp.
251–269). New York, NY: Springer New York.
Verhaegen, P. A., Vandevenne, D., Peeters, J., & Duflou, J. R. (2013). Refinements to the variety metric
for idea evaluation. Design Studies, 34(2), 243–263.
Vincent-Geslin, S., Kaufmann, V., & Ravalet, E. (2016). Réversibilités spatiales, réversibilités sociales ? Sociologies, Penser l’e.
von Hippel, E. (2005). Democratizing innovation: The evolving phenomenon of user innovation.
Journal Fur Betriebswirtschaft, 55(1), 63–78.
Von Hippel, E. (1986). Lead Users: A Source of Novel Product Concepts. Management Science, 791–805.
Vosooghi, R., Kamel, J., Puchinger, J., Leblond, V., & Jankovic, M. (2019). Robo-Taxi Service Fleet
Sizing: Assessing the Impact of User Trust and Willingness to Use. In 98th Annual Meeting of the Transportation Research Board.
Vrande, D., Studer, R., Koreferent, E., Hendler, J. A., Koreferent, Z., Vorsitzende, C. W., & Werner, U.
(2010). Ontology Evaluation. Handbook on Ontologies, 16(June), 251–274.
Vredenburg, K., Mao, J.-Y., Smith, P. W., & Carey, T. (2002). A survey of user-centered design
practice. Proceedings of the SIGCHI Conference on Human Factors in Computing Systems Changing Our World, Changing Ourselves - CHI ’02, (1), 471.
Wachs, M. (2011). Women’s Travel Issues - Creating Knowledge, Improving Policy, and Making
Change. In Women’s issues in transportation, volume 1 (pp. 41–49). Washington, D.C.:
Transportation Research Board.
Walker, J. (2012). Human Transit: How Clearer Thinking about Public Transit Can Enrich Our
References
139
Communities and Our Lives.
Wartzack, S., Vietor, T., Sevtsuk, A., & Hartley, J. (2017). Design and Mobility: Call for a Thematic
Collection of Articles for the Design Science Journal. Design Science, (Design and Mobility), 1.
WBCSD. (2015). Methodology and indicator calculation method for Sustainable Urban Mobility.
Webb, R., Bai, X., Smith, M. S., Costanza, R., Griggs, D., Moglia, M., … Thomson, G. (2018). Sustainable urban systems: Co-design and framing for transformation. Ambio, 47(1), 57–77.
Wegener, M. (2013). The future of mobility in cities: Challenges for urban modelling. Transport Policy,
29, 275–282.
Wesawit. (2013). Quelle est la vitesse moyenne à vélo.
WHO. (2005). Health effects of transport-related air pollution. (M. Krzyzanowski, B. Kuna-Dibbert, &
J. Schneider, Eds.), World Health Organization Library. Denemark.
Woodcock, A., Berkeley, N., Cats, O., Susilo, Y., Hrin, G., Reilly, O., … Pimentel, T. (2014). Measuring quality across the whole journey. Contemporary Ergonomics and Human Factors 2014, 316–323.
Woodcock, A., Osmond, J., Hrin, G. R., Papadopoulou, O., Cats, O., Susilo, Y., … Reilly, O. O. (2014). Deconstructing the Whole Journey Traveler Experience. In 5th International Conference on Applied Human Factors and Ergonomics AHFE 2014 (pp. 4407–4415).
Woodcock, A., Topolavic, S., & Osmond, J. (2013). The Multi-faceted Public Transport Problems
Revealed by a Small Scale Transport Study. In Advances in human aspects of road and rail transportation (pp. 321–330).
Yannou, B. (2015). Supporting need seeker innovation : the Radical Innovation Design (RID) methodology. In ICED 15.
Yannou, B., Cluzel, F., & Farel, R. (2016). Capturing the relevant problems leading to pain- and usage-
driven innovations: The Dependency Structure Modeling Value Bucket algorithm. Concurrent Engineering, (October).
Yannou, B., Leroy, Y., & Jankovic, M. (2013). Observations from radical innovation projects
considering the company context. Journal of Mechanical Design, 135(2), 1–21.
Young, I. (2008). Mental Models, Aligning Design Strategy with Human Behavior.
Zavitsas, K., Kaparias, I., Tomassini, M., Of, C., & Descriptors, N. (2010). Transport problems in cities.
Coordination Of Network Descriptors for Urban Intelligent Transport Systems (CONDUITS).
Zmud, J., Sener, I. N., & Wagner, J. (2016). Consumer Acceptance and Travel Behavior Impacts of Automated Vehicles Final Report Consumer Acceptance and Travel Behavior Impacts of Automated Vehicles.
Appendices

Appendices
140
Appendices
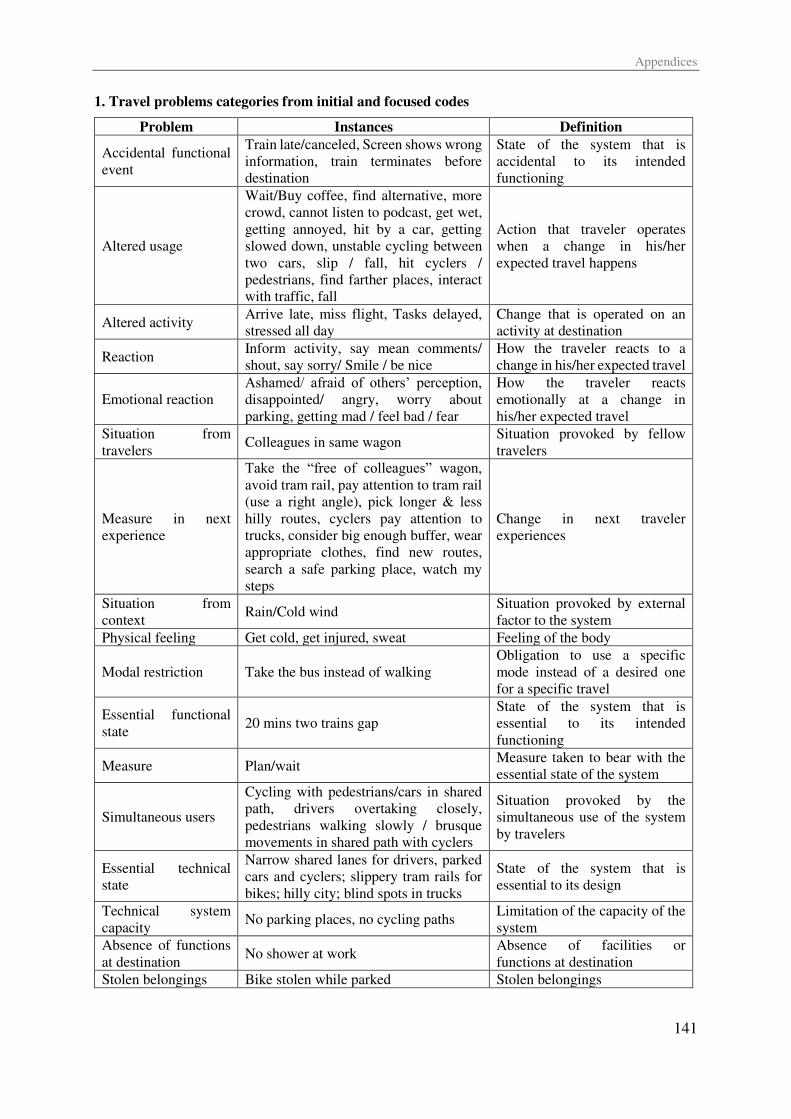
Appendices
141
1. Travel problems categories from initial and focused codes
Problem Instances Definition
Accidental functional
event
Train late/canceled, Screen shows wrong
information, train terminates before
destination
State of the system that is
accidental to its intended
functioning
Altered usage
Wait/Buy coffee, find alternative, more
crowd, cannot listen to podcast, get wet,
getting annoyed, hit by a car, getting
slowed down, unstable cycling between
two cars, slip / fall, hit cyclers /
pedestrians, find farther places, interact
with traffic, fall
Action that traveler operates
when a change in his/her
expected travel happens
Altered activity Arrive late, miss flight, Tasks delayed,
stressed all day
Change that is operated on an
activity at destination
Reaction Inform activity, say mean comments/
shout, say sorry/ Smile / be nice
How the traveler reacts to a
change in his/her expected travel
Emotional reaction
Ashamed/ afraid of others’ perception, disappointed/ angry, worry about
parking, getting mad / feel bad / fear
How the traveler reacts
emotionally at a change in
his/her expected travel
Situation from
travelers Colleagues in same wagon
Situation provoked by fellow
travelers
Measure in next
experience
Take the “free of colleagues” wagon, avoid tram rail, pay attention to tram rail
(use a right angle), pick longer & less
hilly routes, cyclers pay attention to
trucks, consider big enough buffer, wear
appropriate clothes, find new routes,
search a safe parking place, watch my
steps
Change in next traveler
experiences
Situation from
context Rain/Cold wind
Situation provoked by external
factor to the system
Physical feeling Get cold, get injured, sweat Feeling of the body
Modal restriction Take the bus instead of walking
Obligation to use a specific
mode instead of a desired one
for a specific travel
Essential functional
state 20 mins two trains gap
State of the system that is
essential to its intended
functioning
Measure Plan/wait Measure taken to bear with the
essential state of the system
Simultaneous users
Cycling with pedestrians/cars in shared
path, drivers overtaking closely,
pedestrians walking slowly / brusque
movements in shared path with cyclers
Situation provoked by the
simultaneous use of the system
by travelers
Essential technical
state
Narrow shared lanes for drivers, parked
cars and cyclers; slippery tram rails for
bikes; hilly city; blind spots in trucks
State of the system that is
essential to its design
Technical system
capacity No parking places, no cycling paths
Limitation of the capacity of the
system
Absence of functions
at destination No shower at work
Absence of facilities or
functions at destination
Stolen belongings Bike stolen while parked Stolen belongings
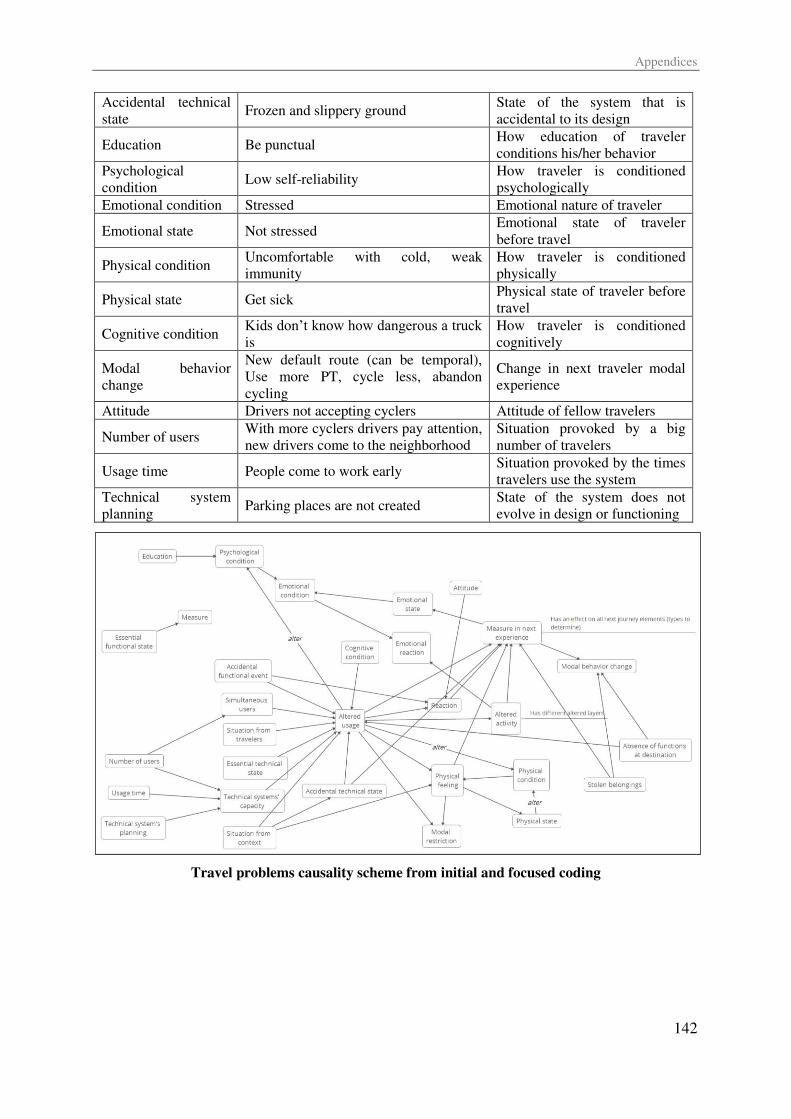
Appendices
142
Accidental technical
state Frozen and slippery ground
State of the system that is
accidental to its design
Education Be punctual How education of traveler
conditions his/her behavior
Psychological
condition Low self-reliability
How traveler is conditioned
psychologically
Emotional condition Stressed Emotional nature of traveler
Emotional state Not stressed Emotional state of traveler
before travel
Physical condition Uncomfortable with cold, weak
immunity
How traveler is conditioned
physically
Physical state Get sick Physical state of traveler before
travel
Cognitive condition Kids don’t know how dangerous a truck is
How traveler is conditioned
cognitively
Modal behavior
change
New default route (can be temporal),
Use more PT, cycle less, abandon
cycling
Change in next traveler modal
experience
Attitude Drivers not accepting cyclers Attitude of fellow travelers
Number of users With more cyclers drivers pay attention,
new drivers come to the neighborhood Situation provoked by a big
number of travelers
Usage time People come to work early Situation provoked by the times
travelers use the system
Technical system
planning Parking places are not created
State of the system does not
evolve in design or functioning
Travel problems causality scheme from initial and focused coding
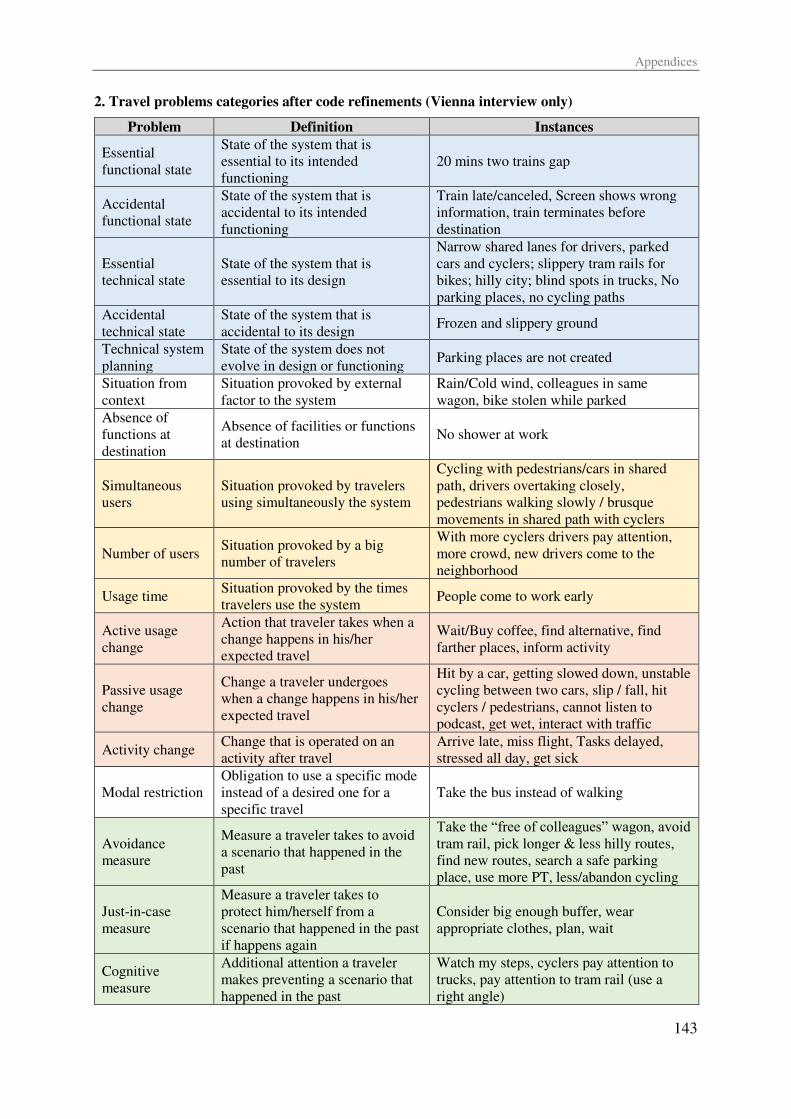
Appendices
143
2. Travel problems categories after code refinements (Vienna interview only)
Problem Definition Instances
Essential
functional state
State of the system that is
essential to its intended
functioning
20 mins two trains gap
Accidental
functional state
State of the system that is
accidental to its intended
functioning
Train late/canceled, Screen shows wrong
information, train terminates before
destination
Essential
technical state
State of the system that is
essential to its design
Narrow shared lanes for drivers, parked
cars and cyclers; slippery tram rails for
bikes; hilly city; blind spots in trucks, No
parking places, no cycling paths
Accidental
technical state
State of the system that is
accidental to its design Frozen and slippery ground
Technical system
planning
State of the system does not
evolve in design or functioning Parking places are not created
Situation from
context
Situation provoked by external
factor to the system
Rain/Cold wind, colleagues in same
wagon, bike stolen while parked
Absence of
functions at
destination
Absence of facilities or functions
at destination No shower at work
Simultaneous
users
Situation provoked by travelers
using simultaneously the system
Cycling with pedestrians/cars in shared
path, drivers overtaking closely,
pedestrians walking slowly / brusque
movements in shared path with cyclers
Number of users Situation provoked by a big
number of travelers
With more cyclers drivers pay attention,
more crowd, new drivers come to the
neighborhood
Usage time Situation provoked by the times
travelers use the system People come to work early
Active usage
change
Action that traveler takes when a
change happens in his/her
expected travel
Wait/Buy coffee, find alternative, find
farther places, inform activity
Passive usage
change
Change a traveler undergoes
when a change happens in his/her
expected travel
Hit by a car, getting slowed down, unstable
cycling between two cars, slip / fall, hit
cyclers / pedestrians, cannot listen to
podcast, get wet, interact with traffic
Activity change Change that is operated on an
activity after travel
Arrive late, miss flight, Tasks delayed,
stressed all day, get sick
Modal restriction
Obligation to use a specific mode
instead of a desired one for a
specific travel
Take the bus instead of walking
Avoidance
measure
Measure a traveler takes to avoid
a scenario that happened in the
past
Take the “free of colleagues” wagon, avoid tram rail, pick longer & less hilly routes,
find new routes, search a safe parking
place, use more PT, less/abandon cycling
Just-in-case
measure
Measure a traveler takes to
protect him/herself from a
scenario that happened in the past
if happens again
Consider big enough buffer, wear
appropriate clothes, plan, wait
Cognitive
measure
Additional attention a traveler
makes preventing a scenario that
happened in the past
Watch my steps, cyclers pay attention to
trucks, pay attention to tram rail (use a
right angle)
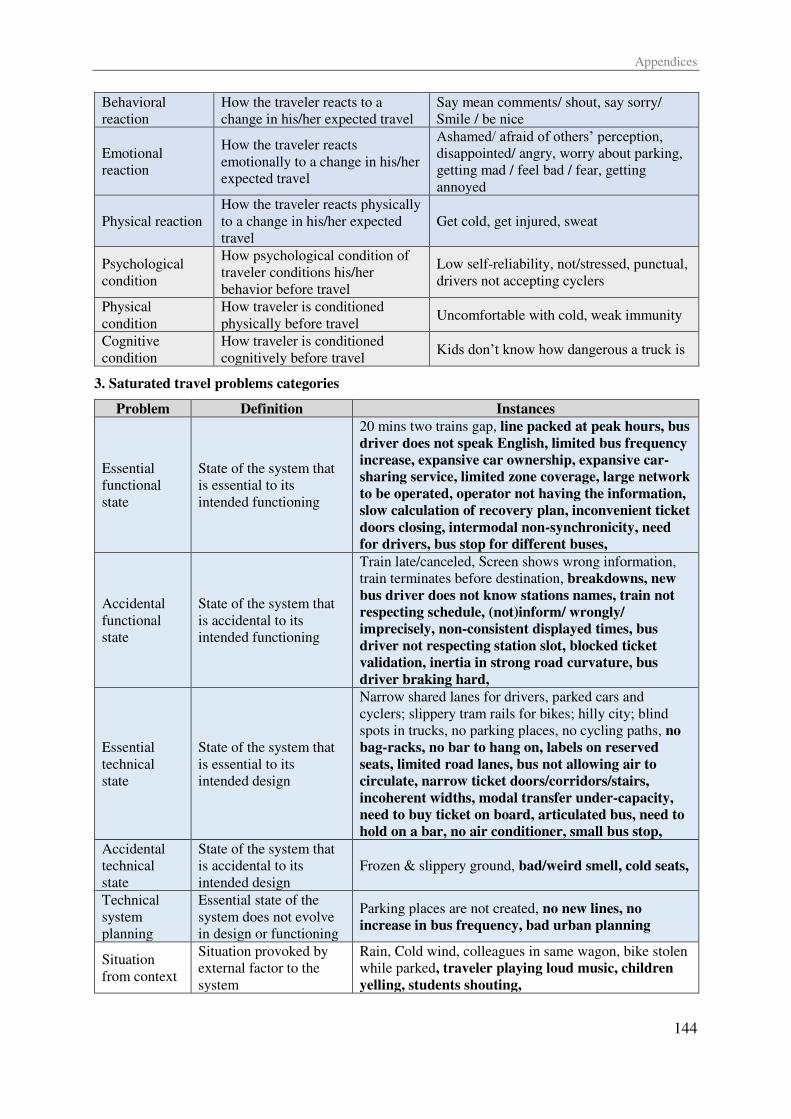
Appendices
144
Behavioral
reaction
How the traveler reacts to a
change in his/her expected travel
Say mean comments/ shout, say sorry/
Smile / be nice
Emotional
reaction
How the traveler reacts
emotionally to a change in his/her
expected travel
Ashamed/ afraid of others’ perception, disappointed/ angry, worry about parking,
getting mad / feel bad / fear, getting
annoyed
Physical reaction
How the traveler reacts physically
to a change in his/her expected
travel
Get cold, get injured, sweat
Psychological
condition
How psychological condition of
traveler conditions his/her
behavior before travel
Low self-reliability, not/stressed, punctual,
drivers not accepting cyclers
Physical
condition
How traveler is conditioned
physically before travel Uncomfortable with cold, weak immunity
Cognitive
condition
How traveler is conditioned
cognitively before travel Kids don’t know how dangerous a truck is
3. Saturated travel problems categories
Problem Definition Instances
Essential
functional
state
State of the system that
is essential to its
intended functioning
20 mins two trains gap, line packed at peak hours, bus
driver does not speak English, limited bus frequency increase, expansive car ownership, expansive car-sharing service, limited zone coverage, large network
to be operated, operator not having the information, slow calculation of recovery plan, inconvenient ticket
doors closing, intermodal non-synchronicity, need for drivers, bus stop for different buses,
Accidental
functional
state
State of the system that
is accidental to its
intended functioning
Train late/canceled, Screen shows wrong information,
train terminates before destination, breakdowns, new
bus driver does not know stations names, train not respecting schedule, (not)inform/ wrongly/ imprecisely, non-consistent displayed times, bus
driver not respecting station slot, blocked ticket validation, inertia in strong road curvature, bus
driver braking hard,
Essential
technical
state
State of the system that
is essential to its
intended design
Narrow shared lanes for drivers, parked cars and
cyclers; slippery tram rails for bikes; hilly city; blind
spots in trucks, no parking places, no cycling paths, no bag-racks, no bar to hang on, labels on reserved
seats, limited road lanes, bus not allowing air to circulate, narrow ticket doors/corridors/stairs,
incoherent widths, modal transfer under-capacity, need to buy ticket on board, articulated bus, need to hold on a bar, no air conditioner, small bus stop,
Accidental
technical
state
State of the system that
is accidental to its
intended design
Frozen & slippery ground, bad/weird smell, cold seats,
Technical
system
planning
Essential state of the
system does not evolve
in design or functioning
Parking places are not created, no new lines, no increase in bus frequency, bad urban planning
Situation
from context
Situation provoked by
external factor to the
system
Rain, Cold wind, colleagues in same wagon, bike stolen
while parked, traveler playing loud music, children
yelling, students shouting,
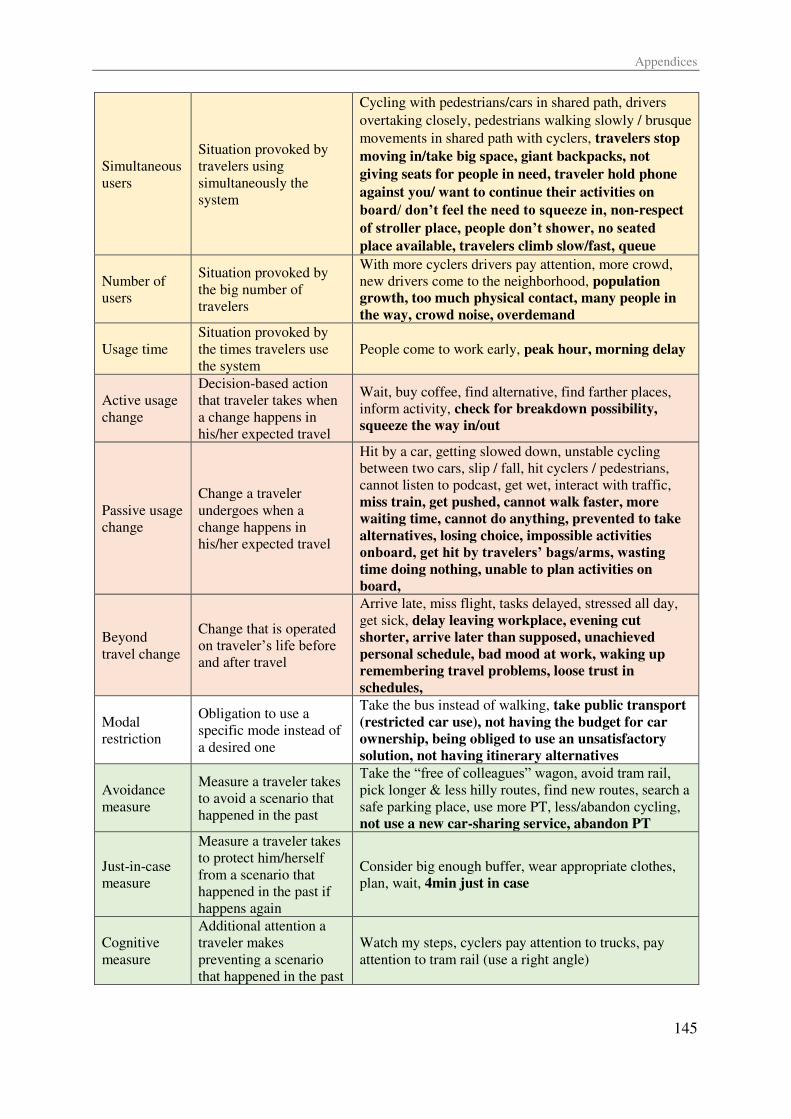
Appendices
145
Simultaneous
users
Situation provoked by
travelers using
simultaneously the
system
Cycling with pedestrians/cars in shared path, drivers
overtaking closely, pedestrians walking slowly / brusque
movements in shared path with cyclers, travelers stop
moving in/take big space, giant backpacks, not
giving seats for people in need, traveler hold phone
against you/ want to continue their activities on
board/ don’t feel the need to squeeze in, non-respect
of stroller place, people don’t shower, no seated place available, travelers climb slow/fast, queue
Number of
users
Situation provoked by
the big number of
travelers
With more cyclers drivers pay attention, more crowd,
new drivers come to the neighborhood, population growth, too much physical contact, many people in
the way, crowd noise, overdemand
Usage time
Situation provoked by
the times travelers use
the system
People come to work early, peak hour, morning delay
Active usage
change
Decision-based action
that traveler takes when
a change happens in
his/her expected travel
Wait, buy coffee, find alternative, find farther places,
inform activity, check for breakdown possibility, squeeze the way in/out
Passive usage
change
Change a traveler
undergoes when a
change happens in
his/her expected travel
Hit by a car, getting slowed down, unstable cycling
between two cars, slip / fall, hit cyclers / pedestrians,
cannot listen to podcast, get wet, interact with traffic,
miss train, get pushed, cannot walk faster, more waiting time, cannot do anything, prevented to take
alternatives, losing choice, impossible activities onboard, get hit by travelers’ bags/arms, wasting time doing nothing, unable to plan activities on board,
Beyond
travel change
Change that is operated
on traveler’s life before and after travel
Arrive late, miss flight, tasks delayed, stressed all day,
get sick, delay leaving workplace, evening cut shorter, arrive later than supposed, unachieved
personal schedule, bad mood at work, waking up remembering travel problems, loose trust in
schedules,
Modal
restriction
Obligation to use a
specific mode instead of
a desired one
Take the bus instead of walking, take public transport
(restricted car use), not having the budget for car ownership, being obliged to use an unsatisfactory solution, not having itinerary alternatives
Avoidance
measure
Measure a traveler takes
to avoid a scenario that
happened in the past
Take the “free of colleagues” wagon, avoid tram rail, pick longer & less hilly routes, find new routes, search a
safe parking place, use more PT, less/abandon cycling,
not use a new car-sharing service, abandon PT
Just-in-case
measure
Measure a traveler takes
to protect him/herself
from a scenario that
happened in the past if
happens again
Consider big enough buffer, wear appropriate clothes,
plan, wait, 4min just in case
Cognitive
measure
Additional attention a
traveler makes
preventing a scenario
that happened in the past
Watch my steps, cyclers pay attention to trucks, pay
attention to tram rail (use a right angle)
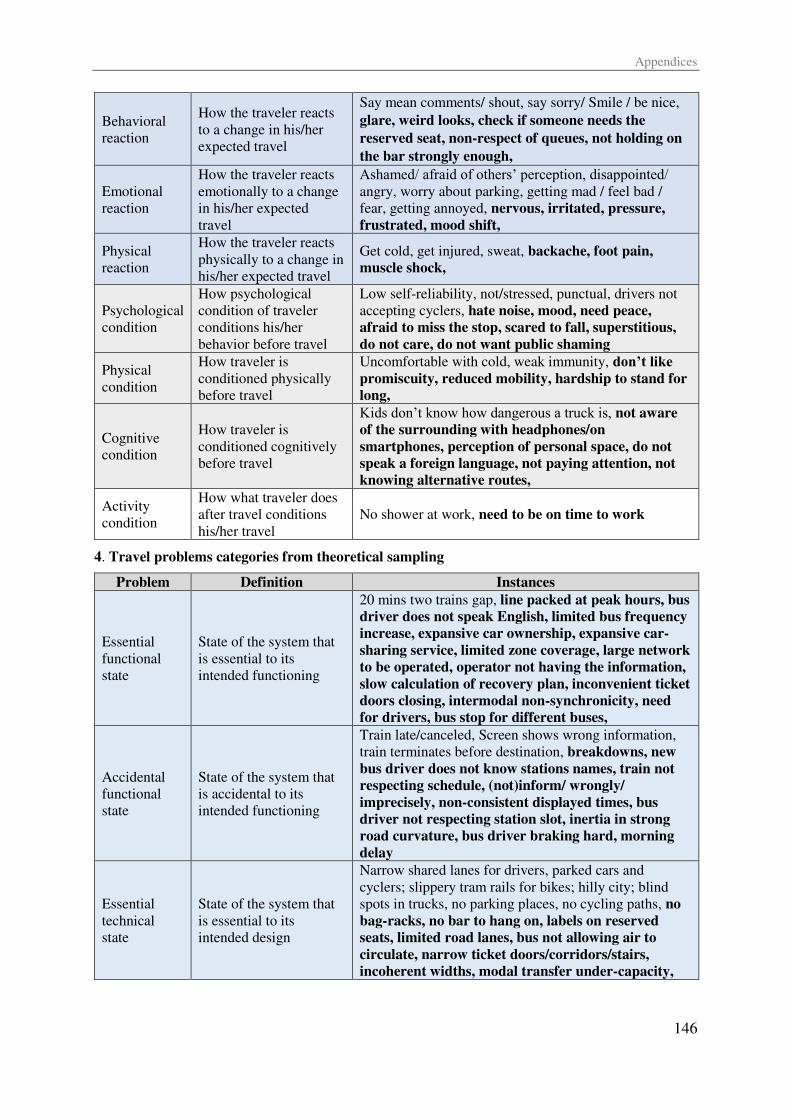
Appendices
146
Behavioral
reaction
How the traveler reacts
to a change in his/her
expected travel
Say mean comments/ shout, say sorry/ Smile / be nice,
glare, weird looks, check if someone needs the
reserved seat, non-respect of queues, not holding on
the bar strongly enough,
Emotional
reaction
How the traveler reacts
emotionally to a change
in his/her expected
travel
Ashamed/ afraid of others’ perception, disappointed/ angry, worry about parking, getting mad / feel bad /
fear, getting annoyed, nervous, irritated, pressure,
frustrated, mood shift,
Physical
reaction
How the traveler reacts
physically to a change in
his/her expected travel
Get cold, get injured, sweat, backache, foot pain, muscle shock,
Psychological
condition
How psychological
condition of traveler
conditions his/her
behavior before travel
Low self-reliability, not/stressed, punctual, drivers not
accepting cyclers, hate noise, mood, need peace, afraid to miss the stop, scared to fall, superstitious,
do not care, do not want public shaming
Physical
condition
How traveler is
conditioned physically
before travel
Uncomfortable with cold, weak immunity, don’t like promiscuity, reduced mobility, hardship to stand for long,
Cognitive
condition
How traveler is
conditioned cognitively
before travel
Kids don’t know how dangerous a truck is, not aware of the surrounding with headphones/on
smartphones, perception of personal space, do not speak a foreign language, not paying attention, not knowing alternative routes,
Activity
condition
How what traveler does
after travel conditions
his/her travel
No shower at work, need to be on time to work
4. Travel problems categories from theoretical sampling
Problem Definition Instances
Essential
functional
state
State of the system that
is essential to its
intended functioning
20 mins two trains gap, line packed at peak hours, bus driver does not speak English, limited bus frequency increase, expansive car ownership, expansive car-
sharing service, limited zone coverage, large network to be operated, operator not having the information,
slow calculation of recovery plan, inconvenient ticket doors closing, intermodal non-synchronicity, need for drivers, bus stop for different buses,
Accidental
functional
state
State of the system that
is accidental to its
intended functioning
Train late/canceled, Screen shows wrong information,
train terminates before destination, breakdowns, new
bus driver does not know stations names, train not respecting schedule, (not)inform/ wrongly/
imprecisely, non-consistent displayed times, bus driver not respecting station slot, inertia in strong road curvature, bus driver braking hard, morning
delay
Essential
technical
state
State of the system that
is essential to its
intended design
Narrow shared lanes for drivers, parked cars and
cyclers; slippery tram rails for bikes; hilly city; blind
spots in trucks, no parking places, no cycling paths, no
bag-racks, no bar to hang on, labels on reserved seats, limited road lanes, bus not allowing air to
circulate, narrow ticket doors/corridors/stairs, incoherent widths, modal transfer under-capacity,
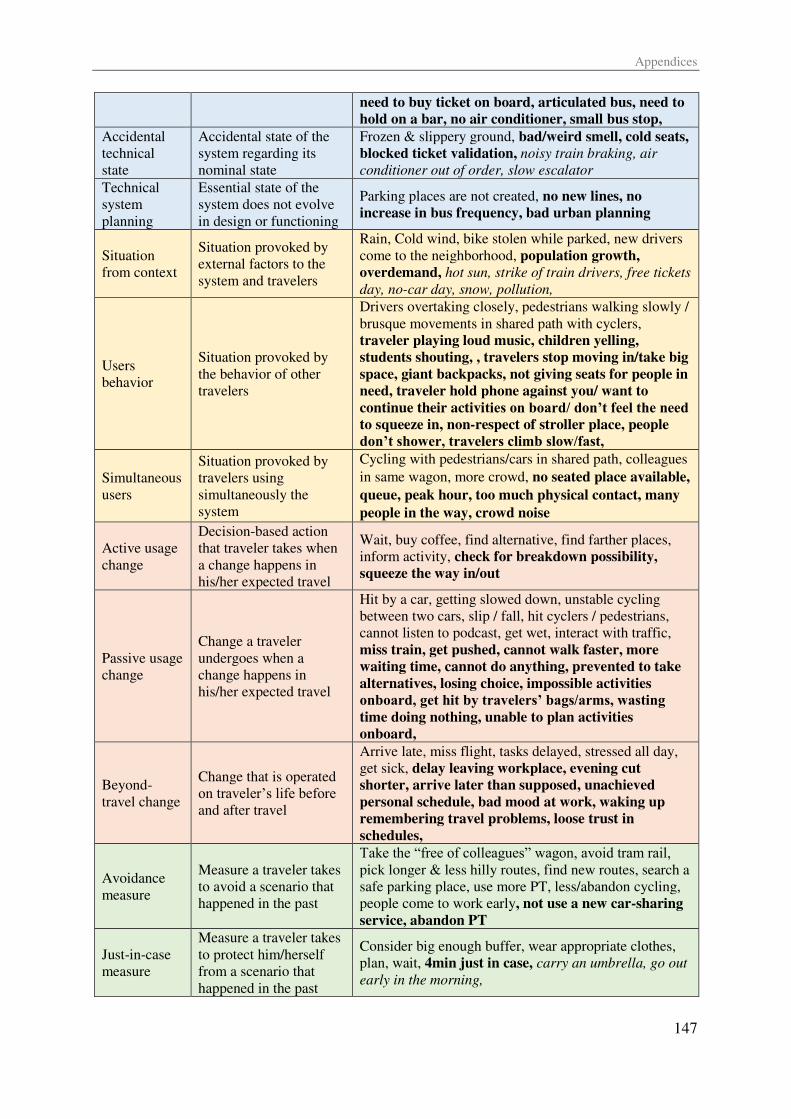
Appendices
147
need to buy ticket on board, articulated bus, need to hold on a bar, no air conditioner, small bus stop,
Accidental
technical
state
Accidental state of the
system regarding its
nominal state
Frozen & slippery ground, bad/weird smell, cold seats, blocked ticket validation, noisy train braking, air conditioner out of order, slow escalator
Technical
system
planning
Essential state of the
system does not evolve
in design or functioning
Parking places are not created, no new lines, no increase in bus frequency, bad urban planning
Situation
from context
Situation provoked by
external factors to the
system and travelers
Rain, Cold wind, bike stolen while parked, new drivers
come to the neighborhood, population growth, overdemand, hot sun, strike of train drivers, free tickets day, no-car day, snow, pollution,
Users
behavior
Situation provoked by
the behavior of other
travelers
Drivers overtaking closely, pedestrians walking slowly /
brusque movements in shared path with cyclers,
traveler playing loud music, children yelling, students shouting, , travelers stop moving in/take big
space, giant backpacks, not giving seats for people in need, traveler hold phone against you/ want to
continue their activities on board/ don’t feel the need to squeeze in, non-respect of stroller place, people don’t shower, travelers climb slow/fast,
Simultaneous
users
Situation provoked by
travelers using
simultaneously the
system
Cycling with pedestrians/cars in shared path, colleagues
in same wagon, more crowd, no seated place available,
queue, peak hour, too much physical contact, many
people in the way, crowd noise
Active usage
change
Decision-based action
that traveler takes when
a change happens in
his/her expected travel
Wait, buy coffee, find alternative, find farther places,
inform activity, check for breakdown possibility, squeeze the way in/out
Passive usage
change
Change a traveler
undergoes when a
change happens in
his/her expected travel
Hit by a car, getting slowed down, unstable cycling
between two cars, slip / fall, hit cyclers / pedestrians,
cannot listen to podcast, get wet, interact with traffic,
miss train, get pushed, cannot walk faster, more waiting time, cannot do anything, prevented to take
alternatives, losing choice, impossible activities onboard, get hit by travelers’ bags/arms, wasting time doing nothing, unable to plan activities onboard,
Beyond-
travel change
Change that is operated
on traveler’s life before and after travel
Arrive late, miss flight, tasks delayed, stressed all day,
get sick, delay leaving workplace, evening cut shorter, arrive later than supposed, unachieved
personal schedule, bad mood at work, waking up remembering travel problems, loose trust in
schedules,
Avoidance
measure
Measure a traveler takes
to avoid a scenario that
happened in the past
Take the “free of colleagues” wagon, avoid tram rail, pick longer & less hilly routes, find new routes, search a
safe parking place, use more PT, less/abandon cycling,
people come to work early, not use a new car-sharing
service, abandon PT
Just-in-case
measure
Measure a traveler takes
to protect him/herself
from a scenario that
happened in the past
Consider big enough buffer, wear appropriate clothes,
plan, wait, 4min just in case, carry an umbrella, go out early in the morning,
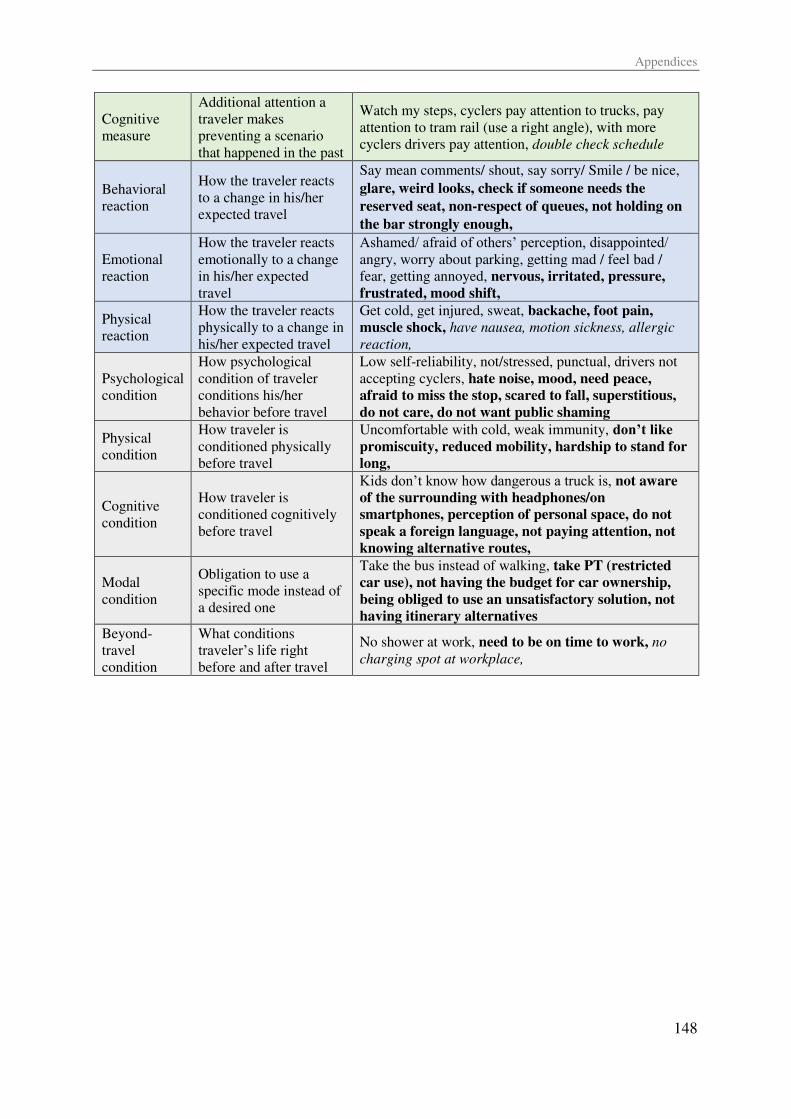
Appendices
148
Cognitive
measure
Additional attention a
traveler makes
preventing a scenario
that happened in the past
Watch my steps, cyclers pay attention to trucks, pay
attention to tram rail (use a right angle), with more
cyclers drivers pay attention, double check schedule
Behavioral
reaction
How the traveler reacts
to a change in his/her
expected travel
Say mean comments/ shout, say sorry/ Smile / be nice,
glare, weird looks, check if someone needs the
reserved seat, non-respect of queues, not holding on
the bar strongly enough,
Emotional
reaction
How the traveler reacts
emotionally to a change
in his/her expected
travel
Ashamed/ afraid of others’ perception, disappointed/ angry, worry about parking, getting mad / feel bad /
fear, getting annoyed, nervous, irritated, pressure,
frustrated, mood shift,
Physical
reaction
How the traveler reacts
physically to a change in
his/her expected travel
Get cold, get injured, sweat, backache, foot pain, muscle shock, have nausea, motion sickness, allergic reaction,
Psychological
condition
How psychological
condition of traveler
conditions his/her
behavior before travel
Low self-reliability, not/stressed, punctual, drivers not
accepting cyclers, hate noise, mood, need peace, afraid to miss the stop, scared to fall, superstitious,
do not care, do not want public shaming
Physical
condition
How traveler is
conditioned physically
before travel
Uncomfortable with cold, weak immunity, don’t like promiscuity, reduced mobility, hardship to stand for long,
Cognitive
condition
How traveler is
conditioned cognitively
before travel
Kids don’t know how dangerous a truck is, not aware of the surrounding with headphones/on smartphones, perception of personal space, do not
speak a foreign language, not paying attention, not knowing alternative routes,
Modal
condition
Obligation to use a
specific mode instead of
a desired one
Take the bus instead of walking, take PT (restricted car use), not having the budget for car ownership,
being obliged to use an unsatisfactory solution, not having itinerary alternatives
Beyond-
travel
condition
What conditions
traveler’s life right before and after travel
No shower at work, need to be on time to work, no charging spot at workplace,
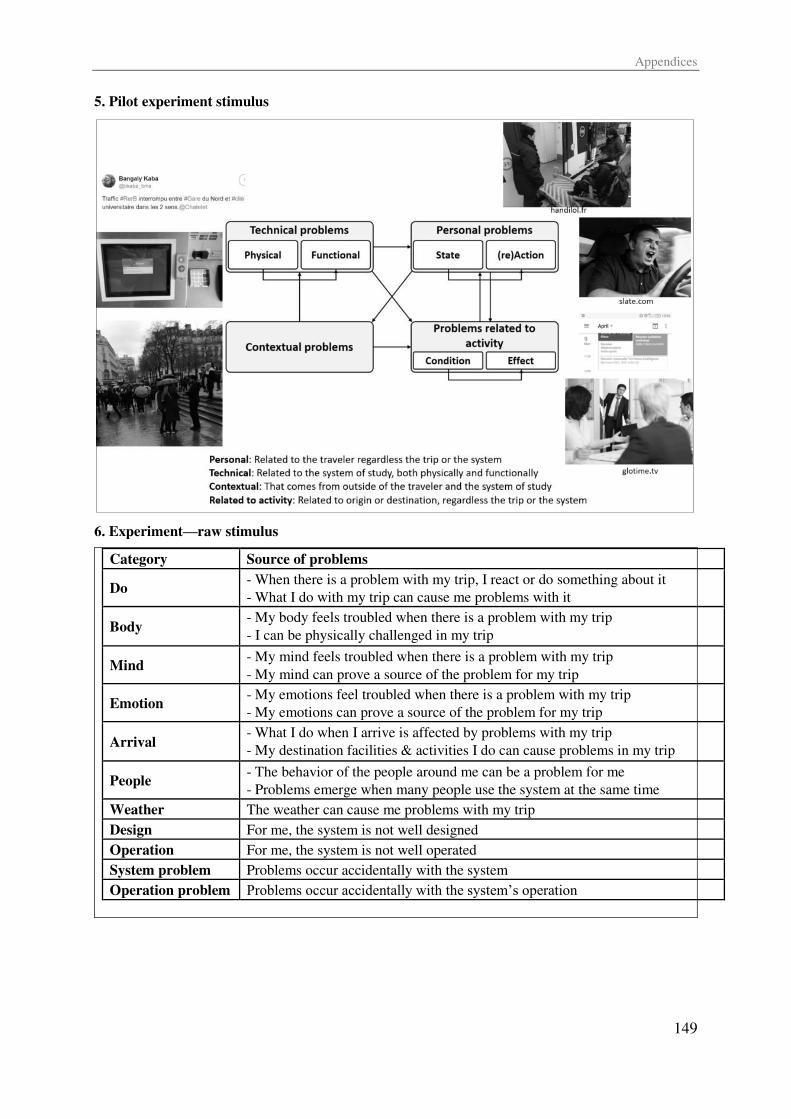
Appendices
149
5. Pilot experiment stimulus
6. Experiment—raw stimulus
Category Source of problems
Do - When there is a problem with my trip, I react or do something about it
- What I do with my trip can cause me problems with it
Body - My body feels troubled when there is a problem with my trip
- I can be physically challenged in my trip
Mind - My mind feels troubled when there is a problem with my trip
- My mind can prove a source of the problem for my trip
Emotion - My emotions feel troubled when there is a problem with my trip
- My emotions can prove a source of the problem for my trip
Arrival - What I do when I arrive is affected by problems with my trip
- My destination facilities & activities I do can cause problems in my trip
People - The behavior of the people around me can be a problem for me
- Problems emerge when many people use the system at the same time
Weather The weather can cause me problems with my trip
Design For me, the system is not well designed
Operation For me, the system is not well operated
System problem Problems occur accidentally with the system
Operation problem Problems occur accidentally with the system’s operation
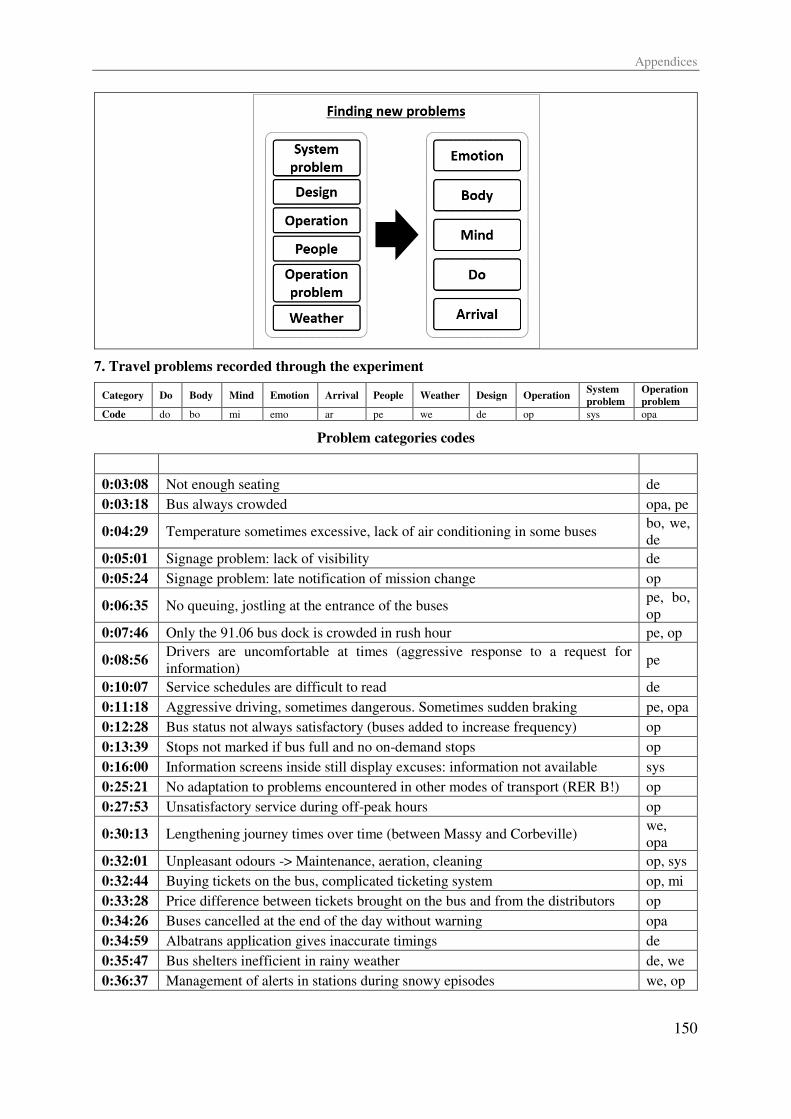
Appendices
150
7. Travel problems recorded through the experiment
Category Do Body Mind Emotion Arrival People Weather Design Operation System
problem
Operation
problem
Code do bo mi emo ar pe we de op sys opa
Problem categories codes
Time Travel problems of G1 Code
0:03:08 Not enough seating de
0:03:18 Bus always crowded opa, pe
0:04:29 Temperature sometimes excessive, lack of air conditioning in some buses bo, we,
de
0:05:01 Signage problem: lack of visibility de
0:05:24 Signage problem: late notification of mission change op
0:06:35 No queuing, jostling at the entrance of the buses pe, bo,
op
0:07:46 Only the 91.06 bus dock is crowded in rush hour pe, op
0:08:56 Drivers are uncomfortable at times (aggressive response to a request for
information) pe
0:10:07 Service schedules are difficult to read de
0:11:18 Aggressive driving, sometimes dangerous. Sometimes sudden braking pe, opa
0:12:28 Bus status not always satisfactory (buses added to increase frequency) op
0:13:39 Stops not marked if bus full and no on-demand stops op
0:16:00 Information screens inside still display excuses: information not available sys
0:25:21 No adaptation to problems encountered in other modes of transport (RER B!) op
0:27:53 Unsatisfactory service during off-peak hours op
0:30:13 Lengthening journey times over time (between Massy and Corbeville) we,
opa
0:32:01 Unpleasant odours -> Maintenance, aeration, cleaning op, sys
0:32:44 Buying tickets on the bus, complicated ticketing system op, mi
0:33:28 Price difference between tickets brought on the bus and from the distributors op
0:34:26 Buses cancelled at the end of the day without warning opa
0:34:59 Albatrans application gives inaccurate timings de
0:35:47 Bus shelters inefficient in rainy weather de, we
0:36:37 Management of alerts in stations during snowy episodes we, op
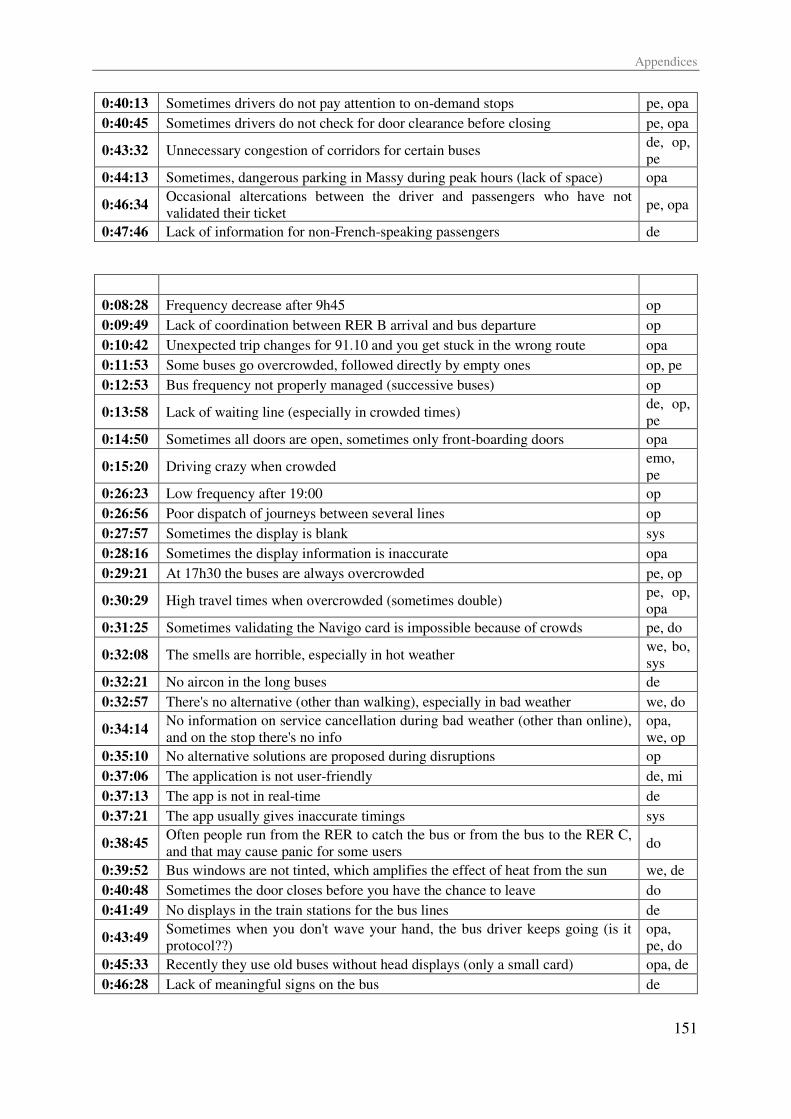
Appendices
151
0:40:13 Sometimes drivers do not pay attention to on-demand stops pe, opa
0:40:45 Sometimes drivers do not check for door clearance before closing pe, opa
0:43:32 Unnecessary congestion of corridors for certain buses de, op,
pe
0:44:13 Sometimes, dangerous parking in Massy during peak hours (lack of space) opa
0:46:34 Occasional altercations between the driver and passengers who have not
validated their ticket pe, opa
0:47:46 Lack of information for non-French-speaking passengers de
Time Travel problems of G2 Code
0:08:28 Frequency decrease after 9h45 op
0:09:49 Lack of coordination between RER B arrival and bus departure op
0:10:42 Unexpected trip changes for 91.10 and you get stuck in the wrong route opa
0:11:53 Some buses go overcrowded, followed directly by empty ones op, pe
0:12:53 Bus frequency not properly managed (successive buses) op
0:13:58 Lack of waiting line (especially in crowded times) de, op,
pe
0:14:50 Sometimes all doors are open, sometimes only front-boarding doors opa
0:15:20 Driving crazy when crowded emo,
pe
0:26:23 Low frequency after 19:00 op
0:26:56 Poor dispatch of journeys between several lines op
0:27:57 Sometimes the display is blank sys
0:28:16 Sometimes the display information is inaccurate opa
0:29:21 At 17h30 the buses are always overcrowded pe, op
0:30:29 High travel times when overcrowded (sometimes double) pe, op,
opa
0:31:25 Sometimes validating the Navigo card is impossible because of crowds pe, do
0:32:08 The smells are horrible, especially in hot weather we, bo,
sys
0:32:21 No aircon in the long buses de
0:32:57 There's no alternative (other than walking), especially in bad weather we, do
0:34:14 No information on service cancellation during bad weather (other than online),
and on the stop there's no info
opa,
we, op
0:35:10 No alternative solutions are proposed during disruptions op
0:37:06 The application is not user-friendly de, mi
0:37:13 The app is not in real-time de
0:37:21 The app usually gives inaccurate timings sys
0:38:45 Often people run from the RER to catch the bus or from the bus to the RER C,
and that may cause panic for some users do
0:39:52 Bus windows are not tinted, which amplifies the effect of heat from the sun we, de
0:40:48 Sometimes the door closes before you have the chance to leave do
0:41:49 No displays in the train stations for the bus lines de
0:43:49 Sometimes when you don't wave your hand, the bus driver keeps going (is it
protocol??)
opa,
pe, do
0:45:33 Recently they use old buses without head displays (only a small card) opa, de
0:46:28 Lack of meaningful signs on the bus de
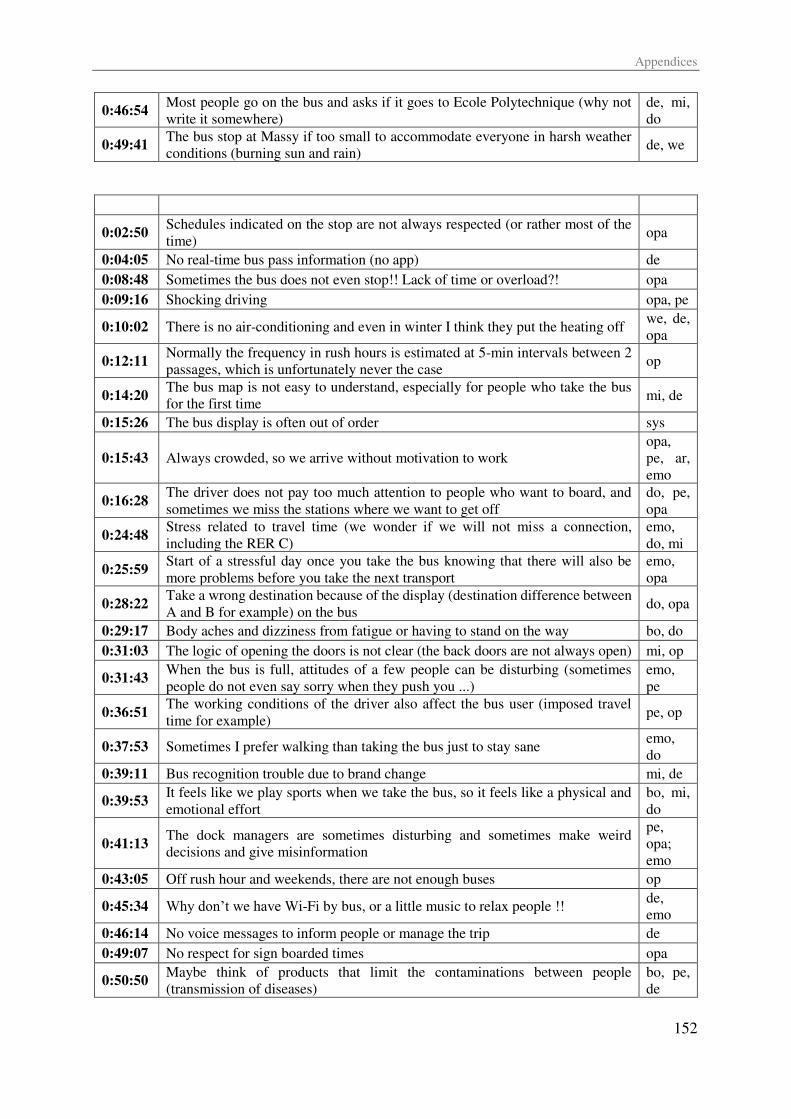
Appendices
152
0:46:54 Most people go on the bus and asks if it goes to Ecole Polytechnique (why not
write it somewhere)
de, mi,
do
0:49:41 The bus stop at Massy if too small to accommodate everyone in harsh weather
conditions (burning sun and rain) de, we
Time Travel problems of G3 Code
0:02:50 Schedules indicated on the stop are not always respected (or rather most of the
time) opa
0:04:05 No real-time bus pass information (no app) de
0:08:48 Sometimes the bus does not even stop!! Lack of time or overload?! opa
0:09:16 Shocking driving opa, pe
0:10:02 There is no air-conditioning and even in winter I think they put the heating off we, de,
opa
0:12:11 Normally the frequency in rush hours is estimated at 5-min intervals between 2
passages, which is unfortunately never the case op
0:14:20 The bus map is not easy to understand, especially for people who take the bus
for the first time mi, de
0:15:26 The bus display is often out of order sys
0:15:43 Always crowded, so we arrive without motivation to work
opa,
pe, ar,
emo
0:16:28 The driver does not pay too much attention to people who want to board, and
sometimes we miss the stations where we want to get off
do, pe,
opa
0:24:48 Stress related to travel time (we wonder if we will not miss a connection,
including the RER C)
emo,
do, mi
0:25:59 Start of a stressful day once you take the bus knowing that there will also be
more problems before you take the next transport
emo,
opa
0:28:22 Take a wrong destination because of the display (destination difference between
A and B for example) on the bus do, opa
0:29:17 Body aches and dizziness from fatigue or having to stand on the way bo, do
0:31:03 The logic of opening the doors is not clear (the back doors are not always open) mi, op
0:31:43 When the bus is full, attitudes of a few people can be disturbing (sometimes
people do not even say sorry when they push you ...)
emo,
pe
0:36:51 The working conditions of the driver also affect the bus user (imposed travel
time for example) pe, op
0:37:53 Sometimes I prefer walking than taking the bus just to stay sane emo,
do
0:39:11 Bus recognition trouble due to brand change mi, de
0:39:53 It feels like we play sports when we take the bus, so it feels like a physical and
emotional effort
bo, mi,
do
0:41:13 The dock managers are sometimes disturbing and sometimes make weird
decisions and give misinformation
pe,
opa;
emo
0:43:05 Off rush hour and weekends, there are not enough buses op
0:45:34 Why don’t we have Wi-Fi by bus, or a little music to relax people !! de,
emo
0:46:14 No voice messages to inform people or manage the trip de
0:49:07 No respect for sign boarded times opa
0:50:50 Maybe think of products that limit the contaminations between people
(transmission of diseases)
bo, pe,
de
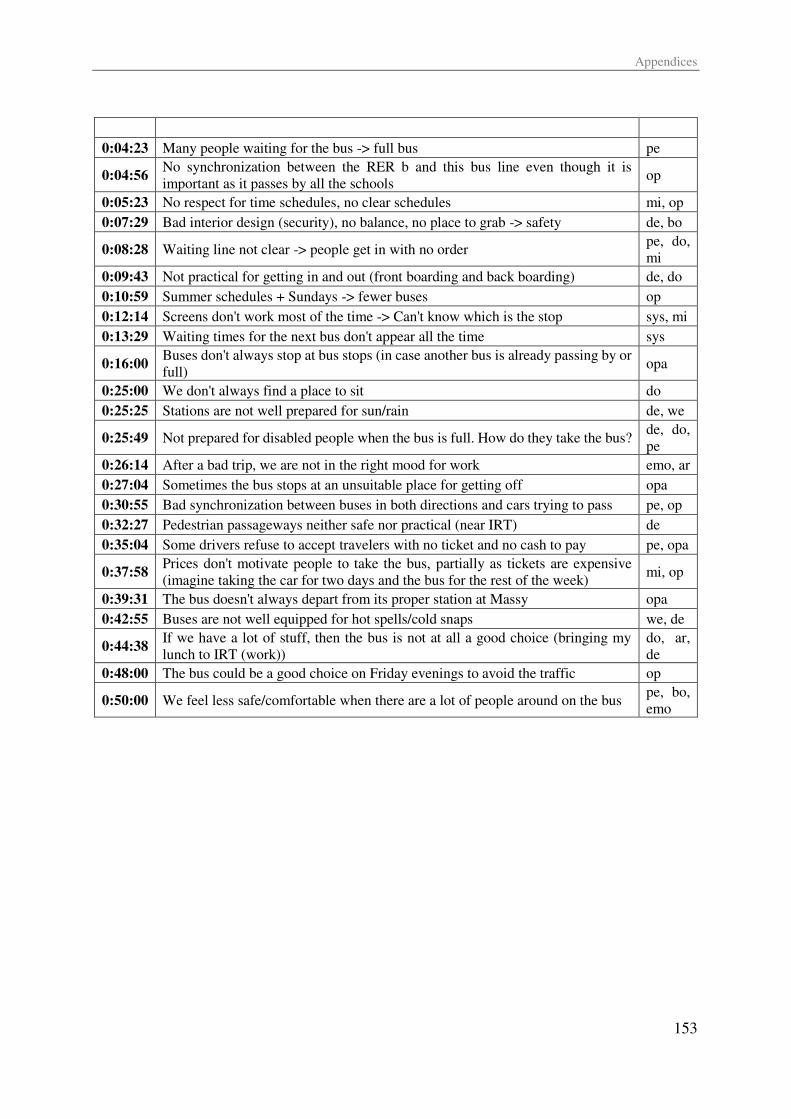
Appendices
153
Time Travel problems of G4 Code
0:04:23 Many people waiting for the bus -> full bus pe
0:04:56 No synchronization between the RER b and this bus line even though it is
important as it passes by all the schools op
0:05:23 No respect for time schedules, no clear schedules mi, op
0:07:29 Bad interior design (security), no balance, no place to grab -> safety de, bo
0:08:28 Waiting line not clear -> people get in with no order pe, do,
mi
0:09:43 Not practical for getting in and out (front boarding and back boarding) de, do
0:10:59 Summer schedules + Sundays -> fewer buses op
0:12:14 Screens don't work most of the time -> Can't know which is the stop sys, mi
0:13:29 Waiting times for the next bus don't appear all the time sys
0:16:00 Buses don't always stop at bus stops (in case another bus is already passing by or
full) opa
0:25:00 We don't always find a place to sit do
0:25:25 Stations are not well prepared for sun/rain de, we
0:25:49 Not prepared for disabled people when the bus is full. How do they take the bus? de, do,
pe
0:26:14 After a bad trip, we are not in the right mood for work emo, ar
0:27:04 Sometimes the bus stops at an unsuitable place for getting off opa
0:30:55 Bad synchronization between buses in both directions and cars trying to pass pe, op
0:32:27 Pedestrian passageways neither safe nor practical (near IRT) de
0:35:04 Some drivers refuse to accept travelers with no ticket and no cash to pay pe, opa
0:37:58 Prices don't motivate people to take the bus, partially as tickets are expensive
(imagine taking the car for two days and the bus for the rest of the week) mi, op
0:39:31 The bus doesn't always depart from its proper station at Massy opa
0:42:55 Buses are not well equipped for hot spells/cold snaps we, de
0:44:38 If we have a lot of stuff, then the bus is not at all a good choice (bringing my
lunch to IRT (work))
do, ar,
de
0:48:00 The bus could be a good choice on Friday evenings to avoid the traffic op
0:50:00 We feel less safe/comfortable when there are a lot of people around on the bus pe, bo,
emo
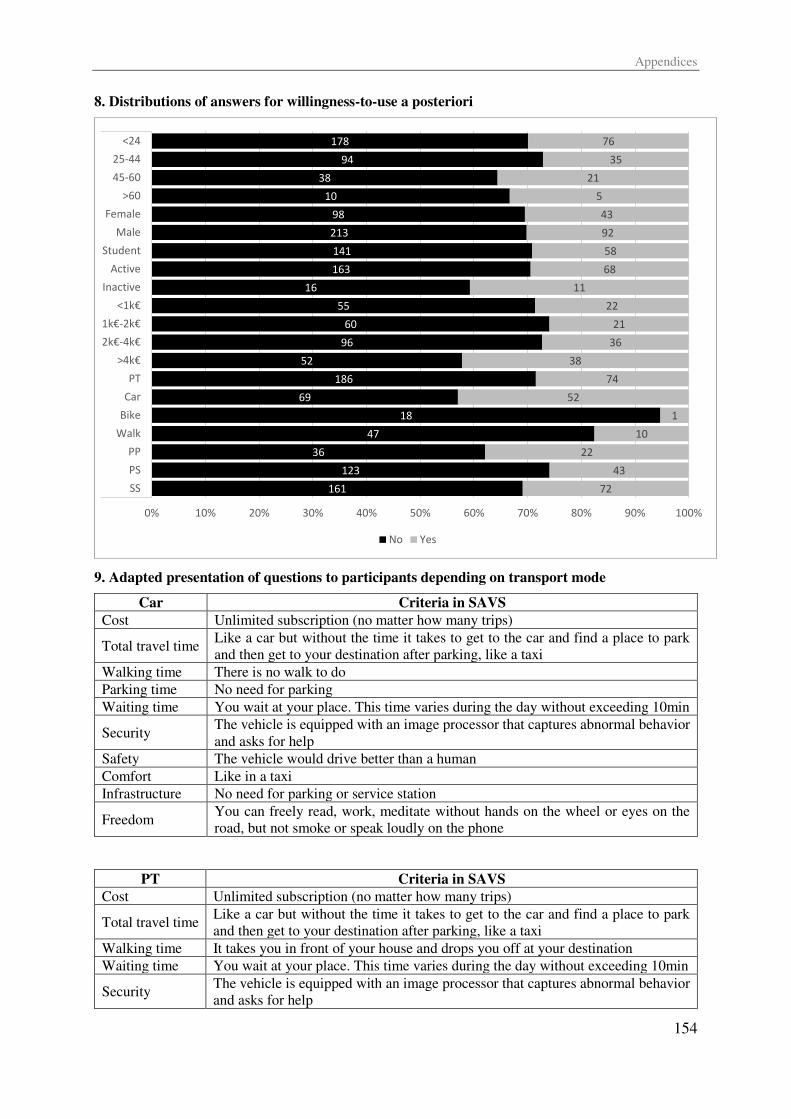
Appendices
154
8. Distributions of answers for willingness-to-use a posteriori
9. Adapted presentation of questions to participants depending on transport mode
Car Criteria in SAVS
Cost Unlimited subscription (no matter how many trips)
Total travel time Like a car but without the time it takes to get to the car and find a place to park
and then get to your destination after parking, like a taxi
Walking time There is no walk to do
Parking time No need for parking
Waiting time You wait at your place. This time varies during the day without exceeding 10min
Security The vehicle is equipped with an image processor that captures abnormal behavior
and asks for help
Safety The vehicle would drive better than a human
Comfort Like in a taxi
Infrastructure No need for parking or service station
Freedom You can freely read, work, meditate without hands on the wheel or eyes on the
road, but not smoke or speak loudly on the phone
PT Criteria in SAVS
Cost Unlimited subscription (no matter how many trips)
Total travel time Like a car but without the time it takes to get to the car and find a place to park
and then get to your destination after parking, like a taxi
Walking time It takes you in front of your house and drops you off at your destination
Waiting time You wait at your place. This time varies during the day without exceeding 10min
Security The vehicle is equipped with an image processor that captures abnormal behavior
and asks for help
178
94
38
10
98
213
141
163
16
55
60
96
52
186
69
18
47
36
123
161
76
35
21
5
43
92
58
68
11
22
21
36
38
74
52
1
10
22
43
72
0% 10% 20% 30% 40% 50% 60% 70% 80% 90% 100%
<24
25-44
45-60
>60
Female
Male
Student
Active
Inactive
< k€k€- k€k€-4k€>4k€
PT
Car
Bike
Walk
PP
PS
SS
No Yes
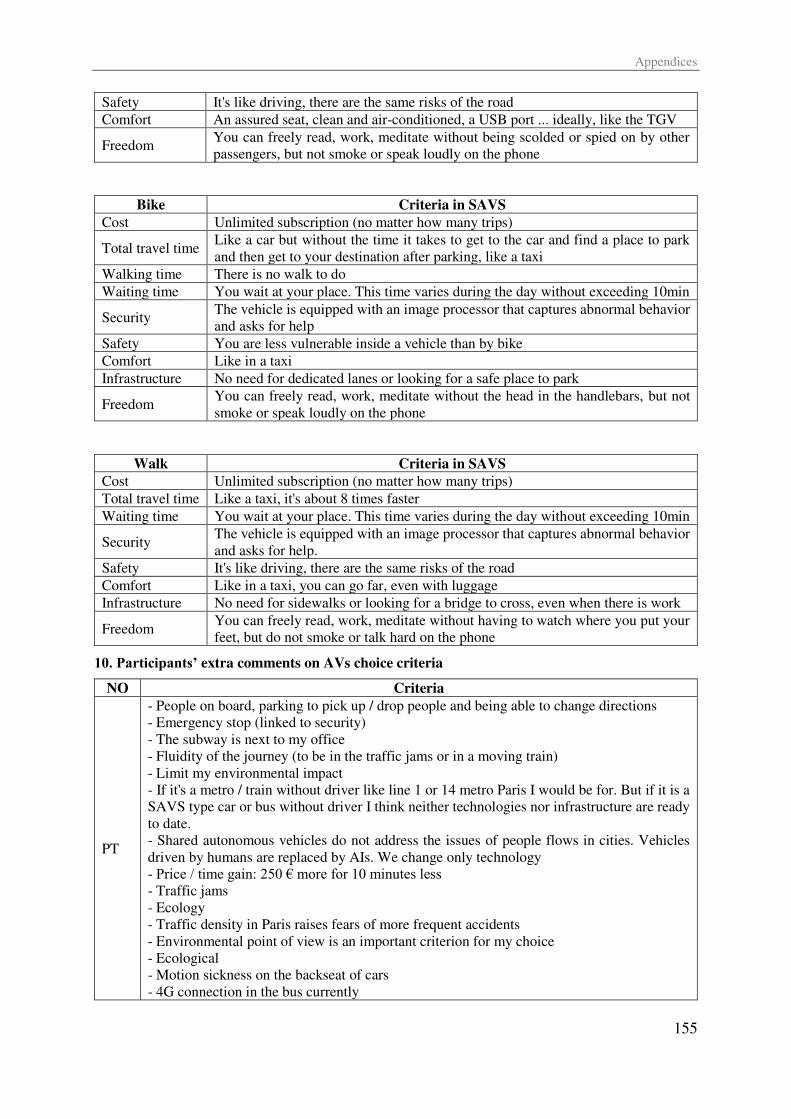
Appendices
155
Safety It's like driving, there are the same risks of the road
Comfort An assured seat, clean and air-conditioned, a USB port ... ideally, like the TGV
Freedom You can freely read, work, meditate without being scolded or spied on by other
passengers, but not smoke or speak loudly on the phone
Bike Criteria in SAVS
Cost Unlimited subscription (no matter how many trips)
Total travel time Like a car but without the time it takes to get to the car and find a place to park
and then get to your destination after parking, like a taxi
Walking time There is no walk to do
Waiting time You wait at your place. This time varies during the day without exceeding 10min
Security The vehicle is equipped with an image processor that captures abnormal behavior
and asks for help
Safety You are less vulnerable inside a vehicle than by bike
Comfort Like in a taxi
Infrastructure No need for dedicated lanes or looking for a safe place to park
Freedom You can freely read, work, meditate without the head in the handlebars, but not
smoke or speak loudly on the phone
Walk Criteria in SAVS
Cost Unlimited subscription (no matter how many trips)
Total travel time Like a taxi, it's about 8 times faster
Waiting time You wait at your place. This time varies during the day without exceeding 10min
Security The vehicle is equipped with an image processor that captures abnormal behavior
and asks for help.
Safety It's like driving, there are the same risks of the road
Comfort Like in a taxi, you can go far, even with luggage
Infrastructure No need for sidewalks or looking for a bridge to cross, even when there is work
Freedom You can freely read, work, meditate without having to watch where you put your
feet, but do not smoke or talk hard on the phone
10. Participants’ extra comments on AVs choice criteria
NO Criteria
PT
- People on board, parking to pick up / drop people and being able to change directions
- Emergency stop (linked to security)
- The subway is next to my office
- Fluidity of the journey (to be in the traffic jams or in a moving train)
- Limit my environmental impact
- If it's a metro / train without driver like line 1 or 14 metro Paris I would be for. But if it is a
SAVS type car or bus without driver I think neither technologies nor infrastructure are ready
to date.
- Shared autonomous vehicles do not address the issues of people flows in cities. Vehicles
driven by humans are replaced by AIs. We change only technology
- Price / time gain: 250 € more for 10 minutes less
- Traffic jams
- Ecology
- Traffic density in Paris raises fears of more frequent accidents
- Environmental point of view is an important criterion for my choice
- Ecological
- Motion sickness on the backseat of cars
- 4G connection in the bus currently
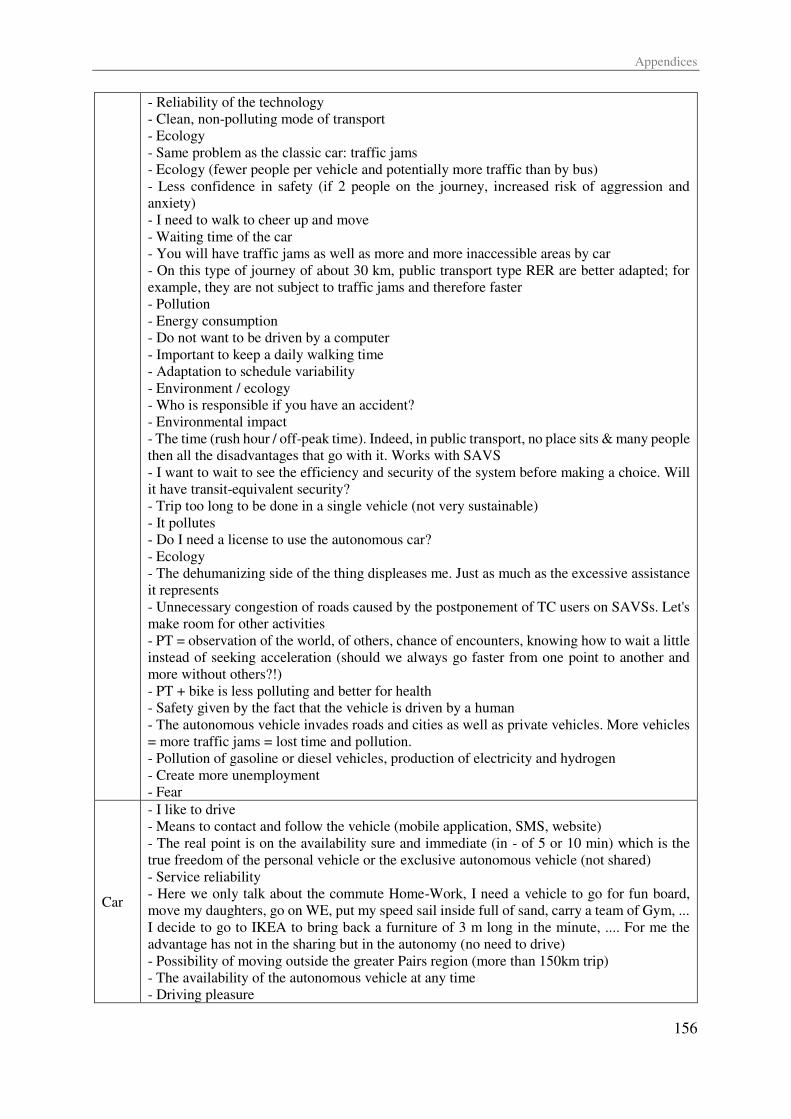
Appendices
156
- Reliability of the technology
- Clean, non-polluting mode of transport
- Ecology
- Same problem as the classic car: traffic jams
- Ecology (fewer people per vehicle and potentially more traffic than by bus)
- Less confidence in safety (if 2 people on the journey, increased risk of aggression and
anxiety)
- I need to walk to cheer up and move
- Waiting time of the car
- You will have traffic jams as well as more and more inaccessible areas by car
- On this type of journey of about 30 km, public transport type RER are better adapted; for
example, they are not subject to traffic jams and therefore faster
- Pollution
- Energy consumption
- Do not want to be driven by a computer
- Important to keep a daily walking time
- Adaptation to schedule variability
- Environment / ecology
- Who is responsible if you have an accident?
- Environmental impact
- The time (rush hour / off-peak time). Indeed, in public transport, no place sits & many people
then all the disadvantages that go with it. Works with SAVS
- I want to wait to see the efficiency and security of the system before making a choice. Will
it have transit-equivalent security?
- Trip too long to be done in a single vehicle (not very sustainable)
- It pollutes
- Do I need a license to use the autonomous car?
- Ecology
- The dehumanizing side of the thing displeases me. Just as much as the excessive assistance
it represents
- Unnecessary congestion of roads caused by the postponement of TC users on SAVSs. Let's
make room for other activities
- PT = observation of the world, of others, chance of encounters, knowing how to wait a little
instead of seeking acceleration (should we always go faster from one point to another and
more without others?!)
- PT + bike is less polluting and better for health
- Safety given by the fact that the vehicle is driven by a human
- The autonomous vehicle invades roads and cities as well as private vehicles. More vehicles
= more traffic jams = lost time and pollution.
- Pollution of gasoline or diesel vehicles, production of electricity and hydrogen
- Create more unemployment
- Fear
Car
- I like to drive
- Means to contact and follow the vehicle (mobile application, SMS, website)
- The real point is on the availability sure and immediate (in - of 5 or 10 min) which is the
true freedom of the personal vehicle or the exclusive autonomous vehicle (not shared)
- Service reliability
- Here we only talk about the commute Home-Work, I need a vehicle to go for fun board,
move my daughters, go on WE, put my speed sail inside full of sand, carry a team of Gym, ...
I decide to go to IKEA to bring back a furniture of 3 m long in the minute, .... For me the
advantage has not in the sharing but in the autonomy (no need to drive)
- Possibility of moving outside the greater Pairs region (more than 150km trip)
- The availability of the autonomous vehicle at any time
- Driving pleasure
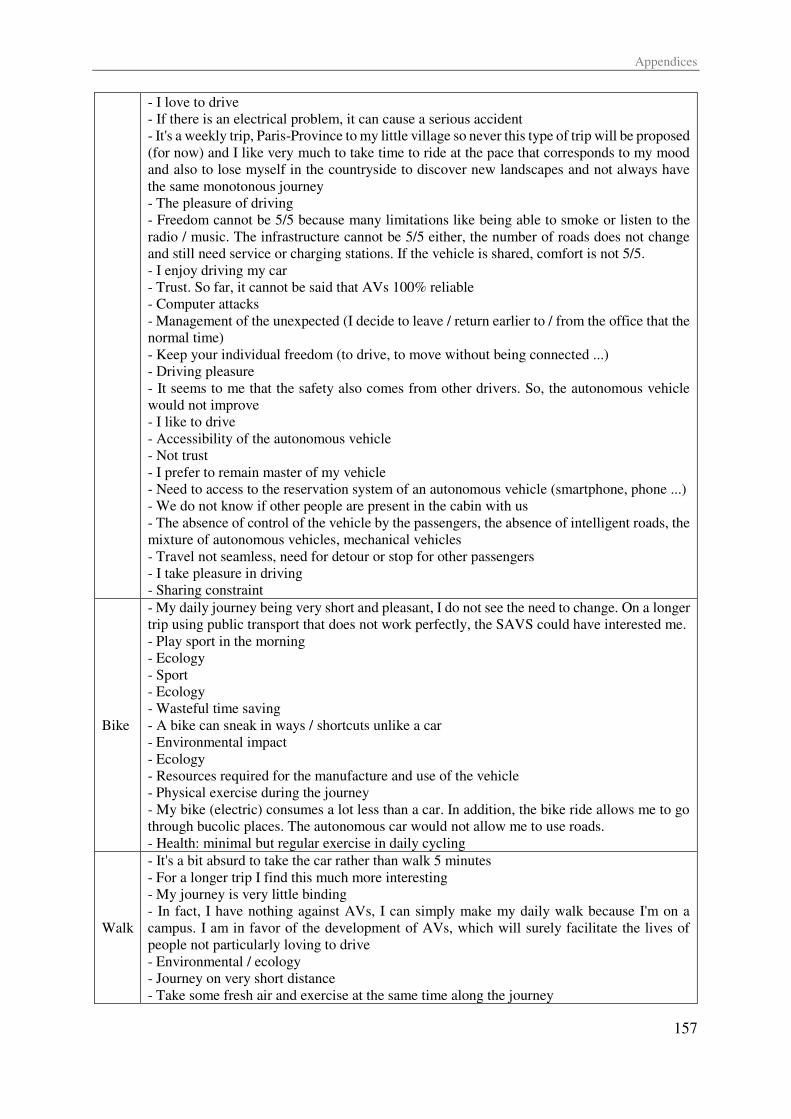
Appendices
157
- I love to drive
- If there is an electrical problem, it can cause a serious accident
- It's a weekly trip, Paris-Province to my little village so never this type of trip will be proposed
(for now) and I like very much to take time to ride at the pace that corresponds to my mood
and also to lose myself in the countryside to discover new landscapes and not always have
the same monotonous journey
- The pleasure of driving
- Freedom cannot be 5/5 because many limitations like being able to smoke or listen to the
radio / music. The infrastructure cannot be 5/5 either, the number of roads does not change
and still need service or charging stations. If the vehicle is shared, comfort is not 5/5.
- I enjoy driving my car
- Trust. So far, it cannot be said that AVs 100% reliable
- Computer attacks
- Management of the unexpected (I decide to leave / return earlier to / from the office that the
normal time)
- Keep your individual freedom (to drive, to move without being connected ...)
- Driving pleasure
- It seems to me that the safety also comes from other drivers. So, the autonomous vehicle
would not improve
- I like to drive
- Accessibility of the autonomous vehicle
- Not trust
- I prefer to remain master of my vehicle
- Need to access to the reservation system of an autonomous vehicle (smartphone, phone ...)
- We do not know if other people are present in the cabin with us
- The absence of control of the vehicle by the passengers, the absence of intelligent roads, the
mixture of autonomous vehicles, mechanical vehicles
- Travel not seamless, need for detour or stop for other passengers
- I take pleasure in driving
- Sharing constraint
Bike
- My daily journey being very short and pleasant, I do not see the need to change. On a longer
trip using public transport that does not work perfectly, the SAVS could have interested me.
- Play sport in the morning
- Ecology
- Sport
- Ecology
- Wasteful time saving
- A bike can sneak in ways / shortcuts unlike a car
- Environmental impact
- Ecology
- Resources required for the manufacture and use of the vehicle
- Physical exercise during the journey
- My bike (electric) consumes a lot less than a car. In addition, the bike ride allows me to go
through bucolic places. The autonomous car would not allow me to use roads.
- Health: minimal but regular exercise in daily cycling
Walk
- It's a bit absurd to take the car rather than walk 5 minutes
- For a longer trip I find this much more interesting
- My journey is very little binding
- In fact, I have nothing against AVs, I can simply make my daily walk because I'm on a
campus. I am in favor of the development of AVs, which will surely facilitate the lives of
people not particularly loving to drive
- Environmental / ecology
- Journey on very short distance
- Take some fresh air and exercise at the same time along the journey
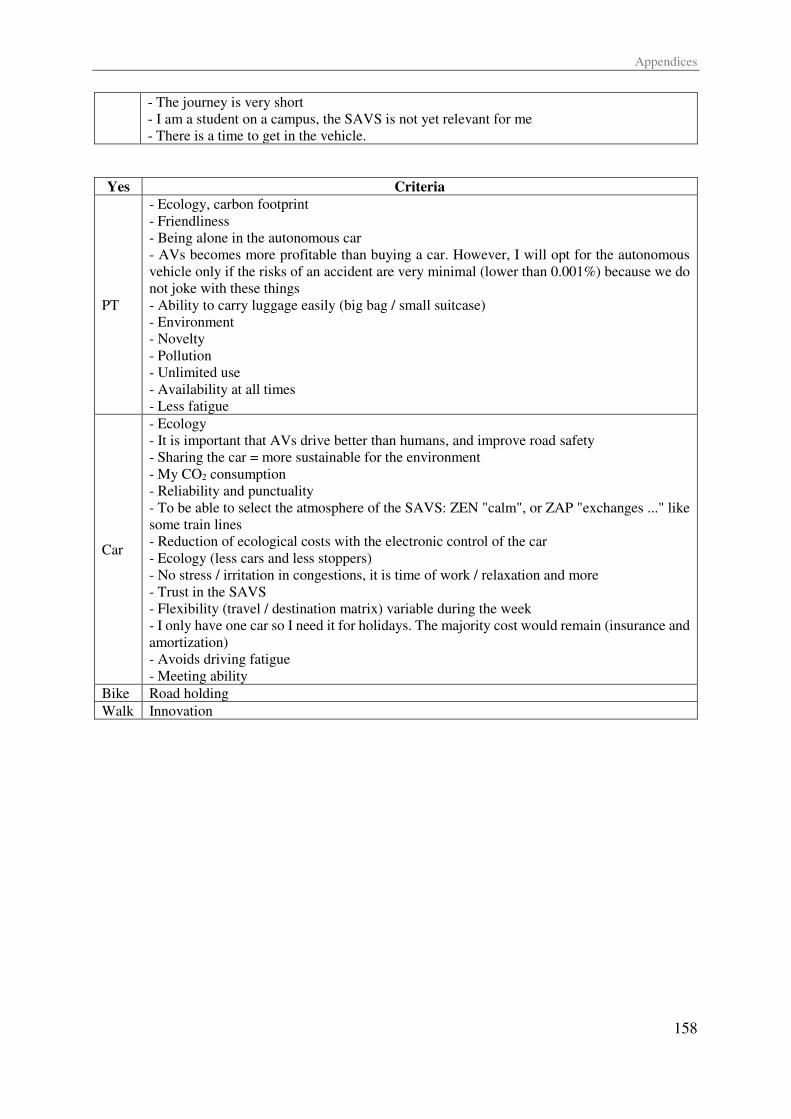
Appendices
158
- The journey is very short
- I am a student on a campus, the SAVS is not yet relevant for me
- There is a time to get in the vehicle.
Yes Criteria
PT
- Ecology, carbon footprint
- Friendliness
- Being alone in the autonomous car
- AVs becomes more profitable than buying a car. However, I will opt for the autonomous
vehicle only if the risks of an accident are very minimal (lower than 0.001%) because we do
not joke with these things
- Ability to carry luggage easily (big bag / small suitcase)
- Environment
- Novelty
- Pollution
- Unlimited use
- Availability at all times
- Less fatigue
Car
- Ecology
- It is important that AVs drive better than humans, and improve road safety
- Sharing the car = more sustainable for the environment
- My CO2 consumption
- Reliability and punctuality
- To be able to select the atmosphere of the SAVS: ZEN "calm", or ZAP "exchanges ..." like
some train lines
- Reduction of ecological costs with the electronic control of the car
- Ecology (less cars and less stoppers)
- No stress / irritation in congestions, it is time of work / relaxation and more
- Trust in the SAVS
- Flexibility (travel / destination matrix) variable during the week
- I only have one car so I need it for holidays. The majority cost would remain (insurance and
amortization)
- Avoids driving fatigue
- Meeting ability
Bike Road holding
Walk Innovation
Appendices
159
Personal publications Personal publications
For an up-to-date list of these publications, please check this link:
https://www.archives-ouvertes.fr/IRT-SYSTEMX/search/index/q/*/authIdHal_s/ouail-al-maghraoui
Journals
Al Maghraoui, O., Vallet, F., Puchinger, J., & Yannou, B. (2019). Modeling traveler experience for designing urban mobility systems. (Accepted in Design Science Journal)
Al Maghraoui, O., Vallet, F., Millonig, A., Puchinger, J., & Yannou, B. (submitted). Understanding urban travel problems: A grounded theory approach. (Submitted to Transportation Research Part A)
Al Maghraoui, O., Vallet, F., Puchinger, J., & Yannou, B. (submitted). Stimulating usage problem generation: An urban mobility case study. (Under revision in Design Studies Journal)
International conferences
Al Maghraoui, O., Vallet, F., Puchinger, J., & Yannou, B. (2017). Framing key concepts to design a
human centered urban mobility system. In International Conference on Engineering Design (ICED17) (Vol. 3, pp. 91–100). Vancouver, Canada.
Al Maghraoui, O., Vallet, F., Puchinger, J., & Yannou, B. (2017). Un cadre conceptuel pour concevoir
le système de mobilité urbaine. In Congrès International de Génie Industriel, CIGI17. Compiègne,
France.
Al Maghraoui, O., Vosooghi, R., Mourad, A., Kamel, J., Puchinger, J., Vallet, F., Yannou, B. (2019).
Shared Autonomous Vehicle Services and User’s Taste Variation: A Survey and Model Applications. (Submitted to EWGT 2019)
Appendices
160
Titre : Modéliser l'expérience voyageur pour concevoir la mobilité urbaine
Mots clés : mobilité urbaine, expérience voyageur, problèmes de voyage, génération de problèmes,
conception centrée sur l'humain, théorie ancrée
Résumé : Cette thèse aborde le défi de la
conception des systèmes de mobilité urbaine.
Elle vise à développer un modèle d’expérience-
voyageur pour faciliter, dans une démarche de
conception, le diagnostic des problèmes de
voyage et améliorer la pertinence des modèles
de transport pour les voyageurs. En combinant
les points de vue de la conception de
l’expérience-utilisateur et du transport, elle
contribue à approfondir la compréhension de
comment les voyageurs vivent leur voyage et
particulièrement des problèmes qu’ils rencontrent. Le premier axe d’investigation est lié à la modélisation de l’expérience-voyageur
pour alimenter un diagnostic pertinent et riche
des problèmes de voyage. Dans un deuxième
axe, les voyageurs sont impliqués, par une
démarche de théorie ancrée, pour identifier les
problèmes qu’ils rencontrent lors de l’utilisation de systèmes de mobilité urbaine au moyen de
stimuli appropriés.
Un troisième axe introduit des attributs
subjectifs de voyage dans des modèles de
transport afin d’améliorer leur précision
Cette recherche utilise la recherche-action
comme méthodologie. Elle combine revue de
littérature dans les disciplines de conception et
de transport, quatre observations terrain, quinze
interviews en profondeurs aves des voyageurs et
experts en transport, cinq ateliers de
problématisation, et deux expérimentations,
dans une amélioration cyclique des résultats.
Les différentes utilisations du modèle ont
permis un diagnostic approfondi de trois
systèmes de mobilité urbaine (train de banlieue,
bus à la demande, navette sur voie dédiée) et la
mise au point d'attributs centrés sur le voyageur
pour un modèle d’optimisation et une simulation multi-agents qui ont été testé par une enquête de
plus de 450 participants.
Title: Designing for Urban Mobility - Modeling the traveler experience
Keywords: urban mobility, traveler experience, travel problems, problem generation, human-
centered design, grounded theory.
Abstract: This thesis addresses the challenge of
designing urban mobility systems. It aims at
developing a traveler experience model to help
diagnose travel problems in a design approach
and improve the relevance of transportation
models for travelers. By combining the views of
user-experience design and transportation, it
helps to deepen the understanding of how
travelers experience their journey and especially
the problems they face. The first axis of
investigation is related to the modeling of the
traveler experience to feed a relevant and rich
diagnosis of travel problems. In the second axis,
travelers are involved, through a grounded
theory approach, to identify the problems they
encounter when using urban mobility systems,
using appropriate stimuli.
The third axis introduces travel subjective
attributes into transport models to improve their
accuracy.
This research used action research as a
methodology. It combines literature review in
design and transportation disciplines, four field
observations, fifteen in-depth interviews with
transport travelers and experts, five problem-
solving workshops, and two experiments, in a
cyclical improvement of results. The various
uses of the model have led to an in-depth
diagnosis of three urban mobility systems
(suburban train, on-demand bus, dedicated
shuttle) and the development of traveler-centric
attributes for an optimization model and a multi-
agent simulation that was tested by a survey of
over 450 participants.
Université Paris-Saclay
Espace Technologique / Immeuble Discovery
Route de l’Orme aux Merisiers RD 128 / 91190 Saint-Aubin, France


