Embed Size (px)
Citation preview

Deriving meaningful rules from gene expressiondata for classification
Nikhil Ranjan Pal, Animesh Sharma‡, Somitra Kumar Sanadhya{nikhil, animeshr, somitrar}@isical.ac.in
Electronics and Communication Sciences Unit, Indian Statistical Institute,203, B. T. Road, Calcutta - 700108, India.
Abstract
We propose a novel scheme for designing fuzzy rule based classifiers for gene expression data analysis. Aneural network based method is used for selecting a set of informative genes. Considering only these selected set ofgenes, we cluster the expression data with a fuzzy clustering algorithm. Each cluster is then converted into a fuzzyif-then rule, which models an area in the input space. These rules are tuned using a gradient descent technique toimprove the classification performance. The rule base is tested on a leukemia data set containing two classes and itis found to produce excellent results. The membership functions associated with the rules are then analyzed and therule base is further simplified without compromising the classification accuracy. The most attractive attributes of theproposed scheme are: it is an automatic extraction scheme; unlike other classifiers, it produces human interpretablerules, and it is not expected to give bad generalization as fuzzy rules do not respond to areas not represented bythe training data.
I. I NTRODUCTION
Improvements in tumor classification are central to precise and individualized therapeutic approaches.One of the most powerful techniques developed in Biotechnology is DNA Microarray [1]. UsingMicroarrays biologists are able to capture expression levels of almost all genes of the cell in a singleexperiment. The number of these genes is in thousands. Thus, it is definitely a major advancement inunderstanding cell processes. But since the data are in huge dimension and the number of instancestypically available is very limited, the classification of such data is a difficult task. The challenge isto gather meaningful information out of such high dimensional data to gain insight into the biologicalprocesses and to identify how their disturbance leads to various diseases [2]. This high dimensionalnature of microarray data and the limited number of exemplars make the task of designing classifiersdifficult because of the curse of dimensionality [3]. It is known that for a given problem all featuresthat characterize a data point may not be equally important. Moreover, use of more features is also notnecessarily good. For example, even if we are able to design a classifier using all gene expression values,it does not help to identify discriminating genes, the marker genes. We further emphasize that the use ofan appropriate set of features has a significant effect on the designed classifier and the influence alsodepends on the type of classifiers used.
Various supervised and unsupervised machine-learning methods have been employed for the analysisof gene expression samples based on gene expression patterns. In unsupervised analysis, since the goalis class discovery, the data are organized without using the class label information. Some examples ofunsupervised methods widely used in the analysis of expression data are hierarchical clustering [4],k-means clustering [5], [6] and self organizing feature maps (SOFM) [7]. Supervised analysis uses
‡ Corresponding Author
1
some external information, such as the disease status of the samples studied. The main objective ofsupervised analysis is to design classifiers that can be used to discriminate between classes to whichthe data belong. To design a classifier, typically, the data set is divided into a training set and a testset. The classifier is then trained on the training set and tested on the test set. Once, the test resultis found to be satisfactory, the classifier can be applied to data with unknown classification. Some ofthe popular supervised methods include k - nearest neighbor (k-NN) classification [8], support vectormachine (SVM) [9], and artificial neural networks (ANN) [10]. We summarize here some results fromthe literature on the leukemia data set as we shall use the same data set for our investigation. Toureet al. [11] reported 58.8% accuracy in predicting the class of leukemia cancer. For the same dataset, Cho et al. [12] used different mutually exclusive sets of features to design several classifiers andcombined them using a neural network. The results obtained by them using various classifiers variedbetween 58.5% and 100%. Min Su et al. [13] reported an accuracy of 76.5% and Ben-Dor et al. [14]reported recognition accuracy of 91.1% on the same data set. Mukherjee et al. [15] achieved 94.1%accuracy with top 5 genes selected on the basis of a feature selection method proposed for SVM classifiers.
Fuzzy rule based classifiers (FRBCs) have been used in various areas like remotely sensed imageanalysis [16] and medical diagnosis [17]. Although FRBCs have been applied to analyze gene expressiondata [18] , they have not been adequately exploited for such analysis. It may be noted that in [18]fuzzy sets are defined by experts. In the present study we propose a methodology to extract a set offuzzy rules for classification of expression data. It uses both supervised and unsupervised methods. Webegin with a set of features selected by an Online Feature Selection (OFS) scheme [19]. Our fuzzyrule extraction scheme uses a fuzzy clustering algorithm to partition the training data into a number ofclusters. Each cluster is then converted into a fuzzy rule. The rule base is then further refined using agradient based iterative scheme. We also demonstrate how some features selected by the OFS schemecan be eliminated without compromising classification accuracy. Unlike [18] we have not done anyexpert defined categorization of the expression levels to define fuzzy sets. Our scheme is a completelyautomated system which finds a set of optimally defined fuzzy sets. The classification performance ofthe FRBC is found to be similar to that of other classifiers, but simpler and easier to interpret. We applyour method to generate human interpretable rules from the two-category cancer expression data, acutemyeloid leukemia (AML) and acute lymphoblastic leukemia (ALL) [20]. Pre-determined test sets ofunseen cases are used for validation. This is one of the well-known data sets available for classificationof gene expression data [21], [22], [23], [24], [25]. The proposed system is able to classify the expressiondata with a good accuracy using only four rules defined just on four features.
II. M ATERIALS AND METHODS
We use a NN (Neural Network) to select a small set of feature and then use a fuzzy clustering algorithmto cluster the data set in the reduced dimension to extract prototypes for each class. Then these prototypesare used to generate set of fuzzy rules which is then refined to improve the classifier performance.
A. Data Set.
Learning the distinction between AML and ALL is a well-known and well-studied problem [20]. Thesetumors are often indistinguishable histologically but show significant differences in clinical behavior.Subclassification of these tumors based on their molecular profiles may help explain why these tumorsrespond so differently to treatment. Golub et al. [20] developed an innovative classification scheme forleukemia, analyzing microarray data based on neighborhood analysis. This strategy was able to distinguish

2
between AML and ALL with an accuracy of 94.1%. In this study we have used the same data set. The geneexpression intensities were obtained from Affymetrix high-density oligonucleotide microarrays, containing7219 probes. In this data set gene expression profiles have been constructed from 72 persons who haveeither ALL or AML. Each person has submitted one sample of DNA microarray, so that the databaseconsists of 72 samples. We have used thesame training-test partitionas used by Cho et al. [12] for a faircomparison with published results. The training data set consists of 38 bone marrow samples, containing27 ALL and 11 AML. The test data set contains 20 ALL and 14 AML cases. We note that this data sethas become a benchmark in the cancer classification community and hence we have used it [21], [22],[23], [24], [25].
B. Feature selection.
Feature selection techniques aim to reduce the feature space to a highly predictive subset of the space,i.e., they aim to discard the bad/ irrelevant features from the available set of features without loosing theaccuracy of prediction. The literature is quite rich in feature selection methodologies[26]. Some of thesemethods use neural networks, neuro-fuzzy systems [11], while others use fuzzy logic [27] or statisticaltechniques [26]. Other approaches to dimensionality reduction involves replacing the given set of featuresby a new but smaller set of computed features [28]. Here we have used a set of features selected by aneural network based feature selection method [19]. In a standard multilayer perceptron (MLP) network,the effect of some features (inputs) can be eliminated by not allowing them into the network, i.e., byequipping each input node (hence each feature) with a gate and closing the gate. For good features theassociated gates can be completely opened. On the other hand, if a feature is partially important, thenthe corresponding gate should be partially opened. Pal and Chintalapudi [11] suggested a mechanism forrealizing such a gate so thatuseful features can be identified and attenuated according to their relativeusefulness. In order to model the gates we associate a gate function to each node in the input layer ofthe MLP. A gate function should produce a value of 1 or nearly 1 for a good feature; while for a badfeature, it should be nearly 0. We call the network an Online Feature Selection (OFS) network. Furtherdetails of the scheme are given in the Appendix. This methodology was used by Pal et al. [19] for geneexpression data analysis.
C. Fuzzy clustering.
We use the above mentioned OFS network to select five features. We use these features and performfuzzy clustering using the Fuzzy c-means (FCM) clustering algorithm. The FCM may assign a data pointto more then one cluster to some degree. The degree to which a data point belong to a cluster is specifiedby a membership grade (Explained in Appendix). Fuzzy c-means has been successfully applied to variousareas including gene expression data [29]. LetXTR = XTR
AML
⋃XTR
ALL be the training data, whereXTRAML
represents the AML part of training data andXTRALL represents the ALL part of it. Suppose we want to
extractC1 andC2 rules respectively from the ALL and AML data. Then we clusterXTRALL into C1 and
XTRAML into C2 clusters. Deciding on the optimal number of clusters (rules) per class is related to the
cluster validity issue [30], which we do not pursue here. In this work we experimented with just twodifferent number of clusters (rules) for each class and found that 2 rules per class gives the best resultand hence we report the result with 2 rules per class.
D. Fuzzy rule based classifier.
A cluster found in the previous step represents a dense compact area in the data and the associatedcluster prototype quantizes the cluster. Ifv ∈ RP be a prototype representing a cluster of points

3
in RP , then we can describe the cluster by a set of pointsv ∈ RP satisfying “x CLOSE TO v”,where “CLOSE TO” is a fuzzy set. A prototype (representing a cluster of points)vi for classk can betranslated into a fuzzy rule of the formRi : If x is CLOSE TOvi then the class isk. The fuzzy setCLOSE TOv is further represented by a set ofp simpler atomic clauses:x1 is CLOSE TOv1 andx2 isCLOSE TOv2 and ..... andxp is CLOSE TOvp. Herev = (v1, v2, ......, vp)
T andx = (x1, x2, ......, xp)T .
In this way we get a set of initial rules. In general, the i-th rule representing one of the c classes takesthe form :x1 is CLOSE TOvi1 and.....andxp is CLOSE TOvip then the class isk. Here p is the numberof features and hence the number of atomic clauses. The fuzzy set CLOSE TOvij is modeled by aGaussian membership function:µij(xj : vij, σij) = exp
(−(xj − vij)
2/σ2ij
), although, other choice are
possible. We computeσij as the standard deviation of thejth component of the data points falling in theith cluster.
For a given data pointx, we first find the firing strength of each rule using the productT-norm:
αi(x) =j=p∏j=1
µij(xj : vij, σij).
Hereαi(x) is the firing strength of the i-th rule on a data pointx. This gives the degree of match betweenthe data pointx and the antecedent of the i-th rule. Now class label of the rule having the maximumfiring strength determines the class of the data pointx. Let l = argmax︸ ︷︷ ︸
i
{αi(x)}, and suppose thel-th
rule represents classc, thenx is assigned to classc.
E. Tuning of the Rule base.
The initial rule baseR0 thus obtained can be further tuned to achieve a better performance. Letx befrom class ’c’ andRc be the rule from class ’c’ giving the maximum firing strengthαc for x. Also letR¬c be the rule from the incorrect classes having the highest firing strengthα¬c for x. We use the errorfunction E forx, Ex = (1−αc + α¬c)
2 to train the rule base. This error function has been used by Chiu[31]. Our goal is to minimizeE =
∑Ex wherex ∈ XTR. To do this wereduceEx with respect tovcj,
v¬cj and σcj, σ¬cj of the two rulesRc and R¬c. This will refine the rules with respect to theircontextin the data space. Details of the rule updating procedure is given in the appendix. The performance ofthe classifier depends crucially on the adequacy of the number of features and the number of rules. Wediscover that the set of 5 genes selected by OFS scheme generates a few rules which can achieve 100%accuracy on the training set and 94.1% accuracy on the test data. These fuzzy rules, unlike SVM andMLP, are interpretable and have biological meaning thus are easy to interpret. Further analyzing at theserules extracted using 5 genes, we were able to cut down 1 gene. Thus using only 4 genes we could obtainsimpler rules without compromising the accuracy of the classifier.
III. R ESULTS
A. Generated Rules.
We discuss the effectiveness of FRBC for performing AML-ALL classification based on gene expressiondata used by Golub et al. [20]. We also demonstrate the elegance of these rules by demonstrating theirhuman interpretability, unlike theblack boxcharacteristics of NN and less interpretablehyperplaneofSVM. In connection with the leukemia data set, authors in [32] remark, “It contains 2 ALL samples thatare consistently misclassified or classified with low confidence by most methods”. There are a number

4
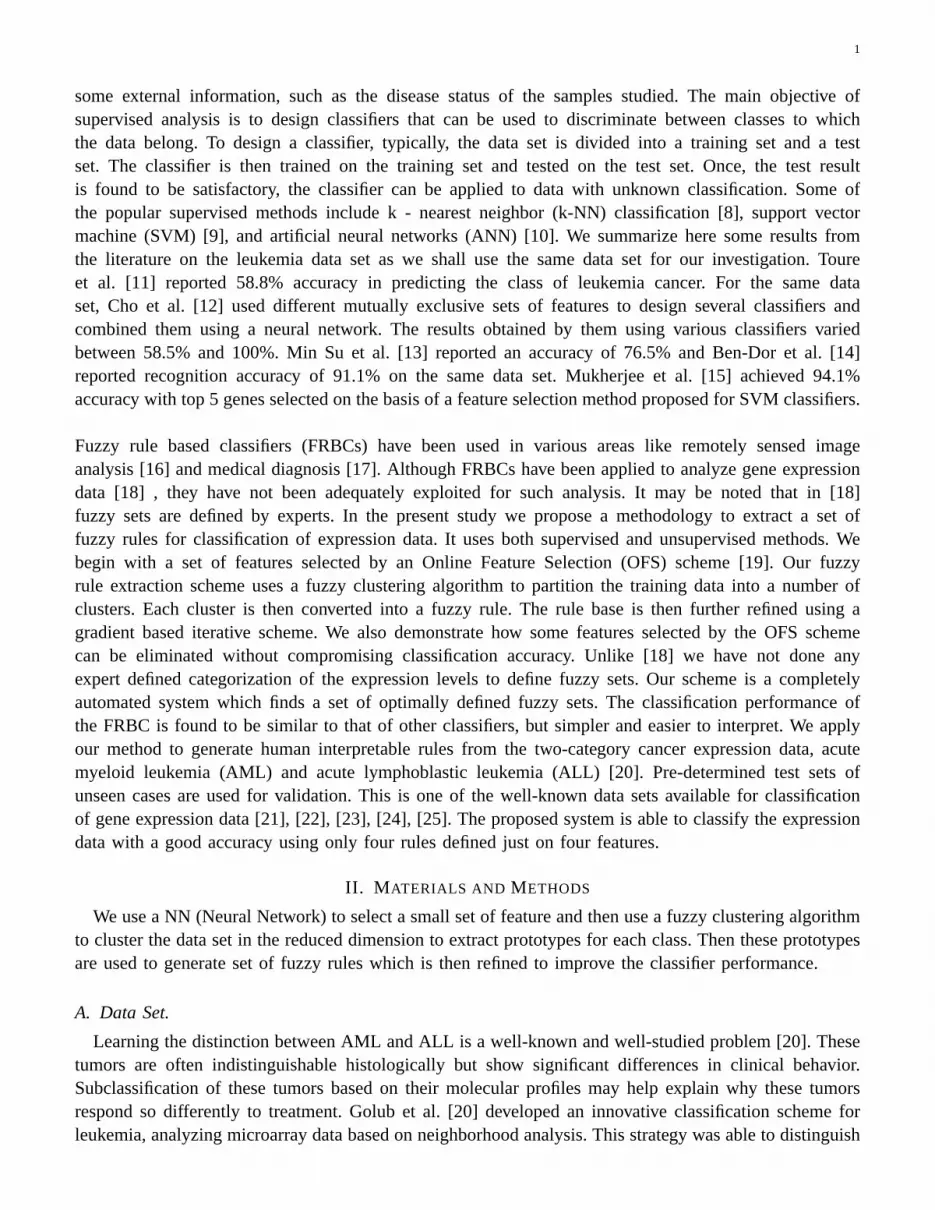
Fig. 1. Rules with 5 features.
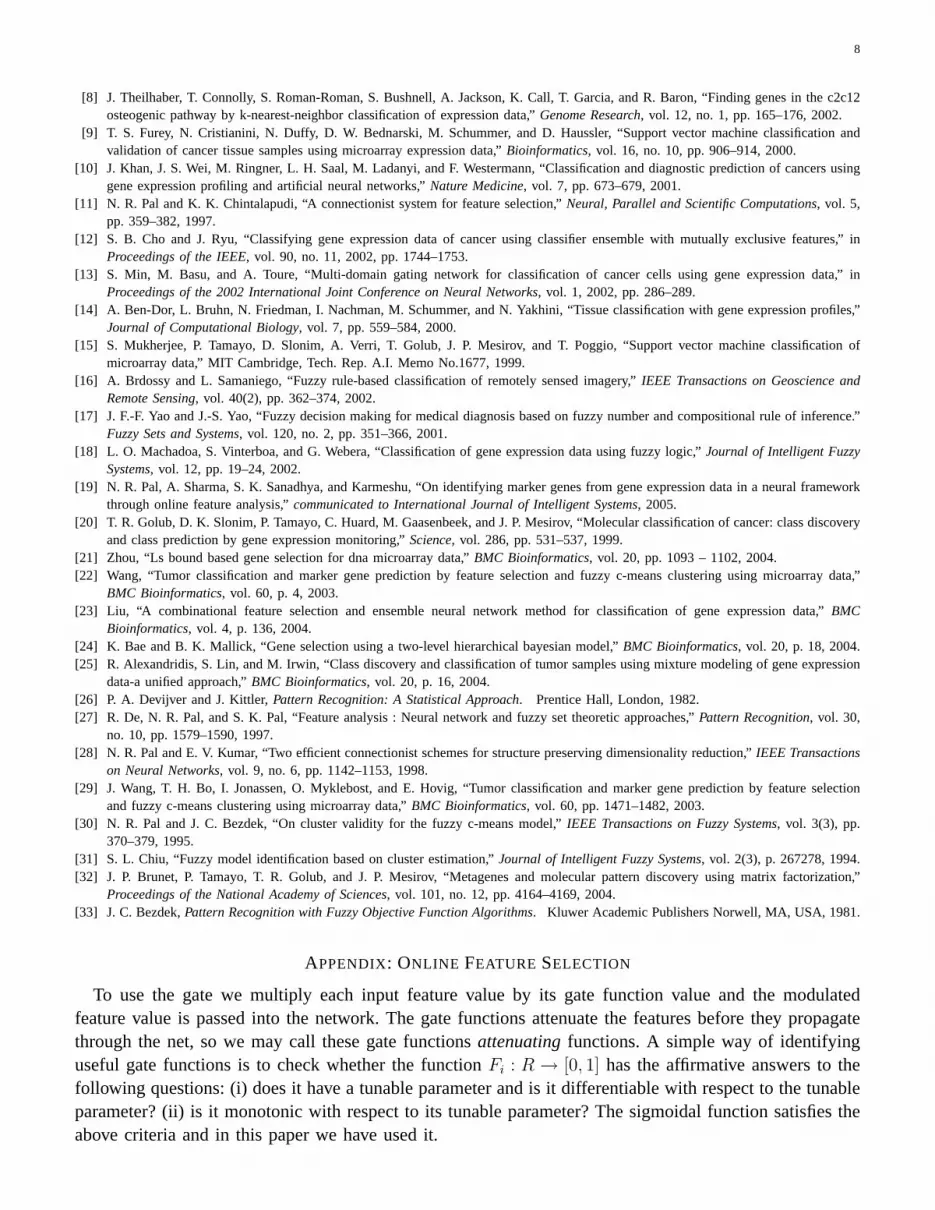
Fig. 2. Rules with 4 features.

5
TABLE I
FIVE BEST FEATURES SELECTED BYOFS,THEIR WITHIN-CLASS MEAN (µ) & STANDARD DEVIATION (σ) WITH SNR
Feature # GeneID Name µALL σALL µAML σAMLµAML−µALLσAML+σALL
1 3320 LTC4S U50136 978 319 2562 753 1.482 4847 Zyxin X95735 at 350 388 3024 1436 1.463 4052 Catalase EC1.11.1.6 1391 1351 4295 1664 0.964 4196 PRG1 X17042 1643 1741 7109 3020 1.155 1249 MCL1 L08246 at 1067 656 3767 1851 1.08
TABLE II
FIVE BEST FEATURES SELECTED BYOFS,THEIR M IN AND MAX VALUES IN TRAINING AND TEST DATA
Feature # GeneID Name Min (Training) Max (Training) Min (Test) Max (Test)1 3320 LTC4S U50136 64 3568 383 39652 4847 Zyxin X95735 at -428 7133 -674 62183 4052 Catalase EC1.11.1.6 318 8970 115 72604 4196 PRG1 X17042 33 10449 140 110035 1249 MCL1 L08246 at 128 7003 190 6718
of possible explanations for this, including incorrect diagnosis of the samples. Using FRBC, we couldclassify the AML-ALL with 94.1% test accuracy (only 2 misclassifications) in the 34 test samples usingfeatures 1,2,4 and 5 from the five features selected by OFS (Table I).
Using these features we generated 2 rules per class. Thus we come to a set of 20 fuzzy sets (2 for eachfeature per class). The rule base is then refined. The points correctly classified by these rule involving 20fuzzy sets are given in Table III. The number within ( ) gives the number of points incorrectly classifiedby the rule. Figure 1 gives a pictorial representation of the rules. Each panel in Figure 1 corresponds toone feature. All five fuzzy sets defining a rule are given a particular color. A careful inspection of Figure1 reveals that three of the fuzzy sets (in rules 2,3 and 4) defined on the third feature have almost thesame mean,i.e., they represent the same concept. So the third feature does not add discriminatory power
TABLE III
POINTS CLASSIFIED BY FOUR RULES INVOLVING20 FUZZY SETS ON FIVE FEATURES
Rule ALL Training AML Training ALL Test AML Test1 7 (0) 0 (0) 3 (0) 0 (0)2 20 (0) 0 (0) 17 (0) 0 (0)3 0 (0) 4 (0) 0 (0) 6 (1)4 0 (0) 7 (0) 0 (0) 6 (1)
TABLE IV
POINTS CLASSIFIED BY FOUR RULES INVOLVING16 FUZZY SETS ON FOUR FEATURES
Rule ALL Training AML Training ALL Test AML Test1 17 (0) 0 (0) 11 (0) 0 (0)2 10 (0) 0 (0) 9 (0) 0 (0)3 0 (0) 7 (0) 0 (0) 8 (1)4 0 (0) 4 (0) 0 (0) 4 (1)

6
TABLE V
POINTS CLASSIFIED BY FOUR RULES INVOLVING13 FUZZY SETS
Rule ALL Training AML Training ALL Test AML Test1 17 (0) 0 (0) 11 (0) 0 (0)2 10 (0) 0 (0) 9 (0) 0 (0)3 0 (0) 7 (0) 0 (0) 8 (1)4 0 (0) 4 (0) 0 (0) 4 (1)
TABLE VI
FOUR RULES WITH THEIR FUZZY SET DEFINITIONS
Rule Feature 1 Feature 2 Feature 4 Feature 5(Gene 3320) (Gene 4847) (Gene 4196) (Gene 1249)
1 Low Low Low Low2 Low-Med Low Low Low3 High-Med High High High4 High Medium Low-Med Medium
to rules 2,3 and 4. On the other hand, rule 1 is well separated from other rules by features 1,2,4 and 5.So the third feature may be dropped. Thus we experimented now with only 4 features and generated 2rules per class (Figure 2). The points classified by these four rules involving 16 fuzzy sets are given inTable IV. Table IV shows thus the overall performance remains the same. It is very much evident fromFigure 2, that this set of 16 fuzzy sets can be further reduced to a set of 13 fuzzy sets (4 fuzzy set onfeature 1 and 3 on each of features 2, 4 and 5 respectively), without compromising with the accuracy.So we do this simplification of the membership function and calculate the accuracy of the simplifiedrule base on the data set. Figure 3 displays the simplified rule base and Table V shows the classificationperformance. Table V shows that both training and test accuracies remain the same for the simplifiedrule base.
Next we try to attach human interpretable linguistic labels to each membership function involvedin the rule. Table II shows the minimum and maximum value of each of the five selected features on thetraining and test data sets. Analyzing the location of membership function defined on a variable on itsdomain, we assign the linguistic values like low, low-medium, high-medium and high. The rule base withthese meaningful linguistic values are shown in Table VI. Looking at Table IV and Table VI, we cansay: i) Low expression level of Gene 3320, 4847, 4196 and 1249 classifies the 17 and 11 ALL sample intraining and test data respectively, ii) Low expression level of Gene 4847, 4196 and 1249 with Low-Medexpression level of Gene 3320 classifies the 10 and 9 ALL sample in training and test data respectively,iii) High expression level of Gene 4847, 4196 and 1249 with High-Med expression level of Gene 3320classifies the 7 and 8 AML sample in training and test data respectively and iv) Medium expressionlevel of Gene 4847 and 1249 with Low-Med expression level of Gene 4196 and High expression levelof Gene 3320 classifies the 4 AML sample in training and test data. This elegantly demonstrates thephysical interpretability of rules derived from FRBC. This will also eliminate the technology dependentscaling errors [18].
IV. D ISCUSSION
We have proposed a method for gene expression data classification. Our method used a connectionistsystem to select five important features (genes). Then we used explorative data analysis to extract fuzzy

7
Fig. 3. The simplified rules with 13 fuzzy sets.
rules for classification based on the five selected features. Analyzing the membership functions extracted,we were able to remove one of the five selected features. We also simplified further the membershipfunctions (hence the rules). The extracted rules are easy to interpret and are not likely to produce badgeneralization because fuzzy rules do not respond to areas not represented in the training data. Since therule base can do an equally good job with only four features, one may wonder, did the NN method selecta bad feature? No. Because as we mentioned earlier, importance of a feature depends on both the problemand the tool used to solve that problem. So a feature which may be important for one classifier, maynot be that important for another classifier. Although, here we have intuitively assigned linguistic labelsto the membership function, in future we plan to use data analysis techniques to derive such labels. Wealso want to investigate effectiveness of the FRBC approach on features selected by other techniques. Wewould also like to explore FRBC on multi-class gene expression data and other bioinformatics problemssuch as protein fold prediction and phylogenetic analysis.
REFERENCES
[1] P. O. Brown and D. Botstein, “Exploring the new world of the genome with dna microarrays,”Nature Genetics, vol. 21, pp. 33–37,1999.
[2] M. Schena, R. A. Heller, T. P. Theriault, K. Konrad, E. Lachenmeier, and R. W. Davis, “Microarrays: biotechnology’s discovery platformfor functional genomics,”Trends in Biotechnology, vol. 16, no. 7, pp. 301–306, 1998.
[3] R. Bellman,Adaptive Control Processes: A Guided Tour. Princeton University Press, 1961.[4] M. B. Eisen, P. T. Spellman, P. O. Brown, and D. Botstein, “Cluster analysis and display of genome-wide expression patterns,”
Proceedings of the National Academy of Sciences, vol. 95, pp. 14 863–14 868, 1998.[5] J. A. Hartigan,Clustering Algorithms. John Wiley and Sons, New York, 1975.[6] S. Tavazoie, J. D. Hughes, M. J. Campbell, R. J. Cho, and G. M. Church, “Systematic determination of genetic network architecture,”
Nature Genetics, vol. 22, pp. 281–285, 1999.[7] P. Tamayo, D. Slonim, J. Mesirov, Q. Zhu, S. Kitareewan, and E. Dmitrovsky, “Interpreting patterns of gene expression with self-
organizing maps: methods and application to hematopoietic differentiation,”Proceedings of the National Academy of Sciences, vol. 96,pp. 2907–2912, 1999.
8
[8] J. Theilhaber, T. Connolly, S. Roman-Roman, S. Bushnell, A. Jackson, K. Call, T. Garcia, and R. Baron, “Finding genes in the c2c12osteogenic pathway by k-nearest-neighbor classification of expression data,”Genome Research, vol. 12, no. 1, pp. 165–176, 2002.
[9] T. S. Furey, N. Cristianini, N. Duffy, D. W. Bednarski, M. Schummer, and D. Haussler, “Support vector machine classification andvalidation of cancer tissue samples using microarray expression data,”Bioinformatics, vol. 16, no. 10, pp. 906–914, 2000.
[10] J. Khan, J. S. Wei, M. Ringner, L. H. Saal, M. Ladanyi, and F. Westermann, “Classification and diagnostic prediction of cancers usinggene expression profiling and artificial neural networks,”Nature Medicine, vol. 7, pp. 673–679, 2001.
[11] N. R. Pal and K. K. Chintalapudi, “A connectionist system for feature selection,”Neural, Parallel and Scientific Computations, vol. 5,pp. 359–382, 1997.
[12] S. B. Cho and J. Ryu, “Classifying gene expression data of cancer using classifier ensemble with mutually exclusive features,” inProceedings of the IEEE, vol. 90, no. 11, 2002, pp. 1744–1753.
[13] S. Min, M. Basu, and A. Toure, “Multi-domain gating network for classification of cancer cells using gene expression data,” inProceedings of the 2002 International Joint Conference on Neural Networks, vol. 1, 2002, pp. 286–289.
[14] A. Ben-Dor, L. Bruhn, N. Friedman, I. Nachman, M. Schummer, and N. Yakhini, “Tissue classification with gene expression profiles,”Journal of Computational Biology, vol. 7, pp. 559–584, 2000.
[15] S. Mukherjee, P. Tamayo, D. Slonim, A. Verri, T. Golub, J. P. Mesirov, and T. Poggio, “Support vector machine classification ofmicroarray data,” MIT Cambridge, Tech. Rep. A.I. Memo No.1677, 1999.
[16] A. Brdossy and L. Samaniego, “Fuzzy rule-based classification of remotely sensed imagery,”IEEE Transactions on Geoscience andRemote Sensing, vol. 40(2), pp. 362–374, 2002.
[17] J. F.-F. Yao and J.-S. Yao, “Fuzzy decision making for medical diagnosis based on fuzzy number and compositional rule of inference.”Fuzzy Sets and Systems, vol. 120, no. 2, pp. 351–366, 2001.
[18] L. O. Machadoa, S. Vinterboa, and G. Webera, “Classification of gene expression data using fuzzy logic,”Journal of Intelligent FuzzySystems, vol. 12, pp. 19–24, 2002.
[19] N. R. Pal, A. Sharma, S. K. Sanadhya, and Karmeshu, “On identifying marker genes from gene expression data in a neural frameworkthrough online feature analysis,”communicated to International Journal of Intelligent Systems, 2005.
[20] T. R. Golub, D. K. Slonim, P. Tamayo, C. Huard, M. Gaasenbeek, and J. P. Mesirov, “Molecular classification of cancer: class discoveryand class prediction by gene expression monitoring,”Science, vol. 286, pp. 531–537, 1999.
[21] Zhou, “Ls bound based gene selection for dna microarray data,”BMC Bioinformatics, vol. 20, pp. 1093 – 1102, 2004.[22] Wang, “Tumor classification and marker gene prediction by feature selection and fuzzy c-means clustering using microarray data,”
BMC Bioinformatics, vol. 60, p. 4, 2003.[23] Liu, “A combinational feature selection and ensemble neural network method for classification of gene expression data,”BMC
Bioinformatics, vol. 4, p. 136, 2004.[24] K. Bae and B. K. Mallick, “Gene selection using a two-level hierarchical bayesian model,”BMC Bioinformatics, vol. 20, p. 18, 2004.[25] R. Alexandridis, S. Lin, and M. Irwin, “Class discovery and classification of tumor samples using mixture modeling of gene expression
data-a unified approach,”BMC Bioinformatics, vol. 20, p. 16, 2004.[26] P. A. Devijver and J. Kittler,Pattern Recognition: A Statistical Approach. Prentice Hall, London, 1982.[27] R. De, N. R. Pal, and S. K. Pal, “Feature analysis : Neural network and fuzzy set theoretic approaches,”Pattern Recognition, vol. 30,
no. 10, pp. 1579–1590, 1997.[28] N. R. Pal and E. V. Kumar, “Two efficient connectionist schemes for structure preserving dimensionality reduction,”IEEE Transactions
on Neural Networks, vol. 9, no. 6, pp. 1142–1153, 1998.[29] J. Wang, T. H. Bo, I. Jonassen, O. Myklebost, and E. Hovig, “Tumor classification and marker gene prediction by feature selection
and fuzzy c-means clustering using microarray data,”BMC Bioinformatics, vol. 60, pp. 1471–1482, 2003.[30] N. R. Pal and J. C. Bezdek, “On cluster validity for the fuzzy c-means model,”IEEE Transactions on Fuzzy Systems, vol. 3(3), pp.
370–379, 1995.[31] S. L. Chiu, “Fuzzy model identification based on cluster estimation,”Journal of Intelligent Fuzzy Systems, vol. 2(3), p. 267278, 1994.[32] J. P. Brunet, P. Tamayo, T. R. Golub, and J. P. Mesirov, “Metagenes and molecular pattern discovery using matrix factorization,”
Proceedings of the National Academy of Sciences, vol. 101, no. 12, pp. 4164–4169, 2004.[33] J. C. Bezdek,Pattern Recognition with Fuzzy Objective Function Algorithms. Kluwer Academic Publishers Norwell, MA, USA, 1981.
APPENDIX: ONLINE FEATURE SELECTION
To use the gate we multiply each input feature value by its gate function value and the modulatedfeature value is passed into the network. The gate functions attenuate the features before they propagatethrough the net, so we may call these gate functionsattenuatingfunctions. A simple way of identifyinguseful gate functions is to check whether the functionFi : R → [0, 1] has the affirmative answers to thefollowing questions: (i) does it have a tunable parameter and is it differentiable with respect to the tunableparameter? (ii) is it monotonic with respect to its tunable parameter? The sigmoidal function satisfies theabove criteria and in this paper we have used it.

9
The basic philosophy of learning would be to keep all gates almost closed at the beginning of thelearning (i.e. no feature is important) and then open the gates as required during the training. To completethe description in connection with MLP, letFi be the gate or attenuation function associated with theith input feature.Fi has an argumentmi , F ′
i (mi) be the value of derivative of the attenuation functionat mi. Let µ be the learning rate of the attenuation parameter;ν be the learning rate of the connectionweights,xi be theith input of an input vectorx; x′i be the attenuated value ofxi, i.e., x′i = xiF (m); wo
ij
be the weight connecting thejth node of the first hidden layer to theith node of the input layer; andδ1j
be the error term for thejth node of the first hidden layer [11].It can be easily shown that except forw0
ij, the update rules for all weights remain the same as thatfor an ordinary MLP trained with backpropagation. Assuming that the first hidden layer has q nodes, theupdate rules forw0
ij andmi are :
w0ij,new = w0
ij,old − νxiδ1j F (mi) (1)
m0i,new = m0
i,old − µxi(Σqj=1w
0ijδ
1j )F
′(mi) (2)
As mentioned earlier, for the gate function, several choices are possible but we use here the sigmoidalfunctionF (w) = 1/(1+e−m). The p gate parameters are so initialized that when the training startsF (m)
is practically zero for all gates, i.e., no feature is allowed to enter the network. As the gradient descentlearning proceeds, gates for the features that can reduce the error faster are opened faster. The learningof the gate function continues along with other weights of the network. At the end of the training we canpick up important features based on the values of the attenuation function. Typically, the training can bestopped when the training error is reduced to an acceptable level. In this study we stopped the trainingwhen training error reduced to 0.00001 and misclassification became 0. Note that, different initializationsof the network may lead to different subsets of good features (genes). If this happens, this indicates thatthere are different sets of features that can do the classifier job equally well. One may rank the featuresbased on the extent the gates are opened and use a set of top ranked features. This is expected to do agood job because OFS looks at all the features at a time during the training process. Consequently, twoco-related features are not likely to appear as good features.
APPENDIX: THE FUZZY C-MEANS ALGORITHM
The Fuzzy C-Means (FCM) clustering algorithm [33] attempts to cluster data vectors intoC groupsbased on the distances between them.
The FCM algorithm minimizes the objective function
J =∑C
i=1
∑Nk=1 um
ik‖xk − vi‖2,
subset to ∑Ci=1 uik = 1 ∀ k = 1, 2, ..., N
and
0 <∑N
k=1 uik < N ∀ i = 1, 2, ..., C ,
whereC is the number of clusters,xk ∈ Rp is thekth data vector,N is the number of data vectors,m > 1 is the fuzzifier,uik denotes the membership ofkth data vector toith cluster andvi ∈ Rp is the

10
centroid of theith cluster.First order necessary conditions onU andV at a local minima ofJ are:
uik =
C∑j=1
(‖xk − vi‖‖xk − vj‖
) 2m−1
−1
, ∀i, k (3)
and
vi =
∑Nk=1 um
ikxk∑Nk=1 um
ik
, ∀i. (4)
The algorithm iterates between equations (4) and (3) in that order, as described below.
Algorithm:Fuzzy C-Means
1) Initialize a valid fuzzy c-partitionU = [uik]C×N .2) Compute a new set of prototypes using eq. (4).3) Compute a new partition matrix using eq. (3) with these new prototypes.4) Repeat this process ( Steps 2 and 3 alternately ) till the entries of the partition matrix stabilize.5) Defuzzification : Assign the data vectorxk to the cluster for which its membership valueujk is
largest.
The same procedure above can be carried out by initializing the prototypes instead of the partitionmatrix in which case the algorithm iterates between equations (3) and (4) in that order. The convergenceproperties remain the same under both schemes of initialization. As the value ofm increases the algorithmproduces more fuzzy partitions [33].
APPENDIX: TUNING OF THE RULE BASE.
Here we give an algorithmic description of the rule refinement algorithm when product is used tocompute the firing strength. The tuning process is repeated until the rate of decrease in E becomesnegligible. When product is used to compute the firing strength, the rule refinement algorithm is asfollows:
BeginChoose learning parametersηm andηs
Choose a parameter reduction factor0 < ε < 1
Choose the maximum number of iterations,maxiter.Compute the errorE0 for the initial rule baseR0.Compute the misclassificationM0 corresponding to initial rule baseR0.
t← 1
While ( t ≤ maxiter) doFor each vectorx ∈ X
Find the rulesRc andR¬c.Modify the parameters of rules and as follows.
For k=1 to p

11
vnewck = vold
ck − ηm∂E
∂voldck
= voldck + ηm(1− αc + α¬c)
αc
σoldck
2 (xk − voldck )
vnew¬ck = vold
¬ck − ηm∂E
∂vold¬ck
= vold¬ck − ηm(1− αc + α¬c)
α¬c
σold¬ck
2 (xk − vold¬ck)
σnewck = σold
ck − ηs∂E
∂σoldck
= σoldck + ηs(1− αc + α¬c)
αc
σoldck
3 (xk − voldck )2
σnew¬ck = σold
¬ck − ηs∂E
∂σold¬ck
= σold¬ck − ηs(1− αc + α¬c)
α¬c
σold¬ck
3 (xk − vold¬ck)
2
End ForEnd ForCompute the errorEt for the new rule baseRt.Compute the misclassificationMt for Rt.If Mt > Mt−1 or Et > Et−1
thenηm ← (1− ε)ηm
ηs ← (1− ε)ηs
Rt ← Rt−1
/* If the error is increased, then possibly thelearning coefficients are too large. So, decreasethe learning coefficients and restore the rule base toRt . */
If Mt = 0 or Et = 0
then Stopt← t + 1
End whileEnd
At the end of the rule base tuning we get the final rule baseRfinal which is expected to give a verylow error rate. Since a Gaussian membership function is extended to infinity, for any data point all ruleswill be fired to some extent. In our implementation, if the firing strength is less than a threshold, (0.01),then the rule is not assumed to be fired. If no rule is fired by a data point, then that point can be thoughtof as an outlier. If this happens for some test data, then that will indicate an observation not close enoughto the training data and consequently no conclusion should be made about such test points.


