Embed Size (px)
Citation preview
PROJECT REPORT ON(16MBAPR407)
A STUDY ON BUDGETARY CONTROL OF BHARAT ELECTRICALS LTD. BANGALORE
BY
JAMUNA N S(1AZ16MBA25)
Submitted to
VISVESVARAYA TECHNOLOGICAL UNIVERSITY,BELAGAVI
In partial fulfilment of the requirements for the award of the degree ofMASTER OF BUSINESS ADMINISTRATION
Under the Guidance of
INTERNAL GUIDE EXTERNAL GUIDEDr. Prakash B Yaragol Mrs. Sudha Professor DGM IMD BEL, Bangalore
Department of MBAAcharya Institute of Technology
Soldevanahalli, Hesarghatta Main Road, Bangalore-107
MAY 2018
Ref. No.493/18-19 W //..klt:fa-6" w du;;n! iF, _...... ...., ~
-...oil·- t91RO ~1/(ffd:.,N
\:.~RNING ANo BHARAT ElECTRONICS
~ \; /)~/,. ~0 ~ ~ O,o " ~ $ ~ (J BHARAT ELECTRONICS, BENGALURU- 560 013 ~
This is to Certify that
SrL/ Smt. /Kum ................ ~~~.~.r.~~.~.~ .................................................................. ..
student of ....... ~~~~.~.:.~.~~~!.~~~~~ .. ?.~.~~~~~~.~~.~.:. ............................................. .. ............ ~~~.~.~.~~.~~ ..................................................... carrLed out Project Work
on ... ~.~T.':'.'?.:..~~.~~~g.~n.~~.~~~.~!-l.r?.~~.T~.~.'!'.f9.~T.9.~ ............................................... .
....................................................................... in .......... ~~~~N~~ ................................. .
SBU/ CSG of our OrganLsatlon, from .................. u.-.O.l.-.20.1~ ....................... ..
to ....... ~!!:.C?~~-~9;1;~ ........................................................................................ .
He I She was regular and punctual Ln hLs !her attendance and hLs I her
conduct was satLifactory during the period.
q I SUDHA GOVINDARAJAN
209407, o.lf.Jr. 1 DGM Fcr~t~- .
209723 Dy. MAf\:t.GE!l (HR/ClD)
ACHARYA INSTITUTE OF TECHNOLOGY
lAffiliatedto Visvesvaraya Technological University, Belagavi, Approved by AICTE, New Delhi and Accredited byNBA and NAAC)
Date: 19/05/2018
CERTIFICATE
This is to certify that Ms. Jamuna N S bearing USN 1AZ16MBA25 is
a bonafide student of Master of Business Administration course of the
Institute 2016-18 batch, affiliated to Visvesvaraya Technological University,
Belgaum. Project report on "A Study on Budgetary Control of Bharat
Electricals Limited Bangalore" is prepared by her under the guidance of
Dr. Prakash B Yaragol in partial fulfillment of the requirements for the
award of the degree of Master of Business Administration, Visvesvaraya
Technological University, Belgaum, Karnataka.
~" ~(~{sf,_., i f Signature of Internal Guide
~
Signature of Principal PRINC!j-J.:.\L
ACHARYA INSTITUTE OF TEt~ni~OLOGY '"ioldevanahalli Bangalore-560 107
Acharya Dr Sarvepalli Radhakrishnan Road, Soladevanahalli, Acharya P.O., Bangalore 560 107. Karnataka, India • www.acharya.ac.m/ait/ • Ph: +91 -80-225 555 55 Extn.: 2102 • Fax: +91-80-237 002 42 • E-mail: [email protected]
DECLARATION
I JAMUNA N S Hereby declares that the project report entitled A study on Budgetary
Control of Bharat Electronics Limited, Bangalore prepared by me under the guidance of
Dr. Prakash B Yaragol of M.B.A Department ACHARYA INSTITUTE OF
TECHNOLOGY and external assistance by Mrs. Sudha (DGM) and Mrs.Prathibha (DM)
also declares that this project work is towards the partial fulfilment of the university
regulations for the awards of degree of Master of Business Administration in Visveswaraya
Technological University Belgaum. I have undergone a project for the period of ten weeks. I
further declare that this project is based on the original study undertaken by me and not has
submitted for the award of any degree/ diploma from any other university/institution.
Place: t30\ n J ~ l 097e.
Date: ~8 - 05 - {) DIB
Jamuna N.S.
1AZ16MBA25
ACKNOWLEDGEMENT
I would like to thank all of those who have helped and supported me in completing this
project successfully.
Firstly, I thank Dr. S. C. Pilli Principal Dr. Mahesh Dean Academics and Dr. Nijaguna G.
Head of the department of MBA of Acharya Institution of Technology for giving
encouragement and support for completing the project.
I wish to pay my heartfelt respect and regards to Mrs. Sudha, Deputy General Manager and
Mrs. Prathibha, Assistant General Manager of Finance / B & C, Bharath Electronics
Limited, Bangalore, for the cooperation and support, which helped me successfully to
accomplish my project work. Also, I am thankful to them for their valuable guidance given to
me during the course of my project.
I take this opportunity to thank our internal guide Dr. Prakash B Yaragol for his constant
guidance in completing the project.
Finally, it gives me great pleasure to extend my thanks to my Parents, Family, Friends and all
Teaching staff and Non-Teaching staff who have been instrumental either directly or
indirectly for this constant encouragement in carrying out this project successfully.
Place: JAMUNA N S
Date: (1AZ16MBA25)
TABLE OF CONTENTS
Chapter No. Contents Page No.
Declaration
Acknowledgement
Certificate by the Company
Certificate by the College
List of Tables
List of Graphs
Executive Summary
1
1 Introduction
Industry profile
Company profile
Vision, Mission & Quality Policy
Products / services profile
Areas of operation
Promoters
Future growth prospects
Infrastructure facilities
Competitors’ information
SWOT Analysis
Financial Highlights
2
4
5
6
7
7
7
8
8
9
10
2 Conceptual Background and Literature Review
Theoretical background of the study
Literature review
11
23
3 Research Design
Statement of the problem
Need for the study
Objectives
Scope of the study
Research methodology
Limitations
27
27
27
28
28
29
4 Data Analysis and interpretation 30
5 Summary of Findings, Suggestions and Conclusion
Findings
Suggestions
Conclusion
83
84
85
Bibliography
Annexures
LIST OF TABLES
Table no. Particulars Page Nos.
1 Table showing Value of production 38
2 Table showing Sales and services 38
3 Table showing Total income 39
4 Table showing Total expenditure 40
5 Table showing Profit before tax 40
6 Table showing Own funds 50
7 Table showing Net fixed asset 51
8 Table showing current assets 51
9 Table showing Current liability and provision 52
10 Table showing Net inventory 57
11 Table showing Inflow of cash 66
12 Table showing outflow of cash 66
13 Table showing Net cash to/from company 67
14 Table showing Gross R&D expenditure 71
15 Table showing Foreign exchange expenses 74
LIST OF GRAPHS
Graph No. Particulars Page Nos.
1 Graph Showing Value of production 38
2 Graph Showing Sales and services 39
3 Graph Showing Total income 39
4 Graph Showing Total expenditure 40
5 Graph Showing Profit before tax 41
6 Graph Showing Own funds 50
7 Graph Showing Net fixed asset 51
8 Graph showing current assets 51
9 Current liability and provision 52
10 Graph Showing Net inventory 58
11 Graph Showing Inflow of cash 66
12 Graph showing outflow of cash 67
13 Graph Showing Net cash to/from company 67
14 Graph Showing Gross R&D expenditure 71
15 Graph Showing Foreign exchange expenses 74
1
EXECUTIVE SUMMARY
Budgetary control is a critical viewpoint for the improvement of any organization since it gives measuring
stick by which the genuine execution is measures. It causes the best administration to take proper choice
to propel and coordinating their staff towards well set designs and goals of the organization. Budgetary
control is a most effective device to the administration for playing out its capacity like figuring the plans,
planning the exercises and controlling the activities and so on adequately and in addition productively.
The examination was embraced on BUDGETARY CONTROL to decide the proficiency and adequacy of
budgets in BHARAT ELECTRONICS LIMITED.
Bharat Electronics Limited is a state owned public venture, began on 1954 at Bangalore under the
Ministry of Defence, Government of India. It was built up to meet the particular requirements of the
Indian defence services, offering an extensive variety of defence items for Indian armed force, naval force
and aviation based armed forces.
In this project an exertion has been made to examine the viability of the budgetary control framework
took after by BEL. The goal is to think about the Budgeting procedure and Budgetary control framework
and to recognize the reasons, which have prompted the deviations if any in the ways and techniques by
which the deviation can be stayed away from later on course of business.
The methodology adopted is descriptive research. The examination was led through gathering essential
information as dialog with concerned people and auxiliary information was acquired from organizations
Budget manuals, Annual records and company site.
This undertaking contains data with respect to different kinds of budget relating to BEL, Bangalore. It
covers all sort of budget prepared at BEL to be specific Revenue budgets like Operating Estimates
budgets, Inventory budgets, cash budgets, research and development budgets, foreign exchange budgets,
projected balance sheet and Capital budgets.
As the budget is assuming a critical part in any organization which contrasts the actual performance and
the budgeted performance, this investigation uncovers the implication of budgetary control and
furthermore give the data about the diverse parts of budget.
2
CHAPTER 1
INTRODUCTION
INDUSTRY PROFILE
DEFENCE AND AEROSPACE INDUSTRY IN INDIA
DEFENCE INDUSTRY OF INDIA
The Defence Industry of India is a deliberately imperative segment in India. With quality of more than 1.3
million dynamic faculty, it is world's third biggest military power and has the world's biggest volunteer
armed force. India has the third biggest military on the world and is the 6th greatest defence spender. The
'Make in India' activity by the Government is concentrating its endeavours on expanding indigenous
defence manufacturing and getting to be independent. The Department of defence Production (DDP) was
set up in November 1962 with the goal of building up a thorough generation framework to deliver the
weapons/frameworks/stages/hardware's required for defence. Throughout the years, the Department has
built up far reaching generation offices for different defence equipment’s through the Ordnance Factories
and Defence Public Sector Undertakings (DPSUs).
Make in India
The Modi government in its first year cleared 39 capital acquirement recommendations, of which 32
propositions worth ₹899 billion (US$ 14 billion) (or 96% of significant worth aggregate
recommendations) were ordered as Buy (India) and Buy and make (India)- the best two organized
household industry-driven acquisition classes according to the Defence Procurement Procedure(DPP).
In July 2015, the defence service facilitated export regulations and quit requesting different confirmations
on end-use from foreign governments notwithstanding available to be purchased of parts by Indian
entities.
There are a few Indian SMEs that oblige the Defence business by providing sub-congregations and
segments and giving administrations like system integration. Under the make in India activity, these
associations are set to improve their assembling and advancement productivity, in this manner adding to
making India independent in defence generation. A portion of the frameworks Integrators obliging the
Defence area in India are Mistral Solutions, Alpha Designs, Astra Microwave and SLN Technologies
among others.
AEROSPACE INDUSTRY OF INDIA
The Indian aeronautic trade is seeing an unpredictable development. Indian Air Force is on a direction of
modernisation and is changing itself into a vital aviation control with full-range ability. Capacity
improvement through new acquisitions, supplanting of out of obsolete equipment with cutting edge
enlistments and update of inheritance weapon stages has been taken up to reinforce operational potential
and adequacy. Prospective acceptances of the Rafale air ship, assault helicopters, overwhelming lift
3
helicopters, compel enhancers, Surface to Air Guided Weapon (SAGW) and Air Defence Radars, hold
awesome guarantee for future. Additionally, it has involved incredible national pride, to usher in the
principal Tejas squadron of the IAF. At the same time, Air craft framework modernisation program and
up-degrees in communication network have fortified the help structure for compelling operation. While
undertaking its modernisation, the IAF has played a dynamic and maintained part in the "Make in India"
design, to take forward indigenous generation of battle airplane, helicopters, weapon sensors and systems,
other than other flight gear. A vibrant and prospering domestic aeronautics capacity would give key
military freedom and lift economic development.
Independence in aerospace sectors is a noteworthy key outcome region for the IAF. Endeavour’s in field
of R&D and in addition producing sectors have been ventured up, keeping in mind the end goal to
decrease dependence on foreign sources. To give a lift to 'Make in India' activity and accomplish self-
reliance in defence manufacturing sector, most astounding need has been given to equipment manufacture
in India.
Make in India: Modernisation design is being sought after with a plan to offer driving force to
indigenisation and to augment the defence producing base and the eco framework. IAF has as of now
identified series of defence product that can be produced under 'Make in India'. Ministry of Defence is
additionally considering to incorporate the private sector manufacturing defence products, assembling of
Ka226 T helicopters, suitable contender fighter aircraft and so on which will offer driving force to 'Make
in India' activity and this has produced huge enthusiasm among worldwide defence elements to begin
manufacturing in India. This won't just produce work and improve ability level, yet in addition help with
outfitting key innovations for development of defence division in the nation.
4
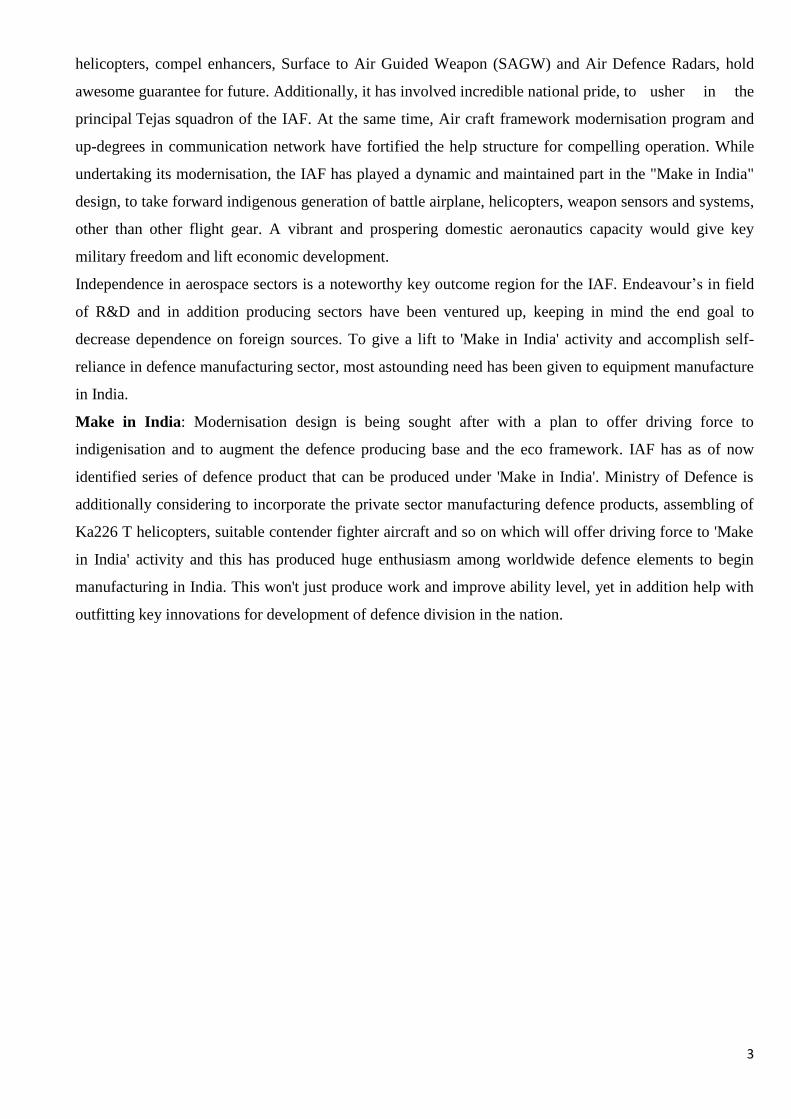
COMPANY PROFILE
COMPANY NAME BHARATH ELECTRONICS LIMITED
TRADED AS BSE: 500049
NSE: BEL
INDUSTRY AEROSPACE & DEFENCE
FOUNDED BANGALURU, KARNATAKA, INDIA IN
(1954)
HEADQUARTERS BANGALURU, KARNATAKA, INDIA
NUMBER OF LOCATIONS NINE MANUFACTURING UNITS
LOCATED IN INDIA
KEY PEOPLE M V GOWTAMA (CHAIRMAN & CEO)
PRODUCTS AVIONICS, RADARS, WEAPONS
SYSTEMS, C41 SYSTEMS,
ELECTRONIC VOTING MACHINES,
ETC.
OWNER GOVERNMENT OF INDIA
OVERSEAS OFFICE SINGAPORE, NEWYORK
PLANT SIZE (BANGALORE) 700 ACRES (BG.CX)
History of BEL
In 1954, in a recently independent India, the need was most extreme to create indigenous industry. The
fantasy of a self-reliance India provided for some Public Sectors Undertakings. BEL was one such dream,
which has made some amazing progress from that point forward with the far-located vision of its
pioneers, the commitment and diligent work of its representatives, support and confidence of its clients
and the government of India. The Government's clarion calls for 'Make in India' reverberates with what
BEL has been effectively improving the situation more than 6 decades.
Beginning from a solitary unit in Jalahalli, Bangalore, BEL has built up its quality the nation over by
setting up eight different Units – in Ghaziabad, Pune, Machilipatnam, Panchkula, Kotadwara, Navi
Mumbai, Chennai and Hyderabad. Every Unit has a particular item blend and client center. BEL has set
up wide system workplaces and administration focuses countrywide and in addition two abroad
workplaces at New York and Singapore.
BEL was built up to meet the particular electronic hardware prerequisites of the Indian Defense
administrations. While this keeps on being its prime concentration, the Company has a critical nearness in
the civilian market, as well. BEL exports portion of its items and administrations to various nations too.
5
BEL has likewise been laying extraordinary accentuation on Research and Development appropriate from
the early years. It has additionally possessed the capacity to effectively accomplice as production agency
with numerous DRDO labs. From a small turnover of ₹.2 lakhs in 1956-57, BEL has developed complex
to record a turnover of 7,510 crores(provisional) in 2015-16.
BEL isn't just a fruitful business story yet in addition an association which administers to individuals and
society. Indeed, even before the term 'Corporate social' Responsibility picked up cash, BEL has embraced
countless CSR exercises and keeps on doing them with a ton of energy and duty. BEL has setup education
institution, including an exceptional school for the mentally challenged. It has likewise set up hospitals,
expressive arts clubs and games offices. These and other welfare activities guarantee an employee and for
their representatives. A portion of these offices additionally serve the local community. BEL is as of now
focusing on promoting education, sanitation, social insurance, rural improvement, employment and
upgrading professional aptitudes, while guaranteeing environment maintainability.
'clean and green' is valid for each Unit of BEL. Worry for the earth is obvious in the lavish greenery in
every one of the Units. A forestation, emanating treatment, utilized water reusing, generation and
utilization of bio gas, rainwater harvesting, green structures, setting up and utilizing wind energy and
solar energy power plants, to give some examples, are a portion of the exercises toward this path.
VISION
“TO BE A WORLD-CLASS ENTERPRISE IN PROFESSIONAL ELECTRONICS.”
MISSION
“TO BE A CUSTOMER FOCUSED, GLOBALLY COMPETITIVE COMPANY IN DEFENCE
ELECTRONICS AND IN OTHER CHOSEN AREAS OF PROFESSIONAL ELECTRONICS,
THROUGH QUALITY, TECHNOLOGY AND INNOVATION.”
VALUES
Putting customers first.
Working with straightforwardness, validity and respectability.
Trusting and with respect to individuals.
Fostering collaboration.
Striving to achieve high labourer satisfaction.
Encouraging versatility and improvement.
Endeavouring to fulfil social commitments.
Proud of being a bit affiliation
OBJECTIVES
To be a buyer focused establishment providing state-of-the-art products & solutions at competitive
values, meeting the demands of quality, distribution & service.
6
To deliver internal resources for valuable advancement.
To achieve inventive expert in Défense Electronics through in-house R&D, Organization with
monitor/ask about research focuses and academic establishments.
To offer trust to export.
To create a facilitating environment for employees to realise their full potential through
continuous learning & team work.
To persistently benchmark association's execution with best-in-class all around.
To raise promoting abilities to overall standards.
To try freedom through indigenisation
QUALITY POLICY
We are dedicated to constantly deliver enhanced value to our clients, through continual enhancement of
our products and processes.
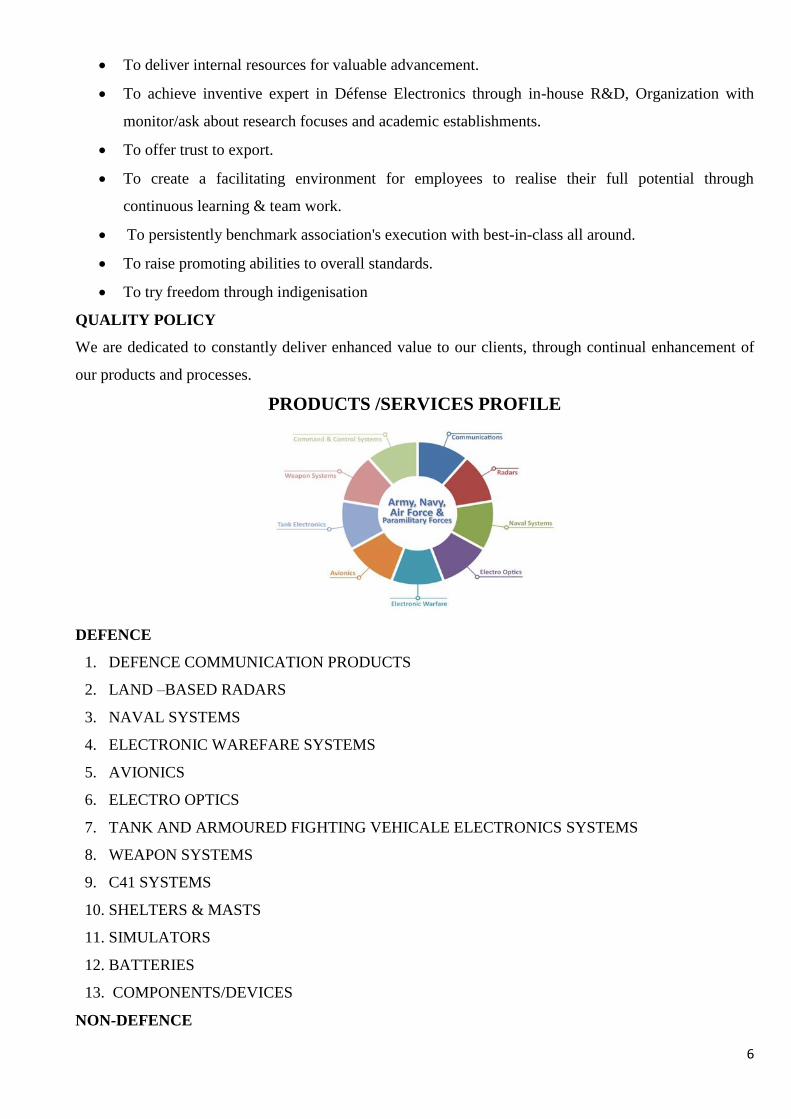
PRODUCTS /SERVICES PROFILE
DEFENCE
1. DEFENCE COMMUNICATION PRODUCTS
2. LAND –BASED RADARS
3. NAVAL SYSTEMS
4. ELECTRONIC WAREFARE SYSTEMS
5. AVIONICS
6. ELECTRO OPTICS
7. TANK AND ARMOURED FIGHTING VEHICALE ELECTRONICS SYSTEMS
8. WEAPON SYSTEMS
9. C41 SYSTEMS
10. SHELTERS & MASTS
11. SIMULATORS
12. BATTERIES
13. COMPONENTS/DEVICES
NON-DEFENCE
7
1. E-GOVERNANCE SYSTEMS
2. HOMELAND SECURITY
3. CIVILIAN RADARS
4. TURNKEY PROJECTS
5. COMPONENTS/DEVICES
6. TELECOM, BROADCAST SYSTEMS
AREAS OF OPERATION
Manufacturing Units of BEL
1. BANGALORE
2. GHAZIABAD
3. PUNE
4. MACHILIPATNAM
5. PANCHKULA
6. CHENNAI
7. KOTDWARA
8. HYDERABAD
9. NAVI MUMBAI
SUBSIDIARYS OF BEL
1. BEL Optronic Devices Limited
2. BEL-Thales Systems Limited
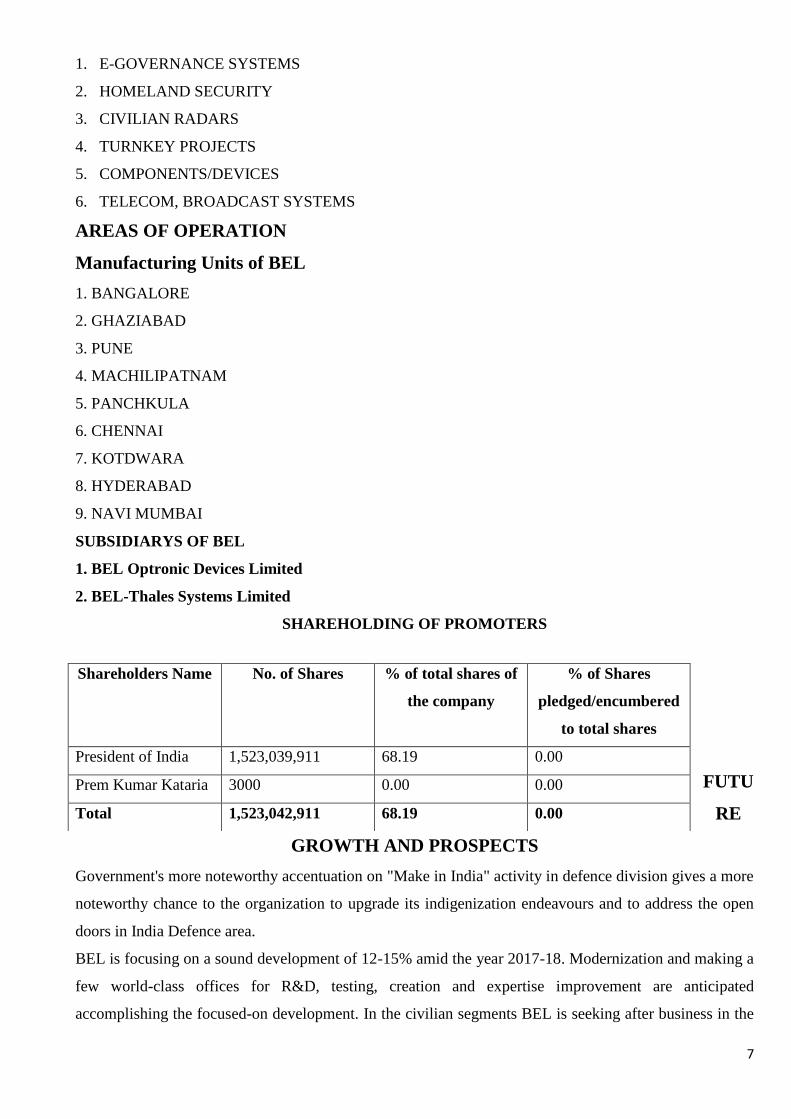
SHAREHOLDING OF PROMOTERS
FUTU
RE
GROWTH AND PROSPECTS
Government's more noteworthy accentuation on "Make in India" activity in defence division gives a more
noteworthy chance to the organization to upgrade its indigenization endeavours and to address the open
doors in India Defence area.
BEL is focusing on a sound development of 12-15% amid the year 2017-18. Modernization and making a
few world-class offices for R&D, testing, creation and expertise improvement are anticipated
accomplishing the focused-on development. In the civilian segments BEL is seeking after business in the
Shareholders Name No. of Shares % of total shares of
the company
% of Shares
pledged/encumbered
to total shares
President of India 1,523,039,911 68.19 0.00
Prem Kumar Kataria 3000 0.00 0.00
Total 1,523,042,911 68.19 0.00
8
field of Solar Energy, Homeland Security, Smart City components, Smart Cards, Cyber Security,
Telecom and Space Electronics. The defence sectors are being opened up for private segment investment
with advancements of defence acquirement method. The legislature is additionally arranging presentation
of "strategic partnership" show for more extensive investment of private division and furthermore to
improve the limits in real defence stage producing notwithstanding DPSUs. This has pushed the
organization towards considerably higher intensity and efficiency through activities for improving worth
expansion. It is critical for BEL to remain side by side of innovation and grow new products consistently.
The organization is additionally laying more noteworthy accentuation on working intimately with DRDO
labs, other research foundation and academic establishments and also niche technology organizations for
improvement of new products and frameworks.
INFRASTRUCTURE FACILITIES
BEL being a public-sector undertaking has great infrastructure facility. It has set up great infrastructure
and assembling offices in their 9 ISO Certified Production Units around the nation. BEL's Bangalore
Complex, traverses a region of 700 sections of land and housed state of art hardware for doing
configuration, assembling and testing of items. It includes great foundation inside the workplace with
modem machines, which causes the laborers to work effectively with new innovation. The Centre for
Learning and Development (CLD) has a decent library with the most recent books, diaries kept up to
International Standards in different fields. The organization has all around kept up preparing corridors.
The organization runs very much prepared containers to give lunch, snacks and so on, to the employees.
All around prepared First Aid confines all offices. Two Medical focuses/rescue vehicle room is situated
inside the manufacturing plant, effective transport office is given in all movements to employees, a
quarter's offices, all around prepared both indoor and open-air stadium, school and school offices to the
children of workers. A crèche with every single present-day office has been accommodated the advantage
of the children of women employees working in BEL
Modernisation and Expansion of infrastructure & facility:
The organization has been contributing altogether towards modernisation and development of its
infrastructure to meet the business needs of the organization. BEL is intending to spend around ₹2,500
Crores in next 3-4 years as a component of limit development and modernisation of it offices in
accordance with the development designs. A portion of the significant projects incorporate Defence
Systems Integration Complex at Palasamudram, EO producing office at Nimmaluru and EW test run at
Irahimpatnam and so on.
COMPETITORS FOR BHARAT ELECTRONICS LTD
Larsen & Toubro.
Tata Advance Systems.
Tata Power SED.
9
Mahindra Defence Land Systems.
Reliance Defence and Engineering Limited.
SWOT ANALYSIS
STRENGTHS
Established Defence Electronics player in India
Good picture and reputation
Good dedicated mentalities
Strong multi layered in-house R&D for development and new thing progression
Joint progression with development partners for equal advances
Committed work compel with incredible structure and amassing workplaces
Well-developed structures and strategies including ERP
Decades of experience achieving excellent space learning and focus abilities in Defence
equipment
Wide product run with strong thing reinforce mastermind
Strong relationship with prepared Services, Defence labs and government associations
Loyal customer base
Active picking up from domestic and outside accomplices
Experience and capacity in executing considerable and complex systems mix wanders
Financially strong and always advantage making
Long term duty with respect to customers
WEAKNESSES
Gaps in a segment of the new development regions
Conservative approach in Business Development and displaying
Dependence on Defence promote
OPPORTUNITIES
Growing Defence and Security needs
Government's highlight on Make in India for make of assurance kinds of apparatus
Growing Defence spending assignment towards modernisation and refresh programs
Growing openings in Maintenance, Repair, Overhaul and Upgrade programs
Increased boost on modernisation of central paramilitary forces
THREATS
Increasing contention from Indian private industry and foreign OEMs joining their JVs in Defence
part
10
Rapid changes in advancement
Difficulty in sourcing couple of fundamental advances
Policy interventions favouring private territory
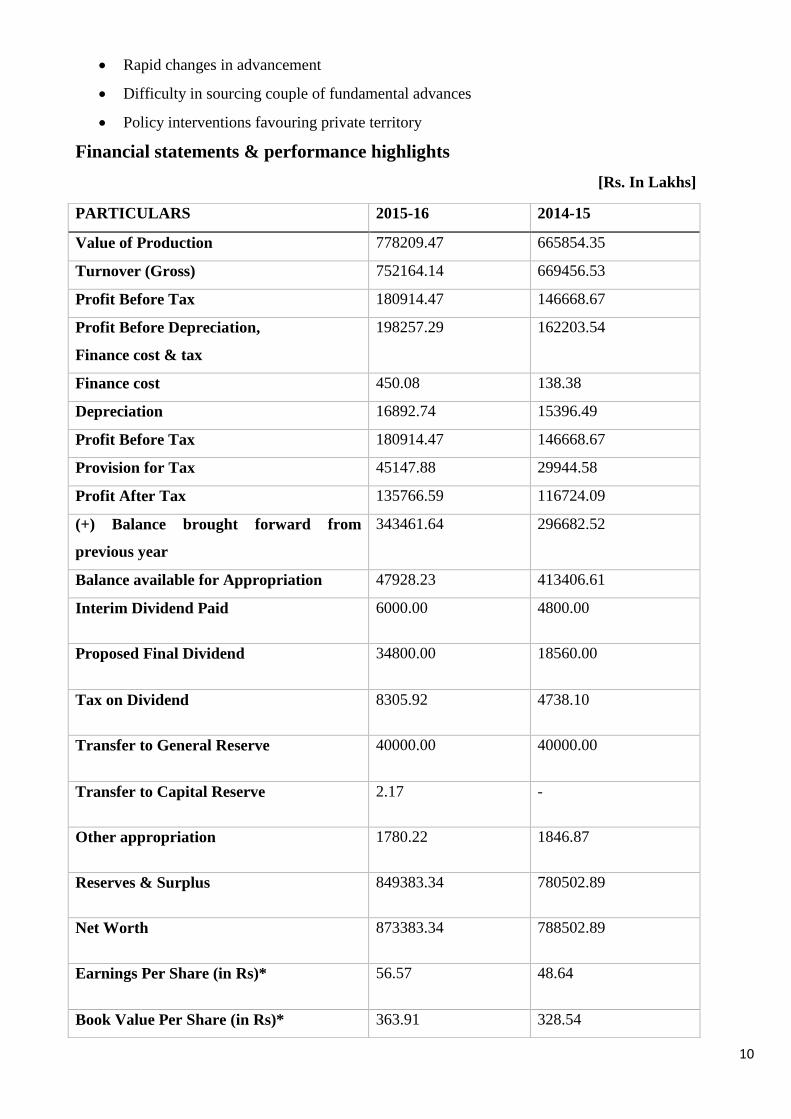
Financial statements & performance highlights
[Rs. In Lakhs]
PARTICULARS 2015-16 2014-15
Value of Production 778209.47 665854.35
Turnover (Gross) 752164.14 669456.53
Profit Before Tax 180914.47 146668.67
Profit Before Depreciation,
Finance cost & tax
198257.29 162203.54
Finance cost 450.08 138.38
Depreciation 16892.74 15396.49
Profit Before Tax 180914.47 146668.67
Provision for Tax 45147.88 29944.58
Profit After Tax 135766.59 116724.09
(+) Balance brought forward from
previous year
343461.64 296682.52
Balance available for Appropriation 47928.23 413406.61
Interim Dividend Paid 6000.00 4800.00
Proposed Final Dividend 34800.00 18560.00
Tax on Dividend 8305.92 4738.10
Transfer to General Reserve 40000.00 40000.00
Transfer to Capital Reserve 2.17 -
Other appropriation 1780.22 1846.87
Reserves & Surplus 849383.34 780502.89
Net Worth 873383.34 788502.89
Earnings Per Share (in Rs)* 56.57 48.64
Book Value Per Share (in Rs)* 363.91 328.54
11
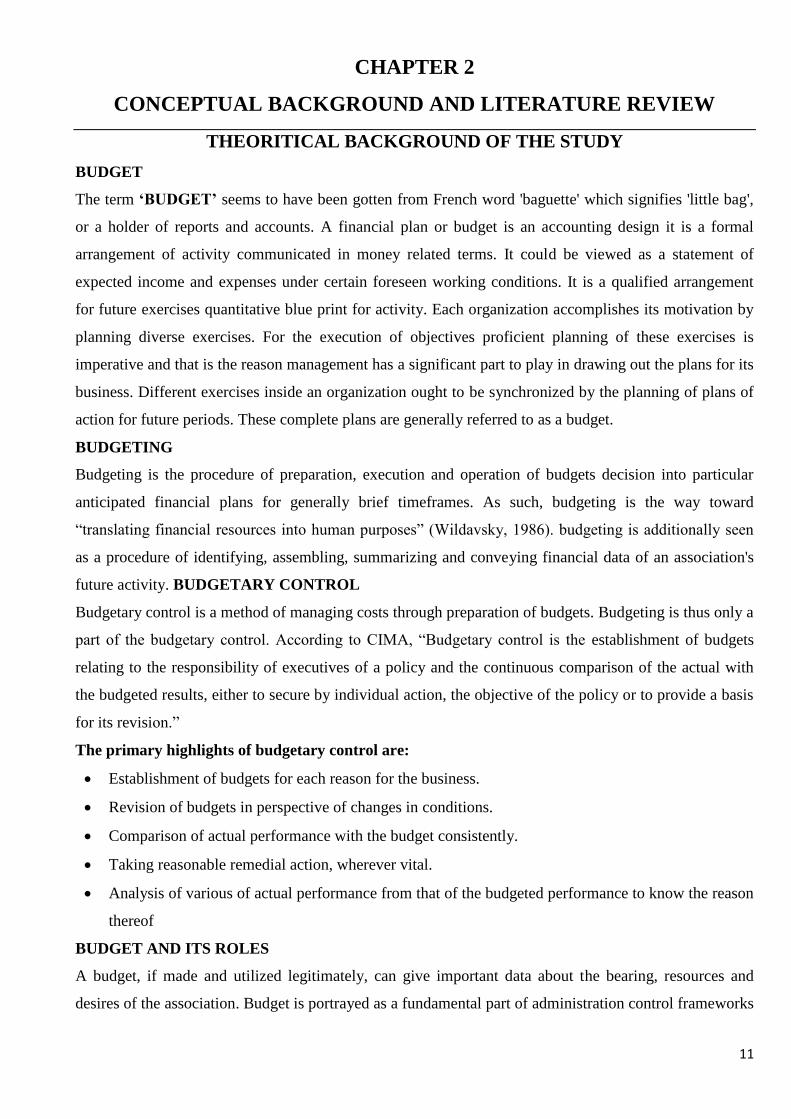
CHAPTER 2
CONCEPTUAL BACKGROUND AND LITERATURE REVIEW
THEORITICAL BACKGROUND OF THE STUDY
BUDGET
The term ‘BUDGET’ seems to have been gotten from French word 'baguette' which signifies 'little bag',
or a holder of reports and accounts. A financial plan or budget is an accounting design it is a formal
arrangement of activity communicated in money related terms. It could be viewed as a statement of
expected income and expenses under certain foreseen working conditions. It is a qualified arrangement
for future exercises quantitative blue print for activity. Each organization accomplishes its motivation by
planning diverse exercises. For the execution of objectives proficient planning of these exercises is
imperative and that is the reason management has a significant part to play in drawing out the plans for its
business. Different exercises inside an organization ought to be synchronized by the planning of plans of
action for future periods. These complete plans are generally referred to as a budget.
BUDGETING
Budgeting is the procedure of preparation, execution and operation of budgets decision into particular
anticipated financial plans for generally brief timeframes. As such, budgeting is the way toward
“translating financial resources into human purposes” (Wildavsky, 1986). budgeting is additionally seen
as a procedure of identifying, assembling, summarizing and conveying financial data of an association's
future activity. BUDGETARY CONTROL
Budgetary control is a method of managing costs through preparation of budgets. Budgeting is thus only a
part of the budgetary control. According to CIMA, “Budgetary control is the establishment of budgets
relating to the responsibility of executives of a policy and the continuous comparison of the actual with
the budgeted results, either to secure by individual action, the objective of the policy or to provide a basis
for its revision.”
The primary highlights of budgetary control are:
Establishment of budgets for each reason for the business.
Revision of budgets in perspective of changes in conditions.
Comparison of actual performance with the budget consistently.
Taking reasonable remedial action, wherever vital.
Analysis of various of actual performance from that of the budgeted performance to know the reason
thereof
BUDGET AND ITS ROLES
A budget, if made and utilized legitimately, can give important data about the bearing, resources and
desires of the association. Budget is portrayed as a fundamental part of administration control frameworks
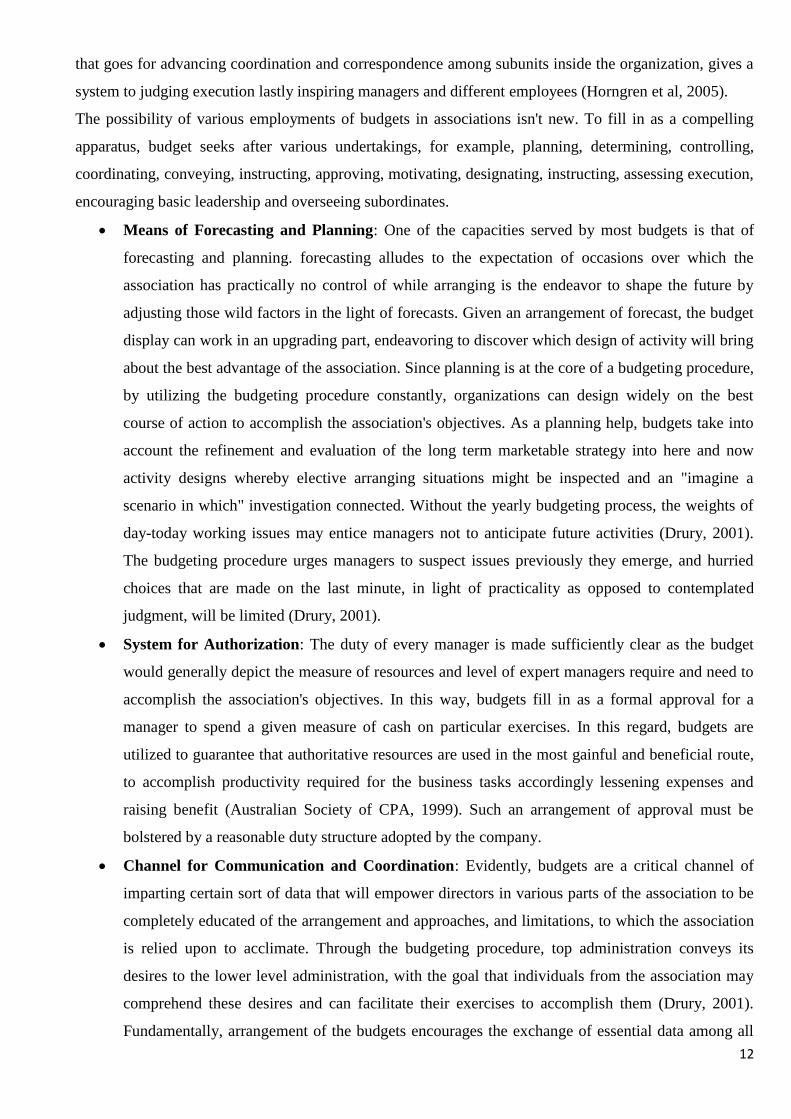
12
that goes for advancing coordination and correspondence among subunits inside the organization, gives a
system to judging execution lastly inspiring managers and different employees (Horngren et al, 2005).
The possibility of various employments of budgets in associations isn't new. To fill in as a compelling
apparatus, budget seeks after various undertakings, for example, planning, determining, controlling,
coordinating, conveying, instructing, approving, motivating, designating, instructing, assessing execution,
encouraging basic leadership and overseeing subordinates.
Means of Forecasting and Planning: One of the capacities served by most budgets is that of
forecasting and planning. forecasting alludes to the expectation of occasions over which the
association has practically no control of while arranging is the endeavor to shape the future by
adjusting those wild factors in the light of forecasts. Given an arrangement of forecast, the budget
display can work in an upgrading part, endeavoring to discover which design of activity will bring
about the best advantage of the association. Since planning is at the core of a budgeting procedure,
by utilizing the budgeting procedure constantly, organizations can design widely on the best
course of action to accomplish the association's objectives. As a planning help, budgets take into
account the refinement and evaluation of the long term marketable strategy into here and now
activity designs whereby elective arranging situations might be inspected and an "imagine a
scenario in which" investigation connected. Without the yearly budgeting process, the weights of
day-today working issues may entice managers not to anticipate future activities (Drury, 2001).
The budgeting procedure urges managers to suspect issues previously they emerge, and hurried
choices that are made on the last minute, in light of practicality as opposed to contemplated
judgment, will be limited (Drury, 2001).
System for Authorization: The duty of every manager is made sufficiently clear as the budget
would generally depict the measure of resources and level of expert managers require and need to
accomplish the association's objectives. In this way, budgets fill in as a formal approval for a
manager to spend a given measure of cash on particular exercises. In this regard, budgets are
utilized to guarantee that authoritative resources are used in the most gainful and beneficial route,
to accomplish productivity required for the business tasks accordingly lessening expenses and
raising benefit (Australian Society of CPA, 1999). Such an arrangement of approval must be
bolstered by a reasonable duty structure adopted by the company.
Channel for Communication and Coordination: Evidently, budgets are a critical channel of
imparting certain sort of data that will empower directors in various parts of the association to be
completely educated of the arrangement and approaches, and limitations, to which the association
is relied upon to acclimate. Through the budgeting procedure, top administration conveys its
desires to the lower level administration, with the goal that individuals from the association may
comprehend these desires and can facilitate their exercises to accomplish them (Drury, 2001).
Fundamentally, arrangement of the budgets encourages the exchange of essential data among all
13
levels in the association and accordingly, level of communication is more upgrade amid the
budgeting procedure.
The co-appointment of business exercises will be supported through the budgeting procedure.
Considering that all activities of the distinctive parts of the association are united and
accommodated into a typical arrangement, the budgeting procedure help to tie an association
together towards the accomplishment the association's objective. With no direction, chiefs may
each settle on their own choices, trusting that they are working to the greatest advantage of the
association (Drury, 2001). Budgeting propels directors to look at the interrelationships and
reliance among various parts of the association, and all the while, to recognize and resolve
clashes.
Motivational Device: The budget can be a valuable device for affecting administrative conduct
and rousing administrators to perform in accordance with the organizational objective (Drury,
2001). A budget gives a standard that in specific situations may spur managers to endeavour to
accomplish the standard. In any case, it is feasible for manager to see the budget as a pressure
device in attempting to inspire them to accomplish a level of execution that they don't see as
achievable. By and by, inspiration would be improved through the sentiment inclusion which
support in the budgeting procedure can advance. On the off chance that people have effectively
taken an interest in setting up the budget, and it is utilized as an apparatus to help managers in
dealing with their units, budget can go about as a solid motivational device by giving a challenge
(Drury, 2001).
Means of Performance Evaluation and Control: A budget helps managers in overseeing and
controlling the exercises for which they are capable. The control of business exercises might be
helped through the examination and quantitative estimation of genuine outcomes against the
budget design. By doing this, managers can determine which exercises don't comply with the first
plan and require their consideration. By exploring the purposes behind the deviations, managers
might have the capacity to distinguish wasteful aspects (Drury, 2001). Thus, suitable control and
remedial move can be made to cure the circumstance (Drury, 2001).
CHARACTERISTICS OF BUDGET
As expressed before, a budget is an outline for management activity. The accompanying are the basic
highlights of budget:
A budget is quantitatively expressed: The figures in the budget are communicated in money
related terms. Be that as it may, the money related figures are upheld by non-fiscal data, for
example, units to be sold, units to be bought and others.
A budget is set up ahead of time: A budget must be drawn up before the period to which it alludes.
Figures created amid or after the period might be critical, yet they are not some portion of a budget.
14
A budget identifies with a specific period: Generally, the budget is set up for one year. In any case,
on account of an occasional business, there might be two budgets for every year – a slack season
budget and a pinnacle season budget.
A budget is an arrangement of activity: A budget is an arrangement since it concerns moves to be
made instead of a detached acknowledgment of future patterns. Arranging is the foundation of goals
and the plan, assessment and determination of the arrangements, techniques, strategies and activity
required to accomplish the targets. Like all designs, budget only occasionally end up being
thoroughly right expectations without bounds. Conditions may change amid the budget time frame,
which renders the budget to be incorrect. All things being equal, budget is valuable in controlling the
activities of chiefs.
A budget is an estimation or forecast of benefit potential: The budget forward the costs and
incomes arranged amid the spending time frame and in this way uncovers its profit potential.
OBJECTIVE OF BUDGETARY CONTROL
1. Planning: planning has been characterized as the plan of a coveted future position for a entity and it
lays on the conviction that the future position can be achieved by continuous administration activity.
Point by point plans identifying with production, sales, raw material prerequisites, work needs, capital
augmentations, and so on are drawn out. By planning numerous issues evaluated well before they
emerge and arrangement can be thought of through cautious investigation. To put it plainly, budgeting
powers the administration to think ahead, to predict and get ready for the foreseen conditions.
Arranging is a steady procedure since it requires consistent modification with evolving conditions.
2. Co-ordination: budgeting assumes a critical part in setting up and look after coordination. Budgeting
helps administrators in organizing their endeavors so issues of the business are unraveled in congruity
with the destinations of its divisions. Proficient arranging and business contribute a great deal in
accomplishing the objectives. Absence of co-appointment in an association is watched when an office
head is allowed to augment the division on the particular needs of that department only, albeit such
advancement may adversely influence different offices and change their performance. Hence, co-
appointment is required at all vertical and also flat levels.
3. Measurement of success: Budgets introduce a valuable method for advising managers how well they
are performing in meeting targets they have beforehand set. In numerous organizations, there is a
routine with regards to compensating workers based on their proficient low budget targets or
advancement of a manager is connected to his budget achievement record. Achievement is dictated by
contrasting the past execution and a past period's execution.
4. Motivation: Budget is constantly viewed as a valuable apparatus for urging managers to finish things
in accordance with the business destinations. In the event that people have seriously taken an interest
in the preparation of budgets, it goes about as a solid motivating power to accomplish the objectives.
15
5. Communication: A budget fills in as a method for conveying data inside a firm. The standard budget
duplicates are appropriated to all administration individuals that gives not just adequate
comprehension and information of the programs and rules to be taken after yet in addition gives
knowledge about the limitations to be achieved to.
6. Control: Control is fundamental to ensure that designs and targets set down in the budget are being
accomplished. Control, when connected to budgeting, as a systematized exertion is to keep the
administration educated of whether arranged execution is being accomplished or not.
ADVANTAGE OF BUDGETARY CONTROL:
In the light of above discussion, one can see that, coordination and control help the planning. These are
the upsides of budgetary control. In any case, this device offers numerous different favorable
circumstances as takes after:
1. This framework gives essential strategies to activities.
2. It empowers the administration to perform business in the most expert way since budgets are set
up to get the ideal utilization of assets and the goals surrounded.
3. It guarantees cooperation and, in this way, empowers the soul of help and common
comprehension among the staff.
4. It builds creation efficiency, disposes of waste and controls the expenses.
5. It shows to the administration where activity is expected to remedy a position.
6. Budgeting likewise helps in acquiring bank credit.
7. It audits the current circumstance and pinpoints the progressions which are important.
8. With its assistance, errands, for example, such as planning, coordination and control happen
viably and effectively.
9. It includes an early planning which is viewed with help by numerous credit agencies as a marker
of sound administration.
LIMITATIONS OF BUDGETARY CONTROL:
1. It has a tendency to achieve unbending nature in task, which is destructive. As budget estimates
are quantitative articulation of every single relevant data, here is a propensity to join a type of inflexibility
or irrevocability to them.
2. It being costly is past the limit of small undertaking. The instrument of budgeting framework is a
detailed process including excessively time and expenses.
3. Budgeting can't take the situation of administration however it is just an instrument of
administration. 'The budget ought to be viewed as not as an ace, but rather as a worker.' It is absolutely
confusion to believe that the presentation of budgeting alone is sufficient to guarantee achievement and to
security of future benefits.
4. It at times prompts create clashes among the managers as every one of them tries to assume
acknowledgment to accomplish the budget targets.
16
5. Simple planning of budget won't guarantee its appropriate execution. On the off chance that it isn't
executed legitimately, it might bring down resolve.
6. The establishment and capacity of a budgetary control framework is an exorbitant issue as it
requires utilizing the particular staff and includes other use which small organization may discover hard
to bring about.
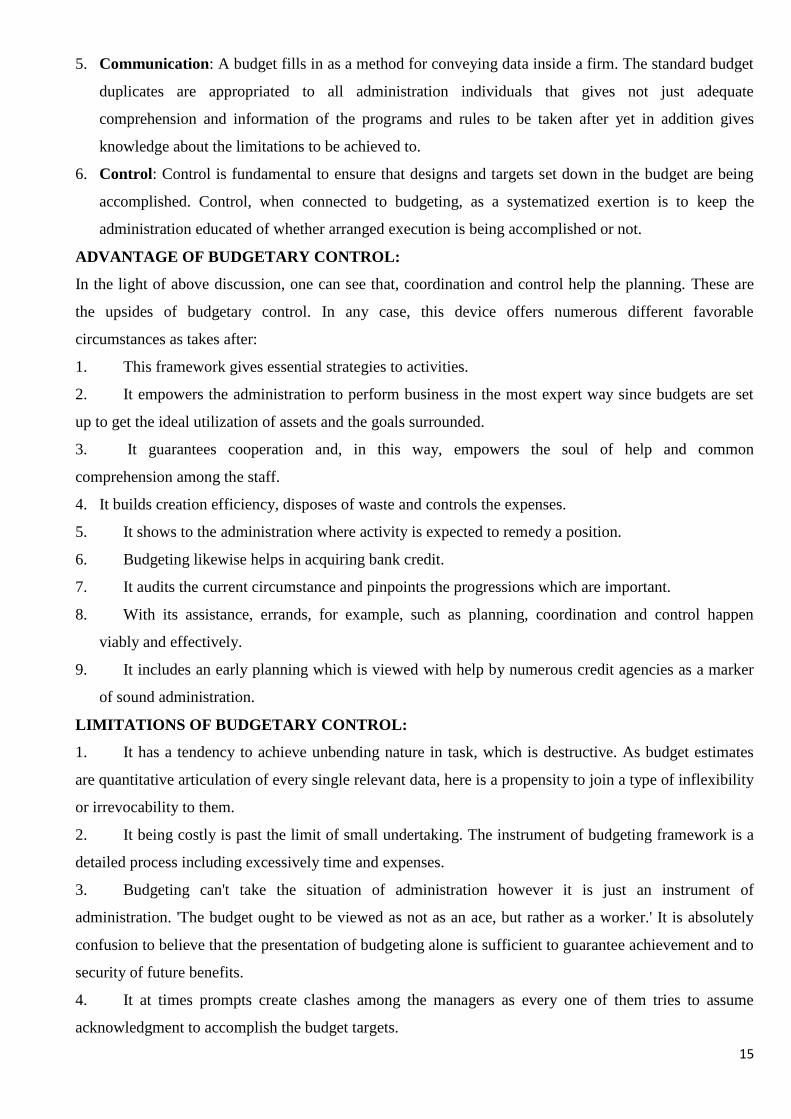
CLASSIFICATION OF BUDGET:
ESSENTIALS OF BUDGETARY CONTROL:
Organization for Budgetary Control
Budget Centres
Budget Manual
Budget Officer
Budget Committee
Budget Period
Determination of Key Factor.
ORGANIZATION FOR BUDGETARY CONTROL:
Great organization is fundamental for the planning, upkeep and organization of budgets. A budget council
is framed, which incorporates departments from various divisions. Every single useful supervisor is in
charge of guaranteeing the best possible execution of their particular departmental budgets.
FUNCTION
SALES BUDGET
PRODUCTION BUDGET
RAW MATERIAL BUDGET
PURCHASE BUDGET
LABOR BUDGET
PRODUCTION OVERHEAD BUDGET
SELLING & DISTRIBUTION BUDGET
ADMINISTRATION COST BUDGET
CAPITAL EXPENDITURE BUDGET
CASH BUDGET
FLEXIBILITY
FIXED BUDGET
FLEXIBLE BUDGET
TIME
LONG-TERM BUDGET
SHORT-TERM BUDGET
CURRENT BUDGET
ROLLING BUDGET
17
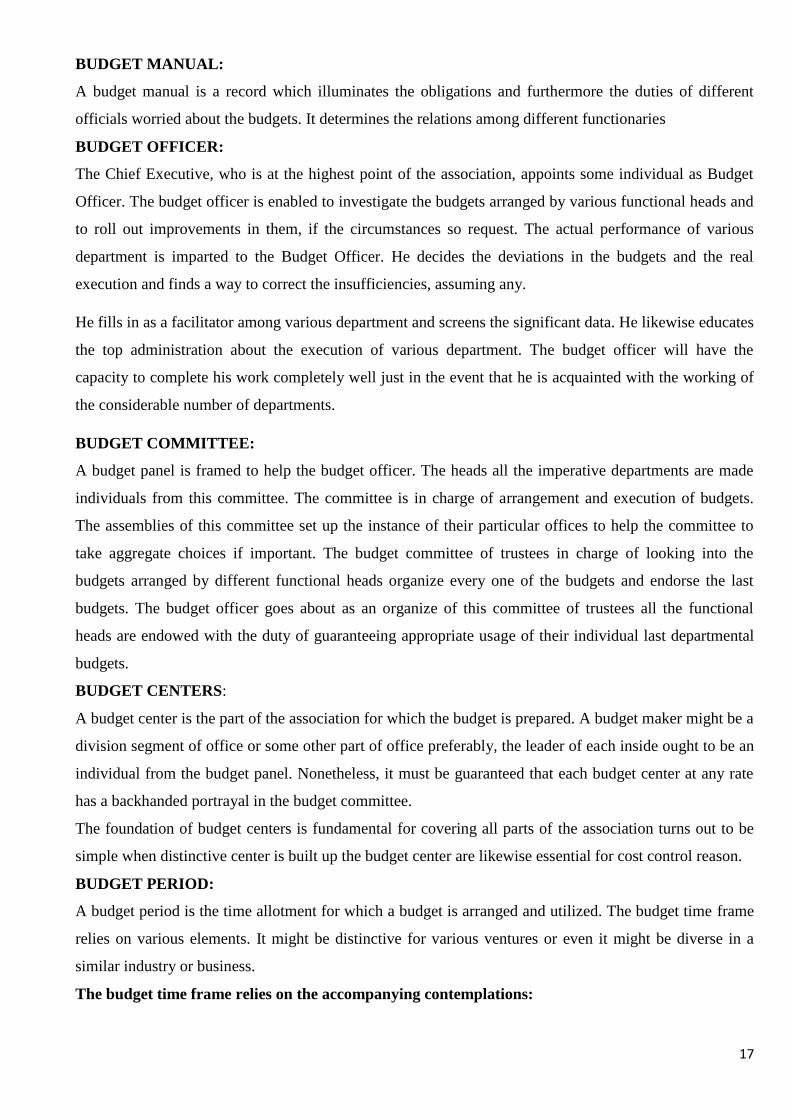
BUDGET MANUAL:
A budget manual is a record which illuminates the obligations and furthermore the duties of different
officials worried about the budgets. It determines the relations among different functionaries
BUDGET OFFICER:
The Chief Executive, who is at the highest point of the association, appoints some individual as Budget
Officer. The budget officer is enabled to investigate the budgets arranged by various functional heads and
to roll out improvements in them, if the circumstances so request. The actual performance of various
department is imparted to the Budget Officer. He decides the deviations in the budgets and the real
execution and finds a way to correct the insufficiencies, assuming any.
He fills in as a facilitator among various department and screens the significant data. He likewise educates
the top administration about the execution of various department. The budget officer will have the
capacity to complete his work completely well just in the event that he is acquainted with the working of
the considerable number of departments.
BUDGET COMMITTEE:
A budget panel is framed to help the budget officer. The heads all the imperative departments are made
individuals from this committee. The committee is in charge of arrangement and execution of budgets.
The assemblies of this committee set up the instance of their particular offices to help the committee to
take aggregate choices if important. The budget committee of trustees in charge of looking into the
budgets arranged by different functional heads organize every one of the budgets and endorse the last
budgets. The budget officer goes about as an organize of this committee of trustees all the functional
heads are endowed with the duty of guaranteeing appropriate usage of their individual last departmental
budgets.
BUDGET CENTERS:
A budget center is the part of the association for which the budget is prepared. A budget maker might be a
division segment of office or some other part of office preferably, the leader of each inside ought to be an
individual from the budget panel. Nonetheless, it must be guaranteed that each budget center at any rate
has a backhanded portrayal in the budget committee.
The foundation of budget centers is fundamental for covering all parts of the association turns out to be
simple when distinctive center is built up the budget center are likewise essential for cost control reason.
BUDGET PERIOD:
A budget period is the time allotment for which a budget is arranged and utilized. The budget time frame
relies on various elements. It might be distinctive for various ventures or even it might be diverse in a
similar industry or business.
The budget time frame relies on the accompanying contemplations:
18
(a) The sort of budget i.e., sales budget, production budget, raw materials purchase budget, capital
expenditure budget. A capital expenditure budget might be for a more extended period i.e. 3 to 5 year's
purchase, sale budgets might be for one year.
(b) The nature of demand for the product.
(c) The timings for the accessibility of the accounts.
(d) The financial circumstance of the nation.
(e) The length of trade cycles.
All the previously mentioned factors are considered while settling time of budgets
BUDGETS REPORTS:
Finding out budget in itself is of no utilization unless there is a steady stream of budget reports
indicating evaluation of the actual and the budget figures. It ought to be set up at normal interims like
each month indicating consequences of the distinction amongst actual and budgeting figure. The reports
ought to be paid ahead of time such that they set up duty regarding the differences. Reports ought to
likewise uncover regardless of whether fluctuations are good and that they are controllable.
The substance of the budget report shifts as per the need of the administrative level. Reports are set up
such that the concerned manager is straightforwardly worried to be given itemized data. As the level
becomes higher, the measure of detail turns out to be less despite the fact that the scope of the report will
enlarge.
BUDGETARY CONTROL AT BEL
BUDGETING PROCESS AT BEL
The budgeting procedure in BEL is an annual exercise and by tradition all budgets submitted to the board
of directors will mirror the plan for 3 years:
Budget estimate of the next financial year (B.E.)
Forecast estimate for the year after next year (F.C)
Revised estimate for the year after next year (R.E)
It can be seen that there is a probability to revise the budget estimate of the current financial year. This
adaptability to audit the original budget and make update may end up essential if there are any huge
changes in either the inward or outer condition. Ideally, the progressions in revised estimate ought to be
kept to the base, since huge scale changes nullify the point of setting up the original budget estimate
itself.
TYPES OF BUDGET PREPARED AT BEL
The budget process in BEL is a yearly exercise and is done by convention of all budget submitted to the
board of director which will reflect the plan for 3 years.
Here in BEL there is flexibility to revise the original in budget and make revision if necessary. There are
2 types of budget prepared by BEL:
19
CAPITAL BUDGET
REVENUE BUDGET
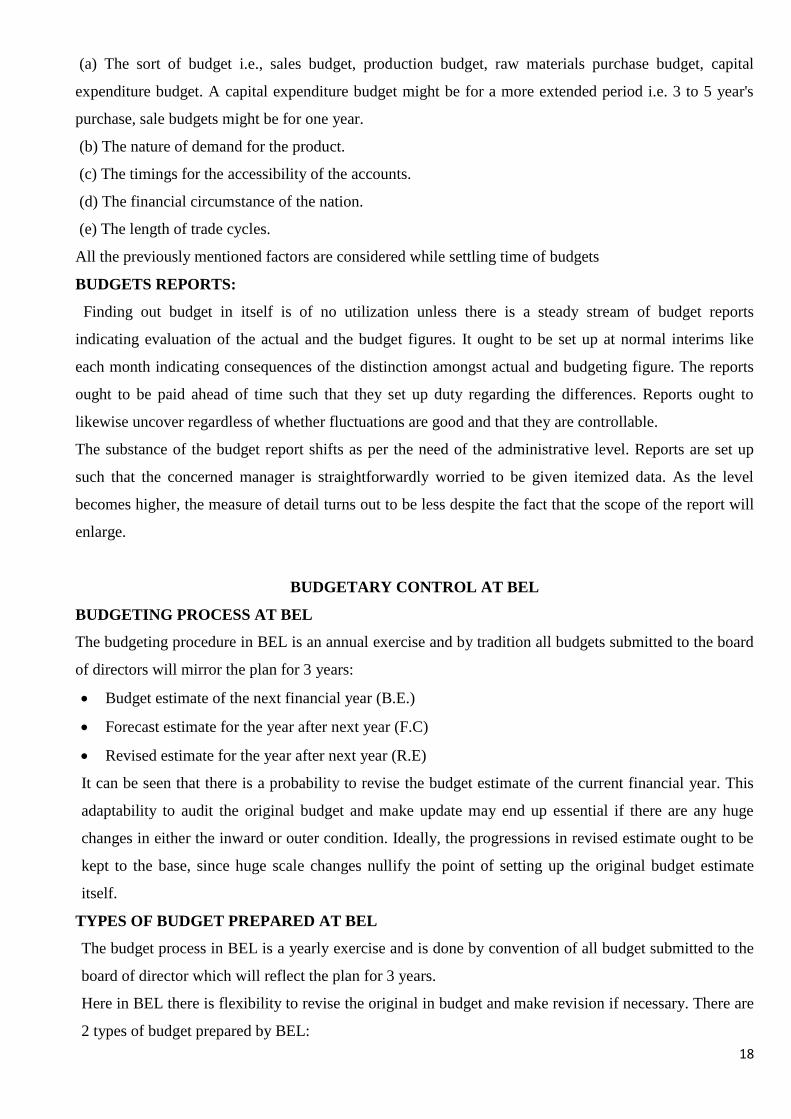
CAPITAL BUDGET
Capital budgeting may be defined as the company’s decision to invest its current funds in the long-term
activities, in anticipating of an expected flow of future benefits. The long-term activities are those which
affect the company’s operations beyond one-year period. Generally, the company’s capital budgeting
decisions will involve additions, disposals, modifications and replacement of long term fixed assets,
building, acquiring land, putting up a new plant and other major investments of similar nature.
CATEGORIES OF CAPITAL INVESTMENT PROPOSALS
I. Projects
II. Augmentation needs (other than projects)
III. Civil works
PROJECTS
Projects are those capital investments where there is recognizable and quantifiable revenue from the
investment proposed and the expenditure predicted. Project cost estimates should be prepared under
various heads such as plant and machinery, electronics equipment’s, special tools/jigs, civil works,
utilities and other infrastructure needs.
AUGMENTATION NEEDS
There is a need for investing in items “other than projects” which will be mainly for augmenting the
existing facilities. Broadly the augmentation needs will fall under the following categories:
a. Embellishments/ Replacements to renovate the current facility or to balance the necessity keeping in
line with the proposed level of activity. These are normally known as “modernization and balancing
needs”.
Corporate goal-Maximise the enterprise value
Investment decisions
long term Investment
Capital budgeting
short term Investment
Financing decisions
Dividend decision
20
b. The requirement for replacement of present assets arises either due to technological obsolescence or
due to wear and tear. Here the determining factors will be the cost and resale value of the original
assets and the capabilities and cost of the intended replacement.
c. Items required for research and development.
CIVIL WORK
All the civil works necessities of new building/floors either in the factory or in the township are to be
recorded here.
Types of capital investment proposal
a. Replacement of plant, machinery and installations to keep the present operations going
b. Additions/ extensions for raising output
c. Taking up a new product line, a new plant construction or a new manufacturing setup
d. Vertical integration viz., making in-house an item so far brought from outside
e. Fixed assets for R&D activity
f. Desirable investment on utilities/ infrastructure including staff welfare
g. Building requirements and civil, mechanical and electrical works for items listed at “a” to “f” above.
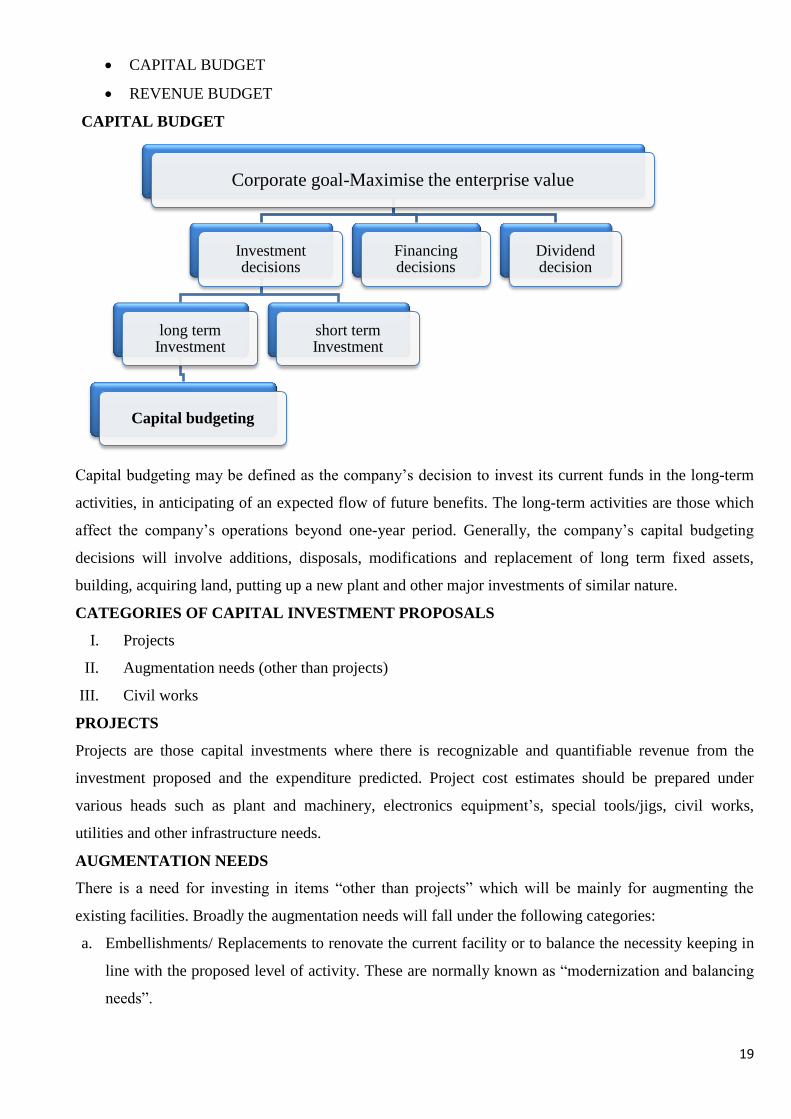
VETTING OF CAPITAL BUDGET PROPOSALS
FLOW CHART OF CAPITAL BUDGET
Indenter approaches the committee with
requirement
Committee consolidates the requirement of
indenter all over the unit
committee projects the requirement with the
finance
deptt compliles the requirement of all the
comittees under appropriate groups, dub
groups and approval type
Initial scrutiny at departmental level to check duplicacy etc.
Draft budget meeting with finance head
Budget review meeting with unit head and
committees
committes justify their requirements on the basis of which items retained or deleted
Budget sent to CO for approval along with
justidications in required format
21
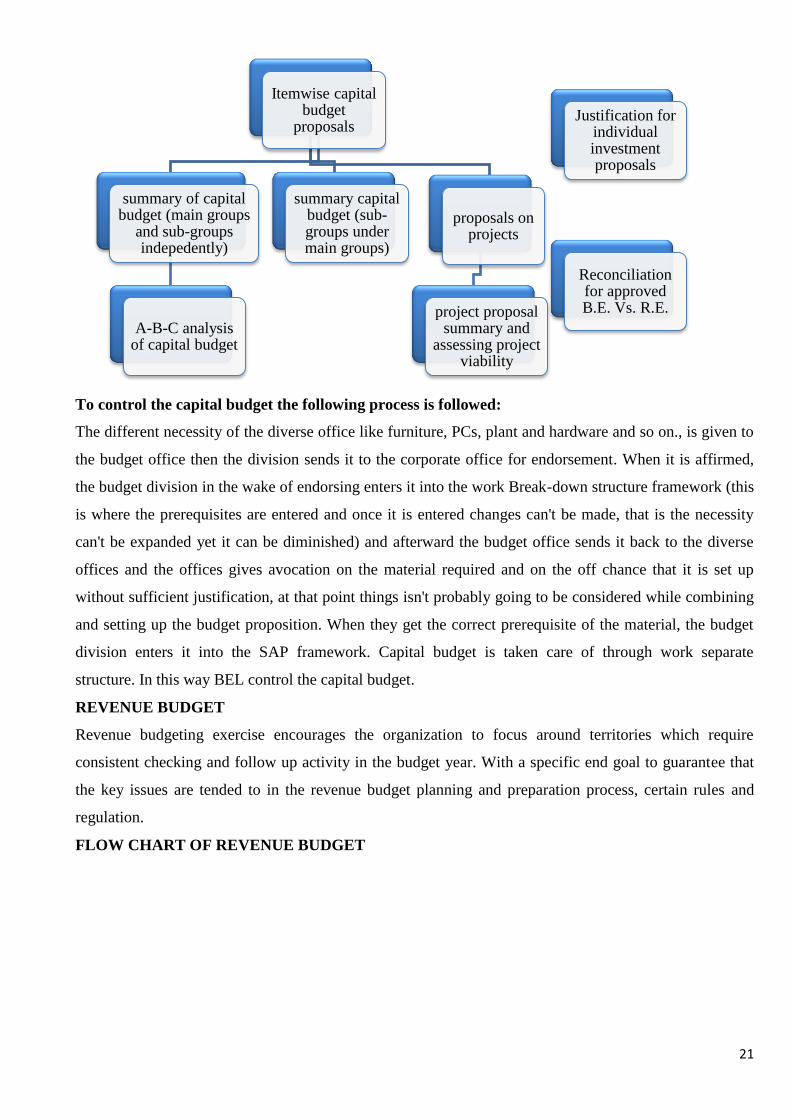
To control the capital budget the following process is followed:
The different necessity of the diverse office like furniture, PCs, plant and hardware and so on., is given to
the budget office then the division sends it to the corporate office for endorsement. When it is affirmed,
the budget division in the wake of endorsing enters it into the work Break-down structure framework (this
is where the prerequisites are entered and once it is entered changes can't be made, that is the necessity
can't be expanded yet it can be diminished) and afterward the budget office sends it back to the diverse
offices and the offices gives avocation on the material required and on the off chance that it is set up
without sufficient justification, at that point things isn't probably going to be considered while combining
and setting up the budget proposition. When they get the correct prerequisite of the material, the budget
division enters it into the SAP framework. Capital budget is taken care of through work separate
structure. In this way BEL control the capital budget.
REVENUE BUDGET
Revenue budgeting exercise encourages the organization to focus around territories which require
consistent checking and follow up activity in the budget year. With a specific end goal to guarantee that
the key issues are tended to in the revenue budget planning and preparation process, certain rules and
regulation.
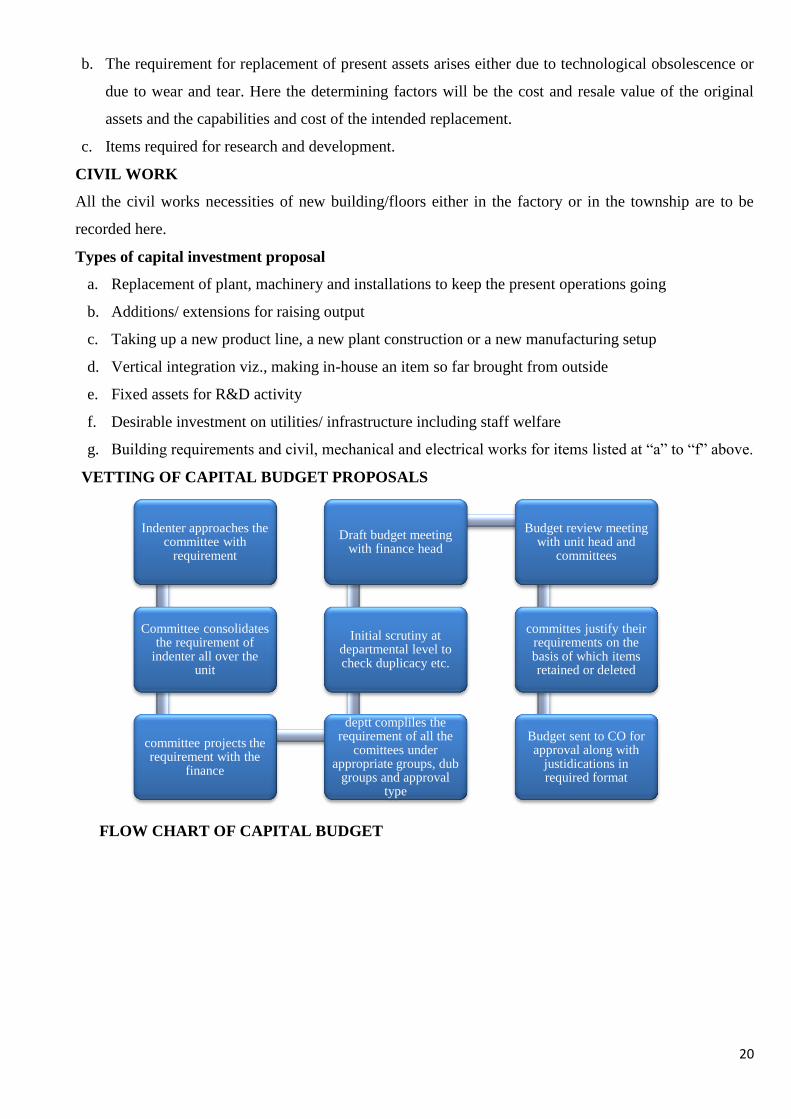
FLOW CHART OF REVENUE BUDGET
Itemwise capital budget
proposals
summary of capital budget (main groups
and sub-groups indepedently)
A-B-C analysis of capital budget
summary capital budget (sub-groups under main groups)
proposals on projects
project proposal summary and
assessing project viability
Justification for individual investment proposals
Reconciliation for approved B.E. Vs. R.E.
22
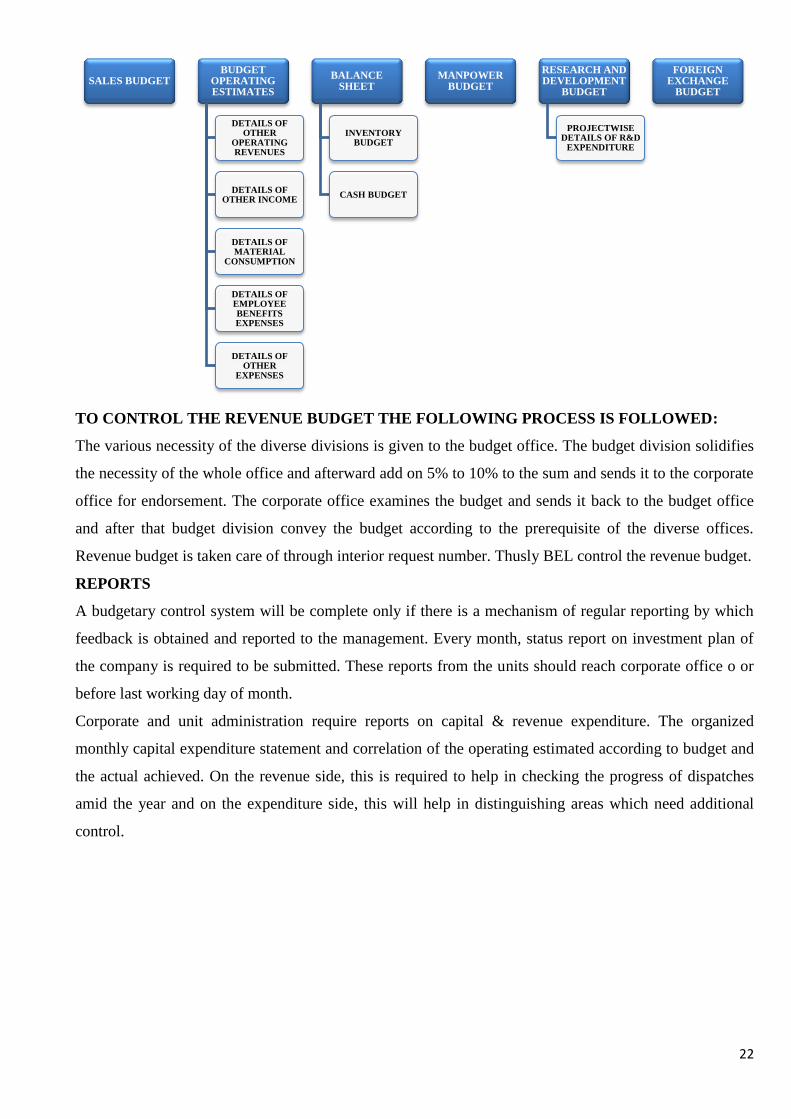
TO CONTROL THE REVENUE BUDGET THE FOLLOWING PROCESS IS FOLLOWED:
The various necessity of the diverse divisions is given to the budget office. The budget division solidifies
the necessity of the whole office and afterward add on 5% to 10% to the sum and sends it to the corporate
office for endorsement. The corporate office examines the budget and sends it back to the budget office
and after that budget division convey the budget according to the prerequisite of the diverse offices.
Revenue budget is taken care of through interior request number. Thusly BEL control the revenue budget.
REPORTS
A budgetary control system will be complete only if there is a mechanism of regular reporting by which
feedback is obtained and reported to the management. Every month, status report on investment plan of
the company is required to be submitted. These reports from the units should reach corporate office o or
before last working day of month.
Corporate and unit administration require reports on capital & revenue expenditure. The organized
monthly capital expenditure statement and correlation of the operating estimated according to budget and
the actual achieved. On the revenue side, this is required to help in checking the progress of dispatches
amid the year and on the expenditure side, this will help in distinguishing areas which need additional
control.
SALES BUDGET BUDGET
OPERATING ESTIMATES
DETAILS OF OTHER
OPERATING REVENUES
DETAILS OF OTHER INCOME
DETAILS OF MATERIAL
CONSUMPTION
DETAILS OF EMPLOYEE BENEFITS EXPENSES
DETAILS OF OTHER
EXPENSES
BALANCE SHEET
INVENTORY BUDGET
CASH BUDGET
MANPOWER BUDGET
RESEARCH AND DEVELOPMENT
BUDGET
PROJECTWISE DETAILS OF R&D
EXPENDITURE
FOREIGN EXCHANGE
BUDGET
23
LITERATURE REVIEW
As per Daniel P. Carpenter "Control over office budgets is a basic instrument of political impact in
administrative basic leadership, yet the causal system of budgetary control is vague. Do budgetary
controls impact offices by forcing asset limitations or by transmitting capable signs to the organization? I
progress and test a stochastic procedure model of versatile flag handling by a various levelled office to
address this inquiry. The essential discoveries of the paper are two. In the first place, presidents and
congressional boards accomplish budgetary control over offices not by controlling total asset
requirements but rather by transmitting intense flags through budget shifts. Second, bureaucratic
progression builds the organization's reaction time in preparing budgetary signs, constraining the viability
of the budget as a gadget of political control. I likewise demonstrate that the greatness of organization
reaction to budgetary signs expanded for official branch offices after 1970 because of official oversight
changes. I close by talking about the cut off points of budgetary controls as a gadget of political control
and the reaction of chose experts to versatile flag preparing by organizations."
As per Alan S. Dunk, 2011 "Associations are progressively calling for more noteworthy budgetary
oversight of the item development process. A noteworthy focal point of their worry is the expenses
related with item development together with their need to improve their budgetary execution through
these undertakings. In any case, the writing has raised various issues emerging from such budgetary
proposition, recommending that the inventiveness of those engaged with item development ought not be
compelled by taken a toll concerns, that the utilization of administration control frameworks is
inconsistent with item advancement, and that budgets may smother development. It is contended in this
paper the degree to which item development positively affects the monetary execution of firms is reliant
on the way in which budgets are utilized as a part of associations. On the off chance that budgets are
utilized prevalently as an arranging instrument, at that point such budget arranging encourages item
advancement bringing about improved execution. Interestingly, if budgets are utilized principally as a
control system, at that point it is impossible that item advancement will add to money related execution.
The aftereffects of the investigation are steady with these desires. This paper makes a commitment to the
writing by giving exact confirmation of the effect of budgets with regards to item advancement."
As per Gokhan Ozer and Emine Yilmaz, 2011 "On account of the expanding significance of powerful
and profitable administration of open associations, budgetary slack is begun to be viewed as a vital issue
for open associations. Keeping in mind the end goal to contribute the arrangement of this issue, the
present examination explores the impacts of budgetary control viability, moral work atmosphere and
directors' procedural equity observation on affinity to make budgetary slack in pubic associations. The
information is acquired through survey reacted by 465 administrators who work in various open
associations. The aftereffects of the examinations demonstrate that viability of budgetary control, moral
work atmosphere and procedural equity view of administrators have a measurably critical and negative
24
effect on supervisors' inclination to make budgetary slack openly associations. Budgetary control and
moral work atmosphere influence administrators' view of procedural equity. What's more, it is induced
from the examination that the view of procedural equity has fractional intervention impact between
adequacy of budgetary control, moral work atmosphere and penchant to make budgetary slack."
Glautier and Under (1987) express that "the rise of logical administration theory with its accentuation
on itemized info‟ as a reason for taking choice gave a huge stimulus to the improvement of administration
bookkeeping and to be sure budgeting techniques‟. Be that as it may, budgeting at the beginning time of
its improvement was worried about getting ready and displaying solid data to legitimize responsibility
and to allow adjust execution assessment and thus, rewards. Throughout the years, the capacity and focal
point of budgeting has moved extensively and business association turn out to be more perplexing and
their condition winds up powerful combined with the rise slant, the term budget and budgeting have been
contrastingly characterized and inspected by different researchers in a few ways."
As indicated by Hudson and Andrew (1996), "control includes the settling on of choices in view of
pertinent data which prompts designs and activities that enhance the usage of the gainful resources and
administrations accessible to associations administration. Successful control is said to be founded on
principles which real execution can be thought about. In the event that there are no gauges, at that point
there can be no compelling measure of achievement. Hudson and Andrew distinguished and explained on
five classes into which guidelines fall, they are: amount, quality, time, dissension and esteem. Viable
control is a key administration errand which guarantees that endeavours created at all levels are similar
with those required to guarantee the long-haul future viability and achievement of the association
(Stewart, 1997)."
As per H.S. Wheldon, "By budgetary control, each thing of genuine cost is so controlled by watchful
supervision as to influence it to accommodate, as almost as could be expected under the circumstances, to
the foreordained models. It has brought about the disposal of waste and overabundance costs in each
appropriate case where budgetary control has been legitimately organized."
As per John Blocker, "Budgetary control is intended to help the administration the assignment of
obligations and specialist, to help in making appraisals and arrangements for future, to aid examination of
different amongst assessed and real outcomes and to create premise of estimation or guidelines with
which to assess the effectiveness of tasks."
As per Brown and Howard, "Budgetary control is an arrangement of controlling costs which
incorporates the readiness of budgets, organizing the divisions and setting up obligations, contrasting real
execution and the budgeted and following up on results to accomplish most extreme gainfulness."
Weldon portrays budgetary control as arranging ahead of time of the different elements of a business with
the goal that the business all in all is controlled
25
K. Amjaroen in his book "5 Essentials of fruitful Budgeting" expressed that, "Budgeting is clear, simple
to do with a spreadsheet and more an activity of diligence than whatever else". "More or less, budgeting
implies that financial specialists don't spend more than they make. It is otherwise called "living beneath
one's signifies" and is by all accounts an idea lost on bunches of people in social orders their framework
empowers living to a great extent on obligation through Visa". Likewise, it is reason while numerous
third world organizations are worried or appropriately fizzled in light of the fact that the Chief Executive
runs the association without compelling budget projection which brought about them living over their
methods.
Dutta in his book titled "Administration Control System" articulates that "budgetary control is a precise
and formalized approach for achieving the arranging, coordination and control duties of administration.
Shipper and Van der Stede (2003) concurred that budgetary control is a focal gadget of administration
control. The utilization of budgets to control an association's exercises is known as budgetary controls
(Garrison and Noreen, 1997)."
As per Young Hoonk Wak and Williams Ibbs (2002), 'Budgetary control is the way toward controlling
the use on a development venture at all phases from start to fulfilment, inside the affirmed. Budget is vital
on the grounds that cost invades are normal bringing about genuine cost issues amid venture execution'.
Anderson S.D. what's more, Lynn Cook E (1995), found, "if the aggregate Cost cognizant and other
Management approach is received in the proposed start methodology itself to execute the extent of the
Project, it will prompt the consistent change for alternate procedures of the Project. Further, the final
product will likewise be savvier"
As indicated by Liang Liu, Scott A. Consumes, Chung – Wei Feng, (1995), "in Cost Management
arranging process, development organizers must choose suitable assets, including team estimate,
hardware, strategies and advances, to play out the errands of a development venture"
Egan, (1997) Egan underscored that "without viable controls, an undertaking will be helpless before
interior and outside powers that disturbs its productivity and be ignorant; such venture will have the
capacity to battle such powers. At the point when a budgeting and control framework is being used,
budgets are built up which set out in monetary terms, the duty of supervisors in connection to the
necessity of the general arrangement of the organization."
Morgan (1997) opines that the "budget had developed past a money related device. It is most importantly
administrative device; fundamentally, it is the best instrument for ensuring that key assets, particularly
execution asset are doled out to needs and to comes about. It is an instrument that empowers the chief to
know when to survey and amend plans, either in light of the fact that outcomes are not quite the same as
desire or because of natural, monetary conditions, economic situations or innovations change, which
never again relate to the presumptions of the budget. Morgan stressed that the budget ought to be utilized
as an apparatus for arranging and control"
26
As indicated by Hudson and Andrew (1996), "control includes the settling on of choices in view of
significant data which prompts designs and activities that enhance the use of the beneficial resources and
administrations accessible to associations administration. Viable control is said to be founded on models
which genuine execution can be analyzed. On the off chance that there are no gauges, at that point there
can be no viable measure of accomplishment. Hudson and Andrew recognized and explained on five
classifications into which benchmarks fall, they are: amount, quality, time, objection and esteem."
Stewart (1997)," Effective control is a key administration undertaking which guarantees that endeavors
created at all levels are comparable with those required to guarantee the long-haul future viability and
achievement of the association."
Isaac Reynolds, concur with wills all the more however noticed that "budget arranging is the way to
survival in today very specialized and aggressive condition and that inability to design comes about, for
some organizations in a business disappointment that may have been kept away from by benefit
arranging."
J.F Weston (1978) and E.F Brigham are in concurrence with Reynolds (1984). In any case, are advisers
for present that the "budget isn't a method for constraining use. Or maybe, it is a technique to enhance
activities, a device for acquiring the most gainful and beneficial employments of the organization's assets
through cautious arranging and controlling."
Hingren and Foster (1988) concurred that the "budget isn't a penny-squeezing gadget. They likewise
concurred with the perspectives communicated by different creators that budget is a guide to co-
appointment and implantation".
As indicated by Chika Agu (2006) for the situation investigation of 'budgeting and budgetary Control in
Business association,' "Budgetary control, is the utilization of the budget as an instrument for the
direction of business tasks. All things considered, budgets fill in as a measuring stick for official control
of activity, to decide the degree which arranged objectives and goals are being achieved and to capture
disconnected floats on "time". While concurring that budgetary control takes after budget readiness,
fortunate opined that budgets require top administrative help as well as that control is helped too by
"support of budgets holders into the examination of answer for the issues which emerge".
27
CHAPTER 3
RESEARCH DESIGN
TOPIC CHOSEN FOR STUDY
“STUDY ON BUDGETARY CONTROL OF BEL Ltd”
STATEMENT OF THE PROBLEM
“A study on budgetary control” was led through an organized survey in order to:
To break down how Budgeting and Budgetary Control helps the BEL
To select the best course of plan.
To give a definite plan of activity for business over some period of time frame
To facilitate the diverse unit and exercises of the association with a view to use the resources
wisely
To practice the control and on cost through correlation of actual outcomes with the budgeted one.
To know the role of Budgetary Control.
Budgetary control is utilized by most associations as a device for appropriate administration of resources
in the association and its activities. A firm with all around planned budgetary controls effectively doles
out its managers the obligation regarding the utilization of assigned monetary resources to accomplish
their allotted operational goals. Budget controls gives correlations of actual outcomes against budget plan.
NEED FOR THE STUDY
Budgetary control is a solid apparatus of business is to expand benefits. The administration is in this
manner continually endeavouring to focus around the best possible planning, compelling coordination and
control keeping in mind the end goal to boost benefits. There are different administrative instruments and
methods valuable for the administration to plan and control business activities. Budget is likewise utilized
for the administration to plan and control business activities and it is generally utilized as a standard
device of planning and control.
Budget gives as an important guide to administration through planning, coordination and control. It is an
apparatus which measures the administrative execution of an association. It advances confidence and
produces harmony in the association.
The investigation centre around breaking down the difference amongst budgeted and actual figures with
uncommon reference to the statement of budgets arranged at BEL. It is difficult to foresee the correct
figures in this manner variety will undoubtedly happen, consequently it winds up important to distinguish
the varieties. This investigation centres around the computation of varieties and examining the reasons of
the same.
OBJECTIVES OF THE STUDY
To study budgetary control practices adopted by BEL Bangalore during 2014-17
28
To give suggestions based on analysis
SCOPE OF THE STUDY
The study covers budget and budgetary framework rehearsed in Bharat Electronics Limited. In any case,
the study absolutely relies on exactness in the budget statement. as for the subject, extent of the
examination is constrained to the study and assessment of the budgeting productivity at the organization
which is completed by contrasting the actual and budgeting proficiency at the organization for a 3-year
deciding variance from the planned performance and furthermore the plausible explanations for the
variation
METHODOLOGY
Methodology adopted is descriptive research.
RESEARCH DESIGN
The study utilized a descriptive survey study research design look it into plan which was gone for
examining the budgetary controls in Bharat Electronics Limited. This design attempts to gather data from
members of the population and describes existing marvel with reference to budgeting controls.
The goal is to draw explanation and generate ideas from the past trends in order to understand the present
and to anticipate the future. It empowers to gasp out relationship with the past and to plan more
intelligently for the future. The past contains the key to the present and the present influences the future.
It involves comparison between budgeted and actual figures, that is to find
Variance = budgeted – actual
Variance % = variance / budgeted * 100
SOURCES OF DATA:
Information gathered is exclusively for education purpose. Despite the sources information accumulated
comes under the grouped section, care has been taken to provide sufficient information. There are mainly
two essential sources through which the whole data is gathered.
Primary data
The primary data of the subject is gathered by personal communication with the authorities of the finance
and accounting department of BEL and also from annuals of the organization. Inquiries were solicited to
the employees of different section of BEL to gather the required information.
Secondary data
Secondary information includes textbook, internet and organization records including budget manual,
annual report, website of the company etc. the information gathered must be correlated and should
indicate soundness in the approach. The financial data identifying with the organization has been gathered
for the 3 years.
Secondary data used in the study are:
Budget Manual
Annual report & books, journals and manuals of the company
29
Company handouts, orientation manuals
Product brochures
Industry and company website.
LIMITATIONS OF THE STUDY
The time period of study was constrained and insufficient to go into the detailed by point
viewpoint to the study.
Most of the issues identified with the budget was confidential. Subsequently it isn't conceivable to
assemble much data.
Data give by organization was restricted.
The findings depend on the information provided by the organization and in view of the
association with different representatives of the separate departments.
The budgeting process took after by Bharat Electronics Limited is one of a kind, entangled and
diverse to understand.
The foundation of a budgeting procedure requires significant investment.
Being a defence organization venture names or any instrument name can't be disclosed.
As the division is very colossal, it was a hard to meet all officials and get their perspectives.
30
CHAPTER 4
DATA ANALYSIS AND INTERPRETATION
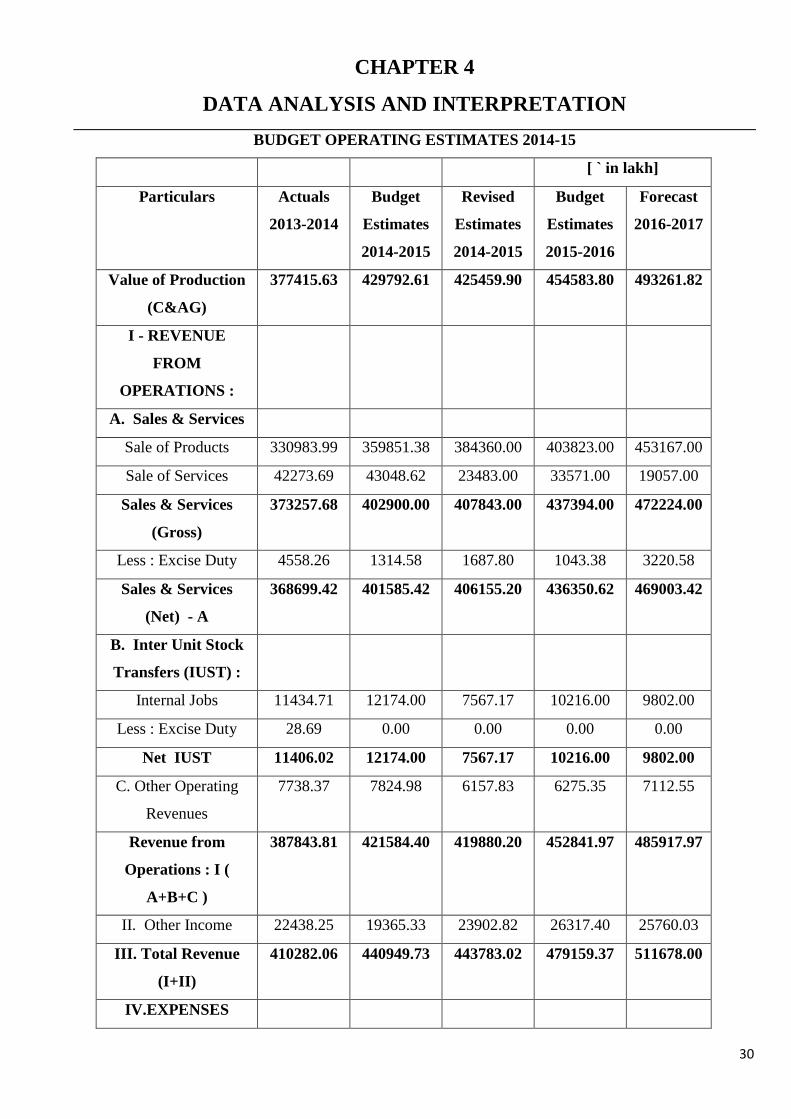
BUDGET OPERATING ESTIMATES 2014-15
[ ` in lakh]
Particulars Actuals
2013-2014
Budget
Estimates
2014-2015
Revised
Estimates
2014-2015
Budget
Estimates
2015-2016
Forecast
2016-2017
Value of Production
(C&AG)
377415.63 429792.61 425459.90 454583.80 493261.82
I - REVENUE
FROM
OPERATIONS :
A. Sales & Services
Sale of Products 330983.99 359851.38 384360.00 403823.00 453167.00
Sale of Services 42273.69 43048.62 23483.00 33571.00 19057.00
Sales & Services
(Gross)
373257.68 402900.00 407843.00 437394.00 472224.00
Less : Excise Duty 4558.26 1314.58 1687.80 1043.38 3220.58
Sales & Services
(Net) - A
368699.42 401585.42 406155.20 436350.62 469003.42
B. Inter Unit Stock
Transfers (IUST) :
Internal Jobs 11434.71 12174.00 7567.17 10216.00 9802.00
Less : Excise Duty 28.69 0.00 0.00 0.00 0.00
Net IUST 11406.02 12174.00 7567.17 10216.00 9802.00
C. Other Operating
Revenues
7738.37 7824.98 6157.83 6275.35 7112.55
Revenue from
Operations : I (
A+B+C )
387843.81 421584.40 419880.20 452841.97 485917.97
II. Other Income 22438.25 19365.33 23902.82 26317.40 25760.03
III. Total Revenue
(I+II)
410282.06 440949.73 443783.02 479159.37 511678.00
IV.EXPENSES
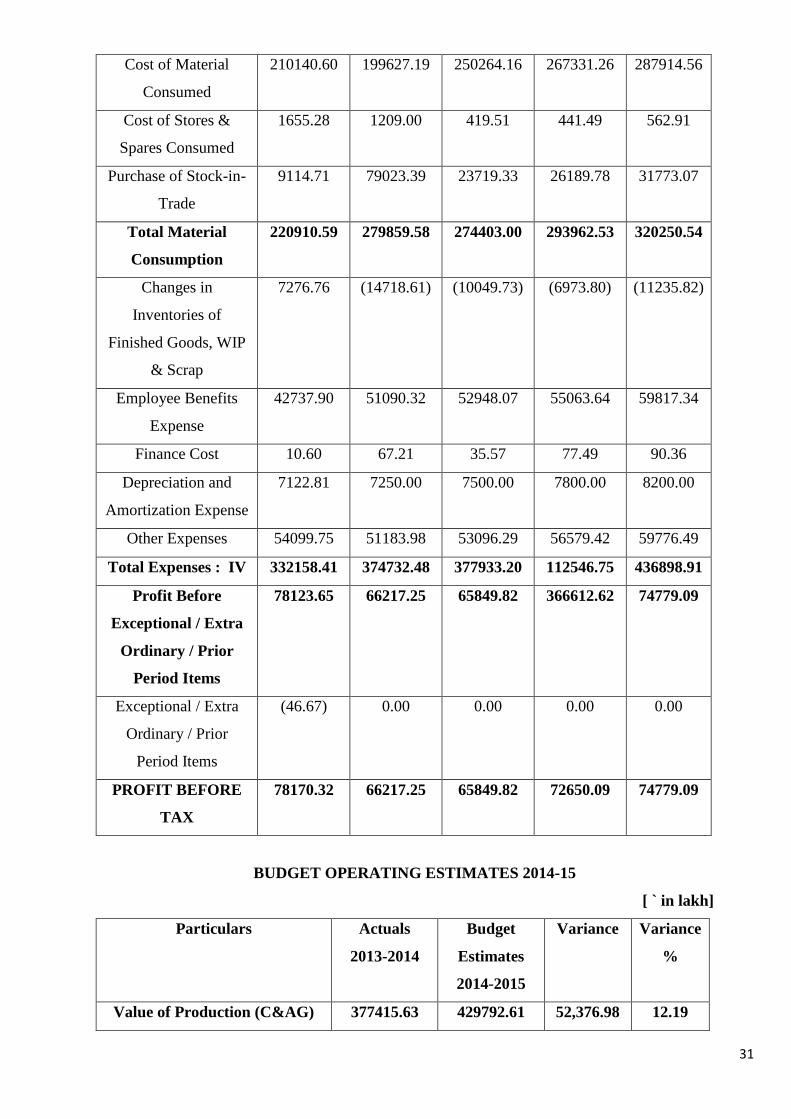
31
Cost of Material
Consumed
210140.60 199627.19 250264.16 267331.26 287914.56
Cost of Stores &
Spares Consumed
1655.28 1209.00 419.51 441.49 562.91
Purchase of Stock-in-
Trade
9114.71 79023.39 23719.33 26189.78 31773.07
Total Material
Consumption
220910.59 279859.58 274403.00 293962.53 320250.54
Changes in
Inventories of
Finished Goods, WIP
& Scrap
7276.76 (14718.61) (10049.73) (6973.80) (11235.82)
Employee Benefits
Expense
42737.90 51090.32 52948.07 55063.64 59817.34
Finance Cost 10.60 67.21 35.57 77.49 90.36
Depreciation and
Amortization Expense
7122.81 7250.00 7500.00 7800.00 8200.00
Other Expenses 54099.75 51183.98 53096.29 56579.42 59776.49
Total Expenses : IV 332158.41 374732.48 377933.20 112546.75 436898.91
Profit Before
Exceptional / Extra
Ordinary / Prior
Period Items
78123.65 66217.25 65849.82 366612.62 74779.09
Exceptional / Extra
Ordinary / Prior
Period Items
(46.67) 0.00 0.00 0.00 0.00
PROFIT BEFORE
TAX
78170.32 66217.25 65849.82 72650.09 74779.09
BUDGET OPERATING ESTIMATES 2014-15
[ ` in lakh]
Particulars Actuals
2013-2014
Budget
Estimates
2014-2015
Variance Variance
%
Value of Production (C&AG) 377415.63 429792.61 52,376.98 12.19
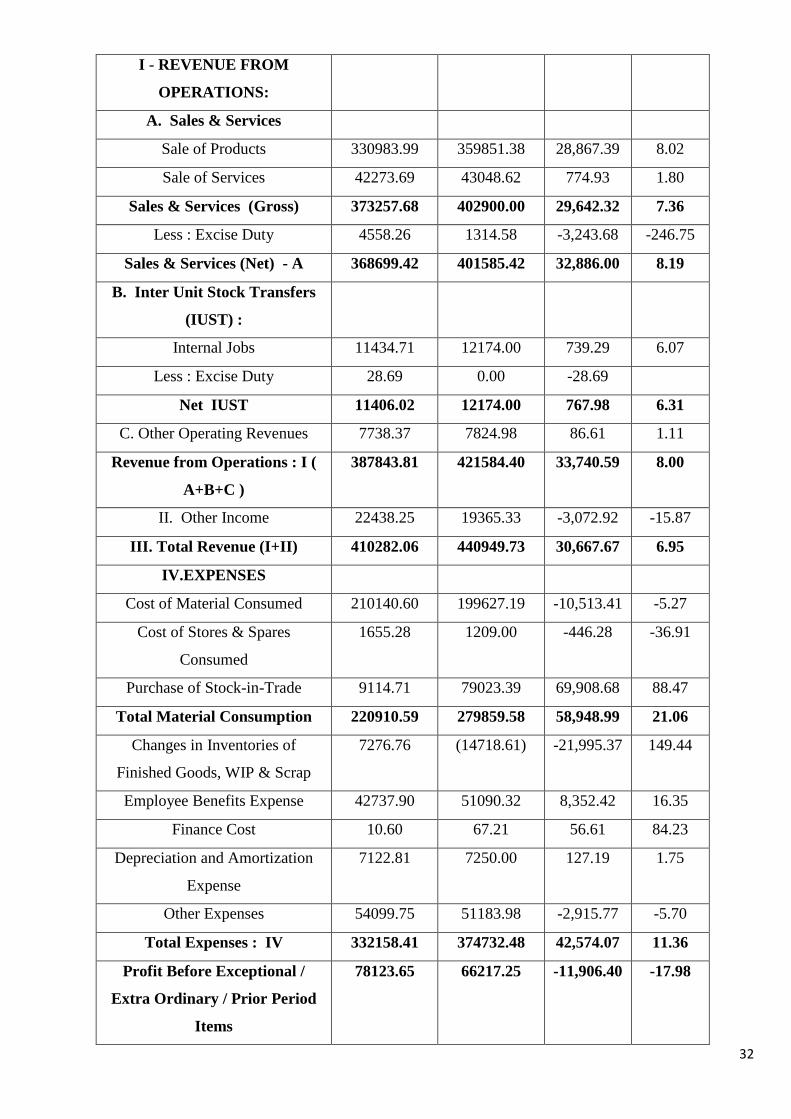
32
I - REVENUE FROM
OPERATIONS:
A. Sales & Services
Sale of Products 330983.99 359851.38 28,867.39 8.02
Sale of Services 42273.69 43048.62 774.93 1.80
Sales & Services (Gross) 373257.68 402900.00 29,642.32 7.36
Less : Excise Duty 4558.26 1314.58 -3,243.68 -246.75
Sales & Services (Net) - A 368699.42 401585.42 32,886.00 8.19
B. Inter Unit Stock Transfers
(IUST) :
Internal Jobs 11434.71 12174.00 739.29 6.07
Less : Excise Duty 28.69 0.00 -28.69
Net IUST 11406.02 12174.00 767.98 6.31
C. Other Operating Revenues 7738.37 7824.98 86.61 1.11
Revenue from Operations : I (
A+B+C )
387843.81 421584.40 33,740.59 8.00
II. Other Income 22438.25 19365.33 -3,072.92 -15.87
III. Total Revenue (I+II) 410282.06 440949.73 30,667.67 6.95
IV.EXPENSES
Cost of Material Consumed 210140.60 199627.19 -10,513.41 -5.27
Cost of Stores & Spares
Consumed
1655.28 1209.00 -446.28 -36.91
Purchase of Stock-in-Trade 9114.71 79023.39 69,908.68 88.47
Total Material Consumption 220910.59 279859.58 58,948.99 21.06
Changes in Inventories of
Finished Goods, WIP & Scrap
7276.76 (14718.61) -21,995.37 149.44
Employee Benefits Expense 42737.90 51090.32 8,352.42 16.35
Finance Cost 10.60 67.21 56.61 84.23
Depreciation and Amortization
Expense
7122.81 7250.00 127.19 1.75
Other Expenses 54099.75 51183.98 -2,915.77 -5.70
Total Expenses : IV 332158.41 374732.48 42,574.07 11.36
Profit Before Exceptional /
Extra Ordinary / Prior Period
Items
78123.65 66217.25 -11,906.40 -17.98
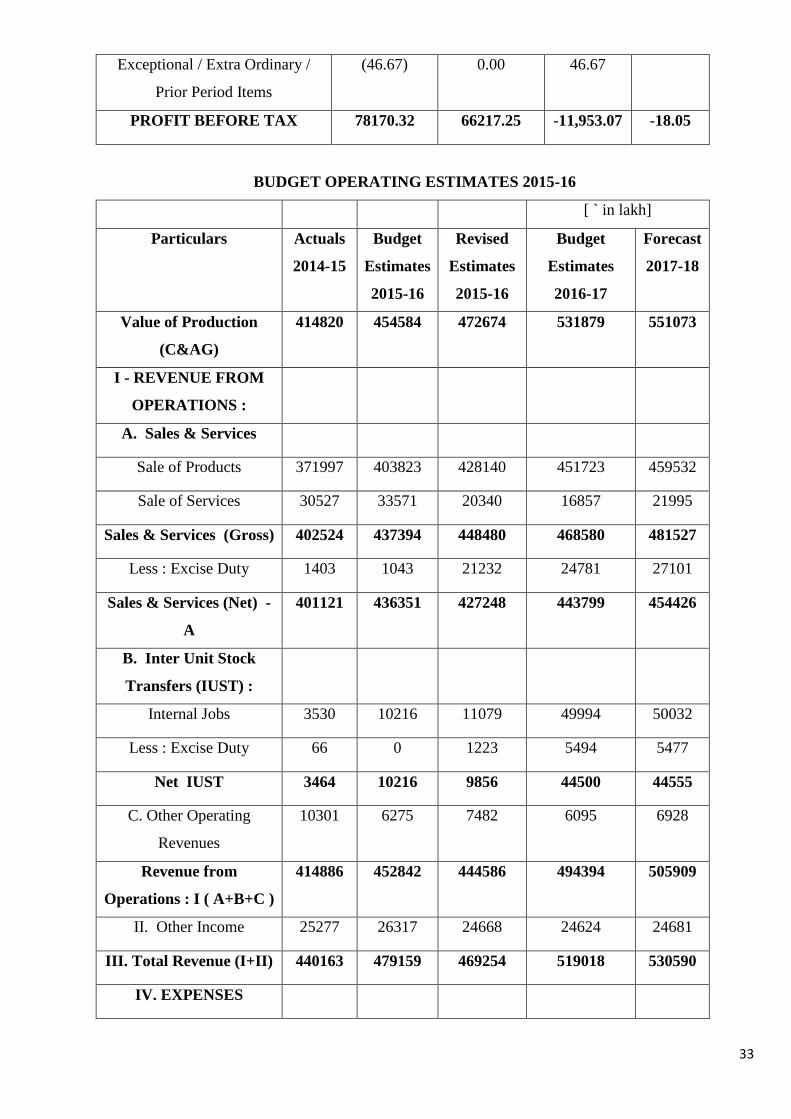
33
Exceptional / Extra Ordinary /
Prior Period Items
(46.67) 0.00 46.67
PROFIT BEFORE TAX 78170.32 66217.25 -11,953.07 -18.05
BUDGET OPERATING ESTIMATES 2015-16
[ ` in lakh]
Particulars Actuals
2014-15
Budget
Estimates
2015-16
Revised
Estimates
2015-16
Budget
Estimates
2016-17
Forecast
2017-18
Value of Production
(C&AG)
414820 454584 472674 531879 551073
I - REVENUE FROM
OPERATIONS :
A. Sales & Services
Sale of Products 371997 403823 428140 451723 459532
Sale of Services 30527 33571 20340 16857 21995
Sales & Services (Gross) 402524 437394 448480 468580 481527
Less : Excise Duty 1403 1043 21232 24781 27101
Sales & Services (Net) -
A
401121 436351 427248 443799 454426
B. Inter Unit Stock
Transfers (IUST) :
Internal Jobs 3530 10216 11079 49994 50032
Less : Excise Duty 66 0 1223 5494 5477
Net IUST 3464 10216 9856 44500 44555
C. Other Operating
Revenues
10301 6275 7482 6095 6928
Revenue from
Operations : I ( A+B+C )
414886 452842 444586 494394 505909
II. Other Income 25277 26317 24668 24624 24681
III. Total Revenue (I+II) 440163 479159 469254 519018 530590
IV. EXPENSES
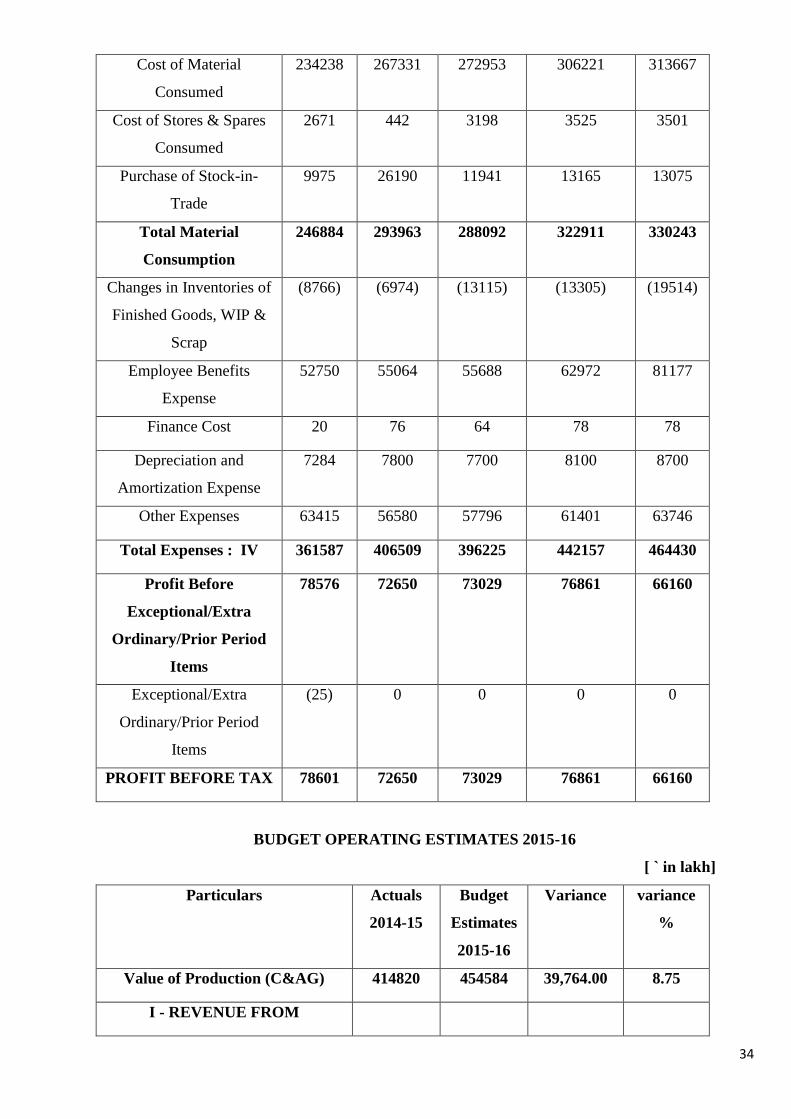
34
Cost of Material
Consumed
234238 267331 272953 306221 313667
Cost of Stores & Spares
Consumed
2671 442 3198 3525 3501
Purchase of Stock-in-
Trade
9975 26190 11941 13165 13075
Total Material
Consumption
246884 293963 288092 322911 330243
Changes in Inventories of
Finished Goods, WIP &
Scrap
(8766) (6974) (13115) (13305) (19514)
Employee Benefits
Expense
52750 55064 55688 62972 81177
Finance Cost 20 76 64 78 78
Depreciation and
Amortization Expense
7284 7800 7700 8100 8700
Other Expenses 63415 56580 57796 61401 63746
Total Expenses : IV 361587 406509 396225 442157 464430
Profit Before
Exceptional/Extra
Ordinary/Prior Period
Items
78576 72650 73029 76861 66160
Exceptional/Extra
Ordinary/Prior Period
Items
(25) 0 0 0 0
PROFIT BEFORE TAX 78601 72650 73029 76861 66160
BUDGET OPERATING ESTIMATES 2015-16
[ ` in lakh]
Particulars Actuals
2014-15
Budget
Estimates
2015-16
Variance variance
%
Value of Production (C&AG) 414820 454584 39,764.00 8.75
I - REVENUE FROM
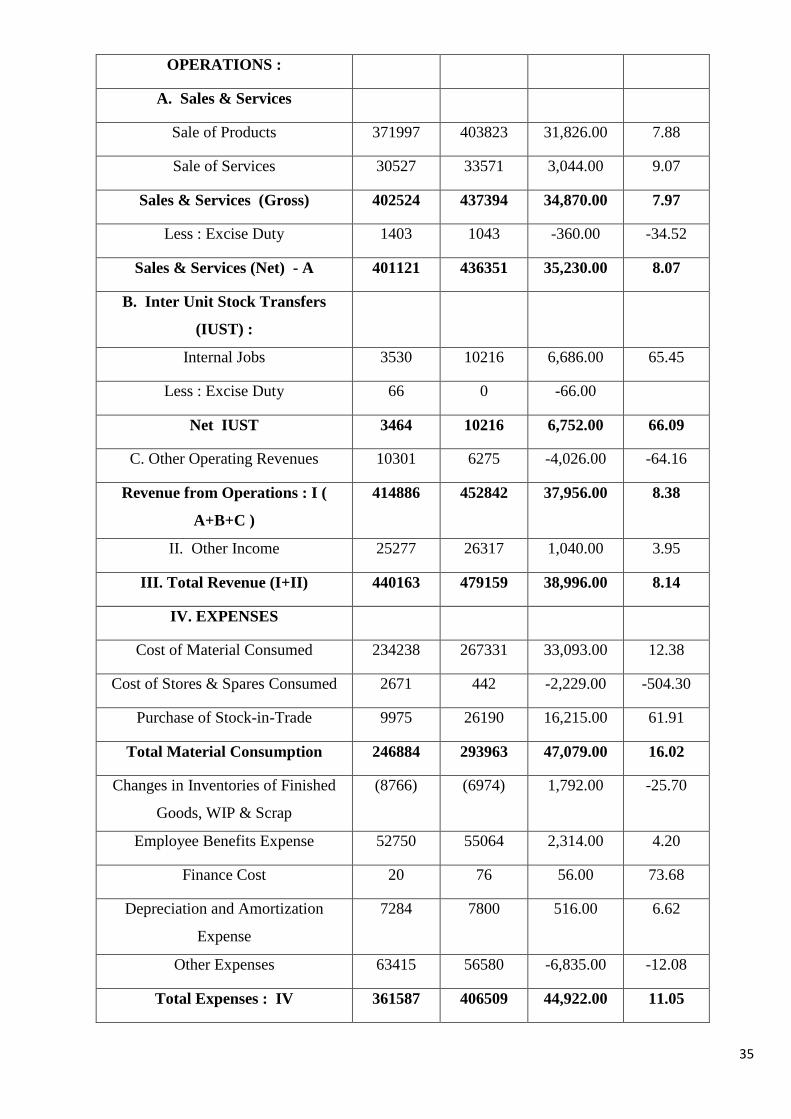
35
OPERATIONS :
A. Sales & Services
Sale of Products 371997 403823 31,826.00 7.88
Sale of Services 30527 33571 3,044.00 9.07
Sales & Services (Gross) 402524 437394 34,870.00 7.97
Less : Excise Duty 1403 1043 -360.00 -34.52
Sales & Services (Net) - A 401121 436351 35,230.00 8.07
B. Inter Unit Stock Transfers
(IUST) :
Internal Jobs 3530 10216 6,686.00 65.45
Less : Excise Duty 66 0 -66.00
Net IUST 3464 10216 6,752.00 66.09
C. Other Operating Revenues 10301 6275 -4,026.00 -64.16
Revenue from Operations : I (
A+B+C )
414886 452842 37,956.00 8.38
II. Other Income 25277 26317 1,040.00 3.95
III. Total Revenue (I+II) 440163 479159 38,996.00 8.14
IV. EXPENSES
Cost of Material Consumed 234238 267331 33,093.00 12.38
Cost of Stores & Spares Consumed 2671 442 -2,229.00 -504.30
Purchase of Stock-in-Trade 9975 26190 16,215.00 61.91
Total Material Consumption 246884 293963 47,079.00 16.02
Changes in Inventories of Finished
Goods, WIP & Scrap
(8766) (6974) 1,792.00 -25.70
Employee Benefits Expense 52750 55064 2,314.00 4.20
Finance Cost 20 76 56.00 73.68
Depreciation and Amortization
Expense
7284 7800 516.00 6.62
Other Expenses 63415 56580 -6,835.00 -12.08
Total Expenses : IV 361587 406509 44,922.00 11.05
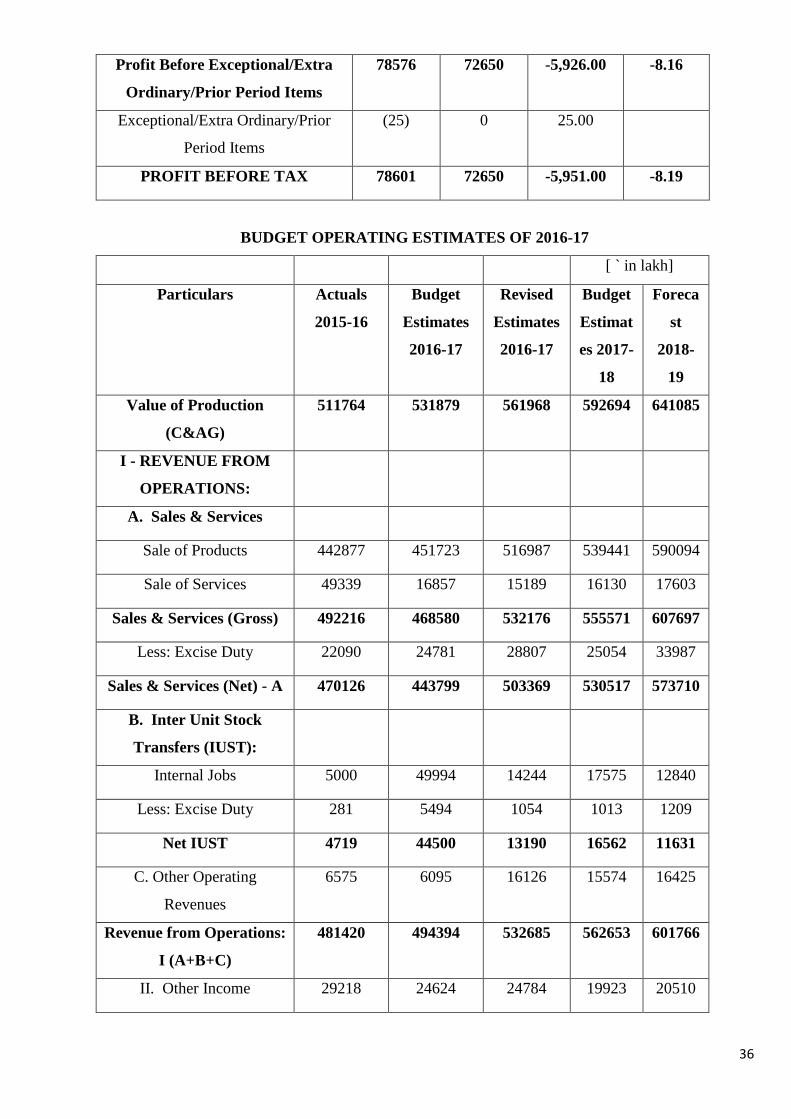
36
Profit Before Exceptional/Extra
Ordinary/Prior Period Items
78576 72650 -5,926.00 -8.16
Exceptional/Extra Ordinary/Prior
Period Items
(25) 0 25.00
PROFIT BEFORE TAX 78601 72650 -5,951.00 -8.19
BUDGET OPERATING ESTIMATES OF 2016-17
[ ` in lakh]
Particulars Actuals
2015-16
Budget
Estimates
2016-17
Revised
Estimates
2016-17
Budget
Estimat
es 2017-
18
Foreca
st
2018-
19
Value of Production
(C&AG)
511764 531879 561968 592694 641085
I - REVENUE FROM
OPERATIONS:
A. Sales & Services
Sale of Products 442877 451723 516987 539441 590094
Sale of Services 49339 16857 15189 16130 17603
Sales & Services (Gross) 492216 468580 532176 555571 607697
Less: Excise Duty 22090 24781 28807 25054 33987
Sales & Services (Net) - A 470126 443799 503369 530517 573710
B. Inter Unit Stock
Transfers (IUST):
Internal Jobs 5000 49994 14244 17575 12840
Less: Excise Duty 281 5494 1054 1013 1209
Net IUST 4719 44500 13190 16562 11631
C. Other Operating
Revenues
6575 6095 16126 15574 16425
Revenue from Operations:
I (A+B+C)
481420 494394 532685 562653 601766
II. Other Income 29218 24624 24784 19923 20510
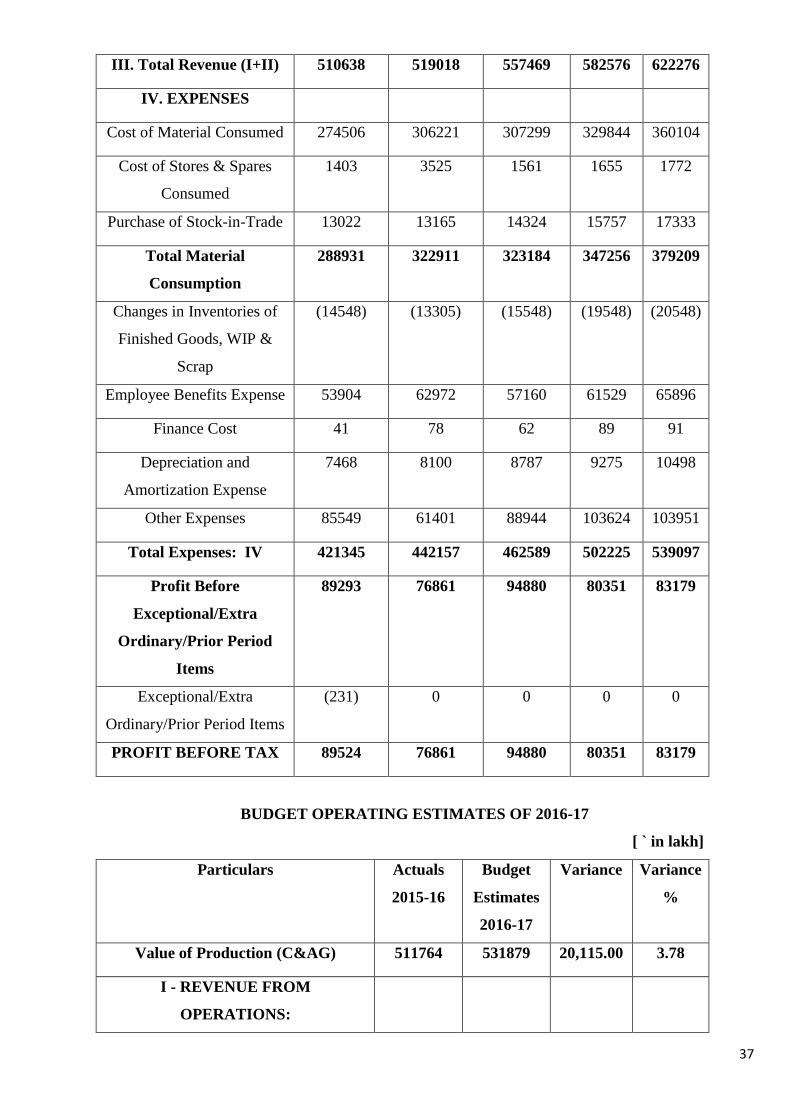
37
III. Total Revenue (I+II) 510638 519018 557469 582576 622276
IV. EXPENSES
Cost of Material Consumed 274506 306221 307299 329844 360104
Cost of Stores & Spares
Consumed
1403 3525 1561 1655 1772
Purchase of Stock-in-Trade 13022 13165 14324 15757 17333
Total Material
Consumption
288931 322911 323184 347256 379209
Changes in Inventories of
Finished Goods, WIP &
Scrap
(14548) (13305) (15548) (19548) (20548)
Employee Benefits Expense 53904 62972 57160 61529 65896
Finance Cost 41 78 62 89 91
Depreciation and
Amortization Expense
7468 8100 8787 9275 10498
Other Expenses 85549 61401 88944 103624 103951
Total Expenses: IV 421345 442157 462589 502225 539097
Profit Before
Exceptional/Extra
Ordinary/Prior Period
Items
89293 76861 94880 80351 83179
Exceptional/Extra
Ordinary/Prior Period Items
(231) 0 0 0 0
PROFIT BEFORE TAX 89524 76861 94880 80351 83179
BUDGET OPERATING ESTIMATES OF 2016-17
[ ` in lakh]
Particulars Actuals
2015-16
Budget
Estimates
2016-17
Variance Variance
%
Value of Production (C&AG) 511764 531879 20,115.00 3.78
I - REVENUE FROM
OPERATIONS:
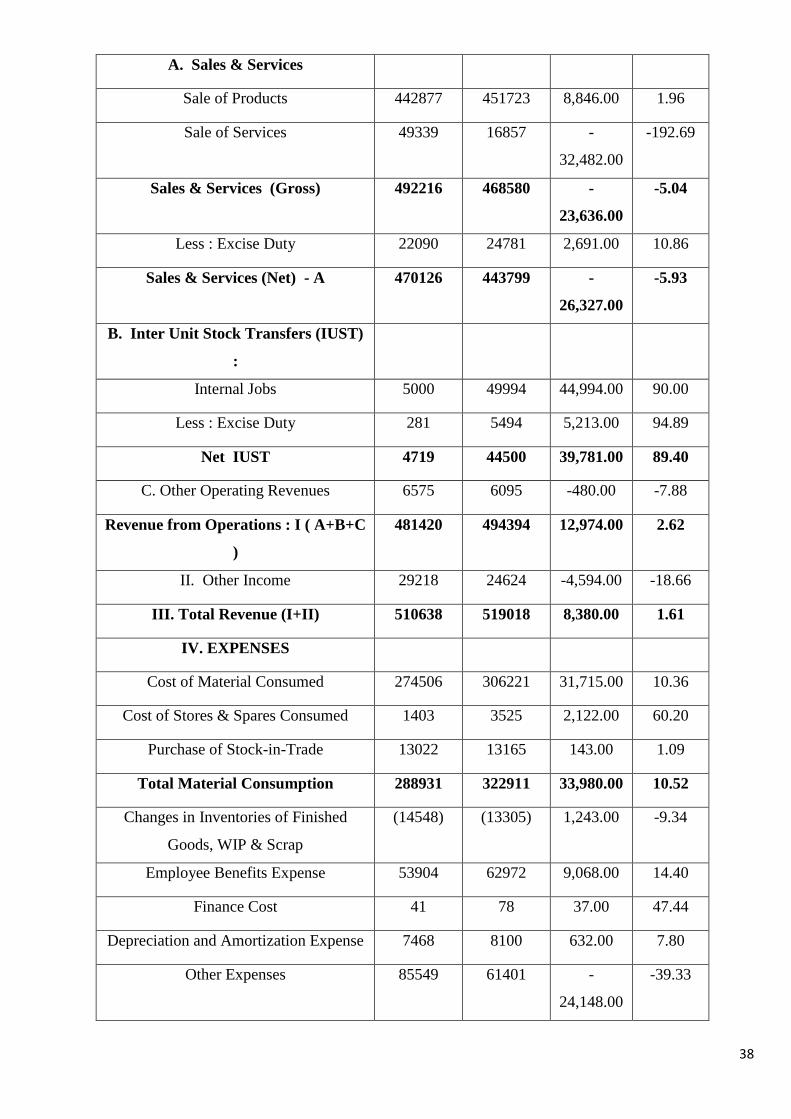
38
A. Sales & Services
Sale of Products 442877 451723 8,846.00 1.96
Sale of Services 49339 16857 -
32,482.00
-192.69
Sales & Services (Gross) 492216 468580 -
23,636.00
-5.04
Less : Excise Duty 22090 24781 2,691.00 10.86
Sales & Services (Net) - A 470126 443799 -
26,327.00
-5.93
B. Inter Unit Stock Transfers (IUST)
:
Internal Jobs 5000 49994 44,994.00 90.00
Less : Excise Duty 281 5494 5,213.00 94.89
Net IUST 4719 44500 39,781.00 89.40
C. Other Operating Revenues 6575 6095 -480.00 -7.88
Revenue from Operations : I ( A+B+C
)
481420 494394 12,974.00 2.62
II. Other Income 29218 24624 -4,594.00 -18.66
III. Total Revenue (I+II) 510638 519018 8,380.00 1.61
IV. EXPENSES
Cost of Material Consumed 274506 306221 31,715.00 10.36
Cost of Stores & Spares Consumed 1403 3525 2,122.00 60.20
Purchase of Stock-in-Trade 13022 13165 143.00 1.09
Total Material Consumption 288931 322911 33,980.00 10.52
Changes in Inventories of Finished
Goods, WIP & Scrap
(14548) (13305) 1,243.00 -9.34
Employee Benefits Expense 53904 62972 9,068.00 14.40
Finance Cost 41 78 37.00 47.44
Depreciation and Amortization Expense 7468 8100 632.00 7.80
Other Expenses 85549 61401 -
24,148.00
-39.33
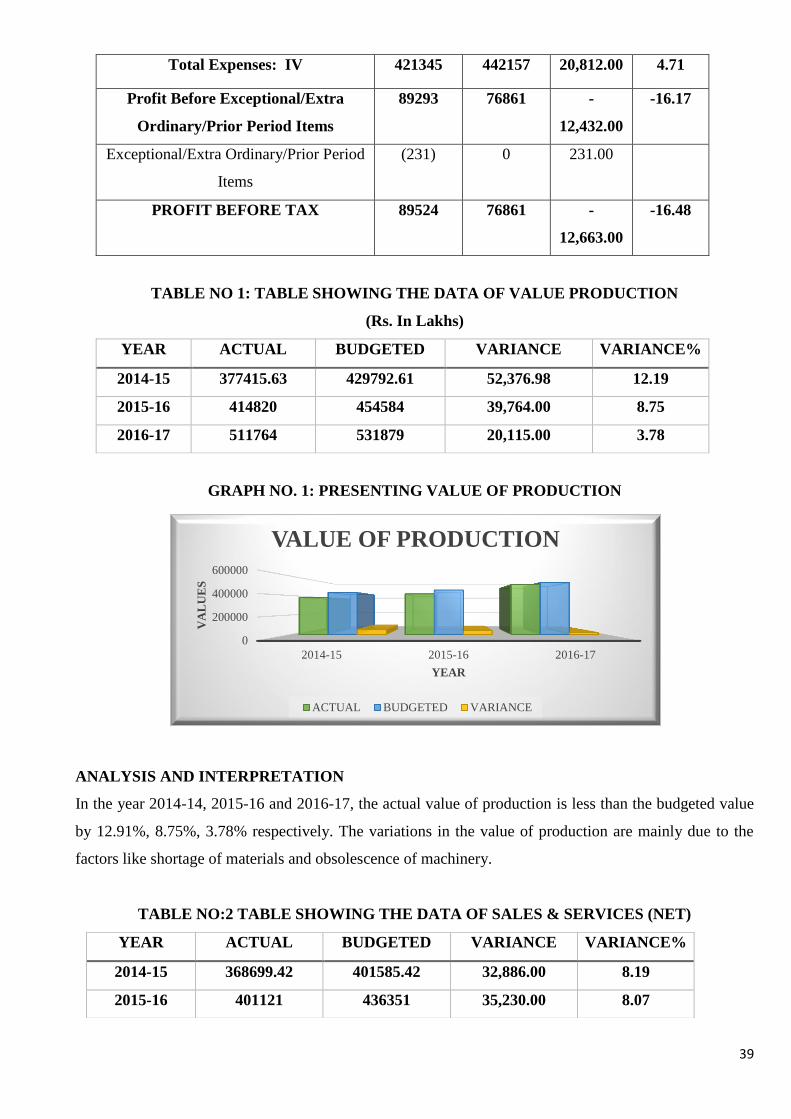
39
Total Expenses: IV 421345 442157 20,812.00 4.71
Profit Before Exceptional/Extra
Ordinary/Prior Period Items
89293 76861 -
12,432.00
-16.17
Exceptional/Extra Ordinary/Prior Period
Items
(231) 0 231.00
PROFIT BEFORE TAX 89524 76861 -
12,663.00
-16.48
TABLE NO 1: TABLE SHOWING THE DATA OF VALUE PRODUCTION
(Rs. In Lakhs)
YEAR ACTUAL BUDGETED VARIANCE VARIANCE%
2014-15 377415.63 429792.61 52,376.98 12.19
2015-16 414820 454584 39,764.00 8.75
2016-17 511764 531879 20,115.00 3.78
GRAPH NO. 1: PRESENTING VALUE OF PRODUCTION
ANALYSIS AND INTERPRETATION
In the year 2014-14, 2015-16 and 2016-17, the actual value of production is less than the budgeted value
by 12.91%, 8.75%, 3.78% respectively. The variations in the value of production are mainly due to the
factors like shortage of materials and obsolescence of machinery.
TABLE NO:2 TABLE SHOWING THE DATA OF SALES & SERVICES (NET)
0
200000
400000
600000
2014-15 2015-16 2016-17
VA
LU
ES
YEAR
VALUE OF PRODUCTION
ACTUAL BUDGETED VARIANCE
YEAR ACTUAL BUDGETED VARIANCE VARIANCE%
2014-15 368699.42 401585.42 32,886.00 8.19
2015-16 401121 436351 35,230.00 8.07
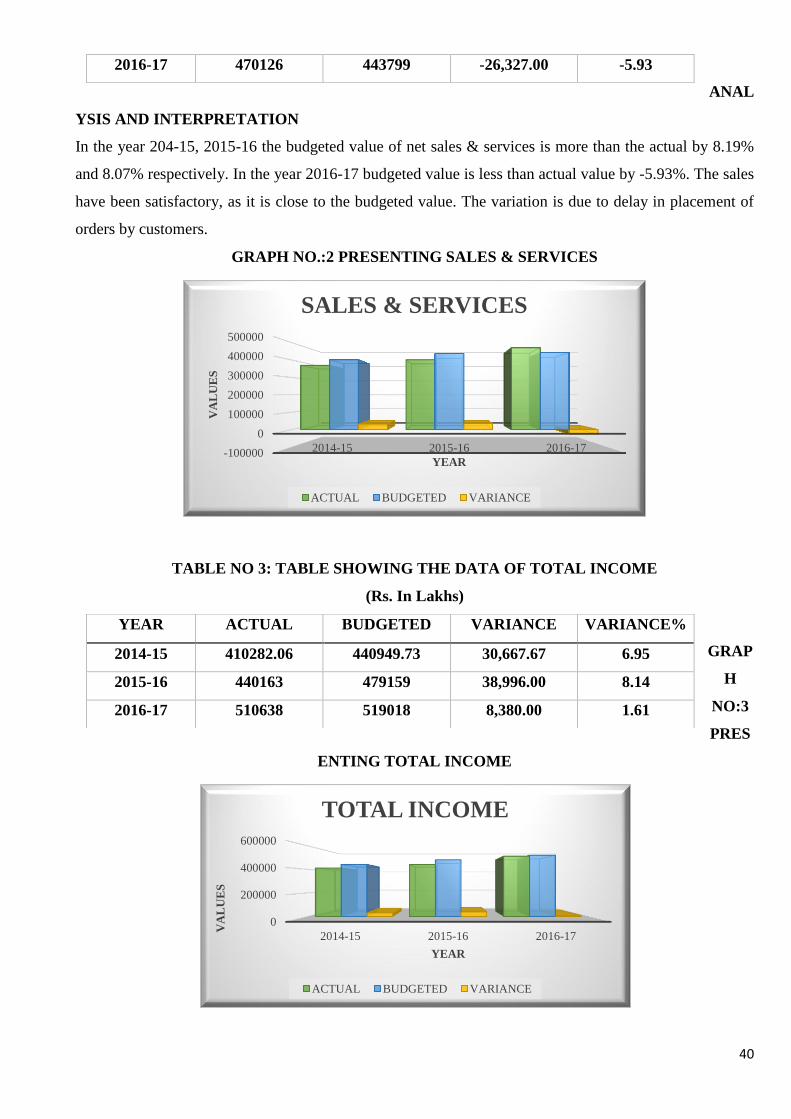
40
ANAL
YSIS AND INTERPRETATION
In the year 204-15, 2015-16 the budgeted value of net sales & services is more than the actual by 8.19%
and 8.07% respectively. In the year 2016-17 budgeted value is less than actual value by -5.93%. The sales
have been satisfactory, as it is close to the budgeted value. The variation is due to delay in placement of
orders by customers.
GRAPH NO.:2 PRESENTING SALES & SERVICES
TABLE NO 3: TABLE SHOWING THE DATA OF TOTAL INCOME
(Rs. In Lakhs)
GRAP
H
NO:3
PRES
ENTING TOTAL INCOME
-100000
0
100000
200000
300000
400000
500000
2014-15 2015-16 2016-17
VA
LU
ES
YEAR
SALES & SERVICES
ACTUAL BUDGETED VARIANCE
0
200000
400000
600000
2014-15 2015-16 2016-17
VA
LU
ES
YEAR
TOTAL INCOME
ACTUAL BUDGETED VARIANCE
2016-17 470126 443799 -26,327.00 -5.93
YEAR ACTUAL BUDGETED VARIANCE VARIANCE%
2014-15 410282.06 440949.73 30,667.67 6.95
2015-16 440163 479159 38,996.00 8.14
2016-17 510638 519018 8,380.00 1.61
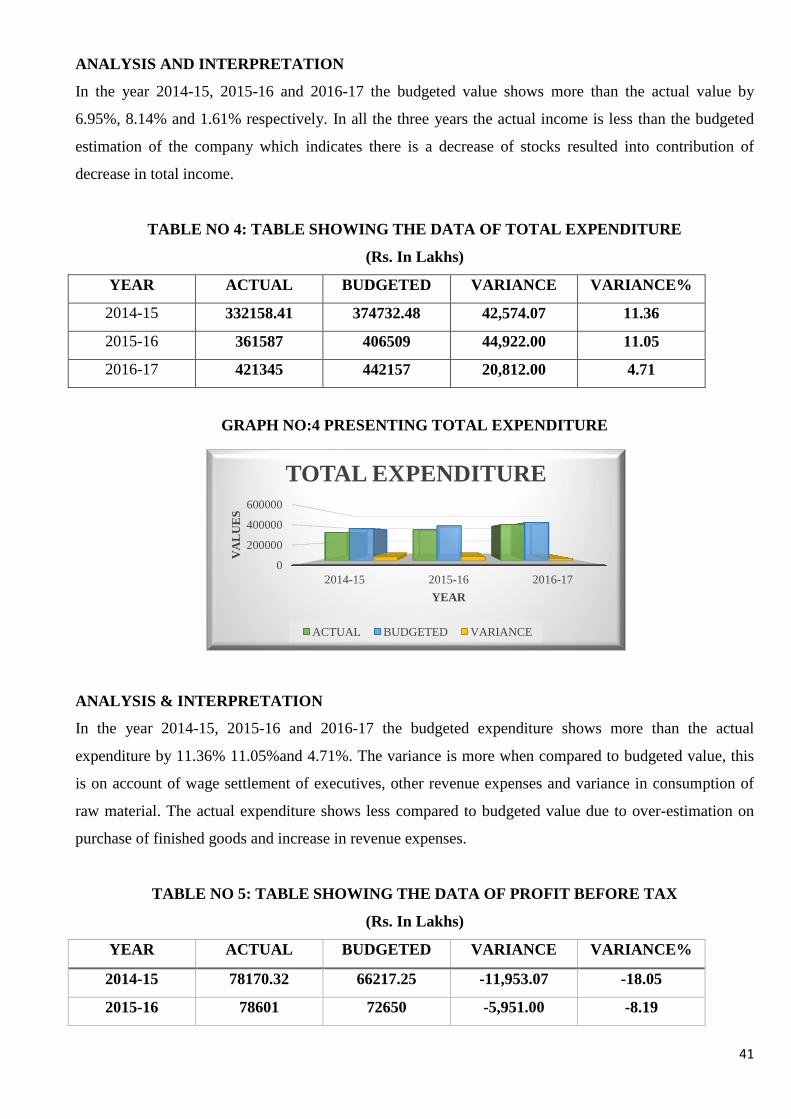
41
ANALYSIS AND INTERPRETATION
In the year 2014-15, 2015-16 and 2016-17 the budgeted value shows more than the actual value by
6.95%, 8.14% and 1.61% respectively. In all the three years the actual income is less than the budgeted
estimation of the company which indicates there is a decrease of stocks resulted into contribution of
decrease in total income.
TABLE NO 4: TABLE SHOWING THE DATA OF TOTAL EXPENDITURE
(Rs. In Lakhs)
YEAR ACTUAL BUDGETED VARIANCE VARIANCE%
2014-15 332158.41 374732.48 42,574.07 11.36
2015-16 361587 406509 44,922.00 11.05
2016-17 421345 442157 20,812.00 4.71
GRAPH NO:4 PRESENTING TOTAL EXPENDITURE
ANALYSIS & INTERPRETATION
In the year 2014-15, 2015-16 and 2016-17 the budgeted expenditure shows more than the actual
expenditure by 11.36% 11.05%and 4.71%. The variance is more when compared to budgeted value, this
is on account of wage settlement of executives, other revenue expenses and variance in consumption of
raw material. The actual expenditure shows less compared to budgeted value due to over-estimation on
purchase of finished goods and increase in revenue expenses.
TABLE NO 5: TABLE SHOWING THE DATA OF PROFIT BEFORE TAX
(Rs. In Lakhs)
YEAR ACTUAL BUDGETED VARIANCE VARIANCE%
2014-15 78170.32 66217.25 -11,953.07 -18.05
2015-16 78601 72650 -5,951.00 -8.19
0
200000
400000
600000
2014-15 2015-16 2016-17
VA
LU
ES
YEAR
TOTAL EXPENDITURE
ACTUAL BUDGETED VARIANCE
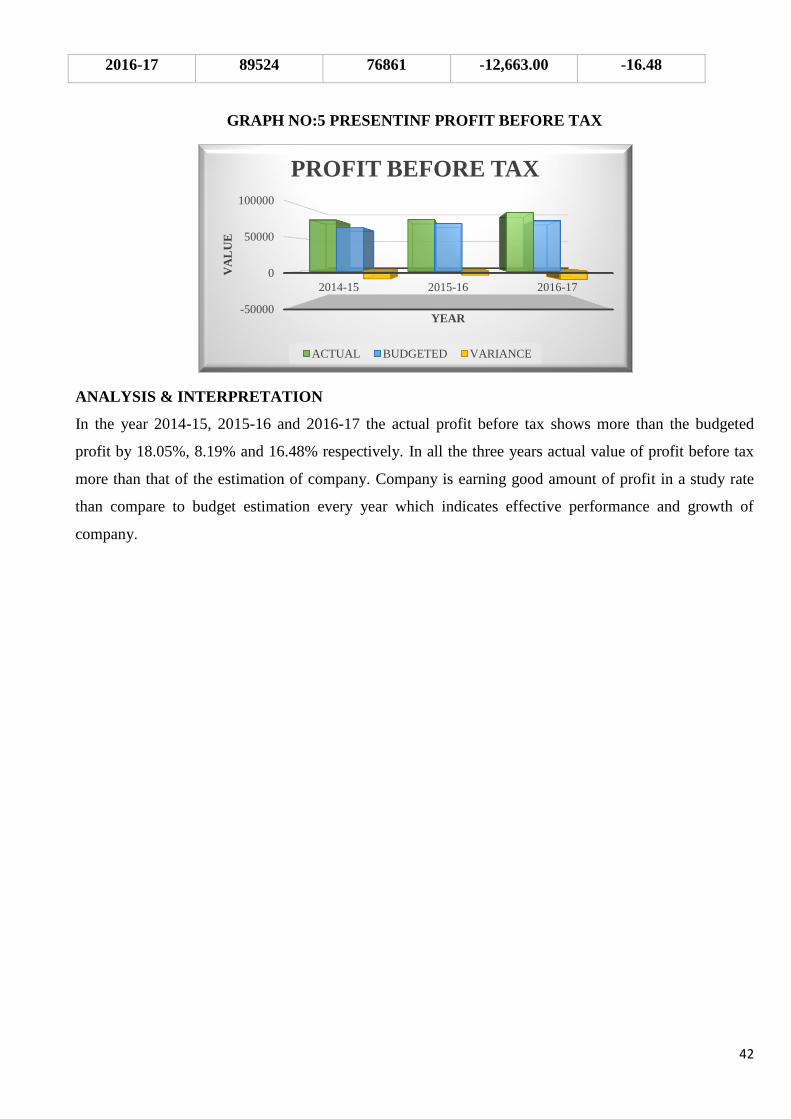
42
2016-17 89524 76861 -12,663.00 -16.48
GRAPH NO:5 PRESENTINF PROFIT BEFORE TAX
ANALYSIS & INTERPRETATION
In the year 2014-15, 2015-16 and 2016-17 the actual profit before tax shows more than the budgeted
profit by 18.05%, 8.19% and 16.48% respectively. In all the three years actual value of profit before tax
more than that of the estimation of company. Company is earning good amount of profit in a study rate
than compare to budget estimation every year which indicates effective performance and growth of
company.
-50000
0
50000
100000
2014-15 2015-16 2016-17
VA
LU
E
YEAR
PROFIT BEFORE TAX
ACTUAL BUDGETED VARIANCE
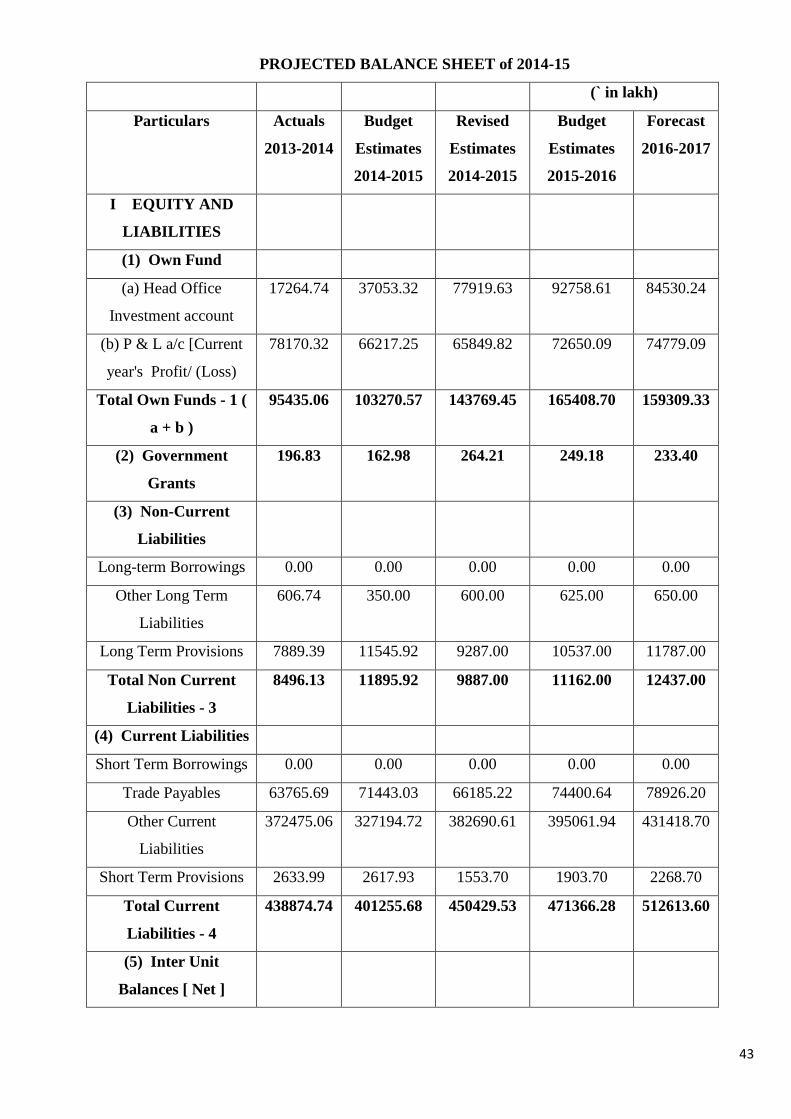
43
PROJECTED BALANCE SHEET of 2014-15
(` in lakh)
Particulars Actuals
2013-2014
Budget
Estimates
2014-2015
Revised
Estimates
2014-2015
Budget
Estimates
2015-2016
Forecast
2016-2017
I EQUITY AND
LIABILITIES
(1) Own Fund
(a) Head Office
Investment account
17264.74 37053.32 77919.63 92758.61 84530.24
(b) P & L a/c [Current
year's Profit/ (Loss)
78170.32 66217.25 65849.82 72650.09 74779.09
Total Own Funds - 1 (
a + b )
95435.06 103270.57 143769.45 165408.70 159309.33
(2) Government
Grants
196.83 162.98 264.21 249.18 233.40
(3) Non-Current
Liabilities
Long-term Borrowings 0.00 0.00 0.00 0.00 0.00
Other Long Term
Liabilities
606.74 350.00 600.00 625.00 650.00
Long Term Provisions 7889.39 11545.92 9287.00 10537.00 11787.00
Total Non Current
Liabilities - 3
8496.13 11895.92 9887.00 11162.00 12437.00
(4) Current Liabilities
Short Term Borrowings 0.00 0.00 0.00 0.00 0.00
Trade Payables 63765.69 71443.03 66185.22 74400.64 78926.20
Other Current
Liabilities
372475.06 327194.72 382690.61 395061.94 431418.70
Short Term Provisions 2633.99 2617.93 1553.70 1903.70 2268.70
Total Current
Liabilities - 4
438874.74 401255.68 450429.53 471366.28 512613.60
(5) Inter Unit
Balances [ Net ]
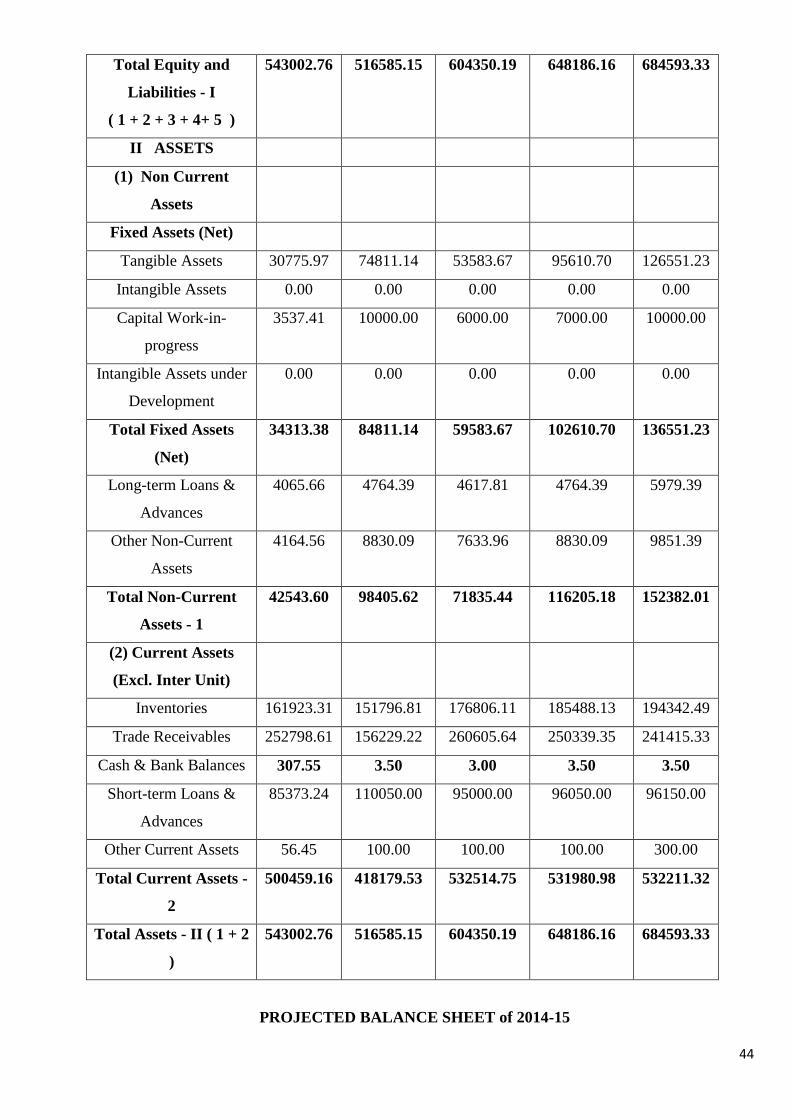
44
Total Equity and
Liabilities - I
( 1 + 2 + 3 + 4+ 5 )
543002.76 516585.15 604350.19 648186.16 684593.33
II ASSETS
(1) Non Current
Assets
Fixed Assets (Net)
Tangible Assets 30775.97 74811.14 53583.67 95610.70 126551.23
Intangible Assets 0.00 0.00 0.00 0.00 0.00
Capital Work-in-
progress
3537.41 10000.00 6000.00 7000.00 10000.00
Intangible Assets under
Development
0.00 0.00 0.00 0.00 0.00
Total Fixed Assets
(Net)
34313.38 84811.14 59583.67 102610.70 136551.23
Long-term Loans &
Advances
4065.66 4764.39 4617.81 4764.39 5979.39
Other Non-Current
Assets
4164.56 8830.09 7633.96 8830.09 9851.39
Total Non-Current
Assets - 1
42543.60 98405.62 71835.44 116205.18 152382.01
(2) Current Assets
(Excl. Inter Unit)
Inventories 161923.31 151796.81 176806.11 185488.13 194342.49
Trade Receivables 252798.61 156229.22 260605.64 250339.35 241415.33
Cash & Bank Balances 307.55 3.50 3.00 3.50 3.50
Short-term Loans &
Advances
85373.24 110050.00 95000.00 96050.00 96150.00
Other Current Assets 56.45 100.00 100.00 100.00 300.00
Total Current Assets -
2
500459.16 418179.53 532514.75 531980.98 532211.32
Total Assets - II ( 1 + 2
)
543002.76 516585.15 604350.19 648186.16 684593.33
PROJECTED BALANCE SHEET of 2014-15
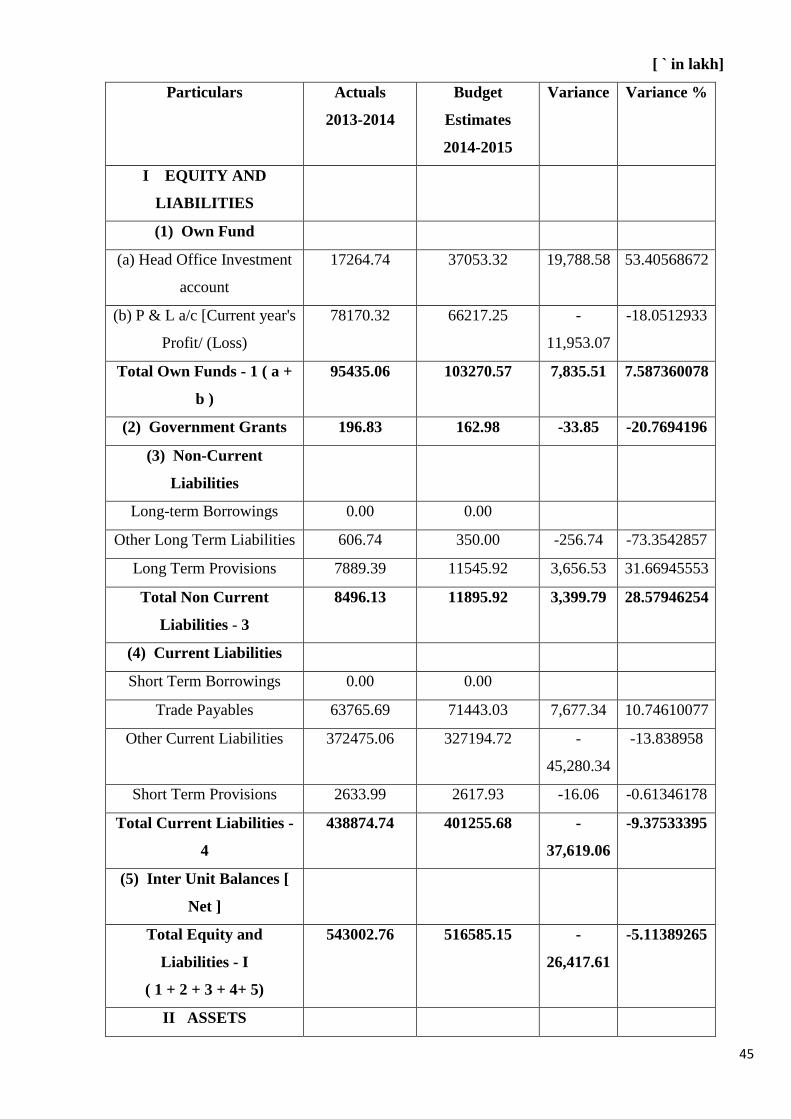
45
[ ` in lakh]
Particulars Actuals
2013-2014
Budget
Estimates
2014-2015
Variance Variance %
I EQUITY AND
LIABILITIES
(1) Own Fund
(a) Head Office Investment
account
17264.74 37053.32 19,788.58 53.40568672
(b) P & L a/c [Current year's
Profit/ (Loss)
78170.32 66217.25 -
11,953.07
-18.0512933
Total Own Funds - 1 ( a +
b )
95435.06 103270.57 7,835.51 7.587360078
(2) Government Grants 196.83 162.98 -33.85 -20.7694196
(3) Non-Current
Liabilities
Long-term Borrowings 0.00 0.00
Other Long Term Liabilities 606.74 350.00 -256.74 -73.3542857
Long Term Provisions 7889.39 11545.92 3,656.53 31.66945553
Total Non Current
Liabilities - 3
8496.13 11895.92 3,399.79 28.57946254
(4) Current Liabilities
Short Term Borrowings 0.00 0.00
Trade Payables 63765.69 71443.03 7,677.34 10.74610077
Other Current Liabilities 372475.06 327194.72 -
45,280.34
-13.838958
Short Term Provisions 2633.99 2617.93 -16.06 -0.61346178
Total Current Liabilities -
4
438874.74 401255.68 -
37,619.06
-9.37533395
(5) Inter Unit Balances [
Net ]
Total Equity and
Liabilities - I
( 1 + 2 + 3 + 4+ 5)
543002.76 516585.15 -
26,417.61
-5.11389265
II ASSETS
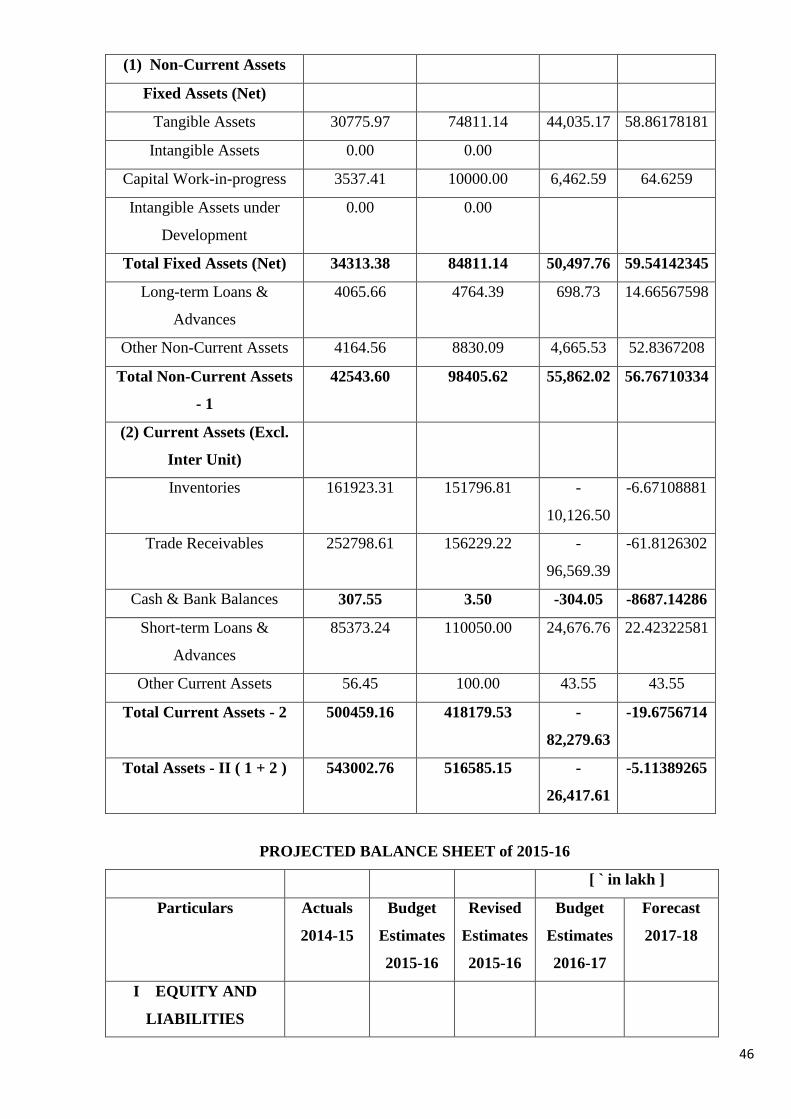
46
(1) Non-Current Assets
Fixed Assets (Net)
Tangible Assets 30775.97 74811.14 44,035.17 58.86178181
Intangible Assets 0.00 0.00
Capital Work-in-progress 3537.41 10000.00 6,462.59 64.6259
Intangible Assets under
Development
0.00 0.00
Total Fixed Assets (Net) 34313.38 84811.14 50,497.76 59.54142345
Long-term Loans &
Advances
4065.66 4764.39 698.73 14.66567598
Other Non-Current Assets 4164.56 8830.09 4,665.53 52.8367208
Total Non-Current Assets
- 1
42543.60 98405.62 55,862.02 56.76710334
(2) Current Assets (Excl.
Inter Unit)
Inventories 161923.31 151796.81 -
10,126.50
-6.67108881
Trade Receivables 252798.61 156229.22 -
96,569.39
-61.8126302
Cash & Bank Balances 307.55 3.50 -304.05 -8687.14286
Short-term Loans &
Advances
85373.24 110050.00 24,676.76 22.42322581
Other Current Assets 56.45 100.00 43.55 43.55
Total Current Assets - 2 500459.16 418179.53 -
82,279.63
-19.6756714
Total Assets - II ( 1 + 2 ) 543002.76 516585.15 -
26,417.61
-5.11389265
PROJECTED BALANCE SHEET of 2015-16
[ ` in lakh ]
Particulars Actuals
2014-15
Budget
Estimates
2015-16
Revised
Estimates
2015-16
Budget
Estimates
2016-17
Forecast
2017-18
I EQUITY AND
LIABILITIES
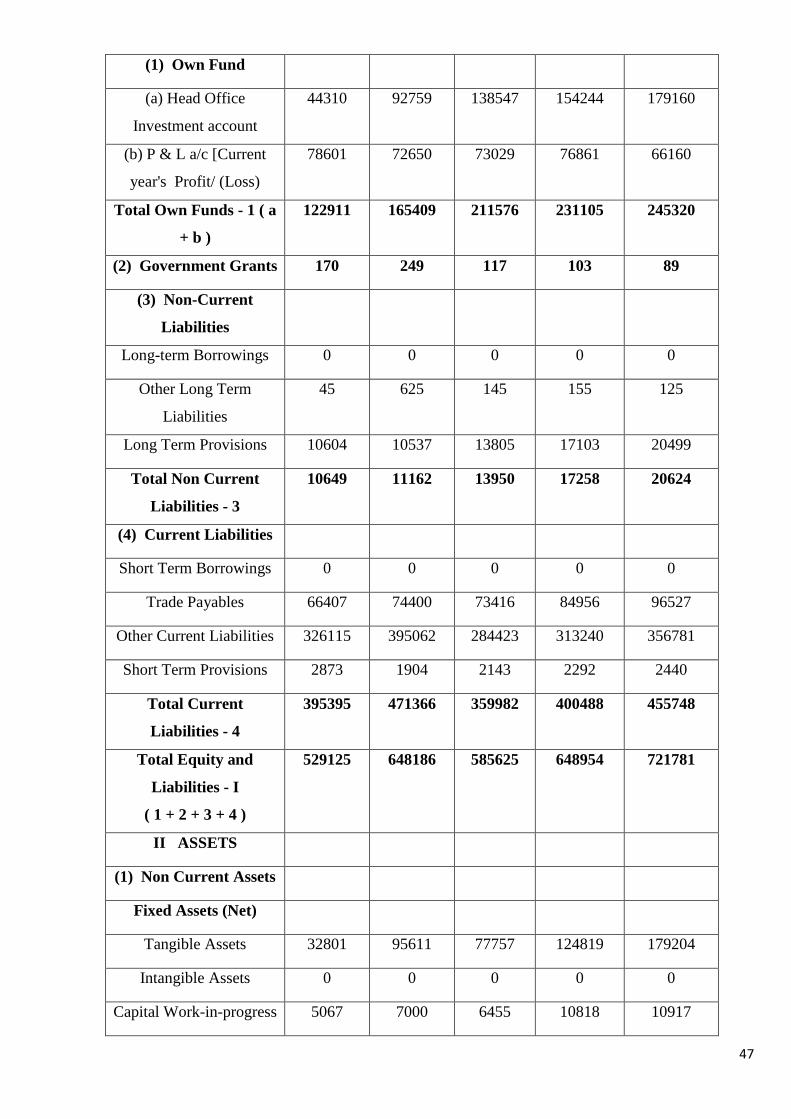
47
(1) Own Fund
(a) Head Office
Investment account
44310 92759 138547 154244 179160
(b) P & L a/c [Current
year's Profit/ (Loss)
78601 72650 73029 76861 66160
Total Own Funds - 1 ( a
+ b )
122911 165409 211576 231105 245320
(2) Government Grants 170 249 117 103 89
(3) Non-Current
Liabilities
Long-term Borrowings 0 0 0 0 0
Other Long Term
Liabilities
45 625 145 155 125
Long Term Provisions 10604 10537 13805 17103 20499
Total Non Current
Liabilities - 3
10649 11162 13950 17258 20624
(4) Current Liabilities
Short Term Borrowings 0 0 0 0 0
Trade Payables 66407 74400 73416 84956 96527
Other Current Liabilities 326115 395062 284423 313240 356781
Short Term Provisions 2873 1904 2143 2292 2440
Total Current
Liabilities - 4
395395 471366 359982 400488 455748
Total Equity and
Liabilities - I
( 1 + 2 + 3 + 4 )
529125 648186 585625 648954 721781
II ASSETS
(1) Non Current Assets
Fixed Assets (Net)
Tangible Assets 32801 95611 77757 124819 179204
Intangible Assets 0 0 0 0 0
Capital Work-in-progress 5067 7000 6455 10818 10917
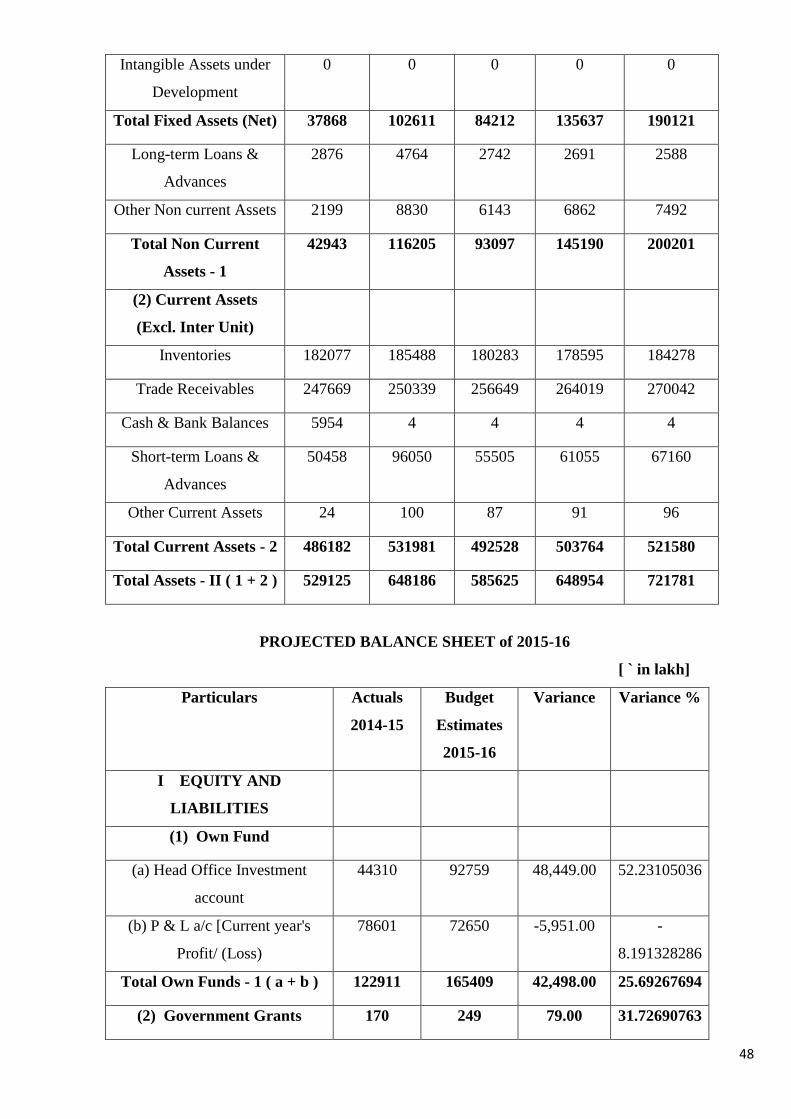
48
Intangible Assets under
Development
0 0 0 0 0
Total Fixed Assets (Net) 37868 102611 84212 135637 190121
Long-term Loans &
Advances
2876 4764 2742 2691 2588
Other Non current Assets 2199 8830 6143 6862 7492
Total Non Current
Assets - 1
42943 116205 93097 145190 200201
(2) Current Assets
(Excl. Inter Unit)
Inventories 182077 185488 180283 178595 184278
Trade Receivables 247669 250339 256649 264019 270042
Cash & Bank Balances 5954 4 4 4 4
Short-term Loans &
Advances
50458 96050 55505 61055 67160
Other Current Assets 24 100 87 91 96
Total Current Assets - 2 486182 531981 492528 503764 521580
Total Assets - II ( 1 + 2 ) 529125 648186 585625 648954 721781
PROJECTED BALANCE SHEET of 2015-16
[ ` in lakh]
Particulars Actuals
2014-15
Budget
Estimates
2015-16
Variance Variance %
I EQUITY AND
LIABILITIES
(1) Own Fund
(a) Head Office Investment
account
44310 92759 48,449.00 52.23105036
(b) P & L a/c [Current year's
Profit/ (Loss)
78601 72650 -5,951.00 -
8.191328286
Total Own Funds - 1 ( a + b ) 122911 165409 42,498.00 25.69267694
(2) Government Grants 170 249 79.00 31.72690763
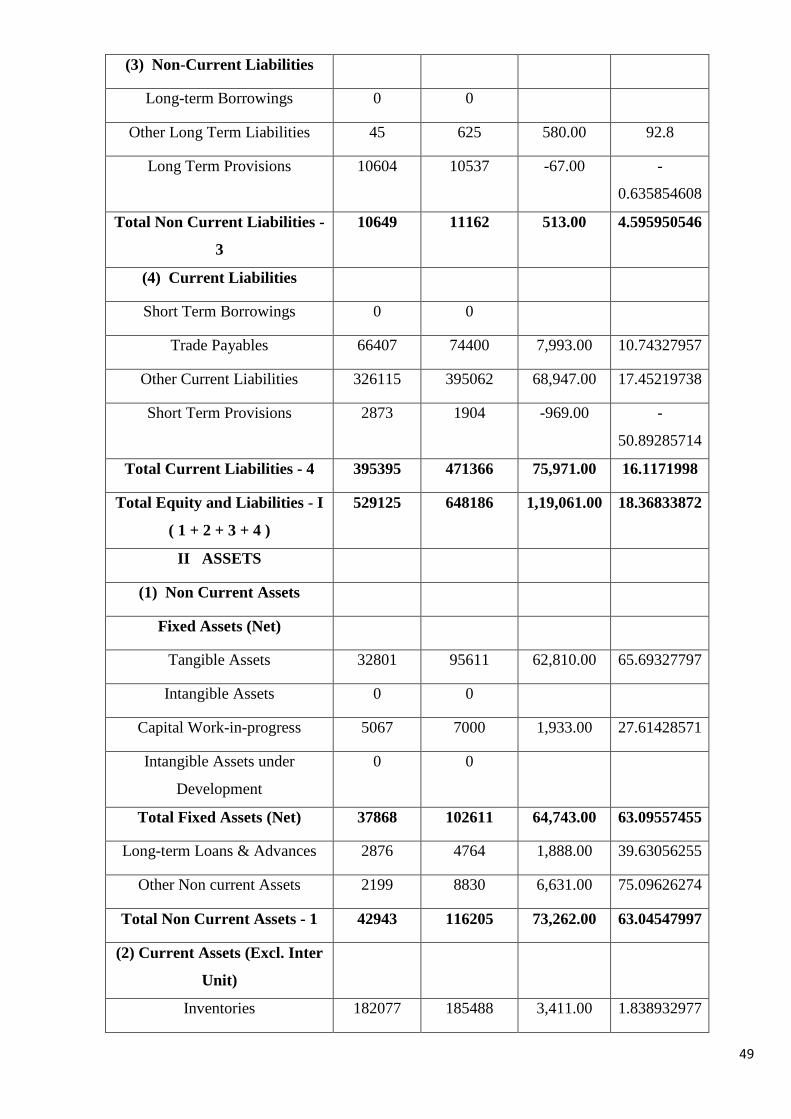
49
(3) Non-Current Liabilities
Long-term Borrowings 0 0
Other Long Term Liabilities 45 625 580.00 92.8
Long Term Provisions 10604 10537 -67.00 -
0.635854608
Total Non Current Liabilities -
3
10649 11162 513.00 4.595950546
(4) Current Liabilities
Short Term Borrowings 0 0
Trade Payables 66407 74400 7,993.00 10.74327957
Other Current Liabilities 326115 395062 68,947.00 17.45219738
Short Term Provisions 2873 1904 -969.00 -
50.89285714
Total Current Liabilities - 4 395395 471366 75,971.00 16.1171998
Total Equity and Liabilities - I
( 1 + 2 + 3 + 4 )
529125 648186 1,19,061.00 18.36833872
II ASSETS
(1) Non Current Assets
Fixed Assets (Net)
Tangible Assets 32801 95611 62,810.00 65.69327797
Intangible Assets 0 0
Capital Work-in-progress 5067 7000 1,933.00 27.61428571
Intangible Assets under
Development
0 0
Total Fixed Assets (Net) 37868 102611 64,743.00 63.09557455
Long-term Loans & Advances 2876 4764 1,888.00 39.63056255
Other Non current Assets 2199 8830 6,631.00 75.09626274
Total Non Current Assets - 1 42943 116205 73,262.00 63.04547997
(2) Current Assets (Excl. Inter
Unit)
Inventories 182077 185488 3,411.00 1.838932977
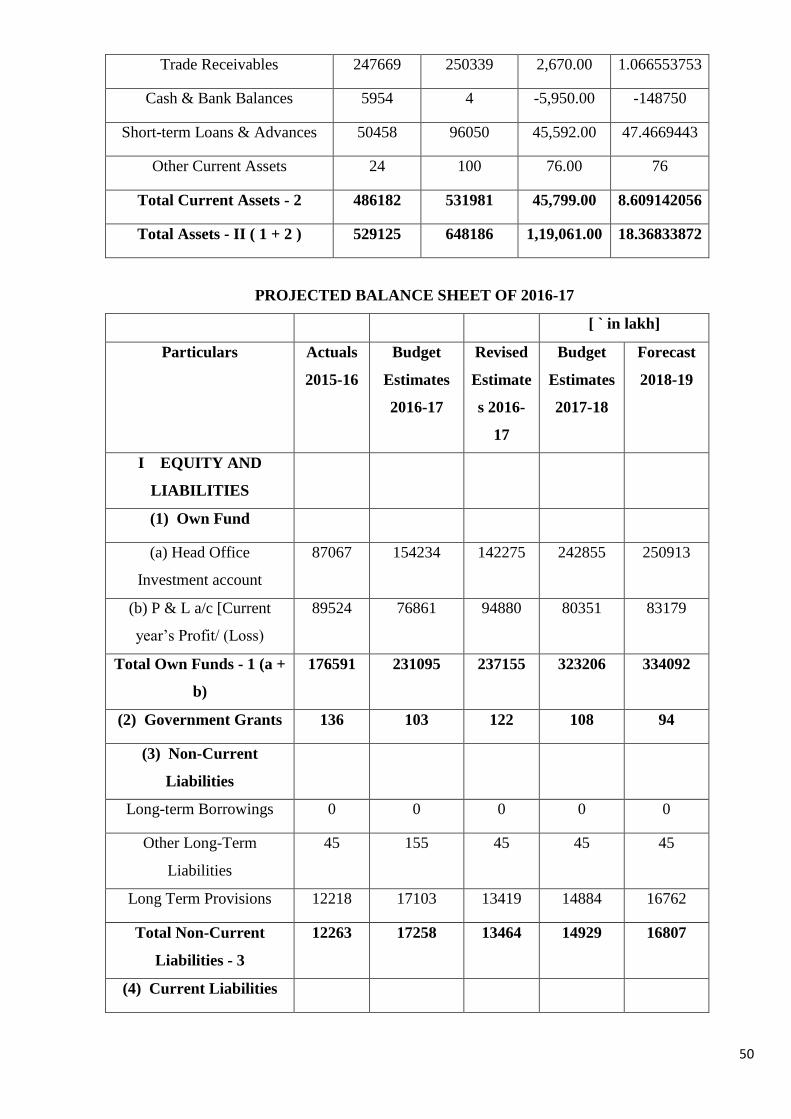
50
Trade Receivables 247669 250339 2,670.00 1.066553753
Cash & Bank Balances 5954 4 -5,950.00 -148750
Short-term Loans & Advances 50458 96050 45,592.00 47.4669443
Other Current Assets 24 100 76.00 76
Total Current Assets - 2 486182 531981 45,799.00 8.609142056
Total Assets - II ( 1 + 2 ) 529125 648186 1,19,061.00 18.36833872
PROJECTED BALANCE SHEET OF 2016-17
[ ` in lakh]
Particulars Actuals
2015-16
Budget
Estimates
2016-17
Revised
Estimate
s 2016-
17
Budget
Estimates
2017-18
Forecast
2018-19
I EQUITY AND
LIABILITIES
(1) Own Fund
(a) Head Office
Investment account
87067 154234 142275 242855 250913
(b) P & L a/c [Current
year’s Profit/ (Loss)
89524 76861 94880 80351 83179
Total Own Funds - 1 (a +
b)
176591 231095 237155 323206 334092
(2) Government Grants 136 103 122 108 94
(3) Non-Current
Liabilities
Long-term Borrowings 0 0 0 0 0
Other Long-Term
Liabilities
45 155 45 45 45
Long Term Provisions 12218 17103 13419 14884 16762
Total Non-Current
Liabilities - 3
12263 17258 13464 14929 16807
(4) Current Liabilities
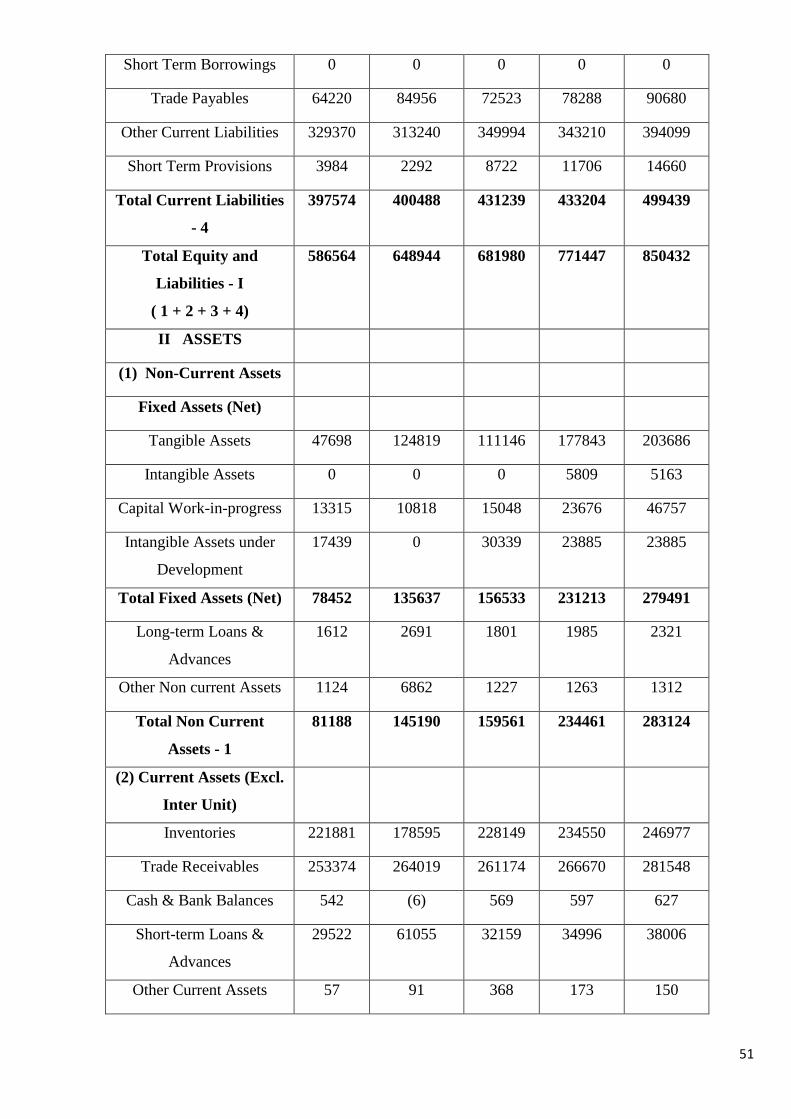
51
Short Term Borrowings 0 0 0 0 0
Trade Payables 64220 84956 72523 78288 90680
Other Current Liabilities 329370 313240 349994 343210 394099
Short Term Provisions 3984 2292 8722 11706 14660
Total Current Liabilities
- 4
397574 400488 431239 433204 499439
Total Equity and
Liabilities - I
( 1 + 2 + 3 + 4)
586564 648944 681980 771447 850432
II ASSETS
(1) Non-Current Assets
Fixed Assets (Net)
Tangible Assets 47698 124819 111146 177843 203686
Intangible Assets 0 0 0 5809 5163
Capital Work-in-progress 13315 10818 15048 23676 46757
Intangible Assets under
Development
17439 0 30339 23885 23885
Total Fixed Assets (Net) 78452 135637 156533 231213 279491
Long-term Loans &
Advances
1612 2691 1801 1985 2321
Other Non current Assets 1124 6862 1227 1263 1312
Total Non Current
Assets - 1
81188 145190 159561 234461 283124
(2) Current Assets (Excl.
Inter Unit)
Inventories 221881 178595 228149 234550 246977
Trade Receivables 253374 264019 261174 266670 281548
Cash & Bank Balances 542 (6) 569 597 627
Short-term Loans &
Advances
29522 61055 32159 34996 38006
Other Current Assets 57 91 368 173 150
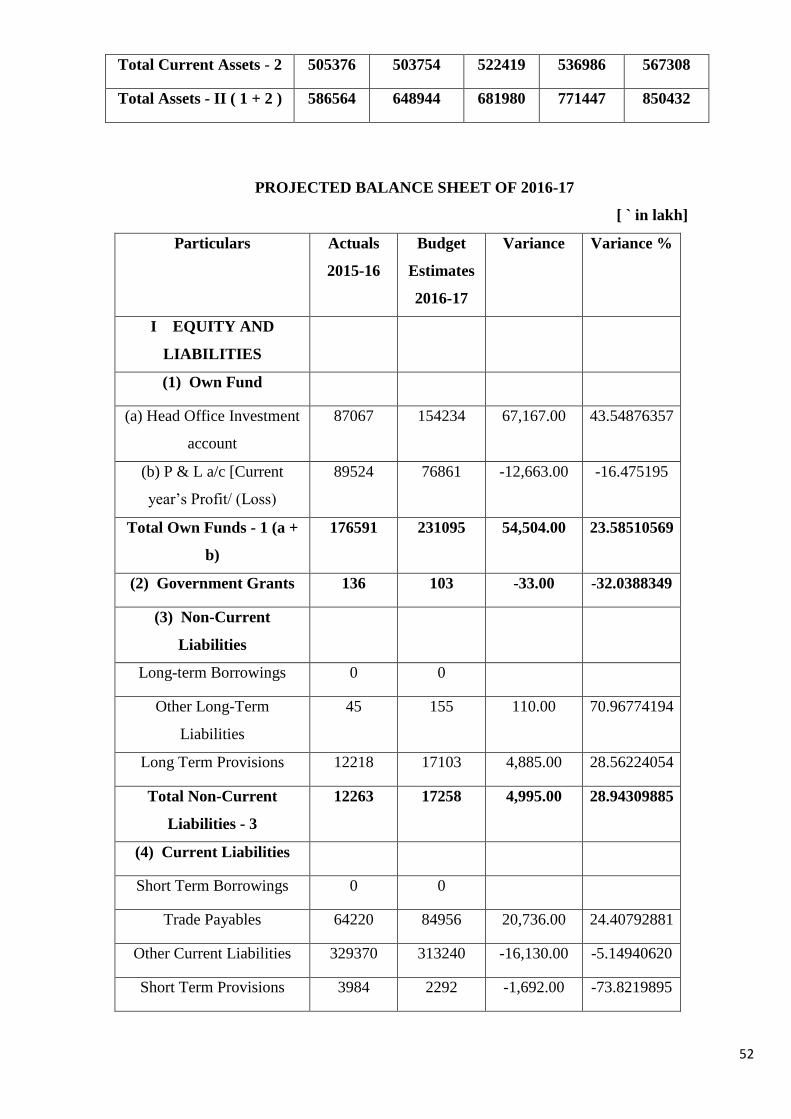
52
Total Current Assets - 2 505376 503754 522419 536986 567308
Total Assets - II ( 1 + 2 ) 586564 648944 681980 771447 850432
PROJECTED BALANCE SHEET OF 2016-17
[ ` in lakh]
Particulars Actuals
2015-16
Budget
Estimates
2016-17
Variance Variance %
I EQUITY AND
LIABILITIES
(1) Own Fund
(a) Head Office Investment
account
87067 154234 67,167.00 43.54876357
(b) P & L a/c [Current
year’s Profit/ (Loss)
89524 76861 -12,663.00 -16.475195
Total Own Funds - 1 (a +
b)
176591 231095 54,504.00 23.58510569
(2) Government Grants 136 103 -33.00 -32.0388349
(3) Non-Current
Liabilities
Long-term Borrowings 0 0
Other Long-Term
Liabilities
45 155 110.00 70.96774194
Long Term Provisions 12218 17103 4,885.00 28.56224054
Total Non-Current
Liabilities - 3
12263 17258 4,995.00 28.94309885
(4) Current Liabilities
Short Term Borrowings 0 0
Trade Payables 64220 84956 20,736.00 24.40792881
Other Current Liabilities 329370 313240 -16,130.00 -5.14940620
Short Term Provisions 3984 2292 -1,692.00 -73.8219895
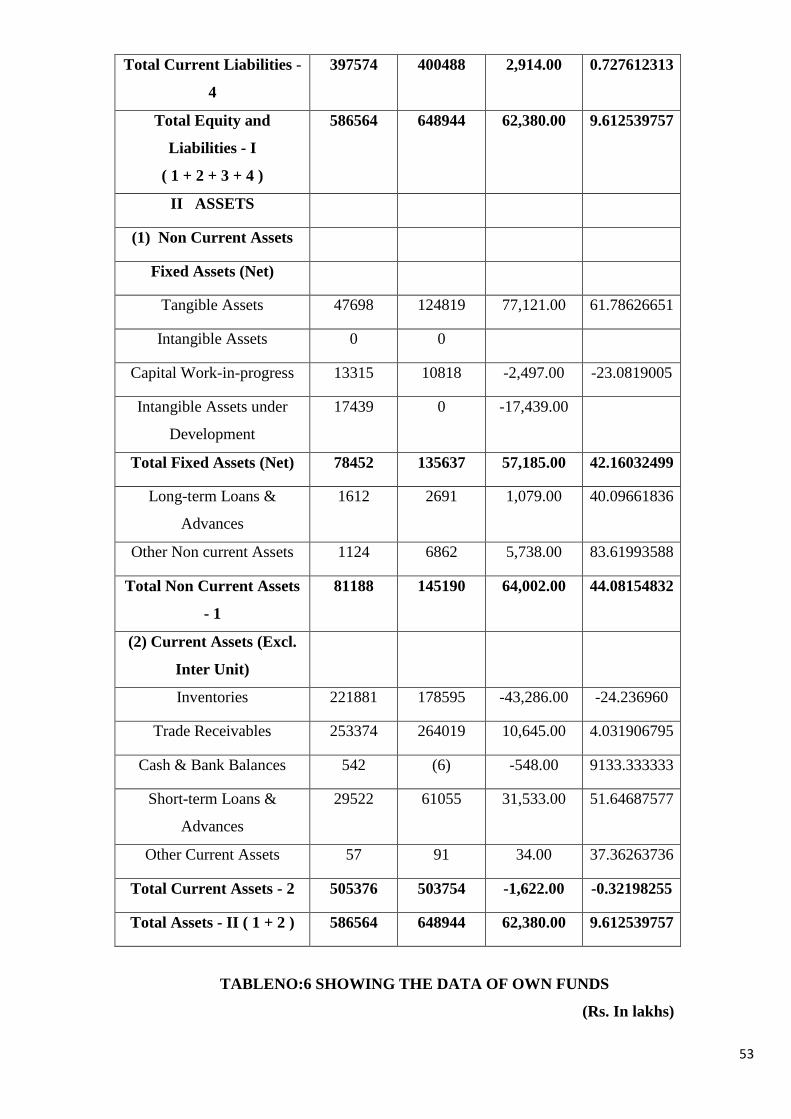
53
Total Current Liabilities -
4
397574 400488 2,914.00 0.727612313
Total Equity and
Liabilities - I
( 1 + 2 + 3 + 4 )
586564 648944 62,380.00 9.612539757
II ASSETS
(1) Non Current Assets
Fixed Assets (Net)
Tangible Assets 47698 124819 77,121.00 61.78626651
Intangible Assets 0 0
Capital Work-in-progress 13315 10818 -2,497.00 -23.0819005
Intangible Assets under
Development
17439 0 -17,439.00
Total Fixed Assets (Net) 78452 135637 57,185.00 42.16032499
Long-term Loans &
Advances
1612 2691 1,079.00 40.09661836
Other Non current Assets 1124 6862 5,738.00 83.61993588
Total Non Current Assets
- 1
81188 145190 64,002.00 44.08154832
(2) Current Assets (Excl.
Inter Unit)
Inventories 221881 178595 -43,286.00 -24.236960
Trade Receivables 253374 264019 10,645.00 4.031906795
Cash & Bank Balances 542 (6) -548.00 9133.333333
Short-term Loans &
Advances
29522 61055 31,533.00 51.64687577
Other Current Assets 57 91 34.00 37.36263736
Total Current Assets - 2 505376 503754 -1,622.00 -0.32198255
Total Assets - II ( 1 + 2 ) 586564 648944 62,380.00 9.612539757
TABLENO:6 SHOWING THE DATA OF OWN FUNDS
(Rs. In lakhs)
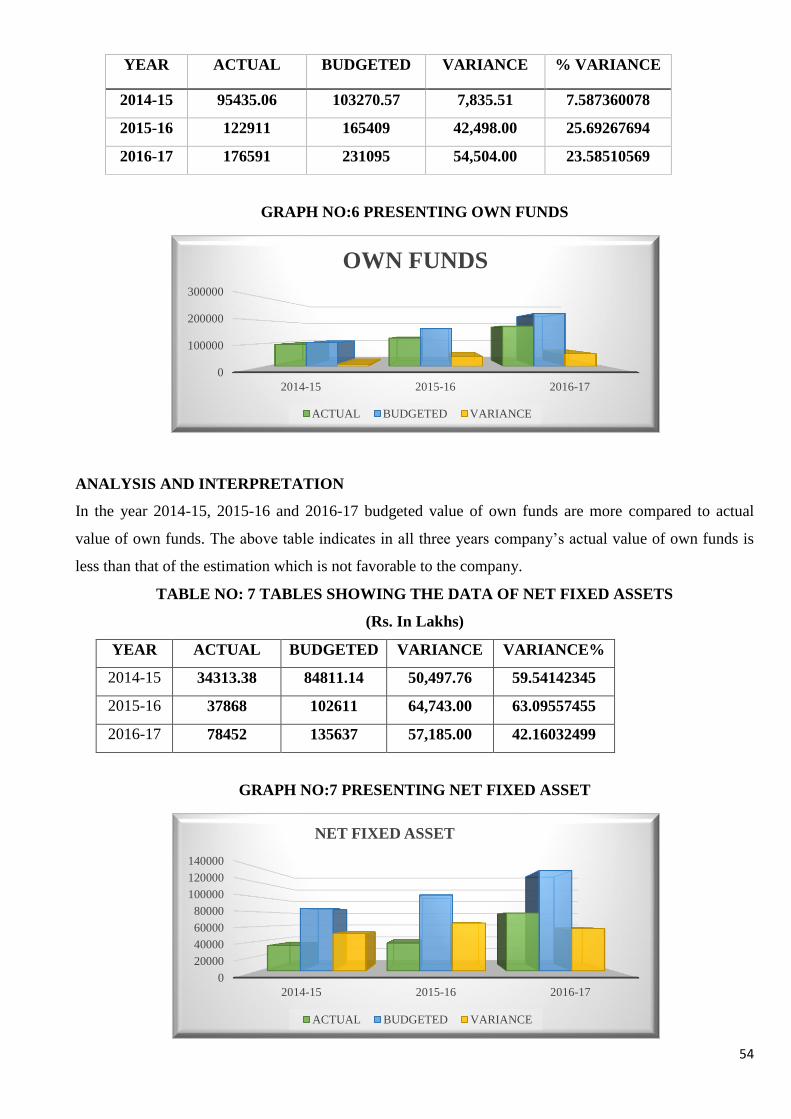
54
YEAR ACTUAL BUDGETED VARIANCE % VARIANCE
2014-15 95435.06 103270.57 7,835.51 7.587360078
2015-16 122911 165409 42,498.00 25.69267694
2016-17 176591 231095 54,504.00 23.58510569
GRAPH NO:6 PRESENTING OWN FUNDS
ANALYSIS AND INTERPRETATION
In the year 2014-15, 2015-16 and 2016-17 budgeted value of own funds are more compared to actual
value of own funds. The above table indicates in all three years company’s actual value of own funds is
less than that of the estimation which is not favorable to the company.
TABLE NO: 7 TABLES SHOWING THE DATA OF NET FIXED ASSETS
(Rs. In Lakhs)
YEAR ACTUAL BUDGETED VARIANCE VARIANCE%
2014-15 34313.38 84811.14 50,497.76 59.54142345
2015-16 37868 102611 64,743.00 63.09557455
2016-17 78452 135637 57,185.00 42.16032499
GRAPH NO:7 PRESENTING NET FIXED ASSET
0
100000
200000
300000
2014-15 2015-16 2016-17
OWN FUNDS
ACTUAL BUDGETED VARIANCE
0
20000
40000
60000
80000
100000
120000
140000
2014-15 2015-16 2016-17
NET FIXED ASSET
ACTUAL BUDGETED VARIANCE
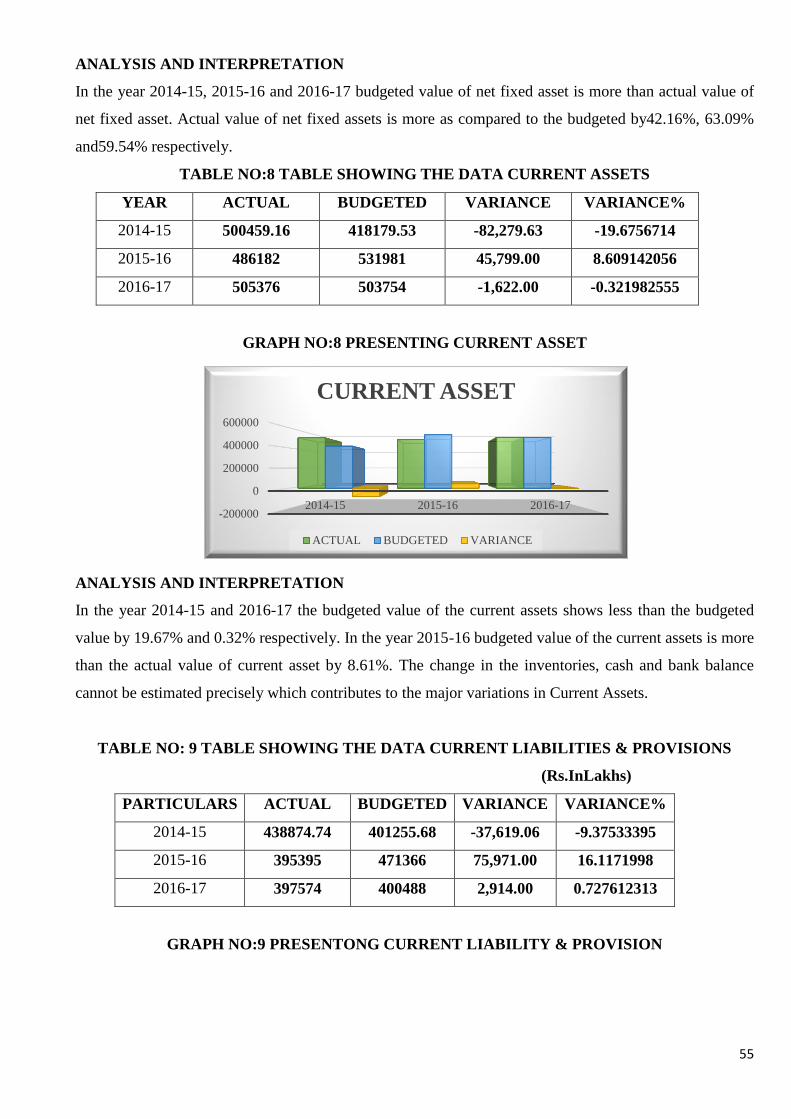
55
ANALYSIS AND INTERPRETATION
In the year 2014-15, 2015-16 and 2016-17 budgeted value of net fixed asset is more than actual value of
net fixed asset. Actual value of net fixed assets is more as compared to the budgeted by42.16%, 63.09%
and59.54% respectively.
TABLE NO:8 TABLE SHOWING THE DATA CURRENT ASSETS
YEAR ACTUAL BUDGETED VARIANCE VARIANCE%
2014-15 500459.16 418179.53 -82,279.63 -19.6756714
2015-16 486182 531981 45,799.00 8.609142056
2016-17 505376 503754 -1,622.00 -0.321982555
GRAPH NO:8 PRESENTING CURRENT ASSET
ANALYSIS AND INTERPRETATION
In the year 2014-15 and 2016-17 the budgeted value of the current assets shows less than the budgeted
value by 19.67% and 0.32% respectively. In the year 2015-16 budgeted value of the current assets is more
than the actual value of current asset by 8.61%. The change in the inventories, cash and bank balance
cannot be estimated precisely which contributes to the major variations in Current Assets.
TABLE NO: 9 TABLE SHOWING THE DATA CURRENT LIABILITIES & PROVISIONS
(Rs.InLakhs)
PARTICULARS ACTUAL BUDGETED VARIANCE VARIANCE%
2014-15 438874.74 401255.68 -37,619.06 -9.37533395
2015-16 395395 471366 75,971.00 16.1171998
2016-17 397574 400488 2,914.00 0.727612313
GRAPH NO:9 PRESENTONG CURRENT LIABILITY & PROVISION
-200000
0
200000
400000
600000
2014-15 2015-16 2016-17
CURRENT ASSET
ACTUAL BUDGETED VARIANCE
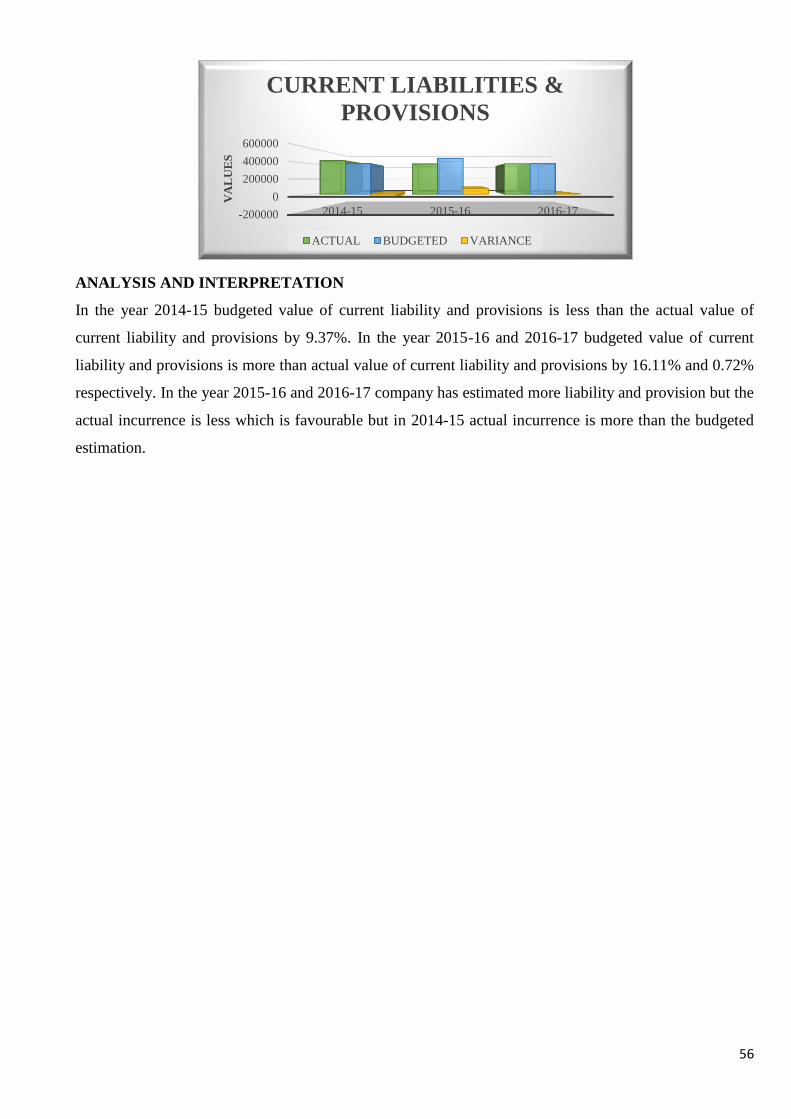
56
ANALYSIS AND INTERPRETATION
In the year 2014-15 budgeted value of current liability and provisions is less than the actual value of
current liability and provisions by 9.37%. In the year 2015-16 and 2016-17 budgeted value of current
liability and provisions is more than actual value of current liability and provisions by 16.11% and 0.72%
respectively. In the year 2015-16 and 2016-17 company has estimated more liability and provision but the
actual incurrence is less which is favourable but in 2014-15 actual incurrence is more than the budgeted
estimation.
-200000
0
200000
400000
600000
2014-15 2015-16 2016-17
VA
LU
ES
CURRENT LIABILITIES &
PROVISIONS
ACTUAL BUDGETED VARIANCE
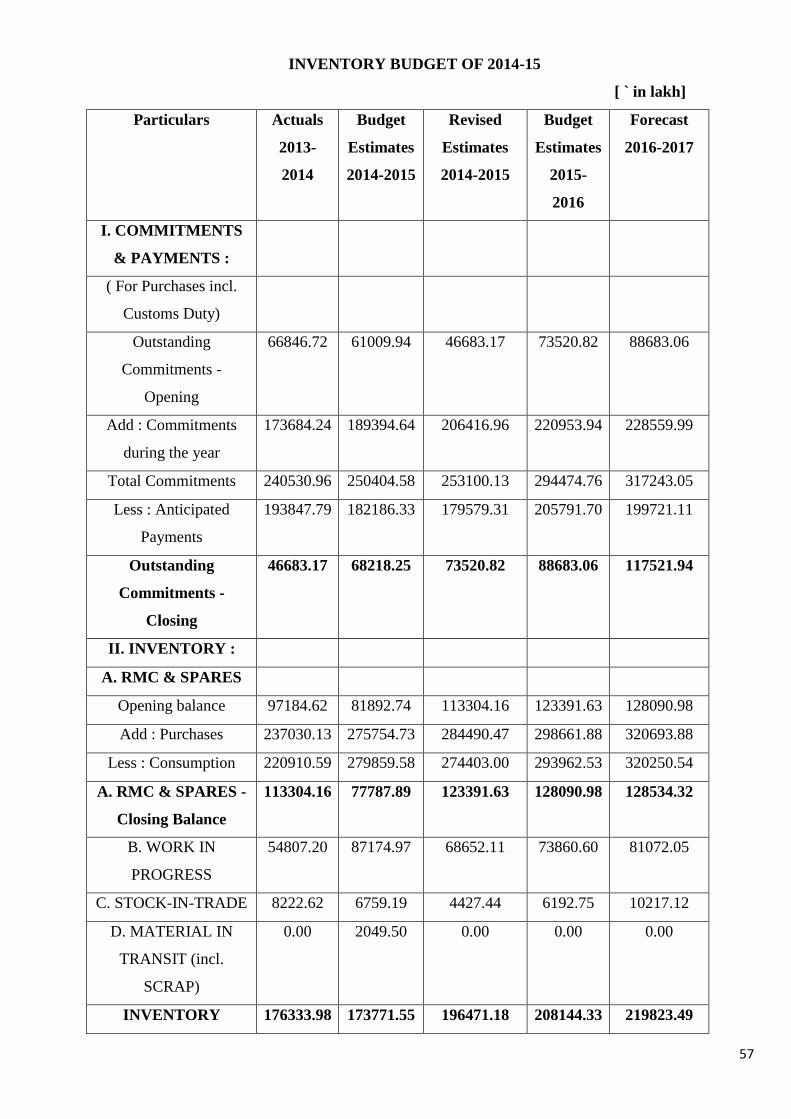
57
INVENTORY BUDGET OF 2014-15
[ ` in lakh]
Particulars Actuals
2013-
2014
Budget
Estimates
2014-2015
Revised
Estimates
2014-2015
Budget
Estimates
2015-
2016
Forecast
2016-2017
I. COMMITMENTS
& PAYMENTS :
( For Purchases incl.
Customs Duty)
Outstanding
Commitments -
Opening
66846.72 61009.94 46683.17 73520.82 88683.06
Add : Commitments
during the year
173684.24 189394.64 206416.96 220953.94 228559.99
Total Commitments 240530.96 250404.58 253100.13 294474.76 317243.05
Less : Anticipated
Payments
193847.79 182186.33 179579.31 205791.70 199721.11
Outstanding
Commitments -
Closing
46683.17 68218.25 73520.82 88683.06 117521.94
II. INVENTORY :
A. RMC & SPARES
Opening balance 97184.62 81892.74 113304.16 123391.63 128090.98
Add : Purchases 237030.13 275754.73 284490.47 298661.88 320693.88
Less : Consumption 220910.59 279859.58 274403.00 293962.53 320250.54
A. RMC & SPARES -
Closing Balance
113304.16 77787.89 123391.63 128090.98 128534.32
B. WORK IN
PROGRESS
54807.20 87174.97 68652.11 73860.60 81072.05
C. STOCK-IN-TRADE 8222.62 6759.19 4427.44 6192.75 10217.12
D. MATERIAL IN
TRANSIT (incl.
SCRAP)
0.00 2049.50 0.00 0.00 0.00
INVENTORY 176333.98 173771.55 196471.18 208144.33 219823.49
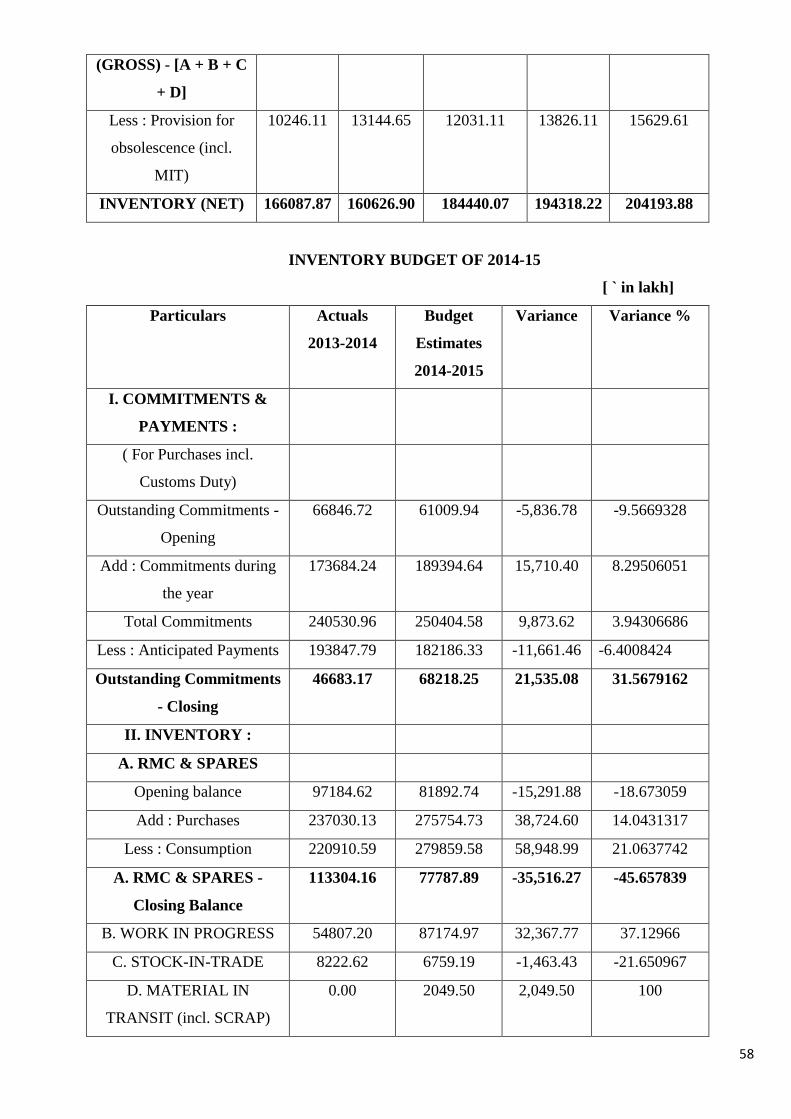
58
(GROSS) - [A + B + C
+ D]
Less : Provision for
obsolescence (incl.
MIT)
10246.11 13144.65 12031.11 13826.11 15629.61
INVENTORY (NET) 166087.87 160626.90 184440.07 194318.22 204193.88
INVENTORY BUDGET OF 2014-15
[ ` in lakh]
Particulars Actuals
2013-2014
Budget
Estimates
2014-2015
Variance Variance %
I. COMMITMENTS &
PAYMENTS :
( For Purchases incl.
Customs Duty)
Outstanding Commitments -
Opening
66846.72 61009.94 -5,836.78 -9.5669328
Add : Commitments during
the year
173684.24 189394.64 15,710.40 8.29506051
Total Commitments 240530.96 250404.58 9,873.62 3.94306686
Less : Anticipated Payments 193847.79 182186.33 -11,661.46 -6.4008424
Outstanding Commitments
- Closing
46683.17 68218.25 21,535.08 31.5679162
II. INVENTORY :
A. RMC & SPARES
Opening balance 97184.62 81892.74 -15,291.88 -18.673059
Add : Purchases 237030.13 275754.73 38,724.60 14.0431317
Less : Consumption 220910.59 279859.58 58,948.99 21.0637742
A. RMC & SPARES -
Closing Balance
113304.16 77787.89 -35,516.27 -45.657839
B. WORK IN PROGRESS 54807.20 87174.97 32,367.77 37.12966
C. STOCK-IN-TRADE 8222.62 6759.19 -1,463.43 -21.650967
D. MATERIAL IN
TRANSIT (incl. SCRAP)
0.00 2049.50 2,049.50 100
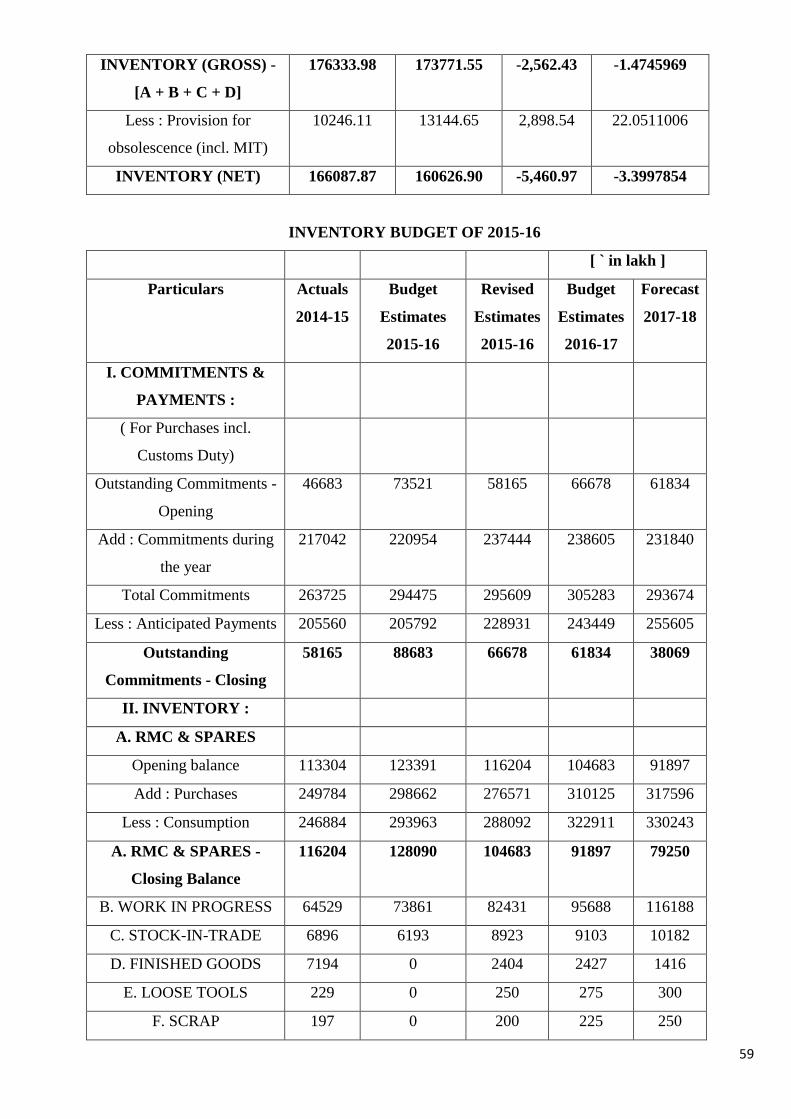
59
INVENTORY (GROSS) -
[A + B + C + D]
176333.98 173771.55 -2,562.43 -1.4745969
Less : Provision for
obsolescence (incl. MIT)
10246.11 13144.65 2,898.54 22.0511006
INVENTORY (NET) 166087.87 160626.90 -5,460.97 -3.3997854
INVENTORY BUDGET OF 2015-16
[ ` in lakh ]
Particulars Actuals
2014-15
Budget
Estimates
2015-16
Revised
Estimates
2015-16
Budget
Estimates
2016-17
Forecast
2017-18
I. COMMITMENTS &
PAYMENTS :
( For Purchases incl.
Customs Duty)
Outstanding Commitments -
Opening
46683 73521 58165 66678 61834
Add : Commitments during
the year
217042 220954 237444 238605 231840
Total Commitments 263725 294475 295609 305283 293674
Less : Anticipated Payments 205560 205792 228931 243449 255605
Outstanding
Commitments - Closing
58165 88683 66678 61834 38069
II. INVENTORY :
A. RMC & SPARES
Opening balance 113304 123391 116204 104683 91897
Add : Purchases 249784 298662 276571 310125 317596
Less : Consumption 246884 293963 288092 322911 330243
A. RMC & SPARES -
Closing Balance
116204 128090 104683 91897 79250
B. WORK IN PROGRESS 64529 73861 82431 95688 116188
C. STOCK-IN-TRADE 6896 6193 8923 9103 10182
D. FINISHED GOODS 7194 0 2404 2427 1416
E. LOOSE TOOLS 229 0 250 275 300
F. SCRAP 197 0 200 225 250
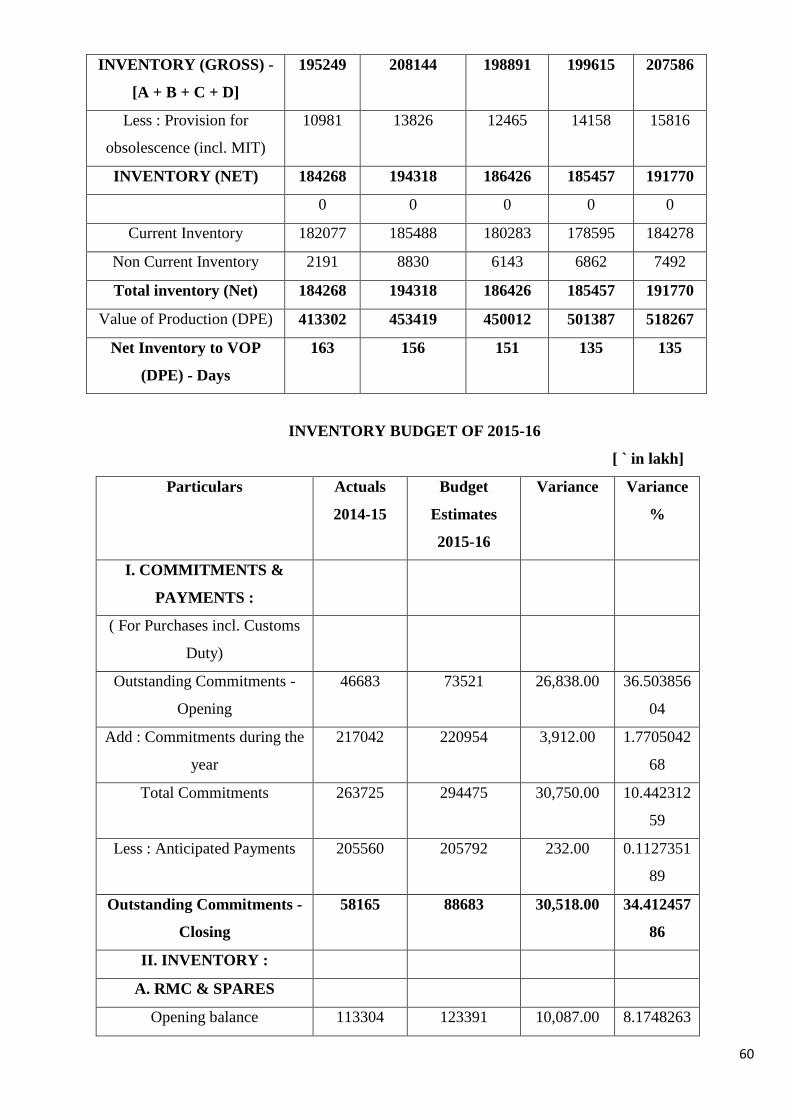
60
INVENTORY (GROSS) -
[A + B + C + D]
195249 208144 198891 199615 207586
Less : Provision for
obsolescence (incl. MIT)
10981 13826 12465 14158 15816
INVENTORY (NET) 184268 194318 186426 185457 191770
0 0 0 0 0
Current Inventory 182077 185488 180283 178595 184278
Non Current Inventory 2191 8830 6143 6862 7492
Total inventory (Net) 184268 194318 186426 185457 191770
Value of Production (DPE) 413302 453419 450012 501387 518267
Net Inventory to VOP
(DPE) - Days
163 156 151 135 135
INVENTORY BUDGET OF 2015-16
[ ` in lakh]
Particulars Actuals
2014-15
Budget
Estimates
2015-16
Variance Variance
%
I. COMMITMENTS &
PAYMENTS :
( For Purchases incl. Customs
Duty)
Outstanding Commitments -
Opening
46683 73521 26,838.00 36.503856
04
Add : Commitments during the
year
217042 220954 3,912.00 1.7705042
68
Total Commitments 263725 294475 30,750.00 10.442312
59
Less : Anticipated Payments 205560 205792 232.00 0.1127351
89
Outstanding Commitments -
Closing
58165 88683 30,518.00 34.412457
86
II. INVENTORY :
A. RMC & SPARES
Opening balance 113304 123391 10,087.00 8.1748263
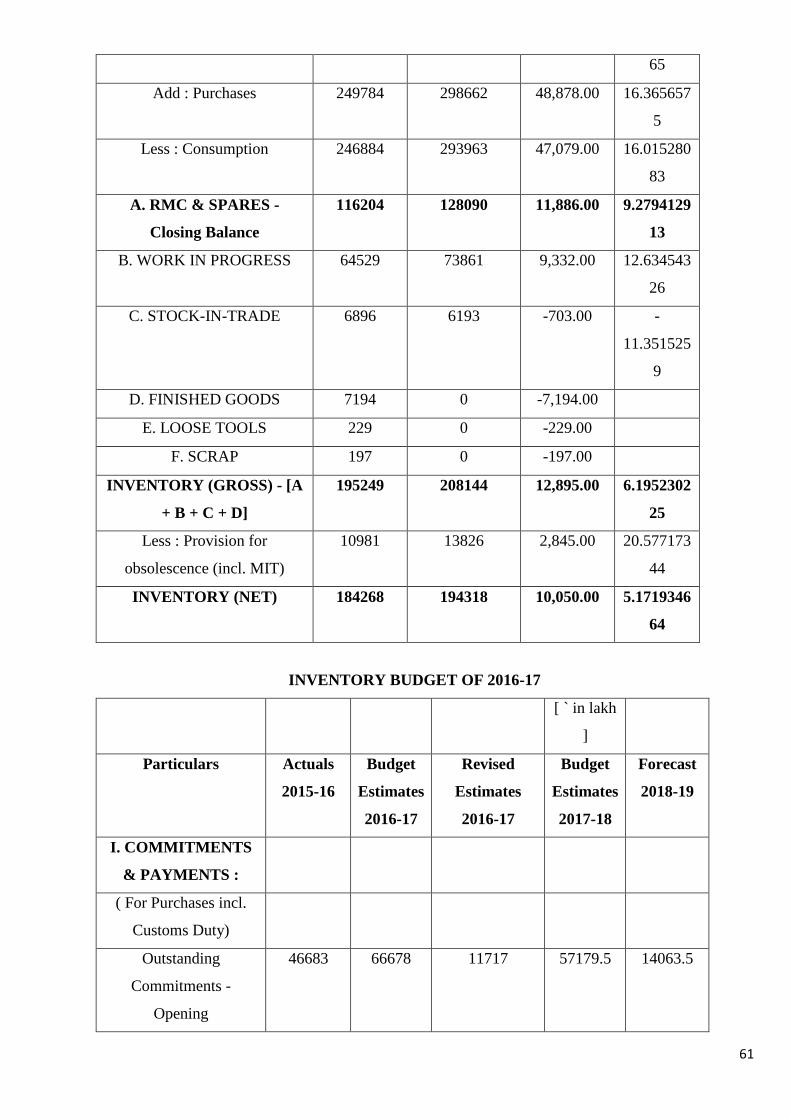
61
65
Add : Purchases 249784 298662 48,878.00 16.365657
5
Less : Consumption 246884 293963 47,079.00 16.015280
83
A. RMC & SPARES -
Closing Balance
116204 128090 11,886.00 9.2794129
13
B. WORK IN PROGRESS 64529 73861 9,332.00 12.634543
26
C. STOCK-IN-TRADE 6896 6193 -703.00 -
11.351525
9
D. FINISHED GOODS 7194 0 -7,194.00
E. LOOSE TOOLS 229 0 -229.00
F. SCRAP 197 0 -197.00
INVENTORY (GROSS) - [A
+ B + C + D]
195249 208144 12,895.00 6.1952302
25
Less : Provision for
obsolescence (incl. MIT)
10981 13826 2,845.00 20.577173
44
INVENTORY (NET) 184268 194318 10,050.00 5.1719346
64
INVENTORY BUDGET OF 2016-17
[ ` in lakh
]
Particulars Actuals
2015-16
Budget
Estimates
2016-17
Revised
Estimates
2016-17
Budget
Estimates
2017-18
Forecast
2018-19
I. COMMITMENTS
& PAYMENTS :
( For Purchases incl.
Customs Duty)
Outstanding
Commitments -
Opening
46683 66678 11717 57179.5 14063.5
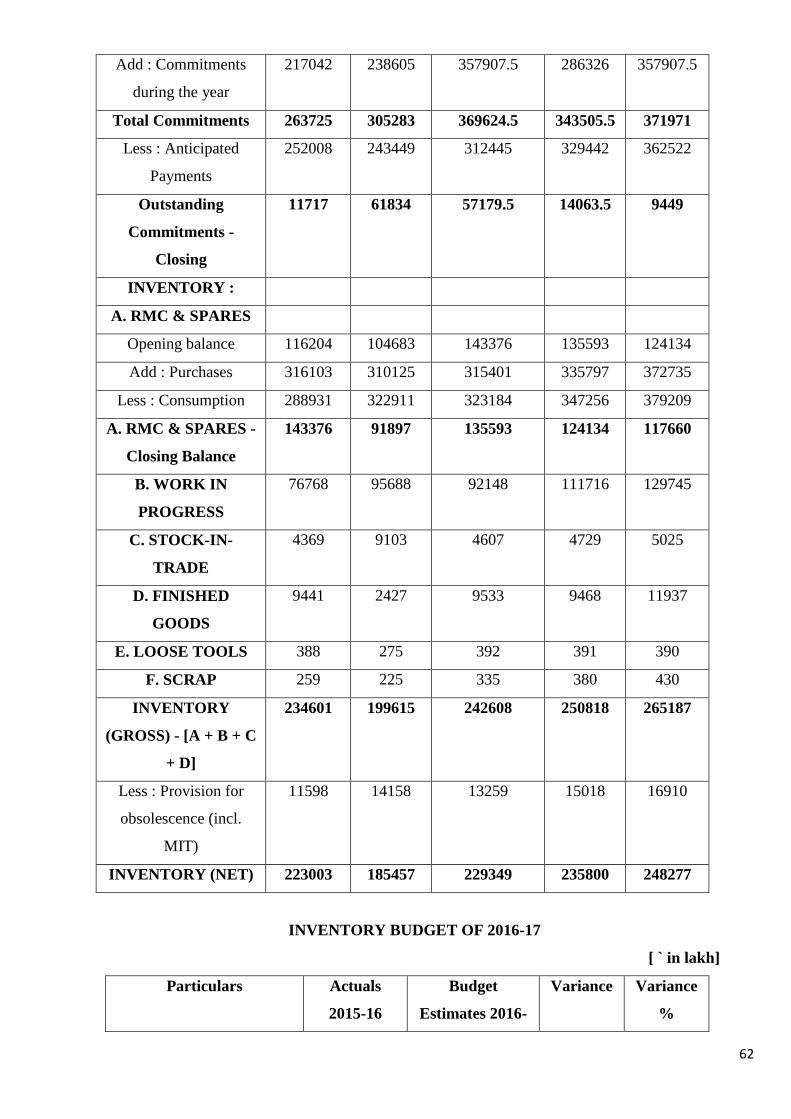
62
Add : Commitments
during the year
217042 238605 357907.5 286326 357907.5
Total Commitments 263725 305283 369624.5 343505.5 371971
Less : Anticipated
Payments
252008 243449 312445 329442 362522
Outstanding
Commitments -
Closing
11717 61834 57179.5 14063.5 9449
INVENTORY :
A. RMC & SPARES
Opening balance 116204 104683 143376 135593 124134
Add : Purchases 316103 310125 315401 335797 372735
Less : Consumption 288931 322911 323184 347256 379209
A. RMC & SPARES -
Closing Balance
143376 91897 135593 124134 117660
B. WORK IN
PROGRESS
76768 95688 92148 111716 129745
C. STOCK-IN-
TRADE
4369 9103 4607 4729 5025
D. FINISHED
GOODS
9441 2427 9533 9468 11937
E. LOOSE TOOLS 388 275 392 391 390
F. SCRAP 259 225 335 380 430
INVENTORY
(GROSS) - [A + B + C
+ D]
234601 199615 242608 250818 265187
Less : Provision for
obsolescence (incl.
MIT)
11598 14158 13259 15018 16910
INVENTORY (NET) 223003 185457 229349 235800 248277
INVENTORY BUDGET OF 2016-17
[ ` in lakh]
Particulars Actuals
2015-16
Budget
Estimates 2016-
Variance Variance
%
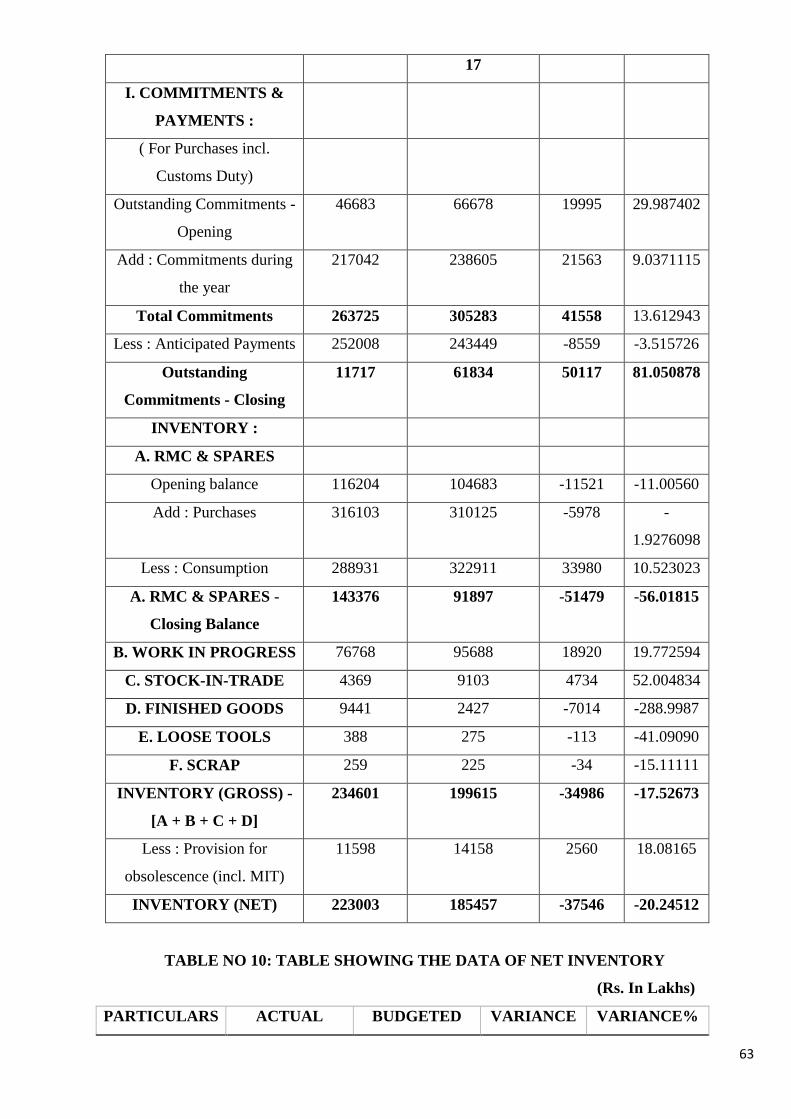
63
17
I. COMMITMENTS &
PAYMENTS :
( For Purchases incl.
Customs Duty)
Outstanding Commitments -
Opening
46683 66678 19995 29.987402
Add : Commitments during
the year
217042 238605 21563 9.0371115
Total Commitments 263725 305283 41558 13.612943
Less : Anticipated Payments 252008 243449 -8559 -3.515726
Outstanding
Commitments - Closing
11717 61834 50117 81.050878
INVENTORY :
A. RMC & SPARES
Opening balance 116204 104683 -11521 -11.00560
Add : Purchases 316103 310125 -5978 -
1.9276098
Less : Consumption 288931 322911 33980 10.523023
A. RMC & SPARES -
Closing Balance
143376 91897 -51479 -56.01815
B. WORK IN PROGRESS 76768 95688 18920 19.772594
C. STOCK-IN-TRADE 4369 9103 4734 52.004834
D. FINISHED GOODS 9441 2427 -7014 -288.9987
E. LOOSE TOOLS 388 275 -113 -41.09090
F. SCRAP 259 225 -34 -15.11111
INVENTORY (GROSS) -
[A + B + C + D]
234601 199615 -34986 -17.52673
Less : Provision for
obsolescence (incl. MIT)
11598 14158 2560 18.08165
INVENTORY (NET) 223003 185457 -37546 -20.24512
TABLE NO 10: TABLE SHOWING THE DATA OF NET INVENTORY
(Rs. In Lakhs)
PARTICULARS ACTUAL BUDGETED VARIANCE VARIANCE%
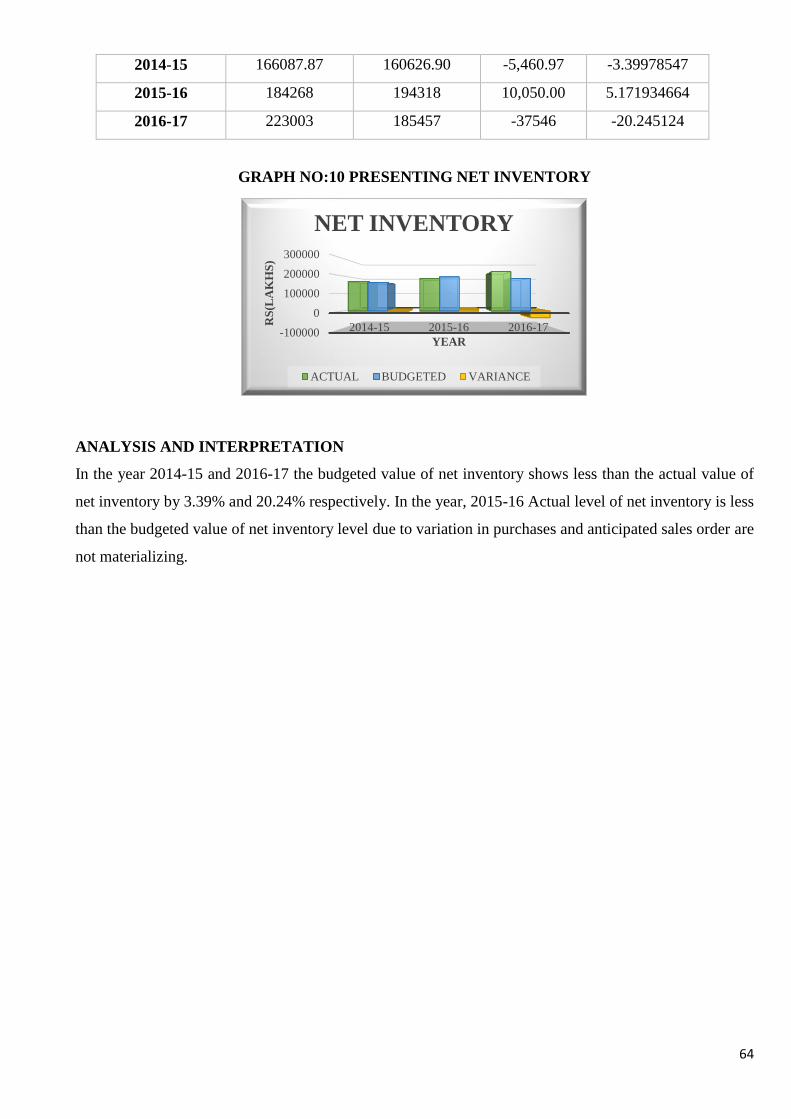
64
2014-15 166087.87 160626.90 -5,460.97 -3.39978547
2015-16 184268 194318 10,050.00 5.171934664
2016-17 223003 185457 -37546 -20.245124
GRAPH NO:10 PRESENTING NET INVENTORY
ANALYSIS AND INTERPRETATION
In the year 2014-15 and 2016-17 the budgeted value of net inventory shows less than the actual value of
net inventory by 3.39% and 20.24% respectively. In the year, 2015-16 Actual level of net inventory is less
than the budgeted value of net inventory level due to variation in purchases and anticipated sales order are
not materializing.
-100000
0
100000
200000
300000
2014-15 2015-16 2016-17 RS
(LA
KH
S)
YEAR
NET INVENTORY
ACTUAL BUDGETED VARIANCE
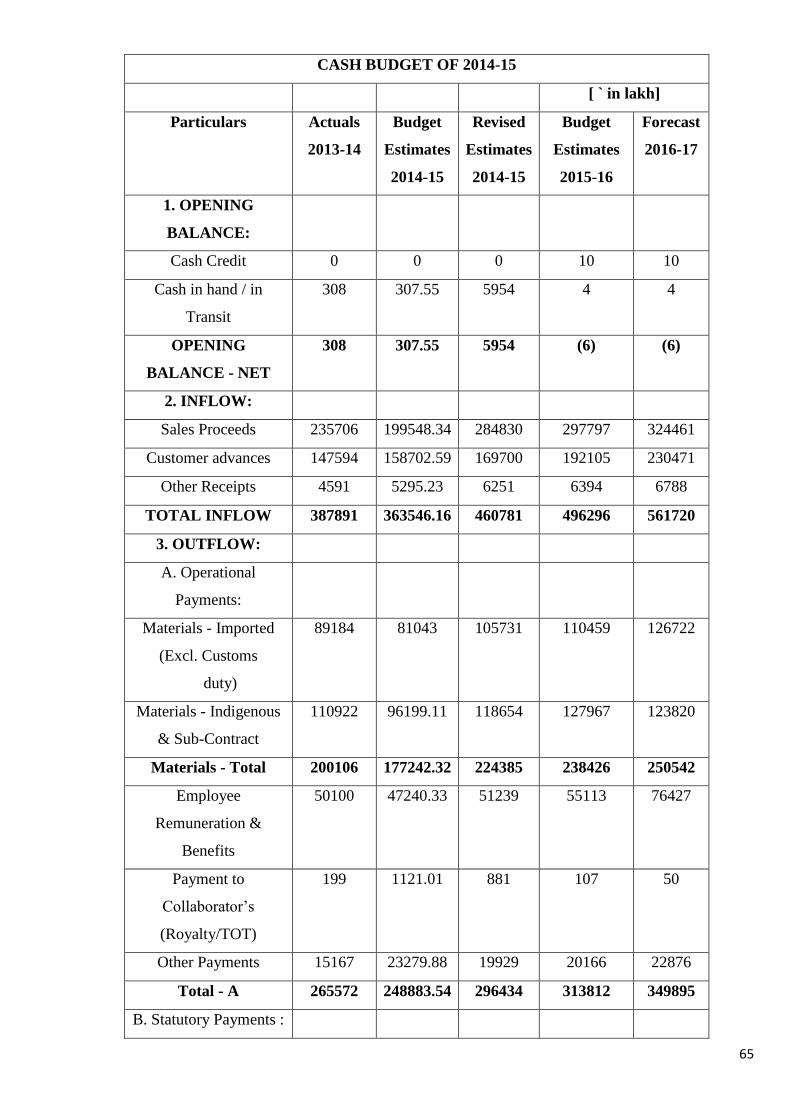
65
CASH BUDGET OF 2014-15
[ ` in lakh]
Particulars Actuals
2013-14
Budget
Estimates
2014-15
Revised
Estimates
2014-15
Budget
Estimates
2015-16
Forecast
2016-17
1. OPENING
BALANCE:
Cash Credit 0 0 0 10 10
Cash in hand / in
Transit
308 307.55 5954 4 4
OPENING
BALANCE - NET
308 307.55 5954 (6) (6)
2. INFLOW:
Sales Proceeds 235706 199548.34 284830 297797 324461
Customer advances 147594 158702.59 169700 192105 230471
Other Receipts 4591 5295.23 6251 6394 6788
TOTAL INFLOW 387891 363546.16 460781 496296 561720
3. OUTFLOW:
A. Operational
Payments:
Materials - Imported
(Excl. Customs
duty)
89184 81043 105731 110459 126722
Materials - Indigenous
& Sub-Contract
110922 96199.11 118654 127967 123820
Materials - Total 200106 177242.32 224385 238426 250542
Employee
Remuneration &
Benefits
50100 47240.33 51239 55113 76427
Payment to
Collaborator’s
(Royalty/TOT)
199 1121.01 881 107 50
Other Payments 15167 23279.88 19929 20166 22876
Total - A 265572 248883.54 296434 313812 349895
B. Statutory Payments :
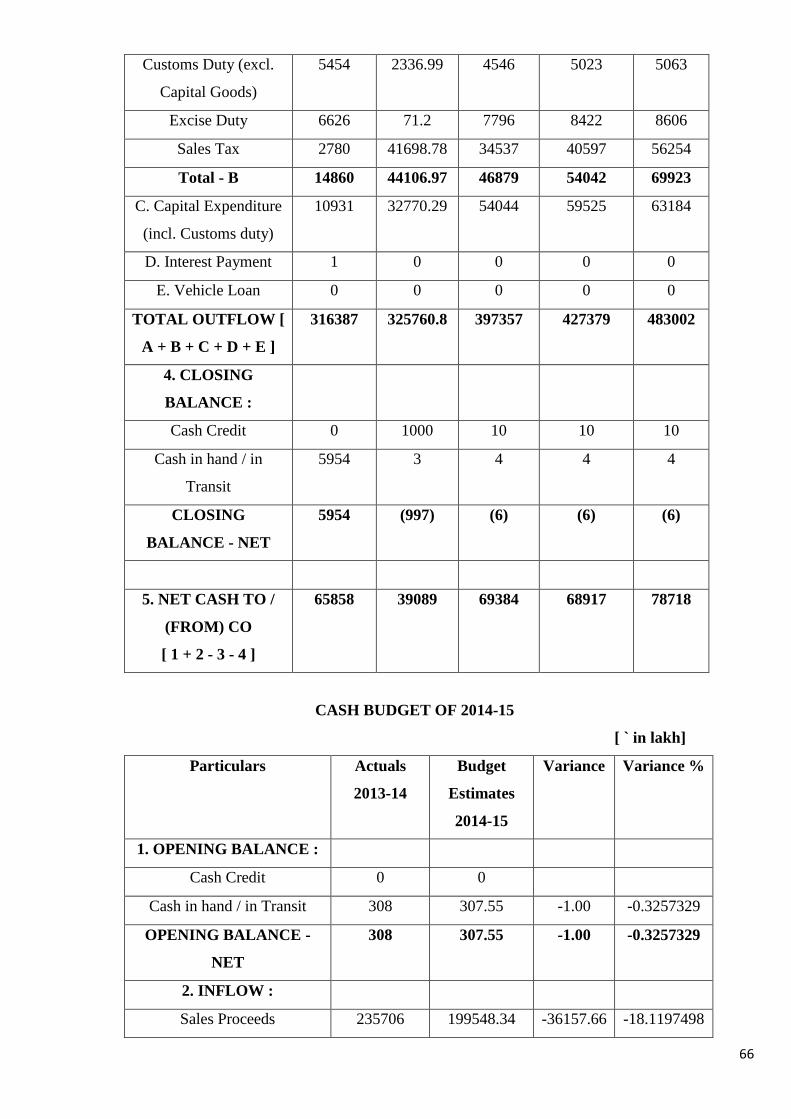
66
Customs Duty (excl.
Capital Goods)
5454 2336.99 4546 5023 5063
Excise Duty 6626 71.2 7796 8422 8606
Sales Tax 2780 41698.78 34537 40597 56254
Total - B 14860 44106.97 46879 54042 69923
C. Capital Expenditure
(incl. Customs duty)
10931 32770.29 54044 59525 63184
D. Interest Payment 1 0 0 0 0
E. Vehicle Loan 0 0 0 0 0
TOTAL OUTFLOW [
A + B + C + D + E ]
316387 325760.8 397357 427379 483002
4. CLOSING
BALANCE :
Cash Credit 0 1000 10 10 10
Cash in hand / in
Transit
5954 3 4 4 4
CLOSING
BALANCE - NET
5954 (997) (6) (6) (6)
5. NET CASH TO /
(FROM) CO
[ 1 + 2 - 3 - 4 ]
65858 39089 69384 68917 78718
CASH BUDGET OF 2014-15
[ ` in lakh]
Particulars Actuals
2013-14
Budget
Estimates
2014-15
Variance Variance %
1. OPENING BALANCE :
Cash Credit 0 0
Cash in hand / in Transit 308 307.55 -1.00 -0.3257329
OPENING BALANCE -
NET
308 307.55 -1.00 -0.3257329
2. INFLOW :
Sales Proceeds 235706 199548.34 -36157.66 -18.1197498
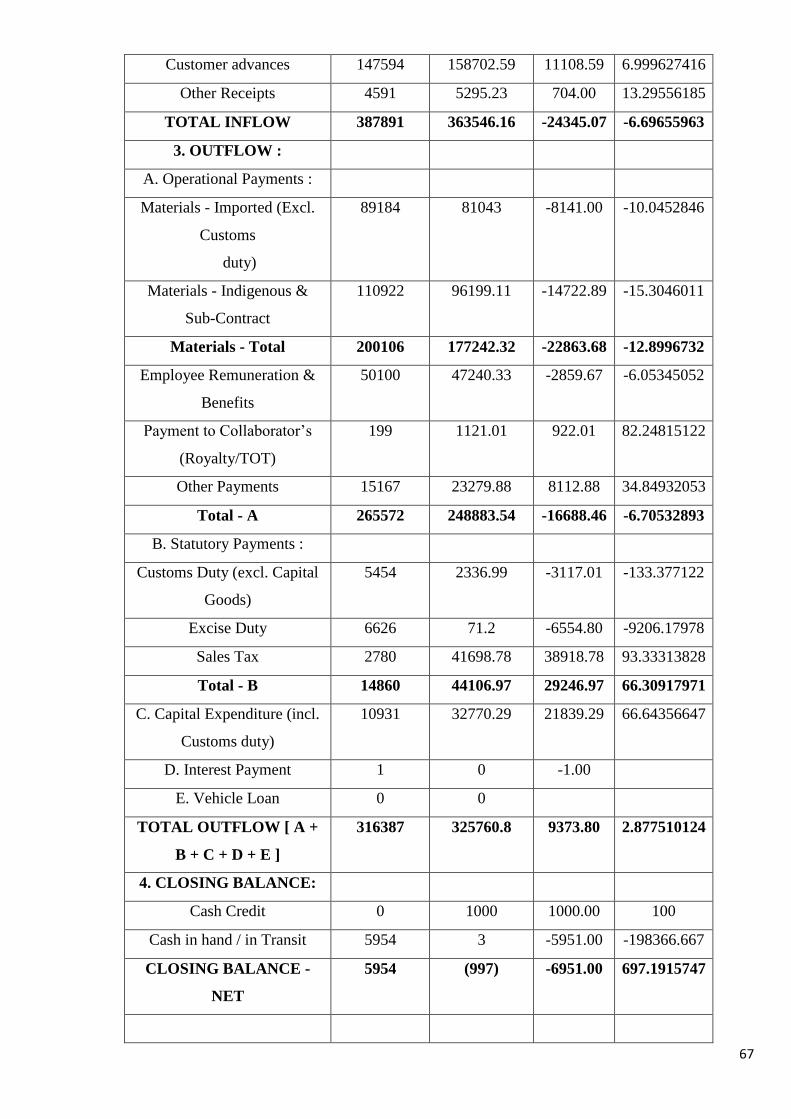
67
Customer advances 147594 158702.59 11108.59 6.999627416
Other Receipts 4591 5295.23 704.00 13.29556185
TOTAL INFLOW 387891 363546.16 -24345.07 -6.69655963
3. OUTFLOW :
A. Operational Payments :
Materials - Imported (Excl.
Customs
duty)
89184 81043 -8141.00 -10.0452846
Materials - Indigenous &
Sub-Contract
110922 96199.11 -14722.89 -15.3046011
Materials - Total 200106 177242.32 -22863.68 -12.8996732
Employee Remuneration &
Benefits
50100 47240.33 -2859.67 -6.05345052
Payment to Collaborator’s
(Royalty/TOT)
199 1121.01 922.01 82.24815122
Other Payments 15167 23279.88 8112.88 34.84932053
Total - A 265572 248883.54 -16688.46 -6.70532893
B. Statutory Payments :
Customs Duty (excl. Capital
Goods)
5454 2336.99 -3117.01 -133.377122
Excise Duty 6626 71.2 -6554.80 -9206.17978
Sales Tax 2780 41698.78 38918.78 93.33313828
Total - B 14860 44106.97 29246.97 66.30917971
C. Capital Expenditure (incl.
Customs duty)
10931 32770.29 21839.29 66.64356647
D. Interest Payment 1 0 -1.00
E. Vehicle Loan 0 0
TOTAL OUTFLOW [ A +
B + C + D + E ]
316387 325760.8 9373.80 2.877510124
4. CLOSING BALANCE:
Cash Credit 0 1000 1000.00 100
Cash in hand / in Transit 5954 3 -5951.00 -198366.667
CLOSING BALANCE -
NET
5954 (997) -6951.00 697.1915747
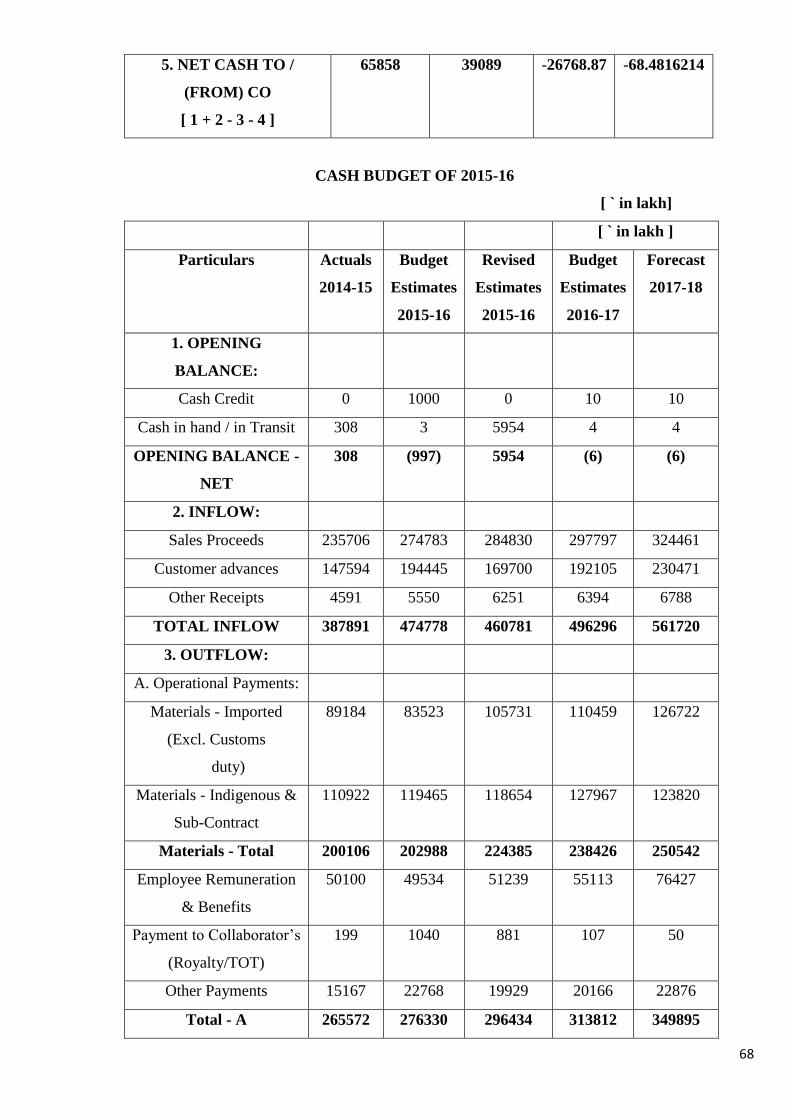
68
5. NET CASH TO /
(FROM) CO
[ 1 + 2 - 3 - 4 ]
65858 39089 -26768.87 -68.4816214
CASH BUDGET OF 2015-16
[ ` in lakh]
[ ` in lakh ]
Particulars Actuals
2014-15
Budget
Estimates
2015-16
Revised
Estimates
2015-16
Budget
Estimates
2016-17
Forecast
2017-18
1. OPENING
BALANCE:
Cash Credit 0 1000 0 10 10
Cash in hand / in Transit 308 3 5954 4 4
OPENING BALANCE -
NET
308 (997) 5954 (6) (6)
2. INFLOW:
Sales Proceeds 235706 274783 284830 297797 324461
Customer advances 147594 194445 169700 192105 230471
Other Receipts 4591 5550 6251 6394 6788
TOTAL INFLOW 387891 474778 460781 496296 561720
3. OUTFLOW:
A. Operational Payments:
Materials - Imported
(Excl. Customs
duty)
89184 83523 105731 110459 126722
Materials - Indigenous &
Sub-Contract
110922 119465 118654 127967 123820
Materials - Total 200106 202988 224385 238426 250542
Employee Remuneration
& Benefits
50100 49534 51239 55113 76427
Payment to Collaborator’s
(Royalty/TOT)
199 1040 881 107 50
Other Payments 15167 22768 19929 20166 22876
Total - A 265572 276330 296434 313812 349895
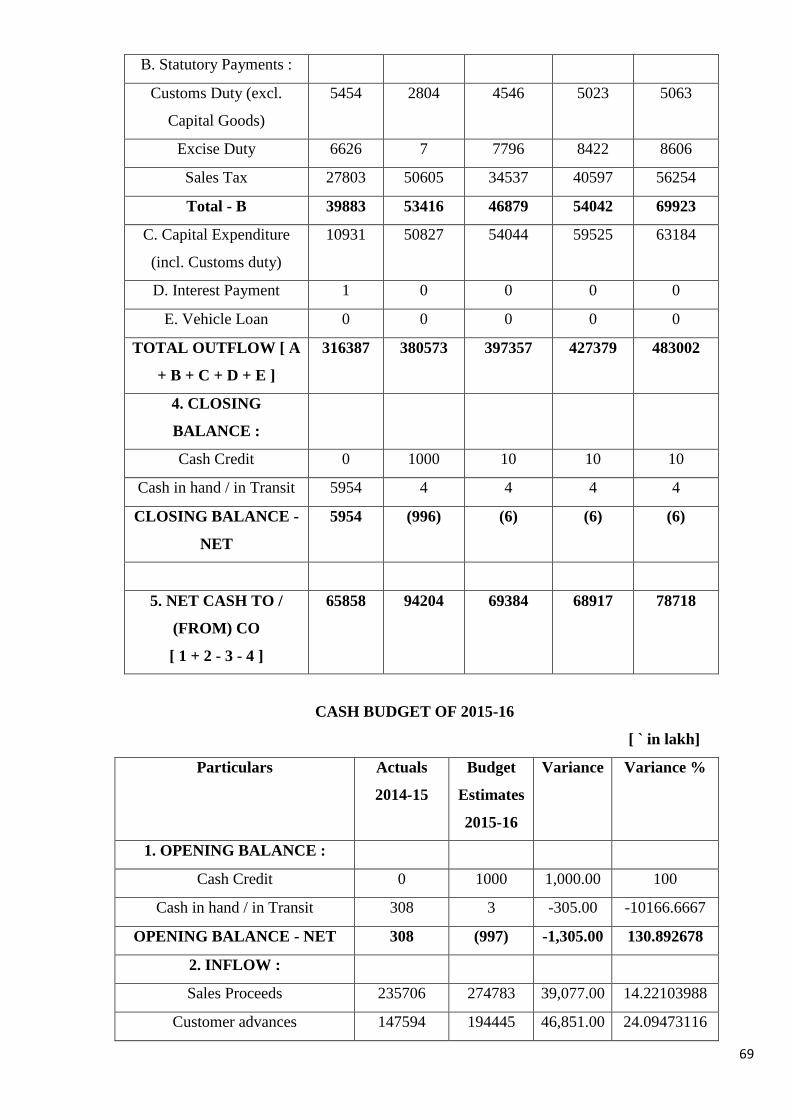
69
B. Statutory Payments :
Customs Duty (excl.
Capital Goods)
5454 2804 4546 5023 5063
Excise Duty 6626 7 7796 8422 8606
Sales Tax 27803 50605 34537 40597 56254
Total - B 39883 53416 46879 54042 69923
C. Capital Expenditure
(incl. Customs duty)
10931 50827 54044 59525 63184
D. Interest Payment 1 0 0 0 0
E. Vehicle Loan 0 0 0 0 0
TOTAL OUTFLOW [ A
+ B + C + D + E ]
316387 380573 397357 427379 483002
4. CLOSING
BALANCE :
Cash Credit 0 1000 10 10 10
Cash in hand / in Transit 5954 4 4 4 4
CLOSING BALANCE -
NET
5954 (996) (6) (6) (6)
5. NET CASH TO /
(FROM) CO
[ 1 + 2 - 3 - 4 ]
65858 94204 69384 68917 78718
CASH BUDGET OF 2015-16
[ ` in lakh]
Particulars Actuals
2014-15
Budget
Estimates
2015-16
Variance Variance %
1. OPENING BALANCE :
Cash Credit 0 1000 1,000.00 100
Cash in hand / in Transit 308 3 -305.00 -10166.6667
OPENING BALANCE - NET 308 (997) -1,305.00 130.892678
2. INFLOW :
Sales Proceeds 235706 274783 39,077.00 14.22103988
Customer advances 147594 194445 46,851.00 24.09473116
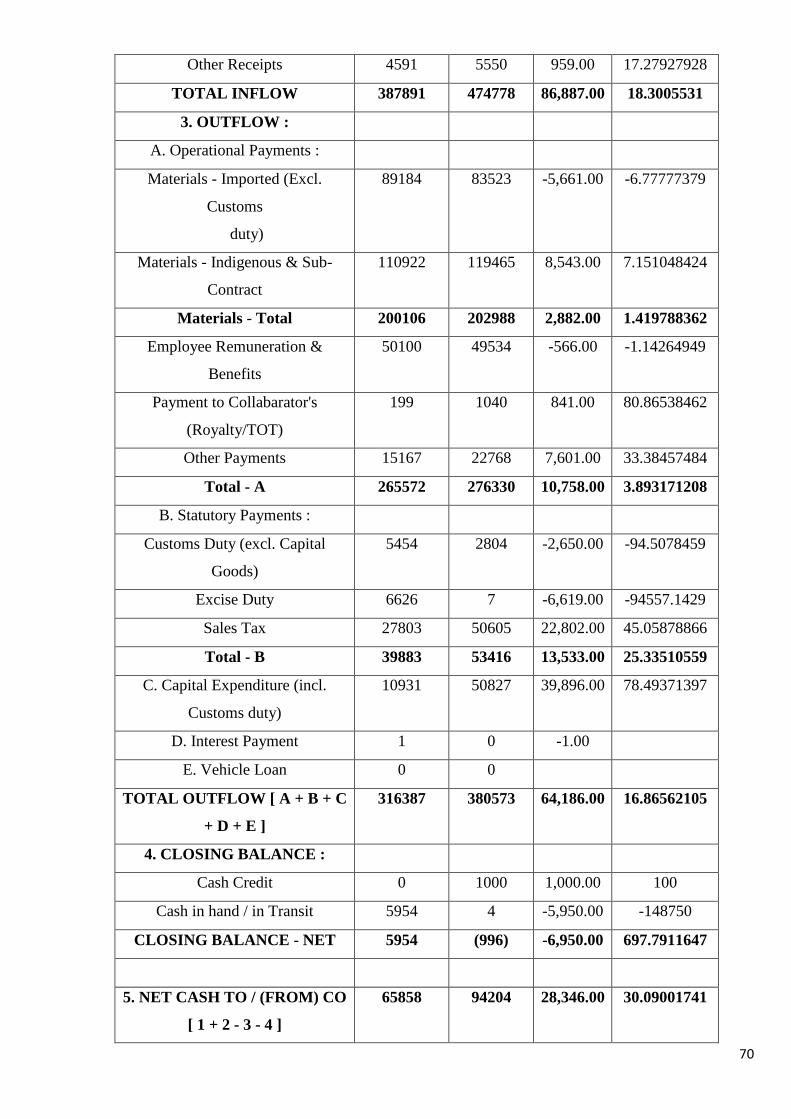
70
Other Receipts 4591 5550 959.00 17.27927928
TOTAL INFLOW 387891 474778 86,887.00 18.3005531
3. OUTFLOW :
A. Operational Payments :
Materials - Imported (Excl.
Customs
duty)
89184 83523 -5,661.00 -6.77777379
Materials - Indigenous & Sub-
Contract
110922 119465 8,543.00 7.151048424
Materials - Total 200106 202988 2,882.00 1.419788362
Employee Remuneration &
Benefits
50100 49534 -566.00 -1.14264949
Payment to Collabarator's
(Royalty/TOT)
199 1040 841.00 80.86538462
Other Payments 15167 22768 7,601.00 33.38457484
Total - A 265572 276330 10,758.00 3.893171208
B. Statutory Payments :
Customs Duty (excl. Capital
Goods)
5454 2804 -2,650.00 -94.5078459
Excise Duty 6626 7 -6,619.00 -94557.1429
Sales Tax 27803 50605 22,802.00 45.05878866
Total - B 39883 53416 13,533.00 25.33510559
C. Capital Expenditure (incl.
Customs duty)
10931 50827 39,896.00 78.49371397
D. Interest Payment 1 0 -1.00
E. Vehicle Loan 0 0
TOTAL OUTFLOW [ A + B + C
+ D + E ]
316387 380573 64,186.00 16.86562105
4. CLOSING BALANCE :
Cash Credit 0 1000 1,000.00 100
Cash in hand / in Transit 5954 4 -5,950.00 -148750
CLOSING BALANCE - NET 5954 (996) -6,950.00 697.7911647
5. NET CASH TO / (FROM) CO
[ 1 + 2 - 3 - 4 ]
65858 94204 28,346.00 30.09001741
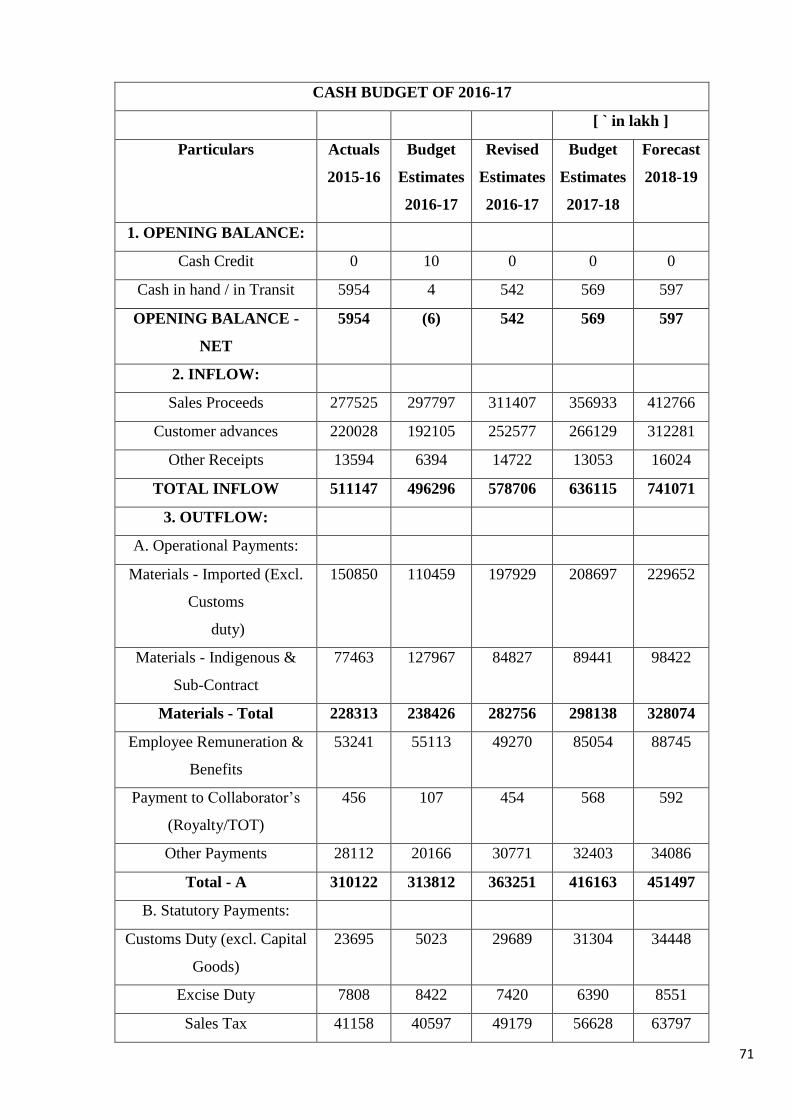
71
CASH BUDGET OF 2016-17
[ ` in lakh ]
Particulars Actuals
2015-16
Budget
Estimates
2016-17
Revised
Estimates
2016-17
Budget
Estimates
2017-18
Forecast
2018-19
1. OPENING BALANCE:
Cash Credit 0 10 0 0 0
Cash in hand / in Transit 5954 4 542 569 597
OPENING BALANCE -
NET
5954 (6) 542 569 597
2. INFLOW:
Sales Proceeds 277525 297797 311407 356933 412766
Customer advances 220028 192105 252577 266129 312281
Other Receipts 13594 6394 14722 13053 16024
TOTAL INFLOW 511147 496296 578706 636115 741071
3. OUTFLOW:
A. Operational Payments:
Materials - Imported (Excl.
Customs
duty)
150850 110459 197929 208697 229652
Materials - Indigenous &
Sub-Contract
77463 127967 84827 89441 98422
Materials - Total 228313 238426 282756 298138 328074
Employee Remuneration &
Benefits
53241 55113 49270 85054 88745
Payment to Collaborator’s
(Royalty/TOT)
456 107 454 568 592
Other Payments 28112 20166 30771 32403 34086
Total - A 310122 313812 363251 416163 451497
B. Statutory Payments:
Customs Duty (excl. Capital
Goods)
23695 5023 29689 31304 34448
Excise Duty 7808 8422 7420 6390 8551
Sales Tax 41158 40597 49179 56628 63797
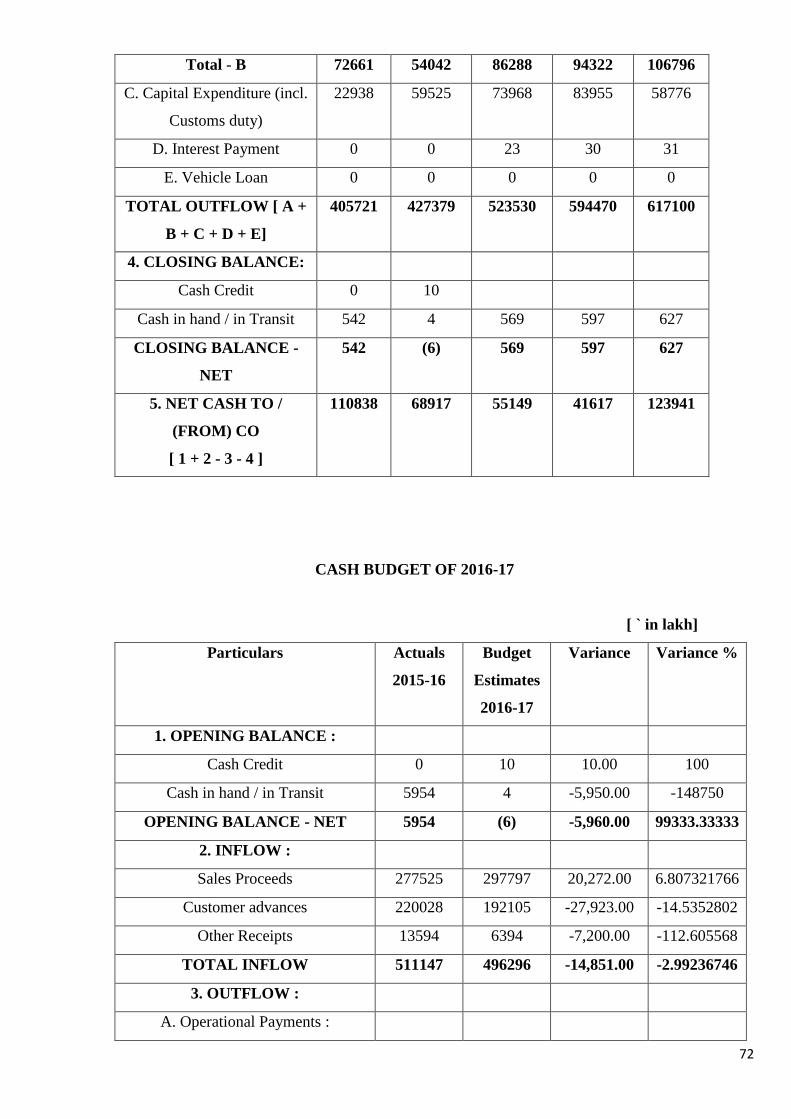
72
Total - B 72661 54042 86288 94322 106796
C. Capital Expenditure (incl.
Customs duty)
22938 59525 73968 83955 58776
D. Interest Payment 0 0 23 30 31
E. Vehicle Loan 0 0 0 0 0
TOTAL OUTFLOW [ A +
B + C + D + E]
405721 427379 523530 594470 617100
4. CLOSING BALANCE:
Cash Credit 0 10
Cash in hand / in Transit 542 4 569 597 627
CLOSING BALANCE -
NET
542 (6) 569 597 627
5. NET CASH TO /
(FROM) CO
[ 1 + 2 - 3 - 4 ]
110838 68917 55149 41617 123941
CASH BUDGET OF 2016-17
[ ` in lakh]
Particulars Actuals
2015-16
Budget
Estimates
2016-17
Variance Variance %
1. OPENING BALANCE :
Cash Credit 0 10 10.00 100
Cash in hand / in Transit 5954 4 -5,950.00 -148750
OPENING BALANCE - NET 5954 (6) -5,960.00 99333.33333
2. INFLOW :
Sales Proceeds 277525 297797 20,272.00 6.807321766
Customer advances 220028 192105 -27,923.00 -14.5352802
Other Receipts 13594 6394 -7,200.00 -112.605568
TOTAL INFLOW 511147 496296 -14,851.00 -2.99236746
3. OUTFLOW :
A. Operational Payments :
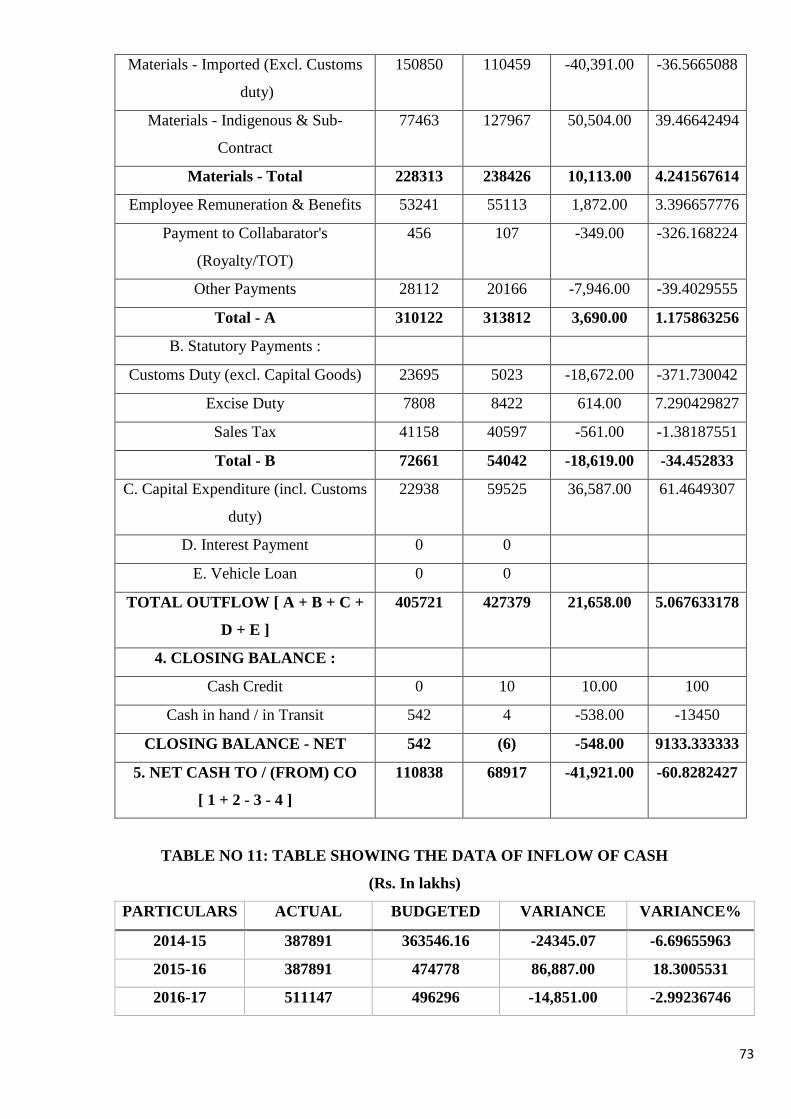
73
Materials - Imported (Excl. Customs
duty)
150850 110459 -40,391.00 -36.5665088
Materials - Indigenous & Sub-
Contract
77463 127967 50,504.00 39.46642494
Materials - Total 228313 238426 10,113.00 4.241567614
Employee Remuneration & Benefits 53241 55113 1,872.00 3.396657776
Payment to Collabarator's
(Royalty/TOT)
456 107 -349.00 -326.168224
Other Payments 28112 20166 -7,946.00 -39.4029555
Total - A 310122 313812 3,690.00 1.175863256
B. Statutory Payments :
Customs Duty (excl. Capital Goods) 23695 5023 -18,672.00 -371.730042
Excise Duty 7808 8422 614.00 7.290429827
Sales Tax 41158 40597 -561.00 -1.38187551
Total - B 72661 54042 -18,619.00 -34.452833
C. Capital Expenditure (incl. Customs
duty)
22938 59525 36,587.00 61.4649307
D. Interest Payment 0 0
E. Vehicle Loan 0 0
TOTAL OUTFLOW [ A + B + C +
D + E ]
405721 427379 21,658.00 5.067633178
4. CLOSING BALANCE :
Cash Credit 0 10 10.00 100
Cash in hand / in Transit 542 4 -538.00 -13450
CLOSING BALANCE - NET 542 (6) -548.00 9133.333333
5. NET CASH TO / (FROM) CO
[ 1 + 2 - 3 - 4 ]
110838 68917 -41,921.00 -60.8282427
TABLE NO 11: TABLE SHOWING THE DATA OF INFLOW OF CASH
(Rs. In lakhs)
PARTICULARS ACTUAL BUDGETED VARIANCE VARIANCE%
2014-15 387891 363546.16 -24345.07 -6.69655963
2015-16 387891 474778 86,887.00 18.3005531
2016-17 511147 496296 -14,851.00 -2.99236746
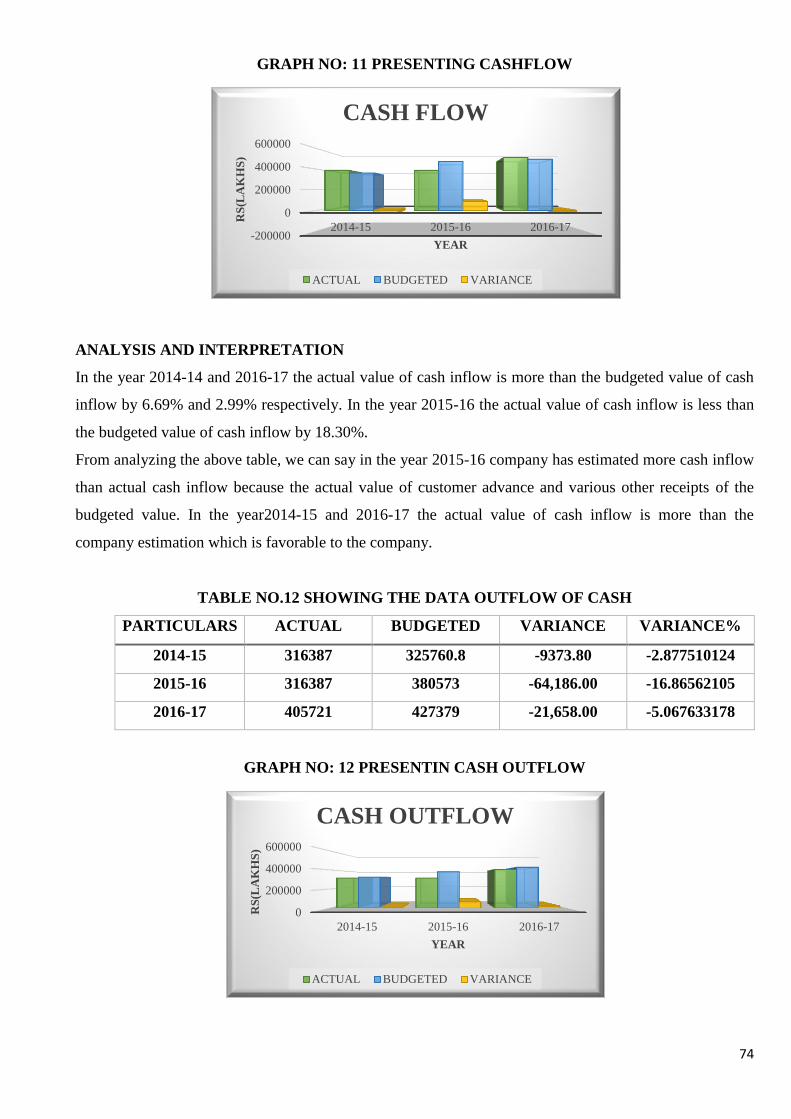
74
GRAPH NO: 11 PRESENTING CASHFLOW
ANALYSIS AND INTERPRETATION
In the year 2014-14 and 2016-17 the actual value of cash inflow is more than the budgeted value of cash
inflow by 6.69% and 2.99% respectively. In the year 2015-16 the actual value of cash inflow is less than
the budgeted value of cash inflow by 18.30%.
From analyzing the above table, we can say in the year 2015-16 company has estimated more cash inflow
than actual cash inflow because the actual value of customer advance and various other receipts of the
budgeted value. In the year2014-15 and 2016-17 the actual value of cash inflow is more than the
company estimation which is favorable to the company.
TABLE NO.12 SHOWING THE DATA OUTFLOW OF CASH
PARTICULARS ACTUAL BUDGETED VARIANCE VARIANCE%
2014-15 316387 325760.8 -9373.80 -2.877510124
2015-16 316387 380573 -64,186.00 -16.86562105
2016-17 405721 427379 -21,658.00 -5.067633178
GRAPH NO: 12 PRESENTIN CASH OUTFLOW
-200000
0
200000
400000
600000
2014-15 2015-16 2016-17 R
S(L
AK
HS
) YEAR
CASH FLOW
ACTUAL BUDGETED VARIANCE
0
200000
400000
600000
2014-15 2015-16 2016-17
RS
(LA
KH
S)
YEAR
CASH OUTFLOW
ACTUAL BUDGETED VARIANCE
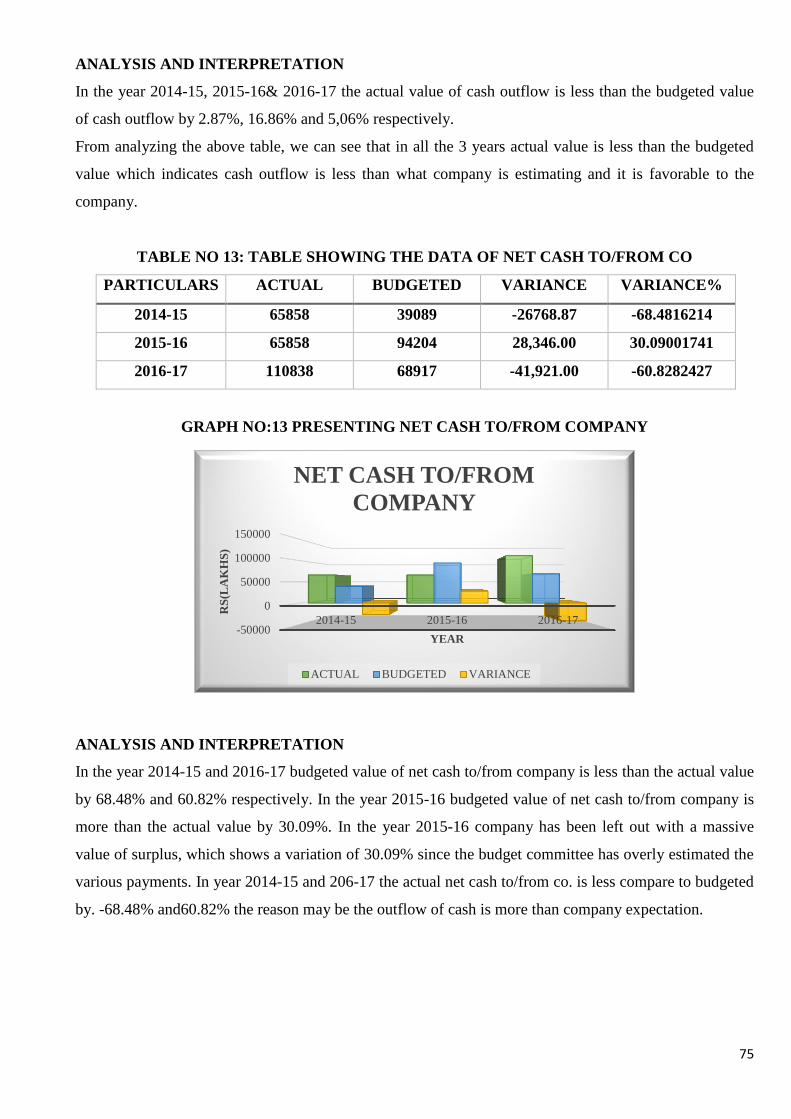
75
ANALYSIS AND INTERPRETATION
In the year 2014-15, 2015-16& 2016-17 the actual value of cash outflow is less than the budgeted value
of cash outflow by 2.87%, 16.86% and 5,06% respectively.
From analyzing the above table, we can see that in all the 3 years actual value is less than the budgeted
value which indicates cash outflow is less than what company is estimating and it is favorable to the
company.
TABLE NO 13: TABLE SHOWING THE DATA OF NET CASH TO/FROM CO
PARTICULARS ACTUAL BUDGETED VARIANCE VARIANCE%
2014-15 65858 39089 -26768.87 -68.4816214
2015-16 65858 94204 28,346.00 30.09001741
2016-17 110838 68917 -41,921.00 -60.8282427
GRAPH NO:13 PRESENTING NET CASH TO/FROM COMPANY
ANALYSIS AND INTERPRETATION
In the year 2014-15 and 2016-17 budgeted value of net cash to/from company is less than the actual value
by 68.48% and 60.82% respectively. In the year 2015-16 budgeted value of net cash to/from company is
more than the actual value by 30.09%. In the year 2015-16 company has been left out with a massive
value of surplus, which shows a variation of 30.09% since the budget committee has overly estimated the
various payments. In year 2014-15 and 206-17 the actual net cash to/from co. is less compare to budgeted
by. -68.48% and60.82% the reason may be the outflow of cash is more than company expectation.
-50000
0
50000
100000
150000
2014-15 2015-16 2016-17
RS
(LA
KH
S)
YEAR
NET CASH TO/FROM
COMPANY
ACTUAL BUDGETED VARIANCE
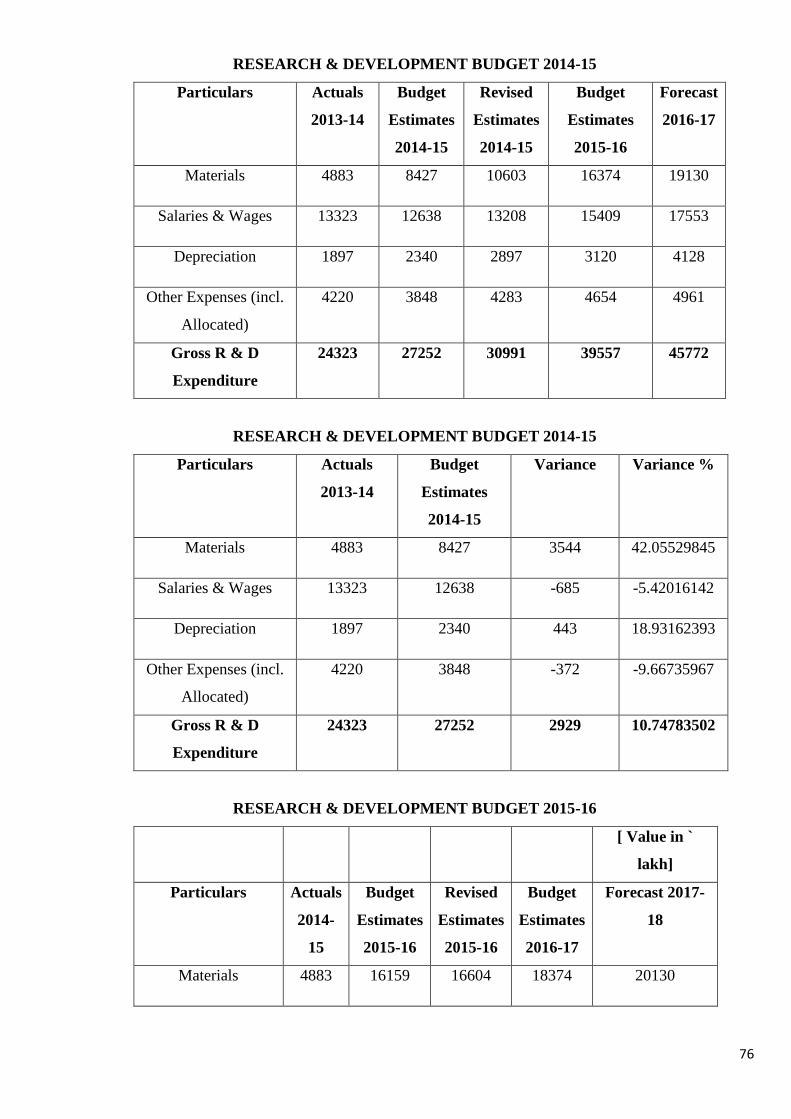
76
RESEARCH & DEVELOPMENT BUDGET 2014-15
Particulars Actuals
2013-14
Budget
Estimates
2014-15
Revised
Estimates
2014-15
Budget
Estimates
2015-16
Forecast
2016-17
Materials 4883 8427 10603 16374 19130
Salaries & Wages 13323 12638 13208 15409 17553
Depreciation 1897 2340 2897 3120 4128
Other Expenses (incl.
Allocated)
4220 3848 4283 4654 4961
Gross R & D
Expenditure
24323 27252 30991 39557 45772
RESEARCH & DEVELOPMENT BUDGET 2014-15
Particulars Actuals
2013-14
Budget
Estimates
2014-15
Variance Variance %
Materials 4883 8427 3544 42.05529845
Salaries & Wages 13323 12638 -685 -5.42016142
Depreciation 1897 2340 443 18.93162393
Other Expenses (incl.
Allocated)
4220 3848 -372 -9.66735967
Gross R & D
Expenditure
24323 27252 2929 10.74783502
RESEARCH & DEVELOPMENT BUDGET 2015-16
[ Value in `
lakh]
Particulars Actuals
2014-
15
Budget
Estimates
2015-16
Revised
Estimates
2015-16
Budget
Estimates
2016-17
Forecast 2017-
18
Materials 4883 16159 16604 18374 20130
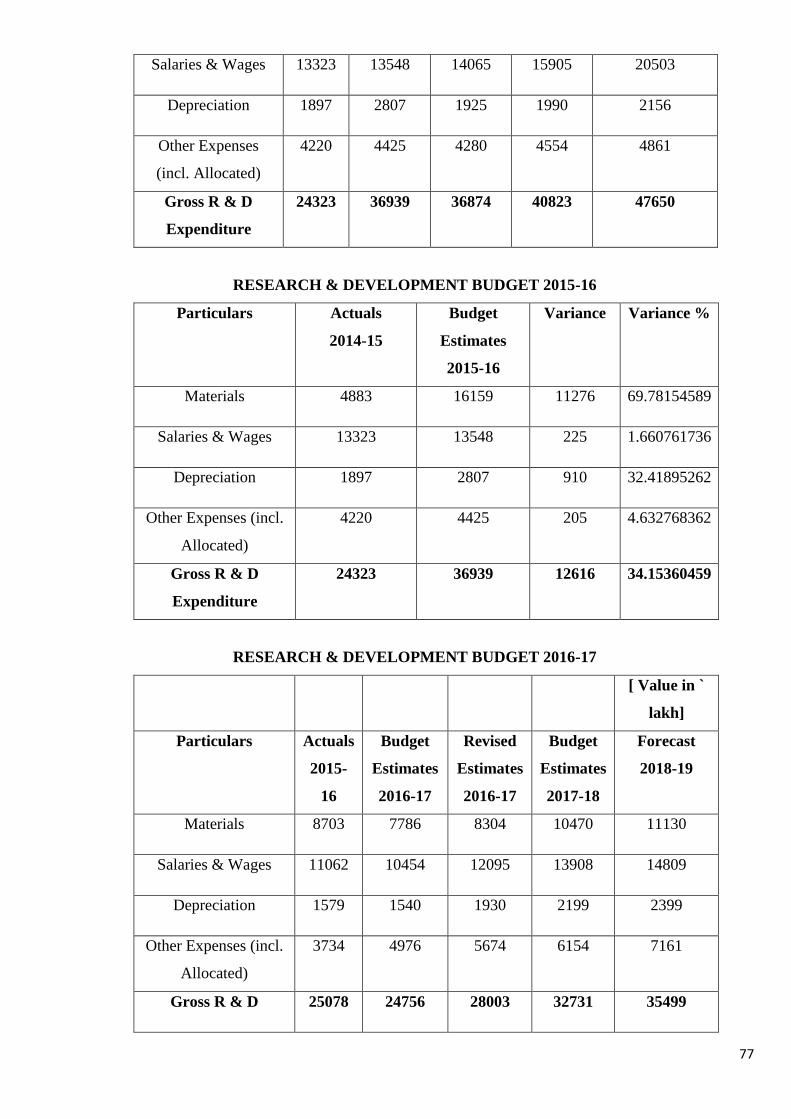
77
Salaries & Wages 13323 13548 14065 15905 20503
Depreciation 1897 2807 1925 1990 2156
Other Expenses
(incl. Allocated)
4220 4425 4280 4554 4861
Gross R & D
Expenditure
24323 36939 36874 40823 47650
RESEARCH & DEVELOPMENT BUDGET 2015-16
Particulars Actuals
2014-15
Budget
Estimates
2015-16
Variance Variance %
Materials 4883 16159 11276 69.78154589
Salaries & Wages 13323 13548 225 1.660761736
Depreciation 1897 2807 910 32.41895262
Other Expenses (incl.
Allocated)
4220 4425 205 4.632768362
Gross R & D
Expenditure
24323 36939 12616 34.15360459
RESEARCH & DEVELOPMENT BUDGET 2016-17
[ Value in `
lakh]
Particulars Actuals
2015-
16
Budget
Estimates
2016-17
Revised
Estimates
2016-17
Budget
Estimates
2017-18
Forecast
2018-19
Materials 8703 7786 8304 10470 11130
Salaries & Wages 11062 10454 12095 13908 14809
Depreciation 1579 1540 1930 2199 2399
Other Expenses (incl.
Allocated)
3734 4976 5674 6154 7161
Gross R & D 25078 24756 28003 32731 35499
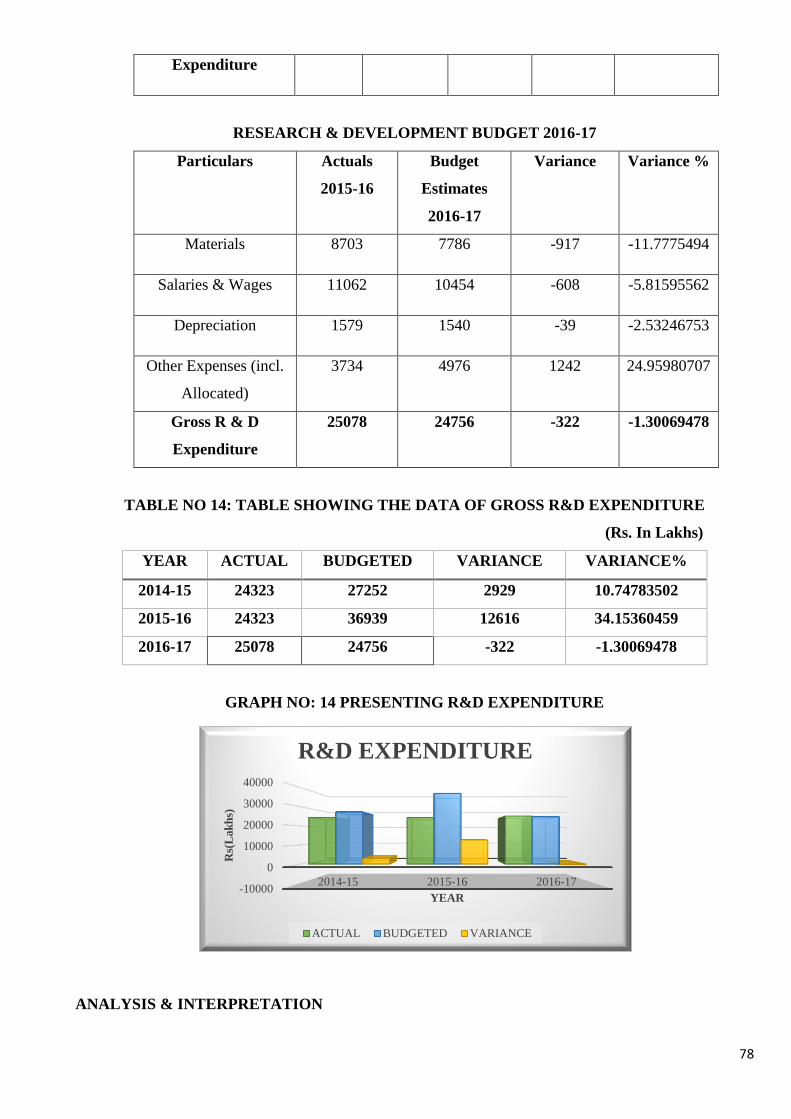
78
Expenditure
RESEARCH & DEVELOPMENT BUDGET 2016-17
Particulars Actuals
2015-16
Budget
Estimates
2016-17
Variance Variance %
Materials 8703 7786 -917 -11.7775494
Salaries & Wages 11062 10454 -608 -5.81595562
Depreciation 1579 1540 -39 -2.53246753
Other Expenses (incl.
Allocated)
3734 4976 1242 24.95980707
Gross R & D
Expenditure
25078 24756 -322 -1.30069478
TABLE NO 14: TABLE SHOWING THE DATA OF GROSS R&D EXPENDITURE
(Rs. In Lakhs)
YEAR ACTUAL BUDGETED VARIANCE VARIANCE%
2014-15 24323 27252 2929 10.74783502
2015-16 24323 36939 12616 34.15360459
2016-17 25078 24756 -322 -1.30069478
GRAPH NO: 14 PRESENTING R&D EXPENDITURE
ANALYSIS & INTERPRETATION
-10000
0
10000
20000
30000
40000
2014-15 2015-16 2016-17
Rs(
Lak
hs)
YEAR
R&D EXPENDITURE
ACTUAL BUDGETED VARIANCE
79
In the year 2014-15 and 2015-16 the actual value of R&D expenditure is less associated to the budgeted
value of R&D by 10.74% and 34.15% respectively. The reason might be budget committee has analyzed
the budgeted cost less on R&D activity than compared to the actual cost. In the year 2016-17 the actual
value of R&D expenditure is more than the budgeted figures by 1.30%. Because of the variation of real
expenses on the R&D activity.
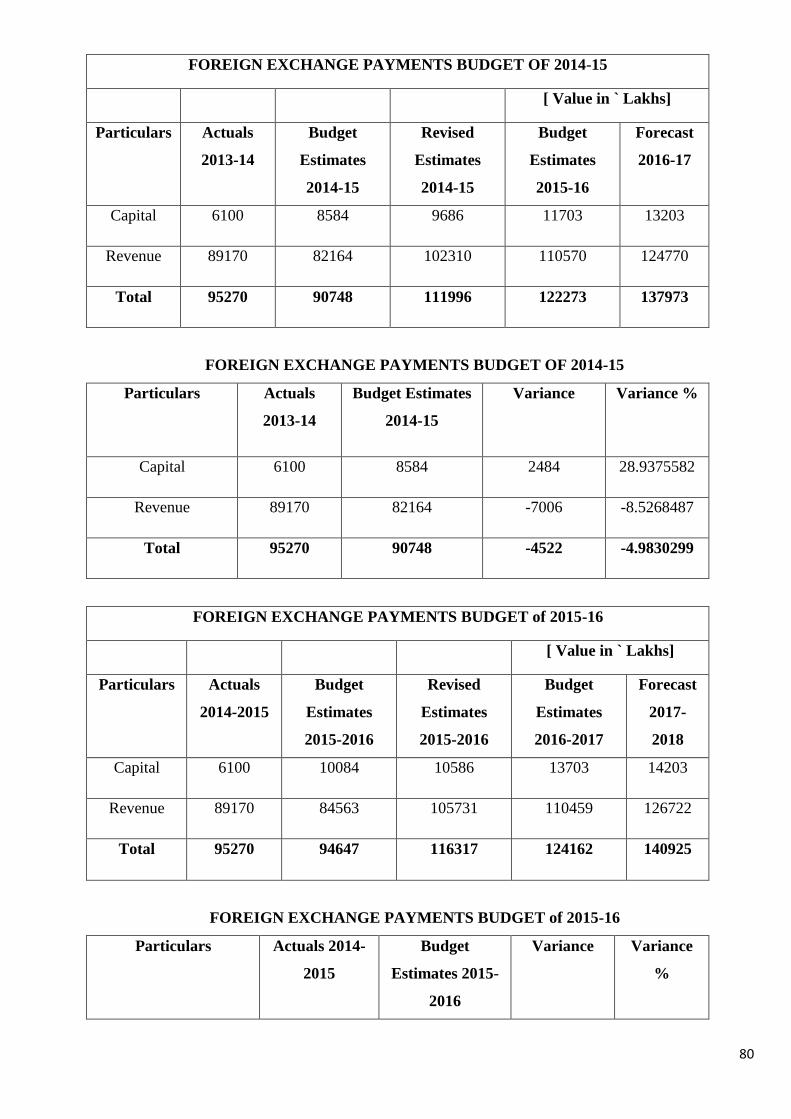
80
FOREIGN EXCHANGE PAYMENTS BUDGET OF 2014-15
[ Value in ` Lakhs]
Particulars Actuals
2013-14
Budget
Estimates
2014-15
Revised
Estimates
2014-15
Budget
Estimates
2015-16
Forecast
2016-17
Capital 6100 8584 9686 11703 13203
Revenue 89170 82164 102310 110570 124770
Total 95270 90748 111996 122273 137973
FOREIGN EXCHANGE PAYMENTS BUDGET OF 2014-15
Particulars Actuals
2013-14
Budget Estimates
2014-15
Variance Variance %
Capital 6100 8584 2484 28.9375582
Revenue 89170 82164 -7006 -8.5268487
Total 95270 90748 -4522 -4.9830299
FOREIGN EXCHANGE PAYMENTS BUDGET of 2015-16
[ Value in ` Lakhs]
Particulars Actuals
2014-2015
Budget
Estimates
2015-2016
Revised
Estimates
2015-2016
Budget
Estimates
2016-2017
Forecast
2017-
2018
Capital 6100 10084 10586 13703 14203
Revenue 89170 84563 105731 110459 126722
Total 95270 94647 116317 124162 140925
FOREIGN EXCHANGE PAYMENTS BUDGET of 2015-16
Particulars Actuals 2014-
2015
Budget
Estimates 2015-
2016
Variance Variance
%
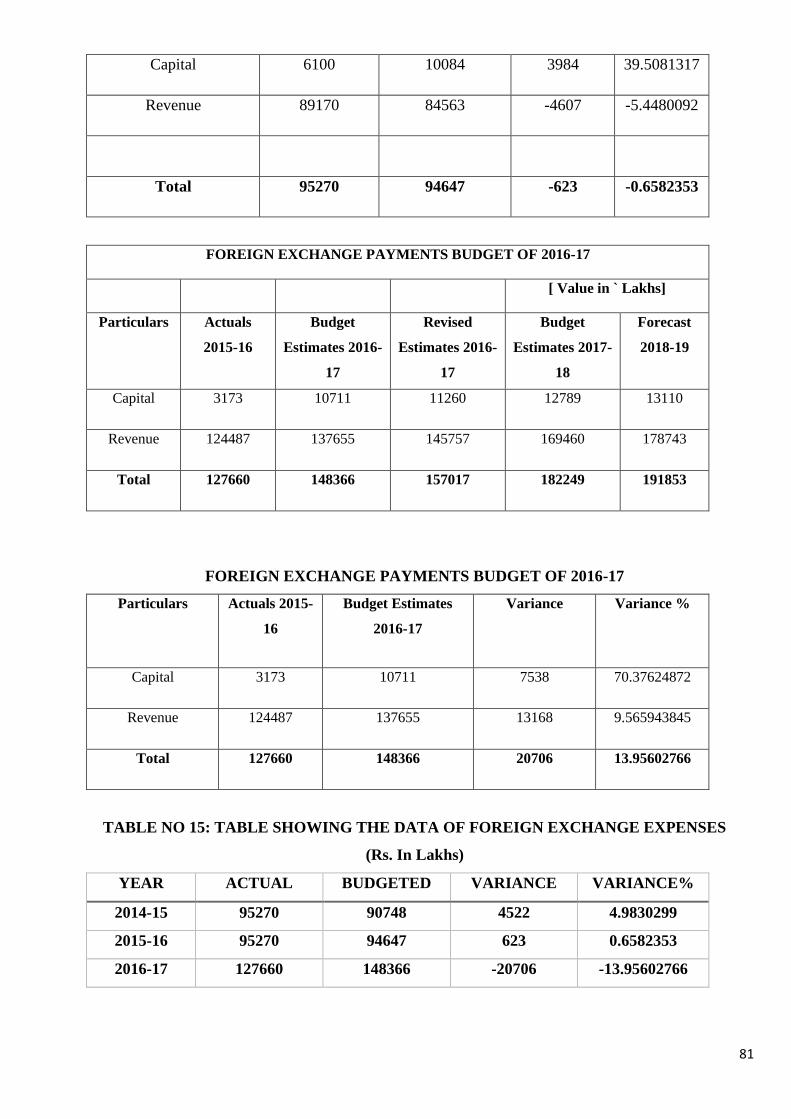
81
Capital 6100 10084 3984 39.5081317
Revenue 89170 84563 -4607 -5.4480092
Total 95270 94647 -623 -0.6582353
FOREIGN EXCHANGE PAYMENTS BUDGET OF 2016-17
[ Value in ` Lakhs]
Particulars Actuals
2015-16
Budget
Estimates 2016-
17
Revised
Estimates 2016-
17
Budget
Estimates 2017-
18
Forecast
2018-19
Capital 3173 10711 11260 12789 13110
Revenue 124487 137655 145757 169460 178743
Total 127660 148366 157017 182249 191853
FOREIGN EXCHANGE PAYMENTS BUDGET OF 2016-17
Particulars Actuals 2015-
16
Budget Estimates
2016-17
Variance Variance %
Capital 3173 10711 7538 70.37624872
Revenue 124487 137655 13168 9.565943845
Total 127660 148366 20706 13.95602766
TABLE NO 15: TABLE SHOWING THE DATA OF FOREIGN EXCHANGE EXPENSES
(Rs. In Lakhs)
YEAR ACTUAL BUDGETED VARIANCE VARIANCE%
2014-15 95270 90748 4522 4.9830299
2015-16 95270 94647 623 0.6582353
2016-17 127660 148366 -20706 -13.95602766
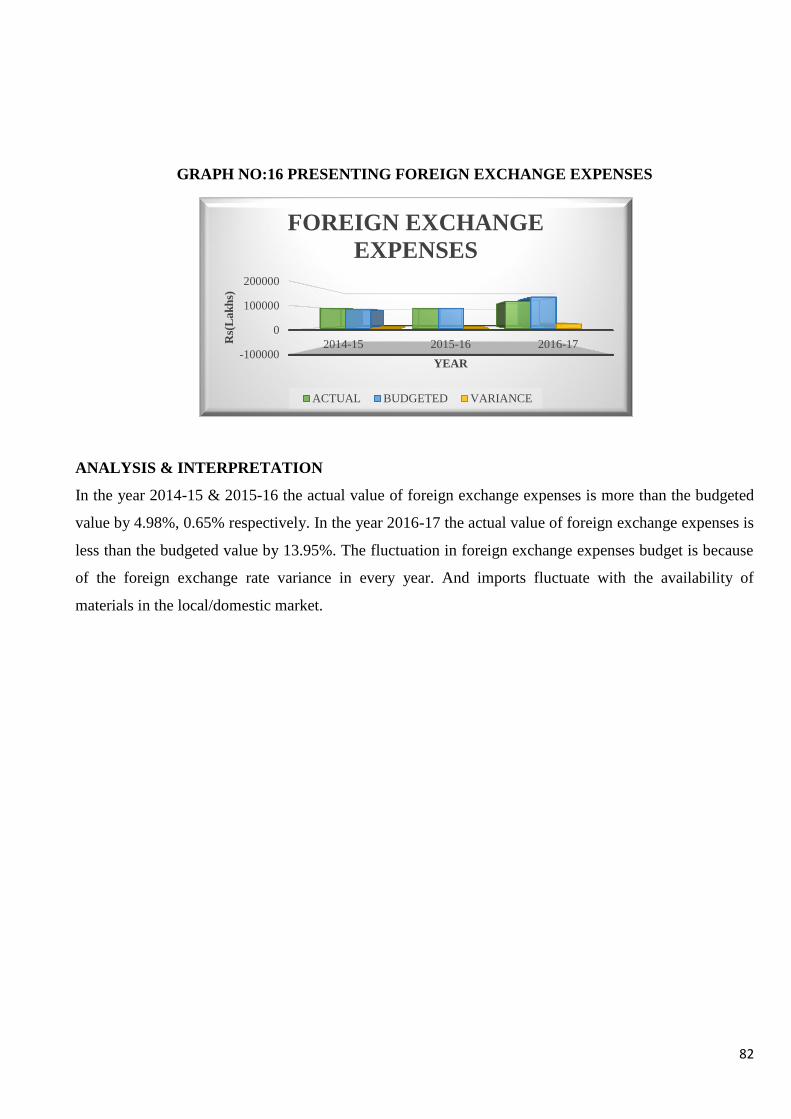
82
GRAPH NO:16 PRESENTING FOREIGN EXCHANGE EXPENSES
ANALYSIS & INTERPRETATION
In the year 2014-15 & 2015-16 the actual value of foreign exchange expenses is more than the budgeted
value by 4.98%, 0.65% respectively. In the year 2016-17 the actual value of foreign exchange expenses is
less than the budgeted value by 13.95%. The fluctuation in foreign exchange expenses budget is because
of the foreign exchange rate variance in every year. And imports fluctuate with the availability of
materials in the local/domestic market.
-100000
0
100000
200000
2014-15 2015-16 2016-17 Rs(
Lak
hs)
YEAR
FOREIGN EXCHANGE
EXPENSES
ACTUAL BUDGETED VARIANCE
83
CHAPTER 5
FINDINGS, SUGGESTIONS AND CONCLUSION
FINDINGS
The discoveries after the investigation of different reports of the organization, for example, Balance sheet,
different budgets like Budget Operating Estimates, Cash budget, Research and Development budget,
Inventory budget and Foreign Exchange Payment budget for a period for 2014-15 to 2016-17 are as per
the following:
Budgeted Operating Estimates from the year 2014 to 2017 delineates that there is a significant
measure of variation amid the budgeted and actual i.e. This demonstrates budgets are either overly
assessed or under evaluated. Consequently, the budgets ought to be arranged suitably on the
incremental basis which would somehow or otherwise lead to main purpose of the budgeting
being invalidated.
There is a huge variation amid the budgeted estimation and actual value of net fixed asset 59.5%
in 2014-15, 63.1% in 2015-16 and 42.16% in 2016-17 slight variance of own funds 7.58% in
2014-5, 25.69% in 2015-16 and 23.58% 2016-17, current assets of 19.67%, 8.6% and 0.31%, and
current liabilities of 9.3%, 16.11% 0.72%.
The cash budget obviously demonstrates that actual amount apportioned have overwhelmed the
budgeted sum in the year 2014-15 (i.e. inflow of 6.69% and outflow of 68.48%) and 2016-17 (i.e.
inflow of 2.99% and outflow of 60.82%). This demonstrates organization's utilization design has
been on an expanding pattern and furthermore that the organization has a decent growth in sales
which can be found in the organization's profits expanding over a period.
The keeping up of inventory is done precisely and the stocks are not squandered. The variation of
budgeted and actual of net inventory in 2014-15 and 2015-16 is less i.e. 3.39%, 5.17%, but in
2016-17 it is slightly high 20.24%.
Revenues have expanded to incredible degree i.e. 410282 lakhs in 2014-15, 440163 lakhs in 2015-
16 and 510638 lakhs in 2016-17 which has brought about the organization's development and
soundness in doing its activities proficiently.
Variation of budgeted and actual in gross R&D expenditure is slightly high 10.74% in 2014-15,
34.15% in 2015-16 and less in 2016-17 i.e. 1.3%.
In foreign exchange expenses there is minor variation of budgeted and actual of 4.98% and 0.65%
in 2014-15 and 2015-16 respectively but more in 2016-17 of 13.95%.
The organization is concentrating on economy for which they have taken a progression of
measures which are long term in nature, the limiting the risk engaged with foreign trade.
84
The primary explanation behind change between the budgeted and actual value because of the
over estimation of the project.
The change is because of foreseen sales orders not emerging during the year, which has brought
about the variance in the Operating Estimates, Inventory and Cash Flow budgets.
Inconsistency in survey and detailing of advisory committee to finalize the Budget.
Many new items included and affirmed items erased or conceded in Revised Budget.
It is discovered that the change caused amongst budgeted and actual sum is from delaying of the
tasks from one year to another year.
Budgets are prepared in light of client necessities, new ventures under consideration, past
execution.
SUGGESTIONS
By taking a gander at the different diagrams in the budgeting operating estimates we can state that there is
a generous measure of variety amid the budgeted and actual. This demonstrates budgets are either overly
assessed or under evaluated. In this way, the check by reason for budgeting will influenced. Along these
lines, for the successful budgeting following recommendations are given:
Measures must be taken by the finance department to gauge the budgeted figures appropriately to
such an extent that it affirms to the actual around, as it was found that there is a wide variation
between the budgeted and actual values.
Inventory administration ought to be kept up more effectively by executing present day inventory
control procedures, for example, Just in Time, Economic Order Quantity and cradle stock.
The organization needs to ensure that money is used within the budgeted esteem, with the goal
that the organization does not lose its liquidity.
Sales budget demonstrate the focused-on turnover as well as point out to where endeavors must be
made to secure orders if the objective is to be met.
The interest of the considerable number of workers ought to be guaranteed while taking choices
identified with Budget.
Top administration ought to assemble consistent meeting of all division heads to talk about the
progress and to take care of the issues in hand.
To guarantee the better yearly target, it is important to perform consistently on quarterly premise
thinking about future development and product life.
Based on material utilization, the outcomes in respect to each Strategic Business Units (SBU) and
these objectives ought to be contrasted and actual execution of each quarter. It is required to get
85
definite clarifications concerning variation between the actual and budgeted amid the quarterly
outcomes.
Based on the necessities, the organization needs to change procedure of budgeting process i.e.,
how detailed the procedure ought to be gone ahead, at what frequency and who all in the
organization ought to be associated with the arrangement of budgets.
The change in Revised Estimates ought to be kept to the base, since extensive scale changes will
have negative effect in the reason for setting up the first budget estimates.
As there is no proper check of the budgeted and actual they should keep a check by getting ready
control ratios, budget is intended to change as per the level of action actually accomplished.
The obligation ought to be given to the specific center, which is only a segment of an association,
where an individual authority concerned is considered in charge of the execution of areas like-cost
centers, investment center and profit center.
Responsibility accounting ought to be taken after i.e. technique for collecting and reporting both
budgeted and actual cost and income by individual manager in charge of them.
Cash budget estimation uncover that the budgeted and the actual are not appropriate. This ought to
be kept up in future and the surplus money ought to be adequately and ideally used.
Since the budgeting and budgetary control frameworks are confounded appropriate training ought
to be given to every single concerned authorities and officials who are part in planning Budget.
As cost records are not kept by BEL they can keep up legitimate records for the future reason.
Identify the additional use spent towards a specific territory and embrace measures to control cost.
Preservation of power, minimization wastage of stationary and other use can add to decrease of
pointless cost.
CONCLUSION
The examination is done on budgetary control framework in Bharat Electronics Limited to discover its
adequacy.
Budgeting is thought to be an important activity for the procedure of any association and for the effective
and efficient performance of the association. Budgetary control process ought not be only a center of top
level administration and finance dept. yet there ought to be hierarchical wide committee for controlling
expenses and amplifying benefits.
To study on budgetary control shows how the use of the various statements of budget improve decision
making in relation to costing, transparency in administrative activities and helps taking corrective
measure more quickly. It throws light on how crucial the budgetary control system is to coordinate the
activities of various units to realize the vision and objectives of the company.
86
It is found from the investigation that the current budgeting framework is very much overseen and
compelling, with couple of deviations. The organization is developing at a quick rate and demonstrating
huge advance in the current years.
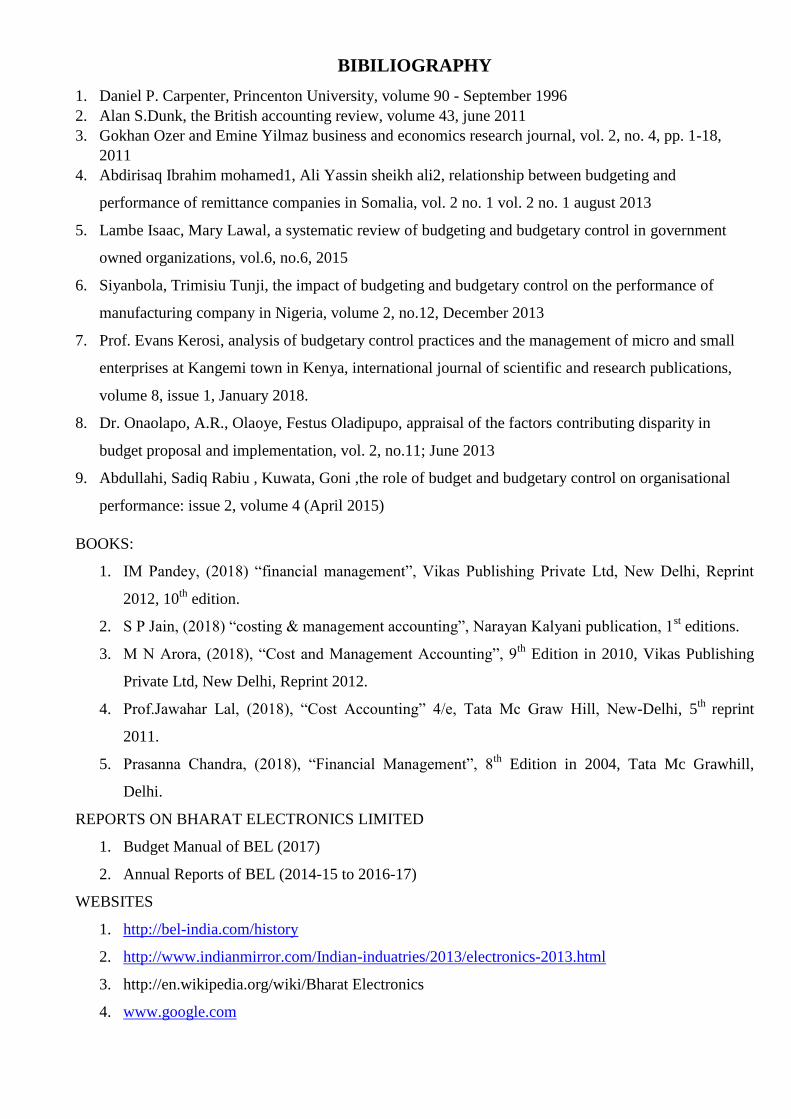
BIBILIOGRAPHY
1. Daniel P. Carpenter, Princenton University, volume 90 - September 1996
2. Alan S.Dunk, the British accounting review, volume 43, june 2011
3. Gokhan Ozer and Emine Yilmaz business and economics research journal, vol. 2, no. 4, pp. 1-18,
2011
4. Abdirisaq Ibrahim mohamed1, Ali Yassin sheikh ali2, relationship between budgeting and
performance of remittance companies in Somalia, vol. 2 no. 1 vol. 2 no. 1 august 2013
5. Lambe Isaac, Mary Lawal, a systematic review of budgeting and budgetary control in government
owned organizations, vol.6, no.6, 2015
6. Siyanbola, Trimisiu Tunji, the impact of budgeting and budgetary control on the performance of
manufacturing company in Nigeria, volume 2, no.12, December 2013
7. Prof. Evans Kerosi, analysis of budgetary control practices and the management of micro and small
enterprises at Kangemi town in Kenya, international journal of scientific and research publications,
volume 8, issue 1, January 2018.
8. Dr. Onaolapo, A.R., Olaoye, Festus Oladipupo, appraisal of the factors contributing disparity in
budget proposal and implementation, vol. 2, no.11; June 2013
9. Abdullahi, Sadiq Rabiu , Kuwata, Goni ,the role of budget and budgetary control on organisational
performance: issue 2, volume 4 (April 2015)
BOOKS:
1. IM Pandey, (2018) “financial management”, Vikas Publishing Private Ltd, New Delhi, Reprint
2012, 10th
edition.
2. S P Jain, (2018) “costing & management accounting”, Narayan Kalyani publication, 1st editions.
3. M N Arora, (2018), “Cost and Management Accounting”, 9th
Edition in 2010, Vikas Publishing
Private Ltd, New Delhi, Reprint 2012.
4. Prof.Jawahar Lal, (2018), “Cost Accounting” 4/e, Tata Mc Graw Hill, New-Delhi, 5th
reprint
2011.
5. Prasanna Chandra, (2018), “Financial Management”, 8th
Edition in 2004, Tata Mc Grawhill,
Delhi.
REPORTS ON BHARAT ELECTRONICS LIMITED
1. Budget Manual of BEL (2017)
2. Annual Reports of BEL (2014-15 to 2016-17)
WEBSITES
1. http://bel-india.com/history
2. http://www.indianmirror.com/Indian-induatries/2013/electronics-2013.html
3. http://en.wikipedia.org/wiki/Bharat Electronics
4. www.google.com
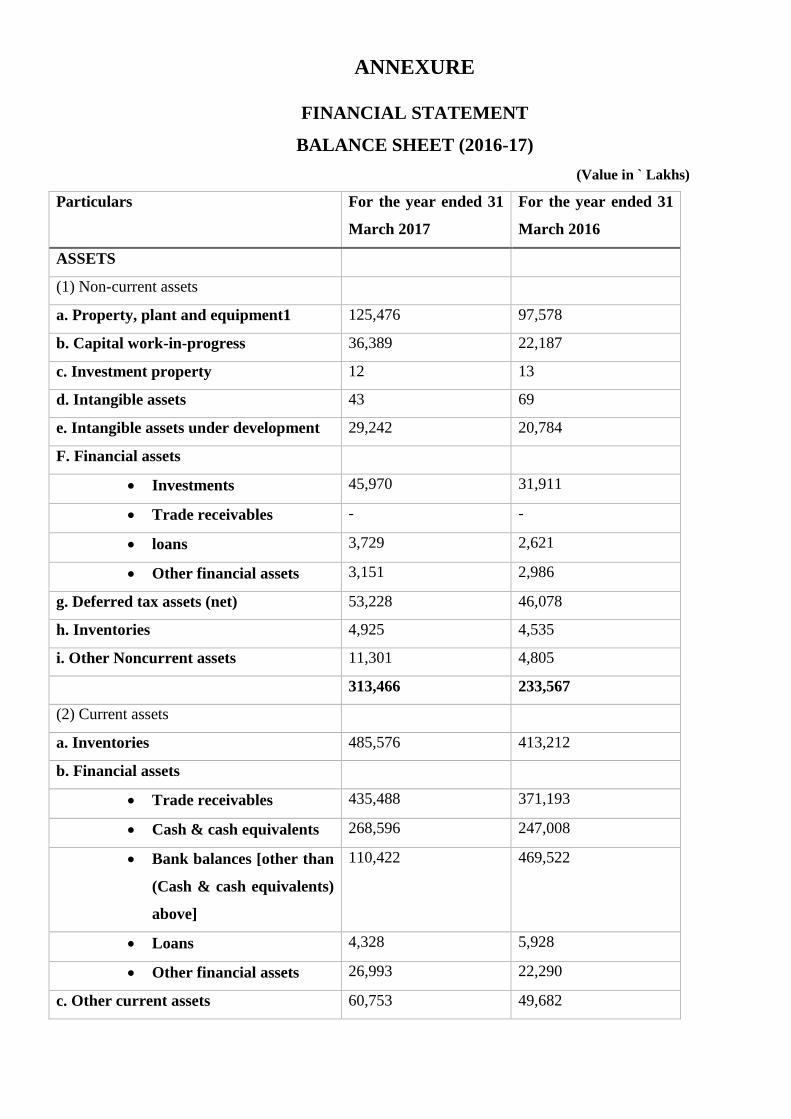
ANNEXURE
FINANCIAL STATEMENT
BALANCE SHEET (2016-17)
(Value in ` Lakhs)
Particulars For the year ended 31
March 2017
For the year ended 31
March 2016
ASSETS
(1) Non-current assets
a. Property, plant and equipment1 125,476 97,578
b. Capital work-in-progress 36,389 22,187
c. Investment property 12 13
d. Intangible assets 43 69
e. Intangible assets under development 29,242 20,784
F. Financial assets
Investments 45,970 31,911
Trade receivables - -
loans 3,729 2,621
Other financial assets 3,151 2,986
g. Deferred tax assets (net) 53,228 46,078
h. Inventories 4,925 4,535
i. Other Noncurrent assets 11,301 4,805
313,466 233,567
(2) Current assets
a. Inventories 485,576 413,212
b. Financial assets
Trade receivables 435,488 371,193
Cash & cash equivalents 268,596 247,008
Bank balances [other than
(Cash & cash equivalents)
above]
110,422 469,522
Loans 4,328 5,928
Other financial assets 26,993 22,290
c. Other current assets 60,753 49,682
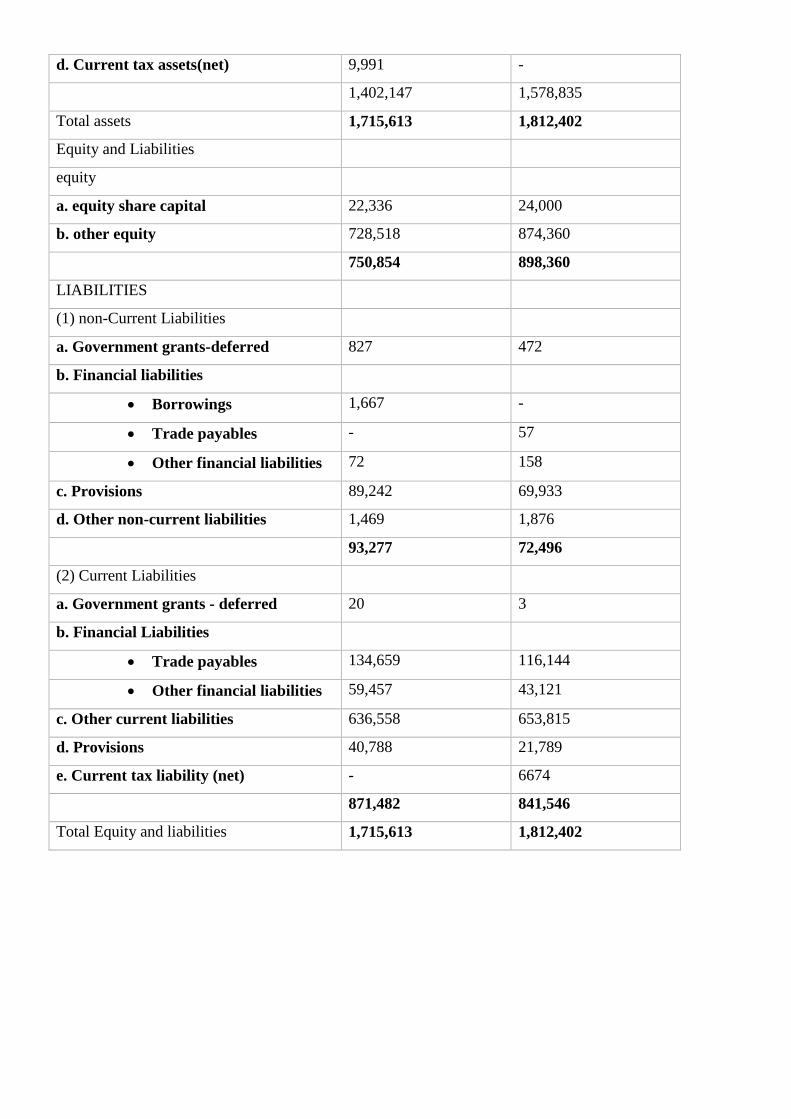
d. Current tax assets(net) 9,991 -
1,402,147 1,578,835
Total assets 1,715,613 1,812,402
Equity and Liabilities
equity
a. equity share capital 22,336 24,000
b. other equity 728,518 874,360
750,854 898,360
LIABILITIES
(1) non-Current Liabilities
a. Government grants-deferred 827 472
b. Financial liabilities
Borrowings 1,667 -
Trade payables - 57
Other financial liabilities 72 158
c. Provisions 89,242 69,933
d. Other non-current liabilities 1,469 1,876
93,277 72,496
(2) Current Liabilities
a. Government grants - deferred 20 3
b. Financial Liabilities
Trade payables 134,659 116,144
Other financial liabilities 59,457 43,121
c. Other current liabilities 636,558 653,815
d. Provisions 40,788 21,789
e. Current tax liability (net) - 6674
871,482 841,546
Total Equity and liabilities 1,715,613 1,812,402
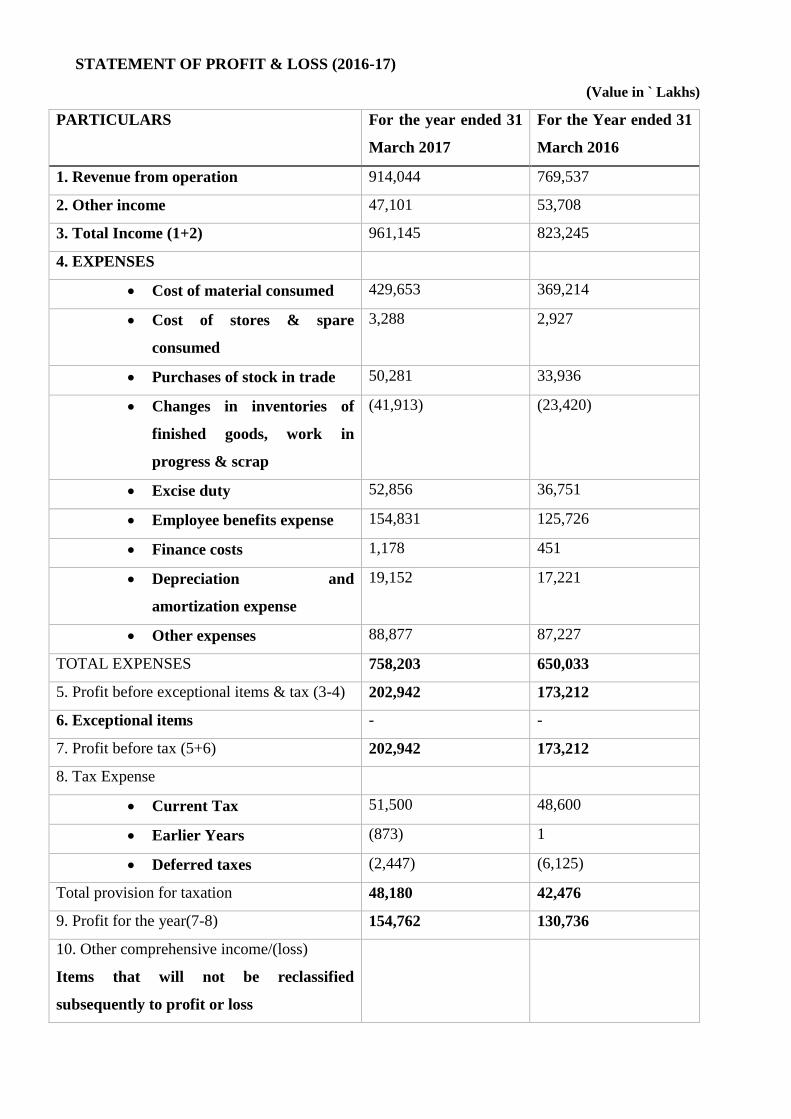
STATEMENT OF PROFIT & LOSS (2016-17)
(Value in ` Lakhs)
PARTICULARS For the year ended 31
March 2017
For the Year ended 31
March 2016
1. Revenue from operation 914,044 769,537
2. Other income 47,101 53,708
3. Total Income (1+2) 961,145 823,245
4. EXPENSES
Cost of material consumed 429,653 369,214
Cost of stores & spare
consumed
3,288 2,927
Purchases of stock in trade 50,281 33,936
Changes in inventories of
finished goods, work in
progress & scrap
(41,913) (23,420)
Excise duty 52,856 36,751
Employee benefits expense 154,831 125,726
Finance costs 1,178 451
Depreciation and
amortization expense
19,152 17,221
Other expenses 88,877 87,227
TOTAL EXPENSES 758,203 650,033
5. Profit before exceptional items & tax (3-4) 202,942 173,212
6. Exceptional items - -
7. Profit before tax (5+6) 202,942 173,212
8. Tax Expense
Current Tax 51,500 48,600
Earlier Years (873) 1
Deferred taxes (2,447) (6,125)
Total provision for taxation 48,180 42,476
9. Profit for the year(7-8) 154,762 130,736
10. Other comprehensive income/(loss)
Items that will not be reclassified
subsequently to profit or loss
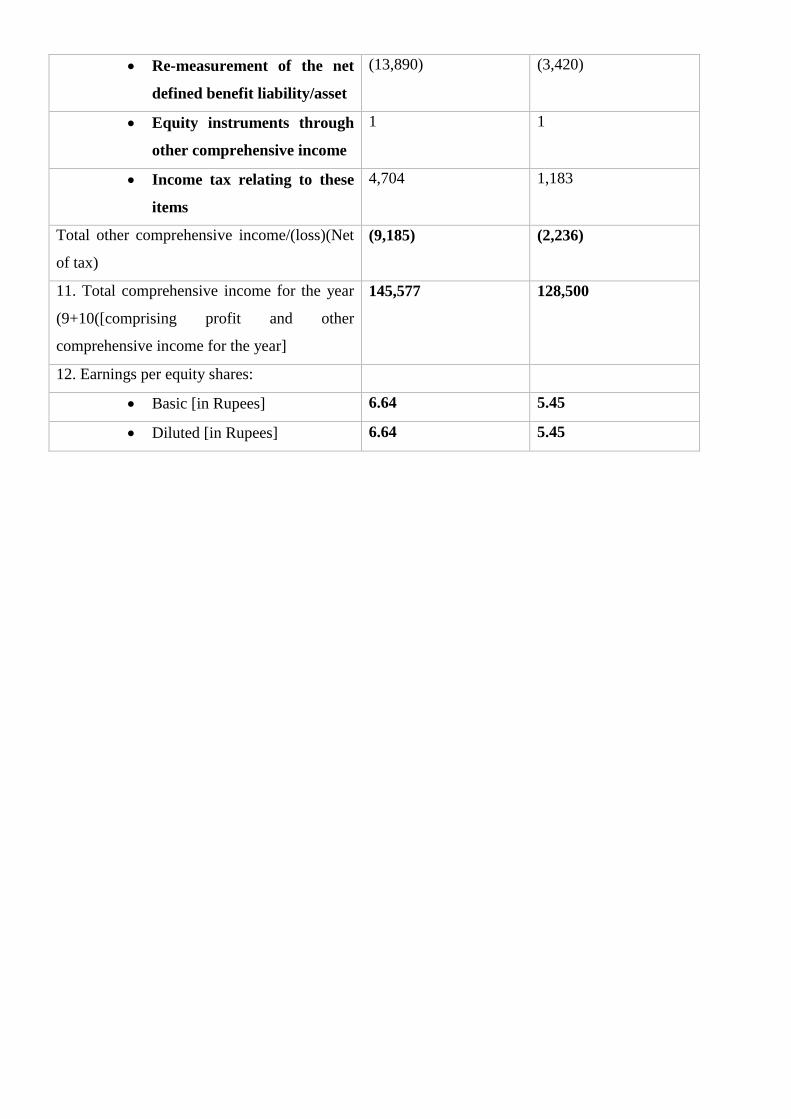
Re-measurement of the net
defined benefit liability/asset
(13,890) (3,420)
Equity instruments through
other comprehensive income
1 1
Income tax relating to these
items
4,704 1,183
Total other comprehensive income/(loss)(Net
of tax)
(9,185) (2,236)
11. Total comprehensive income for the year
(9+10([comprising profit and other
comprehensive income for the year]
145,577 128,500
12. Earnings per equity shares:
Basic [in Rupees] 6.64 5.45
Diluted [in Rupees] 6.64 5.45
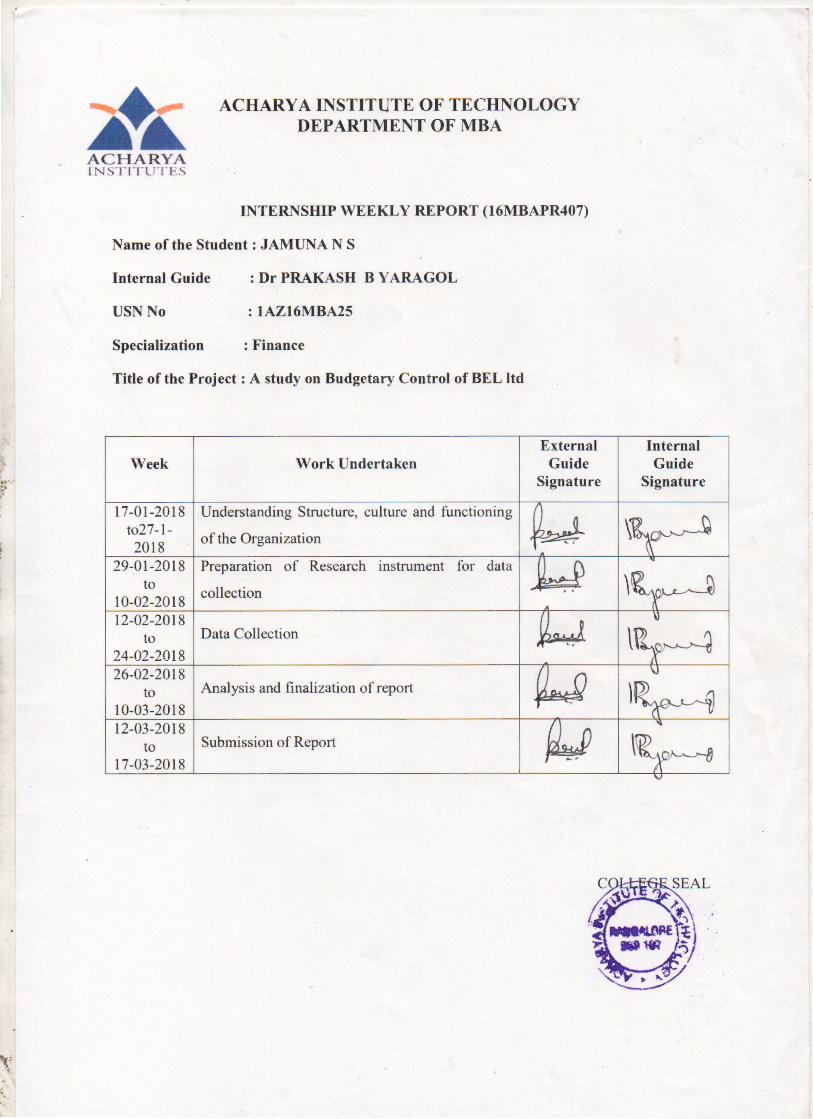
~+.._ A CHARY A INSTITUTE OF TECHNOLOGY DEPARTMENT OF MBA
ACHARYA 1N'>JJ1Lir'>
INTERNSHIP WEEKLY REPORT (16MBAPR407)
Name of the Student : JAM UNA N S
Internal Guide : Dr PRAKASH BY ARAGOL
USN No : 1AZ16MBA25
Specialization :Finance
Title of the Project : A study on Budgetary Control of BEL ltd
Week
17-01-2018 to27-l-2018
29-01-2018 to
I 0-02-2018 12-02-2018
to 24-02-2018 26-02-2018
to I 0-03-2018 12-03-201 8
to 17-03-2018
Work Undertaken
Understanding Structure, culture and functioning
of the Organization
Preparation of Research instrument for data
collection
Data Collection
Analysis and finali zation of rep011
Submission of Report
External Guide
Signature
Internal Guide
Signature


