Embed Size (px)
Citation preview

Go Onlinewww.matthey.com/AR12To view our online annual report
JOHNSON MATTHEY IS A LEADING SPECIALITYCHEMICALS COMPANY UNDERPINNED BYSCIENCE, TECHNOLOGY AND OUR PEOPLE.
The group is a leader in sustainabletechnologies and many of ourproducts enhance the quality of lifefor millions through their beneficialimpact on the environment, healthand wellbeing. Technologyleadership forms the basis ofJohnson Matthey’s strategy to deliversuperior long term growth and wecontinue to invest in R&D to developthe next generation of sustainableproducts for our customers. To us,good performance is not just aboutprofit. It’s about running our businessin the most sustainable andresponsible way and so we haveidentified five elements of sustainabilitywhich have a material impact on ourbusiness. In this report we will updateyou on our progress.
DELIVERINGVALUE
FinancialMust be profitable to be sustainableSustainability initiatives can be cost efficient too
Health and SafetyProtecting employees, customers and communitiesBeneficial products
EnvironmentResponsible operationsBeneficial products
GovernanceWell run businessTransparent reporting
SocialEmployee development and wellbeing, recruitment Supporting communities, safeguarding reputation
Building a Sustainable Business
ANNUAL REPORT & ACCOUNTS
Johnson Matthey
Annual R
eport & Accounts 2012
5th Floor25 Farringdon StreetLondon EC4A 4ABUnited KingdomTel: +44 (0)20 7269 8400Fax: +44 (0)20 7269 8433
2012
VALUEdeveloping products that enhance the quality of life
for millions of people around the world
Go Onlinewww.matthey.comTo view our online annual report
DELIVERING

Johnson Matthey Annual Report & Accounts 2012
Johnson Matthey at a Glance
Environmental Technologies
Emission ControlTechnologies
Process Technologies
Fuel Cells
Environmental Technologies Division’sproducts and services are used globally inapplications which benefit the environment.It supplies catalysts and technologieswhich contribute to pollution control,cleaner fuels, greener power and the moreefficient use of hydrocarbon resources.Its emission control catalysts are fitted toabout one in three cars around the world.
Return on sales excluding 11.3%precious metalsReturn on invested capital (ROIC) 14.2%Capital expenditure £97.1mCapex / depreciation 1.2Average invested capital £1,492mEmployees 5,640
Key Statistics
2009
1,135*
124.3
1,252
120.9
1,566
164.7
1,876
211.8
2010 2011 2012Sales excludingprecious metals
Underlyingoperatingprofit
0
500
1,000
1,500
2,000
£ million
* Excluding inter-segment sales.
Precious Metal Products
Services
Platinum Marketing and DistributionRefining
Manufacturing
Noble MetalsColour Technologies
Catalysts and Chemicals
Precious Metal Products Divisionadds value to precious metals. Its wideranging activities include the marketing,distribution and fabrication of preciousmetals and the manufacture of catalystsand precious metal chemicals. It is alsoa world leading refiner of precious metals,ensuring these valuable materials areefficiently recovered and reused.
Return on sales excluding 34.5%precious metalsReturn on invested capital (ROIC) 58.9%Capital expenditure £31.6mCapex / depreciation 1.4Average invested capital £341mEmployees 2,894
Key Statistics
2009
447*
143.0
454
116.7
541
172.9
582
200.8
2010 2011 2012Sales excludingprecious metals
Underlyingoperatingprofit
0
200
400
600
£ million
Fine Chemicals
API Manufacturing
Macfarlan SmithPharmaceutical Materials and Services
Research Chemicals
Fine Chemicals Division supplies activepharmaceutical ingredients, fine chemicalsand other speciality chemicals to a widerange of pharmaceutical and chemicalindustry customers and research institutesglobally. Its products help relieve pain, treat cancer and other medical conditions,improving the quality of life for many peoplearound the world.
Return on sales excluding 24.5%precious metalsReturn on invested capital (ROIC) 16.7%Capital expenditure £15.8mCapex / depreciation 0.9Average invested capital £418mEmployees 1,090
Key Statistics
2009
215*
49.5
221
55.8
245
56.2
285
69.7
2010 2011 2012Sales excludingprecious metals
Underlyingoperatingprofit
0
100
200
300
£ million
March2007
March2008
March2009
March2011
March2010
March2012
Total accident rate
> 3-day lost timeaccident rate
0
3
6
9
12
2007* 2009 2010 2011 2012
Tonnes CO2
equivalent (’000)Tonnes /£ million sales
0
100
200
300
400
500
0
50
100
150
200
250
300
2008
89.6
37.1
89.5
36.6
86.4
39.0
119.0
46.0
153.7
55.0
2009 20112010 2012Underlying earnings per share
Ordinary dividend per share
0
40
80
120
160
Performance Highlights
* Calendar year.
Johnson Matthey continued its strong performance in 2011/12 withgood growth across all three of its divisions.
Year to 31st March2012 2011 % change
FinancialRevenue £ million 12,023 9,985 +20
Sales excluding precious metals (sales) £ million 2,679 2,280 +17
Profit before tax £ million 409.3 259.32 +58
Total earnings per share pence 148.7 85.22 +75
Underlying1:
Profit before tax £ million 426.0 345.5 +23
Earnings per share pence 153.7 119.0 +29
Dividends per share:
Ordinary pence 55.0 46.0 +20
Special pence 100.0 – –
SocialAverage number of employees 9,914 9,388 +6
Voluntary employee turnover % 6.4 5.6 +1
Training spend per employee £ 335 390 -14
Charitable donations £ thousands 645 517 +25
Health and SafetyGreater than three day accidents per 1,000 employees 2.07 2.992 -31
Total accident rate per 1,000 employees 5.69 7.892 -28
Occupational illness cases per 1,000 employees 3.5 3.5 –
EnvironmentEnergy consumption thousands GJ 4,726 4,749 –
Global warming potential thousand tonnes CO2 equivalent 417 415 –
Total waste tonnes 120,363 113,671 +6
Water consumption thousands m3 2,201 2,076 +6
Total acid gas emissions tonnes SO2 equivalent 444 318 +40
1 Before amortisation of acquired intangibles, major impairment and restructuring charges, profit or loss on disposal of businesses and, where relevant, related tax effects.
2 Restated.
Delivering Superior Valuepence
> Reducing Carbon IntensityTonnes CO2 Tonnes /equivalent (’000) £ million sales
> Safety is a Key Priorityper 1,000 employees
>
The paper in this report contains material sourced from responsibly managed forests, certified inaccordance with the FSC® (Forest Stewardship Council) and is totally recyclable and acid-free.
Fulmar Colour is FSC certified, PEFC certified and ISO 14001 certified showing that it is committedto all round excellence and improving environmental performance is an important part of thisstrategy. Fulmar Colour aims to reduce at source the effect its operations have on the environmentand is committed to continual improvement, prevention of pollution and compliance with anylegislation or industry standards.
Fulmar Colour is a Carbon Neutral Printing Company.
Designed and produced by MAGEEwww.magee.co.ukPrinted by Fulmar Colour
Johnson Matthey is grateful to the following for their help in providing illustrations:
Fruits, page 65 – © Ene | Dreamstime.com

Johnson Matthey Annual Report & Accounts 2012
>DeliveringValue
1
CAUTIONARY STATEMENT
The Business Review and certain other sections of this annual report contain forward looking statements that are subject to risk factors associatedwith, amongst other things, the economic and business circumstances occurring from time to time in the countries and sectors in which the groupoperates. It is believed that the expectations reflected in these statements are reasonable but they may be affected by a wide range of variableswhich could cause actual results to differ materially from those currently anticipated.

This annual report aims to demonstrate how we deliver superiorvalue for our stakeholders. It combines our financial, social, health andsafety, environmental and governance performance into one documentand reflects the five elements of sustainability which we believe have amaterial impact on our business.
Consequently…
Our 2012 Annual Report and Accounts is divided into eight sections:
Contents
Overview: introduces Johnson Matthey and summarises our performance in the year. It also outlines the group’s strategy fordelivering superior value.
Financial: details the financial performance of the group and its three divisions during the year.
Social: highlights initiatives involving our people, our communities andother stakeholder groups. It also contains performance data relating toemployees and community investment.
Health and Safety: outlines our performance in the year, our approach to health, safety and product stewardship and the programmes we havein place to drive continuous improvement.
Environment: provides more detail on the impact of our business on theenvironment. It details the environmental performance of our operationsin the year and highlights the beneficial impact of our products.
Governance: introduces our board of directors and details the corporategovernance structures that are in place to ensure we manage ourbusiness in a responsible and transparent way.
Accounts: includes the consolidated and parent company accountsand related notes, as well as the statement on responsibility of directorsand the independent auditor’s report on the financial accounts.
Other Information: contains the assurance statement on our non-financialdata and a checklist against the Global Reporting Initiative. It alsoprovides further information for shareholders, a glossary and an indexto help the reader locate information in the relevant sections.
In addition to this integrated Annual Report and Accounts we publish case studies andfurther information on sustainability on the internet. Links to this supplementary informationare highlighted in the relevant chapter of this report with the symbol.
Johnson Matthey Annual Report & Accounts 20122
Go Onlinewww.matthey.com/AR12To view our online annual report

3
Report of the DirectorsBusiness Review
What we mean by Delivering ValueOverview:>
Johnson Matthey at a Glance (inner flap) Performance Highlights 2011/12 (inner flap) 6 Chairman’s Statement 8 Chief Executive’s Statement 10 Our Business 12 Our Strategy 16 Group Performance Review 18 Group Key Performance Indicators 20 Risks and Uncertainties
Linking profitability and sustainabilityFinancial:>
26 Financial Review of Operations 26 Environmental Technologies 34 Precious Metal Products 40 Fine Chemicals 43 Financial Review 47 Treasury Policies 47 Liquidity and Going Concern
Investing in our people and ourcommunities around the world
Social:>
50 Social Performance Summary 50 Stakeholder Engagement 52 Building a Sustainable Workforce 56 Community Investment 58 Social Aims and Targets
A key priorityHealth and Safety:>
62 Health and Safety Performance Summary 62 Managing Performance and Driving Continuous Improvement 62 Health Performance in 2011/12 63 Sustainable Health Improvement Priorities for 2012/13 63 Safety Performance in 2011/12 64 Safety Priorities for 2012/13 64 Product Stewardship 65 Product Stewardship Performance in 2011/12 65 Product Stewardship Priorities for 2012/13 66 Animal Testing 67 Responsible Care 67 Regulatory Matters
Environment:>
70 Environmental Performance Summary 70 Managing Performance and Driving Continuous Improvement 70 Environmental Performance in 2011/12 74 Environmental Aims and Targets 75 Biodiversity
Managing our business in the right wayGovernance:>
78 Letter from the Chairman 79 Governance and Sustainability 82 Board of Directors 84 Corporate Governance Report100 Other Statutory Information105 Nomination Committee Report106 Audit Committee Report108 Remuneration Report
The details behind ourfinancial performance
Accounts
120 Responsibility of Directors121 Independent Auditor’s Report122 Consolidated Income Statement122 Consolidated Statement of Total Comprehensive Income123 Consolidated and Parent Company Balance Sheets124 Consolidated and Parent Company Cash Flow Statements125 Consolidated Statement of Changes in Equity126 Parent Company Statement of Changes in Equity127 Accounting Policies131 Notes on the Accounts
Shareholdings, summaries,the glossary and index
Other Information
170 Five Year Record – Financial Data171 Five Year Record – Non-Financial Data172 Basis of Reporting – Non-Financial Data173 Verification and Assurance – Non-Financial Data174 Shareholder Information176 Global Reporting Initiative (GRI) Summary177 Glossary of Terms178 Index179 Financial Calendar 2012/13180 Company Details
Governance
Reducing the impact of our operations anddeveloping beneficial products

Johnson Matthey Annual Report & Accounts 2012Report of the Directors – Business ReviewOverview
4
What wemean byDeliveringValue

Contents
6 Chairman’s Statement 8 Chief Executive’s Statement 10 Our Business 12 Our Strategy 16 Group Performance Review 18 Group Key Performance Indicators 20 Risks and Uncertainties
OverviewThis section introduces Johnson Matthey and summarises our performance in the year. It also outlines the group’s strategyfor delivering superior value.
. The washcoat preparation area at our Smithfield facility in Pennsylvania, USA.
. Inspecting heavy duty diesel catalysts. . State of the art technologies at Smithfield formanufacturing heavy duty diesel catalysts.
> Leading the Way inHDD CatalystsThe market for catalysts to control harmfulemissions from heavy duty diesel (HDD)vehicles, such as trucks and buses, is growing rapidly driven by tightening legislationfor both on road and non-road applicationsaround the world.
Johnson Matthey has developed worldleading catalyst technology for HDD applicationsand, as a result, has established a very strongmarket position thanks to sustained investmentin R&D and state of the art manufacturingfacilities, including at our plant in Smithfield,USA (pictured). 2011/12 marked anotherstrong year for Johnson Matthey’s HDDcatalyst business where sales grew by 48%to £438 million and operating profit morethan doubled.
New and tighter legislation will imposeincreasing technical demands on the emissioncontrol catalyst systems required for HDDapplications and technologies must cope withcontrolling oxides of nitrogen and particulatematter to extremely low levels. This inevitablyresults in increasing value for JohnsonMatthey. Furthermore, as legislation extendsto cover more vehicles and additional regionsof the world, the group’s commitment tomaintaining technology leadership in this fieldpositions us well to benefit from future growthin demand.
Delivering Value

Chairman’s Statement
In my first statement as Chairman, I amdelighted to report that Johnson Mattheyperformed very strongly in 2011/12. Duringthe year the company benefited from gooddemand for its products as well as robustprecious metal prices, particularly in thefirst half. The group’s continuing strongperformance is enabled by our long terminvestment in research and development(R&D) and our strategy of organic growth,complemented by bolt-on acquisitions.Together these have enabled the companyto achieve leading positions in a number of rapidly growing markets. The result isanother year of strong growth in underlyingearnings per share, which were up 29%to 153.7 pence.
The group’s cash generation has also been strong: at 31st March 2012 the group’s net debt (including post taxpension deficits) to EBITDA ratio was1.0 times. As a result of this very goodperformance the board has carried outa review of the group’s balance sheetstructure. The outlook for the groupremains strong; we believe it has ampleresources to fund forecast capitalexpenditure and a further increase in R&D.The board is therefore recommendinga special dividend to shareholders of100 pence per share, which represents atotal payment of approximately £212 million.
Sustainability continues to be a keyelement of the company’s strategy andI am very pleased to be introducing this,Johnson Matthey’s first ‘integrated’ annualreport, which describes all aspects of ourfinancial and non-financial performance.I believe that this reflects both our valuesand our determination to build a sustainablebusiness, as well as communicating to allof our stakeholders our commitment tosustainable growth. In this year’s annualreport we have also included morecomprehensive governance reporting,including in the Corporate GovernanceReport on pages 84 to 99 which formsa key part of the Report of the Directors.
Johnson Matthey Annual Report & Accounts 2012Report of the Directors – Business ReviewOverview
6
Tim StevensonChairman
“Welcome to this, our firstintegrated annual report,which I hope will provide youwith a deeper understandingof the many aspects of ourbusiness, its performance,its long term prospects, itsgovernance and, ultimately,how we deliver value to ourstakeholders.”

This is in light of changes introducedby the UK Corporate Governance Code(the Code), which replaced the CombinedCode on Corporate Governance in June2010. While we reflected certain aspectsof the Code on a voluntary basis in lastyear’s annual report, this year’s CorporateGovernance Report fully reflects a numberof substantial changes in corporategovernance reporting. I hope that thisintegrated annual report will provide youwith a deeper understanding of the manyaspects of our business, its performance,its long term prospects, its governanceand, ultimately, how we deliver value to ourcustomers and to other stakeholders.
I joined the board as ChairmanDesignate in March 2011 and was verypleased to have been appointed asChairman of your company at the close oflast year’s annual general meeting (AGM).
I recognise that an effective boardis central to the long term sustainablesuccess of the company. In the Governancesection of this year’s annual report wedescribe the structures and measures inplace which are designed to ensure itscontinued effectiveness and we reviewhow the principles of the Code have beenapplied in the year, focusing on the roleand effectiveness of the board. Wedescribe in particular the board andcommittee performance evaluationscompleted last year and underway thisyear. These have been especially importantfor me in my first year as Chairman.
I chair the board at an exciting stageof Johnson Matthey’s development. Notonly are its businesses making excellentprogress, realising the benefits of thecompany’s long term strategy andinvestment in R&D and facilities, but ourSustainability 2017 programme continuesto achieve good progress towards meetingits objectives and targets. Its focus onimproving resource efficiency in ourmanufacturing operations and developingmore sustainable products for ourcustomers should make a majorcontribution to growth in the years ahead.
Since joining the company, I have meta number of Johnson Matthey’s majorshareholders and received positive feedbackon the company and its strategy. I am keento maintain regular dialogue with ourshareholders and look forward to meetingmany of you at this year’s AGM when therewill be an opportunity for us to discuss thecompany’s business and achievements.
This is my opportunity to thank mypredecessor, Sir John Banham, for hisstrong leadership of the board and manyefforts on behalf of the company overthe five years that he was Chairman.John brought to the board his wideranging experience of both corporate andpublic sector leadership and governance.He was also a tireless ambassador for thecompany and an eloquent and enthusiasticadvocate of its achievements andpotential. On behalf of all of us at JohnsonMatthey, I thank him for his importantcontribution and wish him all the very bestfor his retirement.
Sir Thomas Harris retires from theboard at the close of this year’s AGMhaving served as a non-executive directorsince April 2009. I would like to thank Tomfor his wise counsel and contribution to thework of the board over the last three yearsand wish him the best for the future.
There is no doubt that our mostimportant investment is that which wemake in our people. The training,development and, most importantly, thewellbeing of our employees is vital to thesuccess of our business. In this respect I am delighted that we have made suchgood progress towards achieving ourtarget of zero accidents during the year.
Since joining the company I have metmany of our employees around the world.I have been repeatedly impressed by theirenthusiasm, professionalism and dedicationat every level of the organisation. Onbehalf of all our stakeholders, I thank ouremployees for their hard workingcontribution to another successful year.
To conclude: as you will read in thisannual report, Johnson Matthey is in verygood shape and continues to make goodprogress in delivering value to itsshareholders and other stakeholders.The drivers of our business remain firmlyin place. Despite current global economicuncertainties, I am confident that we willcontinue to benefit in the years ahead fromour continuing and increasing investmentin R&D, our emphasis on efficientmanufacturing infrastructure and thequality of our people around the world.
Tim StevensonChairman
7

Chief Executive’s Statement
Johnson Matthey Annual Report & Accounts 2012Report of the Directors – Business ReviewOverview
8
I am very pleased to say that JohnsonMatthey had a good year in 2011/12,continuing our strong financial performanceand making good progress towardsimproving our environmental, health andsafety performance. We have alsoincreased our focus on developing ourpeople and on defining and disseminatingour culture, both of which are key to thesuccess of our growing global business.The year has also seen us making goodprogress on our strategy of deliveringsuperior value to our stakeholders throughtechnology leadership, continuing toincrease our investment in research anddevelopment and in state of the artmanufacturing facilities around the world.
The year saw good growth across allthree of our divisions. Sales excludingprecious metals (sales) were substantiallyahead of last year, up 17% at £2.7 billion,and the rate of growth in underlyingoperating profit was higher, at 23%.
Our Environmental TechnologiesDivision had a very good year. Its EmissionControl Technologies (ECT) businessbenefited from good growth in sales of lightduty catalysts, ahead of growth in globalvehicle production, and a substantialincrease in demand for heavy duty dieselcatalysts, particularly in North America. OurProcess Technologies business performedwell boosted by another excellent yearfrom Davy Process Technology (DPT) anda good contribution from our Additivesbusiness (formerly Intercat), which wasacquired in November 2010.
Precious Metal Products Division alsoperformed well, especially in the first sixmonths of the year. After a very strong firsthalf, precious metal prices softened inresponse to concerns over the globaleconomy which adversely impacted thedivision’s Services businesses. ItsManufacturing businesses saw gooddemand across their product range.
Fine Chemicals Division exceeded ourexpectations, delivering excellent results in2011/12, supported by a very strongperformance from its Active PharmaceuticalIngredient (API) Manufacturing businesses.Its global Research Chemicals businessalso grew well in the year.
Neil CarsonChief Executive
“We have made goodprogress this year onour strategy of deliveringsuperior value to ourstakeholders throughtechnology leadership,continuing to increase ourinvestment in research anddevelopment and state ofthe art manufacturingfacilities around the world.”

9
For the group as a whole, revenuewas 20% up on last year at £12 billion and sales were £2.7 billion, 17% higherthan last year. Underlying operating profitwas 23% higher at £450.1 million, whileunderlying profit before tax was also 23% up at £426.0 million. The group’sunderlying return on sales increased to16.8% from 16.1% last year, primarily dueto operational leverage, particularly in ourheavy duty diesel catalyst business, andthe excellent performance from our highermargin DPT business.
Sustainability is a key element of ourstrategy for growth and is well embeddedin all of our businesses and embraced byour employees around the world. Wecontinue to make good progress towardsachieving our Sustainability 2017 Vision viathe challenging targets that we setourselves when we launched it back inDecember 2007. Our sustainability strategyand targets are subject to continuousreview and during the year we have madesome changes to our targets which areoutlined on page 15 of this annual report.In particular we have taken a detailed lookat our commitment to reduce carbonemissions from our operations.
Over the last few years we havegained a much better understanding ofcarbon legislation, markets and emissionsfrom our processes and we have come tothe conclusion that carbon neutrality is notan appropriate target for a growingmanufacturing business like ours. However,we remain committed to driving down ourcarbon emissions as much as is realisticallypossible and with effect from 1st April2012 we have replaced carbon neutralitywith a new target to halve our carbonintensity, relative to our 2007 baselinefigure, by 2017. I believe that this continuesto be a stretching target.
Johnson Matthey is extremely wellplaced to benefit from a combination ofimprovements to the efficiency andenvironmental performance of its ownmanufacturing operations and fromdeveloping new products that bringsignificant sustainability benefits to ourcustomers. Operational improvements andincreased efficiency have undoubtedlybeen making a significant contribution to
the growth and success of the companyin the last few years. Manufacturing is atthe very heart of our business. It is howwe bring our science and technology tolife and deliver what our customers want,when they want it. During the year weestablished and launched a groupwideManufacturing Excellence programme.I believe that this important initiative willbetter equip us to produce high technologyproducts for our customers in the mostsustainable and efficient way and will bringmajor benefits to our business in the yearsahead.
Our people play a vital role in thesuccess of our business, they truly are ourmost valuable resource. Their training anddevelopment and protection of their health,safety and wellbeing have long been, andremain, key priorities. We have continuedto make good progress during the year indeveloping our systems and improvingperformance in these very important areas.
Outlook
After another year of strong growth, thegroup is well positioned for the year ahead.However, once again, it is difficult toassess with any degree of confidence howthe global economy, especially in Europe,will develop in the short term. Thisuncertainty has resulted in a substantialfall in precious metal prices over the lastfew months, despite robust demand.Nonetheless, we remain confident that ourstrong position in markets with structuralgrowth will allow us to make furtherprogress in Environmental Technologiesand Fine Chemicals in 2012/13. This,however, will be offset by a weakerperformance from Precious Metal Products, if precious metal prices remain at current levels.
The outlook for our EnvironmentalTechnologies Division remains positive.Emission Control Technologies shouldbenefit from the continued development ofthe heavy duty diesel catalyst market andanticipated growth in light duty vehicleproduction in North America and Asia.However, we remain cautious about theoutlook for European car and truckmarkets. Notwithstanding that, the removal
of the headwinds in the first half of2011/12 associated with higher rare earthmaterial prices and the Japaneseearthquake should ensure that ECT willperform well in the first six months of thisyear. Process Technologies is also wellplaced for another year of growth,benefiting from the ongoing strongdemand for DPT’s licences and foradditives.
Precious Metal Products Division’sperformance is, as we have outlinedbefore, more dependent upon preciousmetal prices and their recent falls, ifmaintained, will impact the division’sServices businesses. In addition, thesebusinesses suffer from relatively toughcomparatives as metal prices and refiningintakes were strong in the first half of2011/12. Therefore, if precious metalprices remain at current levels, theperformance of the Services businesses inthe first half of 2012/13 will be significantlylower than in 2011/12. The Manufacturingbusinesses are expected to make progressduring 2012/13.
The performance of our FineChemicals Division in 2011/12 exceededour expectations and the strong drivers forthe business remain in place. Continueddemand for our existing APIs, theintroduction of new products and furthergeographic expansion of our ResearchChemicals business’ footprint shouldensure that we have another strong year.
In the longer term, we are continuingto expand our manufacturing capacityaround the world and to invest in R&D.Together, this should enable us to provideproducts that satisfy tightening globallegislation and that meet the growingdemand from our customers. We havestrong positions in markets that will seestructural growth over the next few yearsand, despite current global economicuncertainties, we are confident of thegroup’s continuing growth potential.
Neil CarsonChief Executive

Our Business
Johnson Matthey Annual Report & Accounts 2012Report of the Directors – Business ReviewOverview
10
Johnson Matthey is a global speciality chemicals company.We have operations in over 30 countries and employ around10,000 people worldwide.
The group is organised into three global divisions: > Environmental TechnologiesRead more on page 26.
> Precious Metal ProductsRead more on page 34.
> Fine ChemicalsRead more on page 40.
> Johnson Matthey is a leader insustainable technologies. We focuson clean air, clean energy and lowcarbon technologies and are expertsin the application and recycling ofprecious metals. We invest in R&Dto develop products that enhancethe quality of life for millions of peoplearound the world.
Wellpositionedfor futuregrowth

11
Europe35%
North America34%
China8%
Rest of Asia11%
Rest of World12%
Sales by Region
A Truly Global CompanyJohnson Matthey sells its productsglobally which provides stability in times ofregional market uncertainty. Year on yearwe are increasing our sales to developingmarkets and expanding our operations tosupport this global growth.
19%Sales in Asia in 2011/12.Read more on pages 26 to 42.
>
>
DELIVERINGVALUE
FinancialMust be profitable to be sustainableSustainability initiatives can be cost efficient too
Health and SafetyProtecting employees, customers and communitiesBeneficial products
EnvironmentResponsible operationsBeneficial products
GovernanceWell run businessTransparent reporting
SocialEmployee development and wellbeing, recruitment Supporting communities, safeguarding reputation
Building a Sustainable Business
£128.6mGross spend on R&D in 2011/12.Read more on pages 14 and 15.
Light dutyvehicles
39%
Heavy duty diesel vehicles17%
Pharmaceutical13%
Petrochemical15%
Precious metal services
6%
Other10%
Sales by Key Market
Focused on Key MarketsJohnson Matthey is focused on its keymarkets where we can add value throughapplying our expertise in catalysis andplatinum group metal chemistry. Thisapproach enables us to maintaindifferentiation through technology andachieve leading industry positions withhigh margin products.
48%Growth in heavy duty diesel catalyst sales in2011/12. Read more on pages 30 and 31.
>
>
>£28mSavings from sustainability initiatives to date.Read more on pages 13 to 15 and page 17.
Environment55%
Health10%
Resourceefficiency
21%
Social / lifestyle5%
Other9%
Sales by Area of Beneficial Impact
A Leader in Sustainable TechnologiesJohnson Matthey is focused on developingproducts that deliver sustainability benefitsto our customers and to society. Today,some 86% of the group’s sales representproducts and services which providesustainability benefits through their positiveimpact on the environment, resourceefficiency or our health.
86%Sales from products providing sustainability benefitsin 2011/12. Read more on pages 26 to 42.
>
>
60%Employees working in manufacturing operations.Read more on pages 14 and 15.
A Vision for SustainabilityOur goal at Johnson Matthey is to growour business – but to grow it sustainably.Sustainability is a key element of our strategyfor continued growth and we believe thatthe resource efficient, environmentallyresponsible manufacturing of products thatoffer sustainability benefits for our customerscan leverage commercial advantage for thegroup and deliver superior value.
All across the group, employees areengaged in sustainability programmesfocused on designing and manufacturingour products more efficiently using fewerresources and on developing improved,more efficient products for our customers.
Read more on page 13.
Investing in R&DAt Johnson Matthey, we invest heavily inresearch and development (R&D). Werecognise that this investment is vital if weare to realise new market opportunitiesover the years ahead. Our ability toinnovate and differentiate throughtechnology underpins our future success.
Sustainability 2017Sustainability 2017 is Johnson Matthey’svision for building a sustainable businessand includes challenging targets to supportfuture growth. We aim to double ourunderlying earnings per share while cuttingcarbon intensity by half, achieving zerowaste to landfill and halving the keyresources that we consume per unit ofoutput by 2017, the 200th anniversaryof the company’s foundation.
Manufacturing ExcellenceManufacturing is the way we bring ourscience to life and our ManufacturingExcellence programme is focused onensuring we run our manufacturingoperations with the highest efficiency.Through Manufacturing Excellencewe aim to boost efficiency, reducemanufacturing costs, develop our peopleand support delivery of our Sustainability2017 targets.

There are five major themes directing Johnson Matthey’s strategy:
Focus on leading edge catalysisWe will continue to focus upon the science of catalysis which underpins the majority of Johnson Matthey’s products andenables the group to develop high performance solutions for our customers.
Differentiation through technologyEnhanced investment in R&D in our core markets will enable the group to provide the very best products and maintain acompetitive edge.
Strong position in platinum group metalsAround 70% of Johnson Matthey’s businesses involve platinum group metals (pgms) and we will continue to apply ourexpertise in exploiting their chemical and physical properties to deliver high technology added value products.
Organic growthOrganic growth remains our primary focus however the group will make bolt-on acquisitions where they will accelerate thedelivery of our strategy.
New business developmentWe will increase our investment in new markets and sectors to target further growth from areas that are aligned with thegroup’s technological expertise and commercial interests.
Delivering superior long termgrowth through technology leadership
OurStrategicIntent:
Focus on leading edge catalysis
Differentiation through technology
Strong position in platinum group metals
Organic growth New business development
Our Strategy:
Supported by: Globaldrivers Sustainability R&D
ManufacturingExcellence
Our peopleand culture
In late 2010 the group reviewed its strategy. This review involved adetailed examination of the group’s past performance, its keystrengths and the attributes that make it successful. Globalmegatrends impacting the world around us that will drive growthfor the company were considered and the key strategicopportunities arising from these were identified. From this, thegroup’s strategic direction for the next ten years was defined.
Read more on the strategy review process onpages 8 to 13 of our 2011 Annual Report andAccounts or online at www.matthey.com/AR11.
Our Strategy
Johnson Matthey Annual Report & Accounts 2012Report of the Directors – Business ReviewOverview
12
> Johnson Matthey’s strategic intentis to deliver superior long term growththrough technology leadership. For us,delivering ‘superior long term growth’means growing our business aheadof the underlying growth rates of ourkey markets.
Strategicintent

13
Global Drivers Impacting the Chemical Industry
Johnson MattheyActivities
Industry Sector GLOBAL DRIVERS Johnson MattheyActivities
Industry Sector
Emissioncontrol catalysts
Obscurationenamels
Pharma-ceuticals
Agriculturalchemicals
Emissioncontrol
Clean fuel
Low carbon
PgmsPetrochemicalcatalysts andprocesses
Gas / coal to productstechnology
CatalystsPgm
refining
Automotive Electronics
Construction Bulkchemicals
Population Growth
Urbanisation
Increasing Wealth
Health and Nutrition
Ageing Population
Natural Resource Constraints
Environmental Factors
Climate Change
Regulation
Energysecurity
Alternativeenergy
Resourceefficiency
Recycling
APIsMedical
components
Pgm catalysts
Ammoniasynthesis andnitric acidcatalysts
Fine chemicals
Emissioncontrolcatalysts
Abatementtechnologies
Hydrogencatalysts
Purificationproducts
Fuel cellsCarbon
capture andstorage (CCS)
>
>
<
<
>
>
<
<
There are five fundamental key enablers toour strategy. We now examine each ofthese in more detail to understand theimpact they have on our business and theirrole in enabling future growth.
1. Global Drivers that Support FutureGrowthThere are four major global driverswhich we believe have a major impacton Johnson Matthey’s business:
> Environmental factors, climatechange, regulation
> Natural resource constraints
> Population growth, urbanisation,increasing wealth
> Health and nutrition, ageingpopulation
The figure below illustrates howthese macro level trends impact theindustries into which Johnson Mattheysupplies its products and technologies.All four global drivers provideopportunities for growth in many ofour businesses. For example:
• Projected population growthrates and increasing urbanisationand wealth, particularly inemerging markets, will drive anincrease in the number of carson our roads and therefore linksthrough to growth in JohnsonMatthey’s automotive emissioncontrol catalyst business.
• Projections on how naturalresources will become moredepleted provide estimates ondemand for recycling which inturn will benefit the group’s PgmRefining business.
These global level trends alsooffer opportunities for the group toleverage its expertise in catalysis andplatinum group metals to delivergrowth across its businesses, aheadof underlying market rates.
2. A Vision for SustainabilitySustainability is a key element of ourstrategy for future growth where theresource efficient, environmentallyresponsible manufacturing of hightechnology products that deliversustainability benefits can leveragecommercial advantage for the group.
The group’s Sustainability 2017Vision, launched in December 2007,sets out our direction and aspirationsfor building a more sustainablebusiness. Our long term sustainabilitystrategy is underpinned by twobusiness drivers, five key elementsand six sustainability targets.
Two Business DriversThere are two key business driversfor sustainability which engenderresponsible business practices andsupport future growth. The first
focuses on our internal operationsand on designing and manufacturingour products more efficiently usingfewer resources. This approach helpsus to reduce our costs and at thesame time reduces our impact on theplanet. The second driver concernsour products and services andfocuses on developing improved,more efficient solutions for ourcustomers. By doing this we canenhance our customers’ performanceand improve their sustainabilityfootprint which, in turn, will improveour competitiveness. Together thesedrivers support the development ofproducts and services which have a beneficial impact on the planet, be it through health, social orenvironmental improvements.
Five Key ElementsGrowing our business throughsustainability is not only about ouroperations and products. We arealso committed to best practice ingovernance, to creating a positiveworking environment for employeesand to being a responsible partnerfor our customers, suppliers,communities and other stakeholders.As such, we manage sustainabilityacross the group according to fiveelements: financial; governance; social;health and safety; and environment.Delivering good performance in all fiveareas is vital to our long term success.

Six Sustainability TargetsOur Sustainability 2017 Vision issupported by six challenging targetsas illustrated in the figure above. Ourprogress towards them in 2011/12 issummarised on page 17 and furtherdetails are provided in the Financial,Social, Health and Safety andEnvironment sections of this report.
Read more on sustainabilityat Johnson Matthey atwww.matthey.com/sustainability.
3. Research and DevelopmentContinued investment in R&Dunderpins the future growth ofJohnson Matthey. It is this investment,together with our ability to recruit themost talented scientists, that willensure we maintain the expertise andleadership in the science of catalysis,materials chemistry and pgms thatdrive the development of hightechnology products andmanufacturing processes.
Around 1,200 of our employeeswork in R&D representing around12% of the total workforce andinclude many highly skilled scientistsand engineers. Around 80% of ourR&D staff work within the group’sbusinesses in dedicated R&D andtechnical centres around the world.In our businesses, work is mainlyfocused on delivery of shorter termbusiness specific projects or toaddress particular marketdevelopments or customer needs.
Alongside these activities,Johnson Matthey also has centralcapability on strategic R&D, locatedat two Technology Centres, whichworks on behalf of all of the group’sbusinesses.
We maintain a close link betweenour central R&D activities and thedevelopment work carried out directlyby Johnson Matthey’s businesses.This interaction is key in ensuring the rapid transfer of technology tosupport the continued development ofinnovative new products and servicesfor our customers. Examples of ourcurrent projects are highlighted as‘Innovation in Action’ case studiesthroughout this report.
As previously described, majorglobal drivers provide significantopportunities for Johnson Mattheyto grow and develop its existingbusiness areas over the years aheadand R&D will play an important role inrealising these opportunities.
In 2011/12 Johnson Mattheyincreased its gross investment in R&D by 17% to £128.6 million.
Read more on R&D atJohnson Matthey atwww.matthey.com/innovation.
4. Manufacturing ExcellenceManufacturing is a key contributor toJohnson Matthey’s success and willunderpin our growth in the future. It isa major part of our business in terms ofthe group’s global spend and providesjobs for 60% of our employees.Improving our manufacturingperformance can therefore have asignificant impact on our business.
The 2010/11 strategic reviewidentified that there were opportunitiesfor us to improve our operations andenhance our competitiveness.
Manufacturing Excellence is along term investment in our people,manufacturing processes, engineeringand technology. Lean principles arebecoming integrated at all sites toincrease manufacturing efficiency andimprove overall performance. Technicalcentres of excellence are beingdeveloped to provide opportunitiesfor manufacturing teams around theworld to trial and test new equipment.Engineering teams are working toidentify and develop best practice forour key processes.
The programme offers opportunitiesfor us to increase efficiency, reduce ourcosts, capture our global expertise andimprove our capacity with minimumcapital expenditure.
Our Strategy continued
Johnson Matthey Annual Report & Accounts 2012Report of the Directors – Business ReviewOverview
14
CentralResearch
21%
EnvironmentalTechnologies
61%
PreciousMetal
Products13%
FineChemicals
5%
Research and DevelopmentEmployees
Six Sustainability Targets (from April 2012)
At least double earnings per share
Halve carbon intensity
Achieve zero waste to landfill
Halve key resources consumed per unit of output
Reduce annual incidence of occupationalillness cases by at least 30% over the five yearsto 2013/14
Achieve a zero ‘greater than three day accidents’safety target
Innovation in ActionRead more on our R&D activities throughoutthis annual report:> Staying Ahead of the
Legislation page 29> Deeper Knowledge of
NOx Removal Catalysts page 30> An Insight on the Inside page 32> Looking Inside a Fuel Cell page 33> Sustainable Catalysts to
Replace Mercury page 39

15
5. People and CultureRecruiting the right people, developingthem and providing an environmentwhich motivates them to contributeand stay with the company isfundamental to the group’s long termperformance. A ten year humanresources strategy, developedalongside the group strategy, isfocused on ensuring we can recruit,retain and develop the highly skilledpeople that will be needed to supportour global growth.
The group recognises that ourpeople and culture are a particularstrength and, although the culture ofan organisation is not easy to define,there is a distinctive culture inJohnson Matthey, irrespective ofdivision, business, function orgeographic location. Sustaining andintegrating our culture as we growthe business is a challenge we areembracing on a global scale.
Progress in 2011/12 andFuture Developments
Having established and communicatedits ten year strategy in 2010/11, thegroup has now focused on theprocess of embedding the strategyand on its delivery. During the year, allbusinesses were required to reviewand report on their long term strategicplans and key developments werediscussed.
As a result of the strategic review,the group concluded that it wouldplace more emphasis on newbusiness development and work isnow underway to identify newopportunities and leverage our R&Dexpertise to drive growth. A team hasbeen established, tasked with findingnovel applications outside our currentproducts and markets but which alignwith our technology bases and widercapabilities. A rigorous market basedapproach has been adopted andduring 2011/12, two main areas wereexplored. Opportunities within thewater industry were investigated anda number of potential areas wereidentified where Johnson Matthey’stechnology and capabilities could beapplied. The team also looked at theimplications of the introduction ofelectric automotive powertrains,considering a range of optionsincluding battery materials and othertechnologies. This has identified arange of possible new businessactivities for the company. As a result,we have formed a team who aredeveloping and executing the group’splans to address these markets. It isstill early days, but we hope to makefurther progress during 2012/13.
Two additional sectors will beinvestigated during the year. This workis consistent with our overall objectiveof developing a new business withsales of more than £200 million withinten years.
Work has commenced this yearto explore how we can moreeffectively articulate and communicatethe group’s culture and values. Thiswill continue in 2012/13 and theiralignment with employee behavioursand performance management will beexplored further.
During 2011/12 the grouplaunched its global ManufacturingExcellence programme to support itsstrategic intent. Work will continue toimplement and embed theprogramme and from the start of the2012/13 financial year, performanceagainst a number of key metrics willbe reported by all manufacturing siteson a monthly basis and used internallyto track progress and direct actions.
As discussed in last year’s annualreport, in February 2011 the groupreviewed its sustainability strategy toassess progress and ensure that itstargets were still appropriate tobusiness needs. The reviewconcluded that there was no need toradically change direction, buthighlighted areas where we couldevolve our strategy to better supportthe future growth of the company.These were further investigated during2011/12 and as a result, twoamendments to our Sustainability2017 targets have been introduced.
From April 2012 our target toachieve ISO 14001 at all majormanufacturing facilities has beenremoved as all sites included in theoriginal target have now achieved this.This requirement has now beenincluded in our environment, healthand safety (EHS) management system.
In 2012/13 we will continue toreview the appropriateness of ourtarget to achieve zero waste to landfill.We have made steady progresstowards this target but recognise thatwaste to landfill is only a proportion ofthe waste generated by our operations.Therefore we will consider how wecan broaden this target to encompass
a wider definition of waste andresource efficiency with an overall goalof reducing waste across our business.
One aspect of the strategy weconsidered in detail was ourcommitment to reduce carbonemissions from our operations. Thefeedback from employees hadsuggested that our aspirational targetto achieve carbon neutrality was aconcept that was difficult to understandand was causing confusion internally.Furthermore, over four years into oursustainability programme, we have amuch greater understanding andknowledge of carbon legislation,markets and emissions from ourprocesses. Consequently, we nowdo not believe that carbon neutralityis an appropriate target for us.
As a manufacturing business anda business that is growing, this targetcannot be achieved without purchasingcarbon offsets. We have conducted alot of research into offsets and are notconvinced they offer an appropriateway of mitigating our carbon emissions.We have therefore concluded this isnot an approach we wish to take.
As a group we remain committedto driving down our carbon emissionsas far as is realistically possible andthat any increase will be at a rate thatis below the rate of business growth.
To support this commitment,from 1st April 2012 we have replacedour target to achieve carbon neutralitywith a new target to halve our carbonintensity by 2017, relative to our 2007baseline figure. Our carbon intensity isthe group’s global warming potential(GWP) per £ million of sales excludingprecious metals (sales). In 2007, ourcarbon intensity was 294 tonnes CO2
equivalent / £ million sales and so wehave set a target to halve our carbonintensity to 147 tonnes CO2 equivalent/ £ million sales by 2017.
Many of our products alreadyreduce greenhouse gas emissions forour customers and we continue tofocus on the development of productsthat mitigate climate change. Our ownlife cycle experts group is working tobetter quantify the in service benefitsof our products.
Delivering ValueRead more about how we deliver value throughout this annual report:> Leading the Way in HDD Catalysts pages 4 and 5> Davy Process Technology pages 24 and 25> Growing Our People pages 48 and 49> Investing in New Capacity pages 60 and 61> Developing the Next Generation of Sustainable Products pages 68 and 69> Supporting Our Strategy in Fine Chemicals pages 76 and 77> Customer Focus at Colour Technologies pages 118 and 119> Managing Metals for Our Businesses and Our Customers pages 168 and 169

Johnson Matthey has delivered another year of strong growth witha good contribution from all of its divisions. This performance wasparticularly enhanced by our leading position in heavy duty dieselcatalysts, a very strong year from Davy Process Technology (DPT) andexcellent progress in our North American API Manufacturing business.
Sales
Revenue for the year ended 31st March 2012 was 20% up on lastyear at £12.0 billion. The group’s sales were 17% higher than last yearat £2.7 billion. Translated at constant exchange rates, revenue for theyear was 21% ahead and sales grew by 18%.
Operating Profit
For the group as a whole, underlying operating profit (beforeamortisation of acquired intangibles, major impairment and restructuringcharges) was 23% higher than last year at £450.1 million, whileunderlying profit before tax was also 23% up at £426.0 million. Thegroup’s underlying return on sales increased to 16.8% from 16.1%last year, primarily due to operational leverage, particularly in ourheavy duty diesel catalyst business, and the excellent performancefrom our higher margin DPT business.
The performance of the individual businesses is explained in moredetail in the Financial Review of Operations section on pages 26 to 42.
Group Performance Review
Financial Performance
Johnson Matthey Annual Report & Accounts 2012Report of the Directors – Business ReviewOverview
16
Year to 31st March 2012 2011 % change restated
Revenue £ million 12,023 9,985 +20
Sales excluding precious metals (sales) £ million 2,679 2,280 +17
Operating profit £ million 433.4 279.9 +55
Profit before tax £ million 409.3 259.3 +58
Total earnings per share pence 148.7 85.2 +75
Underlying*:
Operating profit £ million 450.1 366.2 +23
Profit before tax £ million 426.0 345.5 +23
Earnings per share pence 153.7 119.0 +29
* Before amortisation of acquired intangibles, major impairment and restructuring charges, profit or loss on disposal of businesses and, where relevant, related tax effects.
Fine Chemicals10%
Precious MetalProducts
21%
EnvironmentalTechnologies
69%
Group Sales by Division
Europe35%
North America34%
China8%
Rest of Asia11%
Rest of World12%
Group Sales by Destination
2009*
EnvironmentalTechnologies
Precious MetalProducts
FineChemicals
2010 2011 20120
500
1,000
1,500
2,000
2,500
3,000
Divisional Sales£ million
2009
EnvironmentalTechnologies
Precious MetalProducts
FineChemicals
2010 2011 20120
100
200
300
400
500
Divisional Underlying Operating Profit£ million
* Excluding inter-segment sales.

Our Progress
Johnson Matthey has made good progresstowards its Sustainability 2017 targets thisyear.
In 2011/12 our financial performancewas strong with underlying earnings pershare (EPS) at 153.7 pence and we believethe group remains on track to achieve itstarget to double underlying EPS from the2007 baseline by 2017. As outlined in thestrategy section on page 15, the group hasamended its target on carbon this year andprogress towards the new target, to halvecarbon intensity, has been very good.Similarly, initiatives across the group’sbusinesses to improve resource efficiencyare paying off and we remain well on trackto achieve our target to halve keyresources per unit of output by 2017.Steady progress is being made to reducethe amount of waste we send to landfill,although year on year waste to landfillincreased in 2011/12, as explained in theEnvironment section on page 72. Work todrive continuous improvement in health andsafety is reflected by the good progress wehave made this year in further reducing ournumber of greater than three day accidentstowards our target of zero accidents, and inmaintaining our incidence of occupationalillness cases below our target.
Further details of the group’sperformance towards its Sustainability 2017targets are explained in the strategy sectionon pages 13 to 15, the Health and Safetysection on pages 60 to 67, theEnvironment section on pages 68 to 75and on the company’s website atwww.matthey.com/sustainability.
Economic Impact and Distributionof Value to Stakeholders
2011/12 marked another strongperformance from Johnson Matthey withgood growth across all three divisions.
The group generated an underlyingoperating profit of £450.1 million andrevenue of £12.0 billion in the year. Of thisrevenue, £9.3 billion represents the value of precious metals in our products whichin many cases is passed directly on to ourcustomers. As a result, we may see quitelarge year on year swings in the revenue linedepending on the movements in the marketprices of precious metals during the year.Sales excluding the value of precious metalsis thus a better measure of the salesgrowth in our business.
Of the £12 billion revenue, the costsof goods and services were £11 billion(including £9 billion for precious metals)while our own operations created anestimated £1 billion in underlying addedvalue.
Employees received the largest shareof this underlying added value, some 49%of the total, reflecting the fact that JohnsonMatthey is a high technology companyemploying many highly skilled employeesacross the globe. Amounts payable toproviders of capital, i.e. our shareholdersand financiers, were 35% of the total(including the proposed special dividend of£212 million), and corporate income taxesof 10% were payable to governments. In2011/12 we retained / invested 5% in thebusiness for future growth and £0.6 millionwas invested in our local communities.
This community investment representscash donations made by Johnson Mattheyand does not include the value of employeetime donated during working hours. Weare continuing to develop our systemsto capture further information on ourcontribution to local communities, suchas employees’ time from volunteering.
17
Sustainability 2017Sustainability 2017 Target Key Performance Indicators Baseline 2007 20121 Target Progress
At least double Underlying earnings 82.22 153.7 164.4earnings per share per share (pence)
Halve carbon intensity Global warming potential 2943 156 147(tonnes CO2 eq / £ million sales)
Achieve zero waste to landfill Waste to landfill (tonnes) 16,5553 10,708 0
Halve key resources per unit Electricity consumption 1,0983 626 549of output (GJ / £ million sales)
Natural gas consumption 1,6043 1,012 802(GJ / £ million sales)
Water consumption 1.4263 0.822 0.713(m3 ’000 / £ million sales)
Achieve zero greater than Annual greater than three day n/a 2.07 0three day accidents accident rate per 1,000 employees
Reduce occupational illness cases Annual incidence of occupational 5.34 3.5 3.7by at least 30% by 2013/14 illness cases per 1,000 employees
1 Data presented is for the period 1st April 2011 to 31st March 2012.2 Data presented is for the period 1st April 2006 to 31st March 2007.3 Data presented is for the period 1st January 2006 to 31st December 2006.4 Baseline is incidence of occupational illness cases per 1,000 employees in calendar year 2008.
Progress Towards Sustainability 2017
Local communities0.1%
Retained by /invested in business
for future growth5%
Governments10%
Providers of capital
36%
Employees49%
Special dividend
Ordinary dividend
and interest
Johnson Matthey – Distribution ofUnderlying Added Value 2011/12

Group Key Performance Indicators
Johnson Matthey Annual Report & Accounts 2012Report of the Directors – Business ReviewOverview
18
Johnson Matthey uses a range of key performanceindicators (KPIs) to monitor the group’s performance overtime in line with its strategy.
These include key measures of the group’s financialperformance as well as indicators to monitor ongoinginvestment in facilities and in R&D. In addition, the groupalso uses KPIs to track the carbon footprint of itsoperations and to measure and drive continuousimprovement in the safety, wellbeing and developmentof its employees.
The KPIs weuse to monitorand driveperformance
> These principal KPIs, together with the group’s performance against them in 2011/12,are described below:
Sales Excluding Precious Metals£ million
2008
1,7971,7501,886
2,280
2,679
2009 20112010 20120
500
1,000
1,500
2,000
2,500
3,000
Monitoring sales provides a measure ofthe growth of the business. In measuringthe growth of the group, we focus on salesexcluding the value of precious metalsbecause total revenue can be heavilydistorted by year on year fluctuations inprecious metal prices. Not only that, inmany cases, variations in the value of theprecious metal contained within ourproducts are passed directly on to ourcustomers.
Performance in 2011/12In 2011/12 sales excluding preciousmetals grew by 17% with good growthacross all three divisions as described inthe Financial Review of Operations onpages 26 to 42.
Underlying Earnings per Sharepence
2008
89.689.5 86.4
119.0
153.7
2009 20112010 20120
40
80
120
160
Underlying earnings per share is theprincipal measure used by the board toassess the overall profitability of the group.The following items are excluded fromunderlying earnings because they candistort the trend in measuring results:• Amortisation and impairment ofintangible assets arising on acquisitionof businesses (acquired intangibles).
• Major impairment or restructuringcharges.
• Profit or loss on disposal of businesses.• Tax on the above and major tax itemsarising from changes in legislation.
Performance in 2011/12This year underlying earnings per sharerose by 29% to 153.7 pence supported bya strong performance across the group.Further details are provided on pages 26to 46.
Return on Invested Capital%
In a business as capital intensive asJohnson Matthey’s, profitability alone isa poor measure of performance; it ispossible to generate good operatingmargins but poor value for shareholders ifassets are not used efficiently. Return oninvested capital (ROIC) is therefore usedalongside profit measures to ensure focusupon the efficient use of the group’sassets. ROIC is defined for the group asunderlying operating profit divided byaverage capital employed (equity plus netdebt). ROIC for individual divisions iscalculated using average segmental netassets as the denominator.
Performance in 2011/12The group’s ROIC increased from 19.4%to 22.3%, exceeding our target of 20%.
2008 2009 20112010 20128
10
14
16
20
22
18
12
24
Cost of Capital
Target

19
Safety – Annual Rate of >3 DayAccidentsper 1,000 employees
Johnson Matthey is a manufacturingbusiness and a significant proportionof our employees work in productionenvironments with chemicals and processmachinery. Rigorous safety systems applyacross all facilities and are essential if thegroup is to avoid accidents which couldcause injury to people or damage to ourproperty, both of which can impact thegroup’s performance. We actively manageour safety performance through monitoringthe incidence and causes of accidents thatresult in more than three days lost time.
Performance in 2011/12The group’s annual accident rate of greaterthan three day accidents reduced this yearto 2.07 per 1,000 employees. Furtherdetails of our safety improvementprogrammes are provided in the Healthand Safety section on pages 60 to 67.
Occupational Health – AnnualIncidence of Occupational Illnesscases per 1,000 employees
2007*
5.55.8
5.2
3.5 3.5
2009 20112010 20120
1
2
3
4
5
6
* Calendar year.
The health and wellbeing of our employeesis a priority for Johnson Matthey and weare committed to minimising workplacerelated negative health effects. Wemanage our performance in this area bymeasuring the number of occupationalillness cases arising as a result of exposureto workplace health hazards.
Performance in 2011/12The annual incidence of occupationalillness cases was unchanged this yearat 3.5 per 1,000 employees, below ourtarget of 3.7 cases per 1,000 employees,as a result of our initiatives to promoteemployee wellbeing across the group.Further details are provided in the Healthand Safety section on pages 60 to 67.
Voluntary Employee Turnover%
Europe
4.74.8
14.9
8.5
6.4
NorthAmerica
Rest ofWorld
Asia Group0
4
8
12
16
The success of Johnson Matthey is partlydependent upon the extent that we areable to attract and retain talentedemployees. This means that being anattractive employer is a prerequisite ina competitive environment. We monitorour success in retaining our staff usingvoluntary employee turnover statistics.
Performance in 2011/12In 2011/12 the group’s voluntary employeeturnover increased to 6.4% from 5.6% in2010/11.
Capital Expenditure£ million capex / depn (times)
0
1
2
3
2008
203.5
145.0134.4 137.9
149.6
2009 20112010 20120
30
60
90
120
150
180
210
To enable the group to continue to grow,Johnson Matthey invests significantamounts in maintaining and improving ourexisting plants and in adding new facilitiesto provide additional capacity wherenecessary. All new capital expenditure issubject to detailed review to ensure that itsinvestment case passes internal hurdles.Annual capital expenditure is measured asthe cost of property, plant and equipmentand intangible assets purchased duringthe year. The ratio of capital expenditureto depreciation gives an indication of therelative level of investment.
Performance in 2011/12In 2011/12 the group’s capital expenditurewas £149.6 million which represented1.2 times depreciation (2010/11 1.1).
Gross Research andDevelopment Expenditure£ million
2008
87.6
73.0
91.7
109.8
128.6
2009 20112010 20120
20
40
60
80
120
100
140
Johnson Matthey is fundamentally atechnology company. To maintain ourcompetitive position, we need to keepinvesting in research and development.Whilst absolute levels of research anddevelopment expenditure do notnecessarily indicate how successful weare, that success rapidly feeds through tohigher sales as lead times in our businesscan be quite short.
Performance in 2011/12In 2011/12 the group increased itsresearch and development expenditureby 17% to £128.6 million. Further detailsof the group’s research and developmentactivities are described throughout theBusiness Review.
Sustainability – Global WarmingPotentialthousand tonnes CO2 equivalent
2007** Calendar year.
372390 377
415 417
2009 20112010 20120
90
180
270
360
450
We measure our progress towards reducingthe carbon footprint of our operations bylooking at the group’s total global warmingpotential (GWP). Total GWP is based on ourdirect and indirect energy usage and CO2
equivalence which provide a strong platformfor monitoring the impacts associated withenergy use in our operations. We areworking to broaden the scope of our GWPmeasurement to include all aspects of ourbusiness and to consider the beneficialimpacts of our products and services.
Performance in 2011/12This year the group’s GWP increased onlyslightly from 415,000 to 417,000 tonnesCO2 equivalent despite increased activityand a full year’s contribution from twooperations acquired during 2010/11.Further information on the group’s GWPis given in the Environment section onpages 68 to 75.
March2007
March2008
March2009
March2011
March2010
March2012
0
4
2
6

Risks and Uncertainties
Johnson Matthey Annual Report & Accounts 2012Report of the Directors – Business ReviewOverview
20
Risk Description Impact
STRATEGICFailure to grow in the longer The group’s existing activities are well placed to deliver Failure to identify new business areas or extend the term, to take advantage of good growth over the coming years. New business group’s portfolio could impact the ability of the group new opportunities or to have areas will help to sustain the group’s growth beyond to continue to grow in the long term. sufficient capacity to meet that period. demand
Inability to deliver anticipated The group’s strategy is based upon organic growth. Unsuccessful integration of an acquired business benefits from acquisitions, However, acquisitions and investment in capital projects or project time or cost over-runs could result in the capital projects and other will accelerate the achievement of our strategic goals. failure to realise the expected benefits and hence initiatives impact the group’s results.
The realisation of anticipated benefits depends on: • the performance of acquired businesses after
acquisition and their successful integration into thegroup; and
• the delivery of capital projects on cost and to plan.
Changes to future Approximately 50% of the group’s revenue is driven by A curtailment in environmental legislation around the environmental legislation environmental legislation, particularly legislation over world could limit the group’s growth potential and
emissions from light and heavy duty vehicles. Further undermine profit margins. tightening of global emissions legislation generally requires improved technological solutions and the extension of emissions legislation to new applications can create opportunities for the group.
Technological change Johnson Matthey operates in highly competitive markets Failure to keep up with changes in the market place in which technology is a key to success. Constant product and to maintain our technology pipeline could result innovation is critical to maintain competitive advantage. in a lack of competitive products and erosion of
margins and / or loss of market share.
MARKETGlobal political and The global nature of the group’s business exposes it to A sustained period of economic weakness in our markets economic conditions risk arising from economic, political and legislative change could have a material adverse effect on the group’s results.
in the countries in which we operate. The group has no influence upon changes in inflation, interest rates or other economic factors affecting its business. In addition, the possibility of political unrest and legal or regulatory changes also exist in countries in which the group operates.
Commercial relationships The group has well established long term relationships The group has high shares in many of the markets and reputation with a number of customers and suppliers. Maintaining in which it operates. The deterioration in its
good relationships with customers and suppliers reputation or relationship with, or ultimately enables the group to enhance the quality of service the loss of, a key customer or supplier could have to its customers. a material impact on the group’s results.
The effective identification and management of risks and opportunitiesacross the group are integral to the delivery of the group’s strategicobjectives. The group’s approach to risk management is aimed atmonitoring material issues to enable the early identification of key risksand the taking of action to remove or reduce the likelihood of those risksoccurring and their effect.

21
Mitigation Changes since 2011 Annual Report
• Each business prepares a ten year strategic plan to review demand in existing markets The group invested £128.6 million in R&D in the and potential new opportunities. year (2010/11 £109.8 million). • The group continues to invest in research for new products and technologies.
• Capacity and demand considerations are included in the strategic review and The group is targeting potential new markets andadditional capacity management reviews. developing new businesses, both organically
and through acquisition.
• The group has clearly defined criteria for suitable acquisition targets and substantial There were no acquisitions in the year. due diligence is carried out before any acquisition is made. • A dedicated team is appointed to manage the integration process and regular The integration and performance of the Additives
monitoring of the performance of newly acquired businesses is carried out. business (formerly Intercat) during the year is • Requirements of capital projects and other initiatives are strictly defined and subject discussed in the Financial Review of Operations to robust approvals. on page 31.
Significant projects (such as expansion of capacity
in Emission Control Technologies, Process Technologies and Catalysts and Chemicals) are discussed in the Financial Review of Operations.
• The group maintains a diverse product portfolio. No change. • Forthcoming changes in emissions legislation are well understood and our products
are designed to meet these increased requirements. • Profit margins can be maintained with continuous improvements in technology to
reduce the cost and improve the effectiveness of our products. • Regular reviews are undertaken to monitor areas of new potential legislation.
• Lobbying activities are undertaken where appropriate to improve the understanding of regulatory and legislative bodies.
• The group continues to invest in its products through R&D (including through No change. our Technology Centres around the world) and as per our ten year technology plan.
• There is constant innovation and development in cooperation with our key customers. • The group invests in its people to ensure that it maintains a high level of relevant
scientific expertise.
• The group maintains a balanced portfolio of businesses and serves a wide range The group’s strong performance this year reflects of diverse customers which reduces the impact of a change to any one market. the continuing recovery of its businesses since
• Management continuously monitors the performance of our businesses across the the recession in the group’s developed markets. world at both business and group level.
• Our cost base contains a significant variable element and is flexible to changing Given the continued uncertainty in Europe (offset political and economic conditions. partially by the improved outlook in the US) we
have concluded that this risk has increased since last year.
• Some of the group’s key relationships are supported by long term contracts, notably No change. the group’s relationship with Anglo American Platinum.
• A broad customer base is maintained to prevent the group from becoming unduly dependent on any single customer.
• Industry developments and market shares are constantly monitored.• We actively manage our customer relationships at all levels to ensure a high quality
of service.
The board has overall responsibility forensuring that risk is effectively managedacross the group. However, the board hasdelegated to the Audit Committee theresponsibility for reviewing the effectivenessof the group’s system of internal controland procedures for the identification,assessment, management, mitigation andreporting of risk.
The group has in place a process forthe continuous review of its risks. As part ofthat process, each business reviews its risksand its mitigation strategies and actions.Each risk is allocated an owner who has
the authority and responsibility for assessing,monitoring and managing it. The mostsignificant risks identified are collated intoa Group Risk Register. The Group RiskRegister is reviewed by the Chief Executive’sCommittee. Each individual risk is consideredand the status and progression of mitigationactions and plans are monitored. The GroupRisk Register is reviewed by the boardtwice a year.
The table below sets out what theboard believes to be the principal risks anduncertainties facing the group, the mitigatingactions for each and an update on any
change in the profile of each risk duringthe course of 2011/12.
In view of the group’s increasedfocus on the cost of rare earth materialsand the establishment this year of astrategy to manage movement in theirprices (as described in the FinancialReview of Operations section on page 29),we have concluded that the risk associatedwith movements in raw material prices hasdecreased. As a result, we have removedthis from our principal risks this year.

Risk Description Impact
FINANCIALPension scheme The group operates a number of defined benefit pension Actuarial deficits could be adversely affected by funding schemes, some of which are in deficit. changes in interest rates, the market values of
investments, as well as inflation and increasing longevity of the schemes’ members. This may result in greater cash contributions being required.
OPERATIONALChanges to health, safety, In common with similar manufacturing companies, the Changes made to applicable laws, regulations or environmental and other group operates in an environment that is subject to standards could adversely impact the group’s regulations and standards numerous health, safety and environmental laws, manufacturing capability or indeed, the marketability
regulations and standards. of our products.
Availability of raw materials The group uses many raw materials within its Disruption to the supply or a change in the group’s manufacturing processes. Several raw materials are ability to access sufficient stocks of these raw available from only a limited number of countries materials, most notably platinum group metals, rare and / or suppliers. earths or narcotic raw materials, could adversely
affect the group’s profit. This may be due to increased prices or because our ability to manufacture and supply product to customers may be impacted.
Employees and the The group relies upon its ability to recruit, train and The departure of senior management or the lack recruitment and retention develop employees around the world with the necessary of an appropriately skilled workforce could adversely of high quality staff range of skills and experience to meet its stated impact the group’s ability to perform in line with
objectives, including in relation to business growth. expectations.
The existing management team has many years of experience at Johnson Matthey, operating in the markets and developing the technologies in which the group maintains a presence.
Security On any given day the group has significant quantities A material loss due to a breach in the group’s security of high value precious metals or highly regulated measures, including theft or fraud, could be significant substances on site and in transit, the security of which to the group’s performance. is critical.
Intellectual property (IP) The group operates in markets in which the generation Failure to establish the group’s IP rights or to identify and application of technology and IP allows an third parties’ IP rights could undermine the group’s advantage to be maintained. Careful monitoring of competitive advantage particularly given the group’s competitors’ IP is required to ensure that breaches expansion into new markets. Alternatively, not of their rights are not made by the group. noting the expiration of patents held by third parties
could mean the loss of potential business opportunities.
Risks and Uncertainties continued
Johnson Matthey Annual Report & Accounts 2012Report of the Directors – Business ReviewOverview
22

23
Mitigation Changes since 2011 Annual Report
• Where actuarial deficits exist the group has agreed deficit recovery plans. No change. • The group works with the fiduciary committees and trustee boards of each of its
pension schemes around the world to ensure that an appropriate investment strategy is in place. This includes de-risking the schemes as funding levels improve.
• Where possible, appropriate pension scheme assets are held to match movements in the schemes’ liabilities.
• We monitor and proactively manage the rate at which the pension liability grows and consider liability management exercises as appropriate.
• The group is reviewing its options with regard to future pension provision for employees worldwide.
• More detail of the group’s pension schemes is included in note 14 in the Accounts.
• The group carries out regular internal reviews to ensure compliance with current No change. group policies and applicable laws, regulations and standards such as ISO 14001
and OHSAS 18001. Our quality standards are also scrutinised externally by customers, suppliers and the relevant authorities.
• We work with external consultants to understand better our regulatory responsibilities in the territories in which we operate.
• Changes in legislation are carefully monitored and if required, the composition of our products is amended to comply with latest legislation.
• We are committed to proactive communication and to building open relationships with the authorities and relevant legislative bodies, both directly and through the relevanttrade associations.
• Although most of the world’s platinum is mined in South Africa, the group has access No change. to world markets for platinum and other precious metals and is not dependent on any
one source for obtaining supplies. • Appropriate sourcing arrangements are in place for other key raw materials to ensure
that the group is not dependent on any one supplier. • Where possible the group enters into fixed price contracts for key raw materials. • We work closely with key suppliers to ensure availability, including through audits,
benchmarking and specific risk reviews.• We monitor forecast requirements on a regular basis and hold buffer stocks where
necessary.• We look to use alternative raw materials where appropriate.
• Global training and management development programmes are in place, including No change. training of manufacturing leaders to run our operations in a consistent and efficient
way through the Manufacturing Excellence programme. • Regular reviews of management succession plans are carried out.
• Global remuneration policies are in place to ensure appropriate rewards to motivate and retain staff.
• We undertake a continuous assessment of the skills required within the group and action plans are put in place to address identified gaps.
• Succession planning is closely monitored by the Nomination Committee and Management Development and Remuneration Committee (MDRC).
• The group has highly developed security, assay and other process controls. No change. • Annual security audits are carried out across the group.
• Insurance cover is maintained for losses from theft or fraud.
• The group has established policies and procedures for registering patents and for No change. monitoring its existing patent portfolio and those of third parties.
• We defend infringement claims and challenge new patents where it is appropriate to do so. • We continuously evaluate operating restrictions and opportunities available to us
through the use of our IP and know how. • A substantial part of the group’s IP is know how and this is protected through
non-disclosure agreements and other legal measures.• We restrict internal and external access to IP and know how as necessary.• We complete security checks to safeguard both our tangible and intangible assets.• Our investment in technical developments mitigates the risks to our IP and know
how to some degree.

Johnson Matthey Annual Report & Accounts 2012Report of the Directors – Business ReviewFinancial
24
Linkingprofitabilityandsustainability
FinancialThis section details the financial performance of the group and its three divisionsduring the year.
> Davy Process TechnologyWhen a chemical manufacturer decides tobuild a new plant or make a new product itwants to operate the plant and make theproduct in the most cost effective andenvironmentally friendly way. Davy ProcessTechnology (DPT) develops processes thatchemical manufacturers can use to help themdesign and build their plant and then run it atoptimum efficiency. DPT licenses this processtechnology to its customers and works withthem as they use it to guide the constructionand operation of their plant. In effect, DPTprovides its customers with the flowsheet,or blueprint, for their process.
Continued investment in R&D is vital toDPT’s success, enabling it to maintain aportfolio of highly advanced chemical processtechnologies. During 2011/12 DPT secured14 licences and commissioned five newplants. Its engineers are now working withNanjing Bluestar New Chemical Material Co.Ltd. in China to commission a new plant(pictured) for manufacturing three products –tetrahydrofuran, butanediol and gammabutyrolactone which have uses as solventsand in the production of polymers to makeitems such as training shoes, car parts,Spandex fibres and in the pharmaceuticalindustry. This is a second plant for NanjingBluestar, the first having been successfullycommissioned by Nanjing Bluestar and DPT in 2009.
Delivering Value

Contents
26 Financial Review of Operations 26 Environmental Technologies 34 Precious Metal Products 40 Fine Chemicals 43 Financial Review 47 Treasury Policies 47 Liquidity and Going Concern
. Research and development is vital to enable DPT to maintainits portfolio of advanced technologies.
. On site at the new manufacturing plant.

Financial Review of OperationsEnvironmental Technologies
Johnson Matthey Annual Report & Accounts 2012Report of the Directors – Business ReviewFinancial
26
Key Statistics
Capital expenditure £97.1 millionCapex / depreciation 1.2Average invested capital £1,492 millionEmployees 5,640
Year to 31st March % at 2012 2011 % constant £ million £ million change rates
Revenue 3,255 2,708 +20 +20
Sales excluding precious metals (sales) 1,876 1,566 +20 +20
Underlying operating profit 211.8 164.7 +29 +29
Return on sales 11.3% 10.5%
Return on invested capital (ROIC) 14.2% 11.5%
Creatingproducts thatbenefit theenvironment
Process Technologies21%
Fuel Cells1%
Emission ControlTechnologies –
Light Duty52%
Emission ControlTechnologies –
Heavy Duty Diesel23%
Emission ControlTechnologies –
Stationary Emissions Control
3%
Sales
Europe35%
North America31%
China9%
Rest of Asia11%
Rest of World14%
Sales by Destination
2009* 2010 2011 2012
1,1351,252
1,566
1,876
0
500
1,000
1,500
2,000
Divisional Sales £ million
2009 2010 2011 2012
124.3 120.9
164.7
211.8
0
50
100
150
200
250
Divisional Underlying Operating Profit£ million
* Excluding inter-segment sales.
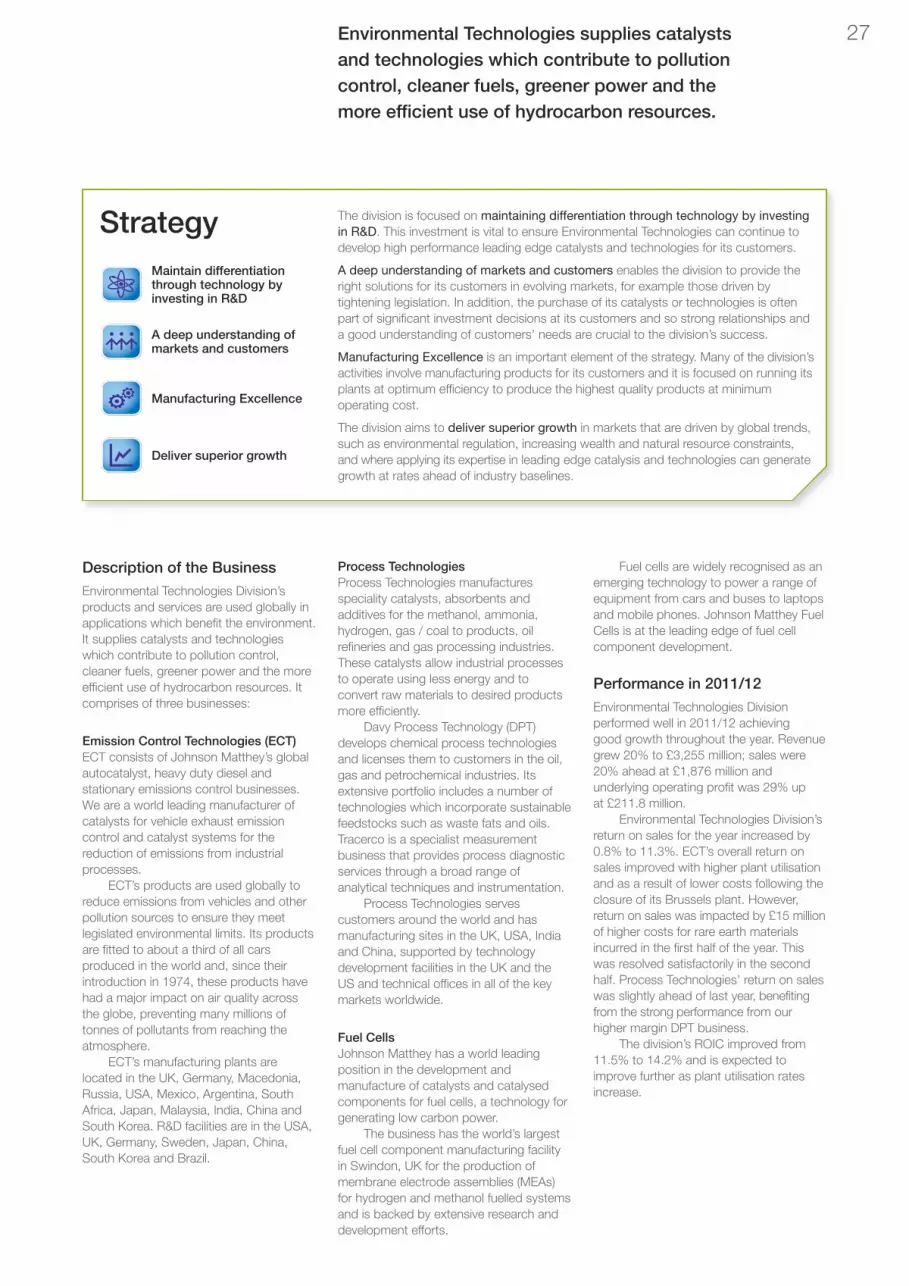
Description of the Business
Environmental Technologies Division’sproducts and services are used globally inapplications which benefit the environment.It supplies catalysts and technologieswhich contribute to pollution control,cleaner fuels, greener power and the moreefficient use of hydrocarbon resources. Itcomprises of three businesses:
Emission Control Technologies (ECT)ECT consists of Johnson Matthey’s globalautocatalyst, heavy duty diesel andstationary emissions control businesses.We are a world leading manufacturer ofcatalysts for vehicle exhaust emissioncontrol and catalyst systems for thereduction of emissions from industrialprocesses.
ECT’s products are used globally toreduce emissions from vehicles and otherpollution sources to ensure they meetlegislated environmental limits. Its productsare fitted to about a third of all carsproduced in the world and, since theirintroduction in 1974, these products havehad a major impact on air quality acrossthe globe, preventing many millions oftonnes of pollutants from reaching theatmosphere.
ECT’s manufacturing plants arelocated in the UK, Germany, Macedonia,Russia, USA, Mexico, Argentina, SouthAfrica, Japan, Malaysia, India, China andSouth Korea. R&D facilities are in the USA,UK, Germany, Sweden, Japan, China,South Korea and Brazil.
Process TechnologiesProcess Technologies manufacturesspeciality catalysts, absorbents andadditives for the methanol, ammonia,hydrogen, gas / coal to products, oilrefineries and gas processing industries.These catalysts allow industrial processesto operate using less energy and toconvert raw materials to desired productsmore efficiently.
Davy Process Technology (DPT)develops chemical process technologiesand licenses them to customers in the oil,gas and petrochemical industries. Itsextensive portfolio includes a number oftechnologies which incorporate sustainablefeedstocks such as waste fats and oils.Tracerco is a specialist measurementbusiness that provides process diagnosticservices through a broad range ofanalytical techniques and instrumentation.
Process Technologies servescustomers around the world and hasmanufacturing sites in the UK, USA, Indiaand China, supported by technologydevelopment facilities in the UK and theUS and technical offices in all of the keymarkets worldwide.
Fuel CellsJohnson Matthey has a world leadingposition in the development andmanufacture of catalysts and catalysedcomponents for fuel cells, a technology forgenerating low carbon power.
The business has the world’s largestfuel cell component manufacturing facilityin Swindon, UK for the production ofmembrane electrode assemblies (MEAs)for hydrogen and methanol fuelled systemsand is backed by extensive research anddevelopment efforts.
27
Fuel cells are widely recognised as anemerging technology to power a range ofequipment from cars and buses to laptopsand mobile phones. Johnson Matthey FuelCells is at the leading edge of fuel cellcomponent development.
Performance in 2011/12
Environmental Technologies Divisionperformed well in 2011/12 achieving good growth throughout the year. Revenuegrew 20% to £3,255 million; sales were20% ahead at £1,876 million andunderlying operating profit was 29% upat £211.8 million.
Environmental Technologies Division’sreturn on sales for the year increased by0.8% to 11.3%. ECT’s overall return onsales improved with higher plant utilisationand as a result of lower costs following theclosure of its Brussels plant. However,return on sales was impacted by £15 millionof higher costs for rare earth materialsincurred in the first half of the year. Thiswas resolved satisfactorily in the secondhalf. Process Technologies’ return on saleswas slightly ahead of last year, benefitingfrom the strong performance from ourhigher margin DPT business.
The division’s ROIC improved from11.5% to 14.2% and is expected toimprove further as plant utilisation ratesincrease.
Strategy
Maintain differentiationthrough technology byinvesting in R&D
A deep understanding ofmarkets and customers
Manufacturing Excellence
Deliver superior growth
The division is focused on maintaining differentiation through technology by investingin R&D. This investment is vital to ensure Environmental Technologies can continue todevelop high performance leading edge catalysts and technologies for its customers.
A deep understanding of markets and customers enables the division to provide theright solutions for its customers in evolving markets, for example those driven bytightening legislation. In addition, the purchase of its catalysts or technologies is oftenpart of significant investment decisions at its customers and so strong relationships anda good understanding of customers’ needs are crucial to the division’s success.
Manufacturing Excellence is an important element of the strategy. Many of the division’sactivities involve manufacturing products for its customers and it is focused on running itsplants at optimum efficiency to produce the highest quality products at minimumoperating cost.
The division aims to deliver superior growth in markets that are driven by global trends,such as environmental regulation, increasing wealth and natural resource constraints,and where applying its expertise in leading edge catalysis and technologies can generategrowth at rates ahead of industry baselines.
Environmental Technologies supplies catalystsand technologies which contribute to pollutioncontrol, cleaner fuels, greener power and themore efficient use of hydrocarbon resources.

Our sales in Europe of £588 million,which represent 61% of our light dutycatalyst sales, increased by 8%, ahead ofthe growth in vehicle production which wasonly up 0.5%. Our sales benefited fromgrowth in the proportion of diesel vehiclesproduced in Western Europe whichrepresented 55% of total light vehicleproduction, up from 54% last year. Salesalso benefited from the full fitment of dieselparticulate filters (DPFs) to light commercialvehicles in Western Europe, completingthe process of fitment of these productsto all light duty diesel vehicles in the region.
As a result of the complex catalyst systemsrequired to meet European diesel emissionsstandards, a diesel vehicle currentlyrepresents approximately five times thecatalyst value of an equivalent gasolinevehicle for Johnson Matthey. Catalyst valuewill increase further with the introduction ofEuro 6 light duty diesel emissions standardsin 2014, which will require additional catalystfitment to meet tighter NOx standards.During the year our European sales alsobenefited from our strong market share withsome of the most successful car companiesin the region and from the introduction ofhigher technology products. Theseproducts offer our customers opportunitiesto reduce costs through advancedtechnology, including the more efficient useof raw materials.
On 31st January 2011 ECT enteredinto consultation with the employees at its inefficient Brussels facility regarding itsclosure. The plant ceased production inJuly 2011 and all production wastransferred to other ECT sites with annualcost savings of approximately £18 millionper year.
Despite the challenges presented bythe Japanese earthquake and tsunami,the floods in Thailand and slower growthin China, our Asian light duty catalystbusiness grew strongly with sales up 20%to £201 million. Light duty vehicleproduction in the region in 2011/12 grewby just over 1%. However, our sales grewat a much faster rate as the result ofgrowth in our market share in many partsof the region and a strong recovery in ourJapanese business in the second half withrobust demand from the original equipmentmanufacturers (OEMs) in Japan once theirfactories were back on line. With continuedeconomic expansion, increasing disposableincome and tightening legislation acrossthe region, Asia should remain a growthengine for ECT in the years ahead.
Financial Review of Operations continuedEnvironmental Technologies continued
Emission Control TechnologiesEmission Control Technologies’ sales grew by 21% from £1,218 million to£1,470 million.
Light Duty CatalystsOur light duty catalyst business, whichrepresented 66% of ECT’s sales in theyear, grew well with sales up 10% to£969 million and operating profit up bya similar percentage.
In Johnson Matthey’s financial year to31st March 2012, global light duty vehiclesales grew by 3% to 76.1 million vehicles.Global production grew steadily, by 2.5%,with a strong recovery in North Americathroughout the year, a moribund market inEurope which declined in our second half,and slight growth in Asia, albeit affected inthe first half by the Japanese earthquakeand tsunami and in the second half by thefloods in Thailand. In China, growth in carproduction was lower than last year, butstill increased by 5%.
Johnson Matthey Annual Report & Accounts 2012Report of the Directors – Business ReviewFinancial
28
2009 2010 2011
North America Europe Asia Global
2012 2013 2014 2009 2010 2011 2012 2013 2014 2009 2010 2011 2012 2013 2014 2009 2010 2011 2012 2013 2014
Source: IHS Automotive (April 2012)
8.611.9 12.9 14.7 15.4 16.5 16.5 19.0 20.1 19.0 19.6
28.9
21.0
37.1 37.043.040.9
45.7
59.5
74.4
81.276.8
85.491.0
0
10
20
30
40
50
60
70
80
90
100
Light Duty Vehicle Production Outlook – 2009-2014 (calendar years)million
Estimated Light Vehicle Sales and Production
Year to 31st March2012 2011 %
millions millions change
North America Sales 15.6 14.5 +7.6Production 13.6 12.4 +9.7
Total Europe Sales 19.0 18.7 +1.6Production 19.8 19.7 +0.5
Asia Sales 30.8 30.5 +1.0Production 37.7 37.2 +1.3
Global Sales 76.1 73.9 +3.0Production 77.7 75.8 +2.5
Source: IHS Automotive
Johnson Matthey’s Light DutyVehicle Catalyst Sales by Region
2012 2011 %£ million £ million change
Europe 588 544 +8Asia 201 168 +20North America 180 167 +8
Total 969 879 +10

In North America the light dutyvehicle market showed good growth withproduction in the region up nearly 10% inour financial year. Our sales grew at aslightly lower rate, up 8% to £180 million,as our North American Japanese transplantcustomers, where we have a higher marketshare, were impacted by supply chainissues following the Japanese earthquakeand tsunami and flooding in Thailand.
Since mid 2010, prices of rare earthraw materials have increased dramaticallyfollowing the imposition of export quotasby the Chinese government. The main rareearth material that we use is cerium oxide,which is used to provide oxygen storagecapabilities in catalysts for gasoline vehicles.Rare earth prices peaked in mid 2011 and,although now well below previous highs,prices remain significantly above those inthe first half of 2010. In response to thissituation, ECT took steps to reduce theimpact of rising rare earth material costsby a combination of thrifting, substitutionfor cheaper raw materials and negotiatingprice surcharges with its customers. Dueto the magnitude and speed of the costincreases, ECT’s results were adverselyaffected by around £5 million in 2010/11and £15 million in the first half of 2011/12.However, by the second half of 2011/12the effects of higher rare earth prices werefully mitigated and any future increasesshould no longer impact the business.
Staying Ahead of the LegislationCatalysts are now routinely fitted to vehicles to control the emissions of pollutantsincluding carbon monoxide, nitrogen oxides, unburnt hydrocarbons and soot.However, legislators are now starting to address the issue of greenhouse gasemissions from vehicles too, with Europe, North America and Japan all proposinglimits. In Europe, for example, a carbon dioxide (CO2) emissions limit of 95g/km by2020 has been proposed.
One method of decreasing CO2 emissions (and improving fuel economy) is touse the waste heat in the exhaust to promote a chemical reaction between exhaustgases and some added hydrocarbons to generate a higher calorific value fuel thatcan be fed back into the engine to help combustion efficiency.
One approach is to use a catalyst promoted steam reforming reaction atelevated temperature to generate a hydrogen rich fuel to feed back into the engine.Given that the exhaust contains both steam and waste heat, the steam reformingreaction is an attractive technology for tackling CO2 emissions while at the sametime improving fuel economy.
Johnson Matthey, in collaboration with the University of Birmingham in the UK,has been studying systems to generate hydrogen mixtures from exhaust gas andadded fuel (e.g. gasoline), demonstrating feasibility both in the lab and on smallsingle cylinder engines. We are now working to develop this further, with partnersincluding Ford, Jaguar Land Rover and Cambustion, as part of a project that ispartially funded by the UK’s Technology Strategy Board. The project has a numberof themes with an overall goal of providing a series of measures to reduce CO2. Ourwork is focused on demonstrating that a catalytic hydrogen generator (reformer)can be integrated with a four cylinder gasoline engine to deliver a reduction in CO2
emissions of up to 4%.
> How Sustainable Are Our Products?It takes raw materials and energy to make a catalytic converter for a car but at whatpoint do the environmental benefits of a catalyst outweigh the environmental costs ofproducing it? A Johnson Matthey team embarked on an analysis to understand andbetter quantify the sustainability benefits of one of its environmental technologies.
The tool chosen was quantitative life cycle assessment (LCA), which allows theimpact of a product to be traced during its whole life. A life cycle experts group wasformed, made up of 12 people from across Johnson Matthey’s businesses. The teamthen selected one of the company’s core products – a catalytic converter for a dieselpowered car – for analysis.
The study was highly insightful and informative and generated several keylearning points for the company. With the help of the LCA tools, Johnson Mattheyaims to better understand the environmental and health benefits of other key productsand develop new technologies with enhanced sustainability benefits in the future.
� Read the full case study at www.matthey.com/sustainability.
Case Study
29
Innovation in Action

Financial Review of Operations continuedEnvironmental Technologies continued
Heavy Duty Diesel CatalystsSales of heavy duty diesel (HDD) catalystsfor both on road and non-road applicationsgrew strongly again this year, up 48% to£438 million and operating profit more thandoubled.
Production of heavy duty diesel trucksin North America continued to growrobustly throughout the year, increasingby 50% to 452,000 vehicles as truckingcompanies replaced their ageing fleets.In Europe, truck sales recovered last yearfrom the global downturn and productiongrowth this year remained robust at 7%.
Johnson Matthey Annual Report & Accounts 2012Report of the Directors – Business ReviewFinancial
30
Johnson Matthey’s Heavy Duty DieselVehicle Catalyst Sales by Region
2012 2011 %£ million £ million change
North America 295 194 +52Europe 116 91 +27Asia 27 11 +137
Total 438 296 +48
2009 2010 2011 2012 2013 2014 2015 2016 2017
Source: LMC Automotive (April 2012)
0
50
100
150
200
250
300
350
400
450
EU Truck Salesthousands
Heavy Duty Diesel Vehicle Sales Outlook (calendar years)
2009 2010 2011 2012 2013 2014 2015 2016 2017
0
100
200
300
400
500
USA Class 4-8 Truck Salesthousands
US 07
0
Euro IV Euro V Euro VI / US 2010regulations
Deeper Knowledge of NOx Removal CatalystsJohnson Matthey’s range of emission control catalysts includes vanadium basedproducts that use selective catalytic reduction (SCR) to control oxides of nitrogen(NOx) emissions from industrial powerplants. In order to further enhance ourknowledge of these SCR DeNOx catalysts and the chemistry of NOx removal, wehave turned to an advanced characterisation technique which allows us to probeour catalysts at the atomic scale.
This technique, called solid state nuclear magnetic resonance spectroscopy(SSNMR), has been available to Johnson Matthey for a number of years through itscollaboration work with leading universities. Recently however, via a knowledgetransfer partnership with the University of Warwick in the UK, we have brought thetechnique in house, thus enabling us to study a wider range of advanced materialsin a faster time. We have successfully used SSNMR to study vanadium based SCRDeNOx catalysts and improve our understanding of the molecular environment ofthe catalytically active vanadium species. In addition, we continue to work withscientists at the University of Warwick to perform even more advancedspectroscopic analyses on our materials. This information is proving invaluable inhelping us to develop novel, higher performance catalysts to tackle harmful NOx.
In North America our sales grew inline with truck production, up 52% to£295 million as we maintained our strongmarket share. In Europe our sales were up27% to £116 million, well ahead of growthin truck production in the EU. However,our European sales also include exportsales of around £5 million to Brazil, whereEuro V legislation started at the beginningof 2012, and strong sales into EasternEuropean markets. HDD catalyst sales in
Innovation in Action

Japan grew from a low base to £27 million,as new legislation requiring the fitment ofDPFs came into force. The implementationof Euro IV legislation in China has beendelayed until mid 2013 due to issues withthe supply of low sulphur diesel fuel.However, very low level sales of HDDcatalysts have commenced to OEMs in bothChina and India as truck manufacturersprepare for future legislation. At only Euro IVequivalent and with relatively simpleengines, these markets are likely to havelower technology requirements thanEurope or North America and thus we arelikely to face much more competition fromour existing competitors and local players.
During the year sales also commencedto non-road OEMs, such as manufacturersof construction, mining and agriculturalequipment, in the USA and Europe wherelegislation requiring the use of emissioncontrol catalysts is being phased inbetween 2011 and 2015. Sales of HDDcatalysts to non-road customers grewfrom a low base, contributing £20 millionin the year.
Towards the end of the year ECTcommenced a major expansion projectat its plant in Macedonia that will doublecapacity at the site. Plans were alsoapproved to increase our DPF productioncapacity at Royston, UK. Both of theseprojects will provide additional capacity forthe high technology products required fortighter European light and heavy dutydiesel legislation, commencing in 2014.In addition, during the year the businesshas added capacity in China for upcomingHDD requirements and expanded its plantsin India and Malaysia to serve growth in carproduction in India and South East Asia.
Process TechnologiesProcess Technologies delivered good growthin the year with sales 19% up at £401 million.The business benefited from anotherexcellent year from DPT and from a fullyear’s contribution from the Additivesbusiness (formerly Intercat), which wasacquired in November 2010 and suppliesspeciality products to the petroleumrefining industry. Operating profit was alsowell ahead of last year, boosted by the verystrong performance from the higher marginDPT business.
Estimated HDD Truck Sales and Production
Year to 31st March2012 2011 %
thousands thousands change
North America Sales 405.2 287.4 +41.0Production 451.8 301.0 +50.1
EU Sales 298.7 257.4 +16.0Production 386.4 360.2 +7.3
Source: LMC Automotive
> From Waste Stream to Commercial ByproductIn 2004 a water treatment facility at our Clitheroe plant in the UK began operating.At that time, the cost of disposing of waste sodium nitrate was a significant financialoverhead. Today, much of that waste stream has become a commercial product,Nitratrete.
A programme of market research and innovation followed the opening of thewater treatment facility and customers for the waste stream were identified.
Since then, Clitheroe has worked closely with its customers to improve thequality and consistency of the product and to develop other applications.
Significant financial benefits have been achieved by avoiding disposal costs ofunsold byproduct and generating revenue from sales. The environmental benefits areequally clear. By 2017, the target is to commercialise 90% of the sodium nitrateproduced at Clitheroe. This is a powerful example of a win-win for sustainability –reducing waste and increasing profit.
� Read the full case study at www.matthey.com/sustainability.
31
In the Ammonia, Methanol, Oil andGas (AMOG) business, which includes theAdditives business, sales of its catalysts,absorbents and speciality additives were27% ahead at £256 million. ExcludingAdditives, sales would have been 3% up.Catalyst sales to ammonia customersgrew well in the year and were 8% aheadat £45 million, however as we expected,sales of methanol catalysts were lowerat £42 million, 14% down on those in2010/11 which saw commissioning of anumber of new plants in China and theMiddle East. Sales of catalysts to hydrogencustomers grew strongly again this year,up 40% to £67 million. Legislation requiringlower sulphur levels in fuels and thecontinued trend of processing dirtier,heavier crude in refineries supporteddemand for hydrogen which in turngenerated an increase in our sales.Demand for gas purification products,used to remove contaminants such assulphur and mercury from gas streams,was impacted, with sales 33% down onlast year, as the business continued to feelthe effect of delayed investment in largegas processing projects.
The Additives business made a goodfirst full year’s contribution to AMOG and isperforming ahead of our expectations atthe time of acquisition. We are alreadyleveraging technology synergies betweenour additives and refinery catalysts and aredrawing on the customer relationships inboth businesses to create new opportunitiesfor the combined product range.
Case Study

Financial Review of Operations continuedEnvironmental Technologies continued
Process Technologies continued tobenefit from energy security concerns inChina which are driving projects tomonetise coal reserves in the country. Thishas supported sales of our catalysts forproducing both chemicals and substitutenatural gas (SNG) from coal. In other partsof the world, particularly the USA, theextraction of shale gas has contributed tolower gas prices compared with those ofoil. This provides new opportunities for oursyngas catalysts.
The business saw continued successin the development of catalysts for gas toliquids (GTL) applications. It signed a tenyear agreement with CompactGTL todevelop, manufacture and supply catalystsfor its modular GTL commercial scaleplants which can be used for remoteoilfields in onshore and offshore locationsto convert gas into sulphur free liquid fuels.
DPT had an excellent year, buildingon its strong performance in 2010/11.This higher margin business delivered salesof £94 million, which were 42% ahead ofprior year, and secured licence andengineering contracts for 14 new plantsacross its portfolio of technologies.Increased demand for petrochemicals inChina continued to drive growth in DPTand the business won contracts for tenplants there, including two SNG plants,four methanol plants and two oxo alcoholsplants. Outside of China, DPT also securedlicences for speciality chemicals plants inMalaysia and in the Netherlands, and oxoalcohols plants in France and Saudi Arabia.
In recent years a significant amount ofchemical manufacturing capacity has beeninstalled, especially in China, and this hasbenefited DPT. We expect that the numberof new plants and hence licences availableto DPT will be maintained in 2012/13 but islikely to reduce thereafter. Despite this, theoutlook for DPT remains positive as globaldrivers, such as increasing wealth inemerging markets and energy security,support demand for its technologies.Furthermore, the business continues toinvest in the research, development andcommercialisation of new processtechnologies, including those which utilisesustainable feedstocks, to maintain itsleading global position. This year saw DPTcommercialise three new technologieswhich now are under construction, includinga process which converts waste oils andfats into second generation biofuels.
Johnson Matthey Annual Report & Accounts 2012Report of the Directors – Business ReviewFinancial
32
AMOG64%
DPT23%
Tracerco13%
Process Technologies’ Sales
2008 2009 2010 2011 20120
12
15
6
9
3
Methanol Oxo alcohols SNG Butanediol Other
Davy Process Technology– Projects Awarded
An Insight on the InsideThe manufacture of catalysts frequently involves the processing, blending and mixingof fluids or slurries with complex flow behaviours (or rheologies). Achieving a wellmixed combination of materials in our catalyst manufacturing processes is critical toensuring final product quality and optimum catalytic performance in our customers’applications. Fundamental research at the laboratory scale, using representativefluids and advanced experimental techniques, has been used to build our knowledgeof the types of non-ideal mixing that can occur.
We have also used a technique called electrical resistance tomography (ERT) onour manufacturing plants to compare different mixing system designs. ERT providesus with a picture of how well the contents of our reaction vessels are mixing. Wehave used the technique to identify best mixing system designs and define bestpractice which has been implemented on new manufacturing plants and retrofitted toour existing operations. Through ERT we are gaining an invaluable insight into what ishappening inside our vessels which enables us to optimise our mixing systems andthus ensure the highest catalyst performance for our customers.
Innovation in Action

Tracerco recovered well after difficulttrading conditions in 2010/11. Its sales in2011/12 were 22% ahead of prior year asthe business benefited from renewedactivity in global oil and gas marketssupported by the high oil price. This hasencouraged oil and gas companies toexploit more difficult to recover resourcesand has boosted demand for Tracerco’sspecialist technologies.
Fuel CellsOur Fuel Cells business was adverselyaffected by a slowdown in demand forstationary combined heat and power unitsthis year as our customers delayed theirproduct deployment programmes.
The development of fuel cell technologyfor transport applications, especially cars,continues. Advances in both vehicledevelopment and hydrogen fuellinginfrastructure around the world remain ontrack for initial market introduction of fuelcell powered vehicles within around fiveyears. Components for automotiveapplications remain an importantopportunity for Johnson Matthey and wehave continued to increase our investmentin R&D for automotive applications duringthe year.
As a result of slower demand and ourincreased R&D expenditure, the net expenseof our Fuel Cells business increased by£4.3 million to £9.2 million this year.
Global drivers, particularly thoserelating to environmental and energysecurity issues, continue to supportinterest in fuel cell technology for transportand for heat and power applications inbuildings. Furthermore, our strongrelationships with system developers andour investment in manufacturinginfrastructure position us well in thedeveloping fuel cell market where highperformance platinum group metalcatalysts and technology are key.
. Development of new process catalysts at our Billingham, UK facility.
. Fuel cell catalyst testing at the Johnson MattheyTechnology Centre in Sonning, UK.
Looking Inside a Fuel CellCollaborating with other leading players has always been an important element ofour R&D programmes, giving us the opportunity to work with the world’s smartestscientists and the very latest technology and equipment. In an extension to ourcollaborations, Johnson Matthey has established a deeper partnership withCambridge University in the UK, sponsoring its chemical engineering activities,providing financial support and seconding two Johnson Matthey scientists to workat the university.
For the last four years the company has been closely involved with researchand teaching activities at the Department of Chemical Engineering andBiotechnology at Cambridge University. Current research activities include magneticresonance imaging of catalysts and reactions, developing spectroscopy andmicroscopy techniques to study materials and catalysts, and research into fuel cellsthrough the use of microfluidic devices.
A microfluidic device is so called because it can be built at a small scale tomimic a larger real life system, such as a fuel cell; this allows precise control offlows within the device and enables the device to be used in conjunction withanalytical equipment, which gives us an insight into what is actually going on insidethe device. In our work with Cambridge University we are looking at fuel cell devicesfor simultaneous production of chemicals and power generation, known ascogeneration, and, through the use of these techniques, we are gaining newknowledge of the detailed chemical workings of a fuel cell.
Innovation in Action

Financial Review of Operations continuedPrecious Metal Products
Johnson Matthey Annual Report & Accounts 2012Report of the Directors – Business ReviewFinancial
34
Key Statistics
Capital expenditure £31.6 millionCapex / depreciation 1.4Average invested capital £341 millionEmployees 2,894
Year to 31st March % at 2012 2011 % constant £ million £ million change rates
Revenue 9,841 8,270 +19 +20
Sales excluding precious metals (sales) 582 541 +8 +8
Underlying operating profit 200.8 172.9 +16 +16
Return on sales 34.5% 31.9%
Return on invested capital (ROIC) 58.9% 55.9%
Addingvalue topreciousmetals
Manufacturing –Catalysts and Chemicals
30%
Services34%
Manufacturing –Noble Metals
21%
Manufacturing –Colour Technologies
15%
Sales
Europe35%
North America36%
China8%
Rest of Asia12%
Rest of World9%
Sales by Destination
2009* 2010 2011 2012
447 454
541582
0
150
300
450
600
Divisional Sales £ million
2009 2010 2011 2012
143.0
116.7
172.9
200.8
0
50
100
150
200
250
Divisional Underlying Operating Profit£ million
* Excluding inter-segment sales.

Description of the Business
Precious Metal Products Division (PMPD)adds value to precious metals. Its wideranging activities comprise two main areas:Services businesses and Manufacturingbusinesses.
Services BusinessesThe activities of our Services businessescomprise the marketing, distribution,refining and recycling of platinum groupmetals (pgms) and the refining of gold andsilver. As well as serving their externalcustomers around the globe, the Servicesbusinesses also provide a critical service tobusinesses in the Johnson Matthey groupand their customers. Around 70% ofJohnson Matthey’s products and businessesinvolve pgms and so the sourcing andrecycling of them is critical to the continuityand profitability of the group. Our Servicesbusinesses comprise two areas:
Platinum Marketing and DistributionThis includes our worldwide platinummarketing and distribution activities.Marketing is headquartered in Royston, UKwith support facilities in Philadelphia, USAand Hong Kong. We are the world’sleading distributor of pgms and the solemarketing agent for Anglo AmericanPlatinum, the world’s largest producer ofplatinum.
RefiningJohnson Matthey is a leader in therecycling and refining of precious metals.Our refining and recycling operationsprovide a vital service to ensure thesevaluable natural resources are recycled andreused as efficiently and sustainably aspossible.
Our Pgm Refining and Recyclingbusiness recovers pgms from spentcatalysts and other secondary materialsand refines primary pgms from globalmining operations. It has facilities in the UKand USA.
Our Gold and Silver refining businesscomprises our gold and silver refining andbullion manufacturing operations. Thebusiness serves the world’s miningindustries and recycles secondary scrapmaterial. Its operations are located in theUSA and Canada.
Manufacturing BusinessesThe activities of the Manufacturingbusinesses include the fabrication ofproducts using precious metals and relatedmaterials, pgm and base metal catalystsand pgm chemicals. There are threeManufacturing businesses:
Noble MetalsNoble Metals produces a wide range ofprecious metal and other fabricatedproducts for industrial and medicalapplications and Johnson Matthey is themarket leader in pgm fabricated productsfor industrial applications. Its manufacturingoperations are based in the UK and USA.
Many of Noble Metals’ products havea positive impact on our health or on theenvironment. It manufactures componentsused in medical devices which are used in life saving surgery for maintainingcardiovascular health. Its products alsoinclude catalyst systems which are used innitric acid manufacturing plants to abatenitrous oxide (N2O), a highly potentgreenhouse gas. To date, reductionsequivalent to over 35 million tonnes ofcarbon dioxide have been achieved usingthese systems.
Colour TechnologiesHeadquartered in the Netherlands, ourColour Technologies business manufactureshigh technology functional coatings whichinclude black obscuration enamels andsilver conductive materials for automotiveglass. It also makes colours, enamels anddecorative precious metal products forother glass applications such as bottlesand architectural glass as well as fortableware and other ceramic applications.Manufacturing takes place in theNetherlands, USA and South Korea.
Catalysts and ChemicalsCatalysts and Chemicals manufacturesprecious and base metal catalysts whichare used to enhance the operatingefficiency of chemical and pharmaceuticalmanufacturing processes. It alsomanufactures precious metal chemicals fora wide range of applications. The businesshas manufacturing operations in the UK,USA, Germany, India and China.
35
Strategy
Leverage our deep understanding of:• Catalysis and pgm chemistry• Materials science and manufacturing
Provide customer solutionsthrough investment in R&D
Offer first class servicesto our external and internalcustomers
Deliver superior growth
Through leveraging its deep understanding of catalysis, pgm chemistry, materialsscience and manufacturing, Precious Metal Products can apply expertise in thefundamentals of chemistry, materials and process design to ensure it continues todevelop leading edge products and manufacturing routes.
The division is focused on providing customer solutions through investment inR&D. R&D is at the heart of all Johnson Matthey’s activities and whilst the divisioncontains a mix of newer and more mature businesses, constant innovation meansthat a high proportion of its portfolio consists of products developed within the last decade.
Offering first class services to external and internal customers is an importantelement of the strategy. The division serves external customers and also providesvital services to other Johnson Matthey businesses either through the provision ofprecious metals or through refining and recycling spent process or customermaterial. Focusing on the quality and scope of the services it offers is key tomaintaining a competitive position.
The division aims to deliver superior growth by targeting higher technology areaswhere its expertise in adding value to precious metals can generate growth atrates ahead of industry baselines.
Precious Metal Products’ sales increasedby 8% supported by good demand acrossall of its businesses.

March 2010 March 2012March 2011
Platinum Palladium
0
500
1,000
1,500
2,000
Platinum and Palladium PricesUS$/oz
March 2010 March 2012March 20110
1,000
2,000
3,000
4,000
Rhodium PriceUS$/oz
Performance in 2011/12
Precious Metal Products Division’s revenueincreased by 19% to £9,841 million. Itssales were 8% up at £582 million,supported by good demand across all ofits businesses. Underlying operating profitwas 16% ahead at £200.8 million withgood profit growth in all of the division’sbusinesses.
Services BusinessesSales in the division’s Services businesses,which represent 34% of PMPD’s sales,grew by 10% to £199 million. Profit grewstrongly in the year due to continued gooddemand for precious metal refiningservices and slightly higher averageprecious metal prices.
Platinum Marketing and DistributionGlobal demand for platinum increased by2% in the calendar year 2011. Demandfrom the autocatalyst sector grew only
Financial Review of Operations continuedPrecious Metal Products continued
modestly. Strong demand in the heavyduty diesel sector was offset by lowerdemand from the light duty diesel sector,due to increased use of palladium, andfrom Japanese car makers in the aftermathof the March 2011 earthquake. Demandtrends in other sectors were broadlypositive with industrial applicationsenjoying a cyclical upturn. Supplyincreased due to releases of metal fromin process and refined inventories asunderlying mine production in South Africadeclined. After being close to balance in2010, the platinum market moved intosurplus in 2011.
The price of platinum reflected theseweaker fundamentals. After reaching ahigh point of $1,911/oz in August, theprice retreated for the remainder of thecalendar year, caught up in the generalliquidation across the commodity sector,to end the year below $1,400/oz. Platinumaveraged $1,670/oz for the financial year,virtually unchanged on 2010/11.
The balance of the platinum marketis expected to be similar in 2012, withboth supply and demand expected to besomewhat lower than in 2011. Investmentsentiment is likely to continue to have thedetermining influence on the platinum price.
The palladium market moved intosurplus in 2011 with growth in industrialdemand outweighed by further Russianstock sales and net liquidation in thephysically backed Exchange Traded Fund(ETF) investment market. The demand sidewas a mixed picture with autocatalystdemand reaching a new high but otherindustrial demand showing only moderategrowth. Supplies of newly mined palladiumwere flat but there was a sharp increase inmetal recovered from autocatalyst recycling.
Having opened the year at $770/oz,the palladium price suffered in the face ofweak fundamentals. After reaching a yearhigh of $845/oz in June, palladium hadretreated to $570/oz by October as ETFliquidation reached a peak. The pricerecovered slowly in the rest of the year toaverage $710/oz, up 15% on the averagefor 2010/11.
Johnson Matthey Annual Report & Accounts 2012Report of the Directors – Business ReviewFinancial
36
2007 2008 2009 2010 2011
South Africa Russia Elsewhere
0
6
5
4
3
2
1
7
Supply of Platinum2007-2011million oz
2007 2008 2009 2010 2011
Autocatalyst Jewellery Industrial Investment
0
1
2
3
4
5
6
7
8
9
Gross Demand for Platinum2007-2011*million oz
2007 2008 2009 2010 2011
South Africa Russia Elsewhere
0
1
2
3
4
5
6
7
8
9
Supply of Palladium2007-2011million oz
2007 2008 2009 2010 2011
Autocatalyst Electronics Jewellery Other
0
2
4
6
8
10
Gross Demand for Palladium2007-2011**million oz
* Recycling of scrapped autocatalysts,electronics and jewellery contributed1.41 million oz in 2009, 1.83 million ozin 2010 and 2.05 million oz in 2011.
** Recycling of scrapped autocatalysts,electronics and jewellery contributed1.43 million oz in 2009, 1.85 million ozin 2010 and 2.35 million oz in 2011.

March 2010 March 2012March 2011
Gold Silver
1,000
1,250
1,500
1,750
2,000
10
20
30
40
50
Gold and Silver Pricesgold US$/oz silver US$/oz
With significantly lower shipments ofRussian state stock anticipated in 2012and a modest increase in demand, thepalladium market is expected to swingback into deficit. This will be supportive ofa rising price trend although externaleconomic factors, particularly in emergingmarkets, are expected to have a significantinfluence.
The rhodium market was once againoversupplied in 2011 as modest growth indemand was outpaced by a rise in suppliesand higher volumes of metal recoveredfrom scrap autocatalysts. With a growingsurplus, the price found little support,falling $1,000/oz to close the financial yearat $1,400/oz. The average price of$1,734/oz was down 28% on 2010/11.The rhodium market is expected to remainin surplus in 2012, suggesting limitedupside potential in the price.
RefiningOur Refining businesses had anotherstrong year, led by our gold and silverrefineries. In our Pgm Refining businesssales were 1% up on 2010/11. Volumeswere strong in the first half but there wassome slowing of demand in the secondfollowing the fall in pgm prices duringSeptember. The business continued tobenefit from its key strategic position in the refining of pgms from end of lifeautocatalyst scrap, with volumes 20% upon the strong growth seen in the prior year.Intakes of the more difficult to refineinsoluble pgms, rhodium, ruthenium andiridium, also continued to be strong,benefiting from further development of thebusiness’ world leading pgm chemistryand refining capabilities in this area.Operational improvements and continuedfocus on capacity management resulted ina reduction of metal tied up in refiningprocesses and the business continues towork on long term projects to add value forits customers.
Both of our gold and silver refinerieshad a strong year. Throughputs were up by13% for gold and 5% for silver against aback drop of record levels in the prior year.Our refinery in Salt Lake City, USAbenefited from several new mines reachingoptimal output during the year. In 2011/12gold and silver prices averaged $1,661/ozand $36/oz, up 28% and 50% respectivelyon those in 2010/11. The second half sawa slowdown in demand for recycling as theeconomy started to recover in the US.However, demand for investment productssuch as gold and silver bars were at arecord high, particularly in China.
Mines15%
Johnson Matthey11%
Refiners10%
Pharmaceuticals /chemicals
8%
Glass / nitric8%
Others8%
Autocatalyst scrap40%
Pgm Refining Throughput by Market Sector
37
> Process Improvements in Refining Bring RewardActivities at Johnson Matthey’s Royston site in the UK include the refining of platinumgroup metals and a project on one of the operation’s core purification steps hasdelivered swift improvements, targeting four of the Sustainability 2017 goals.
Whilst the business’ technology for this core purification step is well established,a project and cross functional team were set up to improve the process and make theoperation more sustainable.
The resulting benefits were significantly reduced raw material usage, effluentgeneration and carbon emissions, as well as significant cost savings.
The project combined structured problem solving with innovation and furtherimprovements are planned. The sustainability dividend is closely entwined withefficiency gains and financial benefits, and these results make a significantcontribution to Johnson Matthey’s vision for a sustainable business.
� Read the full case study at www.matthey.com/sustainability.
Case Study

Manufacturing BusinessesSales in our Manufacturing businesses,which represent 66% of PMPD’s sales,were up 6% to £383 million. Operatingprofit was well up on prior year.
Noble MetalsFollowing last year’s strong recovery, NobleMetals’ sales grew 4% to £125 million.However, operating profit was well aheadof last year with a trend towards higheradded value products for the automotiveand medical device sectors and improvedmarket share following the success ofseveral new product introductions.
Sales of industrial products, whichrepresent 70% of Noble Metals’ sales,grew by 4% to £88 million. The businesshas developed a range of new higherperformance pgm alloy catalysts used infertiliser manufacture. This has enabled usto increase our market share andoutperform market growth.
Carbon trading opportunities continueto be the main driver for the use of N2Oabatement systems in the nitric acidproduction industry. Noble Metals continuedto see good demand for these products
during the year and, despite recent fallsin the market price for carbon, salescontinued to grow. Further growthopportunities will depend upon thelegislative environment as developedcountries tackle the threat of climatechange. The business is well placed torespond.
The business has also developed arange of high technology pgm alloys usedin manufacturing spark plugs designed tomeet the automotive industry’s demand forimproved performance and fuel efficiency.During the year the business has investedin increased production capacity to servethis growing market.
Sales of medical components (30% ofNoble Metals’ sales) were 6% up on lastyear at £37 million driven by recorddemand for products used primarily in thecardiovascular markets. Governmenthealthcare initiatives and an ageingpopulation in the US are resulting in ahigher number of medical procedures.This, together with increasing wealth inChina, India and Southeast Asia, is drivingdemand for our products. During the yearthe business invested in high technology
fine hole cutting equipment at its SanDiego, USA operation to support growingdemand for micromachined parts. It alsoexpanded its facility in San Jose, USA toservice increased demand for nitinol tubingwhich is used in nitinol stents to treatperipheral vascular disease.
Colour TechnologiesColour Technologies’ sales were 6% upon last year at £87 million and operatingprofit grew ahead of sales. The year sawgood growth in sales of obscurationenamels for the automotive glass industry,particularly in China and the Americas,supported by the introduction of innovativenew products. High precious metal pricescontinued to adversely impact demand fordecorative precious metal products buthad little impact on functional applicationsof these materials, for example in theaerospace industry. The year also saw astrong increase in sales of conductive silverpastes to the automotive glass industryresulting from a combination of improvedproducts, successful collaboration withcustomers and market growth.
Johnson Matthey Annual Report & Accounts 2012Report of the Directors – Business ReviewFinancial
38
Financial Review of Operations continuedPrecious Metal Products continued
> Interactive Training Promotes Sustainabilityin DowningtownJohnson Matthey’s Colour Technologies operations in Downingtown, US, set up asustainability training programme for all of its employees. The programme offeredinteractive learning, practical exercises and insights into the fundamentals ofsustainability, achieving 100% participation among employees.
The training schedule kicked off with an overview session designed toincrease awareness and encourage engagement. In the second session,employees explored the use of streamlined life cycle assessment tools on a reallife example of relevance to the business. Other parts of the training coveredJohnson Matthey’s Sustainability Intranet, where employees were shown how tocontribute to it, and use of a carbon calculator tool to enable staff to think abouttheir own carbon footprint.
The outcome is a workforce with greater understanding and renewed enthusiasm. Developing employee awareness andencouraging use of tools such as the streamlined life cycle assessment and the Sustainability Intranet play an effective part instrengthening involvement in the company’s sustainability agenda.
� Read the full case study at www.matthey.com/sustainability.
Case Study

Catalysts and ChemicalsCatalysts and Chemicals’ sales grew by8% to £171 million. Demand for ourcatalysts was good, supported by newproduct launches for solvent manufacturingand growth in sales of newly developedpgm catalysts for the petrochemical market.The business also saw good growth insales of catalysts for the production ofoleochemicals, particularly in Asia, and insales of platinum coated discs used incontact lens disinfecting systems. Duringthe year the business commissioned itsnew pgm catalyst plant in Shanghai, Chinamainly to service customers in thepharmaceutical and fine chemical sectors.
Sales of chemical products, whichinclude pgm salts used in the manufactureof autocatalysts, were down on prior yearmainly due to the impact, particularly inthe first half, of the Japanese earthquakeand tsunami on demand from Japaneseautomakers. The year saw the introductionof ‘It’sFresh!’ sheets, which contain our e+™ ethylene remover, to major UKsupermarkets to extend the shelf life offruit. Whilst current sales are relativelymodest, we are optimistic that our saleswill exceed £10 million per annum withinthe next few years.
39
Sustainable Catalysts to Replace MercuryThe development of more sustainable products is a key component of JohnsonMatthey’s Sustainability 2017 Vision. Our scientists are not only working on thecreation of new solutions for new markets, but also on developing more sustainablealternatives for existing applications.
Johnson Matthey, together with Jacobs Engineering, has developed a newproduct to replace a mercury based catalyst for making vinyl chloride monomer(VCM), a chemical used in the manufacture of PVC. Current demand for thiscatalyst, which is used mainly in China, is around 10,000 tonnes per annum.
Our new catalyst is an innovative supported precious metal catalyst. Initialresearch to create a mercury free catalyst formulation began at the Johnson MattheyTechnology Centre in Sonning, UK in 2006. Once a successful catalyst had beenidentified, its manufacture was scaled up at the company’s Catalysts and Chemicals’facility in Royston, UK. The catalyst is now in evaluation trials in a VCM pilot plant inChina and construction of a full scale demonstration VCM plant is underway.
Johnson Matthey’s expertise in materials characterisation has played a key roleat every stage in the new catalyst’s development. It has enabled us to determinethe exact distribution and chemical form of precious metals within the catalyst atthe atomic scale. This information has provided us with an understanding of thecatalyst’s performance and provides us with a solid basis for further catalystdevelopment and future customer support.
Innovation in Action

Johnson Matthey Annual Report & Accounts 2012Report of the Directors – Business ReviewFinancial
40
Financial Review of Operations continuedFine Chemicals
Key Statistics
Capital expenditure £15.8 millionCapex / depreciation 0.9Average invested capital £418 millionEmployees 1,090
Year to 31st March % at 2012 2011 % constant £ million £ million change rates
Revenue 292 255 +15 +16
Sales excluding precious metals (sales) 285 245 +16 +17
Underlying operating profit 69.7 56.2 +24 +26
Return on sales 24.5% 22.9%
Return on invested capital (ROIC) 16.7% 13.7%
Providingproducts thatultimatelyenhancequality of life
API Manufacturing72%
Research Chemicals28%
Sales
Europe41%
North America49%
China3%
Restof Asia
5%
Rest ofWorld2%
Sales by Destination
2009* 2010 2011 2012
215 221245
285
0
100
200
300
Divisional Sales £ million
2009 2010 2011 2012
49.555.8 56.2
69.7
0
25
50
75
Divisional Underlying Operating Profit£ million
* Excluding inter-segment sales.

> Unlocking a Production Bottleneck toSave Money and ResourcesImproving the efficiency of our processes is an essential part of our sustainabilitystrategy to save resources. In Johnson Matthey’s Pharmaceutical Materials andServices business an exercise to streamline operations at the West Deptford site inthe US led to significant process improvement.
Employees from all functions were involved with Engineering, Production andResearch providing the technical data, Production and Automation simplifying theprogramming and Commercial, Quality and Operations keeping external customersinformed.
The project makes an important contribution to Sustainability 2017 and its goal ofhalving key resources per unit of output. The key resources here, which are productionequipment time and energy use, have been more than halved. Furthermore, reducedmanufacturing costs and increased overall production also contribute to the sustainabilitygoal of doubling our underlying earnings per share.
� Read the full case study at www.matthey.com/sustainability.
Case Study
Description of the Business
Fine Chemicals Division supplies activepharmaceutical ingredients (APIs), finechemicals and other speciality chemicalsto a wide range of chemical andpharmaceutical industry customers andresearch institutes globally. Its productshelp relieve pain, treat cancer and alleviateother medical conditions, thus improvingthe quality of life for many people aroundthe world. It comprises two areas:
API ManufacturingOur API Manufacturing businesses supplyAPIs and intermediate products for thepharmaceutical and fine chemical
industries and provide contract researchservices to the pharmaceutical industry.Macfarlan Smith, based in Edinburgh, UKis the world’s leading manufacturer ofopiate alkaloids which are used for painmanagement and other pharmaceuticalapplications. Our US basedPharmaceutical Materials and Servicesbusiness specialises in the manufacture ofAPIs for controlled drugs and for platinumbased anticancer treatments. It alsoprovides a full range of commercial scalemanufacturing services for APIs to bothgeneric and branded pharmaceuticalcompanies.
Research ChemicalsThe Research Chemicals business is aglobally integrated supplier of specialityinorganic and organic chemicals andbiochemicals. The business supplieschemicals into both industry and researchinstitutions in small scale researchquantities, via its catalogue, and bulk scaleshipments. Around 50% of its sales are to pharmaceutical companies. It operatesunder the Alfa Aesar brand name and isbased in the UK, USA, Germany, Chinaand India. The operations in the UK andChina have manufacturing capabilityservicing the catalogue and the needs ofexternal bulk scale customers and providecustom synthesis of key pharmaceuticalintermediates for both external and internalcustomers.
41
Strategy
Deliver niche products tothe generic pharmaceuticalmarket
Leverage synergies betweenresearch, development andmanufacturing
Increase market share ofestablished products
Deliver superior growth
Fine Chemicals is focused on delivering niche products to the generic pharmaceuticalmarket where it can apply its expertise to benefit from the trend towards the use ofgeneric pharmaceuticals. Furthermore, with commercial advantages from being first tomarket with generic APIs, the division is supported by its strengths in research,development and manufacturing.
Through leveraging synergies between research, development and manufacturingacross the division, Fine Chemicals can maintain a pipeline of new products forcustomers of both its API Manufacturing and Research Chemicals businesses.
Increasing market share of established products where the division has a strongposition, such as opiate based APIs, is an important element of the strategy. Thedivision is optimising its global manufacturing capacity to enable it to benefit fromopportunities to strengthen its position in both existing and developing markets.
The division aims to deliver superior growth in markets that are driven by global trendstowards the increased use of pharmaceutical products. Its strong position in niche areasand its research and manufacturing infrastructure position it well for growth at ratesahead of industry baselines.
Fine Chemicals’ products help relieve pain, treatcancer and alleviate other medical conditions.
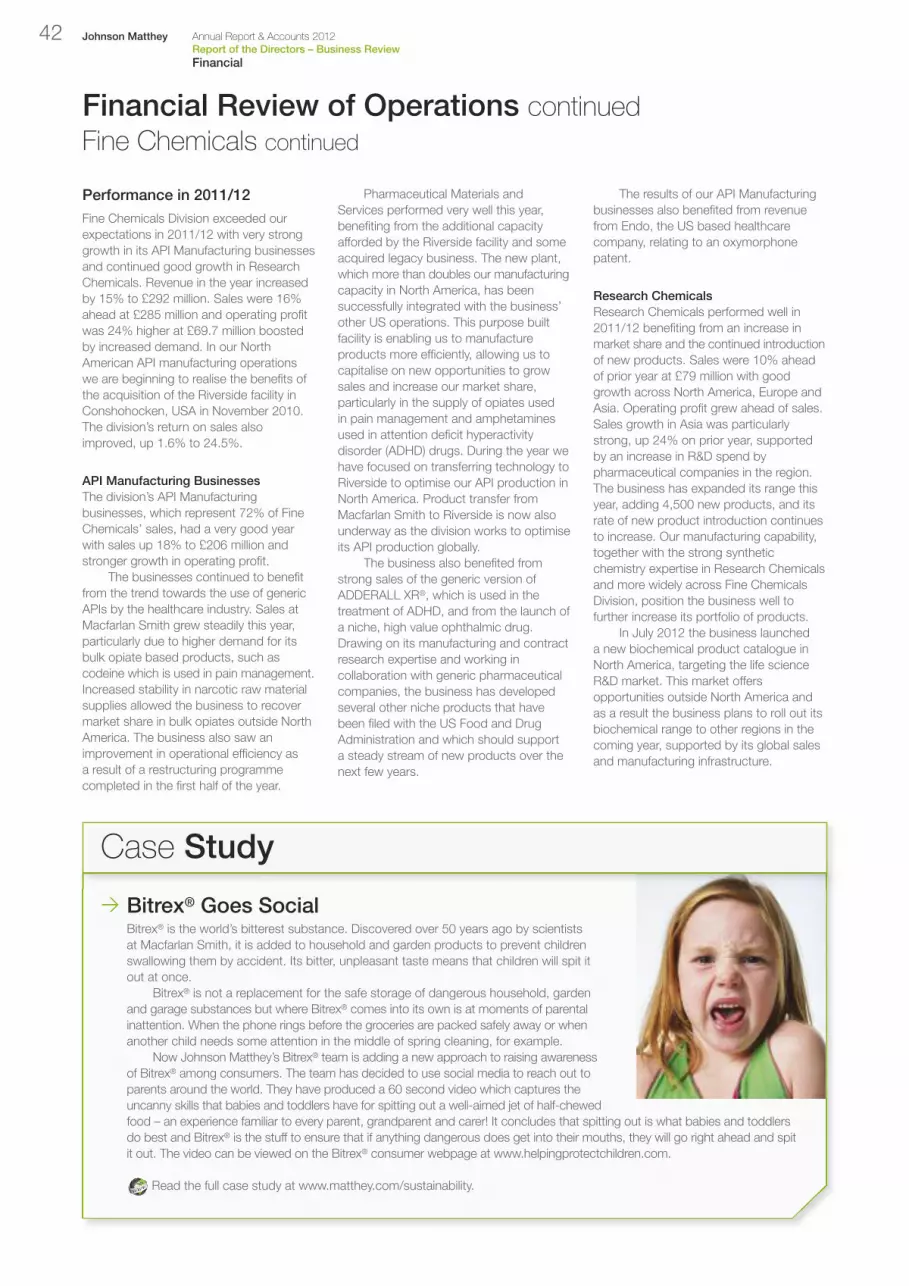
Performance in 2011/12
Fine Chemicals Division exceeded ourexpectations in 2011/12 with very stronggrowth in its API Manufacturing businessesand continued good growth in ResearchChemicals. Revenue in the year increasedby 15% to £292 million. Sales were 16%ahead at £285 million and operating profitwas 24% higher at £69.7 million boostedby increased demand. In our NorthAmerican API manufacturing operationswe are beginning to realise the benefits ofthe acquisition of the Riverside facility inConshohocken, USA in November 2010.The division’s return on sales alsoimproved, up 1.6% to 24.5%.
API Manufacturing BusinessesThe division’s API Manufacturingbusinesses, which represent 72% of FineChemicals’ sales, had a very good yearwith sales up 18% to £206 million andstronger growth in operating profit.
The businesses continued to benefitfrom the trend towards the use of genericAPIs by the healthcare industry. Sales atMacfarlan Smith grew steadily this year,particularly due to higher demand for itsbulk opiate based products, such ascodeine which is used in pain management.Increased stability in narcotic raw materialsupplies allowed the business to recovermarket share in bulk opiates outside NorthAmerica. The business also saw animprovement in operational efficiency asa result of a restructuring programmecompleted in the first half of the year.
Pharmaceutical Materials andServices performed very well this year,benefiting from the additional capacityafforded by the Riverside facility and someacquired legacy business. The new plant,which more than doubles our manufacturingcapacity in North America, has beensuccessfully integrated with the business’other US operations. This purpose builtfacility is enabling us to manufactureproducts more efficiently, allowing us tocapitalise on new opportunities to growsales and increase our market share,particularly in the supply of opiates used in pain management and amphetaminesused in attention deficit hyperactivitydisorder (ADHD) drugs. During the year wehave focused on transferring technology toRiverside to optimise our API production inNorth America. Product transfer fromMacfarlan Smith to Riverside is now alsounderway as the division works to optimiseits API production globally.
The business also benefited fromstrong sales of the generic version ofADDERALL XR®, which is used in thetreatment of ADHD, and from the launch ofa niche, high value ophthalmic drug.Drawing on its manufacturing and contractresearch expertise and working incollaboration with generic pharmaceuticalcompanies, the business has developedseveral other niche products that havebeen filed with the US Food and DrugAdministration and which should supporta steady stream of new products over thenext few years.
The results of our API Manufacturingbusinesses also benefited from revenuefrom Endo, the US based healthcarecompany, relating to an oxymorphonepatent.
Research ChemicalsResearch Chemicals performed well in2011/12 benefiting from an increase inmarket share and the continued introductionof new products. Sales were 10% aheadof prior year at £79 million with goodgrowth across North America, Europe andAsia. Operating profit grew ahead of sales.Sales growth in Asia was particularlystrong, up 24% on prior year, supportedby an increase in R&D spend bypharmaceutical companies in the region.The business has expanded its range thisyear, adding 4,500 new products, and itsrate of new product introduction continuesto increase. Our manufacturing capability,together with the strong syntheticchemistry expertise in Research Chemicalsand more widely across Fine ChemicalsDivision, position the business well tofurther increase its portfolio of products.
In July 2012 the business launcheda new biochemical product catalogue inNorth America, targeting the life scienceR&D market. This market offersopportunities outside North America andas a result the business plans to roll out itsbiochemical range to other regions in thecoming year, supported by its global salesand manufacturing infrastructure.
Johnson Matthey Annual Report & Accounts 2012Report of the Directors – Business ReviewFinancial
42
Financial Review of Operations continuedFine Chemicals continued
> Bitrex® Goes SocialBitrex® is the world’s bitterest substance. Discovered over 50 years ago by scientistsat Macfarlan Smith, it is added to household and garden products to prevent childrenswallowing them by accident. Its bitter, unpleasant taste means that children will spit itout at once.
Bitrex® is not a replacement for the safe storage of dangerous household, gardenand garage substances but where Bitrex® comes into its own is at moments of parentalinattention. When the phone rings before the groceries are packed safely away or whenanother child needs some attention in the middle of spring cleaning, for example.
Now Johnson Matthey’s Bitrex® team is adding a new approach to raising awarenessof Bitrex® among consumers. The team has decided to use social media to reach out to parents around the world. They have produced a 60 second video which captures the uncanny skills that babies and toddlers have for spitting out a well-aimed jet of half-chewed food – an experience familiar to every parent, grandparent and carer! It concludes that spitting out is what babies and toddlersdo best and Bitrex® is the stuff to ensure that if anything dangerous does get into their mouths, they will go right ahead and spitit out. The video can be viewed on the Bitrex® consumer webpage at www.helpingprotectchildren.com.
Read the full case study at www.matthey.com/sustainability.
Case Study

43
Profit Before Tax
The group’s underlying profit before tax increased by 23% to £426.0 million (2010/11 £345.5 million). Profit before tax was 58% higher at£409.3 million (2010/11 restated £259.3 million). Items excluded from underlying profit were:
• amortisation of acquired intangibles of £16.7 million. This was £2.2 million higher than 2010/11 mainly due to a full year impact of theacquisition of the Additives business (formerly Intercat) made in November 2010; and
• in 2010/11, an impairment and restructuring charge of £71.8 million in respect of the closure of ECT’s manufacturing facility in Brusselsand the Vertec business.
Exchange Rates
The main impact of exchange rate movements on the group’s results comes from the translation of foreign subsidiaries’ profit into sterlingas the group does not hedge the impact on the income statement or balance sheet of these translation effects. The group’s underlyingoperating profit at constant exchange rates is shown in the table below:
Financial Review
Robert MacLeodGroup Finance Director
Underlying Profit Reconciliation Year to 31st March 2012 Year to 31st March 2011 Profit Income Profit from Profit Income Profit from before tax continuing before tax continuing tax expense operations tax expense operations restated restated restated £ million £ million £ million £ million £ million £ million
Underlying basis 426.0 (100.0) 326.0 345.5 (91.7) 253.8Amortisation of acquired intangibles (16.7) 6.1 (10.6) (14.5) 4.6 (9.9)Major impairment / restructuring:Closure of autocatalyst facility in Brussels – – – (57.0) 8.1 (48.9)Closure of Vertec business – – – (14.8) 3.5 (11.3)Dissolution of associate – – – 0.1 – 0.1
Reported basis 409.3 (93.9) 315.4 259.3 (75.5) 183.8
Underlying Operating Profit 2011 at 2012 Year to 31st March exchange 2012 2011 % rates % £ million £ million change £ million change
Environmental Technologies 211.8 164.7 +29 163.8 +29Precious Metal Products 200.8 172.9 +16 172.7 +16Fine Chemicals 69.7 56.2 +24 55.5 +26Corporate (32.2) (27.6) (27.5)
Total group 450.1 366.2 +23 364.5 +23
During the year, sterling strengthened slightly against the US dollar but weakened slightly against the Chinese renminbi and the euro.Together these decreased reported group underlying operating profit for the year by £1.0 million.
“In 2011/12 the group’sunderlying profit beforetax increased by 23%to £426.0 million.”

Of the group’s underlying operating profit that is denominatedin overseas currencies the average exchange rates during 2011/12were:
Going forward, each one cent change in the averageUS dollar exchange rate and each one cent change in the euroexchange rate have approximately a £0.9 million and £0.6 millioneffect respectively on underlying operating profit in a full year.
Return on Sales
The group’s return on sales increased from 16.1% to 16.8% asthe group benefited from higher returns across all the divisions,as described on pages 26 to 42.
Return on Invested Capital
For the second consecutive year, the group’s return on investedcapital (ROIC) improved significantly, from 19.4% to 22.3%.Underlying operating profit was £83.9 million higher than last yearat £450.1 million and average invested capital was £131 millionhigher at £2,015 million. At 22.3%, the group’s ROIC is well aheadof our pre-tax cost of capital, which we estimate to be 11.2%.
Our target for several years has been to achieve a group ROICabove 20% on a pre-tax basis. This year we have achieved this goal.
Looking forward, whilst we will seek to continually improvethe group’s returns, we will not do this at the expense of the longterm future of the group. We will continue to invest in capitalexpenditure in our businesses across the world and in research anddevelopment. Therefore, whilst further improvements in the group’sROIC may be possible, our objective is to maintain the group’sROIC at a minimum of 20%.
Interest
The group’s net finance costs increased by £3.4 million to£24.1 million as a result of higher precious metal borrowing costs.
Approximately 73% of the group’s net debt at 31st March2012 has fixed interest rates averaging approximately 4.9%.
Taxation
The group’s total tax charge for the year was £93.9 million, a taxrate of 22.9% on profit before tax (2010/11 restated 29.1%).
The effective tax rate on underlying profit before tax reducedfrom 26.5% last year to 23.5%. This reduction was due to theresolution of certain open years’ tax positions, a reduction in theheadline rate of corporation tax in the UK and other factors.
A substantial proportion of the group’s operating profit isearned in countries other than the UK. However, for tax purposesthe parent company, which is UK tax resident, charges overseaslegal entities for the use of patents, know how and technologiesdeveloped in the group’s UK R&D centres, in addition to chargingoverseas subsidiary companies for the cost of UK basedmanagement and UK provided finance. These charges arerequired under UK transfer pricing legislation. As a result of thesecharges, the amount of the group’s profit that is subject to UKcorporation tax is particularly pronounced. The group has thereforematerially benefited from the reduction in the headline UKcorporation tax rate from 28% for the year ended 31st March 2011to 24% for the year ending 31st March 2013.
In addition, further planned reductions in the headline UKcorporation tax rate to 22% for accounting periods beginning onor after 1st April 2014, the proposal announced by the UKgovernment to reduce the corporation tax charged on profit earnedfrom qualifying patented technologies to 10% and the proposedfavourable changes to the UK Controlled Foreign Companies taxlegislation, both effective for the year ending 31st March 2014,should help to reduce the group’s effective tax rate further.However, the UK government’s proposal to introduce an ‘abovethe line’ R&D credit regime with effect from 1st April 2013 willincrease the group’s reported effective tax rate on underlying profit.Going forward, the rate should nevertheless be at least 2% lowerthan the headline rate for UK corporation tax.
Johnson Matthey Annual Report & Accounts 2012Report of the Directors – Business ReviewFinancial
44
Share of2011/12
non-sterlingdenominated
underlying Average exchange rateoperating profit 2011/12 2010/11
US dollar 49% 1.597 1.555Euro 25% 1.160 1.176Chinese renminbi 8% 10.21 10.43
Return on Invested CapitalAverage Return on
invested capital1 invested capital2
2012 2011restated 2012 2011
£ million £ million % %
Environmental Technologies 1,492 1,434 14.2 11.5Precious Metal Products 341 309 58.9 55.9Fine Chemicals 418 409 16.7 13.7Corporate / other (236) (268) n/a n/a
Total group 2,015 1,884 22.3 19.4
1 Average of opening and closing segmental net assets as shown in note 1 on theaccounts on pages 131 and 132. For the group, the average of opening and closing equity plus net debt.
2 Underlying operating profit divided by average invested capital.
Return on SalesSales excludingprecious metals Return on sales1
2012 2011 2012 2011£ million £ million % %
Environmental Technologies 1,876 1,566 11.3 10.5Precious Metal Products 582 541 34.5 31.9Fine Chemicals 285 245 24.5 22.9Less inter-segment sales (64) (72) n/a n/a
Total group 2,679 2,280 16.8 16.1
1 Underlying operating profit divided by sales excluding precious metals.
Financial Review continued

45
Tax StrategyIn 2011/12, Johnson Matthey had operations in over 30 countriesacross the world. For each country in which we have operations,we organise our operations to pay the correct and appropriateamount of tax at the right time according to the laws of the relevantcountry and ensure compliance with the group’s tax policies andguidelines. The group’s tax strategy is annually reviewed andendorsed by the board. This strategy is executed by a global teamof tax professionals, assisted by external advisers where appropriate.
Our tax strategy covers the application of all taxes, both directand indirect, to our business including corporation tax, payrolltaxes, value added tax and customs duties. The tax strategy alsocovers our approach to any tax planning required by the businessand key policy areas such as transfer pricing.
Earnings per Share
The growth in the group’s underlying earnings per share of 29%to 153.7 pence benefits both from growth in the business and thelower effective tax rate. Total earnings per share were 148.7 pence,75% up on last year.
Dividend
If the proposed final dividend of 40.0 pence per share is approved,the group’s dividend for the full year will be 55.0 pence (2010/1146.0 pence). At this level, the dividend would be covered 2.8 timesby underlying earnings per share.
This year, the board is also recommending a special dividendof 100.0 pence per share following a review of the group’s capitalstructure, as detailed on page 46.
Pensions
IFRS – Accounting BasisAt 31st March 2012 the group’s principal defined benefit pensionscheme in the UK was in deficit by £84.8 million (92% funded)on an IFRS basis compared with a deficit of £60.6 million at31st March 2011. The £24.2 million increase in the deficit wasprincipally due to a decrease in the discount rate used to value thescheme’s liabilities. Worldwide, the group has other similar definedbenefit pension arrangements, some of which are in deficit (totaldeficit £45.9 million) and others which are in surplus (total surplus£2.0 million).
Worldwide, including provisions for the group’s post-retirementhealthcare schemes, the group had a net deficit of £169.4 millionon employee benefit obligations at 31st March 2012 (2011£130.4 million).
The impact of the higher deficit and lower discount rate isexpected to increase the accounting charge for pensions in2012/13 compared with 2011/12 by more than £10 million.
Actuarial – Funding BasisIn 2010/11 the company commenced deficit funding contributionsto the UK scheme under a ten year recovery plan agreed with theTrustees following the 2009 actuarial valuation. During the year thecompany made deficit funding payments of £23.1 million to thescheme. The group’s normal ongoing contribution to the UKscheme in 2011/12 was £21.6 million (2010/11 £22.0 million),making total cash contributions to the scheme in the year of £44.7 million.
The latest actuarial valuation of the UK scheme, effectiveas at 1st April 2012, is underway. The previous actuarial valuation,as at 1st April 2009, estimated that the scheme deficit was£173 million. The results of this latest actuarial valuation are notexpected to be available until later this year, however it is anticipatedthat the scheme’s deficit will have increased further despite thedeficit funding contributions made since 2009. This increase iscaused by a reduction in gilt yields that are used to value thescheme’s liabilities. Once the results of the latest valuation areavailable, the company will enter into discussions with thescheme’s Trustees to agree a revised deficit recovery plan. Thismay require the company to increase and / or extend the level ofcash contributions.
In addition to the expected increase in the scheme’s actuarialdeficit, the cash cost of providing the ongoing benefits to existingmembers is likely to increase substantially. As a result, the companyis reviewing its options for future pension provision in the UK.
The group operates other defined benefit pension schemes forsome overseas employees. Certain of these schemes also haveactuarial deficits which require additional cash contributions andwhere the ongoing costs associated with future pension provisionis also increasing. The group intends to review those pensionarrangements in due course.
The company continues to work with the fiduciary committeesand trustee boards of each of its pension schemes worldwide toensure an appropriate investment strategy is in place, which includesde-risking the schemes as funding levels improve. Currently, 52%of the group’s total pension assets are held in government orcorporate bonds.
Capital Expenditure
Capital expenditure was £149.6 million (of which £150.7 million wascash spent in the year) which equated to 1.2 times depreciation. Inthe year, £97.1 million, or 65%, was incurred by EnvironmentalTechnologies Division with the principal investments being to add afurther autocatalyst line in China, to increase our heavy duty dieselcatalyst manufacturing capacity in Europe and China and tocontinue the investment started last year in new manufacturingplants in the UK and India to make process catalysts for ourAmmonia, Methanol, Oil and Gas business.
The long term outlook for the group remains robust and thereare good opportunities for growth. To access these opportunitieswe anticipate that capital expenditure will rise substantially during2012/13, to around £230 million, and will be in the range of 1.5 to1.7 times depreciation for the next few years. Depreciation, whichwas £126.1 million in 2011/12 (2010/11 £123.2 million), will rise asa consequence of this increased investment to around £135 millionin 2012/13 and then further, to around £160 million, by 2014/15.
Cash Flow
During the year ended 31st March 2012 net cash flow from operatingactivities was £464.4 million (2010/11 restated £122.9 million).The demand for our products grew but towards the end of the yearprecious metal prices dropped due to concerns about the globaleconomy. Working capital, excluding the element that relates toprecious metals, increased by £41.5 million, which represented54 days of sales, down from last year’s 60 days. Working capitalin respect of precious metals decreased by £60.9 million primarilydue to the lower precious metal prices towards the end of the year.
The group’s free cash flow was an inflow of £299.4 million(2010/11 restated an outflow of £26.5 million).

Financial Review continued
Johnson Matthey Annual Report & Accounts 2012Report of the Directors – Business ReviewFinancial
46
Capital Structure
In the year ended 31st March 2012 net debt fell by £185.2 millionto £454.2 million and the group’s EBITDA (on an underlying basis)rose by 18% to £576.2 million (2010/11 £489.4 million). Net debt /EBITDA for the year was 0.8 times but if post tax pension deficitsof £97.0 million are included within net debt, the ratio wouldincrease to 1.0 times. Interest cover (underlying operating profit /net finance costs) was 18.7 times (2010/11 17.7 times).
Over the last few years, the group has performed very well,substantially growing underlying profit despite considerable capitalexpenditure and increased investment in research and development.The group’s cash generation has also been strong.
As a result of this strong performance the board has carriedout a review of the group’s balance sheet structure. The outlookfor the group remains strong and we believe that it has ampleresources to fund forecast capital expenditure and a furtherincrease in research and development. The board is, therefore,recommending a special dividend to shareholders of 100.0 penceper share, which represents a total payment of approximately£212 million. The special dividend will be accompanied by a share consolidation. The consolidation factor will be announced to shareholders in the annual general meeting circular on 20th June 2012.
In order to enable the group’s objective of delivering long termgrowth to its shareholders, it is imperative that the company hassufficient funds to invest in capital expenditure, research anddevelopment and appropriate acquisitions whilst at the same timemaintaining a balance sheet structure that safeguards the group’sfinancial strength through economic cycles.
The group is subject to potentially large working capitalswings as business activity changes. In particular, EmissionControl Technologies has a substantial working capital requirementas business activity increases. These swings can be accentuatedby volatility in precious metal prices. As a result of these factors, itis appropriate to run the business with a modest amount of debt.We believe that a net debt (including post tax pension deficits) toEBITDA ratio of around 1.5 to 2.0 times is appropriate for thegroup over the longer term.
If the special dividend is approved by shareholders, the netdebt (including post tax pension deficits) to EBITDA ratio for theyear ended 31st March 2012 would have been, on a pro formabasis, 1.3 times. The company will also, as required, havediscussions with the UK pension scheme’s Trustees regarding thisreturn of capital as part of the current actuarial valuation.
Borrowings31st March 2012 31st March 2011
£ million % £ million %
Five to ten years 83.5 14 181.0 24Two to five years 218.9 37 330.4 44One to two years 198.7 33 40.6 5Within one year 92.2 16 206.3 27
Gross borrowings(net of swaps) 593.3 100 758.3 100Less: cash and deposits 139.1 118.9
Net debt 454.2 639.4

Financial Risk Management andTreasury Policies
The group uses financial instruments, inparticular forward currency contracts andcurrency swaps, to manage the financialrisks associated with its underlying businessactivities and the financing of thoseactivities. The group does not undertakeany speculative trading activity in financialinstruments. Our treasury department isrun as a service centre rather than a profitcentre.
Interest Rate Risk
At 31st March 2012 the group had netborrowings of £454.2 million. Some 73%of this debt was at fixed rates with anaverage interest rate of 4.9%. The remaining27% of the group’s net borrowings wasfunded on a floating rate basis. A 1%change in all interest rates would have a0.3% impact on underlying profit beforetax. This is within the range the boardregards as acceptable.
Treasury Policies
Foreign Currency Risk
Johnson Matthey’s operations are locatedin over 30 countries, providing globalcoverage. The significant amount of itsprofit is earned outside the UK. In order toprotect the group’s sterling balance sheetand reduce cash flow risk the group hasfinanced most of its investment in the USAand Europe by borrowing US dollars andeuros respectively. Although much of thisfunding is obtained by directly borrowingthe relevant currency, a part is achievedthrough currency swaps which can be moreefficient and reduce costs. To a lesser extentthe group has also financed a portion of itsinvestment in China, Japan and SouthAfrica using currency borrowings andswaps. The group uses forward exchangecontracts to hedge foreign exchangeexposures arising on forecast receipts andpayments in foreign currencies. Currencyoptions are occasionally used to hedgeforeign exchange exposures, usually in abid situation. Details of the contractsoutstanding on 31st March 2012 areshown on page 155.
Precious Metal Prices
Fluctuations in precious metal prices canhave a significant impact on JohnsonMatthey’s financial results. Our policy forall manufacturing businesses is to limit thisexposure by hedging against future pricechanges where such hedging can be doneat acceptable cost. The group does nottake material exposures on metal trading.
All the group’s stocks of gold andsilver are fully hedged by leasing or forwardsales. Currently the majority of the group’splatinum stocks are unhedged because ofthe lack of liquidity in the platinum market.
The group’s policy on funding capacity isto ensure that we always have sufficientlong term funding and committed bankfacilities in place to meet foreseeable peakborrowing requirements. At 31st March2012 the group had cash and deposits of£139.1 million and £312.1 million ofundrawn committed bank facilities availableto meet future funding requirements. Thegroup also has a number of uncommittedfacilities, including overdrafts and metallease lines, at its disposal.
Gross borrowings (net of related swaps)of £593.3 million at 31st March 2012included £539.1 million of debt arrangedunder long term bond issues and long termfunding from the European InvestmentBank (EIB). Of this, only £40.0 million fallsdue to be repaid in the 15 months to30th June 2013 (the going concern period).The group’s committed bank facilities havea range of maturities with £191.3 millionexpiring after 30th June 2013. The maturitydates of the group’s debt and borrowingfacilities are illustrated in the table on page46 and the chart to the right. In the contextof our policy on funding capacity, to takeaccount of the proposed special dividendof approximately £212 million, we are inthe process of arranging additional longterm financing arrangements.
Liquidity and Going Concern
Maturity Profile of Debt FacilitiesAt 31st March 2012 exchange rates£ million
The directors have assessed thefuture funding requirements of the groupand the company and compared it to thelevel of long term debt and committed bankfacilities for the 15 months from thebalance sheet date. The assessmentincluded a sensitivity analysis on the keyfactors which could affect future cash flow
and funding requirements. Havingundertaken this work the directors are ofthe opinion that the group has adequateresources to fund its operations for theforeseeable future and so determine that itis appropriate to prepare the accounts ona going concern basis.
47
March2012
March2013
March2014
March2015
March2016
March2017
March2018
March2019
March2020
March2021
0
100
200
300
600
500
800
700
900
400
EIB loans
Bonds
Bank facilities
Net debt at 31st March 2012

Johnson Matthey Annual Report & Accounts 2012Report of the Directors – Business ReviewSocial
48
Investing inour peopleand ourcommunitiesaround theworld

Contents
50 Performance Summary 50 Stakeholder Engagement 52 Building a Sustainable Workforce 56 Community Investment 58 Social Aims and Targets
SocialThis section highlights initiatives involving our people, our communities and other stakeholder groups. It also containsperformance data relating to employees and community investment.
> Growing Our PeopleIt is Johnson Matthey’s people that make thecompany successful and it is their knowledge,expertise and contributions that drive thebusiness forward.
Developing our employees and providingan environment which motivates them tocontribute and stay with the company isfundamental to the group’s long termperformance. At Johnson Matthey we aimto provide interesting and challenging jobs togrow our people personally and professionallyin a supportive culture where everyone isencouraged to reach their full potential.
Our learning and development strategyhas always included a balance of workplacebased experience, personal developmentsupport and feedback, as well as morestructured training programmes to buildemployees’ skills and encourage collaborationand networking with their colleagues acrossthe group.
During 2011/12 we have introduceda number of new global and regionalprogrammes aimed at introducing newgraduates to the business, developing ourmanufacturing personnel and buildingleadership capacity in our major regions.We are continuing to refresh and expandour people development activities on a globalbasis to support future growth and theincreasing global reach of our business.
. Students from a local school visit Johnson Matthey’s platinumgroup metals refinery in Brimsdown, UK.
. Children in India participate in ‘Healthy Body Healthy Mind’,a programme sponsored by Johnson Matthey and whichis run by the charity Peace Child India.
Delivering Value

Stakeholder Engagement
Johnson Matthey has a wide range ofstakeholders with an interest in hearingfrom or working with the company at botha corporate and business level. Ourstakeholders include any person ororganisation that may interact with, orhave an interest in, Johnson Matthey andinclude customers, employees and theirrepresentatives, suppliers, fund managers,shareholders, communities, governments,non-governmental organisations (NGOs)and national and international tradeassociations. The company is alsoengaged with national and localgovernment to inform the developmentof policy in areas where our technologyand products can play a pivotal role.Johnson Matthey meets regularly with itsmajor shareholders, as described in theCorporate Governance Report on pages98 and 99, to discuss the performanceand development of the group’s businesses,including matters relating to sustainabilityand corporate social responsibility.
We aim to provide meaningful andtransparent communications to meet theneeds of all stakeholder groups and deliverinformation to them in the most appropriateformat. These formats may include annualperformance reports, participation inperformance indices (Carbon DisclosureProject, FTSE4Good, for example) or oneto one discussions on specific topics. InMarch 2012 the company launched itsnew corporate website. The site has beendeveloped to provide more in depthinformation for all stakeholder groups withenhanced navigation to enable users tofind the information they need morequickly. We communicate with ourstakeholders throughout the year andengagement is integrated into our businessdecision making processes. This 360 degreedialogue is essential in providing all partieswith a rounded view of all material issuesand helps all to shape their actions andstrategies to move forward on thesematters. For further details on ourstakeholder engagement activities, includinga stakeholder map, visit the company’swebsite at www.matthey.com/sustainability.
Developments in 2011/12We have continued to see evidence thisyear of the increasing importance ofgovernance matters in our supply chainsand have completed a number ofquestionnaires received from ourcustomers and suppliers regarding ourenvironmental, social and ethical practices.
We remain actively involved with thekey trade associations and industryorganisations that are connected with ourbusiness activities as an effective way ofunderstanding, shaping, participating andcontributing to a range of discussion areasrelevant to the company’s stakeholders,and those of the broader industry andmarket sectors in which we operate.
Our involvement and discussionsmay cover areas such as climate change,emerging regulation, legislation, health andsafety, standards and guidance. Emergingissues that may have a material impact onour industry sectors are also carefullyconsidered. Examples of our involvementare illustrated in the following case studies.
2012 2011
Average number of employees 9,914 9,388
Total employee turnover1 % 11.7 8.5
Voluntary employee turnover1 % 6.4 5.6
Employee gender (female)2 % 22 22
Gender of new recruits (female) % 25 23
Trade union representation % 35 38
Training days per employee 3.1 2.6
Training spend per employee3 £ 335 390
Internal promotions % of all recruitment in year 35 33
Attendance days lost per employee 5.0 5.2
Charitable donations £ thousands 645 517
1 Employee turnover is calculated by reference to the total number of leavers during the year expressed as a percentage of the average number of people employed during theyear. The analysis does not include agency workers not directly employed by Johnson Matthey.
2 At 31st March.
3 Training spend does not include the cost of in house training or the cost of employees’ wages during training.
Social
Johnson Matthey Annual Report & Accounts 2012Report of the Directors – Business ReviewSocial
50
Performance Summary
In Johnson Matthey there is a strong tradition of looking after our employees, of goodcommunity relations and of interaction with and responsiveness towards our stakeholders.We recognise that in order to operate in a socially sustainable manner, our actions andour policies must be focused on the long term benefits to employees, suppliers, customers,communities and other stakeholders.
> Read more on our social policies in the Governance section on pages 79 to 81.
Visit our website for full details of our social activities and policies at www.matthey.com.

51
Stakeholder Engagement in Action
> The International PlatinumGroup Metals AssociationJohnson Matthey has continued its work with theInternational Platinum Group Metals Association (IPA)whose membership comprises major primaryplatinum group metal (pgm) mining companies andfabricators accounting for some 80% of annualpgm supply. The IPA is engaged in developing asustainability strategy for the pgm industry andJohnson Matthey leads its sub-committee responsiblefor achieving sustainability strategy outcomes.
During the last 12 months we have helpedthe IPA to develop a programme for a life cycleinventory study which aims to measure theenvironmental burdens and benefits of producingand using platinum group metals. The study isprojected to cover the entire life cycle of the metalsfrom primary extraction through refining, fabrication,use and recycling. It is intended to be used for theinternal benchmarking of the environmentalperformance of the pgm industry.
Case Study
Stakeholder Engagement in Action
> Pgm Health ScienceResearch GroupIn response to interest from our stakeholders andas part of our voluntary product responsible careefforts, Johnson Matthey has continued to fund andparticipate in the Pgm Health Science ResearchGroup (HSRG), an industry sector organisationwhich aims to improve the quality of existing riskassessments for the pgms and their applications,for example in autocatalysts. During the yearHSRG’s research programmes have delivered newinformation relevant to risk assessments and in theinterests of transparency, these findings continueto be published in appropriate peer reviewedscience journals.
Case Study
Stakeholder Engagement in Action
> The Chemical IndustriesAssociationJohnson Matthey is a member of the UK ChemicalIndustries Association (CIA) and a number of oursenior managers and specialist advisers participatein CIA networks and working groups. Following thedevelopment last year of the CIA sustainable healthmetrics indicator tool, which was piloted globally inJohnson Matthey and has been integrated into ourhealth improvement programmes, the CIA has nowpublished the final version of the scorecard. It hasbeen made available to member companies throughlaunch events and the CIA has plans to roll it outto a wider audience for more general use by thechemical and other industries. The scorecardunderpins the leading metrics for the UK CIA’ssustainable development goals set in 2010 for 2020.It will allow the CIA to identify whether membercompanies have the correct level of healthprogrammes in place and track / encourage furtherimprovement.
We have also continued to support the CIA’sResponsible Care® programme as a peer reviewerto verify other member companies.
Case Study
Stakeholder Engagement in Action
> The Prince of Wales’sCorporate Leaders Groupon Climate ChangeJohnson Matthey is a founder member of the Princeof Wales’s Corporate Leaders Group (UK CLG) onClimate Change, working closely on climate changeissues with 17 other leading UK businesses. UKCLG members share our belief that there needs tobe clear, ambitious and long term policies in placein order to mitigate the effects of climate change.As a member of the UK CLG we helped to shapethe influential Copenhagen Communiqué whichhas now been signed by almost 1,000 companiesaround the world. In June 2011 the UK CLGpublished ‘Seize the Day’, a new report intogovernment policy, that calls for stronger action onclimate leadership. In May 2012 it launched ‘Downto Zero’, a collaboration with UK government’sDepartment for Business, Innovation and Skills, thatwill bring public and private companies together inprocurement compacts to deliver progressivelylower carbon goods and services into the market.
Case Study

Building a Sustainable Workforce
Recruiting the right people, developingthem and providing an environment whichmotivates them to contribute and stay withthe company is fundamental to the group’slong term performance. At JohnsonMatthey, our employees are respected asthe group’s most valuable resource andplay a vital role in building a sustainablebusiness. Their skills, qualities andwellbeing underpin the company’ssuccess.
We recognise that our people andculture are a particular strength and,although the culture of an organisation isnot easy to define, there is a distinctiveculture in Johnson Matthey, irrespective ofdivision, business, function or geographiclocation. Capturing and drawing on thestrengths of our culture will support thegroup’s future growth, particularly as itcontinues to expand globally. During theyear work commenced to better articulateour company values and explore how theycan be best used to develop and grow ourbusiness and our people.
Social continued
Recruitment and RetentionJohnson Matthey has effective recruitmentprocesses to support the regularrequirement for high calibre employees.Increasingly, we are recruiting graduatesand qualified employees from beyond ourtraditional bases in Europe and NorthAmerica as we continue to develop a moreinternationally diverse workforce to supportour global business.
Recruiting well qualified staff is vital tosupport business development, particularlyin new and emerging markets such as inAsia, and this is achieved by appropriatemanpower planning, local recruitment andthe encouragement of international andcross divisional mobility. It is the group’spolicy to promote from within whereverpossible and in 2011/12 35% of vacancieswere filled by internal candidates, supportingthe retention of employees and developingtheir careers.
During the year we have improvedour online global recruitment systemsfor external candidates, including the launchof a new application management systemfor recruitment into our UK businesses.
We have also reviewed the careers sectionof the company’s website and continue todevelop it with a focus on increasingawareness of the company and candidateattraction. There are also plans to expandour activities via key social media channelsto further support our global recruitmentactivities.
The average number of employeeshas increased by 6% this year withcontinued growth in average employeenumbers in Asia (up 11%) and a 9%increase in North America. As illustratedin the pie chart below, EnvironmentalTechnologies remains the group’s largestdivision with over 50% of employees. In2011/12, average employee numbersincreased across all divisions.
Johnson Matthey Annual Report & Accounts 2012Report of the Directors – Business ReviewSocial
52
> Employer of Choice in MalaysiaWhat do Apple Days, teddy bear sales and the acquisition of new work skillshave in common? The answer, from the Emission Control Technologies siteat Nilai, Malaysia is that these are all elements in its community, welfare andtraining activities. The site’s proactive approach to community participation,together with its employee health and training programmes, have earned it theEmployer of Choice 2011 award. The awards were organised by theMalaysian Institute of Human Resources and Jobstreet.
Initiatives at the site have included donations of old office furnitureto a school in a disadvantaged area and teddy bears to a local hospital.Programmes to support employees’ wellbeing and development are equallyprominent. Activities related to healthier lifestyles include a health monitoring programme and ‘Apple Days’ which are heldtwice a week to promote healthy eating. A large capital investment project is underway at the Nilai site and as the day to dayjobs of employees change, training will be given to enable them to develop their skill sets.
This mix of community involvement, concern for employee health and wellbeing and training to meet the needs of achanging industry makes Johnson Matthey an employer of choice in Malaysia.
� Read the full case study at www.matthey.com/sustainability.
Case Study
EnvironmentalTechnologies
5,568
Precious MetalProducts
2,847
Fine Chemicals1,089
Corporate410
Total Employees by DivisionAverage headcount for 2011/12

Maintaining the quality of our employeerelations is a priority for the company andJohnson Matthey is proud of the high levelof commitment and loyalty from its people.We have a low voluntary staff turnover,6.4% in 2011/12 (2010/11 5.6%), withmany employees staying with the companyfor their whole careers. Total employeeturnover increased this year from 8.5%to 11.7% as a result of the closure of oursite in Brussels, redundancy programmesin South Korea and more proactiveperformance management in a numberof other countries. The table below setsout employee turnover in 2011/12 bygeographical region. The employee turnoverfigure is calculated by reference to thetotal number of leavers during the yearexpressed as a percentage of the averagenumber of people employed during theyear. The analysis does not include agencyworkers not directly employed by JohnsonMatthey.
The group’s employee turnover overthe past five years is illustrated in the graphbelow and shows that voluntary employeeturnover has remained steady.
Good performance in attendance rateswas maintained this year. The averagenumber of days lost per employee in2011/12 due to sickness absence was5.0 days (2010/11 5.2 days). This represents2.0% of lost time per employee in theworking year, a slight improvement on lastyear. We continue to invest in sustainablehealth and wellness programmes to supportthe longer term health, wellbeing andperformance of our employees.
Training and DevelopmentThe knowledge, expertise andcontributions of our employees is whatdrives the business forward and as aresult, employee development is a keyelement of Johnson Matthey’s strategy forfuture growth. We offer training anddevelopment programmes at careerfoundation and management levels whichseek to offer a broad understanding of thegroup’s businesses, give a strong base inthe company’s strategy, culture and ethicsand provide direct contact and networkingopportunities with peers and seniormanagers across international boundaries.Our programmes are aimed at developingour talented people, encouragingcommitment to the company and buildinghigh level skills and competences.
53
> Encouraging our Future ScientistsMany Johnson Matthey sites have educational links with their localcommunities. The Future Scientist Programme, developed by employees atJohnson Matthey’s Billingham site in the north east of England has firmlygrasped the issue of awakening pupil interest at an early stage in their secondaryeducation to help direct children with talent towards a career in science.
The programme builds on the site’s ten years’ of experience workingwith primary school children and takes the form of three lessons, including apractical session, all given by Johnson Matthey employees.
In all, 360 children at St Michael’s, the local secondary school, have so farparticipated in the programme, with 12 teachers involved in the codevelopmentand implementation. The feedback from pupils and teachers has been extremelypositive. As one of the youngsters said, “I had not thought about a job in industry before, but I am now.”
Following on from the launch, a group from the Future Scientist Programme visited the House of Commons in the UK inJanuary 2012 to explain the initiative and gain wider support for the programme amid an audience of industry professionals,Members of Parliament and government representatives.
Read the full case study at www.matthey.com/sustainability.
Case Study
Average Number of People EmployedAverage headcount 2011/12
TemporaryPermanent contract
Region employees employees Total
Europe 4,868 174 5,042North America 2,839 13 2,852Asia 1,344 63 1,407Rest of World 611 2 613
Total group 9,662 252 9,914
Annual Change in People EmployedNet change between 31st March 2011and 31st March 2012
TemporaryPermanent contract Total net
Region employees employees change
Europe +145 +10 +155North America +271 -29 +242Asia +107 +28 +135Rest of World -8 +2 -6
Total group +515 +11 +526
Employee Turnover by Region2011/12
VoluntaryTotal Employee employee
Region leavers turnover turnover
Europe 592 12.2% 4.8%North America 226 8.0% 4.7%Asia 243 18.1% 14.9%Rest of World 65 10.6% 8.5%
Total group 1,126 11.7% 6.4%20071 20092 20102 20112 20122
Total Employee Turnover
Voluntary EmployeeTurnover
0
5
10
15
Employee Turnover%
1 Calendar year.2 Financial year.

We are continuing to increase ourfocus on learning and development acrossthe group and are expanding activitiesand resources on a global basis. Oursustainability awareness training has beenrolled out in our major regions and we aredeveloping a more in depth inductionprogramme which will be launched in2012/13. A number of new programmeshave been introduced during the year,both across the group and within ourbusinesses, underpinned by our keythemes of acting globally, people andculture, sharing good practice andincreasing business understanding. Wehave particularly increased our focus onmanagement and leadership developmentand on coaching and mentoring to supportand develop our staff.
The group’s Manufacturing Excellenceprogramme, which was launched in2011/12, places particular emphasis ondeveloping our manufacturing leaders andon providing our manufacturing staff withimprovement tools to implement andembed a culture of lean manufacturing.Specific training modules are beingdeveloped to target key employee groupsand encourage the sharing of best practiceacross our global manufacturing operations.
Talent reviews and successionplanning are instrumental throughout ourbusinesses and we have robust reviewprocesses in place to support theinternational recognition and developmentof management talent within the group.
Social continued
In 2012/13 a new developmentprogramme aimed at senior leaders inJohnson Matthey will be introduced whichwill provide world class developmentsupport to further build leadership capacityin line with our strategy for growth.
Johnson Matthey is a strongsupporter of apprenticeship schemes as avaluable route for training and developingnew talent. Programmes operate at anumber of our facilities around the worldand during 2011/12 several of ourbusinesses have introduced or expandedtheir schemes. In the UK this year, thecompany and its apprentices have receivedrecognition from government and otherorganisations for their commitment andcontribution to apprenticeship schemes.
The table above sets out, on a totaland on a per employee basis, the days oftraining and training spend during 2011/12.
The figure below shows the total trainingspend per employee over the past fiveyears. The training spend does not includethe cost of in house training or the cost ofemployees’ wages during training.
1 Calendar year.2 Financial year.
Johnson Matthey Annual Report & Accounts 2012Report of the Directors – Business ReviewSocial
54
> Continuing the Tradition of ApprenticesJohnson Matthey has a long tradition of apprenticeships. In fact, George Matthey,one of the founders of the company, started his career as an apprentice at the age of13 back in the 19th century. Today, programmes operate at many Johnson Mattheyfacilities around the world and focus on a range of skills and disciplines.
At our Zurich sales office in Switzerland, which runs an apprenticeship scheme togive three young people three years’ commercial training, apprentices work alongsidethe other 26 Johnson Matthey employees there and learn a wide range of office basedskills. Our Brimsdown refinery, in the London borough of Enfield, UK, reintroduced itsapprenticeship programme in 2010 and provides training in engineering disciplines.The site has since gone on to encourage other local businesses to do the same andhas gained support and recognition for its efforts from several UK politicians.
� �Read the full case studies at www.matthey.com/sustainability.
Case Study
Training Days and Spend on Training 2011/12
Numberof days / Total Spend per
shifts training training permanentTotal days / per permanent spend employee
Region shifts training employee £ thousands £
Europe 15,140 3.1 2,021 415North America 6,043 2.1 527 186Asia 4,543 3.4 490 365Rest of World 3,947 6.5 197 322
Total group 29,673 3.1 3,235 335
20071
346327
291
390
335
20092 2011220102 20122
0
100
200
300
400
Total Training Spend per Employee£

The level of training activity across thegroup has risen this year as indicated byan increase in the number of days / shiftstraining per employee which is up from 2.6in 2010/11 to 3.1 in 2011/12. Althoughthe group’s overall external training spendper employee has decreased this year,spend per employee in Asia has more thantrebled, reflecting the increased focus onemployee development in the region. Ourstrong and continuing commitment to thetraining and personal development of allour employees is reflected in the fact thatduring 2011/12, approximately 690 internalpromotions were actioned. This represents35% of all appointments made in the year.
DiversityAt Johnson Matthey we recognise theimportance of diversity, including genderdiversity, and the benefits this can bringto our organisation. With regard to genderdiversity specifically, Johnson Mattheyfaces challenges similar to those facedby other organisations in the chemical,technology and manufacturing sectors.To address these, we have policies andprocesses in place which are designedto support gender diversity in employeerecruitment, development and promotionand we are committed to ensuring thatwomen have an equal chance with men ofdeveloping their careers within our business.
We encourage gender diversity at the earlycareer stage by working outside JohnsonMatthey to encourage women to enterscientific and industrial fields. The boardis in the process of reviewing the broadquestion of diversity within the group.
In accordance with applicable law,Johnson Matthey bases all employmentrelated decisions on the principles of equalemployment opportunity and our policiesin this area are presented on page 81 andthe website.
The group’s gender balance wasunchanged this year at 78% male and22% female although the gender balanceof new recruits is improving at 75% maleand 25% female.
Employee Relations andCommunicationEffective two way communication withemployees and, in particular, face to facedialogue, is important in embeddingcompany culture, building commitment,celebrating achievements and increasingunderstanding of the business, itsperformance and strategy. Communicationon matters of interest to employees isexchanged through in house magazines,attitude surveys, regular news bulletins,presentations to staff and team briefings.Employees are also encouraged to accessthe group’s corporate intranet, sustainabilityintranet and websites.
Encouraging communication betweenemployees is becoming increasinglyimportant as Johnson Matthey continuesto expand its range of business activitiesand its geographic locations. Encouragingbetter communication between our peoplewill help to promote exchange of ideas andbest practice, expedite research anddevelopment and support the embeddingof corporate culture. Although ourcompany operates as separate businesseswithin our three divisions, there arecommon activities and themes which runthroughout the group. Our ManufacturingExcellence programme is one examplewhere success is highly dependent onengagement and communication betweenemployees. More generally, the grouprecognises the value of such exchangesand projects are underway to provideenhanced internal systems that supportimproved communication across our globaloperations.
Employee involvement is a criticalfactor in the development of animprovement culture. Employees at alllevels are making a major contribution tothe success of our many sustainabilityand lean manufacturing initiatives aroundthe world which provide an excellentopportunity for staff engagement anddevelopment.
The company continues to supportemployee share ownership and employeeshave the opportunity to participate in shareownership plans, where practicable. Underthese plans, employees can buy shares inthe company which are matched by acompany funded component. Employeesin six countries are able to contribute to acompany share ownership plan or a 401kapproved savings investment plan.Through these ownership plans JohnsonMatthey’s current and former employeescollectively held 1.77% of the company’sshares at 31st March 2012.
77%
23%
80%
20%
80%
20%
72%
28%
78%
22%
0
20
40
60
80
100
Europe NorthAmerica
Asia Rest ofWorld
Group
Employee Gender by Region%
Male
Female
. Volunteers from Johnson Matthey’s Emission ControlTechnologies business in Royston, UK helped out atthe local train station to create floral displays for thetown’s ‘Royston in Bloom’ event.
. Employees and their families at our Nilai operationsin Malaysia enjoy an ‘environment, health andsafety’ treasure hunt organised by the site.

Johnson Matthey also sponsorspension plans for its employees worldwide.These pension plans are a combination ofdefined benefit and defined contributionpension arrangements, savings schemesand provident funds designed to provideappropriate retirement benefits based onlocal laws, custom and market practice.
Johnson Matthey continues tomaintain good and constructive relationswith all recognised trade unions whichcollectively represent 35% of all groupemployees worldwide (2010/11 38%). Thefollowing table sets out the average numberand percentage of Johnson Matthey’semployees who were covered by collectivebargaining arrangements and representedby trade unions by geographical region in2011/12. During 2011/12 no working timewas lost within the group due to employeeaction.
Social continued
Community Investment
Johnson Matthey has a strong tradition ofgood community relations and the companyand its employees are actively involved inprogrammes worldwide. We believe thatinvesting in our communities is an integralpart of our social commitment to ensurethe ongoing sustainable success of thecompany.
Although Johnson Matthey is a globalcompany, we believe community investmentis about making a real difference locallyand making a positive impact in thecommunities where we have operations.We have an important contribution tomake to the economic development of ourlocal communities, not only as an employerbut also through collaboration andinvestment, both financial and in kind, forexample by volunteering and donatingresources and expertise.
As we are global, the communities weoperate in face a wide range of priorities,issues and challenges. As a result we aimto ensure that our sites have the resourcesand support to identify those projects,initiatives and partnerships that can makea real difference in their communities andthat mean something to employees andtheir families. We also aim to support thefuture growth of our business through thepromotion of science education amongyoung people.
We have four key objectives for ourcommunity investment programmes:
• To demonstrate our commitment tobeing a responsible business thatprovides value beyond our products.
• To make a positive impact on thecommunities in which we operate.
• To create goodwill and enhance ourreputation within our localcommunities.
• To build our profile as an employerof choice.
Guidance on site requirements forcommunity relations is detailed in thegroup environment, health and safetymanagement system and a review ofcommunity investment activities across thegroup is carried out each year. In 2011/12,the review indicates that 85% of JohnsonMatthey’s operations participated inactivities within their local communities.These activities are wide ranging andinclude charitable giving, support foreducational projects, the advancementof science and economic regenerationprojects. The review also indicates that95% of sites have a nominated personresponsible for this area. Looking aheadto 2012/13, the review shows that 78%of operations have set objectives for theircommunity investment activities with 65%having planned activities for the year.
Johnson Matthey Annual Report & Accounts 2012Report of the Directors – Business ReviewSocial
56
> Investing in the Local CommunityLocal Enterprise Partnerships are a scheme that was launched by the coalitiongovernment in England in 2011 to foster growth at a local level. Johnson Mattheyis a leading business in Royston and so when the Hertfordshire Local EnterprisePartnership (LEP) was formed, it was natural that Johnson Matthey should be involvedfrom the start. John Gourd, the Site Planning and Services Director at Royston,accepted a position on the initial board and, subsequently, the role of chairman.
The Hertfordshire LEP is a business led partnership between local businesses,academic institutions and local government which aims to boost the local economyand create new jobs.
In February 2012, the chairs of all 39 LEPs around the country, including JohnGourd, were invited to meet the Prince of Wales and discuss the work of his charity,the Prince’s Trust. Prince Charles was keen to understand how the LEPs could workwith his charity to help young people, especially in areas of high unemployment.
Our participation in the local LEP is an extension of the Royston site’s community engagement strategy and recognises theimportance of playing our part in helping to strengthen the local economy.
Read the full case study at www.matthey.com/sustainability.
Case Study
Trade Union RepresentationAverage headcount 2011/12
Permanent %Region employees Represented represented
Europe 4,868 2,194 45%North America 2,839 558 20%Asia 1,344 306 23%Rest of World 611 337 55%
Total group 9,662 3,395 35%

The review also indicates that 68% ofsites have specific budgets allocated tocommunity investment activities for the2012/13 financial year.
Employees also participate in activitiesor hold community related roles outsidethe work environment. The company issupportive of this broader communityengagement, allowing employees time offduring working hours as appropriate.
In efforts to further encouragevolunteering among employees and tomore broadly support our sites aroundthe world in their community programmes,the group has developed a communityinvestment strategy and policy this year.In developing the policy, Johnson Mattheysought input from a number of itsemployees, charity partners, shareholdersand other experts to ensure the policy andstrategy are relevant and deliver value forall stakeholders.
The policy requires all sites toundertake a community investmentprogramme, measure its impact and allocatea budget for activities in the year. It alsoprovides additional guidance to assist sitesin developing their programmes. The policyalso sets out the group’s commitment toencouraging its employees and sites tosupport their local communities andcharities. From the start of the 2012/13financial year, every employee will beallowed up to two days paid leave a yearto undertake voluntary work in the localcommunity or with a charitable organisation(subject to business needs and the approvalof their manager). Furthermore, thecompany will match employees’ fundraisingin aid of a registered charity up to the valueof £1,000 per employee per year, with acap of £50,000 per annum for the groupas a whole.
57
> Volunteering in EcuadorIn October 2010, ten employees from Johnson Matthey’s Davy ProcessTechnology business set about raising £15,000 to enable them tosupport a community project in rural Ecuador to renovate a school andbuild a local nursery. After several fundraising events, generous donationsand more office cake sales than the ‘health’ element of the sustainabilityprogramme ever envisaged, the team set off to Ecuador in July 2011.
Hosted by local Shuar families, the team was introduced to thedistinctive Shuar culture and they were also able to share some UK traditions of their own. By the time the team left, the school buildings had been renovated and they were ready for use. All the wood needed for the building of the nursery had been collected. For thevolunteers, it had been hard work but wholly rewarding and had given them the opportunity to show real concern forcommunity wellbeing, whether that community is on the doorstep of the company or far away.
�Read the full case study at www.matthey.com/sustainability.
Case Study
> Making a Difference in Sri LankaJohnson Matthey was swift to react, along with the global community, whenthe tsunami hit the Indian Ocean on 26th December 2004. The companymade an initial donation and also made a commitment to maintain arelationship with young victims of the tsunami by making a donation of £3,000a year over five years to support the education of children who had beenorphaned. This money was earmarked for their school fees, supplies and extraclasses, and was intended to help them to pursue their education.
In July 2011, Johnson Matthey’s Chief Executive, Neil Carson, and hisfamily visited one of the schools the company supports in Sri Lanka. He sawat first hand the impact of the funding and met some of the children who aresponsored, including one girl who is soon to become a doctor.
Having recently reached the final year of its original five year commitment,Johnson Matthey’s Charities Committee agreed that the company shouldrenew its commitment with a further five years of donations. As a result, thegroup will continue to support many of the same children, along with a handfulof new students, with the aim of increasing the scope of opportunities for theirfuture.
Read the full case study at www.matthey.com/sustainability.
Case Study

Social Aims and Targets
We will continue to improve our recruitmentprocesses on a global basis to ensure thatwe are well placed to recruit high calibreemployees in all our regions. Plans areunderway to further develop our onlinepresence and use digital media to enhanceusers’ experience and encourage interestin our business.
Alongside our efforts on recruitment,employee training and development at alllevels will remain a key priority to ensurewe retain high potential and highperforming staff and equip them with thetechnical and leadership capabilitiesneeded to achieve the long term goals setout in our strategy. Plans are in place tolaunch a number of new training modulesin 2012/13, including those to support thegroup’s Manufacturing Excellenceprogramme and leadership developmentin China.
Community investment remains animportant aspect of building a sustainablebusiness and following the launch of thecommunity investment strategy and policy,work will continue to support ouroperations around the world in developingtheir community programmes. We will alsostart to track additional performancemetrics, for example employee volunteeringdays, with a view to reporting this data infuture years.
Charitable DonationsJohnson Matthey’s long history of supportfor charitable causes continues todaythrough group and business programmes.The causes we support reflect the areas inwhich the group’s technologies have abenefit and the issues which strike a chordwith our employees. In the financial yearto 31st March 2012 Johnson Mattheydonated £645,000 to charitableorganisations, up 25% on the prior year.This figure only includes donations madeby Johnson Matthey and does not includepayroll giving, donations made by staff oremployee time. The company made nopolitical donations in the year.
Across the globe, Johnson Matthey’ssites lend support to many charities locallyand nationally through donations,employee time or loans of companyfacilities. Examples of these initiatives aresummarised in the case study examplesin this report with full details and furtherexamples available on our website.
Read more online atwww.matthey.com/sustainability.
At a group level, Johnson Mattheyoperates a charitable donationsprogramme which represented 47%(£305,000) of total company donationsin 2011/12. This programme supportsorganisations working in the areas ofenvironment and sustainability, medicaland health, science and education, socialwelfare and international development.
The charitable donations programmeincludes an annual donations schemewhere a number of charities are selectedtriennially and receive a donation from thecompany each year for a three year period.
Social continued
In 2011/12, 33 charitable causes receivedan annual donation through this scheme.The group’s programme also considersindividual requests for support throughoutthe year and a further 67 charitableorganisations received donations on thisbasis in 2011/12. The group also has aspecific programme of support focused onpromoting the understanding andawareness of science among children andyoung people and has identified severalnew programmes which it will support in2012/13.
The Johnson Matthey EducationalTrust was set up in 1967 to commemoratethe 150th anniversary of the founding ofthe company. It awards scholarships tosupport the university education of theoffspring of Johnson Matthey’s current andretired employees. During the year theTrust approved grants totalling £82,500.
The company continues to select acharity partner to focus support on oneparticular cause and employee views areconsidered when identifying the charity.The group is supporting CLIC Sargent, theUK’s leading cancer charity for childrenand young people and their families, andother national childhood cancer charitiesaround the world in a two year partnershipthat will run to the end of 2013/14.
Johnson Matthey is a member of theLondon Benchmarking Group (LBG), aglobal network of companies that shareand drive best practice in corporatecommunity investment.
Johnson Matthey Annual Report & Accounts 2012Report of the Directors – Business ReviewSocial
58
Social welfare34%
Science andeducation
23%
Medicaland health
21%
Internationaldevelopment
4%
Environmentand sustainability
1%
Other17%
Charitable Donations – Corporate(central group donations)% of total (£305,000) donated bycharitable type
2008
495
415458
517
645
2009 20112010 20120
100
200
300
400
500
700
600
Charitable Donations£ thousands
Corporate(central group
donations)47%
EnvironmentalTechnologies
30%
PreciousMetal Products
15%
FineChemicals
6%
Othercorporatefunctions
2%
Charitable Donations 2011/12

59
> Working Together to Support Childrenwith CancerEvery two years, Johnson Matthey selects a charity partner in the UK andcentres its fundraising activities on that cause. Sites in other countries areencouraged to find and support a similar charity.
Johnson Matthey has chosen CLIC Sargent, a leading UK cancer charity,as its charity partner for 2012 to 2014. CLIC Sargent supports children andyoung people who have been diagnosed with cancer. It helps them and theirfamilies by providing clinical, financial and emotional support.
Funds raised go towards a range of services: financial support, free breaksfor families, ‘play’ specialists who use play to help children understand theprocedures involved, free self-catering accommodation close to specialisthospitals and more.
CLIC Sargent is affiliated to the International Confederation of Cancer Parent Organizations, which has memberorganisations on five continents. Johnson Matthey’s operations around the world have been invited to get involved andsupport their local childhood cancer charity.
The company’s charity partnership provides a focus for employee fundraising and the sums raised provide a very realsupport to the charity. In the previous partnership, over £70,000 was raised to support the British Heart Foundation.
Read the full case study at www.matthey.com/sustainability.
Case Study
> Revitalising the Field of DreamsThe Field of Dreams is a recreational playground in West Deptford, New Jersey,USA. Once a fairyland of turrets, walkways and dedicated play areas, it wasoriginally built by community volunteers in 1996. The park is close toJohnson Matthey’s West Deptford site and employees themselves have usedthe park for family outings.
Time has, however, taken its toll and the Field of Dreams had become inneed of repair, with its once colourful towers weather beaten and worn andthe protective mulch ground down to bare dirt. It was in need of love.
Johnson Matthey, together with another local company, has come to therescue with donations of much needed funds and with employees volunteeringtheir time to restore the park to its former glory. The project was completed inMay 2012 and Johnson Matthey’s West Deptford site is proud to have beenable to help realise the dreams of local children.
Read the full case study at www.matthey.com/sustainability.
Case Study

Johnson Matthey Annual Report & Accounts 2012Report of the Directors – Business ReviewHealth and Safety
60
A key priority
Health and SafetyThis section outlines our approach to health, safety and product stewardship,our performance in the year and the programmes we have in place to drivecontinuous improvement.
> Investing in New CapacityWith ever increasing concerns over theavailability of natural resources, countriesaround the world remain focused on ensuringtheir energy security and continue to seek toreduce their dependence on the use ofimported oil.
In China, which has low natural gasreserves and lots of coal, there is particularinterest in converting coal into substitute naturalgas (SNG) and Johnson Matthey has leadingtechnology and catalysts for this process.
Investments at our Process Technologiesbusiness’ Panki site in India are increasingcapacity for manufacturing SNG catalyststo meet demand from customers in China.Projects to construct new facilities are wellunderway and several upgrades to our existingassets have been completed. As well asboosting capacity, these upgrades haveincluded a number of health and safetyimprovements to provide an enhancedworking environment for our employeesat Panki.
Delivering Value

Contents
62 Performance Summary 62 Managing Performance and Driving Continuous Improvement 62 Health Performance in 2011/12 63 Sustainable Health Improvement Priorities for 2012/13 63 Safety Performance in 2011/12 64 Safety Priorities for 2012/13 64 Product Stewardship 65 Product Stewardship Performance in 2011/12 65 Product Stewardship Priorities for 2012/13 66 Animal Testing 67 Responsible Care 67 Regulatory Matters
. Inside the control room of a recently completed facility at Panki.. Employees at Panki outside one of the new catalystmanufacturing facilities.

Health and Safety
Johnson Matthey Annual Report & Accounts 2012Report of the Directors – Business ReviewHealth and Safety
62
Many of Johnson Matthey’s products andservices make a contribution to enhancinggeneral health and wellbeing or providesafety benefits. We manufacture a rangeof products used in medical applications.These include opiate based activepharmaceutical ingredients (APIs) for painrelief, such as morphine and codeine,platinum based anticancer compounds forchemotherapy treatments, other controlledsubstance APIs, components used inmedical devices which are used to assistwith surgery or treat long term medicalconditions and Bitrex®, the world’s bitterestsubstance, which is added to householdcleaning products to prevent accidentalswallowing by children. Our emissioncontrol catalysts, which are used to reduceharmful emissions from vehicles andindustrial processes, have a major impacton air quality for millions of people aroundthe world.
Targets to improve health and safetyperformance are a key part of ourSustainability 2017 Vision. The group aimsto achieve zero greater than three day losttime accidents and to reduce its incidenceof occupational illness cases by at least30% over five years to 2013/14. In orderto meet these aspirations, long termhealth and safety improvement plansand performance indicators have beenestablished.
Read more on Sustainability 2017on pages 13 to 15 and atwww.matthey.com/sustainability.
> Read more on our progress towardsSustainability 2017 on page 17.
Read more on the health and safetybenefits of our products atwww.matthey.com/sustainability/products.
Managing Performance andDriving Continuous Improvement
Johnson Matthey is a manufacturingbusiness and a significant proportion of ouremployees work in production environmentswith chemicals and process machinery.Rigorous policies, systems and processesapply across all facilities to monitor andmanage health and safety performanceand to drive continuous improvement.
> Read more in the Governance sectionon pages 80 and 81.
Read full details of our policiesand strategies to manage anddrive performance atwww.matthey.com/sustainability.
Proactive management of health andsafety delivers value for our business inmany ways. It can assist in the avoidanceor reduction of liability claims, potentiallegal exposure, concern over the cost ofinsurance premiums and external pressuresfrom insurance companies. In addition,it helps support maintenance of thegroup’s corporate reputation, expectationsof its customers and in meetinggovernment targets. Most importantly itsupports our moral obligations to ouremployees and other stakeholders and,when effectively managed, can have apositive impact on staff morale, attendance,recruitment and retention and on ourproductivity, efficiency and quality of service.
Health Performance in 2011/12
In 2011/12 we have continued toconsolidate the sustainability of ourcorporate and facility health programmes.From May 2011, longer term healthimprovement goals were incorporated into
the group’s ten year environment, healthand safety (EHS) strategy and goodprogress has been made during the firstfull year of its implementation.
The proportion of facilities globallywho reported that they had complied withthe requirement to conduct an annualsustainable health review and improvementplanning process rose again this year to90%, which is the highest level achievedsince this corporate requirement wasintroduced in 2006.
Good progress has been madeagainst our Sustainability 2017 target toreduce the annual incidence of occupationalillness cases by at least 30% over fiveyears to 2013/14 (to 3.7 cases or less per1,000 employees). The occupational illnessincidence in 2011/12 was 3.5 employeecases per 1,000 employees (0.17 employeecases per 100,000 work hours), aheadof the group target and maintaining ourperformance in 2010/11. In addition,one case of chemical exposure relatedoccupational illness occurred amongstcontractors as a result of workplaceexposure at a Johnson Matthey facility.
Chemical exposure related illnessesand musculoskeletal conditions accountedfor 86% of reported occupational illnesses in2011/12. Chemical exposure managementand ergonomic risk management thereforecontinue to be the two highest priorityhealth programmes.
During the year a working group wasestablished to develop and implement anergonomic risk management programmeat all facilities. The group has identified andengaged a US based ergonomic consultingpractice from which we will licenseergonomic assessment tools, technicalguidance and training materials.
Performance Summary 2012 2011 % change
Incidence of greater than three day accidents per 1,000 employees 2.07 2.99* -31
Total number of accidents that resulted in lost time 55 74* -26
Total accident rate per 1,000 employees 5.69 7.89* -28
Total lost time accident incident rate per 100,000 hours worked 0.28 0.40* -30
Total number of accident days lost per 1,000 employees 90 102 -12
Incidence of occupational illness cases per 1,000 employees 3.5 3.5 –
* Restated.
Johnson Matthey is committed to minimising the health and safety related impacts foremployees, customers, communities and other stakeholders arising from our operationsand from our products in use.

. Manufacturing active pharmaceutical ingredients at ourRiverside facility in Conshohocken, USA.
. Employees discuss progress at a team meeting in ourEmission Control Technologies business.
We have also made further progressin the group’s chemical exposuremanagement programme. Throughevaluating progress of its implementationwe have identified areas of additionalaction, resources and support needed tocomplete the programme over anappropriate timescale. New policy andguidance on the prevention, identificationand management of occupational illnessand on first aid and medical emergencyresponse have also been introduced.
During the year we have used leadinghealth metric data from a scorecardcompleted by all facilities to supportmanagers in identifying the actions neededto achieve a best practice level of healthprogramme performance. In addition,trends in health scorecard ratings havebeen communicated to regional anddivisional management teams to engagethem in prioritising and directing healthimprovement activities.
The group has comprehensiveprogrammes in place to prevent, identifyand manage all types of occupationalillness conditions at every facility. Theseinclude chemical related, musculoskeletal,mental health and physical agent relatedillnesses (noise and hand-arm vibration).The elements of these programmes aresummarised in the table above (based onguidance provided in the Global ReportingInitiative reporting guidelines).
Sustainable Health ImprovementPriorities for 2012/13
We will continue to focus on reducing theincidence of occupational illness to the
lowest level reasonably achievable and tooptimise the long term health, wellbeingand performance of our workforce.
The key activities in 2012/13 to addressfurther health programme improvementthrough the group’s ten year EHS strategyare to:
• Appoint a corporate industrial hygienemanager to provide technical advice,support and coaching on theassessment and control of workplacehealth hazards to all global facilities.
• Commence a programme of regionaltraining courses to support theintroduction of ergonomic riskmanagement programme tools to eachfacility which will run into 2013/14.
• Introduce new corporate EHS policyand guidance on the prevention andmanagement of platinum group metalcompound health effects and noiseexposure management.
• Incorporate workplace health hazardevaluation and control into the group’sManufacturing Excellence programmeactivities, for example, when definingbest practice guidance for the designand operation of manufacturingprocesses.
• Continue to emphasise themanagement of leading health metricindicators at all facilities through theuse of the health scorecard and othertechniques.
• Support the specific regional healthprogramme improvement needs ofour facilities in developing countries.
• Revise and adjust the content andfrequency of the health managementreview (audit) programme to targetthis more effectively according toindicators of facility health programmeperformance.
• Develop further sustainable health andwellness initiatives relevant to theregional and site specific health needsof the workforce.
Safety Performance in 2011/12
Accidents and incidents are activelymonitored and detailed statistics arecompiled monthly at group level and usedby the Chief Executive’s Committee andthe board at their regular meetings toreview safety performance. Any accident isthoroughly investigated to determine rootcauses and appropriate preventative andcorrective actions are assigned. Thegroup’s rate of occupational accidentsinvolving lost time is shown in the table onpage 62 and its five year performance ispresented in the graphs on page 64.Details of our methodology for calculatingaccident statistics is described on page 172.
During 2011/12, despite increasingproduction levels, we have observed animprovement in safety performance andthe group’s greater than three day lost timeaccident rate per 1,000 employees at 31st March 2012 is at its lowest year endlevel recorded. This good result has beenachieved through raising awareness of theimportance of health and safety which hasled to the introduction of improved accidentcontrol measures. In addition, there hasbeen particular focus at sites with higherthan average accident rates with one facilitypiloting a culture improvement systemwhich will be used more widely across thegroup in the coming year. Our EHS LearningEvents programme has continued to delivergood results, particularly at facilitiessubmitting a higher number of EHSLearning Event reports.
Occupational Illness Assistance Programmes
Programme recipients Education / training Counselling Prevention / risk control Treatment
Workers Yes Yes Yes Yes
Workers’ families n/a n/a n/a n/a
Community members n/a n/a n/a n/a

For Johnson Matthey any accident isunacceptable and our Sustainability 2017target is to achieve zero accidents thatresult in more than three days’ lost time.In 2011/12, 83% of our facilities achievedzero greater than three day accidents andat a group level we completed 57 dayswithout a greater than three day accident.
The health, safety and wellbeing ofcontractors who are working on our sitesare of equal importance to those of ouremployees and the group has safetyperformance metrics specifically forcontractors, similar to those for ouremployees. These temporary workers areengaged typically to cover periods of longterm sickness absence or maternity leave,or to manage seasonal variations inworkload. In 2011/12 there were eight losttime contractor accidents (three of whichwere greater than three days) compared to12 lost time contractor accidents in 2010/11(five of which were greater than threedays). This is equivalent to an annual totallost time accident frequency rate of 0.27accidents per 100,000 hours worked peryear (2010/11 0.50 accidents per 100,000hours worked per year).
During the year we strengthenedour audit policy to include one day followup reviews of audit recommendationsto be conducted one year after therecommendations were made. A total of19 one day reviews were undertaken thisyear in addition to 26 full audits across thegroup. Conducting these follow up reviewshas significantly reduced repeat actions atsubsequent audits.
Health and Safety continued
The group’s EHS Learning Eventsprogramme has been reinvigorated anddeveloped into a full environment, healthand safety near miss reporting system.During the year all greater than three daylost time accidents were analysed andcompared with the accident types reportedlocally through the EHS Learning Eventsprogramme. This has allowed us todetermine the effectiveness of EHSLearning Events to help reduce accidentsin the workplace and has highlightedfurther opportunities to improve theprogramme going forward.
This year we have continued todevelop our process risk management(PRM) programmes to develop bestpractice and drive improvement in processsafety systems across our operations.In 2011/12 two process safety audits(one in Europe and one in North America)were conducted and these identified aseries of improvement actions. We havealso established a European PRM workinggroup of engineers from our facilities inthe region. The group meets twice a yearto discuss PRM related issues, reviewindustry case studies and identify furtherimprovement opportunities.
Safety Priorities for 2012/13
Our principal priority remains that ofachieving the group’s target of zero greaterthan three day accidents and there is anoverall trend of continued improvement.Wider implementation of the EHS cultureimprovement programme piloted in2011/12 is seen to be critical in speedingup improvement in our performancetowards this target.
The key activities for 2012/13 toaddress safety improvement through thegroup’s ten year EHS strategy are to:
• Roll out the EHS culture programmeto selected businesses and developa core set of Johnson Matthey EHSbehavioural standards throughconsultations with the group’sbusinesses.
• Complete the schedule of corporateEHS audits at facilities across thegroup, including audit action reviewsand legal compliance audits.
• Review current approaches to EHSgovernance assurance throughmeasurement, reporting and auditprogrammes to determine how theseshould be developed to meet futurebusiness needs.
• Continue to develop the work of theEuropean PRM working group andestablish a similar group in NorthAmerica.
• Deliver fire prevention training seminarsregionally, focusing on platinum groupmetal fires and combustible gas safety.
• Develop leading metrics for our safety,environmental, PRM and productstewardship programmes andincorporate them into our corporateEHS reporting systems.
Product Stewardship
Product stewardship involves an integratedapproach to products, materials andservices management designed to assessobjectively and then minimise or eliminatethe environmental and health relatedimpacts of products.
Johnson Matthey Annual Report & Accounts 2012Report of the Directors – Business ReviewHealth and Safety
64
March2007
March2008
March2009
March2011
March2010
March2012
Total accident rate > 3-day lost time accidents
0
3
6
9
12
Annual Accident Rateper 1,000 employees
March2007
March2008
March2009
March2011
March2010
March2012
0
30
60
90
120
150
Annual Accident Days Lostper 1,000 employees

As part of our commitment tosustainability, we fully acknowledge that allthe chemicals we use and produce mustbe managed responsibly. Our productstewardship systems are aligned to a keytarget in the Strategic Approach toInternational Chemicals Management(SAICM). This is to ensure soundmanagement of chemicals throughout theircomplete life cycle, so that ‘chemicals areproduced and used in ways that minimisesignificant adverse impacts on humanhealth and the environment’.
Johnson Matthey maintains a longstanding commitment to product safetyand conducts systematic and rigorousevaluations of both new and existingproducts. Our product stewardshipmanagement systems focus on thecharacterisation of any risks associatedwith product use, a thorough determinationof related risk management measures andmechanisms to effectively communicatethis information outside the company. We work in cooperation with industrypartners and customers, regulators andnon-governmental organisations tostrengthen confidence in our products.
Johnson Matthey’s businesses havemanagement systems in place whichassess the health and safety impacts ofproducts during their various life cyclestages. These include coverage of:
• The product concept and research anddevelopment stage. This activity isundertaken centrally or by businessesas appropriate.
• Manufacturing and production.
• Storage, distribution and supply intomarkets.
• The in use service life phase.
• The end of life or reuse phase.
Product StewardshipPerformance in 2011/12
A systematic product responsibility reportingscheme (conforming to the Global ReportingInitiative Sustainability Reporting Guidelines)is used to monitor the performance of ouroperations and maintain surveillance of thecompany’s products and services. In2011/12, there were no notifications ofsignificant end user health effects involvingour products and no major incidents orenvironmental releases during our productdistribution were recorded. No productrecalls occurred for safety reasons. Therewere a total of three self detected incidentsof non-compliance with standards orcodes of practice covering product hazardcommunication which were resolvedinternally by the businesses involved.
During the year enhanced internalproduct stewardship systems for reviewingnew and existing products were launchedand are being implemented by ourbusinesses. These new systems incorporateindustry best practice guidelines and setschedules for product reviews at thepre-commercialisation stage and thereafter.They also place increased focus onsupporting our supply chains, for examplethrough conducting end use riskassessments. Updated policies andguidance covering restricted substancemanagement and products that are subjectto trade controls were issued to ourbusinesses globally. We also publishedadditional new health protection andenvironmental information for preciousmetal containing products for our supplychains.
Further training and technical supportfor our established internal productstewardship programme covering chemicalexposure management were introducedthis year as we work to reduce chemicallyrelated occupational illness within ourworkforce to the lowest level feasible.
In response to interest from ourstakeholders and as part of our voluntaryproduct responsible care efforts, JohnsonMatthey has continued to fund andparticipate in the Pgm Health ScienceResearch Group. Further details areprovided on page 51.
Product Stewardship Prioritiesfor 2012/13
Johnson Matthey remains committed todriving improvement in product sustainabilityand effective product stewardship in theexternal supply chain and within ouroperations.
The key activities for 2012/13 toaddress product stewardship improvementthrough the group’s ten year EHS strategyare to:
• Encourage the responsiblemanagement of substances throughoutthe supply chain.
• Enhance product sustainability as partof our overall corporate sustainabilityprogramme with a particular focus onmanaging restricted substances, theuse of optimisation strategies duringnew product introduction and theapplication of green chemistryapproaches in product design.
65
> The Right Kind of Fruit Machine!Johnson Matthey sites around the world are concerned with the occupational healthof employees, but the company’s commitment to staff health and wellness goesbeyond that. The Pilar site in Argentina has recently launched a wellness programmeto complement an existing initiative, started by employees themselves, to improvefitness and counter the ill effects of a sedentary lifestyle.
The site was assisted by the company doctor (to advise on diet) and a personaltrainer (to help with fitness). Steps were also taken to create an environment wherepeople had access to healthy food during the working day. Dispensers offering cerealswere introduced in the dining area for those taking breakfast on site and a fruitmachine was installed to help all employees reach their ‘five a day’ portions of fruitand vegetables. Every month, the company gives each employee 20 tokens to use toobtain fruit from the machine – with the result that employees get the chance to eatfresh fruit every day at work. Uptake has been excellent and at least 90% ofemployees at Pilar now eat fruit on a daily basis at work.
Read the full case study at www.matthey.com/sustainability.
Case Study

• Use systematic substance selectionmechanisms to identify preferredalternatives in terms of human healthand environmental safety.
• Continue to improve the publiclyavailable information on the health andenvironmental effect profiles of anychemical substances placed on themarket and link this to updated riskmanagement measures.
• Promote the use of objective hazardranking techniques and relatedexposure control targets for ourchemical products and processintermediates. These will be appliedin Johnson Matthey’s workplaces andmore widely in our product stewardshipand risk management activitiesthroughout the supply chain.
During 2012/13 we will also build onour capability to track and manage newregulatory initiatives, for example those inAsia, and to better respond to our supplychains and other external stakeholders onproduct sustainability. We will also continueto support the work of our businesses todevelop a minimum standard set of EHSdata for all bulk products marketed at lowerproduction volume (i.e. approaching 1 tonneper annum).
Health and Safety continued
Animal Testing
In common with all companies developingand marketing chemical substances,Johnson Matthey must comply withinternational legislation to make toxicityinformation available to assure productsafety for humans, wildlife and theenvironment. We are committed to ethicalprinciples of animal protection and ourcorporate policy is based on the followingprinciples:
1. Johnson Matthey has embraced the‘3Rs’ approach in relying on properlyvalidated alternative methods whichreduce, refine or replace the use ofanimal testing. Therefore we nowplace emphasis firstly on applying thelatest integrated testing strategies(e.g. in vitro assays, computermodelling of effects and in vivo testwaiving approaches). New 3Rtechniques are continually trackedand implemented as they becomeendorsed by regulatory bodies.
2. If, after confirming that suitable datadoes not already exist, in vivo studiesare unavoidable, we always seek tolimit new testing and avoidunnecessary studies by undertakingcollaborative work with industrialpartners.
3. It is ensured that any studies complywith all applicable laws, regulations,licensing and welfare codes.
4. Johnson Matthey only uses fullyaccredited contract researchorganisations and does not undertakeany in house toxicity testing.
5. As a fundamental operating principle,our oversight procedures require thatour businesses commission novertebrate animal studies until ajustification has been carefullyconsidered and approved at grouplevel.
The group does not manufacture anycosmetics or consumer goods and testing istherefore aligned to regulatory requirementsfor industrial substances. Any testingrequired as a result of registrationrequirements imposed under the EUREACH regulation is minimised by workingwithin industry consortia.
Johnson Matthey shares currentsocietal and political concern over animaltesting and we only commission studieswhen mandated by law and if no alternativesexist. During the last year, JohnsonMatthey has continued to provide financialsponsorship for external educationalprogrammes aimed at increasing awarenessof 3Rs alternative approaches. We remainoptimistic that advances in toxicologyscience will enable us to further reduce invivo testing while continuing to safeguardhuman health and the environment.
Johnson Matthey Annual Report & Accounts 2012Report of the Directors – Business ReviewHealth and Safety
66
> National Safety Day Activities at PankiNational Safety Day is an annual event in India and the Johnson Matthey site at Panki,Kanpur, celebrated the occasion with a mix of serious and light hearted activities.
In fact, the Safety ‘Day’ stretches into a whole week and the Panki site optedto meet on 5th and 12th March 2012. The serious side of the occasion was a seminaron personal level risk assessment and any hazards and safety challenges at the site.The seminar held an ‘open mike’: would-be speakers applied via departmental headsand were given five minutes to speak.
A slogan and poster competition contributed to the light hearted side of theevent and entries were accepted in both Hindi and English. There was alsorecognition of achievements, with a number of staff who had done first aid trainingin the year receiving St John’s Ambulance certificates. Eight EHS champions wererecognised and 14 others received appreciation awards.
The National Safety activities create an enjoyable shared experience foremployees, encouraging them to engage with the health and safety aims of theSustainability 2017 Vision.
Read the full case study at www.matthey.com/sustainability.
Case Study

Responsible Care
Johnson Matthey has aligned its operatingpractices with the principles of ResponsibleCare® (as defined in the Global Charterdeveloped by the International Council ofChemical Associations (ICCA)) and withsustainable development goals and guidingprinciples (for example those outlined bythe UK Chemical Industries Association inits ‘Chemistry of Sustainability’ report).
Responsible Care® is a voluntaryprogramme in which companies commit tocontinuously improve their environmental,health and safety performance. It placesparticular emphasis on product stewardshipand sustainability, and communication withstakeholders about their products andprocesses.
Regulatory Matters
Chemical Control Regulations (REACH,GHS, TSCA and Related Standards)Substantial progress has been made thisyear to develop further our testing andevaluation programmes in support of ourscheduled product registrations for thenext EU REACH regulation milestone inmid 2013 (covering medium tonnagesubstances). We continued to participatein industry consortia to maximise datasharing opportunities and to reduce costs.Preparations for compliance with new Asiaregion REACH equivalent regulations arealso underway.
The majority of the group’s productsnow conform with the current requirementsof the Globally Harmonised System (GHS)for chemical classification and hazardcommunication. Following theannouncement of US implementation ofGHS (‘HazCom 2012’), we are alsoworking to implement the associatedworkplace and hazard communicationrequirements for this major system.
> Behavioural Safety at RedwitzA strong safety culture is key to industrial site safety. Analysis of accidents andincidents at the Johnson Matthey site at Redwitz in Germany showed thatbehaviour played a significant role and a behavioural safety programme wasset up to improve the safety culture.
The programme was launched in the summer of 2011 and was facilitatedby a specialist industrial psychologist. In the first phase, 98 employeesparticipated as managers, supervisors and operators met to assess the site’ssafety performance. In the second phase of the programme, managers andsupervisors developed safety behaviour standards which define the behaviourthat is expected of everyone on site. These standards are beingcommunicated to all employees and integrated into induction and staff trainingprogrammes.
All employees were involved in the programme and a collective ownershipof safety has emerged. Results to date have been very promising; all lost timeaccidents have been reduced by more than 40% and greater than three dayaccidents have been reduced to zero. However, even this is not enough. Inorder to make further improvements, the site is continuing its behavioural safetyprogramme and plans are in place to roll out the programme to other sites.
�Read the full case study at www.matthey.com/sustainability.
Case Study
. Our Catalysts and Chemicals business develops and commercialisescatalyst technologies for customers in the pharmaceutical and finechemical industries.
. Manufacturing decorative precious metals for glass andceramics at our Maastricht facility in the Netherlands.

Johnson Matthey Annual Report & Accounts 2012Report of the Directors – Business ReviewEnvironment
68
Reducing theimpact of ouroperations anddevelopingbeneficialproducts
EnvironmentThis section provides more detail on the impact of our business on theenvironment. It details the environmental performance of our operationsin the year and highlights the beneficial impact of our products.
> Developing theNext Generation ofSustainable ProductsResearch and development efforts at JohnsonMatthey are focused on the development of new, more sustainable products for ourcustomers. With continued interest aroundthe world in the development of fuels fromrenewable resources, our scientists areapplying their expertise in catalysis to developcost competitive routes to hydrocarbon fuelsderived from non-food biomass.
In one collaborative research project,which is funded by the US Department ofEnergy, we are investigating technology thatturns carbon dioxide into liquid transportationfuels. Organisms, such as algae, are highlyefficient at converting carbon dioxide into fattyacids and triglycerides and at JohnsonMatthey we are developing state of the artcatalysts that will convert those fatty acids andtriglycerides into hydrocarbon fuels.
The project aims to develop technologythat is not only cost competitive withpetroleum derived fuels, but that is also moresustainable than existing biofuels. Progressto date has been showcased at the recentARPA-e Energy Innovation summit inWashington, US where a half litre sample ofbiorenewable diesel, produced using JohnsonMatthey’s patented catalyst technology, wason display.
Delivering Value

Contents
70 Performance Summary 70 Managing Performance and Driving Continuous Improvement 70 Environmental Performance in 2011/12 74 Environmental Aims and Targets 75 Biodiversity
. Johnson Matthey’s nitrous oxide abatement systems have contributedto reductions equivalent to over 35 million tonnes of carbon dioxidefrom nitric acid manufacturing plants.
. Our emission control catalysts have a beneficial impacton the environment by improving air quality for millionsof people around the world.

A major part of our business involvesapplying our scientific knowledge andexpertise to turn natural resources intomore valuable products for our customers.Natural resource costs are likely to increasein future as they are depleted or becomeharder to access. Our Sustainability 2017and Manufacturing Excellence programmesboth focus on increasing the efficiency withwhich we use these valuable resourcesand will generate cost savings for ourbusiness today and help to conserveresources for the future.
In addition, as leading recyclers andrefiners of precious metals, we draw onour expertise in this area to enhance theresource efficiency of our own operationsand provide improved solutions andservices for our customers.
Many of the group’s products have apositive impact on the environment includingemission control catalysts for vehicles,process catalysts that improve resourceefficiency and abatement systems whichmitigate the production of greenhousegases. A significant proportion of our R&Defforts are directed towards developingthe next generation of environmentallybeneficial products.
> Read more about how we use lifecycle assessment tools to betterunderstand and improve thesustainability credentials of ourproducts on page 29.
> Read more on our product stewardshipsystems in the Health and Safetysection on pages 64 to 66.
Environment
Targets to improve environmentalperformance are a key part of ourSustainability 2017 Vision. The group aimsto cut its carbon intensity by half, achievezero waste to landfill and halve the keyresources per unit of output consumed by2017. In order to meet these aspirations,long term environmental improvementplans and performance indicators havebeen established.
Read more on Sustainability 2017on pages 13 to 15 and atwww.matthey.com/sustainability.
> Read more on our progress towardsSustainability 2017 on page 17.
Read more on the environmentalbenefits of our products atwww.matthey.com/sustainability/products.
Managing Performance andDriving Continuous Improvement
The group has robust policies, systemsand processes in place to manage itsenvironmental performance and to drivecontinuous improvement.
> Read more in the Governance sectionon pages 80 and 81.
Read full details of our policiesand strategies to manage anddrive performance atwww.matthey.com/sustainability.
ISO 14001When launched in December 2007, thegroup’s Sustainability 2017 Vision includeda target to achieve ISO 14001 certificationat all major manufacturing sites and bythe end of 2010/11 all but one of our siteshad achieved certification. This year, thefinal site has achieved its certification and,as detailed previously on page 15, thistarget has now been removed from theSustainability 2017 Vision. We still believethat ISO 14001 is an important standardthat should be maintained by our sites andachieved by new or acquired facilitieswithin two years of beneficial operation oracquisition. As a result, this requirementhas now been included in our environment,health and safety (EHS) managementsystem.
Environmental Performancein 2011/12
Johnson Matthey undertakes acomprehensive annual review of groupenvironmental performance which coversall manufacturing and research anddevelopment facilities. Data is presentedfor a five year period for nine keyenvironmental indicators and data ispresented on a financial year (unlessotherwise stated).
Business expansion has had a directimpact on our environmental performancethis year with increases in eight of the ninekey environmental indicators we report.The increases in our emissions and use ofresources have arisen as a result of a fullyear’s data in 2011/12 from sites acquiredduring 2010/11 (Process Technologies’Savannah, USA site and Fine Chemicals’
Johnson Matthey Annual Report & Accounts 2012Report of the Directors – Business ReviewEnvironment
70
Performance Summary 2012 2011 % change
Energy consumption thousands GJ 4,726 4,749 –
Total global warming potential thousand tonnes CO2 equivalent 417 415 –
Total acid gas emissions tonnes SO2 equivalent 444 318 +40
Total VOC emissions tonnes 189.8 185.7 +2
Total waste tonnes 120,363 113,671 +6
Total waste to landfill tonnes 10,708 6,165 +74
Water consumption thousands m3 2,201 2,076 +6
Johnson Matthey has an impact on the environment in many ways: through theresources we use, the way we operate our processes and the action of our productsand services on enhancing the environment for others.

Riverside facility in Conshohocken, USA),recently commissioned facilities reachingfull production and from incrementalincreases across the group’s manufacturingoperations as demand for our productsincreased. Despite these absolute increases,six out of nine of our environmental metricsincreased at a rate below the rate ofgrowth of the group’s sales excluding thevalue of precious metals (sales) asillustrated in the graphs and tables in thissection of the report. There were nosignificant fines and no non-monetarysanctions for non-compliance withenvironmental laws and regulations in the year.
Energy ConsumptionThe group’s total energy consumption wasessentially flat this year at 4.7 million GJbut reduced by 15% relative to salesbenefiting from programmes at our sites toimprove energy efficiency. Of the energyconsumed in 2011/12, 65% arose fromdirect sources (i.e. various fuels and naturalgas combusted by the group) and 35%from consumed electricity generated by asupplier. The global energy bill for 2011/12was £54.7 million, an increase of £3.0 millioncompared with 2010/11, reflecting higherglobal energy costs.
Global Warming PotentialWe report greenhouse gas emissions fromprocess and energy use and convert thetotal group energy use to tonnes of carbondioxide (CO2) equivalent using national and regional conversion factors for eachemissions source as appropriate. Thegroup’s total global warming potential (GWP)is based on our Scope 1 and Scope 2emissions (as defined by the greenhousegas protocol www.ghgprotocol.org).
In 2011/12 the group’s GWPincreased only very slightly by less than 1%to 417,407 tonnes CO2 equivalent, whichrepresents a good result given the inclusionof a full year’s data from the Savannah andRiverside sites and increased demand forour products. Of this year’s total, 38%resulted from Scope 1 emissions (generatedby the direct burning of fuel, predominantlynatural gas) and 62% from Scope 2emissions (generated by the purchase ofgrid electricity). The group also made goodprogress towards its Sustainability 2017target to halve carbon intensity in 2011/12with a year on year reduction of 14% inGWP relative to sales.
Johnson Matthey does not own theships, trucks or aircraft used to transportits products and so emissions fromtransportation are not included in the data.The majority of our products are high valuebut low volume and so the carbon producedby transportation is low relative to othercarbon intensity indicators, for exampleScope 2 emissions.
We also report indicative data for ourCO2 emissions from travel by employeeson company business and collect datafrom all sites. While we recognise this datadoes not represent all emissions as a resultof company travel, it does provide anindicator and year on year comparator.In 2011/12 CO2 emissions from air travelby employees on company business were6,263 tonnes and emissions from companycar travel were 1,569 tonnes. We continueto develop our work on assessing thecarbon footprint of our business, includingways to expand the level of information wecollect on our indirect carbon emissions,to include emissions from third partytransportation of our products by air, sea,rail and road.
. Developing catalysts and components for fuel cells,a technology for generating low carbon power.
. Operations at Johnson Matthey Colour Technologies’headquarters in Maastricht, the Netherlands.
20071
2009 2010 2011 2012
GJ (’000) GJ / £ millionsales
0
1,000
2,000
3,000
4,000
5,000
0
500
1,000
1,500
2,000
2,500
3,000
Energy ConsumptionGJ (’000) GJ / £ million
sales
GJ / £ millionGJ (’000) sales
20071 3,787 2,2002009 4,070 2,2652010 4,001 2,1212011 4,749 2,0832012 4,726 1,764
1 Calendar year.2007
12009 2010 2011 2012
Tonnes CO2
equivalentTonnes / £ million sales
0
100,000
200,000
300,000
400,000
500,000
0
50
100
150
200
250
300
Total Global Warming Potential (GWP)Tonnes CO2 Tonnes /equivalent £ million sales
Tonnes CO2
equivalent Tonnes /(’000) £ million sales
20071 390 226.62009 372 207.02010 377 199.92011 415 182.02012 417 155.7
1 Calendar year.

The UK’s Carbon Reduction CommitmentOngoing compliance with the UKgovernment’s Carbon ReductionCommitment (CRC) does not present amaterial issue for Johnson Matthey, giventhat the majority of our UK facilities areexempt from the process as they arealready being regulated under existingclimate change levy agreements that driveyear on year energy efficiency andreduction programmes. Our facilities in theUK account for 31% of the group’s totalGWP (Scope 1 and 2 emissions) and of theemissions from these facilities, over 95%are exempt from the CRC process. In the2011/12 CRC Annual Report, to besubmitted to the Environment Agencyduring July 2012, Johnson Matthey Plc willreport energy use data for its four UKsubsidiaries that are not covered by thegroup’s exemption.
EU Emission Trading Scheme (EU ETS)We are closely monitoring the potentialimpacts and opportunities for our businessarising from the Phase III of EU ETS whichwill be implemented in 2013.
Other EmissionsEmissions from our operations aregenerated from a number of sourcesincluding combustion processes, materialshandling and chemical reactions and aretypically licensed by local regulations. Allsites monitor emissions to ensurecompliance with these regulations and settheir own absolute targets aimed atreducing significant emissions as part oftheir local environment, health and safetyimprovement plans.
In 2011/12, our total emissions ofacid gases have increased by 40% to444 tonnes sulphur dioxide (SO2)equivalent and were up 19% relative tosales. This was mainly due to an increasein emissions of oxides of nitrogen (NOx)from our operations.
Environment continued
Compared with last year, total NOxemissions were up 44% at 566 tonnes andincreased 23% relative to sales. Theincrease on 2010/11 was due to higherproduction rates at several facilities, a fullyear of data from Savannah and Riversideand from more robust data this year fromthree sites that reviewed their datacollection methods for combustiongenerated NOx and, as a result, havereported more accurate values.
The group’s total SO2 emissionsincreased by 4.5 tonnes (or 10%) to47.5 tonnes but fell 6% relative to sales.Our absolute emissions were impacted bya 6.2 tonne increase in SO2 emissions fromour Brimsdown, UK site which was partlydue to increased use of its combined heatand power (CHP) generator. Emissions ofvolatile organic compounds (VOCs) were4.1 tonnes (or 2%) higher at 189.8 tonnesin 2011/12 but decreased by 13% relativeto sales. This increase is mainly as a resultof a full year’s data from Savannah andRiverside which accounted for an additional27 tonnes of halogenated VOCs. However,overall, our emissions of halogenatedVOCs reduced this year.
WasteThe group generated 120,363 tonnes ofwaste during the year, an increase of 6%in absolute terms but 10% lower relativeto sales. Waste to landfill increasedsignificantly in the year, up 4,543 tonnes(or 74%) to 10,708 tonnes. Achieving zerowaste to landfill by 2017 is one of thegroup’s Sustainability 2017 targets andinitiatives across our sites to reduce wasteto landfill were impacted this year by thegeneration of waste produced fromconstruction projects to expand operationsat a number of our sites.
In terms of other waste streams,5,251 tonnes of waste were sent forincineration (up 9%),16,023 tonnes weresent for recovery (down 11%) and 90,677tonnes of waste were sent for treatmentand disposal by third party waste serviceproviders (up 6%).
Packaging WastesJohnson Matthey collects and quantifiesthe different types of packaging wasterecycled by our sites as shown in thetable below:
Johnson Matthey Annual Report & Accounts 2012Report of the Directors – Business ReviewEnvironment
72
Waste Recycled
2012 2011Waste Waste %
Packaging type tonnes tonnes change
Steel 2,314 1,847 +25Paper 704 258 +173Plastic 1,148 439 +162Wood 3,003 896 +235
20071
2009 2010 2011 2012
Tonnes Tonnes /£ million sales
0
100
200
300
400
500
600
0
0.05
0.10
0.15
0.20
0.25
0.30
Total NOx EmissionsTonnes Tonnes /
£ million sales
Tonnes /Tonnes £ million sales
20071 448 0.26032009 439 0.24432010 434 0.23012011 393 0.17242012 566 0.2113
1 Calendar year.2007
12009 2010 2011 2012
Tonnes SO2 equivalent
Tonnes /£ million sales
0
100
200
300
400
500
0
0.05
0.10
0.15
0.20
0.25
0.30
Total Acid Gas EmissionsTonnes SO2 Tonnes /equivalent £ million sales
Tonnes SO2 Tonnes /equivalent £ million sales
20071 416 0.24172009 334 0.18592010 335 0.17762011 318 0.13952012 444 0.1658
1 Calendar year.
Good progress has been made thisyear with many sites recycling a greaterproportion of packaging waste as a result ofinitiatives to increase awareness of recycling.At our Clitheroe, UK site, its packagingwaste this year has included a greaterproportion of plastic and wood, both ofwhich have been recycled, thus contributingto improvement in the overall group figuresfor these two materials.
Johnson Matthey complies withinternational agreements, regulations andpolicies that govern the internationalshipment of waste. During 2011/12,4,293 tonnes of waste (2010/11 4,295tonnes) were moved between countries,predominately for the reclamation andreuse of metal from spent catalysts at ourBrimsdown, UK refinery.

20071
2009 2010 2011 2012
Tonnes Tonnes /£ million sales
0
10
20
30
40
50
0
0.004
0.008
0.012
0.016
0.020
Total SO2 EmissionsTonnes Tonnes /
£ million sales
Tonnes /Tonnes £ million sales
20071 31.8 0.01852009 25.8 0.01442010 31.0 0.01642011 43.0 0.01892012 47.5 0.0177
1 Calendar year.
> Reducing Waste to Landfill at ClitheroeOne of Johnson Matthey’s sustainability targets is to eliminate waste to landfill by2017. On the Clitheroe site in the north of England, which makes catalysts, goodprogress had been made on reducing hazardous waste despatched to landfill, but thesite was concerned that the level of non-hazardous waste sent to landfill would remainstagnant at around 200 tonnes.
What were the obstacles? Was an attitude of ‘any bin will do’ holding backefforts to reduce waste?
Of the waste sent to landfill, around 67% was non-hazardous, so this was set asa priority area. In 2011 the site met with a number of waste contractors to determinehow it could move towards increased recycling and achieve a significant reduction inwaste to landfill.
An ambitious target was set for 2011/12; only 100 tonnes of non-hazardous waste should be sent to landfill, just halfof the 2008 figure. The new waste collection scheme has been implemented enthusiastically and the actual figure achievedcame in below the target – at 78 tonnes. This is a 40% reduction on 2010/11 and led to cost savings of £7,500 for the site.
Read the full case study at www.matthey.com/sustainability.
Case Study
Water ConsumptionDuring the year, water consumptionincreased by 6% in absolute terms butwas down 10% relative to sales comparedwith 2010/11. Most of this increase is fromsites reporting a full year of data for the firsttime and from an increase in mains water
use at our Brimsdown, UK site where verydry weather reduced the scope for waterharvesting. Of the total water used by thegroup, 91% was supplied by localmunicipal water authorities, 6% was drawnfrom boreholes and 3% was taken fromlocal water courses. Total effluent decreasedby 18% this year to 1.4 million m3, mainly
as a result of more accurate reporting fromone of our sites. Of the total effluentproduced, 82% was discharged to localauthority sewers after treatment and inaccordance with local discharge consentagreements and 18% was discharged towater courses after treatment and withinquality limits set by local water authorities.
. Manufacturing operations at our Catalysts and Chemicals business’West Deptford site in the USA.
. Our Colour Technologies business manufactures black obscurationenamels which are used in automotive glass applications.
20071
2009 2010 2011 2012
Tonnes Tonnes /£ million sales
0
50
100
150
200
250
0
0.02
0.04
0.06
0.08
0.10
0.12
0.14
Total VOC EmissionsTonnes Tonnes /
£ million sales
Tonnes /Tonnes £ million sales
20071 207.1 0.12032009 209.1 0.11642010 180.8 0.09592011 185.7 0.08142012 189.8 0.0709
1 Calendar year.

The method of water treatment used ateach site is appropriate to the effluentquality and volume and the requirementsof the receptor.
The chemical oxygen demand (COD)test is commonly used to indirectlymeasure the amount of organic compoundsin water. Most applications of CODdetermine the amount of organic pollutantsfound in surface water (e.g. lakes and rivers),making COD a useful measure of waterquality. In 2011/12 the group dischargedorganic chemicals equivalent to a CODof 260 tonnes into water courses, asregulated by local emission limits at eachmanufacturing facility. This is a 4% increaseon the prior year which resulted mainlyfrom the first full year of data reported bysome sites.
Environment continued
Johnson Matthey has a robust andeffective management system whichrequires all sites to report environmentalincidents to the group’s EHS department.During 2011/12 no significant spillagesto the environment of raw materials,intermediates or products have beenreported by the group.
Environmental Aims and Targets
The group will continue to manageenvironmental impacts in the context ofan expanding business by building on thebest practice examples of performanceimprovement delivered so far, integrationof lean manufacturing principles, processintensification and step changemanufacturing technologies. This work willbe supported by the group’s globalManufacturing Excellence programme.
Our environment related priorities for2012/13 are to:
• Ensure that the future environmentalperformance of the group is alignedto the Sustainability 2017 Vision ofcutting carbon intensity by half,achieving zero waste to landfill andhalving key resources per unit ofoutput, by helping each businessdevelop projects and metrics toachieve our goals.
• Further develop our internal datareporting systems to improveconsistency of reporting across oursites and to increase the frequencyof internal reporting.
Johnson Matthey Annual Report & Accounts 2012Report of the Directors – Business ReviewEnvironment
74
20071
2009 2010 2011 2012
Tonnes Tonnes /£ million sales
0
10,000
5,000
15,000
20,000
25,000
0
2
4
6
8
10
12
14
Total Waste to LandfillTonnes Tonnes /
£ million sales
Tonnes /Tonnes £ million sales
20071 20,977 12.1882009 5,535 3.0802010 5,071 2.6892011 6,165 2.7042012 10,708 3.998
1 Calendar year.2007
12009 2010 2011 2012
Tonnes Tonnes / £ million sales
0
25,000
50,000
75,000
100,000
125,000
0
10
20
30
40
50
60
Total WasteTonnes Tonnes /
£ million sales
Tonnes /Tonnes £ million sales
20071 98,764 57.392009 96,287 53.582010 90,308 47.882011 113,671 49.862012 120,363 44.94
1 Calendar year.
> Is Water Stress a Risk for Johnson Matthey?Climate change experts have warned that parts of the world will experience watershortages in the decades to come. In December 2007, Johnson Matthey made acommitment to halve the amount of water it uses per unit of output by 2017. Now,in addition to its efforts to reduce water consumption, the company is assessing thewater related risks in its direct business operations.
This analysis provides important insights and flags up strategic issues. If waterstress deteriorated into extreme water scarcity, could manufacturing operations beaffected? What are the business risks? The exercise has highlighted which manufacturingsites are in regions of water stress and has enabled informed risk analysis.
Further work will be done on water stress and risk at site and divisional level andthe analysis will help Johnson Matthey to develop policies that promote waterefficiency and infrastructure improvements. Process water recycling and rain watercatchment systems are already part of Johnson Matthey’s response to halving theuse of this key resource. The water stress assessment complements existing workand provides the opportunity for high level strategic planning on water issues.
Read the full case study at www.matthey.com/sustainability.
Case Study

These priorities will be addressed bychecking and focusing on them during siteaudits and by ongoing communication withfacilities throughout the year to promotegood practice and encourage theintegration of sustainable technologies.
At group level, we will also continueour participation in trade associationcollaborations and work with generalmanagers at our facilities to ensurecompliance with upcoming changes inenvironmental legislation.
Biodiversity
By the nature of our business activities,Johnson Matthey has very little negativeimpact on the biodiversity of terrestrial,freshwater and marine environments.We do not have any manufacturingfacilities located in areas of significantecoimportance and we have not identifiedany major biodiversity issues in our supply
chains as we do not source large volumes ofnaturally derived substances. Consequently,at this stage, we do not considerbiodiversity to be amongst the mostmaterial issues for our business.
As part of all significant investmentsand acquisitions, we complete a detailedenvironmental impact assessment. Inaddition, all our manufacturing sites thathave an ISO 14001 compliant managementsystem undertake an environmentalimpacts assessment that formally identifieshow their operations may have an effectupon local biodiversity. Over the years,we have managed a number of projectslooking at improving biodiversity at ouroperating sites.
During the year, we have completed abenchmarking study to assess our positionon biodiversity with that of appropriatepeer group companies and believe that ourposition is both pragmatic and consistentwith other similar businesses. We continueto monitor regulation, policy, codes andstandards in this area to ensure that wemaintain awareness of, and respond to,any emerging issues.
75
20071
2009 2010 2011 2012
Thousands m3
Thousands m3 /
£ million sales
0
500
1,000
1,500
2,000
2,500
0
0.3
0.6
0.9
1.2
1.5
Water ConsumptionThousands m3 Thousands m3 /
£ million sales
Thousands m3 /Thousands m3 £ million sales
20071 2,048 1.1902009 1,951 1.0862010 1,750 0.9282011 2,076 0.9112012 2,201 0.822
1 Calendar year.
> Green Team Promotes Business Sustainabilityat ManesarA group of volunteers, known as the ‘Green Team’, came together at thecompany’s Emission Control Technologies business in Manesar, India to stimulateand shape ideas for putting sustainability into practice. This was not about asingle large project but a multiplicity of modest suggestions.
A whole host of energy saving, water efficiency and waste reduction projectsare underway. For their personal commuting, employees are encouraged to use acar pool or public transport. Sustainability may be a serious commitment, but theGreen Team believes there is no reason why it should not also be fun, andactivities and communications keep employees involved.
This variety of small projects is showing big results and the business is ahead of its sustainability targets for electricityand water consumption. These efficiencies impact directly or indirectly on bringing down carbon emissions and at the sametime improve profitability. Equally important, a culture of sustainability has been embedded, and this wide ranging approachis making sustainability a way of working and a way of life.
Read the full case study at www.matthey.com/sustainability.
Case Study

Johnson Matthey Annual Report & Accounts 2012Report of the Directors – GovernanceGovernance
76
Managingour businessin theright way
GovernanceThis section introduces our board of directors and details the corporategovernance structures that are in place to ensure we manage our businessin a responsible and transparent way.
> Supporting Our Strategyin Fine ChemicalsPeople around the world are living longer.As a result, many will suffer from chronicdiseases and will require more long termdrug therapy. This, together with increasingdemand from doctors and patients for efficientpain management and continued economicdevelopment in Asia, will further drive demandfor pharmaceutical products.
Johnson Matthey holds a strong positionin opiate based active pharmaceuticalingredients (APIs), which are used to relievepain, and in other niche controlled APIs, inparticular amphetamines used in the treatmentof attention deficit hyperactivity disorder(ADHD). Its API Manufacturing businesses,based in the UK and USA, delivered stronggrowth this year, increasing their sales andgrowing market share.
This performance was supported by thebusinesses’ Riverside manufacturing facility,located in Conshohocken, USA, which wasacquired by Johnson Matthey in November2010. This new plant, which more thandoubles our manufacturing capacity in NorthAmerica, has been successfully integrated withthe businesses’ other operations and isenabling us to manufacture products moreefficiently, support growth and capitalise onnew market opportunities.
Delivering Value

Contents
78 Letter from the Chairman 79 Governance and Sustainability 82 Board of Directors 84 Corporate Governance Report100 Other Statutory Information105 Nomination Committee Report106 Audit Committee Report108 Remuneration Report
. The Riverside facility more than doubles Johnson Matthey’sAPI manufacturing capacity in North America.
. Clean room facilities at Riverside for theproduction of highly potent APIs.

GovernanceLetter from the Chairman
Johnson Matthey Annual Report & Accounts 2012Report of the Directors – GovernanceGovernance
78
Tim StevensonChairman
Dear Shareholder
Good governance is a cornerstone of a successful and sustainable company.The group has a well established framework of policies, processes andmanagement systems to support its governance and sustainability efforts, whichapply to all group operations worldwide. These are described on pages 79 to 81.
The UK Corporate Governance Code
The formal Corporate Governance Report is set out on pages 84 to 99. Thecompany is reporting against the UK Corporate Governance Code (the Code),which was introduced in June 2010. Although based on the Combined Codeon Corporate Governance (the Combined Code) which it replaced, the Codecontains a number of substantive changes to the Combined Code’s mainprinciples and provisions. In the main, these place greater emphasis on boardbehaviour. As in previous years, the company is reporting on how it has appliedthe main principles and whether it has complied with the relevant provisions.Under the Code, companies must explain their business model and strategiesfor delivering objectives. Explanations of our business model and strategy arecontained in the Business Review on pages 4 to 75. The Responsibility ofDirectors statement is set out on page 120.
Board Role and Effectiveness
The preface to the Code encourages chairmen to report in their annualstatement how they have ensured that the Code principles concerningleadership and board effectiveness have been applied during the year. I refer tothis briefly in my Chairman’s Statement on pages 6 and 7 and more fully in theCorporate Governance Report. In preparing these, account has been taken ofthe Guidance on Board Effectiveness issued by the Financial Reporting Councilin March 2011, which is aimed at assisting boards in applying these Codeprinciples.
Board and Committee Evaluation
We report on pages 96 and 97 on the board and committee evaluation processcarried out following my appointment as Chairman Designate in March 2011.For the first time, the evaluation was externally facilitated by an independentconsultant experienced in board evaluation. The evaluation process was ongoingat the date of publication of the 2011 annual report and has since beenconcluded. We report on the methodology used and the outcome. The board isconducting an internal review process this year and we describe the processbeing used. I propose to present the outcome of the evaluation, which is notcomplete at the date of publication of this annual report, to the meeting of theboard in July 2012. I will report fully in the 2013 annual report.
Boardroom Diversity and Succession Planning
Boardroom diversity and succession planning are key issues for all boards.Descriptions of our approaches to these topics are set out on pages 92 and 93.
UK Corporate Governance Code Compliance Statement
Our statement of compliance with the provisions of the Code is set out on page 85.I am pleased to report that except in one limited respect, the company hascomplied with all relevant provisions of the Code throughout the year ended31st March 2012 and from that date up to the date of publication of thisannual report.
Tim StevensonChairman
“I am pleased to presentthe Governance sectionof the annual report,including the CorporateGovernance Reportfor the year ended31st March 2012.”

Social Environment Governance FinancialHealthand Safety
POLICIES AND MANAGEMENT SYSTEMS• Key objectives for assessment and control of risks
JOHNSON MATTHEY BOARD• Responsibility for social, environmental and ethical matters
• Risk management processes and review
LOCAL ACTION IN BUSINESSES• Putting principles into practice
SUSTAINABLEBUSINESS
CSR COMPLIANCE COMMITTEE• Setting standards and overseeing
compliance • Identify and monitor EHS, social and governance risks
CHIEF EXECUTIVE’S COMMITTEE• Policy setting and approval
• Addresses risk and control issues
AUDIT COMMITTEE • Monitors performance
• Annual review of CSR risks
Governance and SustainabilityIntroduction
The group has well established policies,processes and management systems tosupport its governance and sustainabilityefforts, which apply to all group operationsworldwide. These encompass the keyareas of:
• Business integrity and ethics
• Supply chain management
• Environment, health and safety (EHS)
• Human resources.
Together they provide the frameworkfor managing environmental, social andgovernance matters. Brief summaries areset out in this section. Further details,together with information about progressand developments over the year to31st March 2012, can be found on thecompany’s website.
Read more atwww.matthey.com/sustainability.
Compliance with applicable legalrequirements is a minimum standard forgroup operations and employees. In manycases we set standards which are inadvance of these.
Employment contracts, handbooksand policies specify acceptable businesspractices and the group’s position onethical issues. The Group Control Manual,which is distributed to all group operations,and security manuals provide furtheroperational guidelines to reinforce these.
The Corporate Governance Reporton pages 84 to 99 describes the role of theboard, the Audit Committee and othercommittees in risk management andinternal control.
The board of directors is ultimatelyresponsible for social, environmental andethical matters. These matters areembedded into the group’s riskmanagement processes and reviewedannually by the board. The Audit Committeemonitors performance and reviews thebusiness risks associated with corporatesocial responsibility (CSR) at least oncea year. Policies are set and approved bythe Chief Executive’s Committee (CEC).
The CEC also addresses risk and controlissues and reviews key EHS, social andgovernance issues. The CSR ComplianceCommittee, a sub-committee of the CEC,has specific executive responsibility forthe identification and monitoring of risksin these areas. It sets and overseescompliance with group standards throughthe dissemination, adoption andimplementation of appropriate grouppolicies and other operational measures.
Every business is required to includesustainability in its annual budget settingprocess and define the nature ofprogrammes and projects to be undertakentogether with capital expenditurerequirements and value generated over athree year business cycle. Plans arediscussed with the CEC and are formallyapproved by the board. As part of theprocess, progress against the Sustainability2017 targets is assessed on a group basisto establish if additional management actionis required.
We have a formal system of site andfunctional reviews to drive improvedperformance in sustainability. In 2011/12,12 site reviews and six sustainability trainingsessions were undertaken.
The group’s sustainability strategy(as detailed in the section on Our Strategyon pages 13 and 14) was defined followingan assessment of the risks, major impactsand future commercial opportunities opento the business. The long term targets
within it address the issues which couldpotentially have a material effect on thegroup’s future performance. The group’smateriality map outlines the key materialissues and the targets in place to addressand monitor them.
View the materiality map online atwww.matthey.com/sustainability.
The area of sustainability continues todevelop rapidly and we continually monitoremerging issues, regulation, legislation,standards and good practice. Developmentsare proactively managed through reviewingthe external landscape to understand thematerial issues that may negatively impactthe group or present real businessopportunities. Responsibility for identifyingand assessing these issues lies with thegroup sustainability team and the CSRCompliance Committee.
During the year a gap analysis andpeer review study against the ISO 26000guidelines on social responsibility wereconducted to ensure the group remainsabreast of best practice developments insustainability. We continued to developour understanding of life cycle assessment(LCA) and completed the first full quantitativeLCA of our automotive emission controlcatalysts (see page 29). In addition, aproject to understand potential implicationsof water stress to our operations wascarried out as described on page 74.
79

Business Integrity and Ethics
Johnson Matthey strives to maintain thehighest standards of ethical conduct andcorporate responsibility worldwide toensure we act with integrity, transparencyand care for the rights of the individualwherever we do business. The group’sethical principles and standards are set outin its Business Integrity and Ethics Policywhich applies to all the group’s employees.
View the policy online atwww.matthey.com/sustainability.
The board and its committees, theChairman, the Chief Executive and theother individual directors all play key roles,together with management, in the promotionand monitoring of ethical behaviour andthe safeguarding of the group’s reputation.
Compliance training is provided toemployees to support their understandingof, and commitment to, group policies inorder to protect and enhance thecompany’s reputation. The trainingeducates managers in their responsibilitiesfor employees, commercial contracts andcompany assets and is delivered globallyvia online learning programmes, face toface seminars and individual training.Online compliance training for employeesaddresses the bribery and corruption,money laundering and competition risksfaced by the group.
All facilities have established policiesand procedures for employees to raiseemployment related issues for considerationand resolution.
A confidential, secure, externally-run‘whistleblowing’ website and telephonehelpline are also in place to give allemployees additional means to raise anyissue of concern. The website offersmultilingual access and allows for writtenor telephone reports. The site is publicisedvia site notice boards and the company’scorporate intranet site. Reports receivedthrough the website and helpline (as wellas any received through other media,such as email, telephone or letter) areappropriately investigated in accordancewith the Group Human Resources Policyon Whistleblowing. Responses andoutcomes are posted on the website, orare communicated to employees via otherinternal media, such as site notices orbriefings. For the group as a whole, therewas a total of eight new whistleblowingreports in the calendar year 2011 and allbut two have been resolved as at the dateof publication of this annual report.
Governance continued
Supply Chain Management
Management of supply chain andcontractor activities is a core componentof the ISO 9000 and ISO 14000 series ofstandards. Supply chain and contractormanagement questionnaires are arequirement for achieving and maintainingregistration and, as such, ISO registeredJohnson Matthey operations require thecompletion of appropriate questionnaires.For those operations without ISOregistration, the group EHS managementsystem provides policy and guidance onsupply chain management and contractorcontrol.
The group’s Ethical and SustainableProcurement Policy provides clearguidance on various topics including thoserelating to the selection of suppliers,auditing against standards and ethicalconduct with suppliers.
View the policy online atwww.matthey.com/sustainability.
Johnson Matthey is confident of thehuman rights performance of its ownoperations but recognises that businesspractices in the supply chain are notalways transparent and represent a riskthat must be managed. Every effort ismade to ensure the issues are managedeffectively. We support the principlesdefined within the United Nations UniversalDeclaration of Human Rights and theInternational Labour Organisation CoreConventions including the conventions in relation to child labour, forced labour,non-discrimination, freedom of associationand collective bargaining. Compliance withand respect for these core principles areintegrated within the risk assessmentprocedures and impact assessmentswhich are undertaken when entering intobusiness in a new territory and within thedue diligence processes when making anacquisition or entering a joint venture.
Johnson Matthey’s North Americanbusinesses have developed a Conflict FreeMinerals Policy in response to US legislativemoves to address reports on the role ofconflict minerals in financing human rightsviolations in the Democratic Republic of theCongo. The policy was published in March2011. In January 2012, these businessesalso issued a Slavery and Human TraffickingPolicy in response to the CaliforniaTransparency in Supply Chains Act 2010.Both policies are available on thecompany’s website.
View the policies online atwww.matthey.com/sustainability.
Environment, Health and Safety
Johnson Matthey is committed to providingthe highest level of protection to theenvironment and to safeguarding the health,safety and wellbeing of its employees,customers, communities and otherstakeholders. This is supported by policies,a comprehensive management system,governance, careful risk assessment,auditing and training which promotecontinuous improvement and ensure thathigh standards are achieved at sitesworldwide. In addition, all facilities havedeveloped local policies to meetinternational, national, local and corporaterequirements.
The Environment, Health and SafetyPolicy is a written statement, formulatedand agreed by the CEC. Signed by theChief Executive, it is available at all sitesand forms the basis of the group EHSmanagement system.
View the policy online atwww.matthey.com/sustainability.
The group EHS management systemis available to all employees via the groupintranet. It is regularly reviewed and,together with the corporate policies andobjectives, it defines accountability andsets the standards against whichconformance audits are assessed.
EHS compliance audits are conductedto maintain continuous improvement andall Johnson Matthey operated manufacturingand research and development facilitiesare included in the audit programme. Auditfrequency for each facility is determined by the scale, inherent risk and pastperformance of the operation. Audits arecarried out by experienced ISO qualifiedEHS professionals and controlled by theGroup EHS Assurance Director. Healthmanagement reviews are undertaken everythree to four years at all operational sites.They are conducted by the Director ofGroup Health who provides consultingadvice to support the prioritisation andplanning of programmes to optimiseworkplace health and promote workforcesustainability. In addition, all businessesundertake annual health managementimprovement planning to adjust healthprogrammes to meet changing businessneeds.
At each board meeting, the boardreviews group EHS performance reportsfor the prior months. These reports set outthe group’s EHS performance in terms ofaccident and incidence rates, lost workdays and the rolling all lost time accidentrate. The reports also contain information
Johnson Matthey Annual Report & Accounts 2012Report of the Directors – GovernanceGovernance
80

from the businesses across the group onlost time accidents, as well as details ofany contractor incidents, occupationalillness, sickness absence and any regulatoryaction. The board reviews EHS strategyand reviews the EHS assurance processon an annual basis.
All EHS audit reports, including healthmanagement reviews, are reviewed bythe CSR Compliance Committee andappropriate follow up actions are takenon outstanding issues. During 2011/12 atotal of 26 detailed compliance audits and19 one day audit action reviews werecompleted. Health management reviewswere conducted at 16 facilities.
A variety of training programmes arein place to support continuous improvementin EHS performance and regular meetingsare held in Europe, North America and Asiato enable the group’s EHS professionals tonetwork, share best practice and discussthe impact of future EHS legislation.
Human Resources
The group’s human resources standardsare progressive, consistent and aimed atbringing out the best in our people.
Group policies are supported bydetailed regional and individual businessprocedures which are regularly updated toreflect both regional best practice and locallegislation. Site specific human resourcespolicies and procedures are communicatedto staff at inductions and through staffhandbooks. Human resources policies andrisks are examined by the CEC and theCSR Compliance Committee.
The group’s policies on equalopportunities and training are publishedon the company’s website and are alsodetailed below.
View the policies online atwww.matthey.com/sustainability.
In line with our Equal OpportunitiesPolicy, we recruit, train and developemployees who meet the requirements ofthe job role regardless of gender, ethnicorigin, age, religion, sexual orientation ordisability. The policy recognises that peoplewith disabilities can often be denied a fairchance at work because of misconceptionsabout their capabilities and seeks toenhance the opportunities available byattempting, wherever possible, to overcomeobstacles, such as the need to modifyequipment, restructure jobs or to improveaccess to premises, provided such actiondoes not compromise health and safetystandards.
Similarly, employees who becomedisabled during their employment will beoffered employment opportunitiesconsistent with their capabilities. We valuethe diversity of our people as a corecomponent of a sustainable business andemployment applications are welcomedand encouraged from all sections of thecommunity including minority groups.
The Management Development andRemuneration Committee takes a specialinterest in ensuring compliance with theTraining and Development Policy objectivesin order to:
• Ensure highest standards in therecruitment of employees
• Assess training needs in the light ofjob requirements
• Ensure relevance of training and linkwith business goals
• Employ and evaluate effective andefficient training methods
• Promote from within, from highpotential pools of talent
• Understand employees’ aspirations
• Provide development opportunitiesto meet employees’ potential andaspirations.
View the policy online atwww.matthey.com/sustainability.
Following the development last yearof a ten year human resources strategy tosupport business growth over the nextdecade, the focus now is on significantrecruitment in our operations in Asia as ourbusinesses in the region continue to expand.
. Sustainability initiatives at Johnson Matthey’s sites around the worldare focused on improving resource efficiency and developing moresustainable products.
. Development of new products for automotive glassapplications at our Colour Technologies business’technology centre in Maastricht, the Netherlands.

Board of Directors
Johnson Matthey Annual Report & Accounts 2012Report of the Directors – GovernanceGovernance
82
1
4 5 6
7 8 9
2 3

1. Tim Stevenson OBEChairman, age 64; joined Johnson Matthey as ChairmanDesignate in March 2011; appointed Chairman in July 2011.Has been Chairman of The Morgan Crucible Company plcsince December 2006 and was Chairman of Travis Perkins plcfrom November 2001 to May 2010. From 1975 to 2000 heheld a variety of senior management positions at BurmahCastrol plc, including Chief Executive from 1998 to 2000.He is a qualified barrister and is Lord Lieutenant of Oxfordshire.M, N
2. Neil Carson BScChief Executive, age 55; joined Johnson Matthey in 1980;appointed Division Director, Catalytic Systems in 1997 afterhaving held senior management positions in the PreciousMetals Division as well as Catalytic Systems in both the UKand the US. Appointed to the board as Managing Director,Catalysts & Chemicals in August 1999 and additionallyassumed board level responsibility for Precious MetalsDivision in August 2002. Appointed Chief Executive in July2004. Currently a non-executive director of AMEC plc.
3. Robert MacLeodGroup Finance Director, age 48; joined Johnson Matthey asGroup Finance Director Designate in June 2009 and assumedhis current role in September 2009. Previously he was GroupFinance Director of WS Atkins plc and worked in a variety ofsenior financial roles at Enterprise Oil plc. He is currently anon-executive director of Aggreko plc. He is a CharteredAccountant.
4. Michael RoneySenior Independent Director and Chairman of theManagement Development and Remuneration Committee,age 57; appointed a non-executive director in June 2007.Currently Chief Executive of Bunzl plc. Joined Bunzl plc asa non-executive director in 2003. Prior to becoming ChiefExecutive of Bunzl he was the Chief Executive Officer ofGoodyear Dunlop Tires Europe BV and had an extensivecareer with the Goodyear Tire and Rubber Co holding anumber of senior management positions with responsibilitiesin Latin America, Asia, Eastern Europe, the Middle East andAfrica. A, M, N
5. Alan FergusonChairman of the Audit Committee, age 54; appointeda non-executive director in January 2011. Currently anon-executive director of Croda International Plc andThe Weir Group PLC (where he is chairman of theirrespective audit committees). He was previously ChiefFinancial Officer and a Director of Lonmin Plc. He left Lonminin December 2010. Prior to joining Lonmin, he was GroupFinance Director of The BOC Group until late 2006 whenthe Linde Group acquired BOC. Before joining BOC in 2005,he worked for Inchcape plc for 22 years in a variety of rolesincluding Group Finance Director from 1999 until hisdeparture. He is a Chartered Accountant. A, M, N
6. Sir Thomas Harris KBE CMGAge 67; appointed a non-executive director in April 2009.Currently Vice Chairman of Standard Chartered Bank, anon-executive director of SC First Bank (Korea), City UK andthe UK India Business Council. Until 2004, he was DirectorGeneral of Trade & Investment USA responsible for Britishbusiness and technology promotion throughout the UnitedStates. He served previously as British Ambassador to theRepublic of Korea in Seoul, Deputy High Commissioner inLagos, Nigeria and Commercial Counsellor in the BritishEmbassy in Washington DC. A, M, N
7. Dorothy ThompsonAge 51; appointed a non-executive director in September2007. Currently Chief Executive of Drax Group plc. Joinedthe board of Drax Group plc as Chief Executive in 2005. Priorto joining Drax she was head of the European business ofthe global power generation firm, InterGen. First starting hercareer in banking she has had senior management roles inthe UK, Asia and Africa. A, M, N
8. Larry Pentz BS ChE, MBAExecutive Director, Environmental Technologies, age 57;joined Johnson Matthey in 1984; appointed Division Director,Process Catalysts and Technologies in 2001 after having helda series of senior management positions within CatalystsDivision in the US. Appointed Executive Director, ProcessCatalysts and Technologies in August 2003, ExecutiveDirector, Emission Control Technologies in July 2004 and tohis current position in April 2009. Currently a non-executivedirector of Victrex plc.
9. Bill Sandford BAExecutive Director, Precious Metal Products, age 59; joinedJohnson Matthey in 1977; appointed Division Director,Precious Metal Products in 2001 after holding a series ofsenior management positions within the division. AppointedExecutive Director, Precious Metal Products in July 2009.
Committees of the BoardA Audit CommitteeM Management Development and Remuneration CommitteeN Nomination Committee
Simon FarrantCompany Secretary; joined Johnson Matthey from corporate legalpractice in 1994. Appointed Company Secretary in 1999 andGroup Legal Director in 2007. He is a Solicitor and Attorney &Counselor-at-Law (State of New York).
83

Corporate Governance Report
Johnson Matthey Annual Report & Accounts 2012Report of the Directors – GovernanceGovernance
84
85 The UK Corporate Governance Code85 Statement of Compliance with the Provisions of the Code
85 Leadership85 The Role of the Board86 The Roles of the Chairman and the Chief Executive
and Division of Responsibilities86 The Role of the Executive Directors86 The Role of the Non-Executive Directors87 The Role of the Senior Independent Director87 The Role of the Company Secretary87 Board Meetings88 Board Committees88 Board Committee Membership89 Board Committee Terms of Reference91 Board and Committee Attendance91 The Chief Executive’s Committee
91 Effectiveness91 The Composition of the Board92 Appointments to the Board and its Committees92 Succession Planning92 Boardroom Diversity93 Board Balance – Independence of the Non-Executive
Directors and of the Chairman94 Time Commitment of the Chairman and of the
Non-Executive Directors94 Terms of Appointment of the Non-Executive Directors94 Annual Re-Election of Directors94 Information and Support94 Independent Professional Advice94 Director Induction, Familiarisation, Training and Development95 Indemnification of Directors and Insurance95 Directors’ Conflicts of Interest96 Evaluation of the Board, Board Committees and Directors97 Review of the Chairman’s Performance
97 Accountability97 The Audit Committee97 Financial and Business Reporting97 Risk Management and Internal Control
98 Remuneration
98 Relations with Shareholders98 Dialogue with Shareholders98 Reporting of Results, Interim Management Statements
and the Investor Day99 Shareholder Contact99 Annual General Meetings
Contents>

85
This section of the annual report discussesthe company’s corporate governancestructures and processes.
The UK Corporate GovernanceCodeThe UK Corporate Governance Code (theCode), issued by the Financial ReportingCouncil (FRC) in June 2010, contains broadprinciples together with more specificprovisions which set out standards of goodpractice in relation to board leadership andeffectiveness, remuneration, accountabilityand relations with shareholders. Listedcompanies, such as Johnson Matthey, arerequired to report on how they have appliedthe main principles of good governance setout in the Code and either to confirm thatthey have complied with the Code’sprovisions or to provide an explanationwhere they have not. The Code replaced theprevious Combined Code on CorporateGovernance and applied to the companythroughout the year ended 31st March 2012.
In his statement on pages 6 and 7,the Chairman comments on how the Codeprinciples relating to the role and effectivenessof the board (in Sections A (Leadership) andB (Effectiveness) of the Code) have beenapplied throughout the year ended31st March 2012.
This Corporate Governance Report,together with the Nomination CommitteeReport on page 105, the Audit CommitteeReport on pages 106 and 107 and theRemuneration Report on pages 108 to 117,describes how the company has compliedwith the provisions of the Code and appliedthe main principles set out in the Codeduring the year ended 31st March 2012.
Statement of Compliance withthe Provisions of the CodeExcept as referred to below, the companyhas complied with all relevant provisionsof the Code throughout the year ended31st March 2012 and from that date up tothe date of publication of this annual report.
The company has not complied withpart of Code provision E.1.1, which providesthat “the senior independent director shouldattend sufficient meetings with a range ofmajor shareholders to listen to their viewsin order to help develop a balancedunderstanding of the issues and concernsof major shareholders”. The board considersthat there are appropriate mechanisms forthe views of shareholders to be listened toand communicated to the board as a whole,without it being necessary for the SeniorIndependent Director to attend meetingswith major shareholders. The SeniorIndependent Director is, however, availableto attend such meetings if requested byshareholders. The board believes that itspractices in this respect are both consistentwith the relevant main principle of the Codeconcerning dialogue with shareholders, towhich the Code provision relates, andconsistent with good governance. Moreinformation on relations with shareholdersis set out on pages 98 and 99.
Leadership
The Role of the BoardThe names and biographical details of allthe members of the board including detailsof their relevant experience and othersignificant commitments are set out onpage 83.
The board’s role is to provideleadership of the company and directionfor management. It is collectively responsibleand accountable to the company’sshareholders for the long term success ofthe group and for ensuring the appropriatemanagement and responsible operation ofthe group in pursuit of its objectives. Theboard reviews management performanceand the operating and financial performanceof the group as a whole. The board isresponsible for ensuring that the necessaryresources are provided for the company tomeet those objectives.
The board sets, and is collectivelyresponsible to the company’s shareholdersfor the achievement of, the group’s strategicobjectives and it determines the nature andextent of the significant risks it is willing totake in order to achieve those objectives.Strategy is discussed in detail on pages 12to 15. The process for the consideration ofrisk is discussed on pages 20 to 21.
The board approves the group’sgovernance structures and reviews thegroup’s internal control and risk managementframework to ensure that they are prudentand effective and that risk is able to beassessed, monitored and managed. Theboard is collectively responsible to thecompany’s shareholders for the group’ssystem of corporate governance and isultimately accountable for the group’sactivities, strategy, risk management andfinancial performance, for stewardship ofthe group’s resources and for social,environmental and ethical matters.
Key matters for board decision includeapproval of the annual group operating andcapital expenditure budgets and annualgroup three year plan, as well as the groupstrategy. The board also approvesannouncements of the group’s results,the Annual Report and Accounts, thedeclaration of the interim dividend andrecommendation of the final dividend. Theboard is responsible for considering andapproving major capital projects, majoracquisitions and major disposals of assetsor operations in excess of definedthresholds.
In discharging its responsibilities theboard seeks to set, promote anddemonstrate adherence to clear values andethical standards for the group. The boardalso remains cognisant of the need toobserve the duties owed by directors in law,including the overriding duty for each directorto act in the way he or she considers, ingood faith, will be most likely to promote thesuccess of the company for the benefit of itsmembers as a whole, whilst balancing theinterests of stakeholders (the company’sshareholders, the group’s employees,suppliers and customers and the broadercommunity).
The board determines the structure,size and composition of the board,appointments to the board, selection of the Chairman and the Chief Executive,appointment of the Senior IndependentDirector and membership and chairmanshipof board committees. The board has overallresponsibility for succession planning for theChief Executive and the other executive andnon-executive directors and is involved insuccession planning for senior management.Further information on the successionplanning process is set out on page 92.
Certain types of decision are taken bythe board and others are delegated by theboard to executive management. A formalschedule of matters specifically reserved forboard decision has been adopted by theboard. This is set out in full in the InvestorRelations / Corporate Governance sectionof the company’s website.

Corporate Governance Report continued
Johnson Matthey Annual Report & Accounts 2012Report of the Directors – GovernanceGovernance
86
The board discharges itsresponsibilities through an annualprogramme of board and other meetings.Through a planned programme of boardagendas, referred to further under ‘The Role ofthe Chairman’ below, the board ensures thatall necessary matters are discussed. Theboard is afforded sufficient time for debateand challenge, particularly in respect ofstrategy and risk, including risk appetite.The board also seeks to allow sufficientopportunity for the review of past decisionswhere necessary. At board meetings, theboard receives and considers papers andpresentations from management in respectof matters under review. Effective review anddecision making is supported by provisionto the board of high quality, accurate, clearand timely information and the obtaining bythe board of expert and independentopinion, analysis and advice where necessary(see ‘Information and Support’ on page 94).The board’s processes in respect of conflictsof interest are dealt with under ‘Directors’Conflicts of Interest’ on pages 95 and 96.The board delegates certain specificresponsibilities to board committees, asdescribed under ‘Board Committees’ onpage 88.
The Roles of the Chairman andthe Chief Executive and Divisionof ResponsibilitiesTim Stevenson was appointed Chairmanwith effect from the close of the 2011Annual General Meeting on 19th July 2011,having been appointed to the board on29th March 2011. Mr Stevenson’sbiographical details including details of hisrelevant experience and other significantcommitments are set out on page 83.
Neil Carson was appointed ChiefExecutive in July 2004. Mr Carson’sbiographical details including details of hisrelevant experience and other significantcommitments are set out on page 83.
There is a clear division ofresponsibilities between the running of theboard and the executive responsibility forthe running of the company’s business. Noone individual has unfettered powers ofdecision. The roles of Chairman and ChiefExecutive are separate and the division ofresponsibilities between these roles is clearlyestablished in a written statement adoptedby the board on 28th April 2005. This is setout in full in the Investor Relations /Corporate Governance section of thecompany’s website.
The Role of the ChairmanThe Chairman leads the board. He isresponsible for creating the conditions for,and for ensuring, an effective board andeffective contributions from individualdirectors, particularly non-executive directors,based on a culture of mutual respect,openness, debate and constructive challenge.To achieve this it is necessary for theChairman to facilitate and encourage opencommunication and constructive workingrelations between the executive and non-executive directors. The Chairmanseeks to ensure that the executive directorsare open and responsive to constructivechallenge by the non-executive directors ofexecutive proposals. The Chairman is infrequent contact with the Chief Executive,meeting face to face or by telephone at leastonce each week. The Chairman also keepsthe non-executive directors up to date withsignificant developments between boardmeetings. The Chairman is also responsiblefor ensuring effective communication withshareholders and this is discussed furtherunder ‘Relations with Shareholders’ onpages 98 and 99.
The Chairman sets the board’s agendaand ensures that adequate time is dedicatedfor discussion of all agenda items, particularlystrategic issues and risk appetite. Since hisappointment as Chairman in July 2011,Mr Stevenson has led a detailed process ofboard agenda review and planning, workingwith the Company Secretary, the chairmen ofthe board committees and the Chief Executive.During the year, the board approved anannual agenda plan designed to ensure thatall necessary matters are reserved for boarddecision and are afforded adequate time fordiscussion throughout the year. Particularattention has been paid to ensuring thatsufficient time is made available for thediscussion of strategy in order to allow theopportunity for the non-executive directorsto challenge and help develop strategyproposals. Strategy is discussed in detail onpages 12 to 15. The Chairman monitors, withassistance from the Company Secretary, theinformation distributed to the board toensure that it is of high quality, accurate,clear and timely.
During the year ended 31st March2012, the Chairman met with the non-executive directors without theexecutives being present in order to review executive director performance.
The Role of the Chief ExecutiveThe Chief Executive has day to daymanagement responsibility for the runningof the group’s operations, for the applicationof group policies and for the implementationof group strategy and policies agreed by theboard. The board has given the ChiefExecutive broad authority to operate thebusiness of the group and he is accountablefor, and reports to the board on, theperformance of the business. The ChiefExecutive also has a key role in the processfor the setting and review of strategy. Morebroadly, the Chief Executive promotes thecompany’s culture and standards, includingappropriate governance standards,throughout the group. In addition, heensures that the views of the executivedirectors on business issues and, asappropriate, employees’ views on relevantissues are communicated to the board in abalanced way.
In carrying out his responsibilities, theChief Executive is supported by the GroupFinance Director who, together with theChief Executive, is responsible amongstother things for ensuring that high qualityinformation is provided to the board on thecompany’s financial performance.
The Role of the ExecutiveDirectorsThe biographical details of the executivedirectors and details of their relevantexperience and other significantcommitments are set out on page 83.
The executive directors have specificexecutive responsibilities but as directors theirduties extend to the whole of the group’soperations and activities and are not confinedto the parts of the business encompassedby their specific executive roles.
The Role of the Non-ExecutiveDirectorsThe biographical details of the non-executivedirectors including details of their relevantexperience and other significantcommitments are set out on page 83.
The role of the non-executive directors isto scrutinise the performance of managementin meeting agreed goals and objectives andto monitor the reporting of performance.Their role is also to satisfy themselves onthe integrity of financial information and thatfinancial and non-financial controls andsystems of risk management are robust and defensible.

87
As members of the board, thenon-executive directors have a key rolein constructively challenging in all areasand this is vital to the independence andobjectivity of the board’s deliberationsand decision making. This is particularlyimportant in helping develop proposalson strategy. The Chief Executive and the other executive directors are open andresponsive to constructive challenge bythe non-executive directors of executiveproposals. Non-executive directors alsohave an important part to play in supportingthe Chairman and the executive directors ininstilling the company’s culture, values andstandards within the board and morebroadly within the group.
As chairmen of the board committees(Michael Roney of the ManagementDevelopment and Remuneration Committeeand Alan Ferguson of the Audit Committee),the non-executive directors fulfill importantleadership roles. The non-executive directorsare also responsible for determiningappropriate levels of remuneration for theexecutive directors and have a prime role inappointing and, where necessary, removingexecutive directors, and in successionplanning. Further information on successionplanning is set out on page 92.
The Role of the SeniorIndependent DirectorMichael Roney was appointed by the boardas the Senior Independent Director witheffect from the close of the 2011 AnnualGeneral Meeting on 19th July 2011.
The role of a Senior IndependentDirector is to provide a sounding board forthe Chairman, to serve as a focal point andintermediary for the concerns of the othernon-executive directors when necessaryand to ensure that any key issues not beingaddressed by the Chairman or the executivemanagement are taken up. While no suchcircumstances have arisen in respect of thecompany, the board and the SeniorIndependent Director recognise that theSenior Independent Director may, ifcircumstances dictate, be required to workwith the Chairman or others or to interveneto resolve any significant issues arisingwhich threaten the stability of the companyor the board.
The Senior Independent Director isavailable to shareholders should they haveconcerns which contact through the normalchannels of Chairman, Chief Executive orother executive directors has failed toresolve or for which such contact may beinappropriate. He is available to attendmeetings with major shareholders to listento their views in order to help develop abalanced understanding of their issues andconcerns.
The Senior Independent Director playsan important role in respect of successionto the group chairmanship by ensuring thereis an orderly succession process. AlanThomson, the then Senior IndependentDirector, led the work of the NominationCommittee in selecting and appointing asuccessor to Sir John Banham as Chairmanof the board.
The Senior Independent Director isresponsible for leading the annual appraisalof the Chairman’s performance and this isdiscussed further under ‘Review of theChairman’s Performance’ on page 97.
The Role of the CompanySecretarySimon Farrant was appointed CompanySecretary on 1st May 1999. He is secretaryto the board and all of its committees.Mr Farrant’s biographical details are set outon page 83.
The Company Secretary reports to theChairman on board governance matters.Together with the Chairman he keeps theefficacy of the company’s and the board’sgovernance processes under review andconsiders improvements. He is alsoresponsible to the board in respect ofcompliance with board procedures. He isresponsible, through the Chairman, foradvising and keeping the board up to dateon all legislative, regulatory and governancematters and developments. Under thedirection of the Chairman, the CompanySecretary’s responsibilities include ensuringgood information flows within the board and its committees and between seniormanagement and non-executive directors,as well as facilitating induction and assistingwith professional development as required.The advice, services and support of theCompany Secretary are available to allindividual directors.
Board MeetingsThe board meets regularly throughout theyear in order to effectively discharge its duties.
During the year ended 31st March 2012the board met seven times. The board metonce between 31st March 2012 and thedate of publication of this annual report.
At its meeting on 29th September2011, the board reviewed and approved theboard agenda plan for 2012/13 and forsubsequent years. The board agreed thatthe business usually conducted at themeeting held in early May each year couldbe conducted at other meetings during theyear and that such a meeting was not,therefore, required or necessary.Accordingly, the board has agreed to reducethe number of meetings it holds each yearto six by eliminating its meeting in early May.The board will keep the efficacy of thischange under review.
During the year ended 31st March2012, the board met outside the UK on one occasion, in September 2011, inPhiladelphia, USA when it visited FineChemicals’ active pharmaceutical ingredients(API) manufacturing facility at Riverside,Conshohocken, Pennsylvania.

The board ensures that its committeesare provided with sufficient resources toundertake their duties, including access tothe services of the Company Secretary asrequired. Each board committee has theauthority to seek any information that itrequires from any officer or employee of thecompany or its subsidiaries. In connection
Corporate Governance Report continued
with its duties, each committee is authorisedby the board to take such independentadvice (including legal or other professionaladvice), at the company’s expense, as itconsiders necessary. Each committee mayrequest information from, or commissioninvestigations by, external advisers.
The board committees formally reportto the board on their proceedings after eachmeeting and generally on all matters andactivities for which they are responsiblethrough the committee chairmen and viacommittee minutes.
Johnson Matthey Annual Report & Accounts 2012Report of the Directors – GovernanceGovernance
88
Board Committee MembershipEach independent non-executive director is a member of each board committee. No one other than the board committee chairmen andmembers is entitled to be present at a meeting of the Nomination Committee, the Audit Committee or the MDRC. Others may attend,however, at the invitation of the board committee. Executive directors are not members of the board committees. The Company Secretaryis secretary to each of the board committees.
Alan Ferguson was appointed as Chairman of the Audit Committee with effect from the close of the 2011 Annual General Meeting, havingbeen appointed as a non-executive director on 13th January 2011. Michael Roney took over the chairmanship of the Management Developmentand Remuneration Committee, also with effect from the close of the 2011 Annual General Meeting.
The current membership of the board committees is shown below:
Nomination Committee Audit Committee MDRC
Tim Stevenson Chairman Invited to attend MemberNeil Carson Invited to attend Invited to attend Invited to attendAlan Ferguson Member Chairman MemberSir Thomas Harris Member Member MemberRobert MacLeod – Invited to attend –Larry Pentz – – –Michael Roney Member Member ChairmanBill Sandford – – –Dorothy Thompson Member Member Member
The board takes into account the value of ensuring that board committee membership is refreshed when deciding chairmanship andmembership of the committees, and in doing so seeks to ensure that undue reliance is not placed on particular individuals.
Board CommitteesThe board has established the following committees:
• The Nomination Committee
• The Audit Committee
• The Management Development and Remuneration Committee (MDRC).
The Nomination Committee Report is on page 105, the Audit Committee Report is on pages 106 and 107 and the Remuneration Report,which describes the work of the MDRC, is on pages 108 to 117.
The reporting framework of the board committees and of the Chief Executive’s Committee and its sub-committees is shown below.
Key:Board CommitteesExecutive Committees
NOMINATIONCOMMITTEE
ChairmanTim Stevenson
CSRComplianceCommittee
IT CommitteeContracts
ReviewCommittee
Financeand
AdministrationCommittee
MDRCChairmanMichaelRoney
AUDITCOMMITTEE
ChairmanAlan Ferguson
BOARDChairman
Tim Stevenson
Chief Executive
Chief Executive’s Committee

89
Board Committee Terms of ReferenceEach board committee has written terms of reference which have been approved by the board and are reviewed periodically to ensure thatthey comply with the latest legal and regulatory requirements and reflect developments in best practice. The terms of reference of the AuditCommittee were reviewed in detail during the year ended 31st March 2012 in order, in part, to reflect the recommendations of the Code.Its amended terms were adopted by resolution of the board on 22nd November 2011.
The terms of reference of each board committee can be found in the Investor Relations / Corporate Governance section of the company’swebsite, or may be obtained from the Company Secretary. The following is a summary of the terms of reference of each board committee:
NOMINATION COMMITTEE
Responsibilities Advising the board and making recommendations to the board on the appointment and, if necessary,the removal of executive and non-executive directors
Membership All the independent non-executive directors and the group Chairman
Chairman The group Chairman, Tim Stevenson (the group Chairman may not chair the committee when it is dealingwith the matter of succession to the chairmanship of the company)
Attending by invitation The Chief Executive, the Group Director, Human Resources and Environment, Health and Safety and external advisers when appropriate
Quorum Two members, each of whom must be independent non-executive directors
Number of meetings per year As required
Committee report Page 105
AUDIT COMMITTEE
Responsibilities Financial Reporting• Monitoring the integrity of the group’s reported financial information and reviewing significant financial
reporting issues and judgments which they contain
Internal Control and Risk Management Systems• Keeping under review the adequacy and effectiveness of the group’s internal financial controls and
internal control and risk management systems
• Reviewing the company’s procedures for handling allegations from whistleblowers
Internal Audit• Monitoring and reviewing the effectiveness of the group’s internal audit function and approving the
appointment and removal of the head of the internal audit function
• Considering and approving the remit of the internal audit function
• Reviewing and approving the annual internal audit plan
• Reviewing internal audit reports
External Audit• Considering and making recommendations to the board, to be put to shareholders for approval at
the annual general meeting, in relation to the appointment, reappointment and removal of theexternal auditor
• Overseeing the relationship with the external auditor including approving its fee for audit servicesand its terms of engagement, assessing annually the effectiveness of the audit process and theindependence and objectivity of the external auditor, taking into account the provision of anynon-audit services
• Developing and implementing a policy on the supply of non-audit services by the external auditorand keeping this policy and any fees paid to the external auditor in respect of the supply of non-auditservices under review
• Meeting regularly with the external auditor, including at least once a year, without management beingpresent, to discuss its remit and any issues arising from the audit
• Reviewing and approving the annual external audit plan and reviewing the findings of the audit withthe external auditor

Corporate Governance Report continued
Johnson Matthey Annual Report & Accounts 2012Report of the Directors – GovernanceGovernance
90
Board Committee Terms of Reference (continued)
AUDIT COMMITTEE (continued)
Membership All the independent non-executive directors, at least one of whom is required to have recent and relevantfinancial experience. The group Chairman is not a member
Chairman Alan Ferguson. The chairman is required to be an independent non-executive director
Attending by invitation The group Chairman, the Chief Executive, the Group Finance Director, the Head of Internal Audit and Riskand representatives from finance and other group functions as and when appropriate and necessary. Theexternal auditor is invited to attend on a regular basis. The chairman of the committee may request theattendance of others at meetings including external advisers and, if so requested, executive directors willalso make themselves available
Quorum Two members
Number of meetings per year At least four per year at appropriate times in the reporting and audit cycle and otherwise as required
Committee report Pages 106 and 107
THE MANAGEMENT DEVELOPMENT AND REMUNERATION COMMITTEE (MDRC)
Responsibilities • Determining on behalf of the board fair remuneration for the Chief Executive, the executive directorsand the group Chairman, which, while set in the context of what the company can reasonably afford,recognises their individual contributions to the company’s overall performance
• Assisting the board in ensuring that the current and future senior management of the group arerecruited, developed and remunerated in appropriate fashion
• Determining the remuneration and terms and conditions of employment (including in respect ofpension entitlement) of the Chief Executive and the executive directors and the remuneration andterms of appointment of the group Chairman
• Reviewing the proposals of the executive for recommendation to the board on share optionschemes, executive bonus / incentive schemes and employee share participation schemes
• Reviewing training, development and succession plans for senior management of the company
• Reviewing the disclosure to be made of directors’ remuneration in the annual report
Membership All the independent non-executive directors and the group Chairman
Chairman Michael Roney. The chairman of the committee is required to be an independent non-executive director
Attending by invitation The Chief Executive, the Group Director, Human Resources and Environment, Health and Safety (exceptwhen their own performance and remuneration are discussed) and external advisers when appropriate
Quorum Two members
Number of meetings per year At least two per year and at such other times as the chairman of the committee requires
Committee report Remuneration Report on pages 108 to 117

91
Board and Committee AttendanceThe attendance of members at board and board committee meetings in the year ended 31st March 2012 was as follows:
Board Nomination Committee Audit Committee MDRCEligible to Eligible to Eligible to Eligible to
Director attend Attended attend Attended attend Attended attend Attended
Tim Stevenson 7 6(2) 2 1 (2) – 4(1) 4 3(2)
Sir John Banham 3 3 1 1 – 2(1) 2 2Neil Carson 7 7 – 2(1) – 4(1) – –Alan Ferguson 7 7 2 2 4 4 4 4Sir Thomas Harris 7 7 2 1(3) 4 4 4 4Robert MacLeod 7 7 – – – 4(1) – –Larry Pentz 7 7 – – – – – –Michael Roney 7 6(4) 2 2 4 3(4) 4 3(4)
Bill Sandford 7 7 – – – – – –Dorothy Thompson 7 7 2 2 4 4 4 4Alan Thomson 3 3 1 1 2 2 2 2Robert Walvis 3 3 1 1 2 2 2 2
Notes(1) Includes meetings attended by invitation for all or part of meeting.
(2) Tim Stevenson was unable to attend the board meeting and the meetings of the Nomination Committee and the MDRC on 10th May 2011 as the date coincided with the annual generalmeeting of The Morgan Crucible Company plc of which he is Chairman.
(3) Sir Thomas Harris did not attend the meeting of the Nomination Committee on 29th March 2012, at which the matter of the appointment of an additional non-executive director followinghis prospective retirement from the board was discussed.
(4) Michael Roney was unable to attend the board meeting on 19th July 2011, the 2011 Annual General Meeting held later that day or the meetings of the Audit Committee and the MDRCheld on the previous day because of coinciding commitments at Bunzl plc, where he is Chief Executive.
Where directors are unable to attend aboard or board committee meeting, theycommunicate their comments andobservations on the matter to be consideredin advance of the meeting via the groupChairman, the Senior Independent Directoror the relevant board committee chairmanfor raising as appropriate at the meeting.
Individuals’ attendance at board andboard committee meetings is considered, asnecessary, during the one to one meetingsconducted by the Chairman with directorsas part of the formal annual review of theirperformance. Further information onperformance evaluation is given under‘Evaluation of the Board, Board Committeesand Directors’ on pages 96 and 97.
The Chief Executive’s Committee In discharging his responsibilities, the ChiefExecutive is assisted by the Chief Executive’sCommittee (CEC). The CEC is amanagement committee chaired by theChief Executive. It is responsible for therecommendation to the board of strategicand operating plans and on makingrecommendations on matters reserved to the board where appropriate. It isresponsible for the executive managementof the group’s businesses.
During the year ended 31st March 2012the CEC comprised the Chief Executive;the Group Finance Director; the two otherexecutive directors; the division directorswho do not sit on the board; the Group
Director, Corporate and StrategicDevelopment; the Group Director, HumanResources and Environment, Health andSafety; and the Company Secretary andGroup Legal Director.
During the year ended 31st March2012, the CEC met eight times. In order to more effectively use the time of itsmembers, the CEC no longer meets formallyevery month (except in August) and afterSeptember 2011 moved to a programmeof meeting formally every other month andinformally on such other occasions as maybe necessary.
The CEC has a number ofsub-committees as referred to furtheron page 88.
Effectiveness
The Composition of the BoardThe board comprises the Chairman (Tim Stevenson), the Chief Executive (Neil Carson), three other executive directors (Robert MacLeod, Larry Pentz and Bill Sandford), and four independent non-executive directors (Alan Ferguson, Sir Thomas Harris, Michael Roney andDorothy Thompson).
The board seeks to ensure that bothit and its committees have the appropriaterange and balance of skills, experience,knowledge and independence to enablethem to discharge their respective duties and
responsibilities effectively. Further informationon board and committee appointments isset out on page 92 under ‘Appointments tothe Board and its Committees’ and in theNomination Committee Report on page 105.
The board is of the view that it is ofa size such that the requirements of thebusiness can be met, that changes to theboard’s composition and that of itscommittees can be managed without unduedisruption, and that it is not so large as tobe unwieldy. The board is also of the viewthat it includes an appropriate combinationof executive and non-executive directors(and, in particular, independent non-executivedirectors). The size of the board, as well asits composition, is kept under review by theNomination Committee.
Throughout the year ended 31st March2012, and from that date up to the publicationof this annual report, at least half the boardmembers, excluding the Chairman, werenon-executive directors determined by theboard to be independent (as referred tofurther on page 93).
As announced on 22nd May 2012,Sir Thomas Harris will be retiring from theboard at the close of the 2012 AnnualGeneral Meeting on 25th July 2012.Following his retirement there will be amajority of executive directors on the boardpending the appointment of an additionalindependent non-executive director. Asdescribed in the Nomination CommitteeReport on page 105, the process for theappointment of an additional non-executivedirector has commenced.

Corporate Governance Report continued
Johnson Matthey Annual Report & Accounts 2012Report of the Directors – GovernanceGovernance
92
Appointments to the Board andits CommitteesThe board, through the NominationCommittee, follows a formal, rigorous andtransparent procedure for the selection andappointment of new directors to the board.The processes are similar for the appointmentof executive and of non-executive directors.
The Nomination Committee leads theprocess for board appointments and makesrecommendations to the board. Furtherinformation on the Nomination Committeeand its work is set out in the NominationCommittee Report on page 105.
In considering board composition, theNomination Committee assesses the rangeand balance of skills, experience, knowledgeand independence on the board, identifiesany gaps or issues, and considers any needto refresh the board. If it is determined inlight of such evaluation that it is necessaryto appoint a new non-executive director,the Committee prepares a description of therole and of the capabilities required for theappointment and sets objective selectioncriteria accordingly. In doing so it has regardfor the benefits of diversity on the board,including gender diversity. This is discussedmore fully under ‘Boardroom Diversity’ below.
The Committee considers anyproposed recruitment in the context of thecompany’s strategic priorities, plans andobjectives as well as the prevailing businessenvironment. The Committee also takes intoaccount succession plans in place (and thisis discussed further under ‘SuccessionPlanning’ below). The Committee seeksprospective board members who can makepositive contributions to the board and itscommittees, including the capability tochallenge on such matters on strategy. This is balanced with the desire to maintainboard cohesiveness.
The Committee uses external searchconsultancies to assist in the appointmentprocess. Appointments are ultimately madeon merit against the agreed selection criteria.
The board recognises the importanceof developing internal talent for boardappointments as well as recruiting externally.In this regard, the company has in placevarious mentoring arrangements andvarious types and levels of managementdevelopment programmes.
The board also recognises theimportance of recruiting non-executivedirectors with the necessary technical skillsand knowledge relevant to the work of itscommittees and who have the potential totake over as committee chairmen.
Succession PlanningThe board, through the MDRC, is activelyengaged in ongoing succession planning inorder to ensure that plans are in place forthe orderly and progressive refreshing of theboard and for the identification anddevelopment of senior management withpotential for board and CEC positions.
Each division and corporate functionacross the group prepares and maintainssuccession plans with the assistance ofdivisional and group Human Resources.The CEC rigorously reviews these plans indetail annually, with a focus on ensuring anappropriate pipeline of talented and capableindividuals to fill senior roles. A key aim is toensure broad experience and encouragecross fertilisation across the group’sdivisions. The CEC also considers theidentification and development of highpotential individuals. The review of the plansby the CEC generally leads to furtherrefinement and changes, resulting in the finalplans which are submitted to the MDRC.The MDRC reviews succession policy, thesuccession plan and the managementdevelopment and succession planningprocess each year.
Boardroom DiversityThe board believes that diversity is importantfor board effectiveness. The board hasfollowed carefully the debate regarding therepresentation of women in the boardroomfollowing the publication of Lord Davies’report, ‘Women on Boards’, in February2011 (the Davies Report).
Statement on Board DiversityIn response to the Davies Report, on28th November 2011 the board publishedthe following statement on board diversity.It is set out in the Investor Relations /Corporate Governance section of thecompany’s website.
“The board of Johnson Matthey hasfollowed the important debate around therecommendations of Lord Davies’ reviewon Women on Boards and the questionof boardroom diversity. We do not thinkquotas, for the proportion of women onthe board or otherwise, are appropriatefor a number of reasons. We believe allappointments should be made on meritrather than through positive discrimination.We are clear, however, that maintaining anappropriate balance around our board tablethrough a diverse mix of skills, experience,knowledge and background is of paramountimportance. Gender diversity is a significantelement of this.
At present the board has one womanmember in a board of nine. When we nextmake an appointment to the board, ourbrief to search consultants in the selectionprocess as regards external candidates willbe to review candidates from a variety ofbackgrounds and perspectives. Theconsultants will be asked to work to aspecification which will include the strongdesirability of producing a long-list of possiblecandidates which fully reflects the benefitsof diversity, including gender diversity. Anyappointment of an internal candidate, whilesimilarly based on merit, will also take intoaccount the benefits of diversity, includinggender diversity.
Looking beyond the board to our widerworkforce, we recognise the importance ofdiversity, including gender diversity, and thebenefits this can bring to our organisation.With regard to gender diversity specifically,Johnson Matthey faces challenges similarto those faced by other organisations in thechemical, technology and manufacturingsectors. To address these, we have policiesand processes in place which are designedto support gender diversity in employeerecruitment, development and promotionand we are committed to ensuring thatwomen have an equal chance with men ofdeveloping their careers within our business.Finally, we encourage gender diversity at theearly career stage by working outsideJohnson Matthey to encourage women toenter scientific and industrial fields.”

93
Gender Diversity StatisticsNumber Proportion
The board 1 woman on the board as at the date of 11% of board membership publication of this annual report
Senior management 32 women out of 196 total as at 16% of senior management31st March 2012
Graduate intake – 30% of graduate intake
The group 2,205 women employees as at 22% of group employees 31st March 2012
The company has taken, and continues to take, several steps to promote diversity, including gender diversity, at senior management leveland in the boardroom. The basis of these measures is in developing policies and processes that prevent bias in relation to recruitment andpromotion, but the key to progress is in actively promoting diversity, ensuring that other positive measures are taken. These include requestingbalanced shortlists when recruiting, looking at diversity mix in company events and conferences, actively discussing diversity in successionplanning, promoting industrial and scientific careers to young women and developing family friendly and flexible employment policies. Thereare challenges to overcome, particularly in respect of gender diversity, given the sector within which the group operates but the group ismaking good progress.
Boardroom Diversity PolicyFollowing the publication of the DaviesReport, in October 2011 the FRC confirmedits intention to include revisions in the nextversion of the amended Code to bepublished in 2012 in order to accommodatethe Davies Report recommendation inrespect of diversity policy. These revisionswill require companies to include in thesection of the annual report describing the work of the nomination committee a description of the board’s policy on diversity, including gender, any measurableobjectives that it has set for implementingthe policy and progress on achieving theobjectives. The changes will formally apply to companies with a financial yearcommencing on or after 1st October 2012,and so for Johnson Matthey’s year ending31st March 2014.
The board is in the process ofreviewing the broad question of diversitywithin the group and is considering a policyfor diversity.
Board Evaluation ProcessThe FRC also announced in October 2011that a new supporting principle would beincluded in the Code to the effect thatevaluation of the board should consider thebalance of skills, experience, independenceand knowledge of the company on theboard, its diversity, including gender, howthe board works together as a unit andother factors relevant to its effectiveness.Again, this change will be incorporated inan updated version of the Code to bepublished in 2012. The board is followingthis principle in its board and committeeevaluation process which is underway as atthe date of publication of this annual report.
Further information is set out under‘2011/12 Evaluation Process’ on pages 96and 97.
Appointments to the Board As described under ‘Appointments to theBoard and its Committees’ on page 92, thesearch for board candidates is conducted,and appointments made, on merit, againstobjective selection criteria having due regardfor the benefits of diversity on the board,including gender. Further information ondiversity in the context of board appointmentsis contained in the Nomination CommitteeReport on page 105.
Board Balance – Independenceof the Non-Executive Directorsand of the ChairmanThe question of the independence of thenon-executive directors is relevant to boardbalance.
Director independence was reviewedby the board at its meeting on 29th March2012. In making its determination ofindependence in respect of a director, theboard considers all relevant relationshipsand circumstances, including those set outin the Code. The board considers, forexample, whether the director has, or hashad within the last three years, a materialbusiness relationship with the company,holds cross directorships or has significantlinks with other directors throughinvolvement in other companies or bodies,or represents or has a material connection toa controlling or significant shareholder or isnominated by a shareholder.
The board considers that there areno business or other relationships orcircumstances which are likely to affect,
or may appear to affect, the judgmentof any non-executive director and each non-executive director was determined bythe board to be independent in characterand judgment.
There are no cross directorships orreciprocal directorships among thedirectors; no two directors are also directorsof another company.
Tim Stevenson was considered by theboard to meet the independence criteria setout in the Code on his appointment as anon-executive director and ChairmanDesignate in March 2011 and on hisappointment as Chairman in July 2011.Sir John Banham, who retired as Chairmanat the close of the 2011 Annual GeneralMeeting in July 2011, was not involved inthe selection or appointment of Mr Stevensonas Chairman.
Information on the company’sprocedures for authorising potential conflictsof interest is set out under ‘Directors’Conflicts of Interest’ on page 95.

Corporate Governance Report continued
Johnson Matthey Annual Report & Accounts 2012Report of the Directors – GovernanceGovernance
94
Time Commitment ofthe Chairman and of theNon-Executive DirectorsThe board recognises that it is vital that alldirectors should be able to dedicatesufficient time to the company to effectivelydischarge their responsibilities.
The time commitment required by thecompany is considered by the board and byindividual directors on appointment. Theletters of appointment of the Chairman andof each non-executive director set out theexpected minimum time commitment fortheir roles. Each undertake that they willhave sufficient time to meet what is expectedof them for the proper performance of theirduties and acknowledge that there may, onoccasion, be a need for additional timecommitment. The minimum time commitmentconsidered by the board to be necessary fora non-executive director and provided in theletters of appointment is two days permonth following induction. In his letter ofappointment, the Chairman undertook todevote such time to the affairs of thecompany as is required by his duties as Chairman.
The other significant commitments of theChairman and of each non-executivedirector are disclosed to the board beforeappointment, with an indication of the timecommitment involved. The board requires tobe, and is, informed of subsequent changesas they arise.
Details of Tim Stevenson’s othersignificant commitments are set out onpage 83. There were no changes to theseduring the year ended 31st March 2012.On 8th May 2012 it was announced byThe Morgan Crucible Company plc thatMr Stevenson would be retiring as chairmanof that company on 31st July 2012.
Details of the non-executive directors’other significant commitments are set outon page 83. Alan Ferguson has, since hisappointment to the board, been appointedas a non-executive director of CrodaInternational Plc (in July 2011), where hehas chaired the audit committee sinceAugust 2011. He was also appointed as anon-executive director of The Weir Group PLCin December 2011 and has chaired its audit committee since May 2012. Theseappointments were reported to the boardas they arose. The board assessed theimpact of these appointments and believesthat Mr Ferguson continues to be able tomanage his time commitments and allocatesufficient time to the company to dischargehis responsibilities effectively, including hisresponsibilities as Chairman of the AuditCommittee.
Terms of Appointment of theNon-Executive DirectorsThe non-executive directors are appointedfor specified terms subject to annualelection and to the provisions of theCompanies Act 2006 (the 2006 Act) relatingto the removal of a director.
Any term beyond six years for a non-executive director is subject toparticularly rigorous review and takes intoaccount the need for progressive refreshingof the board. No non-executive director whowill be proposed for re-election at the 2012Annual General Meeting on 25th July 2012will then have served longer than six years.
The terms and conditions ofappointment of the non-executive directorsand the contracts of service of the executivedirectors with the company are available tobe inspected by any person at theregistered office of the company duringnormal business hours. They are alsoavailable for inspection at the annual generalmeeting of the company prior to the meetingand during the meeting. Accordingly, theywill be available for inspection at MerchantTaylors’ Hall, 30 Threadneedle Street,London EC2R 8JB from 10.00 am onWednesday 25th July 2012 until theconclusion of the 2012 Annual GeneralMeeting.
Annual Re-Election of DirectorsThe company’s Articles of Associationrequire one third of the board to retire byrotation at each annual general meeting.However, the Code provides that alldirectors of FTSE 350 companies shouldbe subject to re-election by theirshareholders every year subject tocontinued satisfactory performance. Inaccordance with this provision, the boardhas decided that all directors will retire ateach annual general meeting and offerthemselves for re-election by shareholders.
Each director stood for re-election at the 2011 Annual General Meeting. Alldirectors will be offering themselves for re-election at the 2012 Annual GeneralMeeting except for Sir Thomas Harris, whowill be retiring from the board at the close ofthat meeting.
Biographical details of each of thedirectors, including details of their otherdirectorships and responsibilities and relevantprevious positions held, together with anyfurther relevant factors including details of thetheir skills and experience and contributionsto the board, are set out in the circular toshareholders in respect of the 2012 AnnualGeneral Meeting. This is to assistshareholders to take an informed decision on the resolutions for their re-election.
The circular sets out to shareholders whythe board believes each director should bere-elected based on continued satisfactoryperformance in the role. In the circular, theChairman confirms to shareholders that,following formal performance evaluation, theperformance of each non-executive directorproposed for re-election continues to beeffective and to demonstrate commitment to the role (including commitment of time for board and board committee meetings).Further information on performanceevaluation is given under ‘Evaluation of theBoard, Board Committees and Directors’ on page 96.
Information and SupportThe board has in place processes to ensurethat it is supplied in a timely manner withinformation in a form and of a qualityappropriate to enable it to discharge itsduties. The Chairman, through the CompanySecretary and with the support of theexecutive directors and management,ensures that this information is of highquality in terms of its accuracy, clarity,appropriateness, comprehensiveness andcurrency.
Directors are able to seek clarificationor amplification from management wherenecessary.
The role of the Company Secretary inproviding support and information is set outon page 87.
Independent Professional AdviceThe non-executive and the executivedirectors have access to independentexternal professional advice (such as legaland financial advice) at the company’sexpense where they judge this necessary todischarge their responsibilities as directors.
Director Induction, Familiarisation,Training and DevelopmentInductionThe company puts in place full, formal andtailored induction programmes for all newdirectors on joining the board. While thistakes into account the directors’ differentbackgrounds and experience, the inductionis aimed to be a broad introduction to thegroup’s businesses and its areas ofsignificant risk. Key elements of the inductionprocess are meeting the executive directorsand senior and middle managementindividually and collectively and visiting thegroup’s major operating sites.

95
Since their appointments TimStevenson and Alan Ferguson haveundergone tailored induction programmesfacilitated by the Company Secretary. Theseprogrammes included meetings with theChief Executive, the executive directors andsenior management in order to be briefedon group strategy and on individualbusinesses, briefing sessions with key groupfunctions and visits to the principal UK sites.The programmes also allowed Mr Stevensonand Mr Ferguson to familiarise themselveswith any issues arising from service on, orchairmanship of, board committees. As partof his induction programme, Tim Stevensonhad separate meetings with several majorshareholders.
Familiarisation, Training and DevelopmentTo ensure the effective fulfilment of the rolesof the directors on the board and on theboard committees and to ensure that theircontributions remain informed and relevant,various steps are taken to ensure that alldirectors are able to gain and to continuallyupdate and refresh their knowledge andskills. The intention is that all directors havefamiliarity with, and appropriate knowledgeof, the company and gain access to itsoperations and employees. The boardensures that the company provides thenecessary resources to allow this to happen.
Each board meeting includes one ormore business or strategy presentationsfrom senior managers. To ensure that theboard is kept up to date on importantmatters, including environmental, legal,governance and regulatory developments,presentations are also made to the board byboth external and internal advisers.
The board also holds at least one boardmeeting per year at one of the group’soperational sites and takes the opportunityto tour the site and discuss business issues,risks and strategy with local management.During the year ended 31st March 2012, the board visited Fine Chemicals’ APImanufacturing facility at Riverside,Conshohocken, Pennsylvania, USA inSeptember 2011 and Precious MetalProducts’ Catalysts and Chemicalsmanufacturing facility at Royston,Hertfordshire in the UK in March 2012. The board toured these sites and receivedpresentations from management on therecently acquired facility at Riverside and on Catalyst and Chemicals’ new productsrespectively. Individual non-executivedirectors also undertake site visits.
Such presentations, meetings and sitevisits assist the non-executive directors infamiliarising themselves with, and gaining agreater insight into, the group’s businessesand help to give a balanced overview of thegroup. They enable the non-executivedirectors to continue to develop and refreshtheir knowledge and understanding of thegroup’s businesses, the markets in which itoperates and its key relationships. They arealso important for building links with thegroup’s employees.
As part of the annual performancereview process referred to under ‘Evaluationof the Board, Board Committees andDirectors’ on page 96, the Chairman meetswith each director annually on a one to onebasis to review and agree their individualtraining and development requirements.
Indemnification of Directorsand InsuranceUnder Deed Polls dated 20th July 2005 thecompany granted indemnities in favour ofeach director of the company in respect ofany liability that he or she may incur to athird party in relation to the affairs of thecompany or any group member. Suchindemnities were in force during the yearended 31st March 2012 for the benefit of allpersons who were directors of the companyat any time during the year and remain inforce for the benefit of all persons who aredirectors of the company as at the datewhen this Report of the Directors wasapproved and from that date up to the dateof publication of this annual report.
Under Deed Polls also dated 20th July2005 the company granted indemnities infavour of each director of its subsidiaries inrespect of any liability that he or she mayincur to a third party in relation to the affairs ofany group member. Such indemnities werein force during the year ended 31st March2012 for the benefit of all persons who weredirectors of the subsidiaries at any timeduring the year and remain in force for thebenefit of all persons who are directors ofthe subsidiaries as at the date when thisReport of the Directors was approved andfrom that date up to the date of publicationof this annual report.
The company has in place appropriatedirectors and officers liability insurance coverin respect of legal action against, amongstothers, its executive and non-executivedirectors.
Copies of the Deed Polls and thecompany’s Articles of Association areavailable to be inspected by any person atthe registered office of the company duringnormal business hours. They are alsoavailable for inspection at the annual generalmeeting of the company prior to the meetingand during the meeting. Accordingly, theywill be available for inspection at MerchantTaylors’ Hall, 30 Threadneedle Street,London EC2R 8JB from 10.00 am onWednesday 25th July 2012 until theconclusion of that meeting.
Neither the company nor anysubsidiary has indemnified any director ofthe company or a subsidiary in respect ofany liability that he or she may incur to athird party in relation to a relevantoccupational pension scheme.
Directors’ Conflicts of InterestUnder the Companies Act 2006 (the 2006Act), a director must avoid situations inwhich he or she has, or can have, a director indirect interest that conflicts with, or mayconflict with, the interests of the company.This covers, in particular, the exploitation ofproperty, information or opportunity and itapplies whether or not the company is in aposition to take advantage of it. There is nobreach of this duty if authorisation of theconflict situation has been given by theindependent directors. The company’sArticles of Association give power to theindependent directors to give suchauthorisation but board authorisation is notpermitted in respect of the acceptance ofbenefits from third parties. Directors alsohave a duty under the 2006 Act to makeprior declaration to the other directors of thenature and extent of any direct or indirectinterest in a proposed transaction orarrangement with the company. Additionally,directors must declare the nature and extentof any direct or indirect interest in an existingtransaction or arrangement entered into bythe company, to the extent that the interesthas not been declared under the duty inrespect of proposed transactions orarrangements.

Corporate Governance Report continued
Johnson Matthey Annual Report & Accounts 2012Report of the Directors – GovernanceGovernance
96
Established procedures in accordancewith the company’s Articles of Associationare in place to ensure compliance with thedirectors’ conflicts of interest duties underthe 2006 Act and for dealing with conflictof interest situations. The company hascomplied with these procedures during theyear ended 31st March 2012 and from thatdate up to the date of publication of thisannual report. During the year, details of anynew conflicts or potential conflict matterswere submitted to the board for considerationand, where appropriate, these wereapproved.
In March 2012, the board undertookan annual review of the register of previouslyapproved conflict or potential conflictmatters and, to the extent that these werestill relevant, agreed that they shouldcontinue to be authorised on the termspreviously set out. In each case, the reviewwas undertaken by directors who weregenuinely independent of the conflict matter.Authorised conflict or potential conflictmatters will continue to be reviewed by theboard on an annual basis.
The board confirms that the companycomplies with its procedures in place toauthorise conflict situations and is satisfiedthat its powers to authorise conflictsituations are being exercised properly andeffectively and in accordance with thecompany’s Articles of Association.
Evaluation of the Board, BoardCommittees and DirectorsWith the aim of improving effectiveness, theboard undertakes a formal annual evaluationof its own performance and that of itscommittees and individual directors. Theevaluation, which is led by the Chairman,aims to be as rigorous and objective aspossible.
The process for evaluation of the boardconsiders its strengths and weaknesses,the range and balance of skills, experience,independence and knowledge of thecompany on the board, its diversity,including gender diversity, how the boardworks together as a unit and any otherfactors considered relevant to itseffectiveness. Individual evaluation aims toshow whether each director continues tocontribute effectively and to demonstratecommitment to the role (including timecommitment). The Chairman acts on theresults of the performance evaluation.The strengths are recognised and anyweaknesses addressed.
2010/11 Evaluation ProcessFollowing the appointment of Tim Stevensonas Chairman Designate in March 2011, theboard instigated a formal evaluation of itsperformance and that of its committeesand individual directors. This evaluation wasled by Tim Stevenson and was externallyfacilitated by an independent consultantexperienced in board evaluation. This wasthe first time that the board had undertakenan externally facilitated evaluation process.The external facilitator had no otherconnection with the company and was notsubject to any conflict of interest. Theevaluation was designed, in particular, toallow Tim Stevenson to gain an objectiveoverview and evaluation of the workings ofthe board and its committees, of strengthsand weaknesses, of areas for furtherimprovement and of the contributions ofindividual directors. The review wasintended to build on the internal boardreview carried out by the CompanySecretary in 2009/10.
The methodology of the evaluationincluded a series of detailed one to onemeetings with each director and theCompany Secretary in order to gather viewsand feedback. The external evaluator alsoattended one full board meeting as anobserver. The review covered the followingmain areas, which were determined by theChairman and the external evaluator to beof most importance or value to the board:
• Overall board working and efficiency;
• Board composition and balance;
• Succession planning;
• Strategy process;
• Financial and non-financial monitoring;
• Risk management and riskmanagement systems; and
• Board development (including trainingand site visits).
The full evaluation process was notcomplete at the date of publication of the2011 annual report and has since beenconcluded. Overall feedback from theevaluation was provided in the form of apresentation by the external evaluator at ameeting of the board in May 2011, whichthen debated the findings. The board alsodiscussed the evaluation process itself andagreed that the external evaluation wasbroadly effective. The external evaluator alsoprovided a comprehensive written report to the Chairman, feedback to the boardcommittee chairmen and individualfeedback for the Chief Executive.
Good progress was noted across allthe areas of review, building on initiativesand action developed as a result of prioreffectiveness reviews. Certain suggestionswere made to ensure continuing progress.The evaluation process gave assurance thateach director continued to contributeeffectively and demonstrated commitmentto the role.
The Chairman agreed with the boardthat no actions or changes to board orcommittee practice were required in theimmediate term following the review but thatthe output would be considered furtherfollowing his appointment as Chairman inJuly 2011 and in the course of the review for2011/12 to ensure continuing improvement.
2011/12 Evaluation ProcessAs the 2010/11 review process had beenexternally facilitated, the board decided toconduct an internal review process during2012. The evaluation of the performanceand effectiveness of the board and itscommittees and individual directors is beingconducted by the Chairman in collaborationwith the board committee chairmen. Theevaluation is not complete at the date ofpublication of this annual report.
The evaluation process has includedone to one interviews by the Chairman witheach director and the Company Secretary.The topics being discussed, which weredetermined by the Chairman to be theprincipal areas of focus following theexternally facilitated review in the previousyear, include:
• Strategy and strategy focus;
• Monitoring financial and non-financialperformance;
• Stakeholder relationships;
• Risk and uncertainties;
• Executive remuneration; and
• Key themes for discussion focus in2012/13.
In carrying out the evaluation, theboard is following the new supportingprinciple to be included in the Code, asannounced by the FRC in October 2011,to the effect that evaluation of the boardshould consider, amongst other things,the board’s diversity, including genderdiversity. Further information is set out under‘Board Evaluation Process’ on page 93.

97
The Chairman proposes to report theoutcome of the evaluation process to theboard meeting in July 2012. The board willdebate the findings and any lessons to belearned and will agree any follow up actionsand responsibilities as appropriate. The keyoutcomes of the evaluation processes andthe steps the board intends to take toaddress any issues will be reported in the2013 annual report.
Future ReviewsThe board intends to undertake an externallyfacilitated evaluation process at least everythree years. In the intervening years, thereview will be facilitated by the Chairmansupported by the Senior IndependentDirector and the Company Secretary.
Review of the Chairman’sPerformanceThe non-executive directors recognise thatthe Chairman’s effectiveness is vital to thatof the board. Led by the Senior IndependentDirector, the non-executive directors areresponsible for performance evaluation ofthe Chairman and for providing a fair andbalanced assessment to shareholders.
In view of the change in thechairmanship of the company with theappointment of Tim Stevenson as Chairmanon 19th July 2011, a separate formal reviewof the Chairman’s performance was notundertaken during the year ended 31st March2011 but feedback on the Chairman’sperformance was reflected in the externallyfacilitated evaluation referred to on page 96.A review of the Chairman’s performancewas, however, undertaken in the year ended31st March 2012. On 28th March 2012,the non-executive directors, led by theSenior Independent Director, met separately,without the Chairman being present, todiscuss the Chairman’s performance. Indoing so they took into account the viewsof executive directors. The results weresubsequently reported by the SeniorIndependent Director to the board. Theyconsidered that the Chairman demonstratedeffective leadership and that hisperformance and contribution were strong.
Accountability
The Audit CommitteeThe membership of the Audit Committee is set on page 90.
The terms of reference of the AuditCommittee are summarised on pages 89and 90. The terms of reference can befound in the Investor Relations / CorporateGovernance section of the company’swebsite or may be obtained from theCompany Secretary.
The Audit Committee Report, whichdescribes the work of the Audit Committeein discharging its responsibilities, is set outon pages 106 and 107.
Financial ExperienceThe board is satisfied that at least onemember of the Audit Committee, AlanFerguson, has recent and relevant financialexperience. His biographical details are setout page 83.
Financial and Business ReportingIn its reporting to shareholders the boardrecognises its responsibility to present a fair,balanced and understandable assessmentof the group’s position and prospects. Thisresponsibility covers the Annual Report andAccounts and extends to interim and otherprice sensitive public reports and reports toregulators as well as to information requiredto be presented by statutory requirements.
The Business Review on pages 4 to 75sets out explanations of the basis on whichthe company generates or preserves valueover the longer term (the business model)and the strategy for delivering the objectivesof the company. This annual report isintended to provide the informationnecessary to enable an assessment of thecompany’s performance, the businessmodel and its strategy.
The group’s organisational structure isfocused on its three divisions. These are allseparately managed but report to the boardthrough a board director. The CEC receivesand reviews monthly summaries of financialresults from each division through astandardised reporting process. Forecastsare prepared monthly throughout the year.The group has in place a comprehensiveannual budgeting and planning processincluding plans for the following two years.Budgets are approved by the board.Variances from budget are closelymonitored. In addition to the annualbudgeting process, there is a ten yearstrategy review process as referred toon page 12.
Directors’ and Auditor’s ResponsibilityA statement of the directors’ responsibilityfor preparing the Annual Report andAccounts is set out on page 120. Astatement by the auditor, KPMG Audit Plcabout its reporting responsibilities is set outon page 121.
Risk Management and InternalControlThe board is ultimately responsible formaintaining sound risk management andinternal control systems (including financialcontrols, controls in respect of the financialreporting process and controls of anoperational and compliance nature).
As the company is the parent companyof a group, its internal control systems areon a groupwide basis and the review of theireffectiveness is implemented and reportedfrom a groupwide perspective. Thedirectors’ review of the effectiveness ofinternal control systems and the applicationof the Revised Guidance for Directors on theCombined Code issued by the FRC inOctober 2005 (Revised Turnbull Guidance)extends to the company and itssubsidiaries.
The group’s risk management systemsand internal control systems are designed tomeet the group’s needs and manage therisks to which it is exposed, including therisk of failure to achieve business objectives,but such risks cannot be eliminated. Suchsystems can only provide reasonable, butnot absolute, assurance against a failure tomeet business objectives or against the riskof material misstatement or loss. They cannever completely protect against suchfactors as unforeseeable events, humanfallibility or fraud.
The board confirms that there is aframework of continuous and ongoingprocesses (established in accordance withthe Revised Turnbull Guidance) in place foridentifying, evaluating and managing thesignificant risks faced by the group. Theseprocesses are regularly reviewed by theboard and the Audit Committee asappropriate and have been in place duringthe year ended 31st March 2012 and up tothe date of approval of this annual report.
The board is responsible fordetermining the nature and extent of thesignificant risks it is willing to take inachieving its strategic objectives. Theboard’s view of the group’s key strategicand operating risks and how the companyseeks to manage those risks is set out onpages 20 to 23.

Corporate Governance Report continued
Johnson Matthey Annual Report & Accounts 2012Report of the Directors – GovernanceGovernance
98
The Risk Management and InternalControl SystemsThe group’s risk management and internalcontrol systems comprise group policies,procedures and practices covering a rangeof areas including the appropriateauthorisation and approval of transactions,the application of financial reportingstandards and the review of financialperformance and significant judgments.
The Group Control Manual, which isdistributed to all group operations, clearlysets out the composition, responsibilitiesand authority limits of the various board andexecutive committees and also specifieswhat may be decided without centralapproval. It is supplemented by otherspecialist policy and procedures manualsissued by the group, divisions and individualbusinesses or departments.
Review of Effectiveness of the Group’sRisk Management and Internal ControlSystemsA key responsibility of the board is forreviewing, assessing and confirming theadequacy and effectiveness of the group’srisk management and internal controlsystems (including financial controls,controls in respect of the financial reportingprocess and controls of an operational andcompliance nature). The board hasdelegated part of this responsibility to theAudit Committee. In addition to determiningrisk appetite, the board specifically reviewsEHS strategy, performance and assuranceprocesses as well as the performance ofgroup HR and IT. The Audit Committeereviews other key risk areas and theassurance processes in respect of themanagement of risk.
The board, through setting its ownannual agenda plan and in approving that of the Audit Committee, defines the processto be undertaken for the review, includingthe scope and frequency of assurancereports received throughout the year. Theboard and Audit Committee agenda plansare designed to ensure that all significantareas of risk are reported on and consideredduring the course of the year.
The Audit Committee receives andconsiders regular reports and presentationsfrom management, from the heads of groupcorporate functions such as group treasuryand from internal audit. These identify andprovide assessments of areas of significantrisk either for the businesses or the groupas a whole and of the effectiveness of thecontrol systems in managing those risks.Any significant issues are highlighted anddiscussed. The Audit Committee is thusable to focus on the key risk areas andeffectively assess how they have beenidentified, evaluated and managed. Inassessing the effectiveness of the controlsystems, the Audit Committee considers
carefully the impact of any weaknesses,whether necessary actions are being takenpromptly and whether more extensivemonitoring is needed. Amongst othermatters, the Audit Committee reviews thegroup’s credit control procedures and risks,controls over precious metals, IT controlsand the group’s whistleblowing procedures.The Audit Committee also reviews theperformance of both the internal andexternal auditors. The Audit Committee alsoconsiders observations by the externalauditor in relation to internal financial control.
The group’s internal audit functionplays an important part in the assessment ofthe risks facing the group and is responsiblefor independently monitoring and assessingthe adequacy and effectiveness of thegroup’s systems of internal financial control. Internal audit reports on controleffectiveness to the Audit Committee in linewith the agreed audit plan and AuditCommittee agenda plan. The internal auditfunction is a unified, groupwide functionunder the leadership of the Head of InternalAudit and Risk. The global nature of thefunction allows for more holistic assuranceand consistency in approach. The Head ofInternal Audit and Risk has a dual reportingline to the Group Finance Director and to theChairman of the Audit Committee. The AuditCommittee approves the plans for internalaudit reviews and receives the reportsproduced by the internal audit function ona regular basis. Plans for corrective actionand control improvement are agreed withmanagement to address any issues,non-compliance or control deficienciesidentified by internal audits. Internal auditfollows up the implementation of itsrecommendations, including anyrecommendations to improve internalcontrols, and reports the outcome to seniormanagement and to the Audit Committee.
Each year businesses are required to formally review their financial and non-financial controls and their compliancewith group policies and statutory andregulatory obligations and to provideassurance on these. The results of thesereviews are collated and summarised by theinternal audit function and a report is madeannually to the Audit Committee.
The Audit Committee conducts anannual assessment of effectiveness onbehalf of the board in order for the board toreport on effectiveness in the annual report.The Audit Committee reports to the boardon the operation and effectiveness of therisk management and internal controlsystems and such reports are considered by the board in forming its view of theireffectiveness. A report from the AuditCommittee on its activities and on the work of internal audit is given on pages 106 and 107.
The board, in part through the AuditCommittee, has conducted an overarchingreview of the effectiveness of the company’srisk management and internal controlsystems, covering all material controls,including financial, operational andcompliance controls, for the year ended31st March 2012 and up to the date of itsapproval of this annual report on 6th June2012. The review process accords with theRevised Turnbull Guidance. Following thisreview, the group is enhancing andstandardising the stock take proceduresacross its gold and silver refineries.
Remuneration
The board has established a remunerationcommittee, the Management Developmentand Remuneration Committee (MDRC).
The membership of the MDRC is seton page 90.
The terms of reference of the MDRCare summarised on page 90. The terms of reference can be found in the InvestorRelations / Corporate Governance sectionof the company’s website or may beobtained from the Company Secretary.
The Remuneration Report, whichdescribes the work of the MDRC, is set outon pages 108 to 117.
Relations with Shareholders
Dialogue with ShareholdersThe board welcomes the opportunity toopenly engage with shareholders as itrecognises the importance of a continuingeffective dialogue (whether with majorinstitutional investors, private or employeeshareholders) based on the mutualunderstanding of respective objectives. Theboard as a whole takes responsibility forensuring that such dialogue takes place.
Reporting of Results, InterimManagement Statements andthe Investor DayThe company reports formally to shareholderswhen its full year results are published inJune and its half year results are publishedin November. The company’s results areposted on the Investor Relations / ResultsCentre section of the company’s website.The full year results are included in thecompany’s annual report.
At the same time as publication of theresults, executive directors give presentationson the half year and full year results in faceto face meetings with institutional investors,analysts and the media in London. Livewebcasts of these results presentations areavailable on the company’s website.

99
The company’s first quarter and thirdquarter Interim Management Statements(issued respectively on the day of the annualgeneral meeting in July and in early Februaryeach year) are also made available on theInvestor Relations / Results Centre sectionof the company’s website.
The company also holds an annual‘Investor Day’ for its institutional investorsand analysts. At the 2012 Investor Day heldin London on 1st February, the companygave a presentation in respect of itsPrecious Metal Products Division. This wasdesigned to provide a deeper understandingof the division, its strategy and drivers andto highlight why the division is such anintrinsic part of the group. The presentationalso outlined the group’s role in the globalplatinum group metals market and thedynamics of the division’s businesses. It alsoexplained the role of R&D in adding valueand providing future growth opportunities. A live webcast of the Investor Daypresentations is made available on thecompany’s website. A copy of the InvestorDay presentation is posted on the InvestorRelations / Presentations section of thecompany’s website.
Shareholder ContactWhile the Chairman takes overall responsibilityfor ensuring that the views of shareholdersare communicated to the board as a wholeand that all directors are made aware ofmajor shareholders’ issues and concerns,contact with major shareholders is principallymaintained by the Chief Executive and theGroup Finance Director. They maintain acontinual dialogue with institutionalshareholders throughout the year onperformance, plans and objectives througha programme of regular one to one andgroup meetings and they ensure thatshareholder views are communicated to theboard. The group’s Investor RelationsDepartment acts as a focal point for contactwith investors throughout the year.
The Chairman is available to meet withinstitutional investors to hear their views anddiscuss any issues or concerns, includingon governance and strategy. The SeniorIndependent Director and the othernon-executive directors are also available tomeet with major shareholders if requested.Other than meetings held with shareholdersby Tim Stevenson as part of his inductionprogramme, no such meetings were held orrequested during the year ended 31st March2012 or from that date to the date ofpublication of this annual report.
The board believes that appropriatesteps have been taken during the year toensure that the members of the board, andin particular the non-executive directors,develop an understanding of the views ofmajor shareholders about the company.Such steps have included, for example,analysts’ and brokers’ briefings, considerationby the board of monthly brokers’ reportsand of feedback from shareholder meetingson a six-monthly basis. The canvassing ofmajor shareholders’ views for the board in adetailed investor survey is usually conductedevery two years by external consultants. Atits meeting in November 2011, the boardconsidered a perception analysis reportprepared for the company by Smith’sCorporate Advisory dated October 2011.The purpose of this was to ascertain theviews and opinions of a broad range of bothshareholders and non-shareholders.
Also, as reported in the RemunerationReport in the 2011 annual report, a selectionof major institutional shareholders andinstitutional investor bodies were consultedin detail by the MDRC during 2010/11 in acollective consultation exercise as part of itscomprehensive review of executive directorand senior management remunerationarrangements within the group.
The board takes the view that thesemethods, taken together, are a practicaland efficient way for the board, includingthe Senior Independent Director, to keep intouch with shareholder opinion and viewsand to reach a balanced understandingof major shareholders’ objectives, issuesand concerns.
Annual General Meetings An important part of effective communicationwith shareholders is the Annual GeneralMeeting.
The company’s annual general meetingtakes place in London. Notice of themeeting and any related papers are sent toshareholders at least 20 working daysbefore the meeting and are also publishedon the Investor Relations / ShareholderCentre / Annual General Meeting section ofthe company’s website. The circular sent toshareholders with the notice of meetingaims to set out a balanced and clearexplanation of each resolution to beproposed.
All directors, including the chairmenof the Nomination Committee, the AuditCommittee and the MDRC, who are ableto attend the annual general meetings do so.The entire board was in attendance at thecompany’s 2011 Annual General Meeting,except for Michael Roney who was unableto attend the meeting because of coincidingcommitments at Bunzl plc, where he isChief Executive.
In order to better communicate withshareholders a business presentation ismade by the Chief Executive at the annualgeneral meeting. Shareholder participation at the meeting is encouraged. All directors in attendance are available to answerquestions in their capacity as directors or ascommittee chairmen, formally through theChairman during the meeting and informallyafterwards.
At the meetings, the companyproposes separate resolutions on eachsubstantially separate issue, including on the Annual Report and Accounts. For eachresolution, shareholders have the optionthrough the proxy appointment formsprovided to direct their proxy to vote eitherfor or against the resolution or to withholdtheir vote. The proxy form itself and theannouncement of the results of a vote makeit clear that a ‘vote withheld’ is not legally avote and is not counted in the calculationof the proportion of the votes cast for andagainst the resolution. All valid proxyappointments received are properlyrecorded and counted.
All resolutions at the annual generalmeeting are decided on a poll as required bythe company’s Articles of Association (ratherthan on a show of hands) and poll voting iscarried out by electronic means.
The results of the poll are announcedto the market as soon as possible andposted on the Investor Relations /Shareholder Centre / Annual GeneralMeeting section of the company’s website.The announcement shows votes for andagainst as well as votes withheld.
Details of the annual general meetingto be held on 25th July 2012 are set out inthe circular to shareholders accompanyingthis annual report and the resolutions to beproposed are summarised under ‘2012Annual General Meeting’ on page 100.

2012 Annual General MeetingThe 2012 Annual General Meeting of thecompany will be held at 11.00 am onWednesday 25th July 2012 at MerchantTaylors’ Hall, 30 Threadneedle Street,London EC2R 8JB.
The notice of the 2012 Annual GeneralMeeting is contained in the circular toshareholders accompanying this annualreport, together with an explanation of theresolutions to be considered at the meeting.The notice of the 2012 Annual GeneralMeeting will be published on the InvestorRelations / Shareholder Centre / AnnualGeneral Meeting section of the company’swebsite.
The business to be transacted at themeeting will include:
• To receive the company’s annualaccounts for the year ended 31st March2012 together with the Report of theDirectors and the auditor’s report onthose accounts
• To receive and approve the directors’remuneration report for the year ended31st March 2012 and the auditor’sreport on the auditable part of thedirectors’ remuneration report
• To declare a final dividend per ordinaryshare in respect of the year ended31st March 2012
• To declare a special dividend perordinary share and to effect a shareconsolidation
• To re-elect all directors retiring at themeeting who are seeking reappointment
Other Statutory Information
• To reappoint KPMG Audit Plc asauditor of the company and toauthorise the directors to determineits remuneration
• To authorise the company (and allcompanies which are subsidiaries ofthe company) in aggregate to makepolitical donations to political parties or independent election candidates, to make political donations to politicalorganisations other than political partiesand to incur political expenditure,provided that the combined aggregateamount of donations made andexpenditure incurred does not exceed£50,000
• To authorise the directors to exerciseall the powers of the company to allotshares in the company and to grantrights to subscribe for, or to convertany security into, shares in thecompany up to certain limits
• To empower the directors to dis-applypre-emption rights when allotting equitysecurities for cash, subject to certainlimits
• To authorise the company to makemarket purchases of its own ordinaryshares, subject to certain limits andconditions
• To permit a general meeting of thecompany, other than an annual generalmeeting, to be called on not less than14 clear days’ notice.
A member entitled to attend and voteat the meeting is entitled to appoint a proxyto exercise all or any of his or her rights toattend and to speak and vote on his or herbehalf at the meeting. A member mayappoint more than one proxy in relation tothe meeting provided that each proxy isappointed to exercise the rights attachedto a different share or shares held by thatmember. A proxy need not be a memberof the company.
DividendsThe interim dividend of 15.0 pence pershare (2011 12.5 pence) was paid inFebruary 2012.
The directors recommend a finaldividend of 40.0 pence per share in respectof the year ended 31st March 2012 (201133.5 pence), making a total for the year of55.0 pence per share (2011 46.0 pence),payable on 17th August 2012 toshareholders on the register at the close of business on 3rd August 2012.
At the 2012 Annual General Meeting aresolution will be proposed to declare aspecial dividend of 100.0 pence per shareand to approve a share consolidation. Full information on the proposed specialdividend and share consolidation iscontained in the circular to shareholders inrespect of the 2012 Annual General Meetingaccompanying this annual report.
Johnson Matthey Annual Report & Accounts 2012Report of the Directors – GovernanceGovernance
100
100 2012 Annual General Meeting100 Dividends101 Dividend Payments and DRIP101 Share Capital and Control101 Listing of the Company’s Shares101 American Depositary Receipt Programme102 Employee Share Schemes102 Interests in Voting Rights102 Contracts with Controlling Shareholders102 Directors103 Appointment and Replacement of Directors103 The Company’s Articles of Association103 Powers of the Directors
103 The Interests of Directors in the Company’s Shares103 Directors’ Interests in Contracts103 Change of Control104 Disabled Persons104 Employee Involvement104 Use of Financial Instruments104 Branches104 Policy on Payment of Commercial Debts104 Charitable Donations104 Political Donations and Expenditure104 Financial Assistance Received from Government104 Auditors and Disclosure of Information104 Management Report
Contents>

101
Other than as referred to under‘Employee Share Schemes’ on page 102,during the year ended 31st March 2012 andfrom that date up to the date of publicationof this annual report there were noarrangements under which a shareholderhas waived or agreed to waive anydividends nor any agreement by ashareholder to waive future dividends.
Dividend Payments and DRIPDividends can be paid directly intoshareholders’ bank accounts. A DividendReinvestment Plan (DRIP) is also available.This allows shareholders to purchaseadditional shares in the company with theirdividend payment. Further information anda mandate can be obtained from thecompany’s registrars, Equiniti, whose detailsare set out on page 175 and on the InvestorRelations section of the company’s website.
Share Capital and ControlCapital StructureThe issued share capital of the company at31st March 2012 was 214,675,736 ordinaryshares of £1.00 each (excluding treasuryshares). The company did not allot any sharesduring the year ended 31st March 2012.
As at 31st March 2012, the companyheld 5,997,877 treasury shares. There wereno purchases, sales or transfers of treasuryshares during the year ended 31st March2012.
Purchase by the Company of its Own SharesAt the 2011 Annual General Meeting,shareholders renewed the company’sauthority to make market purchases of upto 21,467,573 ordinary shares representing10% of the issued share capital of thecompany (excluding treasury shares) as at1st June 2011. This authority subsisted at31st March 2012.
During the year ended 31st March2012 and from that date up to the date ofpublication of this annual report, thecompany did not make any purchases of itsown shares or propose to purchase its ownshares (either through the market or by anoffer made to all shareholders or otherwise),nor did the company acquire any of its own shares other than by purchase. Since31st March 2012 the company has noteffected any purchases of its own shares,entered into any options to purchase its ownshares or entered into any contracts tomake such purchases (including transactionsmade through the market or by an offermade to all shareholders or otherwise).
At the 2012 Annual General Meetingthe board will again seek shareholders’approval to renew the annual authority forthe company to make purchases of its ownshares through the market.
Rights and Obligations Attaching toSharesThe holders of ordinary shares in thecompany are entitled to receive dividendswhen declared, to receive the company’sannual report, to attend and speak atgeneral meetings of the company, toappoint proxies and to exercise votingrights.
As at 31st March 2012 and as at thedate of publication of this annual report,except as referred to below, there are norestrictions on the transfer of ordinary sharesin the company, no limitations on the holdingof securities and no requirements to obtainthe approval of the company, or of otherholders of securities in the company, for atransfer of securities.
The directors may, in certaincircumstances, refuse to register the transferof a share in certificated form which is notfully paid up, where the instrument oftransfer does not comply with therequirements of the company’s Articles ofAssociation, or if entitled to do so under theUncertificated Securities Regulations 2001.The directors may also refuse to register atransfer of ordinary shares in certificatedform, which represent 0.25% or more of theissued share capital of the company,following the failure by the member or anyother person appearing to be interested inthe shares to provide the company withinformation requested under section 793 ofthe Companies Act 2006 (the 2006 Act).
No person holds securities in thecompany carrying any special rights withregard to control of the company. There areno restrictions on voting rights (including anylimitations on voting rights of holders of agiven percentage or number of votes ordeadlines for exercising voting rights) exceptthat a shareholder has no right to vote inrespect of a share unless all sums due inrespect of that share are fully paid. Thereare no arrangements by which, with thecompany’s cooperation, financial rightscarried by shares in the company are heldby a person other than the holder of theshares. As at 31st March 2012 and as at thedate of publication of this annual report,there are no agreements known to thecompany between holders of securities thatmay result in restrictions on the transfer ofsecurities or on voting rights.
Nominees and LiensDuring the year ended 31st March 2012 andfrom that date up to the date of publicationof this annual report:
• No shares in the company wereacquired by the company’s nominee,or by a person with financial assistancefrom the company, where the companyhas a beneficial interest in the shares(and there was no person whoacquired shares in the company in aprevious financial year in its capacity asthe company’s nominee or with financialassistance from the company); and
• The company did not obtain or hold alien or other charge over its own shares.
Allotment of Securities for Cash andPlacing of Equity SecuritiesDuring the year ended 31st March 2012 andfrom that date up to the date of publicationof this annual report, the company has notallotted, nor has any major subsidiaryundertaking of the company allotted, equitysecurities for cash (other than pursuant toan open offer, a rights issue or any issuespecifically authorised by shareholdersor otherwise). During the year ended31st March 2012 and from that date upto the date of publication of this annualreport the company has not participatedin any placing of equity securities.
Listing of the Company’s SharesThe company’s shares have Premium Listingon the London Stock Exchange and tradeas part of the FTSE 100 index under thesymbol JMAT.
American Depositary ReceiptProgrammeThe company has a sponsored Level 1American Depositary Receipt (ADR)programme which BNY Mellon administersand for which it acts as Depositary. EachADR represents two ordinary shares ofthe company. The ADRs trade on the USover-the-counter market under the symbolJMPLY. When dividends are paid toshareholders, the Depositary converts suchdividends into US dollars, net of fees andexpenses, and distributes the net amountto ADR holders. Contact details for BNYMellon are set out on page 175.

Employee Share SchemesAt 31st March 2012, 4,485 current andformer employees, representingapproximately 45% of employeesworldwide, were shareholders in thecompany through the group’s employeeshare schemes. Through these schemes,current and former employees held3,803,914 ordinary shares (1.77% of issuedshare capital, excluding treasury shares). Asat 31st March 2012, 282 current and formeremployees held options over 758,867ordinary shares through the company’sexecutive share option schemes. Also as at31st March 2012, 2,676,241 ordinary shareshad been allocated but had not yet vestedunder the company’s long term incentive planto 1,007 current and former employees.
Shares acquired by employees throughthe company’s employee share schemesrank equally with the other shares in issueand have no special rights. Voting rights inrespect of shares held through thecompany’s employee share schemes arenot exercisable directly by employees.However, employees can direct the trusteeof the schemes to exercise voting rights ontheir behalf. The trustees of the company’semployee share ownership trust (ESOT)have waived their rights to dividends onshares held by the ESOT which have not yetvested unconditionally in employees.
Interests in Voting RightsThe UK Financial Services Authority’s (FSA)Disclosure and Transparency Rules (DTRs)
set out certain notification requirements inrespect of voting rights in listed companies.In summary, a person must notify the issuerof securities of the percentage of its votingrights he or she holds as shareholder (orholds or is deemed to hold through his orher direct or indirect holding of certainfinancial instruments) if, as a result of anacquisition or disposal of shares in thecompany or financial instruments, thepercentage of those voting rights reaches,exceeds or falls below certain thresholds. In respect of the company, the threshold is 3% (and each 1% threshold above 3%,up to 100%).
Information provided to the companypursuant to the FSA’s DTRs is published ona Regulatory Information Service and on theMedia / News / Regulatory News section ofthe company’s website.
Contracts with ControllingShareholdersThere were no contracts of significance (asdefined in the FSA’s Listing Rules) subsistingduring the year ended 31st March 2012 orfrom that date up to the date of publicationof this annual report between any groupundertaking and a controlling shareholder.There were no contracts for the provision ofservices to any group undertaking by acontrolling shareholder subsisting during theyear ended 31st March 2012 or from thatdate up to the date of publication of thisannual report.
DirectorsThe following served as directors during theyear ended 31st March 2012:
• Tim Stevenson• Sir John Banham (retired 19th July 2011)• Neil Carson• Alan Ferguson• Sir Thomas Harris• Robert MacLeod• Larry Pentz• Michael Roney• Bill Sandford• Dorothy Thompson• Alan Thomson (retired 19th July 2011)• Robert Walvis (retired 19th July 2011).
The biographical details of all thedirectors serving at 31st March 2012,including details of their relevant experienceand other significant commitments, areshown on page 83.
As announced on 22nd May 2012, Sir Thomas Harris will be retiring from theboard at the close of the 2012 AnnualGeneral Meeting on 25th July 2012.
Johnson Matthey Annual Report & Accounts 2012Report of the Directors – GovernanceGovernance
102
The following information had been disclosed to the company under the FSA’s DTRs in respect of notifiable interests in the voting rights inthe company’s issued share capital exceeding the 3% notification threshold:
Nature of holding (1) Total voting rights % of total voting rights (2)
As at 31st March 2012:
BlackRock, Inc. Indirect 21,440,270 9.99%Financial Instrument (CFD) 25,683 0.01%
Ameriprise Financial, Inc. Direct 264,202 0.12%Indirect 10,512,731 4.89%
Lloyds Banking Group plc Indirect 10,731,602 4.99%
FIL Limited Indirect 10,516,934 4.89%Financial Instrument (CFD) 43,890 0.02%
Legal & General Group Plc Direct 8,581,762 3.99%
From 31st March 2012 to 31st May 2012:
BlackRock, Inc. Indirect 21,262,792 9.90%Financial Instrument (CFD) 269,490 0.13%
(1) A person has an ‘Indirect’ holding of securities if they are held on its behalf or it is able to secure that rights carried by them are exercised in accordance with its instructions.
(2) Total voting rights attaching to the issued ordinary share capital of the company (excluding treasury shares) at the date of disclosure as notified to the company.
Other than as stated above, as far as the company is aware, there is no person with a significant direct or indirect holding of securities inthe company.
Other Statutory Information continued

103
Appointment and Replacementof DirectorsThe rules about the appointment andreplacement of directors are contained inthe company’s Articles of Association. TheArticles of Association provide that thenumber of directors is not subject to anymaximum but must not be less than six,unless otherwise determined by the companyby ordinary resolution. Directors may beappointed by an ordinary resolution of themembers or by a resolution of the directors.
Under the Articles of Association, adirector appointed by the directors mustretire at the next following annual generalmeeting and is not taken into account indetermining the directors who are to retireby rotation at the meeting. Also under thecompany’s Articles of Association, at leastone third of the board must retire byrotation at each annual general meeting.Notwithstanding these provisions, theboard has agreed that all directors will seekre-election at each annual general meetingin accordance with the Code. Accordingly,all directors (other than Sir Thomas Harris) will be offering themselves for re-electionat the 2012 Annual General Meeting.
A director may be removed by aspecial resolution of the company. Inaddition, a director must automaticallycease to be a director if (i) he or she ceasesto be a director by virtue of any provision ofthe 2006 Act or he or she becomesprohibited by law from being a director, or (ii) he or she becomes bankrupt or makesany arrangement or composition with his orher creditors generally, or (iii) he or she issuffering from a mental disorder, or (iv) he orshe resigns from his or her office by notice in writing to the company or, in the case ofan executive director, the appointment isterminated or expires and the directorsresolve that his or her office be vacated, or (v) he or she is absent for more than sixconsecutive months without permission ofthe directors from meetings of the directorsand the directors resolve that his or heroffice be vacated, or (vi) he or she isrequested in writing, or by electronic form,by all the other directors to resign.
The Company’s Articles ofAssociationThe company’s Articles of Association areavailable on the Investor Relations /Corporate Governance section of thecompany’s website. The company’s Articlesof Association may only be amended by aspecial resolution at a general meeting ofthe company.
Powers of the DirectorsThe powers of the directors are determinedby the company’s Articles of Association,UK legislation including the 2006 Act andany directions given by the company ingeneral meeting.
The directors have been authorised bythe company’s Articles of Association toissue and allot ordinary shares and to makemarket purchases of its own shares. Thesepowers are referred to shareholders forrenewal at each annual general meeting.Any shares so purchased by the companymay be cancelled or held as treasury shares.Further information is set out under‘Purchase by the Company of its OwnShares’ on page 101.
The Interests of Directors in theCompany’s SharesThe interests of persons who were directorsof the company at 31st March 2012, andtheir connected persons, in the issuedshares of the company (or in derivatives orother financial instruments relating to suchshares) as at that date notified or notifiableto the company under the FSA’s DTRs aregiven in the Remuneration Report on pages116 and 117. The Remuneration Report alsosets out details of any changes in thoseinterests between 31st March 2012 and31st May 2012.
Directors’ Interests in ContractsOther than service contracts, no directorhad any interest in any material contract withany group company at any time during theyear ended 31st March 2012 or from thatdate up to the date of publication of thisannual report. There were no contracts ofsignificance (as defined in the FSA’s ListingRules) subsisting during the year ended 31st March 2012 or from that date up to thedate of publication of this annual report towhich any group undertaking was a partyand in which a director of the company is or was materially interested.
Change of ControlDuring the year ended 31st March 2012and from that date up to the date ofpublication of this annual report there wereno significant agreements to which thecompany or any subsidiary was or is a partythat take effect, alter or terminate on achange of control of the company followinga takeover bid.
However, the company and itssubsidiaries were, during this period, andare, as at the date of publication of thisannual report, party to a number ofcommercial agreements that may allowthe counterparties to alter or terminatethe agreements on a change of controlof the company following a takeover bid.
Other than the matters referred to below,these are not deemed by the company tobe significant in terms of their potentialeffect on the group as a whole.
The group has a number of loan notesand borrowing facilities which may requireprepayment of principal and payment ofaccrued interest and breakage costs if thereis change of control of the company. Thegroup has also entered into a series offinancial instruments to hedge its currency,interest rate and metal price exposureswhich provide for termination or alterationif a change of control of the companymaterially weakens the creditworthinessof the group.
The company is party to a marketingagreement with a subsidiary of AngloAmerican Platinum Limited, originallyentered into in 1992, under which thecompany was appointed as sales andmarketing agent for refined platinum groupmetals worldwide excluding the US and thecompany agreed to provide certainmarketing services. The agreement containsprovisions under which the counterpartymay have the right to terminate theagreement on a change of control of thecompany.
The executive directors’ servicecontracts each contain a provision to theeffect that if the contract is terminated bythe company within one year after a changeof control of the company, the company willpay to the director as liquidated damagesan amount equivalent to one year’s grossbasic salary and other contractual benefitsless the period of any notice given by thecompany to the director.
The rules of the company’s employeeshare schemes set out the consequencesof a change of control of the company onparticipants’ rights under the schemes.Generally such rights will vest and becomeexercisable on a change of control subjectto the satisfaction of relevant performanceconditions.
During the year ended 31st March2012 and from that date up to the date ofpublication of this annual report there wereno other agreements between the companyor any subsidiary and its or their directors oremployees providing for compensation forloss of office or employment (whetherthrough resignation, purported redundancyor otherwise) that occurs because of atakeover bid.

Disabled PersonsA description of the company’s policyapplied during the year ended 31st March2012 and from that date up to the date ofpublication of this annual report relating tothe recruitment, employment and training of disabled employees can be found onpage 81.
Employee InvolvementA description of the action taken by thecompany during the year ended 31st March2012 and from that date up to the date ofpublication of this annual report relating toemployee involvement can be found onpages 48 to 59.
Use of Financial InstrumentsInformation on the group’s financial riskmanagement objectives and policies and itsexposure to credit risk, liquidity risk, interestrate risk and foreign currency risk can befound on pages 155 to 160.
BranchesThe company and its subsidiaries haveestablished branches in a number ofdifferent countries in which they operate.
Policy on Payment ofCommercial DebtsThe group’s policy in relation to the paymentof all suppliers and persons who maybecome suppliers is set out in its GroupControl Manual, which is distributed to allgroup operations. The group’s policy is thatpayment should be made within the creditterms agreed with the supplier, subject tothe supplier having performed its obligationsunder the relevant contract. It is not thegroup’s policy to follow any other specificcode or standard on payment practice inrespect of its suppliers.
At 31st March 2012, the company’saggregate level of ‘creditor days’ amountedto 5 days. Creditor days are calculated bydividing the aggregate of the amounts whichwere outstanding as trade payables at 31st March 2012 by the aggregate of theamounts the company was invoiced bysuppliers during the year ended 31st March2012 and multiplying by 365 to express theratio as a number of days.
Charitable DonationsDuring the year ended 31st March 2012 thegroup donated £645,000 (2011 £517,000) tocharitable organisations worldwide, of which£378,000 (2011 £320,000) was in the UK.Further information on donations made bythe group worldwide are given on page 58.
Political Donations andExpenditureIt is the policy of the group not to makepolitical donations or incur politicalexpenditure.
Under applicable UK legislation (the2006 Act), political donations by thecompany to any political parties, otherpolitical organisations or independentelection candidates or the incurring by thecompany of political expenditure areprohibited unless authorised by shareholdersin advance. Under the legislation, the termspolitical donation, political party, politicalorganisation and political expenditure arecapable of wide interpretation. Sponsorship,subscriptions, payment of expenses, paidleave for employees fulfilling public dutiesand support for bodies representing thebusiness community in policy review orreform may fall within these definitions.
During the year ended 31st March 2012:
• No political donations were made bythe company or its subsidiaries to anyEU political party, to any other EUpolitical organisation or to any EUindependent election candidate(2011 £ nil);
• No EU political expenditure wasincurred by the company or itssubsidiaries (2011 £ nil); and
• No contributions were made by thecompany or any subsidiary to anynon-EU political party within themeaning of the 2006 Act (2011 £ nil).
The term ‘EU’ as used above appliesto parties, organisations and independentelection candidates that seek public office inany EU Member State and to expenditureincurred in their support or in relation to anyreferendum held under the laws of an EUMember State. ‘Non-EU political party’means any political party which carries on,or proposes to carry on, its activities whollyoutside EU Member States.
The company has no intention eithernow or in the future of making any politicaldonation or incurring any politicalexpenditure in respect of any political party,political organisation or independent electioncandidate. However, to avoid inadvertentlycontravening the 2006 Act, the board isproposing at the 2012 Annual GeneralMeeting to renew the authority, first grantedby shareholders at the annual generalmeeting in 2004, and renewed at eachsubsequent annual general meeting, for thecompany to make political donations and toincur political expenditure. The proposed
authority will be subject to an overallaggregate limit on donations andexpenditure of £50,000. As permitted underthe 2006 Act, the resolution will extend topolitical donations made, or politicalexpenditure incurred, by any subsidiariesof the company.
Financial Assistance Receivedfrom GovernmentThe group received no financial assistancefrom government during the year.
Auditors and Disclosure ofInformationIn accordance with section 489 of the 2006Act, resolutions are to be proposed at the2012 Annual General Meeting for thereappointment of KPMG Audit Plc as auditorof the company and to authorise thedirectors to determine its remuneration.
So far as each person serving as adirector of the company at the date thisReport of the Directors was approved by theboard is aware, there is no relevant auditinformation (that is information needed bythe auditor in connection with preparing itsreport) of which the company’s auditor isunaware. Each such director herebyconfirms that he or she has taken all thesteps that he or she ought to have taken asa director in order to make himself or herselfaware of any relevant audit information andto establish that the company’s auditor isaware of that information.
Management ReportThe Report of the Directors is the“management report” for the purposes ofthe Financial Services Authority’s Disclosureand Transparency Rules (DTR 4.1.8R).
The Report of the Directors was approvedby the board on 6th June 2012 and issigned on its behalf by:
Simon FarrantCompany Secretary
Other Statutory Information continued
Johnson Matthey Annual Report & Accounts 2012Report of the Directors – GovernanceGovernance
104

105
Nomination Committee Report
Tim StevensonChairman of the NominationCommittee
RoleThe terms of reference of the NominationCommittee are summarised on page 89.The terms of reference can be found in theInvestor Relations / Corporate Governancesection of the company’s website or maybe obtained from the Company Secretary.
CompositionThe Nomination Committee comprises allthe independent non-executive directorstogether with the group Chairman. Thequorum necessary for the transaction ofbusiness is two, each of whom must bean independent non-executive director.Biographical details of the independentnon-executive directors and the groupChairman are set out on page 83. Theirremuneration is set out on page 114.
The group Chairman acts as theChairman of the Nomination Committee,although he does not chair the Committeewhen it is dealing with the matter ofsuccession to the chairmanship of thecompany. A non-executive director may notchair the Committee when it is dealing with amatter relating to that non-executive director.
Only members of the Committee havethe right to attend committee meetings.However, the Chief Executive, the GroupDirector, Human Resources and Environment,Health and Safety, external advisers andothers may be invited to attend for all or partof any meeting as and when appropriate.
The Company Secretary is secretaryto the Nomination Committee.
The Committee has the authority toseek any information that it requires fromany officer or employee of the company orits subsidiaries. In connection with its duties,the Committee is also authorised by theboard to take such independent advice(including legal or other professional advice,at the company’s expense) as it considersnecessary. This includes requestinginformation from, or commissioninginvestigations by, external advisers.
Meeting FrequencyMeetings are held on an ad hoc basis,usually immediately after a board meeting,but on such other occasions as may beneeded.
“I am pleased to presentthe Report of theNomination Committee for 2012.”
Main Activities in the YearThe Nomination Committee met twice during the year ended 31st March 2012, on the following dates, and it conducted the following business:
Meeting date Main activities
10th May 2011 • Agreed to recommend to the board the appointment of Michael Roney as Senior IndependentDirector and as Chairman of the Management Development and Remuneration Committee (MDRC)with effect from the close of the annual general meeting in July 2011 following the retirements ofAlan Thomson and Robert Walvis respectively
29th March 2012 • Reviewed board size, structure and composition. The Chairman reported that Sir Thomas Harriswould be retiring from the board at the close of the 2012 Annual General Meeting
• Considered the process for the search for a new non-executive director, including the appointmentof external search consultants
• Discussed the selection criteria for the proposed appointment of a new non-executive director
Since 31st March 2012, the Nomination Committee met once, on the following date, and it conducted the following business:
Meeting date Main activities
31st May 2012 • Reviewed progress in respect of the search for a new non-executive director, including theappointment of external search consultants
Boardroom DiversityThe search for board candidates isconducted, and appointments made, onmerit, against objective selection criteriahaving due regard, amongst other things,to the benefits of diversity on the board,including gender. Diversity is considered bythe Nomination Committee on behalf of theboard in considering board composition andin its process for making board appointments,
including in setting selection criteria. This isreferred to further in the board’s statementon board diversity dated 28th November2011 which is published in the InvestorRelations / Corporate Governance sectionof the company’s website and is set out onpage 92.
In respect of the proposed recruitmentof a new non-executive director, at itsmeeting on 29th March 2012 the Committee
considered a specification which set outcertain essential characteristics for the role,while stating the desirability of diversity.
On behalf of the Nomination Committee:
Tim StevensonChairman of the Nomination Committee

Johnson Matthey Annual Report & Accounts 2012Report of the Directors – GovernanceGovernance
106
Audit Committee Report
Alan FergusonChairman of the AuditCommittee
RoleThe terms of reference of the AuditCommittee, which were updated during thefinancial year, are summarised on pages 89and 90. The terms of reference can befound in the Investor Relations / CorporateGovernance section of the company’swebsite or may be obtained from theCompany Secretary.
CompositionThe Audit Committee comprises all theindependent non-executive directors.Biographical details of the independent non-executive directors are set out on page 83. Their remuneration is set out onpage 114.
Alan Ferguson replaced Alan Thomsonas Chairman of the Audit Committee in July2011 on his retirement from the board.Details of Alan Ferguson’s previous roles,experience and qualifications are set out onpage 83.
The group Chairman, the ChiefExecutive, the Group Finance Director, theHead of Internal Audit and Risk and theexternal auditor attend Audit Committeemeetings by invitation. The Committee alsomeets separately with the Head of InternalAudit and Risk and with the external auditorwithout management being present.
The Company Secretary is secretaryto the Audit Committee.
“I am pleased topresent the Reportof the Audit Committeefor 2012.”
Main Activities in the YearThe Audit Committee met four times during the year ended 31st March 2012, on the following dates, and it conducted the following business:
Meeting date Main activities
26th May 2011 • Reviewed the group’s preliminary announcement, draft report and accounts for the financial year
• Reviewed papers on key accounting judgments, on credit control and credit risk and on litigationaffecting the group
• Considered reports from the external auditor on its audit and its review of the accounts includingaccounting policies and areas of judgment, and its comments on risk management and controlmatters
• Met with both internal audit and the external auditor without management being present
18th July 2011 • Reviewed the group’s interim management statement for the first quarter of the financial year
• Considered reports on internal controls from the internal auditors
• Reviewed the proposed external audit fees and audit scope for the financial year
• Assessed the performance of the external auditor. The review of the external auditor was used toconfirm the appropriateness of its reappointment and included assessment of its independence,qualification, expertise and resources, and effectiveness of the audit process
• Recommended to the board the reappointment of KPMG Audit Plc as auditor
• Considered reports on IT strategy and risks from the Group Director, Information Technology
21st November 2011 • Reviewed the group’s half year results and announcement and the external auditor’s review
• Reviewed papers on key accounting judgments, on credit control and credit risk and on litigationaffecting the group
• Considered reports on the group’s treasury activities from the Group Treasurer
• Considered reports on internal controls from the internal auditors and group security
• Recommended to the board the approval of revised terms of reference for the Committee
• Assessed the performance of the internal auditors

107
Main Activities in the Year (continued)Meeting date Main activities
31st January 2012 • Reviewed the group’s interim management statement for the third quarter of the financial year
• Reviewed the group’s risk register, reports on controls from the internal auditors and group securityand reports from management on the effectiveness of the group’s systems for internal financialcontrol and risk management
• Considered internal audit and security resource requirements and approved the internal audit andgroup security plans for 2012/13
• Reviewed metal trading limits and controls
• Received an update from the external auditor on accounting, reporting and governance developments
• Reviewed non-audit services provided by the external auditor during the financial year to date andthe associated authorisation policy
• Reviewed the group’s whistleblowing procedures and the matters raised during the year
• Approved changes to the Group Control Manual, including changes to the group authority levels
• Received and considered a presentation on the risks facing the Process Technologies business fromits finance director
Since 31st March 2012, the Audit Committee has met once, on the following date, and it conducted the following business:
Meeting date Main activities
31st May 2012 • Reviewed the group’s preliminary announcement, draft report and accounts for the financial year andthe group’s assessment of going concern
• Considered the reappointment of the external auditor for the following year
• Considered reports on internal controls from the internal auditors and group security
• Met with both internal audit and the external auditor without management being present
Independence of External AuditorBoth the board and the external auditor have for many years had safeguards inplace to avoid the possibility that theauditor’s objectivity and independence couldbe compromised. The issue of auditorindependence is taken very seriously and isreviewed annually. This year some changeshave been made to the senior audit team.A second partner has been introduced partlyto provide greater senior level coverage butalso to provide some continuity when thesigning partner rotates in 2013.
Our policy in respect of servicesprovided by the external auditor is asfollows:
• Audit related services – the externalauditor is invited to provide serviceswhich, in its position as auditor, it must or is best placed to undertake.This includes formalities relating toborrowings, shareholder and othercirculars, various other regulatoryreports and work in respect ofacquisitions and disposals
• Tax compliance and advice – theauditor may provide such serviceswhere it is best suited, but otherwisesuch work is put out to tender
• Other services – these may not beprovided where precluded by ethicalstandards or where we believe it wouldcompromise audit independence andobjectivity.
To the extent consistent with the abovepolicy, services likely to cost less than£25,000 may be approved by the GroupFinance Director. Services above thisamount must be approved by the Chairmanof the Audit Committee, unless they arelikely to be in excess of £100,000, when theymust be approved by the Audit Committee.
The split between audit and non-auditfees for the year ended 31st March 2012and information on the nature of non-auditfees appear in note 5 on the accounts.
Internal AuditInternal audit independently reviews therisks and control processes operated bymanagement. It carries out independentaudits in accordance with an internal auditplan which is agreed with the AuditCommittee before the start of the financialyear. As part of this process the Committeelooks at the resources devoted to thefunction to ensure they are adequate todeliver the plan.
The plan provides a high degree offinancial and geographical coverage anddevotes significant effort to the review of therisk management framework surroundingthe major business risks.
Internal audit reports includerecommendations to improve internalcontrols together with agreed managementaction plans to resolve the issues raised.Internal audit follows up the implementationof recommendations and reports progressto senior management and the AuditCommittee.
The Audit Committee reviews thefindings of the internal audits completedduring the year.
The effectiveness of the internal auditfunction is reviewed and discussed on anannual basis.
On behalf of the Audit Committee:
Alan FergusonChairman of the Audit Committee

Remuneration ReportRemuneration Report to Shareholders for the
year ended 31st March 2012
Johnson Matthey Annual Report & Accounts 2012Report of the Directors – GovernanceGovernance
108
Michael RoneyChairman of the ManagementDevelopment andRemuneration Committee
Contents>
Terms of Reference andConstitution of theManagement Developmentand Remuneration Committee(MDRC)
The Management Development andRemuneration Committee is a committeeof the board and comprises all theindependent non-executive directors of thecompany as set out on page 83 and thegroup Chairman. The Chairman of theCommittee was Robert Walvis until hisretirement on 19th July 2011, after whichMichael Roney took over the role.
The Committee’s terms of referenceinclude determination on behalf of the boardof fair remuneration for the Chief Executive,the other executive directors and the groupChairman (in which case the groupChairman does not participate).
Non-executive directors’ remunerationis determined by the board, within the limitsprescribed by the company’s Articles ofAssociation. The remuneration consists offees, which are set following advice takenfrom independent consultants and arereviewed at regular intervals.
In addition, the Committee assists theboard in ensuring that the company has welldeveloped plans for managementsuccession, including the recruitment anddevelopment of senior management, alongwith appropriate remuneration policies toensure that management are retained andmotivated.
The Group Director, Human Resourcesand Environment, Health and Safety(HR and EHS) acts as secretary to theCommittee. The full terms of referenceof the Committee are available on thecompany’s website at www.matthey.com in the Investor Relations / CorporateGovernance section.
108 Introduction to the Remuneration Report 108 Terms of Reference and Constitution of the Management
Development and Remuneration Committee (MDRC)109 Activities of the MDRC109 Johnson Matthey – Executive Remuneration Policy110 Executive Remuneration Practices and Rules 2011/12112 Outcomes – Actual Remuneration for 2011/12115 Other Historical and Statutory Information
Introduction to the Remuneration Report
The overriding responsibility of a remuneration committee is to createthe remuneration policies and practices that achieve the best value forshareholders. Pay and incentives have to be set at the right level toattract and retain good management and to fully incentivise outstandingmanagement performance, but at levels that are in line with the sector ingeneral, and that provide a fair return to shareholders.
This year, we recognise that the remuneration of senior executives isunder more scrutiny than ever before and we are mindful of theprinciples of remuneration published by stakeholder representativessuch as the Association of British Insurers (ABI) and of the potentialrevisions to governance outlined by the Department of Business,Innovation and Skills. This report seeks to be open and transparent inreporting on remuneration and on the basis for remuneration, bothhistorically and going forward.
The remuneration committee is also charged with ensuring that thelong term interests of the company and shareholders are taken fully intoaccount, both in remuneration structure and in ensuring that goodprocesses exist for management development and succession planning.This is particularly important in a high technology company where R&Dinvestment is required many years before those ideas come tocommercial fruition. Therefore we aim to build remuneration policies andstructures that reward performance over the long term and thatencourage directors and employees to develop long term careers withthe company.
I believe that the consistent results over the last decade, theconsistency and success of a largely internally developed managementteam and the very strong year we have experienced in 2011/12 indicatethat we have good policies and practices in place. However, we willcontinue to review all aspects of remuneration, managementdevelopment and succession planning to ensure that shareholders’interests continue to be fully represented.
Michael Roney

109
Activities of the MDRC
The Committee meets at least three times per year. The principal activities are set out in the terms of reference and the timetable for specificreviews and approval processes is set out below. In 2011/12 the committee met on four occasions.
Table of Remuneration Committee Activities
Meeting Annual agenda items Other agenda items
May Review of CEC and senior managers’ salary increasesReview of executive directors’ salary and bonusReview of pay within the groupApproval of the Remuneration Report
May or July Approval of executive directors’ salary and bonus Chairman’s feesApproval of LTIP allocation (every three years)Approval of LTIP vestingReview of other senior managers’ salary increases and bonus payments
November Management development and succession planningReview of the share incentive planUpdate on remuneration issuesReview of remuneration policy
March Approval of bonus scheme rules Major review of structureReview of the share incentive plan of executive remuneration
(every three years)
Johnson Matthey – ExecutiveRemuneration PolicyKey Goals of Policy and BalanceBetween Fixed and VariableRemunerationThe key goal of the remuneration policyremains to obtain the best value forshareholders. This requires that the pay andbenefits structure is competitive within thesector, whilst simultaneously providingstretching targets that require significantoutperformance to maximise incentivepayments.
Basic salaries are the primary elementof remuneration and the general policy isto set basic salaries at the level requiredto retain and motivate, taking into accountindividual performance, the complexityand scale of the director’s duties, lengthof time in post and taking due cognisanceof market levels in the appropriate sector.The Committee recognises that there is acompetitive market for successful executivesand therefore benchmark data are regardedas relevant background information.However, it is not the policy of theCommittee to set salaries directly in linewith that data, or in line with benchmarksmathematically derived from that data.
With regard to variable pay, theCommittee believes that the provision ofappropriate rewards for superior performanceis vital to the continued growth of the business.
Further incentives in variable pay aretherefore to be structured in a way thatprovides the incentives for effective shortand long term management and createsthe opportunity for enhanced remunerationbut only for outstanding performance.
The details of the structures devised forshort term bonuses and long termincentives are described in the subsequentsection of this Remuneration Report.
The Committee further considers the balance between fixed elements ofremuneration, such as basic salaries, andthe performance related aspects of theremuneration package and seeks to ensurethat any earnings beyond basic salaries arefully reflected in increased shareholder valuethrough higher profit and earnings per share.
It is also an element of the policy thatexecutive directors are encouraged to buildup over time, and hold, a shareholding in thecompany equal to at least their basic salarywith a view to ensuring that their interestsremain fully aligned with those of theshareholders. Details of directors’shareholdings are set out on page 116.
Global Pay and EmploymentPolicies Across the GroupThe remuneration policy of the groupremains consistent in all countries and at alllevels of the company with the overridingconsideration being to pay competitivesalaries in line with the appropriate countryand sector and to provide opportunities toincrease earnings to higher levels throughsuperior performance. Almost all JohnsonMatthey employees are able to earnbonuses based on business performanceand around 900 employees are able to earnbonuses based on individual, team andbusiness performance. Around 900employees globally are eligible to participatein the Johnson Matthey Long Term IncentivePlan (LTIP).
Executive Pay in the Context ofGeneral Earnings Across theGroupIn setting executive directors’ basic salaries,annual bonus awards and LTIP allocations,the Committee is made aware ofcomparative data relating to the pay andbenefits of other group employees.International data provided by the HayGroup is also utilised in considering anddetermining local settlements.
Policy with Regard toRemuneration AdvisersIn determining the remuneration structure,the Committee appoints and receives advicefrom independent remuneration consultantson the pay and incentive arrangementsprevailing in comparably sized industrialcompanies in each country in whichJohnson Matthey has operations. During theyear, such advice was received from the HayGroup, which also provided advice on jobevaluation, and PricewaterhouseCoopers LLP.PricewaterhouseCoopers LLP also providedexpatriate tax advice and other tax advice,tax audit work, completion of overseas taxreturns, advice on set up of new overseasoperations, some overseas payroll servicesand a review of some financial controls.
A statement regarding the use ofremuneration consultants for the year ended31st March 2012 is available on thecompany’s website at www.matthey.com inthe Investor Relations / CorporateGovernance section.

The Committee also receivesrecommendations from the Chief Executiveon the remuneration of those reporting tohim as well as advice from the GroupDirector, HR and EHS.
This is the general remuneration policyof the Committee and the details of theexact remuneration structure are given in thesubsequent section of this report.
Executive RemunerationPractices and Rules 2011/12
In 2010/11 a full review of remuneration was carried out, followed by a shareholderconsultation in early 2011. The newpractices and rules were described in lastyear’s annual report and are now used in thecalculation of variable pay and bonuses forthe executive directors.
Remuneration Basis with Effectfrom 1st April 2011: the Rules asthey StandExecutive directors’ remuneration consistsof three principal elements: these beingbasic pay, annual bonus and a long termincentive plan. The details of these are set out below. Information on pensionarrangements for the executive directorsis also included in this section.
Basic Salary The general policy regarding basic salarieshas been set out on page 109, indicatingthat there are a number of determinants inarriving at the basic salary award. These key determinants are described in moredetail below.
The first determinant is theperformance of the individual executive.Performance is considered against a broadset of parameters including financial,environmental, social and governanceissues.
The second factor taken into account isthe length of time that the executive directorhas been in post. For example, wherepromotion has taken place, the salary mayinitially be set at a lower level than theoutgoing director. This can then give rise tohigher than normal salary increases whilethe director gathers experience and movestowards the job norm.
The third factor is a judgment as towhether the level of basic pay remainscompetitive and appropriate in the relevantcomparator group. For the purposes ofbenchmarking, the remuneration comparatorused by the Committee during 2011/12 forexecutive directors was drawn from FTSE100 and 250 industrial and servicecompanies (excluding the oil and financialsectors) with market capitalisation of around£4.8 billion and with over 40% of revenue
coming from overseas. Further independentbenchmark data was sourced from the HayGroup. Benchmark data are regarded asrelevant background information for theCommittee, but it is not its policy to setsalaries directly in line with that data, or withbenchmarks mathematically derived fromthat data. Basic salary is normally reviewedon 1st August each year.
LTIPThe LTIP is designed to incentivise aboveaverage performance and growth over thelonger term. Shares allocated under theterms of the LTIP (which also applies to thegroup’s 900 senior and middle managers)are released on the third anniversary of theallocation date with the release beingsubject to targets based on compoundannual growth in the company’s earningsper share (EPS). Current rules require that toachieve the maximum release of allocatedshares, a compound annual growth inunderlying EPS of 15% must be achievedover the three year period. The Committeestrongly believes that EPS remains the bestoverall measure of the performance of thegroup across all strategic goals. TheCommittee has considered setting broadertargets for LTIP in areas such assustainability and new product development,but is satisfied that the full total of successfuland long term focused company activitiesare best encapsulated in the simple andtransparent measure of compound annualgrowth in EPS over a longer period.
Prior to 2011, the bases for shareallocations were 150% of basic annualsalary for the Chief Executive and 120% forexecutive directors. In 2011, in accordancewith the review published in the 2011 annualreport, share allocations of 175% of basicannual salary for the Chief Executive and140% of annual salary for executivedirectors were made. These allocationsremain within the LTIP rules, as approved byshareholders at the 2007 Annual GeneralMeeting, which allow for share allocations ofup to a maximum of 200% of basic annualsalary each year, allowing the Committee totake account of evolution of market practice if required.
The minimum release, of 15% of theallocated shares, requires underlying EPSgrowth of 6% compound per annum overthe three year period. For the maximumrelease of 100% of the allocation, underlyingEPS must have grown by at least 15%compound per annum over the three yearperformance period. The number ofallocated shares released will vary on astraight line basis between these points.There is no retesting of the performancetarget and so allocations will lapse ifunderlying EPS growth is less than 6%compound per annum over the three yearperformance period.
In 2009, following consultation withmajor shareholders, the Committeeapproved an adjustment to the performancetargets for one year only to reflect themarket conditions prevailing at the time ofallocation. For the 2009 allocation only, theminimum release, of 15% of the allocation,requires underlying EPS growth of 3%compound per annum over the three yearperiod, with no retesting of the performancetarget. For the maximum release of 100%of the allocation, underlying EPS must havegrown by at least 10% compound perannum over the three year performanceperiod. As a result of this adjustment, thelevel of award was reduced to 120% ofbasic annual salary for the Chief Executiveand 100% for executive directors for thatyear. Also in 2009, there was a one-offallocation of 170% of basic salary to thethen newly appointed Group FinanceDirector to ensure close alignment of hisobjectives with those of shareholders.
Although growth in underlying EPS isthe primary financial measure, it is also a key objective of the company to achieveearnings growth only in the context of agood performance on return on investedcapital (ROIC). Accordingly, the Committeeis required to make an assessment of thegroup’s ROIC over the performance periodto ensure underlying EPS growth has beenachieved with ROIC in line with the group’splanned expectations. The Committee mayscale back vesting to the extent that ROIChas not developed appropriately.
Annual Bonus The annual bonus is complementary to thelonger term LTIP award and provides astrong incentive for a short term delivery ofbudget in the relevant year. Whilst the LTIPtarget encourages business managers andthe executive directors to set ambitiousthree year targets, the annual bonus allowsthe board to ensure that those plans areproperly reflected in stretching butachievable annual budgets. The annualbonus is then based strictly on performanceagainst budget, requiring that the group’sbudgeted underlying profit before tax(PBT) is exceeded by 10% to release themaximum payment.
The maximum bonus is set as apercentage of basic salary under the terms of the company’s ExecutiveCompensation Plan. As with the LTIP, thisplan applies not only to the executivedirectors, but to around 200 of the group’smost senior executives.
Remuneration Report continued
Johnson Matthey Annual Report & Accounts 2012Report of the Directors – GovernanceGovernance
110

111
An annual bonus payment of 75% of basicsalary (prevailing at 31st March) is paid tothe Chief Executive and 62.5% of basicsalary is paid to executive directors if thegroup meets the annual budget. This bonusmay rise on a straight line basis to amaximum 150% of basic salary for the ChiefExecutive and 125% for executive directorsif 110% of budgeted underlying PBT isachieved. Underlying PBT must reach 95%of budget for a minimum bonus of 15% ofsalary to be payable.
For the Chief Executive, 33.3% of thebonus payable is awarded as shares anddeferred for a period of three years. Forother executive directors, 20% of the bonuspayable is awarded as shares and deferredfor three years. The Committee is entitled toclaw back the deferred element in cases ofmisstatement or misconduct or otherrelevant reason as determined by theCommittee.
The Committee retains discretion inawarding annual bonuses and seeks toensure that the incentive structure for seniormanagement does not raise environmental,social and governance risks by inadvertentlymotivating irresponsible behaviour. TheCommittee is fully prepared to utilise thisdiscretion where management has failed toproperly address such risks.
Other BenefitsThe other benefits available to the executivedirectors are private medical insurance, acompany car and membership of thegroup’s employee share incentive planswhich are open to all employees in thecountries in which the group operates such plans.
Service ContractsThe executive directors are employed oncontracts subject to one year’s notice at anytime. On early termination of their contractsthe directors would normally be entitled to 12 months’ salary and benefits. Thecontracts of service of the executive directorsand the terms and conditions of appointmentof the non-executive directors are availablefor inspection at the company’s registeredoffice during normal business hours and atthe forthcoming annual general meeting.
Pensions – General Description ofArrangementsThe company provides executive directorswith membership of its UK HM Revenue &Customs registered occupational pensionscheme – the Johnson Matthey EmployeesPension Scheme (JMEPS). The benefitsprovided to executive directors throughJMEPS are the same as for all other UKemployees, namely a defined benefitretirement pension, dependents’ and lifeassurance benefits plus a top-up definedcontribution account. There have been nosignificant changes to the JMEPS rulesduring 2011/12.
The pension earned in respect ofservice up to 31st March 2010 is based ona member’s final salary at the point ofretirement, or earlier date of withdrawal fromemployment. Pension earned in respect ofservice from 1st April 2010 is based on themember’s career average revalued earnings.Members are not required to paycontributions to receive these definedbenefits. However members may payvoluntary contributions to a supplementaldefined contribution account and the
company will match any contribution madeup to 3% of pensionable pay each year.
Under the provisions of the Finance Act2004 benefits from a registered pensionscheme that exceed the Annual Allowanceor Lifetime Allowance will be subject to a taxcharge. The Annual Allowance and LifetimeAllowance were reduced to £50,000 and£1.5 million respectively with effect from6th April 2011. On reaching these thresholdsmembers, including executive directors,are given the option to limit their benefitsin JMEPS and receive a cash supplementin lieu of the pension benefit forgone, or tocontinue accruing benefits in the schemeand pay the tax charge. Any tax liability due is the responsibility of the individual notthe company.
Neil Carson and Bill Sandford withdrewfrom pensionable service on 31st March2006 and Robert MacLeod withdrew on31st March 2011. No pensionable servicein JMEPS has been accrued by thesedirectors since then and all have received acash supplement of 25% of basic salary inlieu of the pension benefit forgone. Theincrease in accrued pension for MessrsCarson and Sandford in the table on page115 is attributable solely to the effect of theincrease in their basic salary in 2011/12 ontheir pension earned before 1st April 2006.
During the year Larry Pentz accruedpension in JMEPS up to the AnnualAllowance and elected to cease pensionaccrual for the remainder of the year inreturn for a cash supplement of 21% ofbasic salary.
The supplemental payments receivedby all executive directors are reflected in thetable on page 114.
Annual Bonus RulesBonus
awarded Bonus at 110%
awarded Bonus of budgetat threshold awarded (maximum
(95% of budget) at target award) % of awarded(% of salary) (% of salary) (% of salary) bonus deferred
Chief Executive 15% 75% 150% 33.3%Other executive directors 15% 62.5% 125% 20%
Setting the Annual Bonus TargetIn order for the annual bonus to provide a strong short term performance incentive, it is key that the budgeted profitability is set at anachievable but demanding target. The board is responsible for agreeing the targeted performance and takes into account the detailedbusiness climate for each operating division of the group. Commercial sensitivity prevents the advance publication of targets, but furtherinformation regarding historical performance is available in the following table.
Retrospective Data on Annual Budget Targets
Chief ExecutiveBudgeted Actual Executive’s directors’ Vara Actual
underlying PBT underlying PBT % of bonus bonus consensus* underlyingYear (£ million) (£ million) budget (% of salary) (% of salary) (£ million) PBT growth
2011/12 406.0 426.0 104.9% 111.75% 93.13% 382 23%
* The Vara consensus referred to is the published data regarding industry analysts’ performance expectations for Johnson Matthey, as expressed at the start of the budget year in question.For example, the consensus for 2011/12 is that published in March 2011.

Outcomes – Actual Remuneration for 2011/12
This section provides details of the actual payments and awards to directors in 2011/12. Full numerical details are provided in the tables onpages 113 to 117.
In order to fully illustrate the relationships between actual payments, on target payments and stretch (maximum) payments, graphs of therelevant data are shown below for each of the four executive directors. This does not include share option exercises from awards made inprior years. See pages 116 and 117 for further details.
Remuneration Report continued
Johnson Matthey Annual Report & Accounts 2012Report of the Directors – GovernanceGovernance
112
0 500 1,000 1,500 2,000 2,500 3,000 3,500
Stretch
£ thousands
On target
Actual
Basic salary Benefits Payment in lieu of pension Bonus (cash) Bonus (deferred to 2015) LTIP paid out
> Neil Carson – overall remuneration
0 500 1,000 1,500 2,000 2,500 3,000 3,500
Stretch
£ thousands
On target
Actual
> Robert MacLeod – overall remuneration
0 500 1,000 1,500 2,000 2,500 3,000 3,500
Stretch
£ thousands
On target
Actual
> Larry Pentz – overall remuneration
0 500 1,000 1,500 2,000 2,500 3,000 3,500
Stretch
£ thousands
On target
Actual
> Bill Sandford – overall remuneration
Basic Salary 2011/12The changes in basic salary for each of the directors are illustrated in the table below.
Basic salary at Basic salary at1st August 2010 1st August 2011 Increase
Name (£) (£) (%)
Neil Carson 750,000 776,250 3.5Robert MacLeod 406,600 421,000 3.5Larry Pentz 390,000 403,650 3.5Bill Sandford 345,000 357,100 3.5
Comparison to Other Pay Awards in Johnson MattheyPay awards throughout Johnson Matthey’s global operations have generally ranged between 0% and 10% in the last year, depending on localpay conditions and on local business and economic conditions. Pay awards in the UK have generally been around the 3% level with somelocal variations dependent on business conditions.

113
LTIP Vesting in 2011/12 and Historical InformationThe 2008 share allocation vested in July 2011. The performance condition was met to the extent that 52.42% of the allocated shares were released.
Details of LTIP awards, performance and vesting details are provided below.
Compoundannual growth in Value at time
Year of % salary Shares underlying EPS Shares of releaseYear of allocation vesting awarded awarded in the period released (£)
Neil Carson2007 2010 150 56,704 1.68% 0 02008 2011 150 56,239 9.96% 29,480 614,2332009 2012 120 71,611 19.60% 71,611 Vesting July 20122010 2013 150 72,393 n/a2011 2014 175 69,096 n/a
Robert MacLeod2007 2010 n/a 0 1.68% 0 02008 2011 n/a 0 9.96% 0 02009 2012 170* 55,072 19.60% 55,072 Vesting July 20122010 2013 120 31,397 n/a2011 2014 140 29,979 n/a
Larry Pentz2007 2010 120 22,327 1.68% 0 02008 2011 120 21,853 9.96% 11,455 238,6722009 2012 100 31,116 19.60% 31,116 Vesting July 20122010 2013 120 30,115 n/a2011 2014 140 28,744 n/a
Bill Sandford2007 2010 120 15,268 1.68% 0 02008 2011 120 15,318 9.96% 8,029 167,2892009 2012 100 25,575 19.60% 25,575 Vesting July 20122010 2013 120 26,640 n/a2011 2014 140 25,429 n/a
* See page 110.

Johnson Matthey Annual Report & Accounts 2012Report of the Directors – GovernanceGovernance
114
Summary Statement of Directors’ Emoluments 2011/12Total
Payment Annual Annual Total prior yearDate of in lieu of cash deferred excluding excludingservice Date of Basic salary pension(1) bonus bonus(2) Benefits pension pension
agreement appointment £’000 £’000 £’000 £’000 £’000 £’000 £’000
ExecutiveNeil Carson (3) 1.8.99 1.8.99 768 192 578 289 22 1,849 1,687Robert MacLeod (4) 3.2.09 22.6.09 416 104 314 78 19 931 822Larry Pentz (5) 1.1.06 1.8.03 399 57 301 75 59 891 810Bill Sandford 21.7.09 21.7.09 353 88 266 67 17 791 774
Total 1,936 441 1,459 509 117 4,462 4,093
TotalTotal prior year
Date of excluding excludingletter of Date of Fees pension pension
appointment appointment £’000 £’000 £’000
Non-executive (6)
Sir John Banham (Chairman) (7) 10.12.05 1.1.06 91 91 293Alan Ferguson 10.1.11 13.1.11 57(9) 57 11Sir Thomas Harris 22.1.09 1.4.09 50 50 50Michael Roney 29.3.07 1.6.07 56(10) 56 50Tim Stevenson (Chairman Designate) (8) 10.1.11 29.3.11 225 225 –Dorothy Thompson 22.5.07 1.9.07 50 50 50Alan Thomson (7) 1.8.02 24.9.02 18(9) 18 60Robert Walvis (7) 1.8.02 24.9.02 18(10) 18 58
Total 565 565 572
The aggregate amount of remuneration receivable by directors and non-executive directors totalled £5,027,000 (2011 £4,665,000).
Notes(1) Neil Carson, Bill Sandford and Robert MacLeod no longer accrue pensionable service in the Johnson Matthey Employees Pension Scheme. Messrs Carson and
Sandford ceased to accrue with effect from 31st March 2006 and Mr MacLeod ceased to accrue with effect from 31st March 2011. They now receive an annual cashpayment in lieu of pension equal to 25% of basic salary. Larry Pentz accrued pension during the year up to the Annual Allowance and received a cash supplement of21% of basic salary thereafter. These payments are taxable under the PAYE system.
(2) This is the element of the annual bonus which is payable as shares but is deferred for three years.(3) Neil Carson is a non-executive director of AMEC plc. His fees for the year in respect of this non-executive directorship were £54,375. This amount is excluded from the
table above and retained by him.(4) Robert MacLeod is a non-executive director of Aggreko plc. His fees for the year in respect of this non-executive directorship were £61,750. This amount is excluded
from the table above and retained by him.(5) Larry Pentz is a non-executive director of Victrex plc. His fees for the year in respect of this non-executive directorship were £48,000. This amount is excluded from the
table above and retained by him.(6) Non-executive fees (other than for the Chairman) were reviewed on 1st April 2010 for the period from 1st April 2010 to 31st March 2013. The fees are £50,000 per
annum, with the fee for chairmanship of the Audit Committee being £10,000 per annum and the Management Development and Remuneration Committee being £8,000per annum. Sir John Banham’s fees were reviewed on 1st August 2010 for the period 1st August 2010 to 19th July 2011 (the date of his retirement). The Chairman andthe non-executive directors do not receive any pension benefits, LTIP allocations, share option grants or bonus payments.
(7) Sir John Banham, Alan Thomson and Robert Walvis retired on 19th July 2011.(8) Tim Stevenson was Chairman Designate until Sir John Banham’s retirement on 19th July 2011, after which he became Chairman.(9) Includes £10,000 per annum for chairmanship of the Audit Committee. Alan Ferguson was appointed Chairman of the Audit Committee on 19th July 2011.
Alan Thomson previously carried out this role and retired on 19th July 2011.(10) Includes £8,000 per annum for chairmanship of the Management Development and Remuneration Committee. Michael Roney was appointed Chairman of the
Management Development and Remuneration Committee on 19th July 2011. Robert Walvis previously carried out this role and retired on 19th July 2011.
Remuneration Report continued

115
Other Historical and Statutory Information
Johnson Matthey and FTSE 100 Total Shareholder Return Rebased to 100The following graph charts total cumulative shareholder return of the company for the five year period from 31st March 2007 to 31st March2012 against the FTSE 100 as the most appropriate comparator group, rebased to 100 at 1st April 2007. The graph shows significantoutperformance by Johnson Matthey against the FTSE 100 group over the five year period.
Pension BenefitsDisclosure of directors’ pension benefits has been made under the requirements of the Financial Services Authority’s Listing Rules and inaccordance with the Companies Act 2006. The information below sets out the disclosures under the two sets of requirements.
Total Total Change in Change inaccrued accrued accrued Transfer Transfer transfer
pension as at pension as at pension value as at value as at value lessAge as at 31st March 31st March after allowing 31st March 31st March Directors’ directors’
31st March 2011(1) 2012(1) for inflation 2011(2) 2012(2) contributions(3) contributions2012 £’000pa £’000 pa £’000 pa £’000 £’000 £’000 £’000
Neil Carson 54 353 365 (6) 6,402 7,655 – 1,253Robert MacLeod 47 9 9 – 81 106 – 25Larry Pentz (4) 56 111 116 2 1,371 1,702 – 331Bill Sandford 58 179 185 (3) 3,779 4,390 – 611
Notes(1) The total accrued pension represents the pension which would be paid annually on normal retirement, based on pensionable service to 31st March 2012 (except in the
case of Neil Carson and Bill Sandford whose pensionable service ceased on 31st March 2006 and Robert MacLeod whose pensionable service ceased on 31st March2011). The element of the pension earned before 31st March 2010 would be subject to an actuarial reduction if retirement precedes age 60, and the element of thepension earned from 1st April 2010 will be reduced if taken before age 65.
(2) The transfer values have been calculated in accordance with GN11 issued by the actuarial profession. For UK based pension benefits the assumptions used are thesame as those in the calculation of cash equivalent transfers from JMEPS. For US based pension benefits the assumptions used are the same as those used foraccounting disclosure. No allowance has been made in the transfer values for any discretionary benefits that have been or may be awarded.
(3) Members are not required to pay contributions towards their pension benefits. Any voluntary contributions paid by executive directors are not shown except where theseare matched by the company. Larry Pentz paid voluntary contributions into the supplemental defined contribution account amounting to 3% of his April 2011 salary, thiscontribution was matched by the company.
(4) Larry Pentz is a US citizen but became a member of JMEPS on 1st January 2006. Prior to that he was a member of the Johnson Matthey Inc. Salaried EmployeesPension Plan (a non-contributory defined benefit arrangement) and also of a US savings plan (401k). He also has benefits in a Supplemental Executive Retirement Plan(SERP). The pension values reported above are the aggregate for his separate membership of the UK and US pension schemes and the SERP. The total accruedpension as 31st March 2011 has been restated to include all of his pension benefits. US entitlements have been converted to sterling by reference to exchange rates on31st March 2011 and 31st March 2012. Mr Pentz’s US pension was fixed on 31st December 2005. The sterling equivalent of it has fluctuated over the year as a resultof exchange rate movements. Of the change in the accrued benefit and the transfer value £300 and £3,020, respectively, is due to currency movements.
Johnson Matthey FTSE 100
40
180
60
80
100
120
140
160
March 2007 March 2008 March 2009 March 2010 March 2011 March 2012
As at 31st March 2012, Johnson Matthey was ranked 60th by market capitalisation in the FTSE 100.

116
Remuneration Report continued
Johnson Matthey Annual Report & Accounts 2012Report of the Directors – GovernanceGovernance
Directors’ InterestsThe interests (in respect of which transactions are notifiable to the company under the Financial Services Authority’s Disclosure andTransparency Rules) of the directors as at 31st March 2012 in the shares of the company were:
1. Ordinary Shares31st March 31st March
2012 2011
Tim Stevenson 5,500 5,500*Neil Carson 188,804 174,374Alan Ferguson 1,000 1,000Sir Thomas Harris 1,807 1,807Robert MacLeod 3,604 3,368Larry Pentz 25,789 25,383Michael Roney 3,000 3,000Bill Sandford 9,165 5,091Dorothy Thompson 9,721 9,721
* Shares acquired on 3rd March 2011, not disclosed in the 2011 annual report.
All of the above interests were beneficial. The executive directors are also deemed to be interested in shares held by an employee shareownership trust (see note 30 on page 162).
Directors’ interests as at 31st May 2012 were unchanged from those listed above, other than that the trustees of the Johnson MattheyShare Incentive Plan have purchased on behalf of Neil Carson, Robert MacLeod, Larry Pentz and Bill Sandford a further 33 shares each.
2. Share OptionsAs at 31st March 2012, individual holdings by the directors under the company’s executive share option schemes were as set out below.Options are not granted to non-executive directors.
TotalOrdinary Exercise Date from number of
Date of shares price which Expiry ordinary sharesgrant under option (pence) exercisable date under option
Neil Carson 17.7.03 33,407 898 17.7.06 17.7.1326.7.06 59,481 1,282 26.7.09 26.7.16 92,888
(2011 218,282)
Larry Pentz 17.7.03 17,185 898 17.7.06 17.7.1326.7.06 28,765 1,282 26.7.09 26.7.16 45,950
(2011 101,530)
Bill Sandford 26.7.06 3,774 1,282 26.7.09 26.7.16 3,774(2011 18,868)
Share Options
The LTIP is now the company’s singlemeans for the provision of long term awardsand from 2007 replaced the granting ofshare options under the Johnson Matthey2001 Share Option Scheme (the 2001Scheme). From 2001 to 2006 options weregranted each year under the 2001 Scheme.There have been no option grants since2006. Options were granted at the marketvalue of the company’s shares at the time ofgrant and were subject to performancetargets over a three year period. Optionsmay be exercised upon satisfaction of therelevant performance targets. Approximately800 employees were granted options underthe 2001 Scheme each year.
Options granted from 2004 to 2006Grants made in 2004, 2005 and 2006 weresubject to a three year performance targetof EPS growth of UK RPI plus 3% perannum. If the performance target was notmet at the end of the three yearperformance period, the options lapsed asthere was no retesting of the performancetarget. In addition, to reduce the costcalculated under the International FinancialReporting Standard 2 – ‘Share-basedPayment’, gains made on the exercise ofoptions are capped at 100% of the grant price.
The Committee had the discretion toaward grants greater than 100% of basicannual salary. Grants which were madeabove this threshold were, however, subjectto increasingly stretching performancetargets. Grants between 100% and 125% ofbasic annual salary were subject to EPSgrowth of UK RPI plus 4% per annum andgrants between 125% and 150% of basic
annual salary were subject to EPS growth ofUK RPI plus 5% per annum. The executivedirectors were granted options equal to150% of basic annual salary. All the options,other than those granted in 2006 whichwere subject to EPS growth of UK RPI plus5% per annum, have met their performancetargets. The 2006 options which did notmeet their performance targets have lapsed.
Options granted prior to 2004Prior to 2004, options granted to theexecutive directors under the 2001 Schemewere up to a maximum of 100% of basicannual salary each year. Such options weresubject to a performance target of EPSgrowth of UK RPI plus 4% per annum overany three consecutive years during the lifeof the option. The performance target wassubject to annual retesting until the lapseof the options on the tenth anniversary ofgrant. All of these options have met theirperformance targets.

117
Between 1st April 2011 and 31st March 2012 the following options were exercised by directors:
Exercise Market priceDate of Date of Options price on exercisegrant exercise exercised (pence) (pence)
Neil Carson 18.7.01 3.6.11 2,770 1,083 2,03818.7.01 3.6.11 16,621 1,083 2,03420.7.05 1.2.12 77,102 1,070 2,14017.7.02 14.2.12 28,901 865 2,281
Larry Pentz 17.7.02 11.1.12 17,730 865 1,99820.7.05 1.2.12 37,850 1,070 2,140
Bill Sandford 26.7.06 1.12.11 15,094 1,282 1,874
Gains made on exercise of options by the directors during the year totalled £2,113,928 (2011 £88,138).
The closing market price of the company’s shares at 30th March 2012 was 2,359 pence. The highest and lowest closing market pricesduring the year ended 31st March 2012 were 2,403 pence and 1,523 pence respectively.
3. LTIP AllocationsNumber of allocated shares:
Market priceAs at Allocations at date of Released Lapsed As at
31st March during allocation during during 31st March2011 the year (pence) the year the year 2012
Neil Carson 200,243 69,096 1,966 29,480 26,759 213,100Robert MacLeod 86,469 29,979 1,966 – – 116,448Larry Pentz 83,084 28,744 1,966 11,455 10,398 89,975Bill Sandford 67,533 25,429 1,966 8,029 7,289 77,644
On 25th July 2011 shares allocated in 2008 under the LTIP were released to participants. The compound annual growth in thecompany’s underlying EPS over the three year performance period, commencing in the year of allocation, resulted in a release of 52.42%of the allocated shares and the following gains:
Number of Share priceshares when released Gain
released (pence) (£)
Neil Carson 29,480 2,084 614,233Larry Pentz 11,455 2,084 238,672Bill Sandford 8,029 2,084 167,289
The Remuneration Report was approved by the Board of Directors on 6th June 2012 and signed on its behalf by:
Michael RoneyChairman of the Management Development and Remuneration Committee
The detailsbehind ourfinancialperformance
Johnson Matthey Annual Report & Accounts 2012Accounts
118

Contents
120 Responsibility of Directors121 Independent Auditor’s Report122 Consolidated Income Statement122 Consolidated Statement of
Total Comprehensive Income123 Consolidated and Parent Company
Balance Sheets124 Consolidated and Parent Company
Cash Flow Statements125 Consolidated Statement of Changes
in Equity126 Parent Company Statement of Changes
in Equity127 Accounting Policies131 Notes on the Accounts
AccountsThis section includes the consolidated and parent company accounts and related notes, as well as the statementon responsibility of directors and the independent auditor’s report on the financial accounts.
. Colour Technologies’ products include black obscurationenamels which are printed onto car windscreens.
. Screen printing facilities in the technologycentre at Maastricht.
. Manufacturing black obscuration enamelsat the Maastricht site.
> Customer Focus atColour TechnologiesJohnson Matthey’s Colour Technologiesbusiness manufactures high technologyfunctional and decorative products for theglass and ceramics industries. Many are usedby our customers in highly demandingapplications, such as automotive andaerospace, and we align our research anddevelopment efforts with our customers’processes to ensure we meet their exactingperformance requirements.
Expertise in precious metals, materialsscience and surface chemistry underpins newproduct development activities which arecentred at the business’ global technologycentre, located at its headquarters inMaastricht, the Netherlands. The facility isequipped with the latest materialscharacterisation techniques and has a varietyof lab scale process equipment, includingfurnaces and screen printers. This capabilityenables us to closely replicate our customers’manufacturing processes and allows ourscientists to optimise the performance of newproducts under realistic plant conditionsthroughout the R&D process.
Delivering Value

120
Statement of Directors’ Responsibilities in Respect of the Annual Report and AccountsThe directors are responsible for preparing the annual report and the group and parent company accounts in accordance with applicable lawand regulations.
Company law requires the directors to prepare group and parent company accounts for each financial year. Under that law they are requiredto prepare the group accounts in accordance with International Financial Reporting Standards (IFRS) as adopted by the European Union (EU)and applicable law and have elected to prepare the parent company accounts on the same basis.
Under company law the directors must not approve the accounts unless they are satisfied that they give a true and fair view of the state ofaffairs of the group and parent company and of their profit or loss for that period. In preparing each of the group and parent companyaccounts, the directors are required to:
• select suitable accounting policies and then apply them consistently;
• make judgments and estimates that are reasonable and prudent;
• state whether they have been prepared in accordance with IFRS as adopted by the EU; and
• prepare the accounts on the going concern basis unless it is inappropriate to presume that the group and the parent company willcontinue in business.
The directors are responsible for keeping adequate accounting records that are sufficient to show and explain the parent company’stransactions and disclose with reasonable accuracy at any time the financial position of the parent company and enable them to ensure thatits accounts comply with the Companies Act 2006. They have general responsibility for taking such steps as are reasonably open to them tosafeguard the assets of the group and to prevent and detect fraud and other irregularities.
Under applicable law and regulations the directors are also responsible for preparing a directors’ report, directors’ Remuneration Report andCorporate Governance statement that comply with that law and those regulations.
The directors are responsible for the maintenance and integrity of the corporate and financial information included on the company’s website.Legislation in the UK governing the preparation and dissemination of accounts may differ from legislation in other jurisdictions.
Responsibility Statement of the Directors in Respect of the Annual Report and AccountsEach of the directors as at the date of the Annual Report and Accounts, whose names and functions are set out on page 83, states that tothe best of his or her knowledge:
• the group and parent company accounts, prepared in accordance with the applicable set of accounting standards, give a true and fairview of the assets, liabilities, financial position and profit or loss of the company and the undertakings included in the consolidation takenas a whole; and
• the management report (which comprises the Report of the Directors) includes a fair review of the development and performance of thebusiness and the position of the company and the undertakings included in the consolidation taken as a whole, together with adescription of the principal risks and uncertainties that they face.
This responsibility statement was approved by the board on 6th June 2012 and is signed on its behalf by:
Tim StevensonChairman
Responsibility of Directors
Johnson Matthey Annual Report & Accounts 2012Accounts

121
Independent Auditor’s Reportto the members of Johnson Matthey Public Limited Company
We have audited the group and parent company accounts of Johnson Matthey Plc for the year ended 31st March 2012 which comprise theConsolidated Income Statement, the Consolidated Statement of Total Comprehensive Income, the Consolidated and Parent CompanyBalance Sheets, the Consolidated and Parent Company Cash Flow Statements, the Consolidated Statement of Changes in Equity, the ParentCompany Statement of Changes in Equity and the related notes. The financial reporting framework that has been applied in their preparationis applicable law and International Financial Reporting Standards (IFRS) as adopted by the EU and, as regards the parent company accounts,as applied in accordance with the provisions of the Companies Act 2006.
This report is made solely to the company’s members, as a body, in accordance with Chapter 3 of Part 16 of the Companies Act 2006. Ouraudit work has been undertaken so that we might state to the company’s members those matters we are required to state to them in anauditor’s report and for no other purpose. To the fullest extent permitted by law, we do not accept or assume responsibility to anyone otherthan the company and the company’s members, as a body, for our audit work, for this report, or for the opinions we have formed.
Respective Responsibilities of Directors and AuditorAs explained more fully in the directors’ responsibilities statement set out on page 120, the directors are responsible for the preparation of theaccounts and for being satisfied that they give a true and fair view. Our responsibility is to audit, and express an opinion on, the accounts inaccordance with applicable law and International Standards on Auditing (UK and Ireland). Those standards require us to comply with theAuditing Practices Board’s (APB’s) Ethical Standards for Auditors.
Scope of the Audit of the AccountsA description of the scope of an audit of accounts is provided on the APB’s website at www.frc.org.uk/apb/scope/private.cfm.
Opinion on AccountsIn our opinion:
• the accounts give a true and fair view of the state of the group’s and of the parent company’s affairs as at 31st March 2012 and of thegroup’s profit for the year then ended;
• the group accounts have been properly prepared in accordance with IFRS as adopted by the EU;
• the parent company accounts have been properly prepared in accordance with IFRS as adopted by the EU and as applied inaccordance with the provisions of the Companies Act 2006; and
• the accounts have been prepared in accordance with the requirements of the Companies Act 2006 and, as regards the group accounts,Article 4 of the IAS Regulation.
Opinion on Other Matters Prescribed by the Companies Act 2006In our opinion:
• the part of the directors’ Remuneration Report to be audited has been properly prepared in accordance with the Companies Act 2006; and
• the information given in the directors’ report for the financial year for which the accounts are prepared is consistent with the accounts.
Matters on Which we are Required to Report by Exception We have nothing to report in respect of the following:
Under the Companies Act 2006 we are required to report to you if, in our opinion:
• adequate accounting records have not been kept by the parent company, or returns adequate for our audit have not been received frombranches not visited by us; or
• the parent company accounts and the part of the directors’ Remuneration Report to be audited are not in agreement with the accountingrecords and returns; or
• certain disclosures of directors’ remuneration specified by law are not made; or
• we have not received all the information and explanations we require for our audit.
Under the Listing Rules we are required to review:
• the directors’ statement, set out on page 47, in relation to going concern; and
• the part of the Corporate Governance statement on page 85 relating to the company’s compliance with the nine provisions of the UKCorporate Governance Code specified for our review; and
• certain elements of the report to shareholders by the board on directors’ remuneration.
D V Matthews (Senior Statutory Auditor)for and on behalf of KPMG Audit Plc, Statutory AuditorChartered Accountants15 Canada Square, London E14 5GL
6th June 2012

Johnson Matthey Annual Report & Accounts 2012Accounts
122
The notes on pages 131 to 167 form an integral part of the accounts.
Consolidated Income Statementfor the year ended 31st March 2012
2012 2011 restated
Notes £ million £ million
Revenue 1,2 12,023.2 9,984.8 Cost of sales (11,270.2) (9,337.2)
Gross profit 753.0 647.6 Distribution costs (119.8) (112.2)Administrative expenses (183.1) (169.2)Major impairment and restructuring charges 3 – (71.8)Amortisation of acquired intangibles 4 (16.7) (14.5)
Operating profit 1,6 433.4 279.9 Finance costs 7 (35.4) (33.1)Finance income 8 11.3 12.4 Dissolution of associate – 0.1
Profit before tax 409.3 259.3 Income tax expense 9 (93.9) (75.5)
Profit for the year from continuing operations 315.4 183.8 Loss for the year from discontinued operations 40 – (1.9)
Profit for the year 315.4 181.9
Attributable to:Owners of the parent company 315.9 181.5 Non-controlling interests (0.5) 0.4
315.4 181.9
pence pence
Earnings per ordinary share attributable to the equity holders of the parent company Continuing operationsBasic 11 148.7 86.1 Diluted 11 146.9 85.6
TotalBasic 11 148.7 85.2 Diluted 11 146.9 84.7
Consolidated Statement of Total Comprehensive Incomefor the year ended 31st March 2012
2012 2011 restated
Notes £ million £ million
Profit for the year 315.4 181.9
Other comprehensive income:Currency translation differences 31 (53.7) (8.9)Cash flow hedges 31 6.1 3.7 Fair value gains on net investment hedges 23.7 2.2 Actuarial (loss) / gain on post-employment benefits assets and liabilities 14 (70.6) 85.4 Tax on above items taken directly to or transferred from equity 32 18.7 (30.0)
Other comprehensive (expense) / income for the year (75.8) 52.4
Total comprehensive income for the year 239.6 234.3
Attributable to:Owners of the parent company 240.1 233.9 Non-controlling interests (0.5) 0.4
239.6 234.3

123
The notes on pages 131 to 167 form an integral part of the accounts.
Consolidated and Parent Company Balance Sheetsas at 31st March 2012
Group Parent company
2012 2011 2012 2011 restated
Notes £ million £ million £ million £ million
AssetsNon-current assetsProperty, plant and equipment 15 909.5 907.7 235.7 230.8 Goodwill 16 519.5 528.7 110.5 110.5 Other intangible assets 17 127.8 152.9 5.4 6.4 Investments in subsidiaries 18 – – 1,546.2 1,506.2 Deferred income tax assets 29 25.4 39.7 14.2 19.9 Available-for-sale investments 19 8.0 8.0 – – Swaps related to borrowings 24 29.3 23.7 29.3 23.7 Other receivables 21 3.0 3.0 387.7 524.0 Post-employment benefits net assets 14 2.0 3.8 – –
Total non-current assets 1,624.5 1,667.5 2,329.0 2,421.5
Current assetsInventories 20 630.8 556.3 164.4 154.8 Current income tax assets 11.5 9.4 – – Trade and other receivables 21 847.1 893.2 1,009.6 793.3 Cash and cash equivalents – cash and deposits 24 139.1 118.9 78.0 23.1 Other financial assets 25 11.6 6.9 11.2 7.2
Total current assets 1,640.1 1,584.7 1,263.2 978.4
Total assets 3,264.6 3,252.2 3,592.2 3,399.9
LiabilitiesCurrent liabilitiesTrade and other payables 22 (710.7) (662.9) (1,554.4) (1,286.3)Current income tax liabilities (103.1) (114.2) (5.5) (15.4)Cash and cash equivalents – bank overdrafts 24 (35.8) (24.5) (65.9) (74.1)Other borrowings and finance leases 24 (56.4) (181.8) (40.3) (146.8)Other financial liabilities 26 (4.5) (6.5) (4.8) (7.8)Provisions 28 (34.0) (60.1) (17.1) (2.5)
Total current liabilities (944.5) (1,050.0) (1,688.0) (1,532.9)
Non-current liabilitiesBorrowings, finance leases and related swaps 24 (530.4) (575.7) (530.1) (575.0)Deferred income tax liabilities 29 (53.4) (59.5) – – Employee benefits obligations 14 (171.4) (134.2) (96.6) (73.2)Provisions 28 (28.8) (24.2) (12.6) (13.3)Other payables 22 (4.3) (4.8) (23.3) (0.2)
Total non-current liabilities (788.3) (798.4) (662.6) (661.7)
Total liabilities (1,732.8) (1,848.4) (2,350.6) (2,194.6)
Net assets 1,531.8 1,403.8 1,241.6 1,205.3
EquityShare capital 30 220.7 220.7 220.7 220.7 Share premium account 148.3 148.3 148.3 148.3 Shares held in employee share ownership trust (ESOT) (50.2) (35.8) (50.2) (35.8)Other reserves 33 43.0 68.3 6.8 1.8 Retained earnings 1,169.6 1,001.2 916.0 870.3
Total equity attributable to owners of the parent company 1,531.4 1,402.7 1,241.6 1,205.3 Non-controlling interests 0.4 1.1 – –
Total equity 1,531.8 1,403.8 1,241.6 1,205.3
The accounts were approved by the Board of Directors on 6th June 2012 and signed on its behalf by:
N A P CarsonDirectors
R J MacLeod

Johnson Matthey Annual Report & Accounts 2012Accounts
124
The notes on pages 131 to 167 form an integral part of the accounts.
Consolidated and Parent Company Cash Flow Statementsfor the year ended 31st March 2012
Group Parent company
2012 2011 2012 2011 restated
Notes £ million £ million £ million £ million
Cash flows from operating activitiesProfit before tax 409.3 259.3 199.2 231.1 Adjustments for:Dissolution of associate – (0.1) – – Discontinued operations 40 – (1.9) – – Depreciation, amortisation, impairment losses and profit on sale of non-current assets and investments 146.8 168.8 30.9 41.9 Share-based payments 12.8 11.3 7.7 6.7 Increase in inventories (88.9) (159.6) (9.7) (53.4)Decrease / (increase) in receivables 24.5 (250.9) (80.0) (215.3)Increase / (decrease) in payables 55.4 113.1 237.1 (96.6)(Decrease) / increase in provisions (19.2) 52.0 14.0 5.8 Contributions in excess of employee benefit obligations charge (30.9) (26.8) (30.0) (23.4)Changes in fair value of financial instruments (0.7) 1.7 (0.3) 1.0 Dividends received from subsidiaries – – (80.8) (123.3)Net finance costs 24.1 20.7 (20.3) (20.0)Income tax paid (68.8) (64.7) (4.2) (16.0)
Net cash inflow / (outflow) from operating activities 464.4 122.9 263.6 (261.5)
Cash flows from investing activitiesDividends received from associate – 3.5 – –Dividends received from subsidiaries – – 80.8 123.3 Purchases of non-current assets and investments 34 (150.7) (137.4) (34.5) (29.1)Proceeds from sale of non-current assets and investments 8.3 3.9 – 3.8 Purchases of businesses 34 0.6 (53.1) – –
Net cash (outflow) / inflow from investing activities (141.8) (183.1) 46.3 98.0
Cash flows from financing activitiesNet cost of ESOT transactions in own shares 34 (25.7) (9.1) (25.7) (9.1)(Repayment of) / proceeds from borrowings and finance leases 34 (166.4) 96.2 (147.0) 101.0 Dividends paid to equity holders of the parent company 10 (103.1) (86.1) (103.1) (86.1)Dividends paid to non-controlling interests – (0.5) – – Settlement of currency swaps for net investment hedging 8.8 7.4 8.8 7.4 Interest paid (34.0) (33.1) (47.6) (42.0)Interest received 11.4 13.7 67.8 63.2
Net cash (outflow) / inflow from financing activities (309.0) (11.5) (246.8) 34.4
Increase / (decrease) in cash and cash equivalents in the year 13.6 (71.7) 63.1 (129.1)Exchange differences on cash and cash equivalents (4.7) 1.7 – – Cash and cash equivalents at beginning of year 94.4 164.4 (51.0) 78.1
Cash and cash equivalents at end of year 35 103.3 94.4 12.1 (51.0)
Reconciliation to net debtIncrease / (decrease) in cash and cash equivalents in the year 13.6 (71.7) 63.1 (129.1)Repayment of / (proceeds from) borrowings and finance leases 166.4 (96.2) 147.0 (101.0)
Change in net debt resulting from cash flows 180.0 (167.9) 210.1 (230.1)Borrowings acquired with subsidiaries – (20.5) – – Exchange differences on net debt 5.2 22.4 10.0 20.0
Movement in net debt in year 185.2 (166.0) 220.1 (210.1)Net debt at beginning of year (639.4) (473.4) (749.1) (539.0)
Net debt at end of year 24 (454.2) (639.4) (529.0) (749.1)
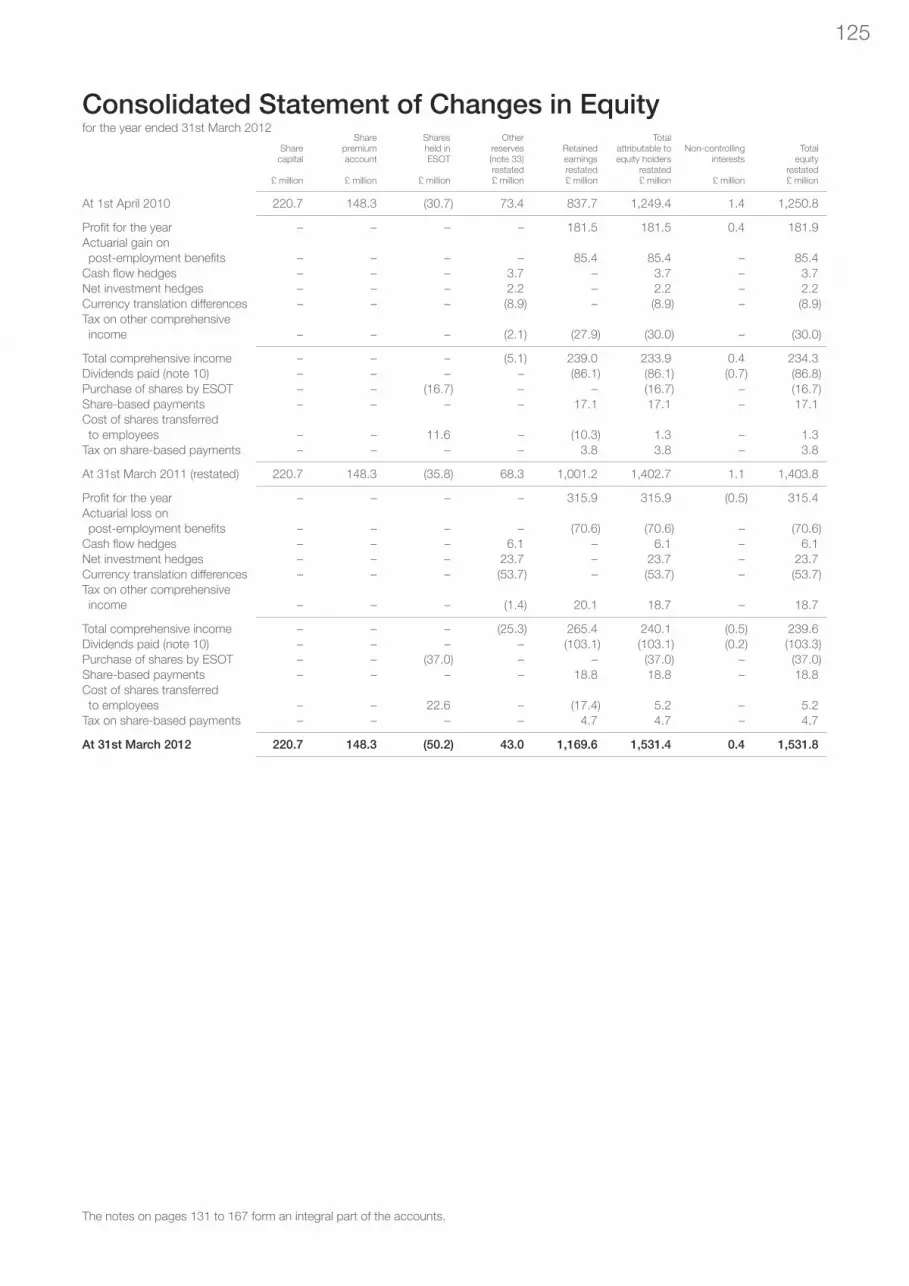
125
The notes on pages 131 to 167 form an integral part of the accounts.
Consolidated Statement of Changes in Equityfor the year ended 31st March 2012
Share Shares Other TotalShare premium held in reserves Retained attributable to Non-controlling Totalcapital account ESOT (note 33) earnings equity holders interests equity
restated restated restated restated£ million £ million £ million £ million £ million £ million £ million £ million
At 1st April 2010 220.7 148.3 (30.7) 73.4 837.7 1,249.4 1.4 1,250.8
Profit for the year – – – – 181.5 181.5 0.4 181.9 Actuarial gain on post-employment benefits – – – – 85.4 85.4 – 85.4 Cash flow hedges – – – 3.7 – 3.7 – 3.7 Net investment hedges – – – 2.2 – 2.2 – 2.2 Currency translation differences – – – (8.9) – (8.9) – (8.9)Tax on other comprehensive income – – – (2.1) (27.9) (30.0) – (30.0)
Total comprehensive income – – – (5.1) 239.0 233.9 0.4 234.3 Dividends paid (note 10) – – – – (86.1) (86.1) (0.7) (86.8)Purchase of shares by ESOT – – (16.7) – – (16.7) – (16.7)Share-based payments – – – – 17.1 17.1 – 17.1 Cost of shares transferred to employees – – 11.6 – (10.3) 1.3 – 1.3 Tax on share-based payments – – – – 3.8 3.8 – 3.8
At 31st March 2011 (restated) 220.7 148.3 (35.8) 68.3 1,001.2 1,402.7 1.1 1,403.8
Profit for the year – – – – 315.9 315.9 (0.5) 315.4 Actuarial loss on post-employment benefits – – – – (70.6) (70.6) – (70.6)Cash flow hedges – – – 6.1 – 6.1 – 6.1 Net investment hedges – – – 23.7 – 23.7 – 23.7 Currency translation differences – – – (53.7) – (53.7) – (53.7)Tax on other comprehensive income – – – (1.4) 20.1 18.7 – 18.7
Total comprehensive income – – – (25.3) 265.4 240.1 (0.5) 239.6 Dividends paid (note 10) – – – – (103.1) (103.1) (0.2) (103.3)Purchase of shares by ESOT – – (37.0) – – (37.0) – (37.0)Share-based payments – – – – 18.8 18.8 – 18.8 Cost of shares transferred to employees – – 22.6 – (17.4) 5.2 – 5.2 Tax on share-based payments – – – – 4.7 4.7 – 4.7
At 31st March 2012 220.7 148.3 (50.2) 43.0 1,169.6 1,531.4 0.4 1,531.8

126 Johnson Matthey Annual Report & Accounts 2012Accounts
Parent Company Statement of Changes in Equityfor the year ended 31st March 2012
Share Shares OtherShare premium held in reserves Retained Totalcapital account ESOT (note 33) earnings equity£ million £ million £ million £ million £ million £ million
At 1st April 2010 220.7 148.3 (30.7) 0.2 686.0 1,024.5
Profit for the year – – – – 210.6 210.6 Actuarial gain on post-employment benefits – – – – 74.8 74.8 Cash flow hedges – – – 0.6 – 0.6 Currency translation differences – – – 1.2 – 1.2 Tax on other comprehensive income – – – (0.2) (23.8) (24.0)
Total comprehensive income – – – 1.6 261.6 263.2 Dividends paid (note 10) – – – – (86.1) (86.1)Purchase of shares by ESOT – – (16.7) – – (16.7)Share-based payments – – – – 15.3 15.3 Cost of shares transferred to employees – – 11.6 – (8.5) 3.1 Tax on share-based payments – – – – 2.0 2.0
At 31st March 2011 220.7 148.3 (35.8) 1.8 870.3 1,205.3
Profit for the year – – – – 183.4 183.4 Actuarial loss on post-employment benefits – – – – (53.3) (53.3)Cash flow hedges – – – 6.7 – 6.7 Currency translation differences – – – (0.1) – (0.1)Tax on other comprehensive income – – – (1.6) 14.6 13.0
Total comprehensive income – – – 5.0 144.7 149.7 Dividends paid (note 10) – – – – (103.1) (103.1)Purchase of shares by ESOT – – (37.0) – – (37.0)Share-based payments – – – – 16.2 16.2 Cost of shares transferred to employees – – 22.6 – (14.8) 7.8 Tax on share-based payments – – – – 2.7 2.7
At 31st March 2012 220.7 148.3 (50.2) 6.8 916.0 1,241.6
The notes on pages 131 to 167 form an integral part of the accounts.

127
Accounting Policiesfor the year ended 31st March 2012
The group’s and parent company’s significant accounting policies, together with the judgments made by management in applying thosepolicies which have the most significant effect on the amounts recognised in the accounts, are:
Basis of accounting and preparationThe accounts are prepared in accordance with International Financial Reporting Standards (IFRS) and interpretations issued by theInternational Financial Reporting Interpretations Committee (IFRIC) or the Standing Interpretations Committee (SIC) as adopted by theEuropean Union. For Johnson Matthey, there are no differences between IFRS as adopted by the European Union and full IFRS as publishedby the International Accounting Standards Board (IASB) and so the accounts comply with IFRS.
The accounts are prepared on the historical cost basis, except for certain assets and liabilities which are measured at fair value as explainedbelow.
The consolidated accounts for 31st March 2011 have been restated for measurement period adjustments to the fair values of the Intercat, Inc.acquisition (note 39). Also, cost of sales and distribution costs for the year ended 31st March 2011 have been represented by £9.0 millionfollowing a reclassification of certain employee costs out of distribution costs in one of the group’s businesses to better reflect the nature ofthe costs.
The parent company has not presented its own income statement, statement of total comprehensive income and related notes as permittedby section 408 of the Companies Act 2006.
Basis of consolidationThe consolidated accounts comprise the accounts of the parent company and all its subsidiaries, including the employee share ownership trust.
Entities over which the group has the ability to exercise control are accounted for as subsidiaries. Entities that are not subsidiaries or jointventures but where the group has significant influence (i.e. the power to participate in the financial and operating policy decisions) areaccounted for as associates.
The results of businesses acquired or disposed of in the year are consolidated from or up to the effective date of acquisition or disposalrespectively. The net assets of businesses acquired are incorporated in the consolidated accounts at their fair values at the date of acquisition.
Transactions and balances between group companies are eliminated. No profit is taken on transactions between group companies.
Foreign currenciesForeign currency transactions are recorded in the functional currency of the relevant subsidiary or branch at the exchange rate at the date oftransaction. Foreign currency monetary assets and liabilities are retranslated into the relevant functional currency at the exchange rate at thebalance sheet date.
Income statements and cash flows of overseas subsidiaries and branches are translated into sterling at the average rates for the year. Balancesheets of overseas subsidiaries and branches, including any fair value adjustments and including related goodwill, are translated into sterlingat the exchange rates at the balance sheet date.
Exchange differences arising on the translation of the net investment in overseas subsidiaries and branches, less exchange differences arisingon related foreign currency financial instruments which hedge the group’s net investment in these operations, are taken to a separatecomponent of equity. The group has taken advantage of the exemption allowed in IFRS 1 – ‘First-time Adoption of International ReportingStandards’ to deem the cumulative translation difference for all overseas subsidiaries and branches to be zero at 1st April 2004.
Other exchange differences are taken to operating profit.
RevenueRevenue comprises all sales of goods and rendering of services at the fair value of consideration received or receivable after the deduction ofany trade discounts and excluding sales taxes. Revenue is recognised when it can be measured reliably and the significant risks and rewardsof ownership are transferred to the customer. With the sale of goods, this occurs when the goods are despatched or made available to thecustomer, except for the sale of consignment products located at customers’ premises where revenue is recognised on notification that theproduct has been used. With the rendering of services, revenue is recognised by reference to the stage of completion as measured by theproportion that costs incurred to date bear to the estimated total costs. With royalties and licence income, revenue is recognised inaccordance with the substance of the relevant agreement.
Long term contractsWhere the outcome of a long term contract can be estimated reliably, revenue and costs are recognised by reference to the stage ofcompletion. This is measured by the proportion that contract costs incurred to date bear to the estimated total contract costs.
Where the outcome of a long term contract cannot be estimated reliably, contract revenue is recognised to the extent of contract costsincurred that it is probable will be recoverable. Contract costs are recognised as expenses in the period in which they are incurred.
When it is probable that the total contract costs will exceed total contract revenue, the expected loss is recognised as an expenseimmediately.
Finance costs and finance incomeFinance costs that are directly attributable to the construction of an asset that necessarily takes a substantial period of time to get ready for itsintended use and for which construction was commenced after 1st April 2007 are capitalised as part of the cost of that asset. Other financecosts and finance income are recognised in the income statement in the year incurred.

128
Accounting Policiesfor the year ended 31st March 2012
Research and developmentResearch expenditure is charged to the income statement in the year incurred.
Development expenditure is charged to the income statement in the year incurred unless it meets the IFRS recognition criteria forcapitalisation. When the recognition criteria have been met any further development expenditure is capitalised as an intangible asset.
Property, plant and equipmentProperty, plant and equipment are stated at cost less accumulated depreciation and any provisions for impairment. Finance costs that relateto an asset that takes a substantial period of time to construct and for which construction was started after 1st April 2007 are capitalised aspart of the cost of that asset. Other finance costs are not capitalised.
Depreciation is provided at rates calculated to write off the cost less estimated residual value of each asset over its useful life. Certain freeholdbuildings and plant and equipment are depreciated using the units of production method, as this more closely reflects their expectedconsumption. All other assets are depreciated using the straight line method. The useful lives vary according to the class of the asset, but aretypically: leasehold property 30 years (or the life of the lease if shorter); freehold buildings 30 years; and plant and equipment 4 to 10 years.Freehold land is not depreciated.
GoodwillGoodwill arises on the acquisition of a business when the fair value of the consideration given exceeds the fair value attributed to the netassets acquired (including contingent liabilities). It is subject to annual impairment reviews. Acquisition-related costs arising on acquisitionsmade after 31st March 2010 are charged to the income statement as incurred. Acquisition-related costs arising on acquisitions made on orbefore 31st March 2010 were regarded as a component of consideration and therefore increased goodwill.
The group and parent company have taken advantage of the exemption allowed under IFRS 1 and so goodwill arising on acquisitions madebefore 1st April 2004 is included at the carrying amount at that date less any subsequent impairments. Up to 31st March 1998 goodwill waseliminated against equity.
Intangible assetsIntangible assets are stated at cost less accumulated amortisation and any provisions for impairment. They are amortised in accordance withthe relevant income stream or by using the straight line method over the useful lives from the time they are first available for use. Theestimated useful lives vary according to the specific asset but are typically: 1 to 12 years for customer contracts and relationships; 3 to 8years for capitalised computer software; 3 to 20 years for patents, trademarks and licences; 10 years for acquired research and technology;and 3 to 8 years for capitalised development currently being amortised.
Intangible assets which are not yet being amortised are subject to annual impairment reviews.
Investments in subsidiariesInvestments in subsidiaries are stated in the parent company’s balance sheet at cost less any provisions for impairment. If a distribution isreceived from a subsidiary then the investment in that subsidiary is assessed for an indication of impairment.
LeasesLeases are classified as finance leases whenever they transfer substantially all the risks and rewards of ownership to the group. The assets areincluded in property, plant and equipment and the capital elements of the leasing commitments are shown as obligations under financeleases. The assets are depreciated on a basis consistent with similar owned assets or the lease term if shorter. The interest element of thelease rental is included in the income statement.
All other leases are classified as operating leases and the lease costs are expensed on a straight line basis over the lease term.
GrantsGrants related to assets are included in deferred income and released to the income statement in equal instalments over the expected usefullives of the related assets.
Grants related to income are deducted in reporting the related expense.
Precious metal inventoriesInventories of gold, silver and platinum group metals are valued according to the source from which the metal is obtained. Metal which hasbeen purchased and committed to future sales to customers or hedged in metal markets is valued at the price at which it is contractuallycommitted or hedged, adjusted for unexpired contango and backwardation. Other precious metal inventories owned by the group, which areunhedged, are valued at the lower of cost and net realisable value using the weighted average cost formula.
Other inventoriesNon-precious metal inventories are valued at the lower of cost, including attributable overheads, and net realisable value. Except where costsare specifically identified, the first-in, first-out or weighted average cost formulae are used to value inventories.
Johnson Matthey Annual Report & Accounts 2012Accounts

129
Accounting Policiesfor the year ended 31st March 2012
Cash and cash equivalentsCash and deposits comprise cash at bank and in hand, including short term deposits with a maturity date of three months or less from thedate of acquisition. The group and parent company routinely use short term bank overdraft facilities, which are repayable on demand, as anintegral part of their cash management policy. Therefore cash and cash equivalents in the cash flow statements are cash and deposits lessbank overdrafts. Offset arrangements across group businesses have been applied to arrive at the net cash and overdraft figures.
Derivative financial instrumentsThe group and parent company use derivative financial instruments, in particular forward currency contracts and currency swaps, to managethe financial risks associated with their underlying business activities and the financing of those activities. The group and parent company donot undertake any trading activity in derivative financial instruments.
Derivative financial instruments are measured at their fair value. Derivative financial instruments may be designated at inception as fair valuehedges, cash flow hedges or net investment hedges if appropriate. Derivative financial instruments which are not designated as hedginginstruments are classified under IFRS as held for trading, but are used to manage financial risk.
Changes in the fair value of any derivative financial instruments that are not designated as or are not determined to be effective hedges arerecognised immediately in the income statement.
Changes in the fair value of derivative financial instruments designated as fair value hedges are recognised in the income statement, togetherwith the related changes in the fair value of the hedged asset or liability. Fair value hedge accounting is discontinued if the hedging instrumentexpires or is sold, terminated or exercised, the hedge no longer meets the criteria for hedge accounting or the designation is revoked.
Changes in the fair value of derivative financial instruments designated as cash flow hedges are recognised in equity, to the extent that thehedges are effective. Ineffective portions are recognised in the income statement immediately. If the hedged item results in the recognition of anon-financial asset or liability, the amount recognised in equity is transferred out of equity and included in the initial carrying amount of theasset or liability. Otherwise, the amount recognised in equity is transferred to the income statement in the same period that the hedged item isrecognised in the income statement. If the hedging instrument expires or is sold, terminated or exercised, the hedge no longer meets thecriteria for hedge accounting or the designation is revoked, amounts previously recognised in equity remain in equity until the forecasttransaction occurs. If a forecast transaction is no longer expected to occur, the amounts previously recognised in equity are transferred to theincome statement.
For hedges of net investments in foreign operations, the effective portion of the gain or loss on the hedging instrument is recognised in equity,while the ineffective portion is recognised in the income statement. Amounts taken to equity are transferred to the income statement when theforeign operations are sold.
Other financial instrumentsAll other financial instruments are initially recognised at fair value plus transaction costs. Subsequent measurement is as follows:
• Unhedged borrowings are measured at amortised cost.
• Available-for-sale investments are investments in equity instruments that do not have a quoted market price in an active market andwhose fair value cannot be measured reliably and so are measured at cost.
• All other financial assets and liabilities, including short term receivables and payables, are measured at amortised cost less anyimpairment provision.
TaxationCurrent and deferred tax are recognised in the income statement, except when they relate to items recognised directly in equity when therelated tax is also recognised in equity.
Current tax is the amount of income tax expected to be paid in respect of taxable profits using the tax rates that have been enacted orsubstantively enacted at the balance sheet date.
Deferred tax is provided in full, using the liability method, on temporary differences arising between the tax bases of assets and liabilities andtheir carrying amount in the balance sheet. It is provided using the tax rates that are expected to apply in the period when the asset or liabilityis settled, based on tax rates that have been enacted or substantively enacted at the balance sheet date.
Deferred tax assets are recognised to the extent that it is probable that future taxable profits will be available against which the temporarydifferences can be utilised. No deferred tax asset or liability is recognised in respect of temporary differences associated with investments insubsidiaries, branches and associates where the group is able to control the timing of the reversal of the temporary difference and it isprobable that the temporary difference will not reverse in the foreseeable future.
Provisions and contingenciesProvisions are recognised when the group has a present obligation as a result of a past event and a reliable estimate can be made of aprobable adverse outcome, for example warranties, environmental claims and restructurings. Otherwise, material contingent liabilities aredisclosed unless the transfer of economic benefits is remote. Contingent assets are only disclosed if an inflow of economic benefits is probable.
The parent company considers financial guarantees of its subsidiaries’ borrowings and precious metal leases to be insurance contracts.These are treated as contingent liabilities unless it becomes probable that it will be required to make a payment under the guarantee.

130 Johnson Matthey Annual Report & Accounts 2012Accounts
Share-based payments and employee share ownership trust (ESOT)The fair value of outstanding shares allocated to employees under the long term incentive plan is calculated by adjusting the share price on thedate of allocation for the present value of the expected dividends that will not be received. The resulting cost is charged to the incomestatement over the relevant vesting periods, adjusted to reflect actual and expected levels of vesting where appropriate.
The group and parent company provide finance to the ESOT to purchase company shares in the open market. Costs of running the ESOT arecharged to the income statement. The cost of shares held by the ESOT is deducted in arriving at equity until they vest unconditionally inemployees.
Pensions and other post-employment benefitsThe group operates a number of contributory and non-contributory plans, mainly of the defined benefit type, which require contributions to bemade to separately administered funds.
The costs of the defined contribution plans are charged to the income statement as they fall due.
For defined benefit plans, the group and parent company recognise the net assets or liabilities of the schemes in their balance sheets.Obligations are measured at present value using the projected unit credit method and a discount rate reflecting yields on high qualitycorporate bonds. Assets are measured at their fair value at the balance sheet date. The changes in scheme assets and liabilities, based onactuarial advice, are recognised as follows:
• The current service cost is spread over the period during which benefit is expected to be derived from the employees’ services based onthe most recent actuarial valuation and is deducted in arriving at operating profit.
• The interest cost, based on the discount rate at the beginning of the year and the present value of the defined benefit obligation duringthe year, is included in operating profit.
• The expected return on plan assets, based on market expectations at the beginning of the year for returns over the entire life of therelated obligation and amended for changes in the fair value of plan assets as a result of contributions paid in and benefits paid out, isincluded in operating profit.
• Actuarial gains and losses, representing differences between the expected return and actual return on plan assets and reimbursementrights, differences between actuarial assumptions underlying the plan liabilities and actual experience during the year, and changes inactuarial assumptions, are recognised in the statement of total comprehensive income in the year they occur.
• Past service costs are spread evenly over the period in which the increases in benefit vest and are deducted in arriving at operating profit.If an increase in benefits vests immediately, the cost is recognised immediately.
• Gains or losses arising from settlements or curtailments are included in operating profit.
Standards and interpretations adopted in the yearDuring the year, the following new and amendments to accounting standards and interpretations were adopted:
IAS 24 – ‘Related Party Disclosures’, Amendments to IFRIC 14 – ‘Prepayments of a Minimum Funding Requirement’, IFRIC 19 –‘Extinguishing Financial Liabilities with Equity Instruments’, Amendments to IFRS 1 – ‘Limited Exemption from Comparative IFRS 7 Disclosuresfor First-time Adopters’ and the ‘Improvements to IFRSs’ issued in May 2010 have all been adopted during the year. There was no materialimpact on the reported results or financial position of the group and parent company.
Standards and interpretations issued but not yet appliedThe impact of the adoption of IFRS 9 – ‘Financial Instruments’, Amendments to IFRS 9 and IFRS 7 – ‘Mandatory Effective Date and TransitionDisclosures’, IFRS 10 – ‘Consolidated Financial Statements’, IFRS 11 – ‘Joint Arrangements’, IFRS 12 – ‘Disclosure of Interests in OtherEntities’ and IFRS 13 – ‘Fair Value Measurement’ and the revised IAS 27 – ‘Separate Financial Statements’ and IAS 28 – ‘Investments inAssociates and Joint Ventures’ are still being evaluated.
IAS 19 – ‘Employee Benefits’ was revised in June 2011 and is applicable for periods beginning on or after 1st January 2013. It removes the‘corridor approach’ for recognising actuarial gains and losses and eliminates options for presenting gains and losses which will have no effecton the group and parent company. It also amends the disclosures and requires the replacement of the expected return on plan assets andinterest cost on plan obligations with net interest on the net defined benefit liability based on the discount rate. The full effect on the group andparent company is still being evaluated but it is likely to reduce the group’s profit before tax by approximately £6 million.
The effects of any standards and interpretations amended or issued after 30th April 2012 have not yet been evaluated.
The group and parent company do not consider that any other standards or interpretations issued by the IASB but not yet applicable will havea significant impact on their reported results or net assets.
Accounting Policiesfor the year ended 31st March 2012

131
Notes on the Accountsfor the year ended 31st March 2012
1 Segmental informationFor management purposes, the group is organised into three operating divisions – Environmental Technologies, Precious Metal Productsand Fine Chemicals and each division is represented by a director on the Board of Directors. These operating divisions represent thegroup’s segments. Their principal activities are described on pages 26 to 42. The performance of the divisions is assessed by the Boardof Directors on underlying operating profit, which is before amortisation of acquired intangibles, major impairment and restructuringcharges and profit or loss on disposal of businesses. Each division is also assessed on sales excluding precious metals including inter-segment sales. Sales between segments are made at market prices, taking into account the volumes involved.
Year ended 31st March 2012Environmental Precious Metal FineTechnologies Products Chemicals Eliminations Total
£ million £ million £ million £ million £ million
Revenue from external customers 3,123.6 8,609.4 290.2 – 12,023.2 Inter-segment revenue 131.0 1,232.0 2.2 (1,365.2) –
Total revenue 3,254.6 9,841.4 292.4 (1,365.2) 12,023.2
External sales excluding the value of precious metals 1,861.9 534.3 282.4 – 2,678.6 Inter-segment sales 13.8 47.7 2.3 (63.8) –
Sales excluding the value of precious metals 1,875.7 582.0 284.7 (63.8) 2,678.6
Segmental underlying operating profit 211.8 200.8 69.7 – 482.3 Unallocated corporate expenses (32.2)
Underlying operating profit 450.1 Amortisation of acquired intangibles (note 4) (16.7)
Operating profit 433.4Net finance costs (24.1)
Profit before tax 409.3
Segmental net assets 1,448.6 324.6 418.8 – 2,192.0 Net debt (454.2)Post-employment benefits net assets and liabilities (169.4)Deferred income tax assets and liabilities (28.0)Provisions and non-current other payables (67.1)Unallocated corporate net assets 58.5
Total net assets 1,531.8
Segmental capital expenditure 97.1 31.6 15.8 – 144.5Other additions to non-current assets (excluding financial assets, deferred tax assets and post-employment benefits net assets) 0.3 – – (0.3) –
Segmental total additions to non-current assets 97.4 31.6 15.8 (0.3) 144.5 Corporate capital expenditure 5.1
Total additions to non-current assets 149.6
Segment depreciation and amortisation 82.8 22.6 17.4 – 122.8 Corporate depreciation 3.3Amortisation of acquired intangibles (note 4) 16.7
Total depreciation and amortisation 142.8

132
1 Segmental information (continued)Year ended 31st March 2011 (restated)
Environmental Precious Metal FineTechnologies Products Chemicals Eliminations Total
£ million £ million £ million £ million £ million
Revenue from external customers 2,703.4 7,028.3 253.1 – 9,984.8 Inter-segment revenue 4.6 1,241.3 1.9 (1,247.8) –
Total revenue 2,708.0 8,269.6 255.0 (1,247.8) 9,984.8
External sales excluding the value of precious metals 1,561.3 475.4 243.6 – 2,280.3 Inter-segment sales 4.5 65.8 1.8 (72.1) –
Sales excluding the value of precious metals 1,565.8 541.2 245.4 (72.1) 2,280.3
Segmental underlying operating profit 164.7 172.9 56.2 – 393.8 Unallocated corporate expenses (27.6)
Underlying operating profit 366.2 Major impairment and restructuring charges (note 3) (71.8)Amortisation of acquired intangibles (note 4) (14.5)
Operating profit 279.9 Net finance costs (20.7)Dissolution of associate 0.1
Profit before tax 259.3
Segmental net assets 1,534.9 357.3 417.5 – 2,309.7 Net debt (639.4)Post-employment benefits net assets and liabilities (130.4)Deferred income tax assets and liabilities (19.8)Provisions and non-current other payables (89.1)Unallocated corporate net assets (27.2)
Total net assets 1,403.8
Segmental capital expenditure 90.1 26.1 16.0 – 132.2 Other additions to non-current assets (excluding financial assets,deferred tax assets and post-employment benefits net assets) 62.8 2.1 10.9 (0.3) 75.5
Segmental total additions to non-current assets 152.9 28.2 26.9 (0.3) 207.7Corporate capital expenditure 5.7
Total additions to non-current assets 213.4
Segment depreciation and amortisation 78.8 24.3 17.2 – 120.3 Corporate depreciation 2.9 Amortisation of acquired intangibles (note 4) 13.6
Total depreciation and amortisation 136.8
The group received £1,690.0 million of revenue from one external customer (2011 £1,196.8 million) which is 14% (2011 12%) of thegroup’s revenue from external customers. The revenue is reported in Precious Metal Products as it is generated by the group’s platinummarketing and distribution activities and so has a very low return on sales.
Notes on the Accountsfor the year ended 31st March 2012
Johnson Matthey Annual Report & Accounts 2012Accounts

133
1 Segmental information (continued)The group’s country of domicile is the UK. Revenue from external customers is based on the customer’s location. Non-current assets arebased on the location of the assets and exclude financial assets, deferred tax assets and post-employment benefits net assets.
Revenue from external customers Non-current assets
2012 2011 2012 2011 restated
£ million £ million £ million £ million
UK 3,534.4 2,442.0 665.3 665.0 Germany 869.4 762.1 227.9 242.8 Rest of Europe 1,379.7 1,242.3 97.2 105.4 USA 2,896.9 2,690.5 343.3 350.4 Rest of North America 126.8 105.0 16.0 14.2 China (including Hong Kong) 1,497.4 1,197.9 51.8 53.1 Rest of Asia 1,027.4 965.1 123.8 118.6 Rest of World 691.2 579.9 34.3 42.7
Total 12,023.2 9,984.8 1,559.6 1,592.2
2 Revenue2012 2011
£ million £ million
Sale of goods 11,771.9 9,801.1 Rendering of services 193.1 145.0 Royalties and licence income 58.2 38.7
Total revenue 12,023.2 9,984.8
3 Major impairment and restructuring chargesDuring the year ended 31st March 2011 the group closed its Haverton manufacturing site in Billingham, UK. This gave rise to a pre-taximpairment and restructuring charge of £14.8 million in that year, which was excluded from underlying operating profit.
During the year ended 31st March 2011 the group announced it was starting consultation with the Works Council about the closure of itsautocatalyst facility in Brussels. The plant ceased production in July 2011, the closure of the site then commenced and is expected to becompleted during the year ending 31st March 2013. This gave rise to a pre-tax impairment and restructuring charge in the year ended31st March 2011 of £57.0 million, which was excluded from underlying operating profit. There is no impact in the consolidated incomestatement in the year ended 31st March 2012.
4 Amortisation of acquired intangiblesThe amortisation of intangible assets which arise on the acquisition of businesses, together with any subsequent impairment of theseintangible assets, is shown separately on the face of the income statement. It is excluded from underlying operating profit.
Notes on the Accountsfor the year ended 31st March 2012

134
5 Fees payable to auditors2012 2011
£ million £ million £ million £ million
Fees payable to the company’s auditor for the audit of the company’s annual accounts 0.5 0.5 Fees payable to the company’s auditor and its associates for other services:– the audit of the company’s subsidiaries, pursuant to legislation 1.1 1.0 – other services supplied pursuant to legislation 0.1 0.1 – tax compliance services 0.2 0.2 – tax advisory services 0.2 0.1 – due diligence – 0.1 – other services 0.1 0.1
Total fees payable to the company’s auditor and its associates for other services 1.7 1.6
Total fees payable to the company’s auditor and its associates 2.2 2.1
Audit fees paid to other auditors were £0.1 million (2011 £0.1 million).
6 Operating profit2012 2011
restated £ million £ million
Operating profit is arrived at after charging / (crediting):
Total research and development expenditure 128.6 109.8 less development expenditure capitalised (9.1) (13.0)
Research and development charged 119.5 96.8 less external funding received – from government grants (2.0) (1.4)
– from other organisations (4.2) (3.9)
Net research and development 113.3 91.5
Other government grants (0.2) (0.1)
Inventories recognised as an expense 10,561.4 8,668.9 Write-down of inventories recognised as an expense 8.6 7.1 Reversal of write-down of inventories arising from increases in net realisable value (2.2) (1.5)
Net (gains) / losses on foreign exchange (5.2) 3.8 Net losses / (gains) on foreign currency forwards held for trading 6.0 (2.8)
Cash flow hedges transferred from equity – revenue (2.3) (0.5)– cost of sales 0.1 (0.2)
– total (2.2) (0.7)
Depreciation of property, plant and equipment 108.5 108.3
Amortisation of internally generated intangible assets included in cost of sales 12.5 9.6 Amortisation of other intangible assets included in – cost of sales 3.2 3.5
– distribution costs 0.1 0.1 – administrative expenses 1.8 1.7 – amortisation of acquired intangibles (note 4) 16.7 13.6
Operating lease rentals payable – minimum lease payments 13.4 12.8 Operating lease rentals payable – sublease payments received (0.2) (0.1)
The items above are for both continuing operations and total group.
Notes on the Accountsfor the year ended 31st March 2012
Johnson Matthey Annual Report & Accounts 2012Accounts

135
7 Finance costs2012 2011
£ million £ million
Remaining loss on remeasurement of net investment hedging instruments to fair value – 0.2 Net loss on remeasurement of fair value hedges and related hedged items to fair value 0.1 –
Net losses on financial assets and liabilities classified as held for trading 0.1 0.2 Interest payable on financial liabilities measured at amortised cost 35.0 32.5 Unwinding of discount on provisions 0.3 0.4
Total finance costs 35.4 33.1
8 Finance income2012 2011
£ million £ million
Interest receivable on interest rate swaps 8.2 9.2
Net gains on financial assets and liabilities classified as held for trading 8.2 9.2 Interest receivable on loans and receivables 3.1 3.2
Total finance income 11.3 12.4
9 Taxation2012 2011
restated£ million £ million
Current taxCorporation tax on profits for the year 82.6 85.9 Adjustment for prior years (8.4) 2.2
Total current tax 74.2 88.1
Deferred taxOrigination and reversal of temporary differences 22.7 (11.7)Changes in tax rates and laws (2.8) (2.3)Benefit from previously unrecognised tax losses, tax credits or temporary differences of prior years (0.2) (0.2)Write-downs, or reversal of previous write-downs, of deferred tax assets – 1.6
Total deferred tax 19.7 (12.6)
Income tax expense 93.9 75.5
The tax charge for the year can be reconciled to the profit per the income statement as follows:2012 2011
restated£ million £ million
Profit before tax 409.3 259.3
Tax expense at UK corporation tax rate of 26% (2011 28%) 106.4 72.6 Effects of:Overseas tax rates 8.5 3.0 Expenses not deductible for tax purposes 1.7 7.1 Unutilised losses 2.6 1.1 Utilisation of tax losses and tax holidays (4.9) (6.5)Adjustments for prior years (8.6) 2.0 Research and development credits (7.0) (5.6)Other (4.8) 1.8
Tax expense for the year 93.9 75.5
In March 2012 the UK government enacted a change in the UK corporation tax rate from 26% to 24% effective from 1st April 2012 andso the UK deferred tax balances at 31st March 2012 have been recalculated at the new rate.
Notes on the Accountsfor the year ended 31st March 2012

136
10 Dividends2012 2011
£ million £ million
2009/10 final ordinary dividend paid – 27.9 pence per share – 59.4 2010/11 interim ordinary dividend paid – 12.5 pence per share – 26.7 2010/11 final ordinary dividend paid – 33.5 pence per share 71.2 –2011/12 interim ordinary dividend paid – 15.0 pence per share 31.9 –
Total dividends 103.1 86.1
A final dividend of 40.0 pence per ordinary share has been proposed by the board which will be paid on 17th August 2012 toshareholders on the register at the close of business on 3rd August 2012. The estimated amount to be paid is £84.8 million and has notbeen recognised in these accounts. The board is also recommending a special dividend to shareholders of 100.0 pence per ordinaryshare which will be paid on 17th August 2012 to shareholders on the register at the close of business on 3rd August 2012. Thisrepresents a total payment of approximately £212 million and has not been recognised in these accounts.
11 Earnings per ordinary share2012 2011
restated pence pence
TotalBasic 148.7 85.2 Diluted 146.9 84.7 ContinuingBasic 148.7 86.1 Diluted 146.9 85.6 DiscontinuedBasic – (0.9)Diluted – (0.9)
Earnings per ordinary share have been calculated by dividing the profit attributable to equity holders of the parent company by theweighted average number of shares in issue during the period.
2012 2011 restated
£ million £ million
EarningsProfit for the year from continuing operations attributable to equity holders of the parent company 315.9 183.4 Loss for the year from discontinued operations attributable to equity holders of the parent company – (1.9)
Profit for the year attributable to equity holders of the parent company 315.9 181.5
2012 2011
Weighted average number of shares in issueBasic 212,431,522 212,907,178Dilution for share options and long term incentive plans 2,567,460 1,344,782
Diluted 214,998,982 214,251,960
Notes on the Accountsfor the year ended 31st March 2012
Johnson Matthey Annual Report & Accounts 2012Accounts

137
11 Earnings per ordinary share (continued)Underlying earnings per ordinary share are calculated as follows:
2012 2011 restated
£ million £ million
Profit for the year attributable to equity holders of the parent company 315.9 181.5 Major impairment and restructuring charges (note 3) – 71.8 Amortisation of acquired intangibles (note 4) 16.7 14.5 Dissolution of associate – (0.1)Loss on disposal of discontinued operations – 1.9 Tax thereon (6.1) (16.2)
Underlying profit for the year 326.5 253.4
2012 2011 pence pence
Underlying earnings per shareBasic 153.7 119.0 Diluted 151.9 118.3
12 Employee and key management personnel costs12a Employee numbers
2012 2011
The average monthly number of employees during the year was:Environmental Technologies 5,568 5,313 Precious Metal Products 2,847 2,657 Fine Chemicals 1,089 1,052 Corporate and Central Research 410 366
Average number of employees 9,914 9,388
Actual number of employees at 31st March 10,058 9,742
The number of temporary employees included above at 31st March 2012 was 253 (2011 237).
The actual number of staff was:
At 31st March 2012 At 31st March 2011
Actual Agency Total Actual Agency Totalemployees staff headcount employees staff headcount
Environmental Technologies 5,640 687 6,327 5,569 654 6,223 Precious Metal Products 2,894 165 3,059 2,711 88 2,799 Fine Chemicals 1,090 17 1,107 1,089 35 1,124Corporate and Central Research 434 4 438 373 6 379
Total 10,058 873 10,931 9,742 783 10,525
12b Employee benefits expense
2012 2011 £ million £ million
Wages and salaries 392.9 371.2 Social security costs 48.2 36.4 Pension and other post-employment costs 32.3 34.3 Share-based payments 18.8 17.1
Total employee benefits expense 492.2 459.0
Termination benefits of £5.2 million (2011 £33.3 million) are not included above.
Notes on the Accountsfor the year ended 31st March 2012

138
12 Employee and key management personnel costs (continued)12c Key management personnel
The key management of the group and parent company consist of the Board of Directors and the members of the Chief Executive’sCommittee (CEC). During the year ended 31st March 2012 the CEC had eleven members (2011 twelve members). Their compensationcharged in the year was:
2012 2011 £ million £ million
Short term employee benefits 6.5 6.8 Pension and other post-employment costs 0.4 0.6 Share-based payments 3.6 2.9 Non-executive directors’ fees and benefits 0.6 0.6
Total compensation of key management personnel 11.1 10.9
Other than the compensation above there were no transactions with any key management personnel. There were no balancesoutstanding at the year end.
Information on the directors’ remuneration is given in the Remuneration Report on pages 108 to 117.
13 Share-based paymentsLong Term Incentive Plan (LTIP)
Under the LTIP, shares are allocated to approximately 900 of the group’s executive directors, senior managers and middle managersbased on a percentage of salary and are subject to performance targets over a three year period. At 31st March 2012, shares allocatedin 2009, 2010 and 2011 (at 31st March 2011, shares allocated in 2008, 2009 and 2010) were outstanding in respect of which theperformance period has not expired. The minimum release of 15% of the allocation is subject to the achievement of underlying earningsper share (EPS) growth of 6% compound per annum over the three year period. For the maximum release of 100% of the allocation, EPSmust have grown by at least 15% compound per annum. The number of allocated shares released will vary on a straight line basisbetween these points. Allocations will lapse if the EPS growth is less than 6% compound per annum over the three year performanceperiod. For the shares allocated in 2009 only, the performance conditions have been relaxed and so the minimum release requires EPSgrowth of 3% compound per annum and the maximum release requires EPS growth of 10% compound per annum. Of the sharesallocated in 2008, 52.42% were released and 47.58% expired during the year.
Share options
In 2007 the LTIP was introduced and allocations of shares under this plan replaced the granting of share options. No share options havebeen granted since the year ended 31st March 2007. Equity settled share options were granted to employees at the average of themarket value of the company’s shares over the three days prior to the date of grant and were subject to performance targets over a threeyear period and have a maximum life of ten years. The number of shares over which options were granted was based on a percentage ofthe employee’s salary and approximately 800 employees were granted options each year.
Options granted in 2004 to 2006 were subject to a minimum three year performance target of EPS growth of UK RPI plus 3% perannum. Other performance targets were EPS growth of UK RPI plus 4% per annum and EPS growth of UK RPI plus 5% per annum. Ifthe performance targets were not met at the end of the three year performance period, the options would lapse. The targets for optionsgranted in 2004, 2005 and the 3% and 4% targets for options granted in 2006 have been met and so these options are exercisable. The5% target for options granted in 2006 was not met and so these options have lapsed. Gains are capped at 100% of the grant price.
Options granted in 2002 and 2003 can only be exercised if the normalised EPS has grown by at least UK RPI plus 4% per annum overany three consecutive years during the life of the options. They were subject to annual retesting until they lapse on the tenth anniversaryof grant. Since the targets have been met all these options are exercisable.
Deferred bonus
In the year ended 31st March 2012 the bonus rules were changed for the executive directors and members of the Chief Executive’sCommittee, whereby a proportion of their bonus payable is now awarded as shares and deferred for three years. The first shares will beawarded in August 2012 for the 2011/12 bonus. The Management Development and Remuneration Committee is entitled to claw backthe deferred element in cases of misstatement or misconduct or other relevant reason as determined by them.
Share Incentive Plan (SIP) – UK and Overseas
Under the SIP, all employees with at least one year of service with the group and who are employed by a participating group companyare entitled to contribute up to 2.5% of basic pay each month, subject to a £125 per month limit. The SIP trustees buy shares(partnership shares) at market value each month with the employees’ contributions. For each partnership share purchased, the grouppurchases two shares (matching shares) which are allocated to the employee. In the UK SIP, if the employee sells or transfers partnershipshares within three years from the date of allocation, the linked matching shares are forfeited. In the Overseas SIP, partnership shares andmatching shares are subject to a three year holding period and cannot be sold or transferred during that time.
Notes on the Accountsfor the year ended 31st March 2012
Johnson Matthey Annual Report & Accounts 2012Accounts

139
13 Share-based payments (continued)401k approved savings investment plans (401k plans)
In the US there are two 401k plans, one for salaried employees and one for hourly employees. Salaried employees may contribute up to50% of their base pay and hourly employees up to 20% of their base pay, both subject to a statutory limit. Salaried employees choosingJohnson Matthey Plc shares matching are matched 100% of the first 4% contributed and hourly employees are matched 50% of the first2% contributed. Employees may contribute after one month of service and are eligible for matching after one year of service.
Further details of the directors’ remuneration under share-based payment plans are given in the Remuneration Report on pages 108 to 117.
Options were exercised on a regular basis throughout the year. The average share price during the year was 1,943.04 pence (2011 1,787.40 pence).
Activity relating to share options was:2012 2012 2011 2011
Weighted Weightedaverage averageexercise exercise
Number of price Number of priceoptions pence options pence
Outstanding at the start of the year 1,797,780 1,124.02 2,474,307 1,117.88 Forfeited during the year (15,063) 1,060.78 (24,299) 1,150.11 Exercised during the year (1,023,850) 1,087.59 (652,228) 1,099.75
Outstanding at the end of the year 758,867 1,174.42 1,797,780 1,124.02
Exercisable at the end of the year 758,867 1,174.42 1,797,780 1,124.02
Details of share options outstanding at the end of the year are:
2012 2012 2011 2011 Weighted Weightedaverage average
Number of remaining life Number of remaining lifeoptions years options years
Range of exercise price800 pence to 900 pence 199,965 1.1 336,847 1.9 1,000 pence to 1,100 pence 15,335 3.3 710,930 3.9 1,200 pence to 1,300 pence 543,567 4.3 750,003 5.3
758,867 3.5 1,797,780 4.1
The fair value of the shares allocated during the year under the LTIP was 1,907.2 pence per share allocation (2011 1,523.6 pence pershare allocation). The fair value was based on the share price at the date of allocation of 2,040.0 pence (2011 1,636.0 pence) adjustedfor the present value of the expected dividends that will not be received at an expected dividend rate of 2.25% (2011 2.38%).
Activity relating to the LTIP was:2012 2011
Number of Number of allocated allocatedshares shares
Outstanding at the start of the year 2,402,541 2,176,594 Allocated during the year 937,850 849,617 Forfeited during the year (127,552) (50,844)Released during the year (280,521) –Expired during the year (256,077) (572,826)
Outstanding at the end of the year 2,676,241 2,402,541
252,092 (2011 266,614) matching shares under the SIP and 55,442 (2011 64,078) shares under the 401k plans were allocated toemployees during the year. They are nil cost awards on which performance conditions are substantially completed at the date of grant.Consequently the fair value of these awards is based on the market value of the shares at that date.
The total expense recognised during the year in respect of equity settled share-based payments, taking into account expected lapsesdue to leavers and the probability that EPS performance conditions will not be met, was £18.8 million (2011 £17.1 million).
Notes on the Accountsfor the year ended 31st March 2012

140
14 Post-employment benefits14a Group
The group operates a number of post-employment benefits plans around the world, the forms and benefits of which vary with conditionsand practices in the countries concerned. The majority of the plans are defined benefit which require contributions to be made intoseparately administered funds and retirement benefits are based on factors such as employees’ pensionable salary and length of service.Some of the plans are defined contribution, where the retirement benefits are determined by the value of funds arising from contributionspaid in respect of each employee. The group also makes payments to employees’ personal pension plans. The amount recognised as anexpense for defined contribution plans was £6.9 million (2011 £6.0 million).
The major defined benefit plans are pension plans and post-retirement medical plans in the UK and the US. The UK pension plan is acareer average salary plan with a final salary section which was closed to future accrual of benefits from 1st April 2010. The US hourlypension plan is a fixed benefit plan based upon years of service. The US salaried pension plan is a final salary plan. Full actuarialvaluations were carried out at 1st April 2009 for the UK pension plan and 30th June 2011 for the US pension plans and the valuations ofall of the UK and US plans were updated to 31st March 2012 by qualified independent actuaries.
The main assumptions were:2012 2012 2012 2011 2011 2011
UK plans US plans Other plans UK plans US plans Other plans % % % % % %
First 3 years rate of increase in salaries 3.40 3.40 3.21 4.50 3.75 3.17 Ultimate rate of increase in salaries 4.15 3.40 3.21 4.50 3.75 3.17 Rate of increase in pensions in payment 3.40 – 1.57 3.50 – 2.44 Discount rate 5.10 4.80 4.78 5.50 5.70 5.57 Inflation 2.75 1.76 2.75 2.06– UK RPI 3.40 3.50– UK CPI 2.70 3.00 Current medical benefits cost trend rate 5.40 7.78 – 7.70 8.06 –Ultimate medical benefits cost trend rate 5.40 4.50 – 6.00 4.50 –
The group uses certain mortality assumptions when calculating plan obligations. The current mortality assumptions for all major plansretain prudent allowance for future improvements in longevity and take account of experience.
The group’s largest plan is in the UK and for the purposes of calculating that plan’s pension liabilities as at 31st March 2012, the grouphas used SAPS S1 mortality tables based on year of birth (as published by the Institute of Actuaries) for both pensioner and non-pensionermembers in conjunction with the results of an investigation into the actual mortality experience of plan members. In addition, to allow forfuture improvements in longevity, the CMI 2011 tables (published by the Institute of Actuaries) have been used, with an assumed longterm rate of future annual mortality improvement of 1.25%.
The mortality tables used for the UK pension plan have been updated since 31st March 2011 following a mortality investigation. Last yearthe group used PA92 mortality tables projected to calendar year 2009 (as published by the Institute of Actuaries) for both pensioner andnon-pensioner members. In addition, allowance for future improvements in longevity was made using the medium cohort projections witha 1% underpin.
The mortality tables used for the other larger plans were:
US RP2000 projected to 2017 using Scale AANetherlands AG Prognosetafel 2005-2050 with one year age set backCanada UP 94 generational (including allowance for future mortality improvements)Germany RT2005 GSouth Africa PA(90), rated down by two years
The expected future lifetime of average members currently at age 65 and average members at age 65 in 25 years time (i.e. memberswho are currently aged 40 years) is respectively:
Currently age 65 Age 65 in 25 years
UK plan US plans UK plan US plans
Male 22.0 18.0 24.2 18.0 Female 24.8 19.9 27.2 19.9
Notes on the Accountsfor the year ended 31st March 2012
Johnson Matthey Annual Report & Accounts 2012Accounts

141
14 Post-employment benefits (continued)14a Group (continued)
A 1% point change in the assumed medical cost trend rates would have the following effects on:1% point increase 1% point decrease
UK plan US plan UK plan US plan £ million £ million £ million £ million
Post-retirement medical plan expense 0.1 0.4 (0.1) (0.3)Post-retirement medical plan defined benefit obligation 1.6 4.6 (1.3) (3.7)
A 0.1% change in the discount rate and rate of increase in salaries would have the following increases / (decreases) on the pensionplans’ defined benefit obligations at 31st March 2012:
0.1% point increase 0.1% point decrease
UK plan US plans UK plan US plans£ million £ million £ million £ million
Effect of discount rate (24.7) (3.0) 24.1 3.1 Effect of rate of increase in salaries 7.3 0.9 (7.3) (0.9)
A one year increase in life expectancy would have the following increase on:UK plan US plans£ million £ million
Pension defined benefit obligation 28.9 5.1
The fair values and expected rates of return for plan assets were:UK pension US pensions Other
Expected rate Expected rate Expected rate of return Value of return Value of return Value
% £ million % £ million % £ million
At 31st March 2012Equities 7.10 430.7 7.70 86.3 8.57 5.7Bonds 4.24 550.5 3.70 70.7 4.90 11.0Property 5.40 47.4 – – – –Insurance policies – – – – 4.36 24.0
5.49 1,028.6 5.90 157.0 5.09 40.7
At 31st March 2011Equities 8.10 456.6 7.70 71.0 7.70 10.0 Bonds 5.20 472.6 5.00 63.0 5.19 7.5 Property 6.60 37.6 – – – – Insurance policies – – – – 5.28 18.3
6.62 966.8 6.43 134.0 5.94 35.8
The defined benefit pension plans do not invest directly in Johnson Matthey Plc shares and no property or other assets owned by thepension plans are used by the group. The overall expected rate of return is determined on a country by country basis by reference tomarket expectations for each class of asset. It is based upon the forecasts of actuaries and market professionals.
Notes on the Accountsfor the year ended 31st March 2012

142
14 Post-employment benefits (continued)14a Group (continued)
Movements in the fair value of the plan assets during the year were:UK post- US post-retirement retirement
UK medical US medicalpension benefits pensions benefits Other Total£ million £ million £ million £ million £ million £ million
At 1st April 2010 886.7 – 122.5 – 36.0 1,045.2 Expected return on plan assets 60.2 – 8.3 – 1.9 70.4 Settlement losses – – – – (3.5) (3.5)Actuarial gain 8.1 – 8.5 – 1.4 18.0 Employee contributions – – – – 0.3 0.3 Company contributions 45.1 0.3 6.2 0.6 1.9 54.1 Benefits paid (33.3) (0.3) (4.4) (0.6) (2.0) (40.6)Exchange adjustments – – (7.1) – (0.2) (7.3)
At 31st March 2011 966.8 – 134.0 – 35.8 1,136.6 Expected return on plan assets 64.3 – 8.6 – 2.0 74.9 Settlement gains – – – – 0.9 0.9 Actuarial (loss) / gain (11.4) – 10.2 – 3.1 1.9 Employee contributions – – – – 0.3 0.3 Company contributions 44.7 0.5 8.5 0.7 2.1 56.5 Benefits paid (35.8) (0.5) (4.7) (0.7) (1.5) (43.2)Exchange adjustments – – 0.4 – (2.0) (1.6)
At 31st March 2012 1,028.6 – 157.0 – 40.7 1,226.3
The actual return on plan assets for UK plans was £52.9 million (2011 £68.3 million) and for US plans was £18.8 million (2011 £16.8 million).It is estimated that the group will contribute about £58 million to the post-employment defined benefits plans during the year ending31st March 2013. The latest actuarial valuation of the group’s UK pension plan as at 1st April 2012 is underway and additional cashcontributions may be required once the valuation is complete.
Movements in the defined benefit obligation during the year were:UK post- US post-retirement retirement
UK medical US medicalpension benefits pensions benefits Other Total£ million £ million £ million £ million £ million £ million
At 1st April 2010 (1,043.6) (14.4) (149.6) (28.5) (54.2) (1,290.3)Current service cost – in operating profit (22.8) (0.1) (6.8) (0.9) (2.1) (32.7)Current service cost – capitalised (0.1) – – – – (0.1)Past service cost – vested (1.9) – – – – (1.9)Past service cost – non-vested – – – 0.4 – 0.4 Interest cost (56.5) (0.8) (8.2) (1.6) (2.7) (69.8)Curtailment gains – – – – 4.4 4.4 Settlement gains – – – – 3.5 3.5 Employee contributions – – – – (0.3) (0.3)Actuarial gain / (loss) 64.2 2.5 (0.2) 2.6 (0.9) 68.2 Benefits paid 33.3 0.3 4.4 0.6 2.0 40.6 Exchange adjustments – – 8.3 1.6 0.7 10.6
At 31st March 2011 (1,027.4) (12.5) (152.1) (25.8) (49.6) (1,267.4)Current service cost – in operating profit (23.0) (0.1) (6.9) (0.8) (1.7) (32.5)Current service cost – capitalised (0.1) – – – – (0.1)Past service cost – vested (0.2) – – – (0.1) (0.3)Interest cost (55.5) (0.7) (8.5) (1.5) (2.6) (68.8)Curtailment gains – – – – 0.2 0.2 Settlement losses – – – – (0.9) (0.9)Employee contributions – – – – (0.3) (0.3)Actuarial (loss) / gain (43.0) 1.1 (19.7) (3.3) (8.6) (73.5)Benefits paid 35.8 0.5 4.7 0.7 1.5 43.2 Exchange adjustments – – (0.5) (0.1) 2.8 2.2
At 31st March 2012 (1,113.4) (11.7) (183.0) (30.8) (59.3) (1,398.2)
Notes on the Accountsfor the year ended 31st March 2012
Johnson Matthey Annual Report & Accounts 2012Accounts

143
14 Post-employment benefits (continued)14a Group (continued)
Movements in the reimbursement rights during the year were:UK post- US post-retirement retirement
UK medical US medicalpension benefits pensions benefits Other Total£ million £ million £ million £ million £ million £ million
At 1st April 2010 – – – 5.5 0.6 6.1 Expected return – – – 0.5 – 0.5 Actuarial loss – – – (0.8) – (0.8)Company contributions – – – – 0.1 0.1 Exchange adjustments – – – (0.3) – (0.3)
At 31st March 2011 – – – 4.9 0.7 5.6 Expected return – – – 0.5 – 0.5 Actuarial gain – – – 1.0 – 1.0
At 31st March 2012 – – – 6.4 0.7 7.1
Amounts recognised in the income statement in respect of these plans were:UK post- US post-retirement retirement
UK medical US medicalpension benefits pensions benefits Other Total£ million £ million £ million £ million £ million £ million
Year ended 31st March 2012Current service cost (23.0) (0.1) (6.9) (0.8) (1.7) (32.5)Interest on plan liabilities (55.5) (0.7) (8.5) (1.5) (2.6) (68.8)Expected return on plan assets 64.3 – 8.6 – 2.0 74.9Expected return on reimbursement rights – – – 0.5 – 0.5Curtailment gains – – – – 0.2 0.2 Past service cost ─ vested (0.2) – – – (0.1) (0.3)Past service cost ─ non-vested – – – 0.6 – 0.6
Charge to income (14.4) (0.8) (6.8) (1.2) (2.2) (25.4)
Year ended 31st March 2011Current service cost (22.8) (0.1) (6.8) (0.9) (2.1) (32.7)Interest on plan liabilities (56.5) (0.8) (8.2) (1.6) (2.7) (69.8)Expected return on plan assets 60.2 – 8.3 – 1.9 70.4 Expected return on reimbursement rights – – – 0.5 – 0.5 Curtailment gains – – – – 4.4 4.4 Past service cost ─ vested (1.9) – – – – (1.9)Past service cost ─ non-vested – – – 0.8 – 0.8
Charge to income (21.0) (0.9) (6.7) (1.2) 1.5 (28.3)
Of the total charge for the year, £15.3 million (2011 £20.7 million) has been included within cost of sales, £3.0 million (2011 £4.9 million)in distribution costs, £7.1 million (2011 £5.9 million) in administrative expenses and a credit of £ nil (2011 £3.2 million) in major impairmentand restructuring charges.
Notes on the Accountsfor the year ended 31st March 2012

144
14 Post-employment benefits (continued)14a Group (continued)
The net post-employment benefits assets and liabilities shown in the balance sheet are analysed as:UK post- US post-retirement retirement
UK medical US medicalpension benefits pensions benefits Other Total£ million £ million £ million £ million £ million £ million
At 31st March 2012Present value of funded obligations (1,113.4) – (183.0) – (45.0) (1,341.4)Present value of unfunded obligations – (11.7) – (30.8) (14.3) (56.8)
Defined benefit obligation (1,113.4) (11.7) (183.0) (30.8) (59.3) (1,398.2)Fair value of plan assets 1,028.6 – 157.0 – 40.7 1,226.3Reimbursement rights – – – 6.4 0.7 7.1Unrecognised past service credit − non-vested – – – (2.3) – (2.3)
Net post-employment benefits assets and liabilities (84.8) (11.7) (26.0) (26.7) (17.9) (167.1)
At 31st March 2011Present value of funded obligations (1,027.4) – (152.1) – (37.8) (1,217.3)Present value of unfunded obligations – (12.5) – (25.8) (11.8) (50.1)
Defined benefit obligation (1,027.4) (12.5) (152.1) (25.8) (49.6) (1,267.4)Fair value of plan assets 966.8 – 134.0 – 35.8 1,136.6 Reimbursement rights – – – 4.9 0.7 5.6 Unrecognised past service credit − non-vested – – – (2.9) – (2.9)
Net post-employment benefits assets and liabilities (60.6) (12.5) (18.1) (23.8) (13.1) (128.1)
These are included in the balance sheet as:2012 2012 2012 2011 2011 2011 Post- Post-
employment Employee employment Employee benefits benefits benefits benefits
net assets obligations Total net assets obligations Total£ million £ million £ million £ million £ million £ million
UK pension plan – (84.8) (84.8) – (60.6) (60.6)UK post-retirement medical benefits plan – (11.7) (11.7) – (12.5) (12.5)US pension plans – (26.0) (26.0) – (18.1) (18.1)US post-retirement medical benefits plan – (26.7) (26.7) – (23.8) (23.8)Other plans 2.0 (19.9) (17.9) 3.8 (16.9) (13.1)
Total post-employment plans 2.0 (169.1) (167.1) 3.8 (131.9) (128.1)
Other long term employee benefits (2.3) (2.3)
Total long term employee benefits obligations (171.4) (134.2)
The cumulative amount of actuarial gains / (losses) recognised in the statement of total comprehensive income were:UK post- US post-retirement retirement
UK medical US medicalpension benefits pensions benefits Other Total£ million £ million £ million £ million £ million £ million
At 1st April 2010 (249.0) (2.2) (34.7) (3.2) (4.8) (293.9)Recognised in year 72.3 2.5 8.3 1.8 0.5 85.4
At 31st March 2011 (176.7) 0.3 (26.4) (1.4) (4.3) (208.5)Recognised in year (54.4) 1.1 (9.5) (2.3) (5.5) (70.6)
At 31st March 2012 (231.1) 1.4 (35.9) (3.7) (9.8) (279.1)
Notes on the Accountsfor the year ended 31st March 2012
Johnson Matthey Annual Report & Accounts 2012Accounts

145
14 Post-employment benefits (continued)14a Group (continued)
History of the plans and experience adjustments are:UK post- US post-retirement retirement
UK medical US medicalpension benefits pensions benefits Other Total£ million £ million £ million £ million £ million £ million
Year ended 31st March 2012Present value of defined benefit obligation (1,113.4) (11.7) (183.0) (30.8) (59.3) (1,398.2)Fair value of plan assets 1,028.6 – 157.0 – 40.7 1,226.3Reimbursement rights – – – 6.4 0.7 7.1
Deficit in the plan (84.8) (11.7) (26.0) (24.4) (17.9) (164.8)
Experience adjustments arising on plan liabilities – 0.3 0.7 (3.3) (3.0) (5.3)Experience adjustments arising on plan assets (11.4) – 10.2 – 3.1 1.9
Year ended 31st March 2011Present value of defined benefit obligation (1,027.4) (12.5) (152.1) (25.8) (49.6) (1,267.4)Fair value of plan assets 966.8 – 134.0 – 35.8 1,136.6 Reimbursement rights – – – 4.9 0.7 5.6
Deficit in the plan (60.6) (12.5) (18.1) (20.9) (13.1) (125.2)
Experience adjustments arising on plan liabilities 2.7 (0.2) (0.2) 3.3 0.6 6.2 Experience adjustments arising on plan assets 8.1 – 8.5 – 1.4 18.0
Year ended 31st March 2010Present value of defined benefit obligation (1,043.6) (14.4) (149.6) (28.5) (54.2) (1,290.3)Fair value of plan assets 886.7 – 122.5 – 36.0 1,045.2 Reimbursement rights – – – 5.5 0.6 6.1
Deficit in the plan (156.9) (14.4) (27.1) (23.0) (17.6) (239.0)
Experience adjustments arising on plan liabilities (5.2) 1.2 (2.1) 0.4 (0.2) (5.9)Experience adjustments arising on plan assets 173.4 – 19.8 – 1.9 195.1
Year ended 31st March 2009Present value of defined benefit obligation (715.6) (12.0) (128.3) (26.7) (45.3) (927.9)Fair value of plan assets 670.4 – 77.9 – 29.4 777.7 Reimbursement rights – – – 4.5 – 4.5
Deficit in the plan (45.2) (12.0) (50.4) (22.2) (15.9) (145.7)
Experience adjustments arising on plan liabilities 24.4 (0.6) 0.9 (1.0) 0.3 24.0 Experience adjustments arising on plan assets (191.2) – (32.4) – (3.8) (227.4)
Year ended 31st March 2008Present value of defined benefit obligation (744.4) (10.9) (86.4) (15.6) (39.0) (896.3)Fair value of plan assets 809.5 – 78.5 – 27.1 915.1 Reimbursement rights – – – 2.6 – 2.6
Surplus / (deficit) in the plan 65.1 (10.9) (7.9) (13.0) (11.9) 21.4
Experience adjustments arising on plan liabilities (3.0) – 5.9 1.8 (0.4) 4.3 Experience adjustments arising on plan assets (87.7) – (6.9) – (2.8) (97.4)
Notes on the Accountsfor the year ended 31st March 2012

146
14 Post-employment benefits (continued)14b Parent company
The parent company is the sponsoring employer of the group’s UK defined benefit pension plan and the UK post-retirement medicalbenefits plan. There is no contractual agreement or stated policy for charging the net defined benefit cost for the plan to the individualgroup entities. The main assumptions used for these plans are disclosed in note 14a.
The fair values and expected rates of return for defined benefit pension plan assets were:
2012 2012 2011 2011 Expected rate Expected rate
of return Value of return Value% £ million % £ million
Equities 7.10 430.7 8.10 456.6 Bonds 4.24 550.5 5.20 472.6 Property 5.40 47.4 6.60 37.6
5.49 1,028.6 6.62 966.8
The defined benefit pension plan does not invest directly in Johnson Matthey Plc shares and no property or other assets owned by thepension plan are used by the company. The overall expected rate of return is determined by reference to market expectations for eachclass of asset. It is based upon the forecasts of actuaries and market professionals.
Movements in the fair value of the plan assets during the year were:2012 2012 2011 2011
Post- Post- retirement retirement medical medical
Pension benefits Pension benefits £ million £ million £ million £ million
At beginning of year 966.8 – 886.7 – Expected return on plan assets 64.3 – 60.2 – Actuarial (loss) / gain (11.4) – 8.1 – Company contributions 44.7 0.5 45.1 0.3 Benefits paid (35.8) (0.5) (33.3) (0.3)
At end of year 1,028.6 – 966.8 –
The actual return on plan assets was £52.9 million (2011 £68.3 million). It is estimated that the company will contribute about £42 million(and its subsidiaries will also contribute about £6 million) to the company’s post-employment defined benefits plans during the yearending 31st March 2013. The latest actuarial valuation of the company’s pension plan as at 1st April 2012 is underway and additionalcash contributions may be required once the valuation is complete.
Movements in the defined benefit obligation during the year were:2012 2012 2011 2011
Post- Post- retirement retirement medical medical
Pension benefits Pension benefits £ million £ million £ million £ million
At beginning of year (1,027.4) (12.5) (1,043.6) (14.4)Current service cost – in operating profit (23.0) (0.1) (22.8) (0.1)Current service cost – capitalised (0.1) – (0.1) –Past service cost – vested (0.2) – (1.9) –Interest cost (55.5) (0.7) (56.5) (0.8)Actuarial (loss) / gain (43.0) 1.1 64.2 2.5 Benefits paid 35.8 0.5 33.3 0.3
At end of year (1,113.4) (11.7) (1,027.4) (12.5)
Notes on the Accountsfor the year ended 31st March 2012
Johnson Matthey Annual Report & Accounts 2012Accounts

147
14 Post-employment benefits (continued)14b Parent company (continued)
The net post-employment benefits assets and liabilities shown in the balance sheet are analysed as:2012 2012 2011 2011
Post- Post- retirement retirement medical medical
Pension benefits Pension benefits £ million £ million £ million £ million
Present value of funded obligations (1,113.4) – (1,027.4) –Present value of unfunded obligations – (11.7) – (12.5)
Defined benefit obligation (1,113.4) (11.7) (1,027.4) (12.5)Fair value of plan assets 1,028.6 – 966.8 –
Net retirement benefits assets and liabilities (84.8) (11.7) (60.6) (12.5)
These are included in the balance sheet under employee benefits obligations as:2012 2011
£ million £ million
Pension plan (84.8) (60.6)Post-retirement medical benefits plan (11.7) (12.5)
Total post-employment plans (96.5) (73.1)Other long term employee benefits (0.1) (0.1)
Total long term employee benefits obligations (96.6) (73.2)
The cumulative amount of actuarial gains / (losses) recognised in the statement of changes in equity were:2012 2012 2011 2011
Post- Post- retirement retirement medical medical
Pension benefits Pension benefits £ million £ million £ million £ million
At beginning of year (178.1) 0.3 (250.4) (2.2)Recognised in year (54.4) 1.1 72.3 2.5
At end of year (232.5) 1.4 (178.1) 0.3
History of the plans and experience adjustments are:Present Experience Experiencevalue of Surplus / adjustments adjustments
defined benefit Fair value of (deficit) arising on arising on obligation plan assets in plan plan liabilities plan assets £ million £ million £ million £ million £ million
Year ended 31st March 2012Pension (1,113.4) 1,028.6 (84.8) – (11.4) Post-retirement medical benefits (11.7) – (11.7) 0.3 –
Year ended 31st March 2011Pension (1,027.4) 966.8 (60.6) 2.7 8.1 Post-retirement medical benefits (12.5) – (12.5) (0.2) –
Year ended 31st March 2010Pension (1,043.6) 886.7 (156.9) (5.2) 173.4 Post-retirement medical benefits (14.4) – (14.4) 1.2 –
Year ended 31st March 2009Pension (715.6) 670.4 (45.2) 24.4 (191.2)Post-retirement medical benefits (12.0) – (12.0) (0.6) –
Year ended 31st March 2008Pension (744.4) 809.5 65.1 (3.0) (87.7)Post-retirement medical benefits (10.9) – (10.9) – –
Notes on the Accountsfor the year ended 31st March 2012

148
15 Property, plant and equipment15a Group
Assets in Freehold land Long & short Plant & the course of & buildings leasehold machinery construction Total £ million £ million £ million £ million £ million
CostAt 1st April 2010 416.0 22.7 1,190.7 51.9 1,681.3 Additions 5.4 1.7 51.7 61.3 120.1 Acquisitions (restated) (note 39) 4.4 – 15.3 0.7 20.4Reclassifications 11.9 0.7 37.6 (50.2) – Disposals (7.2) (0.1) (35.4) – (42.7)Exchange adjustments (restated) (4.4) (0.4) (18.0) (1.3) (24.1)
At 31st March 2011 (restated) 426.1 24.6 1,241.9 62.4 1,755.0 Additions 5.8 0.4 53.7 77.0 136.9 Reclassifications 8.6 0.1 36.7 (45.4) – Disposals (1.8) (0.1) (72.9) (8.3) (83.1)Exchange adjustments (6.4) (0.9) (22.0) (2.5) (31.8)
At 31st March 2012 432.3 24.1 1,237.4 83.2 1,777.0
Accumulated depreciation and impairmentAt 1st April 2010 116.7 9.8 633.2 – 759.7 Charge for the year 14.5 2.7 91.1 – 108.3 Impairment losses 0.5 3.6 23.2 – 27.3 Disposals (3.3) (0.1) (32.8) – (36.2)Exchange adjustments (1.6) – (10.2) – (11.8)
At 31st March 2011 126.8 16.0 704.5 – 847.3 Charge for the year 14.5 0.9 93.1 – 108.5 Impairment losses – 1.4 1.6 – 3.0 Reversal of impairment losses – – (2.8) – (2.8)Disposals (1.5) – (69.8) – (71.3)Exchange adjustments (1.6) (0.7) (14.9) – (17.2)
At 31st March 2012 138.2 17.6 711.7 – 867.5
Carrying amount at 31st March 2012 294.1 6.5 525.7 83.2 909.5
Carrying amount at 31st March 2011 (restated) 299.3 8.6 537.4 62.4 907.7
Carrying amount at 1st April 2010 299.3 12.9 557.5 51.9 921.6
The carrying amount of plant and machinery includes £1.6 million (2011 £1.9 million) in respect of assets held under finance leases.
Compensation received for impaired or lost property, plant and equipment was £3.0 million (2011 £ nil).
Finance costs capitalised were £0.7 million (2011 £0.5 million) and the capitalisation rate used to determine the amount of finance costseligible for capitalisation was 4.4% (2011 5.6%).
The impairment losses for freehold land and buildings of £ nil (2011 £0.5 million) have been included in major impairment andrestructuring charges (note 3). Of the impairment losses for long and short leaseholds in the year £0.3 million (2011 £ nil) have beenincluded in cost of sales, £0.7 million (2011 £ nil) in administrative expenses and £0.4 million (2011 £3.6 million) in major impairment andrestructuring charges (note 3). Of the impairment losses for plant and machinery £1.0 million (2011 £0.1 million) have been included inadministrative expenses, £0.6 million in cost of sales (2011 £0.7 million) and £ nil (2011 £22.4 million) in major impairment and restructuringcharges (note 3). Impairment losses of £0.6 million, £1.0 million and £1.4 million are included in the underlying operating profit ofEnvironmental Technologies, Precious Metal Products and Fine Chemicals respectively and arose as the assets have become idle.
Of the reversal of impairment losses for plant and machinery, £2.1 million (2011 £ nil) is included in major impairment and restructuringcharges and relates to assets impaired in the year ended 31st March 2011 as part of the closure of the Brussels autocatalyst facility (note 3),which were subsequently transferred to other group companies or sold. £0.7 million (2011 £ nil) is included in cost of sales and relates toassets impaired in the year ended 31st March 2011 as they were damaged in the Japanese earthquake in March 2011 and were thoughtto be beyond repair, but have subsequently been able to be repaired. These are included in Environmental Technologies’ underlyingoperating profit.
Notes on the Accountsfor the year ended 31st March 2012
Johnson Matthey Annual Report & Accounts 2012Accounts

149
15 Property, plant and equipment (continued)15b Parent company
Assets in Freehold land Long & short Plant & the course of & buildings leasehold machinery construction Total £ million £ million £ million £ million £ million
CostAt 1st April 2010 96.4 0.2 346.2 2.0 444.8 Additions 2.5 0.9 22.3 2.8 28.5 Reclassifications – – 2.7 (2.7) – Disposals (4.7) (0.1) (4.3) – (9.1)
At 31st March 2011 94.2 1.0 366.9 2.1 464.2 Additions 3.1 – 25.0 5.5 33.6 Reclassifications – – 4.0 (4.0) – Disposals (1.3) – (3.8) (0.2) (5.3)
At 31st March 2012 96.0 1.0 392.1 3.4 492.5
Accumulated depreciation and impairmentAt 1st April 2010 32.4 0.1 167.0 – 199.5 Charge for the year 2.6 0.1 27.2 – 29.9 Impairment losses 0.5 – 7.6 – 8.1 Disposals (0.8) (0.1) (3.2) – (4.1)
At 31st March 2011 34.7 0.1 198.6 – 233.4 Charge for the year 2.7 – 25.3 – 28.0 Disposals (1.1) – (3.5) – (4.6)
At 31st March 2012 36.3 0.1 220.4 – 256.8
Carrying amount at 31st March 2012 59.7 0.9 171.7 3.4 235.7
Carrying amount at 31st March 2011 59.5 0.9 168.3 2.1 230.8
Carrying amount at 1st April 2010 64.0 0.1 179.2 2.0 245.3
The carrying amount of plant and machinery includes £1.5 million (2011 £1.8 million) in respect of assets held under finance leases.
Notes on the Accountsfor the year ended 31st March 2012

150
16 GoodwillParent
Group company £ million £ million
CostAt 1st April 2010 513.8 110.5 Acquisitions (restated) (note 39) 20.0 –Adjustments to consideration of prior year’s acquisitions (0.1) –Exchange adjustments (5.0) –
At 31st March 2011 (restated) 528.7 110.5 Exchange adjustments (9.2) –
At 31st March 2012 519.5 110.5
ImpairmentAt 1st April 2010, 31st March 2011 and 31st March 2012 – –
Carrying amount at 31st March 2012 519.5 110.5
Carrying amount at 31st March 2011 (restated) 528.7 110.5
Carrying amount at 1st April 2010 513.8 110.5
Goodwill arising on the acquisition of businesses is allocated, at acquisition, to the cash-generating units (CGUs) that are expected tobenefit from that business combination. Goodwill is allocated as follows:
Group Parent company
2012 2011 2012 2011 restated
£ million £ million £ million £ million
Environmental TechnologiesEmission Control Technologies ─ Non-light Duty Catalysts 84.4 89.2 – – Process Technologies 245.3 249.4 110.5 110.5
Precious Metal ProductsCatalysts and Chemicals 24.8 24.9 – – Other 5.6 5.8 – –
Fine ChemicalsMacfarlan Smith 117.1 117.1 – – Pharmaceutical Materials and Services 20.7 20.7 – – Research Chemicals 21.6 21.6 – –
519.5 528.7 110.5 110.5
The group and parent company test goodwill annually for impairment, or more frequently if there are indications that goodwill might beimpaired. The recoverable amounts of the CGUs are determined using value in use calculations which use cash flow projections basedon financial budgets and plans approved by management, generally covering a three year period except as discussed below. Thebudgets and plans are based on a number of key assumptions. Assumptions on the likelihood and timing of new product launches arebased on management’s best estimate of what may happen. Foreign exchange rates are based on actual rates at the time the budgetswere prepared and are held constant over the budget and plan years. Other assumptions such as market share, expected changes toselling prices, product profitability, precious metal prices and other direct input costs are based on past experience and management’sexpectations of future changes in the markets using external sources of information where appropriate. These cash flows are thenextrapolated using the long term average growth rates for the relevant products, industries and countries in which the CGUs operate.The cash flows are discounted at the group’s estimated pre-tax weighted average cost of capital adjusted for the estimated tax cashflows and risk applicable to each CGU.
For the Non-light Duty Catalysts CGU five (2011 four) year plans have been approved by management. Over the next decademanagement expects the markets for heavy duty diesel catalysts and stationary emissions catalysts will continue to grow significantly,based on emission control legislation already in place or anticipated, as described on pages 30 and 31 of the Financial Review ofOperations, although some of this growth is now included in the five year plan. Therefore the cash flow projections have beenextrapolated using a long term average growth rate of 12% for years 6 to 10 (2011 20% for years 5 to 10) and 4% (2011 3%) after that.The discount rate used was 12.3% (2011 10.4%). The impairment test results in headroom of 40% over the carrying value of the CGU’snet assets and so it is unlikely that a reasonably possible change in a key assumption would result in an impairment of goodwill.
Notes on the Accountsfor the year ended 31st March 2012
Johnson Matthey Annual Report & Accounts 2012Accounts

151
16 Goodwill (continued)For Process Technologies the long term average growth rate used was 5% (2011 5%) and the discount rate was 12.0% (2011 10.1%).For Catalysts and Chemicals the long term average growth rate used was 4.7% (2011 5%) and the discount rate was 12.0% (2011 10.1%).For Macfarlan Smith the long term average growth rate used was 2.5% (2011 2.5%) and the discount rate was 8.0% (2011 7.6%). ForPharmaceutical Materials and Services the long term average growth rate used was 4% (2011 4%) and the discount rate was 8.3%(2011 7.4%). For Research Chemicals the long term average growth rate used was 5% (2011 5%) and the discount rate was 9.2%(2011 8.3%). These impairment tests all result in headroom of over of 100%, except for Macfarlan Smith which is over 80%, and so itis unlikely that a reasonably possible change in a key assumption would result in an impairment of goodwill.
17 Other intangible assets17a Group
Customer Patents, Acquired contracts and Computer trademarks research and Development relationships software and licences technology expenditure Total
£ million £ million £ million £ million £ million £ million
CostAt 1st April 2010 51.9 49.4 19.6 21.6 85.8 228.3 Additions – 4.7 0.1 – 13.0 17.8 Acquisitions (restated) (note 39) 22.1 – 9.2 3.8 – 35.1 Disposals – (0.1) – – – (0.1)Exchange adjustments (restated) (0.5) (0.5) 0.1 (0.2) (1.6) (2.7)
At 31st March 2011 (restated) 73.5 53.5 29.0 25.2 97.2 278.4 Additions – 3.5 0.1 – 9.1 12.7 Disposals – (2.5) – – – (2.5)Exchange adjustments (2.4) (1.5) (0.5) (1.1) (1.2) (6.7)
At 31st March 2012 71.1 53.0 28.6 24.1 105.1 281.9
Accumulated amortisation and impairmentAt 1st April 2010 21.8 36.0 6.1 – 32.8 96.7 Charge for the year (restated) 11.3 4.3 3.2 0.1 9.6 28.5 Impairment losses – 0.4 – 0.9 0.6 1.9 Disposals – (0.1) – – – (0.1)Exchange adjustments – (0.6) – – (0.9) (1.5)
At 31st March 2011 (restated) 33.1 40.0 9.3 1.0 42.1 125.5 Charge for the year 13.0 4.0 3.6 1.2 12.5 34.3 Disposals – (2.5) – – – (2.5)Exchange adjustments (1.5) (0.9) (0.3) – (0.5) (3.2)
At 31st March 2012 44.6 40.6 12.6 2.2 54.1 154.1
Carrying amount at 31st March 2012 26.5 12.4 16.0 21.9 51.0 127.8
Carrying amount at 31st March 2011 40.4 13.5 19.7 24.2 55.1 152.9
Carrying amount at 1st April 2010 30.1 13.4 13.5 21.6 53.0 131.6
The carrying amount of development expenditure includes £29.8 million (2011 £23.9 million) which is not yet being amortised as theassets are not yet available for use. The carrying amount of acquired research and technology includes £2.4 million (2011 £23.9 million)which is not yet being amortised as the assets are not yet available for use. These assets are tested for impairment annually.
The impairment losses for computer software of £ nil (2011 £0.4 million) have been included in major impairment and restructuringcharges (note 3). The impairment losses for acquired research and technology of £ nil (2011 £0.9 million) have been included inamortisation of acquired intangibles (note 4). The impairment losses for development expenditure of £ nil (2011 £0.6 million) have beenincluded in administrative expenses.
Notes on the Accountsfor the year ended 31st March 2012

152
17 Other intangible assets (continued)17b Parent company
Computer Developmentsoftware expenditure Total £ million £ million £ million
CostAt 1st April 2010 14.4 8.0 22.4 Additions 0.8 1.0 1.8
At 31st March 2011 15.2 9.0 24.2 Additions 1.2 – 1.2 Disposals (1.0) – (1.0)
At 31st March 2012 15.4 9.0 24.4
Accumulated amortisation and impairmentAt 1st April 2010 12.1 4.0 16.1 Charge for the year 1.1 0.6 1.7
At 31st March 2011 13.2 4.6 17.8 Charge for the year 1.0 1.2 2.2 Disposals (1.0) – (1.0)
At 31st March 2012 13.2 5.8 19.0
Carrying amount at 31st March 2012 2.2 3.2 5.4
Carrying amount at 31st March 2011 2.0 4.4 6.4
Carrying amount at 1st April 2010 2.3 4.0 6.3
18 Investments in subsidiariesCost of
investments in Accumulated Carrying subsidiaries impairment amount
£ million £ million £ million
At 1st April 2010 1,703.9 (185.2) 1,518.7 Capital reduction of subsidiary (11.6) – (11.6)Impairment loss – (0.9) (0.9)
At 31st March 2011 1,692.3 (186.1) 1,506.2 Additional shares issued by subsidiary 40.0 – 40.0
At 31st March 2012 1,732.3 (186.1) 1,546.2
The principal subsidiaries are shown in note 42.
19 Non-current available-for-sale investments2012 2011
£ million £ million
Unquoted investments 8.0 8.0
Notes on the Accountsfor the year ended 31st March 2012
Johnson Matthey Annual Report & Accounts 2012Accounts

153
20 InventoriesGroup Parent company
2012 2011 2012 2011 £ million £ million £ million £ million
Raw materials and consumables 154.8 136.2 31.6 28.5 Work in progress 229.1 200.9 87.3 79.2 Finished goods and goods for resale 246.9 219.2 45.5 47.1
630.8 556.3 164.4 154.8
The group also holds customers’ materials in the process of refining and fabrication and for other reasons.
21 Trade and other receivablesGroup Parent company
2012 2011 2012 2011 restated
£ million £ million £ million £ million
CurrentTrade receivables 690.3 764.2 139.4 214.1 Amounts receivable from long term contract customers 12.3 13.0 – – Amounts receivable from subsidiaries – – 827.7 555.8 Prepayments and accrued income 68.7 34.2 34.5 8.9 Value added tax and other sales tax receivable 31.5 29.0 3.9 3.2 Other receivables 44.3 52.8 4.1 11.3
Current trade and other receivables 847.1 893.2 1,009.6 793.3
Non-currentAmounts receivable from subsidiaries – – 387.6 523.9 Prepayments and accrued income 2.9 2.9 0.1 0.1 Other receivables 0.1 0.1 – –
Non-current trade and other receivables 3.0 3.0 387.7 524.0
22 Trade and other payablesGroup Parent company
2012 2011 2012 2011 restated
£ million £ million £ million £ million
CurrentTrade payables 344.7 313.8 103.6 111.3 Amounts payable to long term contract customers 80.4 46.7 – – Amounts payable to subsidiaries – – 1,206.9 956.3 Accruals and deferred income 222.8 244.5 77.7 76.0 Other payables 62.8 57.9 166.2 142.7
Current trade and other payables 710.7 662.9 1,554.4 1,286.3
Non-currentAmounts payable to subsidiaries – – 22.6 – Accruals and deferred income 1.7 2.5 – 0.2 Other payables 2.6 2.3 0.7 –
Non-current trade and other payables 4.3 4.8 23.3 0.2
Notes on the Accountsfor the year ended 31st March 2012

154
23 Long term contracts2012 2011
£ million £ million
Contract revenue recognised 117.1 75.7 Contracts in progress at the year end:Costs incurred plus recognised profits less recognised losses in the year 116.4 69.3Costs incurred plus recognised profits less recognised losses to date 244.9 241.4Amount of advances received 73.6 42.2
24 Net debtGroup Parent company
2012 2011 2012 2011 £ million £ million £ million £ million
Non-current borrowings, finance leases and related swapsBank, other loans and related swaps4.66% Euro Bonds 2021 83.3 88.4 83.3 88.4 5.67% US Dollar Bonds 2016 110.9 106.2 110.9 106.2 4.95% US Dollar Bonds 2015 135.8 133.8 135.8 133.8 4.987% Euro European Investment Bank (EIB) loan 2013 104.2 110.7 104.2 110.7 5.55% US Dollar Bonds 2013 62.6 62.4 62.6 62.4 5.17% Sterling Bonds 2013 – 40.0 – 40.0 Cross currency interest rate swaps designated as cash flow hedges 0.3 0.3 0.3 0.3 Other repayable from two to three years – 31.5 – 31.2 Other repayable from one to two years 31.5 0.3 31.3 – Finance leases repayableAfter five years 0.2 0.6 0.2 0.6 From four to five years 0.4 0.4 0.4 0.4 From three to four years 0.4 0.4 0.4 0.4 From two to three years 0.4 0.4 0.4 0.3 From one to two years 0.4 0.3 0.3 0.3
Non-current borrowings, finance leases and related swaps 530.4 575.7 530.1 575.0
Current borrowings and finance leases5.17% Sterling Bonds 2013 40.0 – 40.0 – Other bank and other loans 16.1 181.5 – 146.5 Finance leases 0.3 0.3 0.3 0.3
Current borrowings and finance leases excluding bank overdrafts 56.4 181.8 40.3 146.8 Bank overdrafts 35.8 24.5 65.9 74.1
Current borrowings and finance leases 92.2 206.3 106.2 220.9
Total borrowings and finance leases 622.6 782.0 636.3 795.9
Less interest rate swaps designated as fair value hedges 29.3 23.7 29.3 23.7 Less cash and deposits 139.1 118.9 78.0 23.1
Net debt 454.2 639.4 529.0 749.1
Of the 4.95% US Dollar Bonds 2015, US $35.0 million have been swapped into sterling at 5.15% and US $165.0 million have beenswapped into floating rate US dollars. All the 5.67% US Dollar Bonds 2016 have been swapped into floating rate US dollars. The interestrate implicit in the finance leases is 5.9% and the lease term ends in 2017. Apart from the bonds, EIB loans and finance leases shownseparately above, all the loans, overdrafts and bank deposits are denominated in various currencies and bear interest at commercialfloating rates.
Notes on the Accountsfor the year ended 31st March 2012
Johnson Matthey Annual Report & Accounts 2012Accounts

155
25 Other financial assetsGroup Parent company
2012 2011 2012 2011 £ million £ million £ million £ million
Forward foreign exchange contracts and options designated as cash flow hedges 7.0 3.3 7.1 3.8 Forward foreign exchange contracts and currency swaps held for trading 3.1 1.9 2.9 2.0 Foreign exchange swaps designated as hedges of a net investment in foreign operations 0.3 0.3 – –Embedded derivatives 1.2 1.4 1.2 1.4
11.6 6.9 11.2 7.2
Of the other financial assets listed above, all are measured at fair value using observable inputs (level 2 inputs per IFRS 7’s fair valuehierarchy) except for certain embedded derivatives which are valued based on both observable and unobservable inputs (level 3 inputs).
The reconciliation of other financial assets valued using level 3 inputs is:Parent
Group company £ million £ million
At 1st April 2010 1.2 1.2Gains recognised in cost of sales 5.1 5.1Settlements (4.9) (4.9)
At 31st March 2011 1.4 1.4 Gains recognised in cost of sales 4.8 4.8 Settlements (5.0) (5.0)
At 31st March 2012 1.2 1.2
There were no transfers between the levels of IFRS 7’s fair value hierarchy during the year.
26 Other financial liabilitiesGroup Parent company
2012 2011 2012 2011 £ million £ million £ million £ million
Forward foreign exchange contracts and options designated as cash flow hedges 0.6 3.1 1.6 5.3 Forward foreign exchange contracts and currency swaps held for trading 3.9 2.0 3.2 2.5 Foreign exchange swaps designated as hedges of a net investment inforeign operations – 1.4 – –
4.5 6.5 4.8 7.8
All other financial liabilities are measured at fair value using observable inputs (level 2 inputs per IFRS 7’s fair value hierarchy).
27 Financial risk managementThe group’s and parent company’s activities expose them to a variety of financial risks including market risk, liquidity risk and credit risk.Market risk includes currency risk, interest rate risk and price risk. The main financial risks managed by the group and parent company,under policies approved by the board, are foreign currency risk, interest rate risk, liquidity risk and credit risk. The group and parentcompany use derivative financial instruments, in particular forward currency contracts and currency swaps, to manage their financial risksassociated with their underlying business activities and the financing of those activities. Some derivative financial instruments used tomanage financial risk are not designated as hedges and so are classified as ‘held for trading’. The group and parent company do notundertake any speculative trading activity in financial instruments.
Notes on the Accountsfor the year ended 31st March 2012

156
27 Financial risk management (continued)27a Foreign currency risk
The group operates globally with a significant amount of its profit earned outside the UK. In order to protect the group’s sterling balancesheet and reduce cash flow risk the group has financed most of its investment in the USA and Europe by borrowing US dollars and eurosrespectively. Although much of this funding is obtained by directly borrowing the relevant currency, a part is achieved through currencyswaps which can be more efficient and reduce costs. To a lesser extent the group has also financed a portion of its investment in China,Japan and South Africa using currency borrowings and swaps. The group has designated the currency swaps and two euro loans (fairvalue of the loans was £202.0 million (2011 £205.1 million)) as hedges of net investments in foreign operations as they hedge thechanges in values of the subsidiaries’ net assets against movements in exchange rates.
The main currencies of the net debt after taking into account the effect of the currency swaps were:Group Group Parent company Parent company
Borrowings Borrowings Cash Cash Borrowings Borrowings Cash Cash 2012 2011 2012 2011 2012 2011 2012 2011
£ million £ million £ million £ million £ million £ million £ million £ million
Sterling 220.4 338.3 394.9 497.7 240.2 338.4 390.6 496.9 US dollar 424.3 509.2 75.9 95.2 421.9 499.1 69.4 86.6 Euro 372.8 500.8 38.1 72.0 388.4 540.7 23.1 55.9 South African rand 28.9 22.6 52.2 59.0 19.7 22.6 51.5 37.8 Hong Kong dollar – 0.3 46.5 45.0 – 0.3 46.0 42.8 Chinese renminbi 19.7 54.6 9.9 8.5 14.4 41.0 – – South Korean won 19.3 4.6 5.2 3.1 17.0 – – – Japanese yen 10.2 40.6 2.1 8.1 16.9 40.6 1.4 3.4 Canadian dollar 6.9 6.7 8.6 20.3 7.9 7.8 8.5 17.3 Indian rupee 9.8 1.1 9.0 15.4 – – – – Other currencies 5.4 4.5 21.1 19.6 5.3 6.8 12.2 7.5
1,117.7 1,483.3 663.5 843.9 1,131.7 1,497.3 602.7 748.2
The group and parent company use forward exchange contracts, and occasionally purchased currency options, to hedge foreignexchange exposures arising on forecast receipts and payments in foreign currencies. These are designated and accounted for as cashflow hedges. The majority of the cash flows are expected to occur and the hedge effect realised in the income statement in the yearending 31st March 2013.
The main impact of movements in exchange rates on the group’s results arises on translation of overseas subsidiaries’ profits intosterling. The group’s largest exposure is to the US dollar and a 5% (8.0 cent (2011 7.8 cent)) movement in the average exchange rate forthe US dollar against sterling would have had a £7.3 million (2011 £4.6 million) impact on operating profit. The group is also exposed tothe euro and a 5% (5.8 cent (2011 5.9 cent)) movement in the average exchange rate for the euro against sterling would have had a £3.7 million (2011 £3.0 million) impact on operating profit. This exposure is part of the group’s economic risk of operating globally whichis essential to remain competitive in the markets in which the group operates.
For financial instruments the main exposures are to the US dollar and euro and are due to loans, swaps and cash flow hedges onforecast receipts and payments. A 5% (8.0 cent (2011 8.0 cent)) movement in the closing exchange rate for the US dollar against sterlingwould have had a £3.1 million (2011 £4.4 million) impact on operating profit and a £20.8 million (2011 £23.9 million) impact on equity forthese instruments. A 5% (6.0 cent (2011 5.7 cent)) movement in the closing exchange rate for the euro against sterling would have had a£5.7 million (2011 £4.6 million) impact on operating profit and a £21.4 million (2011 £27.2 million) impact on equity for these instruments.However, the impact on operating profit relates primarily to the cash flow hedging instruments hedging the forecast receipts andpayments whose cash flows have occurred in the year and so would be offset by similar movements in the hedged items. Similarly, theimpact on equity relates primarily to foreign exchange positions used to hedge the subsidiaries’ net assets and so would be offset by anequal and opposite movement in the value of the relevant subsidiaries’ net assets. The remaining impact on equity of £3.3 million (2011 £3.2 million) for the US dollar and £4.6 million (2011 £5.7 million) for the euro relates to cash flow hedging instruments hedging theforecast receipts and payments whose cash flows have yet to occur.
Notes on the Accountsfor the year ended 31st March 2012
Johnson Matthey Annual Report & Accounts 2012Accounts

157
27 Financial risk management (continued)27b Interest rate risk
The group’s and parent company’s interest rate risk arises from their fixed rate borrowings (fair value risk) and floating rate borrowings(cash flow risk). Their policy is to optimise interest cost and reduce volatility in reported earnings and equity. They manage their risk byreviewing the profile of their debt regularly and by selectively using interest rate and cross currency swaps to maintain borrowings inappropriate currencies and at competitive rates. The group and parent company have designated the US dollar fixed rate to US dollarfloating rate swaps as fair value hedges as they hedge the changes in fair value of bonds attributable to changes in interest rates. Thegains on the interest rate swaps in the year ended 31st March 2012 were £5.6 million (2011 £5.0 million) and the losses on the bondsattributable to the hedged risk were £5.7 million (2011 £5.0 million). The group and parent company have designated the US dollar fixedinterest rate to sterling fixed interest rate cross currency swap as a cash flow hedge as it hedges the movement in the cash flows of thehedged bond attributable to changes in the US dollar / sterling exchange rate. The cross currency swap’s cash flows are expected tooccur in 2015 when the bond which it hedges matures. The interest element of the cash flow hedge is realised in the income statementeach year and the exchange effect is expected to be realised in the income statement in 2015. At 31st March 2012, 73% (2011 54%) ofthe group’s net debt and 62% (2011 44%) of the parent company’s net debt were at fixed rates with an average interest rate of 4.91%(2011 5.06%). The remaining debt is funded on a floating rate basis. Based on the group’s net debt funded at floating rates, after takinginto account the effect of the swaps, a 1% change in all interest rates would have a £1.2 million (2011 £3.0 million) impact on the group’sprofit before tax. This is within the range the board regards as acceptable.
27c Fair value of financial instruments
The fair value of financial instruments is approximately equal to book value except for:2012 2011
Carrying Fair Carrying Fair amount value amount value
Group £ million £ million £ million £ million
US Dollar Bonds 2013, 2015 and 2016 (309.3) (334.1) (302.4) (304.2)Euro Bonds 2021 (83.3) (93.6) (88.4) (89.7)Euro EIB loan 2013 (104.2) (108.4) (110.7) (115.4)Sterling Bonds 2013 (40.0) (41.1) (40.0) (42.0)
2012 2011
Carrying Fair Carrying Fair amount value amount value
Parent company £ million £ million £ million £ million
Amounts receivable from subsidiaries 1,215.3 1,247.8 1,079.7 1,084.1 US Dollar Bonds 2013, 2015 and 2016 (309.3) (334.1) (302.4) (304.2)Euro Bonds 2021 (83.3) (93.6) (88.4) (89.7)Euro EIB loan 2013 (104.2) (108.4) (110.7) (115.4)Sterling Bonds 2013 (40.0) (41.1) (40.0) (42.0)
The fair values are calculated by discounting future cash flows to net present values using appropriate market interest rates prevailing atthe year end. It is not possible to determine reliably the fair value of the group’s unquoted available-for-sale investments which have abook value of £8.0 million (2011 £8.0 million) as there is no active market. These are investments in a company that is in the start upphase and in an investment vehicle that invests in start up companies and so there is a wide range of possible values. Given their size itwould be overly onerous to provide additional detail.
27d Liquidity risk
The group’s and parent company’s policy on funding capacity is to ensure that they always have sufficient long term funding andcommitted bank facilities in place to meet foreseeable peak borrowing requirements. At 31st March 2012 the group and parent companyhad no borrowings under committed bank facilities (2011 £146.7 million). The group and parent company also have a number ofuncommitted facilities, including metal leases, and overdraft lines at their disposal.
Group Parent company
2012 2011 2012 2011 £ million £ million £ million £ million
Undrawn committed borrowing facilitiesExpiring within one year 120.8 94.2 120.8 94.2 Expiring in more than one year but not more than two years 131.3 68.5 131.3 68.5 Expiring in more than two years 60.0 7.0 60.0 7.0
312.1 169.7 312.1 169.7
Notes on the Accountsfor the year ended 31st March 2012

158
27 Financial risk management (continued)27d Liquidity risk (continued)
The maturity analyses for financial liabilities showing the remaining contractual undiscounted cash flows, including future interestpayments but excluding unamortised transaction costs, were:
Within 1 year 1 to 2 years 2 to 5 years After 5 years TotalGroup as at 31st March 2012 £ million £ million £ million £ million £ million
Bank overdrafts 35.8 – – – 35.8Bank and other loans – principal 56.2 198.5 219.0 83.3 557.0Bank and other loans – interest payments 29.2 22.1 28.7 15.3 95.3Finance lease obligations 0.4 0.5 1.3 0.2 2.4Financial liabilities in trade and other payables 588.8 0.8 0.5 0.4 590.5
Total non-derivative financial liabilities 710.4 221.9 249.5 99.2 1,281.0
Foreign exchange forwards, options and swaps – payments 370.8 2.2 0.7 – 373.7 Foreign exchange forwards, options and swaps – receipts (366.4) (2.2) (0.7) – (369.3)
Total derivative financial liabilities 4.4 – – – 4.4
Within 1 year 1 to 2 years 2 to 5 years After 5 years Total Group as at 31st March 2011 (restated) £ million £ million £ million £ million £ million
Bank overdrafts 24.5 – – – 24.5 Bank and other loans – principal 181.5 40.3 329.3 181.8 732.9 Bank and other loans – interest payments 29.3 27.1 53.6 25.9 135.9 Finance lease obligations 0.4 0.4 1.4 0.6 2.8 Financial liabilities in trade and other payables 570.9 0.6 0.4 0.5 572.4
Total non-derivative financial liabilities 806.6 68.4 384.7 208.8 1,468.5
Foreign exchange forwards, options and swaps – payments 518.2 0.9 0.6 – 519.7 Foreign exchange forwards, options and swaps – receipts (511.1) (1.0) (0.6) – (512.7)
Total derivative financial liabilities 7.1 (0.1) – – 7.0
Within 1 year 1 to 2 years 2 to 5 years After 5 years Total Parent company as at 31st March 2012 £ million £ million £ million £ million £ million
Bank overdrafts 65.9 – – – 65.9 Bank and other loans – principal 40.0 198.1 219.0 83.3 540.4Bank and other loans – interest payments 27.3 21.9 28.7 15.3 93.2 Finance lease obligations 0.4 0.4 1.3 0.2 2.3 Financial liabilities in trade and other payables 1,539.4 0.1 0.3 22.9 1,562.7
Total non-derivative financial liabilities 1,673.0 220.5 249.3 121.7 2,264.5
Foreign exchange forwards, options and swaps – payments 395.9 4.6 0.8 – 401.3 Foreign exchange forwards, options and swaps – receipts (391.3) (4.5) (0.7) – (396.5)
Total derivative financial liabilities 4.6 0.1 0.1 – 4.8
Within 1 year 1 to 2 years 2 to 5 years After 5 years TotalParent company as at 31st March 2011 £ million £ million £ million £ million £ million
Bank overdrafts 74.1 – – – 74.1 Bank and other loans – principal 146.5 40.0 328.9 181.8 697.2 Bank and other loans – interest payments 27.9 26.9 53.5 25.9 134.2 Finance lease obligations 0.4 0.4 1.3 0.6 2.7 Financial liabilities in trade and other payables 1,286.3 – – 0.2 1,286.5
Total non-derivative financial liabilities 1,535.2 67.3 383.7 208.5 2,194.7
Foreign exchange forwards, options and swaps – payments 527.3 3.7 0.7 – 531.7 Foreign exchange forwards, options and swaps – receipts (518.2) (3.6) (0.6) – (522.4)
Total derivative financial liabilities 9.1 0.1 0.1 – 9.3
Notes on the Accountsfor the year ended 31st March 2012
Johnson Matthey Annual Report & Accounts 2012Accounts

159
27 Financial risk management (continued)27e Credit risk
Within certain businesses, the group and parent company derive a significant proportion of their revenue from sales to major customers.Sales to individual customers are frequently high if the value of precious metals is included in the price. The failure of any such companyto honour its debts could materially impact the group’s and parent company’s results. The group and parent company derive significantbenefit from trading with their large customers and manage the risk at many levels. Each business and division has a credit committeethat regularly monitors its exposure. The Audit Committee receives a report every six months that details all significant credit limits,amounts due and amounts overdue within the group and the relevant actions being taken. At 31st March 2012 trade receivables for thegroup amounted to £690.3 million (2011 £764.2 million) (parent company £139.4 million (2011 £214.1 million)). £482.2 million (2011£516.0 million) of these receivables at group level (£103.7 million (2011 £128.2 million) at parent company level) arose in Emission ControlTechnologies (ECT) which is part of Environmental Technologies Division and mainly supplies the automotive industry including car andtruck manufacturers and component suppliers. Although ECT has a wide spread of the available customers the concentrated nature ofthis industry means that amounts owed by individual customers can be large. Other parts of the group tend to sell to a larger number ofcustomers and amounts owed tend to be lower. As at 31st March 2012 (and at 31st March 2011) for the group as a whole, no singleoutstanding balance exceeded 2% of the group’s revenue. No assets have been taken possession of as collateral.
The credit profiles of the group’s and parent company’s customers are obtained from credit rating agencies and are closely monitored.The scope of these reviews includes amounts overdue and credit limits. Generally, payments in the automotive industry and in the othermarkets in which the group operates are made promptly.
Trade receivables are considered impaired when the amount is in dispute, customers are in financial difficulty or for other reasons whichimply there is doubt over the recoverability of the debt. Trade receivables can be analysed as:
Group Parent company
2012 2011 2012 2011 £ million £ million £ million £ million
Amounts neither past due nor impaired 618.8 680.0 129.3 195.4
Amounts past due but not impairedless than 30 days 52.2 65.9 7.2 14.6 30 – 90 days 11.3 12.8 1.8 4.1 more than 90 days 8.5 5.5 1.2 0.3
Total past due but not impaired 72.0 84.2 10.2 19.0
Amounts impaired 4.8 7.2 1.1 1.5 Specific allowances for bad and doubtful debts (4.4) (6.5) (1.1) (1.3)
Carrying amount of impaired receivables 0.4 0.7 – 0.2
Other allowances for bad and doubtful debts (0.9) (0.7) (0.1) (0.5)
Trade receivables net of allowances 690.3 764.2 139.4 214.1
Movements in the allowances for impairments were:Group Parent company
2012 2011 2012 2011 £ million £ million £ million £ million
At beginning of year 7.2 7.5 1.8 2.8 Charge for year 2.9 3.9 0.7 1.3 Acquisitions – 0.1 – –Release (1.7) (3.1) (0.2) (2.2)Utilised (2.9) (1.1) (1.1) (0.1)Exchange adjustments (0.2) (0.1) – –
At end of year 5.3 7.2 1.2 1.8
Financial assets included in sundry receivables are all current and not impaired.
The credit risk on cash and deposits and derivative financial instruments is limited because the counterparties with significant balancesare banks with high credit ratings. The exposure to individual banks is monitored frequently against internally defined limits together withthe bank’s credit ratings and credit default swap prices. As at 31st March 2012, the maximum exposure with a single bank for depositswas £12.8 million (2011 £15.9 million) for the group and £12.2 million (2011 £10.7 million) for the parent company, whilst the largest markto market exposure for derivative financial instruments to a single bank was £14.3 million (2011 £11.9 million) for the group and parentcompany. The group and parent company also use money market funds to invest surplus cash thereby further diversifying credit risk andat 31st March 2012 the group’s and parent company’s exposure to these funds was £59.7 million (2011 £ nil). The amounts on depositat the year end represent the group’s and parent company’s maximum exposure to credit risk on cash and deposits.
The parent company also guarantees some of its subsidiaries’ borrowings, partly through interest netting arrangements, and preciousmetal leases and its exposure at 31st March 2012 was £26.8 million (2011 £31.1 million).
Notes on the Accountsfor the year ended 31st March 2012

160
27 Financial risk management (continued)27f Capital management
The group’s policy for managing capital is to maintain an efficient balance sheet to ensure that the group always has sufficient resourcesto be able to invest in future growth. The group has a long term target of a return on invested capital (underlying operating profit dividedby average capital employed) of over 20% to ensure focus on efficient use of the group’s capital. See the section on return on investedcapital in the Financial Review of Operations on page 44 for more information. The group also has a long term target of net debt(including post tax pension deficits) to EBITDA of between 1.5 and 2.0 times although in any given year it may fall outside this rangedepending on future plans. See the section on capital structure in the Financial Review of Operations on page 46 for more information.
Group Parent company
2012 2011 2012 2011 restated
£ million £ million £ million £ million
Net debt 454.2 639.4 529.0 749.1 Equity 1,531.8 1,403.8 1,241.6 1,205.3
Capital employed 1,986.0 2,043.2 1,770.6 1,954.4
Net debt (including post tax pension deficits) 551.2 709.4 EBITDA 576.2 489.4
Return on invested capital 22.3% 19.4%
Net debt (including post tax pension deficits) to EBITDA 1.0 times 1.4 times
28 Provisions and contingent liabilities28a Group
Warranty &Restructuring technology Other provisions provisions provisions Total
restated restated £ million £ million £ million £ million
At 1st April 2011 (restated) 47.0 22.7 14.6 84.3 Charge for year 6.6 8.2 9.4 24.2 Utilised (33.9) (2.0) (2.6) (38.5)Released (0.2) (4.3) (0.4) (4.9)Unwinding of discount – – 0.3 0.3 Exchange adjustments (1.5) (0.5) (0.6) (2.6)
At 31st March 2012 18.0 24.1 20.7 62.8
2012 2011 restated
£ million £ million
Current 34.0 60.1 Non-current 28.8 24.2
Total provisions 62.8 84.3
The restructuring provisions relate to Environmental Technologies Division and Fine Chemicals Division and are expected to be fully spentin 2012/13.
The warranty and technology provisions represent management’s best estimate of the group’s liability under warranties granted andremedial work required under technology licences, based on past experience in Environmental Technologies Division. Warrantiesgenerally cover a period of up to three years.
The other provisions include environmental, onerous leases and legal provisions arising across the group. Amounts provided reflectmanagement’s best estimate of the expenditure required to settle the obligations at the balance sheet date. They are expected to be fullyspent over the next seven years.
Notes on the Accountsfor the year ended 31st March 2012
Johnson Matthey Annual Report & Accounts 2012Accounts

161
28 Provisions and contingent liabilities (continued)28b Parent company
Restructuring Warranty Otherprovisions provisions provisions Total£ million £ million £ million £ million
At 1st April 2011 1.1 0.1 14.6 15.8 Charge for year 3.7 – 13.2 16.9 Utilised (0.8) – (1.5) (2.3)Released (0.2) (0.1) (0.4) (0.7)
At 31st March 2012 3.8 – 25.9 29.7
2012 2011 £ million £ million
Current 17.1 2.5 Non-current 12.6 13.3
Total provisions 29.7 15.8
The restructuring provisions relate to Environmental Technologies Division and are expected to be fully spent in 2012/13.
The warranty provisions represent management’s best estimate of the parent company’s liability under warranties granted, based onpast experience in Environmental Technologies Division.
The other provisions include onerous leases, legal provisions, a provision for a recharge to refund a subsidiary for its restructuring costsand provisions to buy metal to cover positions created by the parent company selling metal belonging to subsidiaries. Amounts providedreflect management’s best estimate of the expenditure required to settle the obligations at the balance sheet date.
Details of guarantees given by the parent company are disclosed in note 27e.
29 Deferred taxation29a Group
TotalProperty, Post- deferred tax plant & employment (assets) /
equipment benefits Provisions Inventories Intangibles Other liabilities £ million £ million £ million £ million £ million £ million £ million
At 1st April 2010 64.3 (64.6) (2.8) (45.8) 34.8 13.5 (0.6)(Credit) / charge to income (restated) (6.9) 3.0 (21.4) (0.5) (8.2) 21.4 (12.6)Acquisitions (restated) (note 39) 0.5 – (2.4) (0.2) 12.6 (2.7) 7.8 Tax on items taken directly to or transferred from equity – 27.9 – – – (1.9) 26.0 Exchange adjustments (1.4) 0.8 (0.1) 0.4 – (0.5) (0.8)
At 31st March 2011 (restated) 56.5 (32.9) (26.7) (46.1) 39.2 29.8 19.8 Charge / (credit) to income 13.3 4.9 9.0 8.4 (6.1) (9.8) 19.7 Tax on items taken directly to ortransferred from equity – (9.4) – – – (0.9) (10.3)Exchange adjustments (0.7) 0.1 0.6 0.1 (0.6) (0.7) (1.2)
At 31st March 2012 69.1 (37.3) (17.1) (37.6) 32.5 18.4 28.0
2012 2011 restated
£ million £ million
Deferred tax assets (25.4) (39.7)Deferred tax liabilities 53.4 59.5
28.0 19.8
Deductible temporary differences, unused tax losses and unused tax credits not recognised on the balance sheet are £72.5 million(2011 £72.8 million).
Deferred tax liabilities have not been recognised on temporary differences of £576.9 million (2011 £652.1 million) associated withinvestments in subsidiaries.
Notes on the Accountsfor the year ended 31st March 2012

162
29 Deferred taxation (continued)29b Parent company
TotalProperty, Post- deferred tax plant & employment (assets) /
equipment benefits Provisions Inventories Intangibles Other liabilities £ million £ million £ million £ million £ million £ million £ million
At 1st April 2010 24.1 (43.9) (0.3) (37.9) 1.1 7.8 (49.1)(Credit) / charge to income (3.6) 5.7 0.1 1.6 – 2.9 6.7 Tax on items taken directly to ortransferred from equity – 23.8 – – – (1.3) 22.5
At 31st March 2011 20.5 (14.4) (0.2) (36.3) 1.1 9.4 (19.9)(Credit) / charge to income (0.1) 3.6 0.2 8.4 (0.4) (2.4) 9.3 Tax on items taken directly to ortransferred from equity – (4.0) – – – 0.4 (3.6)
At 31st March 2012 20.4 (14.8) – (27.9) 0.7 7.4 (14.2)
Deductible temporary differences, unused tax losses and unused tax credits not recognised on the balance sheet are £4.0 million(2011 £4.0 million).
30 Share capitalNumber £ million
Issued and fully paid ordinary shares of £1 eachAt 1st April 2010, 31st March 2011 and 31st March 2012 220,673,613 220.7
Details of outstanding share options and allocations under the company’s long term incentive plan which have yet to mature aredisclosed in note 13.
At the last annual general meeting on 19th July 2011 shareholders approved a resolution for the company to make purchases of its ownshares up to a maximum number of 21,467,573 shares. The resolution remains valid until the conclusion of this year’s annual generalmeeting. The company will purchase its own shares when the board believes it to be in the best interests of the shareholders generallyand will result in an increase in earnings per share.
The group and parent company’s employee share ownership trust (ESOT) also buys shares on the open market and holds them in trustfor employees participating in the group’s executive share option schemes and long term incentive plan. At 31st March 2012 the ESOTheld 2,508,723 shares (2011 1,995,144 shares) which had not yet vested unconditionally in employees. Computershare Trustees (CI)Limited, as trustee for the ESOT, has waived its dividend entitlement.
The total number of treasury shares held was 5,997,877 (2011 5,997,877) at a total cost of £91.7 million (2011 £91.7 million).
31 Components of other comprehensive income2012 2011
restated £ million £ million
Cash flow hedges:Gains taken to equity 8.3 4.4 Transferred to income statement (2.2) (0.7)
6.1 3.7
Currency translation differences:Taken to equity (53.7) (8.9)
(53.7) (8.9)
Notes on the Accountsfor the year ended 31st March 2012
Johnson Matthey Annual Report & Accounts 2012Accounts

163
32 Tax effects relating to other comprehensive income2012 2011
Before tax Tax Net of tax Before tax Tax Net of tax restated restated
£ million £ million £ million £ million £ million £ million
Currency translation differences (53.7) – (53.7) (8.9) (10.3) (19.2)Cash flow hedges 6.1 (1.4) 4.7 3.7 (1.0) 2.7 Fair value gains on net investment hedges 23.7 – 23.7 2.2 9.2 11.4 Actuarial (loss) / gain on post-employment benefitsassets and liabilities (70.6) 20.1 (50.5) 85.4 (27.9) 57.5
Total other comprehensive (expense) / income (94.5) 18.7 (75.8) 82.4 (30.0) 52.4
33 Other reserves33a Group
Capital Foreign Total redemption currency Hedging other
reserve translation reserve reservesrestated restated
£ million £ million £ million £ million
At 1st April 2010 6.5 70.0 (3.1) 73.4 Cash flow hedges:Gains taken to equity – – 4.4 4.4 Transferred to income statement – – (0.7) (0.7)Fair value gains on net investment hedges – 2.2 – 2.2 Currency translation differences on foreign currency net investments andrelated loans (restated) (note 39) – (8.9) – (8.9)Tax on items taken directly to or transferred from equity – (1.1) (1.0) (2.1)
At 31st March 2011 (restated) 6.5 62.2 (0.4) 68.3 Cash flow hedges:Gains taken to equity – – 8.3 8.3 Transferred to income statement – – (2.2) (2.2)Fair value gains on net investment hedges – 23.7 – 23.7 Currency translation differences on foreign currency net investments andrelated loans – (53.7) – (53.7)Tax on items taken directly to or transferred from equity – – (1.4) (1.4)
At 31st March 2012 6.5 32.2 4.3 43.0
33b Parent companyCapital Foreign Total
redemption currency Hedging otherreserve translation reserve reserves £ million £ million £ million £ million
At 1st April 2010 6.5 (5.0) (1.3) 0.2 Cash flow hedges:Gains taken to equity – – 2.6 2.6 Transferred to income statement – – (2.0) (2.0)Currency translation differences on foreign operations – 1.2 – 1.2 Tax on items taken directly to or transferred from equity – – (0.2) (0.2)
At 31st March 2011 6.5 (3.8) (0.9) 1.8 Cash flow hedges:Gains taken to equity – – 8.5 8.5 Transferred to income statement – – (1.8) (1.8)Currency translation differences on foreign operations – (0.1) – (0.1)Tax on items taken directly to or transferred from equity – – (1.6) (1.6)
At 31st March 2012 6.5 (3.9) 4.2 6.8
Notes on the Accountsfor the year ended 31st March 2012

164
34 Gross cash flows34a Purchases of non-current assets and investments
Group Parent company
2012 2011 2012 2011 £ million £ million £ million £ million
Purchases of property, plant and equipment 137.5 119.3 33.3 27.2 Purchases of intangible assets 13.0 17.6 1.2 1.9 Purchases of available-for-sale investments 0.2 0.5 – –
150.7 137.4 34.5 29.1
34b Purchases of businessesGroup Parent company
2012 2011 2012 2011 £ million £ million £ million £ million
Purchase of businesses – 52.4 – – Cash acquired with businesses – (1.0) – – Consideration refunded for prior years’ acquisitions (1.6) – – – Consideration paid for prior years’ acquisitions 1.0 1.7 – –
(0.6) 53.1 – –
34c Net cost of ESOT transactions in own sharesGroup Parent company
2012 2011 2012 2011 £ million £ million £ million £ million
Purchase of own shares by ESOT (36.8) (16.2) (36.8) (16.2)Release of own shares by ESOT 11.1 7.1 11.1 7.1
(25.7) (9.1) (25.7) (9.1)
34d (Repayment of) / proceeds from borrowings and finance leasesGroup Parent company
2012 2011 2012 2011 restated
£ million £ million £ million £ million
Proceeds from borrowings falling due within one year 2.6 120.1 – 96.7 Repayment of borrowings falling due within one year (168.7) (109.1) (146.7) (80.9)Proceeds from borrowings falling due after more than one year – 85.5 – 85.5 Capital element of finance lease rental payments (0.3) (0.3) (0.3) (0.3)
(166.4) 96.2 (147.0) 101.0
35 Cash and cash equivalentsGroup Parent company
2012 2011 2012 2011 £ million £ million £ million £ million
Cash and deposits 139.1 118.9 78.0 23.1 Bank overdrafts (35.8) (24.5) (65.9) (74.1)
Cash and cash equivalents 103.3 94.4 12.1 (51.0)
Notes on the Accountsfor the year ended 31st March 2012
Johnson Matthey Annual Report & Accounts 2012Accounts

165
36 Precious metal operating leasesThe group leases, rather than purchases, precious metals to fund temporary peaks in metal requirements provided market conditionsallow. These leases are from banks for specified periods (typically a few months) and for which the group pays a fee. These arrangementsare classified as operating leases. The group holds sufficient precious metal inventories to meet all the obligations under these leasearrangements as they fall due. At 31st March 2012 precious metal leases were £9.1 million (2011 £93.0 million).
37 CommitmentsGroup Parent company
2012 2011 2012 2011 £ million £ million £ million £ million
Future capital expenditure contracted but not provided 20.8 15.1 1.4 2.1
Future minimum amounts payable under non-cancellable operating leasesWithin one year 17.1 12.6 2.3 1.9 From one to five years 27.9 27.0 6.9 5.9 After five years 19.4 27.6 8.7 10.7
64.4 67.2 17.9 18.5
Future minimum sublease payments expected to be received undernon-cancellable operating leases (0.3) (0.4) (0.3) –
Future minimum amounts payable under finance leasesWithin one year 0.4 0.4 0.4 0.4 From one to five years 1.8 1.8 1.7 1.7 After five years 0.2 0.6 0.2 0.6
2.4 2.8 2.3 2.7 Less future finance charges (0.3) (0.4) (0.3) (0.4)
Present value of finance lease obligations 2.1 2.4 2.0 2.3
The group and parent company lease some of its property, plant and equipment which are used by the group and parent company intheir operations, except for leases of some property which the group and parent company no longer use which are now sublet.
38 Transactions with related partiesTransactions between the parent company and its subsidiaries, which are related parties, have been eliminated on consolidation and soare only disclosed for the parent company’s accounts. Guarantees of subsidiaries’ borrowings are disclosed in note 27e.
Group Parent company
2012 2011 2012 2011 £ million £ million £ million £ million
Trading transactions with subsidiariesSale of goods – – 2,898.2 2,131.5 Purchases of goods – – 404.9 325.6 Income from service charges – – 16.2 15.5 Amounts receivable from subsidiaries – – 140.9 120.4Amounts payable to subsidiaries – – 18.6 16.4 Loans to subsidiaries – – 1,074.4 959.3Loans from subsidiaries – – 1,210.9 939.9
The group had an associate, AGR Matthey, which was dissolved on 14th September 2010. During the year ended 31st March 2011 thegroup received £3.5 million related to the final AGR Matthey distribution of residual cash.
The group’s post-employment benefits plans are related parties and the group’s and parent company’s transactions with them aredisclosed in notes 14a and 14b respectively.
The transactions with key management personnel are described in note 12c.
Notes on the Accountsfor the year ended 31st March 2012

166
39 Restatement of acquisition in the year ended 31st March 2011On 1st November 2010 the group acquired 100% of Intercat, Inc. and its subsidiaries. The fair values disclosed at 31st March 2011 wereprovisional. These have now been finalised and the balance sheet at 31st March 2011 restated.
The net assets acquired were:Estimated Revised fair value fair value Measurementat time of at time of periodacquisition acquisition adjustments£ million £ million £ million
Property, plant and equipment 11.5 11.5 –Intangible assets – patents, trademarks and licences 10.1 8.5 (1.6)Intangible assets – customer contracts and relationships 17.7 20.5 2.8 Intangible assets – acquired research and technology 2.8 2.8 –Inventories 5.8 5.8 –Trade and other receivables 5.4 5.2 (0.2)Cash and cash equivalents 1.0 1.0 –Current other borrowings (21.5) (20.5) 1.0 Trade and other payables (10.6) (11.0) (0.4)Current income tax liabilities (1.4) (1.8) (0.4)Deferred income tax liabilities (8.0) (7.6) 0.4 Provisions – (1.9) (1.9)
Total net assets acquired 12.8 12.5 (0.3)Goodwill on acquisition 20.2 19.4 (0.8)
Total consideration 33.0 31.9 (1.1)
As a result of these changes the amortisation of acquired intangibles for the year ended 31st March 2011 increased by £1.3 million to£14.5 million and the income tax expense decreased by £0.5 million to £75.5 million. Also the currency translation loss in othercomprehensive income increased by £1.0 million to £8.9 million.
40 Discontinued operationsOn 28th February 2007 the group sold its Ceramics Division. During the year ended 31st March 2011 further costs of £1.9 million wereprovided in respect of environmental warranty claims.
41 Key sources of estimation uncertaintyDetermining the carrying amounts of some assets and liabilities requires estimation of the effects of uncertain future events on thoseassets and liabilities at the balance sheet date. The group and parent company have made appropriate estimates when applying theaccounting policies, but the actual outcome may differ from those calculated.
The key sources of estimation uncertainty at the balance sheet date which have a significant risk of causing a material adjustment to thecarrying amounts of assets and liabilities within the next financial year are:
Post-employment benefits
The group’s and parent company’s defined benefit plans are assessed annually by qualified independent actuaries. The details of theplans and assumptions used are described in note 14.
Goodwill
The group has capitalised goodwill of £519.5 million and the parent company has £110.5 million. Annual impairment reviews areperformed which require various assumptions. More details are given in note 16.
Other intangible assets
Other intangible assets which are not yet being amortised are also subject to annual impairment reviews based on discounted cash flowprojections. More details are given in note 17.
Notes on the Accountsfor the year ended 31st March 2012
Johnson Matthey Annual Report & Accounts 2012Accounts

41 Key sources of estimation uncertainty (continued)Provisions and contingent liabilities
As described in note 28 and the accounting policies, the group and parent company measure provisions and contingent liabilities atmanagement’s best estimate of the expenditure required to settle the obligations at the balance sheet date.
Taxation
The tax payable on profits is determined based on tax laws and regulations that apply in each of the numerous jurisdictions in which thegroup operates. Where the precise impact of these laws and regulations is unclear then reasonable estimates may be used to determinethe tax charge included in the accounts. If the tax eventually payable or reclaimable differs from the amounts originally estimated then thedifference will be charged or credited in the accounts for the year in which it is determined.
Refining process and stock takes
The group’s and parent company’s refining and fabrication businesses process significant quantities of precious metal and, similar tomany industrial activities, losses may arise during processing. The extent of such losses depends on many factors, including the nature ofmaterial being refined, the specific refining processes applied and the processes’ efficiency. Judgment is therefore required in estimatingthe amount of such losses when setting process loss provisions. In addition stock takes, particularly at the refining businesses, involveestimation of volumes in the refining system and the subsequent assaying of material to assess the precious metal content. In addition,the results of assaying and therefore the stock take itself are only available some time after the date of the stock take. In setting processloss provisions and assessing the stock take results management takes account of past experience, ability to extract precious metalsfrom the refining process and other factors when estimating losses and gains.
42 Principal subsidiariesThe group’s principal subsidiaries at 31st March 2012 are set out below. Those held directly by the parent company are marked with anasterisk (*). All the companies are wholly owned unless otherwise stated. All the subsidiaries are involved in the principal activities of thegroup. A full list of the group’s subsidiaries will be attached to the parent company’s annual return to be filed with the Registrar ofCompanies.
Country of Country ofincorporation incorporation
Europe AsiaS.A. Johnson Matthey N.V. Belgium Johnson Matthey (Shanghai) Catalysts Co., Ltd China
* Avocado Research Chemicals Limited England Johnson Matthey (Shanghai) Chemicals Limited China* Davy Process Technology Limited England Johnson Matthey Pacific Limited Hong Kong* Johnson Matthey Fuel Cells Limited (82.5%) England Johnson Matthey India Private Limited India* Tracerco Limited England Johnson Matthey Chemicals India Private Limited IndiaJohnson Matthey SAS France Johnson Matthey Japan, Inc. USAAlfa Aesar GmbH & Co KG Germany * Johnson Matthey Sdn. Bhd. (92%) MalaysiaJohnson Matthey Catalysts (Germany) GmbH Germany Johnson Matthey Catalysts Korea Limited South KoreaJohnson Matthey GmbH GermanyJohnson Matthey DOOEL Skopje MacedoniaJohnson Matthey BV NetherlandsMacfarlan Smith Limited ScotlandJohnson Matthey AB Sweden AfricaJohnson Matthey & Brandenberger AG Switzerland Johnson Matthey (Proprietary) Limited South Africa
AustralasiaJohnson Matthey (Aust) Ltd Australia
North America South AmericaThe Argent Insurance Co. Limited Bermuda * Johnson Matthey Argentina S.A. ArgentinaJohnson Matthey Limited CanadaJohnson Matthey de Mexico, S.A. de C.V. MexicoJohnson Matthey Inc. USAJohnson Matthey Catalog Company Inc. USAJohnson Matthey Fuel Cells, Inc. (82.5%) USAJohnson Matthey Pharmaceutical Materials, Inc. USAIntercat, Inc. USA
167
Notes on the Accountsfor the year ended 31st March 2012

Shareholdings,summaries,the glossaryand index
Johnson Matthey Annual Report & Accounts 2012Other Information
168

Contents
170 Five Year Record – Financial Data171 Five Year Record – Non-Financial Data172 Basis of Reporting – Non-Financial Data173 Verification and Assurance –
Non-Financial Data174 Shareholder Information176 Global Reporting Initiative (GRI) Summary177 Glossary of Terms178 Index179 Financial Calendar 2012/13180 Company Details
Other InformationThis section contains the assurance statement on our non-financial data and a checklist against theGlobal Reporting Initiative. It also provides further information for shareholders, a glossary and anindex to help the reader locate information in the relevant sections.
. Our platinum group metals trading team sources metalfor Johnson Matthey’s businesses and their customers.
. Johnson Matthey is the market leader inplatinum group metal fabricated products forindustrial applications.
. We manufacture precious metal componentsused in medical devices for maintainingcardiovascular health.
> Managing Metals forOur Businesses andOur CustomersAround 70% of Johnson Matthey productsand businesses involve platinum group metals(pgms) and so the sourcing of them is a vitalservice to our businesses and their customers.Our pgm trading team within our PreciousMetals Marketing and Distribution businessfulfills a key strategic function for the group,acting rather like a pgm ‘treasury’. It looks afterthe group’s metal, ensuring we remain fullyhedged at all times, eliminating exposure tofluctuations in pgm prices. It also plays acrucial role in optimising the group’s metalstocks making sure we have the right amountof the right type of metal in the right form,ready for our manufacturing units to makeproducts to meet their customer orders.
The team also manages metal on behalfof our customers who may choose to deposittheir own metal with us, either to fund theirorders or following refining. It also sells pgmsto internal and external customers and, as aresult, is the world’s largest supplier of pgmsfor physical use.
Delivering Value

2008 2009 2010 2011 2012 £ million £ million £ million £ million £ million
Revenue 7,498.7 7,847.8 7,839.4 9,984.8 12,023.2
Sales excluding the value of precious metals 1,750.2 1,796.9 1,885.5 2,280.3 2,678.6
EBITDA 374.1 398.1 382.7 489.4 576.2 Depreciation (68.3) (88.7) (97.3) (108.3) (108.5)Amortisation (9.0) (10.9) (13.6) (14.9) (17.6)
Underlying operating profit 296.8 298.5 271.8 366.2 450.1Net finance costs (30.3) (32.6) (19.4) (20.7) (24.1)Share of (loss) / profit of associate (1.1) 2.0 1.7 – –
Underlying profit before tax 265.4 267.9 254.1 345.5 426.0Amortisation of acquired intangibles (3.1) (9.1) (9.9) (14.5) (16.7)Major impairment and restructuring charges – (9.4) (11.3) (71.8) –Dissolution of associate – – (4.4) 0.1 –
Profit before tax 262.3 249.4 228.5 259.3 409.3Income tax expense (77.2) (76.7) (64.3) (75.5) (93.9)
Profit after taxation 185.1 172.7 164.2 183.8 315.4Profit / (loss) for the year from discontinued operations 0.3 1.2 – (1.9) – Non-controlling interests 0.8 0.2 – (0.4) 0.5
Profit attributable to owners of the parent company 186.2 174.1 164.2 181.5 315.9
Underlying earnings per ordinary share 89.5p 89.6p 86.4p 119.0p 153.7p
Earnings per ordinary share 88.5p 82.6p 77.6p 85.2p 148.7p
Dividend per ordinary share 36.6p 37.1p 39.0p 46.0p 55.0p
Summary Balance SheetAssets employed:Goodwill 480.4 516.0 513.8 528.7 519.5Property, plant and equipment / other intangible assets 827.9 1,060.5 1,053.2 1,060.6 1,037.3Non-current investments / associates 8.9 12.1 10.9 8.0 8.0Inventories 380.4 371.7 390.1 556.3 630.8Receivables / current investments / tax assets / financial assets 712.4 585.9 718.9 952.2 898.6Payables / provisions / tax liabilities / financial liabilities (655.7) (684.1) (717.0) (932.2) (938.8)Post-employment benefits net assets / employee benefit obligations 16.4 (151.6) (245.7) (130.4) (169.4)
1,770.7 1,710.5 1,724.2 2,043.2 1,986.0
Financed by:Net debt 610.4 534.4 473.4 639.4 454.2 Retained earnings 879.1 849.6 837.7 1,001.2 1,169.6Share capital, share premium, shares held in ESOTs and other reserves 279.8 325.7 411.7 401.5 361.8 Non-controlling interest 1.4 0.8 1.4 1.1 0.4
Capital employed 1,770.7 1,710.5 1,724.2 2,043.2 1,986.0
Return on invested capital 18.5% 17.1% 15.8% 19.4% 22.3%(Underlying operating profit / average capital employed)
2011 has been restated for the changes to Intercat, Inc.’s fair values. In 2009, the balance sheet for 2008 was restated for the changes toArgillon Group’s fair value at acquisition and goodwill on acquisition.
Five Year Record – Financial Data
Johnson Matthey Annual Report & Accounts 2012Other Information
170

Five Year Record – Non-Financial Data
171
20071 2009 2 2010 2 2011 2 2012 2
SocialAverage employee numbers 8,013 8,742 8,575 9,388 9,914Total employee turnover3 % 9.9 12.7 10.0 8.5 11.7Voluntary employee turnover3 % 7.6 6.4 5.4 5.6 6.4Employee gender (female) % 224 225 215 225 225
New recruits gender (female) % 25 29 25 23 25Trade union representation % 34 34 33 38 35Training days per employee 3.9 2.6 2.3 2.6 3.1Training spend per employee6 £ 327 346 291 390 335Internal promotions % of all recruitment in year 29 38 35 33 35Attendance days lost per employee 5.2 5.3 5.2 5.2 5.0Sickness absence rate % 2.1 2.2 2.1 2.1 2.0Charitable donations £ thousands 4152 495 458 517 645
Health and SafetyGreater than three day accidents per 1,000 employees 3.04 5.09 2.48 2.997 2.07Total lost time accidents 78 95 607 747 55Total accident rate per 1,000 employees 9.36 10.83 7.11 7.897 5.69Total lost time accident incident rate per 100,000 hours worked 0.50 0.53 0.36 0.407 0.28Total days lost per 1,000 employees 85 124 64 102 90Occupational illness cases per 1,000 employees 5.8 5.5 5.2 3.5 3.5
EnvironmentEnergy consumption thousands GJ 3,787 4,070 4,001 4,749 4,726Total global warming potential thousands tonnes CO2 equivalent 390 372 377 415 417Total acid gas emissions tonnes SO2 equivalent 416 334 335 318 444Total NOx emissions tonnes 448 439 434 393 566Total SO2 emissions tonnes 31.8 25.8 31.0 43.0 47.5Total VOC emissions tonnes 207.1 209.1 180.8 185.7 189.8Total waste tonnes 98,764 96,287 90,308 113,671 120,363Total waste to landfill tonnes 20,977 5,535 5,071 6,165 10,708Packaging waste recycled – steel tonnes * 2,084 1,863 1,847 2,314Packaging waste recycled – paper tonnes * 486 250 258 704Packaging waste recycled – plastic tonnes * 648 396 439 1,148Packaging waste recycled – wood tonnes * 1,811 828 896 3,003Water consumption thousands m3 2,048 1,951 1,750 2,076 2,201Emissions to water tonnes 360 376 236 251 260
1 Calendar year (unless otherwise stated).
2 Financial year (unless otherwise stated).
3 Calculated by reference to the total number of leavers during the year expressed as a percentage of the average number of people employed during the year. Does not include agencyworkers not directly employed by Johnson Matthey.
4 At 31st December.
5 At 31st March.
6 Does not include the cost of in house training or the cost of employees’ wages during training.
7 Restated.
* Not measured.

Johnson Matthey Annual Report & Accounts 2012Other Information
172
Basis of Reporting – Non-Financial Data
Johnson Matthey has adopted a frameworkbased upon the GRI G3 sustainabilityreporting guidelines and applied them inan appropriate context to the group byexamination of the definition, explanationnotes and self diagnosis tests to ensure acomprehensive, accurate and completeaccount when assessed against thereporting criteria. In addition, feedbackreceived on the 2010/11 SustainabilityReport, recommendations on that reportarising from the assurance process and awell structured management approachearly in 2012 have shaped the reportingof non-financial content and context. Dueconsideration has been given to newinternational standards such as theInternational Organization forStandardization’s voluntary standard on‘social responsibility’, ISO 26000.
This report has been developed toincorporate the group’s significant economic,environmental and social impacts and setwithin the context of the United NationsBrundtland definition of sustainability (1987)and our own Sustainability 2017 goals.Understanding the relevance of local, national,regional and global issues, regulation andlegislation is taken into account whenconsidering reporting. The AA1000ASprinciples of inclusivity, materiality andresponsiveness are central to the structureof the report and in setting priorities forreporting.
There are no limitations on the scopeor boundary of the non-financial data in thisreport. The non-financial informationpresented covers the sustainability activitiesand performance of Johnson Matthey’sglobal operations and includes the parentcompany and its subsidiaries (as listed onpage 167). Environmental performancedata covers manufacturing, research andwarehousing operations of the parentcompany and its subsidiaries (andenvironmental performance data from newfacilities is included from the point at whichthe facility is fully operational). The reportalso explains how we are continuing to buildsustainability into our business planning anddecision making processes and how throughour governance processes, we managesocial, environmental and ethical mattersacross the group.
Data measurement techniques, includingcalculations for social, environmental andhealth and safety performance, have usedinternationally recognised protocols suchas the greenhouse gas protocol and theGRI indicator protocols as appropriate.Any exceptions are noted.
All non-financial performance data isreported on a financial year basis unlessotherwise stated. Where necessary datahas been restated, for example to reflectchanges in the business (e.g. divestmentsand site closures), to take account of changesin best practice methodologies for reporting,changes in calculating emissions or inresponse to recommendations made byour assurance provider. For employee data,percentage calculations are made in relationto the number of permanent employees inthe group (unless otherwise stated).
Global warming potential (GWP) intonnes of carbon dioxide (CO2) equivalentincludes Scope 1 and Scope 2 emissions.We report greenhouse gas emissions fromprocess and energy use and convert thetotal group energy use to tonnes CO2equivalent using national and regionalconversion factors for each emissionssource as appropriate.
Certain employee data is included inthe accounts which is subject to externalaudit. The group’s other social, health andsafety and environmental data is collectedannually at a group level. The data iscollated through five questionnaires basedon the requirements of the Global ReportingInitiative third generation (GRI G3) guidelines.It is completed by businesses and signedoff by the general manager for each globaloperation. The reported site level data is acombination of actual measurement andestimates. The processes in place tointernally verify the reported data aredescribed in the Verification and Assurancesection on page 173.
Accident Calculation DefinitionsJohnson Matthey’s definition of an accidentfor the purposes of this report is any acuteunplanned event that causes harm toindividuals, making them unable to attendwork on days after the date of the event.Accidents are further subdivided intoaccidents that result in more than threedays’ work lost and those that cause threeor less days to be lost. Accident incidencerates are calculated based on the rate ofthese accidents per 1,000 employees.
The following metrics are used in this report:
Incidence rate for all lost time accidentsin the year = (number of greater than threeday accidents in the year + number of threeday or less accidents in the year) x 1,000 ÷(average number of employees in the year).
Incidence rate for greater than three dayaccidents in the year = (number of greaterthan three day accidents in the year) x 1,000÷ (average number of employees in the year).
Lost work days per 1,000 employees peryear = (total lost work days in year) x 1,000÷ (average number of employees in the year).
Frequency rate for all lost time accidentsin the year = (number of greater than threeday accidents in the year + number of threeday or less accidents in the year) x 100,000÷ (number of hours worked in the year).

173
Verification and Assurance – Non-Financial Data
AssuranceJohnson Matthey commissioned CorporateCitizenship to provide external assuranceand commentary on the company’ssustainability reporting, comprising thenon-financial aspects of this year’s annualreport and related content on the company’swebsite. Johnson Matthey has chosen touse the AA1000 assurance standard,AA1000AS (2008), as the reference standardfor this year’s assurance.
Corporate Citizenship has evaluatedthe nature and extent of adherence to theAA1000AS principles of inclusivity, materialityand responsiveness, as well as the qualityof Johnson Matthey’s sustainabilityperformance reporting. The criteria used toassure the sustainability performance datawere the GRI G3 Principles for DefiningReport Quality and the Greenhouse GasProtocol Corporate Accounting andReporting Standard (Revised Edition) forgreenhouse gas reporting.
Based on the work undertaken,Corporate Citizenship has concluded thatJohnson Matthey’s sustainability reporting,as outlined above, reflects the principles ofAA1000 (2008): inclusivity, materiality andresponsiveness. A full version of CorporateCitizenship’s AA1000 Assurance Statement,which includes opinions on JohnsonMatthey’s adherence to each AA1000ASprinciple, as well as detailed assurancecommentary, is available online atwww.matthey.com/AR12.
Corporate Citizenship
London31st May 2012
www.corporate-citizenship.com
VerificationThe board reviews corporate socialresponsibility issues as part of its riskmanagement process. The board believesthat the measures taken to review the non-financial information provide a suitablelevel of confidence.
Certain human resources data formspart of Johnson Matthey’s accounts whichare subject to external audit. Other humanresources data, community investmentdata and information relating to charitabledonations is reviewed and verified byinternal experts.
Health and safety data is reviewed bygroup health and safety experts and as partof the group environment, health and safety(EHS) audit programme. Environmental datais reviewed by group environmental expertsand as part of the group EHS auditprogramme.
All data is reviewed by internalsustainability experts and at appropriatelevels of management up to and includingthe Chief Executive’s Committee.
Johnson Matthey utilises externalspecialists on specific sustainability issues.Over the past year this has included externalaudits or reviews of people managementsystems, health and safety (OHSAS 18001)and environmental management systems(ISO 14001).

Johnson Matthey Annual Report & Accounts 2012Other Information
174
Pension Funds18.4%
Investment and Unit Trusts
40.0%
Custodians2.2%
Individuals5.6%
InsuranceCompanies
5.8%
Treasury Sharesand Employee
Share Schemes5.6%
Sovereign Wealth Funds
4.8%
Charities1.3%
Other16.3%
Shareholder Information
Johnson Matthey Share Price as at 31st March2007 2008 2009 2010 2011 2012
1,576p 2,005p 1,053p 1,746p 1,860p 2,359p
Analysis of Ordinary Shareholders as at 30th April 2012By location Number of shares Percentage
UK and Eire 137,068,645 62.1USA and Canada 41,367,358 18.8Continental Europe 14,413,317 6.5Asia Pacific 5,661,015 2.6Rest of World 6,234,586 2.8Unidentified 15,928,692 7.2
Total 220,673,613 100.0
By category Number of shares Percentage
Investment and Unit Trusts 88,209,841 40.0Pension Funds 40,531,222 18.4Individuals 12,413,466 5.6Custodians 4,901,473 2.2Insurance Companies 12,725,066 5.8Treasury Shares and Employee Share Schemes 12,360,631 5.6Sovereign Wealth Funds 10,581,533 4.8Charities 2,919,122 1.3Other 36,031,259 16.3
Total 220,673,613 100.0
By size of holding Number of holdings Percentage Number of shares Percentage
1 – 1,000 7,660 73.8 2,828,568 1.31,001 – 10,000 2,038 19.7 5,185,109 2.410,001 – 100,000 429 4.1 14,612,223 6.6100,001 – 1,000,000 211 2.0 64,944,375 29.41,000,001 – 5,000,000 30 0.3 62,314,276 28.25,000,001 and over 8 0.1 70,789,062 32.1
10,376 100.0 220,673,613 100.0
Johnson Matthey FTSE 100
March 2007 March 2008 March 2009 March 2010 March 2011 March 2012
20
40
60
80
100
120
140
160
UK and Eire62.1%
USA andCanada18.8%
ContinentalEurope6.5%
AsiaPacific2.6%
Rest ofWorld2.8%
Unidentified7.2%
By Location
By Category
10,001–100,0006.6%
1,001–10,0002.4%1–1,000
1.3%
100,001–1,000,000
29.4%
1,000,001 – 5,000,00028.2%
5,000,001and over32.1%
By Size of Holding
Johnson Matthey Share Price Five Year Performance versus FTSE 100

175
Share Dealing ServicesA telephone and internet dealing service for UK shareholders isprovided by the company’s registrars, Equiniti. For further information,including Equiniti’s terms and conditions and details of their fees,log on to www.shareview.co.uk/dealing or call 08456 037 037.
Dividend History – Pence per Share2008 2009 2010 2011 2012
Interim 10.6 11.1 11.1 12.5 15.0Final 26.0 26.0 27.9 33.5 40.0
Total 36.6 37.1 39.0 46.0 55.0
Dividend PolicyIt is Johnson Matthey’s policy to grow ordinary dividends over time,broadly in line with underlying earnings per share while maintainingdividend cover at about two and a half times to ensure sufficientfunds are retained to support organic growth. Over the last five yearsfrom 2007/08, underlying earnings per share have grown at acompound annual growth rate of 14.5% p.a. The board is proposinga final dividend for 2011/12 of 40.0 pence to take the total for theyear to 55.0 pence, which is 20% up. The dividend will be covered2.8 times by underlying earnings.
Dividend Payments and DRIPDividends can be paid directly into shareholders’ bank or buildingsociety accounts. Shareholders wishing to take advantage of thisfacility should contact the company’s registrars, Equiniti, or completethe dividend mandate form attached to their dividend cheque.A Dividend Reinvestment Plan (DRIP) is also available which allows shareholders to purchase additional shares in the company.Further information can be obtained from Equiniti, Aspect House,Spencer Road, Lancing, West Sussex BN99 6DA. Telephone0871 384 2268*. They can also be contacted via their websiteat www.shareview.co.uk.
American Depositary ReceiptsJohnson Matthey has a sponsored Level 1 American DepositaryReceipt (ADR) programme which BNY Mellon administers andfor which it acts as Depositary. Each ADR represents twoJohnson Matthey ordinary shares. The ADRs trade on the USover-the-counter (OTC) market under the symbol JMPLY. Whendividends are paid to shareholders, the Depositary converts suchdividends into US dollars, net of fees and expenses, and distributesthe net amount to ADR holders. For enquiries, BNY Mellon can becontacted on 1-888-BNY-ADRS (1-888-269-2377) toll free if youare calling from within the United States. Alternatively, they can becontacted by e-mail at [email protected] or via theirwebsite at adrbnymellon.com.
Share Price and Group InformationInformation on the company’s current share price together withcopies of the group’s annual and half-yearly reports and majorpresentations to analysts and institutional shareholders are availableon the Johnson Matthey website: www.matthey.com.
The website’s Investor Relations section contains extensiveinformation and a number of tools which will be of assistance toinvestors including historic share price information downloads and ashare price charting facility.
For capital gains tax purposes the mid-market price of thecompany’s ordinary shares on 31st March 1982 was 253 pence.
EnquiriesShareholders who wish to contact Johnson Matthey Plc on anymatter relating to their shareholding are invited to contact thecompany’s registrars, Equiniti, Aspect House, Spencer Road,Lancing, West Sussex BN99 6DA. Telephone 0871 384 2344*or via their website www.shareview.co.uk.
Shareholders may also telephone the company on 020 7269 8400or write to:
The Company SecretaryJohnson Matthey Plc5th Floor25 Farringdon StreetLondonEC4A 4AB
For other enquiries shareholders may contact the Director, InvestorRelations and Corporate Communications at the above address andtelephone number.
* Calls to these numbers are charged at 8p per minute from a BT landline. Other telephonyproviders’ costs may vary. Lines are open 8.30am to 5.30pm Monday to Friday.
Shareholder Information

Johnson Matthey Annual Report & Accounts 2012Other Information
176
Global Reporting Initiative (GRI) Summary
This summary outlines where to find information in this report on the GRI core and additional indicators and topics relevant to the InternationalOrganization for Standardization (ISO) standard on social responsibility (ISO 26000) standard core subject areas. The complete GRI Index canbe found online at www.matthey.com/AR12.
ISO 26000 Standard Core Subject Areas GRI Indicator Subject Page
Strategy and Profile1.1 Chief Executive’s Statement 6-71.2 Key impacts, risks and opportunities 13-15, 20-23, 79-812.1 – 2.10 Organisational profile inner flap, 10, 26-42, 52, 102,
123, 166-167, 174, 1803.1 – 3.4 Report parameters 172, 1803.5 – 3.13 Report scope, boundary and assurance 20-23, 50, 79-81, 127-130,
172-173, 176
Organisational governance 4.1 – 4.10 Corporate governance 16-17, 50, 78-1174.11 – 4.13 Commitments to external initiatives 58, 60-61, 67, 804.14 – 4.17 Stakeholder engagement 48-59
Economic PerformanceManagement approach 12-15EC1 Direct economic value generated and distributed 16-17, 24-47, 58,
104, 136-138EC2 Financial implications due to climate change 13, 22-23, 29, 38, 45, 68EC3 Coverage of the organisation’s defined benefit
plan obligations 140-147EC4 Significant financial assistance received from government 104EC8 Development and impact of infrastructure investments
and services provided primarily for public benefit 56-58
Environmental PerformanceThe environment Management approach 70-75
EN3, EN4 Energy 71EN8 Water 73-75EN16, EN17, EN20 Emissions 71-73EN21 Wastewater 73-74EN22 Waste 72-74EN23 Significant spills 74EN24 Hazardous waste 72EN28 Compliance 71
Social Performance – Labour PracticesLabour practices Management approach 50-56, 62-64, 80-81
LA1, LA2, LA4 Employment 52-56LA7 Occupational health and safety 53, 62-64LA10 Training and education 53-55
Social Performance – Human RightsHuman rights Management approach 81
HR1 Significant investment agreements 80HR6, HR7 Child labour, forced labour, compulsory labour 80HR11 Grievances addressed and resolved 80
Social Performance – SocietyFair operating practices / Management approach 50, 56, 81community involvement SO1 Community 56-59and development SO2, SO3 Corruption 20-23, 80, 97-98
SO6 Political contributions 104
Social Performance – Product ResponsibilityConsumer (customer) issues Management approach 64-66
PR1 Customer health and safety 64-66PR2, PR4, PR9 Compliance 65
Johnson Matthey continues to develop sustainability metrics and reporting criteria in alignment with those developed by the GlobalReporting Initiative (GRI). More information on the GRI Reporting Framework can be found at www.globalreporting.org.
This report has been prepared according to the latest version of the GRI Sustainability Reporting Guidelines (G3.1) and has beenreviewed by Corporate Citizenship as part of the external assurance process in which they used the AA1000AS assurance standards asdescribed on page 173. This third party assurance of the report and disclosures allows Johnson Matthey to self declare a GRI B+ level.

177
HSRG Health Science Research Group
IAS International Accounting Standard
IASB International Accounting Standards Board
ICCA International Council of Chemical Associations
IFRIC International Financial Reporting InterpretationsCommittee
IFRS International Financial Reporting Standards
Interest cover Underlying operating profit / net finance costs
IP Intellectual property
IPA International Platinum Group Metals Association
ISO 14000 Internationally recognised series of standardswhich specify the requirements for anenvironmental management system
ISO 26000 International standard giving guidelines onsocial responsibility
ISO 9000 Internationally recognised series of standardswhich specify the requirements for a qualitymanagement system
JMEPS Johnson Matthey Employees Pension Scheme
KPI Key performance indicator
LBG London Benchmarking Group
LCA Life cycle assessment
LTIP Long term incentive plan
MDRC Management Development and RemunerationCommittee
MEA Membrane electrode assembly
N2O Nitrous oxide
NGO Non-governmental organisation
NOx Oxides of nitrogen
OEM Original equipment manufacturer
PBT Profit before tax
Pgm Platinum group metal
PMPD Precious Metal Products Division
PRM Process risk management
R&D Research and development
REACH Registration, Evaluation and Authorisation ofChemicals. EU chemical control legislationwhich came into force in June 2007
ROIC Return on invested capital
RPI Retail price index
SAICM Strategic Approach to International ChemicalsManagement
SCR Selective catalytic reduction
SERP Supplemental Executive Retirement Plan
SIC Standing Interpretations Committee
SIP Share incentive plan
SNG Substitute natural gas
SO2 Sulphur dioxide
SSNMR Solid state nuclear magnetic resonance, aspectroscopy technique
Syngas, synthesis gas A mixture of hydrogen and carbon oxides
The Code The UK Corporate Governance Code, issued bythe Financial Reporting Council in June 2010
TSCA Toxic Substances Control Act
UK CLG Prince of Wales’s Corporate Leaders Group
VCM Vinyl chloride monomer
VOC Volatile organic compound
Glossary of Terms
AA1000AS An assurance standard for sustainability andcorporate responsibility reporting
ABI Association of British Insurers
ADDERALL XR® An extended release product used in thetreatment of Attention Deficit HyperactivityDisorder
ADHD Attention deficit hyperactivity disorder
ADR American Depositary Receipt
AGM Annual general meeting
Alfa Aesar Brand name of Johnson Matthey’s ResearchChemicals business
AMOG Ammonia, Methanol, Oil and Gas
APB Auditing Practices Board
API Active pharmaceutical ingredient
Bitrex® The world’s bitterest substance which is addedto household cleaning products to preventaccidental swallowing
CEC Chief Executive’s Committee
CGU Cash-generating unit
CHP Combined heat and power
CIA Chemical Industries Association
CO2 Carbon dioxide
COD Chemical oxygen demand
CPI Consumer price index
CRC UK government’s Carbon Reduction Commitment
CSR Corporate social responsibility
DPF Diesel particulate filter
DPT Davy Process Technology
DRIP Dividend Reinvestment Plan
EBITDA Earnings before interest, tax, depreciation andamortisation
ECT Emission Control Technologies
EHS Environment, health and safety
EIB European Investment Bank
EPS Earnings per share
ERT Electrical resistance tomography
ESOT Employee Share Ownership Trust
ETF Exchange Traded Fund
EU European Union
EU ETS European Union Emission Trading Scheme
FRC Financial Reporting Council
FSA’s DTR The UK Financial Services Authority’s Disclosureand Transparency Rules
Fuel cell Technology which converts hydrogen or otherfuels (methanol, natural gas) into clean electricity
GHS Globally Harmonised System of Classificationand Labelling of Chemicals
GRI Global Reporting Initiative
Group Control The group’s compendium of policies, procedures Manual and rules which is distributed to all group
operations
GTL Gas to liquids, multi stage catalytic processused to convert, for example, stranded naturalgas into sulphur free hydrocarbons, includingdiesel fuel
GWP Global warming potential
HDD Heavy duty diesel
HR Human resources

Johnson Matthey Annual Report & Accounts 2012Other Information
178
Index
Page
Group Performance Review 16-17Group Strategy 12-15Guarantees (note 27) 159Health and Safety 60-67Human resources policies 81Income statement 122Intangible assets (note 17) 151-152Inventories (notes 6, 20) 134, 153Investments in available-for-sale assets (note 19) 152Johnson Matthey at a Glance inner flapJohnson Matthey – our business 10-11Key management personnel (note 12) 138Key Performance Indicators 18-19Key sources of estimation uncertainty (note 41) 166-167Liquidity and Going Concern 47Long term contracts (note 23) 154Major impairment and restructuring charges (note 3) 133Net debt (note 24) 154Nomination Committee Report 105Non-controlling interests 125Operating leases (note 6, 36, 37) 134, 165Operating profit (note 6) 134Other reserves (note 33) 163Outlook 9Payables (note 22) 153Pensions and other post-employment benefits (and note 14) 45, 140-147Performance Highlights inner coverPrecious metal operating leases (note 36) 165Precious Metal Products Division 34-39Property, plant and equipment (note 15) 148-149Provisions (note 28) 160-161Receivables (note 21) 153Related parties (note 38) 165Remuneration Report 108-117Research and development (and note 6) 14-15, 134Responsibility of Directors 120Restatement of acquisition (note 39) 166Return on invested capital 44Revenue analysis (note 2) 133Risks and Uncertainties 20-23Segmental information (note 1) 131-133Share-based payments (note 13) 138-139Share capital (note 30) 162Shareholder Information 174-175Social performance 48-59 Stakeholder engagement 50-51Standards adopted in year 130Standards not yet applied 130Statement of changes in equity 125-126Statutory information 100-104Subsidiaries (notes 18, 42) 152, 167Supply chain management 80Sustainability 13-15, 17, 79-81Taxation (and notes 9, 29) 44-45, 135, 161-162Treasury Policies 47Verification and Assurance – Non-Financial Data 173
Page
Accounting Policies 127-130Amortisation of acquired intangibles (note 4) 133Assurance – non-financial data 173Audit Committee Report 106-107Audit fees (note 5) 134Auditor’s report 121Balance sheets 123Basis of Reporting – Non-Financial Data 172Board of Directors 82-83Borrowings (note 24) 154Business integrity and ethics 80Business Review inner cover-75Capital expenditure by segment (note 1) 131-132Capital expenditure to depreciation 45Capital structure and management (and note 27f) 46, 160Cash and cash equivalents (note 35) 164Cash flow hedges transferred to income (note 6) 134Cash flow statements (and note 34) 45, 124, 164Chairman’s Statement 6-7Chief Executive’s Statement 8-9Corporate Governance Code Compliance 85Commitments (note 37) 165Community investment and charitable programmes 56-58Company Details 180Comprehensive income (and notes 31, 32) 122, 162-163Contingent liabilities (note 28) 160-161Corporate Governance Report 84-99Deferred tax (notes 9, 29) 135, 161-162Depreciation and amortisation (note 6) 134Directors’ report inner cover-117Discontinued operations (note 40) 166Dividends (and note 10) 45, 136Earnings per ordinary share (and note 11) 45, 136-137Employee numbers and expense (note 12) 137Employee share ownership trust (ESOT) (note 30) 162Employment policies 81Environmental Technologies Division 26-33Environment 68-75Environment, health and safety policies and systems 80-81Equity 125-126Finance costs / income (notes 7, 8) 135Finance leases (notes 24, 37) 154, 165Financial assets (note 25) 155Financial Calendar 179Financial liabilities (note 26) 155Financial Review 43-46Financial Review of Operations 26-42Financial risk management (and note 27) 47, 155-160Fine Chemicals Division 40-42Five Year Record – Financial Data 170Five Year Record – Non-Financial Data 171Foreign exchange gains and losses (note 6) 134Global Reporting Initiative (GRI) Summary 176Glossary of Terms 177Going Concern 47Goodwill (note 16) 150-151Governance 76-117Grants (note 6) 134

179
Financial Calendar 2012/13
2013 (provisional)
5th February
Payment of interim dividend
6th June
Announcement of results for the year ending 31st March 2013
12th June
Ex dividend date
14th June
Final dividend record date
25th July
122nd AGM
6th August
Payment of final dividend subject to declaration at the AGM
2012
25th July
121st Annual General Meeting (AGM)
1st August
Ex dividend date (final dividend)
3rd August
Record date (final dividend, special dividend and share consolidation)
6th August
Ex dividend date (special dividend)
Share consolidation takes effect (subject to approval at the AGM)
17th August
Payment of final dividend and special dividend (subject to declarationat the AGM)
21st November
Announcement of results for the six months ending30th September 2012
28th November
Ex dividend date
30th November
Interim dividend record date

180 Johnson Matthey Annual Report & Accounts 2012Other Information
Registered Office5th Floor25 Farringdon StreetLondon EC4A 4ABTelephone: +44 (0)20 7269 8400Fax: +44 (0)20 7269 8433Internet address: www.matthey.comE-mail: [email protected]
Registered in England – Number 33774
Professional AdvisersAuditorKPMG Audit Plc15 Canada SquareLondon E14 5GL
BrokersMerrill Lynch International J. P. Morgan Cazenove2 King Edward Street 25 Bank StreetLondon EC1A 1HQ Canary Wharf
London E14 5JP
LawyersHerbert Smith LLP Taylor Wessing LLPExchange House 5 New Street SquarePrimrose Street London EC4A 3TWLondon EC2A 2HS
RegistrarsEquinitiAspect HouseSpencer RoadLancingWest Sussex BN99 6DATelephone: 0871 384 2344*Internet address: www.shareview.co.uk
* Calls to this number are charged at 8p per minute from a BT landline. Other telephony providers’ costs may vary.Lines are open 8.30am to 5.30pm Monday to Friday.
Company Details

Johnson Matthey Annual Report & Accounts 2012
Johnson Matthey at a Glance
Environmental Technologies
Emission ControlTechnologies
Process Technologies
Fuel Cells
Environmental Technologies Division’sproducts and services are used globally inapplications which benefit the environment.It supplies catalysts and technologieswhich contribute to pollution control,cleaner fuels, greener power and the moreefficient use of hydrocarbon resources.Its emission control catalysts are fitted toabout one in three cars around the world.
Return on sales excluding 11.3%precious metalsReturn on invested capital (ROIC) 14.2%Capital expenditure £97.1mCapex / depreciation 1.2Average invested capital £1,492mEmployees 5,640
Key Statistics
2009
1,135*
124.3
1,252
120.9
1,566
164.7
1,876
211.8
2010 2011 2012Sales excludingprecious metals
Underlyingoperatingprofit
0
500
1,000
1,500
2,000
£ million
* Excluding inter-segment sales.
Precious Metal Products
Services
Platinum Marketing and DistributionRefining
Manufacturing
Noble MetalsColour Technologies
Catalysts and Chemicals
Precious Metal Products Divisionadds value to precious metals. Its wideranging activities include the marketing,distribution and fabrication of preciousmetals and the manufacture of catalystsand precious metal chemicals. It is alsoa world leading refiner of precious metals,ensuring these valuable materials areefficiently recovered and reused.
Return on sales excluding 34.5%precious metalsReturn on invested capital (ROIC) 58.9%Capital expenditure £31.6mCapex / depreciation 1.4Average invested capital £341mEmployees 2,894
Key Statistics
2009
447*
143.0
454
116.7
541
172.9
582
200.8
2010 2011 2012Sales excludingprecious metals
Underlyingoperatingprofit
0
200
400
600
£ million
Fine Chemicals
API Manufacturing
Macfarlan SmithPharmaceutical Materials and Services
Research Chemicals
Fine Chemicals Division supplies activepharmaceutical ingredients, fine chemicalsand other speciality chemicals to a widerange of pharmaceutical and chemicalindustry customers and research institutesglobally. Its products help relieve pain, treat cancer and other medical conditions,improving the quality of life for many peoplearound the world.
Return on sales excluding 24.5%precious metalsReturn on invested capital (ROIC) 16.7%Capital expenditure £15.8mCapex / depreciation 0.9Average invested capital £418mEmployees 1,090
Key Statistics
2009
215*
49.5
221
55.8
245
56.2
285
69.7
2010 2011 2012Sales excludingprecious metals
Underlyingoperatingprofit
0
100
200
300
£ million
March2007
March2008
March2009
March2011
March2010
March2012
Total accident rate
> 3-day lost timeaccident rate
0
3
6
9
12
2007* 2009 2010 2011 2012
Tonnes CO2
equivalent (’000)Tonnes /£ million sales
0
100
200
300
400
500
0
50
100
150
200
250
300
2008
89.6
37.1
89.5
36.6
86.4
39.0
119.0
46.0
153.7
55.0
2009 20112010 2012Underlying earnings per share
Ordinary dividend per share
0
40
80
120
160
Performance Highlights
* Calendar year.
Johnson Matthey continued its strong performance in 2011/12 withgood growth across all three of its divisions.
Year to 31st March2012 2011 % change
FinancialRevenue £ million 12,023 9,985 +20
Sales excluding precious metals (sales) £ million 2,679 2,280 +17
Profit before tax £ million 409.3 259.32 +58
Total earnings per share pence 148.7 85.22 +75
Underlying1:
Profit before tax £ million 426.0 345.5 +23
Earnings per share pence 153.7 119.0 +29
Dividends per share:
Ordinary pence 55.0 46.0 +20
Special pence 100.0 – –
SocialAverage number of employees 9,914 9,388 +6
Voluntary employee turnover % 6.4 5.6 +1
Training spend per employee £ 335 390 -14
Charitable donations £ thousands 645 517 +25
Health and SafetyGreater than three day accidents per 1,000 employees 2.07 2.992 -31
Total accident rate per 1,000 employees 5.69 7.892 -28
Occupational illness cases per 1,000 employees 3.5 3.5 –
EnvironmentEnergy consumption thousands GJ 4,726 4,749 –
Global warming potential thousand tonnes CO2 equivalent 417 415 –
Total waste tonnes 120,363 113,671 +6
Water consumption thousands m3 2,201 2,076 +6
Total acid gas emissions tonnes SO2 equivalent 444 318 +40
1 Before amortisation of acquired intangibles, major impairment and restructuring charges, profit or loss on disposal of businesses and, where relevant, related tax effects.
2 Restated.
Delivering Superior Valuepence
> Reducing Carbon IntensityTonnes CO2 Tonnes /equivalent (’000) £ million sales
> Safety is a Key Priorityper 1,000 employees
>
The paper in this report contains material sourced from responsibly managed forests, certified inaccordance with the FSC® (Forest Stewardship Council) and is totally recyclable and acid-free.
Fulmar Colour is FSC certified, PEFC certified and ISO 14001 certified showing that it is committedto all round excellence and improving environmental performance is an important part of thisstrategy. Fulmar Colour aims to reduce at source the effect its operations have on the environmentand is committed to continual improvement, prevention of pollution and compliance with anylegislation or industry standards.
Fulmar Colour is a Carbon Neutral Printing Company.
Designed and produced by MAGEEwww.magee.co.ukPrinted by Fulmar Colour
Johnson Matthey is grateful to the following for their help in providing illustrations:
Fruits, page 65 – © Ene | Dreamstime.com

Go Onlinewww.matthey.com/AR12To view our online annual report
JOHNSON MATTHEY IS A LEADING SPECIALITYCHEMICALS COMPANY UNDERPINNED BYSCIENCE, TECHNOLOGY AND OUR PEOPLE.
The group is a leader in sustainabletechnologies and many of ourproducts enhance the quality of lifefor millions through their beneficialimpact on the environment, healthand wellbeing. Technologyleadership forms the basis ofJohnson Matthey’s strategy to deliversuperior long term growth and wecontinue to invest in R&D to developthe next generation of sustainableproducts for our customers. To us,good performance is not just aboutprofit. It’s about running our businessin the most sustainable andresponsible way and so we haveidentified five elements of sustainabilitywhich have a material impact on ourbusiness. In this report we will updateyou on our progress.
DELIVERINGVALUE
FinancialMust be profitable to be sustainableSustainability initiatives can be cost efficient too
Health and SafetyProtecting employees, customers and communitiesBeneficial products
EnvironmentResponsible operationsBeneficial products
GovernanceWell run businessTransparent reporting
SocialEmployee development and wellbeing, recruitment Supporting communities, safeguarding reputation
Building a Sustainable Business
ANNUAL REPORT & ACCOUNTS
Johnson Matthey
Annual R
eport & Accounts 2012
5th Floor25 Farringdon StreetLondon EC4A 4ABUnited KingdomTel: +44 (0)20 7269 8400Fax: +44 (0)20 7269 8433
2012
VALUEdeveloping products that enhance the quality of life
for millions of people around the world
Go Onlinewww.matthey.comTo view our online annual report
DELIVERING


