Embed Size (px)
Citation preview
ORIGINALARTICLE
Definition of grassland biomes fromphytoliths in West Africa
Laurent Bremond1,2*, Anne Alexandre1, Odile Peyron3 and Joel Guiot1
1Centre Europeen de Recherche et
d’Enseignement des Geosciences de
l’Environnement (CEREGE), Universite Paul
Cezanne Aix-Marseille (UPCAM), Unite
Mixte de Recherche (UMR) 6635, Centre
National de la Recherche Scientifique (CNRS),
Europole Mediterraneen de l’Arbois, Aix-
en-Provence, France, 2Centre de Bio-
Archeologie et d’Ecologie (CBAE), Ecole
Pratique des Hautes Etudes (EPHE),
Universite de Montpellier 2, UMR 5059 CNRS,
Montpellier, France and 3Laboratoire de
Chrono-Ecologie, Universite de Franche-
Comte, UMR 6565 CNRS, UFR Sciences et
Techniques, Besancon, France
*Correspondence: Laurent Bremond, CBAE,
Institut de Botanique, 163 rue Broussonet,
F-34090 Montpellier, France.
E-mail: [email protected]
ABSTRACT
Aim In order to enhance the effectiveness of comparisons between modelled and
empirical data for present and past vegetation, it is important to improve the
characterization of tropical grass-dominated biomes reconstructed from fossil
tracers. This study presents a method for assigning phytolith assemblages to
tropical grass-dominated biomes, with the objective of offering a new tool for
combining pollen and phytolith data in the reconstruction of tropical biomes.
Location The West African latitudinal transect studied here extends from 12� N
(southern Senegal) to 23� N (southern Mauritania), passing through the
Guinean, Sudanian, Sahelian and Saharan bioclimatic zones.
Methods Modern phytolith assemblages were extracted from 59 soil surface
samples taken throughout the study area and allocated, a priori, to three current
biomes: (1) desert C4 grassland, (2) short grass savanna, and (3) tall grass savanna. Five
out of nine phytolith types identified were used as predictors in a discriminant analysis
(with calibration and validation steps) for assigning phytolith assemblages to biomes.
In addition, 74 modern pollen spectra from the West African transect, acquired from
the African Pollen Database (http://medias.obs-mip.fr/apd), were processed by the
biomization method. This mathematical procedure involves assigning palynological
taxa to one or more plant functional types, which represent broad classes of plants.
The plant functional types, in turn, are combined to define biomes following a specific
set of algorithms and rules. The resulting maps of the phytolith biomes thus derived
were compared with maps of pollen biomes and of contemporary ecosystem classes.
Results In the calibration and validation steps, 91.5% and up to 83%,
respectively, of the phytolith samples were assigned to the correct biome. The
short grass savanna and tall grass savanna biomes were assigned with similar
accuracy by both the phytolith and pollen biomization methods, but the phytolith
method gave substantially superior results for the desert C4 grassland biome,
providing seven out of seven correct assignments, compared with just one out of
four by pollen biomization. Comparisons between an existing ecosystem map and
the maps created from phytolith estimation showed close correspondence for
desert C4 grassland, short grass savanna and tall grass savanna, the latter
providing correct assignments in 88, 62 and 91% of cases, respectively.
Main conclusions The phytolith discriminant analysis method presented here
accurately estimates three C4 grass-dominated biomes that are widespread in
West Africa. Complementarities between the phytolith method and pollen
biomization are highlighted. Combining complementary phytolith and pollen
data would provide more accurate assignments of C4 grass-dominated biomes
than pollen biomization alone.
Keywords
Arid environments, biome, C4 grasses, classification, grassland, phytolith, pollen,
tropical grassland, West Africa.
Journal of Biogeography (J. Biogeogr.) (2008) 35, 2039–2048
ª 2008 The Authors www.blackwellpublishing.com/jbi 2039Journal compilation ª 2008 Blackwell Publishing Ltd doi:10.1111/j.1365-2699.2008.01944.x
INTRODUCTION
Global vegetation models provide a means for translating the
outputs from climate models into maps of potential vegetation
distribution in present, past and future climate scenarios
(Prentice et al., 1992; Haxeltine & Prentice, 1996). One type of
output from such models is assignment to biomes, which may
be defined as macro-scale landscape types classified according
to the predominant vegetation characterized by its adap-
tation to the corresponding environment (Campbell, 1996).
The simplest vegetation models are based on bioclimatic
indicators linked to climatic variables affecting specific aspects
of plant growth or survival. These indicators, when appro-
priately selected, can be used to estimate the locations and
potential shifts of biome limits in response to past or future
climate changes (Cramer, 2002). Thus, biome models can be
coupled with climatic models to estimate the distribution of
past biomes (Prentice et al., 1992). The validity of these
simulations may be assessed by comparisons with the distri-
bution of biomes reconstructed from proxy data. To this end,
the biomization method (Prentice et al., 1996, 2000) recon-
structs biomes from pollen data by assigning pollen taxa to one
or more plant functional types (PFTs; broad classes of plants
defined by stature, leaf form, phenology and bioclimatic
factors) and by considering biomes as combinations of several
PFTs (Jolly et al., 1998). This method has proven very efficient
for the reconstruction of forest biomes. However, in the
absence of precise pollen identification of Poaceae species and
subfamilies, grass-dominated biomes, which are the most
widespread modern continental biomes (Bond et al., 2005),
are not accurately characterized by pollen data. For instance,
the two steppic PFTs (warm grasses/shrubs and cool grasses/
shrubs) defined by Prentice et al. (1992), although distin-
guished in Europe (Tarasov et al., 1999), cannot be recon-
structed properly in the intertropical area from modern pollen
data (Jolly et al., 1998). Samples collected in the steppe biome
(dry tropical grassland) are often incorrectly assigned by the
biomization method to the savanna biome (wet tropical
grassland), the tropical xerophytic woods/scrub biome or the
temperate xerophytic woods/scrub biome (Jolly et al., 1998).
This lack of precision is a cause of particular concern when
attempting to reconstruct vegetation during the last glacial
period, when grass-dominated biomes were even more wide-
spread than at present.
One potentially useful method for reconstructing grassland
biomes is based on analysis of phytoliths, amorphous silica
particles that precipitate in and/or between the cells of living
plant tissues. Because of redundancy and multiplicity in
phytolith production (Fredlund & Tieszen, 1994), often one
phytolith type cannot be related to one plant taxon. However,
at a broader level, there are several notable advantages in the
use of phytolith assemblages for reconstructing vegetation
types, particularly for estimating biomes. Phytolith assem-
blages can be used successfully to discriminate current
intertropical grassland types and forests of low elevation,
through variations in phytolith type abundances associated
with variations in dominant grass subfamilies and tree-cover
density (Bremond et al., 2005a, 2008; Barboni et al., 2007).
Several authors (e.g. Alexandre et al., 1997; Scott, 2002;
Abrantes, 2003) have also reconstructed paleovegetation
changes in the intertropical area using fossil phytolith assem-
blages. In addition, recent studies present quantitative calibra-
tion of the relationships between intertropical grass phytolith
assemblages and climatic parameters (Prebble et al., 2002;
Bremond et al., 2005b; Lu et al., 2006). Results of these studies
suggest that, as fossil phytolith remains are recoverable in
significant quantities from various kinds of soil, as well as
marine and continental sediments, phytolith analyses could
make significant contributions to the accurate reconstruction
of global grassland types and their related bioclimatic
constraints. Furthermore, the complementary use of phytolith
and pollen data (the latter being most efficient for recon-
structing forest types) could offer interesting opportunities for
developing a better understanding of global vegetation and
climate dynamics.
The objective of the study presented here was to develop a
new tool for combining pollen and phytolith data in the
analysis of vegetation in intertropical areas. We present a
discriminant analysis procedure that allows biomes estimated
from modern phytolith data to be compared with those
estimated from pollen data using the biomization method
(Prentice et al., 1992). Consistencies and inconsistencies
between the biomes indicated by the two methods are
discussed, and an attempt is made to evaluate estimated West
African vegetation types with respect to the ecosystem groups
described by Olson (1994a,b).
MATERIALS AND METHODS
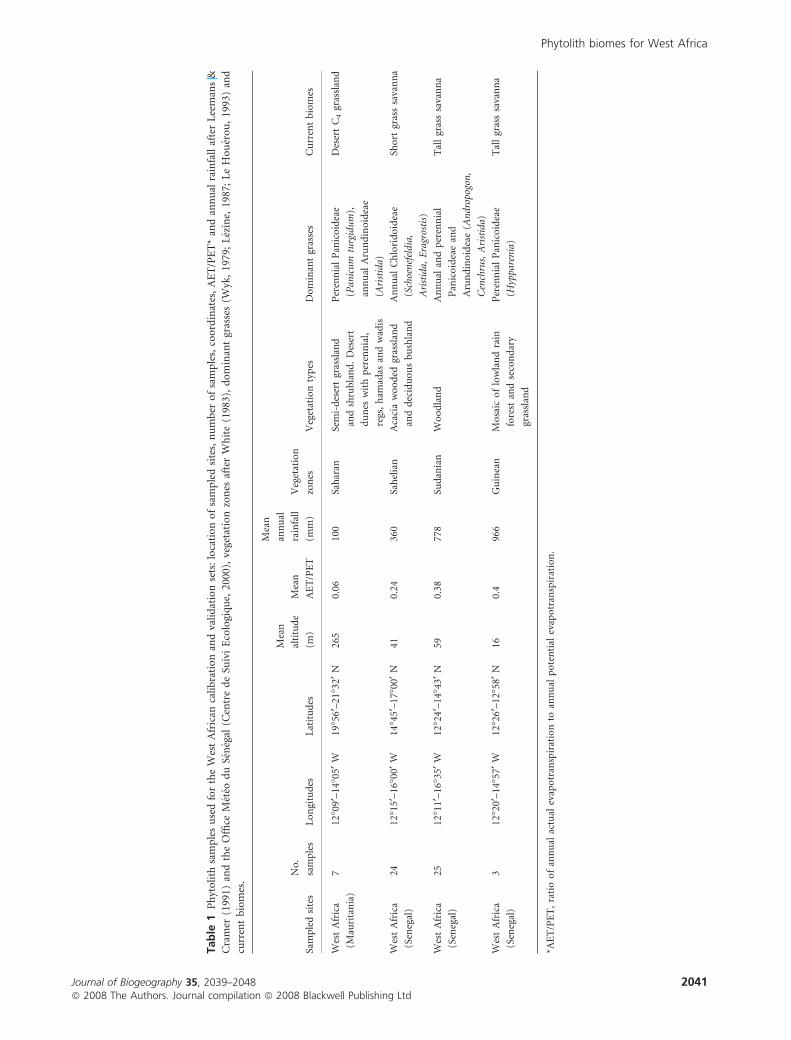
The West African latitudinal transect studied here ranges
between 12� N (southern Senegal) and 23� N (southern
Mauritania). The climatic zoning (Table 1) is characterized
from south to north by a decrease in mean annual rainfall from
1300 to 100 mm and a concomitant increase in the duration of
the dry season from 5 to > 9 months. The mean temperature
of the coldest month ranges from 19�C in the south to 25�C in
the north, and the mean temperature of the warmest month is
between 30 and 31�C throughout the study area.
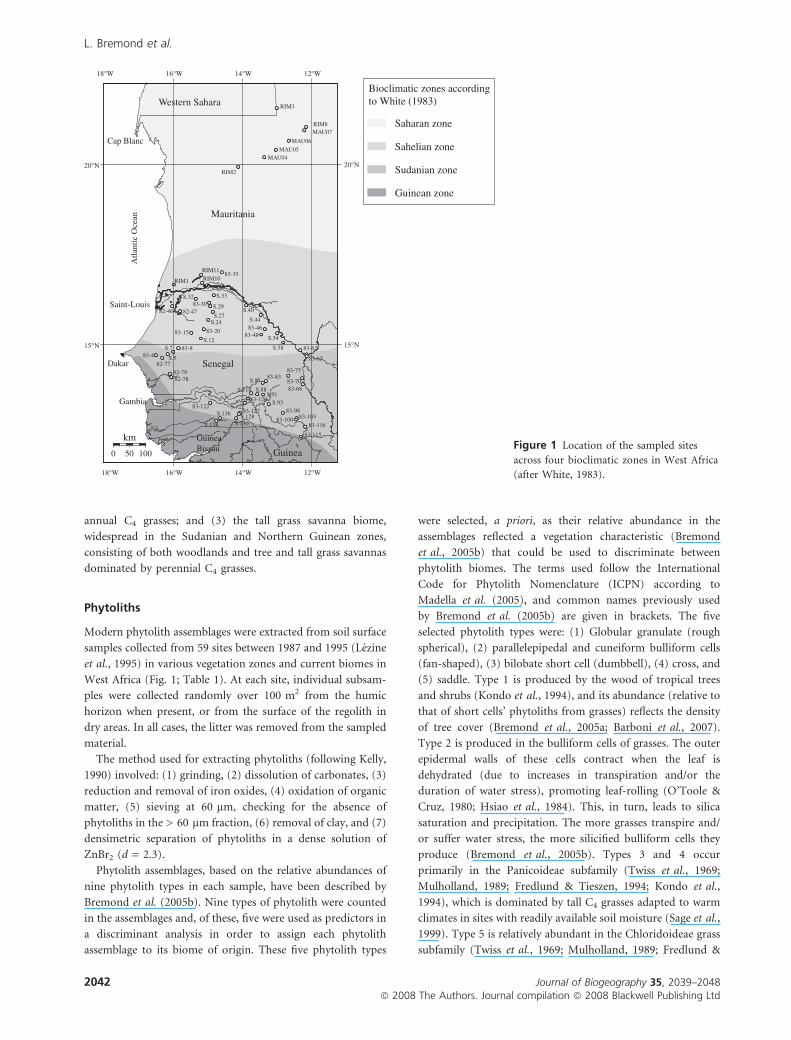
The sampled transect passes through four vegetation zones
(Fig. 1): the Guinean, Sudanian, Sahelian and Saharan zones.
Table 1 presents, for each zone, a description of the vegetation
physiognomy after White (1983); a summary of the dominant
grass subfamilies after Wyk (1979), Lezine (1987) and
Le Houerou (1993); and associated climatic boundaries after
Leemans & Cramer (1991) and the Office Meteo du Senegal
(Centre de Suivi Ecologique, 2000). On the basis of this
information, three current biomes have been outlined
(Table 1): (1) the desert C4 grassland biome, characteristic of
the Saharan zone, dominated by shrub and short grass
savannas with annual and perennial C4 grasses; (2) the short
grass savanna biome, characteristic of the Sahelian zone,
composed of shrub and tree grass savannas dominated by
L. Bremond et al.
2040 Journal of Biogeography 35, 2039–2048ª 2008 The Authors. Journal compilation ª 2008 Blackwell Publishing Ltd
Tab
le1
Ph
yto
lith
sam
ple
su
sed
for
the
Wes
tA
fric
anca
lib
rati
on
and
vali
dat
ion
sets
:lo
cati
on
of
sam
ple
dsi
tes,
nu
mb
ero
fsa
mp
les,
coo
rdin
ates
,A
ET
/PE
T*
and
ann
ual
rain
fall
afte
rL
eem
ans
&
Cra
mer
(199
1)an
dth
eO
ffice
Met
eod
uSe
neg
al(C
entr
ed
eSu
ivi
Eco
logi
qu
e,20
00),
vege
tati
on
zon
esaf
ter
Wh
ite
(198
3),
do
min
ant
gras
ses
(Wyk
,19
79;
Lez
ine,
1987
;L
eH
ou
ero
u,
1993
)an
d
curr
ent
bio
mes
.
Sam
ple
dsi
tes
No
.
sam
ple
sL
on
gitu
des
Lat
itu
des
Mea
n
alti
tud
e
(m)
Mea
n
AE
T/P
ET
Mea
n
ann
ual
rain
fall
(mm
)
Veg
etat
ion
zon
esV
eget
atio
nty
pes
Do
min
ant
gras
ses
Cu
rren
tb
iom
es
Wes
tA
fric
a
(Mau
rita
nia
)
712
�09¢
–14
�05¢
W19
�56¢
–21
�32¢
N26
50.
0610
0Sa
har
anSe
mi-
des
ert
gras
slan
d
and
shru
bla
nd
.D
eser
t
du
nes
wit
hp
eren
nia
l,
regs
,h
amad
asan
dw
adis
Per
enn
ial
Pan
ico
idea
e
(Pan
icu
mtu
rgid
um
),
ann
ual
Aru
nd
ino
idea
e
(Ari
stid
a)
Des
ert
C4
gras
slan
d
Wes
tA
fric
a
(Sen
egal
)
2412
�15¢
–16
�00¢
W14
�45¢
–17
�00¢
N41
0.24
360
Sah
elia
nA
caci
aw
oo
ded
gras
slan
d
and
dec
idu
ou
sb
ush
lan
d
An
nu
alC
hlo
rid
oid
eae
(Sch
oen
efel
dia
,
Ari
stid
a,E
ragr
osti
s)
Sho
rtgr
ass
sava
nn
a
Wes
tA
fric
a
(Sen
egal
)
2512
�11¢
–16
�35¢
W12
�24¢
–14
�43¢
N59
0.38
778
Sud
ania
nW
oo
dla
nd
An
nu
alan
dp
eren
nia
l
Pan
ico
idea
ean
d
Aru
nd
ino
idea
e(A
nd
ropo
gon
,
Cen
chru
s,A
rist
ida)
Tal
lgr
ass
sava
nn
a
Wes
tA
fric
a
(Sen
egal
)
312
�20¢
–14
�57¢
W12
�26¢
–12
�58¢
N16
0.4
966
Gu
inea
nM
osa
ico
flo
wla
nd
rain
fore
stan
dse
con
dar
y
gras
slan
d
Per
enn
ial
Pan
ico
idea
e
(Hyp
pare
nia
)
Tal
lgr
ass
sava
nn
a
*AE
T/P
ET
,ra
tio
of
ann
ual
actu
alev
apo
tran
spir
atio
nto
ann
ual
po
ten
tial
evap
otr
ansp
irat
ion
.
Phytolith biomes for West Africa
Journal of Biogeography 35, 2039–2048 2041ª 2008 The Authors. Journal compilation ª 2008 Blackwell Publishing Ltd
annual C4 grasses; and (3) the tall grass savanna biome,
widespread in the Sudanian and Northern Guinean zones,
consisting of both woodlands and tree and tall grass savannas
dominated by perennial C4 grasses.
Phytoliths
Modern phytolith assemblages were extracted from soil surface
samples collected from 59 sites between 1987 and 1995 (Lezine
et al., 1995) in various vegetation zones and current biomes in
West Africa (Fig. 1; Table 1). At each site, individual subsam-
ples were collected randomly over 100 m2 from the humic
horizon when present, or from the surface of the regolith in
dry areas. In all cases, the litter was removed from the sampled
material.
The method used for extracting phytoliths (following Kelly,
1990) involved: (1) grinding, (2) dissolution of carbonates, (3)
reduction and removal of iron oxides, (4) oxidation of organic
matter, (5) sieving at 60 lm, checking for the absence of
phytoliths in the > 60 lm fraction, (6) removal of clay, and (7)
densimetric separation of phytoliths in a dense solution of
ZnBr2 (d = 2.3).
Phytolith assemblages, based on the relative abundances of
nine phytolith types in each sample, have been described by
Bremond et al. (2005b). Nine types of phytolith were counted
in the assemblages and, of these, five were used as predictors in
a discriminant analysis in order to assign each phytolith
assemblage to its biome of origin. These five phytolith types
were selected, a priori, as their relative abundance in the
assemblages reflected a vegetation characteristic (Bremond
et al., 2005b) that could be used to discriminate between
phytolith biomes. The terms used follow the International
Code for Phytolith Nomenclature (ICPN) according to
Madella et al. (2005), and common names previously used
by Bremond et al. (2005b) are given in brackets. The five
selected phytolith types were: (1) Globular granulate (rough
spherical), (2) parallelepipedal and cuneiform bulliform cells
(fan-shaped), (3) bilobate short cell (dumbbell), (4) cross, and
(5) saddle. Type 1 is produced by the wood of tropical trees
and shrubs (Kondo et al., 1994), and its abundance (relative to
that of short cells’ phytoliths from grasses) reflects the density
of tree cover (Bremond et al., 2005a; Barboni et al., 2007).
Type 2 is produced in the bulliform cells of grasses. The outer
epidermal walls of these cells contract when the leaf is
dehydrated (due to increases in transpiration and/or the
duration of water stress), promoting leaf-rolling (O’Toole &
Cruz, 1980; Hsiao et al., 1984). This, in turn, leads to silica
saturation and precipitation. The more grasses transpire and/
or suffer water stress, the more silicified bulliform cells they
produce (Bremond et al., 2005b). Types 3 and 4 occur
primarily in the Panicoideae subfamily (Twiss et al., 1969;
Mulholland, 1989; Fredlund & Tieszen, 1994; Kondo et al.,
1994), which is dominated by tall C4 grasses adapted to warm
climates in sites with readily available soil moisture (Sage et al.,
1999). Type 5 is relatively abundant in the Chloridoideae grass
subfamily (Twiss et al., 1969; Mulholland, 1989; Fredlund &
15°N
20°N
Saint-Louis
Dakar
Cap Blanc A
tlant
ic O
cean
Gambia
Senegal
Mauritania
Guinea Bissau Guinea
Western Sahara
RIM2
83-30
82-79
S.88
RIM10
S.118
S.32
S.5 82-77
S.136 S.122
83-4
S.54
S.29
83-122
82-47
S.24
RIM3
82-46
MAU07
RIM1
MAU05
S.7
83-68
S.93
83-103 83-100
83-70
S.91
S.84
MAU06
RIM11
83-127
S.58
83-48
S.44
83-75
83-98
83-35
82-78
83-120
S.33
83-15
S.40 S.27
83-8
83-115
RIM8
83-62
83-65
S.128
83-116
83-83
83-46 83-20
S.12
MAU04
S.130 S.138
18°W 16°W 14°W 12°W
15°N
20°N
0 50 100
km
18°W 16°W 14°W 12°W
Guinean zone
Sudanian zone
Sahelian zone
Saharan zone
Bioclimatic zones according to White (1983)
Figure 1 Location of the sampled sites
across four bioclimatic zones in West Africa
(after White, 1983).
L. Bremond et al.
2042 Journal of Biogeography 35, 2039–2048ª 2008 The Authors. Journal compilation ª 2008 Blackwell Publishing Ltd
Tieszen, 1994; Kondo et al., 1994), a group of short C4 grasses
adapted to warm and dry climates at sites with little available
soil moisture (Sage et al., 1999).
The following four phytolith types, although components of
the phytolith assemblages, were excluded from the discrim-
inant analysis for the reasons outlined below. First, the papillae
cell (ICPN name) or cone-shaped (Bremond et al., 2005b) type
is characteristic of Cyperaceae (sedges) (Kondo et al., 1994;
Wallis, 2003). However, because this type fragments and
dissolves rapidly, its relative abundance in soils and sediments
is not proportional to the abundance of sedges (Alexandre
et al., 1997). Second, the globular psilate (ICPN name) or
smooth spherical (Bremond et al., 2005b). This type appears to
have several origins (Kondo et al., 1994; Piperno, 2006), and
has no clear taxonomic significance. Third, the globular
echinate (ICPN name) or crenate spherical (Bremond et al.,
2005b) is produced by Palmae (Piperno, 2006). However, as
palms can be adapted to various climatic conditions, this type
is not helpful for distinguishing among intertropical biomes.
Fourth, the acicular hair cell (ICPN name) or point-shaped (in
Bremond et al., 2005b) type is produced by all the grasses, and
no relationship has been demonstrated between its relative
abundance and either climate or vegetation parameters.
After allocating, a priori, each of the 59 phytolith assem-
blages to one of the three current biomes previously outlined
(Table 1), a factorial discriminant analysis (Venables & Ripley,
2002) was run using the five phytolith types as predictors to
assign one of the three biomes as a result of a discriminant
linear function. In this (calibration) step, the resulting biomes
were referred to as phytolith biomes. The discriminant linear
functions were characterized by coefficients associated with the
five phytolith variables. Each coefficient was calculated to
minimize the variance of the samples (phytolith assemblages)
within groups (phytolith biomes) and to maximize the
variance between the group centroids.
The validity of the discriminant analysis was checked
through bootstrapping analysis with 100 iterations (validation
step) using the function ‘lda’ provided by the r software
(http://www.r-project.org). The data set, comprising 59 assem-
blages, was randomly sampled. The sampled observations were
then used to recalibrate the discriminant functions, while the
remaining observations were used to verify them. Percentages
and confidence intervals of well classified dependent and
independent observations were calculated, and the results
presented as 2.5th, 50th and 97.5th percentiles.
Pollen
Seventy-four modern pollen spectra from the West African
study area (for details see Peyron, 1999) were accessed online
through the African Pollen Database (http://medias.obs-mip.
fr/apd) and assigned to pollen biomes using the biomization
method (Prentice et al., 1996), which classifies the plant taxa
represented in pollen assemblages into a small number of
PFTs. As a biome is defined as a combination of PFTs
potentially present within it (Prentice et al., 1992), it is
possible to construct a taxon vs. biome matrix indicating
which taxa may occur in which biome(s). This matrix can then
be used to calculate affinity values between each pollen
assemblage and each biome. The biome assigned is the one
with the highest affinity value. In this study, assigned pollen
biomes were identified using PPPbase software (Goeury &
Guiot, 1996), which generates affinity scores for PFTs for each
pollen assemblage. The calculation is based on the sum of the
square roots of pollen percentages using all the pollen grains
(excluding aquatics, ferns and exotic taxa) present in the pollen
assemblages. The sum of the scores of the PFTs included in
each biome provides a biome score. Lastly, a biome is assigned
according to the highest affinity score obtained at each site.
This biomization method was applied to African pollen data
first by Jolly et al. (1998) and later by Peyron et al. (2000) and
Vincens et al. (2006).
RESULTS
Phytolith biomes
Calibration step
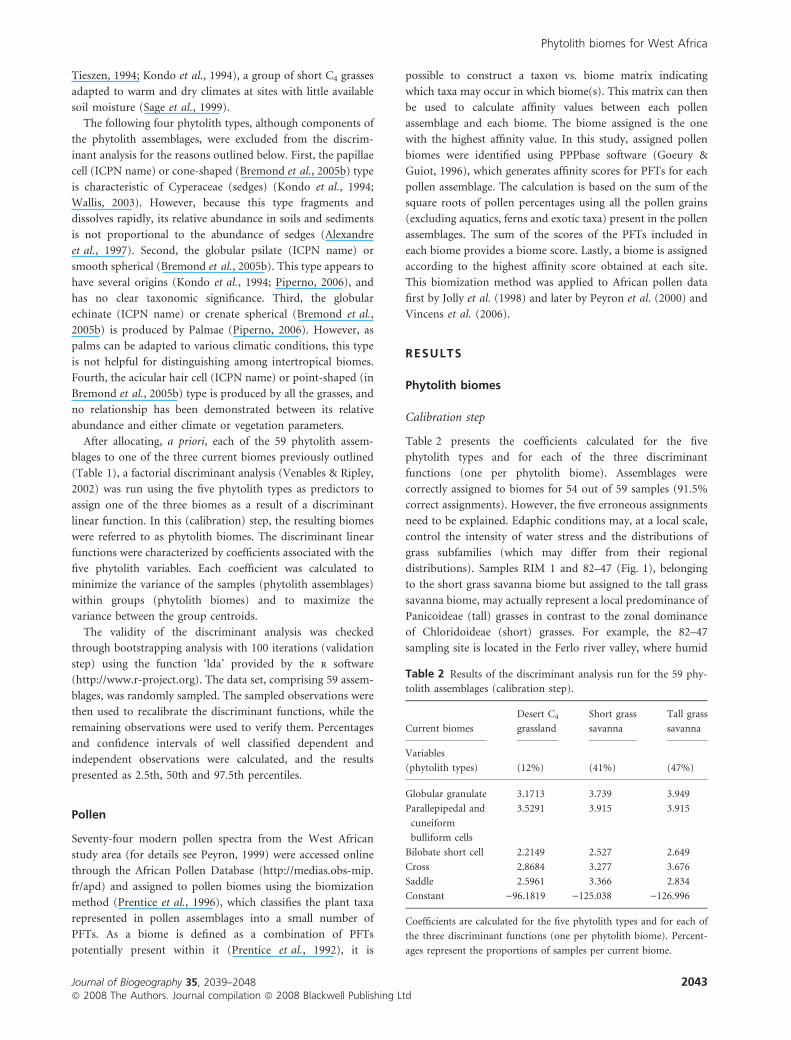
Table 2 presents the coefficients calculated for the five
phytolith types and for each of the three discriminant
functions (one per phytolith biome). Assemblages were
correctly assigned to biomes for 54 out of 59 samples (91.5%
correct assignments). However, the five erroneous assignments
need to be explained. Edaphic conditions may, at a local scale,
control the intensity of water stress and the distributions of
grass subfamilies (which may differ from their regional
distributions). Samples RIM 1 and 82–47 (Fig. 1), belonging
to the short grass savanna biome but assigned to the tall grass
savanna biome, may actually represent a local predominance of
Panicoideae (tall) grasses in contrast to the zonal dominance
of Chloridoideae (short) grasses. For example, the 82–47
sampling site is located in the Ferlo river valley, where humid
Table 2 Results of the discriminant analysis run for the 59 phy-
tolith assemblages (calibration step).
Current biomes
Desert C4
grassland
Short grass
savanna
Tall grass
savanna
Variables
(phytolith types) (12%) (41%) (47%)
Globular granulate 3.1713 3.739 3.949
Parallepipedal and
cuneiform
bulliform cells
3.5291 3.915 3.915
Bilobate short cell 2.2149 2.527 2.649
Cross 2.8684 3.277 3.676
Saddle 2.5961 3.366 2.834
Constant )96.1819 )125.038 )126.996
Coefficients are calculated for the five phytolith types and for each of
the three discriminant functions (one per phytolith biome). Percent-
ages represent the proportions of samples per current biome.
Phytolith biomes for West Africa
Journal of Biogeography 35, 2039–2048 2043ª 2008 The Authors. Journal compilation ª 2008 Blackwell Publishing Ltd
edaphic conditions may have favoured the local predominance
of tall grasses in the riparian vegetation. In contrast, S7 (Fig. 1)
was assigned to the desert C4 grassland biome rather than the
tall grass savanna biome, on account of the high proportion of
parallelepipedal and cuneiform bulliform cells in the assem-
blage, while S-136 (Fig. 1) was assigned to the short grass
savanna biome instead of the tall grass savanna biome. These
samples may have originated from a grassy patch that was
subject to high local water stress and/or high transpiration
rates. Furthermore, erroneous assignments may be related to
the location of some sampling sites in the transition area
between two bioclimatic zones. While the boundaries between
the different zones in this study are defined according to White
(1983), transition areas represent a macro-scale continuum of
grassland types, and some samples obtained from these areas
may have been assigned incorrectly. For instance, S5 (Fig. 1),
located at the transition of the Sudanian and Sahelian zones,
may have been wrongly defined as part of the tall grass savanna
biome.
Validation step
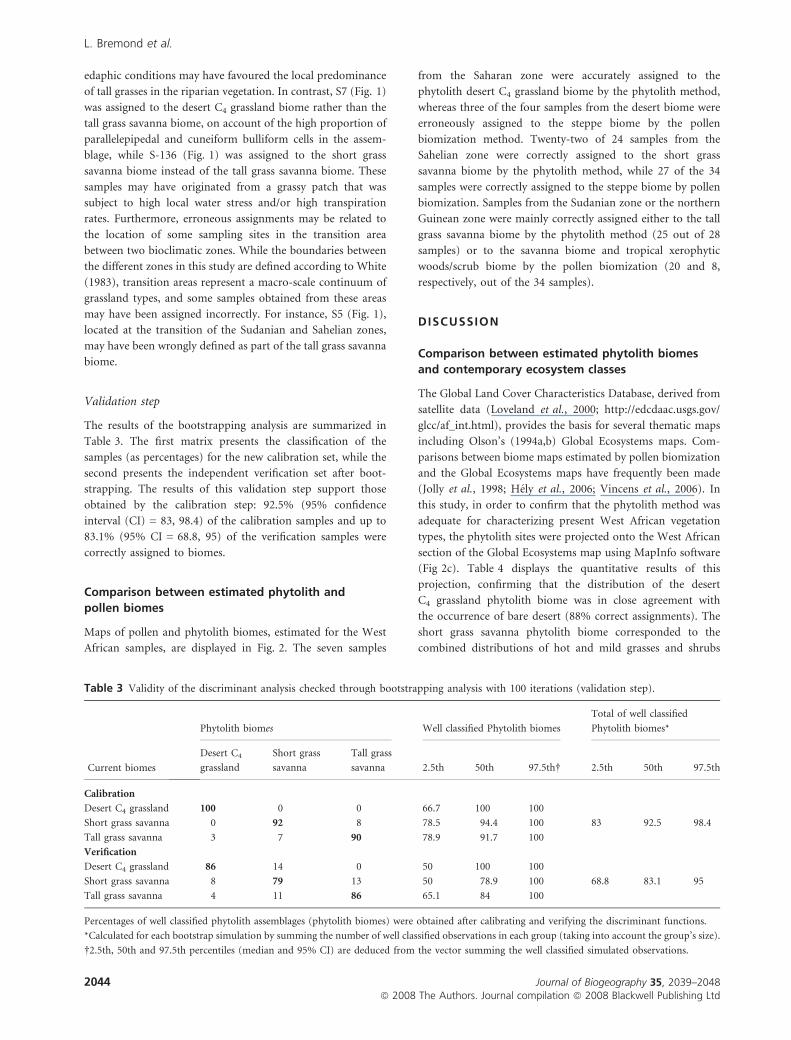
The results of the bootstrapping analysis are summarized in
Table 3. The first matrix presents the classification of the
samples (as percentages) for the new calibration set, while the
second presents the independent verification set after boot-
strapping. The results of this validation step support those
obtained by the calibration step: 92.5% (95% confidence
interval (CI) = 83, 98.4) of the calibration samples and up to
83.1% (95% CI = 68.8, 95) of the verification samples were
correctly assigned to biomes.
Comparison between estimated phytolith and
pollen biomes
Maps of pollen and phytolith biomes, estimated for the West
African samples, are displayed in Fig. 2. The seven samples
from the Saharan zone were accurately assigned to the
phytolith desert C4 grassland biome by the phytolith method,
whereas three of the four samples from the desert biome were
erroneously assigned to the steppe biome by the pollen
biomization method. Twenty-two of 24 samples from the
Sahelian zone were correctly assigned to the short grass
savanna biome by the phytolith method, while 27 of the 34
samples were correctly assigned to the steppe biome by pollen
biomization. Samples from the Sudanian zone or the northern
Guinean zone were mainly correctly assigned either to the tall
grass savanna biome by the phytolith method (25 out of 28
samples) or to the savanna biome and tropical xerophytic
woods/scrub biome by the pollen biomization (20 and 8,
respectively, out of the 34 samples).
DISCUSSION
Comparison between estimated phytolith biomes
and contemporary ecosystem classes
The Global Land Cover Characteristics Database, derived from
satellite data (Loveland et al., 2000; http://edcdaac.usgs.gov/
glcc/af_int.html), provides the basis for several thematic maps
including Olson’s (1994a,b) Global Ecosystems maps. Com-
parisons between biome maps estimated by pollen biomization
and the Global Ecosystems maps have frequently been made
(Jolly et al., 1998; Hely et al., 2006; Vincens et al., 2006). In
this study, in order to confirm that the phytolith method was
adequate for characterizing present West African vegetation
types, the phytolith sites were projected onto the West African
section of the Global Ecosystems map using MapInfo software
(Fig 2c). Table 4 displays the quantitative results of this
projection, confirming that the distribution of the desert
C4 grassland phytolith biome was in close agreement with
the occurrence of bare desert (88% correct assignments). The
short grass savanna phytolith biome corresponded to the
combined distributions of hot and mild grasses and shrubs
Table 3 Validity of the discriminant analysis checked through bootstrapping analysis with 100 iterations (validation step).
Current biomes
Phytolith biomes Well classified Phytolith biomes
Total of well classified
Phytolith biomes*
Desert C4
grassland
Short grass
savanna
Tall grass
savanna 2.5th 50th 97.5th� 2.5th 50th 97.5th
Calibration
Desert C4 grassland 100 0 0 66.7 100 100
Short grass savanna 0 92 8 78.5 94.4 100 83 92.5 98.4
Tall grass savanna 3 7 90 78.9 91.7 100
Verification
Desert C4 grassland 86 14 0 50 100 100
Short grass savanna 8 79 13 50 78.9 100 68.8 83.1 95
Tall grass savanna 4 11 86 65.1 84 100
Percentages of well classified phytolith assemblages (phytolith biomes) were obtained after calibrating and verifying the discriminant functions.
*Calculated for each bootstrap simulation by summing the number of well classified observations in each group (taking into account the group’s size).
�2.5th, 50th and 97.5th percentiles (median and 95% CI) are deduced from the vector summing the well classified simulated observations.
L. Bremond et al.
2044 Journal of Biogeography 35, 2039–2048ª 2008 The Authors. Journal compilation ª 2008 Blackwell Publishing Ltd
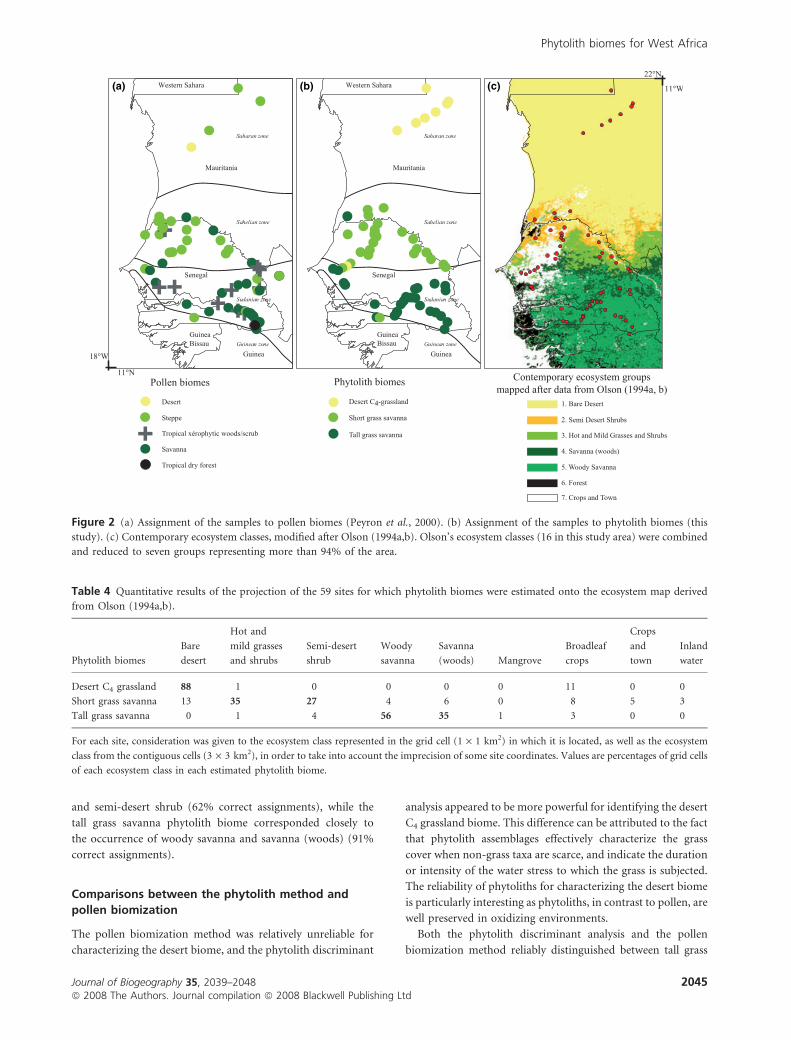
and semi-desert shrub (62% correct assignments), while the
tall grass savanna phytolith biome corresponded closely to
the occurrence of woody savanna and savanna (woods) (91%
correct assignments).
Comparisons between the phytolith method and
pollen biomization
The pollen biomization method was relatively unreliable for
characterizing the desert biome, and the phytolith discriminant
analysis appeared to be more powerful for identifying the desert
C4 grassland biome. This difference can be attributed to the fact
that phytolith assemblages effectively characterize the grass
cover when non-grass taxa are scarce, and indicate the duration
or intensity of the water stress to which the grass is subjected.
The reliability of phytoliths for characterizing the desert biome
is particularly interesting as phytoliths, in contrast to pollen, are
well preserved in oxidizing environments.
Both the phytolith discriminant analysis and the pollen
biomization method reliably distinguished between tall grass
(c)(b)(a)
Figure 2 (a) Assignment of the samples to pollen biomes (Peyron et al., 2000). (b) Assignment of the samples to phytolith biomes (this
study). (c) Contemporary ecosystem classes, modified after Olson (1994a,b). Olson’s ecosystem classes (16 in this study area) were combined
and reduced to seven groups representing more than 94% of the area.
Table 4 Quantitative results of the projection of the 59 sites for which phytolith biomes were estimated onto the ecosystem map derived
from Olson (1994a,b).
Phytolith biomes
Bare
desert
Hot and
mild grasses
and shrubs
Semi-desert
shrub
Woody
savanna
Savanna
(woods) Mangrove
Broadleaf
crops
Crops
and
town
Inland
water
Desert C4 grassland 88 1 0 0 0 0 11 0 0
Short grass savanna 13 35 27 4 6 0 8 5 3
Tall grass savanna 0 1 4 56 35 1 3 0 0
For each site, consideration was given to the ecosystem class represented in the grid cell (1 · 1 km2) in which it is located, as well as the ecosystem
class from the contiguous cells (3 · 3 km2), in order to take into account the imprecision of some site coordinates. Values are percentages of grid cells
of each ecosystem class in each estimated phytolith biome.
Phytolith biomes for West Africa
Journal of Biogeography 35, 2039–2048 2045ª 2008 The Authors. Journal compilation ª 2008 Blackwell Publishing Ltd
savanna and short grass savanna biomes, although the
phytolith method correctly assigned a higher percentage of
samples of these kinds.
CONCLUSIONS
The phytolith discriminant analysis procedure presented here
accurately identified three C4 grass-dominated biomes that are
widespread in West Africa: the desert C4 grassland, the short
grass savanna and the tall grass savanna biomes. This was tested
by statistical validation and by comparing maps of estimated
phytolith biomes and contemporary ecosystem classes.
The success of this first study in defining a method for
constructing phytolith biomes highlights the potential value of
phytolith analysis in the description of vegetation types. In
particular, it is suggested that future studies should be aimed at
defining new phytolith discriminant functions for tropical
biomes with various tree cover densities (e.g. tree and tall grass
savanna, tree and short grass savanna, tropical dry forest,
tropical dense forest) or with C3 grass components. The
applicability of the calibrated functions to phytolith assem-
blages from other tropical areas should also be examined. The
present study suggests that phytolith data may be used to
complement pollen data in attempts to identify tropical
biomes according to the following two procedures. First, as
in this study, phytolith and pollen biomes can be defined for
the same vegetation types and, following Cheddadi et al.
(1997), who used a combination of pollen and lake-level data,
the assignment of samples to given biomes by the biomization
method can be considered to be validated if they are in
agreement with the biomes estimated by the phytolith method.
Second, a combination of phytolith and pollen data could be
used to define new discriminant functions (biomes) using both
phytolith indices (Bremond et al., 2005b) and PFT scores as
discriminant variables. These developments should improve
the reliability of reconstructions of tropical grass-dominated
biomes from fossil records, and enhance the effectiveness of
model/empirical data comparisons for both past and present
systems.
ACKNOWLEDGEMENTS
This work was supported by the French programs PNEDC
(Programme National d’Etudes Dynamique du Climat, INSU-
CNRS, projects ECHO and Calibration des indices phytolith-
iques pour l’integration de la dynamique des biomes herbaces
dans la modelisation des vegetations passees), ACI Ecologie
Quantitative (project RESOLVE), and by the 5th EU PCRDT
(EVK2-CT-2002-00153: MOTIF). Pollen data were accessed
via the African Pollen Database (http://medias.obs-mip.fr/
apd). We are grateful to Anne-Marie Lezine, who collected the
samples from Senegal and Mauritania and made them available
to us. Thanks also to Christine Pailles and Jennifer Dickie for
language corrections, and to the editor, Ole R. Vetaas, and
reviewers for their constructive comments on earlier drafts of
this manuscript.
REFERENCES
Abrantes, F. (2003) A 340,000 year continental climate record
from tropical Africa – news from opal phytoliths from the
equatorial Atlantic. Earth and Planetary Science Letters, 209,
165–179.
Alexandre, A., Meunier, J.-D., Lezine, A.-M., Vincens, A. &
Schwartz, D. (1997) Phytoliths: indicators of grasslands
dynamics during the late Holocene in intertropical Africa.
Palaeogeography, Palaeoclimatology, Palaeoecology, 136, 213–
219.
Barboni, D., Bremond, L. & Bonnefille, R. (2007) Comparative
study of modern phytolith assemblages from inter-tropical
Africa. Palaeogeography, Palaeoclimatology, Palaeoecology,
246, 454–470.
Bond, W.J., Woodward, F.I. & Midgley, G.F. (2005) The global
distribution of ecosystems in a world without fire. New
Phytologist, 165, 525–537.
Bremond, L., Alexandre, A., Hely, C. & Guiot, J. (2005a) A
phytolith index as a proxy of tree cover density in tropical
areas: calibration with leaf area index along a forest–savanna
transect in southeastern Cameroon. Global and Planetary
Change, 45, 277–293.
Bremond, L., Alexandre, A., Peyron, O. & Guiot, J. (2005b)
Grass water stress estimated from phytoliths in West Africa.
Journal of Biogeography, 32, 311–327.
Bremond, L., Alexandre, A., Wooller, M.J., Hely, C., Schafer,
P.A., Majule, A. & Guiot, J. (2008) Phytolith indices as
proxies of grass subfamilies on East African tropical
mountains. Global and Planetary Change, 61, 209–224.
Campbell, N.A. (1996) Biology, 4th edn. Benjamin/Cummings,
Menlo Park.
Centre de Suivi Ecologique (2000) Annuaire sur l’environ-
nement et les ressources naturelles du Senegal. Ministere
de l’Environnement, Republique du Senegal, Centre de Suivi
Ecologique, Dakar.
Cheddadi, R., Yu, G., Guiot, J., Harrison, S.P. & Prentice, I.C.
(1997) The climate of Europe 6000 years ago. Climate
Dynamics, 13, 1–9.
Cramer, W. (2002) Biome models. Encyclopedia of global
environmental change (ed. by T. Munn), pp. 166–171. John
Wiley & Sons, Chichester.
Fredlund, G. & Tieszen, L.T. (1994) Modern phytolith
assemblages from the North American Great Plains. Journal
of Biogeography, 21, 321–335.
Goeury, C. & Guiot, J. (1996) PPPbase software for statistical
analysis of paleoecological and palaeoclimatical data. Den-
drochronologia, 14, 295–300.
Haxeltine, A. & Prentice, I.C. (1996) BIOME3: an equilibrium
terrestrial biosphere model based on ecophysiological con-
straints, resource availability, and competition among plant
functional type. Global Biogeochemical Cycles, 10, 693–709.
Hely, C., Bremond, L., Alleaume, S., Smith, B., Sykes, M. &
Guiot, J. (2006) Sensitivity of African biomes to changes in
the precipitation regime. Global Ecology and Biogeography,
15, 258–270.
L. Bremond et al.
2046 Journal of Biogeography 35, 2039–2048ª 2008 The Authors. Journal compilation ª 2008 Blackwell Publishing Ltd
Hsiao, T.C., O’Toole, J.C., Yambo, E.B. & Turner, N. (1984)
Influence of osmotic adjustment on leaf rolling and tissue
death in rice. Plant Physiology, 75, 338–341.
Jolly, D., Prentice, I.C., Bonnefille, R., Ballouche, A., Bengo,
M., Brenac, P., Buchet, G., Burney, D., Cazet, J., Cheddadi,
R., Edorh, T., Elenga, H., Elmoutaki, S., Guiot, J., Laarif, F.,
Lamb, H., Lezine, A., Maley, J., Mbenza, M., Peyron, O.,
Reille, M., Reynaud-Farrera, I., Riollet, G., Ritchie, J., Roche,
E., Scott, L. & Ssemmanda, I. (1998) Biome reconstruction
from pollen and plant macrofossil data for Africa and the
Arabian peninsula at 0 and 6000 years. Journal of Biogeo-
graphy, 25, 1007–1027.
Kelly, E.F. (1990) Method for extracting opal phytoliths from soil
and plant material. Internal Report. Department of Agron-
omy, Colorado State University, Fort Collins.
Kondo, R., Childs, C. & Atkinson, I. (1994) Opal phytoliths of
New Zealand. Manaaki Whenua Press, Lincoln.
Le Houerou, H.N. (1993) Grasslands of the Sahel. Ecosytems of
the world, 8B: natural grassland (ed. by R.T. Coupland), pp.
197–220. Elsevier, Amsterdam.
Leemans, R. & Cramer, W. (1991) The IIASA database for
mean monthly values of temperature, precipitation and
cloudiness of a global terrestrial grid. International Institut
for Applied Systems Analysis (IIASA), RR-91-18, 61.
Lezine, A.M. (1987) Paleoenvironnements vegetaux d’Afrique
nord-tropicale depuis 12000 ans B.P. Analyse pollinique
de series sedimentaires continentales (Senegal–Mauritanie).
Volume I: Texte. Volume II: Annexes. Universite Aix-Mars-
eille 2, Faculte des Sciences de Luminy, France.
Lezine, A.M., Turon, J.L. & Buchet, G. (1995) Pollen analyses of
Senegal: evolution of the coastal paleoenvironment during the
last deglaciation. Journal of Quaternary Science, 10, 95–105.
Loveland, T.R., Reed, B.C., Brown, J.F., Ohlen, D.O., Zhu, Z.,
Yang, L. & Merchant, J.W. (2000) Development of a global
land cover characteristics database and IGBP DISCover from
1 km AVHRR data. International Journal of Remote Sensing,
21, 1303–1330.
Lu, H.-Y., Wu, N.-Q., Yang, X.-D., Jiang, H., Liu, K.-b. & Liu,
T.-S. (2006) Phytoliths as quantitative indicators for the
reconstruction of past environmental conditions in China I:
phytolith-based transfer functions. Quaternary Science
Reviews, 25, 945–959.
Madella, M., Alexandre, A., Ball, T. & ICPN Working Group
(2005) International code for phytolith nomenclature 1.0.
Annals of Botany, 96, 253–260.
Mulholland, S.C. (1989) Phytoliths shape frequencies in North
Dakota grasses: a comparison to general patterns. Journal of
Archaeological Science, 16, 489–511.
O’Toole, J.C. & Cruz, T.R. (1980) Response of leaf water
potential, stomatal resistance, and leaf rolling to water stress.
Plant Physiology, 65, 428–432.
Olson, J.S. (1994a) Global Ecosystem Framework: definitions.
USGS EROS Data Center Internal Report, Sioux Falls, SD.
Olson, J.S. (1994b) Global Ecosystem Framework: translation
strategy. USGS EROS Data Center Internal Report, Sioux
Falls, SD.
Peyron, O. (1999) Le climat de l’Europe et de l’Afrique
au dernier maximum glaciaire et a l’Holocene moyen. Faculte
des sciences et techniques de Saint Jerome, Universite de
droit et d’economie d’Aix-Marseille III, Marseille.
Peyron, O., Jolly, D., Bonnefille, R., Vincens, A. & Guiot, J.
(2000) Climate of East Africa 6000 14C yr BP inferred from
pollen data. Quaternary Research, 54, 90–101.
Piperno, D.R. (2006) Phytoliths: a comprehensive guide for
archaeologists and paleoecologists. Altamira Press, Lanham.
Prebble, M., Schallenberg, M., Carter, J. & Shulmeister, J.
(2002) An analysis of phytolith assemblages for the quan-
titative reconstruction of late Quaternary environments of
the Lower Taieri Plain, Otago, South Island, New Zealand I.
Modern assemblages and transfer functions. Journal of
Paleolimnology, 27, 393–413.
Prentice, I.C., Cramer, W., Harrison, S.P., Leemans, R.,
Monserud, R.A. & Solomon, A.M. (1992) A global biome
model based on plant physiology and dominance, soil
properties and climate. Journal of Biogeography, 19, 117–134.
Prentice, I.C., Guiot, J., Huntley, B., Jolly, D. & Cheddadi, R.
(1996) Reconstitution biomes from palaeoecological data:
a general method and its application to European data at
0 and 6 ka. Climate Dynamics, 12, 185–194.
Prentice, I.C., Jolly, D. & Biome6000 participants (2000) Mid-
Holocene and glacial-maximum vegetation geography of the
northern continents and Africa. Journal of Biogeography, 27,
507–519.
Sage, R.F., Wedin, D.A. & Meirong, L. (1999) The biogeo-
graphy of C4 photosynthesis: patterns and controlling fac-
tors. C4 plant biology (ed. by R.F. Sage and R.K. Monson),
pp. 313–373. Academic Press, Toronto.
Scott, L. (2002) Grassland development under glacial and
interglacial conditions in southern Africa: review of pollen,
phytolith and isotope evidence. Palaeogeography, Palaeo-
climatology, Palaeoecology, 177, 47–57.
Tarasov, P.E., Guiot, J., Cheddadi, R., Andreev, A.A., Bezusko,
L.G., Blyakharchuk, T.A., Dorofeyuk, N.I., Filimonova, L.V.,
Volkova, V.S. & Zernitskaya, V.P. (1999) Climate in
northern Eurasia 6000 years ago reconstructed from pollen
data. Earth and Planetary Science Letters, 171, 635–645.
Twiss, P.C., Suess, E. & Smith, R.M. (1969) Morphological
classification of grass phytoliths. Soil Science Society of
America Journal, 33, 109–115.
Venables, W.N. & Ripley, B.D. (2002) Modern applied statistics
with S, 4th edn. Springer, New York.
Vincens, A., Bremond, L., Brewer, S., Buchet, G. & Dussouillez,
P. (2006) Modern pollen-based biome reconstructions in
East Africa expanded to southern Tanzania. Review of Pal-
aeobotany and Palynology, 140, 187–212.
Wallis, L. (2003) An overview of leaf phytolith production
patterns in selected northwest Australian flora. Review of
Palaeobotany and Palynology, 125, 201–248.
White, F. (1983) The vegetation map of Africa. UNESCO, Paris.
Wyk, J. (1979) A general account of the grass cover of Africa.
Ecology of grasslands and bamboolands in the world (ed. by
M. Numata), pp. 124–132. W. Junk, The Hague.
Phytolith biomes for West Africa
Journal of Biogeography 35, 2039–2048 2047ª 2008 The Authors. Journal compilation ª 2008 Blackwell Publishing Ltd
BIOSKETCHES
Laurent Bremond is an Assistant Professor of Paleoecology at the Ecole Pratique des Hautes Etudes. He develops methods based
on various proxies (phytoliths, cuticles and stable isotopes) to reconstruct modern and past grass distributions in the tropics and
mountains.
Anne Alexandre is a CNRS researcher at CEREGE developing the study of phytoliths and oxygen isotope composition of biogenic
and low temperature silicates for tropical palaeoenvironments and palaeoclimate reconstructions.
Odile Peyron is a CNRS researcher specializing in the quantitative reconstruction of past climatic parameters from pollen data. Her
recent studies have focused on Late glacial and Holocene palaeoclimates in Europe.
Joel Guiot is a CNRS research director at CEREGE. His work is based on vegetation and climate modelling in the past and the
impact of global change on vegetation. He is an active member of the international Paleoclimate Modelling Intercomparison Project
(PMIPII) and president of the French Scientific Committee on long-term global climatic change (EVE).
Editor: Ole Vetaas
L. Bremond et al.
2048 Journal of Biogeography 35, 2039–2048ª 2008 The Authors. Journal compilation ª 2008 Blackwell Publishing Ltd


