Embed Size (px)
Citation preview

ARTICLE OPEN
DeePaN: deep patient graph convolutional networkintegrating clinico-genomic evidence to stratify lung cancersfor immunotherapyChao Fang1, Dong Xu 2,3, Jing Su4,5✉, Jonathan R Dry 1✉ and Bolan Linghu 1✉
Immuno-oncology (IO) therapies have transformed the therapeutic landscape of non-small cell lung cancer (NSCLC). However,patient responses to IO are variable and influenced by a heterogeneous combination of health, immune, and tumor factors. There isa pressing need to discover the distinct NSCLC subgroups that influence response. We have developed a deep patient graphconvolutional network, we call “DeePaN”, to discover NSCLC complexity across data modalities impacting IO benefit. DeePaNemploys high-dimensional data derived from both real-world evidence (RWE)-based electronic health records (EHRs) and genomicsacross 1937 IO-treated NSCLC patients. DeePaN demonstrated effectiveness to stratify patients into subgroups with significantlydifferent (P-value of 2.2 × 10⁻¹¹) overall median survival of 20.35 months and 9.42 months post-IO therapy. Significant differences inIO outcome were not seen from multiple non-graph-based unsupervised methods. Furthermore, we demonstrate that patientstratification from DeePaN has the potential to augment the emerging IO biomarker of tumor mutation burden (TMB).Characterization of the subgroups discovered by DeePaN indicates potential to inform IO therapeutic insight, including theenrichment of mutated KRAS and high blood monocyte count in the IO beneficial and IO non-beneficial subgroups, respectively.Our work has proven the concept that graph-based AI is feasible and can effectively integrate high-dimensional genomic and EHRdata to meaningfully stratify cancer patients on distinct clinical outcomes, with potential to inform precision oncology.
npj Digital Medicine (2021) 4:14 ; https://doi.org/10.1038/s41746-021-00381-z
INTRODUCTIONRecently immuno-oncology (IO) therapies including checkpointinhibitors have transformed the therapeutic landscape of non-small cell lung cancer (NSCLC)1–3. However, responses to IO inNSCLC are highly variable. Recent findings suggest a hetero-geneous collection of genomic alterations and clinical phenotypescan influence IO response4–6. Thus, there is a pressing need todiscover and characterize NSCLC subgroups across both clinicaland genomic landscapes to advance precision IO.Real-world-evidence (RWE)-based clinical phenotype data such
as electronic health records (EHRs), which include patientexposures, lab data, diagnosis, medications, and clinical out-comes, represent a promising resource for precision oncology.EHR-derived data have been used to identify patient subgroupsto inform cancer therapeutics7–12. Distinct molecular subtypes13–18
derived from rich genomic resources, including high tumormutational burden (TMB) and high PDL1 protein expression, havealso been associated with beneficial responses to checkpointinhibitor therapies in NSCLC1,19–21. The integration of bothgenomic and EHR evidence is expected to reveal a fullerdescription of tumor and patient characteristics impacting drugresponse. Whilst there have been many comparative studiesbetween these high dimensional data modalities22–24, few studiesto date integrate both genomics and EHRs for patient stratificationdue to all types of challenges. For instance, the study cohort canbe too small to investigate this heterogeneous disease; thedatasets used in subtyping studies may not be comprehensiveenough to incorporate both genomic data and diverse clinical-
phenotype data with long-term follow-ups; and the subtypingalgorithms and models may not be effective enough to integratehigh-dimensional data from both genomic and clinical domains.Recently, artificial intelligence (AI) and deep learning methods
have demonstrated great potential for discovery of cancersubtypes25–28, stemming from effective high-dimensional dataintegration and capture of complex nonlinear relationships29–31.However, most AI studies use a grid-based model28,32,33 forpatient-data representation which overlook patient–patient rela-tionships and are sub-optimal for inclusion of multiple datamodalities. Graph-based patient similarity networks (PSNs) haveshown promise for patient subtyping34,35. PSNs effectively modelpatient–patient relationships to intuitively enable heterogeneousdata integration and to cluster patients into subtypes based ontheir feature similarities. Addition of deep convolutional neuralnetworks (CNNs)-based learning of patient-data embeddings tothe PSN framework holds great potential to augment patientsubtype discovery through integrative usage of both genomicand EHR data.Graph convolutional networks (GCNs)36 are such an efficient
variant of CNNs operated on a network (i.e. graph) like PSN’s. GCNsoffer fast and scalable classification of nodes in a graph throughgraph embedding and convolutional operations. GCN hasdemonstrated promise in multiple biomedical applications suchas protein interface prediction and side effects prediction37. Wesought to explore the feasibility and effectiveness of applying GCNfor patient subtype discovery through integrative usage of EHRand genomic data.
1Translational Medicine, Research and Early Development, Oncology R&D, AstraZeneca, Boston, MA, USA. 2Department of Electrical Engineering and Computer Science,University of Missouri, Columbia, MO, USA. 3Christopher S Bond Life Sciences Center, University of Missouri, Columbia, MO, USA. 4Department of Biostatistics, Indiana UniversitySchool of Medicine, Indianapolis, IN, USA. 5Wake Forest Baptist Comprehensive Cancer Center, Winston-Salem, NC, USA. ✉email: [email protected]; [email protected];[email protected]
www.nature.com/npjdigitalmed
Published in partnership with Seoul National University Bundang Hospital
1234567890():,;

We developed a data-driven, unsupervised, graph-based AIrepresentation we call “DeePaN” (i.e. deep patient graphconvolutional network) to stratify NSCLC patients, integrating100 EHR and genomic data features from the Flatiron Health andFoundation Medicine NSCLC “clinico-genomic” database38 acrossa cohort of 1937 IO-treated NSCLC patients. Our “DeePaN”framework employs a GCN autoencoder (AE) to learn a patient-similarity-graph-based feature representation, followed by graphspectral clustering for patient subgrouping.The “DeePaN” framework stratified patients into subgroups with
distinct outcomes post-IO therapy, and this stratification was mostsignificant when both genomic and EHR data modalities wereintegrated. Median survival was 9.42 months from sub-groupswith poor survival vs. 20.35 months for the subgroup with bettersurvival (P-value of 2.2 × 10⁻¹¹). Comparatively, patient sub-groupings derived through well-established methods such as AE,uniform manifold approximation and projection (UMAP), andt-distributed Stochastic Neighbor Embedding (t-SNE) showed nosignificant difference on IO therapy outcome. Furthermore, wedemonstrated the potential to use this DeePaN grouping toaugment the clinical utility of an emerging IO biomarker, TMB.Characterization of the subgroups discovered by DeePaN indicatespotential to inform IO therapeutic insight, including the enrich-ment of KRAS mutations and high blood monocyte count in the IObeneficial subgroup and IO non-beneficial subgroup, respectively.“DeePaN” represents a graph-based AI framework with advances
of effectively integrating heterogeneous clinico-genomic datamodalities, leveraging graph embedding to intuitively modelpatient–patient relationships, and incorporating the high-performance of AI to capture complex relationships of patientdata. Our work demonstrates the feasibility and effectiveness ofemploying a graph-based AI approach to integrate RWE-basedhigh-dimensional EHRs and genomics to stratify NSCLC patients byIO benefit. The subtypes discovered in this work may cast new lighton understanding the heterogeneity of IO treatment responses, andpave ways to inform clinical decision making and therapeuticsinsight for precision oncology.
RESULTSBuilding an IO-treated NSCLC cohort with linked clinico-genomic dataThe aim of this study is to explore the feasibility and effectivenessto develop a data-driven, unsupervised, graph AI-based “deeppatient graph” (DeePaN) framework integrating genomics andEHRs to stratify NSCLC patients into subgroups useful for precisionimmunotherapy. Using Flatiron NSCLC clinico-genomic database,
we identified an IO-treated cohort of 1937 patients characterizedby 100 clinico-genomic features to develop and test this frame-work (“Methods” and Fig. 1). The cohort’s overall clinical anddemographic characteristics are shown in Table 1 and tumorgenomic characteristics are shown in Supplementary Fig. 1C.
Overview of the conceptual DeePaN frameworkFigure 1 illustrates the overall conceptual DeePaN framework.DeePaN employs a graph representation to summarize patientdata in an unsupervised AE, hereon referred to as the graphautoencoder (GAE). Specifically, each node in the graph representsa patient with node contents composed of “clinico-genomic”(combined genomic and EHR-derived clinical) features; linkedneighbor patient nodes share similar clinico-genomic features. TheGAE employs a “denoising process” to learn a graph embeddingby allowing node content to interact with network features(“Methods”). The addition of denoising with the GAE is referred toas the marginalized graph autoencoder (MGAE)39. After applica-tion of MGAE-based graph embedding, a graph-based spectralclustering was then applied to discover patient subgroups withdifferential IO-treatment benefit.
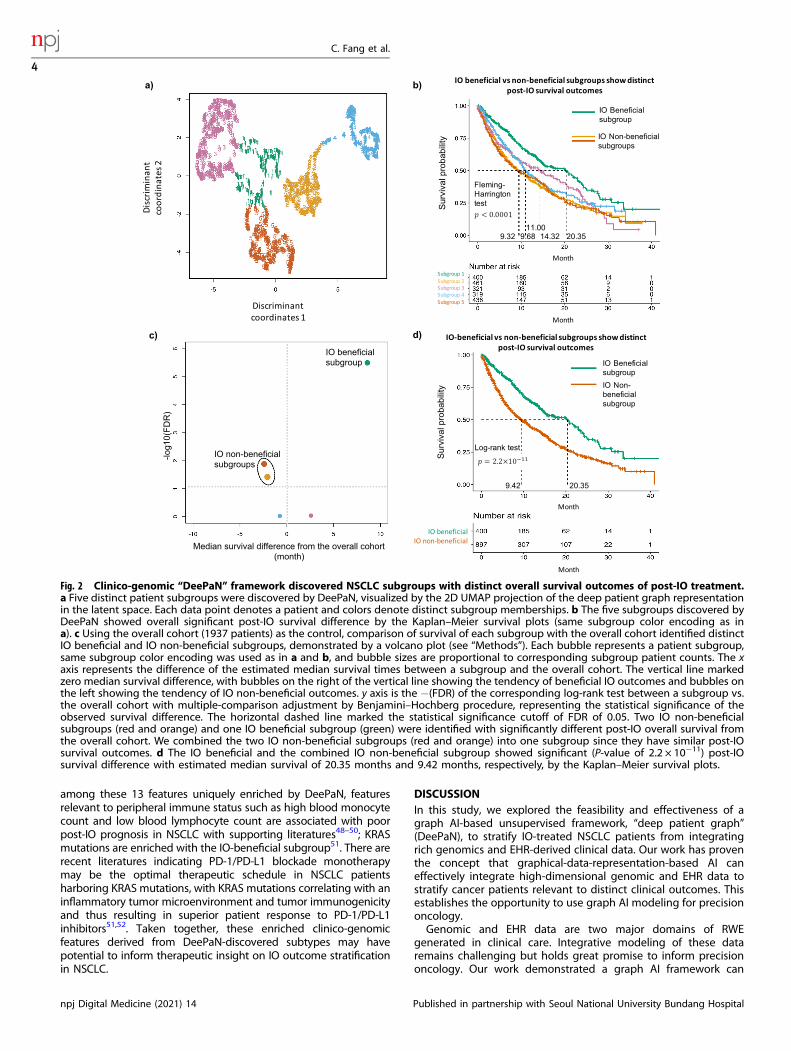
Patient subgroups from DeePaN show distinct IO treatmentbenefitFive distinct patient subgroups were identified (Fig. 2a) byDeePaN. Overall survival (OS) post IO treatments were comparedacross patient subgroups. The five subgroups showed significantOS differences (Fleming-Harrington test P-value <0.0001, mediansurvival ranging from 9.32 to 20.35 months, Fig. 2b). Thisdemonstrated DeePaN can effectively discover subgroups withdistinct immunotherapy outcomes. Using the overall cohort (1937patients) as the control, comparison of survival of each subgroupwith the overall cohort identified two subgroups with poorsurvival, and one subgroup with better survival (Fig. 2c). Since thetwo poor-survival subgroups have similar post-IO OS outcomes(Fig. 2b, c), we combined them as one single IO non-beneficialsubgroup (n= 897, 46.3% of the cohort), for comparison to thebetter survival group as the IO beneficial subgroup (n= 400,20.7% of the cohort). We found significantly different survival postIO between the two groups (log-rank P-value of 2.2 × 10⁻¹¹,median survival of 9.42 vs. 20.35 months, Fig. 2d and Supple-mentary Note 10). The demographic and pathologic character-istics of the IO beneficial and non-beneficial subgroups wereshown in Supplementary Table 1.
Fig. 1 The conceptual “DeePaN” framework as a deep patient graph convolutional network integrating electronic health records andgenomics to strategy NSCLC patients benefiting from immunotherapy. a An IO-treated NSCLC cohort (N= 1937) was identified fromFlatiron clinico-genomic database with linked EHRs and genomics data. The clinical and genomic features are preprocessed (see “Methods”section for details) and concatenated as raw patient-data representations. b The raw patient-data representations are modeled by a deeppatient graph convolutional network (GCN) implemented as the marginalized graph autoencoder (MGAE) to learn latent patientrepresentations. In GCN modeling, patients are represented as nodes, and patients with similar clinico-genomic features are linked by edges.Multiple layers of graph convolutional network are stacked to learn latent patient representations, with each layer of the graph neural networkbeing trained to produce a high-level patient-data representation from the output of the previous layer. c The graph-based deep patientrepresentations are then subjective to spectral clustering to discover patient subgroups with distinct immunotherapy outcomes to informprecision-oncology including patient stratification by IO benefit.
1234567890():,;
C. Fang et al.
2
npj Digital Medicine (2021) 14 Published in partnership with Seoul National University Bundang Hospital
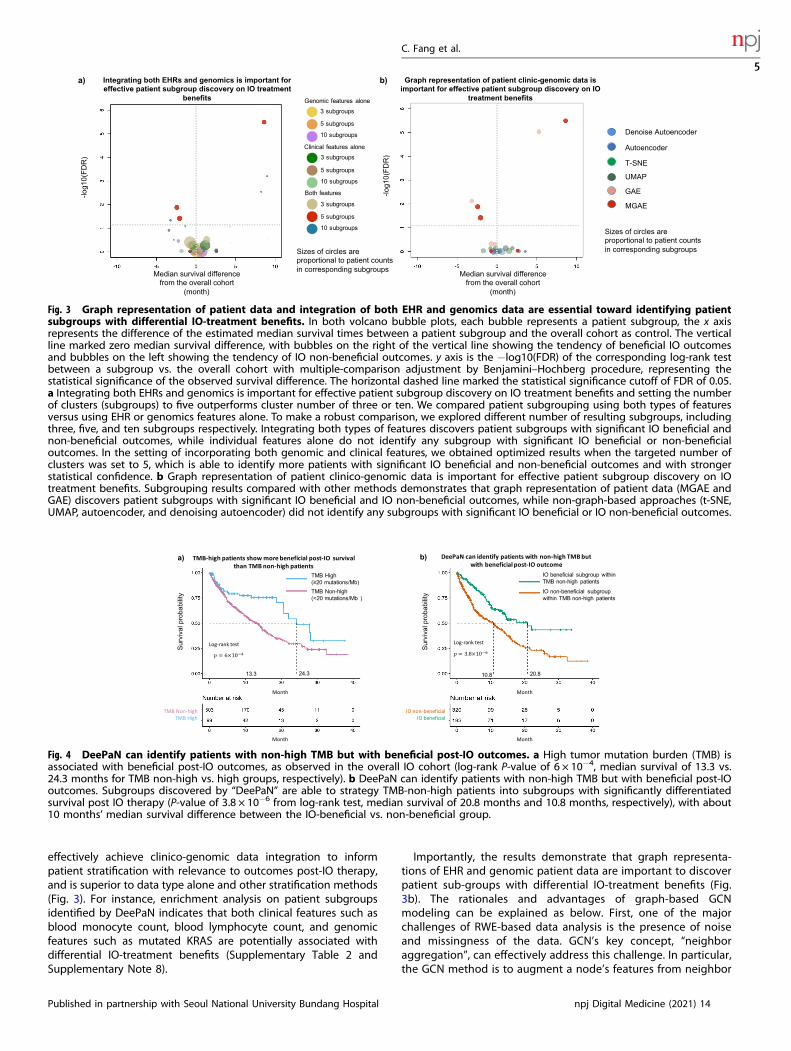
Graphical integration of EHR and genomics data is essentialTo evaluate whether integration of both EHR and genomicsfeatures is essential for effective identification of patientsubgroups with differential IO-treatment benefits, we comparedpatient grouping using both types of features versus using EHR orgenomics features alone (see “Methods”, “Performance evaluationon patient subgrouping by IO outcomes”). To make a robustcomparison, we explored patient grouping with different numbersof resulting subgroups, including three, five, and ten subgroups,respectively. The results demonstrated that integration of bothresources was essential to identify patient subgroups (Fig. 3a). Thishighlighted that integration of genomics and real-world clinicalphenotype evidence can represent and reveal more of thedeterminants of cancer patient survival than using genomics orphenotype data alone.Additionally, to investigate how (1) the patient–patient
relationship-based graph topology and (2) denoising processcontribute to the effectiveness to stratify patients into subgroupswith differential immunotherapy outcomes, we compared fourframeworks, our current MGAE which employed both the
patient–patient graph topology and the denoising process, (2)the GAE which employed only the patient–patient graph topologybut not the denoising process, (3) the denoising AE whichemployed only denoising process, and (4) the AE which employedneither (see Supplementary Note 7 for design details of thesemethods). The results indicate that the graph representation ofpatient–patient relationship is essential since only the MGAE andthe GAE are capable to identify sub-groups with differential IOtreatment benefits (Fig. 3b).Many unsupervised techniques now exist that can accept multi-
modal data as input. To further assess the performance of theDeePaN framework, we compared it with the commonly usedtSNE40 and UMAP41 methods. The results showed that only theDeePaN framework identifies subgroups with differential survivalpost IO therapy (Fig. 3b). We also compared the DeePaNframework with k-medoids clustering (see Supplementary Note 6).The results showed DeePaN has better performance than k-medoids clustering by identifying more patients with significantIO beneficial and IO non-beneficial outcomes and with strongerstatistical confidence (Supplementary Fig. 4). Additionally, wetested the robustness of the DeePaN framework using a ten-round“adjusted Rand index” test42, the result shows the framework isgenerally robust with a mean adjusted Rand index of 0.93 (seeSupplementary Note 5).
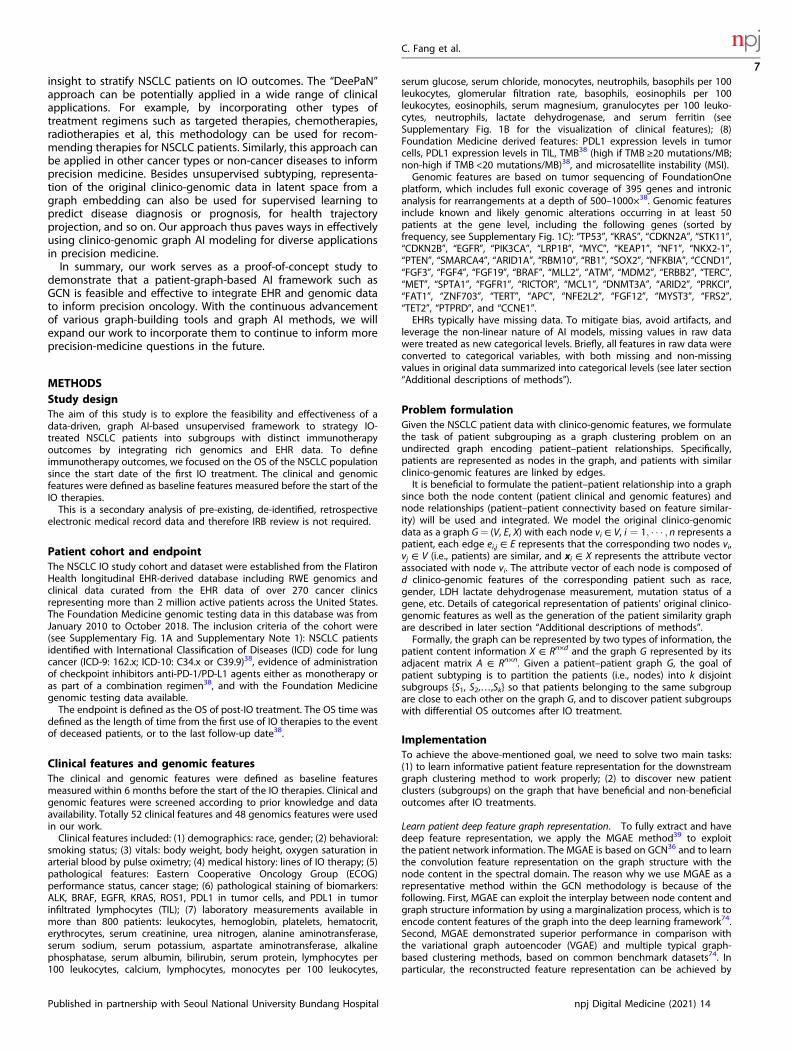
DeePaN discovered IO-beneficial patients with non-high TMBHigh TMB is an emerging biomarker utilized to enrich for patientslikely to benefit from IO therapy43,44, as observed in our Flatiron IOcohort (log-rank P-value of 6 × 10⁴, median survival of 13.3 vs.24.3 months for TMB non-high vs. TMB high groups, respectively,Fig. 4a). Many TMB non-high patients, however, may still benefitfrom IO therapy. We found that subtypes discovered by “DeePaN”were able to further strategy TMB non-high patients intosubgroups with significantly differential survival post-IO therapy(Fig. 4b, P-value of 3.8 × 10⁻⁶ from log-rank test, median survivalof 20.8 months and 10.8 months, respectively), with about10 months’ median survival difference between the IO-beneficialvs non-beneficial group. To assess if the better post-IO survivalgroup (green curve) in Fig. 4b has clinical-relevant beneficial IOoutcomes, we used three recently FDA-approved NSCLC IO trialsin 2019 and 2020 for references45–47. The better survival group hasthe median survival of 20.8 months, which is comparable with themedian survivals in these recent FDA-approved IO NSCLC trialsand therefore demonstrated clinical-relevant IO beneficial out-comes (see Supplementary Note 4 for details). This shows thatDeePaN can identify patients with non-high TMB but with clinical-relevant beneficial post-IO outcomes with a median survival ofover 20 months.
DeePaN subgrouping shows potential to inform therapeuticinsightTo inform biological insight of patient stratification with DeePaN,we characterized the IO beneficial vs. non-beneficial subgroupsidentified by DeePaN and identified 21 significantly enrichedclinico-genomic features (Supplementary Table 2). Many featureshave literature evidence indicating relevance to NSCLC prognosis(Supplementary Table 3). To explore the potential of DeePaN toreal new and complementary insight in comparison with classicalapproaches, we further explored the differences in biologicalinsight revealed by DeePaN compared to the classical log-ranktest (Supplementary Table 3). The log-rank test identified14 significant features associated with IO outcomes with eightfeatures in common with DeePaN. Thirteen out of 21 featuresenriched between DeePaN-defined subgroups did not show astatistically significant relationship to post-IO survival by log-rank,indicating the potential of DeePaN to inform insight on IOstratification complementary to the classical approach. For instance,
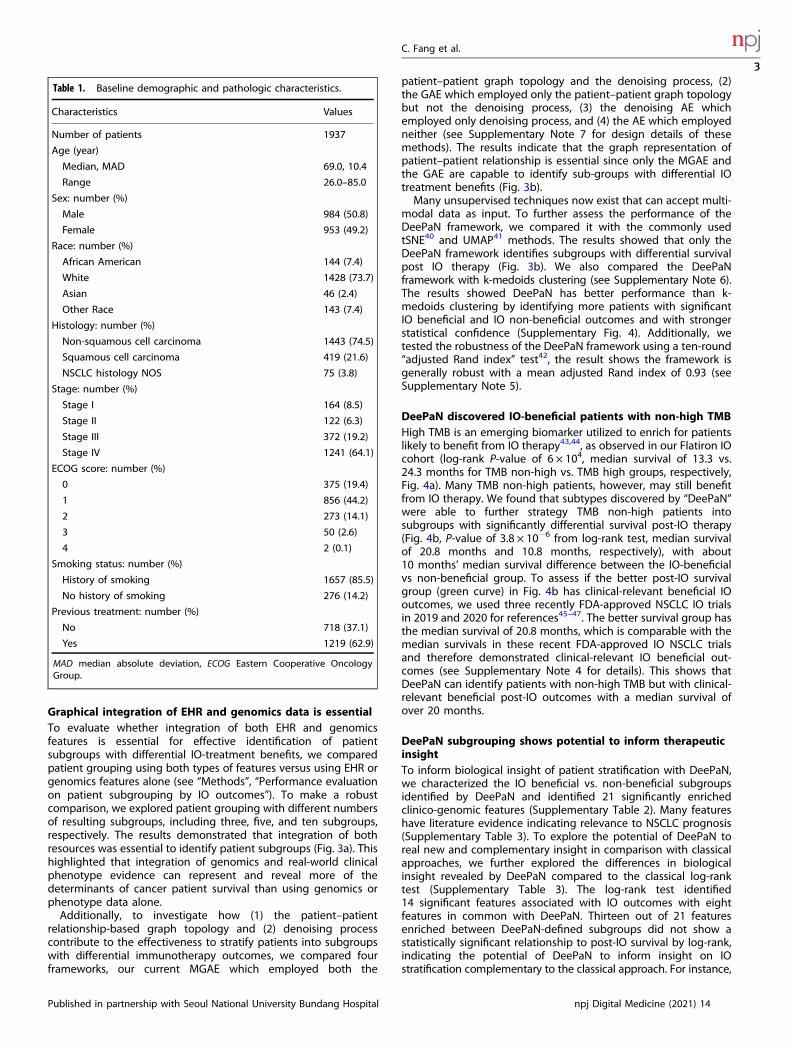
Table 1. Baseline demographic and pathologic characteristics.
Characteristics Values
Number of patients 1937
Age (year)
Median, MAD 69.0, 10.4
Range 26.0–85.0
Sex: number (%)
Male 984 (50.8)
Female 953 (49.2)
Race: number (%)
African American 144 (7.4)
White 1428 (73.7)
Asian 46 (2.4)
Other Race 143 (7.4)
Histology: number (%)
Non-squamous cell carcinoma 1443 (74.5)
Squamous cell carcinoma 419 (21.6)
NSCLC histology NOS 75 (3.8)
Stage: number (%)
Stage I 164 (8.5)
Stage II 122 (6.3)
Stage III 372 (19.2)
Stage IV 1241 (64.1)
ECOG score: number (%)
0 375 (19.4)
1 856 (44.2)
2 273 (14.1)
3 50 (2.6)
4 2 (0.1)
Smoking status: number (%)
History of smoking 1657 (85.5)
No history of smoking 276 (14.2)
Previous treatment: number (%)
No 718 (37.1)
Yes 1219 (62.9)
MAD median absolute deviation, ECOG Eastern Cooperative OncologyGroup.
C. Fang et al.
3
Published in partnership with Seoul National University Bundang Hospital npj Digital Medicine (2021) 14
1234567890():,;
among these 13 features uniquely enriched by DeePaN, featuresrelevant to peripheral immune status such as high blood monocytecount and low blood lymphocyte count are associated with poorpost-IO prognosis in NSCLC with supporting literatures48–50; KRASmutations are enriched with the IO-beneficial subgroup51. There arerecent literatures indicating PD-1/PD-L1 blockade monotherapymay be the optimal therapeutic schedule in NSCLC patientsharboring KRAS mutations, with KRAS mutations correlating with aninflammatory tumor microenvironment and tumor immunogenicityand thus resulting in superior patient response to PD-1/PD-L1inhibitors51,52. Taken together, these enriched clinico-genomicfeatures derived from DeePaN-discovered subtypes may havepotential to inform therapeutic insight on IO outcome stratificationin NSCLC.
DISCUSSIONIn this study, we explored the feasibility and effectiveness of agraph AI-based unsupervised framework, “deep patient graph”(DeePaN), to stratify IO-treated NSCLC patients from integratingrich genomics and EHR-derived clinical data. Our work has proventhe concept that graphical-data-representation-based AI caneffectively integrate high-dimensional genomic and EHR data tostratify cancer patients relevant to distinct clinical outcomes. Thisestablishes the opportunity to use graph AI modeling for precisiononcology.Genomic and EHR data are two major domains of RWE
generated in clinical care. Integrative modeling of these dataremains challenging but holds great promise to inform precisiononcology. Our work demonstrated a graph AI framework can
Fig. 2 Clinico-genomic “DeePaN” framework discovered NSCLC subgroups with distinct overall survival outcomes of post-IO treatment.a Five distinct patient subgroups were discovered by DeePaN, visualized by the 2D UMAP projection of the deep patient graph representationin the latent space. Each data point denotes a patient and colors denote distinct subgroup memberships. b The five subgroups discovered byDeePaN showed overall significant post-IO survival difference by the Kaplan–Meier survival plots (same subgroup color encoding as ina). c Using the overall cohort (1937 patients) as the control, comparison of survival of each subgroup with the overall cohort identified distinctIO beneficial and IO non-beneficial subgroups, demonstrated by a volcano plot (see “Methods”). Each bubble represents a patient subgroup,same subgroup color encoding was used as in a and b, and bubble sizes are proportional to corresponding subgroup patient counts. The xaxis represents the difference of the estimated median survival times between a subgroup and the overall cohort. The vertical line markedzero median survival difference, with bubbles on the right of the vertical line showing the tendency of beneficial IO outcomes and bubbles onthe left showing the tendency of IO non-beneficial outcomes. y axis is the −(FDR) of the corresponding log-rank test between a subgroup vs.the overall cohort with multiple-comparison adjustment by Benjamini–Hochberg procedure, representing the statistical significance of theobserved survival difference. The horizontal dashed line marked the statistical significance cutoff of FDR of 0.05. Two IO non-beneficialsubgroups (red and orange) and one IO beneficial subgroup (green) were identified with significantly different post-IO overall survival fromthe overall cohort. We combined the two IO non-beneficial subgroups (red and orange) into one subgroup since they have similar post-IOsurvival outcomes. d The IO beneficial and the combined IO non-beneficial subgroup showed significant (P-value of 2.2 × 10⁻¹¹) post-IOsurvival difference with estimated median survival of 20.35 months and 9.42 months, respectively, by the Kaplan–Meier survival plots.
C. Fang et al.
4
npj Digital Medicine (2021) 14 Published in partnership with Seoul National University Bundang Hospital
effectively achieve clinico-genomic data integration to informpatient stratification with relevance to outcomes post-IO therapy,and is superior to data type alone and other stratification methods(Fig. 3). For instance, enrichment analysis on patient subgroupsidentified by DeePaN indicates that both clinical features such asblood monocyte count, blood lymphocyte count, and genomicfeatures such as mutated KRAS are potentially associated withdifferential IO-treatment benefits (Supplementary Table 2 andSupplementary Note 8).
Importantly, the results demonstrate that graph representa-tions of EHR and genomic patient data are important to discoverpatient sub-groups with differential IO-treatment benefits (Fig.3b). The rationales and advantages of graph-based GCNmodeling can be explained as below. First, one of the majorchallenges of RWE-based data analysis is the presence of noiseand missingness of the data. GCN’s key concept, “neighboraggregation”, can effectively address this challenge. In particular,the GCN method is to augment a node’s features from neighbor
Fig. 3 Graph representation of patient data and integration of both EHR and genomics data are essential toward identifying patientsubgroups with differential IO-treatment benefits. In both volcano bubble plots, each bubble represents a patient subgroup, the x axisrepresents the difference of the estimated median survival times between a patient subgroup and the overall cohort as control. The verticalline marked zero median survival difference, with bubbles on the right of the vertical line showing the tendency of beneficial IO outcomesand bubbles on the left showing the tendency of IO non-beneficial outcomes. y axis is the −log10(FDR) of the corresponding log-rank testbetween a subgroup vs. the overall cohort with multiple-comparison adjustment by Benjamini–Hochberg procedure, representing thestatistical significance of the observed survival difference. The horizontal dashed line marked the statistical significance cutoff of FDR of 0.05.a Integrating both EHRs and genomics is important for effective patient subgroup discovery on IO treatment benefits and setting the numberof clusters (subgroups) to five outperforms cluster number of three or ten. We compared patient subgrouping using both types of featuresversus using EHR or genomics features alone. To make a robust comparison, we explored different number of resulting subgroups, includingthree, five, and ten subgroups respectively. Integrating both types of features discovers patient subgroups with significant IO beneficial andnon-beneficial outcomes, while individual features alone do not identify any subgroup with significant IO beneficial or non-beneficialoutcomes. In the setting of incorporating both genomic and clinical features, we obtained optimized results when the targeted number ofclusters was set to 5, which is able to identify more patients with significant IO beneficial and non-beneficial outcomes and with strongerstatistical confidence. b Graph representation of patient clinico-genomic data is important for effective patient subgroup discovery on IOtreatment benefits. Subgrouping results compared with other methods demonstrates that graph representation of patient data (MGAE andGAE) discovers patient subgroups with significant IO beneficial and IO non-beneficial outcomes, while non-graph-based approaches (t-SNE,UMAP, autoencoder, and denoising autoencoder) did not identify any subgroups with significant IO beneficial or IO non-beneficial outcomes.
Fig. 4 DeePaN can identify patients with non-high TMB but with beneficial post-IO outcomes. a High tumor mutation burden (TMB) isassociated with beneficial post-IO outcomes, as observed in the overall IO cohort (log-rank P-value of 6 × 10⁻⁴, median survival of 13.3 vs.24.3 months for TMB non-high vs. high groups, respectively). b DeePaN can identify patients with non-high TMB but with beneficial post-IOoutcomes. Subgroups discovered by “DeePaN” are able to strategy TMB-non-high patients into subgroups with significantly differentiatedsurvival post IO therapy (P-value of 3.8 × 10⁻⁶ from log-rank test, median survival of 20.8 months and 10.8 months, respectively), with about10 months’ median survival difference between the IO-beneficial vs. non-beneficial group.
C. Fang et al.
5
Published in partnership with Seoul National University Bundang Hospital npj Digital Medicine (2021) 14

aggregation in a bottom-up fashion, i.e. augmenting a givenpatient’s clinico-genomic features from borrowing informationfrom its similar neighbors, as a result, the clinico-genomicfeatures of a given patient would be augmented with increasedprecision and less missingness. Second, GCN modeling of patientrelationships also enables us to take into account the specificityof network context associated with each different neighborhoodto augment a patient’s clinico-genomic features accordingly.Compared with alternative methods such as AE, which assumesall the patients are independent, GCN is expected to utilize thepatient-to-patient similarity relationships more effectively andhence achieve better signal-to-noise ratio for patient subtypeclustering and discovery. Third, another advantage of using GCNmethod stems from the fact that GCN enables utilization of theglobal patient network topology for effective patient subtypeclustering, which takes into account all the patients and theirsimilarities in a hierarchical structure. Through iterative graphconvolution and stacking multiple layers of GCNs, the GCNmethod effectively enables leveraging the global networktopology by integrating both the direct first neighbor and thenon-direct neighbors such as the second and third neighborswith suitable weights, reflecting their relative importance atdifferent levels of neighborhood. This is not achieved throughtypical graph approaches, most of which only consider condi-tional dependence by edges of directly neighboring nodes. Last,similar usage of topological information derived from nodefeatures for graph modeling has been proved successful inrecent biomedical informatics applications such as single-cellRNA-seq data analysis53–57, particularly in the GCN setting58,59,where the edges of the cell graph were derived from kNN ofgene expression profiles.Characterization of the IO beneficial vs. non-beneficial sub-
groups identified by DeePaN indicates potential to inform newand complementary therapeutic insight for IO stratification inNSCLC in comparison with classical approaches such as the log-rank test approach (Supplementary Table 3). Mechanistic insighton IO outcomes in NSCLC was indicated by features significantlyenriched by DeePaN-discovered patient subgroups but notreaching statistical significance by log-rank test. For instance,the enrichment of high blood monocyte count and lowlymphocyte count in the IO non-beneficial group identified byDeePaN indicates that host peripheral immune status maycontribute to IO outcomes; the enrichment of mutated KRAS inthe IO beneficial subgroup was supported by literature evidencethat KRAS mutations correlating with an inflammatory tumormicroenvironment and tumor immunogenicity and thus resultingin superior patient response to PD-1/PD-L1 inhibitors in NSCLC51.Another DeePaN unique finding is the enrichment of mutatedNKX2-1 gene in the IO-beneficial subgroup. NKX2-1 is a proto-oncogene contributing to lung cancer development, literatureevidences are debating the role of NKX2-1 in lung cancerprognosis, our finding supports to continue to explore its roleon post-IO prognosis60.There are opportunities for future work. First, in EHRs, the
existence of an assay result or the design of the treatment plan fora patient can be the result of comprehensive factors includingeconomic stabilities, educations, community and social context,et al. One aspect of future work is to include more features such associal economic conditions et al into modeling. Second, as agraph-based AI framework, DeePaN utilized both the non-linearcombination of clinico-genomic features and the patient graphstructure for effective subtype identification, it remains challen-ging to biologically interpret this process61. We utilized enrichedclinico-genomic features derived from DeePaN-discovered patientsubtypes to inform therapeutic insight, which can be improved byfuture work of developing more interpretable graph-AI models suchas graph attention networks62 to understand what drives the patientstratification to inform biomarker and therapeutic insight discovery.
To validate “DeePaN”-discovered patients’ subtypes to inform clinicalinsight, we suggest that, as many researchers have argued61,63,64
and the U.S. Food and Drug Administration has been advocating65,66
and practicing67, AI models should be considered as medical devicesor drugs and thus the effectiveness and safety should be evaluatedthrough randomized clinical trials, including EHR-based pragmatictrials. A future direction will be to use multi-site randomizedpragmatic trials to examine the effectiveness of the identifiedsubtypes in augmenting clinical decisions on immunotherapies.Additionally, during the translation of a model to real-worldimplementation, the difference between the training and theimplementation cohorts may undermine model’s effectiveness andaccuracy. Due to the interpretability challenges of AI models, theimpact of cohort difference on model performance cannot be aprioriestimated and adjusted. Instead, transfer learning and otherapproaches are used68–70. Our model has great potential in transferlearning, benefited from the highly representative training cohort.The Flatiron cancer clinico-genomics data were collected from over270 different cancer clinics across the nation, allowing our model tocapture the common relations between biomarkers and IOresponses shared by these clinics. Therefore, our model hasbeneficial generalizability and transfer learning potential whenimplemented for a specific healthcare provider. There is also roomfor improving the GCN model to address the over-smoothing issue,i.e., indistinguishable representations of nodes in different classes71
by exploring latest methods72,73.Future work also includes exploring how the identified subtypes
can be utilized in reality. First, the clinico-genomic featuresenriched in the IO-beneficial vs. non-beneficial subtypes can assistclinicians to decide what clinico-genomic tests to order to informif IO therapy shall be prescribed for a new patient. Many of theseenriched clinico-genomic features are relatively easy to measurefrom blood lab tests or genomic tests (see Supplementary Table 2).For instance, if a patient’s genomic test shows the presence ofKRAS mutation, immunotherapy might be considered as apreferred therapy based on the insight discovery from our study.Second, a new patient can be assigned to a subtype according tomodeling of clinico-genomic features. Many well-establishedapproaches can be used for such purposes. For example, thetrained DeePaN model, together with the training data, can bedirectly used as a transductive model to predict the subtype of anew patient through transfer learning. Our robustness test results(Supplementary Note 5) suggest that the subtyping results of theDeePaN model remain stable when the cohort varies slightly.Other approaches such as label transfer57,59 or supervised learningcan also be used to assign new patients to DeePaN-discovered IObeneficial or non-beneficial group to inform clinical decisionmaking. Last, in our future work, we can also explore predictivemodeling to directly predict a new patient’s clinical outcome,which can be synergized with the patient-subgroup findings fromDeePaN. For instance, we can include the enriched featurescharacterizing IO-beneficial vs. non-beneficial subgroups as pre-selected input features to enhance predictive modeling (seeSupplementary Note 9).Our work thus provides evidence that integrative modeling
using genomics and EHR data in a graph AI framework has clinicalutility in precision oncology. As a case study, we show that as anemerging IO biomarker, although TMB-high vs. TMB-non-highgroups are associated better and worse post-IO outcomesrespectively, the TMB-non-high group may contain a heteroge-neous patient population with distinct post-IO outcomes (Fig. 4a,b). Importantly, patient subgrouping discovered from our DeePaNframework can effectively stratify the heterogeneous TMB-non-high group to identify patient subtypes with non-high TMB butbeneficial IO outcomes. This highlights the potential clinical utilityof our framework on augmentation of the TMB IO biomarker.Characterization of the IO beneficial vs. non-beneficial subgroupsdiscovered by DeePaN indicates potential to inform therapeutic
C. Fang et al.
6
npj Digital Medicine (2021) 14 Published in partnership with Seoul National University Bundang Hospital
insight to stratify NSCLC patients on IO outcomes. The “DeePaN”approach can be potentially applied in a wide range of clinicalapplications. For example, by incorporating other types oftreatment regimens such as targeted therapies, chemotherapies,radiotherapies et al, this methodology can be used for recom-mending therapies for NSCLC patients. Similarly, this approach canbe applied in other cancer types or non-cancer diseases to informprecision medicine. Besides unsupervised subtyping, representa-tion of the original clinico-genomic data in latent space from agraph embedding can also be used for supervised learning topredict disease diagnosis or prognosis, for health trajectoryprojection, and so on. Our approach thus paves ways in effectivelyusing clinico-genomic graph AI modeling for diverse applicationsin precision medicine.In summary, our work serves as a proof-of-concept study to
demonstrate that a patient-graph-based AI framework such asGCN is feasible and effective to integrate EHR and genomic datato inform precision oncology. With the continuous advancementof various graph-building tools and graph AI methods, we willexpand our work to incorporate them to continue to inform moreprecision-medicine questions in the future.
METHODSStudy designThe aim of this study is to explore the feasibility and effectiveness of adata-driven, graph AI-based unsupervised framework to strategy IO-treated NSCLC patients into subgroups with distinct immunotherapyoutcomes by integrating rich genomics and EHR data. To defineimmunotherapy outcomes, we focused on the OS of the NSCLC populationsince the start date of the first IO treatment. The clinical and genomicfeatures were defined as baseline features measured before the start of theIO therapies.This is a secondary analysis of pre-existing, de-identified, retrospective
electronic medical record data and therefore IRB review is not required.
Patient cohort and endpointThe NSCLC IO study cohort and dataset were established from the FlatironHealth longitudinal EHR-derived database including RWE genomics andclinical data curated from the EHR data of over 270 cancer clinicsrepresenting more than 2 million active patients across the United States.The Foundation Medicine genomic testing data in this database was fromJanuary 2010 to October 2018. The inclusion criteria of the cohort were(see Supplementary Fig. 1A and Supplementary Note 1): NSCLC patientsidentified with International Classification of Diseases (ICD) code for lungcancer (ICD-9: 162.x; ICD-10: C34.x or C39.9)38, evidence of administrationof checkpoint inhibitors anti-PD-1/PD-L1 agents either as monotherapy oras part of a combination regimen38, and with the Foundation Medicinegenomic testing data available.The endpoint is defined as the OS of post-IO treatment. The OS time was
defined as the length of time from the first use of IO therapies to the eventof deceased patients, or to the last follow-up date38.
Clinical features and genomic featuresThe clinical and genomic features were defined as baseline featuresmeasured within 6 months before the start of the IO therapies. Clinical andgenomic features were screened according to prior knowledge and dataavailability. Totally 52 clinical features and 48 genomics features were usedin our work.Clinical features included: (1) demographics: race, gender; (2) behavioral:
smoking status; (3) vitals: body weight, body height, oxygen saturation inarterial blood by pulse oximetry; (4) medical history: lines of IO therapy; (5)pathological features: Eastern Cooperative Oncology Group (ECOG)performance status, cancer stage; (6) pathological staining of biomarkers:ALK, BRAF, EGFR, KRAS, ROS1, PDL1 in tumor cells, and PDL1 in tumorinfiltrated lymphocytes (TIL); (7) laboratory measurements available inmore than 800 patients: leukocytes, hemoglobin, platelets, hematocrit,erythrocytes, serum creatinine, urea nitrogen, alanine aminotransferase,serum sodium, serum potassium, aspartate aminotransferase, alkalinephosphatase, serum albumin, bilirubin, serum protein, lymphocytes per100 leukocytes, calcium, lymphocytes, monocytes per 100 leukocytes,
serum glucose, serum chloride, monocytes, neutrophils, basophils per 100leukocytes, glomerular filtration rate, basophils, eosinophils per 100leukocytes, eosinophils, serum magnesium, granulocytes per 100 leuko-cytes, neutrophils, lactate dehydrogenase, and serum ferritin (seeSupplementary Fig. 1B for the visualization of clinical features); (8)Foundation Medicine derived features: PDL1 expression levels in tumorcells, PDL1 expression levels in TIL, TMB38 (high if TMB ≥20 mutations/MB;non-high if TMB <20 mutations/MB)38, and microsatellite instability (MSI).Genomic features are based on tumor sequencing of FoundationOne
platform, which includes full exonic coverage of 395 genes and intronicanalysis for rearrangements at a depth of 500–1000×38. Genomic featuresinclude known and likely genomic alterations occurring in at least 50patients at the gene level, including the following genes (sorted byfrequency, see Supplementary Fig. 1C): “TP53”, “KRAS”, “CDKN2A”, “STK11”,“CDKN2B”, “EGFR”, “PIK3CA”, “LRP1B”, “MYC”, “KEAP1”, “NF1”, “NKX2-1”,“PTEN”, “SMARCA4”, “ARID1A”, “RBM10”, “RB1”, “SOX2”, “NFKBIA”, “CCND1”,“FGF3”, “FGF4”, “FGF19”, “BRAF”, “MLL2”, “ATM”, “MDM2”, “ERBB2”, “TERC”,“MET”, “SPTA1”, “FGFR1”, “RICTOR”, “MCL1”, “DNMT3A”, “ARID2”, “PRKCI”,“FAT1”, “ZNF703”, “TERT”, “APC”, “NFE2L2”, “FGF12”, “MYST3”, “FRS2”,“TET2”, “PTPRD”, and “CCNE1”.EHRs typically have missing data. To mitigate bias, avoid artifacts, and
leverage the non-linear nature of AI models, missing values in raw datawere treated as new categorical levels. Briefly, all features in raw data wereconverted to categorical variables, with both missing and non-missingvalues in original data summarized into categorical levels (see later section“Additional descriptions of methods”).
Problem formulationGiven the NSCLC patient data with clinico-genomic features, we formulatethe task of patient subgrouping as a graph clustering problem on anundirected graph encoding patient–patient relationships. Specifically,patients are represented as nodes in the graph, and patients with similarclinico-genomic features are linked by edges.It is beneficial to formulate the patient–patient relationship into a graph
since both the node content (patient clinical and genomic features) andnode relationships (patient–patient connectivity based on feature similar-ity) will be used and integrated. We model the original clinico-genomicdata as a graph G= (V, E, X) with each node vi ∈ V, i ¼ 1; � � � ; n represents apatient, each edge ei,j ∈ E represents that the corresponding two nodes vi,vj ∈ V (i.e., patients) are similar, and xi ∈ X represents the attribute vectorassociated with node vi. The attribute vector of each node is composed ofd clinico-genomic features of the corresponding patient such as race,gender, LDH lactate dehydrogenase measurement, mutation status of agene, etc. Details of categorical representation of patients’ original clinico-genomic features as well as the generation of the patient similarity graphare described in later section “Additional descriptions of methods”.Formally, the graph can be represented by two types of information, the
patient content information X ∈ Rn×d and the graph G represented by itsadjacent matrix A ∈ Rn×n. Given a patient–patient graph G, the goal ofpatient subtyping is to partition the patients (i.e., nodes) into k disjointsubgroups {S1, S2,…,Sk} so that patients belonging to the same subgroupare close to each other on the graph G, and to discover patient subgroupswith differential OS outcomes after IO treatment.
ImplementationTo achieve the above-mentioned goal, we need to solve two main tasks:(1) to learn informative patient feature representation for the downstreamgraph clustering method to work properly; (2) to discover new patientclusters (subgroups) on the graph that have beneficial and non-beneficialoutcomes after IO treatments.
Learn patient deep feature graph representation. To fully extract and havedeep feature representation, we apply the MGAE method39 to exploitthe patient network information. The MGAE is based on GCN36 and to learnthe convolution feature representation on the graph structure with thenode content in the spectral domain. The reason why we use MGAE as arepresentative method within the GCN methodology is because of thefollowing. First, MGAE can exploit the interplay between node content andgraph structure information by using a marginalization process, which is toencode content features of the graph into the deep learning framework74.Second, MGAE demonstrated superior performance in comparison withthe variational graph autoencoder (VGAE) and multiple typical graph-based clustering methods, based on common benchmark datasets74. Inparticular, the reconstructed feature representation can be achieved by
C. Fang et al.
7
Published in partnership with Seoul National University Bundang Hospital npj Digital Medicine (2021) 14
training an MGAE39 on this patient network using the objective function Las “Eq. (1)”:
L ¼ 1m
Xm
i¼1
jX � ~D�12~A~D�1
2~XiW���
���2þ λjjWjj2F (1)
where ~X ¼ ~X1; ¼ ; ~Xm� �
represents m corrupted copies of the originalinput X ¼ x1; ¼ ; xnf g 2 Rn´ d , ~A ¼ Aþ I is the adjacent matrix modifiedwith self-connections, I is the identity matrix, ~D is the degree matrix of ~A, Wis trainable weights, �k k2F is Frobenius norm, and λ is the regularizationcoefficient.To learn a deep feature representation of patients’ network, we built up
the network in a deep layer fashion by stacking multiple layers of AEs (Fig. 1).The patients’ representation from the output (l− 1)-th layer Z(l−1) can bethen used as input of the l-th layer. We used the reconstructed output fromthe last layer as the high-level patients’ representation for downstreamanalysis, i.e. detection of new patient subgroups. The implementation ofMGAE is based on the open-source code available at https://github.com/FakeTibbers/MGAE.We also explored different numbers of hidden layers as a major hyper
parameter tuning, including one, three, five, and ten hidden layers. Weselected three hidden layers, which is able to identify more patients withsignificant IO beneficial and IO non-beneficial outcomes or with strongerstatistical confidence than hidden layers of one, five, and ten (seeSupplementary Fig. 3 and Supplementary Note 3).Regarding other design details of our graph neural network, based on
the recommended hyperparameters in similar models published byothers74, we set the noise corruption level to be 0.4, network regularizationlambda to be 1e−5, and set the number of feature maps for each hiddenlayer to be 275.
Discovery of patient subgroups. The learned representation Z0 for thepatients’ graph, which is reconstructed from MGAE’s representation(integration of both content and structure information), can then be usedto discover patient subgroups. We applied the spectral clusteringalgorithm39 to discover patient subgroups. Before directly applying spectralclustering, we refine the reconstructed representation Z0 as follows:
i. Apply a linear kernel function to achieve Z1 as described by “Eq. (2)”to learn the pairwise relationship for the patient node;
Z1 ¼ Z0ZT0 (2)
ii. Ensure the representation is symmetric and nonnegative, and weachieved normalized Laplacian Z2 as described by “Eq. (3)”
Z2 ¼ 12
Z1j j þ ZT1
�� ��� �(3)
New clusters (i.e. patient subgroups) were then identified using a spectralclustering algorithm, which was done by running k-means on the top numberof clusters eigenvectors of the normalized Laplacian Z2. Those clusters areidentified as new patient subgroups. Spectral clustering is commonly used toperform dimensionality reduction from all the nodes in a graph and identifyclusters of nodes75. It is probably a more natural fit to graph neural networks,which also incorporate the global information of a graph, than a “bottom-up”approach like hierarchical agglomerative clustering.We explored different numbers of clusters (patient subgroups) as a major
hyper parameter tuning, including three, five, ten clusters (Fig. 3a,Supplementary Note 2, and Supplementary Fig. 2). As demonstrated inFig. 3a, in the setting of incorporating both genomic and clinical features, weobtained optimized results when the targeted number of clusters was set tofive, which is able to identify more patients with significant IO beneficial andnon-beneficial outcomes and with stronger statistical confidence.We used the Kaplan–Meier (KM) estimate76 to assess if discovered
subgroups have differentiable post-IO survival outcomes to inform patientstratification benefiting from IO therapies. For crossed over survival curves,log-rank test is not appropriate to calculate test statistics. Therefore, we haveused Fleming-Harrington test to calculate the P-value for the crossed KMplots77 using “surv_pvalue” function from R package “survminer v0.4.7”.
Performance evaluation on patient subgrouping by IO outcomes. Our goalis to provide actionable insight to support the clinical decision for immunetherapy, i.e. to cluster patients into subgroups and decide whichsubgroups are IO-beneficial or IO non-beneficial. We therefore used three
measures impacting relevance to IO outcomes to assess the performanceby a volcano plot (see Fig. 2c as an example). These criteria were (1)difference of median survival times between an identified cluster and theoverall cohort as the baseline, with positive values corresponding to thetendency of IO beneficial outcomes and negative values corresponding tothe tendency of IO non-beneficial outcomes (x axis); (2) statisticalsignificance of the observed survival difference between an identifiedcluster and the overall cohort as the baseline (y axis); and (3) percentage ofpatients clearly assigned to significant IO beneficial and IO non-beneficialclusters using a FDR cutoff of 0.05.A better performance corresponds to identify more patients with
significant IO beneficial and non-beneficial outcomes, with strongerstatistical significance, and with bigger median survival difference incomparison with the overall cohort as the baseline.
Additional descriptions of methodsClinico-genomic feature encoding and defining linked patients. In theDeePaN modeling, patients are represented as nodes in the graph withassociated clinico-genomic features, and patients with similar clinico-genomic features are linked by edges. The node features are encoded bycategorical feature vectors X. In particular, the genomic features are binaryencoding, i.e. if a patient carries one or more known or likely geneticalternations in a gene, the corresponding gene feature is 1; otherwise, 0.For numerical features, we used the high- and low-bound measurementannotations provided by EHRs to bin the numerical features intocategorical features. For example, a patient has the hemoglobinmeasurement as 8.3 g per deciliter, the low- and high-bound referencesfor hemoglobin are 14 and 18 g per deciliter, respectively. Since it fallsbetween two bounds, it is categorized as the “normal” class. There are 100clinico-genomic features included, which are encoded as 275 featuredimensions. The two nodes are connected if the node feature vectors aresimilar. Here we employed cosine similarity to define similarity35. Thereasons to use cosine similarity is as below. First, cosine similarity has beensuccessfully used to estimate patient similarity based on EHRs35. Second,the usage of cosine similarity for binary attributes is supported by multipleliterature recommendations78–80. We then used the cosine similarity of 0.5as an empirical cutoff. If cosine similarity is less than 0.5, then there is not alink between two nodes; otherwise, connected. The similarity threshold 0.5is chosen based on previous literatures’ recommendation28,35.
Missing data handling. EHRs typically have missing data. To mitigate bias,avoid artifacts, and leverage the non-linear nature of AI models, missingvalues in raw data were treated as new categorical levels. Briefly, allfeatures in raw data were converted to categorical variables, with bothmissing and non-missing values in original data summarized intocategorical levels. This approach, comparing with imputation, providesmany advantages. (1) Better use of the RWE data. EHR data are ofteninformatively censored, with data availability patterns associated withpatients’ health status, access to healthcare, and clinical decisions. Ourapproach allowed such valuable information being intuitively captured,represented, and utilized in our model. (2) Mitigates artifacts and biases.Imputation approaches rely on information from non-missing values fromclosely associated features. These features often show similar data missingpatterns in RWE data, known as structural data missing. For example, all labresults generated from the basic metabolic panel have the sameavailability pattern. This unique challenge undermines the efficiency ofdata imputation and exaggerates artifacts81. (3) Suitable for AI models. Onemajor concern of categorizing missing values instead of imputing them isthe bias and artifacts in linear models. The intrinsic nonlinear nature of AImodels allows effective leveraging such data representation. Therefore, inour work, we categorize missing values to better reserve useful informationand avoid artifacts and biases.
Reporting summaryFurther information on research design is available in the Nature ResearchReporting Summary linked to this article.
DATA AVAILABILITYThe data used in this manuscript were obtained from a de-identified clinico-genomicEHR Database generated and maintained by Flatiron Health (Flatiron Health Inc, NewYork, NY). Flatiron Health is subject to the requirements of the Health InsurancePortability and Accountability Act of 1996 (HIPAA) including appropriate
C. Fang et al.
8
npj Digital Medicine (2021) 14 Published in partnership with Seoul National University Bundang Hospital

de-identification of patients. The authors do not have permission to give publicaccess to the study dataset. Please refer any questions or requests regarding dataused in this manuscript to the following email address: [email protected].
CODE AVAILABILITYAll tools and statistical methods used in our analysis have been described in“Methods” including access of open-source code. Additional statistical codes andmachine learning implementations will be made available upon request submitted tothe corresponding authors.
Received: 26 March 2020; Accepted: 5 January 2021;
REFERENCES1. Lee, C. K. et al. Checkpoint inhibitors in metastatic EGFR-mutated non–small cell
lung cancer—a meta-analysis. J. Thorac. Oncol. 12, 403–407 (2017).2. Aguiar, P. Jr et al. The effect of PD-L1 testing on the cost-effectiveness and
economic impact of immune checkpoint inhibitors for the second-line treatmentof NSCLC. Ann. Oncol. 28, 2256–2263 (2017).
3. Langer, C. J. Emerging immunotherapies in the treatment of non–small cell lungcancer (NSCLC): the role of immune checkpoint inhibitors. Am. J. Clin. Oncol. 38,422–430 (2015).
4. James, C. D. et al. Clonal genomic alterations in glioma malignancy stages. CancerRes. 48, 5546–5551 (1988).
5. Simon, R., Geyer, S., Subramanian, J. & Roychowdhury, S. The Bayesian basketdesign for genomic variant-driven phase II trials. Semin Oncol. 43, 13–18 (2016).
6. Habashy, H. O. et al. Transferrin receptor (CD71) is a marker of poor prognosis inbreast cancer and can predict response to tamoxifen. Breast Cancer Res. Treat.119, 283 (2010).
7. Miller, V. A. et al. Bronchioloalveolar pathologic subtype and smoking historypredict sensitivity to gefitinib in advanced non-small-cell lung cancer. J. Clin.Oncol. 22, 1103–1109 (2004).
8. Shim, H. S., Lee, D. H., Park, E. J. & Kim, S. H. Histopathologic characteristics of lungadenocarcinomas with epidermal growth factor receptor mutations in theInternational Association for the Study of Lung Cancer/American ThoracicSociety/European Respiratory Society lung adenocarcinoma classification. Arch.Pathol. Lab. Med. 135, 1329–1334 (2011).
9. Beaulieu-Jones, B. K. & Greene, C. S. Semi-supervised learning of the electronichealth record for phenotype stratification. J. Biomed. Inform. 64, 168–178(2016).
10. Shinagare, A. B. et al. Unsuspected pulmonary embolism in lung cancer patients:comparison of clinical characteristics and outcome with suspected pulmonaryembolism. Lung Cancer 78, 161–166 (2012).
11. Bepler, G., Neumann, K., Holle, R., Havemann, K. & Kalbfleisch, H. Clinical relevanceof histologic subtyping in small cell lung cancer. Cancer 64, 74–79 (1989).
12. Dai, X. et al. Breast cancer intrinsic subtype classification, clinical use and futuretrends. Am. J. Cancer Res. 5, 2929 (2015).
13. Pikor, L. A., Ramnarine, V. R., Lam, S. & Lam, W. L. Genetic alterations defining NSCLCsubtypes and their therapeutic implications. Lung Cancer 82, 179–189 (2013).
14. Thomas, A., Liu, S. V., Subramaniam, D. S. & Giaccone, G. Refining the treatment ofNSCLC according to histological and molecular subtypes. Nat. Rev. Clin. Oncol. 12,511 (2015).
15. Wislez, M. et al. Non-mucinous and mucinous subtypes of adenocarcinoma withbronchioloalveolar carcinoma features differ by biomarker expression and in theresponse to gefitinib. Lung Cancer 68, 185–191 (2010).
16. Kim, H. S., Mendiratta, S., Kim, J., Pecot, C. V. & Larsen, J. E. et al. Systematicidentification of molecular subtype-selective vulnerabilities in non-small-cell lungcancer. Cell 155, 552–566 (2013).
17. Timms, K. M. et al. Association of BRCA1/2 defects with genomic scores predictiveof DNA damage repair deficiency among breast cancer subtypes. Breast CancerRes. 16, 475 (2014).
18. Bergamaschi, A. et al. Distinct patterns of DNA copy number alteration areassociated with different clinicopathological features and gene‐expressionsubtypes of breast cancer. Genes Chromosomes Cancer 45, 1033–1040 (2006).
19. Spigel, D. R. et al. Results From the Phase III Randomized Trial of OnartuzumabPlus Erlotinib Versus Erlotinib in Previously Treated Stage III B or IV Non-Small-Cell Lung Cancer: METLung. J Clin Oncol 35, 412–420 (2017).
20. Shien, K., Papadimitrakopoulou, V. A. & Wistuba, I. I. Predictive biomarkers ofresponse to PD-1/PD-L1 immune checkpoint inhibitors in non–small cell lungcancer. Lung Cancer 99, 79–87 (2016).
21. Sacher, A. G. & Gandhi, L. Biomarkers for the clinical use of PD-1/PD-L1 inhibitorsin non–small-cell lung cancer: a review. JAMA Oncol. 2, 1217–1222 (2016).
22. Chang, W. Y., Knochenhauer, E. S., Bartolucci, A. A. & Azziz, R. Phenotypic spec-trum of polycystic ovary syndrome: clinical and biochemical characterization ofthe three major clinical subgroups. Fertil. Steril. 83, 1717–1723 (2005).
23. Weatherall, M. et al. Distinct clinical phenotypes of airways disease defined bycluster analysis. Eur. Respir. J. 34, 812–818 (2009).
24. Shah, M. et al. The clinical phenotypes of the juvenile idiopathic inflammatorymyopathies. Medicine 92, 25–41 (2013).
25. Gao, F. et al. DeepCC: a novel deep learning-based framework for cancer mole-cular subtype classification. Oncogenesis 8, 1–12 (2019).
26. Chen, R., Yang, L., Goodison, S. & Sun, Y. Deep learning approach to identifyingbreast cancer subtypes using high-dimensional genomic data. Bioinformatics 36,1476–1483 (2019).
27. Ronen, J., Hayat, S. & Akalin, A. Evaluation of colorectal cancer subtypes and celllines using deep learning. Life Sci. Alliance 2, e201900517 (2019).
28. Miotto, R., Li, L., Kidd, B. A. & Dudley, J. T. Deep patient: an unsupervised repre-sentation to predict the future of patients from the electronic health records. Sci.Rep. 6, 26094 (2016).
29. Rajkomar, A. et al. Scalable and accurate deep learning with electronic healthrecords. NPJ Digit. Med. 1, 18 (2018).
30. Fogel, A. L. & Kvedar, J. C. Artificial intelligence powers digital medicine. NPJ Digit.Med. 1, 1–4 (2018).
31. Madani, A., Arnaout, R., Mofrad, M. & Arnaout, R. Fast and accurate view classi-fication of echocardiograms using deep learning. NPJ Digit. Med. 1, 1–8 (2018).
32. Katsuki, T. et al. Feature extraction from electronic health records of diabeticnephropathy patients with convolutioinal autoencoder. In The Workshops of theThirty-Second AAAI Conference on Artificial Intelligence, (ed. McIlraith S.), (AAAI, 2018).
33. Jaques, N., Taylor, S., Sano, A. & Picard, R. In 2017 Seventh International Conferenceon Affective Computing and Intelligent Interaction (ACII) 202–208 (IEEE, 2017).
34. Pai, S. & Bader, G. D. Patient similarity networks for precision medicine. J. Mol. Biol.430, 2924–2938 (2018).
35. Li, L. et al. Identification of type 2 diabetes subgroups through topologicalanalysis of patient similarity. Sci. Transl. Med. 7, 311ra174 (2015).
36. Kipf, T. N. & Welling, M. Semi-supervised classification with graph convolutionalnetworks. In The International Conference on Learning Representations (eds. Ben-gio, Y. & LeCun, Y.) (ICLR, 2017).
37. Zhou, J. et al. Graph neural networks: a review of methods and applications.Preprint at https://arxiv.org/abs/1812.08434 (2018).
38. Singal, G. et al. Association of patient characteristics and tumor genomics withclinical outcomes among patients with non–small cell lung cancer using a clin-icogenomic database. JAMA 321, 1391–1399 (2019).
39. Wang, C., Pan, S., Long, G., Zhu, X. & Jiang, J. In Proceedings of the 2017 ACM onConference on Information and Knowledge Management 889–898 (ACM, 2017).
40. Maaten, Lvd & Hinton, G. Visualizing data using t-SNE. J. Mach. Learn. Res. 9,2579–2605 (2008).
41. McInnes, L., Healy, J. & Melville, J. Umap: uniform manifold approximation andprojection for dimension reduction. Preprint at https://arxiv.org/abs/1802.03426(2018).
42. Hubert, L. & Arabie, P. Comparing partitions. J. Classification 2, 193–218 (1985).43. Allgäuer, M. et al. Implementing tumor mutational burden (TMB) analysis in
routine diagnostics—a primer for molecular pathologists and clinicians. Transl.Lung Cancer Res. 7, 703 (2018).
44. Goodman, A. M. et al. Tumor mutational burden as an independent predictor ofresponse to immunotherapy in diverse cancers. Mol. Cancer Ther. 16, 2598–2608(2017).
45. U.S. Food and Drug Administration. FDA approves atezolizumab for first-linetreatment of metastatic NSCLC with high PD-L1 expression. http://www.fda.gov/drugs/resources-information-approved-drugs/fda-approves-atezolizumab-first-line-treatment-metastatic-nsclc-high-pd-l1-expression (2020).
46. U.S. Food and Drug Administration. FDA expands pembrolizumab indication forfirst-line treatment of NSCLC (TPS ≥1%). http://www.fda.gov/drugs/fda-expands-pembrolizumab-indication-first-line-treatment-nsclc-tps-1 (2019).
47. U.S. Food and Drug Administration. FDA approves nivolumab plus ipilimumab forfirst-line mNSCLC (PD-L1 tumor expression ≥1%). http://www.fda.gov/drugs/drug-approvals-and-databases/fda-approves-nivolumab-plus-ipilimumab-first-line-mnsclc-pd-l1-tumor-expression-1 (2020).
48. Karantanos, T., Karanika, S., Seth, B. & Gignac, G. The absolute lymphocyte countcan predict the overall survival of patients with non-small cell lung cancer onnivolumab: a clinical study. Clin. Transl. Oncol. 21, 206–212 (2019).
49. Kargl, J. et al. Neutrophil content predicts lymphocyte depletion and anti-PD1treatment failure in NSCLC. JCI Insight 4 (2019).
50. Soyano, A. E. et al. Peripheral blood biomarkers correlate with outcomes inadvanced non-small cell lung Cancer patients treated with anti-PD-1 antibodies.J. Immunother. Cancer 6, 1–9 (2018).
C. Fang et al.
9
Published in partnership with Seoul National University Bundang Hospital npj Digital Medicine (2021) 14
51. Jeanson, A. et al. Efficacy of immune checkpoint inhibitors in KRAS-mutant non-small cell lung cancer (NSCLC). J. Thorac. Oncol. 14, 1095–1101 (2019).
52. Liu, C. et al. The superior efficacy of anti-PD-1/PD-L1 immunotherapy in KRAS-mutant non-small cell lung cancer that correlates with an inflammatory pheno-type and increased immunogenicity. Cancer Lett. 470, 95–105 (2020).
53. van Dijk, D. et al. Recovering gene interactions from single-cell data using datadiffusion. Cell 174, 716–729. e727 (2018).
54. Butler, A., Hoffman, P., Smibert, P., Papalexi, E. & Satija, R. Integrating single-celltranscriptomic data across different conditions, technologies, and species. Nat.Biotechnol. 36, 411–420 (2018).
55. Wolf, F. A. et al. PAGA: graph abstraction reconciles clustering with trajectory infer-ence through a topology preserving map of single cells. Genome Biol. 20, 59 (2019).
56. Baran, Y. et al. MetaCell: analysis of single-cell RNA-seq data using K-nn graphpartitions. Genome Biol. 20, 206 (2019).
57. Stuart, T. et al. Comprehensive integration of single-cell data. Cell 177,1888–1902.e1821 (2019).
58. Wang, J. et al. scGNN: a novel graph neural network framework for single-cellRNA-Seq analyses. Preprint at https://www.biorxiv.org/content/10.1101/2020.08.02.233569v1 (2020).
59. Song, Q., Su, J. & Zhang, W. scGCN: a graph convolutional networks algorithm forknowledge transfer in single cell omics. Preprint at https://www.biorxiv.org/content/10.1101/2020.09.13.295535v1.full (2020).
60. Yang, L. et al. Nkx2-1: a novel tumor biomarker of lung cancer. J. Zhejiang Univ.Sci. B 13, 855–866 (2012).
61. Wang, F., Kaushal, R. & Khullar, D. Should health care demand interpretableartificial intelligence or accept “black box” medicine? Ann. Intern. Med. https://doi.org/10.7326/M19-2548 (2019).
62. Veličković, P. et al. Graph attention networks. The International Conference onLearning Representations (eds. Bengio, Y. & LeCun Y.) (ICLR, 2018).
63. Shah, P. et al. Artificial intelligence and machine learning in clinical development:a translational perspective. NPJ Digit. Med. 2, 69 (2019).
64. Gottlieb, S. Transforming FDA’s approach to digital health. https://www.fda.gov/news-events/speeches-fda-officials/transforming-fdas-approach-digital-health-04262018 (2018).
65. U.S. FDA. Software as a medical device. https://www.fda.gov/MedicalDevices/DigitalHealth/SoftwareasaMedicalDevice/ucm20086412.htm (2018).
66. FDA. Digital Health Innovation Action Plan. https://www.fda.gov/media/106331/download (2018).
67. U.S. FDA. FDA permits marketing of artificial intelligence-based device to detectcertain diabetes-related eye problems. https://www.fda.gov/newsevents/newsroom/pressannouncements/ucm604357.htm (2018).
68. Allen, B., Agarwal, S., Kalpathy-Cramer, J. & Dreyer, K. Democratizing AI. J. Am. Coll.Radiol. 16, 961–963 (2019).
69. Yu, K. H., Beam, A. L. & Kohane, I. S. Artificial intelligence in healthcare. Nat.Biomed. Eng. 2, 719–731 (2018).
70. Ting, D. S. W. et al. AI for medical imaging goes deep. Nat. Med. 24, 539–540(2018).
71. Li, G., Muller, M., Thabet, A. & Ghanem, B. DeepGCNs: can GCNs go as deep asCNNs? In Proc. IEEE International Conference on Computer Vision (eds. Lee, K. M.,Forsyth, D., Pollefeys, M. & Tang, X.) 9267–9276 (IEEE, 2019).
72. Yang, C., Wang, R., Yao, S., Liu, S. & Abdelzaher, T. Revisiting “Over-smoothing” indeep GCNs. Preprint at https://arxiv.org/pdf/2003.13663.pdf (2020).
73. Chen, D. et al. Measuring and relieving the over-smoothing problem for graphneural networks from the topological view. In The Thirty-Fourth AAAI Conferenceon Artificial Intelligence, 3438–3445 (AAAI, 2020).
74. Wang, C., Pan, S., Long, G., Zhu, X. & Jiang, J. In Proc. 2017 ACM on Conference onInformation and Knowledge Management (eds. Lim, E. P. & Winslett, M.) (Asso-ciation for Computing Machinery, Singapore, Singapore, 2017).
75. Bianchi, F. M., Grattarola, D. & Alippi, C. In Proc. 37th International Conference onMachine Learning (eds. Singh, A., Ill, H. D. & Blei, D.) (PMLR, 2020).
76. Bland, J. M. & Altman, D. G. Survival probabilities (the Kaplan-Meier method). BMJ317, 1572 (1998).
77. Fleming, T. R. & Harrington, D. P. Counting Processes and Survival Analysis Vol. 169(John Wiley & Sons, 2011).
78. Romesburg, H. C. Cluster Analysis for Researchers (Lulu, 2004).79. Menche, J. et al. Disease networks. Uncovering disease-disease relationships
through the incomplete interactome. Science 347, 1257601 (2015).80. Han, J., Pei, J. & Kamber, M. Data Mining: Concepts and Techniques (Elsevier, 2011).81. Chen, H. et al. Relational network for knowledge discovery through hetero-
geneous biomedical and clinical features. Sci. Rep. 6, 29915 (2016).
ACKNOWLEDGEMENTSThis research was supported by AstraZeneca (AZ) Postdoc Funding. The high-performance computing resource was supported by Scientific Computing Platform(SCP) at AZ. D.X.’s work was partially supported by the National Institutes of Health(R35-GM126985). J.S.’s work was partially supported by the Cancer Center SupportGrant from the National Cancer Institute to the Comprehensive Cancer Center ofWake Forest Baptist Medical Center (P30 CA012197) as well as the Indiana UniversityPrecision Health Initiative funded to J.S. We would like to thank our colleagues KrisSachsenmeier, Carl Barrett, Mingchao Xie, Zhongwu Lai, Ben Sidders, Hadley Coonley,Paul Metcalfe, Lisa Drew, Iksha Herr, Ketan Patel, Gayle Pouliot, Melinda Merchant,Robert McEwen, Krishna Bulusu, Marylens Hernandez, and Steven Criscione for theirhelp, support, and constructive discussions.
AUTHOR CONTRIBUTIONSB.L., J.D., and J.S. designed and directed this study. D.X. contributed to methodologydesign and provided scientific suggestions. C.F. collected and processed the data,built the model, trained the model, and carried out experiments. All authors analyzedthe data with interpretations and validated the experimental results of data analysis.All authors wrote, reviewed, and revised the manuscript.
COMPETING INTERESTSThe authors declare no competing interests.
ADDITIONAL INFORMATIONSupplementary information The online version contains supplementary materialavailable at https://doi.org/10.1038/s41746-021-00381-z.
Correspondence and requests for materials should be addressed to J.S., J.R.D. or B.L.
Reprints and permission information is available at http://www.nature.com/reprints
Publisher’s note Springer Nature remains neutral with regard to jurisdictional claimsin published maps and institutional affiliations.
Open Access This article is licensed under a Creative CommonsAttribution 4.0 International License, which permits use, sharing,
adaptation, distribution and reproduction in anymedium or format, as long as you giveappropriate credit to the original author(s) and the source, provide a link to the CreativeCommons license, and indicate if changes were made. The images or other third partymaterial in this article are included in the article’s Creative Commons license, unlessindicated otherwise in a credit line to the material. If material is not included in thearticle’s Creative Commons license and your intended use is not permitted by statutoryregulation or exceeds the permitted use, you will need to obtain permission directlyfrom the copyright holder. To view a copy of this license, visit http://creativecommons.org/licenses/by/4.0/.
© The Author(s) 2021
C. Fang et al.
10
npj Digital Medicine (2021) 14 Published in partnership with Seoul National University Bundang Hospital


