Embed Size (px)
Citation preview
1 CONFIDENTIAL AND PROPRIETARY
Debugging for Linux and Android
Peter Liu, Oct 2021
Peter Liu
Sept 2021

2 CONFIDENTIAL AND PROPRIETARY
Agenda
• OS and System analysis
• Oops/Panic case
➢ addr2line
➢ objdump
➢ gdb
• Pstore
• Kdump
• Memory debugging
➢ SLAB
➢ KASAN
➢ Kmemleak
• Performance
➢ Perf
➢ Ftrace
➢ eBPF/bcc

3 CONFIDENTIAL AND PROPRIETARY
Agenda
• OS and System analysis
• Oops/Panic case
➢ addr2line
➢ objdump
➢ gdb
• Pstore
• Kdump
• Memory debugging
➢ SLAB
➢ KASAN
➢ Kmemleak
• Performance
➢ Perf
➢ Ftrace
➢ eBPF/bcc
• Q&A
4 CONFIDENTIAL AND PROPRIETARY
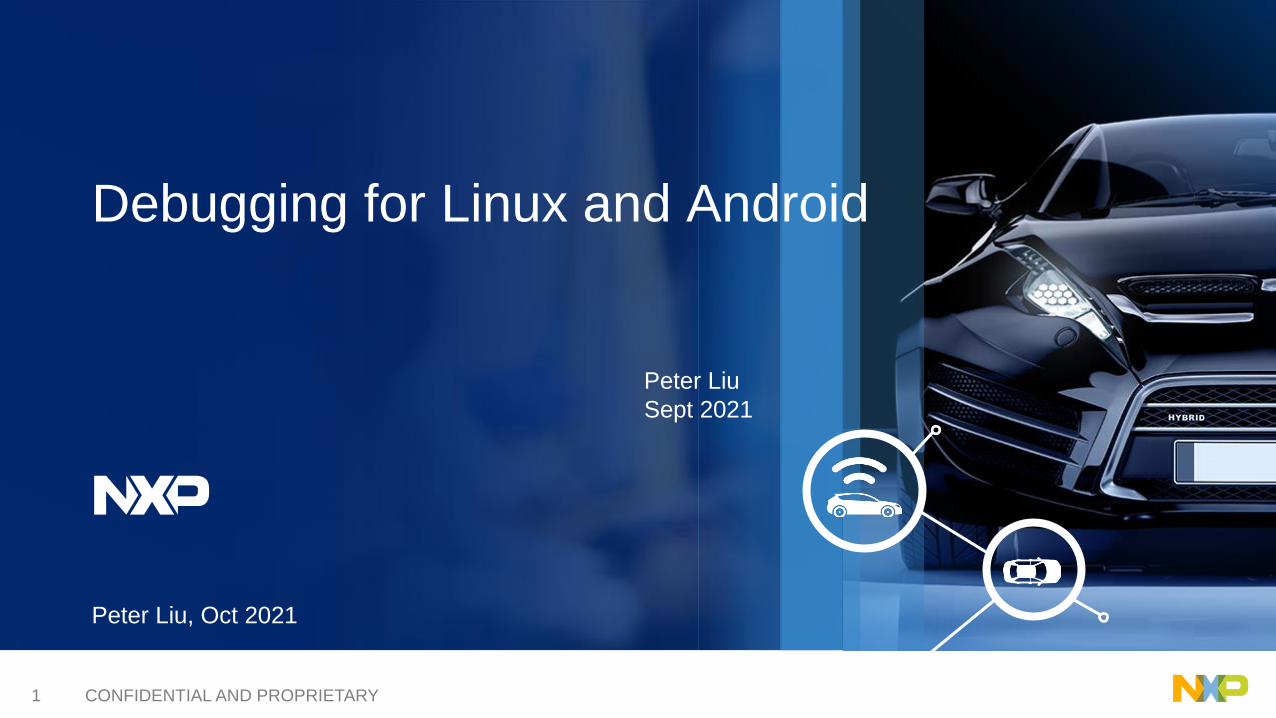
OS and System analysis

5 CONFIDENTIAL AND PROPRIETARY
Agenda
• OS and System analysis
• Oops/Panic case
➢ addr2line
➢ objdump
➢ gdb
• Pstore
• Kdump
• Memory debugging
➢ SLAB
➢ KASAN
➢ Kmemleak
• Performance
➢ Perf
➢ Ftrace
➢ eBPF/bcc
• Q&A
6 CONFIDENTIAL AND PROPRIETARY
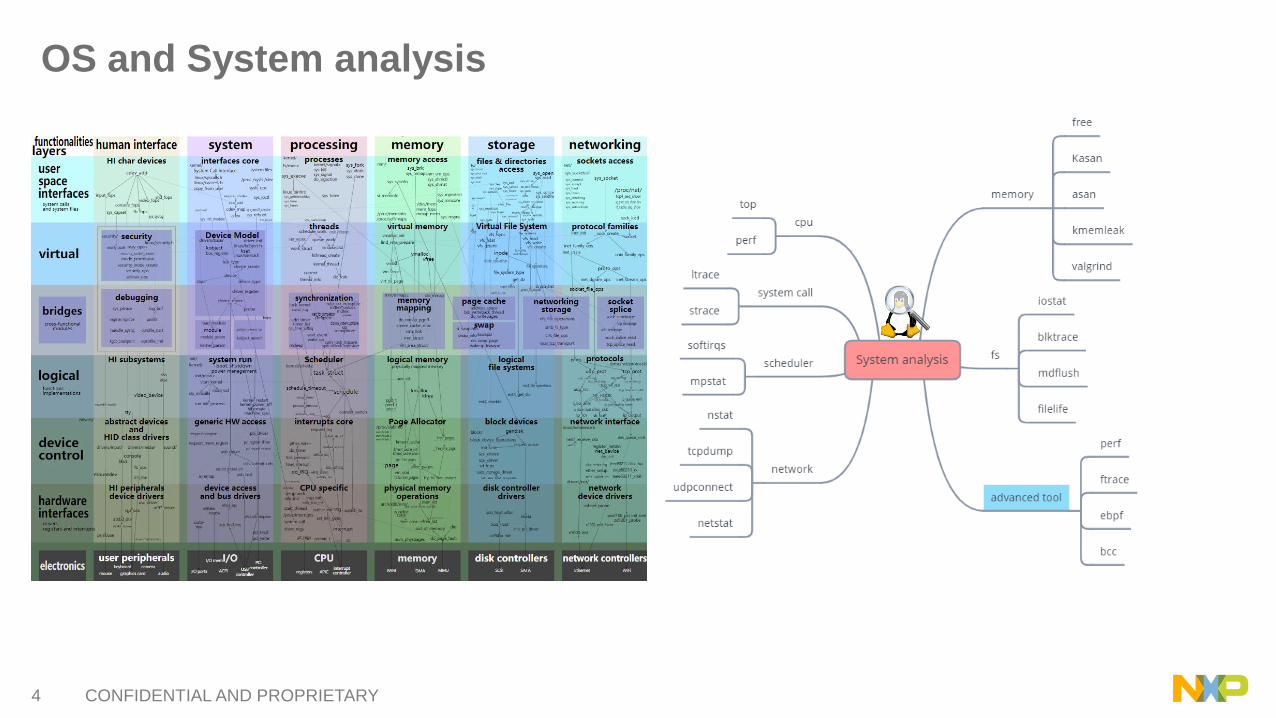
Oops/Panic case
7 CONFIDENTIAL AND PROPRIETARY
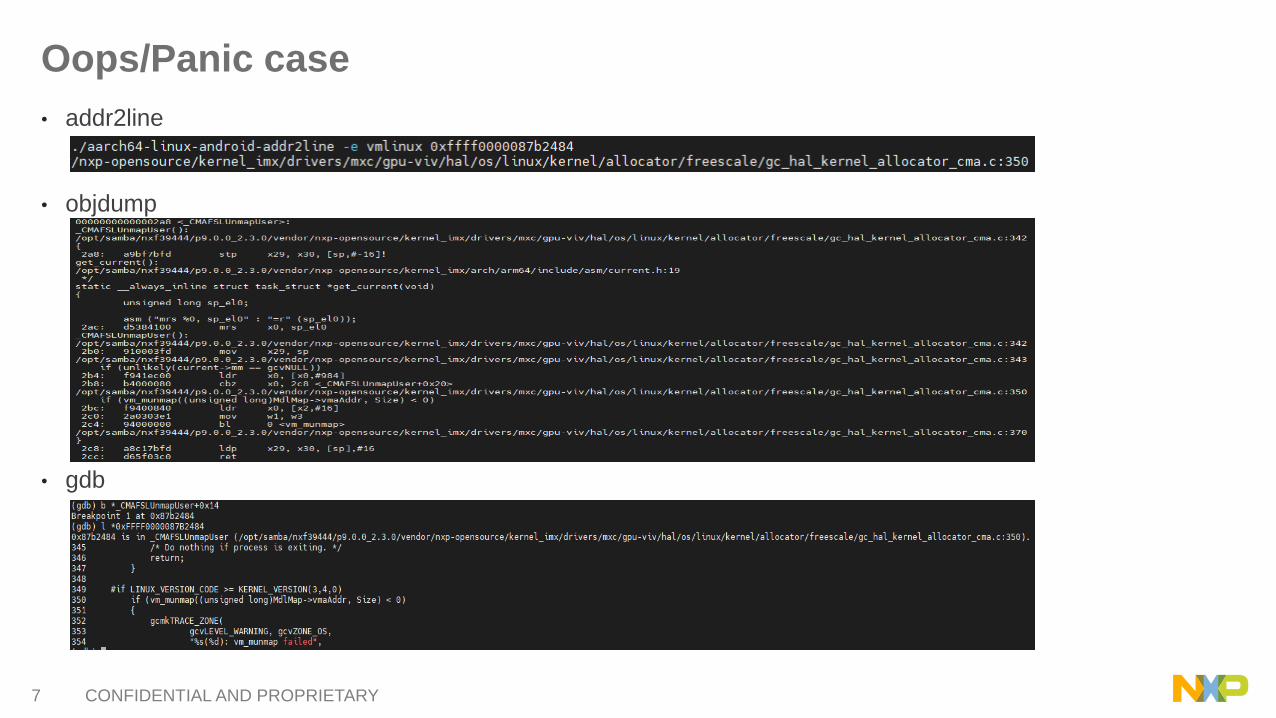
Oops/Panic case
• addr2line
• objdump
• gdb

8 CONFIDENTIAL AND PROPRIETARY
Agenda
• OS and System analysis
• Oops/Panic case
➢ addr2line
➢ objdump
➢ gdb
• Pstore
• Kdump
• Memory debugging
➢ SLAB
➢ KASAN
➢ Kmemleak
• Performance
➢ Perf
➢ Ftrace
➢ eBPF/bcc
• Q&A
9 CONFIDENTIAL AND PROPRIETARY
Pstore
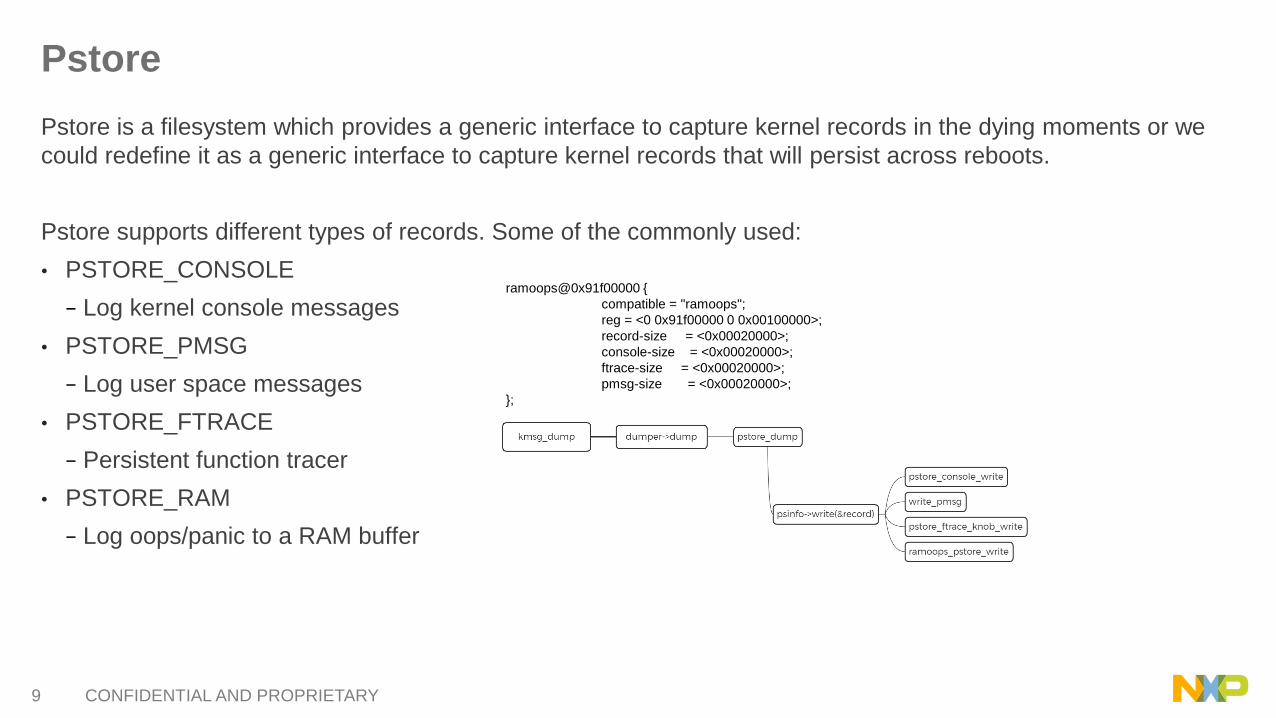
Pstore is a filesystem which provides a generic interface to capture kernel records in the dying moments or we
could redefine it as a generic interface to capture kernel records that will persist across reboots.
Pstore supports different types of records. Some of the commonly used:
• PSTORE_CONSOLE
− Log kernel console messages
• PSTORE_PMSG
− Log user space messages
• PSTORE_FTRACE
− Persistent function tracer
• PSTORE_RAM
− Log oops/panic to a RAM buffer
ramoops@0x91f00000 {
compatible = "ramoops";
reg = <0 0x91f00000 0 0x00100000>;
record-size = <0x00020000>;
console-size = <0x00020000>;
ftrace-size = <0x00020000>;
pmsg-size = <0x00020000>;
};
10 CONFIDENTIAL AND PROPRIETARY
Pstore Ramoops backend
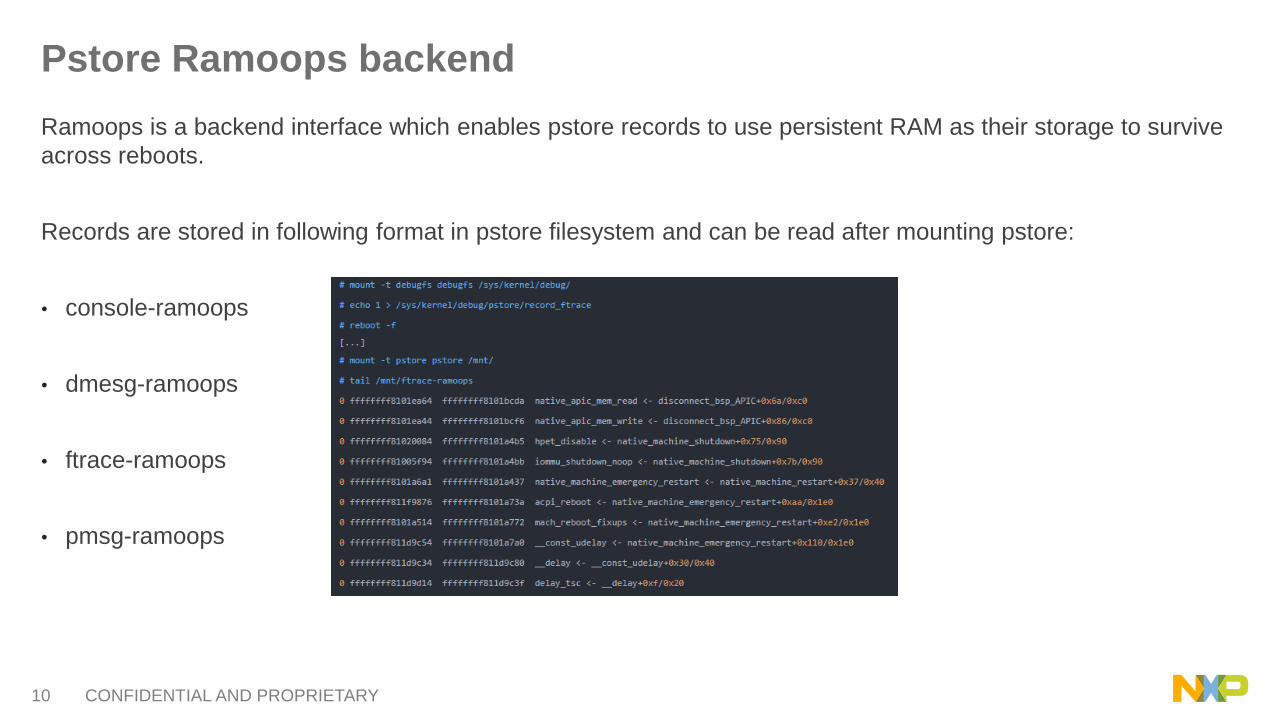
Ramoops is a backend interface which enables pstore records to use persistent RAM as their storage to survive
across reboots.
Records are stored in following format in pstore filesystem and can be read after mounting pstore:
• console-ramoops
• dmesg-ramoops
• ftrace-ramoops
• pmsg-ramoops

11 CONFIDENTIAL AND PROPRIETARY
Agenda
• OS and System analysis
• Oops/Panic case
➢ addr2line
➢ objdump
➢ gdb
• Pstore
• Kdump
• Memory debugging
➢ SLAB
➢ KASAN
➢ Kmemleak
• Performance
➢ Perf
➢ Ftrace
➢ eBPF/bcc
• Q&A
12 CONFIDENTIAL AND PROPRIETARY
Kdump
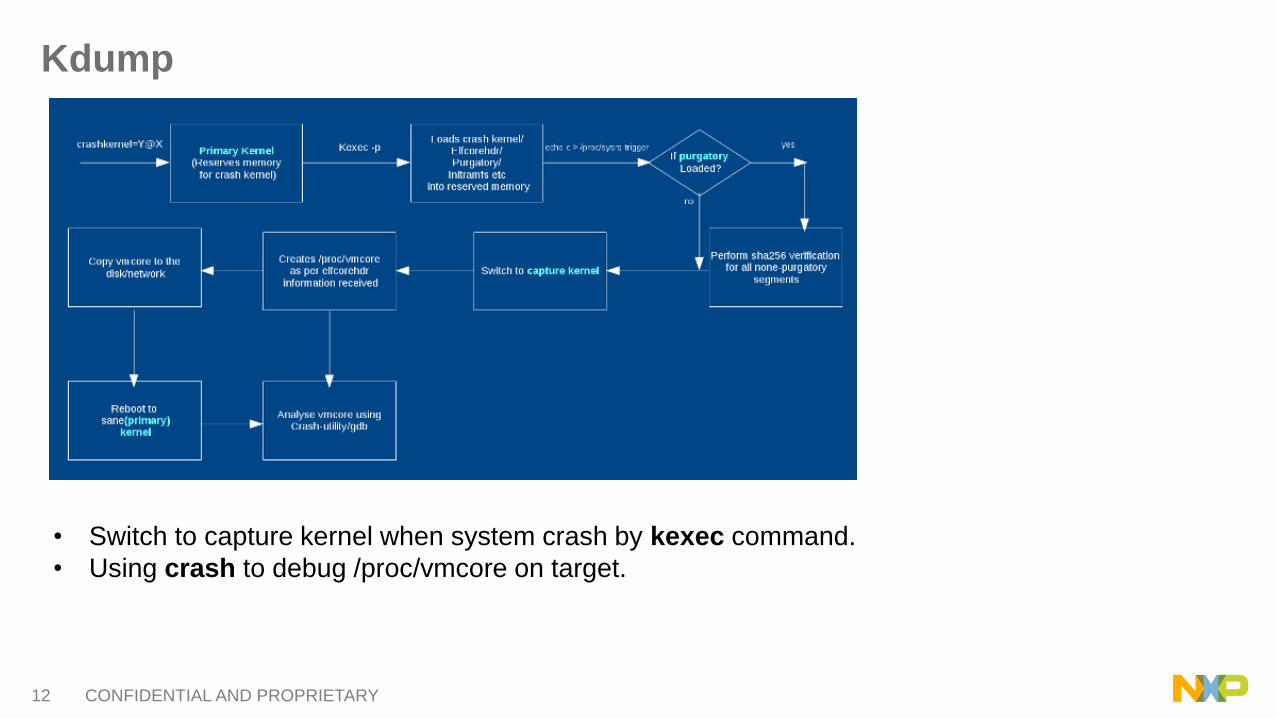
• Switch to capture kernel when system crash by kexec command.
• Using crash to debug /proc/vmcore on target.
13 CONFIDENTIAL AND PROPRIETARY
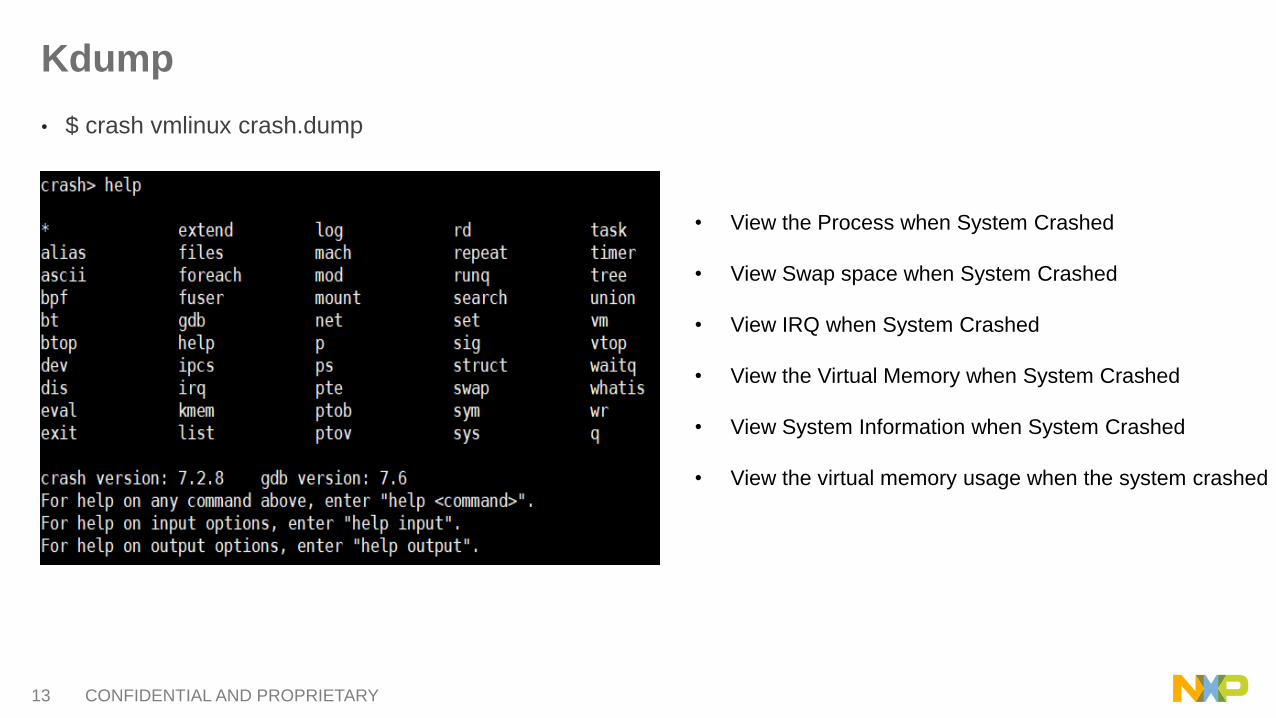
Kdump
• $ crash vmlinux crash.dump
• View the Process when System Crashed
• View Swap space when System Crashed
• View IRQ when System Crashed
• View the Virtual Memory when System Crashed
• View System Information when System Crashed
• View the virtual memory usage when the system crashed
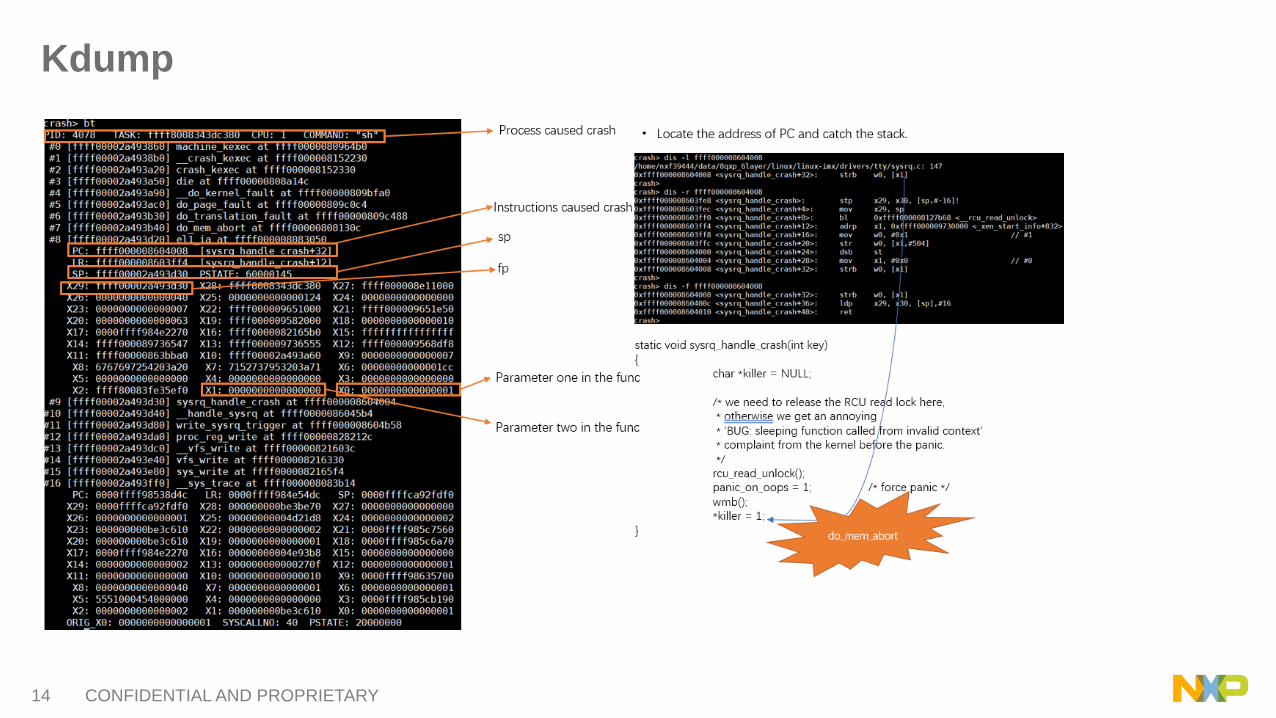
14 CONFIDENTIAL AND PROPRIETARY
Kdump

15 CONFIDENTIAL AND PROPRIETARY
Agenda
• OS and System analysis
• Oops/Panic case
➢ addr2line
➢ objdump
➢ gdb
• Pstore
• Kdump
• Memory debugging
➢ SLAB
➢ KASAN
➢ Kmemleak
• Performance
➢ Perf
➢ Ftrace
➢ eBPF/bcc
• Q&A
16 CONFIDENTIAL AND PROPRIETARY
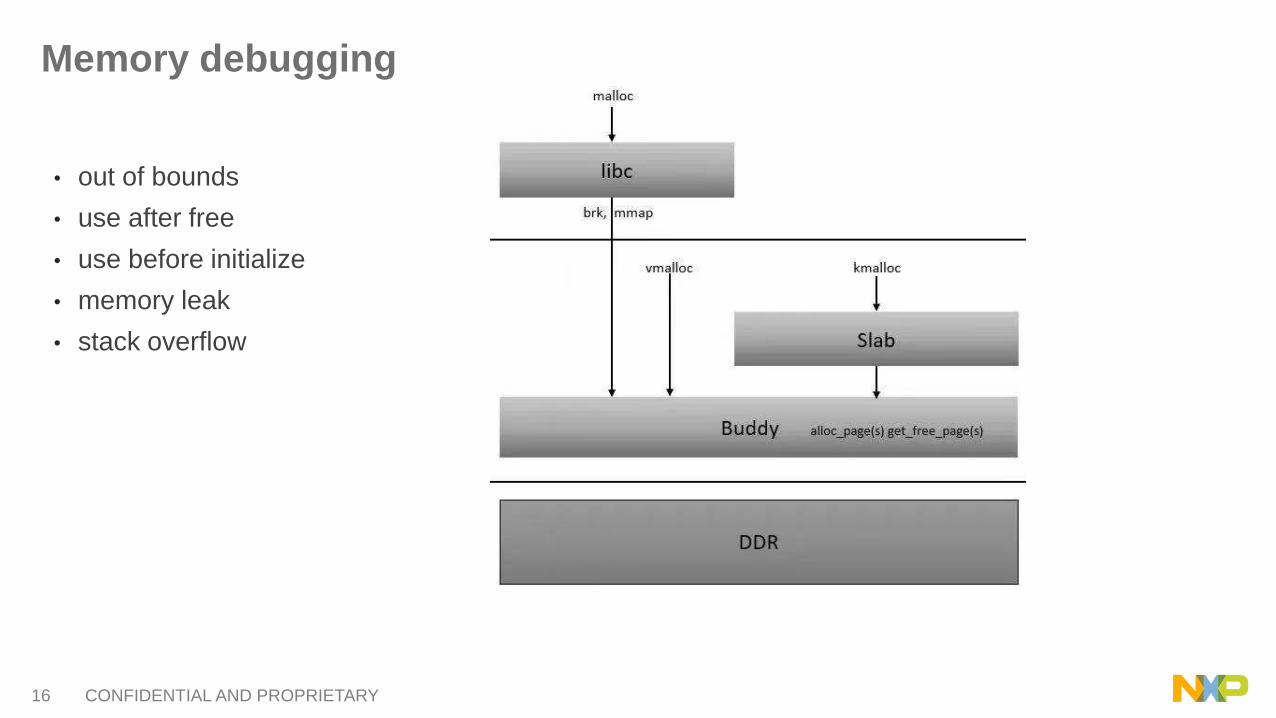
Memory debugging
• out of bounds
• use after free
• use before initialize
• memory leak
• stack overflow
17 CONFIDENTIAL AND PROPRIETARY
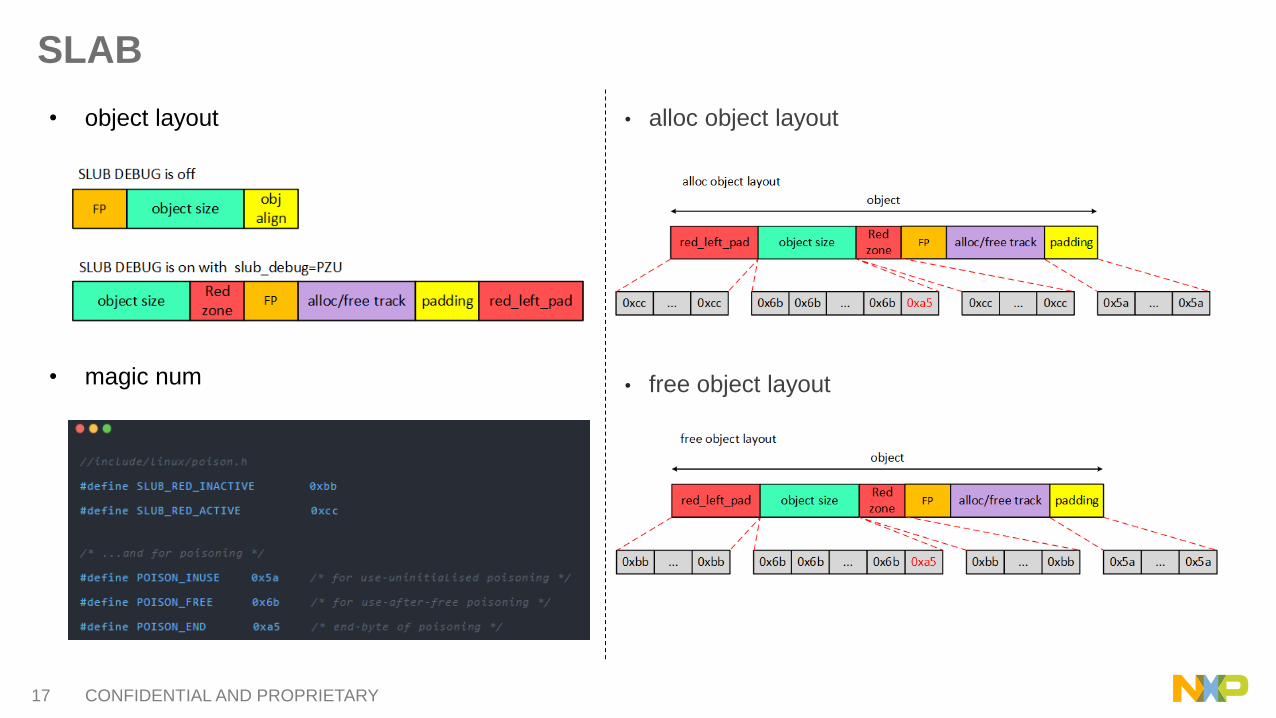
SLAB
• object layout
• magic num
• alloc object layout
• free object layout
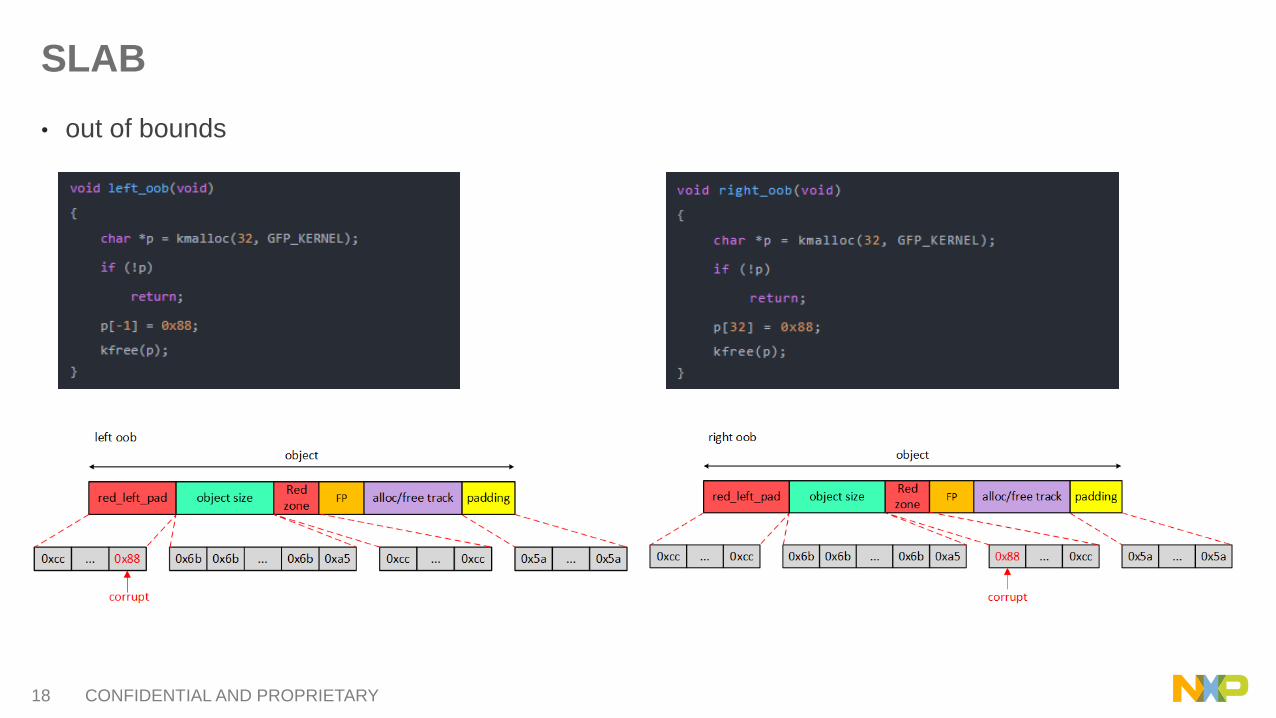
18 CONFIDENTIAL AND PROPRIETARY
SLAB
• out of bounds
19 CONFIDENTIAL AND PROPRIETARY
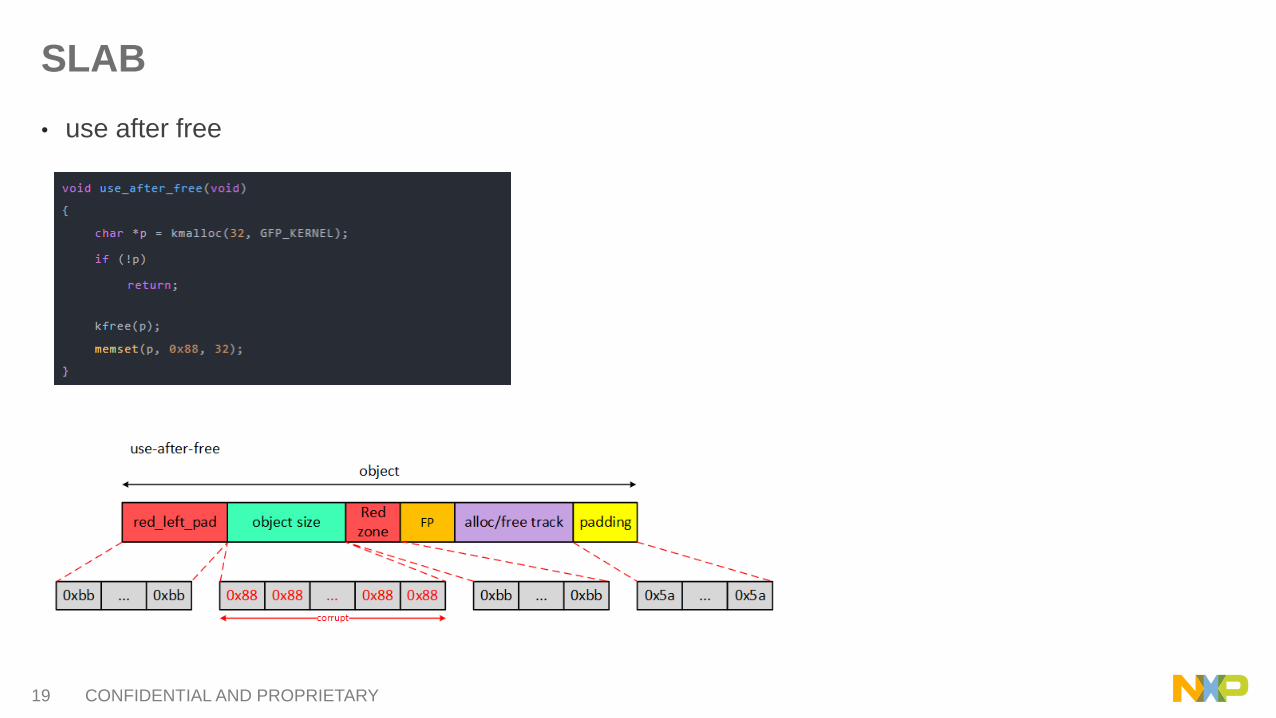
SLAB
• use after free
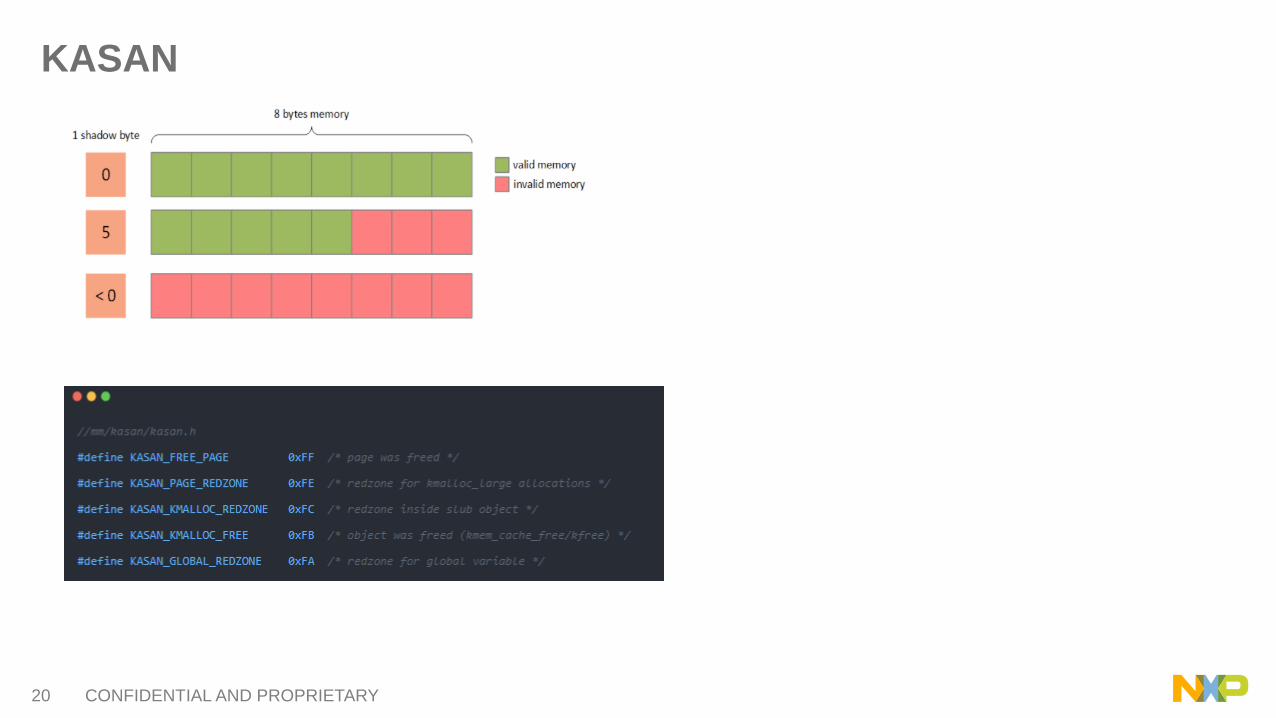
20 CONFIDENTIAL AND PROPRIETARY
KASAN
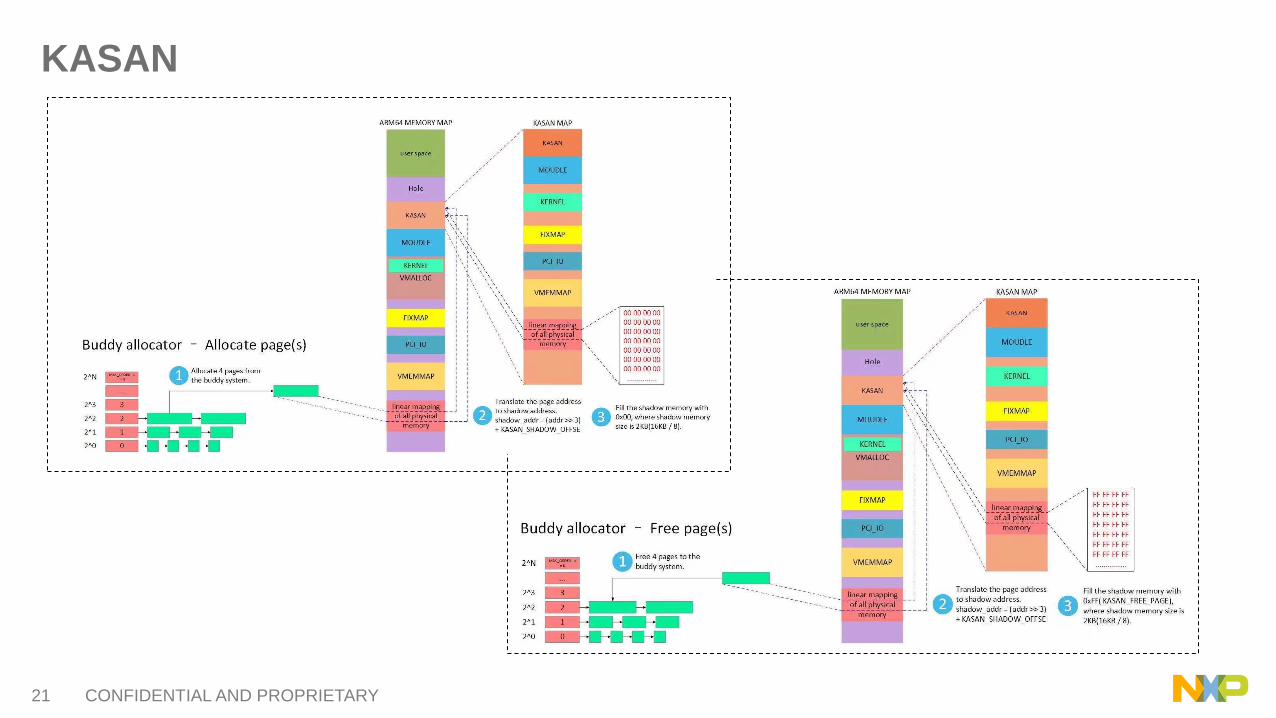
21 CONFIDENTIAL AND PROPRIETARY
KASAN
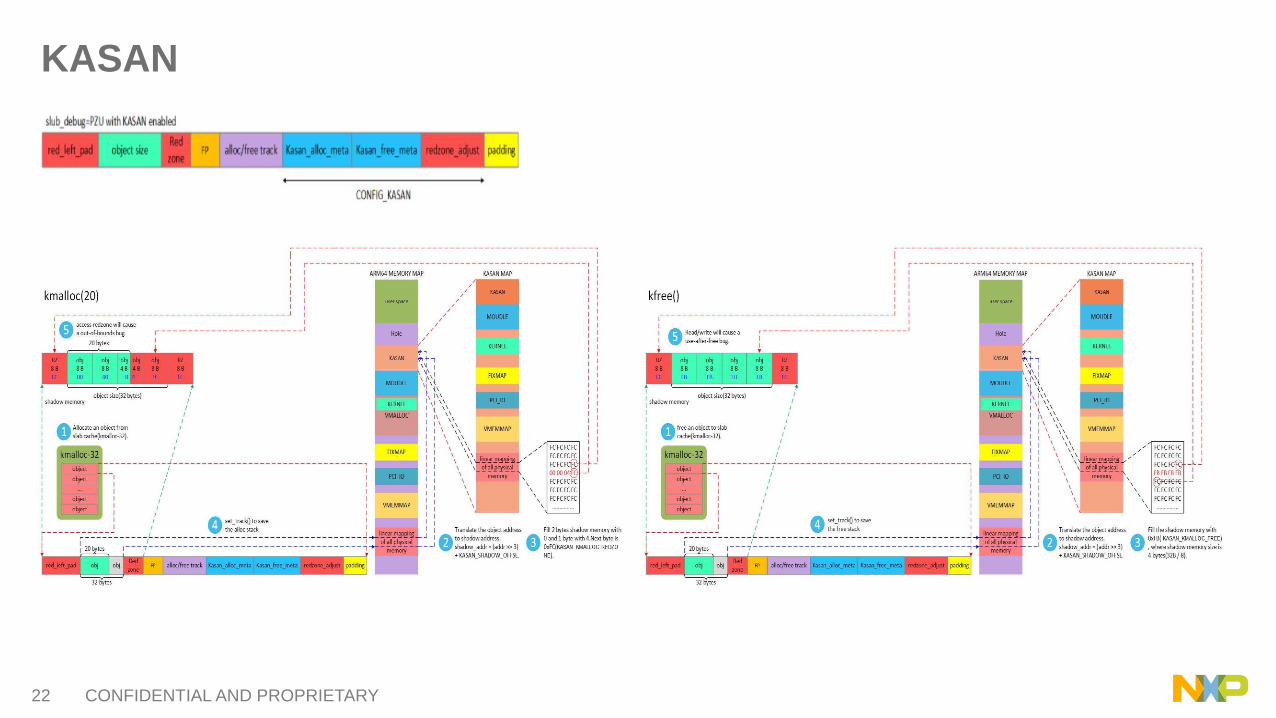
22 CONFIDENTIAL AND PROPRIETARY
KASAN
23 CONFIDENTIAL AND PROPRIETARY
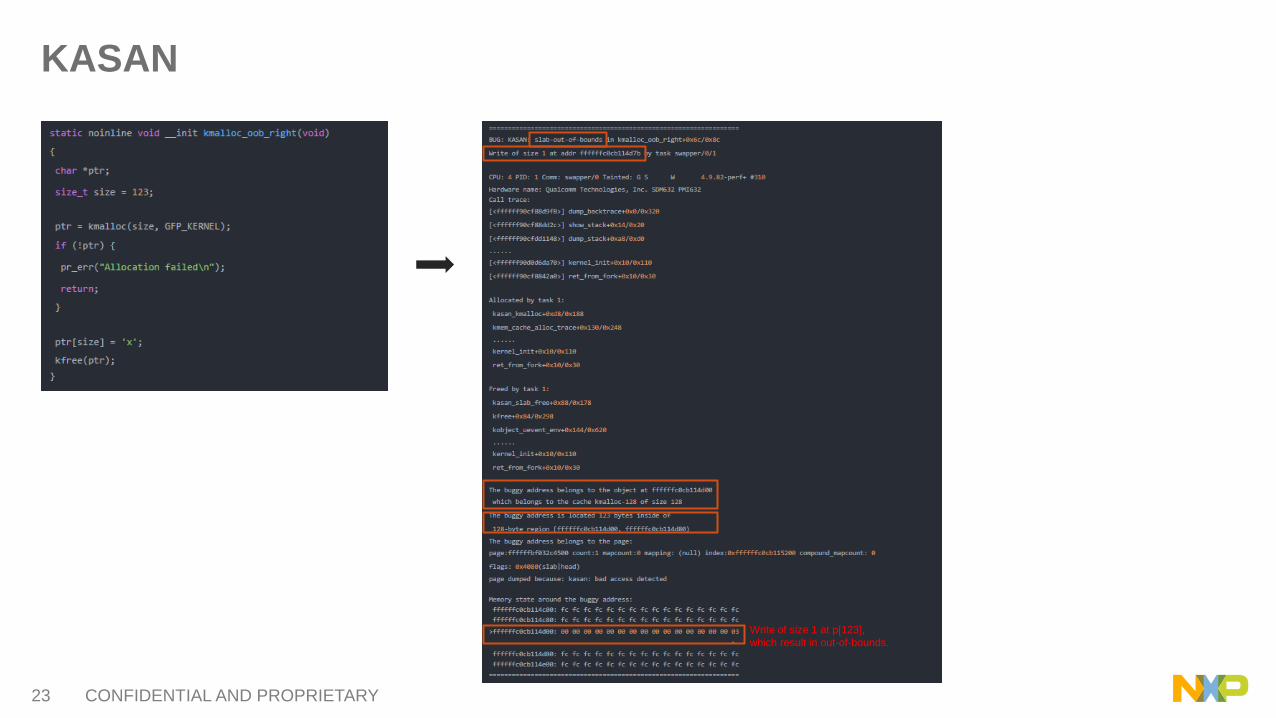
KASAN
Write of size 1 at p[123],
which result in out-of-bounds.
24 CONFIDENTIAL AND PROPRIETARY
Kmemleak
• Kmemleak tracks objects allocated via kmalloc/vmalloc/memblock.
• Kmemleak can not tracks the page allocations such as alloc_pages/_get_free_pages/
dma_alloc_coherent.
• Ioremap mappings are not tracked.
• Scanning the memory could take a long time (minutes)
− Cannot lock the system during scanning
− Memory allocation/freeing can still happen during scanning
• Kmemleak uses RCU list traversal to avoid locking
25 CONFIDENTIAL AND PROPRIETARY
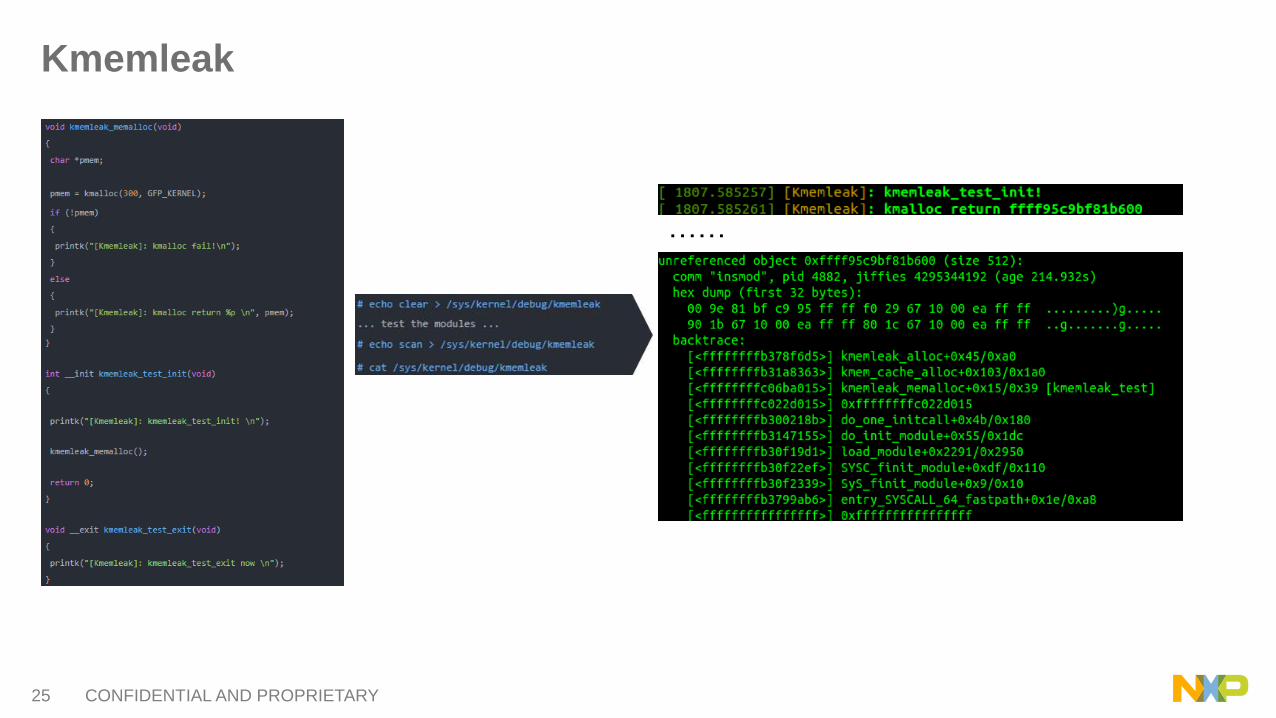
Kmemleak
……

26 CONFIDENTIAL AND PROPRIETARY
Agenda
• OS and System analysis
• Oops/Panic case
➢ addr2line
➢ objdump
➢ gdb
• Pstore
• Kdump
• Memory debugging
➢ SLAB
➢ KASAN
➢ Kmemleak
• Performance
➢ Perf
➢ Ftrace
➢ eBPF/bcc
• Q&A
27 CONFIDENTIAL AND PROPRIETARY
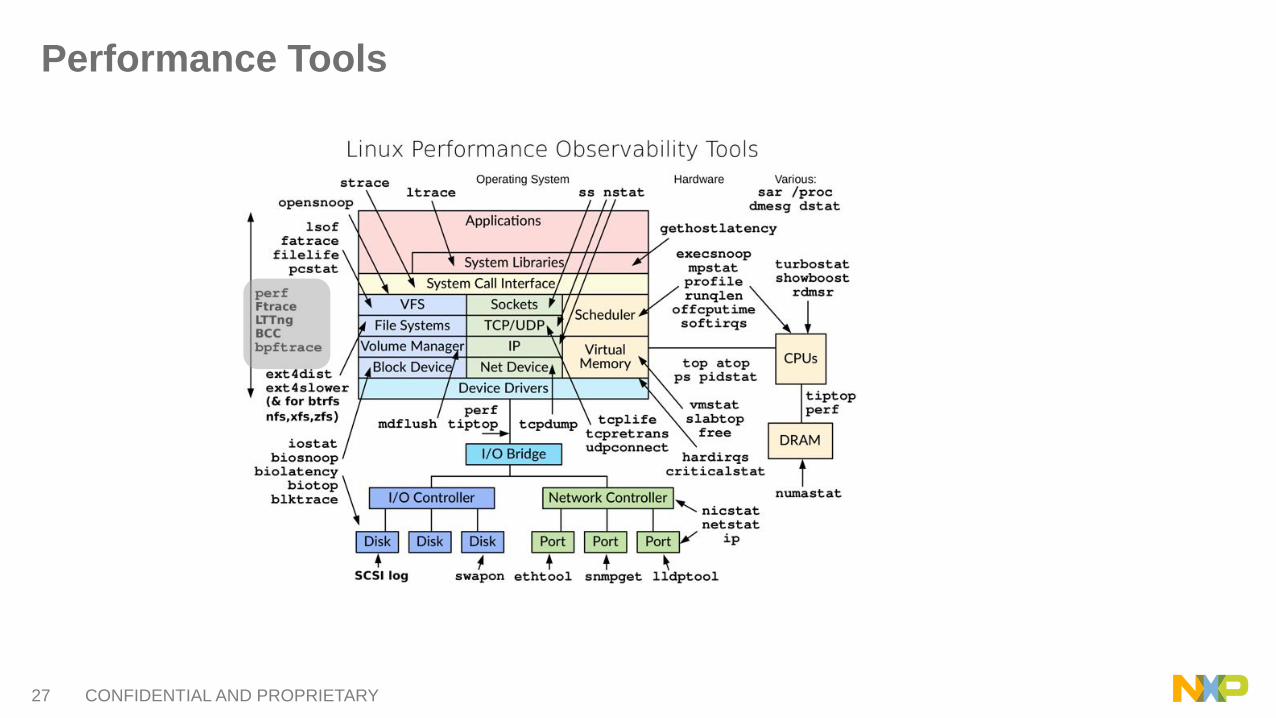
Performance Tools
28 CONFIDENTIAL AND PROPRIETARY
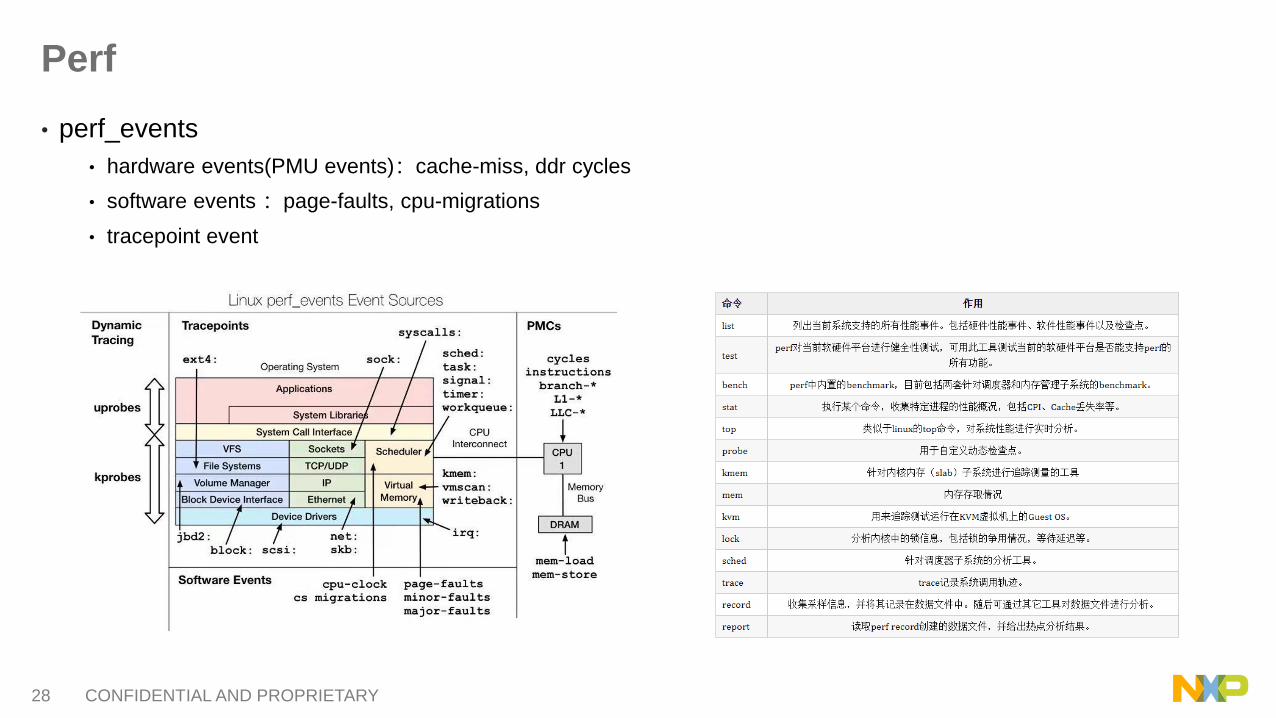
Perf
• perf_events
• hardware events(PMU events):cache-miss, ddr cycles
• software events :page-faults, cpu-migrations
• tracepoint event
29 CONFIDENTIAL AND PROPRIETARY
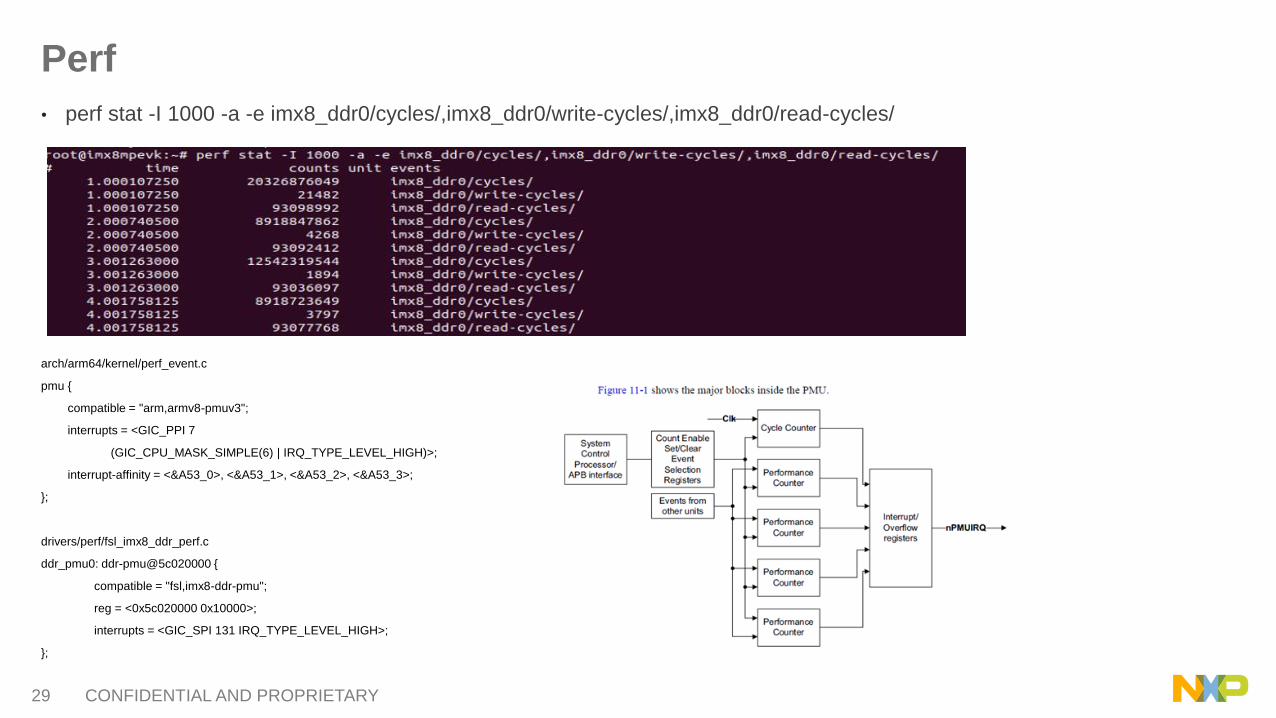
Perf
• perf stat -I 1000 -a -e imx8_ddr0/cycles/,imx8_ddr0/write-cycles/,imx8_ddr0/read-cycles/
arch/arm64/kernel/perf_event.c
pmu {
compatible = "arm,armv8-pmuv3";
interrupts = <GIC_PPI 7
(GIC_CPU_MASK_SIMPLE(6) | IRQ_TYPE_LEVEL_HIGH)>;
interrupt-affinity = <&A53_0>, <&A53_1>, <&A53_2>, <&A53_3>;
};
drivers/perf/fsl_imx8_ddr_perf.c
ddr_pmu0: ddr-pmu@5c020000 {
compatible = "fsl,imx8-ddr-pmu";
reg = <0x5c020000 0x10000>;
interrupts = <GIC_SPI 131 IRQ_TYPE_LEVEL_HIGH>;
};
30 CONFIDENTIAL AND PROPRIETARY
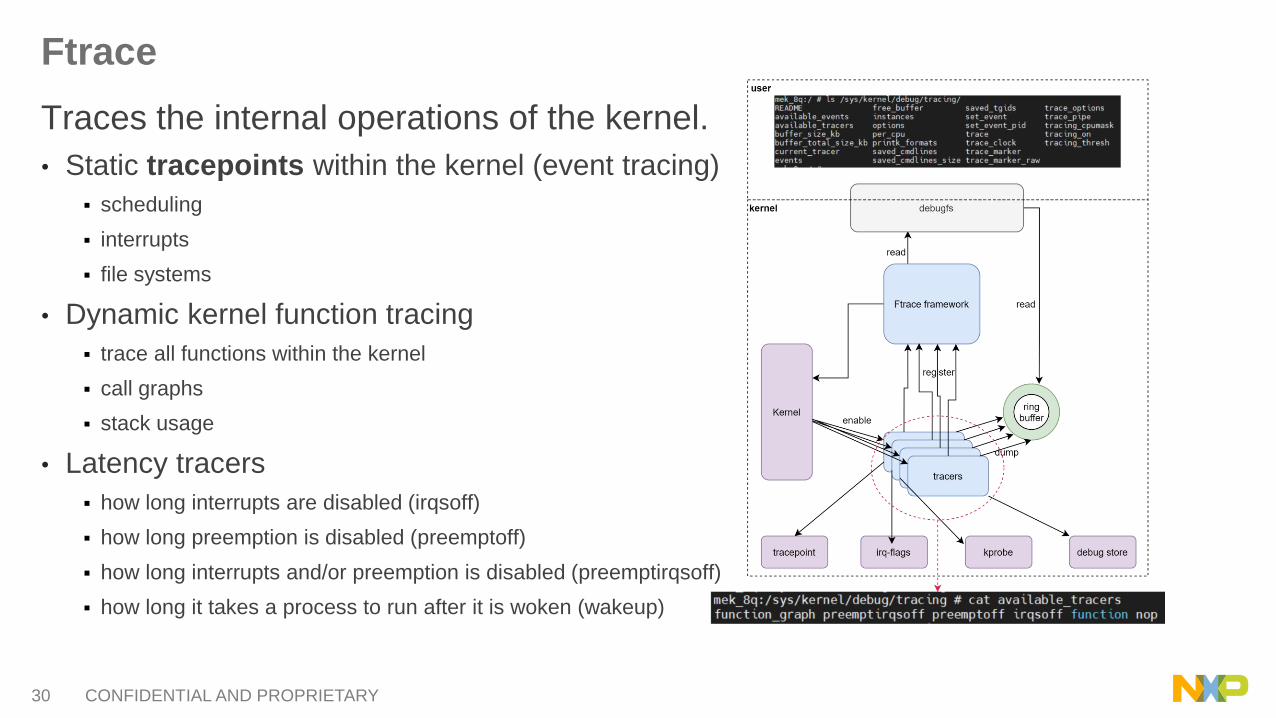
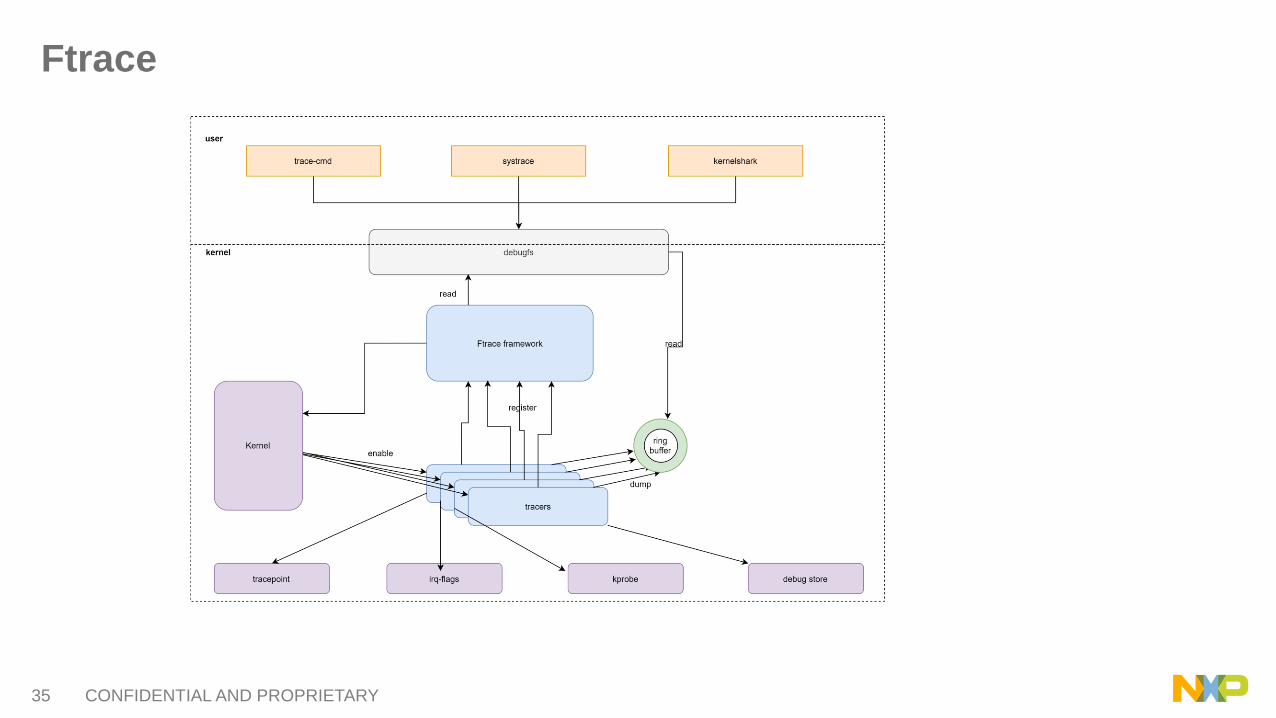
Ftrace
Traces the internal operations of the kernel.
• Static tracepoints within the kernel (event tracing)
▪ scheduling
▪ interrupts
▪ file systems
• Dynamic kernel function tracing
▪ trace all functions within the kernel
▪ call graphs
▪ stack usage
• Latency tracers
▪ how long interrupts are disabled (irqsoff)
▪ how long preemption is disabled (preemptoff)
▪ how long interrupts and/or preemption is disabled (preemptirqsoff)
▪ how long it takes a process to run after it is woken (wakeup)
31 CONFIDENTIAL AND PROPRIETARY
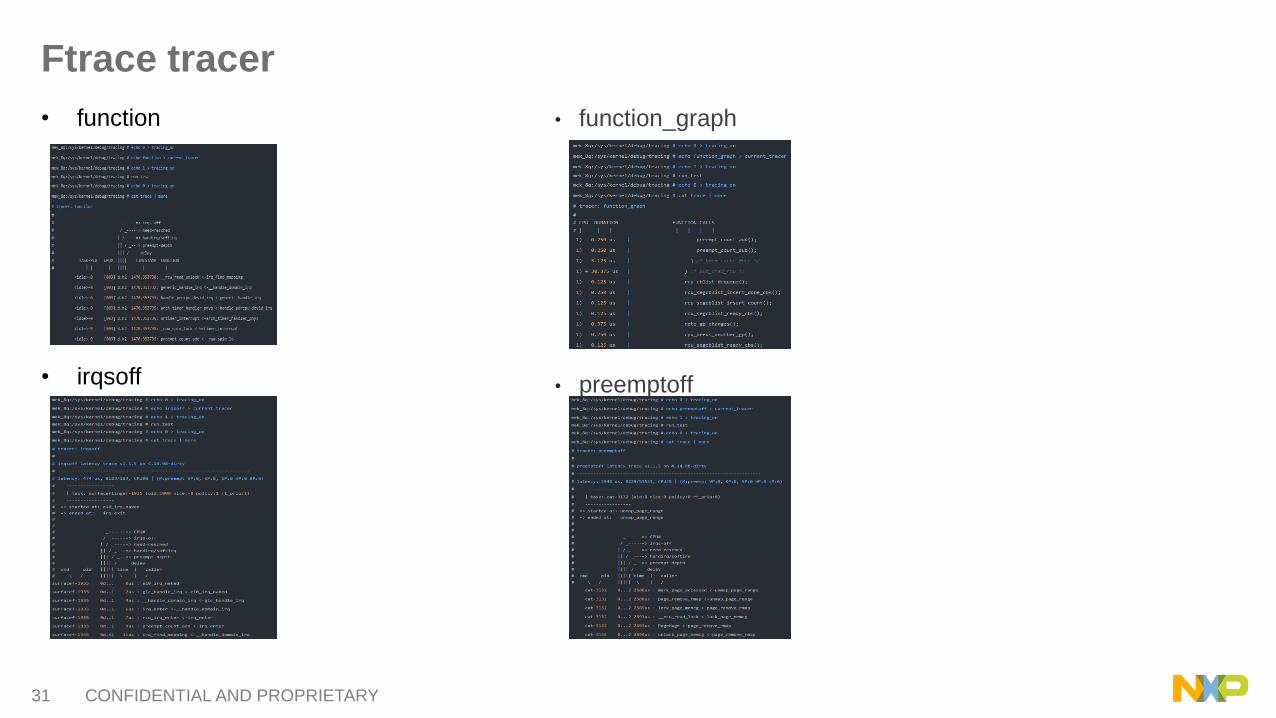
Ftrace tracer
• function_graph
• preemptoff
• function
• irqsoff
32 CONFIDENTIAL AND PROPRIETARY
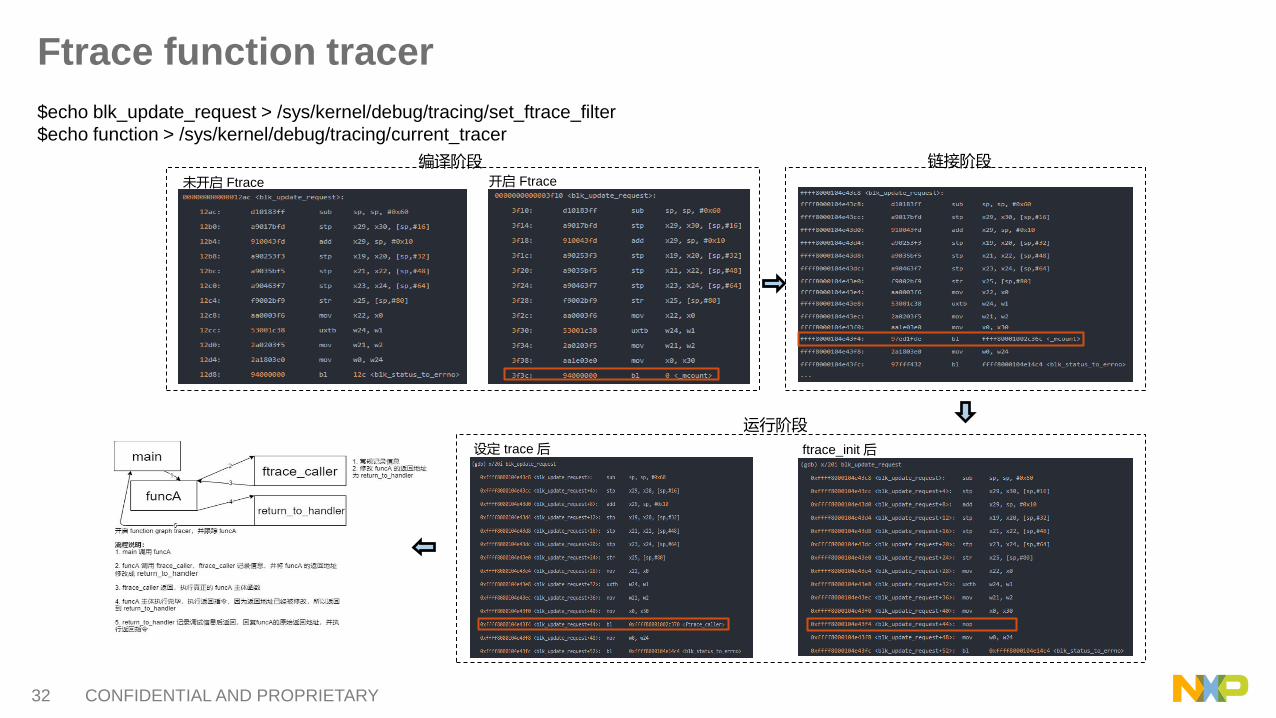
未开启 Ftrace 开启 Ftrace
编译阶段 链接阶段
ftrace_init 后设定 trace 后
运行阶段
Ftrace function tracer
$echo blk_update_request > /sys/kernel/debug/tracing/set_ftrace_filter
$echo function > /sys/kernel/debug/tracing/current_tracer
33 CONFIDENTIAL AND PROPRIETARY
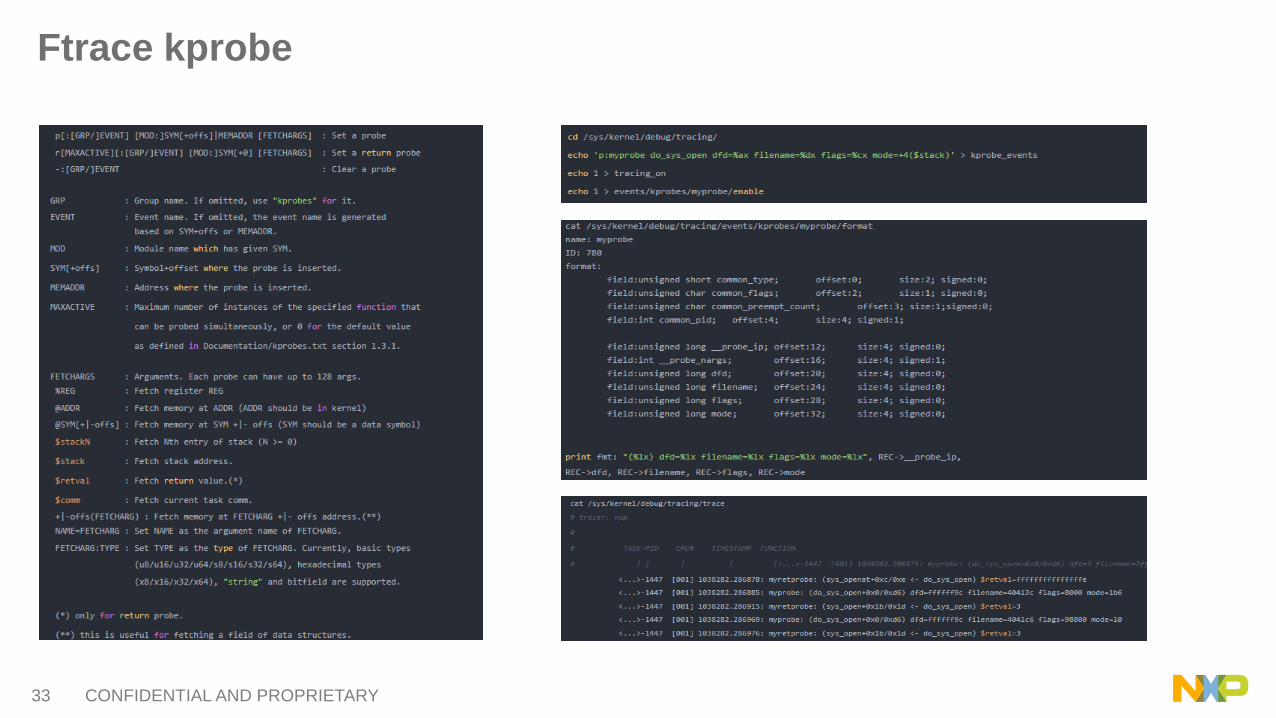
Ftrace kprobe
34 CONFIDENTIAL AND PROPRIETARY
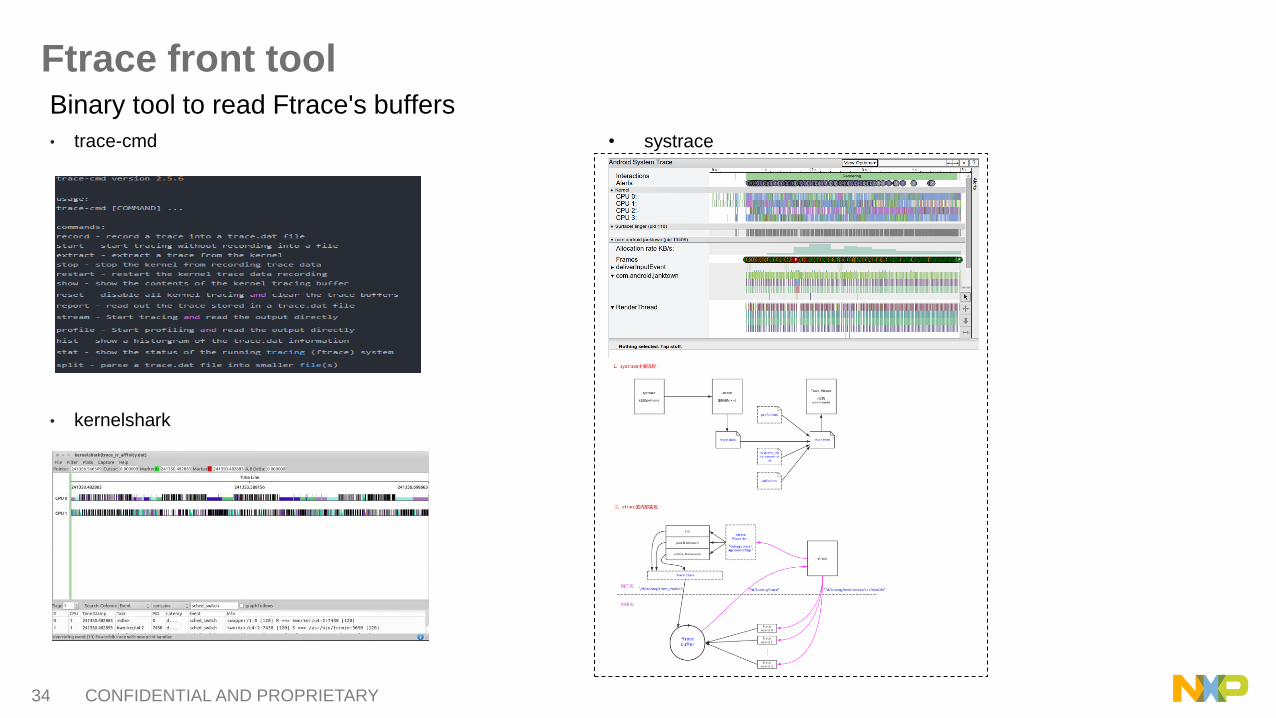
Ftrace front toolBinary tool to read Ftrace's buffers
• trace-cmd
• kernelshark
• systrace
35 CONFIDENTIAL AND PROPRIETARY
Ftrace
36 CONFIDENTIAL AND PROPRIETARY
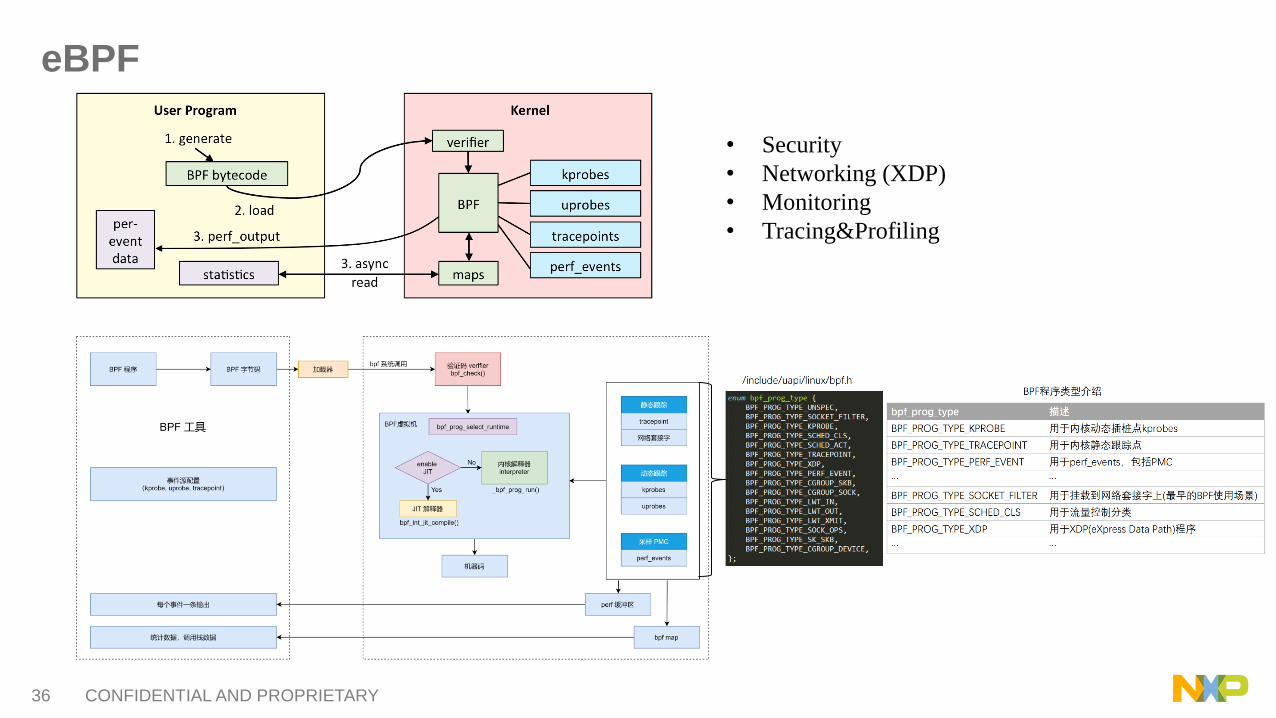
eBPF
• Security
• Networking (XDP)
• Monitoring
• Tracing&Profiling
37 CONFIDENTIAL AND PROPRIETARY
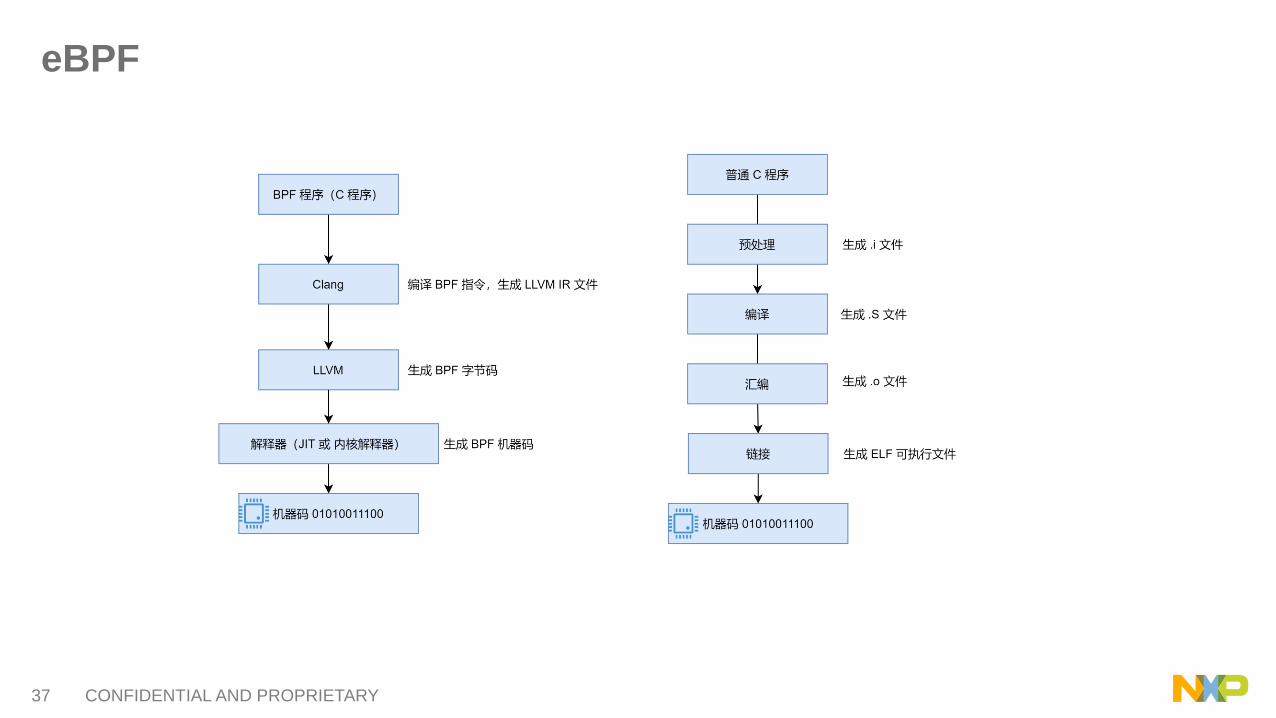
eBPF
38 CONFIDENTIAL AND PROPRIETARY
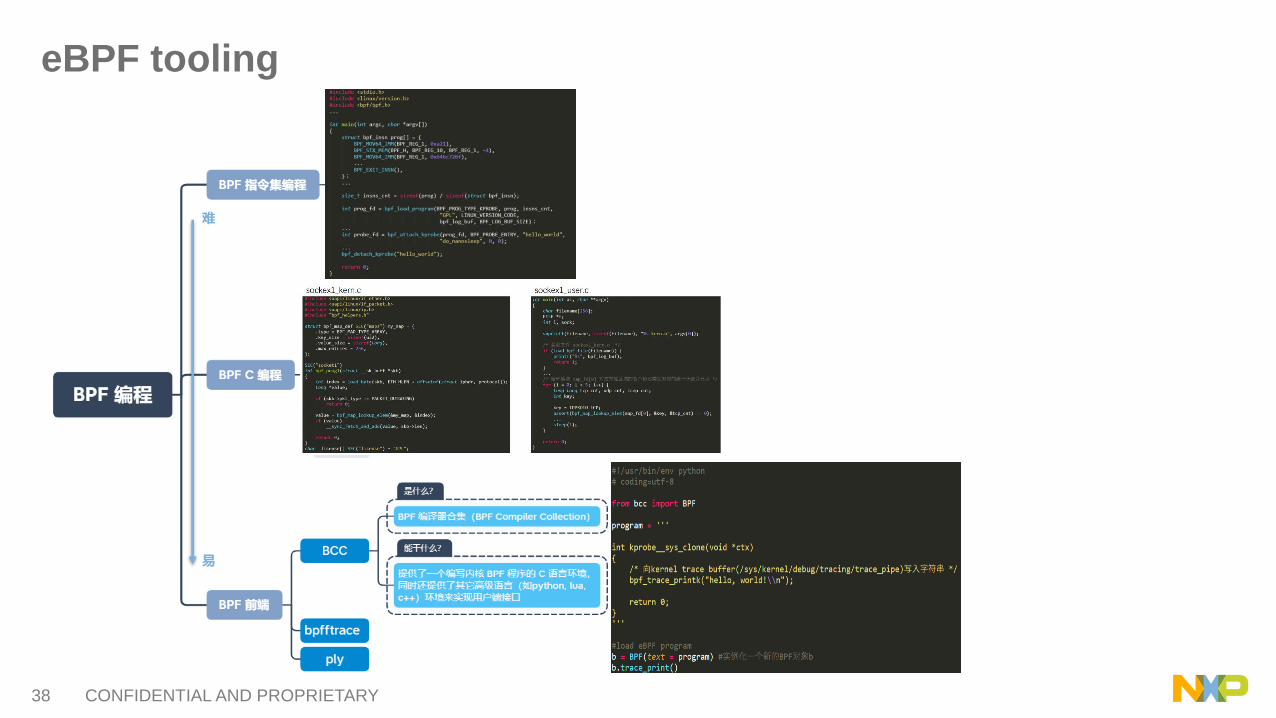
eBPF tooling
难
易

39 CONFIDENTIAL AND PROPRIETARY
Agenda
• OS and System analysis
• Oops/Panic case
➢ addr2line
➢ objdump
➢ gdb
• Pstore
• Kdump
• Memory debugging
➢ SLAB
➢ KASAN
➢ Kmemleak
• Performance
➢ Perf
➢ Ftrace
➢ eBPF/bcc
• Q&A

40 CONFIDENTIAL AND PROPRIETARY