Embed Size (px)
Citation preview
D3.1 Page 1 of 256 14/12/20
Grant Agreement Number: 769054
Project acronym: PIONEERS Project full title: Protective Innovations of New Equipment for Enhanced
Rider Safety
D3.1 Test procedures for PPE, helmet and full vehicle
Due delivery date: M19 Actual delivery date: M32
Organisation name of lead participant for this deliverable: IDIADA
Project funded by the European Commission within Horizon 2020
Dissemination level
PU Public X
CO Confidential, only for members of the consortium (including the Commission Services)
Type
R Document, report X
DEM Demonstrator, pilot, prototype
ORDP Open Research Data Pilot
ETHICS Ethics Requirement
OTHER

D3.1 Page 2 of 256 14/12/20
Document Control Sheet
Deliverable number: D.3.1
Deliverable Title: Test procedures for PPE, helmet and full vehicle
Deliverable date: 30-10-2020
Written by: Enric Soriano
Checked by: Joan Vallès
Approved by
Enric Soriano
Marta Tobar
Joan Vallès
Status Final
Author(s) and contributing partners
Name Organisation E-mail
María del Mar Rasines IDIADA [email protected]
Maria de Odriozola IDIADA [email protected]
Enric Soriano IDIADA [email protected]
Daniel Huster BASt [email protected]
Alessandro Cernicchi DAINESE [email protected]
Simone Di Piazza DUCATI [email protected]
Tom Whyte NeuRA [email protected]
Julie Brown NeuRA [email protected]
Francesco Maffè PIAGGIO [email protected]
Giovanni Baglini PIAGGIO [email protected]
Alessio Mellino PIAGGIO [email protected]
Nicolas Bourdet UNISTRA [email protected]
Caroline Deck UNISTRA [email protected]
Frank Meyer UNISTRA [email protected]
Remy Willinger UNISTRA [email protected]
Jasper den Dekker REV’IT! [email protected]
Michiel Bangels REV’IT! [email protected]
Florian Scherer TU Darmstadt [email protected]
Niccolò Baldanzini UNIFI [email protected]
D3.1 Page 3 of 256 14/12/20
Document Revision History
Version Date Modifications Introduced
Modification Reason Modified by
1 02/10/2020 Compiled version Enric Soriano
2 09/10/2020 Revision on Figures and Tables Florian Scherer and Michiel Bangels
3 09/10/2020 Format check Enric Soriano
4 14/10/2020 Format check Head&Neck content Daniel Huster
5 19/10/2020 Format Check and T3.3 Content Maria de Odriozola
6 23/10/2020 Update of content according to partner’s comments
Enric Soriano
7 27/12/2020 Revision of the document Joan Vallès
Document Distribution Log (Before submitted, to members of Advisory Board or Associated Partners)
Name Organisation E-mail

D3.1 Page 4 of 256 14/12/20
Abstract
This deliverable aims to describe a series of test procedures that have been designed
throughout Tasks 3.1 to 3.3 of the PIONEERS Project. These test procedures intend to
establish a methodology to assess the effectiveness of the safety systems that have been
developed in the PIONEERS Project in order to enhance motorcyclist safety.
On one hand, test designs to assess the effectiveness of PPE (Personal Protective
Equipment) designs have been developed in Section 3. The PPE tests that are included in
this deliverable are: Impact and Abrasion tests, Ankle Impact Tests, Torso Impact Tests with
Airbag device, helmet testing and neck protection testing. On the other hand, test
procedures to evaluate on-board safety systems have also been developed in Section 4 of
this document. These tests include sub-system tests for pelvis PPE test design and Safety
leg cover design; and full-scale crash tests.
To increase the safety of PPEs, one of the current impact abrasion test methods was
improved and adapted to study the risks of soft tissue injuries and failure of fabrics during a
crash. Sample holders equipped with sensors were engineered to further explore and
measure the mechanisms of fabric failure during impact abrasion testing with the AART
machine. Two test setups were developed to measure the temperature rise of a fabric during
an abrasive slide. To measure the moment of hole formation and the impact force of the
sample holder on the tile two other test setups were designed and created. To improve the
factor impact in impact abrasion testing, the AART machine was altered to generate extra
force solely on impact. To better understand the garment failures that occur during real-world
crashes a crashed garment analysis was conducted. After macroscopic and microscopic
examination of the crashed fabrics a new categorization for fabric failures was proposed
based on the cause of the failure.
From PPE’s impact side, new tests methods have been designed in order to be available to
test new parameters for the ankle’s bending. The inversion-eversion and extension-flexion
movements are considered as the main part of the essay.
Has focused on the development of EN 1621-4 and EN 1621-5 by implementing a new test
machine for impact on thorax in order to have a better and more complete test method for
motorcycle airbag jackets.
The proposals have been developed within the design process in T3.1, and the partner’s

D3.1 Page 5 of 256 14/12/20
prototypes will be tested during T3.5. A deviation analysis between the expected and the
obtained results will be done in another stage of the project.
Regarding head and neck protection, PIONEERS project describes two approaches. The
first is a test method for helmets and the second is a proposed geometrical assessment to
consider the interaction of helmets and neck braces. The helmet test method is proposed as
an update and extension of the widely used UN-R22, which defines the mandatory
requirements for motorcycle helmets in the EU. PIONEERS project proposes to include
oblique impact tests in order to better simulate real world impacts of motorcycle riders. In
addition the test conditions are also updated to be more realistic. To fully exploit the potential
of oblique impacts it also considers the use of a Hybrid-III headform as well as advanced
brain injury assessments calculated with the SUFEHM tool. With the proposed helmet test
method the minimum requirements can be set in order to better address brain injury risk of
real world accidents.
To enable an assessment of neck protective devices PIONEERS project proposes a method
to consider the interaction of helmets and neck braces. Currently no standard exists in this
field. As the protection of the cervical spine of PTW riders will need further research and
work beyond PIONEERS project, the proposed method enables the identification of
reasonable helmet brace combinations. With the proposed method the geometry of neck
braces and helmets can be combined virtually to approximate the possible range of motion
of head and neck. This approach can be used in future activities and can also provide
information to customers in to help purchasing the right protective equipment.
In Task 3.3, the test procedures to assess on-board safety systems have been designed. To
do this, the first step has been to identify the target accident scenarios and injuries to be
studied by reviewing the results from PIONEERS D1.1 (Powered Two-Wheelers - Road
Traffic Accident Scenarios and common injuries) and doing an in-depth analysis of
accidentology data to support the development and assessment of on-board safety systems.
Once the scenarios have been identified sub-system and full-scale crash tests have been
designed.
From a sub-system perspective, two different test procedures have been developed. On one
hand a specific test to study the pelvis interaction with the fuel tank, in the event of a frontal
impact, has been developed. This consists in a deceleration test using a mini-sled with a
specific test apparatus (including a rigid wooden fuel tank and a THOR pelvis) mounted on

D3.1 Page 6 of 256 14/12/20
top. Also, a simplified test method to preliminarily assess the performance of PIAGGIO’s
safety leg cover by means of pendulum tests against a full motorcycle with an adult male
rescue manikin sat as motorcyclist rider has also been designed and tested.
In addition to the sub-system tests described above, in task 3.3; full-scale crash test
protocols, to assess and validate PIAGGIO’s safety leg cover and DUCATI’s lateral airbag,
have been developed. In both cases, the chosen test configuration has been a lateral
impact, where the studied motorcycle travels at a constant speed of 30 km/h and is impacted
laterally (at 90º) by an AE-MDB Mobile Deformable Barrier travelling at either 15 km/h or 30
km/h. In both cases, and in alignment with ISO 13232-4; a Motorcyclist Anthropomorphic
Test Device (MATD) or an adapted Hybrid III dummy with MATD lower body has been
proposed as motorcyclist rider. These crash test procedures will be tested in Task 3.5 of the
Project, where two crash tests will be done in each configuration, resulting in a total of 4 full-
scale crash tests (two with the DUCATI motorcycle – one crash with lateral airbags and one
crash without- and two with the PIAGGIO motorcycle -one with safety leg cover and one
without).
Legal Disclaimer
The information in this document is provided “as is”, and no guarantee or warranty is given that
the information is fit for any particular purpose. The above referenced consortium members
shall have no liability for damages of any kind including without limitation direct, special,
indirect, or consequential damages that may result from the use of these materials subject to
any liability which is mandatory due to applicable law.
© 2018 by PIONEERS Consortium.
D3.1 Page 7 of 256 14/12/20
Abbreviations and Acronyms
Acronym Definition
AART Advanced Abrasion Resistance Tester
AIS Abbreviated Injury Scale
AS Accident Scenario
EC European Commission
FOV Field of view
H2020 Horizon 2020
HF Head & Face
IR Infrared
LE Lower Extremities
On-board safety systems Protective systems/ devices that are installed directly on the PTW
OV Opponent Vehicle
PIONEERS Protective Innovations of New Equipment for Enhanced Rider Safety
PPE Personal Protective Equipment
PTW Powered Two-Wheelers
RHA Relative Heading Angle
SDO Standards Developing Organisation
TTS Thorax & Thoracic Spine
UE Upper Extremities
WP Work Package
ROM Range of Motion
HPI Helmet Positioning Index
NBPI Neck Brace Positioning Index
ALL Anterior Posterior Ligament
PLL Posterior Longitudinal Ligament
CL Capsular Ligament
FV Flavum Ligament
ISL Interspinous Ligament
PAAM, AAAM Posterior and Anterior Atlanto-Axial Membranes
AAOM, PAOM Anterior and Posterior Atlanto Occipital Membranes
TL Transverse Ligament
TM Tectorial Membrane

D3.1 Page 8 of 256 14/12/20
C2-C1 Interspinous Ligament
AE-MDB Advanced European Mobile Deformable Barrier face
D3.1 Page 9 of 256 14/12/20
TABLE OF CONTENTS
Legal Disclaimer ........................................................................................................... 6
Abbreviations and Acronyms ...................................................................................... 7
1 Introduction .......................................................................................................... 23
2 Methodology ......................................................................................................... 24
3 Test procedures for PPE, helmet and full vehicle ............................................. 26
3.1 PPE test designs for impact and abrasion ................................................. 26
3.1.1 Introduction ................................................................................................. 26
3.1.2 Preliminary studies ..................................................................................... 27
3.1.3 Test setup to add additional force at moment of impact during abrasion
resistance testing ...................................................................................... 45
3.1.4 AART sample holders equipped with sensors ............................................ 55
3.2 PPE test designs for impact ...................................................................... 94
3.2.1 Impact on ankle .......................................................................................... 94
3.2.2 Impact on torso with airbag device ........................................................... 104
3.3 Head protection test designs ................................................................... 109
3.3.1 Review of current helmet testing .............................................................. 110
3.3.2 Rationale for changes ............................................................................... 113
3.3.3 Proposed impact test procedure ............................................................... 121
3.4 Neck protection test designs ................................................................... 129
3.4.1 Introduction ............................................................................................... 129
3.4.2 Motivation for improvement ...................................................................... 136
3.4.3 Geometrical assessment method ............................................................. 137
3.4.4 Concept of a geometrical approach .......................................................... 138
3.4.5 Helmet measurement procedure .............................................................. 140
3.4.6 Neck brace measurement procedure ....................................................... 147
3.4.7 Numerical assessment procedure ............................................................ 155
3.4.8 Use of proposed geometrical assessment ................................................ 161
3.4.9 Model based criteria ................................................................................. 163
D3.1 Page 10 of 256 14/12/20
3.4.10 Outlook regarding neck brace testing ....................................................... 202
4 Test design for on-board systems .................................................................... 203
4.1 Selection of accident conditions .............................................................. 203
4.1.1 Target accident scenarios and injuries ..................................................... 203
4.1.2 Accidentology data for on-board systems ................................................. 204
4.2 Sub-system physical tests ....................................................................... 208
4.2.1 Pelvis PPE test design ............................................................................. 208
4.2.2 Safety leg cover test design ...................................................................... 212
4.3 Full-scale physical tests ........................................................................... 219
4.3.1 Evaluation of tests performance ............................................................... 219
4.3.2 Test conditions proposal ........................................................................... 220
4.3.3 Definition of crash test protocols ............................................................... 222
5 Conclusions ........................................................................................................ 231
References ................................................................................................................ 235
Appendix A REV’IT!: visual, tactile and microscopic crashed garment analysis ...... 244
Appendix B REV’IT!: reconstruction of garment failures with aart machine ............. 250
Appendix C REV’IT!: reconstruction of garment failure with Tear tester .................. 252
Appendix D REV’IT!: reconstruction of garment failure with tensile tester ............... 253
Appendix E REV’IT!: reconstruction of garment failure with manual cut test ........... 254
APPENDIX F REV’IT!: reconstruction of garment failure with impact tester (drop tower) ...................................................................................................................... 255
Acknowledgments .................................................................................................... 256
D3.1 Page 11 of 256 14/12/20
TABLE OF FIGURES
Figure 1: Impact directions during a motorcycle crash and abrasion testing .......................... 26
Figure 3: Percentage open wounds from Pioneers D1.1 ..................................................... 29
Figure 4: Distribution of garment failures according to zoning in EN13595 (from Meredith et al.)
..................................................................................................................................... 30
Figure 5: Distribution of skin injuries according to zoning in EN13595 (from Meredith et al.) ... 31
Figure 6: Health care costs of top 10 and other injuries by accident category, The Netherlands
1999 (from Meerdin et al.). .............................................................................................. 32
Figure 7: Cambridge (left) and AART (right) abrasion test setups ........................................ 34
Figure 8: Example of a crashed garment analysis form with markings for failures and
measurements ................................................................................................................ 35
Figure 9: Garment failures and reproductions by lab apparatuses ........................................ 36
Figure 10: Garment failure zones of case number 5 ........................................................... 39
Figure 11: Overview of the 7 garment failure categories with information .............................. 42
Figure 12: Categorization overview of garment failures in motorcycle crashes ...................... 43
Figure 13: Fabric belt drive .............................................................................................. 46
Figure 14: Oblique impact with rough surface on the striker & Oblique impact with rough
surface on anvil .............................................................................................................. 46
Figure 15: Rail system impact abrasion ............................................................................. 47
Figure 16: Impact abrasion pendulum ............................................................................... 48
Figure 17: Altered AART machine .................................................................................... 49
Figure 18: Relation between drop height and velocity ......................................................... 50
Figure 19: Electrical Actuator for additional Force on the AART ........................................... 52
Figure 20: Linear spring actuator for additional force on the AART ...................................... 52
Figure 21: Pressure actuator for additional force on the AART ............................................ 53
Figure 22: Design of extra-force mechanism with preloaded spring ...................................... 54
Figure 23: Phases and inputs of the 4 different sensor types with focus area of REV’IT! and
TUDA ............................................................................................................................ 56
Figure 24: Explored monitoring systems to capture the temperature rise during an abrasive
slide............................................................................................................................... 57
Figure 25: Temperature rise on part of the AART abrasive surface during a slide .................. 58
Figure 26: Irreversible temperature labels on fabric samples ............................................... 58
D3.1 Page 12 of 256 14/12/20
Figure 27: Results of irreversible temperature label with a surrounding sticker ...................... 59
Figure 28: Irreversible temperature labels with a 2-layer surrounding sticker ........................ 59
Figure 29: Thermofilm test setup with Thermoscale 100 and colour shift chart ...................... 60
Figure 30: Thermocouple without and with cover, and placement inside the sample holder .... 61
Figure 31: Graph of temperature in relation to time, data collected by a K-type thermocouple 61
Figure 32: Arduino temperature sensor (MLX90614) and setup on tile ................................. 62
Figure 33: SD-card logging of data with Arduino Uno and a MLX90614................................ 63
Figure 34: Test setup IR sensor inside the sample holder, calibration and validation of test
setup ............................................................................................................................. 63
Figure 35: Test setup IR sensor outside the sample holder, calibration and validation of test
setup ............................................................................................................................. 64
Figure 36: Moflon MC400 series, CAD drawing of slip ring design & Final slip ring setup on
AART ............................................................................................................................. 65
Figure 37: Left: Validation and calibration method, Right: Cleaning method .......................... 66
Figure 38: Schematic representation of test design ‘In sample holder’ .................................. 66
Figure 39: Left: Cross section of the sample holder with sensor, Right: Sample holder with 2 IR
Sensors ......................................................................................................................... 67
Figure 40: Left: Hall sensor and magnet ring; Right: Final Test Setup 'In Sample Holder' ....... 67
Figure 42: Left: Cross section of the sample holder with sensor; Right: Sensor Placement in tile
..................................................................................................................................... 68
Figure 41: Schematic representation of test design ‘In tile’. ................................................. 68
Figure 43: Left: Microcontroller with accelerometer in casing; Right: Final Test setup in tile ... 69
Figure 44: Results ‘in sample holder’ for nylon ripstop fabric respectively at 30, 50, 60 and 70
kmh rotational speed ....................................................................................................... 70
Figure 45: Results ‘in sample holder’ for performance leather respectively at 50, 70, 90 and 120
kmh rotational speed ....................................................................................................... 71
Figure 46: Linear and exponential curve fit of maximum temperature vs rotational speed, nylon
ripstop (left side) & performance leather (right side) ........................................................... 72
Figure 47: Maximum temperature differentiation based on sensor location in sample holder .. 73
Figure 48: Temperature data from 6 IR sensors at 60 kmh of nylon ripstop, test run results
with no observable hole formation. ................................................................................... 74
Figure 49: Temperature data from 6 IR sensors at 60 kmh of nylon ripstop, test run results
with observable hole formation on right sample .................................................................. 75
D3.1 Page 13 of 256 14/12/20
Figure 50: Results ‘in tile’ for nylon ripstop fabric respectively at 30, 50, 60 and 70 kmh
rotational ........................................................................................................................ 77
Figure 51: Results ‘in tile’ for performance leather respectively at 50, 70, 90 and 120 kmh
rotational speed .............................................................................................................. 78
Figure 52: Relationship between maximum temperature and rotational speed, ‘in tile’ test setup
..................................................................................................................................... 79
Figure 53: Relationship between maximum temperature and mean friction coefficient, ‘in tile’
test setup ....................................................................................................................... 80
Figure 54: Two explored solutions (PE tape, Kevlar backing layers) to counter the absence of
pressure......................................................................................................................... 81
Figure 55: Schematic overview of force and hole formation sensors .................................... 84
Figure 56: Left: Conducting wires for hole formation sensor, Right: destroyed sensor module 85
Figure 57: Hole Formation Sensor with light barriers .......................................................... 86
Figure 58: Hole formation detection with light barrier sensor ............................................... 87
Figure 59: Load Cell mounting ......................................................................................... 88
Figure 60: Drawer Effect during measurements with load cell .............................................. 88
Figure 61: Position of acceleration sensors ....................................................................... 90
Figure 62: Validation Test 1, Acceleration Sensor .............................................................. 91
Figure 63: Sensor Validation, Test 2, Acceleration Sensor, Raw Data .................................. 92
Figure 64: Sensor Validation, Test 2, Filtered Data Acceleration Sensors ............................. 92
Figure 65: Ankle eversion limit ......................................................................................... 94
Figure 66: Ankle inversion limit ......................................................................................... 95
Figure 67: Subtalar joint center of rotation ......................................................................... 95
Figure 68: IDIADA’s Instron 4206 machine ........................................................................ 96
Figure 69: Instron machine base and attaching holes ......................................................... 97
Figure 70: Inversion-eversion model leg ............................................................................ 98
Figure 71: Flexion-extension model leg ............................................................................. 98
Figure 72: Test preparation ............................................................................................ 100
Figure 73: Alpinestars model leg .................................................................................... 101
Figure 74: Model leg foot with correct rotation axles ......................................................... 101
Figure 75: Flexion-extension test mode ........................................................................... 103
Figure 76: Inversion test mode (left figure) and eversion test mode (right figure) ................. 103
Figure 77: A Striker (left figure) and B Striker (right figure) ................................................ 105
D3.1 Page 14 of 256 14/12/20
Figure 78: Airbag impact machine .................................................................................. 106
Figure 79: Dummy subjection ......................................................................................... 107
Figure 80: Coverage and impact points regarding UNECE-R22 ......................................... 110
Figure 81: Solid headform according to UNECE-R22 ....................................................... 111
Figure 82: Flat and kerbstone anvil ................................................................................. 111
Figure 83: Abrasive and bar anvil according to UNECE-R22 [1] ........................................ 112
Figure 84: Angled anvil to induce rotational kinematics ..................................................... 114
Figure 85 Illustration of the novel WG11 headform dedicated to oblique impacts and potentially
also to linear impacts..................................................................................................... 116
Figure 86: Illustration of the different parts of Strasbourg University Finite Element Head Model
(SUFEHM), with 5320 brick elements of brain. ................................................................. 118
Figure 87: Injury risk curves to predict probability of reversible brain injury by addressing brain
Von Mises stress .......................................................................................................... 118
Figure 88: Improved model-based head injury criteria ...................................................... 119
Figure 89: Illustration of the pre-processor which permits to introduce the 6D head kinematic
versus time curves into the brain model. ......................................................................... 119
Figure 90: Automatic post-processing of the computation results in terms of brain injury risk 120
Figure 91: Representation of linear and rotational sensors used in the Hybrid III headform and
the novel WG11 headform dedicated to oblique impacts and potentially also to linear impacts.
................................................................................................................................... 121
Figure 92 impact points definition for flat impacts ............................................................. 123
Figure 93 impact points definition for oblique impacts ....................................................... 125
Figure 94 Illustration of the coupled experimental versus numerical helmet test method. The
experimental headform acceleration curves are considered as the initial condition of the
numerical head impact simulation followed by the assessment of brain injury risk (AIS2+) ... 127
Figure 95 Neutral, flexed, extended, laterally flexed and rotated head position [21] ............. 130
Figure 96 Limitation of head motion due to helmet-brace-contact ...................................... 131
Figure 97 ATD pendulum used by Leatt in physical and numerical environment [22] ........... 132
Figure 98 Loading directions simulated in (Khosroshahi, Ghajari and Galvanetto 2016) ....... 134
Figure 99 Vertex loading in Meyer, Deck and Willinger [27] ............................................... 135
Figure 100 Impacts simulated in Khoroshahi, Ghajari and Galvanetto [29].......................... 135
Figure 101 Different helmet shapes ................................................................................ 136
Figure 102 Geometries of lower helmet edges from 16 helmets ........................................ 136
D3.1 Page 15 of 256 14/12/20
Figure 103 Lower helmet edge (red) ............................................................................... 138
Figure 104 Neck brace surface relative to T1 location (square) ......................................... 139
Figure 105 Calculated spine postures with contact between helmet and neck brace in different
directions of motions ..................................................................................................... 140
Figure 106 EN 960 headform with highlighted reference plane (blue), mid-sagittal plane (red)
and frontal plane (green) ............................................................................................... 141
Figure 107 Variations of helmet edge inclination due to helmet positioning based on the field of
vision ........................................................................................................................... 142
Figure 108 Lateral view on lower helmet edge of an AGV K6 helmet in three positions ........ 143
Figure 109 Headform, helmet on headform and tip of measurement arm on lower helmet edge
................................................................................................................................... 144
Figure 110 Measurement of points along the lower helmet edge ....................................... 145
Figure 111 Measurement points in areas with low level of detail (left) and with a higher degree
of detai (right) ............................................................................................................... 145
Figure 112 Interpolated lower helmet edge based on 3D measurement points .................... 145
Figure 113 Surrogate shoulder dimensions ..................................................................... 147
Figure 114 Surrogate shoulder side view ........................................................................ 148
Figure 115 Surrogate shoulder ....................................................................................... 148
Figure 116 Surrogate shoulder frontal view ..................................................................... 149
Figure 117 Surrogate shoulder T1 location ...................................................................... 149
Figure 118 Fitment instructions according to the user's manual of the Leatt GPX 5.5 neck brace
................................................................................................................................... 151
Figure 119 Proposal of a Neck Brace Positioning Index (NBPI) ......................................... 152
Figure 120 Outer (red) and inner (green) lines to be measured as a minimum .................... 153
Figure 121 Multiple lines following geometrical structures of the surface ............................ 153
Figure 122 Interpolated and meshed neck brace surfaces relative to T1 (squares) .............. 154
Figure 123 Parametric spine model based on Reed and Jones [37] ................................... 155
Figure 124 Neutral, flexed, extended, laterally flexed and rotated cervical spine posture ..... 157
Figure 125 Simulated contacts in extension, lateral flexion, flexion, rotation and combined
motion ......................................................................................................................... 158
Figure 126 Theoretically possible extension and flexion of different helmets combined with one
neck brace. The percentages are relative to the full extension (72°) and full flexion (64°). .... 159

D3.1 Page 16 of 256 14/12/20
Figure 127 Contact locations between multiple helmets and one neck brace due to head
motion in different directions .......................................................................................... 159
Figure 128 Workflow for a geometric assessment of a helmet-brace-combination ............... 160
Figure 129 (a) Components of the cervical vertebra and intervertebral disc, (b) Ligamentary
system of the lower and upper cervical spine, (c) Overview of the coupled Head-Neck system
FEM. ........................................................................................................................... 165
Figure 130. CORA structure for comparing signal characteristic. ....................................... 167
Figure 131. Presentation of the corridor method. In this study k=2 ..................................... 168
Figure 132 Boundary conditions of the SUFEHNM2020 to reproduce NBDL frontal loading by
implementing T1 velocity time-history curves recorded at T1 level to the SUFEHNM2020
model. ......................................................................................................................... 170
Figure 133 Illustration of SUFEHNM kinematic calculated under frontal loading at different time
steps............................................................................................................................ 170
Figure 134 Superimposition of computed model response to experimental corridor for NBDL
frontal impact simulation in terms of (a) X-axis linear acceleration, (b) Y-axis angular
acceleration, (c) Z-axis linear acceleration, (d) X-axis displacement, (e) Rotation and (f) Z-axis
displacement of the head anatomical center ( [56] [58]) as well as (g) CORA rating results
(values higher than 0.65 are in italic-bold). ...................................................................... 171
Figure 135. Illustration of boundary conditions implemented at T1 level in order to reproduce
NBDL side experiment. .................................................................................................. 172
Figure 136 Illustration of SUFEHNM2020 kinematic under lateral loading .......................... 172
Figure 137 Superimposition of the model responses to experimental corridors for human
volunteer lateral impacts in terms of X-axis (a), Y-axis (b), Z-axis (c) angular accelerations at
the CG of the head, X-axis (d), Y-axis (e), Z-axis (f) linear accelerations at the CG of the head,
X-axis (g), Y-axis (h), Z-axis (i) rotation at the CG of the head, X-axis (j), Y-axis (k), Z-axis (l)
displacement at the CG of the head, and (m) CORA results (values higher than 0.65 are in
italic-bold). ................................................................................................................... 173
Figure 138 Boundary conditions applied to SUFEHNM2020 for validation against vertex impact
accordingly to Nightingale experiments [83] ..................................................................... 174
Figure 139 Head force resultant, Neck axial force and Neck shear force recorded and
computed under vertex impact for validation of SUFEHN-Model against Nightingale et al.
experiments.................................................................................................................. 175
Figure 140. Photo of the experimental setup design by Pintar et al. [84] ............................. 177
D3.1 Page 17 of 256 14/12/20
Figure 141 : Illustration of the kinematic calculated with SUFEHNM2020 against Pintar et al
[84] experiments (Case Fc-197) ..................................................................................... 178
Figure 142 SUFEHNM2020 response against FC-199 case from Pintar et al. [84] .............. 179
Figure 143 SUFEHNM2020 response against FC-200 case from Pintar et al. [84] .............. 179
Figure 144 SUFEHNM2020 response against FC-207 case from Pintar et al. [84] .............. 179
Figure 145 SUFEHNM2020 response against FC-208 case from Pintar et al. [84] .............. 179
Figure 146 SUFEHNM2020 response against FC-209 case from Pintar et al. [84] .............. 179
Figure 147 SUFEHNM2020 response against FC-210 case from Pintar et al. [84] .............. 180
Figure 148 SUFEHNM2020 response against FC-220 case from Pintar et al. [84] .............. 180
Figure 149 SUFEHNM2020 response against FC-221 case from Pintar et al. [84] .............. 180
Figure 150 SUFEHNM2020 response against FC-237 case from Pintar et al. [84] .............. 180
Figure 151 SUFEHNM2020 response against FC-238 case from Pintar et al. [84] .............. 181
Figure 152 SUFEHNM2020 response against FC-239 case from Pintar et al. [84] .............. 181
Figure 153 SUFEHNM2020 response against FC-197 case from Pintar et al. [84] .............. 181
Figure 154 SUFEHNM2020 response against FC-198 case from Pintar et al. [84] .............. 181
Figure 155: Histogram illustrating the Vertical force (Fz) atT1 coming from the Pintar cases
simulated with SUFEHNM2020 ...................................................................................... 182
Figure 156: Injury risk curves propose in terms of vertical Force (Fz) at T1 for an AIS 4+..... 182
Figure 157. Superimposition of computed model responses with the experimental output for
specimen FNSC-102 [86] Linear accelerations at the CG of the head along (a) Y-axis and (b)
Z-axis, (c) Y-axis angular acceleration at the CG of the head, (d) Y axis and (e) Z axis forces at
the OC, (f) moment about the X axis at the OC, (g) Y axis and (h) Z axis forces at T1, (i)
moment about the X axis at T1 as well as (j) CORA rating results (values higher than 0.65 are
in italic-bold) ................................................................................................................. 184
Figure 158. Superimposition of computed model response to experimental result for PMHS
lateral case FNSC-104 in terms of linear accelerations at the CG of the head along (a) Y-axis
and (b) Z-axis, (c) Y-axis angular acceleration at the CG of the head, (d) Y-axis and (e) Z-axis
forces at the OC, (f) moment about the X-axis at the OC, (g) Y-axis and (h) Z-axis forces at T1,
(i) moment about the X-axis at T1 and (j) CORA rating results (values higher than 0.65 are in
italic-bold). ................................................................................................................... 185
Figure 159. Superimposition of computed model response to experimental result for PMHS
lateral case FNSC-109 in terms of linear accelerations at the CG of the head along (a) Y-axis
and (b) Z-axis, (c) Y-axis angular acceleration at the CG of the head, (d) Y-axis and (e) Z-axis
forces at the OC, (f) moment about the X-axis at the OC, (g) Y-axis and (h) Z-axis forces at T1,

D3.1 Page 18 of 256 14/12/20
(i) moment about the X-axis at T1 and (j) CORA rating results (values higher than 0.65 are in
italic-bold)..................................................................................................................... 186
Figure 160. Superimposition of computed model response to experimental result for PMHS
lateral case FNSC-110 in terms of linear accelerations at the CG of the head along (a) Y-axis
and (b) Z-axis, (c) Y-axis angular acceleration at the CG of the head, (d) Y-axis and (e) Z-axis
forces at the OC, (f) moment about the X-axis at the OC, (g) Y-axis and (h) Z-axis forces at T1,
(i) moment about the X-axis at T1 and (j) CORA rating results (values higher than 0.65 are in
italic-bold). ................................................................................................................... 187
Figure 161. Superimposition of computed model response to experimental result for PMHS
lateral case FNSC-115 in terms of linear accelerations at the CG of the head along (a) Y-axis
and (b) Z-axis, (c) Y-axis angular acceleration at the CG of the head, (d) Y-axis and (e) Z-axis
forces at the OC, (f) moment about the X-axis at the OC, (g) Y-axis and (h) Z-axis forces at T1,
(i) moment about the X-axis at T1 and (j) CORA rating results (values higher than 0.65 are in
italic-bold). ................................................................................................................... 188
Figure 162. Superimposition of computed model response to experimental result for PMHS
lateral case FNSC-116 in terms of linear accelerations at the CG of the head along (a) Y-axis
and (b) Z-axis, (c) Y-axis angular acceleration at the CG of the head, (d) Y-axis and (e) Z-axis
forces at the OC, (f) moment about the X-axis at the OC, (g) Y-axis and (h) Z-axis forces at T1,
(i) moment about the X-axis at T1 and (j) CORA rating results (values higher than 0.65 are in
italic-bold). ................................................................................................................... 189
Figure 163. Superimposition of computed model response to experimental result for PMHS
lateral case FNSC-118 in terms of linear accelerations at the CG of the head along (a) Y-axis
and (b) Z-axis, (c) Y-axis angular acceleration at the CG of the head, (d) Y-axis and (e) Z-axis
forces at the OC, (f) moment about the X-axis at the OC, (g) Y-axis and (h) Z-axis forces at T1,
(i) moment about the X-axis at T1 and (j) CORA rating results (values higher than 0.65 are in
italic-bold). ................................................................................................................... 190
Figure 164. Superimposition of computed model response to experimental result for PMHS
lateral case FNSC-126 in terms of linear accelerations at the CG of the head along (a) Y-axis
and (b) Z-axis, (c) Y-axis angular acceleration at the CG of the head, (d) Y-axis and (e) Z-axis
forces at the OC, (f) moment about the X-axis at the OC, (g) Y-axis and (h) Z-axis forces at T1,
(i) moment about the X-axis at T1 and (j) CORA rating results (values higher than 0.65 are in
italic-bold). ................................................................................................................... 191
Figure 165. Computed loads on the neck for the nine lateral impacts for (a) force, (b) moment
at OC, and (c) force, and (d) moment at the T1 levels. ...................................................... 193
D3.1 Page 19 of 256 14/12/20
Figure 166. Injury probability curves for the force at the OC level. Dashed curves show the
confidence interval bounds. Bar chart shows NCIS magnitudes. ........................................ 193
Figure 167. Injury probability curves for the moment at the OC level. Dashed curves show the
confidence interval bounds. Bar chart shows NCIS magnitudes. ........................................ 194
Figure 168. Injury probability curves for the force at the T1 level. Dashed curves show the
confidence interval bounds. Bar chart shows NCIS magnitudes. ........................................ 194
Figure 169. Injury probability curves for the moment at the T1 level. Dashed curves show the
confidence interval bounds. Bar chart shows NCIS magnitudes. ........................................ 194
Figure 170: relationship between change of velocity and mean acceleration ....................... 196
Figure 171 Representation of the lumped parameters model of the trunk [96] ..................... 197
Figure 172: Position of the MC-HNT model in the three seats. .......................................... 198
Figure 173: Kinematic response of the Madymo model and the Head-Neck Finite element
model under a rear impact (Case Corolla 98 N° 29737) .................................................... 198
Figure 174 Results in terms of histograms obtained for the six parameters calculated at OC
and T1 levels for all the 85 real world accident cases reconstructed with the SUFEHNM2020.
................................................................................................................................... 199
Figure 175 Neck injury risk curves in terms of Fxmax calculated at T1 level in order to predict
initial symptom as well as symptoms >1month ................................................................. 200
Figure 176. Relative Heading Angle definition. ................................................................. 205
Figure 177. Test apparatus showing mini-sled, pelvis surrogate and surrogate frame, and fuel
tank surrogate and tank frame. The red arrow indicates the direction of travel of the pelvis
surrogate to impact the fuel tank surrogate. ..................................................................... 209
Figure 178. Pelvis surrogate rotating and the lumbar spine translating upward from the sled
table as a result of the simulated fuel tank impact. ........................................................... 211
Figure 179. Fixing vehicle on test bench. ........................................................................ 213
Figure 180. Dummy characteristics. ................................................................................ 213
Figure 181. Vehicle and dummy fixed on test bench. ........................................................ 214
Figure 182. Pendulum positioning and test setup. ............................................................ 214
Figure 183. Position of impact points on the leg for time history of acceleration data ........... 215
Figure 184. Time history acceleration data impact without safety leg cover ........................ 216
Figure 185. Time history acceleration data impact with safety leg cover ............................. 217
Figure 186. Side crash test proposed for PIAGGIO's safety leg cover. ............................... 220
Figure 187. Side crash test proposed for DUCATI's lateral airbag system. ......................... 221

D3.1 Page 20 of 256 14/12/20
Figure 188. Frontal crash test proposed for NeuRA's pelvis protector. ............................... 222
Figure 189. Trolley for motorcycle support and release. .................................................... 223
Figure 190. Detail of dummy hands positioning. ............................................................... 226
Figure 191. Front and top view of AE-MDB trolley with aluminum structure installed (in grey).
................................................................................................................................... 227
Figure 192. Set up for high-speed cameras. .................................................................... 228
D3.1 Page 21 of 256 14/12/20
TABLE OF TABLES
Table 1: Comparison of damage types between REV'IT! study and Meredith et al. study ........ 37
Table 2: Garment types and failure locations in REV'IT! study ................................................ 37
Table 3: Failure measurements in REV'IT! study ..................................................................... 38
Table 4: Morphological Box for Impact Force Mechanisms ...................................................... 50
Table 5: Correlation between drop height and sliding distance ................................................ 51
Table 6: Correlation between drop height and friction coefficient ............................................. 51
Table 7: Test definitions .......................................................................................................... 99
Table 8: Instron machine base conditions ............................................................................. 102
Table 9: Instron machine base specifications ........................................................................ 104
Table 10: Upper torso impact conditions ............................................................................... 105
Table 11: Test apparatus....................................................................................................... 108
Table 12: Critical values to calculate the BrIC [20] ................................................................ 117
Table 13: Impact calculated measurements .......................................................................... 126
Table 14 Suggested Pass/Fail criteria for the different impact conditions .............................. 127
Table 15: Test matrix ............................................................................................................. 128
Table 16 Intervertebral ROMs in degree according to White and Panjabi [42] ....................... 156
Table 17: Material properties of SUFEHNM2020 implemented under Ls-Dyna software ....... 166
Table 18 Summary of test data.............................................................................................. 177
Table 19 Summary of PMHS lateral impact sled tests and injury scores ............................... 183
Table 20 Database analysis [93] [94] .................................................................................... 196
Table 21 Results of the binary logistic regression in terms of Nagelkerke R² values calculated
for the six candidate parameters able to predict neck injury criteria under rear loading. ........ 200
Table 22. Lateral impact data by OV speed and RHA in AS3. ............................................... 206
Table 23. Lateral impact data by OV speed and environment in AS3. ................................... 206
Table 24. Lateral impact data by PTW speed and RHA in AS3 ............................................. 206
Table 25. Lateral impact data by PTW speed and environment in AS3. ................................ 207
Table 26. Lateral impact data by OV speed and RHA in AS3 (15 km/h clustering for OV speed).
.............................................................................................................................................. 207
Table 27. Lateral impact data by PTW speed and RHA in AS3, with OV speed 30 km/h. ... 208
Table 28. Lateral impact data by PTW speed and RHA in AS3, with OV speed 15 km/h. ... 208
Table 29. Peak pelvis surrogate responses in each test condition ......................................... 211
Table 30. Test parameters setup ........................................................................................... 218
Table 31. Instrumentation used for full MATD. ....................................................................... 224
D3.1 Page 22 of 256 14/12/20
Table 32. Instrumentation used for upper Hybrid III/ lower MATD .......................................... 225
Table 33. List of high-speed camera views. ........................................................................... 228
Table 34. Relative tolerances required for DUCATI’s test comparison................................... 229
Table 35. Relative tolerances required for PIAGGIO’s test comparison. ................................ 230
D3.1 Page 23 of 256 14/12/20
1 Introduction
This deliverable transfers the results of WP1 and WP2 into reliable test methods and the
associated assessment to ensure the protection of the user with the best balance between
repeatability, reproducibility and reliability.
Test procedures for thorax and lower leg impact, impact and abrasion of fabrics, pelvis and
head-neck protection and a frontal and a lateral test for on-board safety systems have been
designed based on accidentology data regarding relevant accident scenarios and main injuries.
Due to differences regarding the state of the art of helmets, the market penetration of neck
protection devices and the need for a separate test for helmets, the authors of this document
decided to split the actions concerning helmet test method and neck protection test method.
Within this document there is a chapter with a proposal for the test procedure for helmets and a
new chapter exposing new approaches for test methods dedicated to neck brace evaluation.
Two full-scale crash test protocols have been designed to validate the two different on-board
systems developed in Task 5.4. In addition, the performance of the defined test have been
evaluated through an assessment and virtual tools specifically designed for the project by the
work of WP6.
Finally, the test methods derived from this Work Package will be tested in T3.5 by assessing
the test method and comparing the expected and the obtained results. All the information
extracted from the work will be provided to the corresponding standards developing
organizations (SDOs) for its implementation in new versions of standards through the work of
WP7.
D3.1 Page 24 of 256 14/12/20
2 Methodology
To create this deliverable, tasks T3.1, T3.2 and T3.3 have been working together following the
prescriptions described below.
The main objective of Task 3.1 is to transfer the knowledge on the impact configurations
identified in Task 2.1 for each accident scenario into feasible test configuration while
maintaining the physical reliability. To increase the safety of PPEs, the impact abrasion test
method will be improved and adapted to cover and study new risks, such as soft tissue injuries
and failure of fabrics. To improve the factor impact in impact abrasion testing a current impact
abrasion apparatus, the AART, will be altered. Sample holders equipped with sensors will be
engineered to further explore and investigate the mechanisms of fabric failure during impact
abrasion testing. Additionally, a specific torso impact test will be designed to study the impact
of a thorax protected with an airbag device recreating the most common accidents. Further, an
impact on the lower leg part of the body will be investigated by applying new stresses for the
new generation PTW boots.
Task 3.2 will develop a test design to assess head and neck protection based on the results of
WP1 and WP2.
In a first stage the relevant impact situations identified within PIONEERS will be combined with
recommendations from literature and the results from other relevant EC projects (e.g.
advanced test methods, assessment criteria). These requirements regarding impact condition
(e.g. velocity, load direction, load mechanism) will be compared to existing regulations and
industry standards to identify the potential for improvements.
In a second stage the identified requirements will form the basis to develop a profound test
method for head and neck protection. The UNECE-R22 [1] as the current regulation for
motorcycle helmets has an isolated view on the helmet without the consideration of neck loads.
Furthermore, the regulation focuses on linear acceleration of the head as the main assessment
criterion. The importance of rotational acceleration e.g. caused by tangential impacts of the
head/helmet is not reflected in the current standard. To assess the performance of helmets,
neck protectors, the interaction of these two elements, the external load conditions as well as
the needed measurement technology will be considered. In the case of external load
conditions, the impact velocity, load direction and the characteristics of contact surfaces will be
defined to enable a reasonable test environment. To address the relevant injury mechanisms
D3.1 Page 25 of 256 14/12/20
found in WP2, the measurement technology and specimens will be selected accordingly. For
both the conditions and the measurement technology, the best possible solution will be
elaborated to achieve a balance between the significance of the results, the reproducibility and
the repeatability of the tests. During the development of the test design the intermediate steps
will be accompanied by WP6 to ensure an approach with the highest possible impact on PTW
safety.
Result of Task 3.2 will be a test set-up to measure relevant characteristics of head and neck
PPE (e.g. translational and rotational head accelerations, neck forces and moments) with
regard to the needs identified within PIONEERS.
WP5 will focus on the development of on-board safety systems to further protect motorcycle
riders. In order to assess these systems and enable the evaluation of future systems, a test
set-up will be designed. Firstly, a set of accident scenarios and the main injuries targeted for
reduction will be selected from previous work in WP1 and WP2 to clearly define the protection
targets and therefore also the evaluation aspects. At least a frontal and a lateral test will be
defined (T3.3). The impact kinematics of the selected accident scenarios will be transferred to
a test set-up considering reliability, reproducibility and the test lab constraints (e.g. use of
dummies, vehicle stability). In order to perform the defined full-scale motorcycle crash tests,
some testing tools may be required to ensure the full vehicle test desired dynamics and the
requirements of repeatability and reproducibility. Those tools will be conceived and virtually
designed in this task.
D3.1 Page 26 of 256 14/12/20
3 Test procedures for PPE, helmet and full
vehicle
In this section of the deliverable the test design for PPEs, for head and neck protection and for
on-board safety systems will be introduced. The test designs mentioned before are defined
tasks within the Work Package.
3.1 PPE test designs for impact and abrasion
3.1.1 Introduction
The focus of this task for REV’IT! and TUDA is on developing a test setup to gain in-depth
knowledge on the changes in physical properties and behaviour of a fabric during abrasion.
The second focus point is to develop a test setup to improve the factor impact on the impact
abrasion test.
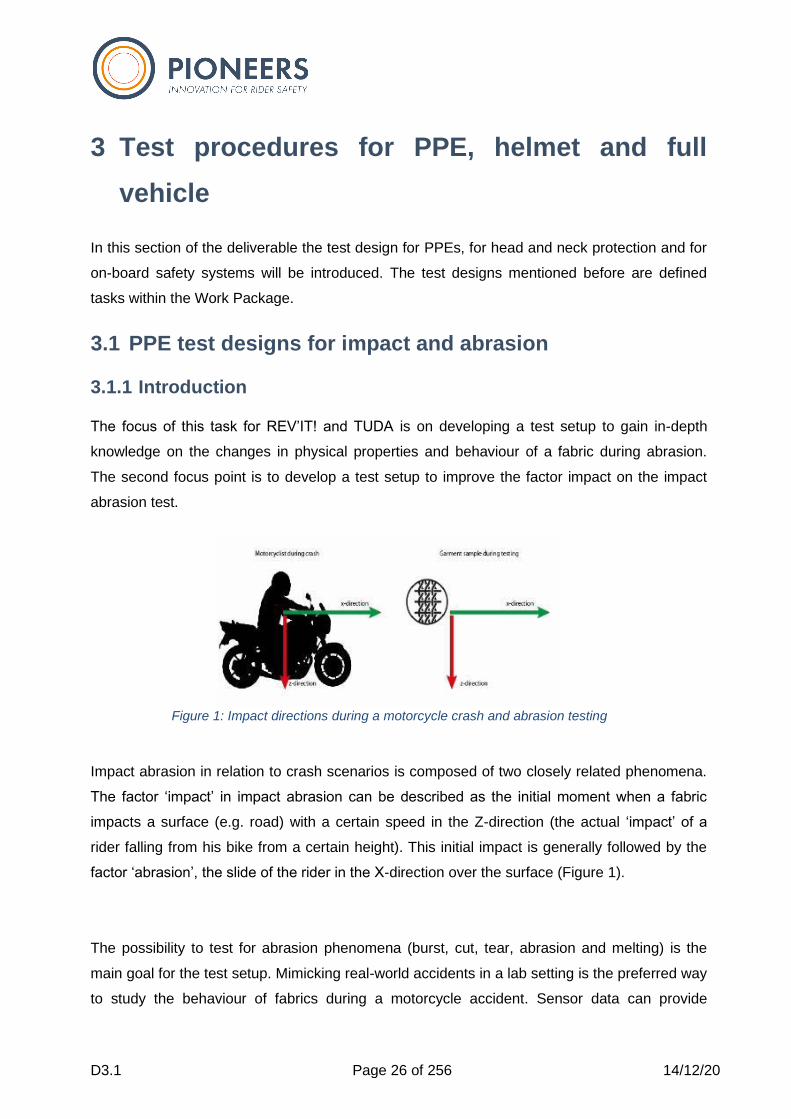
Impact abrasion in relation to crash scenarios is composed of two closely related phenomena.
The factor ‘impact’ in impact abrasion can be described as the initial moment when a fabric
impacts a surface (e.g. road) with a certain speed in the Z-direction (the actual ‘impact’ of a
rider falling from his bike from a certain height). This initial impact is generally followed by the
factor ‘abrasion’, the slide of the rider in the X-direction over the surface (Figure 1).
The possibility to test for abrasion phenomena (burst, cut, tear, abrasion and melting) is the
main goal for the test setup. Mimicking real-world accidents in a lab setting is the preferred way
to study the behaviour of fabrics during a motorcycle accident. Sensor data can provide
Figure 1: Impact directions during a motorcycle crash and abrasion testing
D3.1 Page 27 of 256 14/12/20
additional insights into the underlying mechanisms in fabric failures and can give information
about the protective features of a fabric.
Crashed garment analysis combined with the simulation of crash and fall dynamics on the
AART impact abrasion test machine, resulted in the conclusion that the factor ‘impact’ in impact
abrasion could not be mimicked with the current test machine. To solve this issue the current
AART machine will be altered to a level where the first moment of impact can be studied and
intensified.
To further understand the impact and abrasion phenomena on fabrics sample holders
equipped with sensors will be engineered. Three important parameters, which play a role in
fabric failure, have been determined: temperature, pressure and tensile stress. A fourth sensor
setup for hole formation can give more insight in the moment and specific area of fabric failure.
3.1.2 Preliminary studies
To examine the occurrence of the different types of garment failures, a crashed garment
analysis was performed. A second objective of this study was to define and categorize the
types of garment failures in order to improve analysis accuracy and distinctiveness in REV’IT!’s
in-house lab. By investigating and quantifying the phenomena that lead to garment failure,
more knowledge and a better understanding of the underlying causes could be obtained. With
newfound insights innovative techniques, materials and products can be sourced and produced
to facilitate riders with more protective garments.
The first part of this introduction consists of a literature study on soft tissue injuries and
garment failures caused by motorcycle accidents. The second part lists and compares the two
current test methods for abrasion resistance in lab conditions.
D3.1 Page 28 of 256 14/12/20
Soft tissue injuries literature study
Soft tissue injuries (abrasions, cuts, lacerations and bruising) are in most cases non-life-
threatening injuries but can result in infections, scarring and (temporary) immobility of the rider
after a crash. When looking only at open wounds (abrasions, cuts and lacerations) a reduction
of 58% in upper body open wounds can be noted when riders were wearing a motorcycle
jacket. A reduction of 47% in open leg wounds and a reduction of 38% in lower body open
wounds was observed when riders were riding with motorcycle pants. An open wound is any
internal or external injury that leaves internal tissue exposed to the external environment. The
risk of an open wound injury is significant smaller when motorcycle clothing is worn. Most soft
tissue damage occurs at the legs (76%) followed by the arms (51%) and the head (40%) [2].
Protective clothing is possibly subjected to damage during a crash. Fabric failure may lead to
open wound injuries. More than 25% of worn jackets and pants show damage in the form of
hole formation as a result of a crash. Seams are less frequent to fail according to the study of
de Rome et al. [2]. A possible explanation: seams have a small area in respect to the whole
garment, so less probability to get damaged during a crash.
The study also shows that bruising injuries are the most common type of injury, closely
followed by soft tissue injuries. Motorcycle riders should be protected against these skin
injuries by their PPE (personal protective equipment). To protect, a PPE should have a high
resilience against impact and abrasion. Motorcycle garments should comply to PPE regulation
(EU) 2016/425 [3]. Therefore, garments are generally subjected to the testing procedures
described in EN 17092-1:2002 [4]. This series of standards incorporates amongst others
multiple tests to determine the performance of a fabric used in PPE.
Meredith et al. listed the frequency of the different damage types in crashed garments. 633
garment failures were analyzed and divided into 5 categories: abrasion, tear, burst, cut and
unknown. Failure due to abrasion was the most common failure (77,3%), followed by tear
(11,4%) and burst (3,6%). Cut was only detected in 1,3% of the failures and 6,5% was of an
unknown type [5].
D3.1 Page 29 of 256 14/12/20
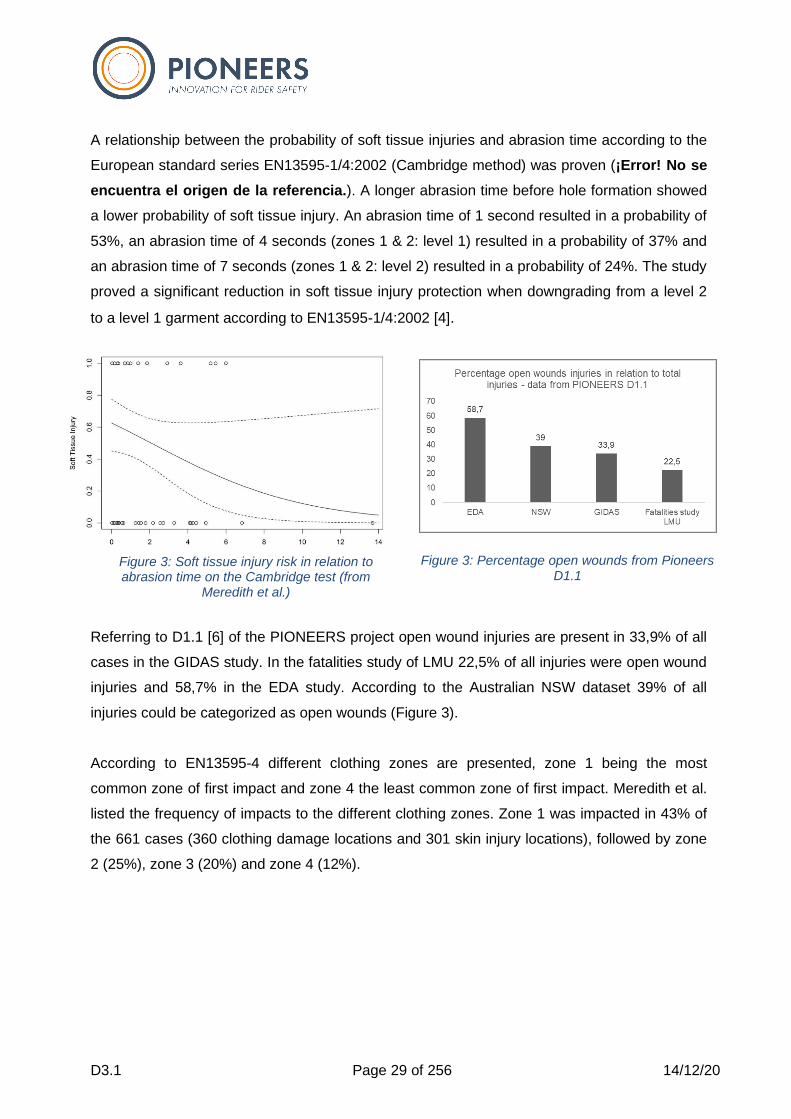
A relationship between the probability of soft tissue injuries and abrasion time according to the
European standard series EN13595-1/4:2002 (Cambridge method) was proven (¡Error! No se
encuentra el origen de la referencia.). A longer abrasion time before hole formation showed
a lower probability of soft tissue injury. An abrasion time of 1 second resulted in a probability of
53%, an abrasion time of 4 seconds (zones 1 & 2: level 1) resulted in a probability of 37% and
an abrasion time of 7 seconds (zones 1 & 2: level 2) resulted in a probability of 24%. The study
proved a significant reduction in soft tissue injury protection when downgrading from a level 2
to a level 1 garment according to EN13595-1/4:2002 [4].
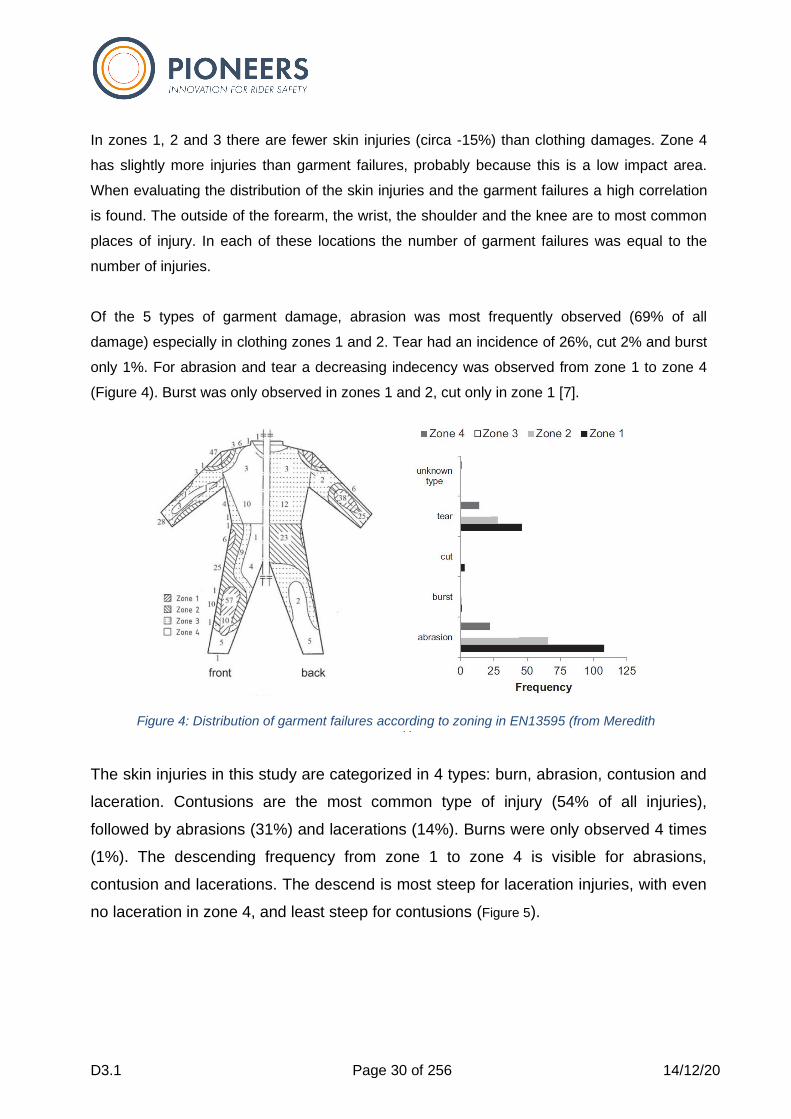
Referring to D1.1 [6] of the PIONEERS project open wound injuries are present in 33,9% of all
cases in the GIDAS study. In the fatalities study of LMU 22,5% of all injuries were open wound
injuries and 58,7% in the EDA study. According to the Australian NSW dataset 39% of all
injuries could be categorized as open wounds (Figure 3).
According to EN13595-4 different clothing zones are presented, zone 1 being the most
common zone of first impact and zone 4 the least common zone of first impact. Meredith et al.
listed the frequency of impacts to the different clothing zones. Zone 1 was impacted in 43% of
the 661 cases (360 clothing damage locations and 301 skin injury locations), followed by zone
2 (25%), zone 3 (20%) and zone 4 (12%).
Figure 3: Soft tissue injury risk in relation to abrasion time on the Cambridge test (from
Meredith et al.)
Figure 3: Percentage open wounds from Pioneers D1.1
D3.1 Page 30 of 256 14/12/20
In zones 1, 2 and 3 there are fewer skin injuries (circa -15%) than clothing damages. Zone 4
has slightly more injuries than garment failures, probably because this is a low impact area.
When evaluating the distribution of the skin injuries and the garment failures a high correlation
is found. The outside of the forearm, the wrist, the shoulder and the knee are to most common
places of injury. In each of these locations the number of garment failures was equal to the
number of injuries.
Of the 5 types of garment damage, abrasion was most frequently observed (69% of all
damage) especially in clothing zones 1 and 2. Tear had an incidence of 26%, cut 2% and burst
only 1%. For abrasion and tear a decreasing indecency was observed from zone 1 to zone 4
(Figure 4). Burst was only observed in zones 1 and 2, cut only in zone 1 [7].
The skin injuries in this study are categorized in 4 types: burn, abrasion, contusion and
laceration. Contusions are the most common type of injury (54% of all injuries),
followed by abrasions (31%) and lacerations (14%). Burns were only observed 4 times
(1%). The descending frequency from zone 1 to zone 4 is visible for abrasions,
contusion and lacerations. The descend is most steep for laceration injuries, with even
no laceration in zone 4, and least steep for contusions (Figure 5).
Figure 4: Distribution of garment failures according to zoning in EN13595 (from Meredith et al.)

D3.1 Page 31 of 256 14/12/20
The economic cost of soft tissue injuries caused by motorcycle accidents is difficult to declare.
Braddock et al. [8] reported that 21,9 % of all injuries were open wounds, from a total of 9250
injuries during principal diagnosis. With this percentage, open wounds are the main injury
suffered by motorcycle riders during a crash followed by femur or lower limb fracture (17,2%)
and upper limb fractures (9,1 %). The medical procedure involvement of the integumentary
system was 17% of 6504 medical procedures. The musculoskeletal system tops this with a
percentage of 38,6% and is thereby to most common human system that needs medical care.
The study of Meerding et al. [9] calculated the cost per patient for the most common injury
groups in The Netherland in 1999. The cost per patient for an open wound is €390 and for a
superficial injury (contusion, small laceration etc.) the cost is €410. These costs rank 25 and 24
respectively, other notable injury groups related to motorcycle accidents are: vertebral
column/spinal cord injury (€6600, rank 4), internal organ injury (€4200, rank 5), Skull-brain
injury (€3100, rank 7), fractures (depending on the body part between €700 and €4100), burn
(€770, rank 17).
The costs of treating patients for open wounds, superficial injuries and burns are smaller in
comparison to other common injuries related to motorcycle accidents. The incidence ranks of
these injuries in traffic accidents is higher, with superficial injury and open wound rank 1 and 2
in the overall statistics, burns have an incidence rank of 15 [9].
Figure 5: Distribution of skin injuries according to zoning in EN13595 (from Meredith et al.)
D3.1 Page 32 of 256 14/12/20
To calculate the total costs for the public health system the incidence and the cost per patient
are multiplied. For The Netherlands in 1999 superficial injury ranks 2 (13.3% of total health
system costs), open wounds ranks 3 (6.6% of total health system costs) and burns ranks 24
(1.1% of total health system costs) [9].
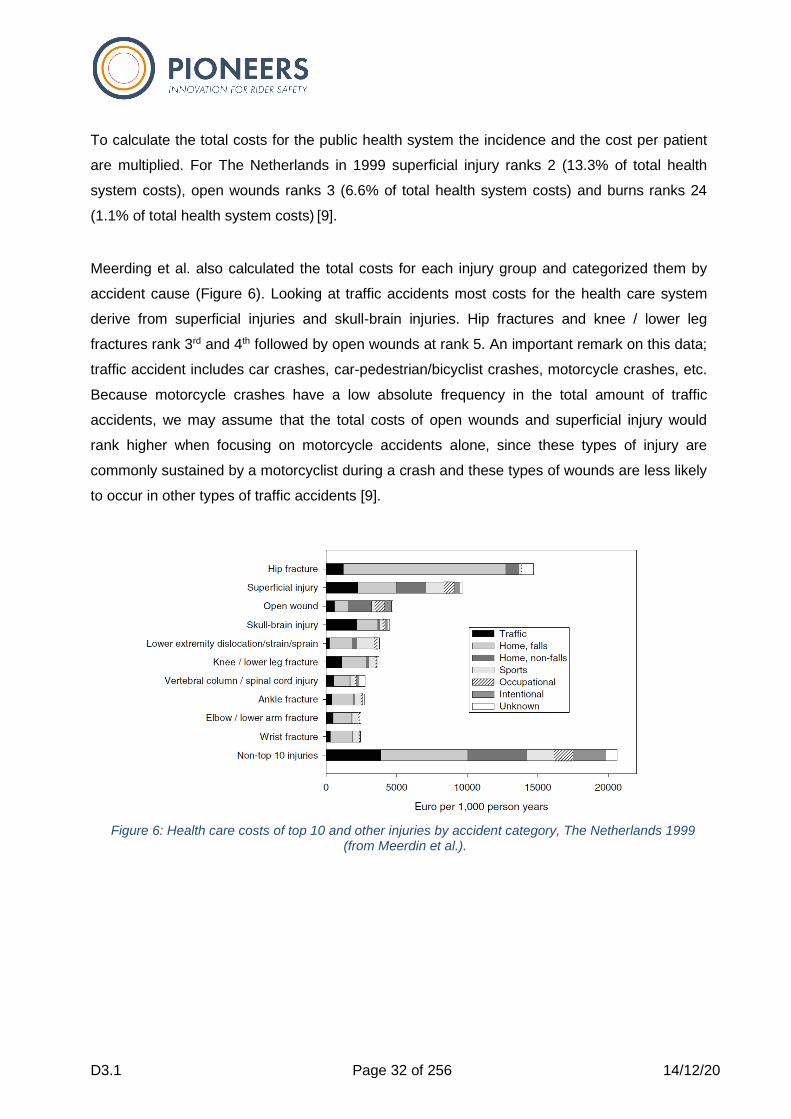
Meerding et al. also calculated the total costs for each injury group and categorized them by
accident cause (Figure 6). Looking at traffic accidents most costs for the health care system
derive from superficial injuries and skull-brain injuries. Hip fractures and knee / lower leg
fractures rank 3rd and 4th followed by open wounds at rank 5. An important remark on this data;
traffic accident includes car crashes, car-pedestrian/bicyclist crashes, motorcycle crashes, etc.
Because motorcycle crashes have a low absolute frequency in the total amount of traffic
accidents, we may assume that the total costs of open wounds and superficial injury would
rank higher when focusing on motorcycle accidents alone, since these types of injury are
commonly sustained by a motorcyclist during a crash and these types of wounds are less likely
to occur in other types of traffic accidents [9].
Figure 6: Health care costs of top 10 and other injuries by accident category, The Netherlands 1999 (from Meerdin et al.).
D3.1 Page 33 of 256 14/12/20
Impact abrasion resistance test methods
Currently two test procedures for impact abrasion resistance are utilized: the Cambridge
procedure (used in EN 13595 [4]) and the AART (Advanced Abrasion Resistance Tester)
procedure (used in EN 17092 [10]). The EN 17092 series ‘Protective Garments for Motorcycle
riders’ (impact abrasion test method: AART) is expected to supersede the EN 13595 series
‘Protective clothing for professional Motorcycle riders’ (impact abrasion test method:
Cambridge). The Cambridge method is known for inconsistent test results due to lack of
reproducibility (CEN/TC 162/WG9 Motorcycle equipment), REV’IT! has decided to focus its
research on the AART impact abrasion resistance method, as well as TUDA because the test
method development goes back to decades of research work at TUDA.
The Cambridge method simulates the process of abrasion between a fabric sample and
sandpaper with a constant velocity of 8 m/s. The sample is dropped on the belt sander by a
pendulum with a force of 49 N and a surface pressure of 2,5 N/cm². The abrasion testing is
carried out as long as the copper wire - that is positioned underneath the test sample - is intact.
The abrasion time until the material is pierced, and thereby cutting the copper wire, is the end
result of this test. The longer a material can withstand the piercing behaviour of the sandpaper
the better its test result. One fabric orientation (warp, weft or 45°) is tested during a run.
The AART method simulates the process of abrasion by orienting 3 fabric samples in 3
directions (warp-, weft- and 45°) on a road surface. The 3 samples are simultaneously
accelerated rotationally to a predefined number of rounds per minute (147 to 707 rpm) and
then dropped from a height of 10 mm on a tile which represents a German concrete road
surface. The fabric sample is dropped with a force of 36,8 N and a surface pressure of 1,875
N/cm². The abrasion testing is carried out until the samples come to a standstill on the tile. One
assessment of a fabric consists of 3 runs where a total of 9 samples are evaluated. The test
result is a pass-fail criterion based on a visual inspection of the 9 samples. Whereas none of
the samples is allowed to have a hole larger than 5 mm in any direction for a pass.
D3.1 Page 34 of 256 14/12/20
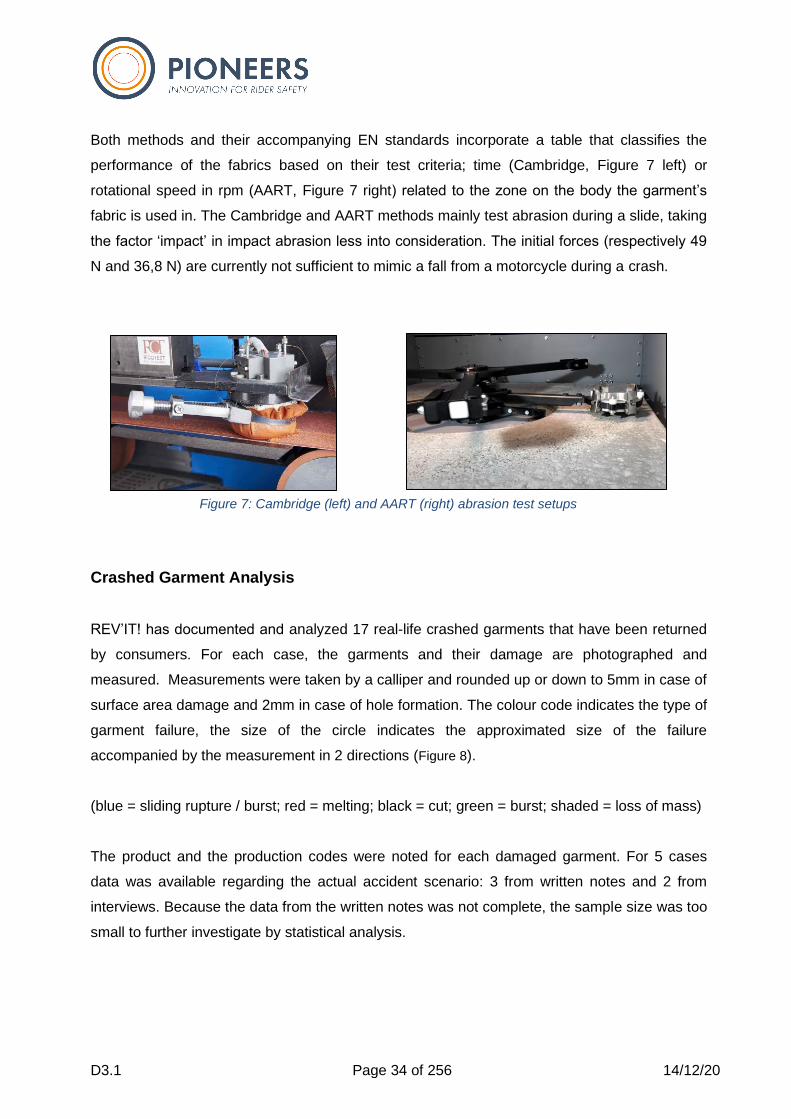
Both methods and their accompanying EN standards incorporate a table that classifies the
performance of the fabrics based on their test criteria; time (Cambridge, Figure 7 left) or
rotational speed in rpm (AART, Figure 7 right) related to the zone on the body the garment’s
fabric is used in. The Cambridge and AART methods mainly test abrasion during a slide, taking
the factor ‘impact’ in impact abrasion less into consideration. The initial forces (respectively 49
N and 36,8 N) are currently not sufficient to mimic a fall from a motorcycle during a crash.
Crashed Garment Analysis
REV’IT! has documented and analyzed 17 real-life crashed garments that have been returned
by consumers. For each case, the garments and their damage are photographed and
measured. Measurements were taken by a calliper and rounded up or down to 5mm in case of
surface area damage and 2mm in case of hole formation. The colour code indicates the type of
garment failure, the size of the circle indicates the approximated size of the failure
accompanied by the measurement in 2 directions (Figure 8).
(blue = sliding rupture / burst; red = melting; black = cut; green = burst; shaded = loss of mass)
The product and the production codes were noted for each damaged garment. For 5 cases
data was available regarding the actual accident scenario: 3 from written notes and 2 from
interviews. Because the data from the written notes was not complete, the sample size was too
small to further investigate by statistical analysis.
Figure 7: Cambridge (left) and AART (right) abrasion test setups

D3.1 Page 35 of 256 14/12/20
The initial analysis of these crashed garments resulted in a classification based on type of
fabric damage due to impact abrasion into 5 categories:
1) Sliding rupture / burst: gradual hole formation & rupture due to a slide.
2) Fabric Melting: fabric melting due to friction and thermal energy in a slide.
3) Loss of mass: surface pilling / minor damage without hole formation due to a slide.
4) Impact rupture / burst: instant rupture/burst because of grabbing of material due to the
fast-moving garment impacting a stationary road surface.
5) Cut: cutting of fibres due to sharp elements in a slide.
By identifying the affected fabrics in the crashed garments and comparing the visual aspects
with the test results on the AART, a relation was established between real life crash damage
and the behaviour of fabrics in a laboratory test setting. It has proven to be difficult to isolate
the individual categories completely since ‘impact abrasion’ mechanisms often result in a
combination of multiple forms of damage in the same area (e.g. ‘fabric melting’ combined with
‘loss of mass’ and possibly ‘cut’).
Four out of five of the categorized types of damage are reproduceable on the AART machine in
a laboratory setting. The impact abrasion mechanism that leads to the type of damage
described as ‘impact rupture / burst’ can currently not be reproduced on the AART machine
due to the mechanical restrictions and the low amount of impact force involved in the initial
drop of the samples on the concrete tile (Figure 9).
Figure 8: Example of a crashed garment analysis form with markings for failures and measurements
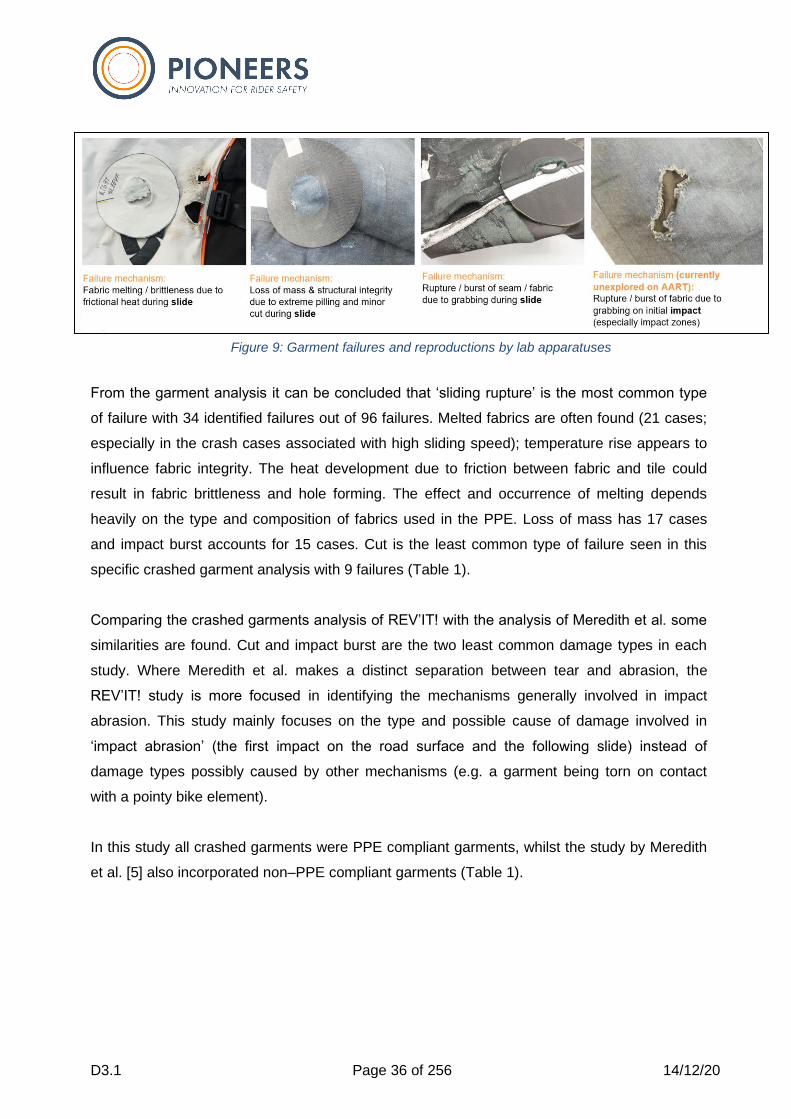
D3.1 Page 36 of 256 14/12/20
From the garment analysis it can be concluded that ‘sliding rupture’ is the most common type
of failure with 34 identified failures out of 96 failures. Melted fabrics are often found (21 cases;
especially in the crash cases associated with high sliding speed); temperature rise appears to
influence fabric integrity. The heat development due to friction between fabric and tile could
result in fabric brittleness and hole forming. The effect and occurrence of melting depends
heavily on the type and composition of fabrics used in the PPE. Loss of mass has 17 cases
and impact burst accounts for 15 cases. Cut is the least common type of failure seen in this
specific crashed garment analysis with 9 failures (Table 1).
Comparing the crashed garments analysis of REV’IT! with the analysis of Meredith et al. some
similarities are found. Cut and impact burst are the two least common damage types in each
study. Where Meredith et al. makes a distinct separation between tear and abrasion, the
REV’IT! study is more focused in identifying the mechanisms generally involved in impact
abrasion. This study mainly focuses on the type and possible cause of damage involved in
‘impact abrasion’ (the first impact on the road surface and the following slide) instead of
damage types possibly caused by other mechanisms (e.g. a garment being torn on contact
with a pointy bike element).
In this study all crashed garments were PPE compliant garments, whilst the study by Meredith
et al. [5] also incorporated non–PPE compliant garments (Table 1).
Figure 9: Garment failures and reproductions by lab apparatuses
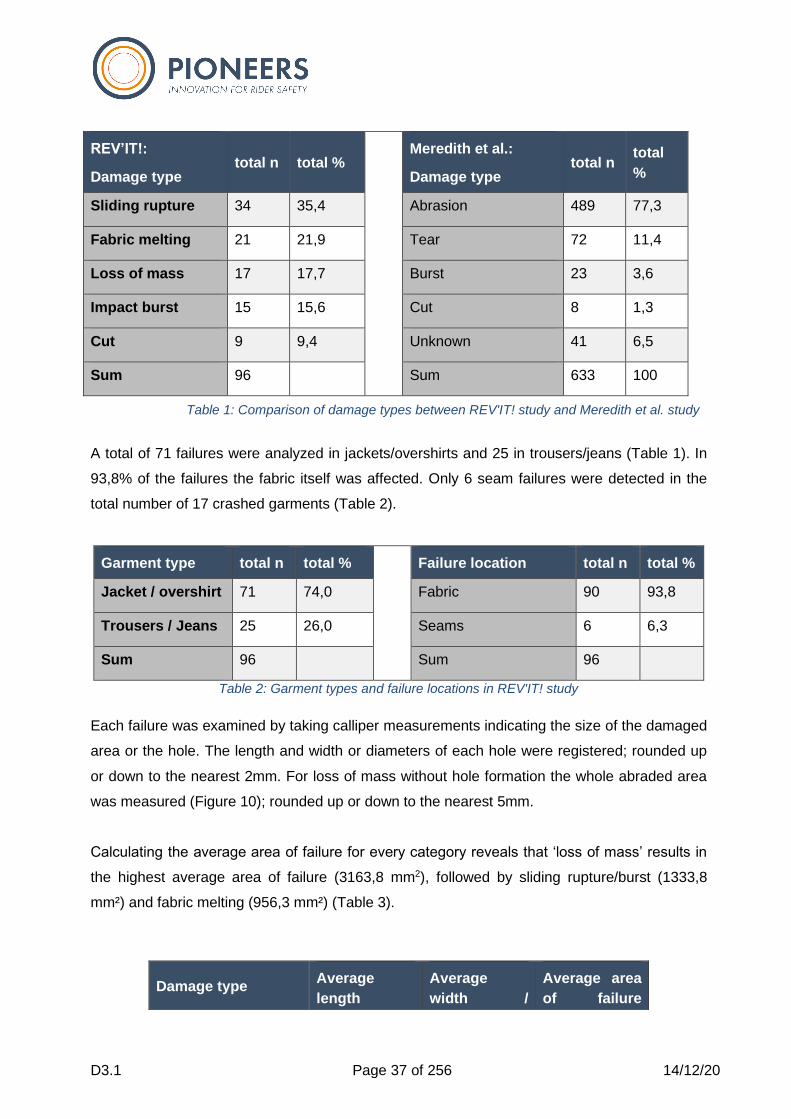
D3.1 Page 37 of 256 14/12/20
REV’IT!:
Damage type
total n total %
Meredith et al.:
Damage type total n
total
%
Sliding rupture 34 35,4 Abrasion 489 77,3
Fabric melting 21 21,9 Tear 72 11,4
Loss of mass 17 17,7 Burst 23 3,6
Impact burst 15 15,6 Cut 8 1,3
Cut 9 9,4 Unknown 41 6,5
Sum 96 Sum 633 100
A total of 71 failures were analyzed in jackets/overshirts and 25 in trousers/jeans (Table 1). In
93,8% of the failures the fabric itself was affected. Only 6 seam failures were detected in the
total number of 17 crashed garments (Table 2).
Garment type total n total %
Failure location total n total %
Jacket / overshirt 71 74,0 Fabric 90 93,8
Trousers / Jeans 25 26,0 Seams 6 6,3
Sum 96 Sum 96
Table 2: Garment types and failure locations in REV'IT! study
Each failure was examined by taking calliper measurements indicating the size of the damaged
area or the hole. The length and width or diameters of each hole were registered; rounded up
or down to the nearest 2mm. For loss of mass without hole formation the whole abraded area
was measured (Figure 10); rounded up or down to the nearest 5mm.
Calculating the average area of failure for every category reveals that ‘loss of mass’ results in
the highest average area of failure (3163,8 mm2), followed by sliding rupture/burst (1333,8
mm²) and fabric melting (956,3 mm²) (Table 3).
Table 1: Comparison of damage types between REV'IT! study and Meredith et al. study
Damage type Average
length
Average
width /
Average area
of failure
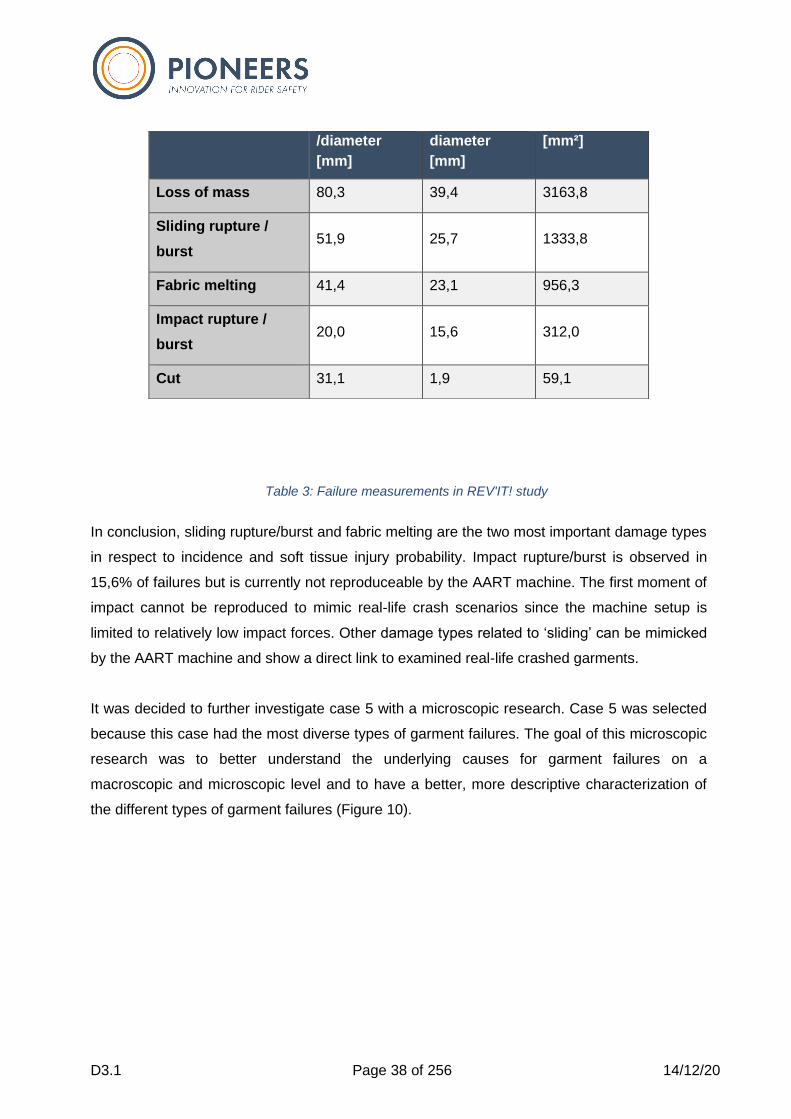
D3.1 Page 38 of 256 14/12/20
In conclusion, sliding rupture/burst and fabric melting are the two most important damage types
in respect to incidence and soft tissue injury probability. Impact rupture/burst is observed in
15,6% of failures but is currently not reproduceable by the AART machine. The first moment of
impact cannot be reproduced to mimic real-life crash scenarios since the machine setup is
limited to relatively low impact forces. Other damage types related to ‘sliding’ can be mimicked
by the AART machine and show a direct link to examined real-life crashed garments.
It was decided to further investigate case 5 with a microscopic research. Case 5 was selected
because this case had the most diverse types of garment failures. The goal of this microscopic
research was to better understand the underlying causes for garment failures on a
macroscopic and microscopic level and to have a better, more descriptive characterization of
the different types of garment failures (Figure 10).
/diameter
[mm]
diameter
[mm]
[mm²]
Loss of mass 80,3 39,4 3163,8
Sliding rupture /
burst 51,9 25,7 1333,8
Fabric melting 41,4 23,1 956,3
Impact rupture /
burst 20,0 15,6 312,0
Cut 31,1 1,9 59,1
Table 3: Failure measurements in REV'IT! study
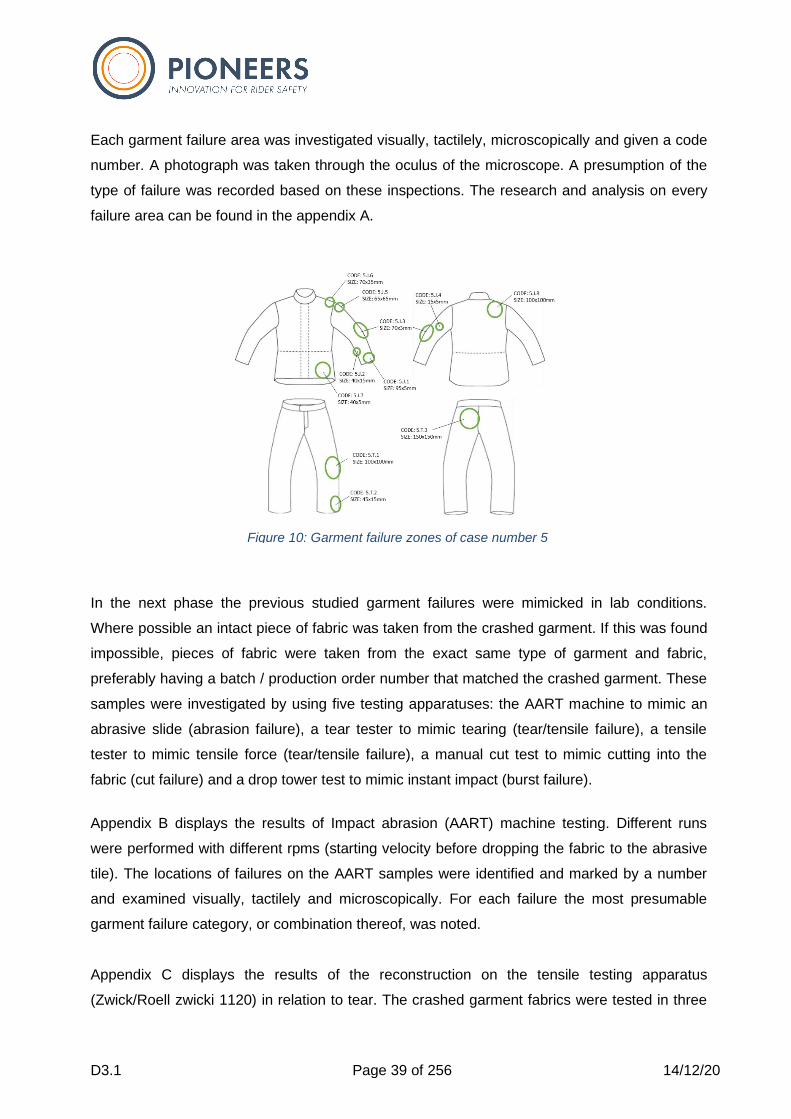
D3.1 Page 39 of 256 14/12/20
Each garment failure area was investigated visually, tactilely, microscopically and given a code
number. A photograph was taken through the oculus of the microscope. A presumption of the
type of failure was recorded based on these inspections. The research and analysis on every
failure area can be found in the appendix A.
In the next phase the previous studied garment failures were mimicked in lab conditions.
Where possible an intact piece of fabric was taken from the crashed garment. If this was found
impossible, pieces of fabric were taken from the exact same type of garment and fabric,
preferably having a batch / production order number that matched the crashed garment. These
samples were investigated by using five testing apparatuses: the AART machine to mimic an
abrasive slide (abrasion failure), a tear tester to mimic tearing (tear/tensile failure), a tensile
tester to mimic tensile force (tear/tensile failure), a manual cut test to mimic cutting into the
fabric (cut failure) and a drop tower test to mimic instant impact (burst failure).
Appendix B displays the results of Impact abrasion (AART) machine testing. Different runs
were performed with different rpms (starting velocity before dropping the fabric to the abrasive
tile). The locations of failures on the AART samples were identified and marked by a number
and examined visually, tactilely and microscopically. For each failure the most presumable
garment failure category, or combination thereof, was noted.
Appendix C displays the results of the reconstruction on the tensile testing apparatus
(Zwick/Roell zwicki 1120) in relation to tear. The crashed garment fabrics were tested in three
Figure 10: Garment failure zones of case number 5
D3.1 Page 40 of 256 14/12/20
directions (warp, weft and 45°) according to EN4674-1:2016, the tear trace was microscopically
analyzed. The same methodology was used to reconstruct the garment failures on a tensile
test according to EN13934-1:2013, only difference was that only two directions were tested
until breakage (warp and weft). These results can be found in appendix D.
Appendix E displays the results of the manual cut test. In this test a sourced fabric sample from
the crashed jacket or trousers was cut by scissors and by a utility knife, having the main aim to
visually identify a cut trace (macroscopically and microscopically).
Appendix F displays the results of a ‘drop test’ reconstruction to mimic direct impact on the
crashed garment fabrics in the Z-axis (instantly compressing the fabric). A drop tower (A.D.
Engineering s.r.l) was used to impact samples derived from the crashed trousers. The samples
were placed on top of a level 2 REV’IT! knee protector and impacted with 50 joules according
to EN1621-1:2012.
By analysing the observations of the crashed garments together with the results of the
microscopic research and reconstruction with the lab apparatuses, 7 fabric failure categories
were defined. For each category the presumable cause of failure was derived from the lab
tests. With this information and data a categorization was created on the basis of observation
and the cause of failure.
A first distinction in the different fabric failure categories is the occurrence of hole formation or
surface damage. If hole formation is present, 5 categories can be defined: cut, tear/tensile,
abrasion, burst, melting. For surface damage 2 categories were defined: pilling/loss of mass
and crystallization.
Cut – Hole formation: Hole formation with clean cut edges due to a slide over a sharp-edged
object (e.g. gravel or glass). The cut trace is influenced by the direction of the slide.
Tear/tensile – Hole formation: Tensile force leading to the disruption of the fabric’s integrity
and resulting in (slotted) hole formation. The edge of the hole is ragged due to the physical
stress exerted in opposite directions. Tearing can occur on the fabric itself or near a stitch line/
seam.
Abrasion – Hole formation: Fabric is highly abraded (loss of mass). Hole formation often due
to damage on yarn level in combination with tensile force. The yarns at the edge of the hole are
hairy and brushed into the opposite direction of the slide.

D3.1 Page 41 of 256 14/12/20
Burst – Hole formation: Hole formation due to an instant impact (compressive force). The
compressive force may be exerted in multiple directions leading to a circular hole.
Melting – Hole formation: Hole formation due to frictional heat (abrasive slide) causing the
yarns to melt.
The edge of the hole feels hard/brittle and bundles of fibres may stick together. The adjacent
area to the periphery often shows signs of crystallization (lustre).
Loss of mass/ pilling – Surface damage: Hairy fabric surface due to pilling of the superficial
fibres. The woven construction is still structurally intact.
Crystallization – Surface damage: Surface crystallization due to friction heat. Increased
lustre, stiffness and brittleness of the affected surface.
Figure 11 gives a detailed overview of each category: picture, evaluation and reconstruction on
macroscopic and microscopic level.
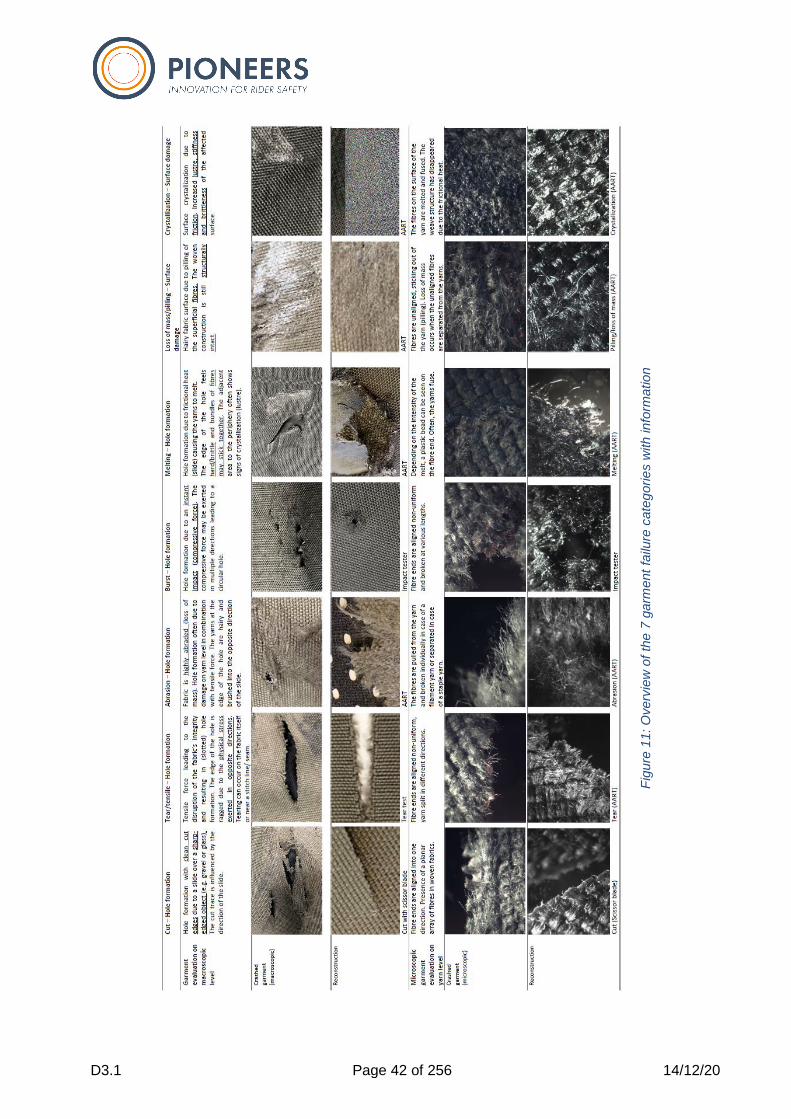
D3.1 Page 42 of 256 14/12/20
Fig
ure
11: O
verv
iew
of
the
7 g
arm
ent
failu
re c
ate
gorie
s w
ith info
rmation

D3.1 Page 43 of 256 14/12/20
A flow chart overview of the 7 different categories, the cause of failure, a short description and
a schematic drawing of the failure is displayed in Figure 12.
This new classification of garment and fabric failures has a more defined demarcation between
the different categories. Causes of failures are linked to the categories and definitions are
supported by schematic representations. The objective of this categorization is to minimize the
amount of doubt between categories. It is to be noted that although 7 fabric failure categories
have been isolated based on observed damage in the crashed garment analysis, a slide (and
therefore the representation on the AART test setup) incorporates a combination of multiple
possible causes of fabric failure. Loss of mass is often combined with tensile forces, frictional
heat and possible cut scenario’s due to sharp elements in the rough road surface.
Additional statistical analysis of the crashed garments could be insightful if more crashed
garments would be collected with accident scenario and rider data. This could give an
indication in which accident scenarios (speed, road condition, first point of impact, rider weight,
type of motorcycle, injury, etc.) the different types of failure occur. This sensitivity study could
be useful to determine if phenomena (grabbing, frictional heat, impact, tension, sharp object,
etc.) are present in a specific accident scenario.
Figure 12: Categorization overview of garment failures in motorcycle crashes
D3.1 Page 44 of 256 14/12/20
All garment failures, as found in the garment analysis, could be mimicked on the AART
machine except for instant burst with hole formation. For this type of failure more force is
needed in the direction perpendicular to the running lane plane. The current AART test setup
does not facilitate in mimicking this kind of failure. The AART test setup is validated for a slide
from a 1-centimeter dropping height. Instant bursts are mostly likely to occur in zones 1
(Meredith et al.), where the impact protectors are located between the skin and the fabric. This
construction provides extra protection to the skin in case the fabric would instantly burst due to
direct impact.
In order to link temperature rise during an abrasive slide to the influence of temperature rise on
the structural strength of a fabric, REV’IT! will perform further research on this topic in T3.5. A
tensile tester will be modified with heating elements to heat up a fabric before and during a
tensile test. This setup is meant to mimic temperature rise during and due to a slide and at the
same time mimic the ‘grabbing’ of a fabric on the concrete tile (resulting in tensile forces). The
same test will also be repeated with samples that received a bum mark at different
temperatures. Results of this research are expected to give an indication to what extend fabrics
lose their integrity when they are heated to temperatures that can be reached during an
abrasive slide. The hypothesis is that the tensile strength of a synthetic fabric will be negatively
influenced when its structural integrity is influenced by the combination of temperature rise and
tensile forces. Another hypothesis is that the structural integrity of leather will not be influenced
by temperature phenomena during an abrasive slide.
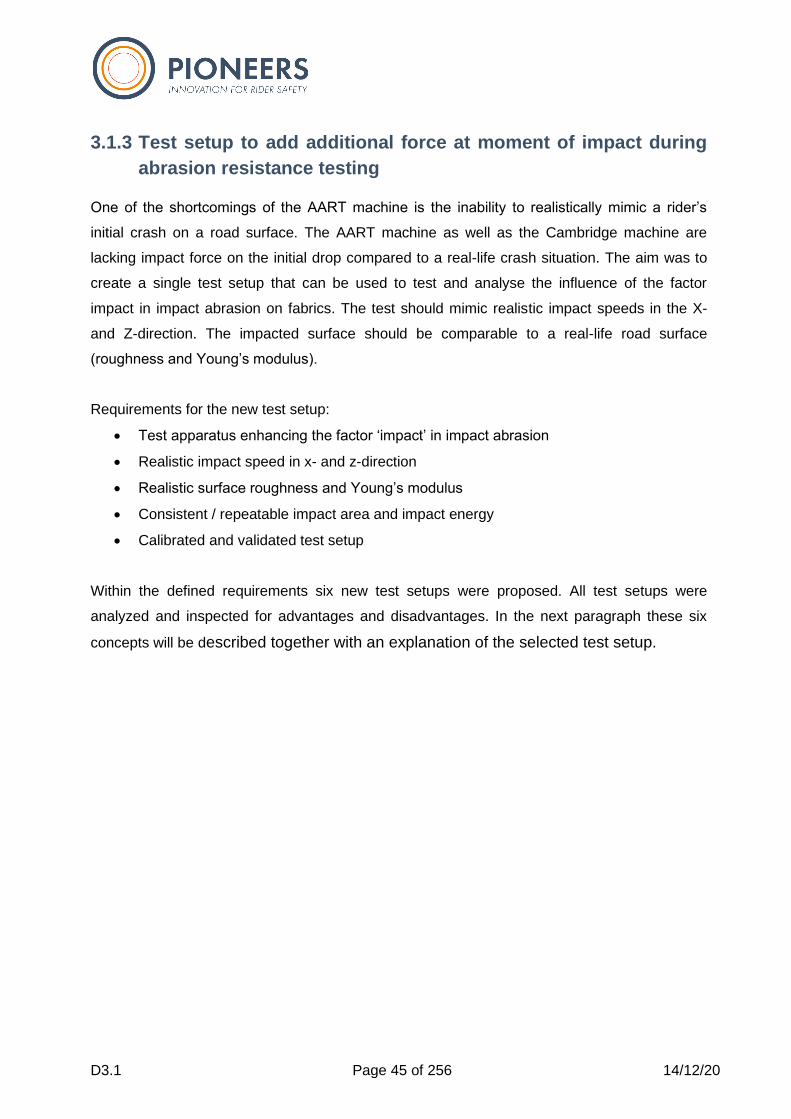
D3.1 Page 45 of 256 14/12/20
3.1.3 Test setup to add additional force at moment of impact during
abrasion resistance testing
One of the shortcomings of the AART machine is the inability to realistically mimic a rider’s
initial crash on a road surface. The AART machine as well as the Cambridge machine are
lacking impact force on the initial drop compared to a real-life crash situation. The aim was to
create a single test setup that can be used to test and analyse the influence of the factor
impact in impact abrasion on fabrics. The test should mimic realistic impact speeds in the X-
and Z-direction. The impacted surface should be comparable to a real-life road surface
(roughness and Young’s modulus).
Requirements for the new test setup:
• Test apparatus enhancing the factor ‘impact’ in impact abrasion
• Realistic impact speed in x- and z-direction
• Realistic surface roughness and Young’s modulus
• Consistent / repeatable impact area and impact energy
• Calibrated and validated test setup
Within the defined requirements six new test setups were proposed. All test setups were
analyzed and inspected for advantages and disadvantages. In the next paragraph these six
concepts will be described together with an explanation of the selected test setup.
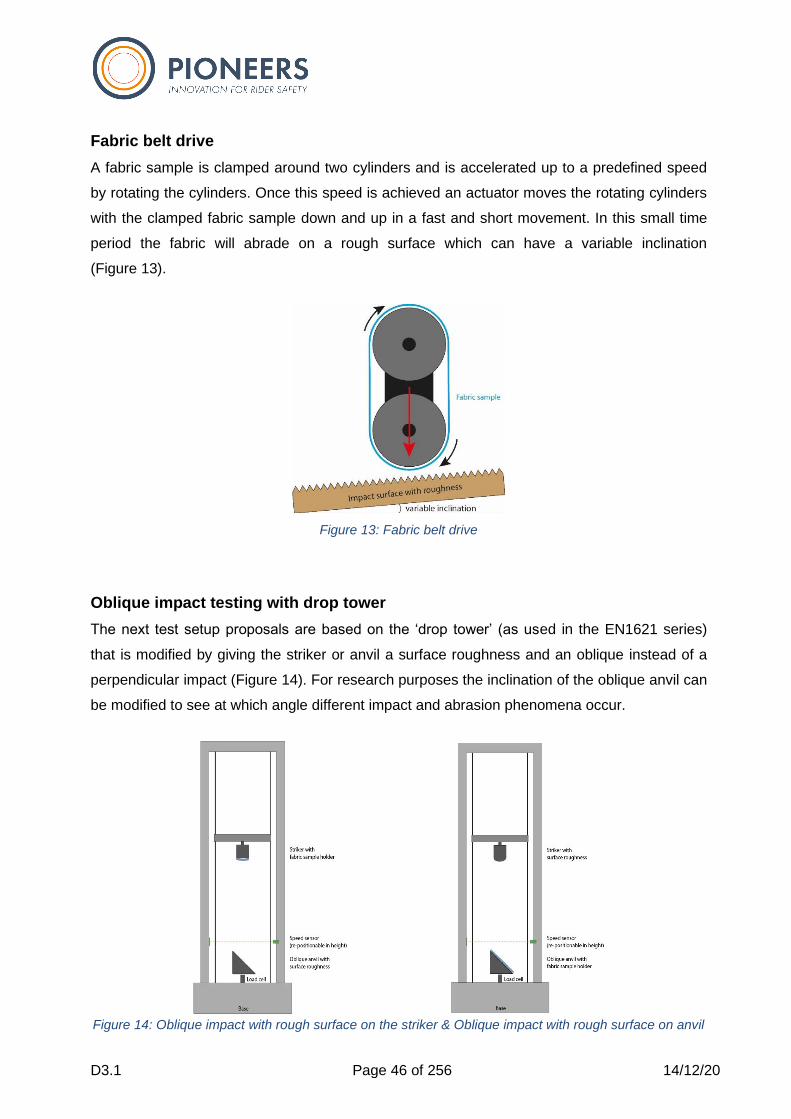
D3.1 Page 46 of 256 14/12/20
Fabric belt drive
A fabric sample is clamped around two cylinders and is accelerated up to a predefined speed
by rotating the cylinders. Once this speed is achieved an actuator moves the rotating cylinders
with the clamped fabric sample down and up in a fast and short movement. In this small time
period the fabric will abrade on a rough surface which can have a variable inclination
(Figure 13).
Oblique impact testing with drop tower
The next test setup proposals are based on the ‘drop tower’ (as used in the EN1621 series)
that is modified by giving the striker or anvil a surface roughness and an oblique instead of a
perpendicular impact (Figure 14). For research purposes the inclination of the oblique anvil can
be modified to see at which angle different impact and abrasion phenomena occur.
Figure 13: Fabric belt drive
Figure 14: Oblique impact with rough surface on the striker & Oblique impact with rough surface on anvil
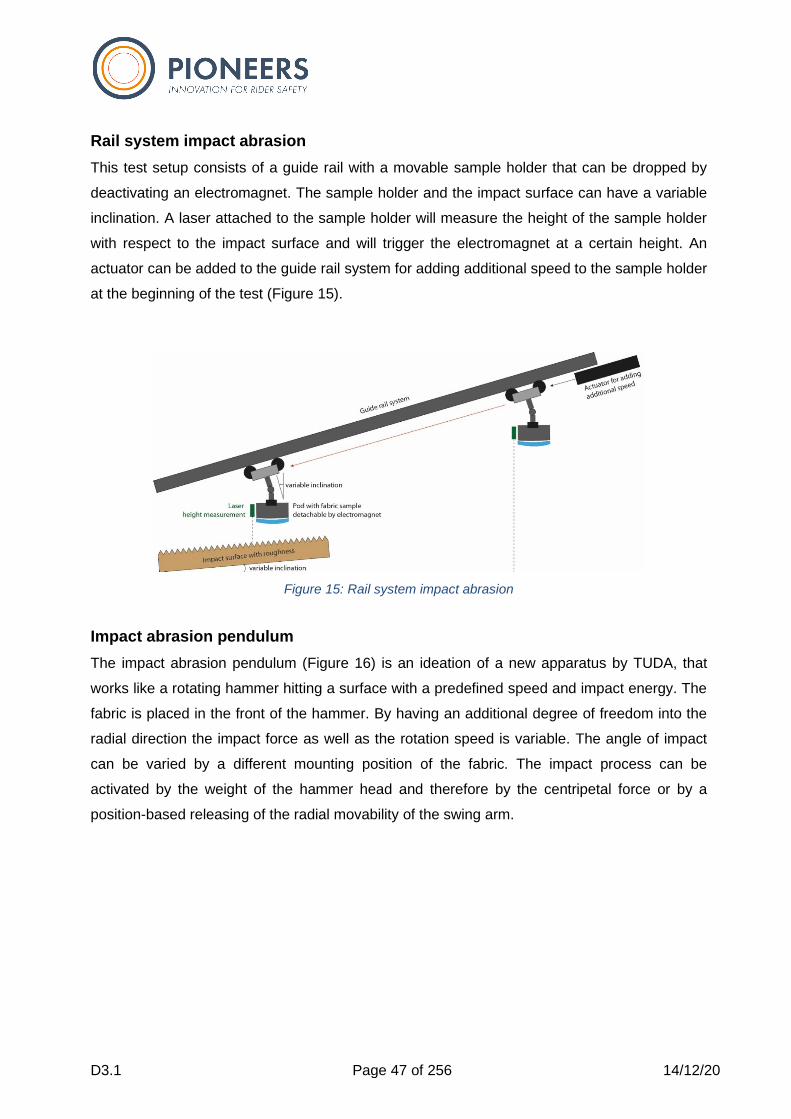
D3.1 Page 47 of 256 14/12/20
Rail system impact abrasion
This test setup consists of a guide rail with a movable sample holder that can be dropped by
deactivating an electromagnet. The sample holder and the impact surface can have a variable
inclination. A laser attached to the sample holder will measure the height of the sample holder
with respect to the impact surface and will trigger the electromagnet at a certain height. An
actuator can be added to the guide rail system for adding additional speed to the sample holder
at the beginning of the test (Figure 15).
Impact abrasion pendulum
The impact abrasion pendulum (Figure 16) is an ideation of a new apparatus by TUDA, that
works like a rotating hammer hitting a surface with a predefined speed and impact energy. The
fabric is placed in the front of the hammer. By having an additional degree of freedom into the
radial direction the impact force as well as the rotation speed is variable. The angle of impact
can be varied by a different mounting position of the fabric. The impact process can be
activated by the weight of the hammer head and therefore by the centripetal force or by a
position-based releasing of the radial movability of the swing arm.
Figure 15: Rail system impact abrasion
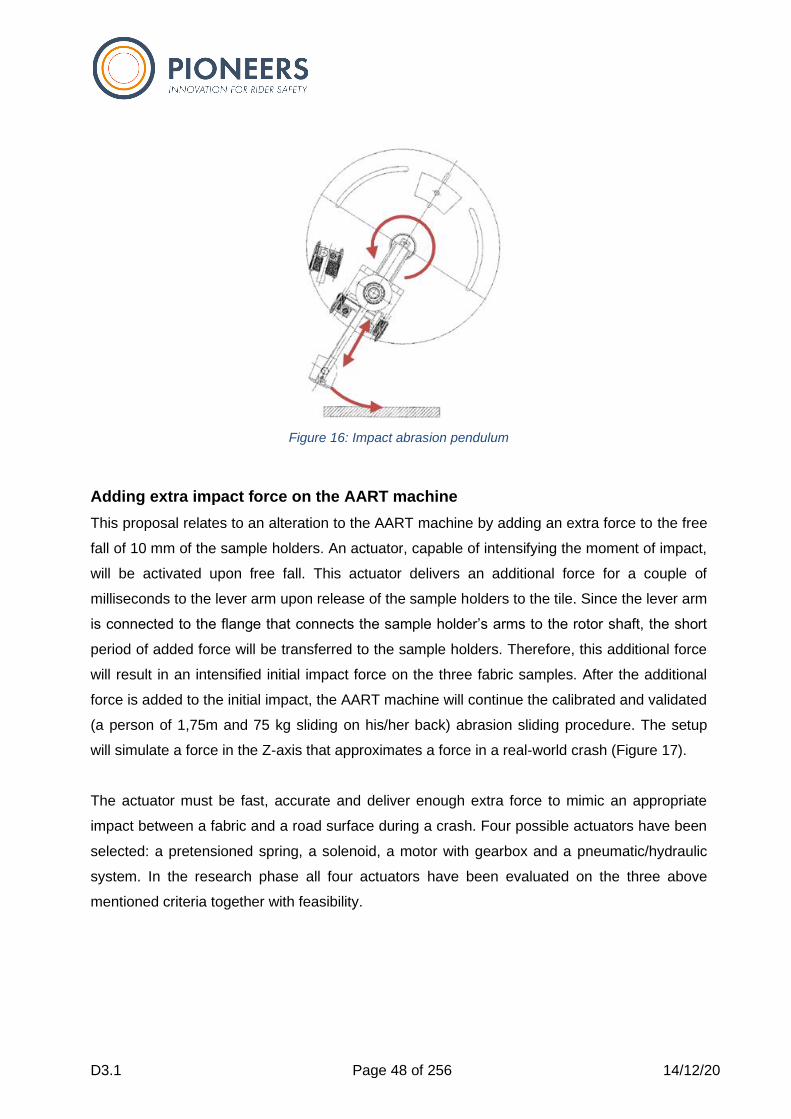
D3.1 Page 48 of 256 14/12/20
Adding extra impact force on the AART machine
This proposal relates to an alteration to the AART machine by adding an extra force to the free
fall of 10 mm of the sample holders. An actuator, capable of intensifying the moment of impact,
will be activated upon free fall. This actuator delivers an additional force for a couple of
milliseconds to the lever arm upon release of the sample holders to the tile. Since the lever arm
is connected to the flange that connects the sample holder’s arms to the rotor shaft, the short
period of added force will be transferred to the sample holders. Therefore, this additional force
will result in an intensified initial impact force on the three fabric samples. After the additional
force is added to the initial impact, the AART machine will continue the calibrated and validated
(a person of 1,75m and 75 kg sliding on his/her back) abrasion sliding procedure. The setup
will simulate a force in the Z-axis that approximates a force in a real-world crash (Figure 17).
The actuator must be fast, accurate and deliver enough extra force to mimic an appropriate
impact between a fabric and a road surface during a crash. Four possible actuators have been
selected: a pretensioned spring, a solenoid, a motor with gearbox and a pneumatic/hydraulic
system. In the research phase all four actuators have been evaluated on the three above
mentioned criteria together with feasibility.
Figure 16: Impact abrasion pendulum
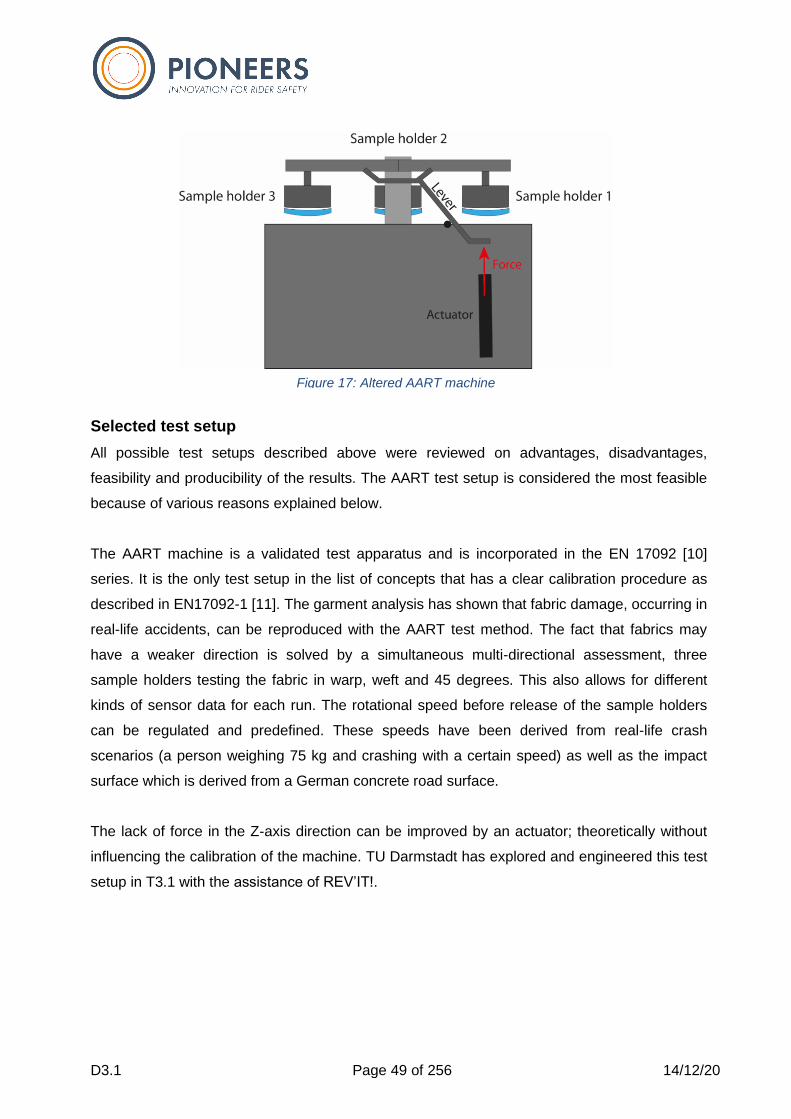
D3.1 Page 49 of 256 14/12/20
Selected test setup
All possible test setups described above were reviewed on advantages, disadvantages,
feasibility and producibility of the results. The AART test setup is considered the most feasible
because of various reasons explained below.
The AART machine is a validated test apparatus and is incorporated in the EN 17092 [10]
series. It is the only test setup in the list of concepts that has a clear calibration procedure as
described in EN17092-1 [11]. The garment analysis has shown that fabric damage, occurring in
real-life accidents, can be reproduced with the AART test method. The fact that fabrics may
have a weaker direction is solved by a simultaneous multi-directional assessment, three
sample holders testing the fabric in warp, weft and 45 degrees. This also allows for different
kinds of sensor data for each run. The rotational speed before release of the sample holders
can be regulated and predefined. These speeds have been derived from real-life crash
scenarios (a person weighing 75 kg and crashing with a certain speed) as well as the impact
surface which is derived from a German concrete road surface.
The lack of force in the Z-axis direction can be improved by an actuator; theoretically without
influencing the calibration of the machine. TU Darmstadt has explored and engineered this test
setup in T3.1 with the assistance of REV’IT!.
Figure 17: Altered AART machine
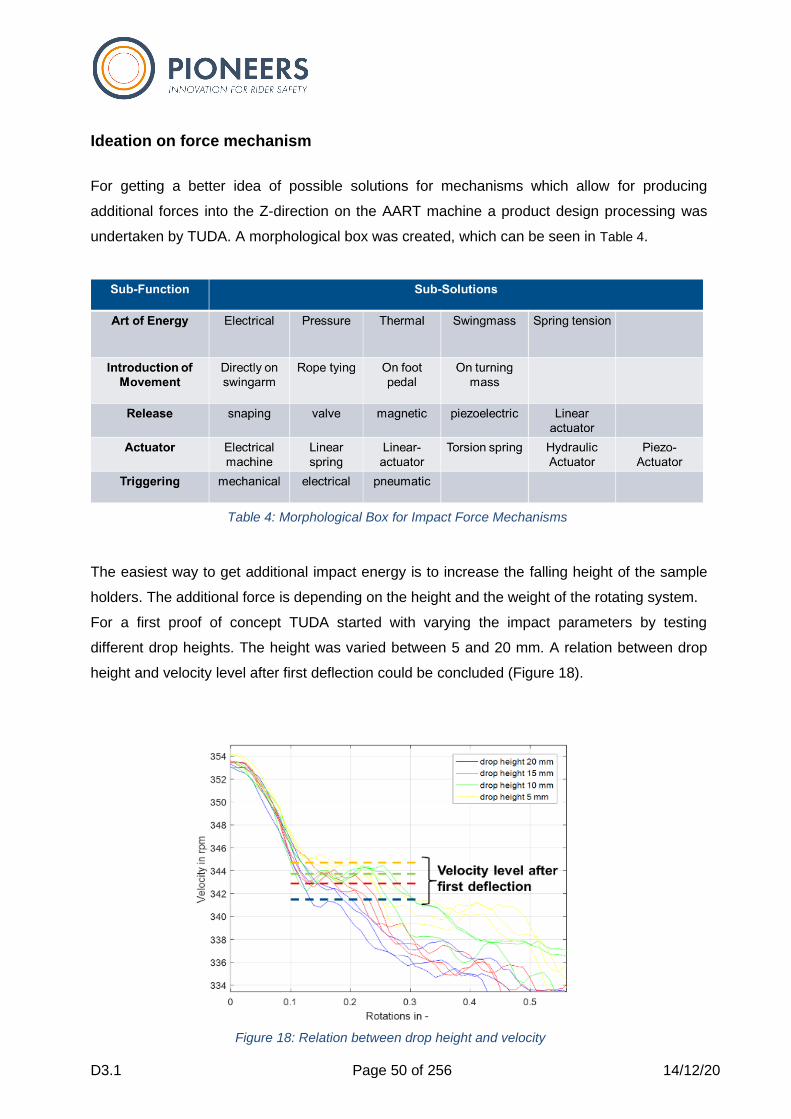
D3.1 Page 50 of 256 14/12/20
Ideation on force mechanism
For getting a better idea of possible solutions for mechanisms which allow for producing
additional forces into the Z-direction on the AART machine a product design processing was
undertaken by TUDA. A morphological box was created, which can be seen in Table 4.
The easiest way to get additional impact energy is to increase the falling height of the sample
holders. The additional force is depending on the height and the weight of the rotating system.
For a first proof of concept TUDA started with varying the impact parameters by testing
different drop heights. The height was varied between 5 and 20 mm. A relation between drop
height and velocity level after first deflection could be concluded (Figure 18).
Figure 18: Relation between drop height and velocity
Table 4: Morphological Box for Impact Force Mechanisms
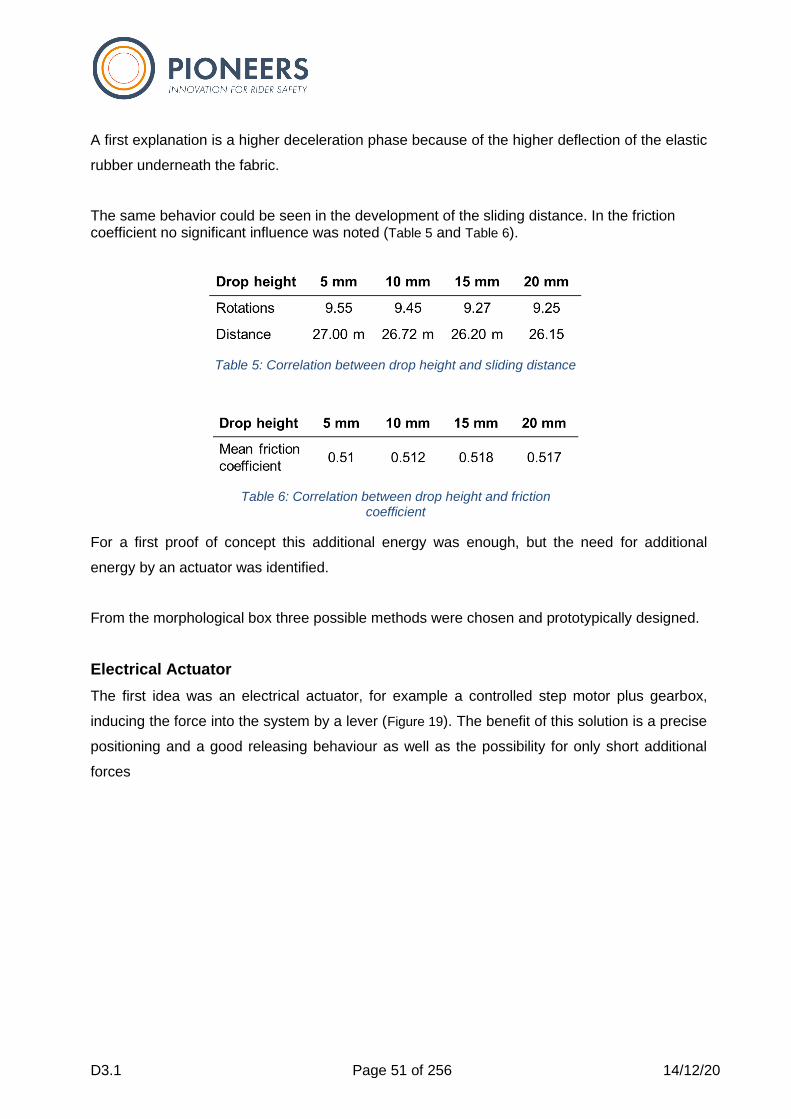
D3.1 Page 51 of 256 14/12/20
A first explanation is a higher deceleration phase because of the higher deflection of the elastic
rubber underneath the fabric.
The same behavior could be seen in the development of the sliding distance. In the friction coefficient no significant influence was noted (Table 5 and Table 6).
For a first proof of concept this additional energy was enough, but the need for additional
energy by an actuator was identified.
From the morphological box three possible methods were chosen and prototypically designed.
Electrical Actuator
The first idea was an electrical actuator, for example a controlled step motor plus gearbox,
inducing the force into the system by a lever (Figure 19). The benefit of this solution is a precise
positioning and a good releasing behaviour as well as the possibility for only short additional
forces
Table 5: Correlation between drop height and sliding distance
Table 6: Correlation between drop height and friction coefficient
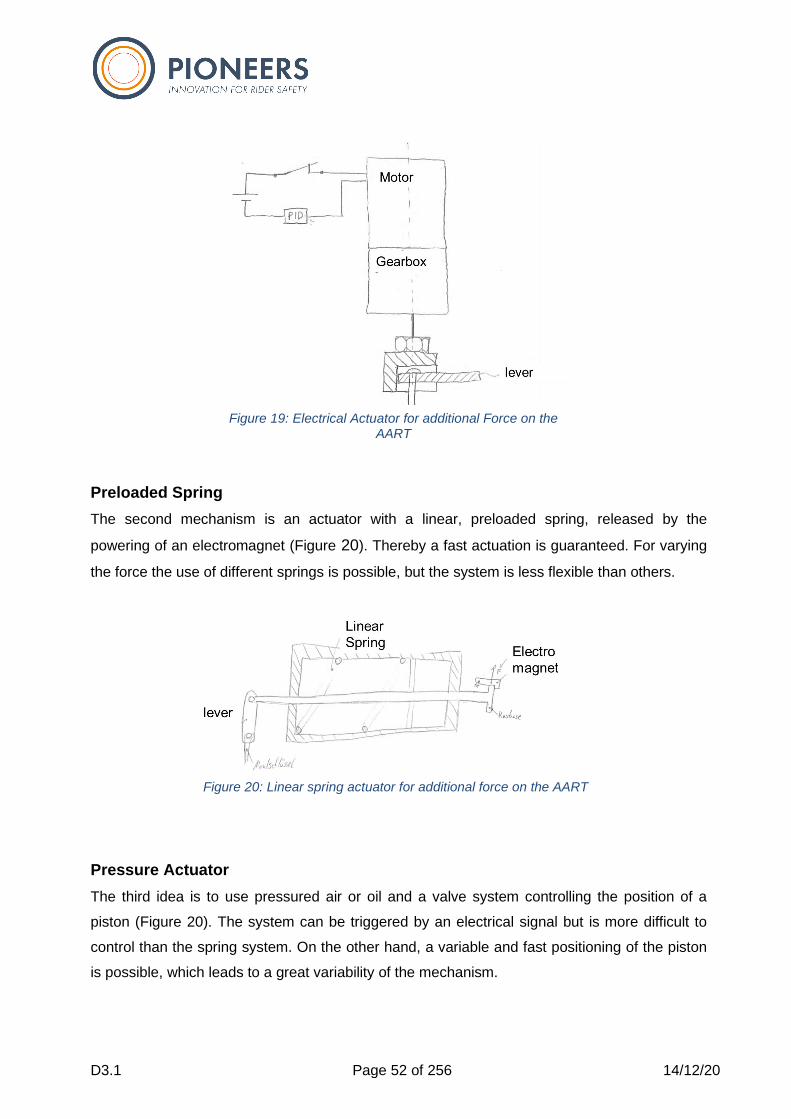
D3.1 Page 52 of 256 14/12/20
Preloaded Spring
The second mechanism is an actuator with a linear, preloaded spring, released by the
powering of an electromagnet (Figure 20). Thereby a fast actuation is guaranteed. For varying
the force the use of different springs is possible, but the system is less flexible than others.
Pressure Actuator
The third idea is to use pressured air or oil and a valve system controlling the position of a
piston (Figure 20). The system can be triggered by an electrical signal but is more difficult to
control than the spring system. On the other hand, a variable and fast positioning of the piston
is possible, which leads to a great variability of the mechanism.
Figure 19: Electrical Actuator for additional Force on the AART
Figure 20: Linear spring actuator for additional force on the AART

D3.1 Page 53 of 256 14/12/20
Selection of concepts
The selection of the system to be developed was made based on an evaluation according to
the criteria of feasibility, safety, controllability and additional energy that could be delivered by
the system. Due to the high amount of additional energy required, the additional effort involved
in controlling and regulating the system, and the lower energy density of the system compared
to the other possible solutions, no system with an electric actuator was selected.
A solution with an additional pressure system and an air or oil pressure actuated actuator offers
great advantages in terms of the additional energy that can be brought in due to the high
energy density of the medium. At the same time, special safety rules must be observed when
using high-pressure systems, as additional monitoring of the system for leaks is necessary.
The necessity of an energy conversion and the special effort in controlling the system led to
bad ratings in these categories. For these reasons, the concept of pressure actuated actuator
was not pursued further.
In the end, the concept of additional energy by a preloaded spring was selected. The concept
received the highest ratings in the categories feasibility, safety and additional energy to be
applied. At the same time, it can be easily controlled by integrating it into the existing release
mechanism.
Figure 21: Pressure actuator for additional force on the AART
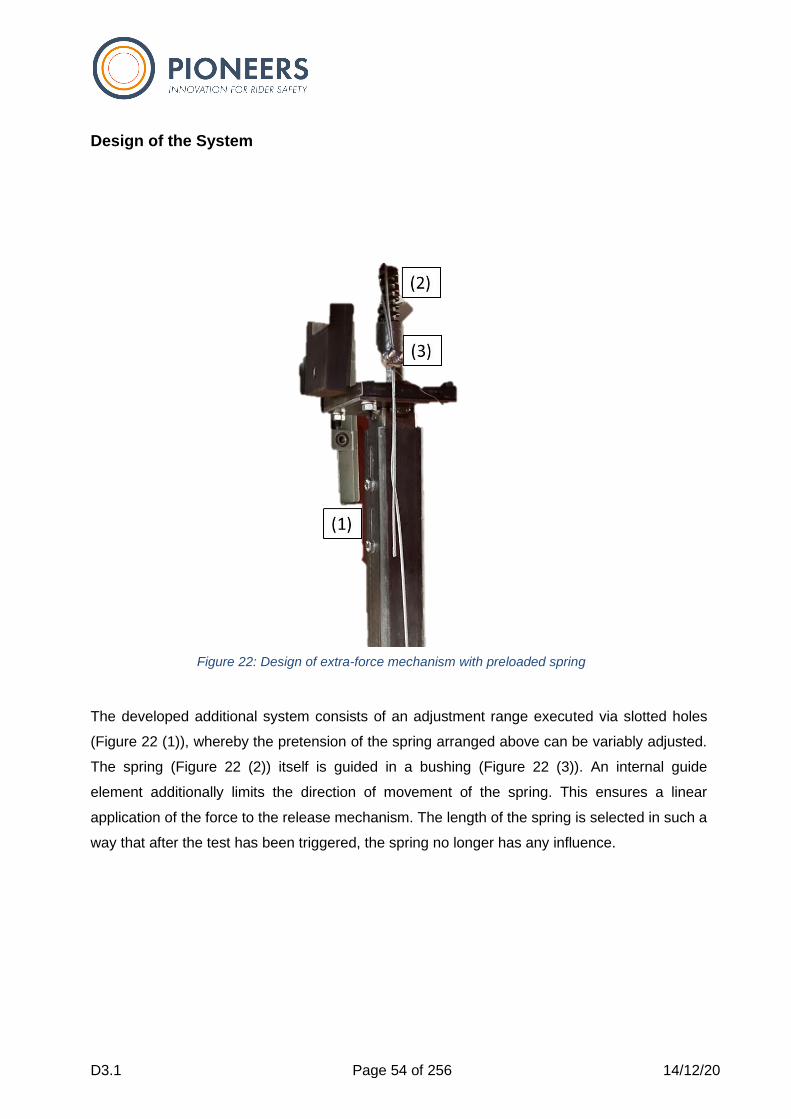
D3.1 Page 54 of 256 14/12/20
Design of the System
The developed additional system consists of an adjustment range executed via slotted holes
(Figure 22 (1)), whereby the pretension of the spring arranged above can be variably adjusted.
The spring (Figure 22 (2)) itself is guided in a bushing (Figure 22 (3)). An internal guide
element additionally limits the direction of movement of the spring. This ensures a linear
application of the force to the release mechanism. The length of the spring is selected in such a
way that after the test has been triggered, the spring no longer has any influence.
Figure 22: Design of extra-force mechanism with preloaded spring
D3.1 Page 55 of 256 14/12/20
3.1.4 AART sample holders equipped with sensors
To further explore the mechanisms leading to different types of fabric damage, as described in
the crashed garment analysis additional data should be acquired; preferably directly derived
from the fabric samples during AART testing.
The garment analysis showed two major differences in fabric damage mechanisms:
- Damage on initial impact: instant grabbing of a fabric leading to burst (relatively thick
edges at the periphery of the hole; showing signs of broken yarns), tear and or cut.
- Damage during sliding: heat development due to frictional energy which could lead to
melting or brittleness and eventually hole formation (melted edges or fabric area),
abrasion that could lead to hole formation (thin / abraded edges at the periphery of the
hole often paired with signs of melting, grabbing and surface pilling), grabbing during a
slide leading to rupture (folded-over, abraded edges), tear and/or cut.
A fabric or seam that impacts with a certain X- and Z- velocity on a rough surface may instantly
grab on this surface causing a possible instant burst of the fabric or seam. To obtain more
information on the aspects that may lead to instant grabbing of a fabric during the initial
moments of impact, tensile and/or pressure sensors can be placed inside the sample holder
underneath the fabric. These sensors in combination with additional force on initial impact
(AART impact actuator, see previous section) will provide information regarding the multi-
directional strain and stress in the fabric on instant grabbing and the forces needed to create
an instant fabric rupture.
Sliding abrasion, scraping of the fabric on a rough surface, may lead to one (or more) impact
abrasion phenomena. The friction energy during a slide can lead to heat development, which
may lead to brittleness and / or melting. A rupture or burst is now more likely to occur because
the fabric has lost its dimensional stability. A heat sensor in the sample holder or inside the tile
can monitor this process over time and can give more information about heat development
during a slide and how fabrics react to this sudden temperature change.
Hole formation is a possible outcome of the AART test run. It can be measured by visual
inspection, by a scale (only very profound ‘loss of mass’ can be measured) or a sensor that can
monitor the hole formation. This sensor could give more information on the exact time of hole
formation during the test run.
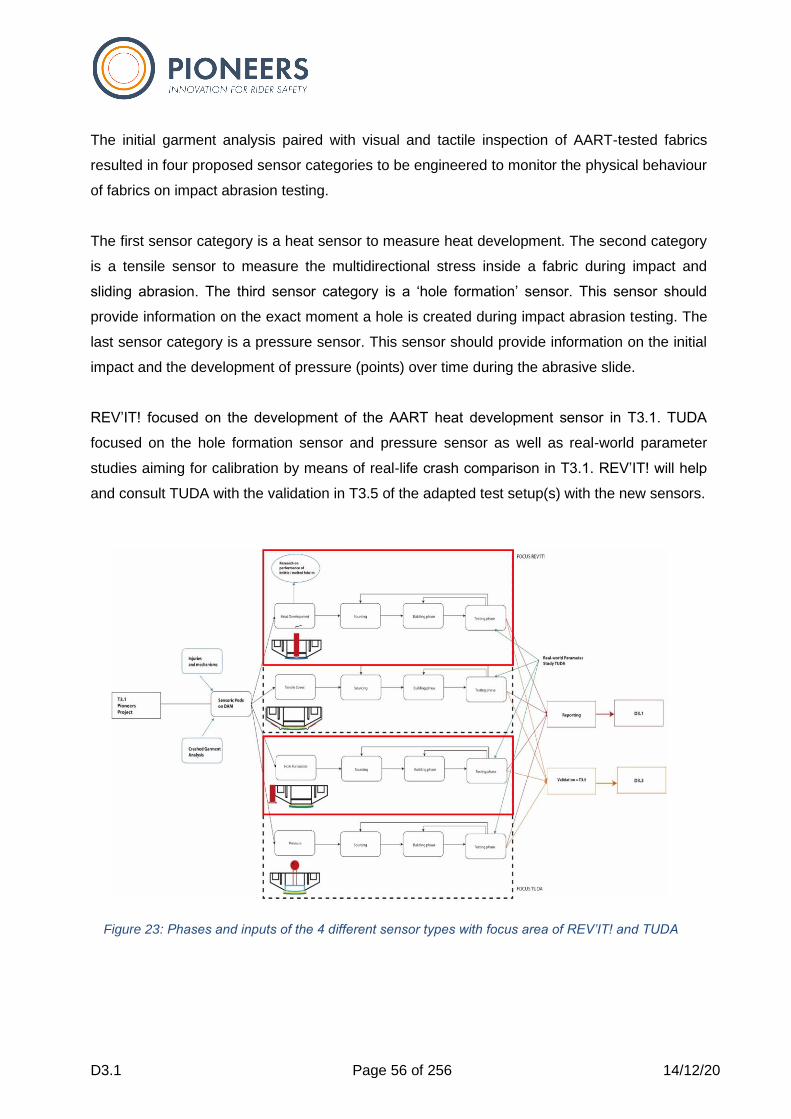
D3.1 Page 56 of 256 14/12/20
The initial garment analysis paired with visual and tactile inspection of AART-tested fabrics
resulted in four proposed sensor categories to be engineered to monitor the physical behaviour
of fabrics on impact abrasion testing.
The first sensor category is a heat sensor to measure heat development. The second category
is a tensile sensor to measure the multidirectional stress inside a fabric during impact and
sliding abrasion. The third sensor category is a ‘hole formation’ sensor. This sensor should
provide information on the exact moment a hole is created during impact abrasion testing. The
last sensor category is a pressure sensor. This sensor should provide information on the initial
impact and the development of pressure (points) over time during the abrasive slide.
REV’IT! focused on the development of the AART heat development sensor in T3.1. TUDA
focused on the hole formation sensor and pressure sensor as well as real-world parameter
studies aiming for calibration by means of real-life crash comparison in T3.1. REV’IT! will help
and consult TUDA with the validation in T3.5 of the adapted test setup(s) with the new sensors.
Figure 23: Phases and inputs of the 4 different sensor types with focus area of REV’IT! and TUDA

D3.1 Page 57 of 256 14/12/20
Heat development sensor
To explore the temperature rise of a fabric during an abrasive slide multiple monitoring
solutions were investigated during task T3.1. The first group of monitoring solutions were
temperature films and labels. This first group has a discrete time evaluation of the temperature,
because of this disadvantage more time was allocated in the research phase to the second
group of monitoring systems. This group consisted of contact sensors and infrared sensor.
Eventually the infrared sensor was chosen as monitoring solution because of its ability to
continuous monitor and its fast sample rate.
Irreversible temperature labels
To develop a sensor sample holder for the AART machine that monitors thermal behaviour of
fabrics during an abrasive slide, a first approach was to measure heat development of the
abrasive surface. A FLIR167 FIR camera was aimed towards the concrete tile during a slide
and the heat development on the tile was monitored (Figure 25). Although this test setup
confirmed an expected temperature rise (although very limited) due to friction, the
measurements were inaccurate and solely provided an impression of the abrasive road surface
temperature; not so much of the actual fabric.
Figure 24: Explored monitoring systems to capture the temperature rise during an abrasive slide
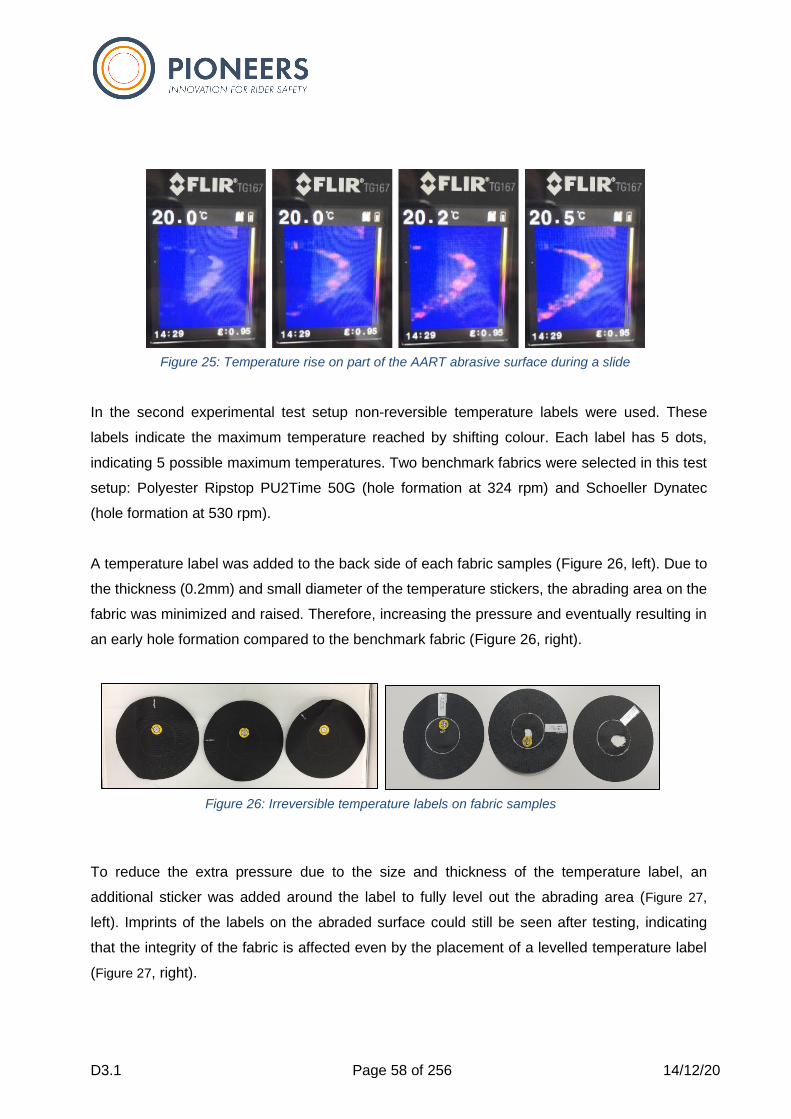
D3.1 Page 58 of 256 14/12/20
In the second experimental test setup non-reversible temperature labels were used. These
labels indicate the maximum temperature reached by shifting colour. Each label has 5 dots,
indicating 5 possible maximum temperatures. Two benchmark fabrics were selected in this test
setup: Polyester Ripstop PU2Time 50G (hole formation at 324 rpm) and Schoeller Dynatec
(hole formation at 530 rpm).
A temperature label was added to the back side of each fabric samples (Figure 26, left). Due to
the thickness (0.2mm) and small diameter of the temperature stickers, the abrading area on the
fabric was minimized and raised. Therefore, increasing the pressure and eventually resulting in
an early hole formation compared to the benchmark fabric (Figure 26, right).
To reduce the extra pressure due to the size and thickness of the temperature label, an
additional sticker was added around the label to fully level out the abrading area (Figure 27,
left). Imprints of the labels on the abraded surface could still be seen after testing, indicating
that the integrity of the fabric is affected even by the placement of a levelled temperature label
(Figure 27, right).
Figure 25: Temperature rise on part of the AART abrasive surface during a slide
Figure 26: Irreversible temperature labels on fabric samples
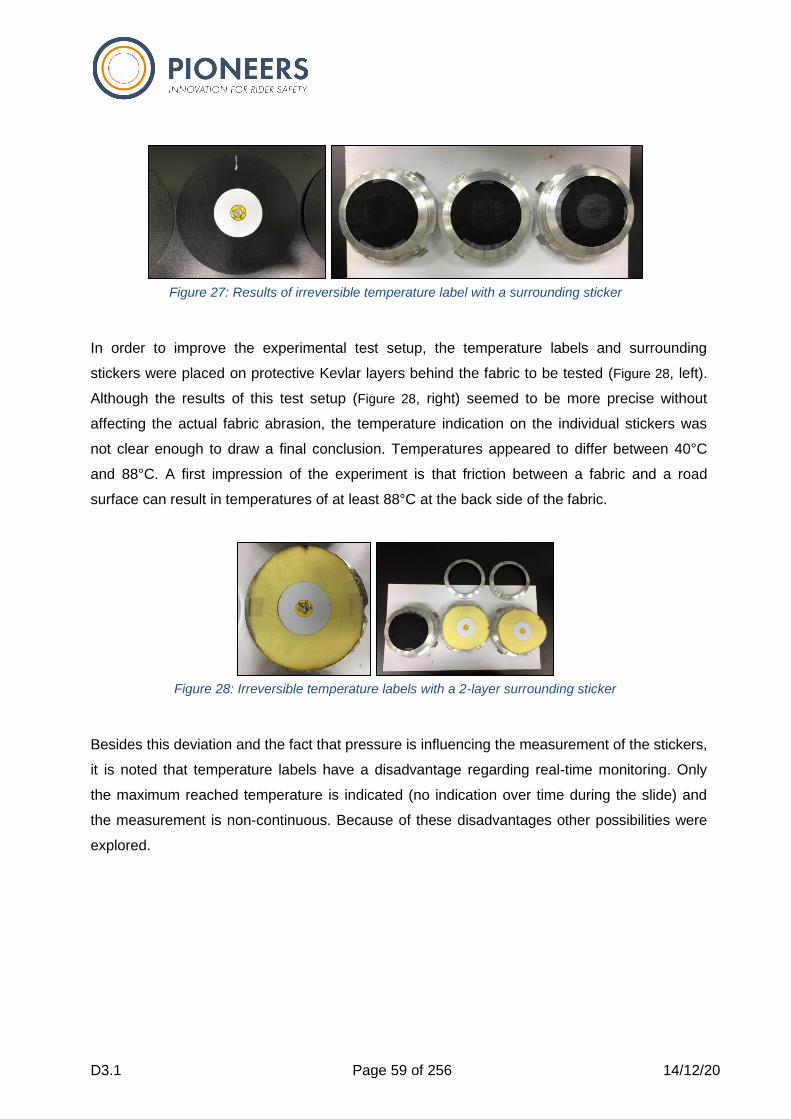
D3.1 Page 59 of 256 14/12/20
In order to improve the experimental test setup, the temperature labels and surrounding
stickers were placed on protective Kevlar layers behind the fabric to be tested (Figure 28, left).
Although the results of this test setup (Figure 28, right) seemed to be more precise without
affecting the actual fabric abrasion, the temperature indication on the individual stickers was
not clear enough to draw a final conclusion. Temperatures appeared to differ between 40°C
and 88°C. A first impression of the experiment is that friction between a fabric and a road
surface can result in temperatures of at least 88°C at the back side of the fabric.
Besides this deviation and the fact that pressure is influencing the measurement of the stickers,
it is noted that temperature labels have a disadvantage regarding real-time monitoring. Only
the maximum reached temperature is indicated (no indication over time during the slide) and
the measurement is non-continuous. Because of these disadvantages other possibilities were
explored.
Figure 27: Results of irreversible temperature label with a surrounding sticker
Figure 28: Irreversible temperature labels with a 2-layer surrounding sticker
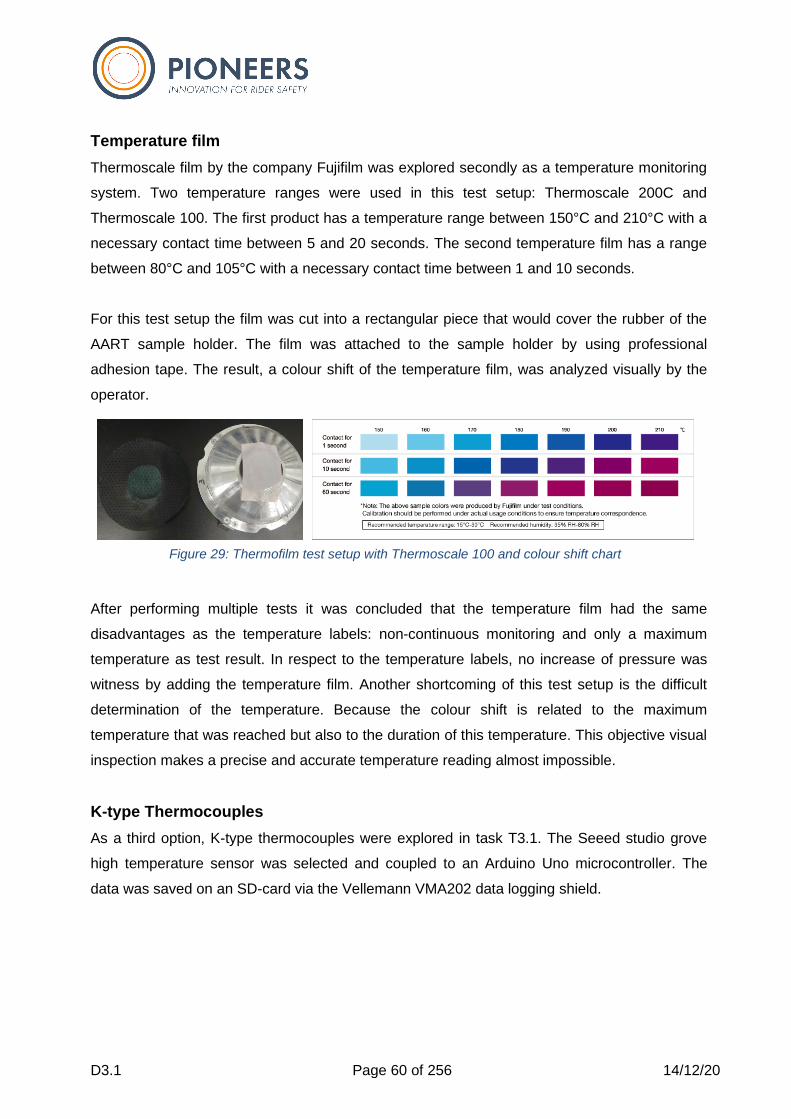
D3.1 Page 60 of 256 14/12/20
Temperature film
Thermoscale film by the company Fujifilm was explored secondly as a temperature monitoring
system. Two temperature ranges were used in this test setup: Thermoscale 200C and
Thermoscale 100. The first product has a temperature range between 150°C and 210°C with a
necessary contact time between 5 and 20 seconds. The second temperature film has a range
between 80°C and 105°C with a necessary contact time between 1 and 10 seconds.
For this test setup the film was cut into a rectangular piece that would cover the rubber of the
AART sample holder. The film was attached to the sample holder by using professional
adhesion tape. The result, a colour shift of the temperature film, was analyzed visually by the
operator.
After performing multiple tests it was concluded that the temperature film had the same
disadvantages as the temperature labels: non-continuous monitoring and only a maximum
temperature as test result. In respect to the temperature labels, no increase of pressure was
witness by adding the temperature film. Another shortcoming of this test setup is the difficult
determination of the temperature. Because the colour shift is related to the maximum
temperature that was reached but also to the duration of this temperature. This objective visual
inspection makes a precise and accurate temperature reading almost impossible.
K-type Thermocouples
As a third option, K-type thermocouples were explored in task T3.1. The Seeed studio grove
high temperature sensor was selected and coupled to an Arduino Uno microcontroller. The
data was saved on an SD-card via the Vellemann VMA202 data logging shield.
Figure 29: Thermofilm test setup with Thermoscale 100 and colour shift chart
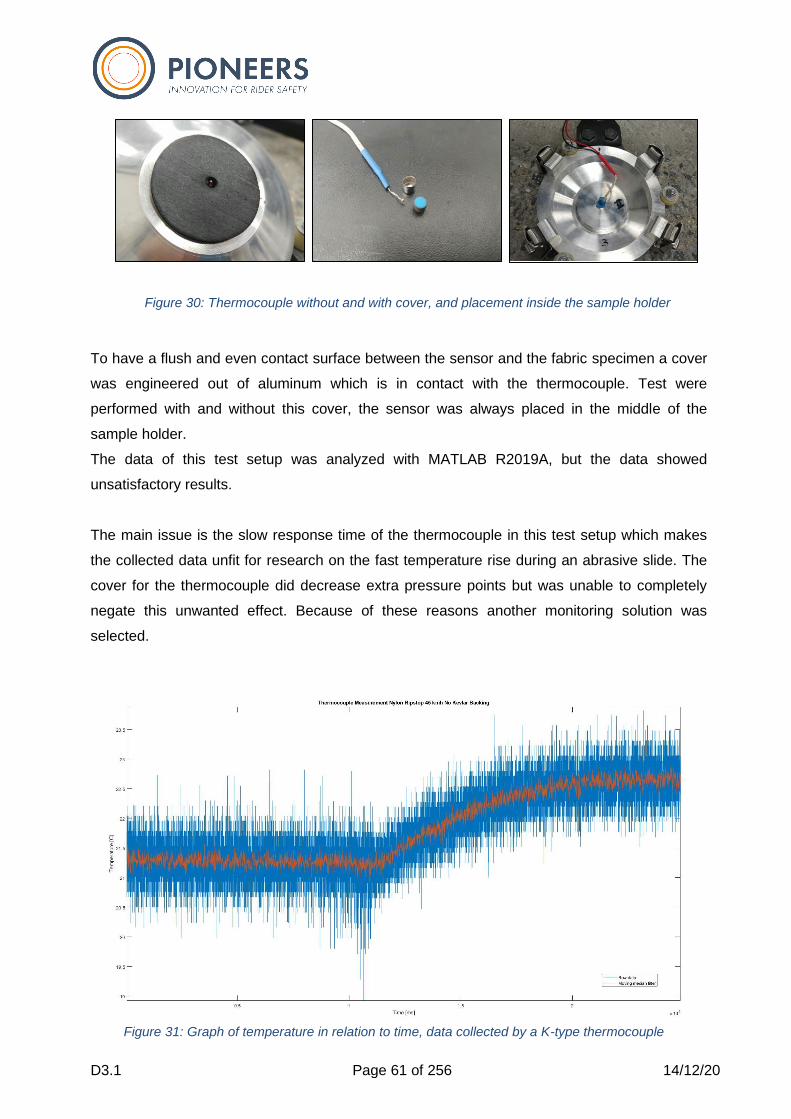
D3.1 Page 61 of 256 14/12/20
To have a flush and even contact surface between the sensor and the fabric specimen a cover
was engineered out of aluminum which is in contact with the thermocouple. Test were
performed with and without this cover, the sensor was always placed in the middle of the
sample holder.
The data of this test setup was analyzed with MATLAB R2019A, but the data showed
unsatisfactory results.
The main issue is the slow response time of the thermocouple in this test setup which makes
the collected data unfit for research on the fast temperature rise during an abrasive slide. The
cover for the thermocouple did decrease extra pressure points but was unable to completely
negate this unwanted effect. Because of these reasons another monitoring solution was
selected.
Figure 30: Thermocouple without and with cover, and placement inside the sample holder
Figure 31: Graph of temperature in relation to time, data collected by a K-type thermocouple
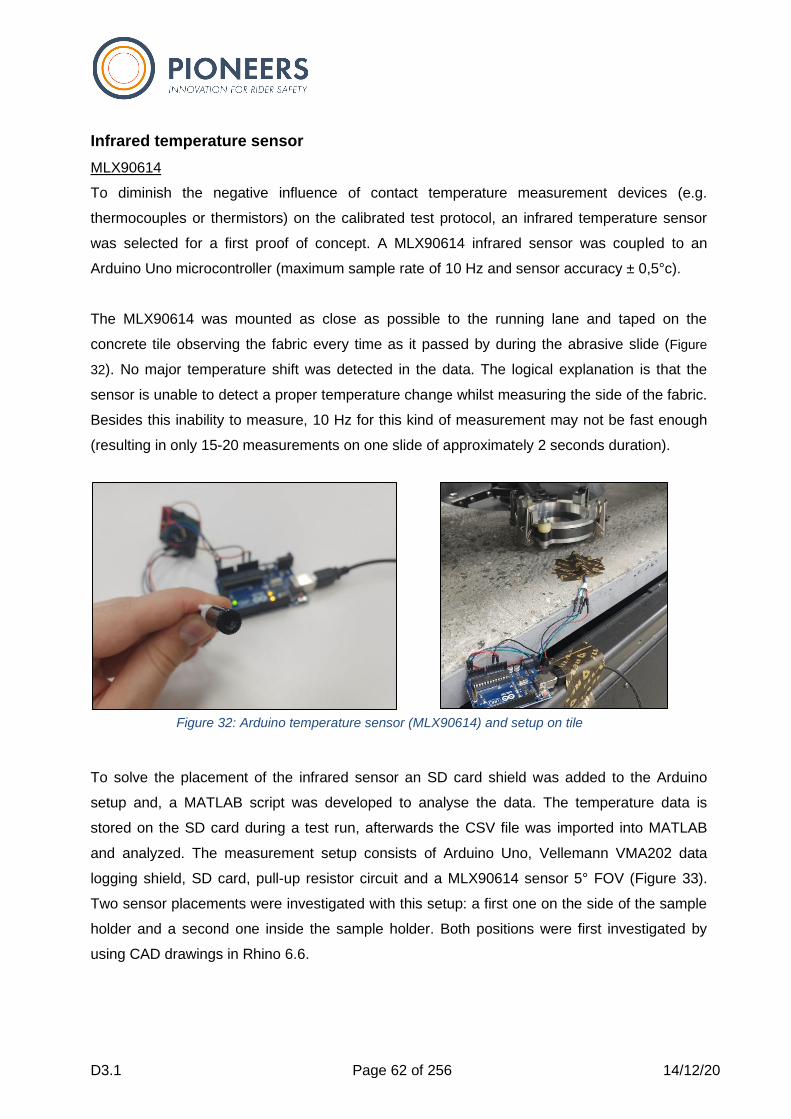
D3.1 Page 62 of 256 14/12/20
Infrared temperature sensor
MLX90614
To diminish the negative influence of contact temperature measurement devices (e.g.
thermocouples or thermistors) on the calibrated test protocol, an infrared temperature sensor
was selected for a first proof of concept. A MLX90614 infrared sensor was coupled to an
Arduino Uno microcontroller (maximum sample rate of 10 Hz and sensor accuracy ± 0,5°c).
The MLX90614 was mounted as close as possible to the running lane and taped on the
concrete tile observing the fabric every time as it passed by during the abrasive slide (Figure
32). No major temperature shift was detected in the data. The logical explanation is that the
sensor is unable to detect a proper temperature change whilst measuring the side of the fabric.
Besides this inability to measure, 10 Hz for this kind of measurement may not be fast enough
(resulting in only 15-20 measurements on one slide of approximately 2 seconds duration).
To solve the placement of the infrared sensor an SD card shield was added to the Arduino
setup and, a MATLAB script was developed to analyse the data. The temperature data is
stored on the SD card during a test run, afterwards the CSV file was imported into MATLAB
and analyzed. The measurement setup consists of Arduino Uno, Vellemann VMA202 data
logging shield, SD card, pull-up resistor circuit and a MLX90614 sensor 5° FOV (Figure 33).
Two sensor placements were investigated with this setup: a first one on the side of the sample
holder and a second one inside the sample holder. Both positions were first investigated by
using CAD drawings in Rhino 6.6.
Figure 32: Arduino temperature sensor (MLX90614) and setup on tile
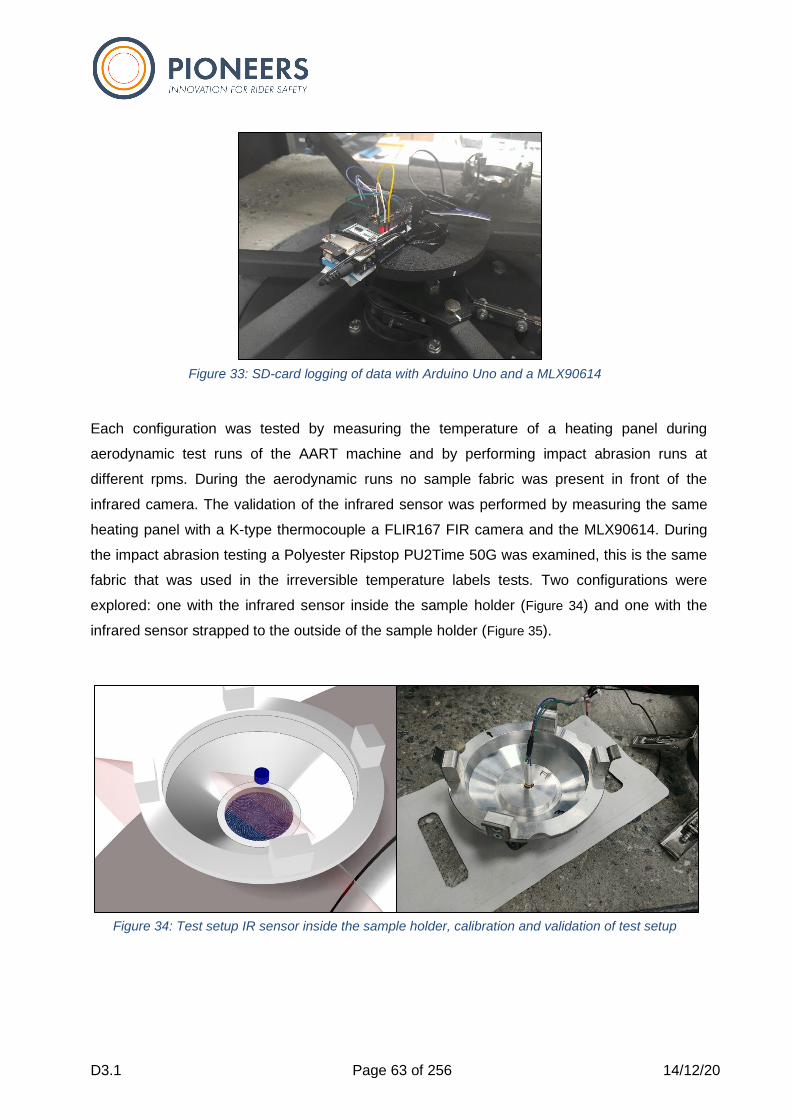
D3.1 Page 63 of 256 14/12/20
Each configuration was tested by measuring the temperature of a heating panel during
aerodynamic test runs of the AART machine and by performing impact abrasion runs at
different rpms. During the aerodynamic runs no sample fabric was present in front of the
infrared camera. The validation of the infrared sensor was performed by measuring the same
heating panel with a K-type thermocouple a FLIR167 FIR camera and the MLX90614. During
the impact abrasion testing a Polyester Ripstop PU2Time 50G was examined, this is the same
fabric that was used in the irreversible temperature labels tests. Two configurations were
explored: one with the infrared sensor inside the sample holder (Figure 34) and one with the
infrared sensor strapped to the outside of the sample holder (Figure 35).
Figure 33: SD-card logging of data with Arduino Uno and a MLX90614
Figure 34: Test setup IR sensor inside the sample holder, calibration and validation of test setup
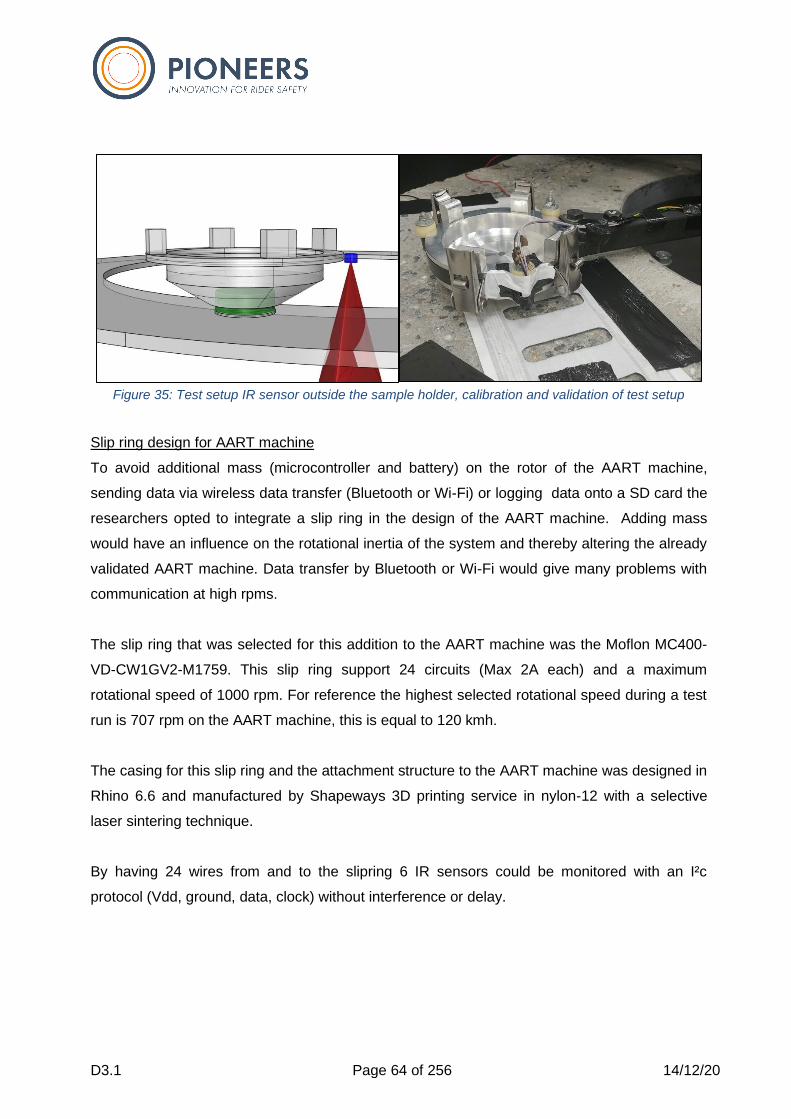
D3.1 Page 64 of 256 14/12/20
Slip ring design for AART machine
To avoid additional mass (microcontroller and battery) on the rotor of the AART machine,
sending data via wireless data transfer (Bluetooth or Wi-Fi) or logging data onto a SD card the
researchers opted to integrate a slip ring in the design of the AART machine. Adding mass
would have an influence on the rotational inertia of the system and thereby altering the already
validated AART machine. Data transfer by Bluetooth or Wi-Fi would give many problems with
communication at high rpms.
The slip ring that was selected for this addition to the AART machine was the Moflon MC400-
VD-CW1GV2-M1759. This slip ring support 24 circuits (Max 2A each) and a maximum
rotational speed of 1000 rpm. For reference the highest selected rotational speed during a test
run is 707 rpm on the AART machine, this is equal to 120 kmh.
The casing for this slip ring and the attachment structure to the AART machine was designed in
Rhino 6.6 and manufactured by Shapeways 3D printing service in nylon-12 with a selective
laser sintering technique.
By having 24 wires from and to the slipring 6 IR sensors could be monitored with an I²c
protocol (Vdd, ground, data, clock) without interference or delay.
Figure 35: Test setup IR sensor outside the sample holder, calibration and validation of test setup
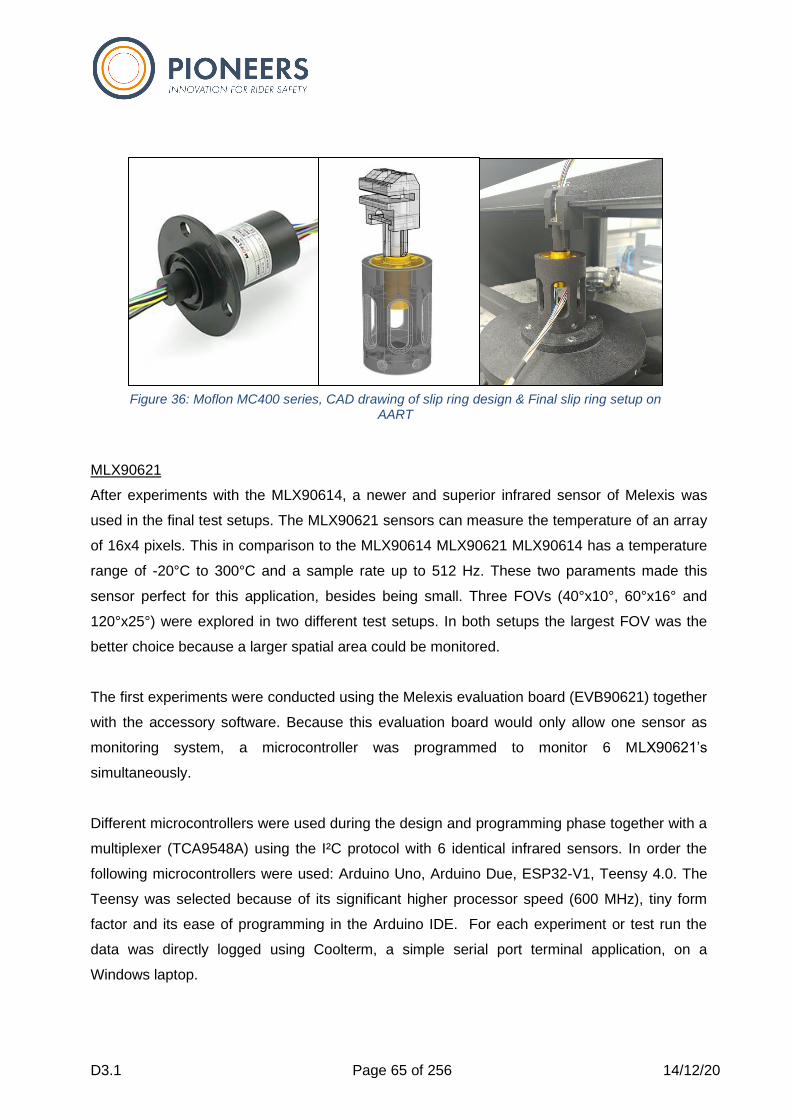
D3.1 Page 65 of 256 14/12/20
MLX90621
After experiments with the MLX90614, a newer and superior infrared sensor of Melexis was
used in the final test setups. The MLX90621 sensors can measure the temperature of an array
of 16x4 pixels. This in comparison to the MLX90614 MLX90621 MLX90614 has a temperature
range of -20°C to 300°C and a sample rate up to 512 Hz. These two paraments made this
sensor perfect for this application, besides being small. Three FOVs (40°x10°, 60°x16° and
120°x25°) were explored in two different test setups. In both setups the largest FOV was the
better choice because a larger spatial area could be monitored.
The first experiments were conducted using the Melexis evaluation board (EVB90621) together
with the accessory software. Because this evaluation board would only allow one sensor as
monitoring system, a microcontroller was programmed to monitor 6 MLX90621’s
simultaneously.
Different microcontrollers were used during the design and programming phase together with a
multiplexer (TCA9548A) using the I²C protocol with 6 identical infrared sensors. In order the
following microcontrollers were used: Arduino Uno, Arduino Due, ESP32-V1, Teensy 4.0. The
Teensy was selected because of its significant higher processor speed (600 MHz), tiny form
factor and its ease of programming in the Arduino IDE. For each experiment or test run the
data was directly logged using Coolterm, a simple serial port terminal application, on a
Windows laptop.
Figure 36: Moflon MC400 series, CAD drawing of slip ring design & Final slip ring setup on AART
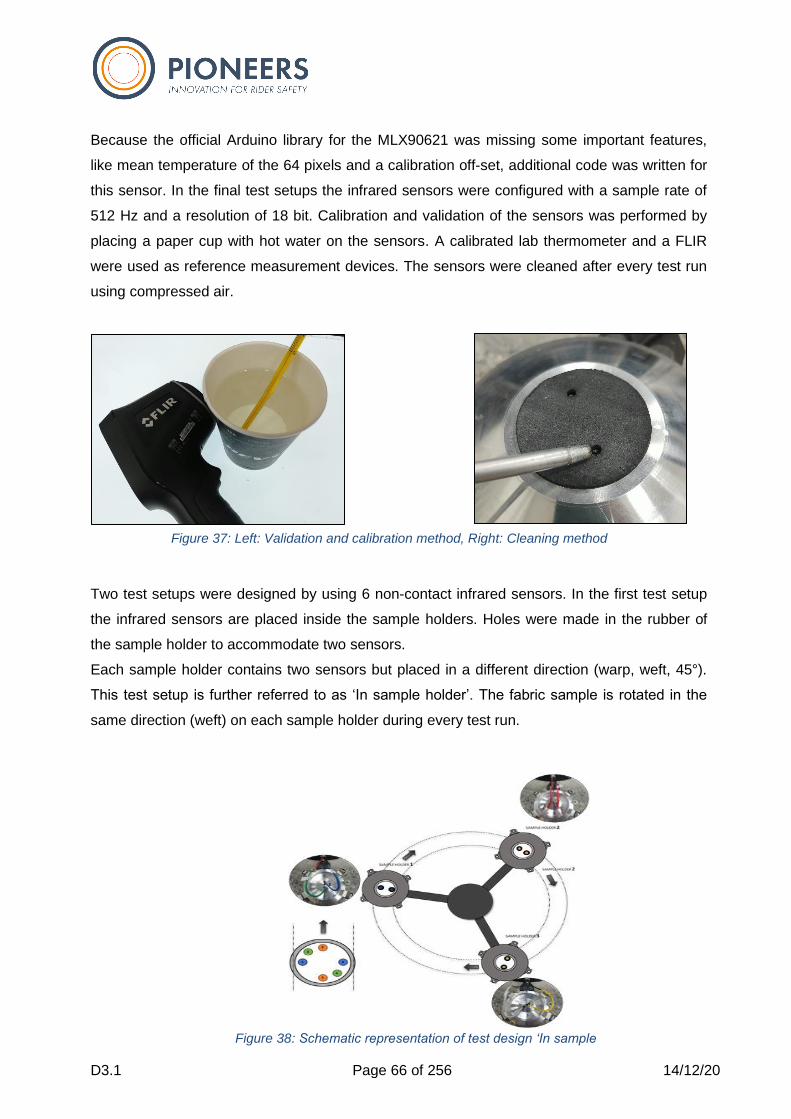
D3.1 Page 66 of 256 14/12/20
Because the official Arduino library for the MLX90621 was missing some important features,
like mean temperature of the 64 pixels and a calibration off-set, additional code was written for
this sensor. In the final test setups the infrared sensors were configured with a sample rate of
512 Hz and a resolution of 18 bit. Calibration and validation of the sensors was performed by
placing a paper cup with hot water on the sensors. A calibrated lab thermometer and a FLIR
were used as reference measurement devices. The sensors were cleaned after every test run
using compressed air.
Two test setups were designed by using 6 non-contact infrared sensors. In the first test setup
the infrared sensors are placed inside the sample holders. Holes were made in the rubber of
the sample holder to accommodate two sensors.
Each sample holder contains two sensors but placed in a different direction (warp, weft, 45°).
This test setup is further referred to as ‘In sample holder’. The fabric sample is rotated in the
same direction (weft) on each sample holder during every test run.
Figure 37: Left: Validation and calibration method, Right: Cleaning method
Figure 38: Schematic representation of test design ‘In sample holder’
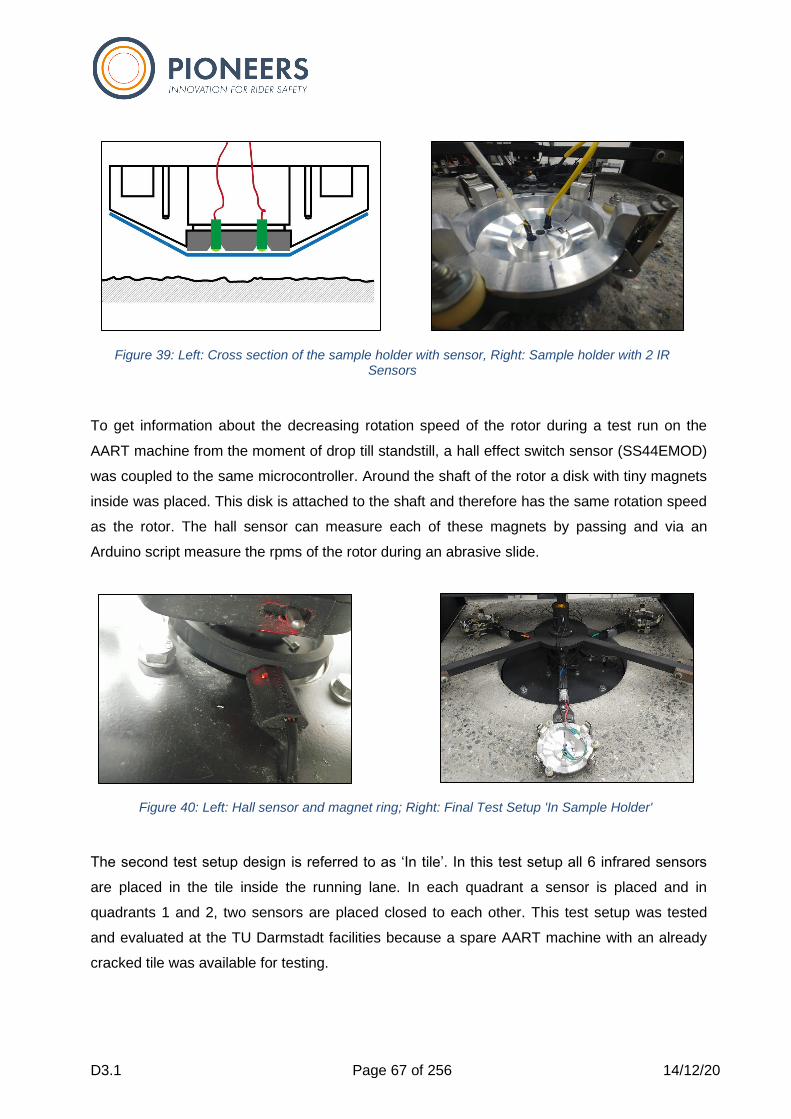
D3.1 Page 67 of 256 14/12/20
To get information about the decreasing rotation speed of the rotor during a test run on the
AART machine from the moment of drop till standstill, a hall effect switch sensor (SS44EMOD)
was coupled to the same microcontroller. Around the shaft of the rotor a disk with tiny magnets
inside was placed. This disk is attached to the shaft and therefore has the same rotation speed
as the rotor. The hall sensor can measure each of these magnets by passing and via an
Arduino script measure the rpms of the rotor during an abrasive slide.
The second test setup design is referred to as ‘In tile’. In this test setup all 6 infrared sensors
are placed in the tile inside the running lane. In each quadrant a sensor is placed and in
quadrants 1 and 2, two sensors are placed closed to each other. This test setup was tested
and evaluated at the TU Darmstadt facilities because a spare AART machine with an already
cracked tile was available for testing.
Figure 39: Left: Cross section of the sample holder with sensor, Right: Sample holder with 2 IR Sensors
Figure 40: Left: Hall sensor and magnet ring; Right: Final Test Setup 'In Sample Holder'
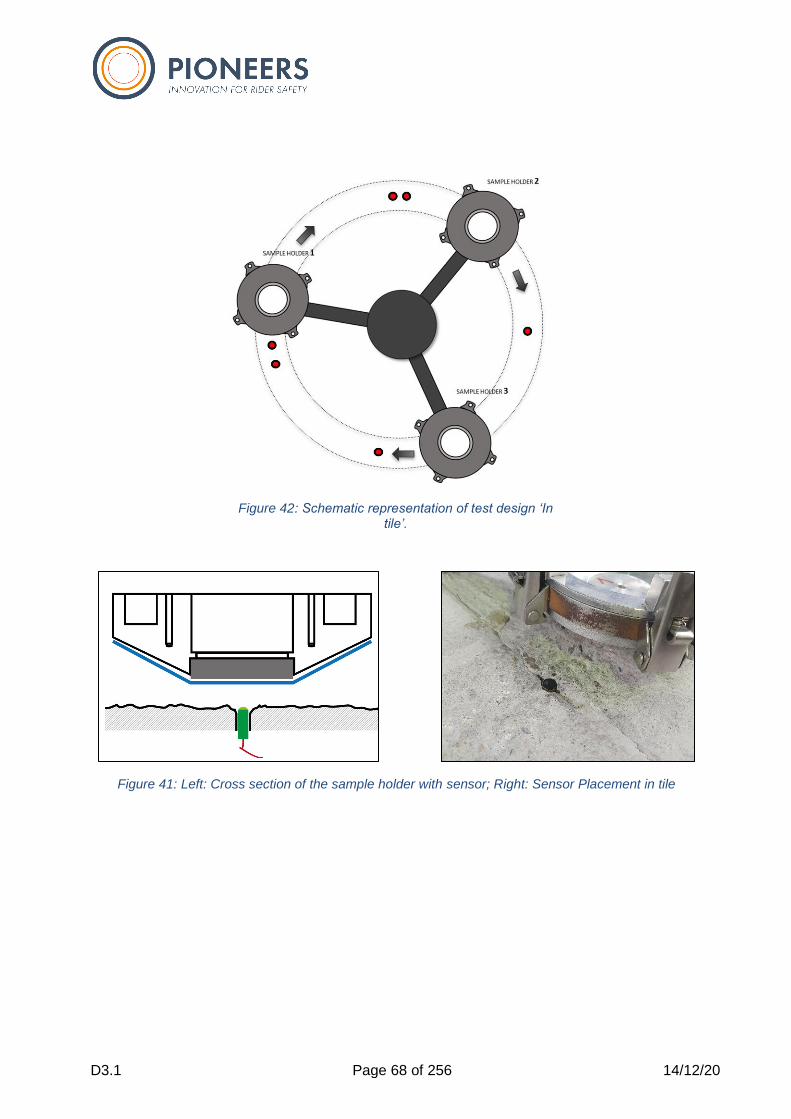
D3.1 Page 68 of 256 14/12/20
Figure 42: Schematic representation of test design ‘In tile’.
Figure 41: Left: Cross section of the sample holder with sensor; Right: Sensor Placement in tile
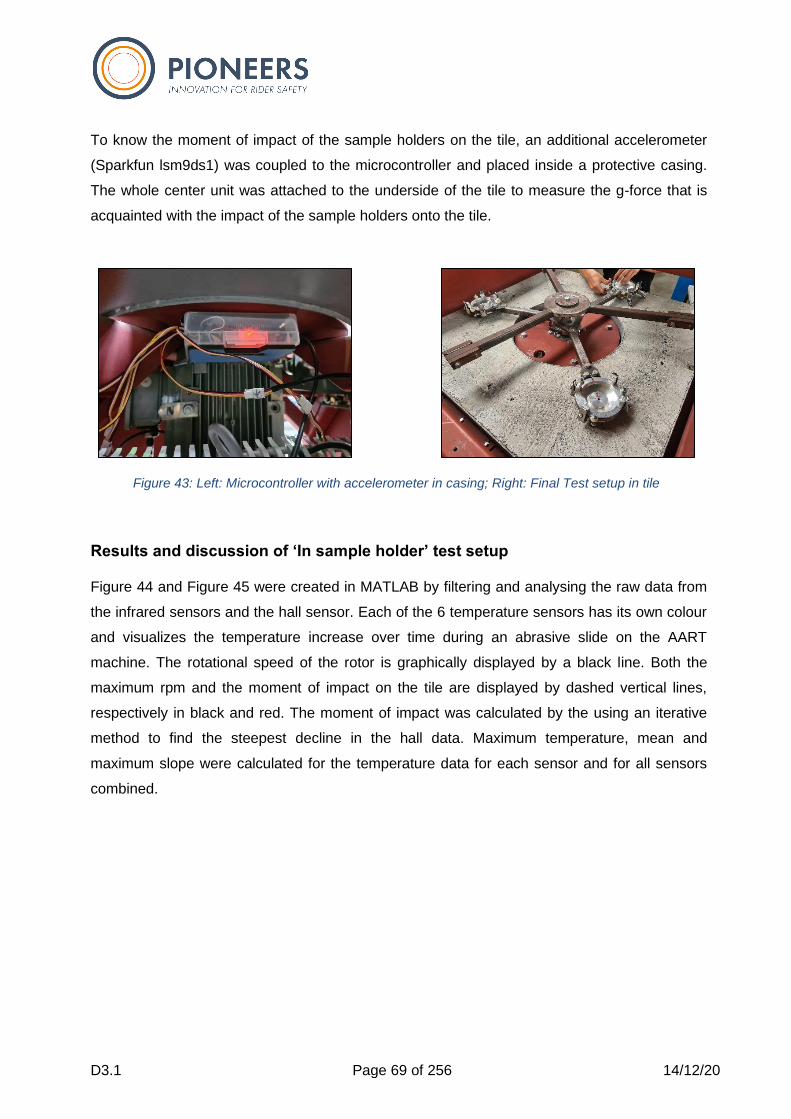
D3.1 Page 69 of 256 14/12/20
To know the moment of impact of the sample holders on the tile, an additional accelerometer
(Sparkfun lsm9ds1) was coupled to the microcontroller and placed inside a protective casing.
The whole center unit was attached to the underside of the tile to measure the g-force that is
acquainted with the impact of the sample holders onto the tile.
Results and discussion of ‘In sample holder’ test setup Figure 44 and Figure 45 were created in MATLAB by filtering and analysing the raw data from
the infrared sensors and the hall sensor. Each of the 6 temperature sensors has its own colour
and visualizes the temperature increase over time during an abrasive slide on the AART
machine. The rotational speed of the rotor is graphically displayed by a black line. Both the
maximum rpm and the moment of impact on the tile are displayed by dashed vertical lines,
respectively in black and red. The moment of impact was calculated by the using an iterative
method to find the steepest decline in the hall data. Maximum temperature, mean and
maximum slope were calculated for the temperature data for each sensor and for all sensors
combined.
Figure 43: Left: Microcontroller with accelerometer in casing; Right: Final Test setup in tile
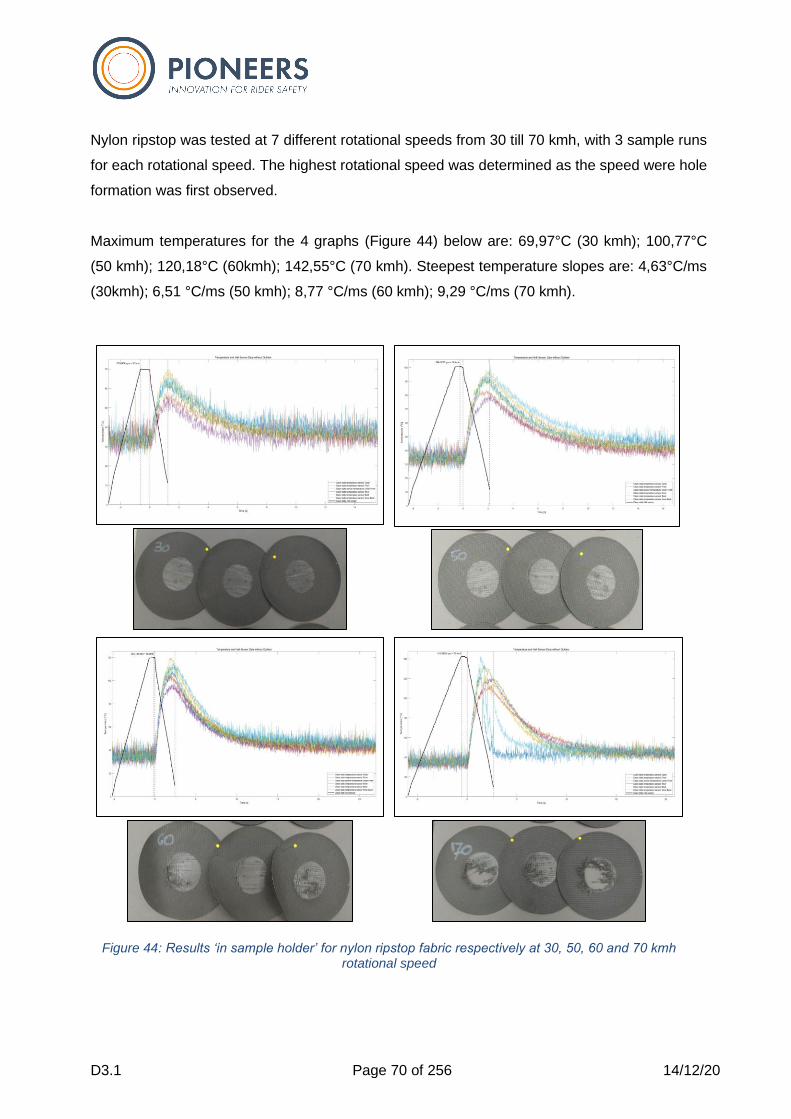
D3.1 Page 70 of 256 14/12/20
Nylon ripstop was tested at 7 different rotational speeds from 30 till 70 kmh, with 3 sample runs
for each rotational speed. The highest rotational speed was determined as the speed were hole
formation was first observed.
Maximum temperatures for the 4 graphs (Figure 44) below are: 69,97°C (30 kmh); 100,77°C
(50 kmh); 120,18°C (60kmh); 142,55°C (70 kmh). Steepest temperature slopes are: 4,63°C/ms
(30kmh); 6,51 °C/ms (50 kmh); 8,77 °C/ms (60 kmh); 9,29 °C/ms (70 kmh).
Figure 44: Results ‘in sample holder’ for nylon ripstop fabric respectively at 30, 50, 60 and 70 kmh rotational speed
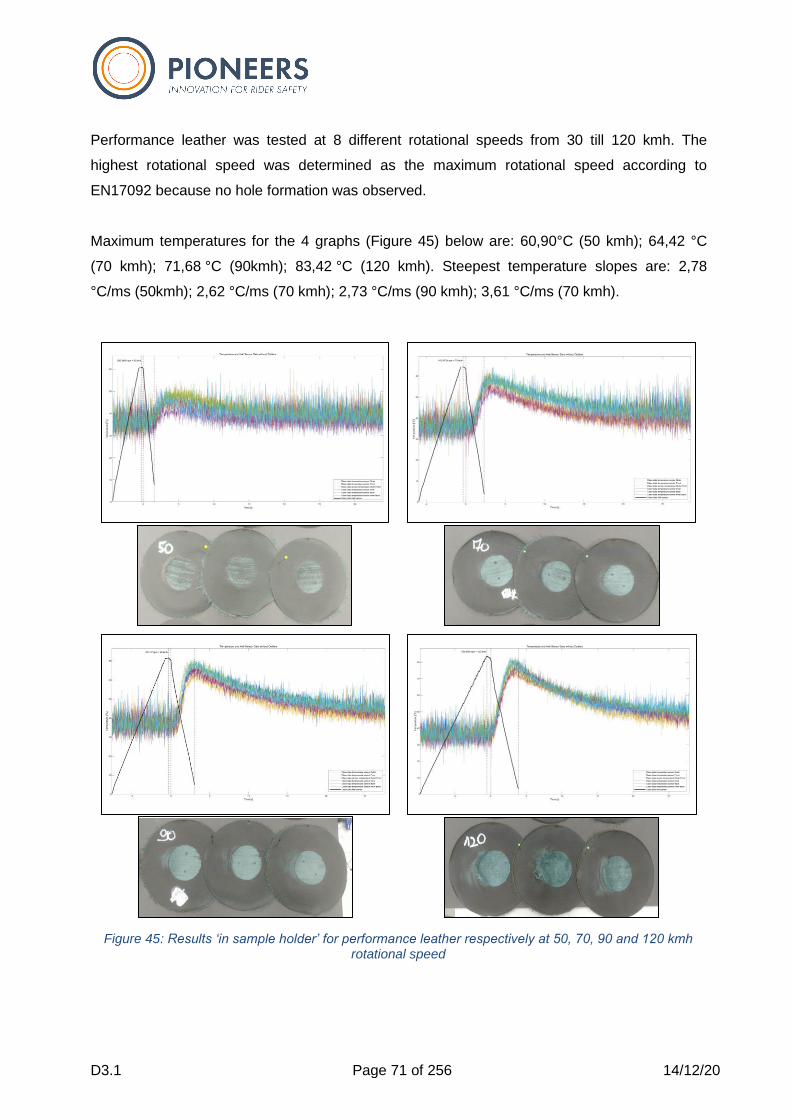
D3.1 Page 71 of 256 14/12/20
Performance leather was tested at 8 different rotational speeds from 30 till 120 kmh. The
highest rotational speed was determined as the maximum rotational speed according to
EN17092 because no hole formation was observed.
Maximum temperatures for the 4 graphs (Figure 45) below are: 60,90°C (50 kmh); 64,42 °C
(70 kmh); 71,68 °C (90kmh); 83,42 °C (120 kmh). Steepest temperature slopes are: 2,78
°C/ms (50kmh); 2,62 °C/ms (70 kmh); 2,73 °C/ms (90 kmh); 3,61 °C/ms (70 kmh).
Figure 45: Results ‘in sample holder’ for performance leather respectively at 50, 70, 90 and 120 kmh rotational speed
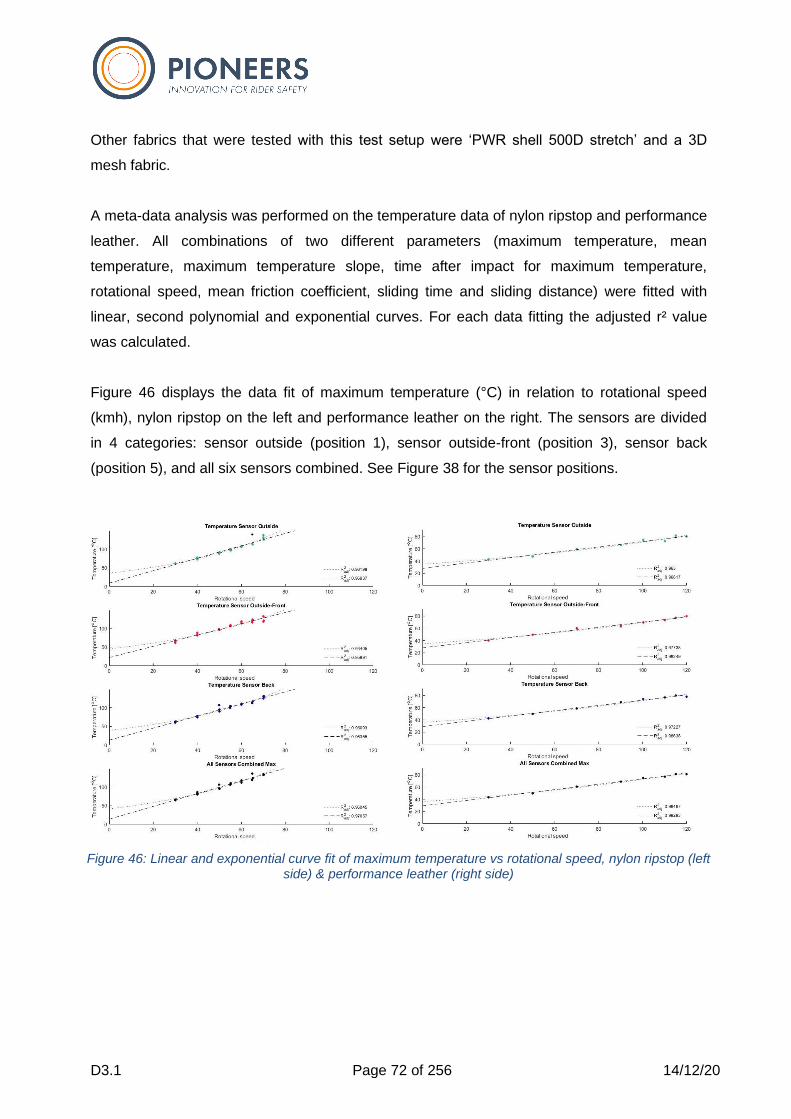
D3.1 Page 72 of 256 14/12/20
Other fabrics that were tested with this test setup were ‘PWR shell 500D stretch’ and a 3D
mesh fabric.
A meta-data analysis was performed on the temperature data of nylon ripstop and performance
leather. All combinations of two different parameters (maximum temperature, mean
temperature, maximum temperature slope, time after impact for maximum temperature,
rotational speed, mean friction coefficient, sliding time and sliding distance) were fitted with
linear, second polynomial and exponential curves. For each data fitting the adjusted r² value
was calculated.
Figure 46 displays the data fit of maximum temperature (°C) in relation to rotational speed
(kmh), nylon ripstop on the left and performance leather on the right. The sensors are divided
in 4 categories: sensor outside (position 1), sensor outside-front (position 3), sensor back
(position 5), and all six sensors combined. See Figure 38 for the sensor positions.
Figure 46: Linear and exponential curve fit of maximum temperature vs rotational speed, nylon ripstop (left side) & performance leather (right side)
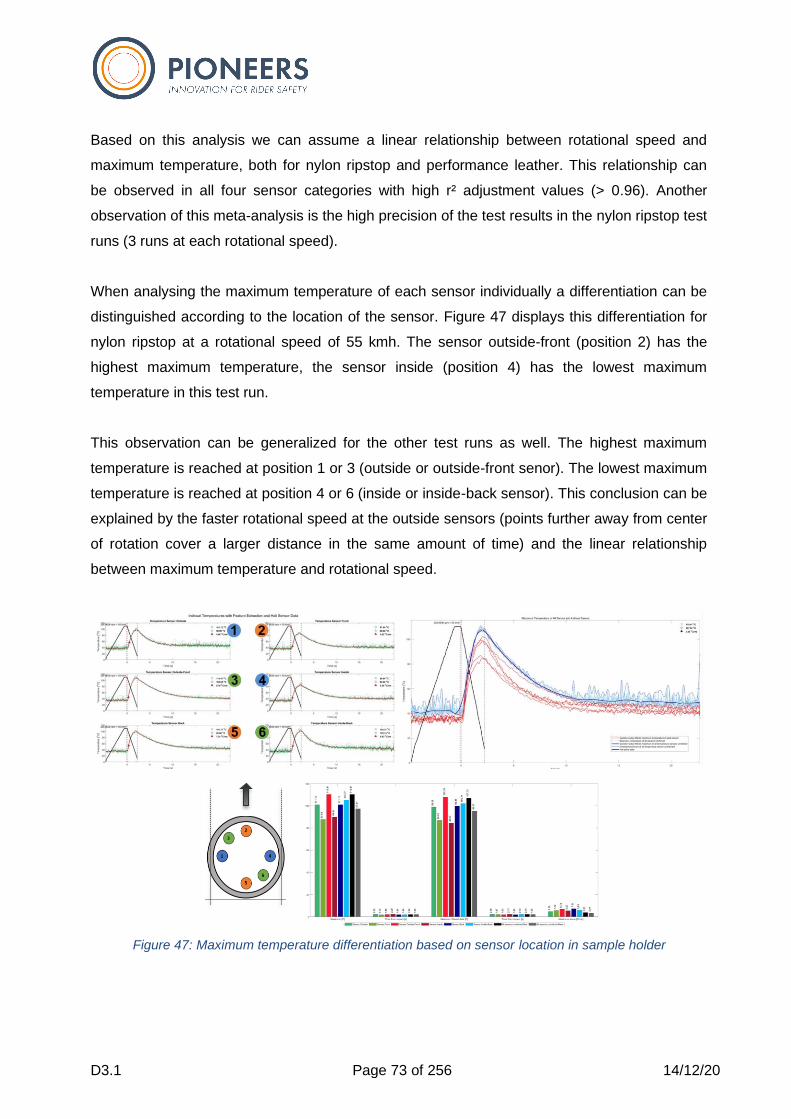
D3.1 Page 73 of 256 14/12/20
Based on this analysis we can assume a linear relationship between rotational speed and
maximum temperature, both for nylon ripstop and performance leather. This relationship can
be observed in all four sensor categories with high r² adjustment values (> 0.96). Another
observation of this meta-analysis is the high precision of the test results in the nylon ripstop test
runs (3 runs at each rotational speed).
When analysing the maximum temperature of each sensor individually a differentiation can be
distinguished according to the location of the sensor. Figure 47 displays this differentiation for
nylon ripstop at a rotational speed of 55 kmh. The sensor outside-front (position 2) has the
highest maximum temperature, the sensor inside (position 4) has the lowest maximum
temperature in this test run.
This observation can be generalized for the other test runs as well. The highest maximum
temperature is reached at position 1 or 3 (outside or outside-front senor). The lowest maximum
temperature is reached at position 4 or 6 (inside or inside-back sensor). This conclusion can be
explained by the faster rotational speed at the outside sensors (points further away from center
of rotation cover a larger distance in the same amount of time) and the linear relationship
between maximum temperature and rotational speed.
Figure 47: Maximum temperature differentiation based on sensor location in sample holder
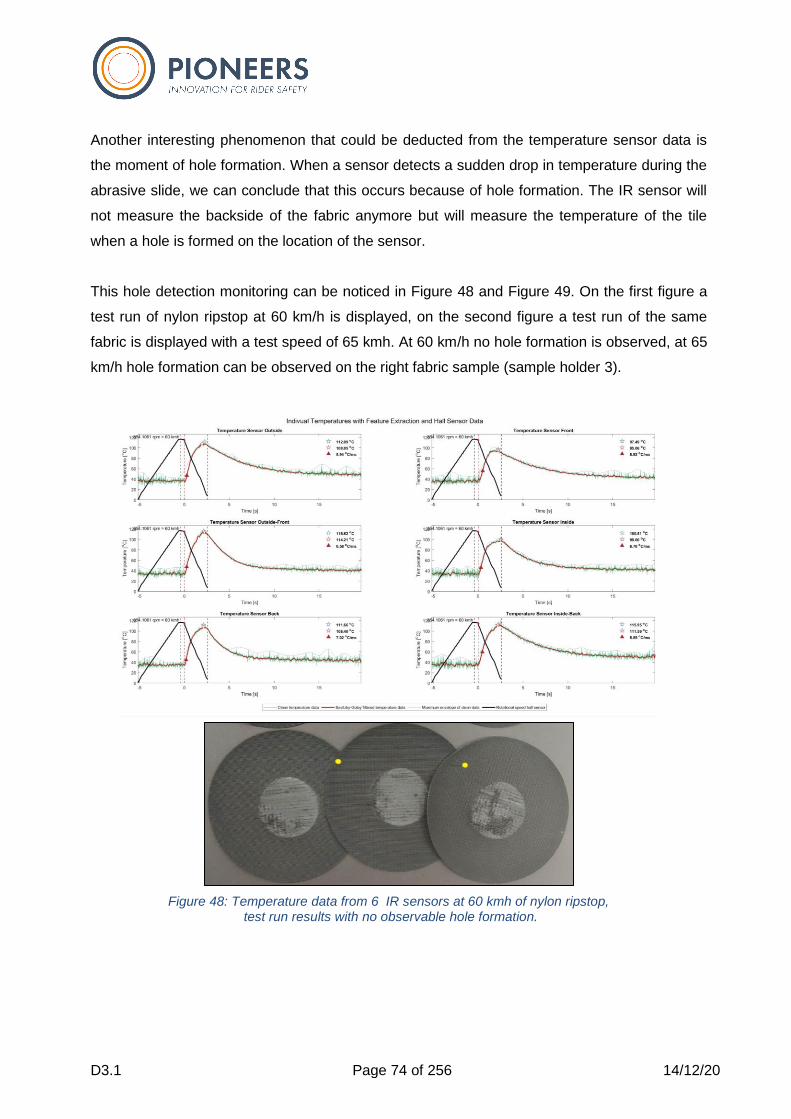
D3.1 Page 74 of 256 14/12/20
Another interesting phenomenon that could be deducted from the temperature sensor data is
the moment of hole formation. When a sensor detects a sudden drop in temperature during the
abrasive slide, we can conclude that this occurs because of hole formation. The IR sensor will
not measure the backside of the fabric anymore but will measure the temperature of the tile
when a hole is formed on the location of the sensor.
This hole detection monitoring can be noticed in Figure 48 and Figure 49. On the first figure a
test run of nylon ripstop at 60 km/h is displayed, on the second figure a test run of the same
fabric is displayed with a test speed of 65 kmh. At 60 km/h no hole formation is observed, at 65
km/h hole formation can be observed on the right fabric sample (sample holder 3).
Figure 48: Temperature data from 6 IR sensors at 60 kmh of nylon ripstop, test run results with no observable hole formation.
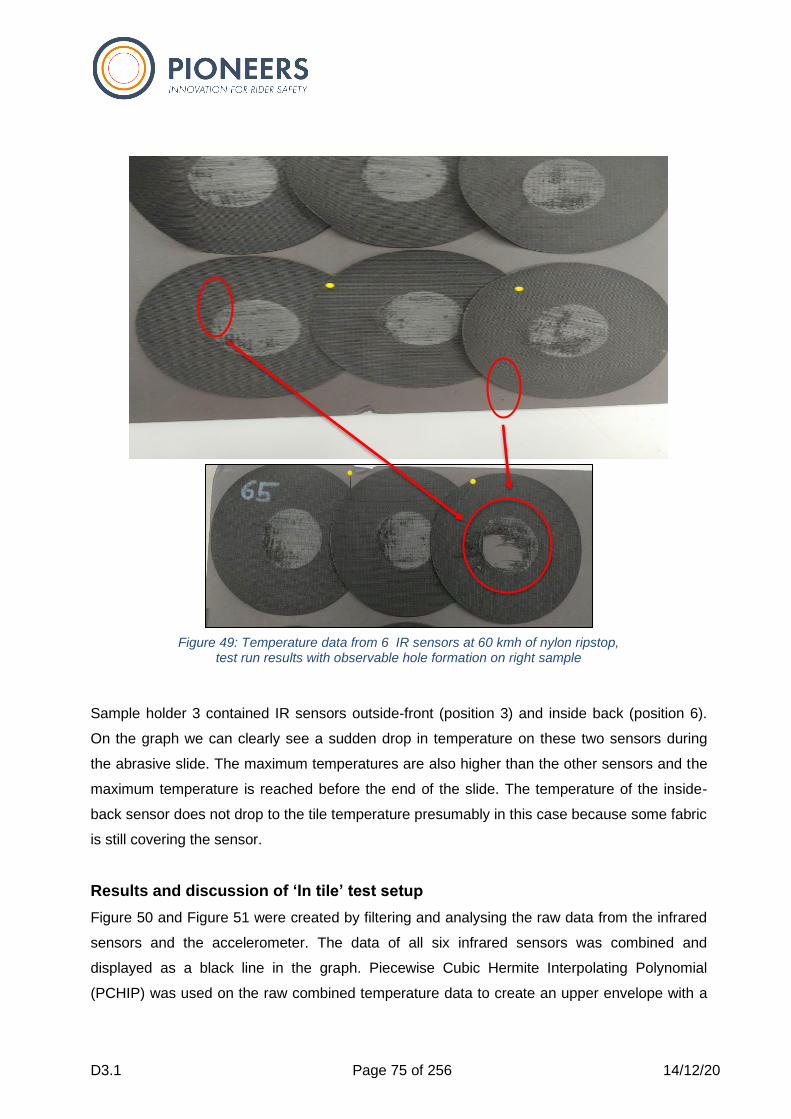
D3.1 Page 75 of 256 14/12/20
Sample holder 3 contained IR sensors outside-front (position 3) and inside back (position 6).
On the graph we can clearly see a sudden drop in temperature on these two sensors during
the abrasive slide. The maximum temperatures are also higher than the other sensors and the
maximum temperature is reached before the end of the slide. The temperature of the inside-
back sensor does not drop to the tile temperature presumably in this case because some fabric
is still covering the sensor.
Results and discussion of ‘In tile’ test setup
Figure 50 and Figure 51 were created by filtering and analysing the raw data from the infrared
sensors and the accelerometer. The data of all six infrared sensors was combined and
displayed as a black line in the graph. Piecewise Cubic Hermite Interpolating Polynomial
(PCHIP) was used on the raw combined temperature data to create an upper envelope with a
Figure 49: Temperature data from 6 IR sensors at 60 kmh of nylon ripstop, test run results with observable hole formation on right sample
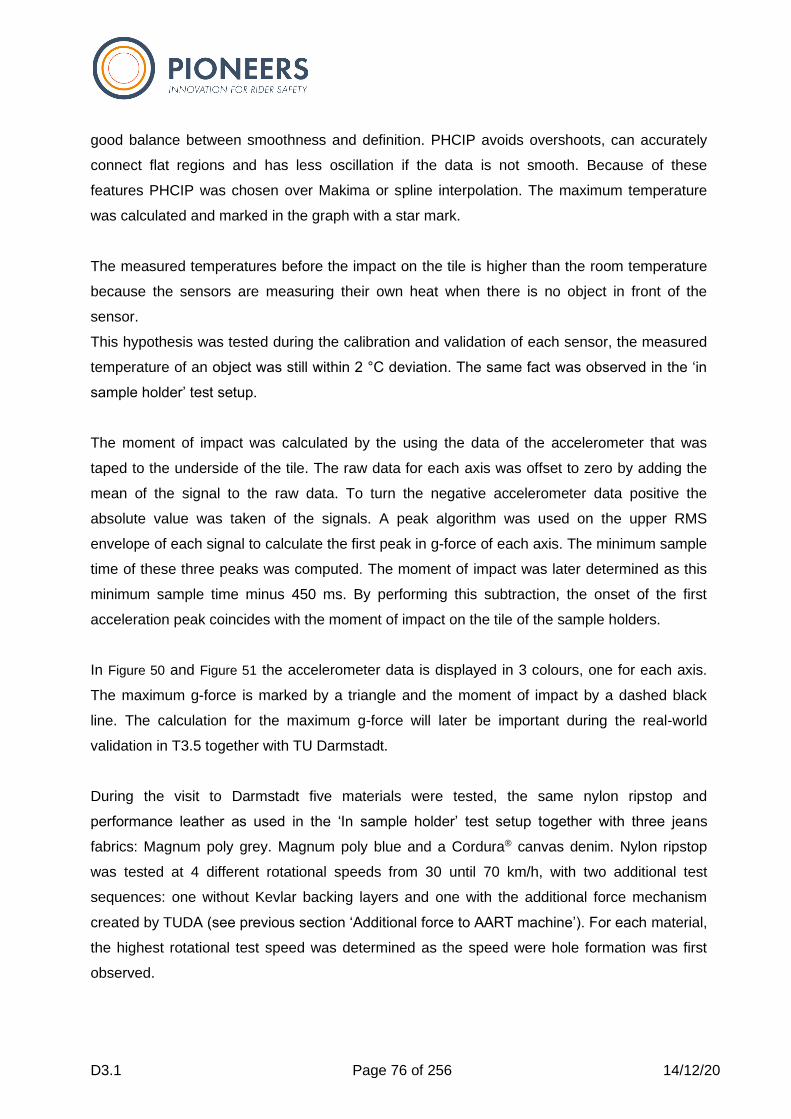
D3.1 Page 76 of 256 14/12/20
good balance between smoothness and definition. PHCIP avoids overshoots, can accurately
connect flat regions and has less oscillation if the data is not smooth. Because of these
features PHCIP was chosen over Makima or spline interpolation. The maximum temperature
was calculated and marked in the graph with a star mark.
The measured temperatures before the impact on the tile is higher than the room temperature
because the sensors are measuring their own heat when there is no object in front of the
sensor.
This hypothesis was tested during the calibration and validation of each sensor, the measured
temperature of an object was still within 2 °C deviation. The same fact was observed in the ‘in
sample holder’ test setup.
The moment of impact was calculated by the using the data of the accelerometer that was
taped to the underside of the tile. The raw data for each axis was offset to zero by adding the
mean of the signal to the raw data. To turn the negative accelerometer data positive the
absolute value was taken of the signals. A peak algorithm was used on the upper RMS
envelope of each signal to calculate the first peak in g-force of each axis. The minimum sample
time of these three peaks was computed. The moment of impact was later determined as this
minimum sample time minus 450 ms. By performing this subtraction, the onset of the first
acceleration peak coincides with the moment of impact on the tile of the sample holders.
In Figure 50 and Figure 51 the accelerometer data is displayed in 3 colours, one for each axis.
The maximum g-force is marked by a triangle and the moment of impact by a dashed black
line. The calculation for the maximum g-force will later be important during the real-world
validation in T3.5 together with TU Darmstadt.
During the visit to Darmstadt five materials were tested, the same nylon ripstop and
performance leather as used in the ‘In sample holder’ test setup together with three jeans
fabrics: Magnum poly grey. Magnum poly blue and a Cordura® canvas denim. Nylon ripstop
was tested at 4 different rotational speeds from 30 until 70 km/h, with two additional test
sequences: one without Kevlar backing layers and one with the additional force mechanism
created by TUDA (see previous section ‘Additional force to AART machine’). For each material,
the highest rotational test speed was determined as the speed were hole formation was first
observed.
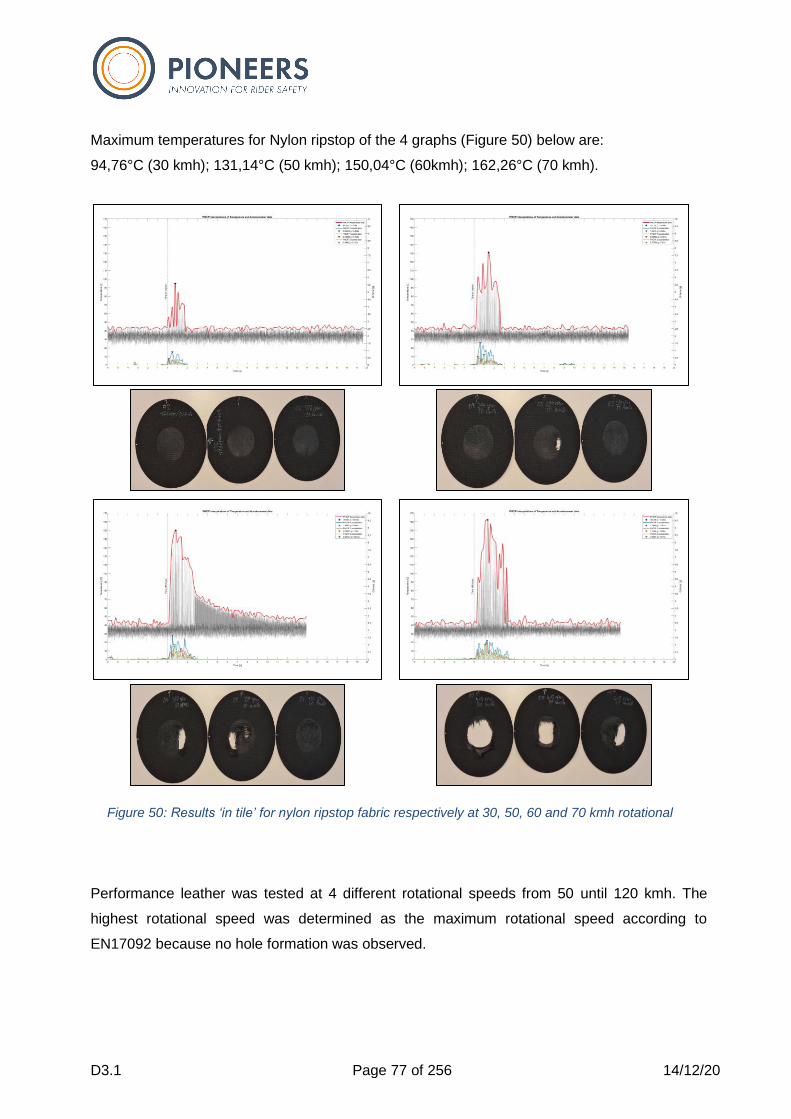
D3.1 Page 77 of 256 14/12/20
Maximum temperatures for Nylon ripstop of the 4 graphs (Figure 50) below are:
94,76°C (30 kmh); 131,14°C (50 kmh); 150,04°C (60kmh); 162,26°C (70 kmh).
Performance leather was tested at 4 different rotational speeds from 50 until 120 kmh. The
highest rotational speed was determined as the maximum rotational speed according to
EN17092 because no hole formation was observed.
Figure 50: Results ‘in tile’ for nylon ripstop fabric respectively at 30, 50, 60 and 70 kmh rotational
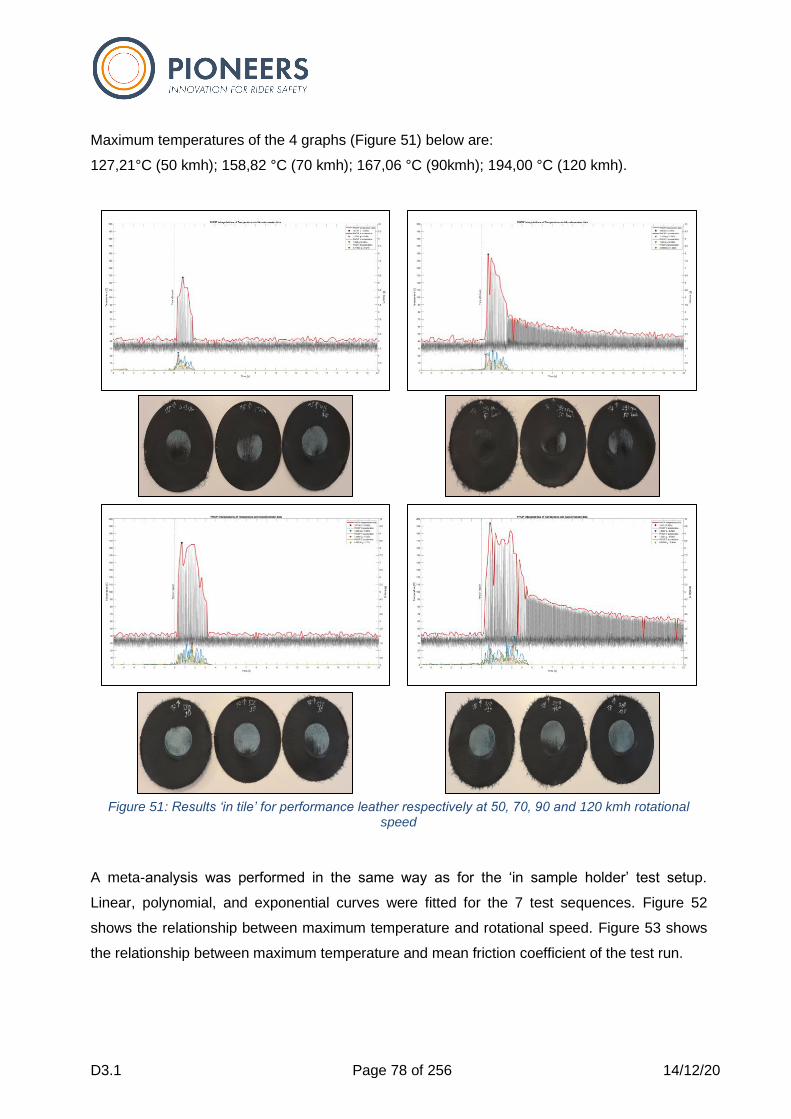
D3.1 Page 78 of 256 14/12/20
Maximum temperatures of the 4 graphs (Figure 51) below are:
127,21°C (50 kmh); 158,82 °C (70 kmh); 167,06 °C (90kmh); 194,00 °C (120 kmh).
A meta-analysis was performed in the same way as for the ‘in sample holder’ test setup.
Linear, polynomial, and exponential curves were fitted for the 7 test sequences. Figure 52
shows the relationship between maximum temperature and rotational speed. Figure 53 shows
the relationship between maximum temperature and mean friction coefficient of the test run.
Figure 51: Results ‘in tile’ for performance leather respectively at 50, 70, 90 and 120 kmh rotational speed
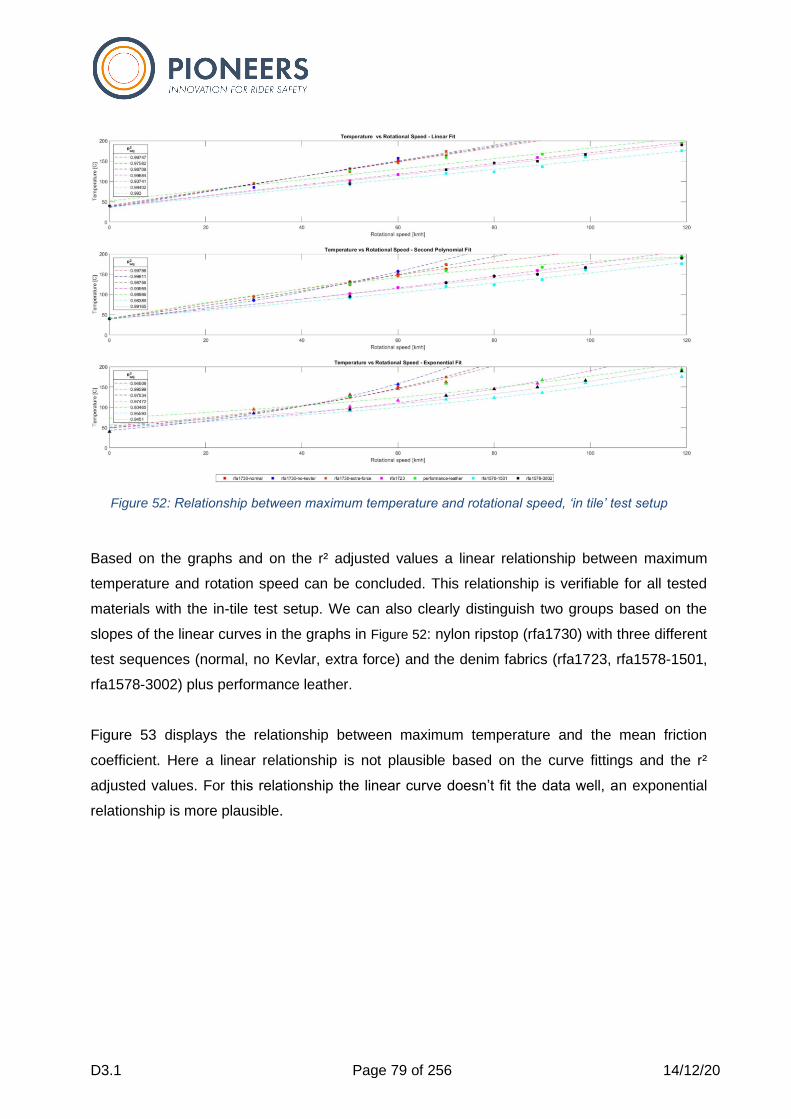
D3.1 Page 79 of 256 14/12/20
Based on the graphs and on the r² adjusted values a linear relationship between maximum
temperature and rotation speed can be concluded. This relationship is verifiable for all tested
materials with the in-tile test setup. We can also clearly distinguish two groups based on the
slopes of the linear curves in the graphs in Figure 52: nylon ripstop (rfa1730) with three different
test sequences (normal, no Kevlar, extra force) and the denim fabrics (rfa1723, rfa1578-1501,
rfa1578-3002) plus performance leather.
Figure 53 displays the relationship between maximum temperature and the mean friction
coefficient. Here a linear relationship is not plausible based on the curve fittings and the r²
adjusted values. For this relationship the linear curve doesn’t fit the data well, an exponential
relationship is more plausible.
Figure 52: Relationship between maximum temperature and rotational speed, ‘in tile’ test setup
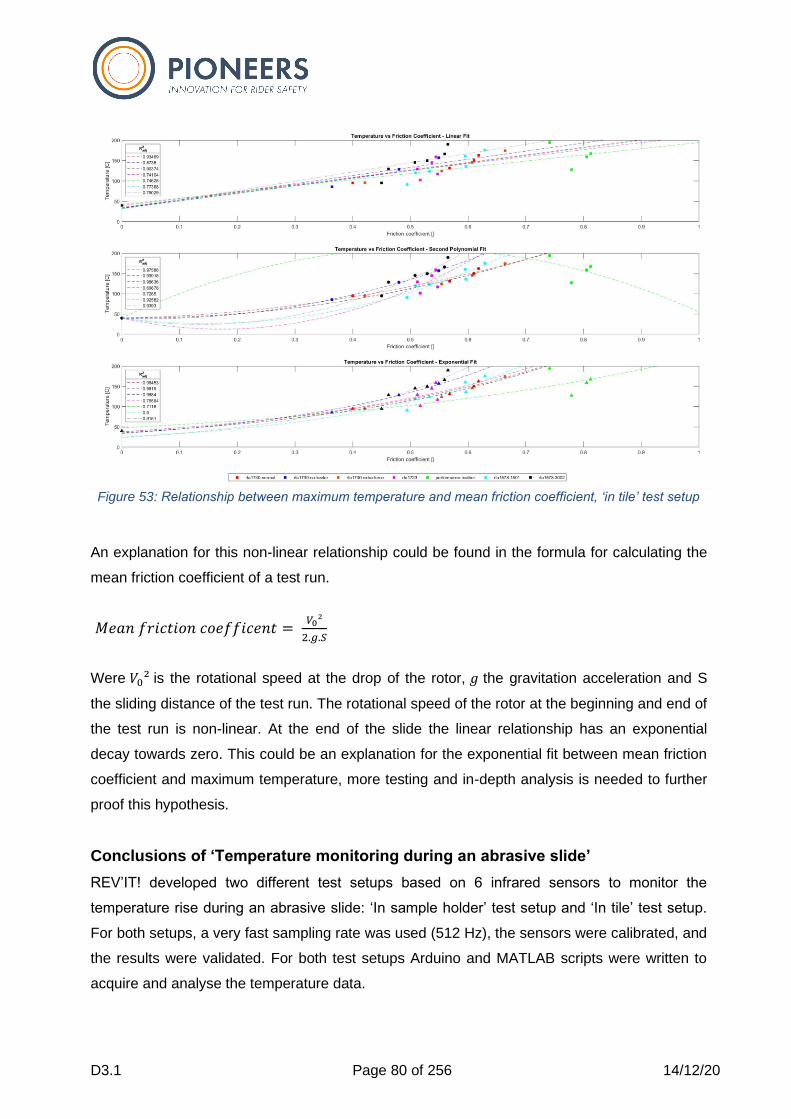
D3.1 Page 80 of 256 14/12/20
An explanation for this non-linear relationship could be found in the formula for calculating the
mean friction coefficient of a test run.
𝑀𝑒𝑎𝑛 𝑓𝑟𝑖𝑐𝑡𝑖𝑜𝑛 𝑐𝑜𝑒𝑓𝑓𝑖𝑐𝑒𝑛𝑡 = 𝑉0²
2.𝑔.𝑆
Were 𝑉0² is the rotational speed at the drop of the rotor, 𝑔 the gravitation acceleration and S
the sliding distance of the test run. The rotational speed of the rotor at the beginning and end of
the test run is non-linear. At the end of the slide the linear relationship has an exponential
decay towards zero. This could be an explanation for the exponential fit between mean friction
coefficient and maximum temperature, more testing and in-depth analysis is needed to further
proof this hypothesis.
Conclusions of ‘Temperature monitoring during an abrasive slide’
REV’IT! developed two different test setups based on 6 infrared sensors to monitor the
temperature rise during an abrasive slide: ‘In sample holder’ test setup and ‘In tile’ test setup.
For both setups, a very fast sampling rate was used (512 Hz), the sensors were calibrated, and
the results were validated. For both test setups Arduino and MATLAB scripts were written to
acquire and analyse the temperature data.
Figure 53: Relationship between maximum temperature and mean friction coefficient, ‘in tile’ test setup
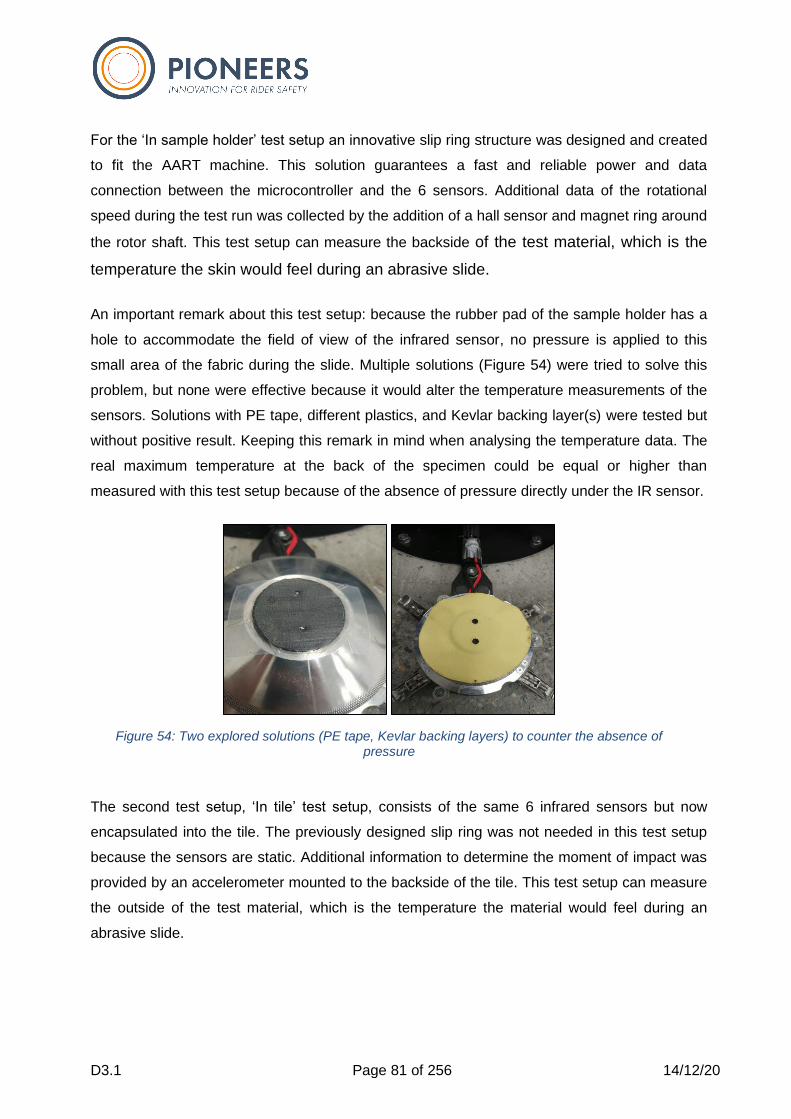
D3.1 Page 81 of 256 14/12/20
For the ‘In sample holder’ test setup an innovative slip ring structure was designed and created
to fit the AART machine. This solution guarantees a fast and reliable power and data
connection between the microcontroller and the 6 sensors. Additional data of the rotational
speed during the test run was collected by the addition of a hall sensor and magnet ring around
the rotor shaft. This test setup can measure the backside of the test material, which is the
temperature the skin would feel during an abrasive slide.
An important remark about this test setup: because the rubber pad of the sample holder has a
hole to accommodate the field of view of the infrared sensor, no pressure is applied to this
small area of the fabric during the slide. Multiple solutions (Figure 54) were tried to solve this
problem, but none were effective because it would alter the temperature measurements of the
sensors. Solutions with PE tape, different plastics, and Kevlar backing layer(s) were tested but
without positive result. Keeping this remark in mind when analysing the temperature data. The
real maximum temperature at the back of the specimen could be equal or higher than
measured with this test setup because of the absence of pressure directly under the IR sensor.
The second test setup, ‘In tile’ test setup, consists of the same 6 infrared sensors but now
encapsulated into the tile. The previously designed slip ring was not needed in this test setup
because the sensors are static. Additional information to determine the moment of impact was
provided by an accelerometer mounted to the backside of the tile. This test setup can measure
the outside of the test material, which is the temperature the material would feel during an
abrasive slide.
Figure 54: Two explored solutions (PE tape, Kevlar backing layers) to counter the absence of pressure
D3.1 Page 82 of 256 14/12/20
The main advantage of this test setup is the unaltered rubber pad in the sample holder. No
holes are needed in the rubber pad to accommodate the sensors, so no absence of pressure in
this area and a uniform pressure on the test material during a test run. The main disadvantages
are the altered tile (although friction coefficient of the tile did not alter much) and the discrete
measurement of temperatures.
Meta-analysis of both test setups revealed a linear relationship between maximum temperature
and rotational speed of the rotor before drop. Test results were precise and accurate (within
tolerable deviation) for both test setups.
A clear temperature difference can be noted between both test setups for the same test
material at the same rotational speed. For nylon ripstop the temperature difference was
between 16°C and 31°C, with the ‘In tile’ test setup providing the higher maximum
temperatures. For performance leather the difference was even bigger, between 67°C and
111°C.
Two possible explanations are suggested for the temperature difference between the two test
setups. The first explanation is the absence of pressure in the area around the infrared sensor
in the ‘In sample holder’ test setup. Lack of pressure in this area would lead to less friction
between the material and the tile and thus less friction heat. A second explanation for the
temperature is the difference in heat capacity and thickness of the test materials.
A second explanation for the difference between both test setups is the difference in thickness
of the test materials. The thermal resistance, Rth, is a function of the thickness of the material L
and the thermal conductivity k, the ability to conduct heat.
𝑅𝑡ℎ = 𝐿
𝑘
A 100% nylon fabric has a heat conductivity of 0,1287 W/mK according to the TPS standard
test [12]. Leather has a heat conductivity between 0,14 and 0,16 W/mK [13]. These values are
comparable, but the thickness of both materials differs substantially. The tested nylon ripstop
had a thickness of 0,37 mm, the tested leather had a thickness of 1,20 mm. This will result in
almost a factor 4 difference in thermal resistance.
D3.1 Page 83 of 256 14/12/20
The specific heat capacity or thermal capacity is the amount of heat to be supplied to a given
mass of a material to produce a unit change in its temperature. Differences in specific heat
capacity and thermal diffusivity could explain the differences in maximum temperatures
between fabrics tested with the same conditions.
𝐶 = lim∆𝑇→0
∆𝑄
∆𝑇∗𝑀
Where ∆Q is the amount of heat that must be added to the object of mass M in order to raise its
temperature by ∆T. The specific heat capacity of leather (1,5 KJ/kg K) is lower than the specific
heat capacity of nylon 6.6 (1,7 KJ/kg K) [14]. Leather needs less frictional energy to heat up.
Thermal diffusivity α combines thermal conductivity k (0,14 W/mK for leather and 0,25 W/mK
for nylon 6.6) with density ρ (0,86 10³ kg/m³ for leather and 1,14 10³ kg/m³ for nylon 6.6) and
specific heat Cp. It quantifies the thermal inertia of a material, the rate of heat transfer of a
material from the hot side to the cold side. The thermal diffusivity of leather is smaller (around
20%) than the thermal diffusivity of a nylon ripstop, it transfers heat slower [14] .
𝛼 =𝑘
𝜌 𝐶𝑝
Based on differences in specific heat capacity, thermal diffusivity and thermal resistance the
temperature differences can be explained between different materials and between both test
setups.
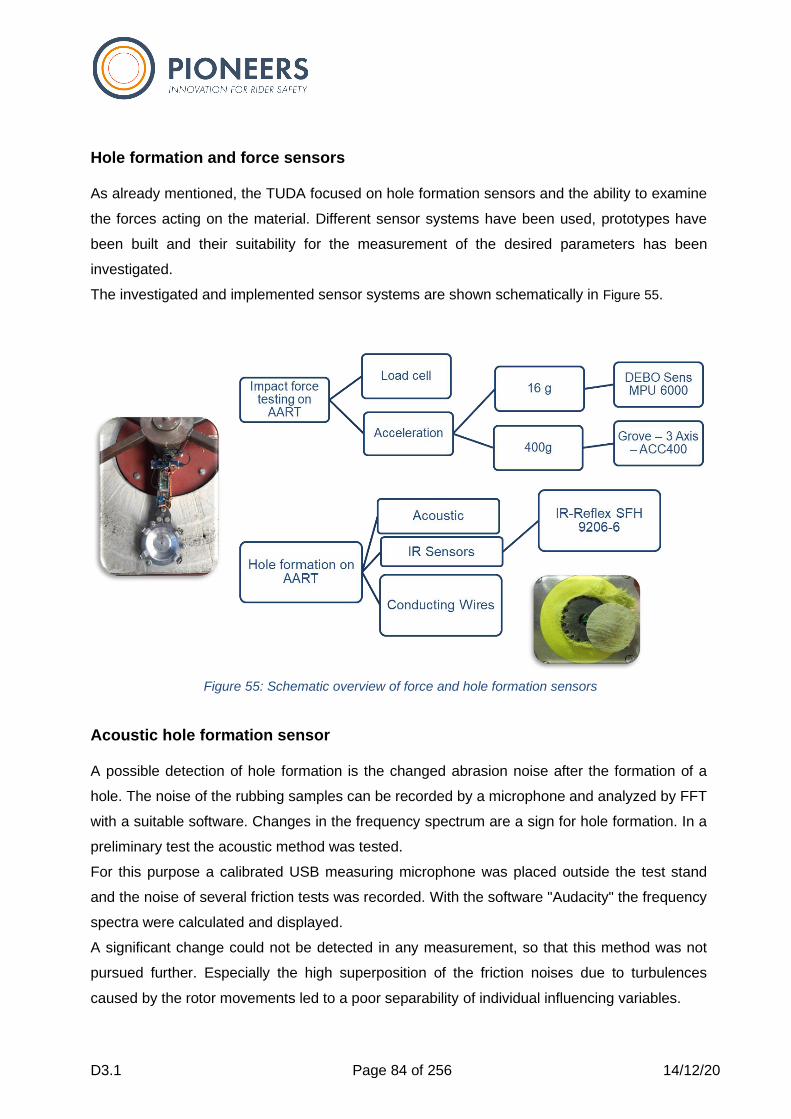
D3.1 Page 84 of 256 14/12/20
Hole formation and force sensors As already mentioned, the TUDA focused on hole formation sensors and the ability to examine
the forces acting on the material. Different sensor systems have been used, prototypes have
been built and their suitability for the measurement of the desired parameters has been
investigated.
The investigated and implemented sensor systems are shown schematically in Figure 55.
Acoustic hole formation sensor A possible detection of hole formation is the changed abrasion noise after the formation of a
hole. The noise of the rubbing samples can be recorded by a microphone and analyzed by FFT
with a suitable software. Changes in the frequency spectrum are a sign for hole formation. In a
preliminary test the acoustic method was tested.
For this purpose a calibrated USB measuring microphone was placed outside the test stand
and the noise of several friction tests was recorded. With the software "Audacity" the frequency
spectra were calculated and displayed.
A significant change could not be detected in any measurement, so that this method was not
pursued further. Especially the high superposition of the friction noises due to turbulences
caused by the rotor movements led to a poor separability of individual influencing variables.
Figure 55: Schematic overview of force and hole formation sensors
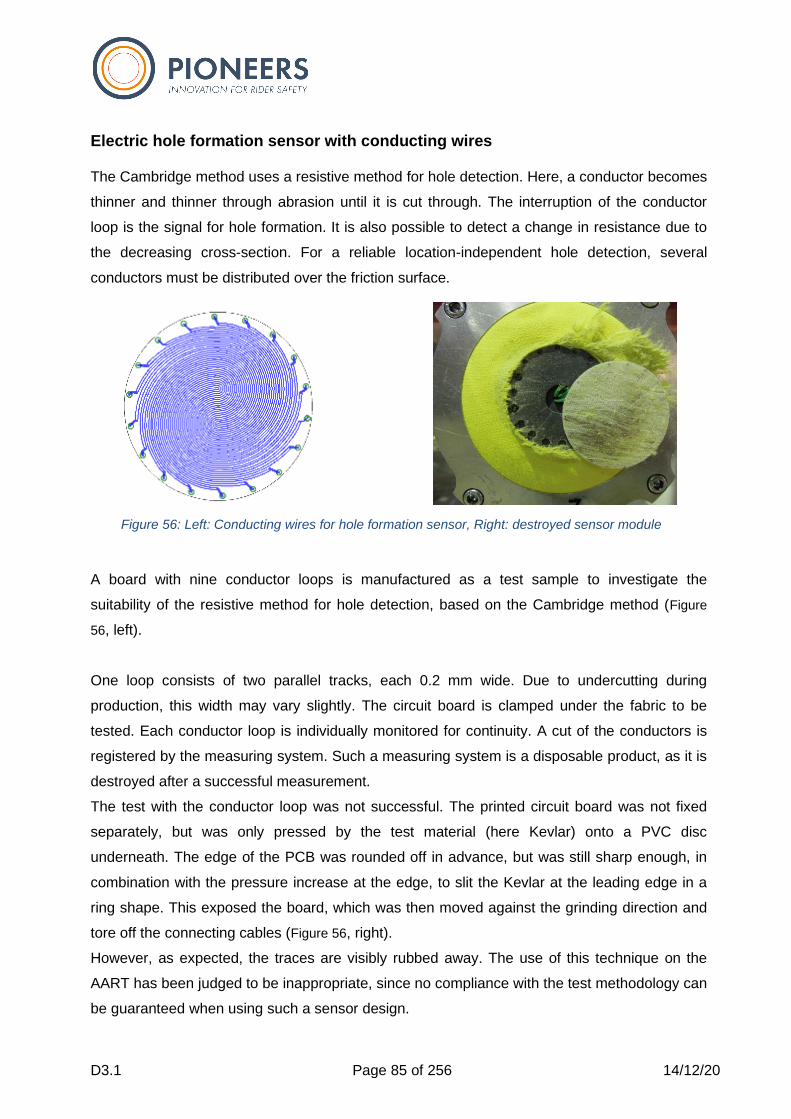
D3.1 Page 85 of 256 14/12/20
Electric hole formation sensor with conducting wires The Cambridge method uses a resistive method for hole detection. Here, a conductor becomes
thinner and thinner through abrasion until it is cut through. The interruption of the conductor
loop is the signal for hole formation. It is also possible to detect a change in resistance due to
the decreasing cross-section. For a reliable location-independent hole detection, several
conductors must be distributed over the friction surface.
A board with nine conductor loops is manufactured as a test sample to investigate the
suitability of the resistive method for hole detection, based on the Cambridge method (Figure
56, left).
One loop consists of two parallel tracks, each 0.2 mm wide. Due to undercutting during
production, this width may vary slightly. The circuit board is clamped under the fabric to be
tested. Each conductor loop is individually monitored for continuity. A cut of the conductors is
registered by the measuring system. Such a measuring system is a disposable product, as it is
destroyed after a successful measurement.
The test with the conductor loop was not successful. The printed circuit board was not fixed
separately, but was only pressed by the test material (here Kevlar) onto a PVC disc
underneath. The edge of the PCB was rounded off in advance, but was still sharp enough, in
combination with the pressure increase at the edge, to slit the Kevlar at the leading edge in a
ring shape. This exposed the board, which was then moved against the grinding direction and
tore off the connecting cables (Figure 56, right).
However, as expected, the traces are visibly rubbed away. The use of this technique on the
AART has been judged to be inappropriate, since no compliance with the test methodology can
be guaranteed when using such a sensor design.
Figure 56: Left: Conducting wires for hole formation sensor, Right: destroyed sensor module
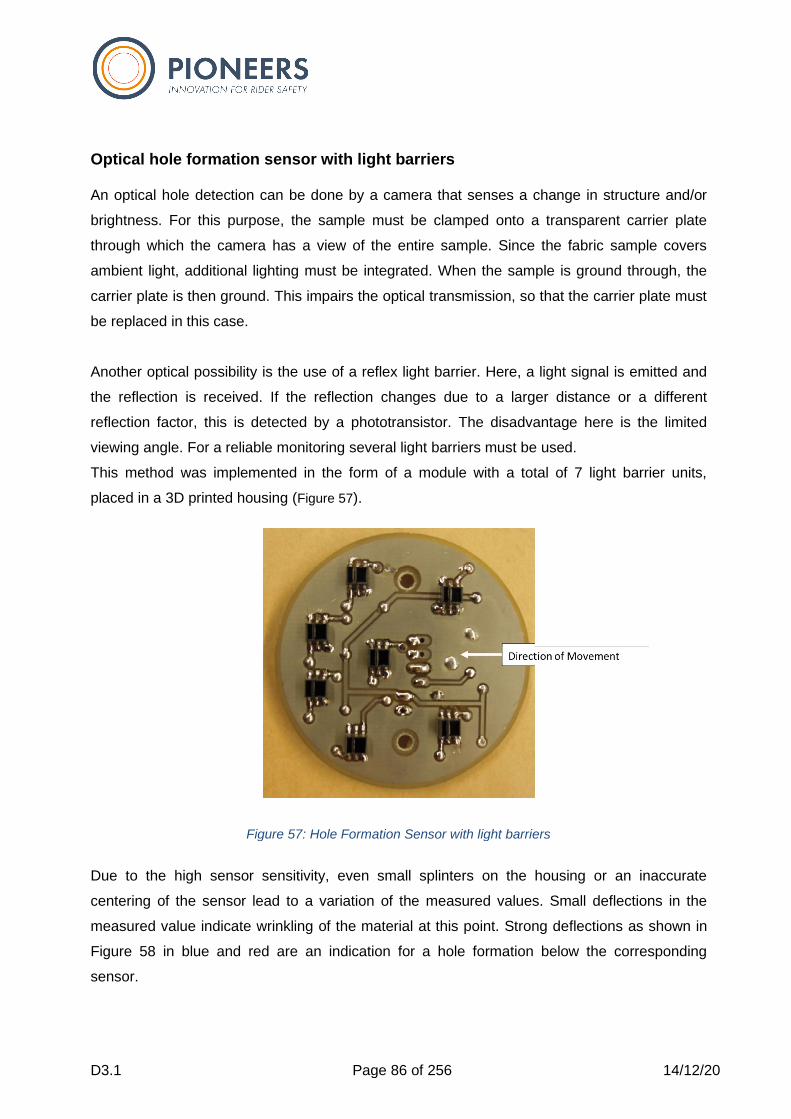
D3.1 Page 86 of 256 14/12/20
Optical hole formation sensor with light barriers An optical hole detection can be done by a camera that senses a change in structure and/or
brightness. For this purpose, the sample must be clamped onto a transparent carrier plate
through which the camera has a view of the entire sample. Since the fabric sample covers
ambient light, additional lighting must be integrated. When the sample is ground through, the
carrier plate is then ground. This impairs the optical transmission, so that the carrier plate must
be replaced in this case.
Another optical possibility is the use of a reflex light barrier. Here, a light signal is emitted and
the reflection is received. If the reflection changes due to a larger distance or a different
reflection factor, this is detected by a phototransistor. The disadvantage here is the limited
viewing angle. For a reliable monitoring several light barriers must be used.
This method was implemented in the form of a module with a total of 7 light barrier units,
placed in a 3D printed housing (Figure 57).
Due to the high sensor sensitivity, even small splinters on the housing or an inaccurate
centering of the sensor lead to a variation of the measured values. Small deflections in the
measured value indicate wrinkling of the material at this point. Strong deflections as shown in
Figure 58 in blue and red are an indication for a hole formation below the corresponding
sensor.
Figure 57: Hole Formation Sensor with light barriers
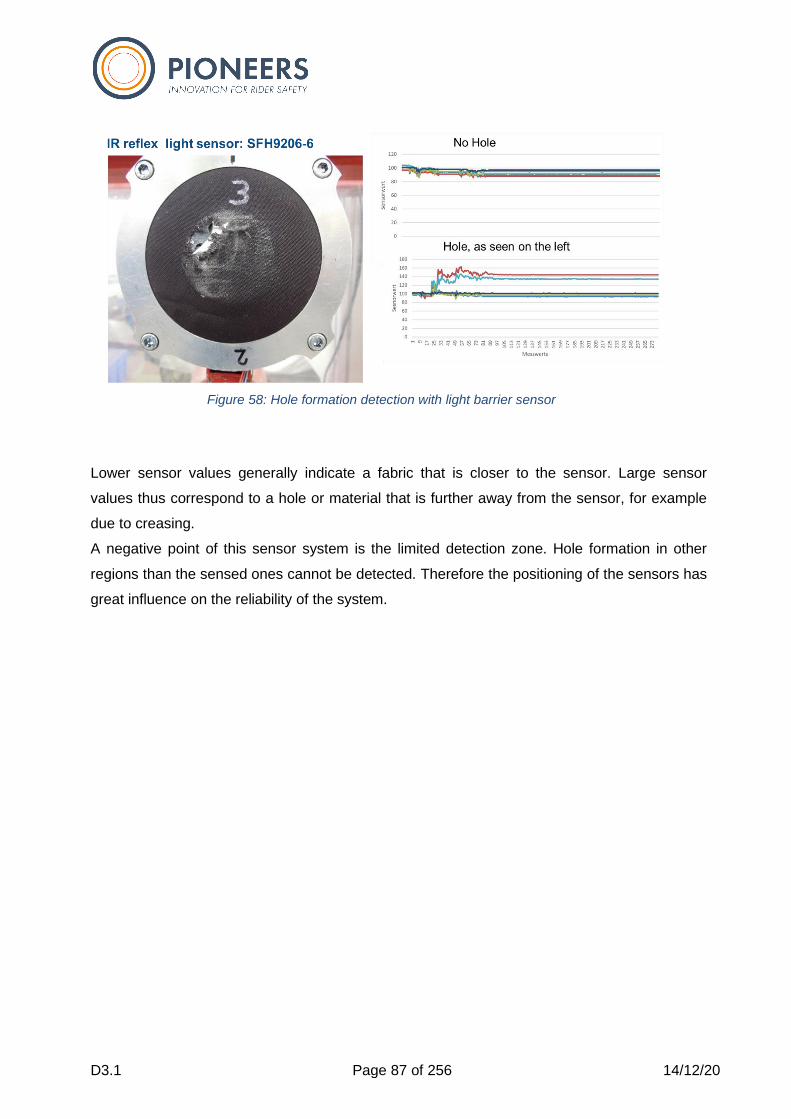
D3.1 Page 87 of 256 14/12/20
Lower sensor values generally indicate a fabric that is closer to the sensor. Large sensor
values thus correspond to a hole or material that is further away from the sensor, for example
due to creasing.
A negative point of this sensor system is the limited detection zone. Hole formation in other
regions than the sensed ones cannot be detected. Therefore the positioning of the sensors has
great influence on the reliability of the system.
Figure 58: Hole formation detection with light barrier sensor
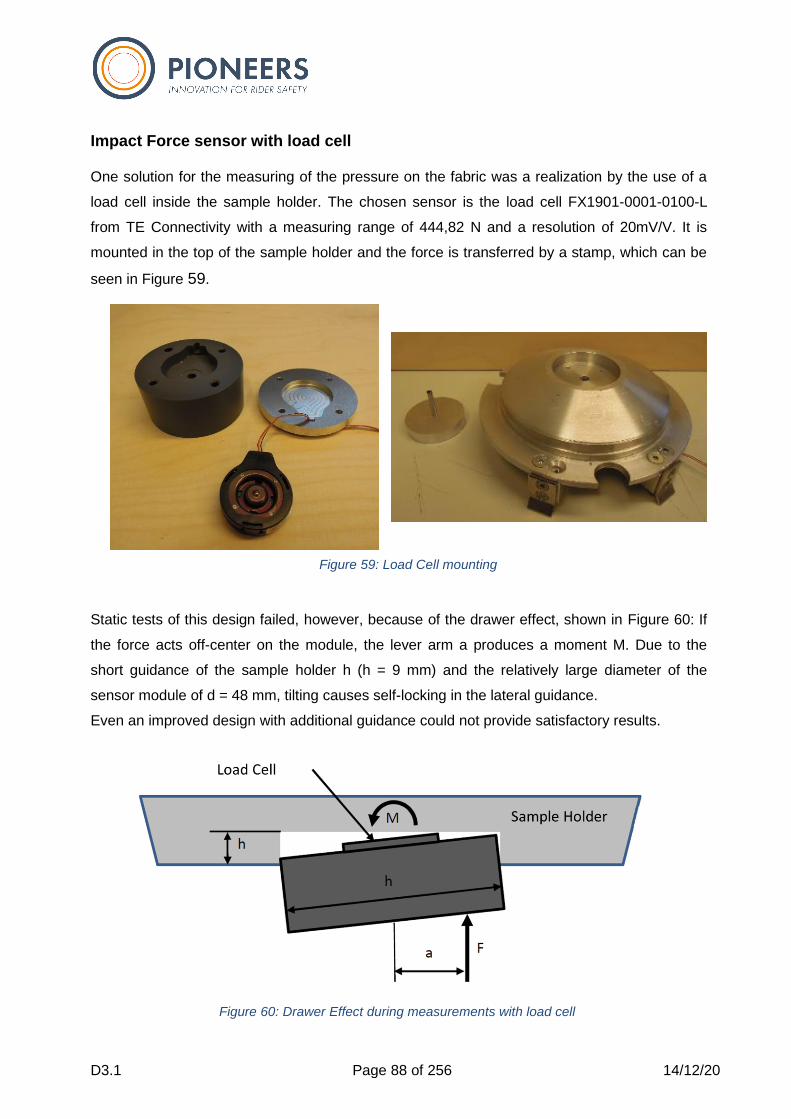
D3.1 Page 88 of 256 14/12/20
Impact Force sensor with load cell One solution for the measuring of the pressure on the fabric was a realization by the use of a
load cell inside the sample holder. The chosen sensor is the load cell FX1901-0001-0100-L
from TE Connectivity with a measuring range of 444,82 N and a resolution of 20mV/V. It is
mounted in the top of the sample holder and the force is transferred by a stamp, which can be
seen in Figure 59.
Static tests of this design failed, however, because of the drawer effect, shown in Figure 60: If
the force acts off-center on the module, the lever arm a produces a moment M. Due to the
short guidance of the sample holder h (h = 9 mm) and the relatively large diameter of the
sensor module of d = 48 mm, tilting causes self-locking in the lateral guidance.
Even an improved design with additional guidance could not provide satisfactory results.
Figure 60: Drawer Effect during measurements with load cell
Figure 59: Load Cell mounting
D3.1 Page 89 of 256 14/12/20
Impact Force Sensor with Acceleration Sensors
Due to the listed disadvantages of direct force measurement, the use of acceleration sensors
was chosen during the development of the sensor concept for measuring the material stress
due to varying surface pressure.
The acceleration on impact of the rotor of the AART is of great interest. This allows conclusions
to be drawn about the strength of the impact, the damping properties of the protective clothing
and the forces acting on it.
Accelerometers use the seismic principle to measure acceleration. In a spring-mass damper
system the acceleration to be measured causes a deflection of the mass, which is determined
by a displacement sensor. Most common are so-called Micro-Electro-Mechanical-Systems,
which measure the deflection capacitively in a micro-mechanical system.
For this reason and due to their space-saving design, sensors based on this measuring
principle are also chosen for specific applications. For comparison purposes two sensors are
used. One is the ADXL346 with a measuring range of ±16 g and a sensitivity of 4 - 35 mg⁄LSB,
the other is the H3LIS331DL with a measuring range of ±400 g and a sensitivity of up to 49 -
195 mg⁄LSB. The larger measuring range is therefore accompanied by a worse resolution.
In order to ensure that the accelerometers provide correct readings, it is necessary to validate
them, which is done by testing on the AART. The goal is to compare the measured values of
the acceleration sensors with a calculated acceleration resulting from the speed of the rotor
and the radial position of the sensors.
The test setup consists of the Raspberry Pi, to which the acceleration sensors are attached,
and the battery that supplies the Raspberry Pi with power. All electronics are attached to the
rotor arm by means of a bracket, see Figure 61.
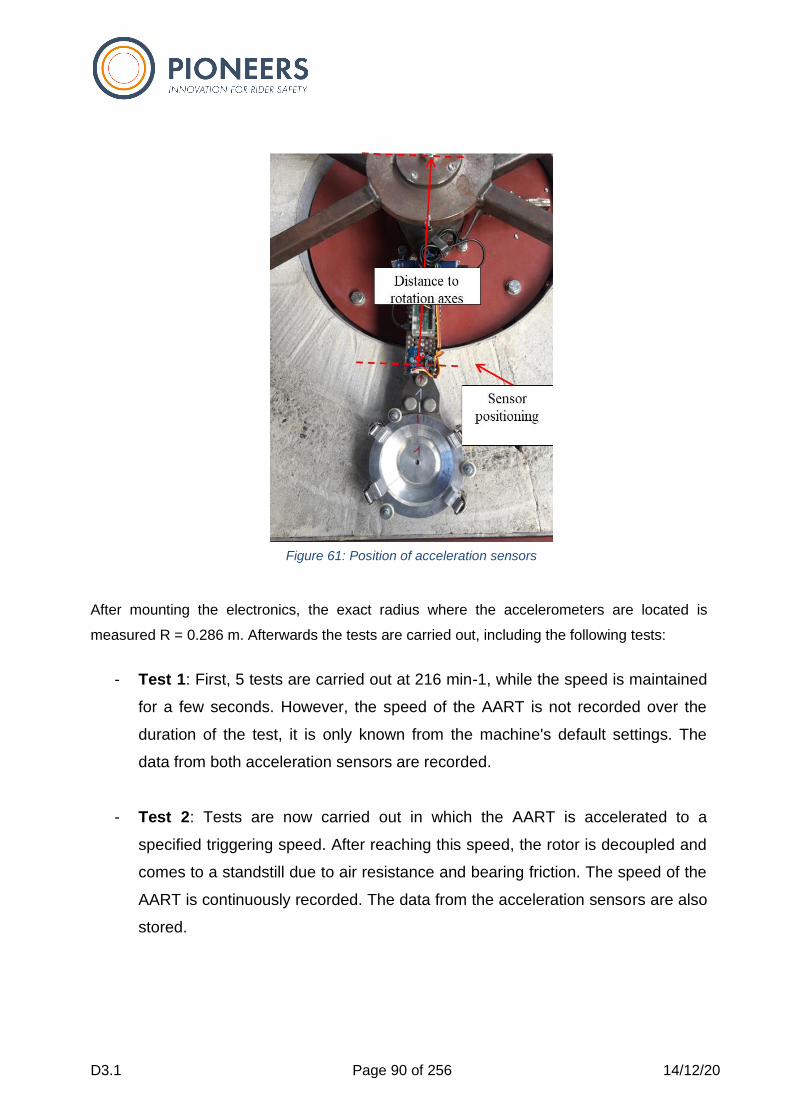
D3.1 Page 90 of 256 14/12/20
After mounting the electronics, the exact radius where the accelerometers are located is
measured R = 0.286 m. Afterwards the tests are carried out, including the following tests:
- Test 1: First, 5 tests are carried out at 216 min-1, while the speed is maintained
for a few seconds. However, the speed of the AART is not recorded over the
duration of the test, it is only known from the machine's default settings. The
data from both acceleration sensors are recorded.
- Test 2: Tests are now carried out in which the AART is accelerated to a
specified triggering speed. After reaching this speed, the rotor is decoupled and
comes to a standstill due to air resistance and bearing friction. The speed of the
AART is continuously recorded. The data from the acceleration sensors are also
stored.
Figure 61: Position of acceleration sensors
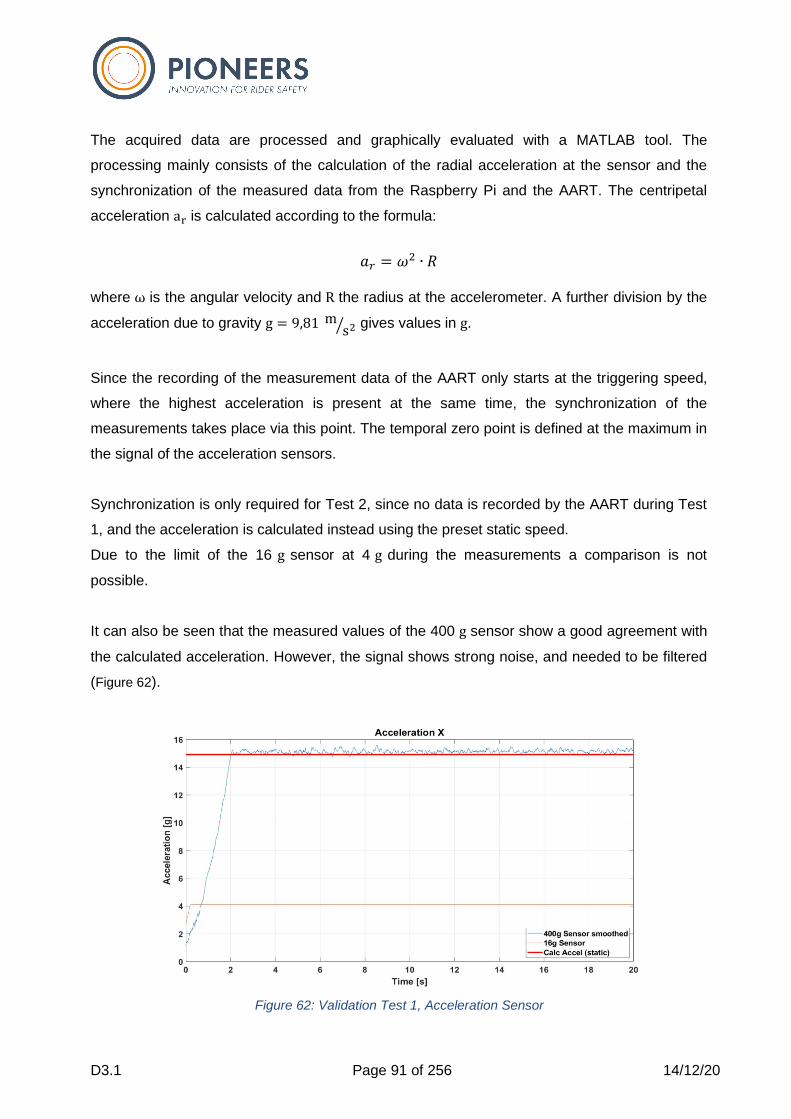
D3.1 Page 91 of 256 14/12/20
The acquired data are processed and graphically evaluated with a MATLAB tool. The
processing mainly consists of the calculation of the radial acceleration at the sensor and the
synchronization of the measured data from the Raspberry Pi and the AART. The centripetal
acceleration ar is calculated according to the formula:
𝑎𝑟 = 𝜔2 ∙ 𝑅
where ω is the angular velocity and R the radius at the accelerometer. A further division by the
acceleration due to gravity g = 9,81 ms2⁄ gives values in g.
Since the recording of the measurement data of the AART only starts at the triggering speed,
where the highest acceleration is present at the same time, the synchronization of the
measurements takes place via this point. The temporal zero point is defined at the maximum in
the signal of the acceleration sensors.
Synchronization is only required for Test 2, since no data is recorded by the AART during Test
1, and the acceleration is calculated instead using the preset static speed.
Due to the limit of the 16 g sensor at 4 g during the measurements a comparison is not
possible.
It can also be seen that the measured values of the 400 g sensor show a good agreement with
the calculated acceleration. However, the signal shows strong noise, and needed to be filtered
(Figure 62).
Figure 62: Validation Test 1, Acceleration Sensor
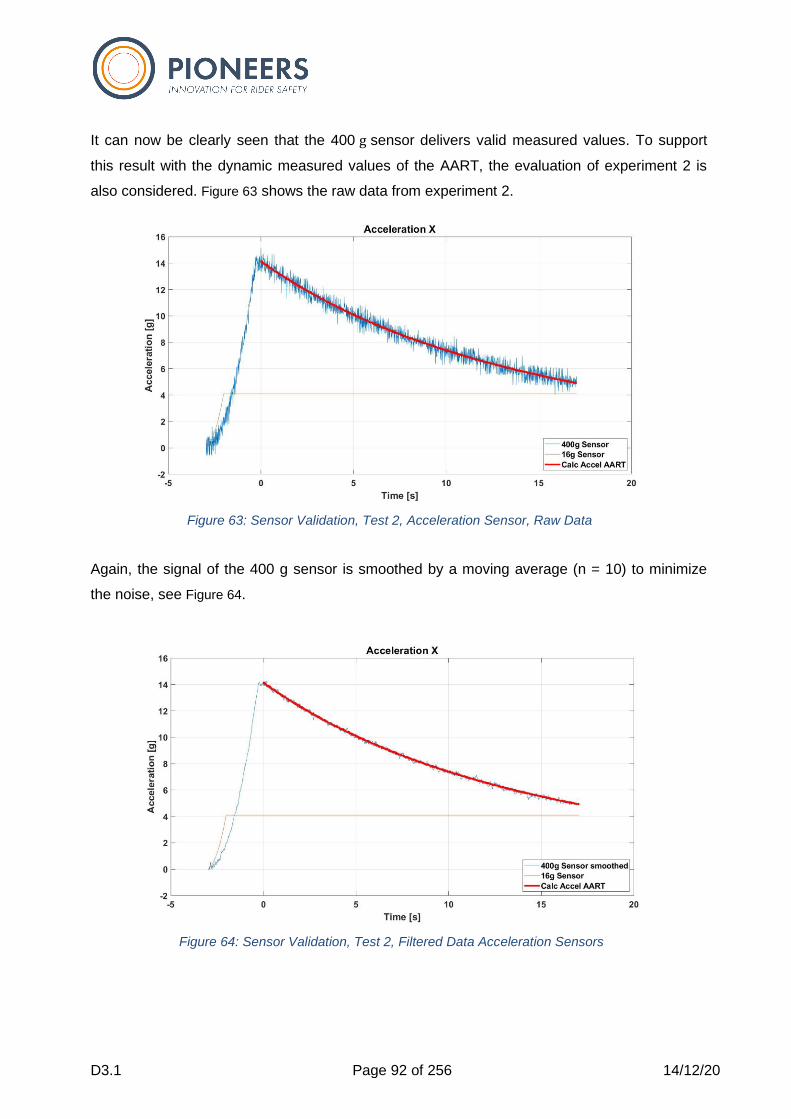
D3.1 Page 92 of 256 14/12/20
It can now be clearly seen that the 400 g sensor delivers valid measured values. To support
this result with the dynamic measured values of the AART, the evaluation of experiment 2 is
also considered. Figure 63 shows the raw data from experiment 2.
Again, the signal of the 400 g sensor is smoothed by a moving average (n = 10) to minimize
the noise, see Figure 64.
Figure 63: Sensor Validation, Test 2, Acceleration Sensor, Raw Data
Figure 64: Sensor Validation, Test 2, Filtered Data Acceleration Sensors
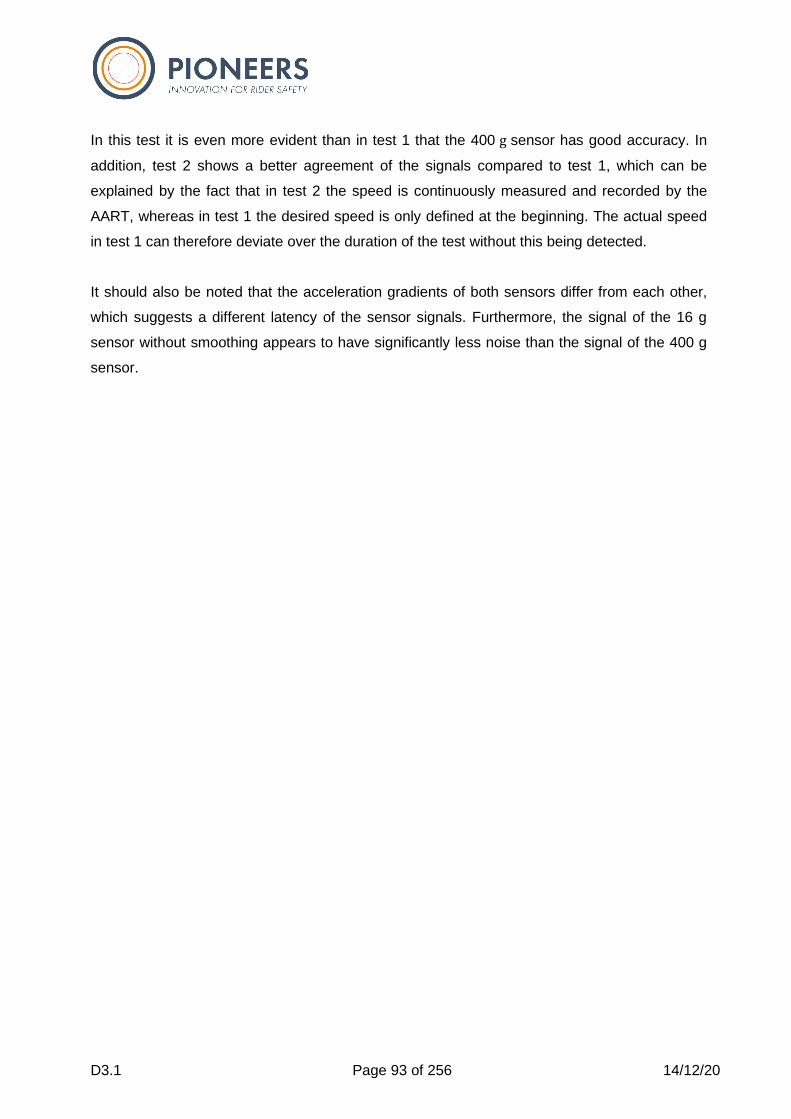
D3.1 Page 93 of 256 14/12/20
In this test it is even more evident than in test 1 that the 400 g sensor has good accuracy. In
addition, test 2 shows a better agreement of the signals compared to test 1, which can be
explained by the fact that in test 2 the speed is continuously measured and recorded by the
AART, whereas in test 1 the desired speed is only defined at the beginning. The actual speed
in test 1 can therefore deviate over the duration of the test without this being detected.
It should also be noted that the acceleration gradients of both sensors differ from each other,
which suggests a different latency of the sensor signals. Furthermore, the signal of the 16 g
sensor without smoothing appears to have significantly less noise than the signal of the 400 g
sensor.
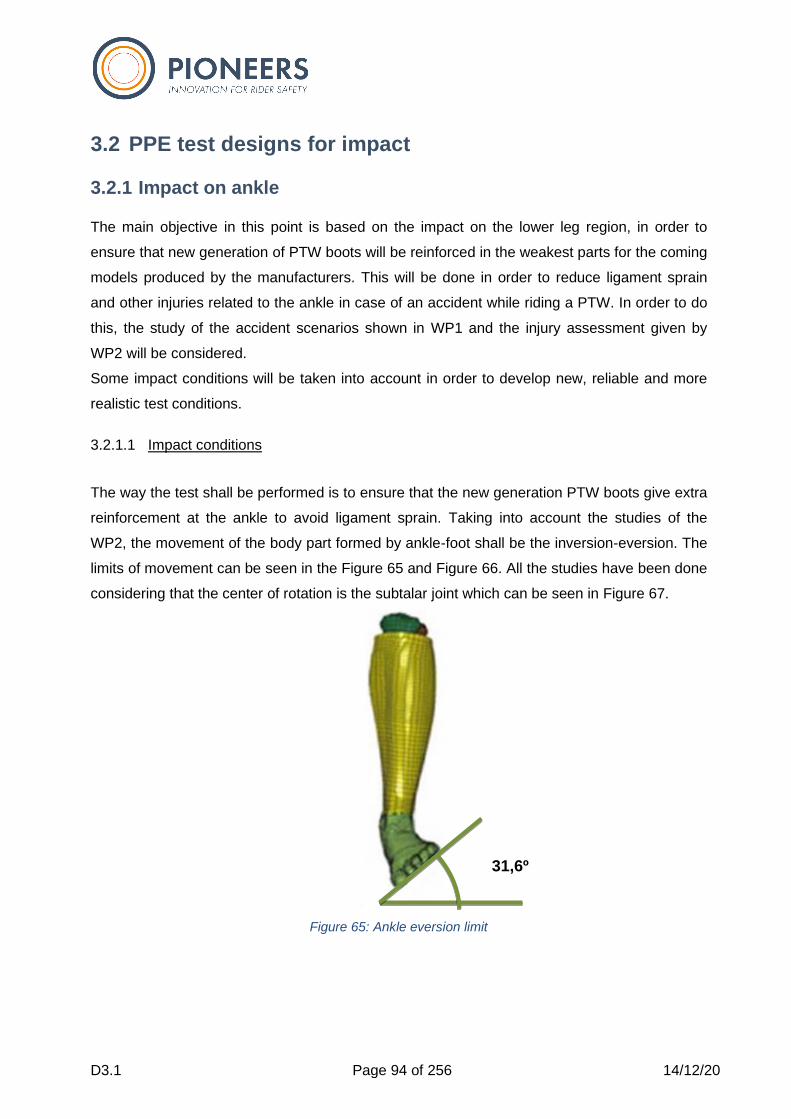
D3.1 Page 94 of 256 14/12/20
3.2 PPE test designs for impact
3.2.1 Impact on ankle
The main objective in this point is based on the impact on the lower leg region, in order to
ensure that new generation of PTW boots will be reinforced in the weakest parts for the coming
models produced by the manufacturers. This will be done in order to reduce ligament sprain
and other injuries related to the ankle in case of an accident while riding a PTW. In order to do
this, the study of the accident scenarios shown in WP1 and the injury assessment given by
WP2 will be considered.
Some impact conditions will be taken into account in order to develop new, reliable and more
realistic test conditions.
3.2.1.1 Impact conditions
The way the test shall be performed is to ensure that the new generation PTW boots give extra
reinforcement at the ankle to avoid ligament sprain. Taking into account the studies of the
WP2, the movement of the body part formed by ankle-foot shall be the inversion-eversion. The
limits of movement can be seen in the Figure 65 and Figure 66. All the studies have been done
considering that the center of rotation is the subtalar joint which can be seen in Figure 67.
Figure 65: Ankle eversion limit
31,6º

D3.1 Page 95 of 256 14/12/20
Figure 66: Ankle inversion limit
Figure 67: Subtalar joint center of rotation
Then, following the studies of WP2 the testing machine should bend the boots in the eversion–
inversion movement demanding the tested boot to flex maximum 30º and 34º, respectively.
Taking advantage to the construction of the machine, it was decided to use the same design to
extend the possibility of tests to perform on it. At that time, after several discussions with the
35,9º
68,6mm
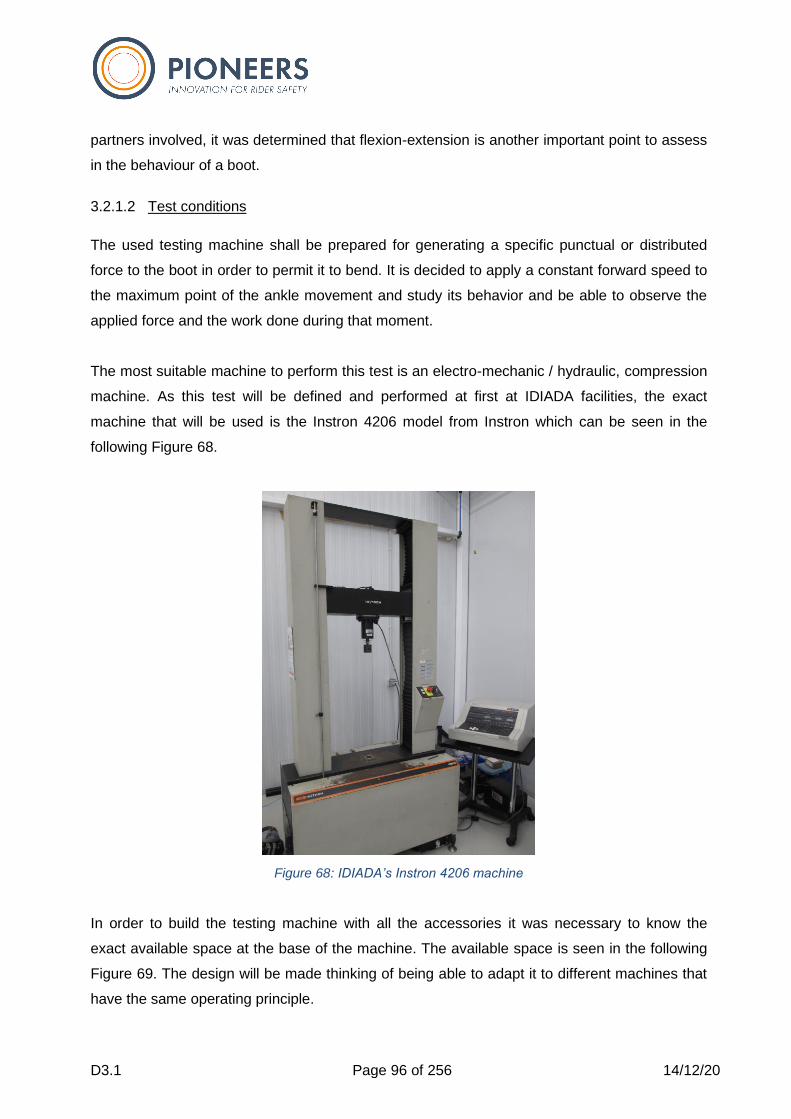
D3.1 Page 96 of 256 14/12/20
partners involved, it was determined that flexion-extension is another important point to assess
in the behaviour of a boot.
3.2.1.2 Test conditions
The used testing machine shall be prepared for generating a specific punctual or distributed
force to the boot in order to permit it to bend. It is decided to apply a constant forward speed to
the maximum point of the ankle movement and study its behavior and be able to observe the
applied force and the work done during that moment.
The most suitable machine to perform this test is an electro-mechanic / hydraulic, compression
machine. As this test will be defined and performed at first at IDIADA facilities, the exact
machine that will be used is the Instron 4206 model from Instron which can be seen in the
following Figure 68.
Figure 68: IDIADA’s Instron 4206 machine
In order to build the testing machine with all the accessories it was necessary to know the
exact available space at the base of the machine. The available space is seen in the following
Figure 69. The design will be made thinking of being able to adapt it to different machines that
have the same operating principle.
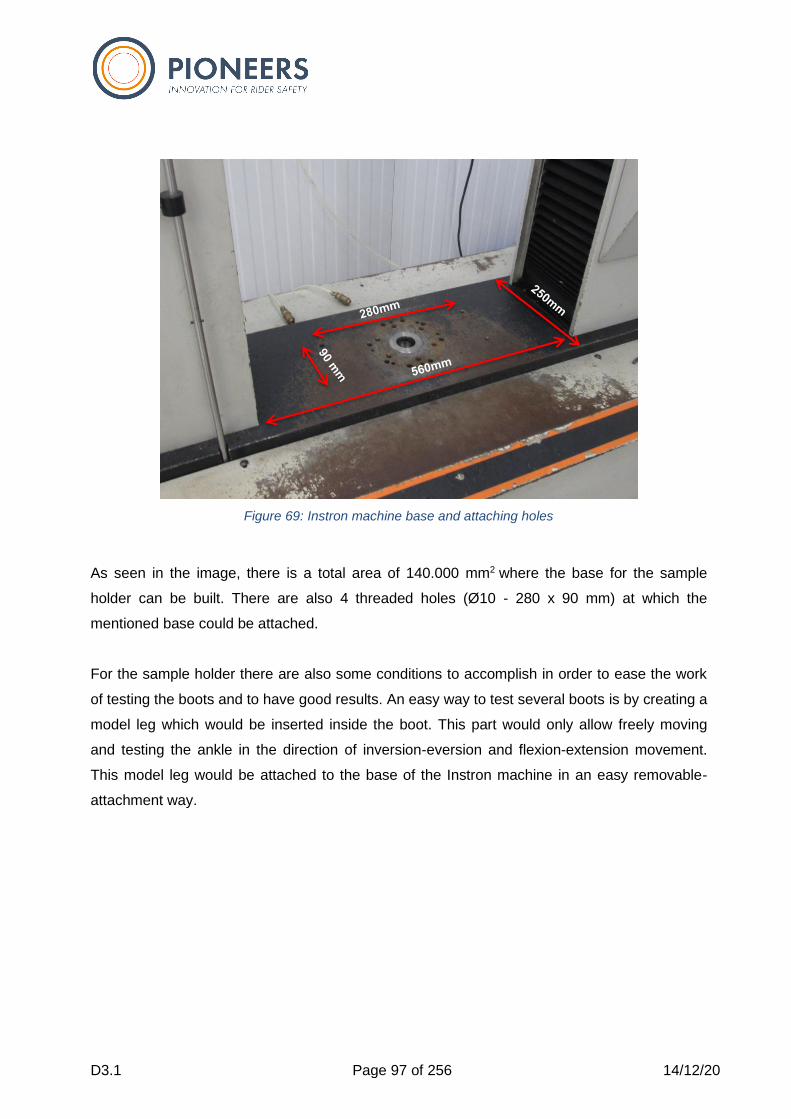
D3.1 Page 97 of 256 14/12/20
Figure 69: Instron machine base and attaching holes
As seen in the image, there is a total area of 140.000 mm2 where the base for the sample
holder can be built. There are also 4 threaded holes (Ø10 - 280 x 90 mm) at which the
mentioned base could be attached.
For the sample holder there are also some conditions to accomplish in order to ease the work
of testing the boots and to have good results. An easy way to test several boots is by creating a
model leg which would be inserted inside the boot. This part would only allow freely moving
and testing the ankle in the direction of inversion-eversion and flexion-extension movement.
This model leg would be attached to the base of the Instron machine in an easy removable-
attachment way.

D3.1 Page 98 of 256 14/12/20
3.2.1.3 Model Leg for inversion-eversion
Figure 70: Inversion-eversion model leg
The model leg shown in the Figure 70 was built by Alpinestars in order to represent the
movement of the ankle in the inversion-eversion way and It will serve to adapt it to the machine
and test the boots and see their behaviour during the test.
3.2.1.4 Model Leg for extension-flexion
Figure 71: Flexion-extension model leg
The model leg shown in the
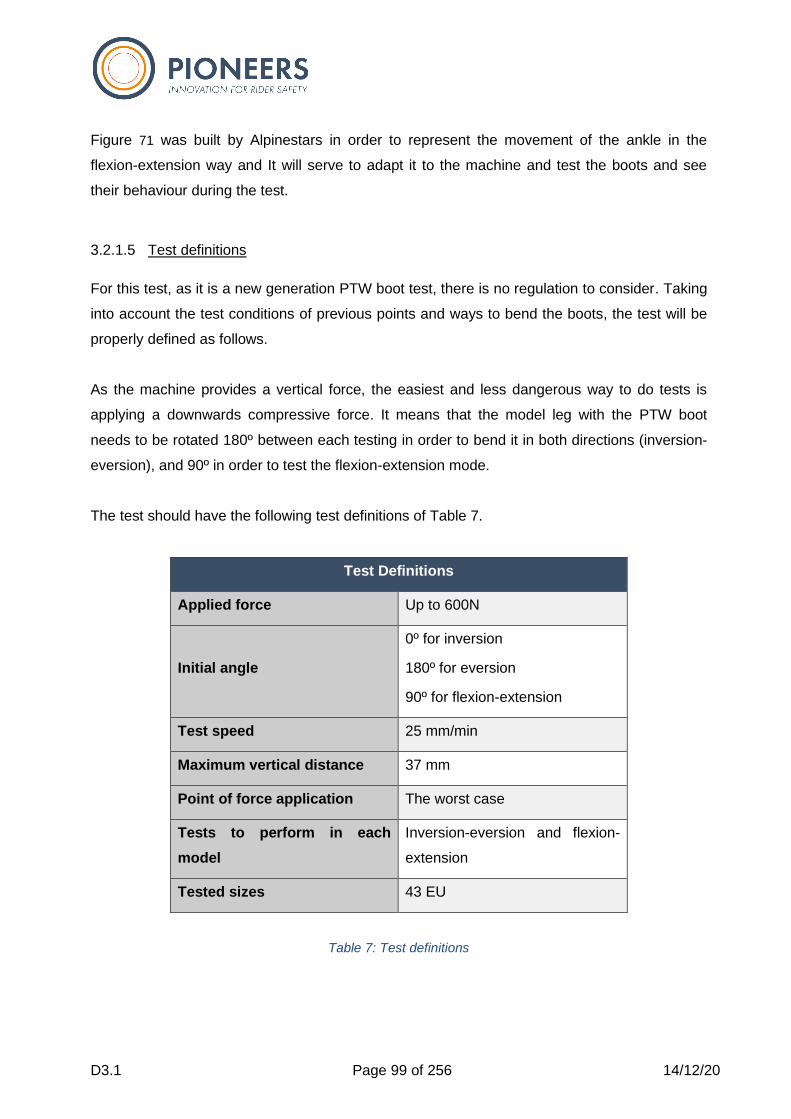
D3.1 Page 99 of 256 14/12/20
Figure 71 was built by Alpinestars in order to represent the movement of the ankle in the
flexion-extension way and It will serve to adapt it to the machine and test the boots and see
their behaviour during the test.
3.2.1.5 Test definitions
For this test, as it is a new generation PTW boot test, there is no regulation to consider. Taking
into account the test conditions of previous points and ways to bend the boots, the test will be
properly defined as follows.
As the machine provides a vertical force, the easiest and less dangerous way to do tests is
applying a downwards compressive force. It means that the model leg with the PTW boot
needs to be rotated 180º between each testing in order to bend it in both directions (inversion-
eversion), and 90º in order to test the flexion-extension mode.
The test should have the following test definitions of Table 7.
Test Definitions
Applied force Up to 600N
Initial angle
0º for inversion
180º for eversion
90º for flexion-extension
Test speed 25 mm/min
Maximum vertical distance 37 mm
Point of force application The worst case
Tests to perform in each
model
Inversion-eversion and flexion-
extension
Tested sizes 43 EU
Table 7: Test definitions
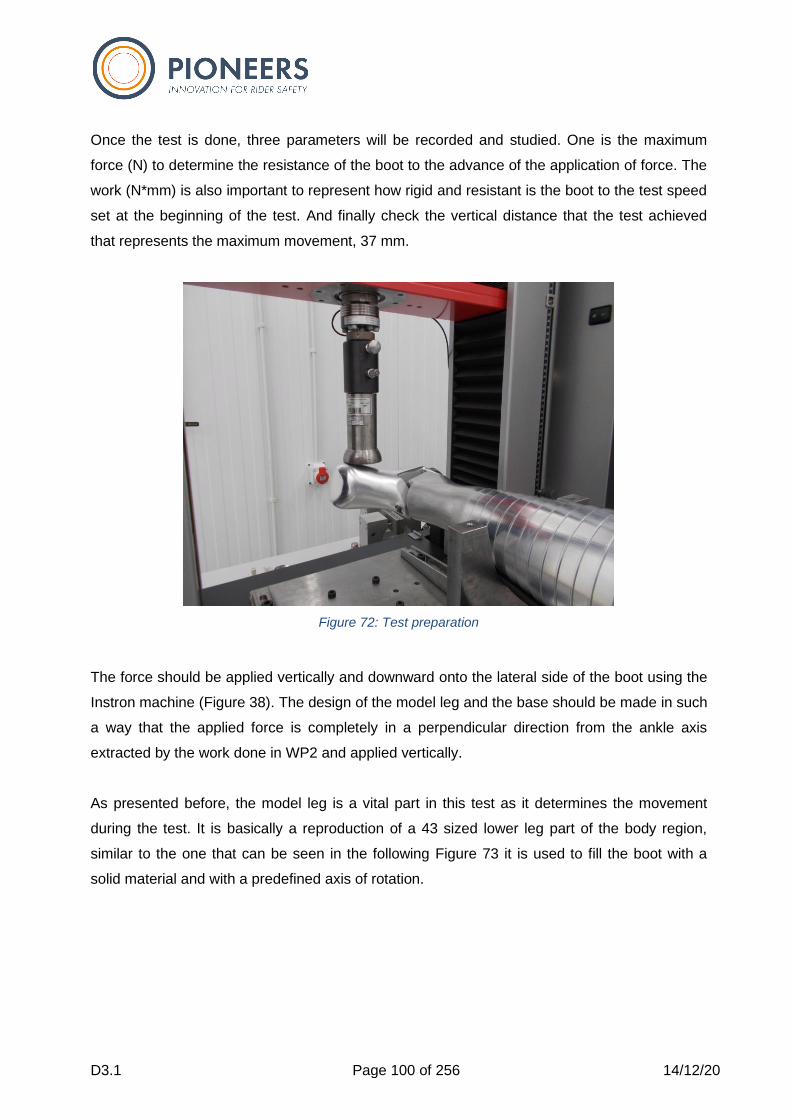
D3.1 Page 100 of 256 14/12/20
Once the test is done, three parameters will be recorded and studied. One is the maximum
force (N) to determine the resistance of the boot to the advance of the application of force. The
work (N*mm) is also important to represent how rigid and resistant is the boot to the test speed
set at the beginning of the test. And finally check the vertical distance that the test achieved
that represents the maximum movement, 37 mm.
Figure 72: Test preparation
The force should be applied vertically and downward onto the lateral side of the boot using the
Instron machine (Figure 38). The design of the model leg and the base should be made in such
a way that the applied force is completely in a perpendicular direction from the ankle axis
extracted by the work done in WP2 and applied vertically.
As presented before, the model leg is a vital part in this test as it determines the movement
during the test. It is basically a reproduction of a 43 sized lower leg part of the body region,
similar to the one that can be seen in the following Figure 73 it is used to fill the boot with a
solid material and with a predefined axis of rotation.

D3.1 Page 101 of 256 14/12/20
Figure 73: Alpinestars model leg
The model leg seen in the previous image is used for other internal testing, this was used as an
inspiration for the new model legs and new tests.
The PIONEERS version has the axis of rotation given by WP2 as it can be seen in the
following Figure 74.
Figure 74: Model leg foot with correct rotation axles
As seen in the previousFigure 74, in green there is the current axis of rotation of the model leg,
in red the new studied axis of rotation given by WP2.
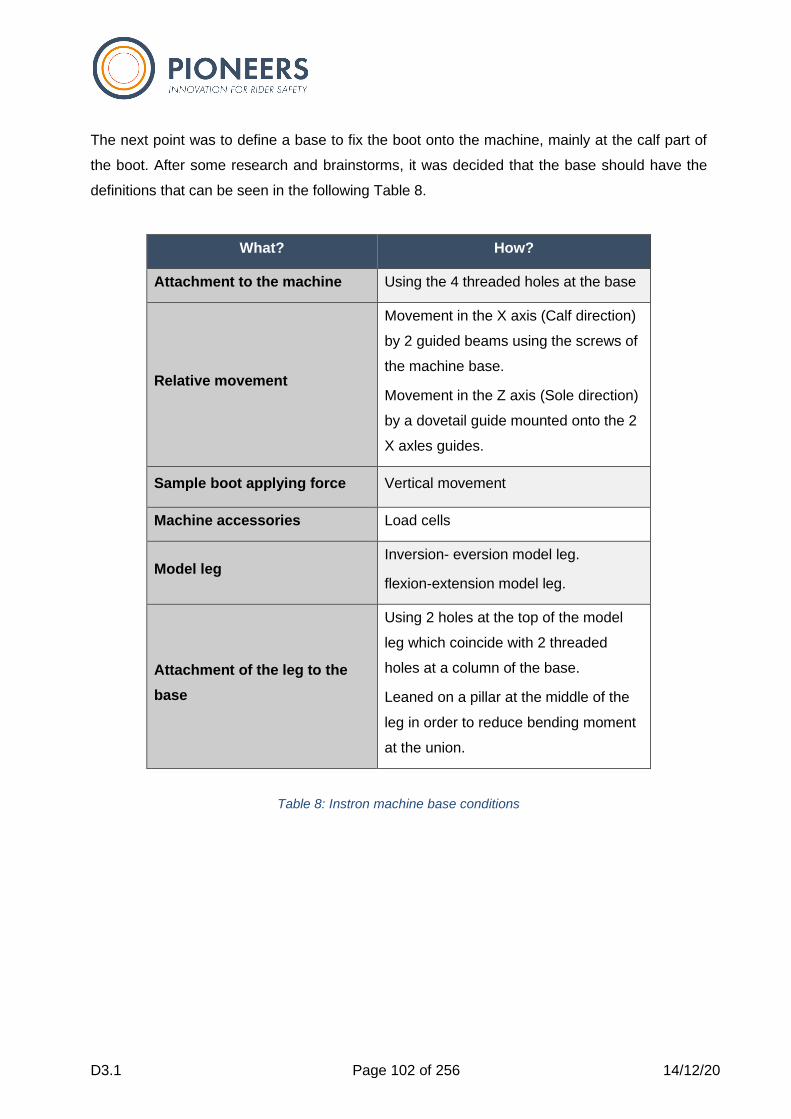
D3.1 Page 102 of 256 14/12/20
The next point was to define a base to fix the boot onto the machine, mainly at the calf part of
the boot. After some research and brainstorms, it was decided that the base should have the
definitions that can be seen in the following Table 8.
What? How?
Attachment to the machine Using the 4 threaded holes at the base
Relative movement
Movement in the X axis (Calf direction)
by 2 guided beams using the screws of
the machine base.
Movement in the Z axis (Sole direction)
by a dovetail guide mounted onto the 2
X axles guides.
Sample boot applying force Vertical movement
Machine accessories Load cells
Model leg Inversion- eversion model leg.
flexion-extension model leg.
Attachment of the leg to the
base
Using 2 holes at the top of the model
leg which coincide with 2 threaded
holes at a column of the base.
Leaned on a pillar at the middle of the
leg in order to reduce bending moment
at the union.
Table 8: Instron machine base conditions
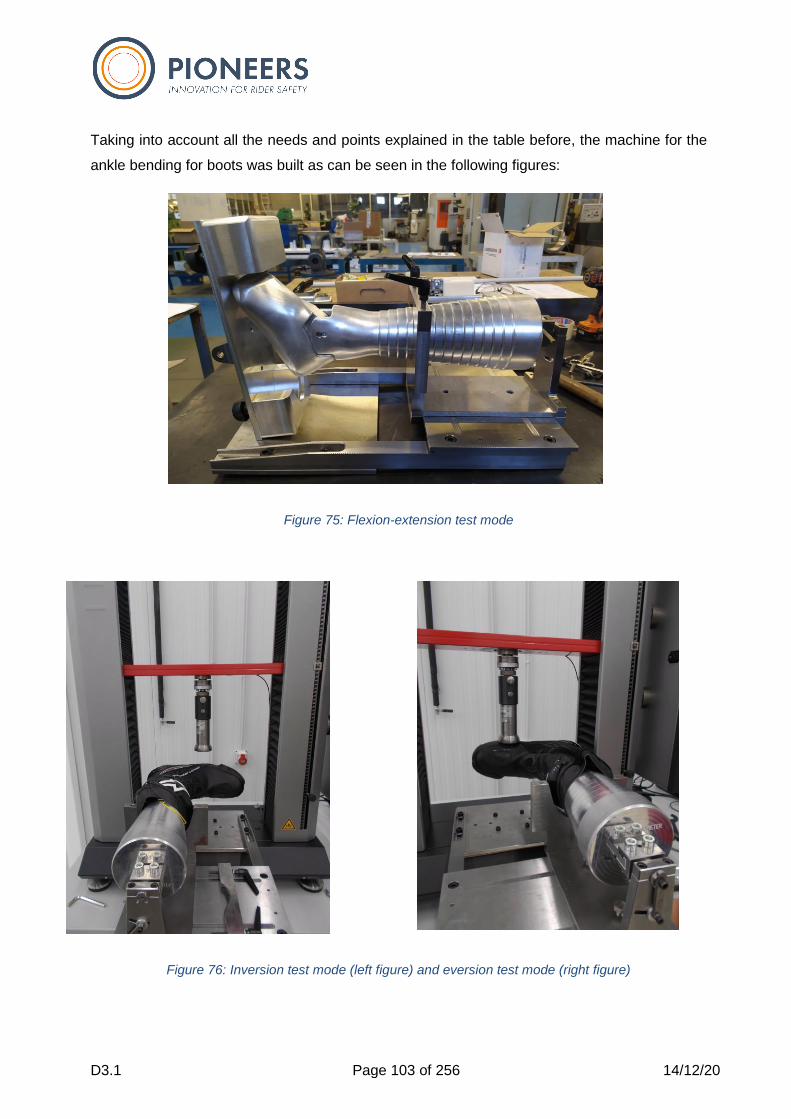
D3.1 Page 103 of 256 14/12/20
Taking into account all the needs and points explained in the table before, the machine for the
ankle bending for boots was built as can be seen in the following figures:
Figure 75: Flexion-extension test mode
Figure 76: Inversion test mode (left figure) and eversion test mode (right figure)
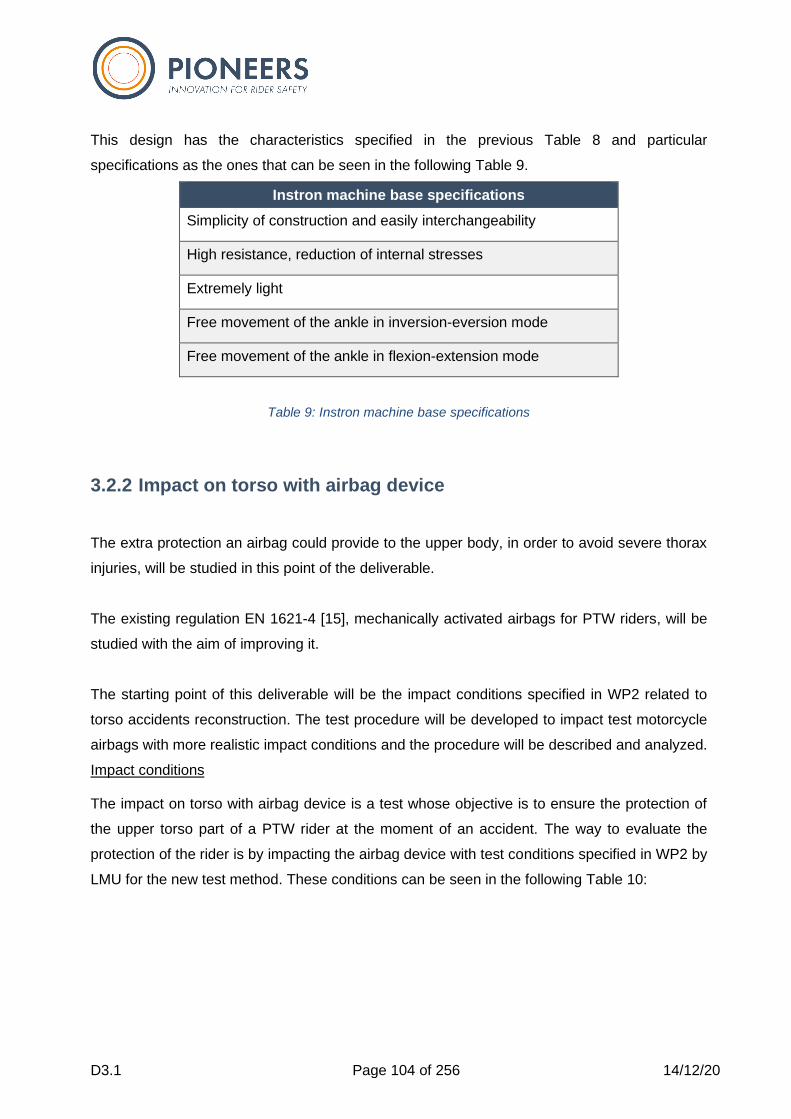
D3.1 Page 104 of 256 14/12/20
This design has the characteristics specified in the previous Table 8 and particular
specifications as the ones that can be seen in the following Table 9.
Instron machine base specifications
Simplicity of construction and easily interchangeability
High resistance, reduction of internal stresses
Extremely light
Free movement of the ankle in inversion-eversion mode
Free movement of the ankle in flexion-extension mode
Table 9: Instron machine base specifications
3.2.2 Impact on torso with airbag device
The extra protection an airbag could provide to the upper body, in order to avoid severe thorax
injuries, will be studied in this point of the deliverable.
The existing regulation EN 1621-4 [15], mechanically activated airbags for PTW riders, will be
studied with the aim of improving it.
The starting point of this deliverable will be the impact conditions specified in WP2 related to
torso accidents reconstruction. The test procedure will be developed to impact test motorcycle
airbags with more realistic impact conditions and the procedure will be described and analyzed.
Impact conditions The impact on torso with airbag device is a test whose objective is to ensure the protection of
the upper torso part of a PTW rider at the moment of an accident. The way to evaluate the
protection of the rider is by impacting the airbag device with test conditions specified in WP2 by
LMU for the new test method. These conditions can be seen in the following Table 10:
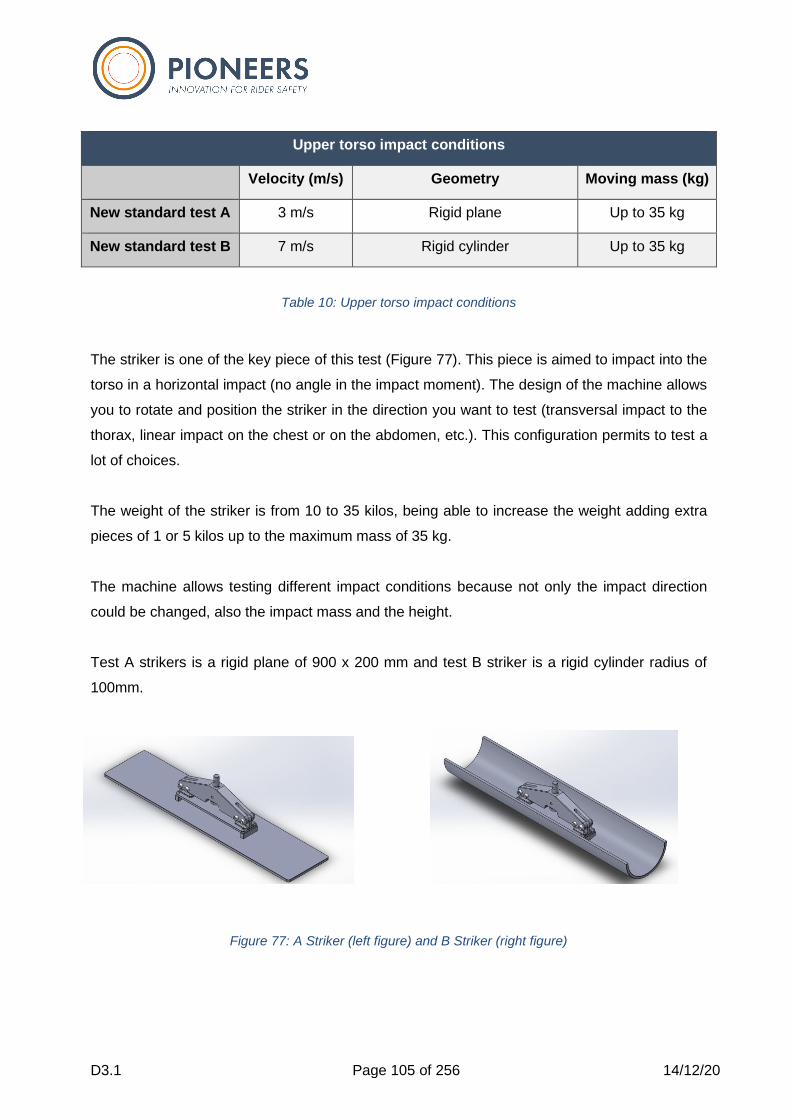
D3.1 Page 105 of 256 14/12/20
Upper torso impact conditions
Velocity (m/s) Geometry Moving mass (kg)
New standard test A 3 m/s Rigid plane Up to 35 kg
New standard test B 7 m/s Rigid cylinder Up to 35 kg
Table 10: Upper torso impact conditions
The striker is one of the key piece of this test (Figure 77). This piece is aimed to impact into the
torso in a horizontal impact (no angle in the impact moment). The design of the machine allows
you to rotate and position the striker in the direction you want to test (transversal impact to the
thorax, linear impact on the chest or on the abdomen, etc.). This configuration permits to test a
lot of choices.
The weight of the striker is from 10 to 35 kilos, being able to increase the weight adding extra
pieces of 1 or 5 kilos up to the maximum mass of 35 kg.
The machine allows testing different impact conditions because not only the impact direction
could be changed, also the impact mass and the height.
Test A strikers is a rigid plane of 900 x 200 mm and test B striker is a rigid cylinder radius of
100mm.
Figure 77: A Striker (left figure) and B Striker (right figure)
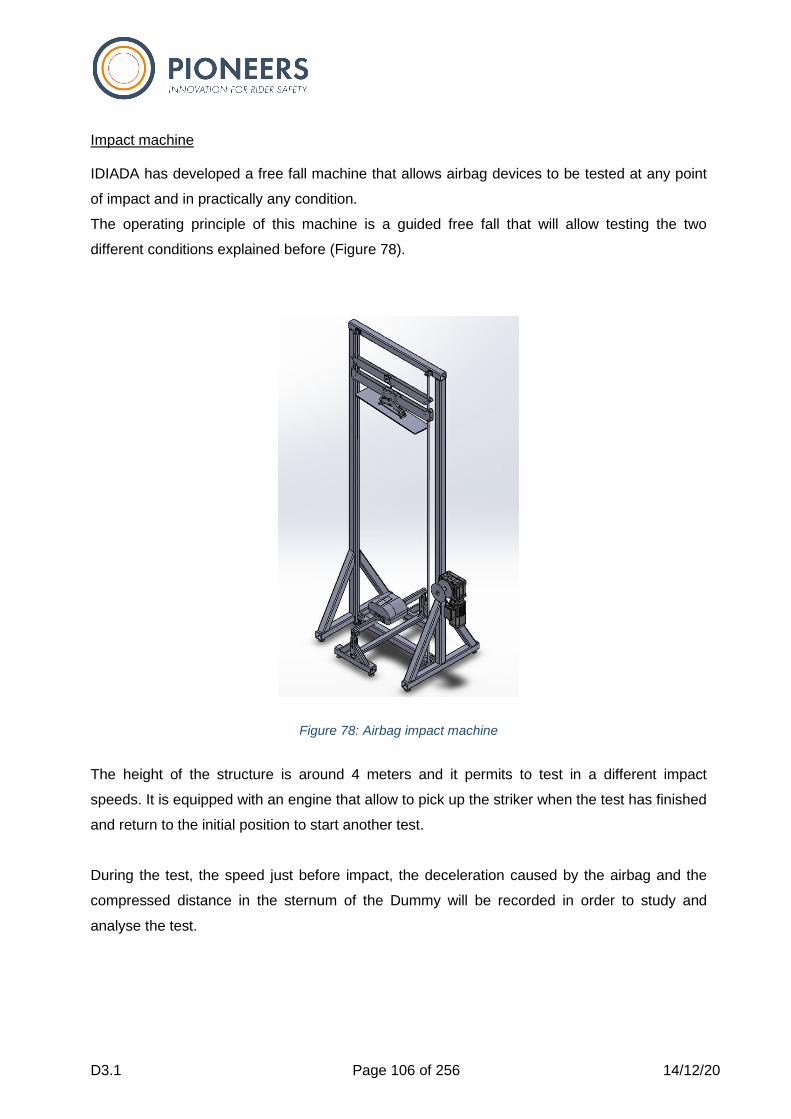
D3.1 Page 106 of 256 14/12/20
Impact machine IDIADA has developed a free fall machine that allows airbag devices to be tested at any point
of impact and in practically any condition.
The operating principle of this machine is a guided free fall that will allow testing the two
different conditions explained before (Figure 78).
Figure 78: Airbag impact machine
The height of the structure is around 4 meters and it permits to test in a different impact
speeds. It is equipped with an engine that allow to pick up the striker when the test has finished
and return to the initial position to start another test.
During the test, the speed just before impact, the deceleration caused by the airbag and the
compressed distance in the sternum of the Dummy will be recorded in order to study and
analyse the test.

D3.1 Page 107 of 256 14/12/20
The base of the machine is made up of a rigid structure that allows the Dummy to be held by
the anchoring points of the neck and spine. The airbag can be installed comfortably over the
torso once it is fixed.
A 95th or 50th percentile dummy will be used depending on availability at the time of testing
(Figure 79).
Figure 79: Dummy subjection
Test procedures based on ideation including their advantages and disadvantages are specified
below in Table 11.
Test apparatus
Test apparatus This construction consists of an anvil which is fixed to a rigid beam and a mobile vertical striker.
Test procedure The striker will be released at a certain height to achieve a predetermined impact energy. During the impact the speed, the deceleration and the sternum compression will be recorded.
Advantages
• Airbag around the full torso
• Project budget can afford it
• Different impact conditions can be performed
• Impact height can be modified
• Impact mass can be modified
• Dummy base is free of movement to adjust to the correct
impact zone
Disadvantages • Flexibility in the beam(s) can cause inaccurate results
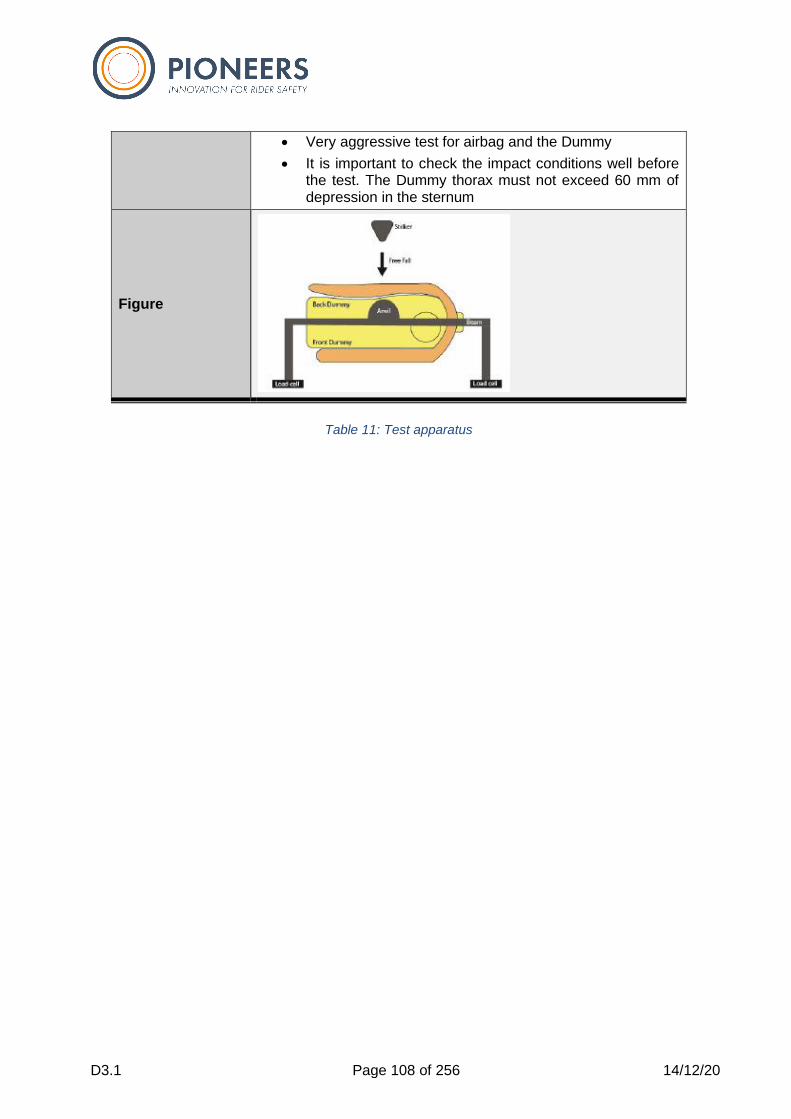
D3.1 Page 108 of 256 14/12/20
• Very aggressive test for airbag and the Dummy
• It is important to check the impact conditions well before the test. The Dummy thorax must not exceed 60 mm of depression in the sternum
Figure
Table 11: Test apparatus

D3.1 Page 109 of 256 14/12/20
3.3 Head protection test designs
Task 3.2 aims to improve the test method of head and neck protection systems of motorcycle
riders. The idea was to develop a test method for helmets and neck protection devices as a
combined approach. Due to differences regarding the state of the art of helmets, the market
penetration of neck protection devices and the need for a separate test for helmets, the authors
of this document decided to split the actions concerning helmet test method and neck
protection test method. This chapter describes the proposed test procedure for helmets. The
next chapter exposes new approaches for test methods dedicated to neck brace evaluation.
To ensure a basic protection the minimum requirements for helmets to be sold in Europe and
many other countries around the world are defined in standards and regulations. In Europe the
UNECE-R22 is used to describe overall requirements as well as specific test procedures to
approve helmets for motorcyclists. As UNECE-R22 [1] is a generally accepted standard and
mandatory across all European countries, in many other countries in south east Asia, in
Australia and New Zealand, it has an important influence on the market.
International regulations tend to take long periods of time to be updated. In addition, the
requirements in such regulations are often only the minimum level to ensure a basic protection.
Compared to the new findings in research as well as the development of the products and the
market, there is a need for an update of the current version 05 of UNECE-R22.
Beside the long update intervals and the limited progressiveness of international regulations
the general acceptance and the widespread use of UNECE-R22 are seen as key factors to
improve head protection on European roads. To maximize the impact of the PIONEERS
Project the update of the currently used UNECE-R22.05 is therefore seen as the most
practicable way. There is a great opportunity to contribute efficiently to the evolution of this
Regulation as discussions were under progress since 2017 within UN-ECE for a version 06 of
UNECE-R22. Proposals for changes include the test procedures as well as the assessment
criteria and tools based on up to date knowledge regarding motorcycle accidents, load cases
and injury mechanisms of head and brain.
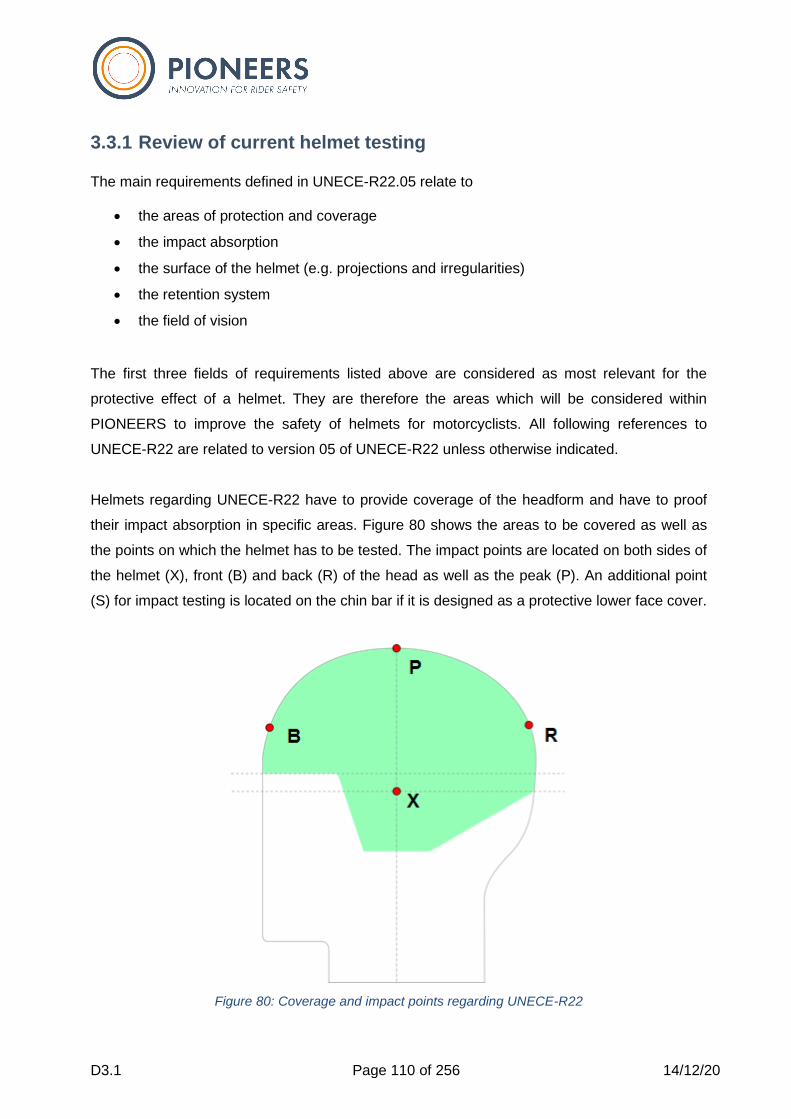
D3.1 Page 110 of 256 14/12/20
3.3.1 Review of current helmet testing
The main requirements defined in UNECE-R22.05 relate to
• the areas of protection and coverage
• the impact absorption
• the surface of the helmet (e.g. projections and irregularities)
• the retention system
• the field of vision
The first three fields of requirements listed above are considered as most relevant for the
protective effect of a helmet. They are therefore the areas which will be considered within
PIONEERS to improve the safety of helmets for motorcyclists. All following references to
UNECE-R22 are related to version 05 of UNECE-R22 unless otherwise indicated.
Helmets regarding UNECE-R22 have to provide coverage of the headform and have to proof
their impact absorption in specific areas. Figure 80 shows the areas to be covered as well as
the points on which the helmet has to be tested. The impact points are located on both sides of
the helmet (X), front (B) and back (R) of the head as well as the peak (P). An additional point
(S) for impact testing is located on the chin bar if it is designed as a protective lower face cover.
Figure 80: Coverage and impact points regarding UNECE-R22
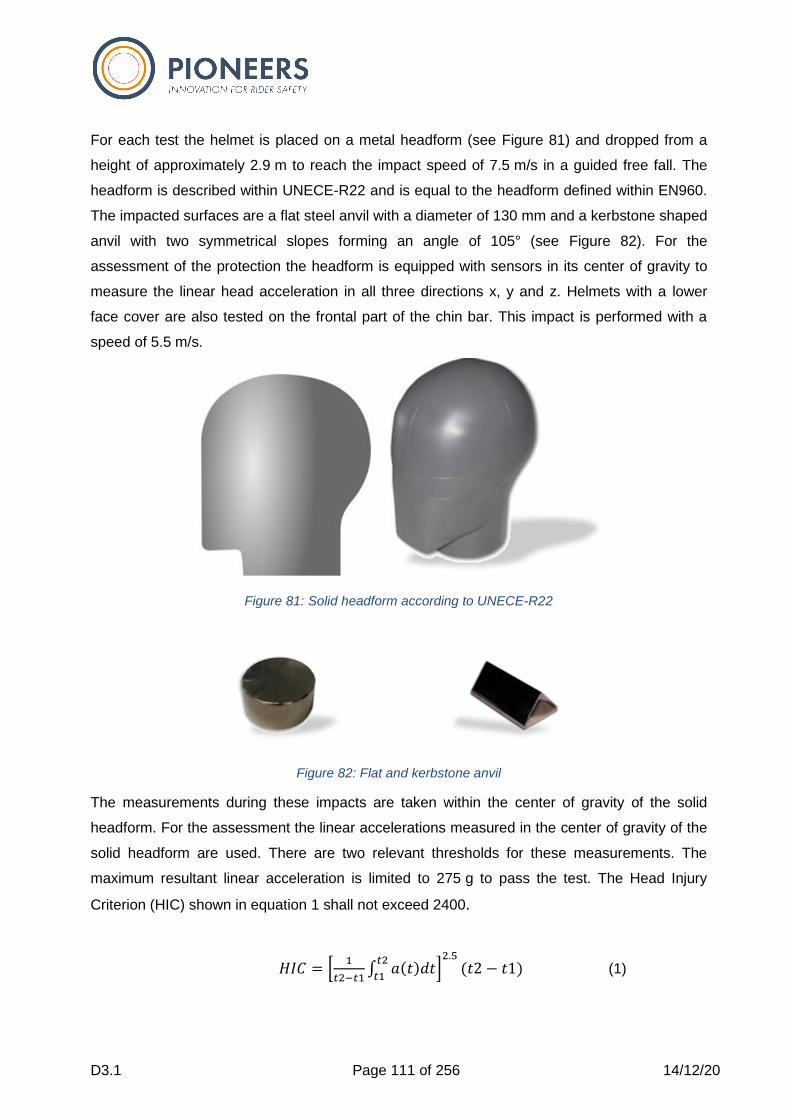
D3.1 Page 111 of 256 14/12/20
For each test the helmet is placed on a metal headform (see Figure 81) and dropped from a
height of approximately 2.9 m to reach the impact speed of 7.5 m/s in a guided free fall. The
headform is described within UNECE-R22 and is equal to the headform defined within EN960.
The impacted surfaces are a flat steel anvil with a diameter of 130 mm and a kerbstone shaped
anvil with two symmetrical slopes forming an angle of 105° (see Figure 82). For the
assessment of the protection the headform is equipped with sensors in its center of gravity to
measure the linear head acceleration in all three directions x, y and z. Helmets with a lower
face cover are also tested on the frontal part of the chin bar. This impact is performed with a
speed of 5.5 m/s.
Figure 81: Solid headform according to UNECE-R22
Figure 82: Flat and kerbstone anvil
The measurements during these impacts are taken within the center of gravity of the solid
headform. For the assessment the linear accelerations measured in the center of gravity of the
solid headform are used. There are two relevant thresholds for these measurements. The
maximum resultant linear acceleration is limited to 275 g to pass the test. The Head Injury
Criterion (HIC) shown in equation 1 shall not exceed 2400.
𝐻𝐼𝐶 = [1
𝑡2−𝑡1∫ 𝑎(𝑡)𝑑𝑡𝑡2
𝑡1]2.5
(𝑡2 − 𝑡1) (1)
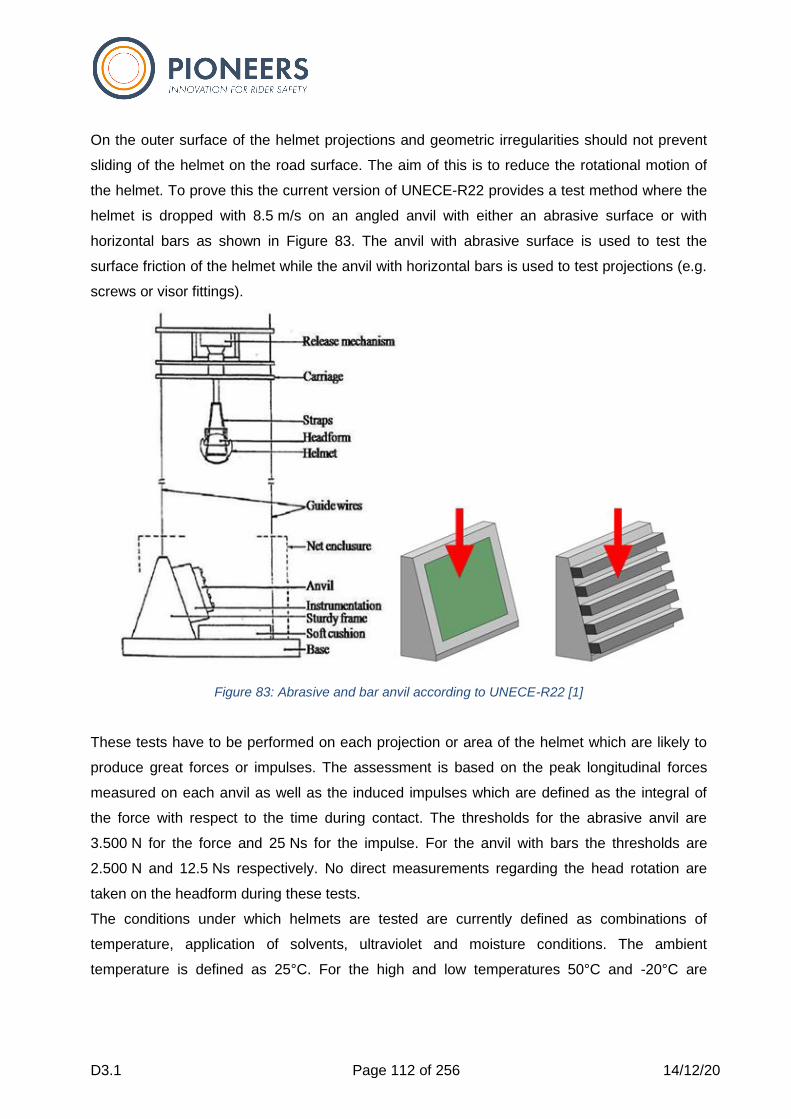
D3.1 Page 112 of 256 14/12/20
On the outer surface of the helmet projections and geometric irregularities should not prevent
sliding of the helmet on the road surface. The aim of this is to reduce the rotational motion of
the helmet. To prove this the current version of UNECE-R22 provides a test method where the
helmet is dropped with 8.5 m/s on an angled anvil with either an abrasive surface or with
horizontal bars as shown in Figure 83. The anvil with abrasive surface is used to test the
surface friction of the helmet while the anvil with horizontal bars is used to test projections (e.g.
screws or visor fittings).
Figure 83: Abrasive and bar anvil according to UNECE-R22 [1]
These tests have to be performed on each projection or area of the helmet which are likely to
produce great forces or impulses. The assessment is based on the peak longitudinal forces
measured on each anvil as well as the induced impulses which are defined as the integral of
the force with respect to the time during contact. The thresholds for the abrasive anvil are
3.500 N for the force and 25 Ns for the impulse. For the anvil with bars the thresholds are
2.500 N and 12.5 Ns respectively. No direct measurements regarding the head rotation are
taken on the headform during these tests.
The conditions under which helmets are tested are currently defined as combinations of
temperature, application of solvents, ultraviolet and moisture conditions. The ambient
temperature is defined as 25°C. For the high and low temperatures 50°C and -20°C are

D3.1 Page 113 of 256 14/12/20
defined respectively. For the simulation of aging processes one helmet shall be exposed to
ultraviolet irradiation as well as to spray water before the impact test.
3.3.2 Rationale for changes
The rational for changes is based on three key observations on which the scientific
communities agree largely and that must be considered in a near future:
• The head impact conditions in real world situation which are not just linear but also
oblique
• The headform and its instrumentation
• The fact that linear impacts are in fact not linear and dissipate energy also in rotational
motions
• The brain injury criteria under complex loading
These four aspects will be discussed in the present section and the foreseen progress within
CEN-WG11 as well as in FIM-FRHP and UNECE-R22.06 will be summarized before moving to
the description of the proposed test method.
3.3.2.1 Impact conditions
In this proposal the current test method for motorcycle helmets is adapted to real world impacts
and relevant characteristics of accidents. Moreover, recent results from head trauma
biomechanics considering advanced head injury criteria will be introduced. As it can be seen in
section 3.3.1 the assessments regarding the head kinematic only consider linear impacts and
linear accelerations. Either by using the maximum resultant linear acceleration directly or by
calculating the HIC which is based on the resultant linear acceleration. So, both, impact
conditions and injury criteria must be revisited to have a more realistic assessment. Real world
accidents of motorcyclists, show a more complex kinematic of the head/helmet as well as more
distributed impact locations on the helmet compared to the 5 specified impact points for the
test. According to D1.1 the distribution of helmet contact areas is much wider. Areas on the
side of the helmet, particularly on the chin bar, as well as the frontal areas on the visor of just
above it are most frequently impacted, but not included in the testing area. Even more
important is the fact that impact velocity is typically not perpendicular to the impacted surface
but presents a significant angle, leading to what is called an oblique impact.

D3.1 Page 114 of 256 14/12/20
The impact speeds used in Regulation UNECE-R22 range from 5.5 m/s for the test of the
protective lower face cover to 8.5 m/s for the test of projections and surface friction. The
mandatory tests for impact assessment onto the flat and kerbstone anvils are performed with
an impact speed of 7.5 m/s. Compared to the speed at which a motorcycle is typically used,
7.5 m/s or 27 km/h seems low. However, the normal component of impact speed of the helmet
to the ground depends on the falling height of the motorcyclists’ heads which is rarely higher
than 2 m on “high-side” falls. On the other hand, a direct impact of the helmeted head into an
opponent vehicle or obstacle can have higher impact speeds. To protect the motorcyclist in
direct impacts with higher speed as well as with lower speeds the tests should take different
impact speeds into account.
To protect the head of a motorcyclist in a real accident the use of pure linear impacts is not
sufficient. In a collision with another vehicle or when the helmet contacts the road surface the
loading of the head velocity vector is often oblique as shown by Bourdet et al. [16] This is due
to the fact that the rider normally does not fall perpendicular but with a relative speed parallel to
the ground. To simulate a more realistic impact the helmet must therefore also be tested with
an angled anvil as shown in Figure 84 to generate tangential impacts. The impact on such an
angled anvil induces rotational kinematics of the helmet and the headform.
Figure 84: Angled anvil to induce rotational kinematics
Beside the more realistic impact condition these rotational kinematics plays also an important
role in inflicting brain injuries. It is well known since Holbourn that rotational acceleration
applied to a gel such as the brain leads to high shearing stresses and strains. [17] This has
further been demonstrated in experimental approaches by Thibault et al. as well as via
numerical approaches by Deck et al 2007. [18] [19]
Regardless of widespread helmet use, brain injury is still a predominant cause of death and
long-term impairment in motorcycle accident. This could be mitigated by considering the
rotational motion of the head into account during helmet testing. A considerable amount of
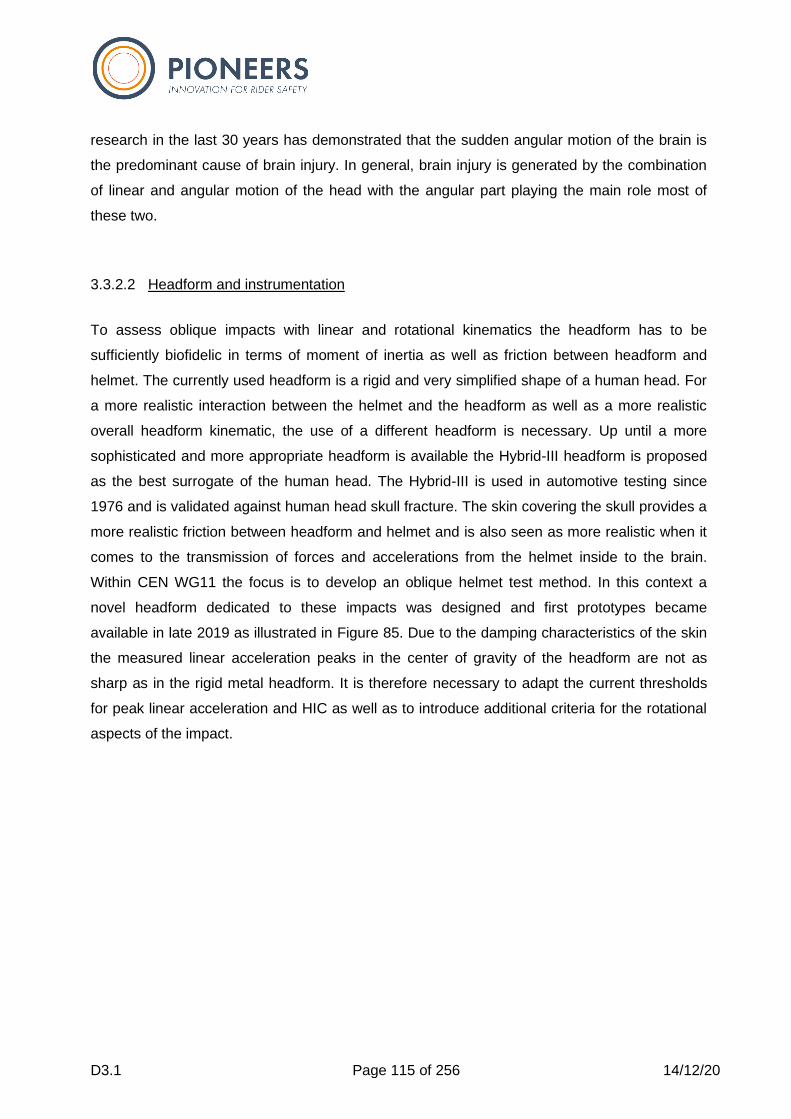
D3.1 Page 115 of 256 14/12/20
research in the last 30 years has demonstrated that the sudden angular motion of the brain is
the predominant cause of brain injury. In general, brain injury is generated by the combination
of linear and angular motion of the head with the angular part playing the main role most of
these two.
3.3.2.2 Headform and instrumentation
To assess oblique impacts with linear and rotational kinematics the headform has to be
sufficiently biofidelic in terms of moment of inertia as well as friction between headform and
helmet. The currently used headform is a rigid and very simplified shape of a human head. For
a more realistic interaction between the helmet and the headform as well as a more realistic
overall headform kinematic, the use of a different headform is necessary. Up until a more
sophisticated and more appropriate headform is available the Hybrid-III headform is proposed
as the best surrogate of the human head. The Hybrid-III is used in automotive testing since
1976 and is validated against human head skull fracture. The skin covering the skull provides a
more realistic friction between headform and helmet and is also seen as more realistic when it
comes to the transmission of forces and accelerations from the helmet inside to the brain.
Within CEN WG11 the focus is to develop an oblique helmet test method. In this context a
novel headform dedicated to these impacts was designed and first prototypes became
available in late 2019 as illustrated in Figure 85. Due to the damping characteristics of the skin
the measured linear acceleration peaks in the center of gravity of the headform are not as
sharp as in the rigid metal headform. It is therefore necessary to adapt the current thresholds
for peak linear acceleration and HIC as well as to introduce additional criteria for the rotational
aspects of the impact.
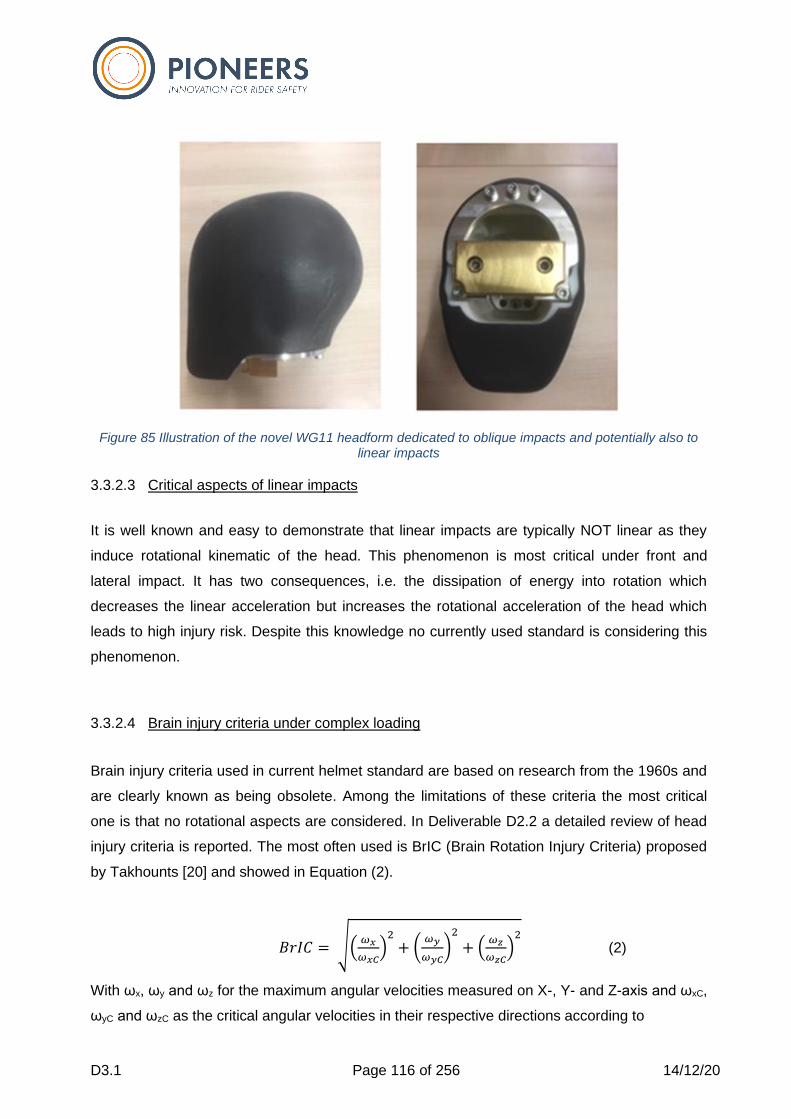
D3.1 Page 116 of 256 14/12/20
Figure 85 Illustration of the novel WG11 headform dedicated to oblique impacts and potentially also to linear impacts
3.3.2.3 Critical aspects of linear impacts
It is well known and easy to demonstrate that linear impacts are typically NOT linear as they
induce rotational kinematic of the head. This phenomenon is most critical under front and
lateral impact. It has two consequences, i.e. the dissipation of energy into rotation which
decreases the linear acceleration but increases the rotational acceleration of the head which
leads to high injury risk. Despite this knowledge no currently used standard is considering this
phenomenon.
3.3.2.4 Brain injury criteria under complex loading
Brain injury criteria used in current helmet standard are based on research from the 1960s and
are clearly known as being obsolete. Among the limitations of these criteria the most critical
one is that no rotational aspects are considered. In Deliverable D2.2 a detailed review of head
injury criteria is reported. The most often used is BrIC (Brain Rotation Injury Criteria) proposed
by Takhounts [20] and showed in Equation (2).
𝐵𝑟𝐼𝐶 = √(𝜔𝑥
𝜔𝑥𝐶)2
+ (𝜔𝑦
𝜔𝑦𝐶)2
+ (𝜔𝑧
𝜔𝑧𝐶)2
(2)
With ωx, ωy and ωz for the maximum angular velocities measured on X-, Y- and Z-axis and ωxC,
ωyC and ωzC as the critical angular velocities in their respective directions according to
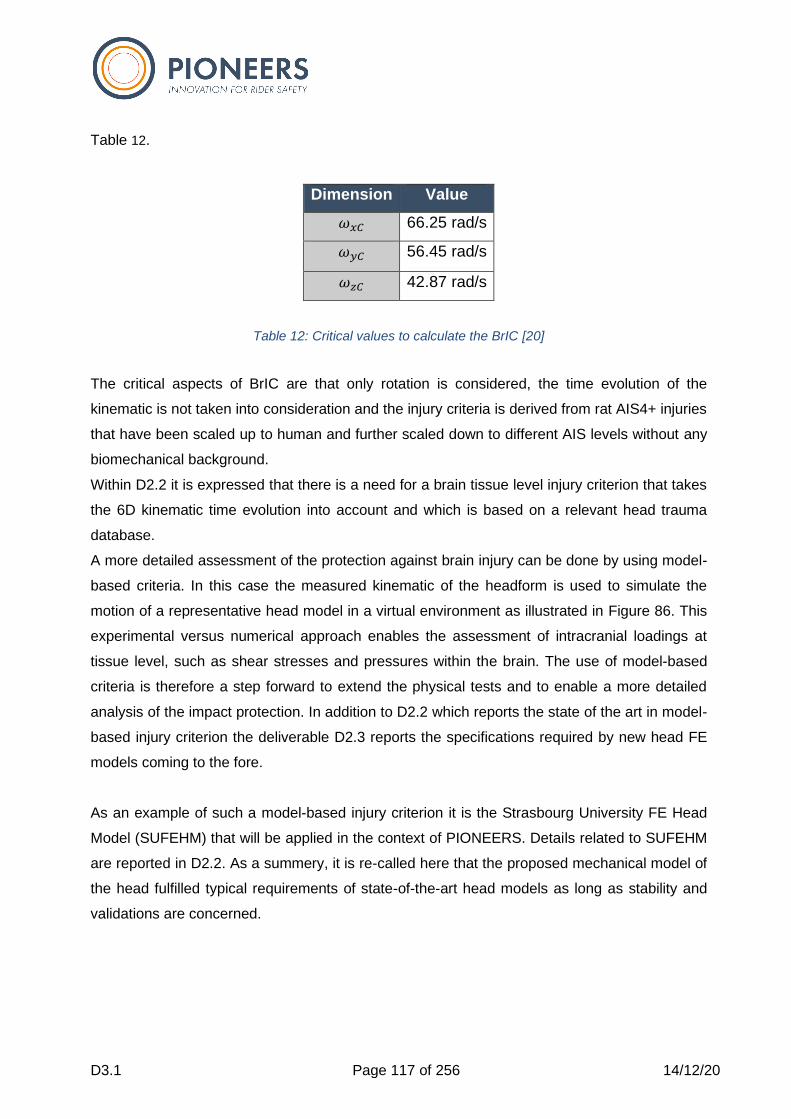
D3.1 Page 117 of 256 14/12/20
Table 12.
Dimension Value
𝜔𝑥𝐶 66.25 rad/s
𝜔𝑦𝐶 56.45 rad/s
𝜔𝑧𝐶 42.87 rad/s
Table 12: Critical values to calculate the BrIC [20]
The critical aspects of BrIC are that only rotation is considered, the time evolution of the
kinematic is not taken into consideration and the injury criteria is derived from rat AIS4+ injuries
that have been scaled up to human and further scaled down to different AIS levels without any
biomechanical background.
Within D2.2 it is expressed that there is a need for a brain tissue level injury criterion that takes
the 6D kinematic time evolution into account and which is based on a relevant head trauma
database.
A more detailed assessment of the protection against brain injury can be done by using model-
based criteria. In this case the measured kinematic of the headform is used to simulate the
motion of a representative head model in a virtual environment as illustrated in Figure 86. This
experimental versus numerical approach enables the assessment of intracranial loadings at
tissue level, such as shear stresses and pressures within the brain. The use of model-based
criteria is therefore a step forward to extend the physical tests and to enable a more detailed
analysis of the impact protection. In addition to D2.2 which reports the state of the art in model-
based injury criterion the deliverable D2.3 reports the specifications required by new head FE
models coming to the fore.
As an example of such a model-based injury criterion it is the Strasbourg University FE Head
Model (SUFEHM) that will be applied in the context of PIONEERS. Details related to SUFEHM
are reported in D2.2. As a summery, it is re-called here that the proposed mechanical model of
the head fulfilled typical requirements of state-of-the-art head models as long as stability and
validations are concerned.
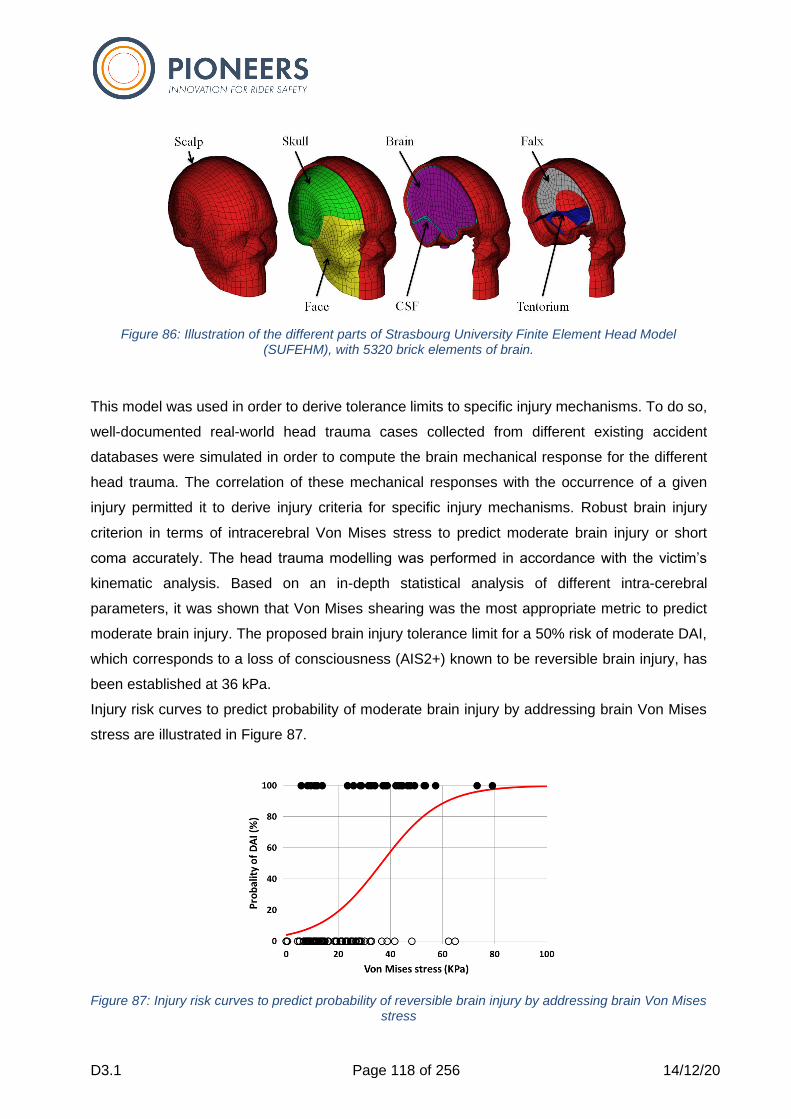
D3.1 Page 118 of 256 14/12/20
Figure 86: Illustration of the different parts of Strasbourg University Finite Element Head Model (SUFEHM), with 5320 brick elements of brain.
This model was used in order to derive tolerance limits to specific injury mechanisms. To do so,
well-documented real-world head trauma cases collected from different existing accident
databases were simulated in order to compute the brain mechanical response for the different
head trauma. The correlation of these mechanical responses with the occurrence of a given
injury permitted it to derive injury criteria for specific injury mechanisms. Robust brain injury
criterion in terms of intracerebral Von Mises stress to predict moderate brain injury or short
coma accurately. The head trauma modelling was performed in accordance with the victim’s
kinematic analysis. Based on an in-depth statistical analysis of different intra-cerebral
parameters, it was shown that Von Mises shearing was the most appropriate metric to predict
moderate brain injury. The proposed brain injury tolerance limit for a 50% risk of moderate DAI,
which corresponds to a loss of consciousness (AIS2+) known to be reversible brain injury, has
been established at 36 kPa.
Injury risk curves to predict probability of moderate brain injury by addressing brain Von Mises
stress are illustrated in Figure 87.
Figure 87: Injury risk curves to predict probability of reversible brain injury by addressing brain Von Mises stress
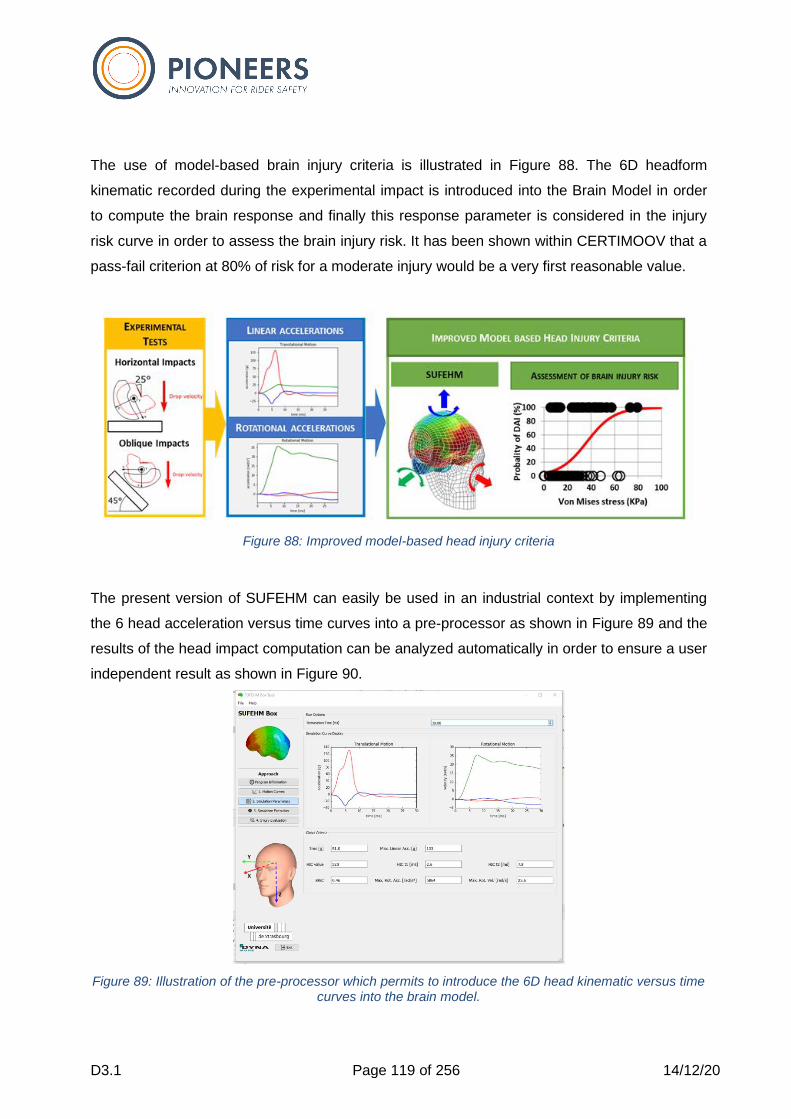
D3.1 Page 119 of 256 14/12/20
The use of model-based brain injury criteria is illustrated in Figure 88. The 6D headform
kinematic recorded during the experimental impact is introduced into the Brain Model in order
to compute the brain response and finally this response parameter is considered in the injury
risk curve in order to assess the brain injury risk. It has been shown within CERTIMOOV that a
pass-fail criterion at 80% of risk for a moderate injury would be a very first reasonable value.
Figure 88: Improved model-based head injury criteria
The present version of SUFEHM can easily be used in an industrial context by implementing
the 6 head acceleration versus time curves into a pre-processor as shown in Figure 89 and the
results of the head impact computation can be analyzed automatically in order to ensure a user
independent result as shown in Figure 90.
Figure 89: Illustration of the pre-processor which permits to introduce the 6D head kinematic versus time curves into the brain model.
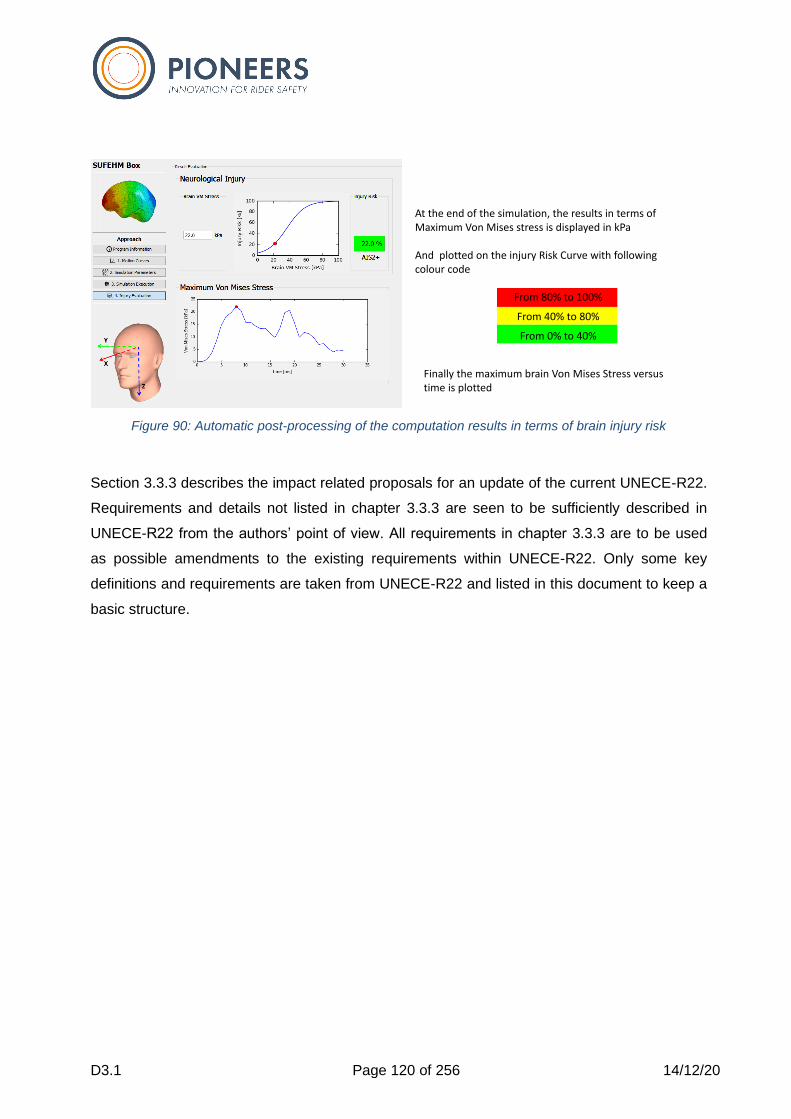
D3.1 Page 120 of 256 14/12/20
Figure 90: Automatic post-processing of the computation results in terms of brain injury risk
Section 3.3.3 describes the impact related proposals for an update of the current UNECE-R22.
Requirements and details not listed in chapter 3.3.3 are seen to be sufficiently described in
UNECE-R22 from the authors’ point of view. All requirements in chapter 3.3.3 are to be used
as possible amendments to the existing requirements within UNECE-R22. Only some key
definitions and requirements are taken from UNECE-R22 and listed in this document to keep a
basic structure.
At the end of the simulation, the results in terms of Maximum Von Mises stress is displayed in kPa
And plotted on the injury Risk Curve with following colour code
From 0% to 40%
From 40% to 80%
From 80% to 100%
Finally the maximum brain Von Mises Stress versus time is plotted
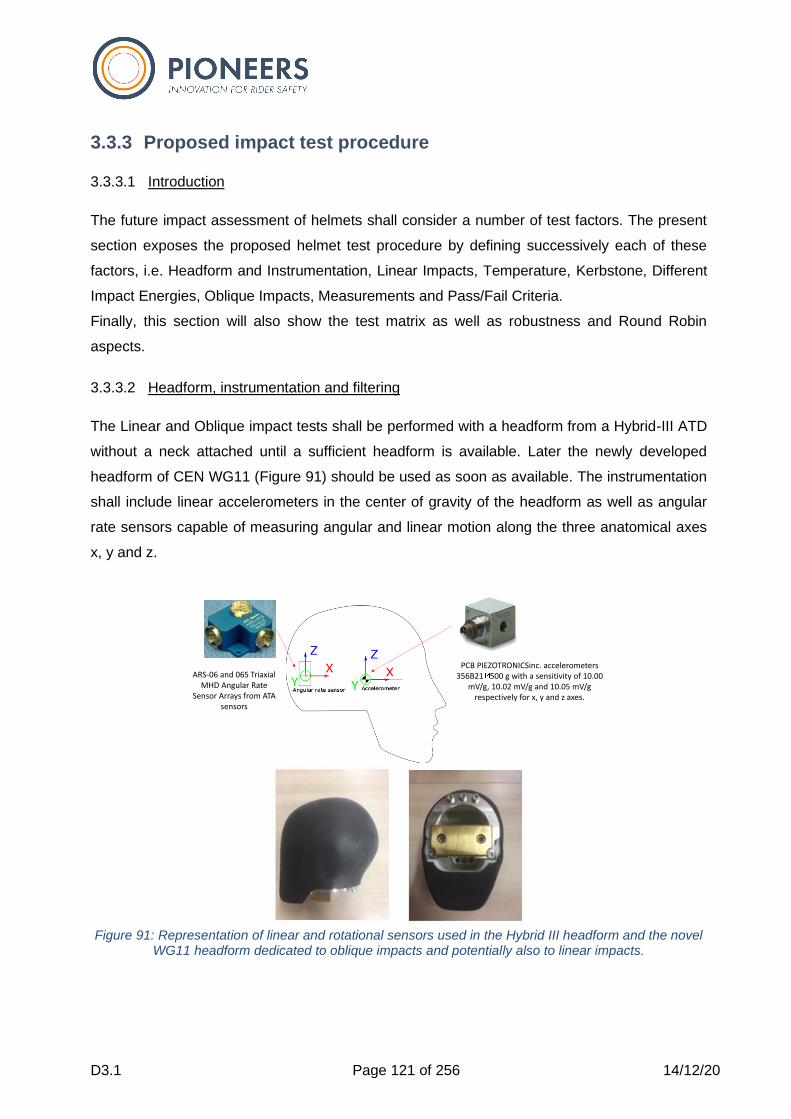
D3.1 Page 121 of 256 14/12/20
3.3.3 Proposed impact test procedure
3.3.3.1 Introduction
The future impact assessment of helmets shall consider a number of test factors. The present
section exposes the proposed helmet test procedure by defining successively each of these
factors, i.e. Headform and Instrumentation, Linear Impacts, Temperature, Kerbstone, Different
Impact Energies, Oblique Impacts, Measurements and Pass/Fail Criteria.
Finally, this section will also show the test matrix as well as robustness and Round Robin
aspects.
3.3.3.2 Headform, instrumentation and filtering
The Linear and Oblique impact tests shall be performed with a headform from a Hybrid-III ATD
without a neck attached until a sufficient headform is available. Later the newly developed
headform of CEN WG11 (Figure 91) should be used as soon as available. The instrumentation
shall include linear accelerometers in the center of gravity of the headform as well as angular
rate sensors capable of measuring angular and linear motion along the three anatomical axes
x, y and z.
Figure 91: Representation of linear and rotational sensors used in the Hybrid III headform and the novel
WG11 headform dedicated to oblique impacts and potentially also to linear impacts.
ARS-06 and 06S Triaxial MHD Angular Rate
Sensor Arrays from ATA sensors
PCB PIEZOTRONICSinc. accelerometers356B21 500 g with a sensitivity of 10.00
mV/g, 10.02 mV/g and 10.05 mV/g respectively for x, y and z axes.
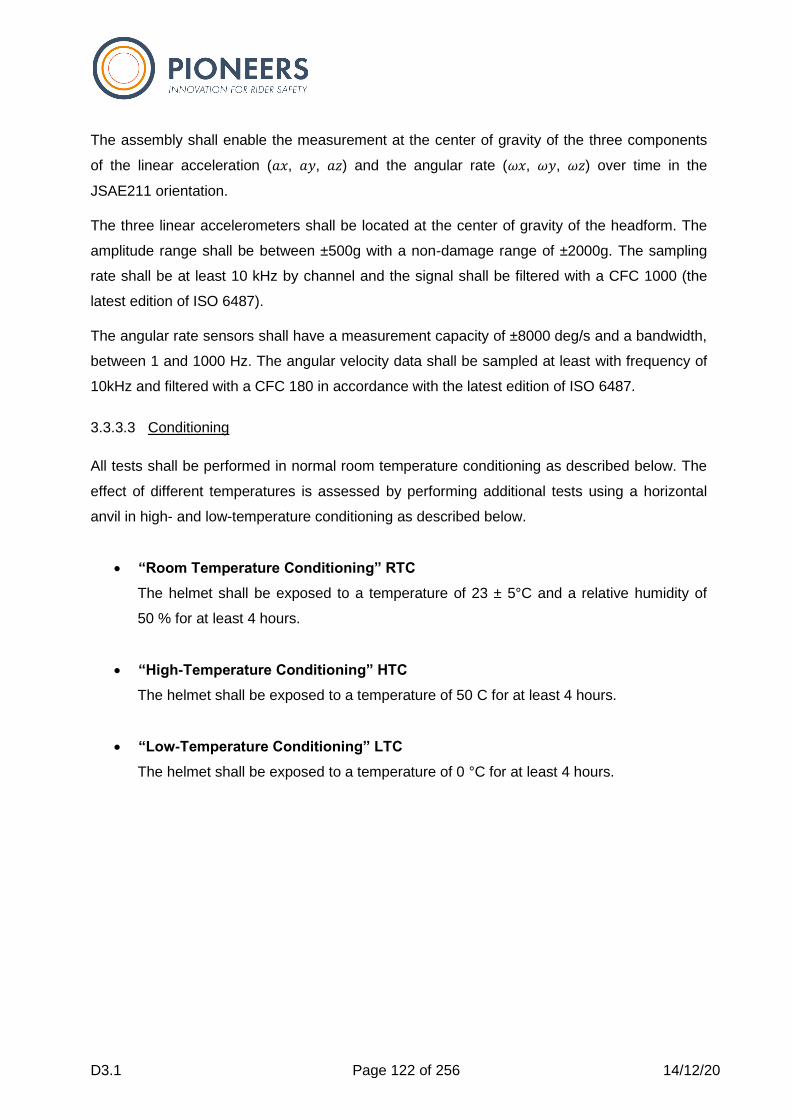
D3.1 Page 122 of 256 14/12/20
The assembly shall enable the measurement at the center of gravity of the three components
of the linear acceleration (𝑎𝑥, 𝑎𝑦, 𝑎𝑧) and the angular rate (𝜔𝑥, 𝜔𝑦, 𝜔𝑧) over time in the
JSAE211 orientation.
The three linear accelerometers shall be located at the center of gravity of the headform. The
amplitude range shall be between ±500g with a non-damage range of ±2000g. The sampling
rate shall be at least 10 kHz by channel and the signal shall be filtered with a CFC 1000 (the
latest edition of ISO 6487).
The angular rate sensors shall have a measurement capacity of ±8000 deg/s and a bandwidth,
between 1 and 1000 Hz. The angular velocity data shall be sampled at least with frequency of
10kHz and filtered with a CFC 180 in accordance with the latest edition of ISO 6487.
3.3.3.3 Conditioning
All tests shall be performed in normal room temperature conditioning as described below. The
effect of different temperatures is assessed by performing additional tests using a horizontal
anvil in high- and low-temperature conditioning as described below.
• “Room Temperature Conditioning” RTC
The helmet shall be exposed to a temperature of 23 ± 5°C and a relative humidity of
50 % for at least 4 hours.
• “High-Temperature Conditioning” HTC
The helmet shall be exposed to a temperature of 50 C for at least 4 hours.
• “Low-Temperature Conditioning” LTC
The helmet shall be exposed to a temperature of 0 °C for at least 4 hours.
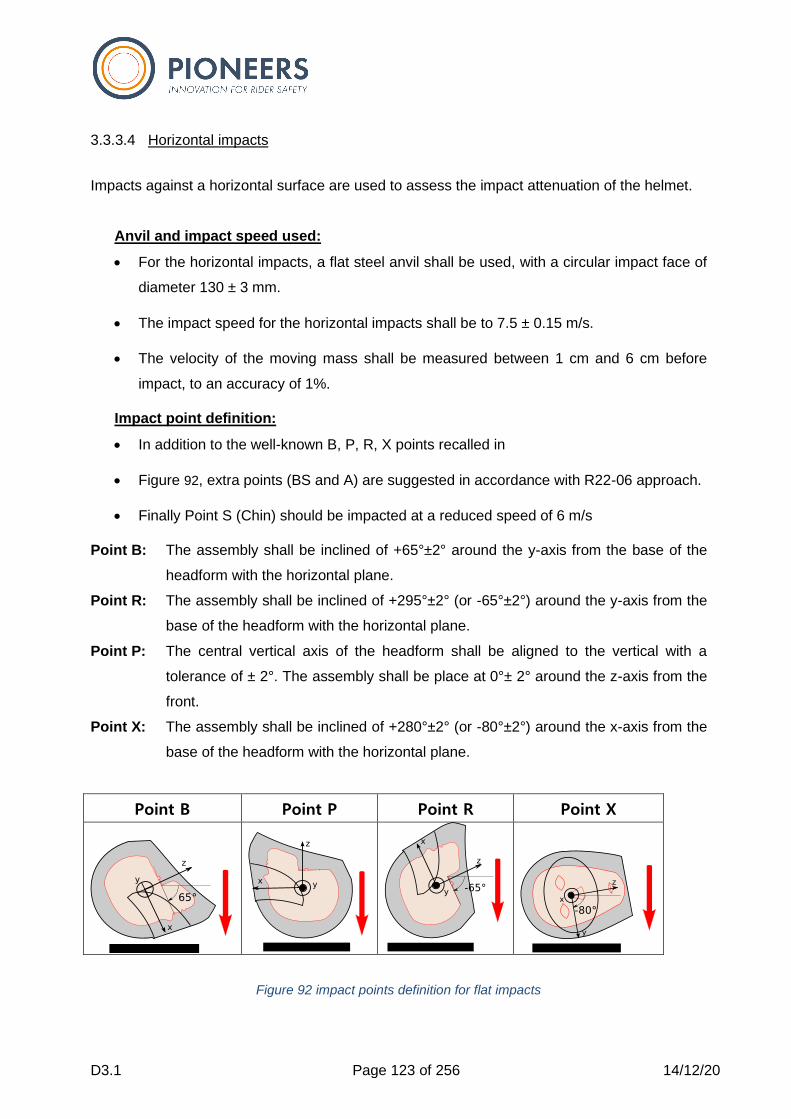
D3.1 Page 123 of 256 14/12/20
3.3.3.4 Horizontal impacts
Impacts against a horizontal surface are used to assess the impact attenuation of the helmet.
Anvil and impact speed used:
• For the horizontal impacts, a flat steel anvil shall be used, with a circular impact face of
diameter 130 ± 3 mm.
• The impact speed for the horizontal impacts shall be to 7.5 ± 0.15 m/s.
• The velocity of the moving mass shall be measured between 1 cm and 6 cm before
impact, to an accuracy of 1%.
Impact point definition:
• In addition to the well-known B, P, R, X points recalled in
• Figure 92, extra points (BS and A) are suggested in accordance with R22-06 approach.
• Finally Point S (Chin) should be impacted at a reduced speed of 6 m/s
Point B: The assembly shall be inclined of +65°±2° around the y-axis from the base of the
headform with the horizontal plane.
Point R: The assembly shall be inclined of +295°±2° (or -65°±2°) around the y-axis from the
base of the headform with the horizontal plane.
Point P: The central vertical axis of the headform shall be aligned to the vertical with a
tolerance of ± 2°. The assembly shall be place at 0°± 2° around the z-axis from the
front.
Point X: The assembly shall be inclined of +280°±2° (or -80°±2°) around the x-axis from the
base of the headform with the horizontal plane.
Point B Point P Point R Point X
Figure 92 impact points definition for flat impacts
D3.1 Page 124 of 256 14/12/20
Point S: Point in the lower face cover area, situated within an area bounded by a sector
of 20° divided symmetrically by the vertical longitudinal plane of symmetry of the
helmet.
Point BS: For full face helmet, anywhere on the frontal area (defined as the area included
in ±45° angle with the longitudinal direction) on the visor, side of chin bar and
frontal shell rim.
Point A: Point on the helmet shell within the coverage area defined in section 6.4.1 of
UNECE-R22 under consideration of ventilation holes, attachment points or other
features with a likelihood of unfavorable test results.
3.3.3.5 Kerbstone impacts
Impacts against a kerbstone shaped anvil are used to assess the helmet’s resistance against
and impact attenuation under concentrated loading.
The kerbstone anvil consists of two sides forming and angle of 105°, each of them with a slope
of 52.5° towards the vertical and meeting along the striking edge with a radius of 15 mm. The
height must be at least 50 mm and the length at least 125 mm.
• The impact points tested are B, P, R, X impact points.
• The impact against a kerbstone shaped anvil should be conducted under cold, room
and hot conditions (RTC, HTC, LTC)
• The impacts will be conducted at an initial speed of 7.5 m/s
3.3.3.6 Tests at different energies
In order to assess the helmet performance for different energy levels, B, P, R, X impacts
against horizontal anvil are suggested at RTC temperature, at a low velocity of 5.5 m/s and at a
high velocity of 8.2 m/s.
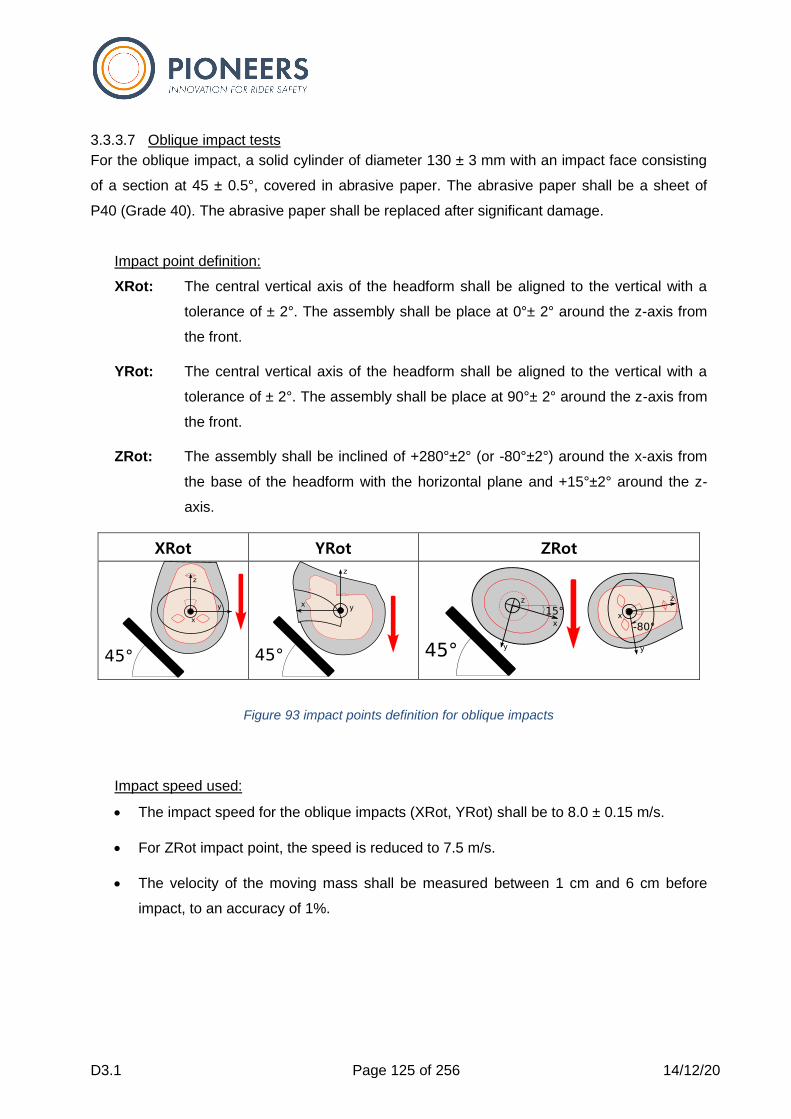
D3.1 Page 125 of 256 14/12/20
3.3.3.7 Oblique impact tests
For the oblique impact, a solid cylinder of diameter 130 ± 3 mm with an impact face consisting
of a section at 45 ± 0.5°, covered in abrasive paper. The abrasive paper shall be a sheet of
P40 (Grade 40). The abrasive paper shall be replaced after significant damage.
Impact point definition:
XRot: The central vertical axis of the headform shall be aligned to the vertical with a
tolerance of ± 2°. The assembly shall be place at 0°± 2° around the z-axis from
the front.
YRot: The central vertical axis of the headform shall be aligned to the vertical with a
tolerance of ± 2°. The assembly shall be place at 90°± 2° around the z-axis from
the front.
ZRot: The assembly shall be inclined of +280°±2° (or -80°±2°) around the x-axis from
the base of the headform with the horizontal plane and +15°±2° around the z-
axis.
XRot YRot ZRot
Figure 93 impact points definition for oblique impacts
Impact speed used:
• The impact speed for the oblique impacts (XRot, YRot) shall be to 8.0 ± 0.15 m/s.
• For ZRot impact point, the speed is reduced to 7.5 m/s.
• The velocity of the moving mass shall be measured between 1 cm and 6 cm before
impact, to an accuracy of 1%.
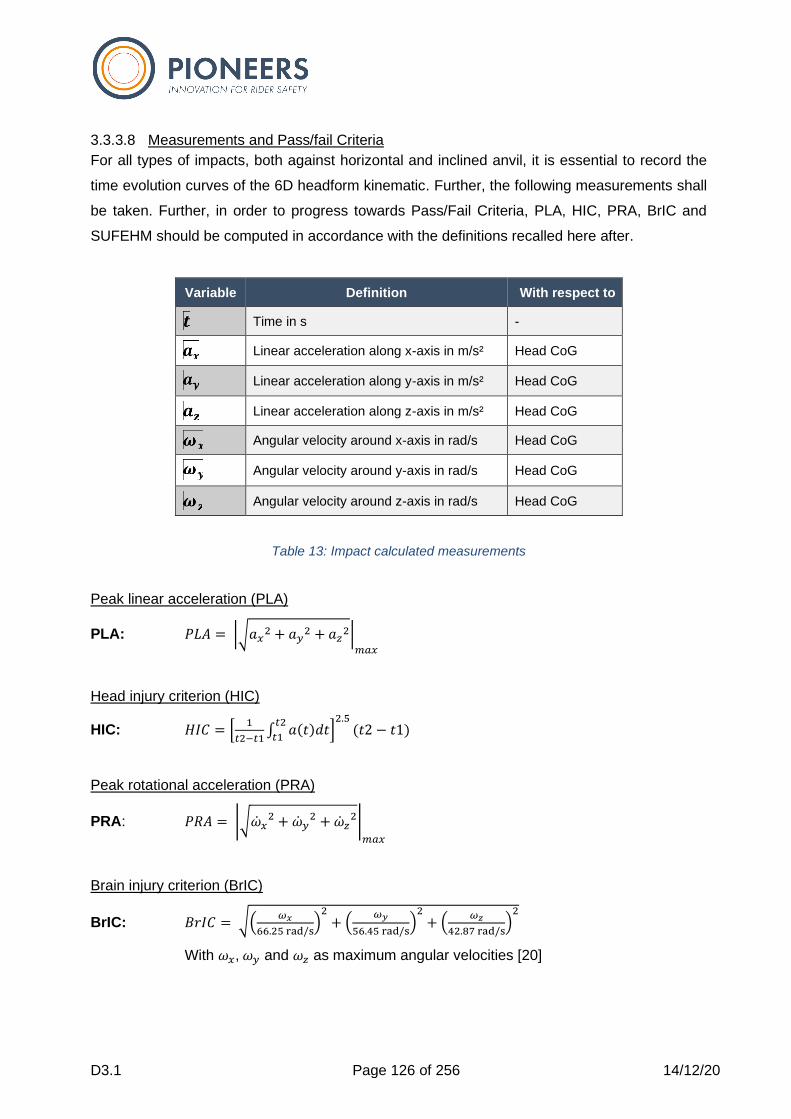
D3.1 Page 126 of 256 14/12/20
3.3.3.8 Measurements and Pass/fail Criteria
For all types of impacts, both against horizontal and inclined anvil, it is essential to record the
time evolution curves of the 6D headform kinematic. Further, the following measurements shall
be taken. Further, in order to progress towards Pass/Fail Criteria, PLA, HIC, PRA, BrIC and
SUFEHM should be computed in accordance with the definitions recalled here after.
Variable Definition With respect to
Time in s -
Linear acceleration along x-axis in m/s² Head CoG
Linear acceleration along y-axis in m/s² Head CoG
Linear acceleration along z-axis in m/s² Head CoG
Angular velocity around x-axis in rad/s Head CoG
Angular velocity around y-axis in rad/s Head CoG
Angular velocity around z-axis in rad/s Head CoG
Table 13: Impact calculated measurements
Peak linear acceleration (PLA)
PLA: 𝑃𝐿𝐴 = |√𝑎𝑥2 + 𝑎𝑦
2 + 𝑎𝑧2|
𝑚𝑎𝑥
Head injury criterion (HIC)
HIC: 𝐻𝐼𝐶 = [1
𝑡2−𝑡1∫ 𝑎(𝑡)𝑑𝑡𝑡2
𝑡1]2.5
(𝑡2 − 𝑡1)
Peak rotational acceleration (PRA)
PRA: 𝑃𝑅𝐴 = |√�̇�𝑥2 + �̇�𝑦
2 + �̇�𝑧2|
𝑚𝑎𝑥
Brain injury criterion (BrIC)
BrIC: 𝐵𝑟𝐼𝐶 = √(𝜔𝑥
66.25 rad/s)2+ (
𝜔𝑦
56.45 rad/s)2+ (
𝜔𝑧
42.87 rad/s)2
With 𝜔𝑥, 𝜔𝑦 and 𝜔𝑧 as maximum angular velocities [20]
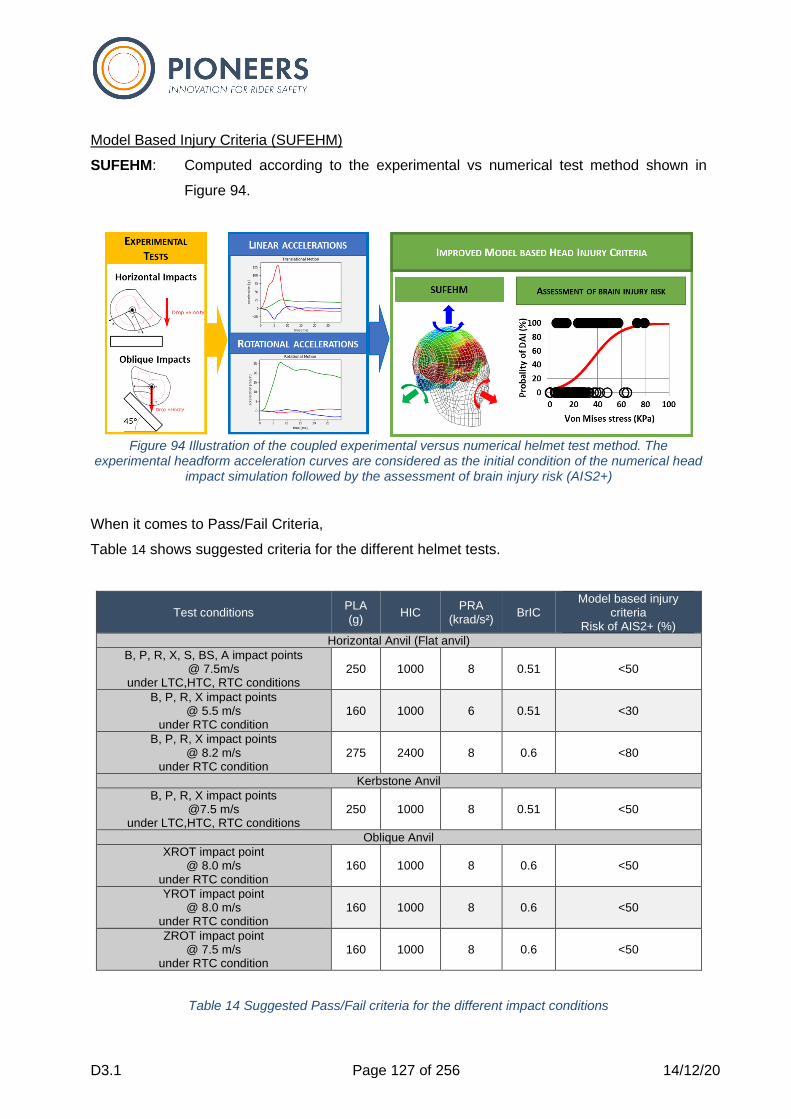
D3.1 Page 127 of 256 14/12/20
Model Based Injury Criteria (SUFEHM)
SUFEHM: Computed according to the experimental vs numerical test method shown in
Figure 94.
Figure 94 Illustration of the coupled experimental versus numerical helmet test method. The
experimental headform acceleration curves are considered as the initial condition of the numerical head impact simulation followed by the assessment of brain injury risk (AIS2+)
When it comes to Pass/Fail Criteria,
Table 14 shows suggested criteria for the different helmet tests.
Test conditions PLA (g)
HIC PRA
(krad/s²) BrIC
Model based injury criteria
Risk of AIS2+ (%)
Horizontal Anvil (Flat anvil)
B, P, R, X, S, BS, A impact points @ 7.5m/s
under LTC,HTC, RTC conditions 250 1000 8 0.51 <50
B, P, R, X impact points @ 5.5 m/s
under RTC condition 160 1000 6 0.51 <30
B, P, R, X impact points @ 8.2 m/s
under RTC condition 275 2400 8 0.6 <80
Kerbstone Anvil
B, P, R, X impact points @7.5 m/s
under LTC,HTC, RTC conditions 250 1000 8 0.51 <50
Oblique Anvil
XROT impact point @ 8.0 m/s
under RTC condition 160 1000 8 0.6 <50
YROT impact point @ 8.0 m/s
under RTC condition 160 1000 8 0.6 <50
ZROT impact point @ 7.5 m/s
under RTC condition 160 1000 8 0.6 <50
Table 14 Suggested Pass/Fail criteria for the different impact conditions

D3.1 Page 128 of 256 14/12/20
3.3.3.9 Number of helmets and test matrix
To test one type of a helmet the individual samples shall be conditioned and tested as it is
listed in the Table 15. Each row of the table describes one impact test in different conditions.
12 helmets shall be used and marked with individual test numbers from 1 to 12. A total of 44
impacts shall be conducted in accordance with the test matrix (Table 15).
Test number
Helmet number
Order Conditioning Speed Anvil Impact point
1 1 1 RTC 7.5 m/s Horizontal. Flat B
2 1 2 RTC 7.5 m/s Horizontal. Flat X
3 1 3 RTC 7.5 m/s Horizontal. Flat P
4 1 4 RTC 7.5 m/s Horizontal. Flat R
5 1 5 RTC 7.5 m/s Horizontal. Flat S
6 2 1 RTC 7.5 m/s Horizontal. Flat BS
7 2 2 RTC 7.5 m/s Horizontal. Flat A
8 3 1 LTC 7.5 m/s Horizontal. Flat B
9 3 2 LTC 7.5 m/s Horizontal. Flat X
10 3 3 LTC 7.5 m/s Horizontal. Flat P
11 3 4 LTC 7.5 m/s Horizontal. Flat R
12 3 5 LTC 7.5 m/s Horizontal. Flat S
13 4 1 LTC 7.5 m/s Horizontal. Flat BS
14 4 2 LTC 7.5 m/s Horizontal. Flat A
15 5 1 HTC 7.5 m/s Horizontal. Flat B
16 5 2 HTC 7.5 m/s Horizontal. Flat X
17 5 3 HTC 7.5 m/s Horizontal. Flat P
18 5 4 HTC 7.5 m/s Horizontal. Flat R
19 5 5 HTC 7.5 m/s Horizontal. Flat S
20 6 1 HTC 7.5 m/s Horizontal. Flat BS
21 6 2 HTC 7.5 m/s Horizontal. Flat A
22 7 1 RTC 5.5 m/s Horizontal. Flat B
23 7 2 RTC 5.5 m/s Horizontal. Flat X
24 7 3 RTC 5.5 m/s Horizontal. Flat P
25 7 4 RTC 5.5 m/s Horizontal. Flat R
26 8 1 RTC 8.2 m/s Horizontal. Flat B
27 8 2 RTC 8.2 m/s Horizontal. Flat X
28 8 3 RTC 8.2 m/s Horizontal. Flat P
29 8 4 RTC 8.2 m/s Horizontal. Flat R
30 9 1 RTC 7.5 m/s Horizontal Kerbstone B
31 9 2 RTC 7.5 m/s Horizontal Kerbstone X
32 9 3 RTC 7.5 m/s Horizontal Kerbstone P
33 9 4 RTC 7.5 m/s Horizontal Kerbstone R
34 10 1 LTC 7.5 m/s Horizontal Kerbstone B
35 10 2 LTC 7.5 m/s Horizontal Kerbstone X
36 10 3 LTC 7.5 m/s Horizontal Kerbstone P
37 10 4 LTC 7.5 m/s Horizontal Kerbstone R
38 11 1 HTC 7.5 m/s Horizontal Kerbstone B
39 11 2 HTC 7.5 m/s Horizontal Kerbstone X
40 11 3 HTC 7.5 m/s Horizontal Kerbstone P
41 11 4 HTC 7.5 m/s Horizontal Kerbstone R
42 12 1 RTC 8.0 m/s Oblique Flat Rot Y
43 12 2 RTC 8.0 m/s Oblique Flat Rot X
44 12 3 RTC 8.0 m/s Oblique Flat Rot Z
Table 15: Test matrix

D3.1 Page 129 of 256 14/12/20
3.4 Neck protection test designs
Due to different levels of implementation, legal relevance and usage, the test methods for
helmets and for neck braces were separated. This chapter describes first approaches towards
a neck brace test method to be used in standardization and comparison of different neck
braces. It must be stated that no regulation is currently in use in Europe, while more and more
products are offered in the market. On the other side, advances have been made in impact
biomechanics and new experimental as well as numerical tools are made available. Within
PIONEERS it is therefore suggested to develop a neck brace test method and to present it to
standardization organizations as a first draft towards a general test method for neck braces.
The focus within PIONEERS will be the geometry of neck braces and helmets as a
conventional neck brace provides protection against excessive head motion in interaction with
the helmet. This analysis of geometry is based on the fact that the number of possible
combinations of helmets and neck braces is huge and that a physical test can therefore not
consider all combinations. The geometrical approach is the first step to identify reasonable
combinations of helmets and neck braces in order to reduce the potential number of tests to
manageable amounts.
The assessment of neck injury reduction due to the use of neck braces is a complex topic. The
interaction between helmet and neck braces, the omnidirectional loading conditions in PTW
accidents as well as the complex structure of the cervical spine require much work in different
fields. Although there are proposed and used methods in literature and internal research
activities to assess the performance of neck braces, the used methods do not consider the
effect of helmet-brace-combinations in terms of geometry. Section 3.4 describes the idea of a
neck brace, the existing test methods, the approach of a geometrical assessment as well as an
outlook on necessary steps towards standardization. It also includes a description of model-
based neck injury criteria in order to provide input for future developments in neck brace
assessment procedures.
3.4.1 Introduction
The focus of this section is the development of a geometrical test procedure in order to assess
the fitment of different helmets and neck braces. In general, a neck brace can be used to limit
the head motion relative to the rider’s torso in order to prevent excessive motion. Excessive
motion in this case is the motion of the head to a greater extent than the physiological Range of

D3.1 Page 130 of 256 14/12/20
Motion (ROM). The ROM of the head neck system can be described as the ability to move the
head in flexion, extension, lateral flexion and rotation as shown in Figure 95.
Figure 95 Neutral, flexed, extended, laterally flexed and rotated head position [21]
The ROM is a physiological characteristic which is influenced by different individual factors
such as age or gender. It can be divided into the active and passive ROM from which the active
ROM describes the possible head positions and orientations reached due to voluntary muscle
actions. The limitation of the active ROM is the strength of muscles and ligaments as well as
the discomfort when trying to move the head into extreme positions. When the motion is not
only based on internal muscle action but on external forces acting on head, neck or torso, the
passive ROM is relevant. The passive ROM is restricted by physiological limitations such as
the strength and length of ligaments or possible range of individual joints.
In accidents the impact conditions of riders impacting an obstacle can lead to external forces
exceeding the physiological strength of the neck. As a result, the passive ROM can be
exceeded which leads to injurious loading mechanisms of the cervical spine.
Conventional neck braces try to provide an external limitation of head movement relative to the
torso in order to prevent the head-neck-system from exceeding its passive ROM. The
protective effect is the stabilization of the head and the transmission of acting forces from the
head-neck-system towards more robust structures of the body such as the shoulder and back
areas. By spreading the load over a wider area, a local overloading of the neck can be
mitigated or prevented. To achieve this the neck brace provides a supporting surface for the
helmet edge to contact with. In an accident the head can move within its normal ROM but
impacts the neck brace before the passive ROM is exceeded. The contact between helmet and
neck brace enables a load transfer from the helmet over the neck brace to the shoulders and
therefore helps to bypass the neck. Therefore, a first step in the development of a neck brace
test method is to focus on a static test that considers the physiological range of motion of the
helmeted head when wearing a neck brace. For the actual assessment of neck brace
performance, more work has to be done beyond the PIONEERS project. To provide input to
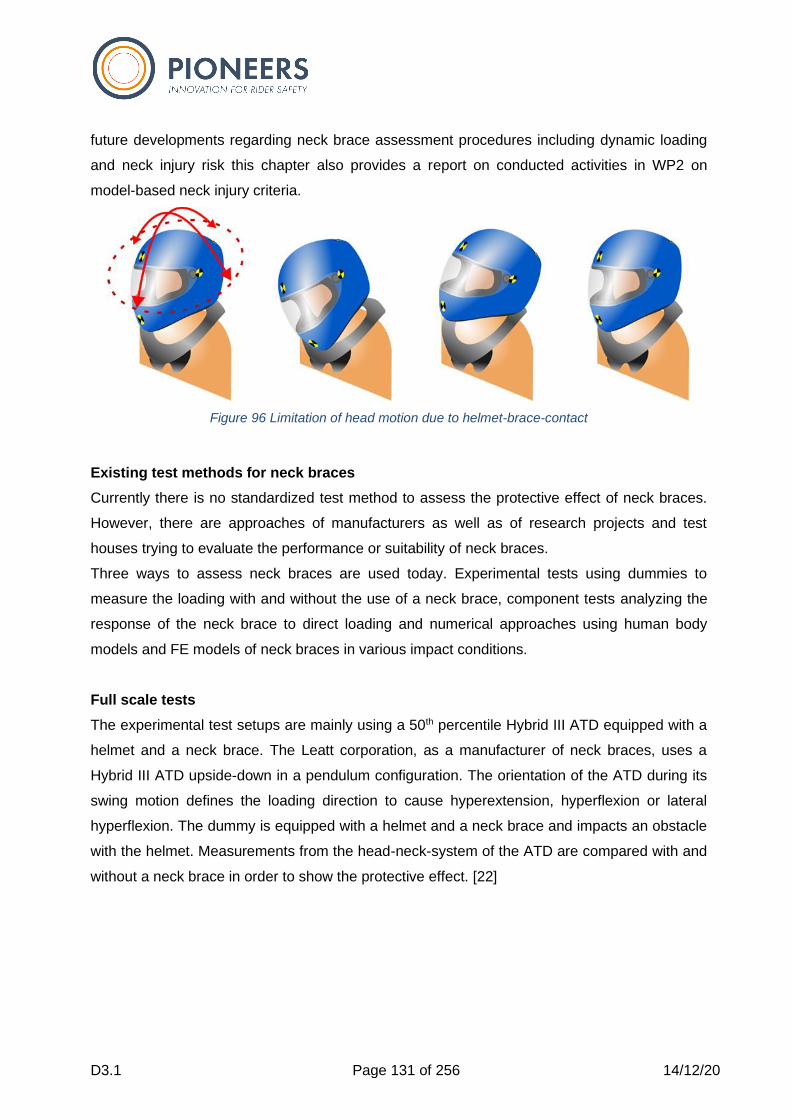
D3.1 Page 131 of 256 14/12/20
future developments regarding neck brace assessment procedures including dynamic loading
and neck injury risk this chapter also provides a report on conducted activities in WP2 on
model-based neck injury criteria.
Figure 96 Limitation of head motion due to helmet-brace-contact
Existing test methods for neck braces
Currently there is no standardized test method to assess the protective effect of neck braces.
However, there are approaches of manufacturers as well as of research projects and test
houses trying to evaluate the performance or suitability of neck braces.
Three ways to assess neck braces are used today. Experimental tests using dummies to
measure the loading with and without the use of a neck brace, component tests analyzing the
response of the neck brace to direct loading and numerical approaches using human body
models and FE models of neck braces in various impact conditions.
Full scale tests
The experimental test setups are mainly using a 50th percentile Hybrid III ATD equipped with a
helmet and a neck brace. The Leatt corporation, as a manufacturer of neck braces, uses a
Hybrid III ATD upside-down in a pendulum configuration. The orientation of the ATD during its
swing motion defines the loading direction to cause hyperextension, hyperflexion or lateral
hyperflexion. The dummy is equipped with a helmet and a neck brace and impacts an obstacle
with the helmet. Measurements from the head-neck-system of the ATD are compared with and
without a neck brace in order to show the protective effect. [22]

D3.1 Page 132 of 256 14/12/20
Figure 97 ATD pendulum used by Leatt in physical and numerical environment [22]
Another form of ATD-pendulum is used by Atlas. [23] Instead of upside-down the orientation of
the 50th percentile Hybrid III ATD is horizontal as flying in a “Superman position”. This
orientation enables both, deflective and compressive loading of the head-neck-system. By
rotating the ATD around it’s z-axis (face down- up- or sideways), the direction of deflective
loading can be changed from extension to flexion or lateral flexion. The ATD is also equipped
with an MATD neck as well as with a, not further described, customized torso. The customized
torso is used to change the neck brace position relative to the head. According to Atlas the
position of the neck brace was seen too low with the normal ATD torso. With the customized
torso, a more realistic position of the neck brace could be achieved.
Developed in the European project MOSAFIM [24] two test setups based on dummies were
proposed. The first test setup of MOSAFIM describes neck loading of a 50th Hybrid III ATD due
to an impactor impacting the helmet of the seated dummy. The 130 mm circular impactor
impacts the helmet with a speed of 7,5 m/s in frontal, side and rear area of the helmet. The
impact locations are based on the locations defined in UNECE-R22. Another test setup
proposed in MOSAFIM is based on the calibration test of the BioRID ATD. This test is based
on an accelerated sled with a BioRID torso including the head-neck-system mounted on top.
The accelerating sled leads to an extension motion of the ATD due to inertia. Instead of
4.75 m/s as defined in the calibration test protocol of the BioRID ATD the sled is impacted by a
33.5 kg impactor at 6 m/s.
D3.1 Page 133 of 256 14/12/20
All beforementioned test methods using ATDs are considering measured loads of the head-
neck-systems of the ATDs. Comparisons are mainly based on directly measured forces and
moments as well as on calculated injury criteria such as Nij, Nkm and LNL. Although the used
helmet model is mentioned by MOSAFIM and the position of the neck brace is considered by
Atlas, no test procedure has focused on the geometrical aspects of helmets and neck braces.
Component tests
Assessments of neck braces based on component tests were performed by another
manufacturer of neck braces. ORTEMA describes in an unpublished document a dynamic test
consisting of a 70 J impact of the neck brace on its rear part in order to check for cracks. Static
tests of the rear part of the neck brace with a 10 kg weight are also described to check the
static neck brace deformation. Component tests were also used at RICOTEST. [25] The
strength and stiffness of neck brace components is assessed with regard to minimum tensile
strength of the fastening and closing system. The maximum displacement of the neck brace
when loaded laterally is evaluated to check the neck brace positioning. Impact tests analogue
to EN 1621-2:2014 are performed to check the resistance against a 50 J kerbstone impact in
the rear and lateral zones. The quick release system is also tested analogue to EN 1621-
2:2014. In addition to the component tests the test protocol of RICOTEST also considers
ergonomic requirements. Tested with a not further specified motocross helmet the free left and
right head rotation of the user is checked as well as the user’s ability to perform 40° flexion and
extension motions and 30° lateral flexion motions with helmet and neck brace on.
Virtual tests
The performance of neck braces is also considered in numerical simulations. Different studies
on the protective effect of neck braces were found in literature describing a variety of loading
conditions.
Khosroshahi, Ghajari, and Galvanetto [26] used a numerical model of a 50th percentile Hybrid
III ATD equipped with a neck brace and a helmet to assess the reaction to different helmet
impacts as shown in Figure 98. The analysis is based on the comparison of Nij in three different
helmet impacts at the rear, the crown and on the chin bar with and without the neck brace in
place.
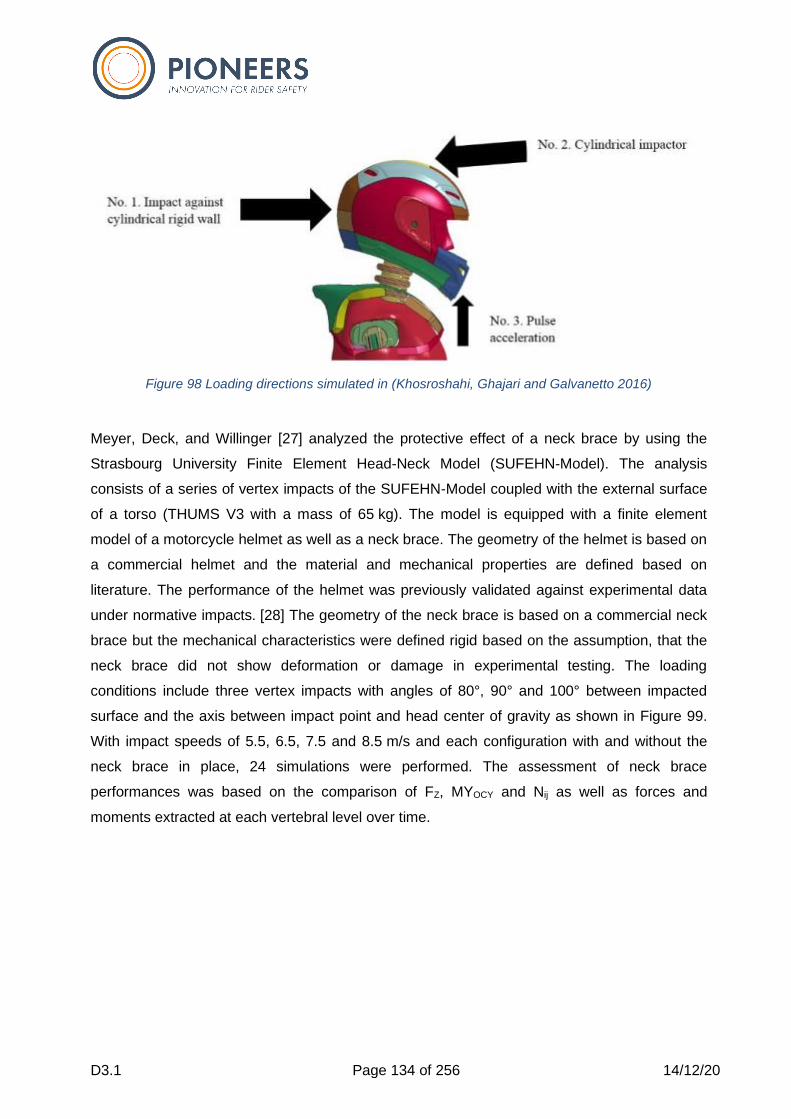
D3.1 Page 134 of 256 14/12/20
Figure 98 Loading directions simulated in (Khosroshahi, Ghajari and Galvanetto 2016)
Meyer, Deck, and Willinger [27] analyzed the protective effect of a neck brace by using the
Strasbourg University Finite Element Head-Neck Model (SUFEHN-Model). The analysis
consists of a series of vertex impacts of the SUFEHN-Model coupled with the external surface
of a torso (THUMS V3 with a mass of 65 kg). The model is equipped with a finite element
model of a motorcycle helmet as well as a neck brace. The geometry of the helmet is based on
a commercial helmet and the material and mechanical properties are defined based on
literature. The performance of the helmet was previously validated against experimental data
under normative impacts. [28] The geometry of the neck brace is based on a commercial neck
brace but the mechanical characteristics were defined rigid based on the assumption, that the
neck brace did not show deformation or damage in experimental testing. The loading
conditions include three vertex impacts with angles of 80°, 90° and 100° between impacted
surface and the axis between impact point and head center of gravity as shown in Figure 99.
With impact speeds of 5.5, 6.5, 7.5 and 8.5 m/s and each configuration with and without the
neck brace in place, 24 simulations were performed. The assessment of neck brace
performances was based on the comparison of FZ, MYOCY and Nij as well as forces and
moments extracted at each vertebral level over time.
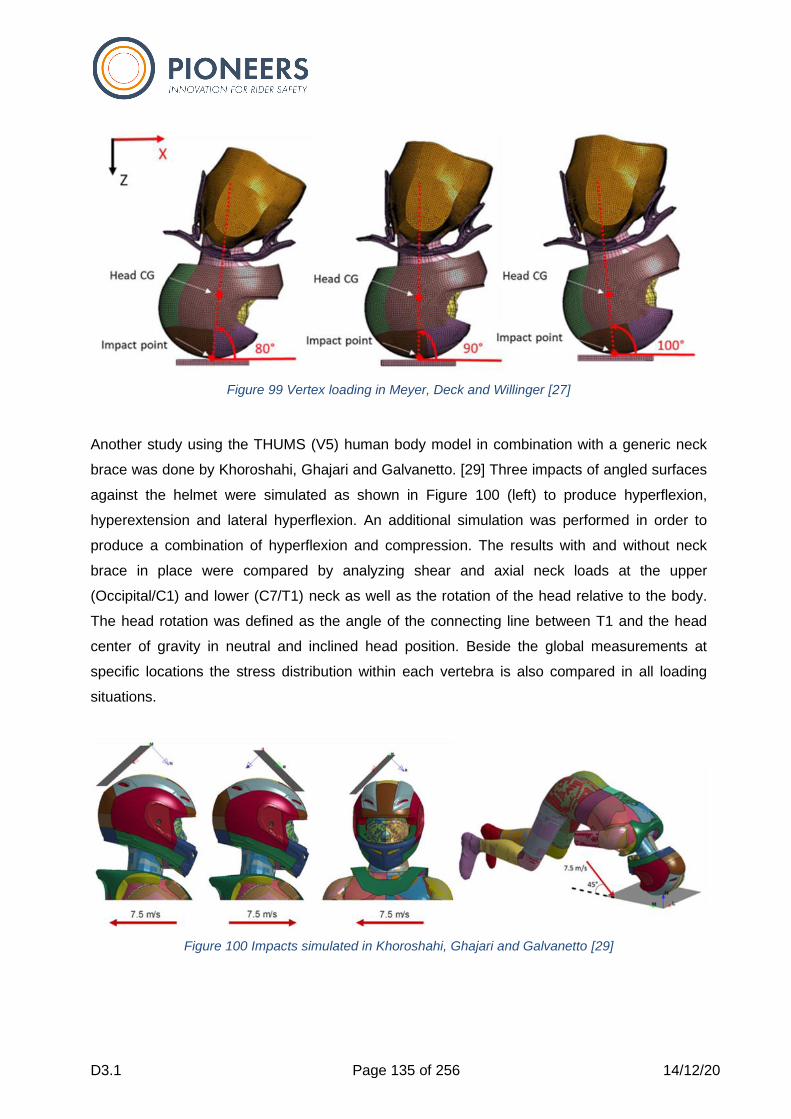
D3.1 Page 135 of 256 14/12/20
Figure 99 Vertex loading in Meyer, Deck and Willinger [27]
Another study using the THUMS (V5) human body model in combination with a generic neck
brace was done by Khoroshahi, Ghajari and Galvanetto. [29] Three impacts of angled surfaces
against the helmet were simulated as shown in Figure 100 (left) to produce hyperflexion,
hyperextension and lateral hyperflexion. An additional simulation was performed in order to
produce a combination of hyperflexion and compression. The results with and without neck
brace in place were compared by analyzing shear and axial neck loads at the upper
(Occipital/C1) and lower (C7/T1) neck as well as the rotation of the head relative to the body.
The head rotation was defined as the angle of the connecting line between T1 and the head
center of gravity in neutral and inclined head position. Beside the global measurements at
specific locations the stress distribution within each vertebra is also compared in all loading
situations.
Figure 100 Impacts simulated in Khoroshahi, Ghajari and Galvanetto [29]

D3.1 Page 136 of 256 14/12/20
3.4.2 Motivation for improvement
Compared to other parts of PPE the neck brace can only work in combination with a helmet.
With the lower helmet edge as the load transferring structure contacting the neck brace surface
the limitation of ROM depends on the geometrical match of both parts. To assess the
protective effect of a neck brace it is therefore important to consider the geometry and position
of the helmet as well. As the geometry of helmets is not regulated and the variety of helmets on
the market is huge, the possible combinations used by riders cannot be foreseen. The existing
test methods described previously do not consider the variety of helmet geometries or
positions. Different helmets were used, often without information on what helmet was used and
why it was chosen. Furthermore, the positions of helmet and neck brace were not defined in a
way to compare the results. Examples of helmet shapes are shown in Figure 101 and
measured lower helmet edges are shown in Figure 102.
Figure 101 Different helmet shapes
Figure 102 Geometries of lower helmet edges from 16 helmets
D3.1 Page 137 of 256 14/12/20
Shortcomings of existing test methods
The previously described test methods consider either actual neck braces on physical
dummies (full scale tests), the neck braces alone (component tests) or as numerical models
(virtual tests). For standardization the use of numerical models only is not seen sufficient. It
requires the existence of a suitable finite element model, the information on specific material
properties and the knowledge to perform simulations properly. Furthermore, the numerical
models of neck braces would need to be validated in order to trust the numerical results and to
prevent fraud during the standardization process of a neck brace. Simplifications like the
definition of a neck brace as a rigid geometry would render the knowledge on material
properties unnecessary but would not consider structural performance of a neck brace (i.e.
functionally flexibility) or insufficiently dimensioned products.
On the other hand, the use of ATDs or dynamic impacts alone is also not seen sufficient. As
the helmet can influence the performance of a neck brace and the helmet geometry is not
regulated the results of a standardized test would not be transferable to the majority of real-
world applications of neck braces. The performance of physical tests using a variety of helmet-
brace-combinations would lead to enormous test efforts and costs. Furthermore, the suitability
of ATDs regarding the assessment of omnidirectional impact conditions is questionable. ATDs
are designed to be used in specific impact configurations. The suitability of an ATD depends
therefore on the direction of loading as well as the intensity. As the protective effect of neck
braces is based on the interaction between helmet and neck brace, the contact between both
parts is crucial. With the trajectory of the ATD’s head influenced by the neck the flexibility and
the ROM are important factors to even reach the neck brace with the helmet edge. The neck of
the Hybrid-III ATD is described in literature as too stiff and its deformation as too uniform
compared to the human cervical spine. [30] [31] [32] [33] [34] While these differences may be
not that relevant in frontal impacts of a restraint ATD the assessment of a neck brace requires
a realistic motion of the head relative to the shoulders. Measured forces and moments in an
ATD will therefore not reflect the loading of a real cervical spine.
3.4.3 Geometrical assessment method
As a step towards standardization of neck braces this task of PIONEERS proposes the use of
geometrical measurements of helmets and neck braces in order to identify reasonable
combinations. This step can be used to reduce the various potential combinations of helmets
and neck braces to a practicable amount. With the geometrical approach the combinations of
helmets and neck braces can be analyzed without the need to have both parts of PPE at the
same place. It also enables a virtual and low-cost analysis of combinations in order to
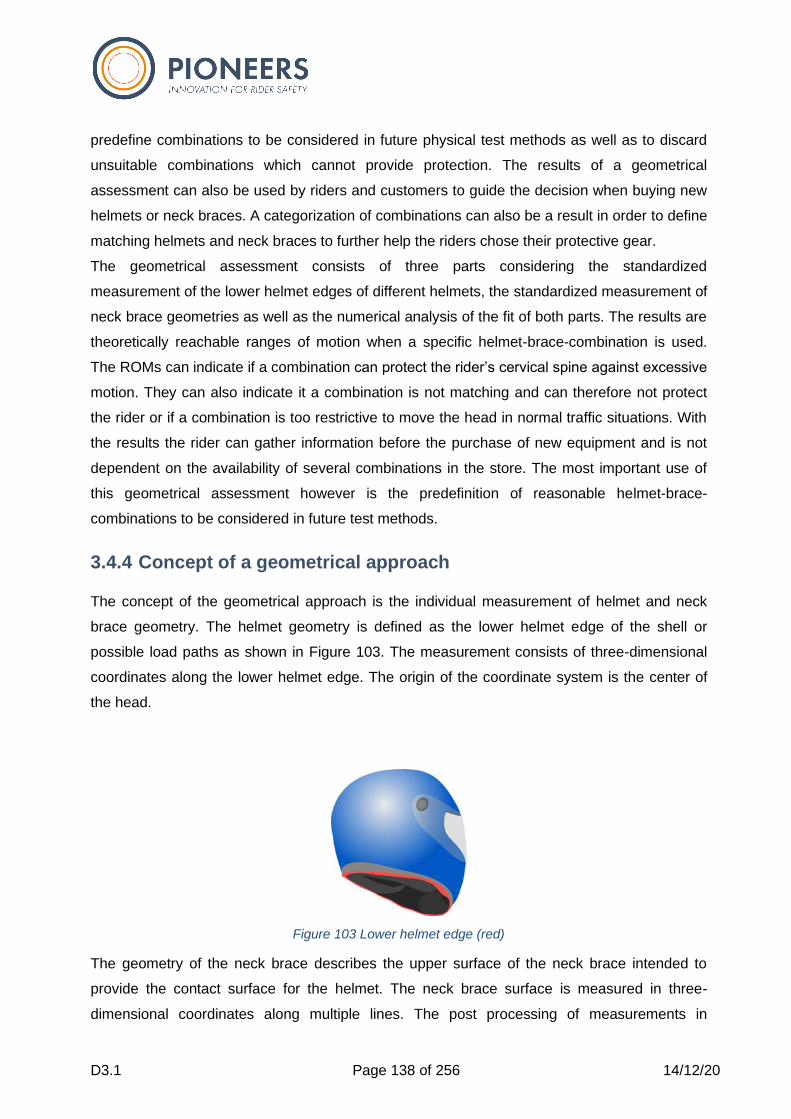
D3.1 Page 138 of 256 14/12/20
predefine combinations to be considered in future physical test methods as well as to discard
unsuitable combinations which cannot provide protection. The results of a geometrical
assessment can also be used by riders and customers to guide the decision when buying new
helmets or neck braces. A categorization of combinations can also be a result in order to define
matching helmets and neck braces to further help the riders chose their protective gear.
The geometrical assessment consists of three parts considering the standardized
measurement of the lower helmet edges of different helmets, the standardized measurement of
neck brace geometries as well as the numerical analysis of the fit of both parts. The results are
theoretically reachable ranges of motion when a specific helmet-brace-combination is used.
The ROMs can indicate if a combination can protect the rider’s cervical spine against excessive
motion. They can also indicate it a combination is not matching and can therefore not protect
the rider or if a combination is too restrictive to move the head in normal traffic situations. With
the results the rider can gather information before the purchase of new equipment and is not
dependent on the availability of several combinations in the store. The most important use of
this geometrical assessment however is the predefinition of reasonable helmet-brace-
combinations to be considered in future test methods.
3.4.4 Concept of a geometrical approach
The concept of the geometrical approach is the individual measurement of helmet and neck
brace geometry. The helmet geometry is defined as the lower helmet edge of the shell or
possible load paths as shown in Figure 103. The measurement consists of three-dimensional
coordinates along the lower helmet edge. The origin of the coordinate system is the center of
the head.
Figure 103 Lower helmet edge (red)
The geometry of the neck brace describes the upper surface of the neck brace intended to
provide the contact surface for the helmet. The neck brace surface is measured in three-
dimensional coordinates along multiple lines. The post processing of measurements in
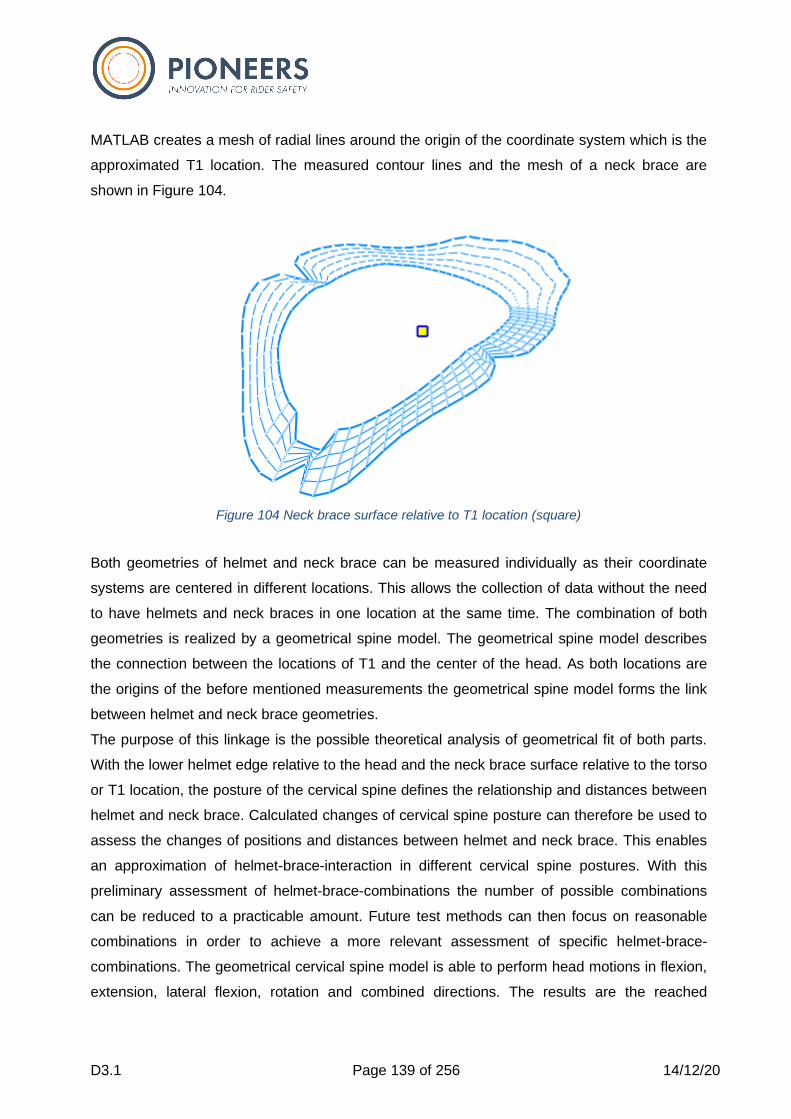
D3.1 Page 139 of 256 14/12/20
MATLAB creates a mesh of radial lines around the origin of the coordinate system which is the
approximated T1 location. The measured contour lines and the mesh of a neck brace are
shown in Figure 104.
Figure 104 Neck brace surface relative to T1 location (square)
Both geometries of helmet and neck brace can be measured individually as their coordinate
systems are centered in different locations. This allows the collection of data without the need
to have helmets and neck braces in one location at the same time. The combination of both
geometries is realized by a geometrical spine model. The geometrical spine model describes
the connection between the locations of T1 and the center of the head. As both locations are
the origins of the before mentioned measurements the geometrical spine model forms the link
between helmet and neck brace geometries.
The purpose of this linkage is the possible theoretical analysis of geometrical fit of both parts.
With the lower helmet edge relative to the head and the neck brace surface relative to the torso
or T1 location, the posture of the cervical spine defines the relationship and distances between
helmet and neck brace. Calculated changes of cervical spine posture can therefore be used to
assess the changes of positions and distances between helmet and neck brace. This enables
an approximation of helmet-brace-interaction in different cervical spine postures. With this
preliminary assessment of helmet-brace-combinations the number of possible combinations
can be reduced to a practicable amount. Future test methods can then focus on reasonable
combinations in order to achieve a more relevant assessment of specific helmet-brace-
combinations. The geometrical cervical spine model is able to perform head motions in flexion,
extension, lateral flexion, rotation and combined directions. The results are the reached
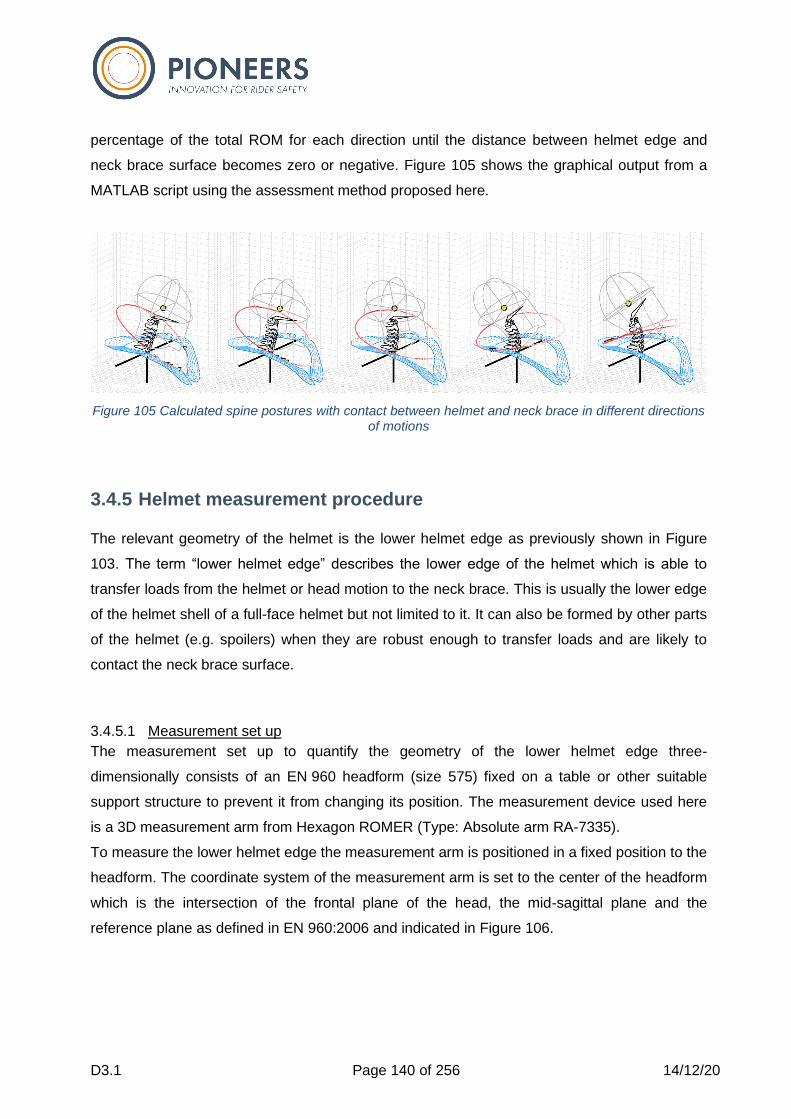
D3.1 Page 140 of 256 14/12/20
percentage of the total ROM for each direction until the distance between helmet edge and
neck brace surface becomes zero or negative. Figure 105 shows the graphical output from a
MATLAB script using the assessment method proposed here.
Figure 105 Calculated spine postures with contact between helmet and neck brace in different directions of motions
3.4.5 Helmet measurement procedure
The relevant geometry of the helmet is the lower helmet edge as previously shown in Figure
103. The term “lower helmet edge” describes the lower edge of the helmet which is able to
transfer loads from the helmet or head motion to the neck brace. This is usually the lower edge
of the helmet shell of a full-face helmet but not limited to it. It can also be formed by other parts
of the helmet (e.g. spoilers) when they are robust enough to transfer loads and are likely to
contact the neck brace surface.
3.4.5.1 Measurement set up
The measurement set up to quantify the geometry of the lower helmet edge three-
dimensionally consists of an EN 960 headform (size 575) fixed on a table or other suitable
support structure to prevent it from changing its position. The measurement device used here
is a 3D measurement arm from Hexagon ROMER (Type: Absolute arm RA-7335).
To measure the lower helmet edge the measurement arm is positioned in a fixed position to the
headform. The coordinate system of the measurement arm is set to the center of the headform
which is the intersection of the frontal plane of the head, the mid-sagittal plane and the
reference plane as defined in EN 960:2006 and indicated in Figure 106.
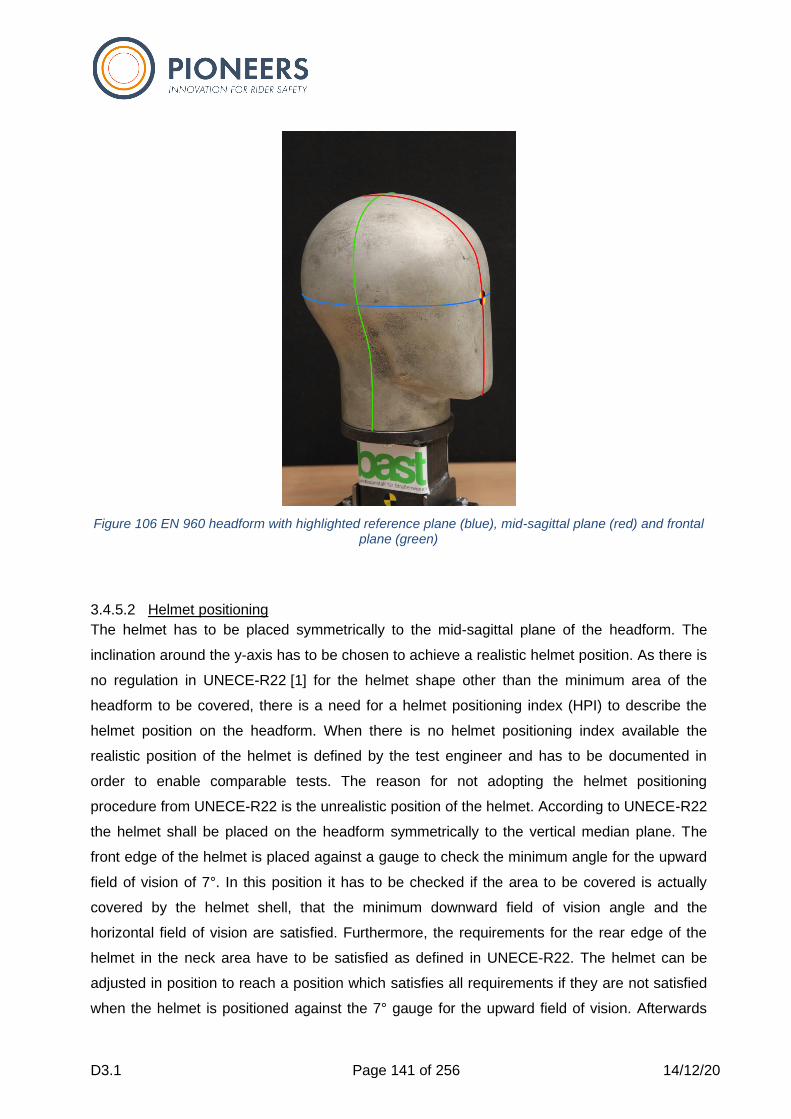
D3.1 Page 141 of 256 14/12/20
Figure 106 EN 960 headform with highlighted reference plane (blue), mid-sagittal plane (red) and frontal plane (green)
3.4.5.2 Helmet positioning
The helmet has to be placed symmetrically to the mid-sagittal plane of the headform. The
inclination around the y-axis has to be chosen to achieve a realistic helmet position. As there is
no regulation in UNECE-R22 [1] for the helmet shape other than the minimum area of the
headform to be covered, there is a need for a helmet positioning index (HPI) to describe the
helmet position on the headform. When there is no helmet positioning index available the
realistic position of the helmet is defined by the test engineer and has to be documented in
order to enable comparable tests. The reason for not adopting the helmet positioning
procedure from UNECE-R22 is the unrealistic position of the helmet. According to UNECE-R22
the helmet shall be placed on the headform symmetrically to the vertical median plane. The
front edge of the helmet is placed against a gauge to check the minimum angle for the upward
field of vision of 7°. In this position it has to be checked if the area to be covered is actually
covered by the helmet shell, that the minimum downward field of vision angle and the
horizontal field of vision are satisfied. Furthermore, the requirements for the rear edge of the
helmet in the neck area have to be satisfied as defined in UNECE-R22. The helmet can be
adjusted in position to reach a position which satisfies all requirements if they are not satisfied
when the helmet is positioned against the 7° gauge for the upward field of vision. Afterwards

D3.1 Page 142 of 256 14/12/20
the helmet is tipped towards the rear in order to displace the front edge by 25 mm in the
median plane. This procedure is used to define the impact locations on the helmet as defined
in UNECE-R22. However, it does not ensure a realistic helmet position. The field of vision is
defined by the geometry of the front opening of a full-face-helmet. As the shape of a helmet is
not regulated, the location of the upper edge of the front opening can vary. Therefore, a helmet
with a smaller front opening will be positioned differently from a helmet with a wider front
opening.
Figure 107 Variations of helmet edge inclination due to helmet positioning based on the field of vision
Figure 107 shows three helmets with different shapes of their front openings. The lower helmet
edge is equally inclined when placed individually on the headform (first row). With the helmet
aligned to achieve the 7° upward field of vision, which is indicated in green, the helmet base
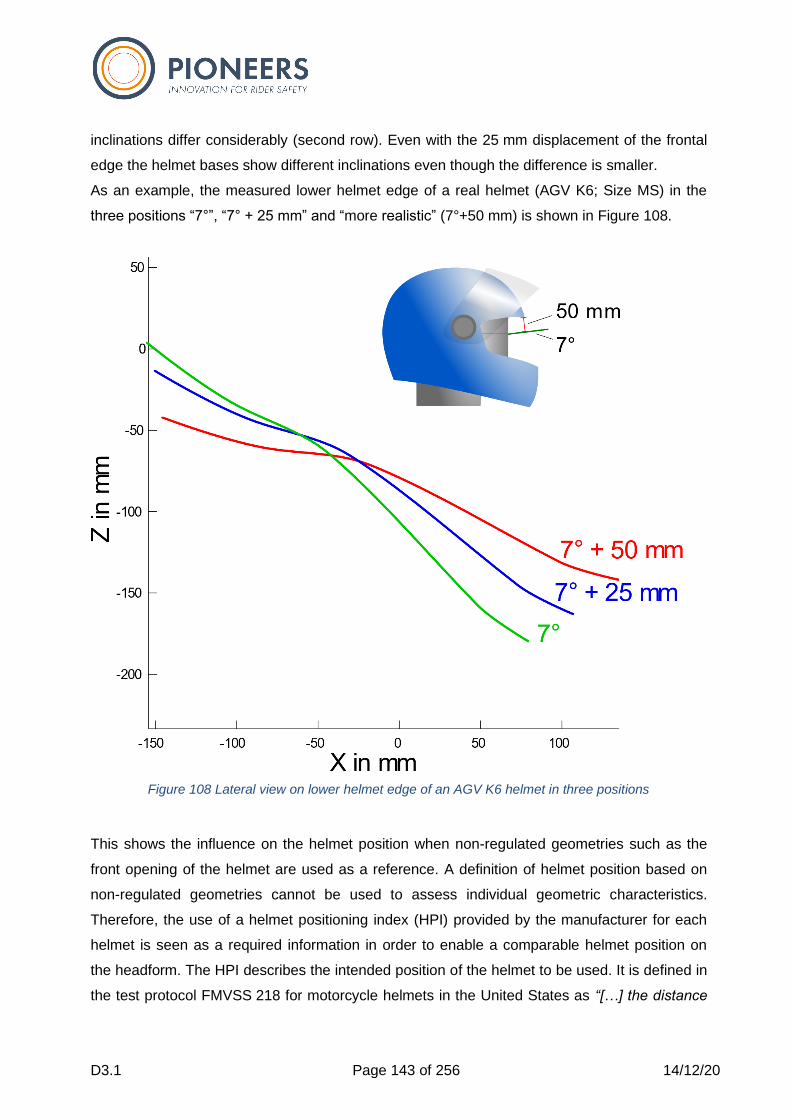
D3.1 Page 143 of 256 14/12/20
inclinations differ considerably (second row). Even with the 25 mm displacement of the frontal
edge the helmet bases show different inclinations even though the difference is smaller.
As an example, the measured lower helmet edge of a real helmet (AGV K6; Size MS) in the
three positions “7°”, “7° + 25 mm” and “more realistic” (7°+50 mm) is shown in Figure 108.
Figure 108 Lateral view on lower helmet edge of an AGV K6 helmet in three positions
This shows the influence on the helmet position when non-regulated geometries such as the
front opening of the helmet are used as a reference. A definition of helmet position based on
non-regulated geometries cannot be used to assess individual geometric characteristics.
Therefore, the use of a helmet positioning index (HPI) provided by the manufacturer for each
helmet is seen as a required information in order to enable a comparable helmet position on
the headform. The HPI describes the intended position of the helmet to be used. It is defined in
the test protocol FMVSS 218 for motorcycle helmets in the United States as “[…] the distance
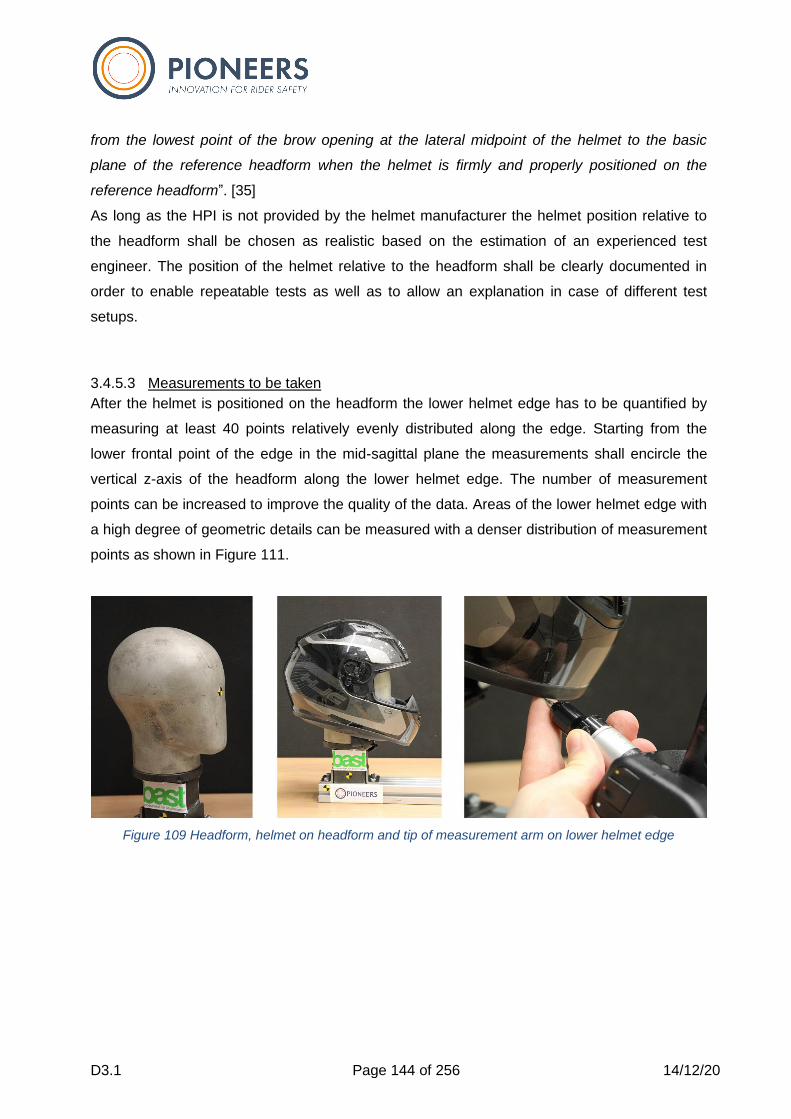
D3.1 Page 144 of 256 14/12/20
from the lowest point of the brow opening at the lateral midpoint of the helmet to the basic
plane of the reference headform when the helmet is firmly and properly positioned on the
reference headform”. [35]
As long as the HPI is not provided by the helmet manufacturer the helmet position relative to
the headform shall be chosen as realistic based on the estimation of an experienced test
engineer. The position of the helmet relative to the headform shall be clearly documented in
order to enable repeatable tests as well as to allow an explanation in case of different test
setups.
3.4.5.3 Measurements to be taken
After the helmet is positioned on the headform the lower helmet edge has to be quantified by
measuring at least 40 points relatively evenly distributed along the edge. Starting from the
lower frontal point of the edge in the mid-sagittal plane the measurements shall encircle the
vertical z-axis of the headform along the lower helmet edge. The number of measurement
points can be increased to improve the quality of the data. Areas of the lower helmet edge with
a high degree of geometric details can be measured with a denser distribution of measurement
points as shown in Figure 111.
Figure 109 Headform, helmet on headform and tip of measurement arm on lower helmet edge
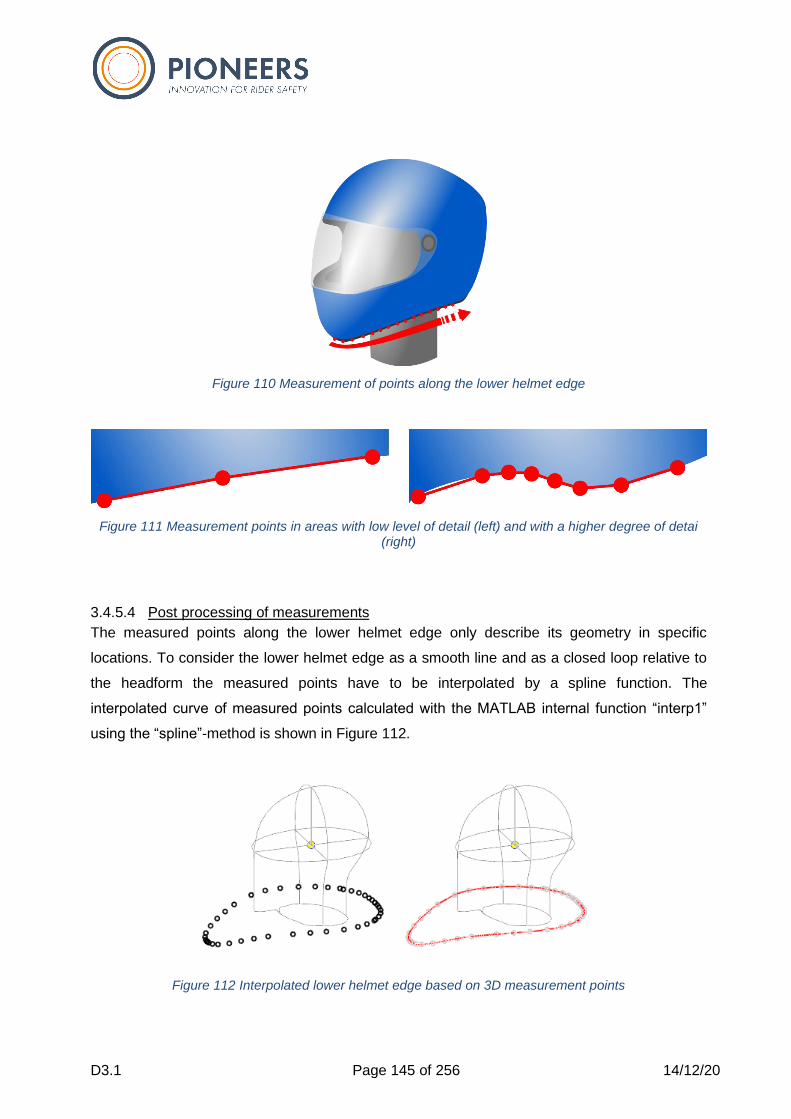
D3.1 Page 145 of 256 14/12/20
Figure 110 Measurement of points along the lower helmet edge
Figure 111 Measurement points in areas with low level of detail (left) and with a higher degree of detai (right)
3.4.5.4 Post processing of measurements
The measured points along the lower helmet edge only describe its geometry in specific
locations. To consider the lower helmet edge as a smooth line and as a closed loop relative to
the headform the measured points have to be interpolated by a spline function. The
interpolated curve of measured points calculated with the MATLAB internal function “interp1”
using the “spline”-method is shown in Figure 112.
Figure 112 Interpolated lower helmet edge based on 3D measurement points

D3.1 Page 146 of 256 14/12/20
3.4.5.5 Summary of steps to measure the lower helmet edge:
1. Placement of helmet symmetrically to the mid-sagittal plane of the headform
2. Rotation of the helmet around the y-axis to achieve a realistic helmet position
3. Measurement of the lower helmet edge with at least 40 three-dimensional
measurement points along the lower helmet edge
4. Saving of measured points in x-, y- and z-coordinates
5. Interpolation of lower helmet edge as a spline with at least 1000 points

D3.1 Page 147 of 256 14/12/20
3.4.6 Neck brace measurement procedure
The relevant geometry of a neck brace to provide protection against hyper motion of the head-
neck-system is the upper surface. This is the structure most likely to be impacted by the lower
helmet edge when the rider’s head is inclined relative to the torso. The surface of a neck brace
described by contour lines is shown in Figure 104. The geometry is measured relative to the
approximated T1 location of a rider in order to have a fixed point as a counterpart to the head.
3.4.6.1 Measurement set up
To measure the geometry of a neck brace a suitable surrogate of a torso is needed. As this
geometrical approach only considers the geometry of the neck brace the use of an ATD or
parts of an ATD are seen to be uneconomic. A surrogate torso with the possibility to adapt the
chest depth as well as the angles of chest and back surfaces is proposed as shown in Figure
113 to Figure 117. The surrogate shoulder is a simplified geometry providing chest, shoulder
and back surfaces for a neck brace to contact with. The location of T1 is the origin of the
coordinate system to measure the neck brace geometry.
Figure 113 Surrogate shoulder dimensions
Chest plateBack plate
Shoulder
T1
Front
70°
O 100 mm
70°
70 mm 100 mm
15 mm20 mm
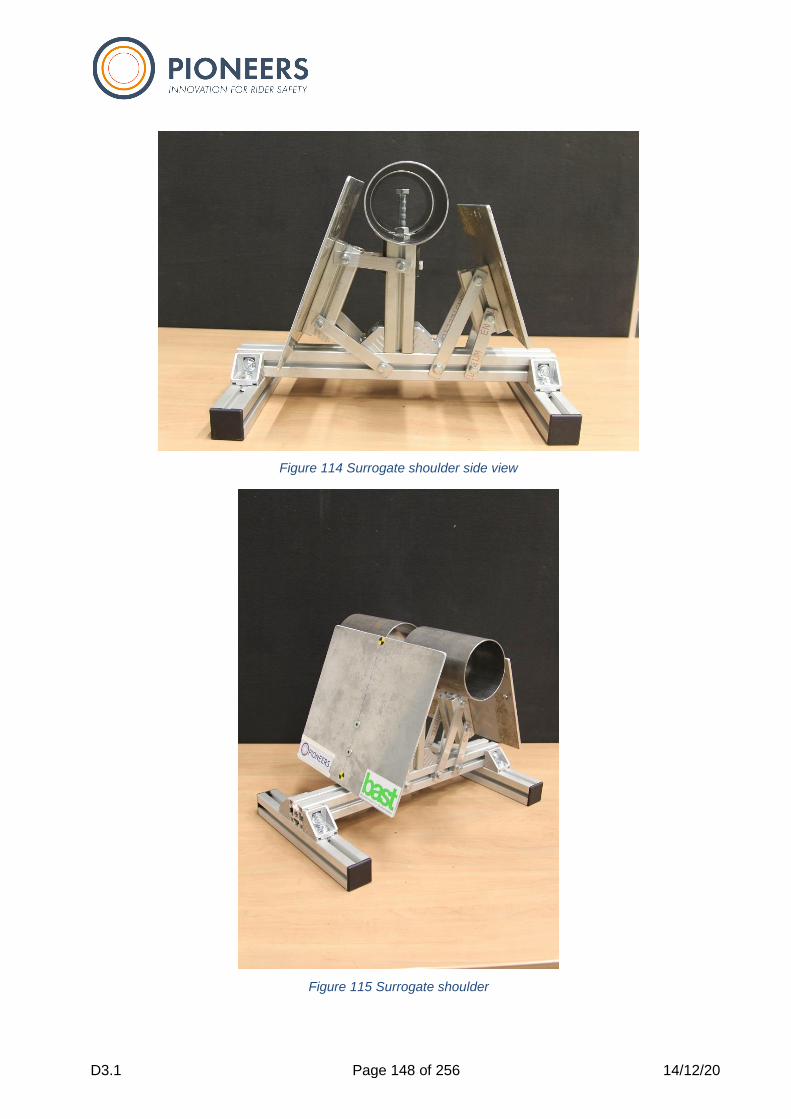
D3.1 Page 148 of 256 14/12/20
Figure 114 Surrogate shoulder side view
Figure 115 Surrogate shoulder

D3.1 Page 149 of 256 14/12/20
Figure 116 Surrogate shoulder frontal view
Figure 117 Surrogate shoulder T1 location
D3.1 Page 150 of 256 14/12/20
The geometry of the surrogate shoulder is a simplification to allow for easy reproduction of the
measurement set up. The location of T1 is approximated but can be adjusted by an offset when
used as a reference. Therefore, the physical arrangement of parts is kept simple in this
prototype. The positions and inclinations of chest and back plates are adjustable in order to
simulate either different body shapes and sizes or to consider the existence of protective gear
worn beneath the neck brace such as a protective jacket with a back protector.
3.4.6.2 Neck brace positioning
Clear instructions and documentation of the position are not only important for the helmet. The
position of the neck brace relative to the rider’s torso/shoulders is also an important issue when
analyzing the geometry. Most neck braces can be adjusted in size by changing the angle or
position of chest and back supports. This enables an individual fit of the neck brace to the
rider’s shape as well as the used protective jacket as the neck brace is normally placed on top
of the jacket.
Instructions delivered with neck braces include information on the fitment specifically related to
the used mechanisms to change the neck brace size. The information is mostly based on the
correct fit of the chest and back support in order to achieve a snug and flat fit. The distance
between helmet and neck brace is often indicated as a range. As an example, the user’s
manual of the Leatt GPX 5.5 neck brace indicates a range of 50-130 mm vertical distance
between the lower front edge of the helmet and the neck brace and a vertical distance of 50-
170 mm at the lower rear edge of the helmet respectively as shown in Figure 118.
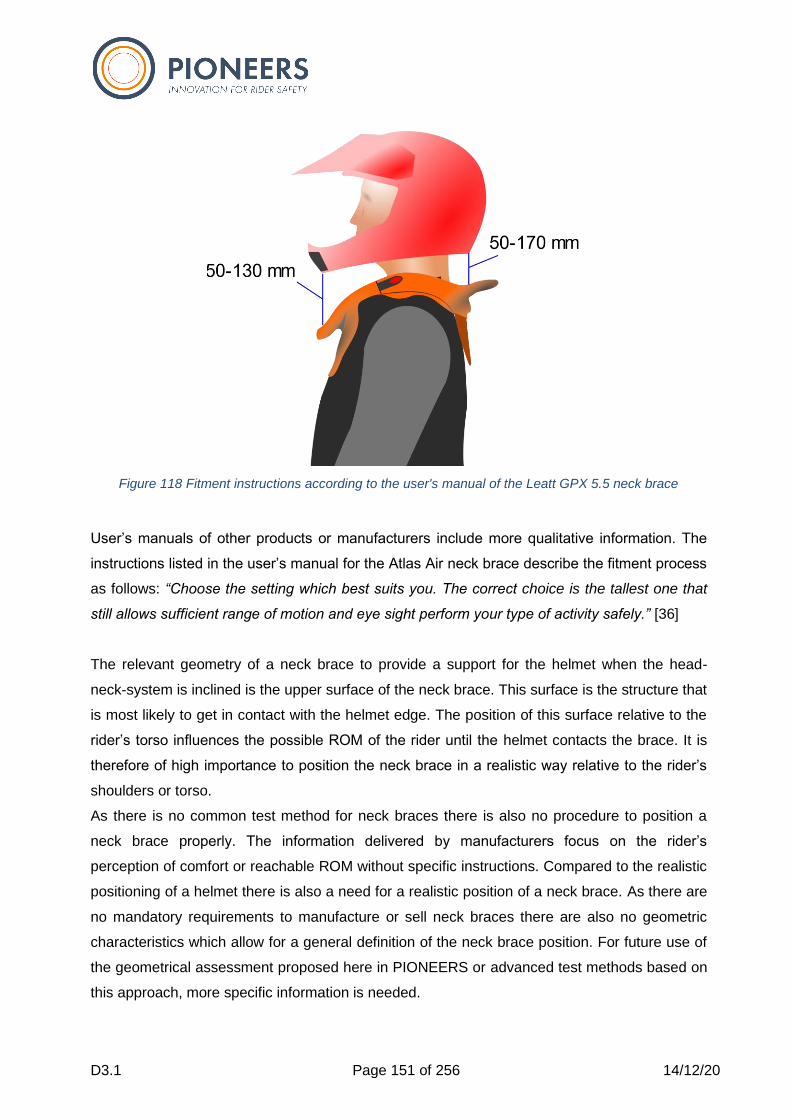
D3.1 Page 151 of 256 14/12/20
Figure 118 Fitment instructions according to the user's manual of the Leatt GPX 5.5 neck brace
User’s manuals of other products or manufacturers include more qualitative information. The
instructions listed in the user’s manual for the Atlas Air neck brace describe the fitment process
as follows: “Choose the setting which best suits you. The correct choice is the tallest one that
still allows sufficient range of motion and eye sight perform your type of activity safely.” [36]
The relevant geometry of a neck brace to provide a support for the helmet when the head-
neck-system is inclined is the upper surface of the neck brace. This surface is the structure that
is most likely to get in contact with the helmet edge. The position of this surface relative to the
rider’s torso influences the possible ROM of the rider until the helmet contacts the brace. It is
therefore of high importance to position the neck brace in a realistic way relative to the rider’s
shoulders or torso.
As there is no common test method for neck braces there is also no procedure to position a
neck brace properly. The information delivered by manufacturers focus on the rider’s
perception of comfort or reachable ROM without specific instructions. Compared to the realistic
positioning of a helmet there is also a need for a realistic position of a neck brace. As there are
no mandatory requirements to manufacture or sell neck braces there are also no geometric
characteristics which allow for a general definition of the neck brace position. For future use of
the geometrical assessment proposed here in PIONEERS or advanced test methods based on
this approach, more specific information is needed.

D3.1 Page 152 of 256 14/12/20
Similar to the Helmet Positioning Index (HPI) the general position of the neck brace should also
be defined by the manufacturer. It is therefore proposed to use a Neck Brace Positioning Index
(NBPI) in order to describe the inclination of the neck brace regarding y-axis as shown in
Figure 119.
Figure 119 Proposal of a Neck Brace Positioning Index (NBPI)
A procedure to position the neck brace in a way that the neck brace is intended to be used by
the manufacturer would be described as follows:
1. Position the neck brace symmetrically to the mid-sagittal plane of the rider’s torso
2. Rotate the neck brace around the y-axis to achieve the NBPI on the frontal surface in
the mid-sagittal plane
3. Adjust the chest and back supports to achieve a snug fit in order to secure the neck
brace position
With a NBPI as described before the manufacturer of a neck brace can extent the information
for riders and test engineers in order to enable correct use of the product.
3.4.6.3 Measurements to be taken
As the relevant geometry of the neck brace is the upper surface the simple measurement of
points along an edge is not sufficient. To describe the geometry of the neck brace surface with
the beforementioned 3D-measurement arm multiple lines are measured subsequently. The
minimum number of lines to describe the neck brace surface is two. These two lines consist of
measurement at least 40 per line points along the outer and inner edge of the surface as
indicated in Figure 120. To consider the structure or curvature of the surface between the outer

D3.1 Page 153 of 256 14/12/20
and inner lines additional lines can be measured. Lines following geometrical contours are
shown in Figure 121.
Figure 120 Outer (red) and inner (green) lines to be measured as a minimum
Figure 121 Multiple lines following geometrical structures of the surface
3.4.6.4 Post processing of measurements
As described for the helmet the measured lines consist of individual points. To describe the
surface each measured line is interpolated as a spline with at least 1000 points to form a
smooth curve along the measured edges. By increasing the density of measurement points the
degree of detail can also be increased in order to consider areas of the neck brace with a
higher degree of geometric variation. To connect the lines radially the MATLAB script uses an
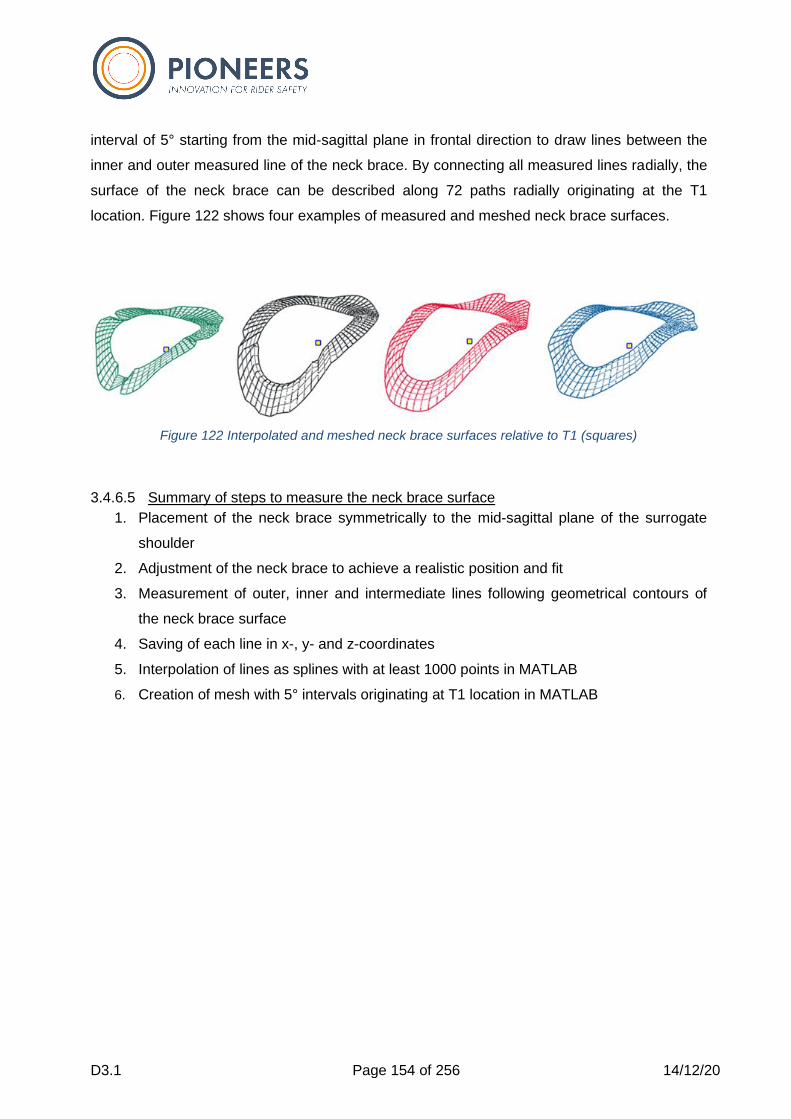
D3.1 Page 154 of 256 14/12/20
interval of 5° starting from the mid-sagittal plane in frontal direction to draw lines between the
inner and outer measured line of the neck brace. By connecting all measured lines radially, the
surface of the neck brace can be described along 72 paths radially originating at the T1
location. Figure 122 shows four examples of measured and meshed neck brace surfaces.
Figure 122 Interpolated and meshed neck brace surfaces relative to T1 (squares)
3.4.6.5 Summary of steps to measure the neck brace surface
1. Placement of the neck brace symmetrically to the mid-sagittal plane of the surrogate
shoulder
2. Adjustment of the neck brace to achieve a realistic position and fit
3. Measurement of outer, inner and intermediate lines following geometrical contours of
the neck brace surface
4. Saving of each line in x-, y- and z-coordinates
5. Interpolation of lines as splines with at least 1000 points in MATLAB
6. Creation of mesh with 5° intervals originating at T1 location in MATLAB
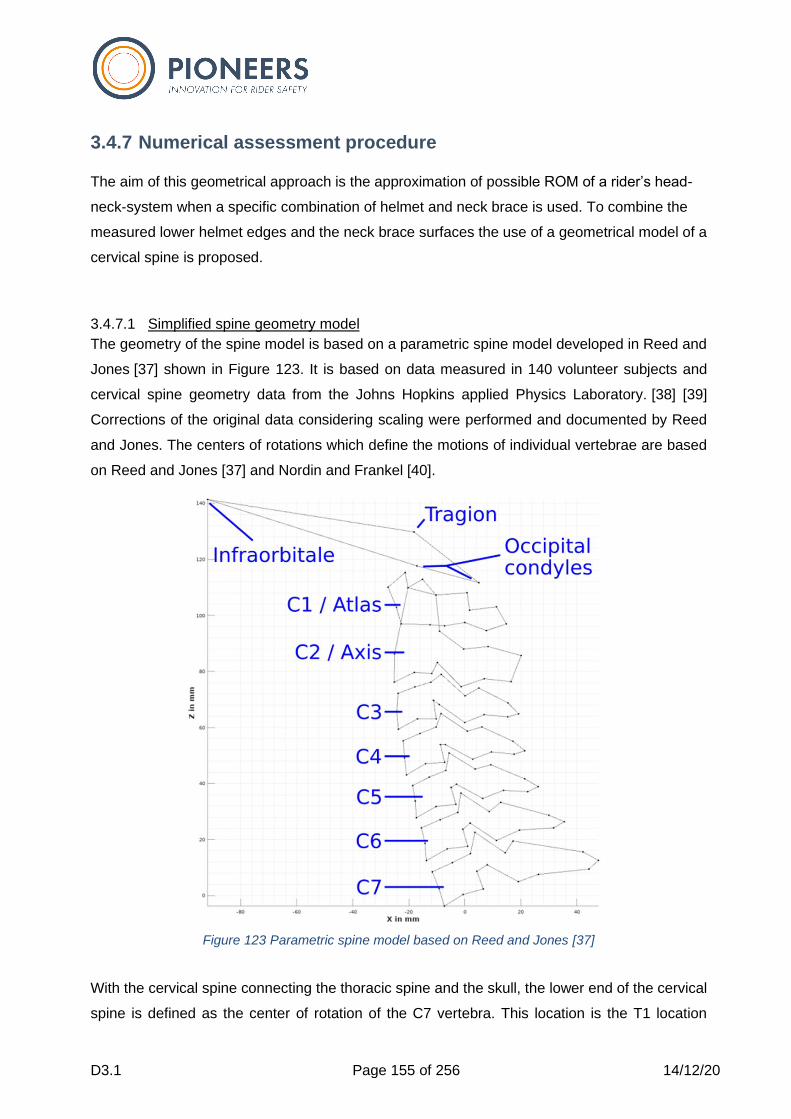
D3.1 Page 155 of 256 14/12/20
3.4.7 Numerical assessment procedure
The aim of this geometrical approach is the approximation of possible ROM of a rider’s head-
neck-system when a specific combination of helmet and neck brace is used. To combine the
measured lower helmet edges and the neck brace surfaces the use of a geometrical model of a
cervical spine is proposed.
3.4.7.1 Simplified spine geometry model
The geometry of the spine model is based on a parametric spine model developed in Reed and
Jones [37] shown in Figure 123. It is based on data measured in 140 volunteer subjects and
cervical spine geometry data from the Johns Hopkins applied Physics Laboratory. [38] [39]
Corrections of the original data considering scaling were performed and documented by Reed
and Jones. The centers of rotations which define the motions of individual vertebrae are based
on Reed and Jones [37] and Nordin and Frankel [40].
Figure 123 Parametric spine model based on Reed and Jones [37]
With the cervical spine connecting the thoracic spine and the skull, the lower end of the cervical
spine is defined as the center of rotation of the C7 vertebra. This location is the T1 location
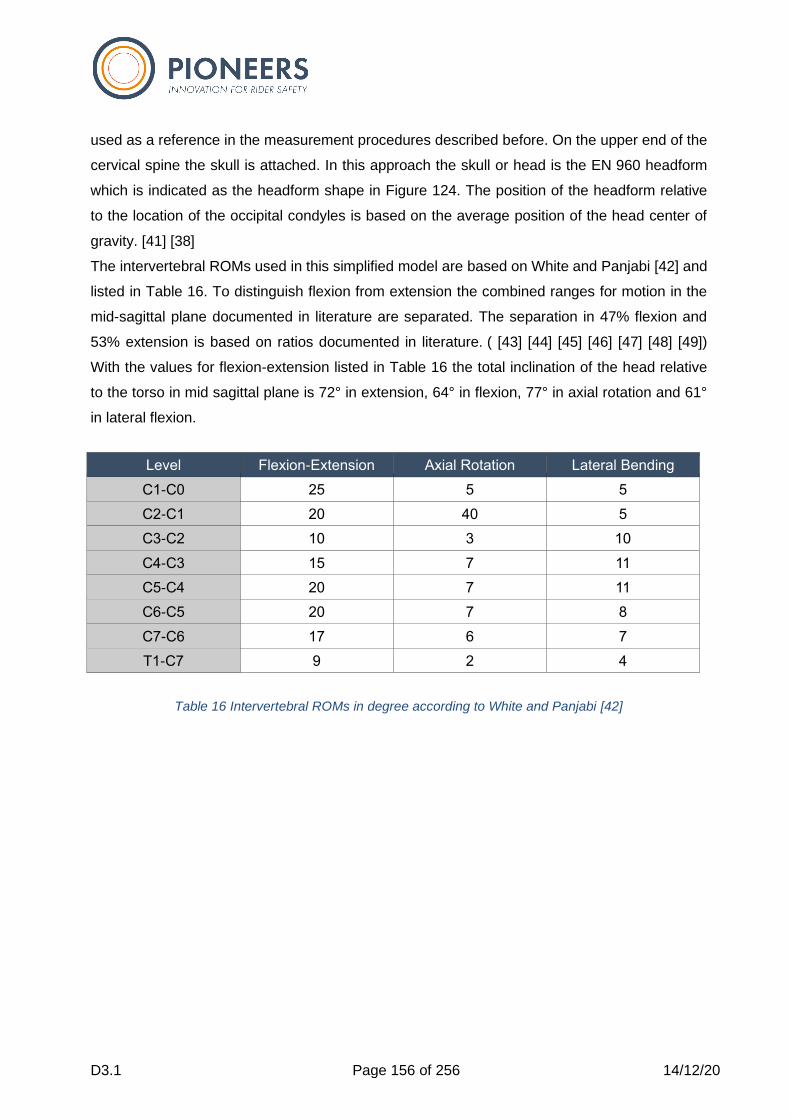
D3.1 Page 156 of 256 14/12/20
used as a reference in the measurement procedures described before. On the upper end of the
cervical spine the skull is attached. In this approach the skull or head is the EN 960 headform
which is indicated as the headform shape in Figure 124. The position of the headform relative
to the location of the occipital condyles is based on the average position of the head center of
gravity. [41] [38]
The intervertebral ROMs used in this simplified model are based on White and Panjabi [42] and
listed in Table 16. To distinguish flexion from extension the combined ranges for motion in the
mid-sagittal plane documented in literature are separated. The separation in 47% flexion and
53% extension is based on ratios documented in literature. ( [43] [44] [45] [46] [47] [48] [49])
With the values for flexion-extension listed in Table 16 the total inclination of the head relative
to the torso in mid sagittal plane is 72° in extension, 64° in flexion, 77° in axial rotation and 61°
in lateral flexion.
Level Flexion-Extension Axial Rotation Lateral Bending
C1-C0 25 5 5
C2-C1 20 40 5
C3-C2 10 3 10
C4-C3 15 7 11
C5-C4 20 7 11
C6-C5 20 7 8
C7-C6 17 6 7
T1-C7 9 2 4
Table 16 Intervertebral ROMs in degree according to White and Panjabi [42]
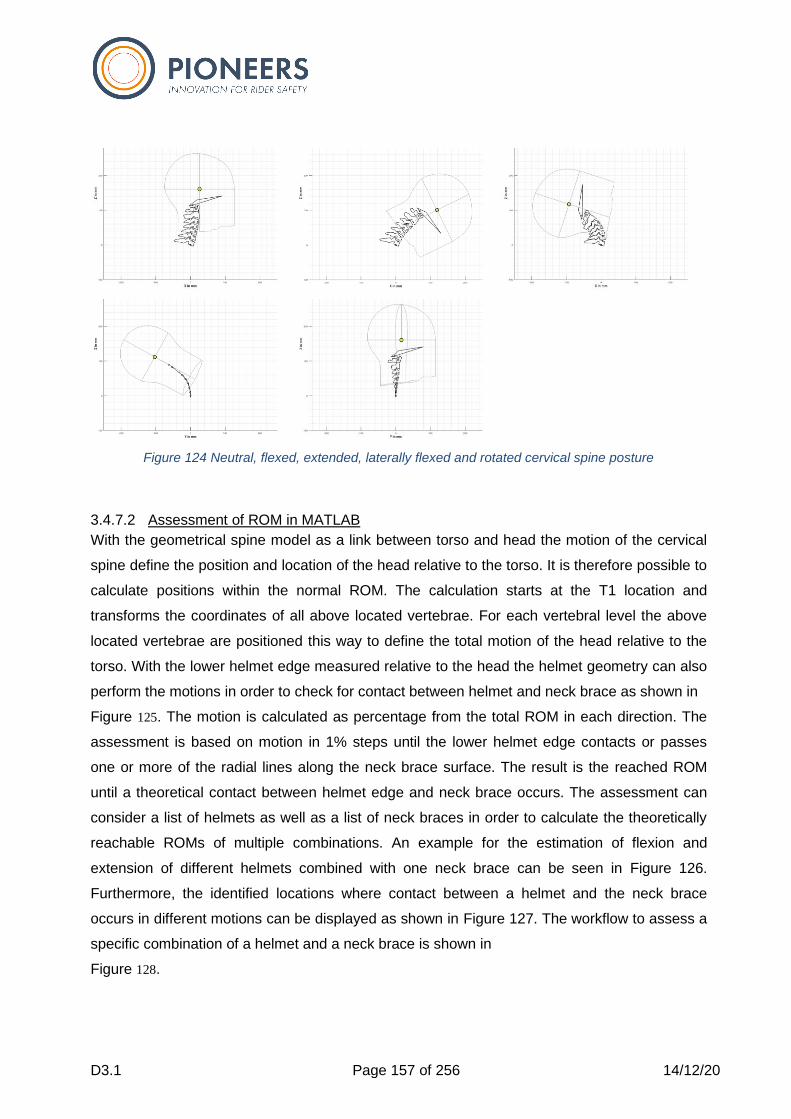
D3.1 Page 157 of 256 14/12/20
Figure 124 Neutral, flexed, extended, laterally flexed and rotated cervical spine posture
3.4.7.2 Assessment of ROM in MATLAB
With the geometrical spine model as a link between torso and head the motion of the cervical
spine define the position and location of the head relative to the torso. It is therefore possible to
calculate positions within the normal ROM. The calculation starts at the T1 location and
transforms the coordinates of all above located vertebrae. For each vertebral level the above
located vertebrae are positioned this way to define the total motion of the head relative to the
torso. With the lower helmet edge measured relative to the head the helmet geometry can also
perform the motions in order to check for contact between helmet and neck brace as shown in
Figure 125. The motion is calculated as percentage from the total ROM in each direction. The
assessment is based on motion in 1% steps until the lower helmet edge contacts or passes
one or more of the radial lines along the neck brace surface. The result is the reached ROM
until a theoretical contact between helmet edge and neck brace occurs. The assessment can
consider a list of helmets as well as a list of neck braces in order to calculate the theoretically
reachable ROMs of multiple combinations. An example for the estimation of flexion and
extension of different helmets combined with one neck brace can be seen in Figure 126.
Furthermore, the identified locations where contact between a helmet and the neck brace
occurs in different motions can be displayed as shown in Figure 127. The workflow to assess a
specific combination of a helmet and a neck brace is shown in
Figure 128.
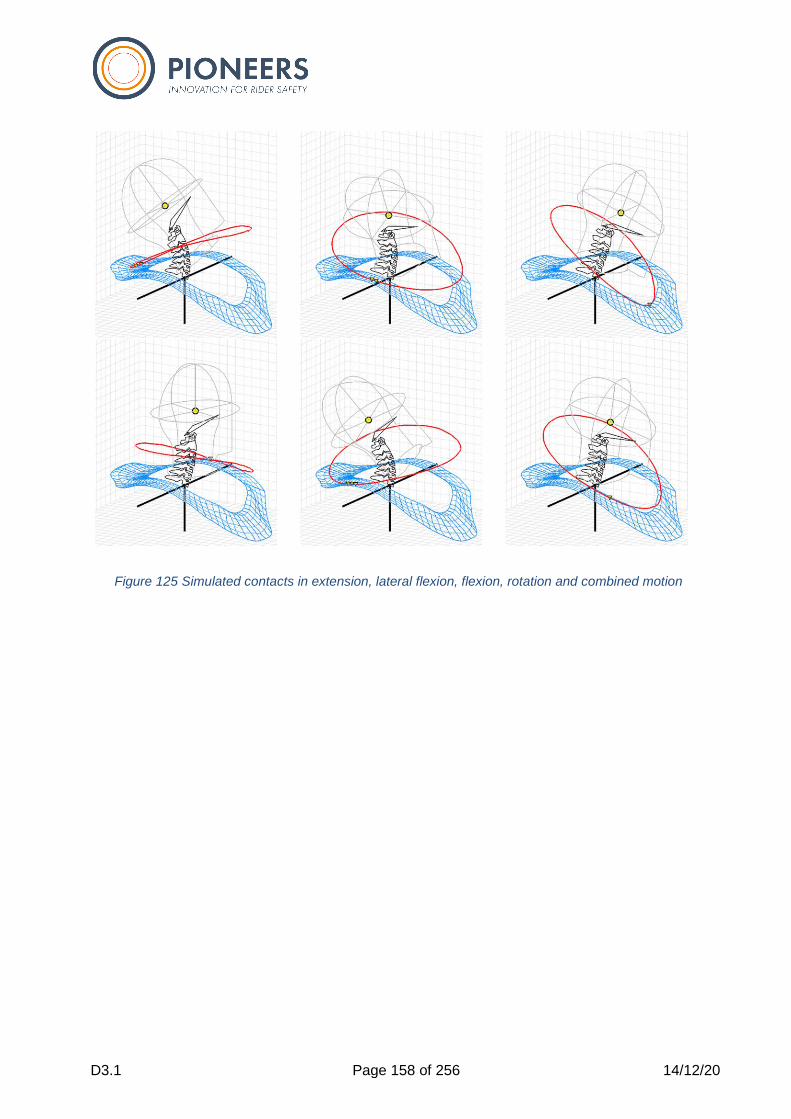
D3.1 Page 158 of 256 14/12/20
Figure 125 Simulated contacts in extension, lateral flexion, flexion, rotation and combined motion

D3.1 Page 159 of 256 14/12/20
Figure 126 Theoretically possible extension and flexion of different helmets combined with one neck
brace. The percentages are relative to the full extension (72°) and full flexion (64°).
Figure 127 Contact locations between multiple helmets and one neck brace due to head motion in
different directions
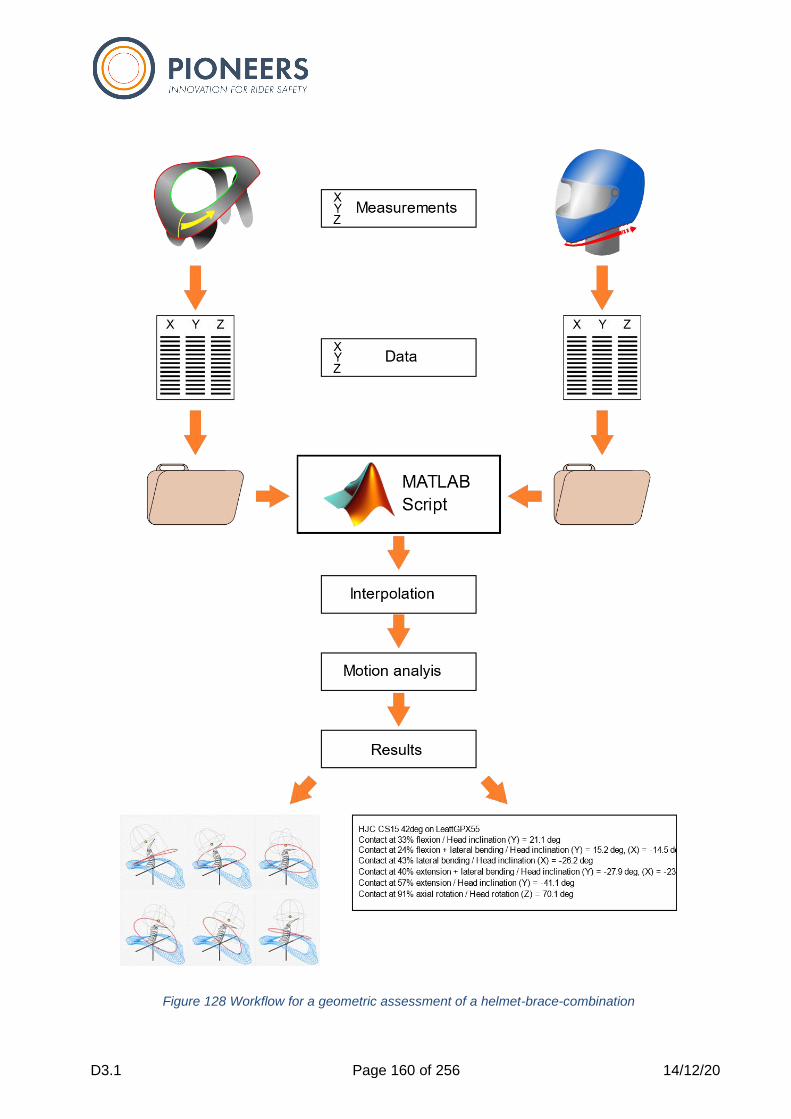
D3.1 Page 160 of 256 14/12/20
Figure 128 Workflow for a geometric assessment of a helmet-brace-combination
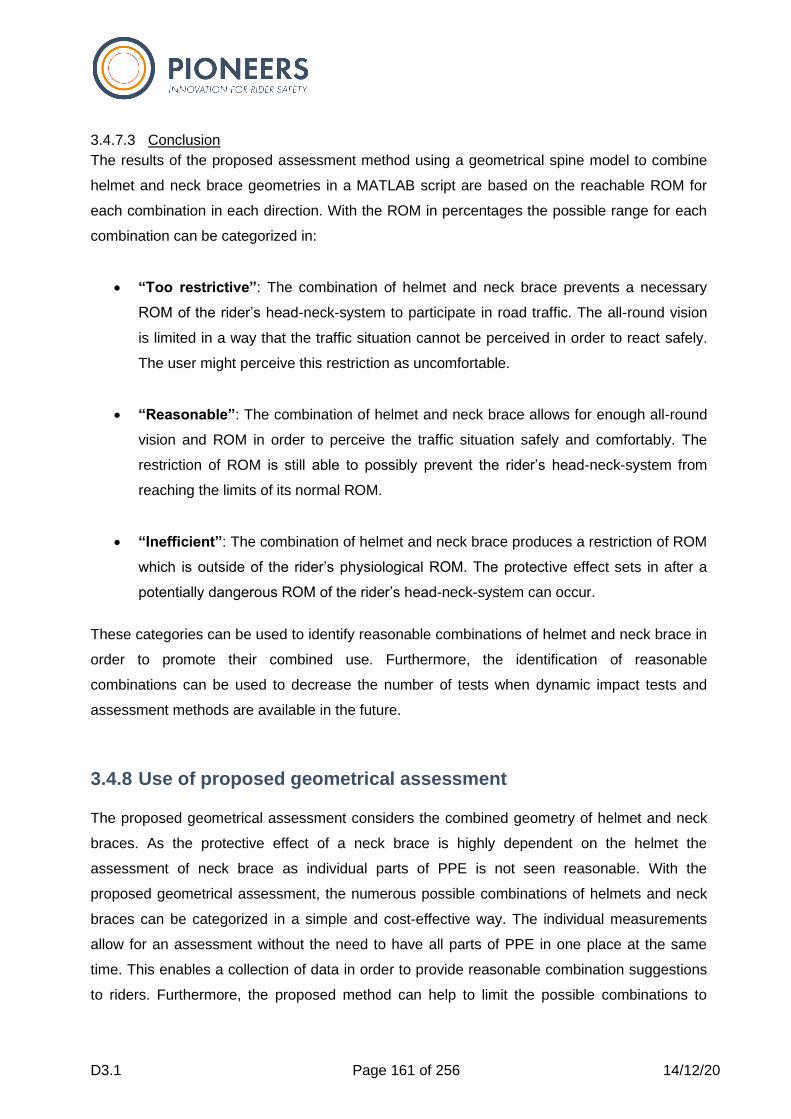
D3.1 Page 161 of 256 14/12/20
3.4.7.3 Conclusion
The results of the proposed assessment method using a geometrical spine model to combine
helmet and neck brace geometries in a MATLAB script are based on the reachable ROM for
each combination in each direction. With the ROM in percentages the possible range for each
combination can be categorized in:
• “Too restrictive”: The combination of helmet and neck brace prevents a necessary
ROM of the rider’s head-neck-system to participate in road traffic. The all-round vision
is limited in a way that the traffic situation cannot be perceived in order to react safely.
The user might perceive this restriction as uncomfortable.
• “Reasonable”: The combination of helmet and neck brace allows for enough all-round
vision and ROM in order to perceive the traffic situation safely and comfortably. The
restriction of ROM is still able to possibly prevent the rider’s head-neck-system from
reaching the limits of its normal ROM.
• “Inefficient”: The combination of helmet and neck brace produces a restriction of ROM
which is outside of the rider’s physiological ROM. The protective effect sets in after a
potentially dangerous ROM of the rider’s head-neck-system can occur.
These categories can be used to identify reasonable combinations of helmet and neck brace in
order to promote their combined use. Furthermore, the identification of reasonable
combinations can be used to decrease the number of tests when dynamic impact tests and
assessment methods are available in the future.
3.4.8 Use of proposed geometrical assessment
The proposed geometrical assessment considers the combined geometry of helmet and neck
braces. As the protective effect of a neck brace is highly dependent on the helmet the
assessment of neck brace as individual parts of PPE is not seen reasonable. With the
proposed geometrical assessment, the numerous possible combinations of helmets and neck
braces can be categorized in a simple and cost-effective way. The individual measurements
allow for an assessment without the need to have all parts of PPE in one place at the same
time. This enables a collection of data in order to provide reasonable combination suggestions
to riders. Furthermore, the proposed method can help to limit the possible combinations to
D3.1 Page 162 of 256 14/12/20
reasonable ones in order to decrease the effort and costs when more advanced test methods
for neck braces are available in the future.
However, the proposed test method is based on multiple assumptions and simplifications. The
underlying idea is that the normal ROM of the head-neck-system can be used without any risk
of injury while exceeding the normal ROM increases the risk of injury. It does not consider
injurious effects occurring within the physiological ROM or other kind of injury not related to
motion. The consideration of helmet and neck brace geometries based on static measurements
does not reflect dynamic situations with applied loading. Furthermore, the positions of helmets
and neck braces have an influence on the results calculated by this static method. As the
position of helmets and neck braces are not defined in realistic and still comparable ways,
further work needs to be done in order to define a more suitable Helmet Positioning Index (HPI)
as well as to establish a new Neck Brace Positioning Index (NBPI). The used geometries to
position helmets and neck braces as well as to simulate the motions do only show average
dimensions and characteristics. Individual ROM or dimensions, which are found in reality,
cannot be assessed for all situations. This is also true for the interaction with other items of
PPE. The neck brace is normally worn on top of a protective jacket. This can lead to different
neck brace positions compared to other jackets (e.g. without a back protector) as well as to
changes in position when parts of the jacket follow the movement of the arms. In dynamic
situations such as PTW accidents the rider’s posture can change dramatically which can
influence the interaction between and the protection of helmets and neck braces.
All simplifications and assumptions emphasize the need for further research and the definition
of proper assessment conditions and thresholds. As the next step to further improve the
assessment of neck braces, the definition of helmet and neck brace positioning indices should
be considered in cooperation with manufacturers, test houses and experts in biomechanics.
For short term implementation of such geometrical assessment method the results of multiple
combinations can be used to help riders reasonably purchasing PPE elements. Cooperation
between helmet and neck brace manufacturers could include such data in marketing to
promote the use of neck braces in reasonable combinations with helmets.
For future development of neck brace test methods, the geometrical data could be used to
identify impact locations and directions between helmet and neck brace in order to generalize
loading and to enable the use of component tests without the need to test a neck brace in
combination with an actual helmet. This would help to eliminate the influence of a helmet in
order to assess the neck brace independently.
D3.1 Page 163 of 256 14/12/20
Furthermore, developments regarding a neck brace test method should also consider dynamic
loading as well as a more detailed neck injury assessment. The following section reports on
activities conducted in WP2 regarding model-based injury criteria. This report is seen as
beneficial input for future developments of a neck brace test method.
3.4.9 Model based criteria
3.4.9.1 Introduction
Finite Element Models (FEM) of the neck have been developed and validated since 1990s. (
[50] [51] [52]) More recently, detailed neck FEMs have been developed with volumetric
meshing of the vertebrae and flesh, descriptions of the intervertebral disc, and implementation
of nonlinear ligament behavior. ( [53] [54] [55]) Typically, the validations of these recent neck
FEMs are based on experimental responses of human volunteers under specific loading
conditions. ( [56] [57] [58]) In addition, validation has been done in the frequency domain based
on the modal analysis. [59] Studies have also included the active response of the spine
musculature. ( [60] [61] [62] [63]) Despite these efforts, few models have simulated real world
crash scenarios or used human cadaver sled tests to define neck tolerances. The objective of
this section is, after a short presentation of an existing recent neck FEM, to validate it and to
present first neck injury risk curves developed during this project under monodirectional
loadings. This recent neck FEM (Strasbourg University Finite Element Head-Neck Model
SUFEHNM2020) with its own tolerance limits will be helpful when new neck brace test method
will be proposed in the future.
This chapter 3.4.9 is a part of the work initially planned in task 2.3 “Head-Neck mechanic” and
the work done by UNISTRA is reported in the present deliverable. Although the assessment of
neck injuries is not used in the geometric assessment of neck braces proposed in the
PIONEERS project the inclusion of this section is seen beneficial for future developments
regarding neck brace assessments.
3.4.9.2 Strasbourg Finite Element Head-Neck Model (SUFEHNM2020) meshing presentation
In order to take into account the last research-developments in terms of mechanical properties,
software ability and computational cost, the existing neck FEM ( [59] [64] [65]) was rethinking
and briefly described here after.
The initial geometry is based on CT-Scans of a healthy volunteer of average size and close to
the 50th percentile male (47 years old, 1.72 m). The scanner sections underwent segmentation
in order to extract a superficial tria-mesh in stereolithographic (STL) format of the bony
D3.1 Page 164 of 256 14/12/20
structures. Then, the STL-file format was imported into the Hypermesh V14.0 Software (Altair,
Troy, MI).
The assumption is made that the model is symmetrical in the sagittal plane. An average
element size of 2 mm is chosen for the discretization.
To reproduce the right inertia and mass of each cervical vertebrae, the cancellous bone was
discretized by using hexahedrons, the cortical bone, and the endplate parts by using shell
elements.
Concerning the intervertebral disc, the nucleus pulposus is a jelly-like core, which is
surrounded by the annulus ground and meshed with hexahedral elements. The annulus
fibrosus is a composite structure represented by five fiber layers of shell elements distributed in
concentric lamellae with alternating fiber angles (±25° in the outer layers to ±45° in the inner
layers). [66] An illustration is proposed through Figure 129a.
All the main ligaments were included in the FEM: Anterior Posterior Ligament (ALL), Posterior
Longitudinal Ligament (PLL), Capsular Ligament (CL), Flavum Ligament (FV), Interspinous
Ligament (ISL) for the lower ligament system, Posterior and Anterior Atlanto-Axial Membranes
(PAAM, AAAM), Anterior and Posterior Atlanto Occipital Membranes (AAOM, PAOM),
Transverse Ligament (TL), Capsular Ligament (CL), Alair-occipital ligament, Apical Ligament
(AL), Tectorial Membrane (TM), Interspinous Ligament (C2-C1) for the upper ligamentary
system. The number of spring element of each ligament has been adapted to each cervical
level to minimize stresses on the common node between the spring and the bone where they
are fixed (Figure 129b).
Concerning the muscle part, it was assumed to reproduce only the passive force, so to not take
into account the effect of the muscle’s activities on the head-neck response. Therefore, only
hexahedrons elements were used to model this anatomical part.
The head FEM coupled to the developed neck FEM is the Strasbourg University FE Head
Model (SUFEHM). [67]
The coupled Head-Neck FEM has a total of 73585 elements (44893 brick elements, 28104
shell elements and 588 spring elements) and is presented in Figure 129c.
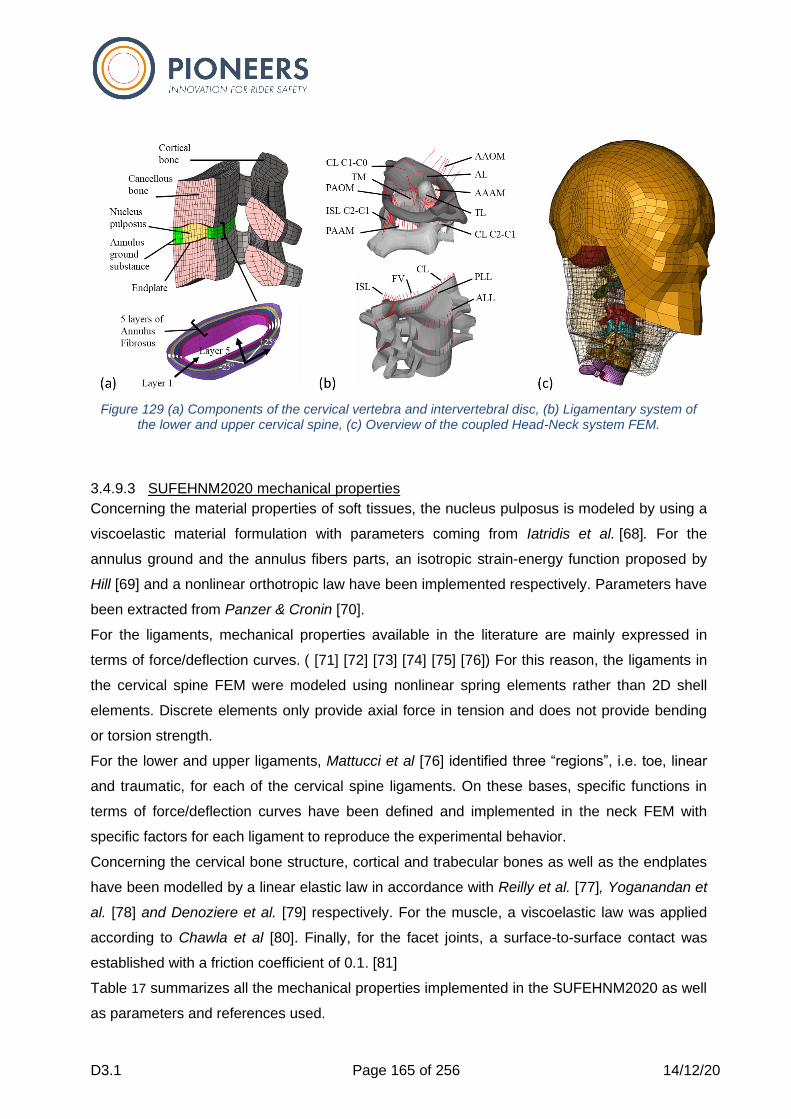
D3.1 Page 165 of 256 14/12/20
Figure 129 (a) Components of the cervical vertebra and intervertebral disc, (b) Ligamentary system of
the lower and upper cervical spine, (c) Overview of the coupled Head-Neck system FEM.
3.4.9.3 SUFEHNM2020 mechanical properties
Concerning the material properties of soft tissues, the nucleus pulposus is modeled by using a
viscoelastic material formulation with parameters coming from Iatridis et al. [68]. For the
annulus ground and the annulus fibers parts, an isotropic strain-energy function proposed by
Hill [69] and a nonlinear orthotropic law have been implemented respectively. Parameters have
been extracted from Panzer & Cronin [70].
For the ligaments, mechanical properties available in the literature are mainly expressed in
terms of force/deflection curves. ( [71] [72] [73] [74] [75] [76]) For this reason, the ligaments in
the cervical spine FEM were modeled using nonlinear spring elements rather than 2D shell
elements. Discrete elements only provide axial force in tension and does not provide bending
or torsion strength.
For the lower and upper ligaments, Mattucci et al [76] identified three “regions”, i.e. toe, linear
and traumatic, for each of the cervical spine ligaments. On these bases, specific functions in
terms of force/deflection curves have been defined and implemented in the neck FEM with
specific factors for each ligament to reproduce the experimental behavior.
Concerning the cervical bone structure, cortical and trabecular bones as well as the endplates
have been modelled by a linear elastic law in accordance with Reilly et al. [77], Yoganandan et
al. [78] and Denoziere et al. [79] respectively. For the muscle, a viscoelastic law was applied
according to Chawla et al [80]. Finally, for the facet joints, a surface-to-surface contact was
established with a friction coefficient of 0.1. [81]
Table 17 summarizes all the mechanical properties implemented in the SUFEHNM2020 as well
as parameters and references used.
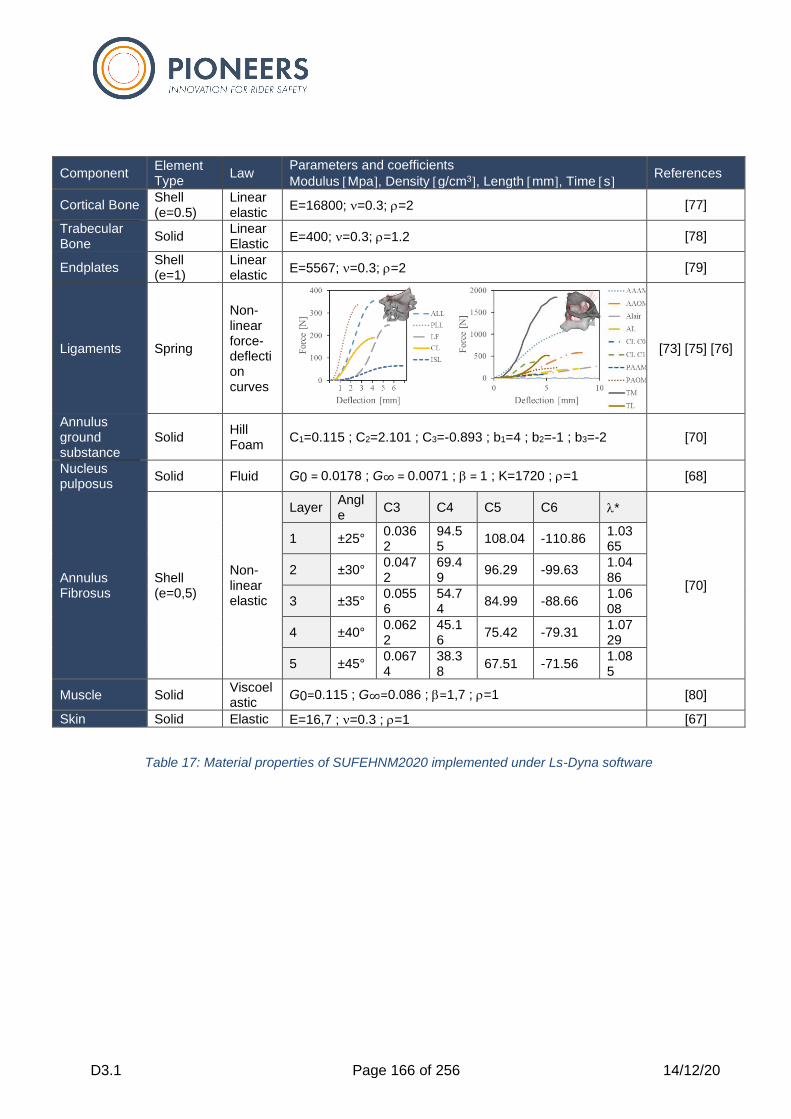
D3.1 Page 166 of 256 14/12/20
Component Element Type
Law Parameters and coefficients
Modulus Mpa, Density g/cm3, Length mm, Time s References
Cortical Bone Shell (e=0.5)
Linear elastic
E=16800; =0.3; =2 [77]
Trabecular Bone
Solid Linear Elastic
E=400; =0.3; =1.2 [78]
Endplates Shell (e=1)
Linear elastic
E=5567; =0.3; =2 [79]
Ligaments Spring
Non-linear force-deflection curves
[73] [75] [76]
Annulus ground substance
Solid Hill Foam
C1=0.115 ; C2=2.101 ; C3=-0.893 ; b1=4 ; b2=-1 ; b3=-2 [70]
Nucleus pulposus
Solid Fluid G0 = 0.0178 ; G∞ = 0.0071 ; = 1 ; K=1720 ; =1 [68]
Annulus Fibrosus
Shell (e=0,5)
Non-linear elastic
Layer Angle
C3 C4 C5 C6 *
[70]
1 ±25° 0.0362
94.55
108.04 -110.86 1.0365
2 ±30° 0.0472
69.49
96.29 -99.63 1.0486
3 ±35° 0.0556
54.74
84.99 -88.66 1.0608
4 ±40° 0.0622
45.16
75.42 -79.31 1.0729
5 ±45° 0.0674
38.38
67.51 -71.56 1.085
Muscle Solid Viscoelastic
G0=0.115 ; G∞=0.086 ; =1,7 ; =1 [80]
Skin Solid Elastic E=16,7 ; =0.3 ; =1 [67]
Table 17: Material properties of SUFEHNM2020 implemented under Ls-Dyna software
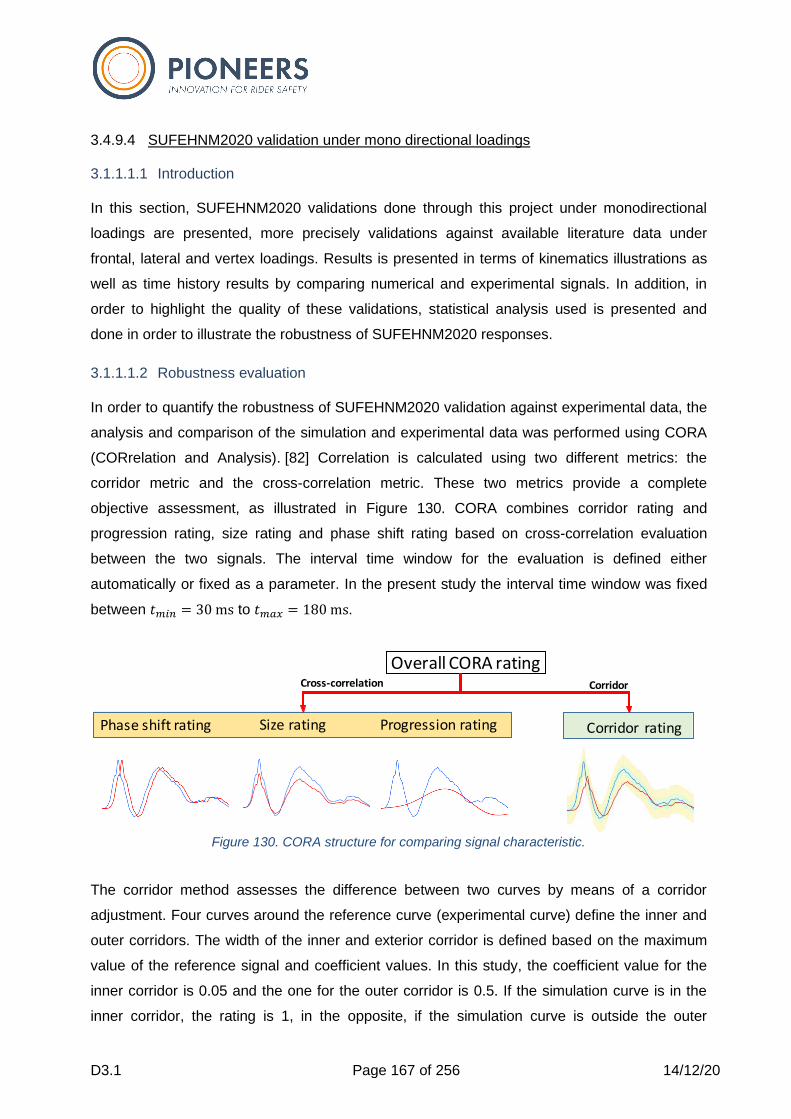
D3.1 Page 167 of 256 14/12/20
3.4.9.4 SUFEHNM2020 validation under mono directional loadings
3.1.1.1.1 Introduction
In this section, SUFEHNM2020 validations done through this project under monodirectional
loadings are presented, more precisely validations against available literature data under
frontal, lateral and vertex loadings. Results is presented in terms of kinematics illustrations as
well as time history results by comparing numerical and experimental signals. In addition, in
order to highlight the quality of these validations, statistical analysis used is presented and
done in order to illustrate the robustness of SUFEHNM2020 responses.
3.1.1.1.2 Robustness evaluation
In order to quantify the robustness of SUFEHNM2020 validation against experimental data, the
analysis and comparison of the simulation and experimental data was performed using CORA
(CORrelation and Analysis). [82] Correlation is calculated using two different metrics: the
corridor metric and the cross-correlation metric. These two metrics provide a complete
objective assessment, as illustrated in Figure 130. CORA combines corridor rating and
progression rating, size rating and phase shift rating based on cross-correlation evaluation
between the two signals. The interval time window for the evaluation is defined either
automatically or fixed as a parameter. In the present study the interval time window was fixed
between 𝑡𝑚𝑖𝑛 = 30 ms to 𝑡𝑚𝑎𝑥 = 180 ms.
Figure 130. CORA structure for comparing signal characteristic.
The corridor method assesses the difference between two curves by means of a corridor
adjustment. Four curves around the reference curve (experimental curve) define the inner and
outer corridors. The width of the inner and exterior corridor is defined based on the maximum
value of the reference signal and coefficient values. In this study, the coefficient value for the
inner corridor is 0.05 and the one for the outer corridor is 0.5. If the simulation curve is in the
inner corridor, the rating is 1, in the opposite, if the simulation curve is outside the outer
Phase shift rating Size rating Progression rating
Cross-correlation
Corridor rating
Overall CORA rating Corridor
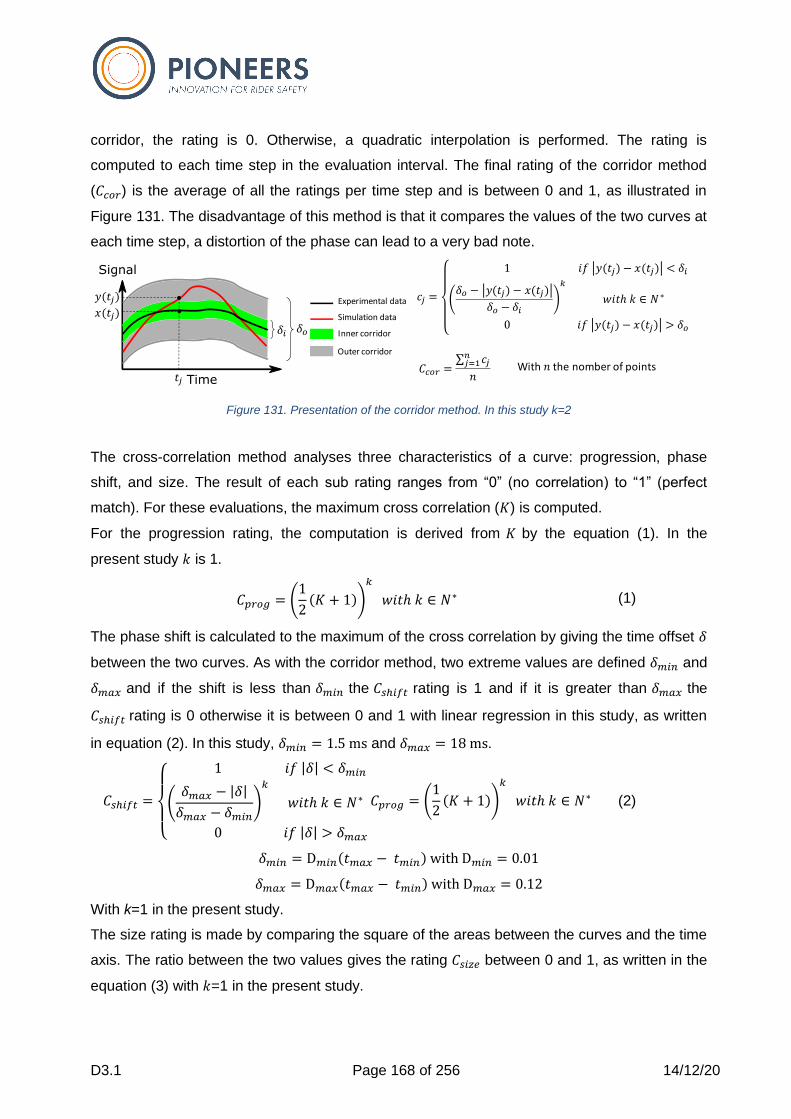
D3.1 Page 168 of 256 14/12/20
corridor, the rating is 0. Otherwise, a quadratic interpolation is performed. The rating is
computed to each time step in the evaluation interval. The final rating of the corridor method
(𝐶𝑐𝑜𝑟) is the average of all the ratings per time step and is between 0 and 1, as illustrated in
Figure 131. The disadvantage of this method is that it compares the values of the two curves at
each time step, a distortion of the phase can lead to a very bad note.
Figure 131. Presentation of the corridor method. In this study k=2
The cross-correlation method analyses three characteristics of a curve: progression, phase
shift, and size. The result of each sub rating ranges from “0” (no correlation) to “1” (perfect
match). For these evaluations, the maximum cross correlation (𝐾) is computed.
For the progression rating, the computation is derived from 𝐾 by the equation (1). In the
present study 𝑘 is 1.
𝐶𝑝𝑟𝑜𝑔 = (1
2(𝐾 + 1))
𝑘
𝑤𝑖𝑡ℎ 𝑘 ∈ 𝑁∗ (1)
The phase shift is calculated to the maximum of the cross correlation by giving the time offset 𝛿
between the two curves. As with the corridor method, two extreme values are defined 𝛿𝑚𝑖𝑛 and
𝛿𝑚𝑎𝑥 and if the shift is less than 𝛿𝑚𝑖𝑛 the 𝐶𝑠ℎ𝑖𝑓𝑡 rating is 1 and if it is greater than 𝛿𝑚𝑎𝑥 the
𝐶𝑠ℎ𝑖𝑓𝑡 rating is 0 otherwise it is between 0 and 1 with linear regression in this study, as written
in equation (2). In this study, 𝛿𝑚𝑖𝑛 = 1.5 ms and 𝛿𝑚𝑎𝑥 = 18 ms.
𝐶𝑠ℎ𝑖𝑓𝑡 =
{
1 𝑖𝑓 |𝛿| < 𝛿𝑚𝑖𝑛
(𝛿𝑚𝑎𝑥 − |𝛿|
𝛿𝑚𝑎𝑥 − 𝛿𝑚𝑖𝑛)
𝑘
𝑤𝑖𝑡ℎ 𝑘 ∈ 𝑁∗
0 𝑖𝑓 |𝛿| > 𝛿𝑚𝑎𝑥
𝐶𝑝𝑟𝑜𝑔 = (1
2(𝐾 + 1))
𝑘
𝑤𝑖𝑡ℎ 𝑘 ∈ 𝑁∗ (2)
𝛿𝑚𝑖𝑛 = D𝑚𝑖𝑛(𝑡𝑚𝑎𝑥 − 𝑡𝑚𝑖𝑛) with D𝑚𝑖𝑛 = 0.01
𝛿𝑚𝑎𝑥 = D𝑚𝑎𝑥(𝑡𝑚𝑎𝑥 − 𝑡𝑚𝑖𝑛) with D𝑚𝑎𝑥 = 0.12
With k=1 in the present study.
The size rating is made by comparing the square of the areas between the curves and the time
axis. The ratio between the two values gives the rating 𝐶𝑠𝑖𝑧𝑒 between 0 and 1, as written in the
equation (3) with 𝑘=1 in the present study.
Experimental data
Simulation data
Inner corridor
Outer corridor
𝛿𝑖 𝛿𝑜
𝑡
𝑦(𝑡 )
𝑥(𝑡 )
𝐶𝑐𝑜𝑟 = 𝑐
𝑛 1
𝑛With 𝑛 the nomber of points
D3.1 Page 169 of 256 14/12/20
𝐶𝑠𝑖𝑧𝑒 =
{
(
𝐹𝑥𝐹𝑦)
𝑘
𝑖𝑓 𝐹𝑥 < 𝐹𝑦
(𝐹𝑦
𝐹𝑥)𝑘
𝑖𝑓 𝐹𝑥 > 𝐹𝑦
𝑤𝑖𝑡ℎ 𝑘 ∈ 𝑁∗ (3)
𝐹𝑥 = 𝑥2(𝑡𝑚𝑖𝑛 + 𝛿 + 𝑖 ∙ ∆𝑡)𝑛𝑖 1 and 𝐹𝑦 = 𝑦2(𝑡𝑚𝑖𝑛 + 𝑖 ∙ ∆𝑡)𝑛
𝑖 1 with ∆𝑡 is the constant time
interval and 𝛿 is the time offset.
The overall evaluation 𝐶𝑜𝑣𝑒𝑟𝑎𝑙𝑙 is a combination of the three cross correlation sub-ratings and
corridor rating as written the equation (4). In the present study it was considered to define the
same the weight all ratings.
𝐶𝑜𝑣𝑒𝑟𝑎𝑙𝑙 = 𝜔𝑐𝑜𝑟 ∙ 𝐶𝑐𝑜𝑟 +𝜔𝑝𝑟𝑜𝑔 ∙ 𝐶𝑝𝑟𝑜𝑔 +𝜔𝑠𝑖𝑧𝑒 ∙ 𝐶𝑠𝑖𝑧𝑒 +𝜔𝑠ℎ𝑖𝑓𝑡 ∙ 𝐶𝑠ℎ𝑖𝑓𝑡 (4)
With 𝜔𝑐𝑜𝑟 = 𝜔𝑝𝑟𝑜𝑔 = 𝜔𝑠𝑖𝑧𝑒 = 𝜔𝑠ℎ𝑖𝑓𝑡 = 0.25
3.1.1.1.3 Validation under Frontal loading
Finite element models of adult necks are typically validated against experimental data carried
out by the Naval Biodynamics Laboratory (NBDL) under frontal loading. [58] Sled tests ranging
from 3-15 G severity were performed on volunteers restrained by a harness belt on a rigid seat.
Accelerations were recorded using a head bracket and a lower neck bracket, which was
strapped to the back at T1 level. These tests were analyzed resulting in response corridors.
These corridors were used for validation of the whole human body model. The advantage of
the N.B.D.L tests is that they are well instrumented tests carried out on volunteers and quite
violent.
The T1 time-history rotation recorded experimentally is used like boundary conditions for the
SUFEHNM2020 and is presented in Figure 132.
Results are expressed in terms of head rotation (flexion) as a function of time relative to Tl,
resultant head center of gravity linear acceleration as a function of time, the mid-sagittal head
rotational acceleration as a function of time as well as in terms of head trajectory as a function
of time relative to T1.
Comparison between FEM’s response and volunteer’s corridor are reported in terms of head
kinematics in
Figure 133 and in terms of head kinematics time-histories in Figure 134.
The head accelerations, displacements and rotations time histories computed with the neck
FEM exhibit similar shapes compared to the experimental data.
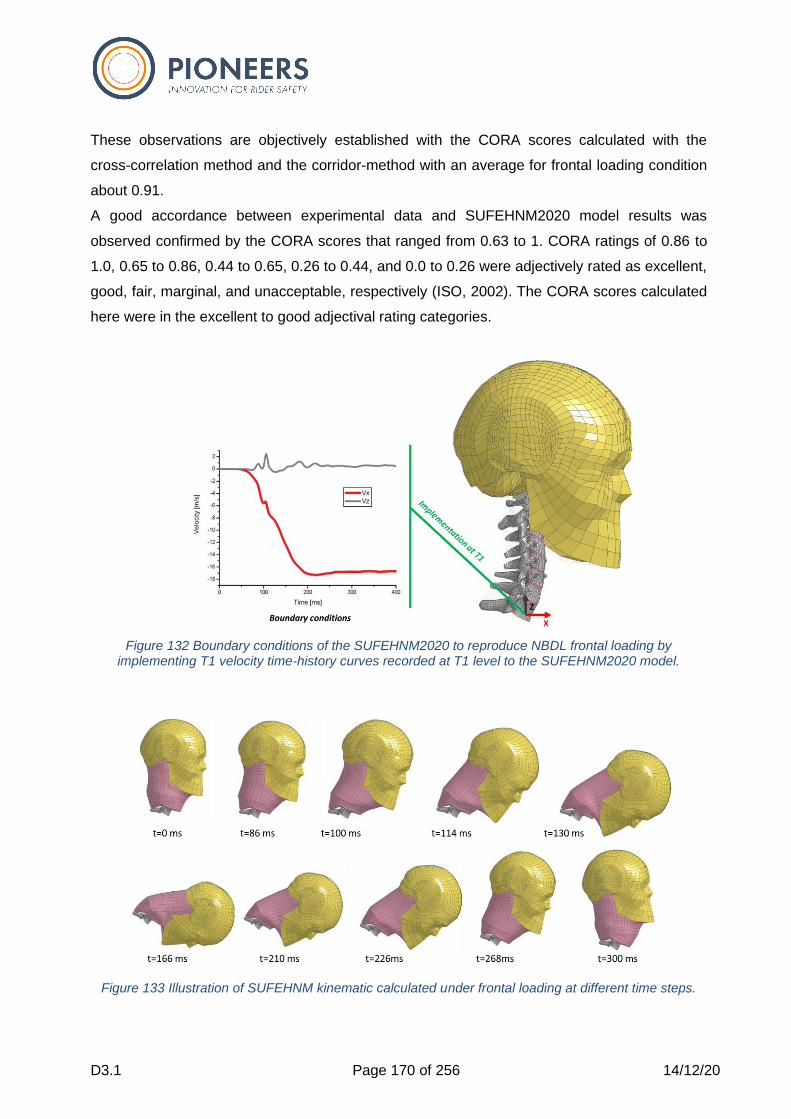
D3.1 Page 170 of 256 14/12/20
These observations are objectively established with the CORA scores calculated with the
cross-correlation method and the corridor-method with an average for frontal loading condition
about 0.91.
A good accordance between experimental data and SUFEHNM2020 model results was
observed confirmed by the CORA scores that ranged from 0.63 to 1. CORA ratings of 0.86 to
1.0, 0.65 to 0.86, 0.44 to 0.65, 0.26 to 0.44, and 0.0 to 0.26 were adjectively rated as excellent,
good, fair, marginal, and unacceptable, respectively (ISO, 2002). The CORA scores calculated
here were in the excellent to good adjectival rating categories.
Figure 132 Boundary conditions of the SUFEHNM2020 to reproduce NBDL frontal loading by
implementing T1 velocity time-history curves recorded at T1 level to the SUFEHNM2020 model.
Figure 133 Illustration of SUFEHNM kinematic calculated under frontal loading at different time steps.
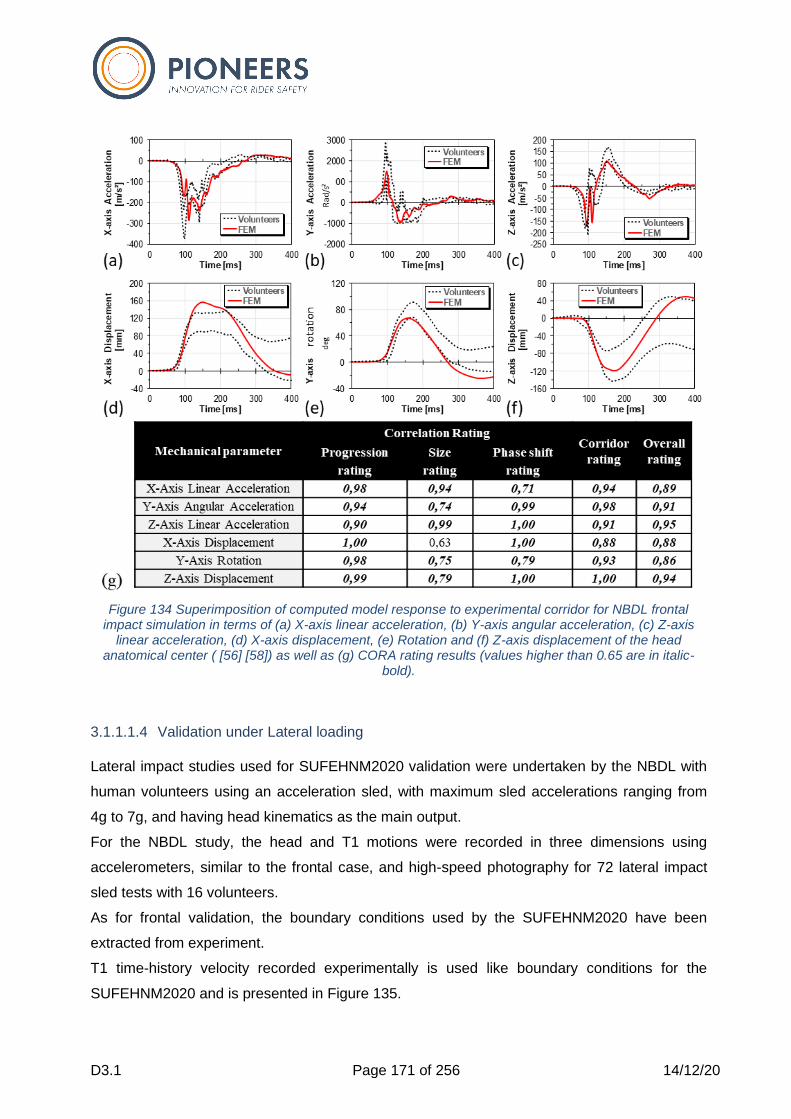
D3.1 Page 171 of 256 14/12/20
Figure 134 Superimposition of computed model response to experimental corridor for NBDL frontal
impact simulation in terms of (a) X-axis linear acceleration, (b) Y-axis angular acceleration, (c) Z-axis linear acceleration, (d) X-axis displacement, (e) Rotation and (f) Z-axis displacement of the head
anatomical center ( [56] [58]) as well as (g) CORA rating results (values higher than 0.65 are in italic-bold).
3.1.1.1.4 Validation under Lateral loading
Lateral impact studies used for SUFEHNM2020 validation were undertaken by the NBDL with
human volunteers using an acceleration sled, with maximum sled accelerations ranging from
4g to 7g, and having head kinematics as the main output.
For the NBDL study, the head and T1 motions were recorded in three dimensions using
accelerometers, similar to the frontal case, and high-speed photography for 72 lateral impact
sled tests with 16 volunteers.
As for frontal validation, the boundary conditions used by the SUFEHNM2020 have been
extracted from experiment.
T1 time-history velocity recorded experimentally is used like boundary conditions for the
SUFEHNM2020 and is presented in Figure 135.
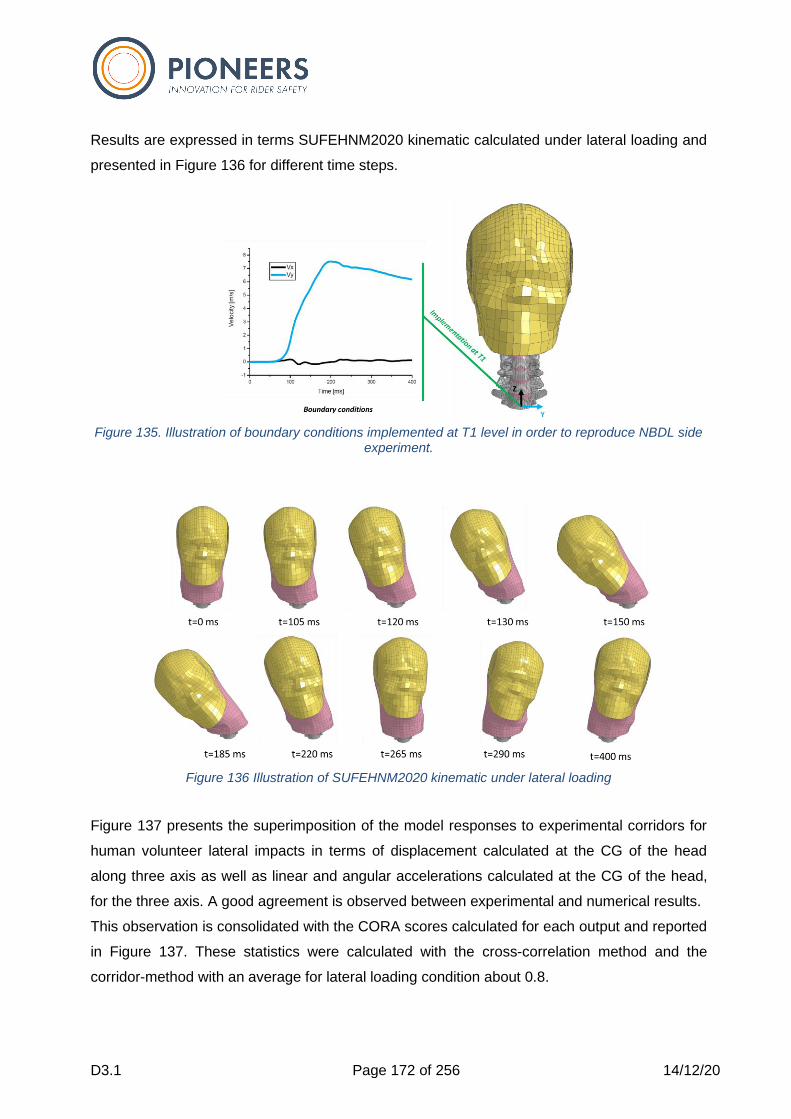
D3.1 Page 172 of 256 14/12/20
Results are expressed in terms SUFEHNM2020 kinematic calculated under lateral loading and
presented in Figure 136 for different time steps.
Figure 135. Illustration of boundary conditions implemented at T1 level in order to reproduce NBDL side
experiment.
Figure 136 Illustration of SUFEHNM2020 kinematic under lateral loading
Figure 137 presents the superimposition of the model responses to experimental corridors for
human volunteer lateral impacts in terms of displacement calculated at the CG of the head
along three axis as well as linear and angular accelerations calculated at the CG of the head,
for the three axis. A good agreement is observed between experimental and numerical results.
This observation is consolidated with the CORA scores calculated for each output and reported
in Figure 137. These statistics were calculated with the cross-correlation method and the
corridor-method with an average for lateral loading condition about 0.8.
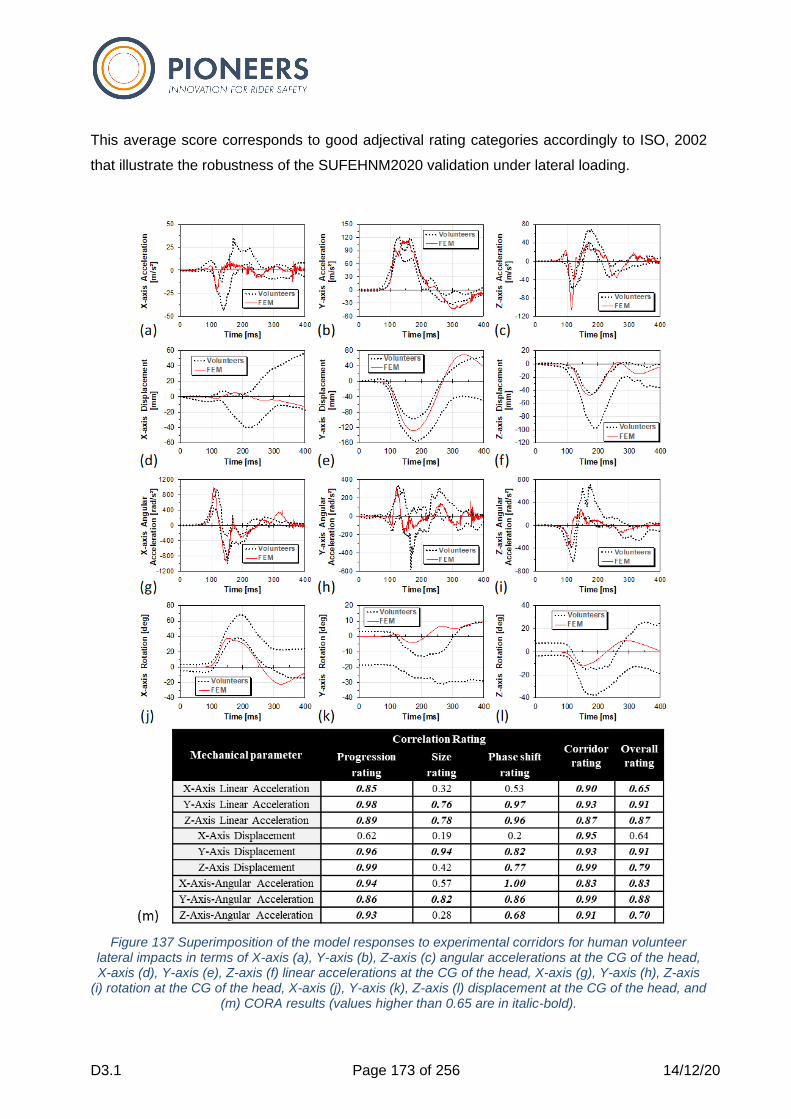
D3.1 Page 173 of 256 14/12/20
This average score corresponds to good adjectival rating categories accordingly to ISO, 2002
that illustrate the robustness of the SUFEHNM2020 validation under lateral loading.
Figure 137 Superimposition of the model responses to experimental corridors for human volunteer
lateral impacts in terms of X-axis (a), Y-axis (b), Z-axis (c) angular accelerations at the CG of the head, X-axis (d), Y-axis (e), Z-axis (f) linear accelerations at the CG of the head, X-axis (g), Y-axis (h), Z-axis
(i) rotation at the CG of the head, X-axis (j), Y-axis (k), Z-axis (l) displacement at the CG of the head, and (m) CORA results (values higher than 0.65 are in italic-bold).
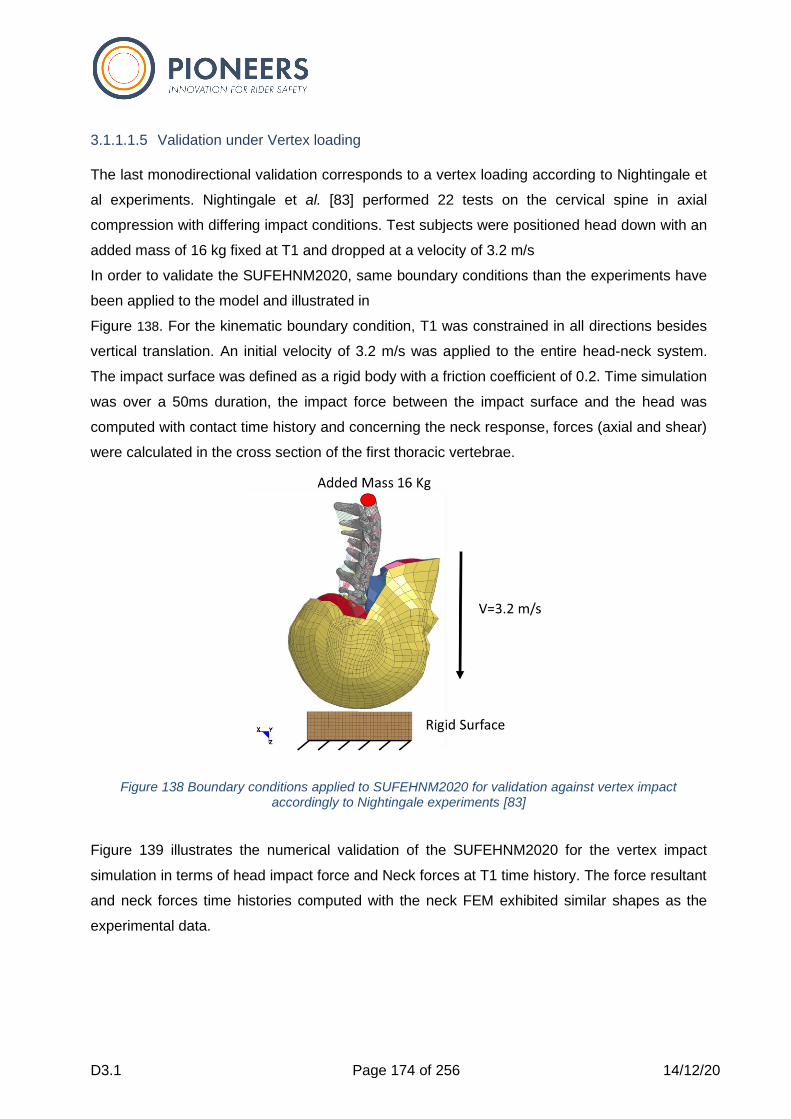
D3.1 Page 174 of 256 14/12/20
3.1.1.1.5 Validation under Vertex loading
The last monodirectional validation corresponds to a vertex loading according to Nightingale et
al experiments. Nightingale et al. [83] performed 22 tests on the cervical spine in axial
compression with differing impact conditions. Test subjects were positioned head down with an
added mass of 16 kg fixed at T1 and dropped at a velocity of 3.2 m/s
In order to validate the SUFEHNM2020, same boundary conditions than the experiments have
been applied to the model and illustrated in
Figure 138. For the kinematic boundary condition, T1 was constrained in all directions besides
vertical translation. An initial velocity of 3.2 m/s was applied to the entire head-neck system.
The impact surface was defined as a rigid body with a friction coefficient of 0.2. Time simulation
was over a 50ms duration, the impact force between the impact surface and the head was
computed with contact time history and concerning the neck response, forces (axial and shear)
were calculated in the cross section of the first thoracic vertebrae.
Figure 138 Boundary conditions applied to SUFEHNM2020 for validation against vertex impact accordingly to Nightingale experiments [83]
Figure 139 illustrates the numerical validation of the SUFEHNM2020 for the vertex impact
simulation in terms of head impact force and Neck forces at T1 time history. The force resultant
and neck forces time histories computed with the neck FEM exhibited similar shapes as the
experimental data.
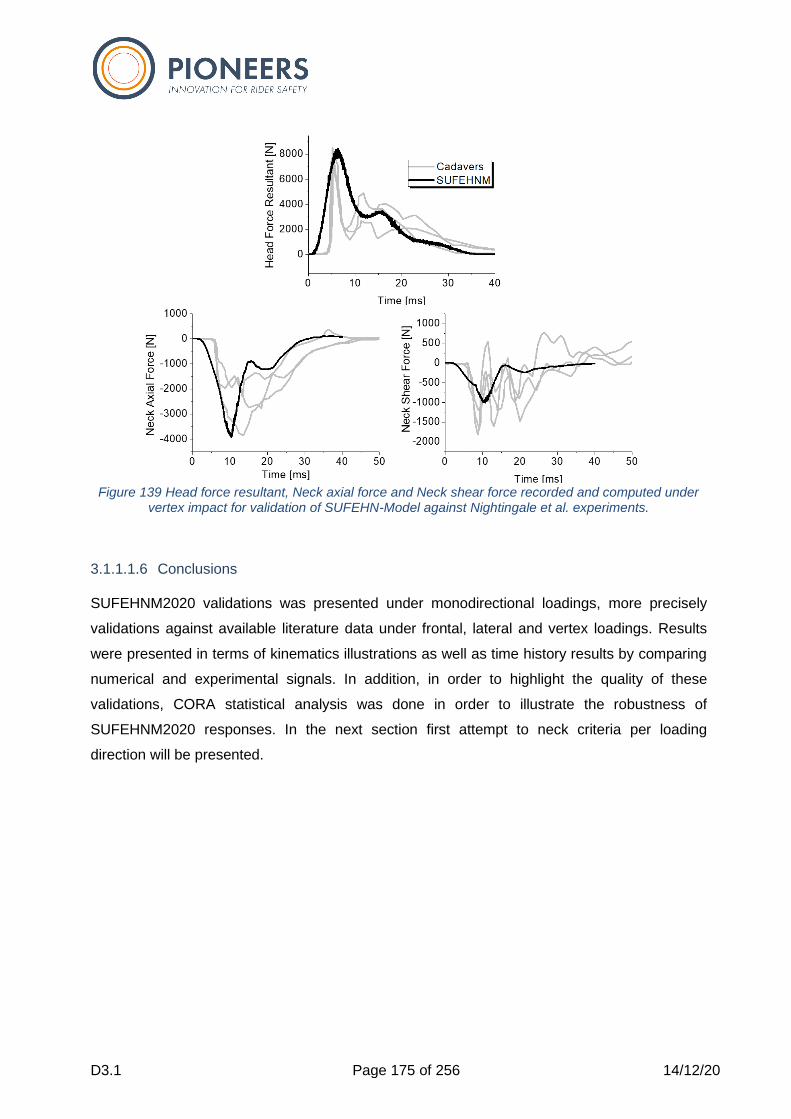
D3.1 Page 175 of 256 14/12/20
Figure 139 Head force resultant, Neck axial force and Neck shear force recorded and computed under
vertex impact for validation of SUFEHN-Model against Nightingale et al. experiments.
3.1.1.1.6 Conclusions
SUFEHNM2020 validations was presented under monodirectional loadings, more precisely
validations against available literature data under frontal, lateral and vertex loadings. Results
were presented in terms of kinematics illustrations as well as time history results by comparing
numerical and experimental signals. In addition, in order to highlight the quality of these
validations, CORA statistical analysis was done in order to illustrate the robustness of
SUFEHNM2020 responses. In the next section first attempt to neck criteria per loading
direction will be presented.
D3.1 Page 176 of 256 14/12/20
3.4.9.5 SUFEHNM2020 injury criteria under monodirectional loadings
3.1.1.1.7 Introduction
After the presentation of the Strasbourg University Finite Element Head Neck Model and its
validation against existing data under monodirectional loadings, this section presents first
attempt to neck criteria under frontal, lateral and rear loadings.
3.1.1.1.8 Neck injury criteria under frontal loading
Database used for neck criteria development under frontal loading study is based on the work
published by Pintar et al. [84]. Five specimens were clothed in leotards and seated in a custom
rigid seat: the seat pan was at an angle of 15 degrees with respect to the horizontal; the seat
back was at an angle of 25 degrees with respect to the vertical.
Each preparation was positioned in the seat by adjusting the head restraint such that it was in
contact with the occiput, and the Frankfort plane of the head was horizontal.
A generic three-point belt system with an adjustable D-ring restrained the specimen. The D-ring
was fixed in the fore-aft direction and was adjusted up and down to the specimen
anthropometry such that it was level with the auditory meatus.
Belt positioning followed FMVSS-208 specifications. To apply a generic belt pre-tensioner
scenario, the belt was pulled 10 cm at the D-ring after the FMVSS-208 belt positioning
procedure.
Concerning the instrumentation, a pyramid-shaped nine accelerometer package was attached
to the head of the specimen. [85] A custom mount was attached to the first thoracic vertebra
(T1).
To obtain the kinematics optically, a set of at least three non-collinear retro-reflective targets
were secured to the T1 using the accelerometer mount, described above. A similar array of
targets was attached to the outer periphery of the head. The above were digitized post test with
respect to local anatomical landmarks.
An illustration of the experimental device developed by Pintar et al. [84] is illustrated in Figure
140.

D3.1 Page 177 of 256 14/12/20
Figure 140. Photo of the experimental setup design by Pintar et al. [84]
Concerning the specimen’s specification and the matrix test, one specimen has 33 years old
and the four others have over 50 years with a total of mean age of 62 years old. Ten tests have
been done at 3,6 m/s, four at 6,9 m/s and two at 15,8 m/s. Three specimens presents an AIS 4
that consists of a dislocation or a fracture at the lower cervical level (T1-C6). Table 18
summarizes the test data and which cases have been simulated with the SUFEHNM2020.
Tests Specimen Age Velocity (m/s) Sled Acceleration (g) Ais Neck Simulated
Fc-133 1 74 3,6 10,2 0 No
Fc-134 1 74 6,9 18,3 4 No
Fc-197 2 33 3,6 9,8 0 Yes
Fc-198 2 33 6,9 17,4 0 Yes
Fc-199 2 33 3,6 9,7 0 Yes
Fc-200 2 33 15,8 19,2 0 Yes
Fc-207 3 71 3,6 11 0 Yes
Fc-208 3 71 6,9 17,8 0 Yes
Fc-209 3 71 3,6 11,5 0 Yes
Fc-210 3 71 15,8 18,3 4 Yes
Fc-220 4 83 3,6 11,6 0 Yes
Fc-221 4 83 6,9 18,5 0 Yes
Fc-222 4 83 3,6 11,9 4 No
Fc-237 5 50 3,6 11,2 0 Yes
Fc-238 5 50 6,9 19,3 0 Yes
Fc-239 5 50 3,6 12,1 0 Yes
Table 18 Summary of test data
In order to further validate the model but also with the intension to derive neck injury criteria
under frontal loading, a total of thirteen PMHS frontal impacts conducted at Medical College of
Wisconsin have been simulated. [84] At experimental level, the recorded accelerations from the
sensors were transformed to the T1 anatomical axes and inputted to the model. The head
center of gravity accelerations from the experiments were used as an additional validation
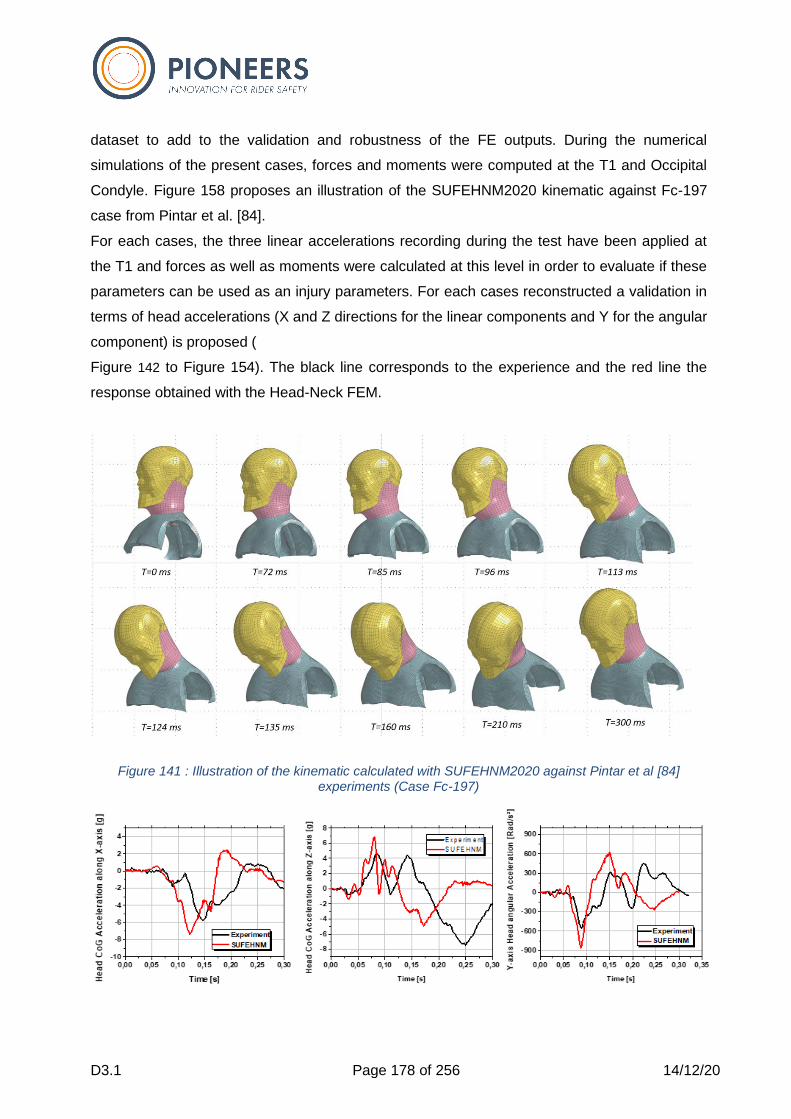
D3.1 Page 178 of 256 14/12/20
dataset to add to the validation and robustness of the FE outputs. During the numerical
simulations of the present cases, forces and moments were computed at the T1 and Occipital
Condyle. Figure 158 proposes an illustration of the SUFEHNM2020 kinematic against Fc-197
case from Pintar et al. [84].
For each cases, the three linear accelerations recording during the test have been applied at
the T1 and forces as well as moments were calculated at this level in order to evaluate if these
parameters can be used as an injury parameters. For each cases reconstructed a validation in
terms of head accelerations (X and Z directions for the linear components and Y for the angular
component) is proposed (
Figure 142 to Figure 154). The black line corresponds to the experience and the red line the
response obtained with the Head-Neck FEM.
Figure 141 : Illustration of the kinematic calculated with SUFEHNM2020 against Pintar et al [84] experiments (Case Fc-197)

D3.1 Page 179 of 256 14/12/20
Figure 142 SUFEHNM2020 response against FC-199 case from Pintar et al. [84]
Figure 143 SUFEHNM2020 response against FC-200 case from Pintar et al. [84]
Figure 144 SUFEHNM2020 response against FC-207 case from Pintar et al. [84]
Figure 145 SUFEHNM2020 response against FC-208 case from Pintar et al. [84]
Figure 146 SUFEHNM2020 response against FC-209 case from Pintar et al. [84]
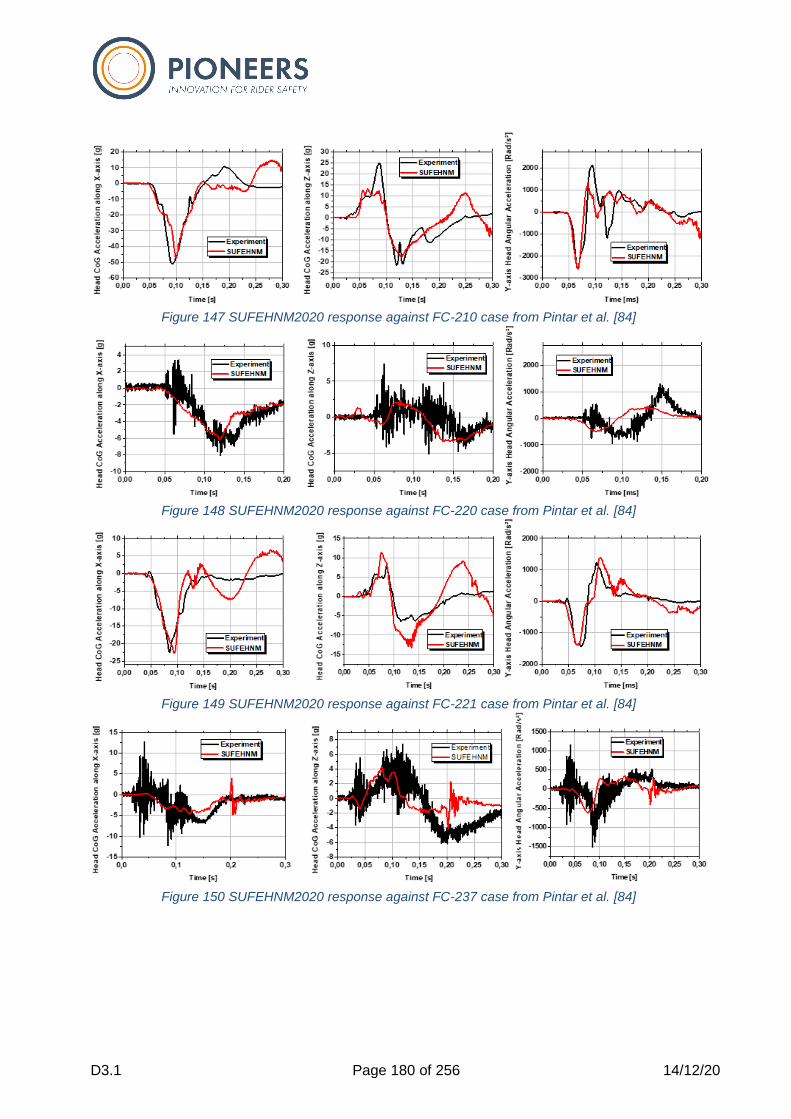
D3.1 Page 180 of 256 14/12/20
Figure 147 SUFEHNM2020 response against FC-210 case from Pintar et al. [84]
Figure 148 SUFEHNM2020 response against FC-220 case from Pintar et al. [84]
Figure 149 SUFEHNM2020 response against FC-221 case from Pintar et al. [84]
Figure 150 SUFEHNM2020 response against FC-237 case from Pintar et al. [84]
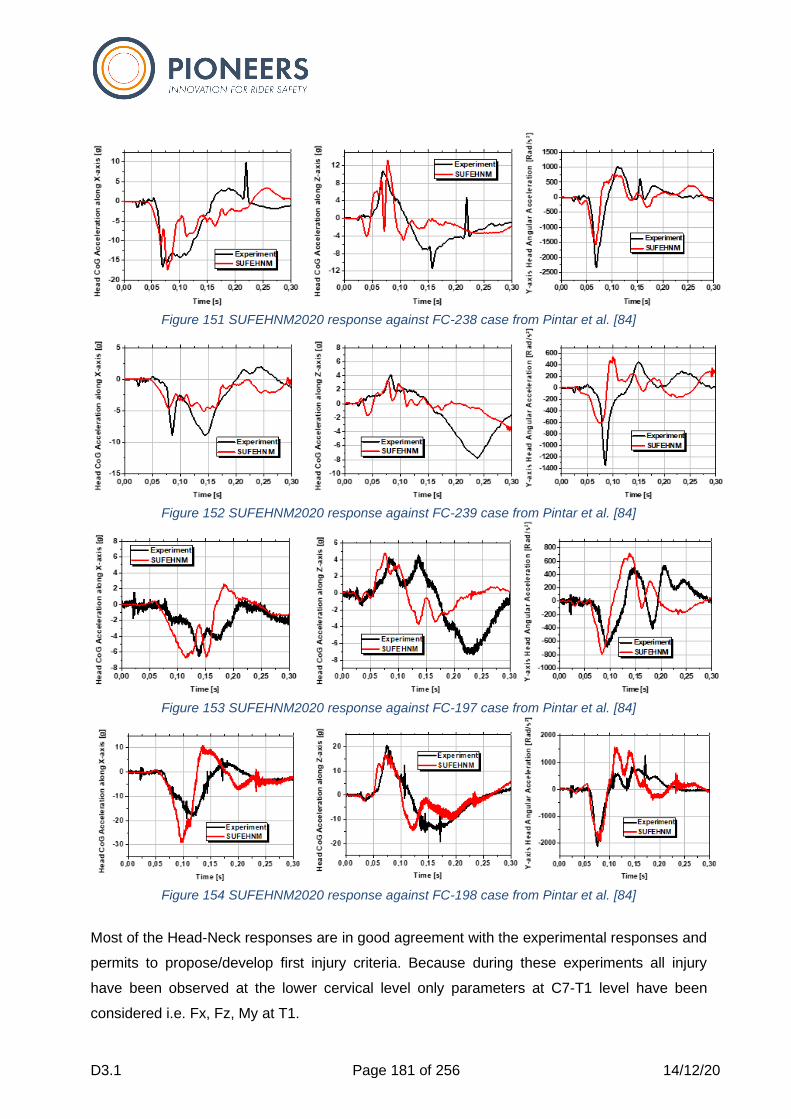
D3.1 Page 181 of 256 14/12/20
Figure 151 SUFEHNM2020 response against FC-238 case from Pintar et al. [84]
Figure 152 SUFEHNM2020 response against FC-239 case from Pintar et al. [84]
Figure 153 SUFEHNM2020 response against FC-197 case from Pintar et al. [84]
Figure 154 SUFEHNM2020 response against FC-198 case from Pintar et al. [84]
Most of the Head-Neck responses are in good agreement with the experimental responses and
permits to propose/develop first injury criteria. Because during these experiments all injury
have been observed at the lower cervical level only parameters at C7-T1 level have been
considered i.e. Fx, Fz, My at T1.
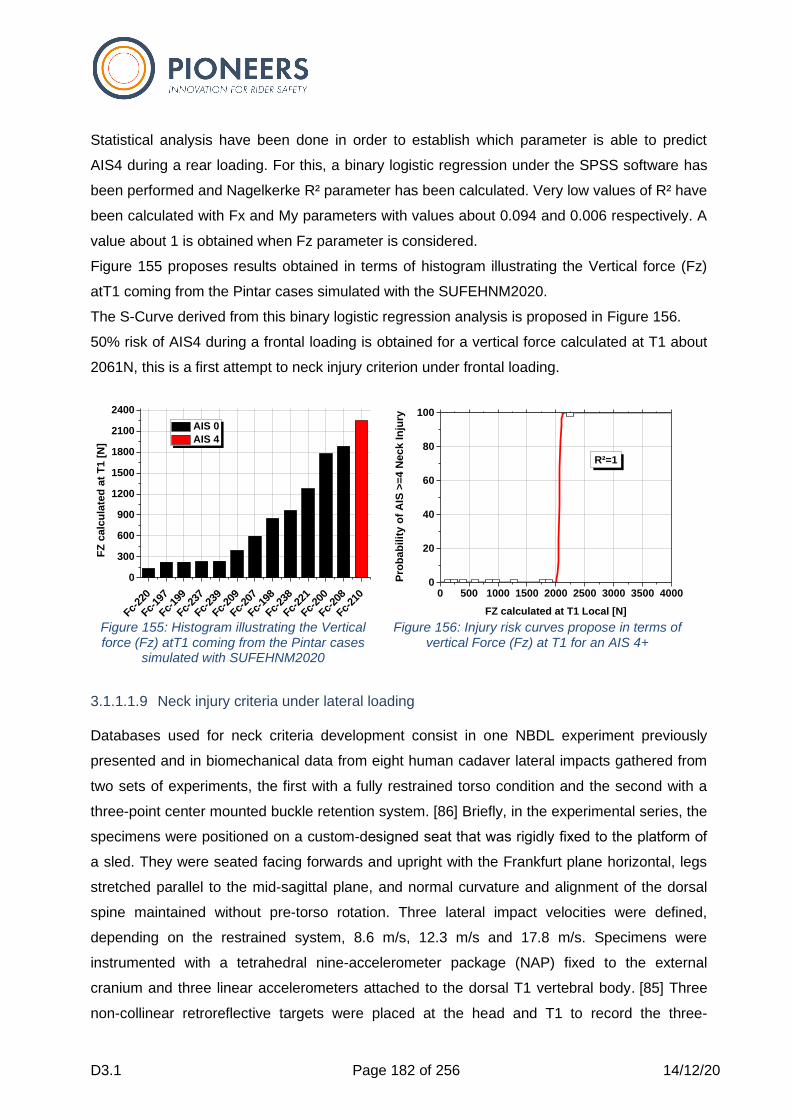
D3.1 Page 182 of 256 14/12/20
Statistical analysis have been done in order to establish which parameter is able to predict
AIS4 during a rear loading. For this, a binary logistic regression under the SPSS software has
been performed and Nagelkerke R² parameter has been calculated. Very low values of R² have
been calculated with Fx and My parameters with values about 0.094 and 0.006 respectively. A
value about 1 is obtained when Fz parameter is considered.
Figure 155 proposes results obtained in terms of histogram illustrating the Vertical force (Fz)
atT1 coming from the Pintar cases simulated with the SUFEHNM2020.
The S-Curve derived from this binary logistic regression analysis is proposed in Figure 156.
50% risk of AIS4 during a frontal loading is obtained for a vertical force calculated at T1 about
2061N, this is a first attempt to neck injury criterion under frontal loading.
Figure 155: Histogram illustrating the Vertical force (Fz) atT1 coming from the Pintar cases
simulated with SUFEHNM2020
Figure 156: Injury risk curves propose in terms of vertical Force (Fz) at T1 for an AIS 4+
3.1.1.1.9 Neck injury criteria under lateral loading
Databases used for neck criteria development consist in one NBDL experiment previously
presented and in biomechanical data from eight human cadaver lateral impacts gathered from
two sets of experiments, the first with a fully restrained torso condition and the second with a
three-point center mounted buckle retention system. [86] Briefly, in the experimental series, the
specimens were positioned on a custom-designed seat that was rigidly fixed to the platform of
a sled. They were seated facing forwards and upright with the Frankfurt plane horizontal, legs
stretched parallel to the mid-sagittal plane, and normal curvature and alignment of the dorsal
spine maintained without pre-torso rotation. Three lateral impact velocities were defined,
depending on the restrained system, 8.6 m/s, 12.3 m/s and 17.8 m/s. Specimens were
instrumented with a tetrahedral nine-accelerometer package (NAP) fixed to the external
cranium and three linear accelerometers attached to the dorsal T1 vertebral body. [85] Three
non-collinear retroreflective targets were placed at the head and T1 to record the three-
Fc-22
0
Fc-19
7
Fc-19
9
Fc-23
7
Fc-23
9
Fc-20
9
Fc-20
7
Fc-19
8
Fc-23
8
Fc-22
1
Fc-20
0
Fc-20
8
Fc-21
0
0
300
600
900
1200
1500
1800
2100
2400
FZ
calc
ula
ted
at
T1 [
N]
AIS 0
AIS 4
0 500 1000 1500 2000 2500 3000 3500 40000
20
40
60
80
100
R²=1
Pro
ba
bil
ity
of
AIS
>=
4 N
ec
k I
nju
ry
FZ calculated at T1 Local [N]
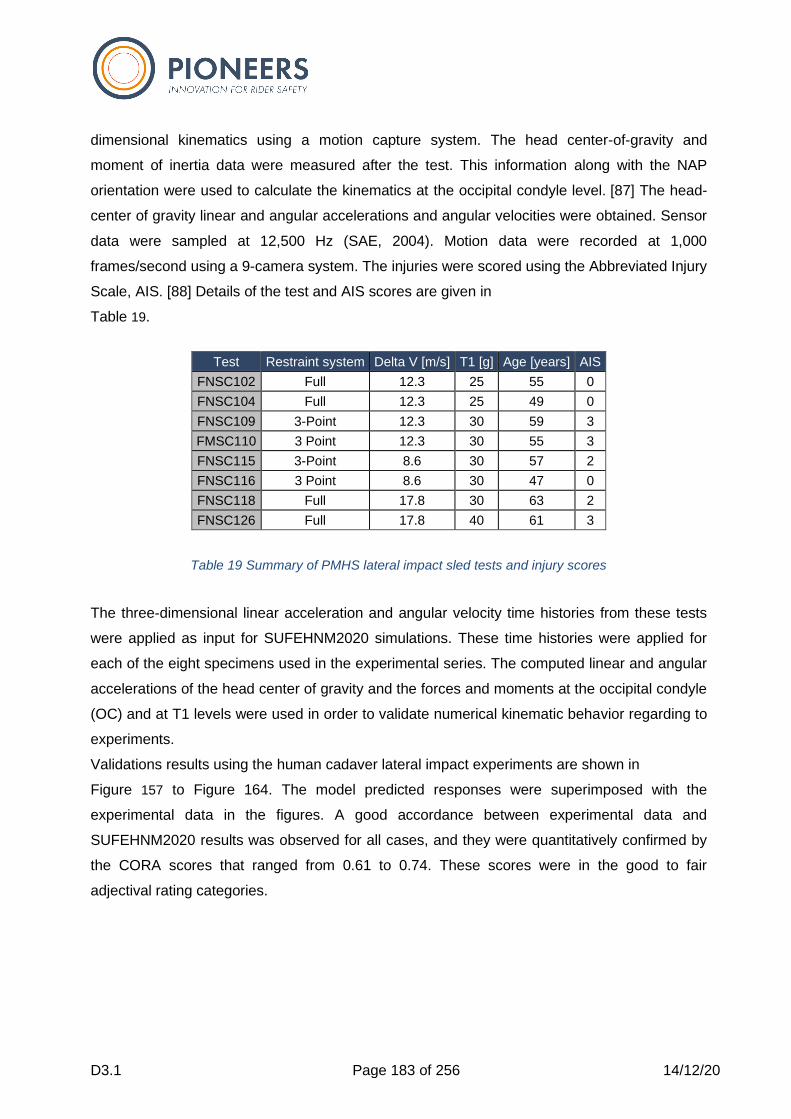
D3.1 Page 183 of 256 14/12/20
dimensional kinematics using a motion capture system. The head center-of-gravity and
moment of inertia data were measured after the test. This information along with the NAP
orientation were used to calculate the kinematics at the occipital condyle level. [87] The head-
center of gravity linear and angular accelerations and angular velocities were obtained. Sensor
data were sampled at 12,500 Hz (SAE, 2004). Motion data were recorded at 1,000
frames/second using a 9-camera system. The injuries were scored using the Abbreviated Injury
Scale, AIS. [88] Details of the test and AIS scores are given in
Table 19.
Test Restraint system Delta V [m/s] T1 [g] Age [years] AIS
FNSC102 Full 12.3 25 55 0
FNSC104 Full 12.3 25 49 0
FNSC109 3-Point 12.3 30 59 3
FMSC110 3 Point 12.3 30 55 3
FNSC115 3-Point 8.6 30 57 2
FNSC116 3 Point 8.6 30 47 0
FNSC118 Full 17.8 30 63 2
FNSC126 Full 17.8 40 61 3
Table 19 Summary of PMHS lateral impact sled tests and injury scores
The three-dimensional linear acceleration and angular velocity time histories from these tests
were applied as input for SUFEHNM2020 simulations. These time histories were applied for
each of the eight specimens used in the experimental series. The computed linear and angular
accelerations of the head center of gravity and the forces and moments at the occipital condyle
(OC) and at T1 levels were used in order to validate numerical kinematic behavior regarding to
experiments.
Validations results using the human cadaver lateral impact experiments are shown in
Figure 157 to Figure 164. The model predicted responses were superimposed with the
experimental data in the figures. A good accordance between experimental data and
SUFEHNM2020 results was observed for all cases, and they were quantitatively confirmed by
the CORA scores that ranged from 0.61 to 0.74. These scores were in the good to fair
adjectival rating categories.
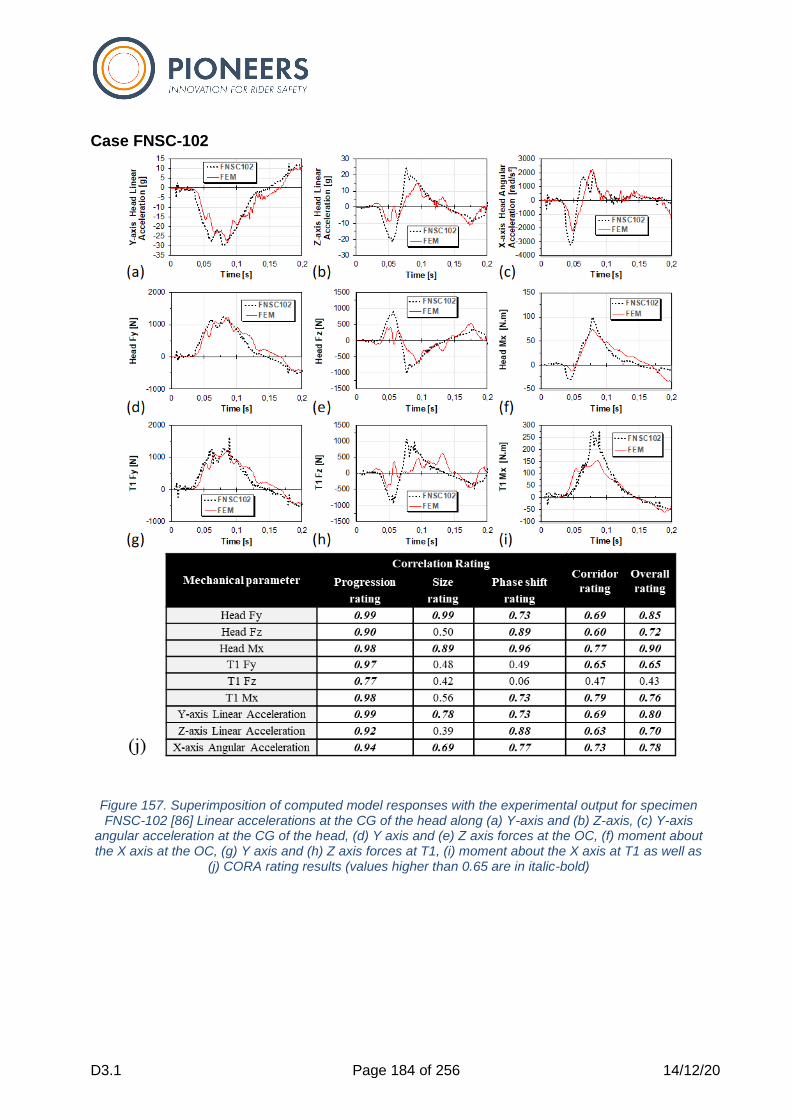
D3.1 Page 184 of 256 14/12/20
Case FNSC-102
Figure 157. Superimposition of computed model responses with the experimental output for specimen FNSC-102 [86] Linear accelerations at the CG of the head along (a) Y-axis and (b) Z-axis, (c) Y-axis
angular acceleration at the CG of the head, (d) Y axis and (e) Z axis forces at the OC, (f) moment about the X axis at the OC, (g) Y axis and (h) Z axis forces at T1, (i) moment about the X axis at T1 as well as
(j) CORA rating results (values higher than 0.65 are in italic-bold)
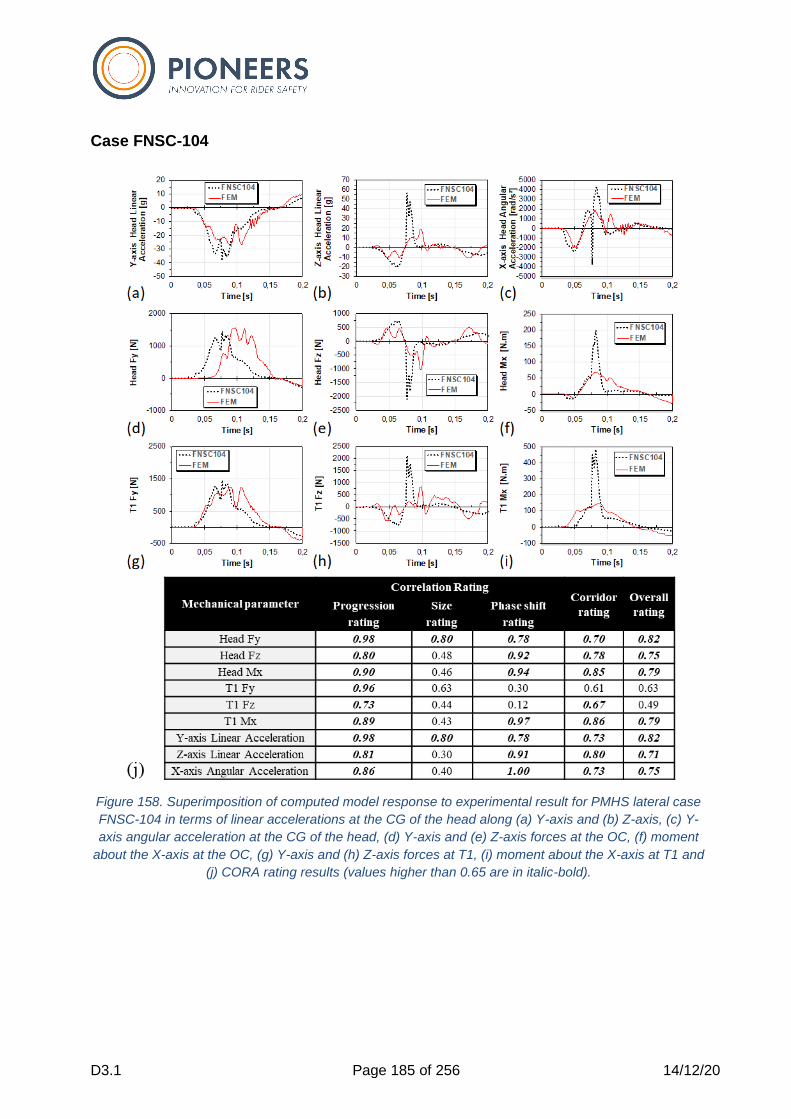
D3.1 Page 185 of 256 14/12/20
Case FNSC-104
Figure 158. Superimposition of computed model response to experimental result for PMHS lateral case
FNSC-104 in terms of linear accelerations at the CG of the head along (a) Y-axis and (b) Z-axis, (c) Y-
axis angular acceleration at the CG of the head, (d) Y-axis and (e) Z-axis forces at the OC, (f) moment
about the X-axis at the OC, (g) Y-axis and (h) Z-axis forces at T1, (i) moment about the X-axis at T1 and
(j) CORA rating results (values higher than 0.65 are in italic-bold).
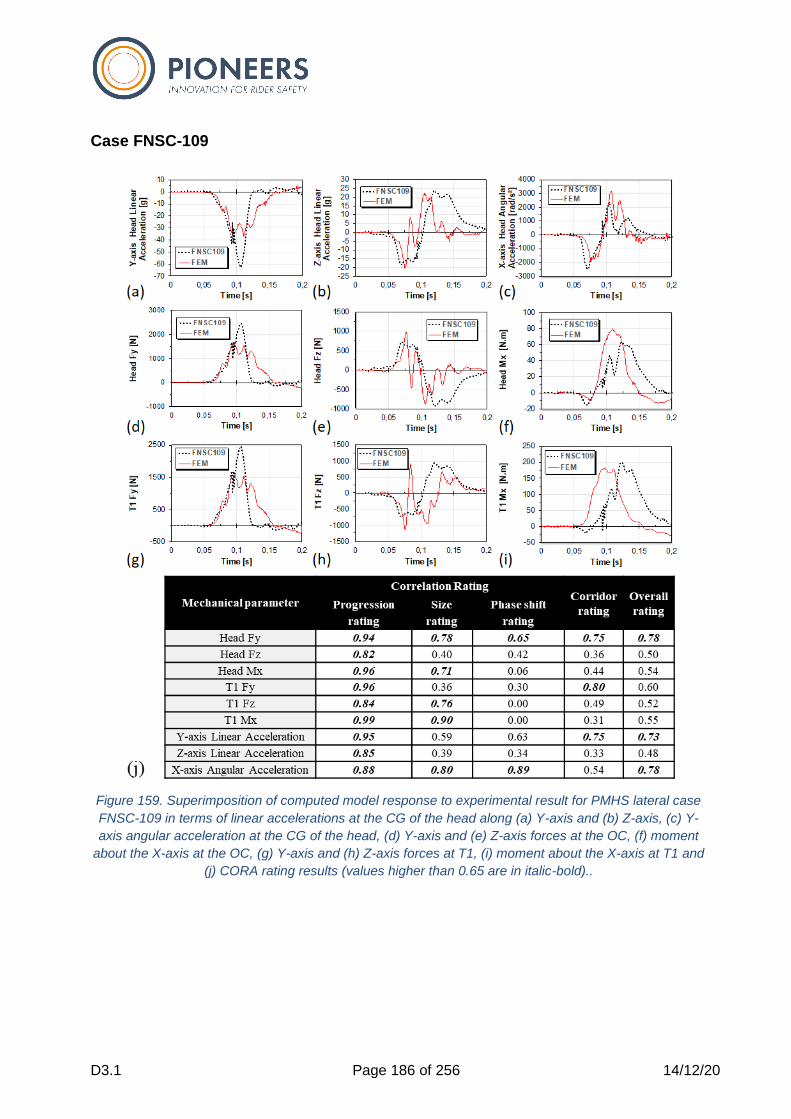
D3.1 Page 186 of 256 14/12/20
Case FNSC-109
Figure 159. Superimposition of computed model response to experimental result for PMHS lateral case
FNSC-109 in terms of linear accelerations at the CG of the head along (a) Y-axis and (b) Z-axis, (c) Y-
axis angular acceleration at the CG of the head, (d) Y-axis and (e) Z-axis forces at the OC, (f) moment
about the X-axis at the OC, (g) Y-axis and (h) Z-axis forces at T1, (i) moment about the X-axis at T1 and
(j) CORA rating results (values higher than 0.65 are in italic-bold)..
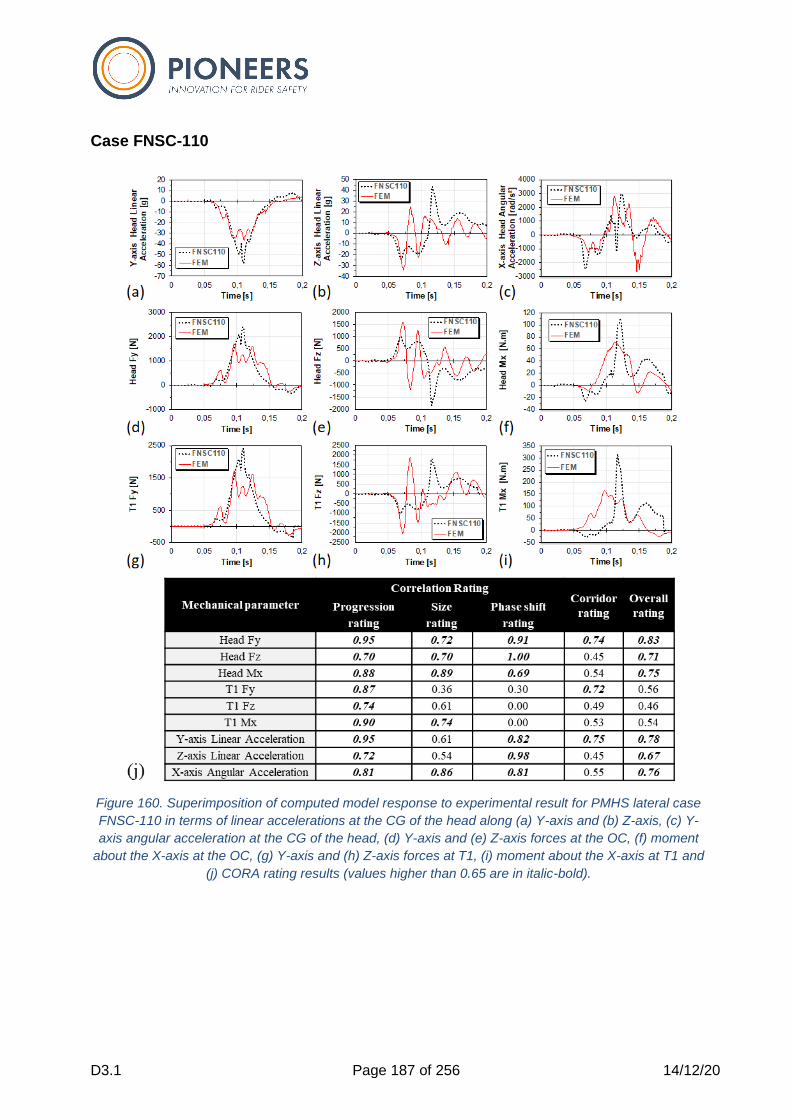
D3.1 Page 187 of 256 14/12/20
Case FNSC-110
Figure 160. Superimposition of computed model response to experimental result for PMHS lateral case
FNSC-110 in terms of linear accelerations at the CG of the head along (a) Y-axis and (b) Z-axis, (c) Y-
axis angular acceleration at the CG of the head, (d) Y-axis and (e) Z-axis forces at the OC, (f) moment
about the X-axis at the OC, (g) Y-axis and (h) Z-axis forces at T1, (i) moment about the X-axis at T1 and
(j) CORA rating results (values higher than 0.65 are in italic-bold).
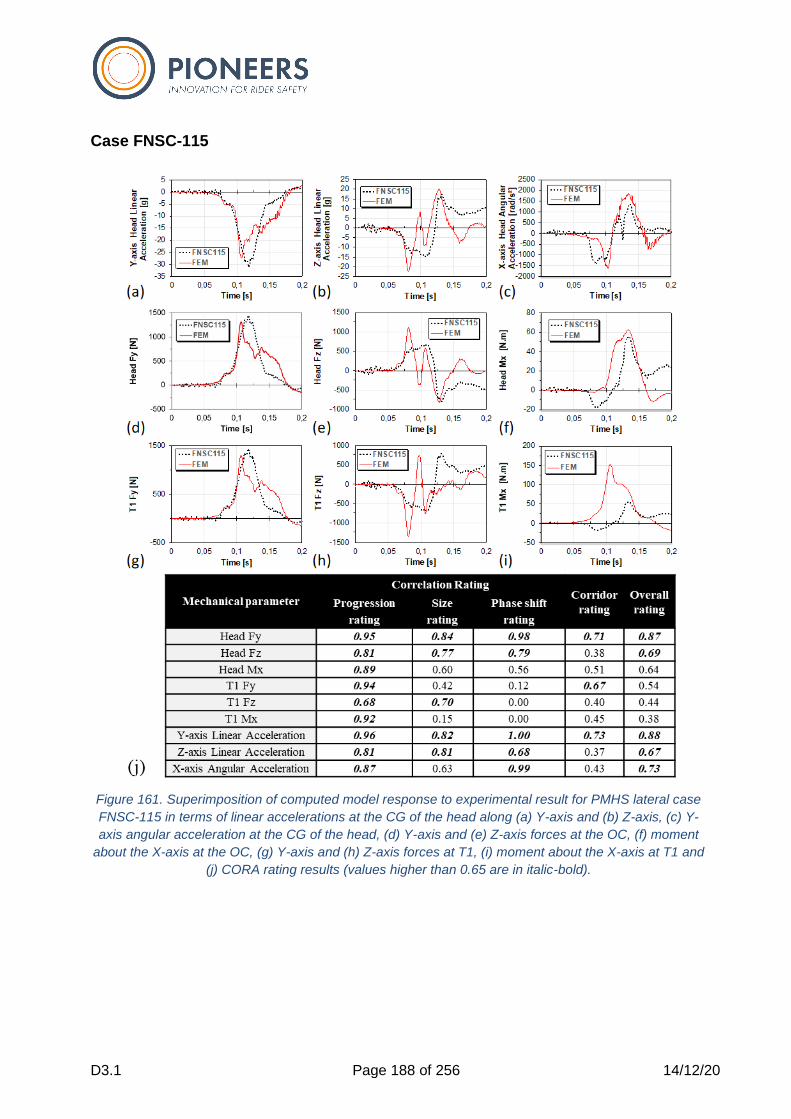
D3.1 Page 188 of 256 14/12/20
Case FNSC-115
Figure 161. Superimposition of computed model response to experimental result for PMHS lateral case
FNSC-115 in terms of linear accelerations at the CG of the head along (a) Y-axis and (b) Z-axis, (c) Y-
axis angular acceleration at the CG of the head, (d) Y-axis and (e) Z-axis forces at the OC, (f) moment
about the X-axis at the OC, (g) Y-axis and (h) Z-axis forces at T1, (i) moment about the X-axis at T1 and
(j) CORA rating results (values higher than 0.65 are in italic-bold).
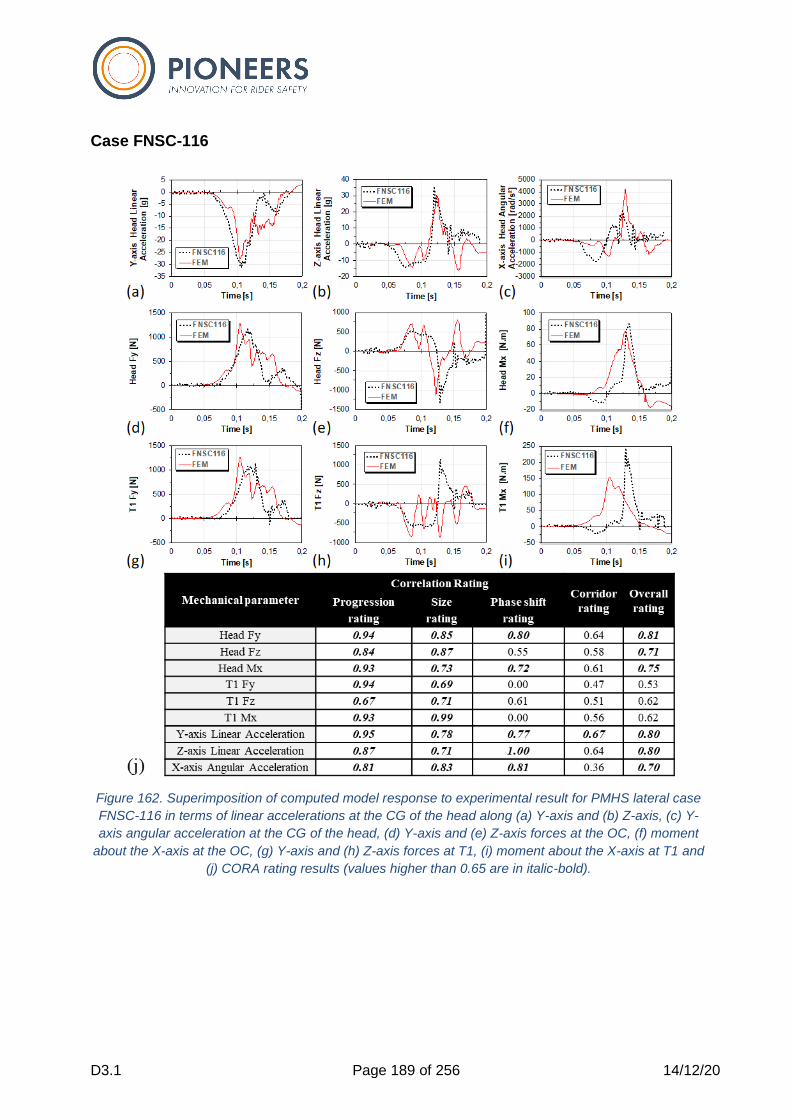
D3.1 Page 189 of 256 14/12/20
Case FNSC-116
Figure 162. Superimposition of computed model response to experimental result for PMHS lateral case
FNSC-116 in terms of linear accelerations at the CG of the head along (a) Y-axis and (b) Z-axis, (c) Y-
axis angular acceleration at the CG of the head, (d) Y-axis and (e) Z-axis forces at the OC, (f) moment
about the X-axis at the OC, (g) Y-axis and (h) Z-axis forces at T1, (i) moment about the X-axis at T1 and
(j) CORA rating results (values higher than 0.65 are in italic-bold).

D3.1 Page 190 of 256 14/12/20
Case FNSC-118
Figure 163. Superimposition of computed model response to experimental result for PMHS lateral case
FNSC-118 in terms of linear accelerations at the CG of the head along (a) Y-axis and (b) Z-axis, (c) Y-
axis angular acceleration at the CG of the head, (d) Y-axis and (e) Z-axis forces at the OC, (f) moment
about the X-axis at the OC, (g) Y-axis and (h) Z-axis forces at T1, (i) moment about the X-axis at T1 and
(j) CORA rating results (values higher than 0.65 are in italic-bold).
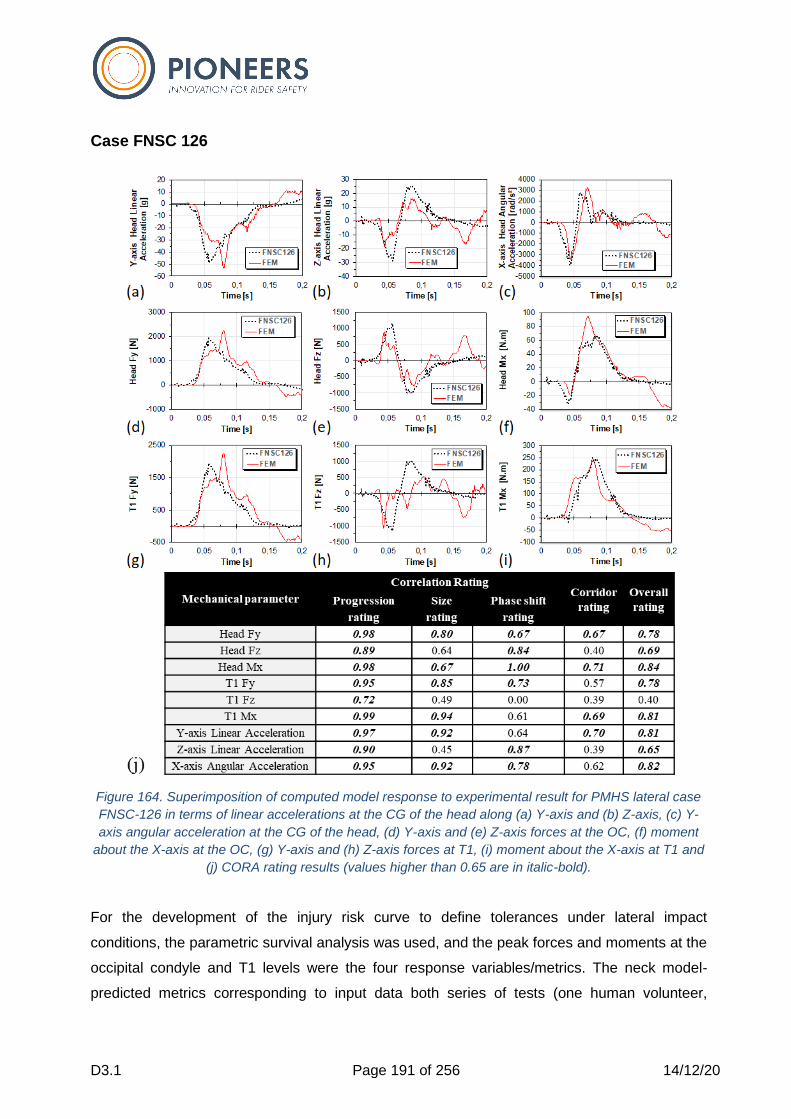
D3.1 Page 191 of 256 14/12/20
Case FNSC 126
Figure 164. Superimposition of computed model response to experimental result for PMHS lateral case
FNSC-126 in terms of linear accelerations at the CG of the head along (a) Y-axis and (b) Z-axis, (c) Y-
axis angular acceleration at the CG of the head, (d) Y-axis and (e) Z-axis forces at the OC, (f) moment
about the X-axis at the OC, (g) Y-axis and (h) Z-axis forces at T1, (i) moment about the X-axis at T1 and
(j) CORA rating results (values higher than 0.65 are in italic-bold).
For the development of the injury risk curve to define tolerances under lateral impact
conditions, the parametric survival analysis was used, and the peak forces and moments at the
occipital condyle and T1 levels were the four response variables/metrics. The neck model-
predicted metrics corresponding to input data both series of tests (one human volunteer,
D3.1 Page 192 of 256 14/12/20
termed as NBDL test and eight human cadaver tests) were used. The Brier Score Metric (BSM)
was used to determine the hierarchical sequence among the four variables. Injury metrics were
treated as uncensored at the AIS3+ level and, noninjury metrics were treated as right censored
in the survival analysis. The Weibull, lognormal, and log-logistic distributions were used, and
their cumulative density functions are given by equations ((5)(6)(7)).
Weibull distribution: 1 − exp {−(t
λ)γ
} (5)
Log-logistic distribution: 1
1 + (t/λ) −γ (6)
Lognormal distribution: Φ(γ log λt), where Φ(t) = ∫1
√2π
t
−∞
exp {−y2
2}dy (7)
Where t represents a value of the metric, when γ and λ are estimated by the maximum
likelihood approach. The delta method was used to describe the 95% confidence interval. [89]
The corrected Akaike Information Criterion (AIC) was determined. [90] Finally, the Normalized
Confidence Interval Size, NCIS, was defined as the ratio of confidence interval width to the
magnitude of the peak force estimate. It is given by the following equation (8).
NCIS =ULp − LLp
Mp
(8)
Where p represents the probability of injury, Mp is the mean (predicted) value of the peak force
or moment at any injury probability level, and ULp and LLp represent the upper and lower limits
of the confidence intervals of the peak force or moment at that probability level.
The NCIS magnitudes of <0.5, between 0.5 and 1, >1 to 1.5, and >1.5 were assigned the
adjectival ratings of good, fair, marginal, and unacceptable, respectively. [91] They were
computed at 25%, 50%, 75%, 90%, and 95% probability levels for all metrics.
The lateral shear force, FY, and coronal moment, Mx, calculated at the OC and T1 levels for
the nine lateral impact cases are shown in Figure 165. The forces and moments were both
greater at the T1 level than at OC level for all cases.

D3.1 Page 193 of 256 14/12/20
Figure 165. Computed loads on the neck for the nine lateral impacts for (a) force, (b) moment at OC, and
(c) force, and (d) moment at the T1 levels.
At the OC and T1 levels, the BSM magnitudes for the forces were 1.39 and 2.64, and for the
moments, they were 2.64 and 2.01, respectively. All metrics were associated with the Weibull
distribution with the exception for the moment at the T1 level that was associated with the
lognormal distribution.
At the 50% injury probability level, the OC force and moment were 1.5 kN and 125 Nm, and the
95% confidence intervals ranged from 1.4 kN to 1.6 kN, and 109 to 143 Nm, respectively.
These data at the T1 level were 1.8 kN and 190 Nm, and the 95% confidence intervals ranged
from 1.4 kN to 2.1 kN, and 69 Nm to 213 Nm, respectively.
For both variables and both neck locations, the quality indexes were in the good category at all
discrete probability levels. The injury risk curves and associated 95% confidence intervals are
shown in Figure 166 and Figure 167 for forces and moments at the OC, and Figure 168 and
Figure 169at the T1 level. Based on the BSM, the force at the OC level was the optimal metric
for AIS3+ neck injury.
Figure 166. Injury probability curves for the force at the OC level. Dashed curves show the confidence
interval bounds. Bar chart shows NCIS magnitudes.
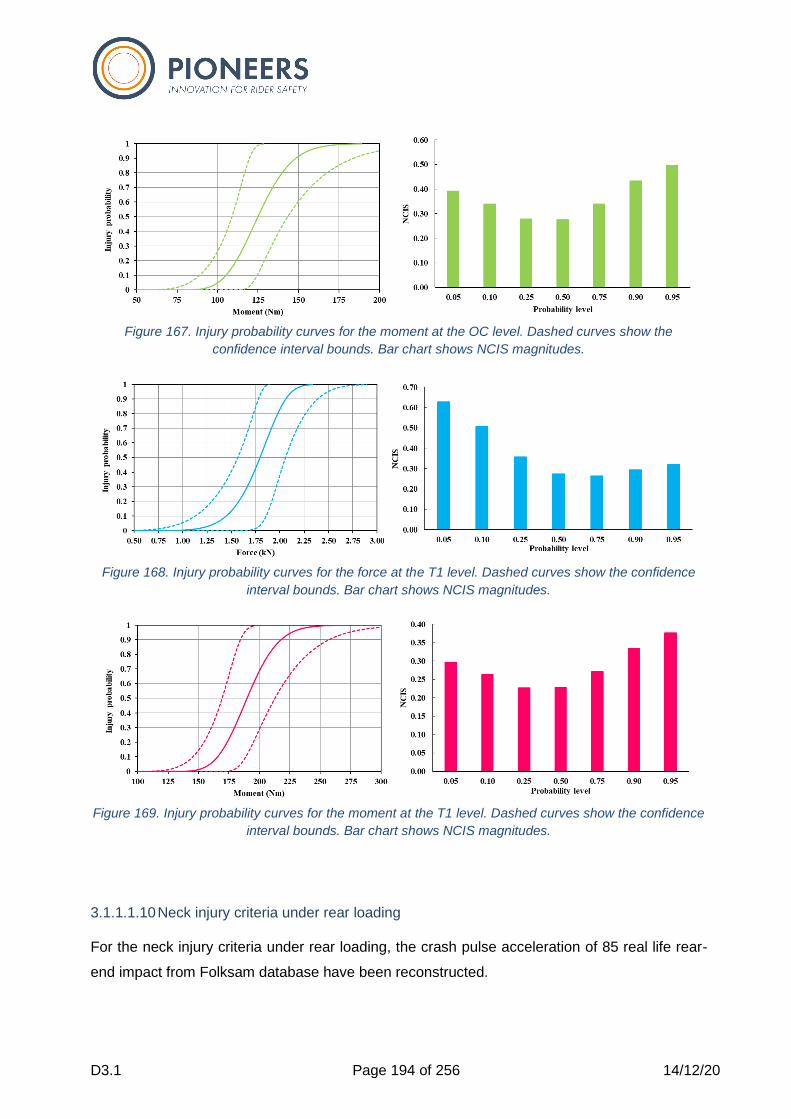
D3.1 Page 194 of 256 14/12/20
Figure 167. Injury probability curves for the moment at the OC level. Dashed curves show the
confidence interval bounds. Bar chart shows NCIS magnitudes.
Figure 168. Injury probability curves for the force at the T1 level. Dashed curves show the confidence
interval bounds. Bar chart shows NCIS magnitudes.
Figure 169. Injury probability curves for the moment at the T1 level. Dashed curves show the confidence
interval bounds. Bar chart shows NCIS magnitudes.
3.1.1.1.10 Neck injury criteria under rear loading
For the neck injury criteria under rear loading, the crash pulse acceleration of 85 real life rear-
end impact from Folksam database have been reconstructed.

D3.1 Page 195 of 256 14/12/20
The seat acceleration-time history was measured during the crash by a crash pulse recorder
fixed on three car models of the same make. The recording and the analyzing have been
described by Aldman et al. [92] and Kullgren et al. [93] [94]. The sampling rate of the crash
pulse recorder is 1000 Hz during the impact phase of the crash and the recorded acceleration
data were filtered at approximately 60 Hz.
The occupant injury severity was divided into three categories (no neck injury, initial symptom,
symptoms > 1 month [94]). The numbers of victims are presented in
Table 20 in function of age and gender distribution.
It can be observed in this table that there is a similar proportion of males and females as well
as ages distribution for occupants with symptoms over one month than for the total population.
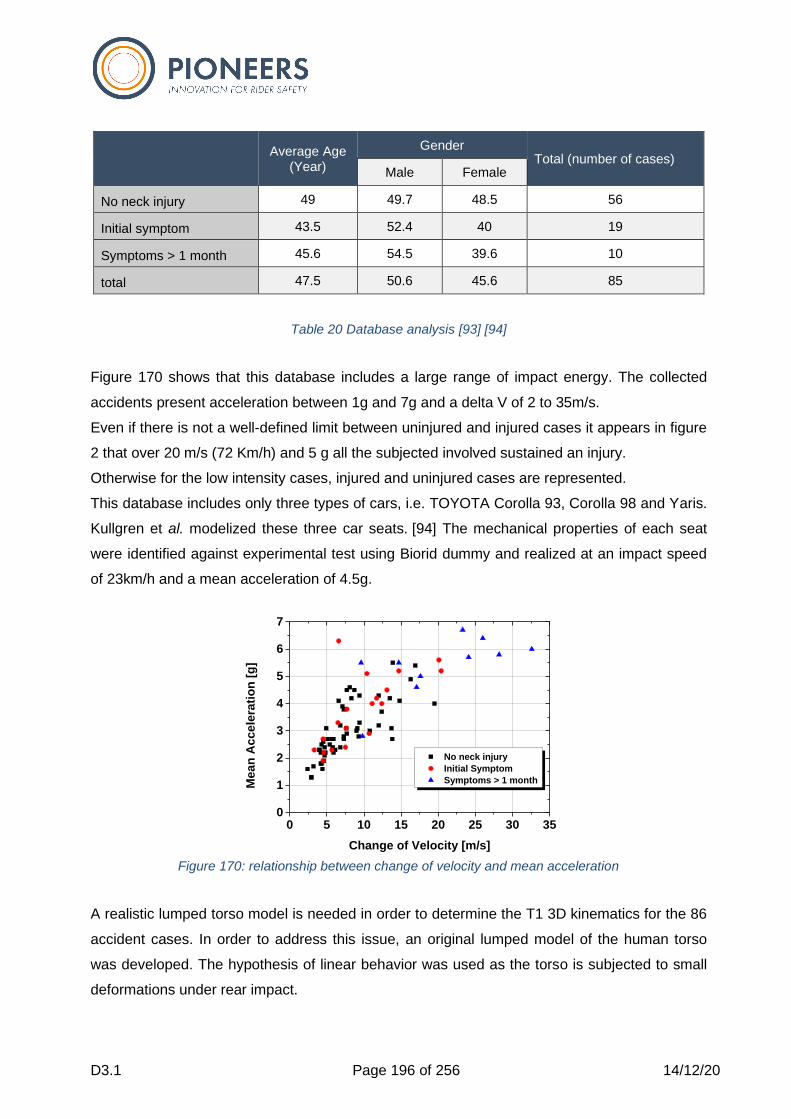
D3.1 Page 196 of 256 14/12/20
Average Age
(Year)
Gender Total (number of cases)
Male Female
No neck injury 49 49.7 48.5 56
Initial symptom 43.5 52.4 40 19
Symptoms > 1 month 45.6 54.5 39.6 10
total 47.5 50.6 45.6 85
Table 20 Database analysis [93] [94]
Figure 170 shows that this database includes a large range of impact energy. The collected
accidents present acceleration between 1g and 7g and a delta V of 2 to 35m/s.
Even if there is not a well-defined limit between uninjured and injured cases it appears in figure
2 that over 20 m/s (72 Km/h) and 5 g all the subjected involved sustained an injury.
Otherwise for the low intensity cases, injured and uninjured cases are represented.
This database includes only three types of cars, i.e. TOYOTA Corolla 93, Corolla 98 and Yaris.
Kullgren et al. modelized these three car seats. [94] The mechanical properties of each seat
were identified against experimental test using Biorid dummy and realized at an impact speed
of 23km/h and a mean acceleration of 4.5g.
Figure 170: relationship between change of velocity and mean acceleration
A realistic lumped torso model is needed in order to determine the T1 3D kinematics for the 86
accident cases. In order to address this issue, an original lumped model of the human torso
was developed. The hypothesis of linear behavior was used as the torso is subjected to small
deformations under rear impact.
0 5 10 15 20 25 30 350
1
2
3
4
5
6
7
No neck injury
Initial Symptom
Symptoms > 1 monthMe
an
Ac
ce
lera
tio
n [
g]
Change of Velocity [m/s]

D3.1 Page 197 of 256 14/12/20
The modal analysis of the human torso in a seating position conducted by Kitazaki et al. was
used for both masses and mechanical properties identification of the human thorax by Bourdet
et al. in 2006. [95] [96]
In order to reproduce the four vibration modes shapes identified experimentally by Kitazaki et
al. in 1992, the torso was divided in six segments to obtain the five degrees of freedom
including the head neck system, as illustrated in
Figure 171. This model is able to reproduce the four first experimental vibration modes and was
validated in the frequency domain in terms of natural frequencies, damping and mode
shapes. [96]
The positioning of the lumped torso model under MADYMO code was realized with the same
procedure as realized by Kullgren et al.. [94] The head headrest distance was therefore
estimated at 69 mm for the Corolla 93, 55 mm for the Corolla 98 and 92 mm for the Yaris.
Figure 172: Position of the MC-HNT model in the three seats.
Figure 172 illustrates the positioning of the lumped torso model for the three configurations.
For each case the pulse recording during the accident was implemented to the seat car model.
The simulation times are of the order of 150-250 ms. In order to reconstruct the accidents with
the SUFEHNM2020 model, the 6 accelerations (three linear and three angular) were extracted
from MADYMO model at the first thoracic vertebrae and at the center of gravity of the
Headrest. Concerning the FE simulation, the headrest rigidity was adjust in order to reproduce
numerically under Ls-Dyna code the same impact force as those calculated with the madymo
model. The headrest inclination and the distance were also taken into account in the FE model.
Figure 173 illustrates one case involving a male aged of 36 years with an initial symptom.
Figure 171 Representation of the lumped parameters model of the trunk [96]
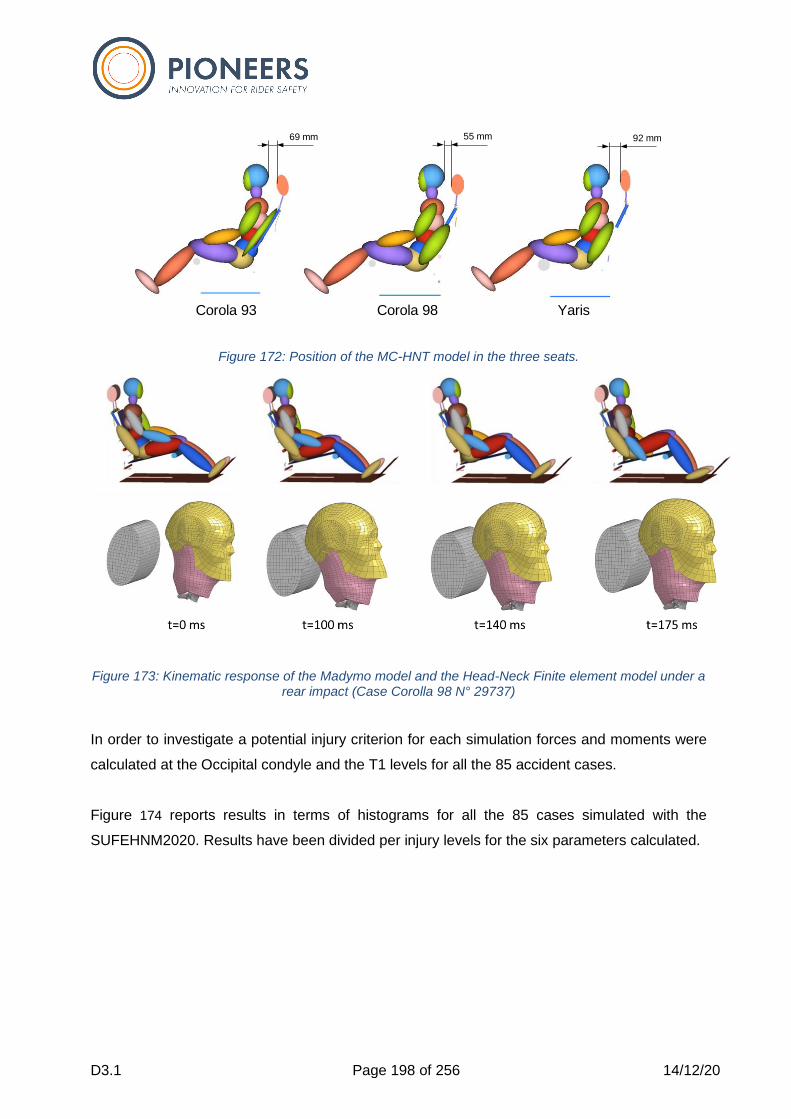
D3.1 Page 198 of 256 14/12/20
Figure 172: Position of the MC-HNT model in the three seats.
Figure 173: Kinematic response of the Madymo model and the Head-Neck Finite element model under a rear impact (Case Corolla 98 N° 29737)
In order to investigate a potential injury criterion for each simulation forces and moments were
calculated at the Occipital condyle and the T1 levels for all the 85 accident cases.
Figure 174 reports results in terms of histograms for all the 85 cases simulated with the
SUFEHNM2020. Results have been divided per injury levels for the six parameters calculated.
69 mm 55 mm 92 mm
Corola 93 Corola 98 Yaris
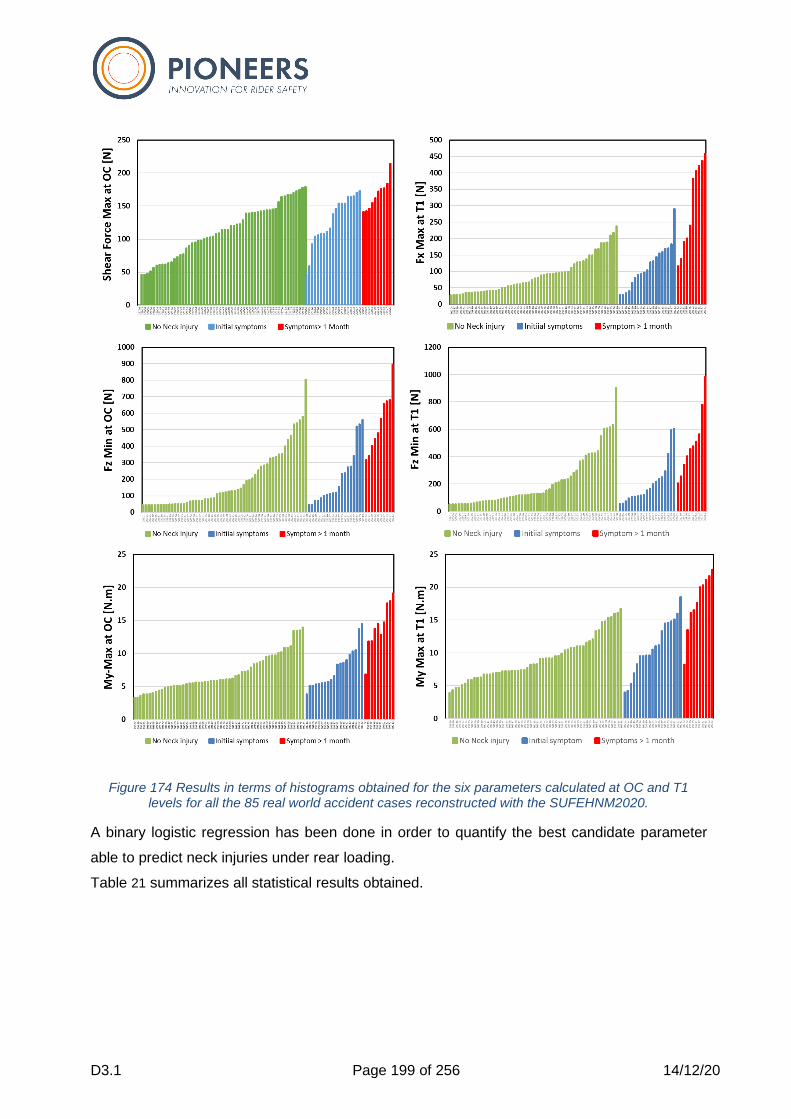
D3.1 Page 199 of 256 14/12/20
Figure 174 Results in terms of histograms obtained for the six parameters calculated at OC and T1 levels for all the 85 real world accident cases reconstructed with the SUFEHNM2020.
A binary logistic regression has been done in order to quantify the best candidate parameter
able to predict neck injuries under rear loading.
Table 21 summarizes all statistical results obtained.
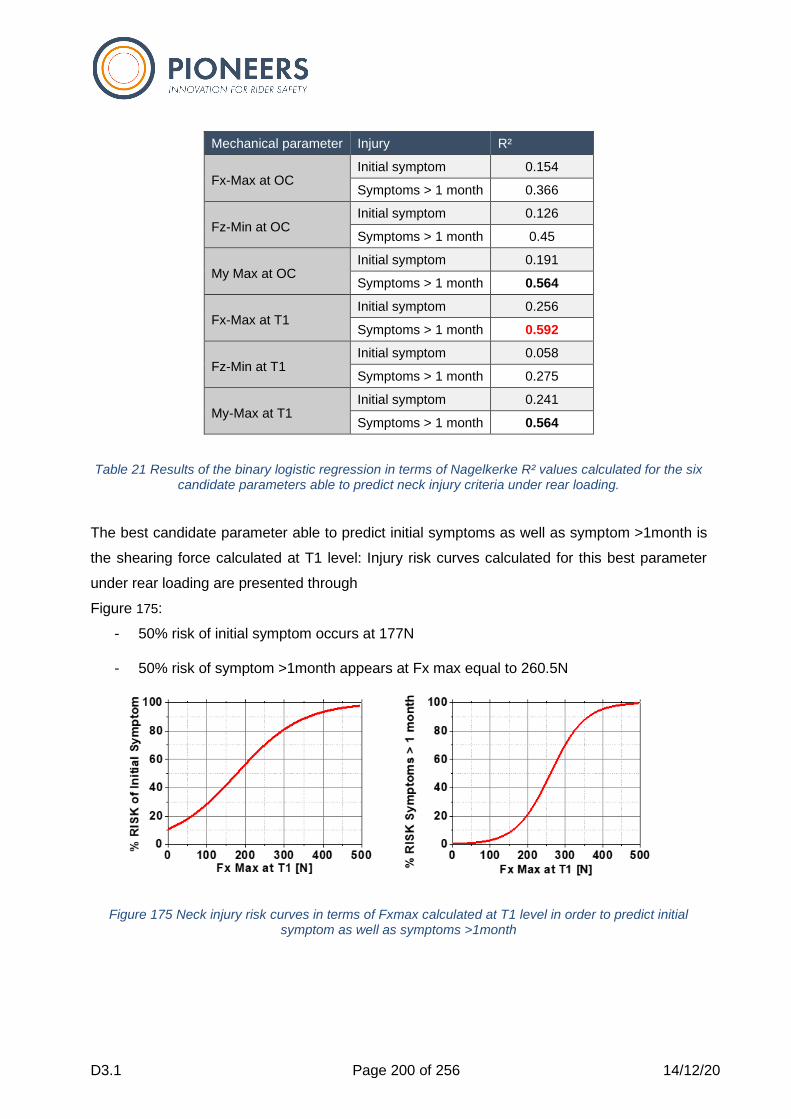
D3.1 Page 200 of 256 14/12/20
Mechanical parameter Injury R²
Fx-Max at OC Initial symptom 0.154
Symptoms > 1 month 0.366
Fz-Min at OC Initial symptom 0.126
Symptoms > 1 month 0.45
My Max at OC Initial symptom 0.191
Symptoms > 1 month 0.564
Fx-Max at T1 Initial symptom 0.256
Symptoms > 1 month 0.592
Fz-Min at T1 Initial symptom 0.058
Symptoms > 1 month 0.275
My-Max at T1 Initial symptom 0.241
Symptoms > 1 month 0.564
Table 21 Results of the binary logistic regression in terms of Nagelkerke R² values calculated for the six candidate parameters able to predict neck injury criteria under rear loading.
The best candidate parameter able to predict initial symptoms as well as symptom >1month is
the shearing force calculated at T1 level: Injury risk curves calculated for this best parameter
under rear loading are presented through
Figure 175:
- 50% risk of initial symptom occurs at 177N
- 50% risk of symptom >1month appears at Fx max equal to 260.5N
Figure 175 Neck injury risk curves in terms of Fxmax calculated at T1 level in order to predict initial symptom as well as symptoms >1month
D3.1 Page 201 of 256 14/12/20
3.4.9.6 Conclusions
First attempt to neck criteria under frontal, lateral and rear loadings have been presented.
- For frontal loading 13 cases have been simulated with the SUFEHNM2020 coming from
Pintar et al. [84]. Statistical analysis have been done in order to establish which
parameter is able to predict AIS4 during a rear loading. For this, a binary logistic
regression under the SPSS software has been performed and Nagelkerke R² parameter
has been calculated. This study has demonstrate that the Fz parameter calculated at
T2 is the best parameter to predict AIS4 with a R² equal to 1. 50% risk of AIS4 during a
frontal loading is obtained for a vertical force calculated at T1 about 2061 N.
- For lateral loading nine lateral impact cases were simulated with SUFEHNM2020 (one
NBDL case and 8 PMHS [86]). As for frontal loading some statistical analysis were
performed. It was shown that the shearing forces at upper level is the most promising
metric to predict AIS3+ injury under lateral loading with a critical value of 1.5kN leading
to a risk of 50%.
- For rear loading, 85 accident cases were reconstructed with SUFEHNM2020, the best
candidate parameter able to predict initial symptoms as well as symptom >1month is
the shearing force calculated at T1 level: 50% risk of initial symptom occurs at 177N
and 50% risk of symptom >1month appears at Fx max equal to 260.5N.
This study presented very first attempts to propose neck injury risk curves for monodirectional
loadings. The proposed neck model (SUFEHNM2020), well validated and able to predict some
unidirectional injuries, will be helpful when new neck protection improvement method will be
proposed by using it through experimental/numerical coupling approach.
D3.1 Page 202 of 256 14/12/20
3.4.10 Outlook regarding neck brace testing
The assessment of neck braces combines several topics ranging from helmet and neck brace
positioning, helmet-brace-interactions, diverse physiology of a complex cervical spine and
insufficiently biofidelic neck surrogates. To develop a sophisticated test and assessment
method for neck braces these issues have to be solved or replaced by suitable steps.
With the geometrical assessment of helmets and neck braces here in the PIONEERS project
the huge number of helmet and neck brace combinations can be analyzed simple and cost
efficient. The identification of reasonable helmet-brace-combinations can be used to match
existing and newly developed PPE.
However, an advanced neck brace test method has to be developed to overcome the identified
short comings of existing approaches which are mainly based on the use of ATDs or solely on
numerical simulations. The physical loading of a neck brace needs to consider the geometry of
the neck brace as well as the physiological behaviour of the cervical spine. The proposed
geometrical assessment is a step towards a more sophisticated test method combining
physical loading and numerical assessment of neck braces. To assess the performance of a
neck brace regarding actual neck injury risk, the described model based criteria are seen to be
beneficial for future test methods.
D3.1 Page 203 of 256 14/12/20
4 Test design for on-board systems
The main objective of Task 3.3 is to develop testing methods to validate the performance of on-
board safety systems developed in Task 5.4. These on-board systems are DUCATI’s lateral
airbag system and PIAGGIO’s safety leg cover.
For this purpose, accident conditions will be selected in the first place, including target accident
scenarios and main injuries, with attention to specific accidentology data for Task 5.4 on-board
systems.
Secondly, simplified laboratory tests for both NeuRA’s pelvis PPE and PIAGGIO’s safety leg
cover will be proposed to pre-validate these safety systems. The aim of NeuRA’s test method
is to study the interaction between rider and motorcycle fuel tanks under dynamic
anteroposterior loading conditions. The aim of PIAGGIO’s test method is to compare impact
energy absorption with and without the protective device, as a preliminary assessment of the
new protective device.
Lastly, two full-scale crash test protocols to validate the two different on-board systems
developed in Task 5.4 will be defined. The selected test conditions will be based on the most
suitable impact configuration from section 4.1.2 and will be validated with several simulations to
ensure the desired dynamics and the requirements of repeatability and reproducibility.
4.1 Selection of accident conditions
In D1.1 [97] of the PIONEERS project, an extensive literature review, related to the analysis of
road traffic accidents involving PTW, was performed. One of the major outputs of this research
was the identification of several Accident Scenarios (AS) where most PTW fatalities occurred,
as well as the identification of the main injuries derived from this type of accidents. Accordingly,
this section will briefly outline the AS and injuries that have been selected and targeted for
reduction.
4.1.1 Target accident scenarios and injuries
Results from D1.1 [97] revealed that the most common AS in this context are AS3 and AS6.
AS3 refers to accidents between an L3 vehicle and a passenger car/taxi, whilst AS6 refers to
single L3 vehicle accidents. Moreover, the most frequently reported first collision contact point
is the center front for the PTW (28.9% of all cases), and the left side for the Opponent Vehicle
(OV) (21.9% of all cases). In fact, urban two-participant crashes at intersections are a prevalent
cause of serious injuries to PTW riders in all countries, pointing to a priority scenario for further
D3.1 Page 204 of 256 14/12/20
attention. Therefore, a lateral left-side test between an L3 vehicle and a car and a frontal test
between an L3 vehicle and a rigid wall will be considered to represent AS3 and AS6,
respectively.
Due to the fact that the DUCATI lateral airbag system will need to be installed in the right-hand
side of the vehicle in order to use the exhaust for the airbag fixation, the impact point in the
crash tests to be conducted in Task 3.5 is likely to be on the right side of the motorcycles. The
final decision regarding this topic will be made in T3.5. However, the theoretical crash test
protocols explained below will consider the tests to be done on the left-hand side in order to
use this approach as a baseline for any testing programs that may refer to this Deliverable in
the future beyond the PIONEERS Project.
On the other hand, as outlined in D1.1 [97], in AS3 cases, the PTW impact speed was often
higher than the OV impact speed. L3 vehicles more frequently crashed with a speed ranging
between 25-35 km/h and 45-60 km/h, while OVs more frequently crashed with a speed ranging
between 10-25 km/h. In AS6 crashes, 60.2% of PTWs were between 40-80 km/h.
The most common demographics of PTW riders injured in crashes in Europe were young
males (16-35 years old) with a height of 161-180 cm. Thus, a male dummy will be chosen to
perform the two different crash tests in Task 3.5 of the PIONEERS project.
Regarding target injuries, the analysis from D1.1 [97] highlighted four body regions: Thorax &
Thoracic Spine (TTS), Head & Face (HF), Upper Extremities (UE), and Lower Extremities (LE).
At least moderate injuries (AIS 2+) were most frequently found in the thorax (rib cage, lung,
and haemothorax) and the brain. Also, abrasions of severity AIS 1 were most frequently found
in the LE, followed by the UE.
4.1.2 Accidentology data for on-board systems
In order to define the design conditions for the on-board protective systems to be developed in
T5.4 and also to define the test conditions of the demonstrators, a focused accident analysis
was performed. In-depth data were obtained from GIDAS to investigate the lateral impact of an
OV into a PTW. The impact point on either side of the PTW was the only filtering condition. The
following information was extracted from the database:
• accident scenario, coded according to the PIONEERS definition;
• type of OV;
• relative heading angle (Figure 176);
• OV impact speed;
• PTW impact speed;
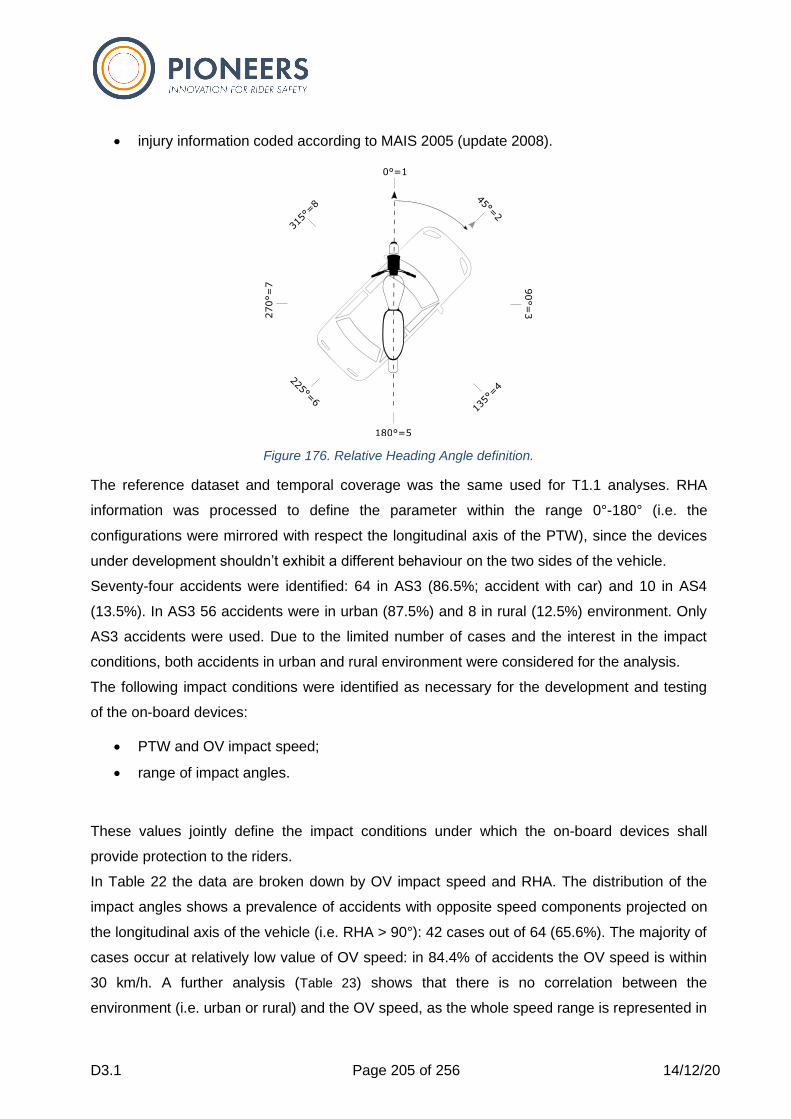
D3.1 Page 205 of 256 14/12/20
• injury information coded according to MAIS 2005 (update 2008).
Figure 176. Relative Heading Angle definition.
The reference dataset and temporal coverage was the same used for T1.1 analyses. RHA
information was processed to define the parameter within the range 0°-180° (i.e. the
configurations were mirrored with respect the longitudinal axis of the PTW), since the devices
under development shouldn’t exhibit a different behaviour on the two sides of the vehicle.
Seventy-four accidents were identified: 64 in AS3 (86.5%; accident with car) and 10 in AS4
(13.5%). In AS3 56 accidents were in urban (87.5%) and 8 in rural (12.5%) environment. Only
AS3 accidents were used. Due to the limited number of cases and the interest in the impact
conditions, both accidents in urban and rural environment were considered for the analysis.
The following impact conditions were identified as necessary for the development and testing
of the on-board devices:
• PTW and OV impact speed;
• range of impact angles.
These values jointly define the impact conditions under which the on-board devices shall
provide protection to the riders.
In Table 22 the data are broken down by OV impact speed and RHA. The distribution of the
impact angles shows a prevalence of accidents with opposite speed components projected on
the longitudinal axis of the vehicle (i.e. RHA > 90°): 42 cases out of 64 (65.6%). The majority of
cases occur at relatively low value of OV speed: in 84.4% of accidents the OV speed is within
30 km/h. A further analysis (Table 23) shows that there is no correlation between the
environment (i.e. urban or rural) and the OV speed, as the whole speed range is represented in
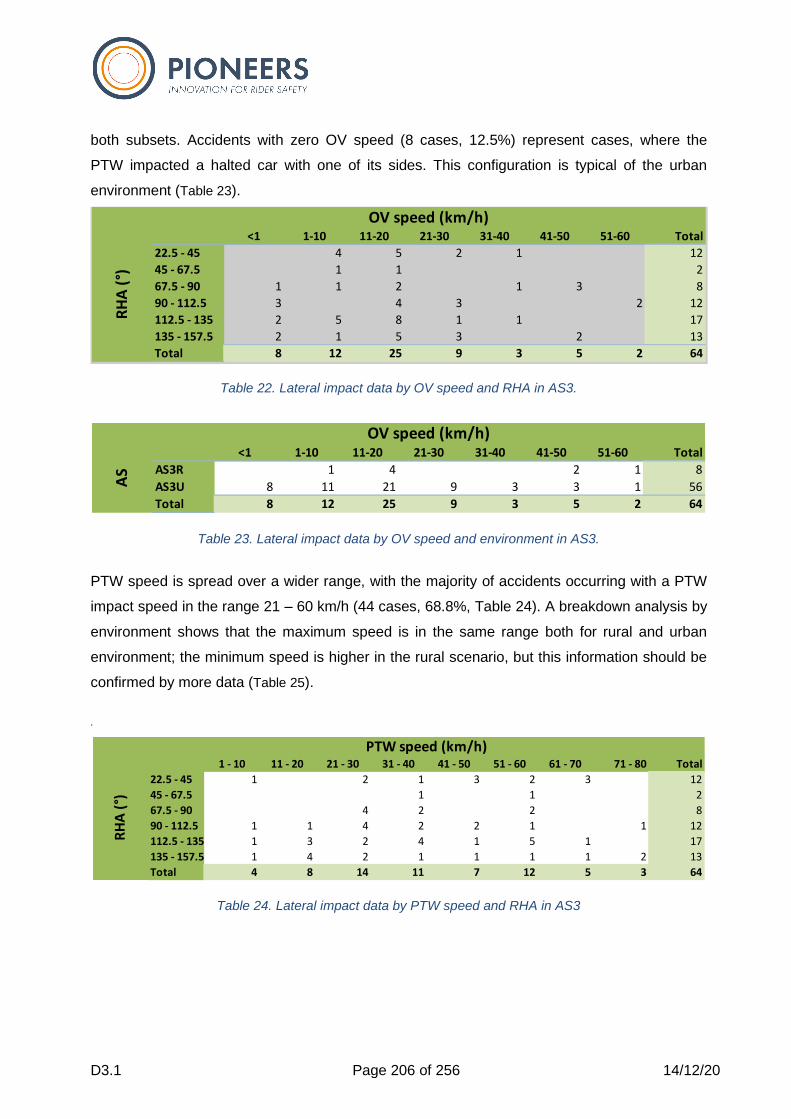
D3.1 Page 206 of 256 14/12/20
both subsets. Accidents with zero OV speed (8 cases, 12.5%) represent cases, where the
PTW impacted a halted car with one of its sides. This configuration is typical of the urban
environment (Table 23).
Table 22. Lateral impact data by OV speed and RHA in AS3.
Table 23. Lateral impact data by OV speed and environment in AS3.
PTW speed is spread over a wider range, with the majority of accidents occurring with a PTW
impact speed in the range 21 – 60 km/h (44 cases, 68.8%, Table 24). A breakdown analysis by
environment shows that the maximum speed is in the same range both for rural and urban
environment; the minimum speed is higher in the rural scenario, but this information should be
confirmed by more data (Table 25).
.
Table 24. Lateral impact data by PTW speed and RHA in AS3
<1 1-10 11-20 21-30 31-40 41-50 51-60 Total
22.5 - 45 4 5 2 1 12
45 - 67.5 1 1 2
67.5 - 90 1 1 2 1 3 8
90 - 112.5 3 4 3 2 12
112.5 - 135 2 5 8 1 1 17
135 - 157.5 2 1 5 3 2 13
Total 8 12 25 9 3 5 2 64
OV speed (km/h)
RH
A (°)
<1 1-10 11-20 21-30 31-40 41-50 51-60 Total
AS3R 1 4 2 1 8
AS3U 8 11 21 9 3 3 1 56
Total 8 12 25 9 3 5 2 64
OV speed (km/h)
AS
1 - 10 11 - 20 21 - 30 31 - 40 41 - 50 51 - 60 61 - 70 71 - 80 Total
22.5 - 45 1 2 1 3 2 3 12
45 - 67.5 1 1 2
67.5 - 90 4 2 2 8
90 - 112.5 1 1 4 2 2 1 1 12
112.5 - 135 1 3 2 4 1 5 1 17
135 - 157.5 1 4 2 1 1 1 1 2 13
Total 4 8 14 11 7 12 5 3 64
RH
A (°)
PTW speed (km/h)
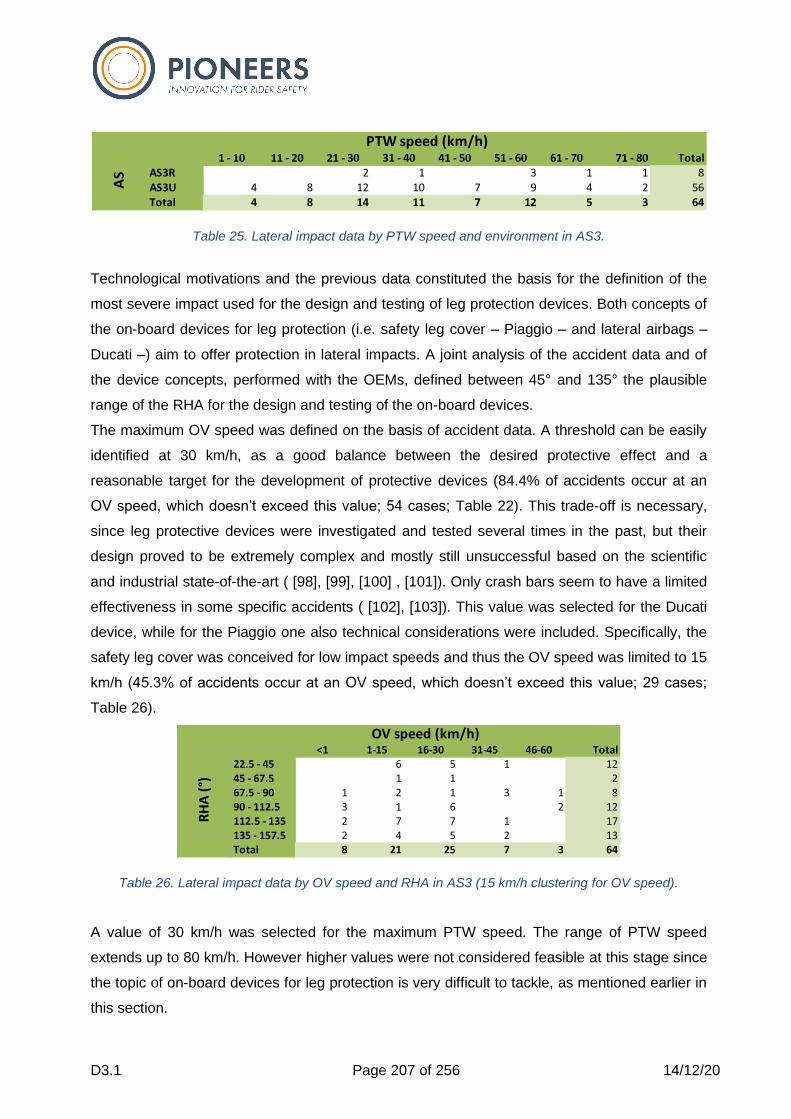
D3.1 Page 207 of 256 14/12/20
Table 25. Lateral impact data by PTW speed and environment in AS3.
Technological motivations and the previous data constituted the basis for the definition of the
most severe impact used for the design and testing of leg protection devices. Both concepts of
the on-board devices for leg protection (i.e. safety leg cover – Piaggio – and lateral airbags –
Ducati –) aim to offer protection in lateral impacts. A joint analysis of the accident data and of
the device concepts, performed with the OEMs, defined between 45° and 135° the plausible
range of the RHA for the design and testing of the on-board devices.
The maximum OV speed was defined on the basis of accident data. A threshold can be easily
identified at 30 km/h, as a good balance between the desired protective effect and a
reasonable target for the development of protective devices (84.4% of accidents occur at an
OV speed, which doesn’t exceed this value; 54 cases; Table 22). This trade-off is necessary,
since leg protective devices were investigated and tested several times in the past, but their
design proved to be extremely complex and mostly still unsuccessful based on the scientific
and industrial state-of-the-art ( [98], [99], [100] , [101]). Only crash bars seem to have a limited
effectiveness in some specific accidents ( [102], [103]). This value was selected for the Ducati
device, while for the Piaggio one also technical considerations were included. Specifically, the
safety leg cover was conceived for low impact speeds and thus the OV speed was limited to 15
km/h (45.3% of accidents occur at an OV speed, which doesn’t exceed this value; 29 cases;
Table 26).
Table 26. Lateral impact data by OV speed and RHA in AS3 (15 km/h clustering for OV speed).
A value of 30 km/h was selected for the maximum PTW speed. The range of PTW speed
extends up to 80 km/h. However higher values were not considered feasible at this stage since
the topic of on-board devices for leg protection is very difficult to tackle, as mentioned earlier in
this section.
1 - 10 11 - 20 21 - 30 31 - 40 41 - 50 51 - 60 61 - 70 71 - 80 TotalAS3R 2 1 3 1 1 8AS3U 4 8 12 10 7 9 4 2 56Total 4 8 14 11 7 12 5 3 64
PTW speed (km/h)
AS
<1 1-15 16-30 31-45 46-60 Total22.5 - 45 6 5 1 1245 - 67.5 1 1 267.5 - 90 1 2 1 3 1 890 - 112.5 3 1 6 2 12112.5 - 135 2 7 7 1 17135 - 157.5 2 4 5 2 13Total 8 21 25 7 3 64
OV speed (km/h)
RH
A (°)
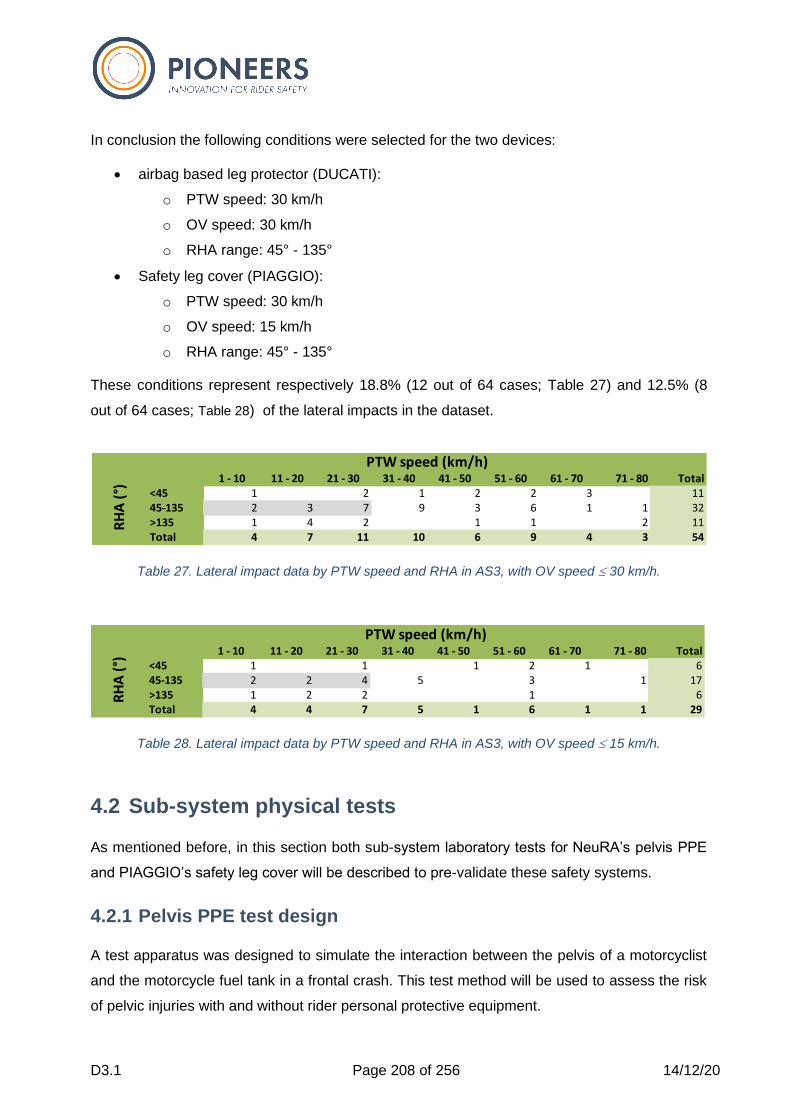
D3.1 Page 208 of 256 14/12/20
In conclusion the following conditions were selected for the two devices:
• airbag based leg protector (DUCATI):
o PTW speed: 30 km/h
o OV speed: 30 km/h
o RHA range: 45° - 135°
• Safety leg cover (PIAGGIO):
o PTW speed: 30 km/h
o OV speed: 15 km/h
o RHA range: 45° - 135°
These conditions represent respectively 18.8% (12 out of 64 cases; Table 27) and 12.5% (8
out of 64 cases; Table 28) of the lateral impacts in the dataset.
Table 27. Lateral impact data by PTW speed and RHA in AS3, with OV speed 30 km/h.
Table 28. Lateral impact data by PTW speed and RHA in AS3, with OV speed 15 km/h.
4.2 Sub-system physical tests
As mentioned before, in this section both sub-system laboratory tests for NeuRA’s pelvis PPE
and PIAGGIO’s safety leg cover will be described to pre-validate these safety systems.
4.2.1 Pelvis PPE test design
A test apparatus was designed to simulate the interaction between the pelvis of a motorcyclist
and the motorcycle fuel tank in a frontal crash. This test method will be used to assess the risk
of pelvic injuries with and without rider personal protective equipment.
1 - 10 11 - 20 21 - 30 31 - 40 41 - 50 51 - 60 61 - 70 71 - 80 Total<45 1 2 1 2 2 3 1145-135 2 3 7 9 3 6 1 1 32>135 1 4 2 1 1 2 11Total 4 7 11 10 6 9 4 3 54
RH
A (°)
PTW speed (km/h)
1 - 10 11 - 20 21 - 30 31 - 40 41 - 50 51 - 60 61 - 70 71 - 80 Total<45 1 1 1 2 1 645-135 2 2 4 5 3 1 17>135 1 2 2 1 6Total 4 4 7 5 1 6 1 1 29
PTW speed (km/h)
RH
A (°)
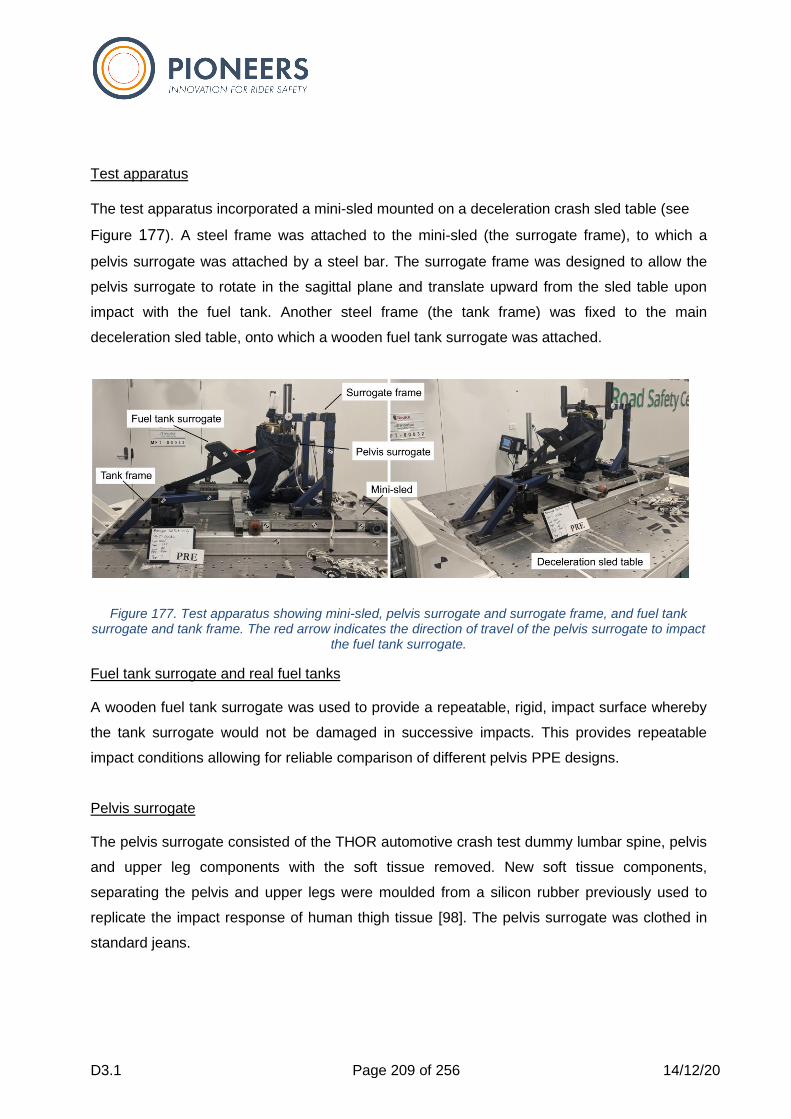
D3.1 Page 209 of 256 14/12/20
Test apparatus
The test apparatus incorporated a mini-sled mounted on a deceleration crash sled table (see
Figure 177). A steel frame was attached to the mini-sled (the surrogate frame), to which a
pelvis surrogate was attached by a steel bar. The surrogate frame was designed to allow the
pelvis surrogate to rotate in the sagittal plane and translate upward from the sled table upon
impact with the fuel tank. Another steel frame (the tank frame) was fixed to the main
deceleration sled table, onto which a wooden fuel tank surrogate was attached.
Figure 177. Test apparatus showing mini-sled, pelvis surrogate and surrogate frame, and fuel tank surrogate and tank frame. The red arrow indicates the direction of travel of the pelvis surrogate to impact
the fuel tank surrogate.
Fuel tank surrogate and real fuel tanks A wooden fuel tank surrogate was used to provide a repeatable, rigid, impact surface whereby
the tank surrogate would not be damaged in successive impacts. This provides repeatable
impact conditions allowing for reliable comparison of different pelvis PPE designs.
Pelvis surrogate The pelvis surrogate consisted of the THOR automotive crash test dummy lumbar spine, pelvis
and upper leg components with the soft tissue removed. New soft tissue components,
separating the pelvis and upper legs were moulded from a silicon rubber previously used to
replicate the impact response of human thigh tissue [98]. The pelvis surrogate was clothed in
standard jeans.
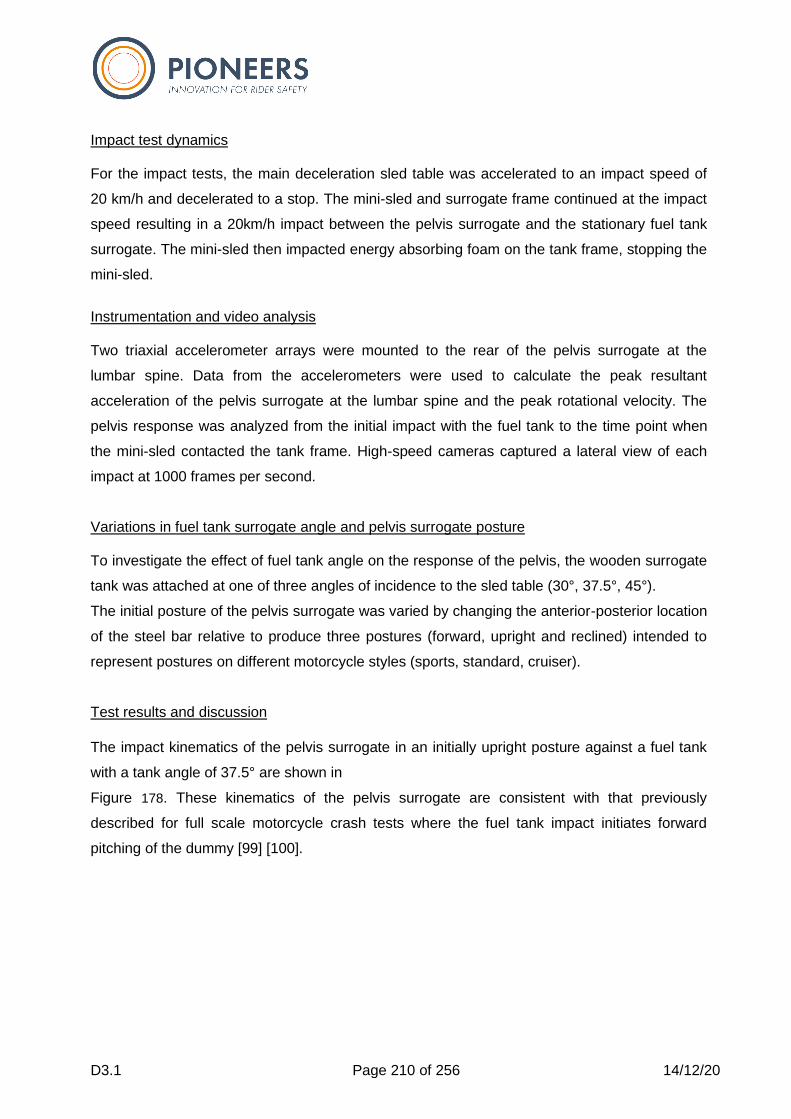
D3.1 Page 210 of 256 14/12/20
Impact test dynamics For the impact tests, the main deceleration sled table was accelerated to an impact speed of
20 km/h and decelerated to a stop. The mini-sled and surrogate frame continued at the impact
speed resulting in a 20km/h impact between the pelvis surrogate and the stationary fuel tank
surrogate. The mini-sled then impacted energy absorbing foam on the tank frame, stopping the
mini-sled.
Instrumentation and video analysis Two triaxial accelerometer arrays were mounted to the rear of the pelvis surrogate at the
lumbar spine. Data from the accelerometers were used to calculate the peak resultant
acceleration of the pelvis surrogate at the lumbar spine and the peak rotational velocity. The
pelvis response was analyzed from the initial impact with the fuel tank to the time point when
the mini-sled contacted the tank frame. High-speed cameras captured a lateral view of each
impact at 1000 frames per second.
Variations in fuel tank surrogate angle and pelvis surrogate posture To investigate the effect of fuel tank angle on the response of the pelvis, the wooden surrogate
tank was attached at one of three angles of incidence to the sled table (30°, 37.5°, 45°).
The initial posture of the pelvis surrogate was varied by changing the anterior-posterior location
of the steel bar relative to produce three postures (forward, upright and reclined) intended to
represent postures on different motorcycle styles (sports, standard, cruiser).
Test results and discussion
The impact kinematics of the pelvis surrogate in an initially upright posture against a fuel tank
with a tank angle of 37.5° are shown in
Figure 178. These kinematics of the pelvis surrogate are consistent with that previously
described for full scale motorcycle crash tests where the fuel tank impact initiates forward
pitching of the dummy [99] [100].
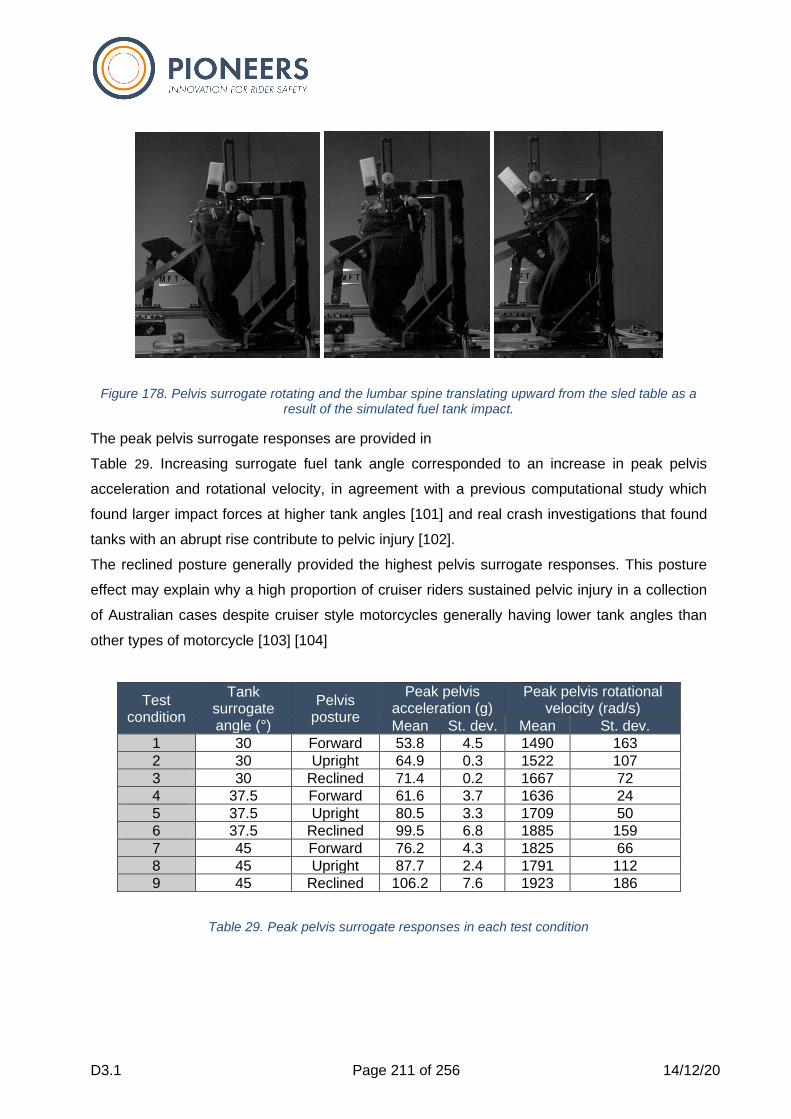
D3.1 Page 211 of 256 14/12/20
Figure 178. Pelvis surrogate rotating and the lumbar spine translating upward from the sled table as a result of the simulated fuel tank impact.
The peak pelvis surrogate responses are provided in
Table 29. Increasing surrogate fuel tank angle corresponded to an increase in peak pelvis
acceleration and rotational velocity, in agreement with a previous computational study which
found larger impact forces at higher tank angles [101] and real crash investigations that found
tanks with an abrupt rise contribute to pelvic injury [102].
The reclined posture generally provided the highest pelvis surrogate responses. This posture
effect may explain why a high proportion of cruiser riders sustained pelvic injury in a collection
of Australian cases despite cruiser style motorcycles generally having lower tank angles than
other types of motorcycle [103] [104]
Test condition
Tank surrogate angle (°)
Pelvis posture
Peak pelvis acceleration (g)
Peak pelvis rotational velocity (rad/s)
Mean St. dev. Mean St. dev.
1 30 Forward 53.8 4.5 1490 163
2 30 Upright 64.9 0.3 1522 107
3 30 Reclined 71.4 0.2 1667 72
4 37.5 Forward 61.6 3.7 1636 24
5 37.5 Upright 80.5 3.3 1709 50
6 37.5 Reclined 99.5 6.8 1885 159
7 45 Forward 76.2 4.3 1825 66
8 45 Upright 87.7 2.4 1791 112
9 45 Reclined 106.2 7.6 1923 186
Table 29. Peak pelvis surrogate responses in each test condition
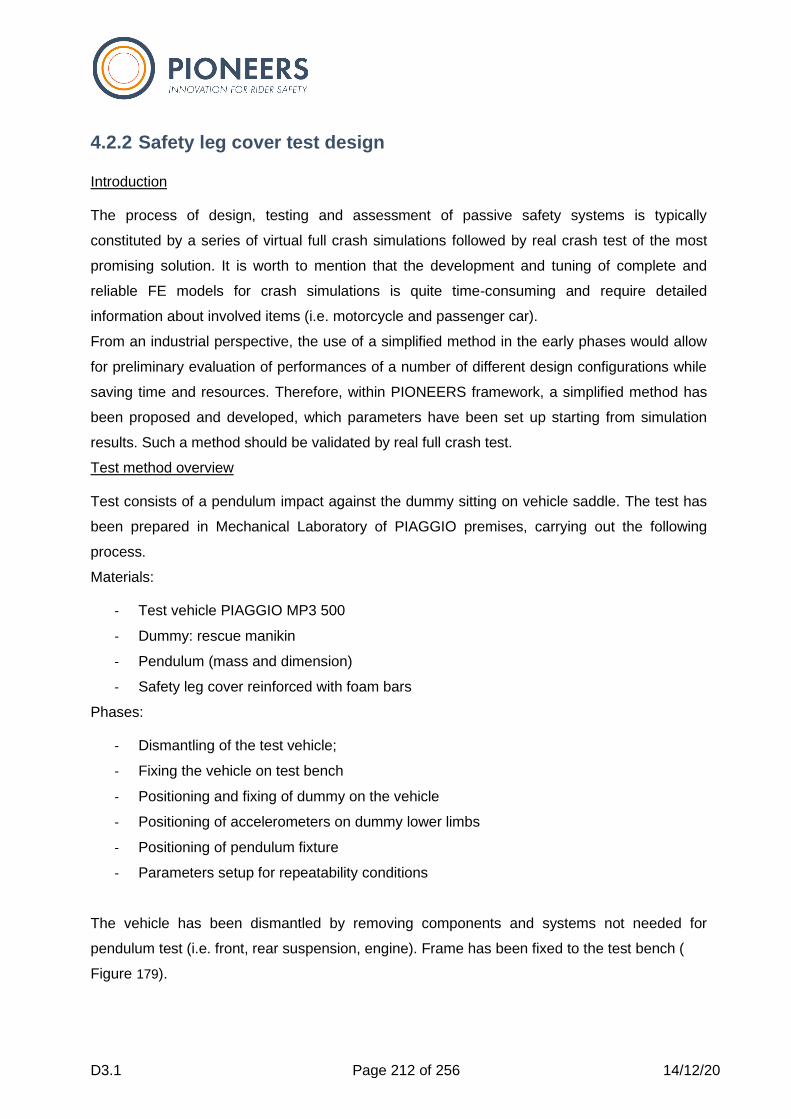
D3.1 Page 212 of 256 14/12/20
4.2.2 Safety leg cover test design
Introduction The process of design, testing and assessment of passive safety systems is typically
constituted by a series of virtual full crash simulations followed by real crash test of the most
promising solution. It is worth to mention that the development and tuning of complete and
reliable FE models for crash simulations is quite time-consuming and require detailed
information about involved items (i.e. motorcycle and passenger car).
From an industrial perspective, the use of a simplified method in the early phases would allow
for preliminary evaluation of performances of a number of different design configurations while
saving time and resources. Therefore, within PIONEERS framework, a simplified method has
been proposed and developed, which parameters have been set up starting from simulation
results. Such a method should be validated by real full crash test.
Test method overview Test consists of a pendulum impact against the dummy sitting on vehicle saddle. The test has
been prepared in Mechanical Laboratory of PIAGGIO premises, carrying out the following
process.
Materials:
- Test vehicle PIAGGIO MP3 500
- Dummy: rescue manikin
- Pendulum (mass and dimension)
- Safety leg cover reinforced with foam bars
Phases:
- Dismantling of the test vehicle;
- Fixing the vehicle on test bench
- Positioning and fixing of dummy on the vehicle
- Positioning of accelerometers on dummy lower limbs
- Positioning of pendulum fixture
- Parameters setup for repeatability conditions
The vehicle has been dismantled by removing components and systems not needed for
pendulum test (i.e. front, rear suspension, engine). Frame has been fixed to the test bench (
Figure 179).
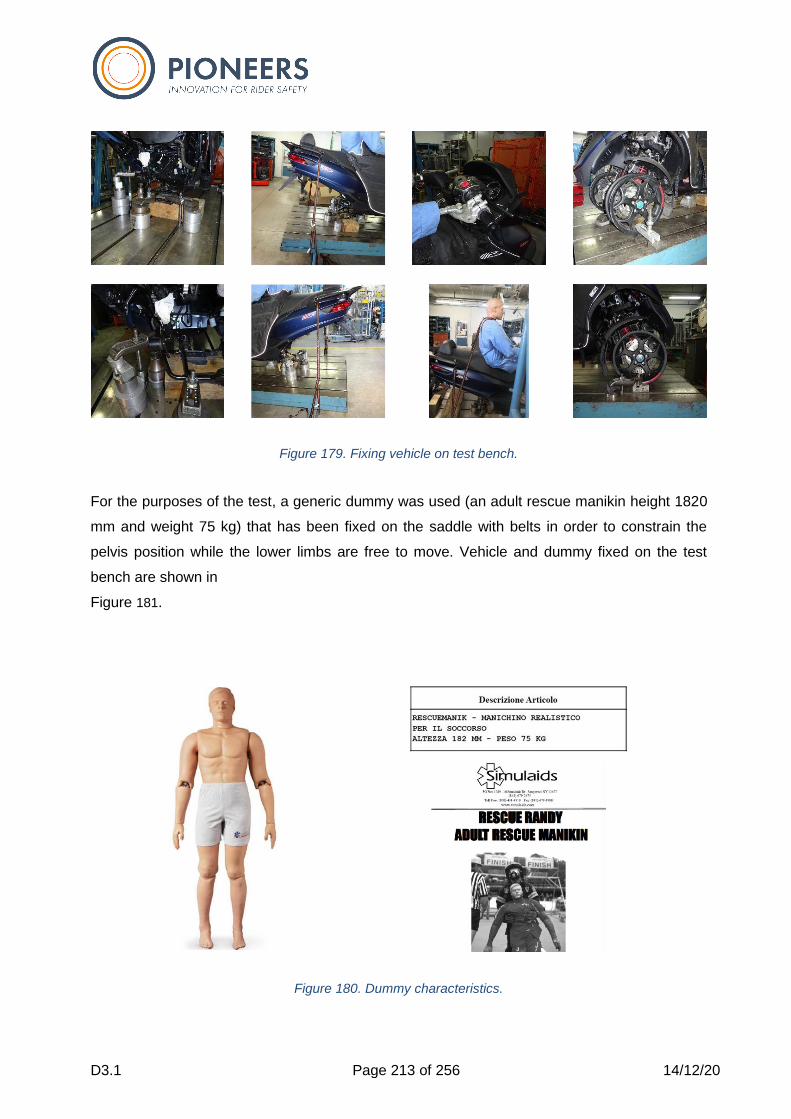
D3.1 Page 213 of 256 14/12/20
Figure 179. Fixing vehicle on test bench.
For the purposes of the test, a generic dummy was used (an adult rescue manikin height 1820
mm and weight 75 kg) that has been fixed on the saddle with belts in order to constrain the
pelvis position while the lower limbs are free to move. Vehicle and dummy fixed on the test
bench are shown in
Figure 181.
Figure 180. Dummy characteristics.
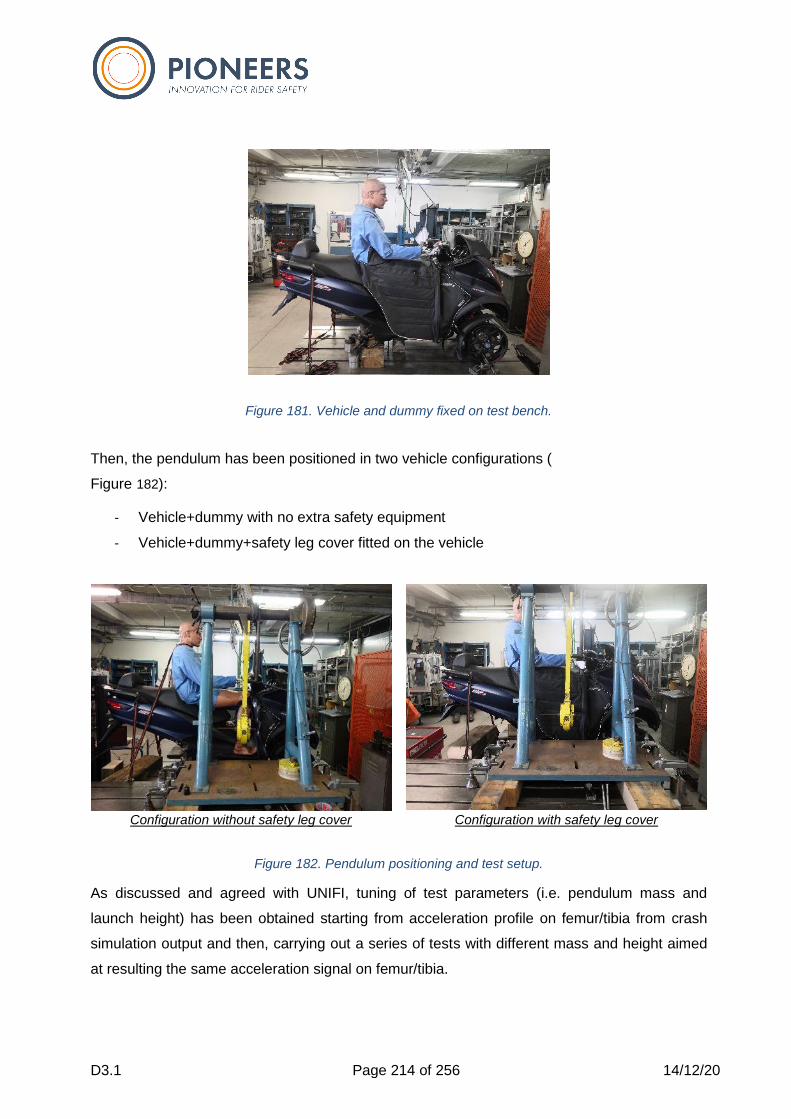
D3.1 Page 214 of 256 14/12/20
Figure 181. Vehicle and dummy fixed on test bench.
Then, the pendulum has been positioned in two vehicle configurations (
Figure 182):
- Vehicle+dummy with no extra safety equipment
- Vehicle+dummy+safety leg cover fitted on the vehicle
Configuration without safety leg cover Configuration with safety leg cover
Figure 182. Pendulum positioning and test setup.
As discussed and agreed with UNIFI, tuning of test parameters (i.e. pendulum mass and
launch height) has been obtained starting from acceleration profile on femur/tibia from crash
simulation output and then, carrying out a series of tests with different mass and height aimed
at resulting the same acceleration signal on femur/tibia.

D3.1 Page 215 of 256 14/12/20
In order to extrapolate accelerations in different points (from A to H, shown in Figure 183) of
rider leg during impact, stationary-moving configuration has been considered, with car moving
@ 5 m/s.
Figure 183. Position of impact points on the leg for time history of acceleration data
Time history of acceleration data along impact direction (perpendicular to the vehicle) have
been reported in xls format split by:
- Without safety leg cover (
- Figure 184)
- With safety leg cover (
- Figure 185)
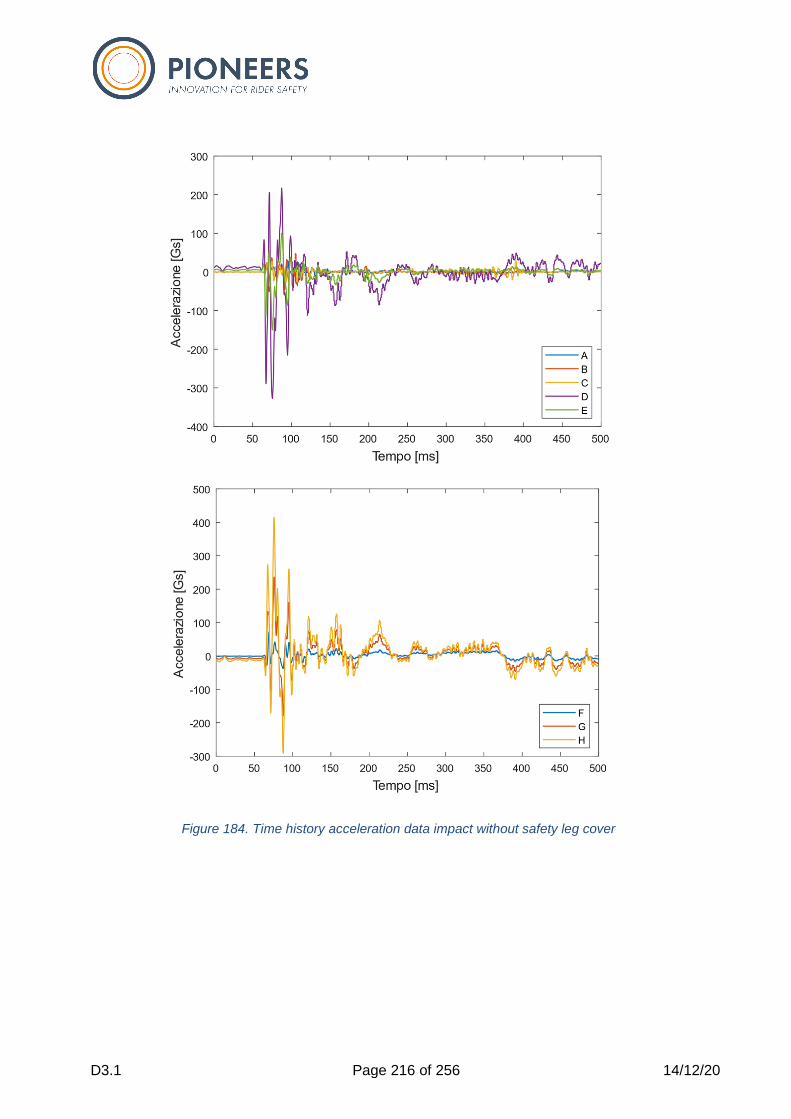
D3.1 Page 216 of 256 14/12/20
Figure 184. Time history acceleration data impact without safety leg cover
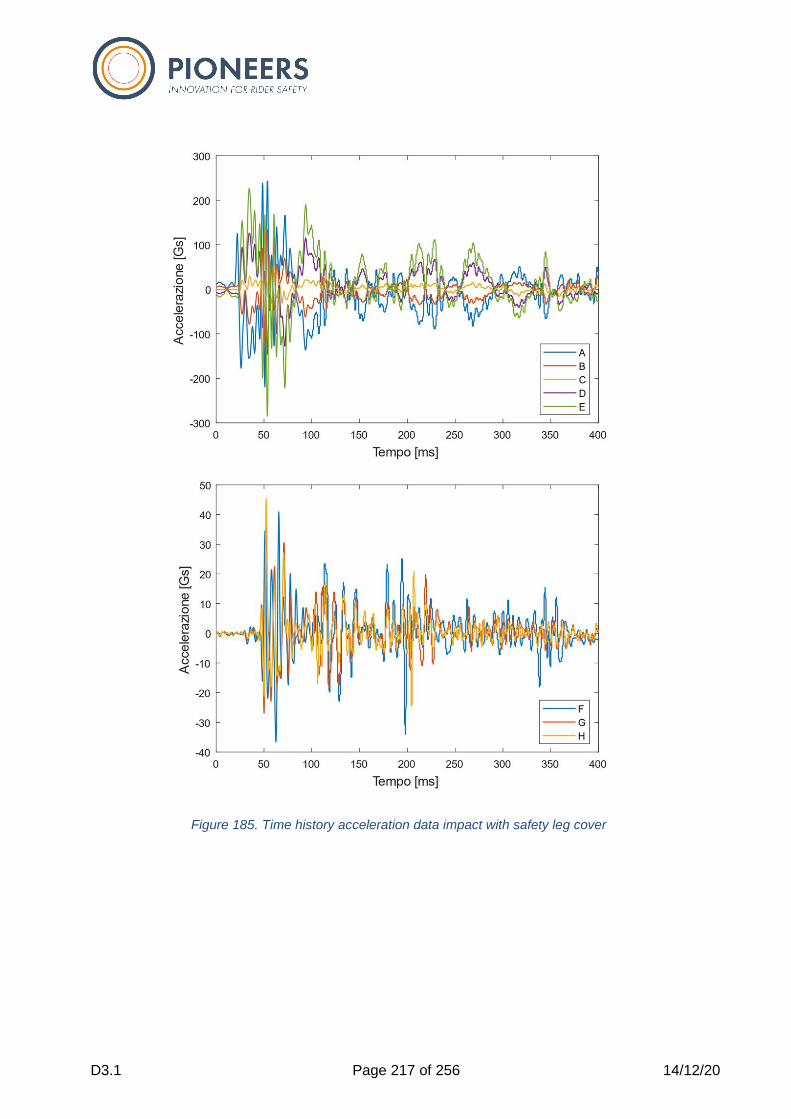
D3.1 Page 217 of 256 14/12/20
Figure 185. Time history acceleration data impact with safety leg cover
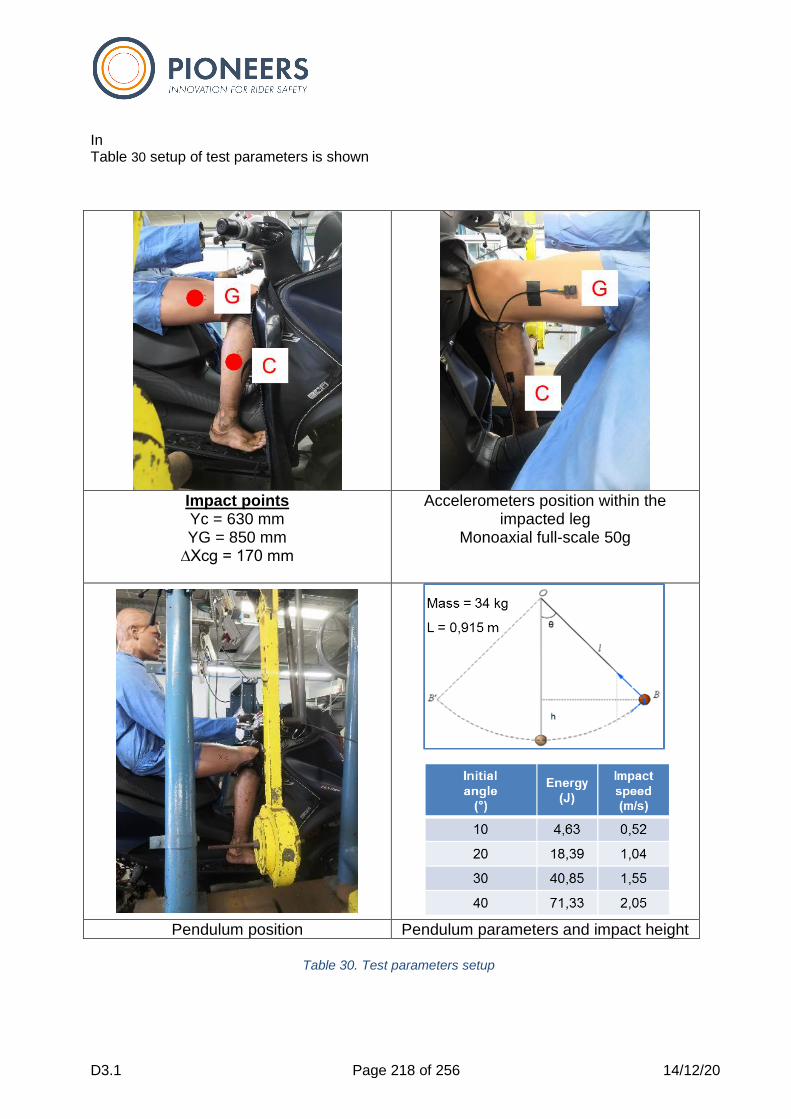
D3.1 Page 218 of 256 14/12/20
In Table 30 setup of test parameters is shown
Impact points Yc = 630 mm YG = 850 mm
∆Xcg = 170 mm
Accelerometers position within the impacted leg
Monoaxial full-scale 50g
Pendulum position Pendulum parameters and impact height
Table 30. Test parameters setup

D3.1 Page 219 of 256 14/12/20
4.3 Full-scale physical tests
This section will involve the description of the virtual simulation models that have been
developed to pre-validate the on-board safety systems designed in Task 5.4 of the PIONEERS
project, as well as the test conditions proposal for both on-board systems and the pelvis PPE
and, finally, the definition of the crash test protocols that will be followed in Task 5.4 to validate
the on-board systems.
4.3.1 Evaluation of tests performance
The results of full-scale physical tests will be used for the evaluation of the devices but also for
the indirect validation of the simulation environment. The most important parameters, that will
be used, are:
• MATD femur:
o axial force;
o bending and torsional moments;
• MATD tibia bending and torsional moments;
• analysis of the frangible bones and of the frangible knee assembly (simulation of the
knee ligament failure).
The evaluation of the devices will be absolute and relative, using peak values of the
parameters. Absolute since MATD will return absolute values and information on the bone
injuries; relative since the data will enable a comparison between the baseline configuration
(i.e. no device installed) and the configuration with the on-board device.
The validation of the simulation environment will be indirect, based on the results of the relative
comparison. In fact, simulations were and will be run using a Hybrid III numerical model, since
there is no numerical MATD model. Hybrid III has some well-known limitations in reproducing
the rider kinematics, especially in case of serious injuries (i.e. bone fracture) and generally its
structure is not capable to correctly measure the loads on the legs ( [105], [106]). Nonetheless
the dummy can be used for a comparative analysis (ref. D5.3 of this project). Because of the
above-mentioned limitations, the test results will be used to verify if the simulation environment
is capable to capture the same relative variation of the load parameters, at least up to the point
when the kinematics of the two dummies could diverge [106].
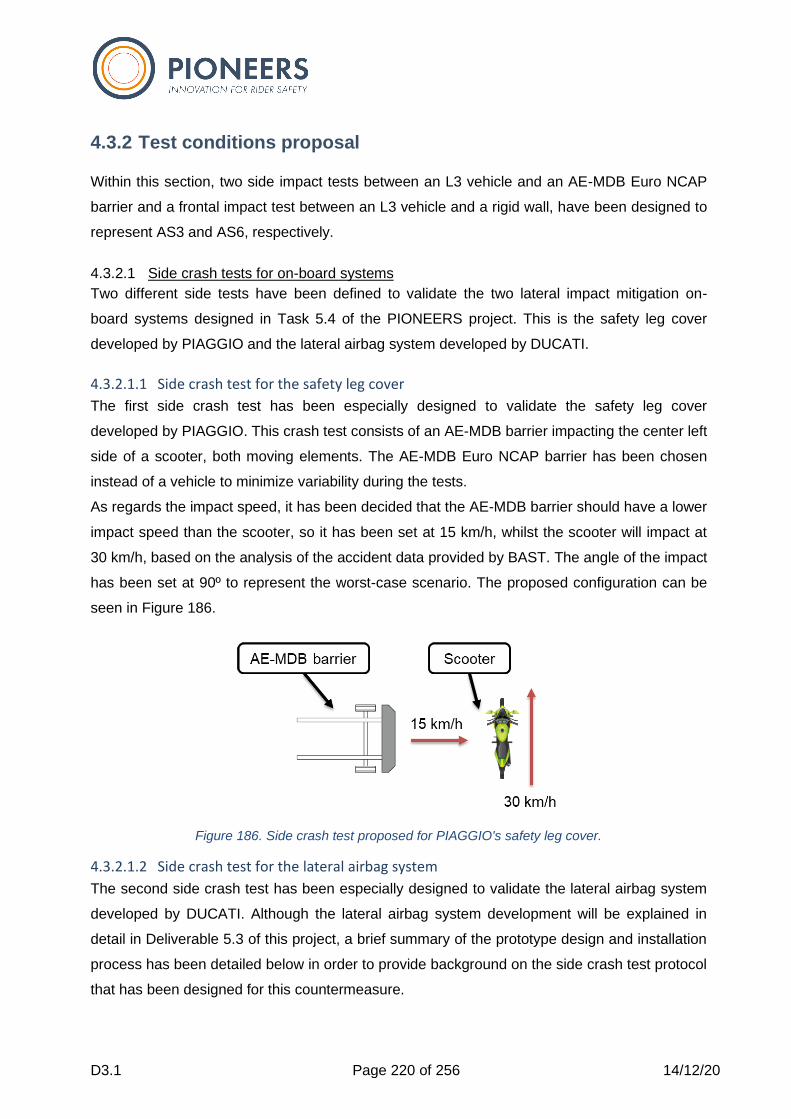
D3.1 Page 220 of 256 14/12/20
4.3.2 Test conditions proposal
Within this section, two side impact tests between an L3 vehicle and an AE-MDB Euro NCAP
barrier and a frontal impact test between an L3 vehicle and a rigid wall, have been designed to
represent AS3 and AS6, respectively.
4.3.2.1 Side crash tests for on-board systems
Two different side tests have been defined to validate the two lateral impact mitigation on-
board systems designed in Task 5.4 of the PIONEERS project. This is the safety leg cover
developed by PIAGGIO and the lateral airbag system developed by DUCATI.
4.3.2.1.1 Side crash test for the safety leg cover
The first side crash test has been especially designed to validate the safety leg cover
developed by PIAGGIO. This crash test consists of an AE-MDB barrier impacting the center left
side of a scooter, both moving elements. The AE-MDB Euro NCAP barrier has been chosen
instead of a vehicle to minimize variability during the tests.
As regards the impact speed, it has been decided that the AE-MDB barrier should have a lower
impact speed than the scooter, so it has been set at 15 km/h, whilst the scooter will impact at
30 km/h, based on the analysis of the accident data provided by BAST. The angle of the impact
has been set at 90º to represent the worst-case scenario. The proposed configuration can be
seen in Figure 186.
Figure 186. Side crash test proposed for PIAGGIO's safety leg cover.
4.3.2.1.2 Side crash test for the lateral airbag system
The second side crash test has been especially designed to validate the lateral airbag system
developed by DUCATI. Although the lateral airbag system development will be explained in
detail in Deliverable 5.3 of this project, a brief summary of the prototype design and installation
process has been detailed below in order to provide background on the side crash test protocol
that has been designed for this countermeasure.
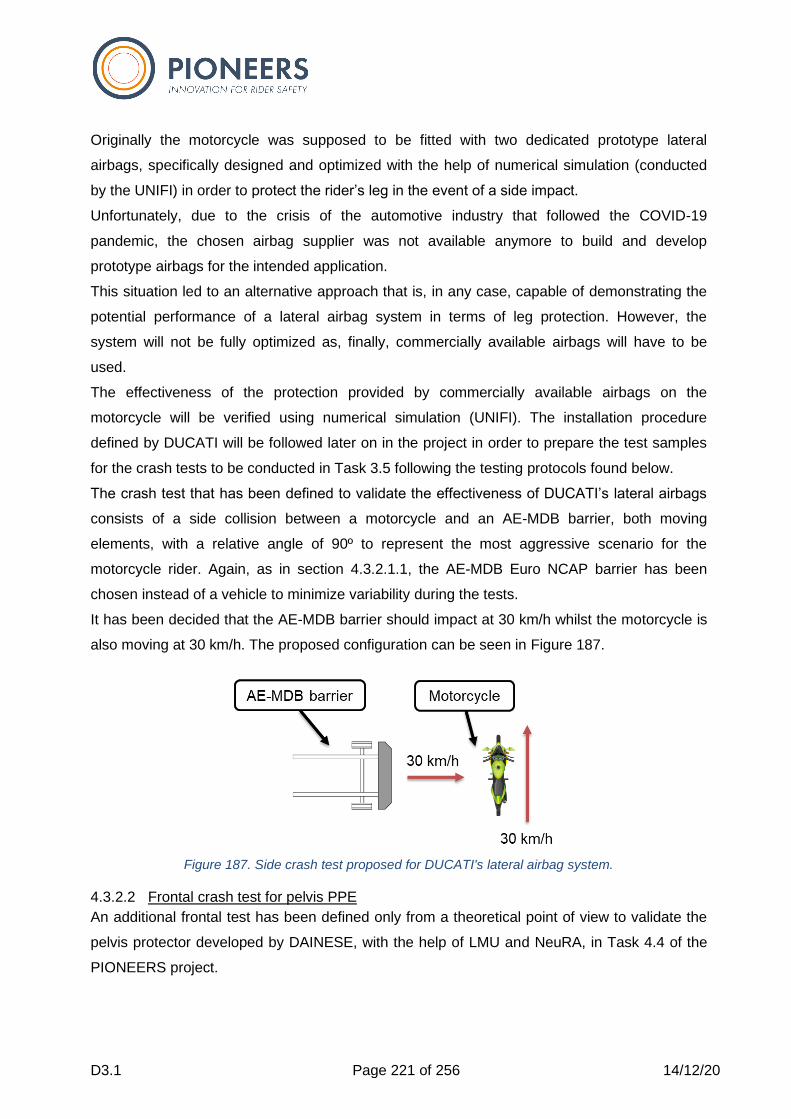
D3.1 Page 221 of 256 14/12/20
Originally the motorcycle was supposed to be fitted with two dedicated prototype lateral
airbags, specifically designed and optimized with the help of numerical simulation (conducted
by the UNIFI) in order to protect the rider’s leg in the event of a side impact.
Unfortunately, due to the crisis of the automotive industry that followed the COVID-19
pandemic, the chosen airbag supplier was not available anymore to build and develop
prototype airbags for the intended application.
This situation led to an alternative approach that is, in any case, capable of demonstrating the
potential performance of a lateral airbag system in terms of leg protection. However, the
system will not be fully optimized as, finally, commercially available airbags will have to be
used.
The effectiveness of the protection provided by commercially available airbags on the
motorcycle will be verified using numerical simulation (UNIFI). The installation procedure
defined by DUCATI will be followed later on in the project in order to prepare the test samples
for the crash tests to be conducted in Task 3.5 following the testing protocols found below.
The crash test that has been defined to validate the effectiveness of DUCATI’s lateral airbags
consists of a side collision between a motorcycle and an AE-MDB barrier, both moving
elements, with a relative angle of 90º to represent the most aggressive scenario for the
motorcycle rider. Again, as in section 4.3.2.1.1, the AE-MDB Euro NCAP barrier has been
chosen instead of a vehicle to minimize variability during the tests.
It has been decided that the AE-MDB barrier should impact at 30 km/h whilst the motorcycle is
also moving at 30 km/h. The proposed configuration can be seen in Figure 187.
Figure 187. Side crash test proposed for DUCATI's lateral airbag system.
4.3.2.2 Frontal crash test for pelvis PPE
An additional frontal test has been defined only from a theoretical point of view to validate the
pelvis protector developed by DAINESE, with the help of LMU and NeuRA, in Task 4.4 of the
PIONEERS project.
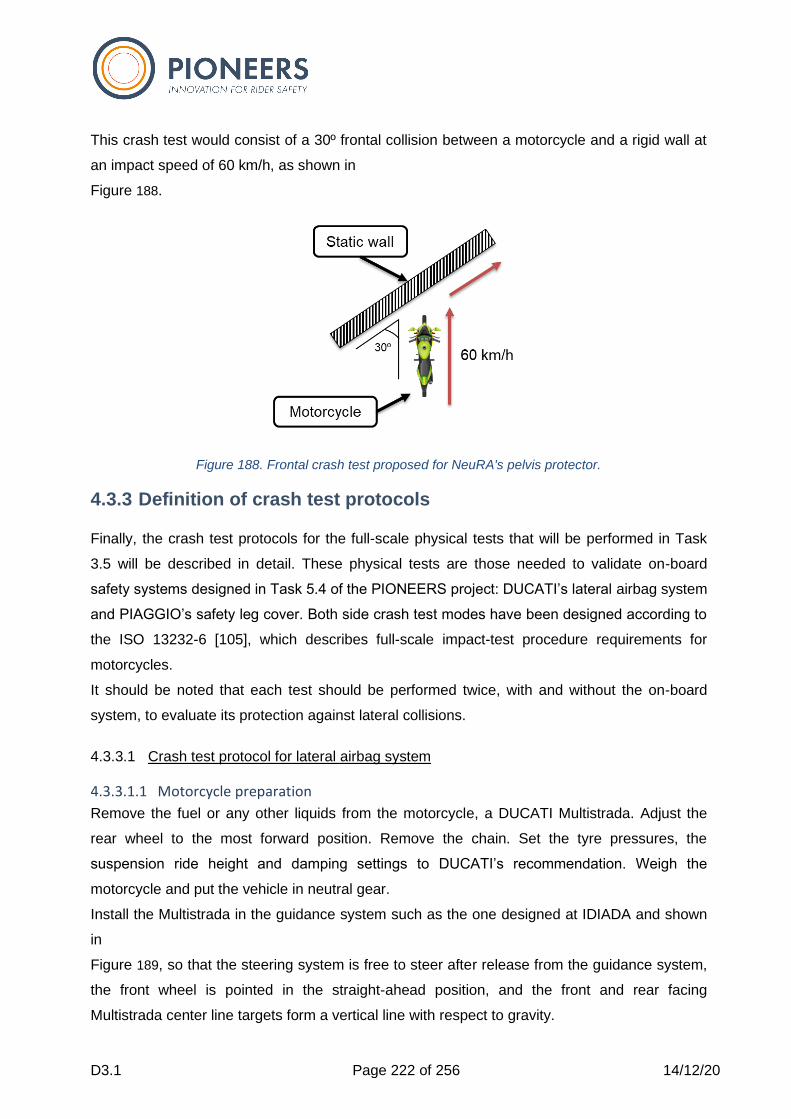
D3.1 Page 222 of 256 14/12/20
This crash test would consist of a 30º frontal collision between a motorcycle and a rigid wall at
an impact speed of 60 km/h, as shown in
Figure 188.
Figure 188. Frontal crash test proposed for NeuRA's pelvis protector.
4.3.3 Definition of crash test protocols
Finally, the crash test protocols for the full-scale physical tests that will be performed in Task
3.5 will be described in detail. These physical tests are those needed to validate on-board
safety systems designed in Task 5.4 of the PIONEERS project: DUCATI’s lateral airbag system
and PIAGGIO’s safety leg cover. Both side crash test modes have been designed according to
the ISO 13232-6 [105], which describes full-scale impact-test procedure requirements for
motorcycles.
It should be noted that each test should be performed twice, with and without the on-board
system, to evaluate its protection against lateral collisions.
4.3.3.1 Crash test protocol for lateral airbag system
4.3.3.1.1 Motorcycle preparation
Remove the fuel or any other liquids from the motorcycle, a DUCATI Multistrada. Adjust the
rear wheel to the most forward position. Remove the chain. Set the tyre pressures, the
suspension ride height and damping settings to DUCATI’s recommendation. Weigh the
motorcycle and put the vehicle in neutral gear.
Install the Multistrada in the guidance system such as the one designed at IDIADA and shown
in
Figure 189, so that the steering system is free to steer after release from the guidance system,
the front wheel is pointed in the straight-ahead position, and the front and rear facing
Multistrada center line targets form a vertical line with respect to gravity.
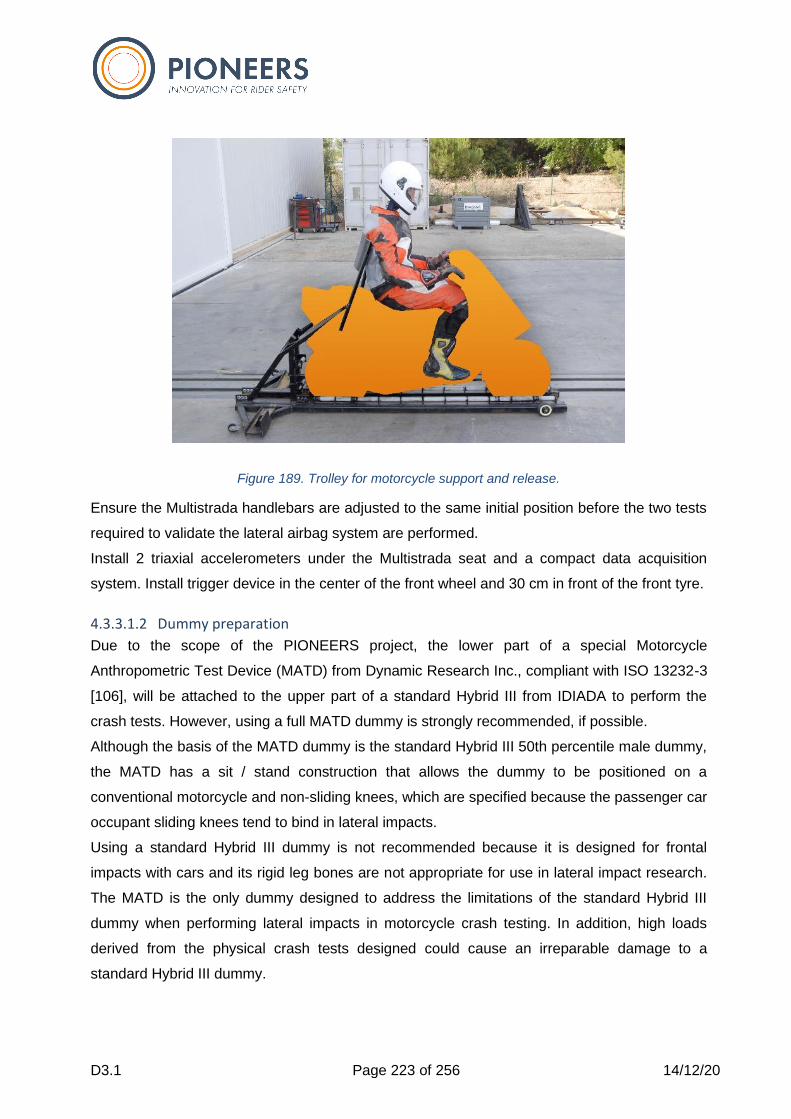
D3.1 Page 223 of 256 14/12/20
Figure 189. Trolley for motorcycle support and release.
Ensure the Multistrada handlebars are adjusted to the same initial position before the two tests
required to validate the lateral airbag system are performed.
Install 2 triaxial accelerometers under the Multistrada seat and a compact data acquisition
system. Install trigger device in the center of the front wheel and 30 cm in front of the front tyre.
4.3.3.1.2 Dummy preparation
Due to the scope of the PIONEERS project, the lower part of a special Motorcycle
Anthropometric Test Device (MATD) from Dynamic Research Inc., compliant with ISO 13232-3
[106], will be attached to the upper part of a standard Hybrid III from IDIADA to perform the
crash tests. However, using a full MATD dummy is strongly recommended, if possible.
Although the basis of the MATD dummy is the standard Hybrid III 50th percentile male dummy,
the MATD has a sit / stand construction that allows the dummy to be positioned on a
conventional motorcycle and non-sliding knees, which are specified because the passenger car
occupant sliding knees tend to bind in lateral impacts.
Using a standard Hybrid III dummy is not recommended because it is designed for frontal
impacts with cars and its rigid leg bones are not appropriate for use in lateral impact research.
The MATD is the only dummy designed to address the limitations of the standard Hybrid III
dummy when performing lateral impacts in motorcycle crash testing. In addition, high loads
derived from the physical crash tests designed could cause an irreparable damage to a
standard Hybrid III dummy.
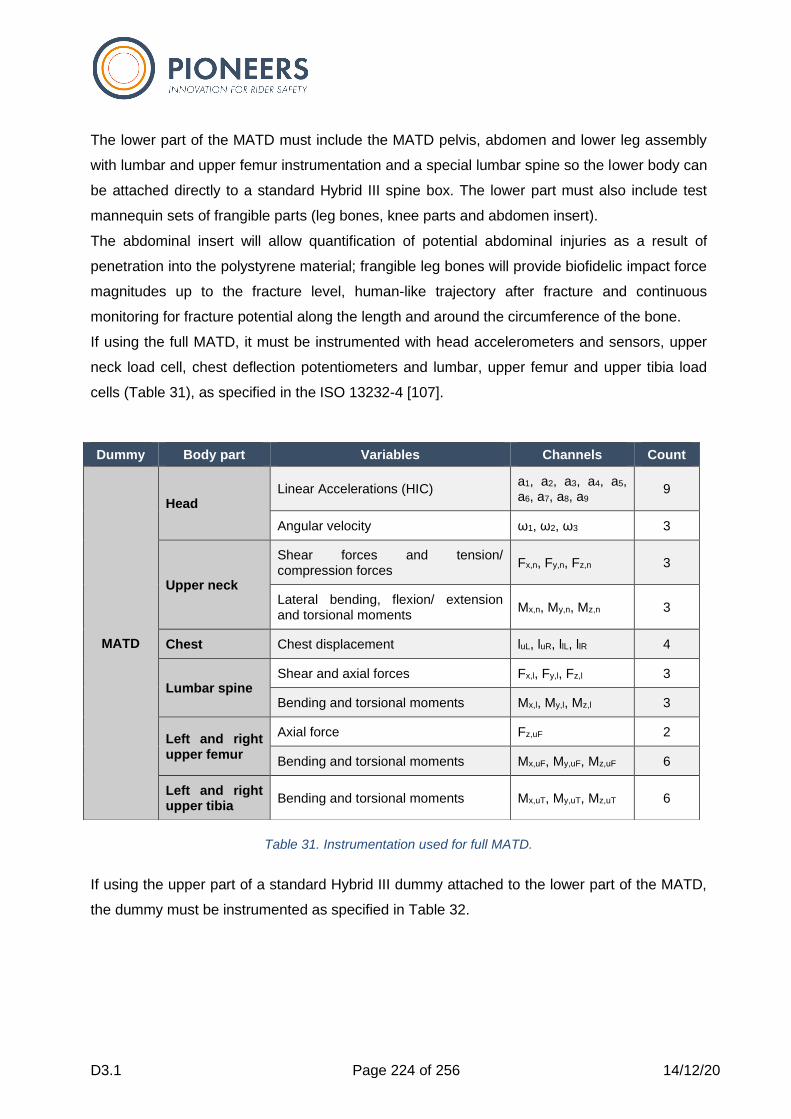
D3.1 Page 224 of 256 14/12/20
The lower part of the MATD must include the MATD pelvis, abdomen and lower leg assembly
with lumbar and upper femur instrumentation and a special lumbar spine so the lower body can
be attached directly to a standard Hybrid III spine box. The lower part must also include test
mannequin sets of frangible parts (leg bones, knee parts and abdomen insert).
The abdominal insert will allow quantification of potential abdominal injuries as a result of
penetration into the polystyrene material; frangible leg bones will provide biofidelic impact force
magnitudes up to the fracture level, human-like trajectory after fracture and continuous
monitoring for fracture potential along the length and around the circumference of the bone.
If using the full MATD, it must be instrumented with head accelerometers and sensors, upper
neck load cell, chest deflection potentiometers and lumbar, upper femur and upper tibia load
cells (Table 31), as specified in the ISO 13232-4 [107].
Table 31. Instrumentation used for full MATD.
If using the upper part of a standard Hybrid III dummy attached to the lower part of the MATD,
the dummy must be instrumented as specified in Table 32.
Dummy Body part Variables Channels Count
MATD
Head Linear Accelerations (HIC)
a1, a2, a3, a4, a5, a6, a7, a8, a9
9
Angular velocity ω1, ω2, ω3 3
Upper neck
Shear forces and tension/ compression forces
Fx,n, Fy,n, Fz,n 3
Lateral bending, flexion/ extension and torsional moments
Mx,n, My,n, Mz,n 3
Chest Chest displacement luL, luR, llL, llR 4
Lumbar spine Shear and axial forces Fx,l, Fy,l, Fz,l 3
Bending and torsional moments Mx,l, My,l, Mz,l 3
Left and right upper femur
Axial force Fz,uF 2
Bending and torsional moments Mx,uF, My,uF, Mz,uF 6
Left and right upper tibia
Bending and torsional moments Mx,uT, My,uT, Mz,uT 6
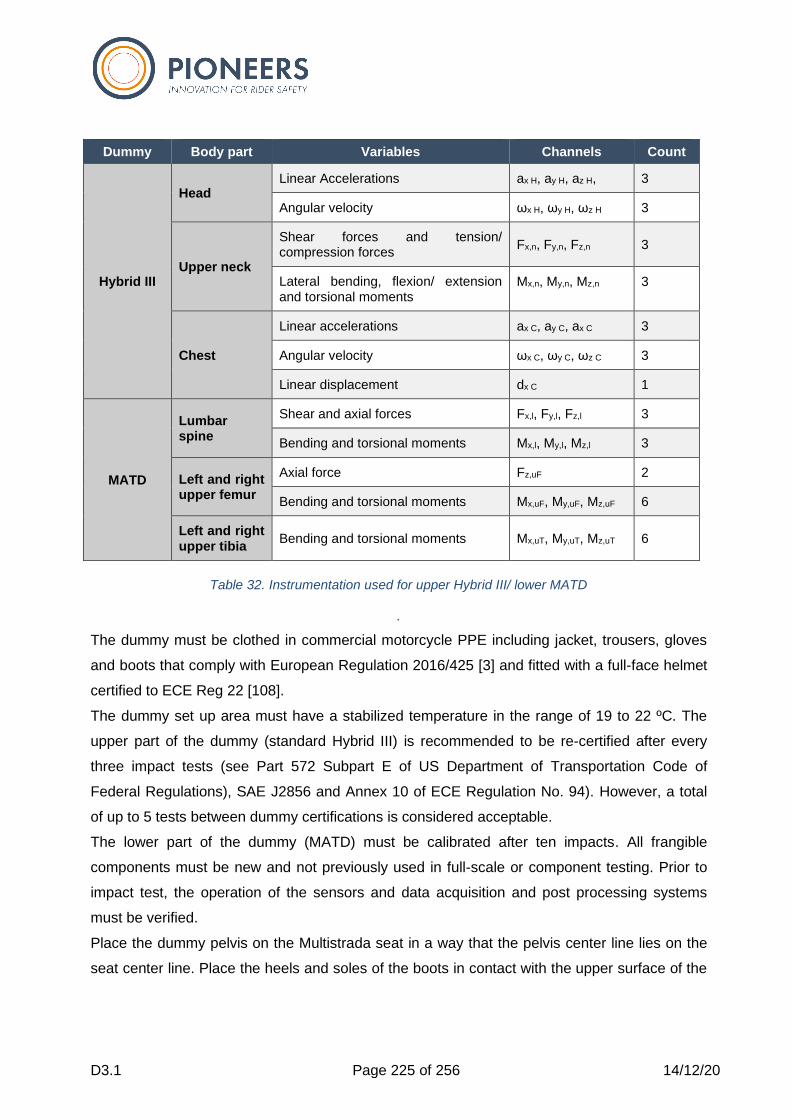
D3.1 Page 225 of 256 14/12/20
Table 32. Instrumentation used for upper Hybrid III/ lower MATD
.
The dummy must be clothed in commercial motorcycle PPE including jacket, trousers, gloves
and boots that comply with European Regulation 2016/425 [3] and fitted with a full-face helmet
certified to ECE Reg 22 [108].
The dummy set up area must have a stabilized temperature in the range of 19 to 22 ºC. The
upper part of the dummy (standard Hybrid III) is recommended to be re-certified after every
three impact tests (see Part 572 Subpart E of US Department of Transportation Code of
Federal Regulations), SAE J2856 and Annex 10 of ECE Regulation No. 94). However, a total
of up to 5 tests between dummy certifications is considered acceptable.
The lower part of the dummy (MATD) must be calibrated after ten impacts. All frangible
components must be new and not previously used in full-scale or component testing. Prior to
impact test, the operation of the sensors and data acquisition and post processing systems
must be verified.
Place the dummy pelvis on the Multistrada seat in a way that the pelvis center line lies on the
seat center line. Place the heels and soles of the boots in contact with the upper surface of the
Dummy Body part Variables Channels Count
Hybrid III
Head Linear Accelerations ax H, ay H, az H, 3
Angular velocity ωx H, ωy H, ωz H 3
Upper neck
Shear forces and tension/ compression forces
Fx,n, Fy,n, Fz,n 3
Lateral bending, flexion/ extension and torsional moments
Mx,n, My,n, Mz,n 3
Chest
Linear accelerations ax C, ay C, ax C 3
Angular velocity ωx C, ωy C, ωz C 3
Linear displacement dx C 1
MATD
Lumbar spine
Shear and axial forces Fx,l, Fy,l, Fz,l 3
Bending and torsional moments Mx,l, My,l, Mz,l 3
Left and right upper femur
Axial force Fz,uF 2
Bending and torsional moments Mx,uF, My,uF, Mz,uF 6
Left and right upper tibia
Bending and torsional moments Mx,uT, My,uT, Mz,uT 6

D3.1 Page 226 of 256 14/12/20
foot rests, adjusting the feet until they are perpendicular to the lower legs. Press the knees
toward each other until the legs are in contact with the Multistrada surface.
If using the full MATD dummy, hands must be functional and able to be positioned as follows:
the first finger in contact with the inner edge of the hand grip, all fingers wrapped over and in
contact with the hand grip, the thumb wrapped under and in contact with the hand grip, the
palm in contact with the hand grip and the back of the hand parallel to the surface connecting
the hand grip and hand lever.
If using the upper part of a standard Hybrid III dummy attached to the lower part of the MATD,
place the dummy hands on the hand grips with all fingers wrapped over and in contact with the
hand grip and the palm in contact with the hand grip, as shown in
Figure 190.
Note that, in both cases, the lower arm must be pivoted 10º with respect to the upper arm. For
this purpose, minor adjustments may be made in this order of preference: rotate the shoulder,
pivot the shoulder, rotate the wrist, pivot the wrist and adjust the handlebar.
Figure 190. Detail of dummy hands positioning.
Finally, targets must be placed on the dummy clothing at the shoulder, elbow, hip, knee,
projected ankle point of the boot on the dummy side which is closest to the Multistrada side
view high-speed camera, and helmet (projected center of gravity and front and rear center
line).
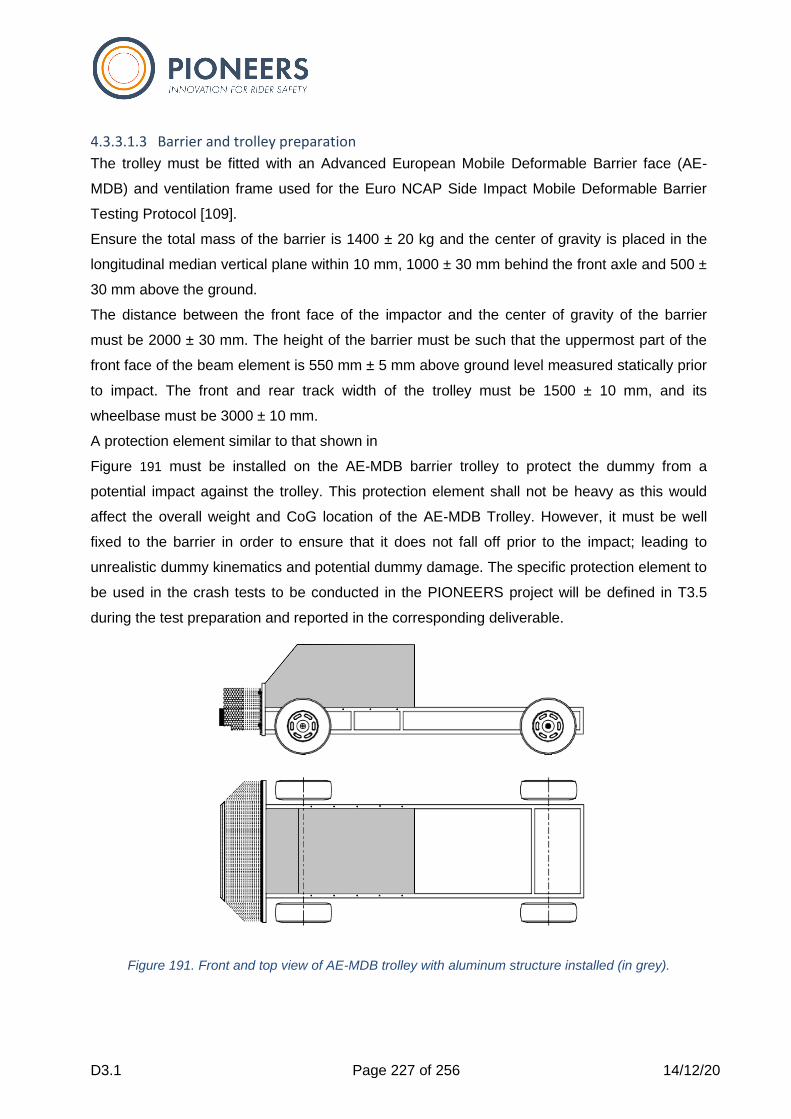
D3.1 Page 227 of 256 14/12/20
4.3.3.1.3 Barrier and trolley preparation
The trolley must be fitted with an Advanced European Mobile Deformable Barrier face (AE-
MDB) and ventilation frame used for the Euro NCAP Side Impact Mobile Deformable Barrier
Testing Protocol [109].
Ensure the total mass of the barrier is 1400 ± 20 kg and the center of gravity is placed in the
longitudinal median vertical plane within 10 mm, 1000 ± 30 mm behind the front axle and 500 ±
30 mm above the ground.
The distance between the front face of the impactor and the center of gravity of the barrier
must be 2000 ± 30 mm. The height of the barrier must be such that the uppermost part of the
front face of the beam element is 550 mm ± 5 mm above ground level measured statically prior
to impact. The front and rear track width of the trolley must be 1500 ± 10 mm, and its
wheelbase must be 3000 ± 10 mm.
A protection element similar to that shown in
Figure 191 must be installed on the AE-MDB barrier trolley to protect the dummy from a
potential impact against the trolley. This protection element shall not be heavy as this would
affect the overall weight and CoG location of the AE-MDB Trolley. However, it must be well
fixed to the barrier in order to ensure that it does not fall off prior to the impact; leading to
unrealistic dummy kinematics and potential dummy damage. The specific protection element to
be used in the crash tests to be conducted in the PIONEERS project will be defined in T3.5
during the test preparation and reported in the corresponding deliverable.
Figure 191. Front and top view of AE-MDB trolley with aluminum structure installed (in grey).
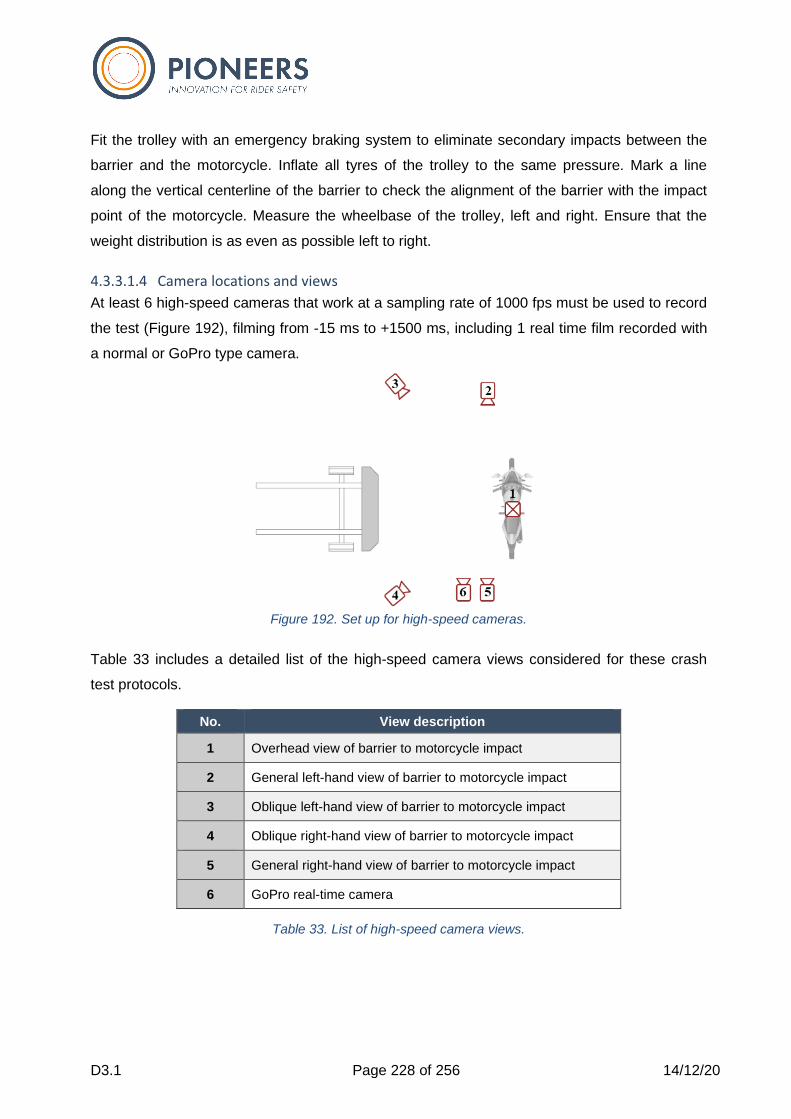
D3.1 Page 228 of 256 14/12/20
Fit the trolley with an emergency braking system to eliminate secondary impacts between the
barrier and the motorcycle. Inflate all tyres of the trolley to the same pressure. Mark a line
along the vertical centerline of the barrier to check the alignment of the barrier with the impact
point of the motorcycle. Measure the wheelbase of the trolley, left and right. Ensure that the
weight distribution is as even as possible left to right.
4.3.3.1.4 Camera locations and views
At least 6 high-speed cameras that work at a sampling rate of 1000 fps must be used to record
the test (Figure 192), filming from -15 ms to +1500 ms, including 1 real time film recorded with
a normal or GoPro type camera.
Figure 192. Set up for high-speed cameras.
Table 33 includes a detailed list of the high-speed camera views considered for these crash
test protocols.
Table 33. List of high-speed camera views.
No. View description
1 Overhead view of barrier to motorcycle impact
2 General left-hand view of barrier to motorcycle impact
3 Oblique left-hand view of barrier to motorcycle impact
4 Oblique right-hand view of barrier to motorcycle impact
5 General right-hand view of barrier to motorcycle impact
6 GoPro real-time camera
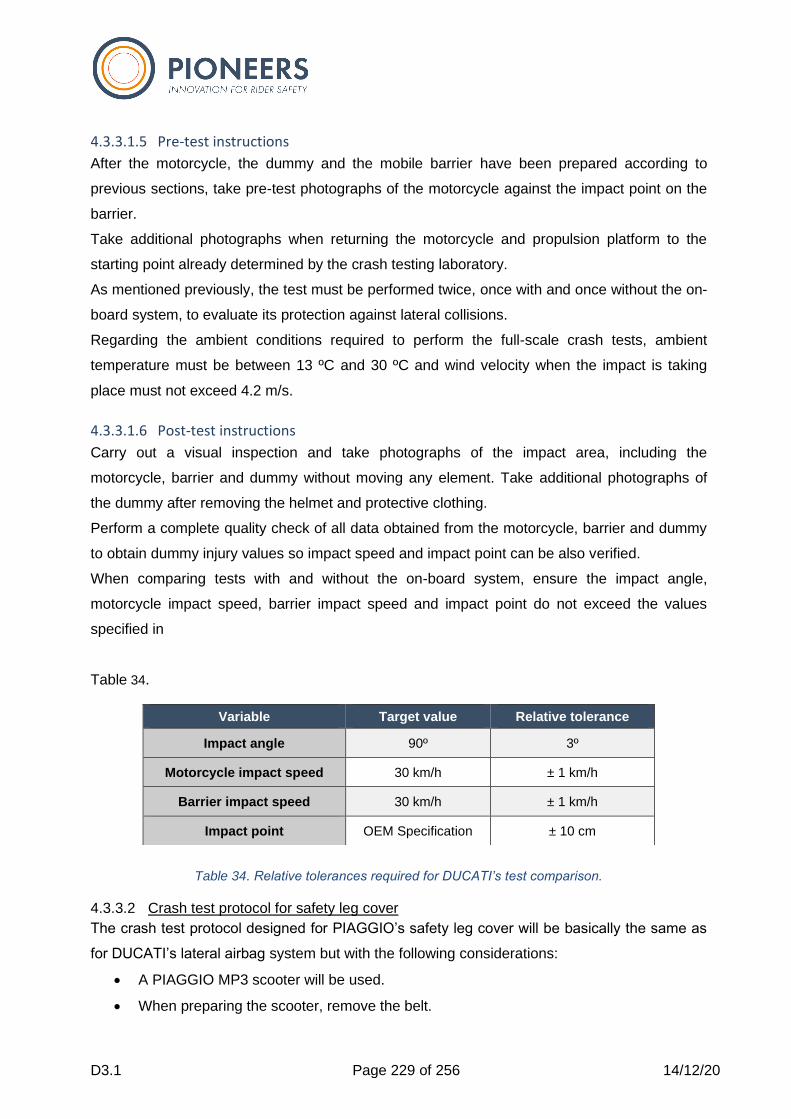
D3.1 Page 229 of 256 14/12/20
4.3.3.1.5 Pre-test instructions
After the motorcycle, the dummy and the mobile barrier have been prepared according to
previous sections, take pre-test photographs of the motorcycle against the impact point on the
barrier.
Take additional photographs when returning the motorcycle and propulsion platform to the
starting point already determined by the crash testing laboratory.
As mentioned previously, the test must be performed twice, once with and once without the on-
board system, to evaluate its protection against lateral collisions.
Regarding the ambient conditions required to perform the full-scale crash tests, ambient
temperature must be between 13 ºC and 30 ºC and wind velocity when the impact is taking
place must not exceed 4.2 m/s.
4.3.3.1.6 Post-test instructions
Carry out a visual inspection and take photographs of the impact area, including the
motorcycle, barrier and dummy without moving any element. Take additional photographs of
the dummy after removing the helmet and protective clothing.
Perform a complete quality check of all data obtained from the motorcycle, barrier and dummy
to obtain dummy injury values so impact speed and impact point can be also verified.
When comparing tests with and without the on-board system, ensure the impact angle,
motorcycle impact speed, barrier impact speed and impact point do not exceed the values
specified in
Table 34.
Table 34. Relative tolerances required for DUCATI’s test comparison.
4.3.3.2 Crash test protocol for safety leg cover
The crash test protocol designed for PIAGGIO’s safety leg cover will be basically the same as
for DUCATI’s lateral airbag system but with the following considerations:
• A PIAGGIO MP3 scooter will be used.
• When preparing the scooter, remove the belt.
Variable Target value Relative tolerance
Impact angle 90º 3º
Motorcycle impact speed 30 km/h ± 1 km/h
Barrier impact speed 30 km/h ± 1 km/h
Impact point OEM Specification ± 10 cm
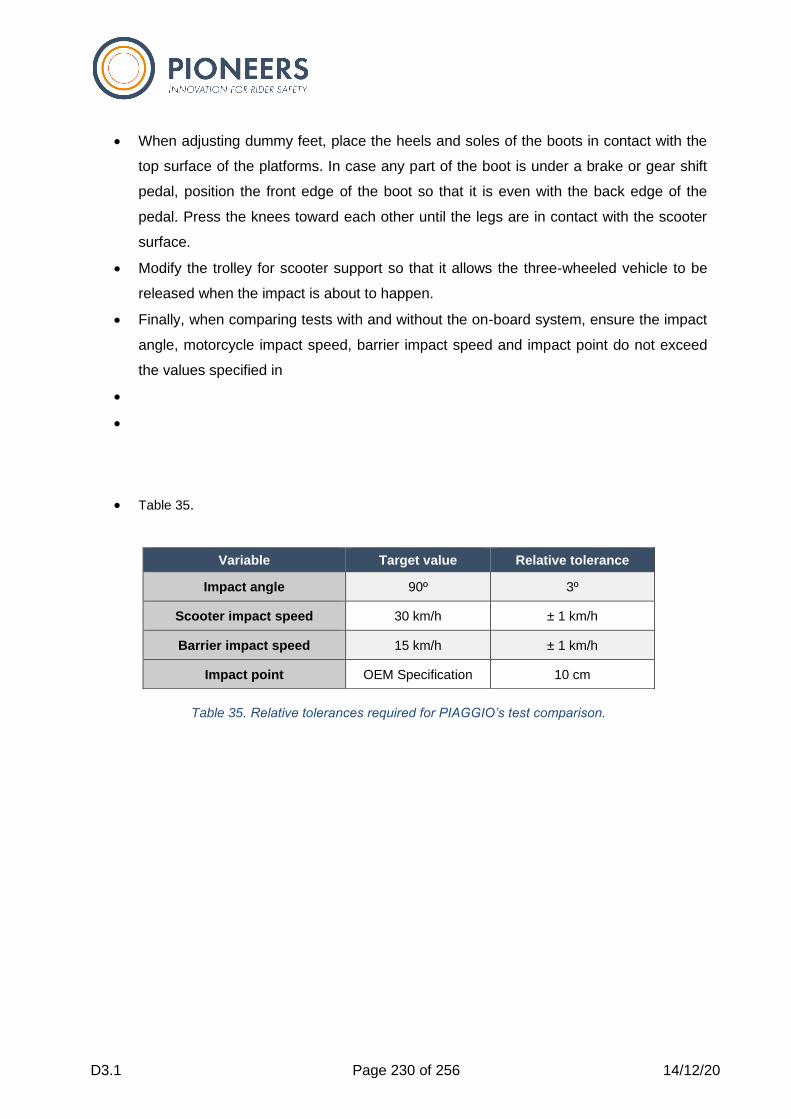
D3.1 Page 230 of 256 14/12/20
• When adjusting dummy feet, place the heels and soles of the boots in contact with the
top surface of the platforms. In case any part of the boot is under a brake or gear shift
pedal, position the front edge of the boot so that it is even with the back edge of the
pedal. Press the knees toward each other until the legs are in contact with the scooter
surface.
• Modify the trolley for scooter support so that it allows the three-wheeled vehicle to be
released when the impact is about to happen.
• Finally, when comparing tests with and without the on-board system, ensure the impact
angle, motorcycle impact speed, barrier impact speed and impact point do not exceed
the values specified in
•
•
• Table 35.
Table 35. Relative tolerances required for PIAGGIO’s test comparison.
Variable Target value Relative tolerance
Impact angle 90º 3º
Scooter impact speed 30 km/h ± 1 km/h
Barrier impact speed 15 km/h ± 1 km/h
Impact point OEM Specification 10 cm
D3.1 Page 231 of 256 14/12/20
5 Conclusions
This document is the result of the different work carried out in different areas such as the test
design for PPE, head-neck protection and on-board systems.
An in-depth crashed garment analysis was performed to better understand the phenomena
during a crash that could lead to garment failure. From this research, 7 fabric failure categories
were defined, each with their presumable cause of failure deducted from in-lab reconstruction
tests. Descriptions of each category are defined on macroscopic and microscopic level
together with a schematic drawing of the failure on macroscopic level as found in the analysed
garments.
From the reconstruction of the different categories it can be concluded that the AART test
setup mimics and combines all garment failures that were categorized, except for instant fabric
burst due to direct impact. An increase in impact force on the AART setup is needed to mimic
this type of failure. The new classification of fabric failures has a more defined demarcation
between the different categories than previously known. Causes of failures are linked to
categories and definitions are supported by schematic representations.
REV’IT! developed two different test setups in T3.1 based on 6 infrared sensors to monitor the
temperature rise during an abrasive slide on the AART machine: a ‘In sample holder’ test setup
and a ‘In tile’ test setup. For both setups, a high sampling rate was used (512 Hz), the sensors
were calibrated, and the results were validated. For both test setups Arduino and MATLAB
scripts were written to acquire and analyse the temperature data.
Meta-analysis of both test setups revealed a linear relationship between maximum temperature
and rotational speed. Test results were precise and accurate (within acceptable deviation) for
both test setups. A clear temperature difference can be noted between both test setups for the
same test material at the same rotational speed. One explanation for this difference is the
absence of pressure on the fabric due to the hole in rubber pad that are needed in order to
allow for an unobstructed temperature measurement during the ‘In sample holder’ test run.
Another explanation for the difference in temperature rise between the two test setups is
directly related to the test material’s thermal resistance (mainly due to thickness of the test
material).
D3.1 Page 232 of 256 14/12/20
In T3.1, different options for investigating the influence of impact in the test method of
protective clothing materials were compared. An additional system to increase the impact
energy inside the current standard EN 17092-1 was developed and implemented. To improve
the test methodology, different sensor systems for measuring impact energy and hole
formation were compared. Especially the use of acceleration sensors as well as optical hole
formation sensors delivered good results.
In T3.5 the relationship between structural integrity of a fabric and temperature rise will be
investigated. Although no representative data is available in literature, it is expected that the
maximum temperatures recorded during these experiments may lead to skin burn injuries.
IDIADA has designed a machine in order to improve and develop the test method proposed in
EN 1621-4 and EN 1621-5 focused on inflatables devices.
The final proposal will be tested in T3.5 by assessing the test method and comparing the
expected and the obtained results from the partner’s prototypes.
Regarding the boot testing in order to see the performance of the ankle’s bending, the main
objective has been accomplished. A new and realistic test method has been created besides
the one described in EN 13634 to perform bending on ankle by analysing the boot’s movement
during the inversion-eversion and flexion-extension test.
During the coming task (T3.5) it will be possible to test physically the prototypes in the new test
methods designed and study their performance in the laboratory. All the information extracted
from this work will be provided to the corresponding standards developing organizations
(SDOs) for its implementation in new versions of standards.
The development of test methods for PPEs went through different ideation stages and the first
prototypes are currently being produced. Further research and exploration is necessary to
iterate upon the first tests and insights.
Test methods for the head as well as the neck region are proposed. Due to differences in legal
implementation and existing work in these fields both topics were separated. For head
protection existing helmet test procedures were analyzed and potential for optimization was
defined. The main difference for helmet tests is the consideration of tangential impacts as well
as the introduction of model-based assessment methods. These changes address real world
D3.1 Page 233 of 256 14/12/20
accidents and loading conditions and also update the injury assessment towards more
sophisticated approaches in order to mitigate the prevalence of brain injuries in PTW accidents.
The proposed method is an adaption of existing test setups such as drop towers and
headforms. It is therefore seen as a realistic and reasonable input to standardization as well as
to consumer helmet tests.
The test method for neck braces is, compared to the helmet test, based on much less work
done previously. At the same time the assessment of a neck brace is also dependent on the
interaction between the helmet and the neck brace. Here in PIONEERS it is therefore proposed
to start with geometrical aspects in order to identify reasonable helmet-brace-combinations.
This approach enables the reduction of possible helmet-brace-combinations to a practicable
amount for further testing. As the neck is one of the most complex structures of the human
body the injury assessment is also a complex topic. Biomechanical data, existing dummies as
well as injury criteria used in the automotive sector are too limited to address the
omnidirectional and diverse impact configurations seen in PTW accidents. The geometrical
assessment procedure proposed in PIONEERS is therefore seen as a first step towards a
more sophisticated neck brace test method. It will help to give reasonable advice to customers
who want to buy helmets and neck braces. Furthermore the focus on matching geometries
enables a more detailed analysis of helmet-brace-interactions in order to define impact
conditions and assessment methods in the future.
In addition, in Task 3.3, test procedures to assess the effectiveness of the on-board safety
systems that have designed in WP5 have been developed. To do so, several research stages
have been conducted. First of all, the accident conditions to be studied have been selected by
analyzing accidentology data, identifying the target accident scenarios and injuries and
combining the outputs of this study with the technological limitations of the on-board safety
systems (regarding applicable impact speed, mounting, etc.).
Next, sub-system physical tests to evaluate the effectiveness of Pelvis PPEs and to support the
development of the safety leg cover were designed.
On one hand, NeuRA worked on the Pelvis PPE sub-system test design. The physical test
method developed for this study provides a means of systematically investigating the
interaction between the pelvis of a motorcyclist and the fuel tank in a frontal crash. The test
showed good repeatability and the ability to monitor the pelvis response which was sensitive to
changes in test conditions that have been linked to pelvis injury risk in previous studies. In the
D3.1 Page 234 of 256 14/12/20
future, the test method could be used to aid in improving crashworthiness of motorcycle fuel
tanks and in the design of protective equipment for riders.
On the other hand, PIAGGIO developed a side pendulum test that mimicked the femur and
tibia acceleration profiles that were achieved by means of an FE simulation of a side impact
crash. After tuning the pendulum mass and launch height, similar femur and tibia accelerations
were achieved by means of the simplified sub-system test, enabling the use of this new test
method for the safety leg design and validation.
Finally, a series of full-scale crash test protocols were designed in order to establish the testing
methods to be followed in Task 3.5 of the PIONEERS project. Although both frontal and side
impact load cases of interest were identified, the only test protocols that were developed in
detail were those corresponding to the side impact tests; as they could be used for the on-
board safety system effectiveness evaluation. Thus, two different side impact tests (one for the
safety leg cover from PIAGGIO and one for the lateral airbags from DUCATI) were designed.
Both side impact test set-ups consist in a motorcycle or scooter moving longitudinally at a
constant speed of 30 km/h and being hit perpendicularly to their trajectory by an AE-MDB
movable deformable barrier. The AE-MDB barrier and trolley would be travelling at a speed of
15 km/h in the test to assess PIAGGIO’s safety leg cover; while it would be traveling at 30 km/h
in the test to evaluate DUCATI’s lateral airbag. In both cases, the motorcycle/scooter rider
would either be a fully Motorcyclist Dummy (M-ATD) or an updated version of the Hybrid III 50th
percentile male dummy with an M-ATD lower body.
By executing these crash tests in Task 3.5, it will be possible to evaluate the safety benefit from
implementing the on-board safety systems that have been developed throughout the
PIONEERS project, in a representative and repeatable laboratory test condition.
D3.1 Page 235 of 256 14/12/20
References
[1] United Nations, "Regulation No. 22 - UNIFORM PROVISIONS CONCERNING THE
APPROVAL OF PROTECTIVE HELMETS AND THEIR VISORS FOR DRIVERS AND
PASSENGERS OF MOTOR CYCLES AND MOPEDS. Rev.1/Add.21/Rev.4.," 2002.
[2] Rome et al., «Motorcycle protective clothing: Protection from injury or just the weather?
Accident Analysis & Prevention, 1893-1900,» 2011.
[3] European Parliament and European Union Council., «REGULATION (EU) 2016/425 OF
THE EUROPEAN PARLIAMENT AND OF THE COUNCIL of 9 March 2016 on personal
protective equipment and repealing Council Directive 89/686/EEC.,» Official Journal of
the European Union (2016), 9 March 2016.
[4] Technical Committee CEN/TC, «EN 13595:2002 Protective clothing for professional
motorcycle riders,» 2002.
[5] Meredith, Validation of the abrasion resistance test protocols and performance criteria of
EN13595: The probability of soft tissue injury to motorcycle riders, 2017.
[6] European Commission, «PIONEERS project: D1.1 Powered Two-Wheelers - Road
Accident Scenario and Common Injuries».
[7] Meredith, «Distribution and Type of Crash Damage to Motorcyclists' Clothing: Valdidation
of the Zone Approach in European Standard for Motorcycle Protective Clothing,
EN13595,» Traffic Injury Prevention, nº 15:5, pp. 501-507, 2014.
[8] Braddock, «A population-based study of motorcycle injury and costs,» Annals of
Emergency Medicine, vol. 21, nº 3, pp. 273-278, 1992.
[9] Meerding, «Incidence and costs of injuries in The Netherlands,» European Journal of
Public Health, vol. 16, nº 3, pp. 271-277, 2006.
[10] Technical Committee CEN/TC 162, «FprEN 17092: 2019 Protective garments for
motorcycle riders».
[11] Technical Committee CEN/TC 162, «FprEN 17092-1:2019 Protective garments for
motorcycle riders - Part 1: test».
[12] T. Instruments, «https://thermtest.com/thermal-conductivity-testing-of-fabrics,» [En línea].
[13] F. Incropera, Fundamentals of Heat and Mass Transfer, 6th Edition, John Wiley & Sons,
2007.
[14] Engineering Toolbox, «Engineering ToolBox, Specific Heat of Solids/ Specific Density/
Heat conductivity,» 2003. [En línea]. Available: https://www.engineeringtoolbox.com.
[15] CEN /TC, Motorcyclists's protective clothing against mechanical impact - Part 4:
Motorcyclists' inflatable protectors - Requirements and test methods, 2013.
D3.1 Page 236 of 256 14/12/20
[16] N. Bourdet and R. Willinger, "Human neck characterization under thoracic vibration –
inter-individual and gender influence," in International Conference on the Biomechanics
of Impacts, 2005.
[17] Holbourn, "Mechanics Of Head Injuries," THE LANCET, pp. 438-441, 9 October 1943.
[18] L. Thibault and T. Gennarelli, "Biomechanics of diffuse brain injuries," in Proc. 29th Stapp
Car Crash Conference, 1985.
[19] C. Deck, D. Baumgartner and R. Willinger, "Influence of rotational acceleration on
intracranial mechanical parameters under accidental circumstances," in International
Research Council on Biokinetics of Impacts, Maastricht, The Netherlands, 2007.
[20] E. G. Takhounts, M. J. Craig, K. Moorhouse and J. McFadden, "Development of Brain
Injury Criteria (BrIC)," Stapp Car Crash Journal, pp. 243-266, November 2013.
[21] Sances, Myklebust, Maiman, Larson, Cusick and Jodat, "The Biomechanics of Spinal
Injuries," Critical Reviews in Biomedical Engineering, vol. 11, no. 1, p. 1–76, 1984.
[22] C. Leatt, C. d. Jongh and P. A. Keevy, "White Paper: Research and Development Efforts
towards the Production of the Leatt-Brace® Moto GPX Unrestrained Torso Neck Brace,"
Leatt Corporation, 2012.
[23] Atlas Brace Technologies, "Brace Testing," 2020. [Online]. Available:
https://www.atlasbrace.com/testing/.
[24] MOSAFIM, "MOSAFIM Final Report - MOtorcyclists Road SAFety IMprovement through
Better Behaviour of the Equipment and First Aid Devices," 2013.
[25] RICOTEST, "(Unpublished) Test Report in Accordance with Me-Int 088 Rev. 10 for the
Aim of the Certification (Regulation (EU)2016/425)," 2019.
[26] S. Khosroshahi, M. Ghajari and G. U., "Finite Element Simulation of Neck Brace
Protective Equipment for Motorcycle Riders," Turin, 2016.
[27] F. Meyer, C. Deck and R. Willinger, "Protection from Motorcycle Neck–Braces Using FE
Modelling," Sports Engineering, vol. 21, no. 4, p. 267–276, 2018.
[28] V. Tinard, C. Deck and R. Willinger, "Modelling and Validation of Motorcyclist Helmet with
Composite Shell," International Journal of Crashworthiness, vol. 17, no. 2, p. 209–215,
2012.
[29] S. Khosroshahi, M. Ghajari and U. Galvanetto, "Assessment of the Protective
Performance of Neck Braces for Motorcycle Riders: A Finite-Element Study,"
International Journal of Crashworthiness, vol. 24, no. 5, p. 487–498, 2019.
[30] J. Wismans and C. H. Spenny, "Head-Neck Response in Frontal Flexion," 1984.
[31] M. R. Seemann, W. H. Muzzy and L. S. Lustick, "Comparison of Human and Hybrid III
Head and Neck Dynamic Response," 1986.
D3.1 Page 237 of 256 14/12/20
[32] McElhaney, Doherty, Paver, Barry, Myers and Gray, "Combined Bending and Axial
Loading Responses of the Human Cervical Spine," 1988.
[33] A. Sances, «DYNAMIC COMPARISON OF THE HYBRID III AND HUMAN NECK,» de In
Frontiers in Head and Neck Trauma: Clinical and Biomechanical, Ohmsha, IOS Press,
1998.
[34] Pintar, Sances, Yoganandan, Reinartz, Maiman, Suh, Unger, Cusick and Larson,
"Biodynamics of the Total Human Cadaveric Cervical Spine," 1990.
[35] NHTSA, LABORATORY TEST PROCEDURE FOR FMVSS No. 218 Motorcycle Helmets
TP-218-07, 2013.
[36] Atlas Brace Technologies, "Atlas Air/Carbon User Manual," 2020. [Online]. Available:
https://www.atlasbrace.com/content/img/download/full/Air-Carbon-User-Manual.pdf.
[37] M. P. Reed and M. L. Jones, "A Parametric Model of Cervical Spine Geometry and
Posture Final Report UMTRI-2017-1," University of Michigan Transportation Research
Institute, 2017.
[38] R. G. Snyder, D. B. Chaffin and D. R. Foust, "Bioengineering Study of Basic Physical
Measurements Related to Susceptibility to Cervical Hyperextension-Hyperflexion Injury,"
Highway Safety Research Institute, Ann Arbor, Michigan, 1975.
[39] Drenkow, Pyles, Kuo, Harrigan, Thawait, Fritz and Carneal, "Improved Head-Neck Finite
Element Model for Dynamic Head Impact Simulation," Johns Hopkins University Applied
Physics Laboratory, 2017.
[40] M. Nordin and V. H. Frankel, Basic Biomechanics of the Musculoskeletal System. 3rd ed,
Philadelphia: Lippincott Williams & Wilkins, 2001.
[41] Beier, Schuck, Schuller and Spann, "Determination of Physical Data of the Head. I.
Center of Gravity and Moments of Inertia of Human Heads," Institut für Rechtmedizin der
Universität München, 1979.
[42] A. A. White and M. M. Panjabi, Clinical Biomechanics of the Spine. 2nd ed, Philadelphia:
Lippincott, 1990.
[43] Buck, Dameron, Dow and Skowlund, "Study of Normal Range of Motion in the Neck
Utilizing a Bubble Goniometer," Archives of Physical Medicine and Rehabilitation, 1959.
[44] V. Feipel, B. Rondelet, J.-P. L. Pallec and M. Rooze, "Normal Global Motion of the
Cervical Spine," Clinical Biomechanics, vol. 14, no. 7, p. 462–470, 1999.
[45] V. F. Ferrario, C. Sforza, S. Graziano, G. Grassi and E. Mossi, "Active Range of Motion
of the Head and Cervical Spine: A Three-Dimensional Investigation in Healthy Young
Adults," Journal of Orthopaedic Research, vol. 20, no. 1, p. 122–129, 2002.
[46] A. Glanville and G. Kreezer, "The Maximum Amplitude and Velocity of Joint Movements
in Normal Male Human Adults," Hum Biol, no. 9, p. 197–211, 1937.
D3.1 Page 238 of 256 14/12/20
[47] Mannion, Klein, Dvorak and Lanz, "Range of Global Motion of the Cervical Spine:
Intraindividual Reliability and the Influence of Measurement Device," European Spine
Journal, vol. 9, no. 5, p. 379–385, 2000.
[48] H. J. Mertz and L. M. Patrick, "Strength and Response of the Human Neck," 1971.
[49] Youdas, Garrett, Suman, Bogard, Hallman and Carey, "Normal Range of Motion of the
Cervical Spine: An Initial Goniometric Study," Physical Therapy, vol. 72, no. 11, p. 770–
780, 1992.
[50] F. Dauvilliers, Modélisation Tridimensionnelle et Dynamique du Rachis Cervical, Paris:
ENSAM, 1994.
[51] M. Kleinberger, "Application of finite element techniques to the study of cervical spine
mechanics," in Proc 37th Stapp Car Crash Conference, Warrendale, PA, 1994.
[52] K. Yang, F. Zhu, F. Luan, L. Zhao and P. Begeman, "Development of a Finite Element
Model of the Human Neck," in Proc. 42th Stapp Car Crash Conference, Warrendale, PA,
1998.
[53] H. Kimpara, Y. Nakahira, M. Iwamoto, K. Miki, K. Ichihara, S. Kawano y T. Taguchi,
«Investigation of anteroposterior head-neck responses during severe frontal impacts
using a brain-spinal cord complex FE model,» Stapp Car Crash J, nº 50, pp. 509-544,
2006.
[54] J. Osth, M. Mendoza-Vazquez, F. Sato, M. Svensson, A. Linder and K. Brolin, "A female
head-neck model for rear impact simulations," J Biomech 51, pp. 49-56, 2017.
[55] M. Panzer, J. Fice and D. Cronin, "Cervical spine response in frontal crash," Med Eng
Phys, no. 33, pp. 1147-1159, 2011.
[56] C. Ewing, D. Thomas, L. Patrick, G. Beeler and M. Smith, "Dynamic response of the head
and neck of the living human to -Gx impact acceleration," in Proc. 12th Stapp Car Crash
Conference, Warrendale, PA, 1968.
[57] C. Ewing, D. Thomas, G. Beeler, L. Patrick y D. Gillis, «Living human dynamic response
to -Gx impact acceleration II - Accelerations measured on the head and neck,» de Proc.
13th Stapp Car Crash Conference, Warrendale, PA, 1969.
[58] C. Ewing, D. Thomas, L. Lustick, I. W. Muzzy, G. Willems and P. Majewski, "Dynamic
response of the human head and neck to +Gy impact acceleration," in Proc. 21st Stapp
Car Crash Conference, Warrendale, PA., 1977.
[59] F. Meyer, N. Bourdet, C. Deck, R. Willinger and J. Raul, "Human Neck Finite Element
Model Development and Validation against Original Experimental Data," Stapp Car Crash
J, no. 48, pp. 177-206, 2004.
[60] M. Correia, S. McLachlin and D. Cronin, "ptimization of muscle activation schemes in a
finite element neck model simulating volunteer frontal impact scenarios," J Biomech, no.
104, 2020.

D3.1 Page 239 of 256 14/12/20
[61] S. Ejima, K. Ono, K. Kaneoka and M. Fukushima, "Development and Validation of the
Human Neck Muscle Model Under Impact Loading," in IRCOBI, 2005.
[62] M. Iwamoto, Y. Nakahira, H. Kimpara, T. Sugiyama and K. Min, "Development of a
human body finite element model with multiple muscles and their controller for estimating
occupant motions and impact responses in frontal crash situations," Stapp Car Crash J,
no. 56, pp. 231-268, 2012.
[63] J. Ólafsdóttir, J. Östh and K. Brolin, "Modelling Reflex Recruitment of Neck Muscles in a
Finite Element Human Body Model for Simulating Omnidirectional Head Kinematics," in
IRCOBI, 2019.
[64] F. Meyer, N. Bourdet, C. Deck, R. Willinger and J. Raul, "Development and validation of a
coupled headneck FEM – application to whiplash injury criteria investigation,"
International journal of Crashworthiness, no. 13, pp. 667-678, 2012.
[65] F. Meyer, J. Humm, Y. Purushothaman, R. Willinger, F. Pintar and N. Yoganandan,
"Forces and moments in cervical spinal column segments in frontal impacts using finite
element modeling and human cadaver tests," J Mech Behav Biomed Mater, no. 90, pp.
681-688, 2019.
[66] J. Cassidy, A. Hiltner and E. Baer, "Hierarchical structure of the intervertebral disc,"
Connect Tissue, no. 23, pp. 75-88, 1989.
[67] C. Deck and R. Willinger, "Improved head injury criteria based on head FE model,"
International journal of Crashworthiness, no. 13, 2008.
[68] J. Iatridis, L. Setton, M. Weidenbaum and V. Mow, "Alterations in the mechanical
behavior of the human lumbar nucleus pulposus with degeneration and aging," J Orthop
Res, no. 15, pp. 318-322, 1997.
[69] R. Hill, "Aspects of Invariance in Solid Mechanics," Adv Appl Mech, no. 18, pp. 1-75,
1979.
[70] M. Panzer and D. Cronin, "C4-C5 segment finite element model development, validation,
and load-sharing investigation," J Biomech, no. 42, pp. 480-490, 2009.
[71] J. Chazal, A. Tanguy, M. Bourges, G. Gaurel, G. Escande, M. Guillot and G. Vanneuville,
"Biomechanical properties of spinal ligaments and a histological study of the supraspinal
ligament in traction," J Biomech, no. 18, pp. 167-176, 1985.
[72] J. Myklebust, F. Pintar, N. Yoganandan, J. Cusick, D. Maiman, T. Myers and A. J.
Sances, "Tensile strength of spinal ligaments," Spine, no. 13, pp. 526-531, 1988.
[73] S. Mattucci, J. Moulton, N. Chandrashekar and D. Cronin, "Strain rate dependent
properties of younger human cervical spine ligaments," J Mech Behav Biomed Mater, no.
10, pp. 216-226, 2012.
[74] N. Yoganandan, S. Kumaresan and F. A. Pintar, "Biomechanics of the cervical spine Part
2. Cervical spine soft tissue responses and biomechanical modeling," Clinical
D3.1 Page 240 of 256 14/12/20
biomechanics, vol. 16, no. 1, pp. 1-27, 2001.
[75] S. Mattucci, J. Moulton, N. Chandrashekar and D. Cronin, "Strain rate dependent
properties of human craniovertebral ligaments," J Mech Behav Biomed Mater, no. 23, pp.
71-79, 2013.
[76] S. Mattucci and D. Cronin, "A method to characterize average cervical spine ligament
response based on raw data sets for implementation into injury biomechanics models," J
Mech Behav Biomed Mater, no. 41, pp. 251-260, 2015.
[77] D. Reilly and A. Burstein, "The elastic and ultimate properties of compact bone tissue," J
Biomech, no. 8, pp. 393-405, 1975.
[78] N. Yoganandan, F. Pintar, B. Stemper, J. Baisden, R. Aktay, B. Shender, G. Paskoff and
P. Laud, "Trabecular bone density of male human cervical and lumbar vertebrae," Bone,
no. 39, pp. 336-344, 2006.
[79] G. Denoziere and D. Ku, "Biomechanical comparison between fusion of two vertebrae
and implantation of an artificial intervertebral disc," J Biomech, no. 39, pp. 766-775, 2006.
[80] A. Chawla, S. Mukherjee and B. Karthikeyan, "Characterization of human passive
muscles for impacts loads using genetic algorithm and inverse finite element methods," J.
Biomech. Modeling in Mechanobiol, no. 8, pp. 195-208, 2009.
[81] S. Chen, Z. Zhong, C. Chen, W. Chen and C. Hung, "Biomechanical comparison
between lumbar disc arthroplasty and fusion," Med Eng Phys, no. 31, pp. 244-253, 2009.
[82] C. Thunert, "CORAplus Release 4.0.4 User’s Manual," 2017.
[83] R. Nightingale, J. McElhaney, L. Camacho, M. Kleinberger, B. Winkelstein and B. Myers,
"The Dynamic Responses of the Cervical Spine: Buckling, End Condition, and Tolerance
in Compressive Impacts," in Proceeding of Stapp Car Crash Conference, 1997.
[84] F. Pintar, N. Yoganandan and D. Maiman, "Lower cervical spine loading in frontal sled
tests using inverse dynamics: potential applications for lower neck injury criteria," Stapp
Car Crash J, no. 54, pp. 133-166, 2010.
[85] N. Yoganandan, J. Zhang, F. Pintar and Y. King Liu, "Lightweight low-profile nine-
accelerometer package to obtain head angular accelerations in short-duration impacts," J
Biomech, no. 39, pp. 1347-1354, 2006.
[86] M. Philippens, J. Wismans, P. Forbes, N. Yoganandan, F. Pintar and S. Soltis, "ES2
Neck injury assessment reference values for lateral loading in side facing seats," Stapp
Car Crash J, no. 53, p. 421–441, 2009.
[87] F. A. Pintar, N. Yoganandan and B. J, "Characterizing occipital condyle loads under high-
speed head rotation," Stapp Car Crash J, pp. 33-47, 2005.
[88] AAAM Association for the Advancement of Automotive Medicine, "The Abbreviated Injury
Scale 1990 revision," AAAM, Des Plaines, Illinois , 1990.
D3.1 Page 241 of 256 14/12/20
[89] W. Parr, "A note on the jackknife, the bootstrap and the delta method estimators of bias
and variance," Biometrika, vol. 70, no. 3, pp. 719-722, 1983.
[90] A. Akaike, "A new look at the statistical model identification," IEEE Transactions on
Automatic Control 19, pp. 716-723, 1974.
[91] ISO - International Organization for Standardization, TS18506: Road Vehicles -
Procedure to construct injury risk curves for the evaluation of road users protection in
crash tests, New York: American National Standards Institute, 2013.
[92] B. Aldman, A. Kullgren, A. Lie and C. Tingvall, "Crash Pulse Recorder (CPR) -
Development and Evaluation of a Low Cost Device for Measuring Crash Pulse and Delta-
V in Real Life Accidents," in ESV conference, 1991.
[93] A. Kullgren, A. Lie and C. Tingvall, "Crash Pulse Recorder (CPR) - Validation in Full
Scale Crash Tests," Accident, Analysis and Prevention, vol. 27, no. 5, pp. 717-727, 1995.
[94] A. Kullgren, L. Eriksson, M. Krafft and O. Boström, "Validation of neck injury criteria using
reconstructed real-life end crashes with recorded crash pulses," in Proceeding of 20th
ESV Conference, 2003.
[95] S. Kitazaki, "Application of experimental modal analysis to the human whole-body
vibration," in Proceedings of the United Kingdom Informal Group Meeting on Human
Response to Vibration, Southampton, Hampshire, 1992.
[96] N. Bourdet and R. Willinger, "Modeling of car seat and human body interaction under rear
impact," International Journal of Crashworthiness, vol. 11, no. 6, pp. 553-560, 2006.
[97] EU Project PIONEERS - WP1 - Critical accident scenarios and rider needs, «D1.1
Powered Two-Wheelers - Road Traffic Accident Scenarios and common injuries,» 2019.
[98] B. P. C. a. M. A. Macaulay, «Leg protection for motorcycles,» de IRCOBI Conference,
1984.
[99] S. F. a. K. M. H. Tadokoro, «A study of Motorcycle Leg Protection,» de 10th International
Technical Conference on the Enhanced Safety of Vehicles, pp. 1100-1108, , 1985.
[100] T. Uto, «Side collision test of motorcycles equipped with side protection devices,» de
International Motorcycle Safety Conference, pp. 267-307, 1975.
[101] N. M. R. a. J. W. Zellner, «An overall evaluation of UKDS motorcyclist leg protectors
based on ISO 13232,» de 16th International Technical Conference on the Enhanced
Safety of Vehicles, 1998.
[102] Nairn, R. J., «Motorcycle Safety Research Literature Review: 1987 to 1991,» Department
of Transport and Communications, 1992.
[103] A. S. M. a. A. Eghbalian, «Investigating the Impact of Using Motorcycle Leg Protectors on
Reducing Accident Injuries,» de 20th International Technical Conference on the
Enhanced Safety of Vehicles, 2007.

D3.1 Page 242 of 256 14/12/20
[104] C. Hrysomallis, «Surrogate thigh model for assessing impact force attenuation of
protective pads,» Journal of science and medicine in sport, vol. 12, pp. 35-41, 2009.
[105] K. R. E. a. P. H. C. Bothwell P W, «Dynamics of motorcycle impact. Motorcycle crash test
program. Final report.,» Dynamics of motorcycle impact., vol. II, 1978.
[106] H. H. a. J. P. Ruter G, «Investigations into the kinematics and loads of motorcycle riders
in frontal crashes,» Proceedings of the International Motorcycle Safety Conference, vol.
2, p. 599–614, 1980.
[107] M. A. K. J. a. W. B. Wobrock J L, «Pelvic injury potential and motorcycle gas tanks,»
Proceedings of the International Research Council on the Biomechanics of Injury
conference, vol. 34, 2006.
[108] O. J. V. a. H. H. J, «Groin injuries in motorcycle accidents,» de Association for the
Advancement of Automotive Medicine (AAAM) 24th Annual Proceedings, San Francisco,
CA, 1981.
[109] B. M. F. M. a. B. J. Meredith L, «Pelvic Injury Mechanisms among Motorcyclists,» de
IRCOBI Conference Proceedings , Berlin, Germany, 2014.
[110] B. M. F. M. a. B. J. Meredith L, «The motorcycle fuel tank and pelvic injury in crashed
motorcyclists,» Forschungshefte Zweiradsicherheit, 2014.
[111] J. N. J. Z. a. K. W. T.J. Gibson, «An improved anthropometric test device,» de
Proceedings of The NATO Advisory Group for Aerospace Research and Development
Conference, 1992.
[112] K. W. N. B. J. N. J.W. Zellner, «A Standardized Motorcyclist Impact Dummy for Protective
Device Research,» de 15th International Technical Conference on the Enhanced Safety
of Vehicles, Paper Number 96-S10-W-21, Melbourne, 1996.
[113] ISO 13232-6 Motorcycles, «Test and analysis procedures for research evaluation of rider
crash protective devices fitted to motorcycles — Part 6: Full-scale impact-test
procedures,» 2005.
[114] ISO 13232-3. Motorcycles, «Test and analysis procedures for research evaluation of rider
crash protective devices fitted to motorcycles — Part 3: Motorcyclist anthropometric
impact dummy,» 2005.
[115] ISO 13232-4. Motorcycles , «Test and analysis procedures for research evaluation of
rider crash protective devices fitted to motorcycles — Part 4: Variables to be measured,
instrumentation and measurement procedures,» 2005.
[116] United Nations, «Regulation No. 22. Uniform provisions concerning the approval of
protective helmets and of their visors for drivers and passengers of motorcycles and
mopeds,» 2002.
[117] European New Car Assessment Programme (Euro NCAP), «Side Impact Mobile
Deformable Barrier Testing Protocol. Version 8.1.1,» November 2019.
D3.1 Page 243 of 256 14/12/20
[118] UNECE-R22, «Uniform provisions concerning the approval of protective helmets and
their visors for drivers and passengers of motorcycles and mopeds,» 2002.
[119] European parliament and council, «Regulation (EU) 2016/425 of the European
Parliament and of the Council of 9 March 2016 on personal protective equipment and
repealing Council Directive 89/686/EEC,» 2016.
[120] CEN/TC, Motorcyclists' protective clothing against mechanical impact, 2014.
[121] CEN, WG11: Test methods for sports surfaces.
[122] E. ToolBox, «Engineering ToolBox, Specific Heat of Solids,» 2003. [En línea]. Available:
https://www.engineeringtoolbox.com/specific-heat-solids-d_154.html.
[123] N. Yoganandan, F. Pintar, D. Maiman, J. Cusick, J. Sances and P. Walsh, "Human head-
neck biomechanics under axial tension," Med. Eng. Phys., vol. 18, no. 4, pp. 289-294,
1996.
[124] EN, DIN EN 960:2006-09, Prüfköpfe Zur Prüfung von Schutzhelmen; Deutsche Fassung
EN_960:2006, Beuth Verlag GmbH, 2006.
[125] Meredith et al., Validation of the abrasion resistance test protocols and performance
criteria of EN13595: The probability of soft tissue injury to motorcycle riders, 2017.
[126] Bourdet et al..
[127] Deck et al., 2007.
[128] Takhounts, 2013.
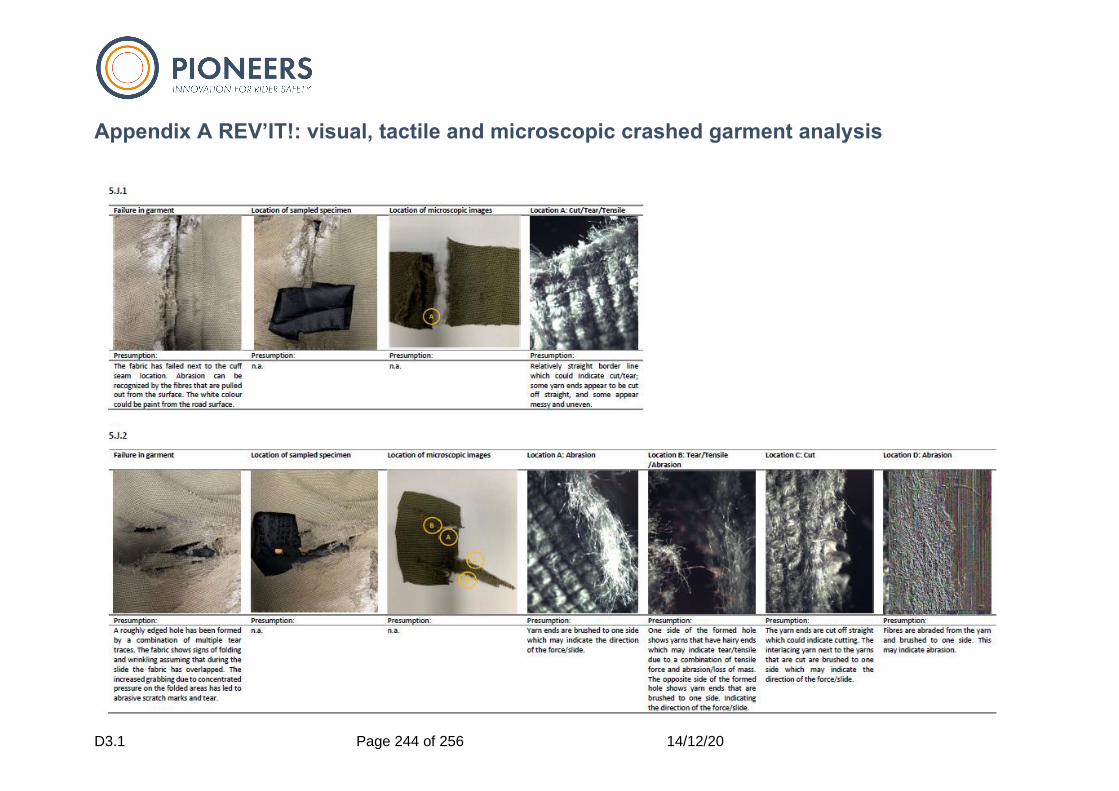
D3.1 Page 244 of 256 14/12/20
Appendix A REV’IT!: visual, tactile and microscopic crashed garment analysis
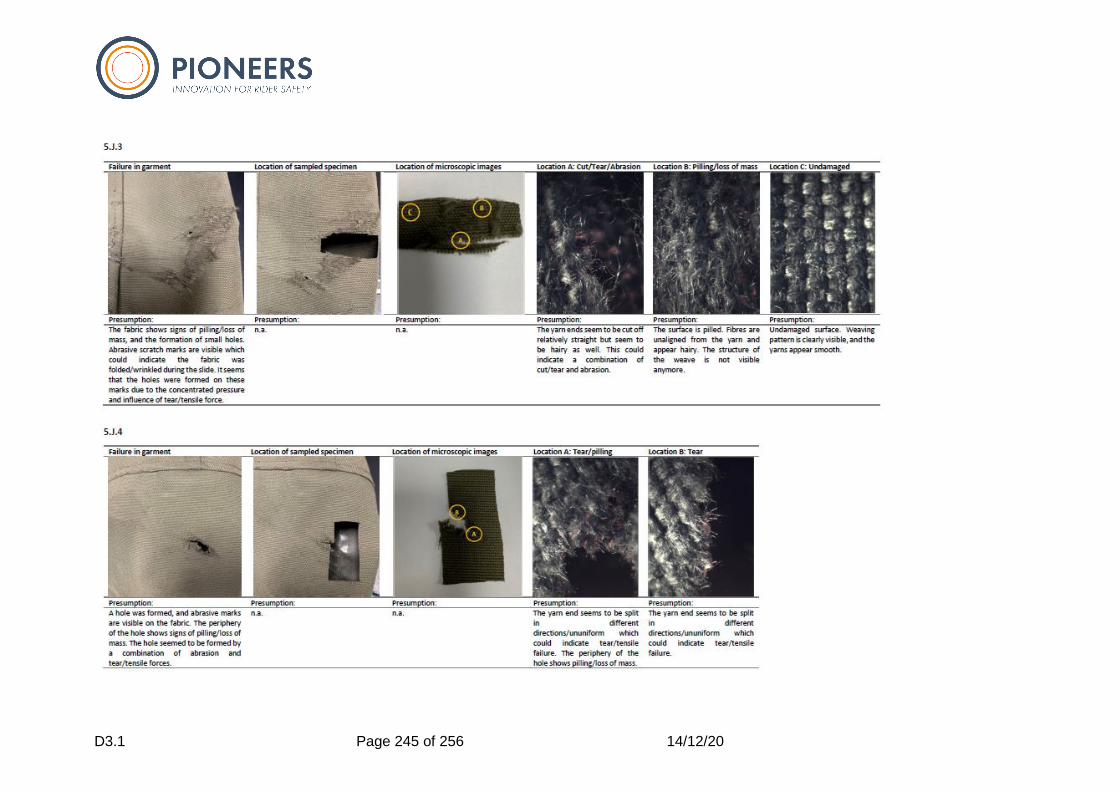
D3.1 Page 245 of 256 14/12/20
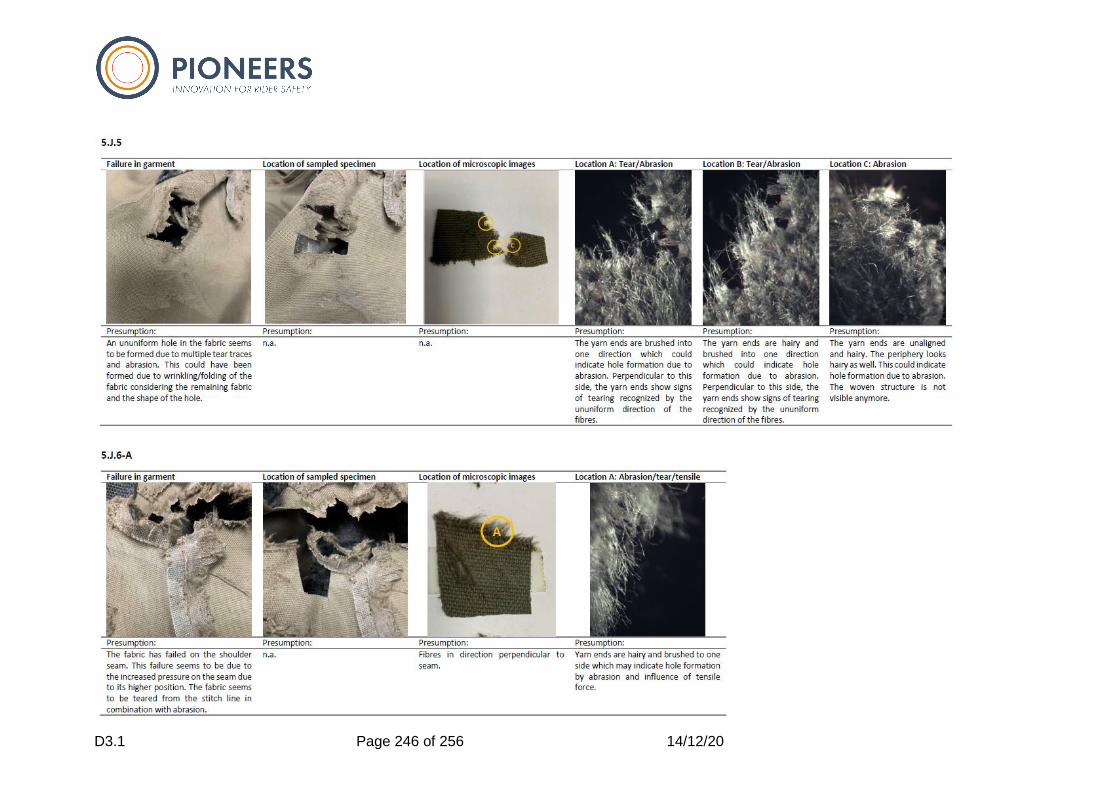
D3.1 Page 246 of 256 14/12/20
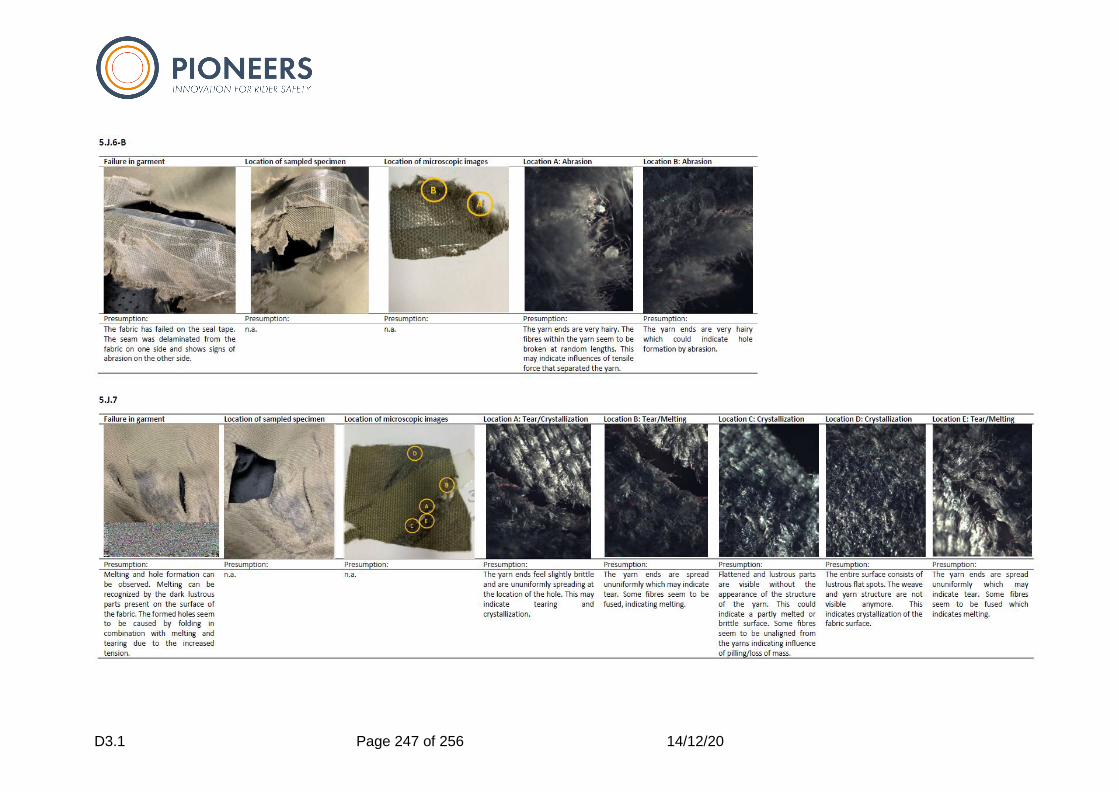
D3.1 Page 247 of 256 14/12/20
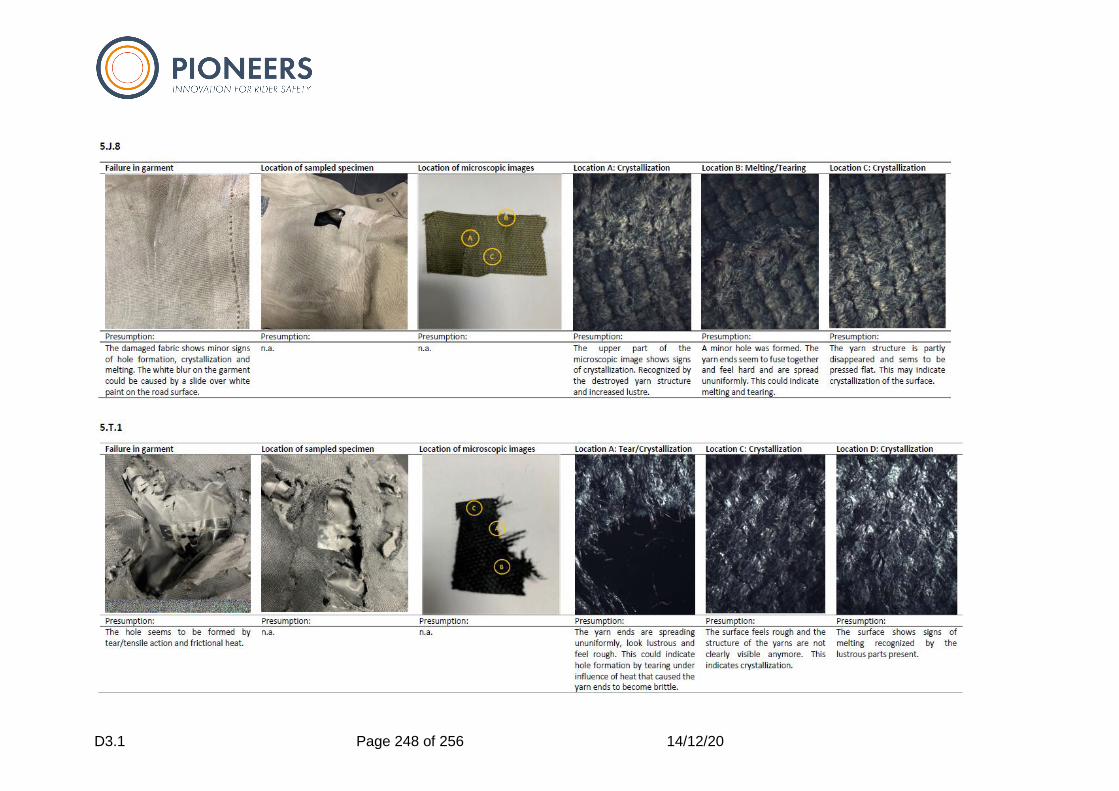
D3.1 Page 248 of 256 14/12/20
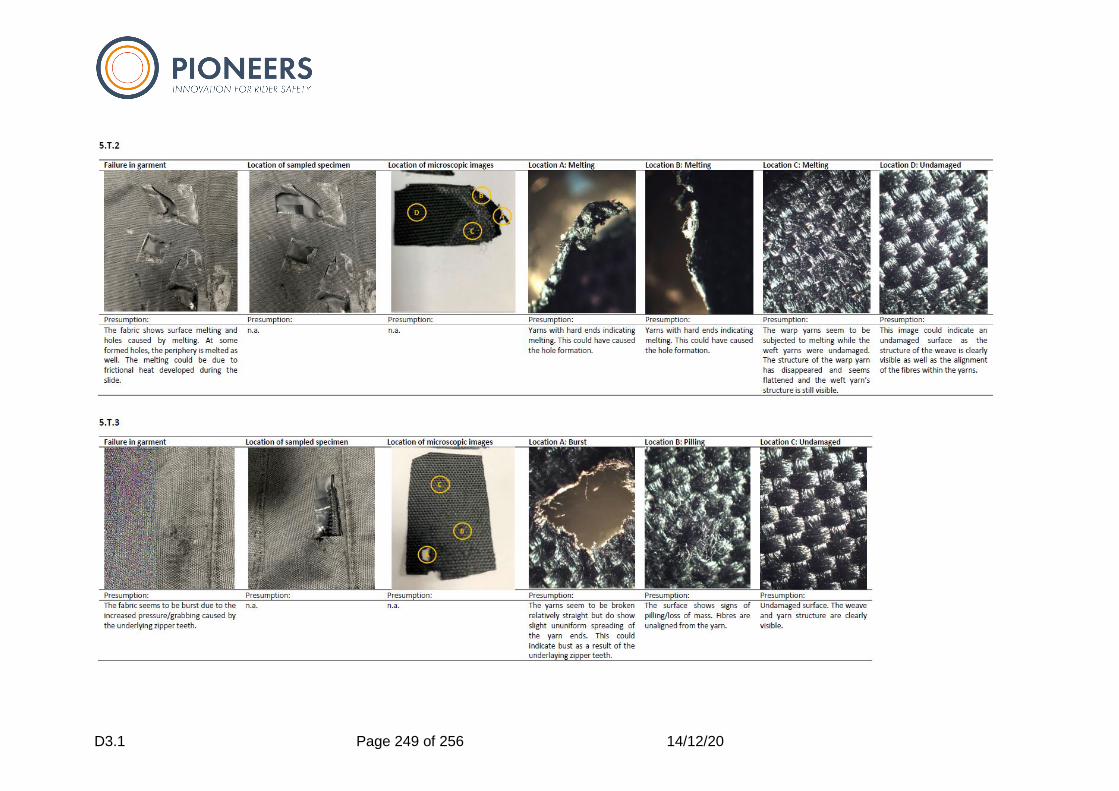
D3.1 Page 249 of 256 14/12/20
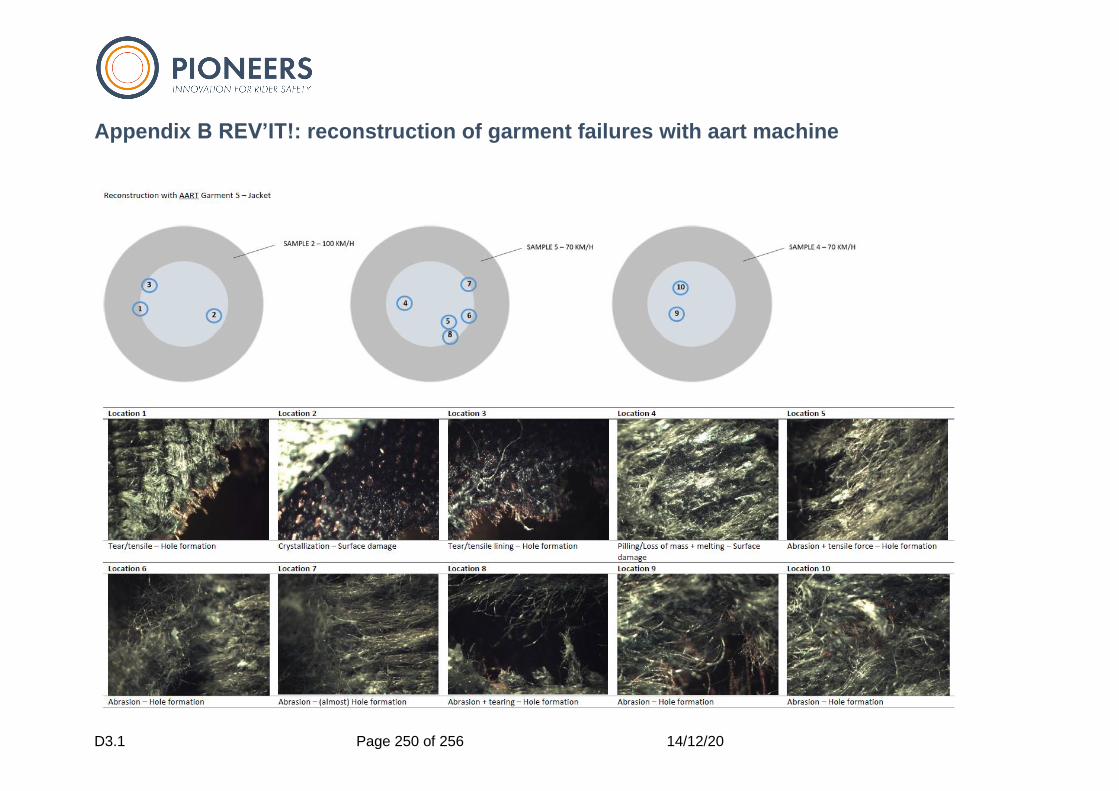
D3.1 Page 250 of 256 14/12/20
Appendix B REV’IT!: reconstruction of garment failures with aart machine
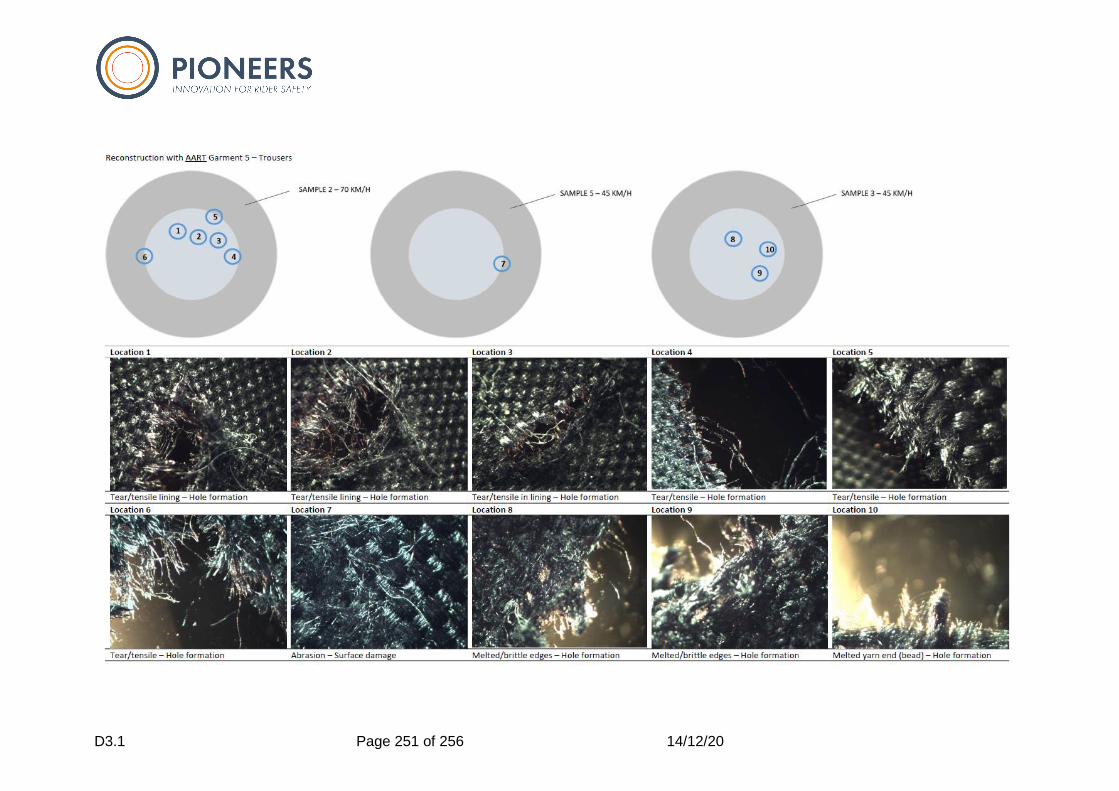
D3.1 Page 251 of 256 14/12/20
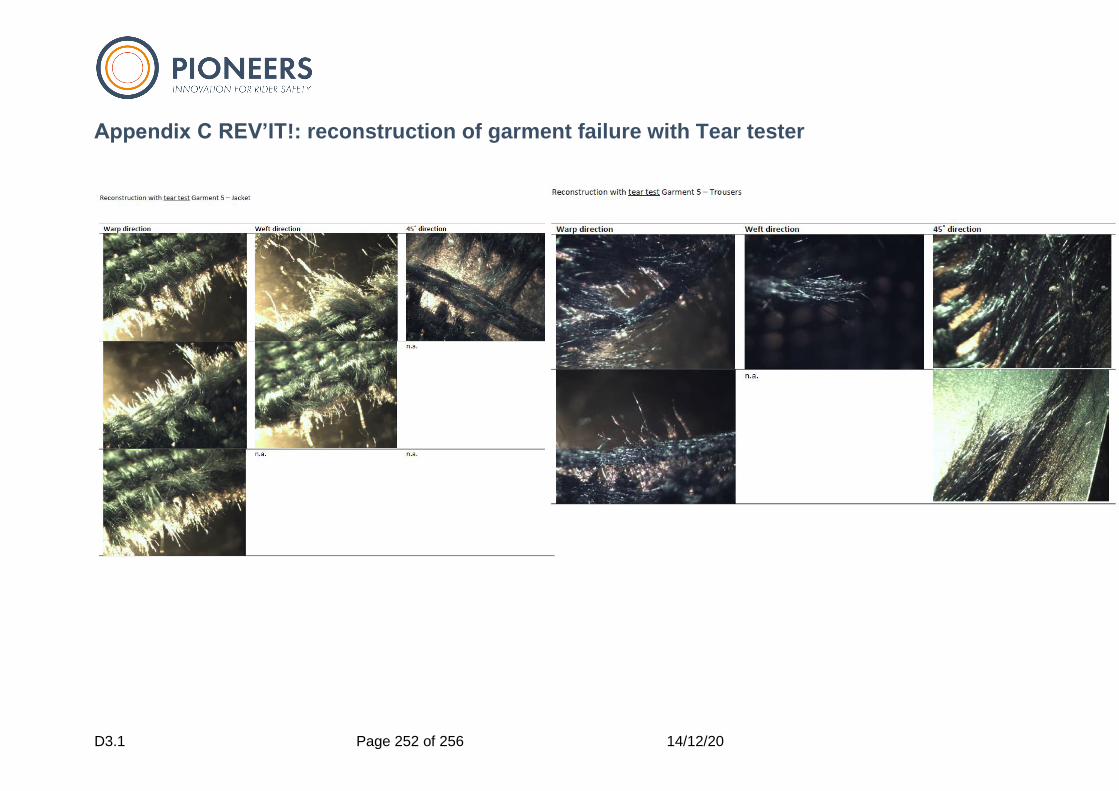
D3.1 Page 252 of 256 14/12/20
Appendix C REV’IT!: reconstruction of garment failure with Tear tester
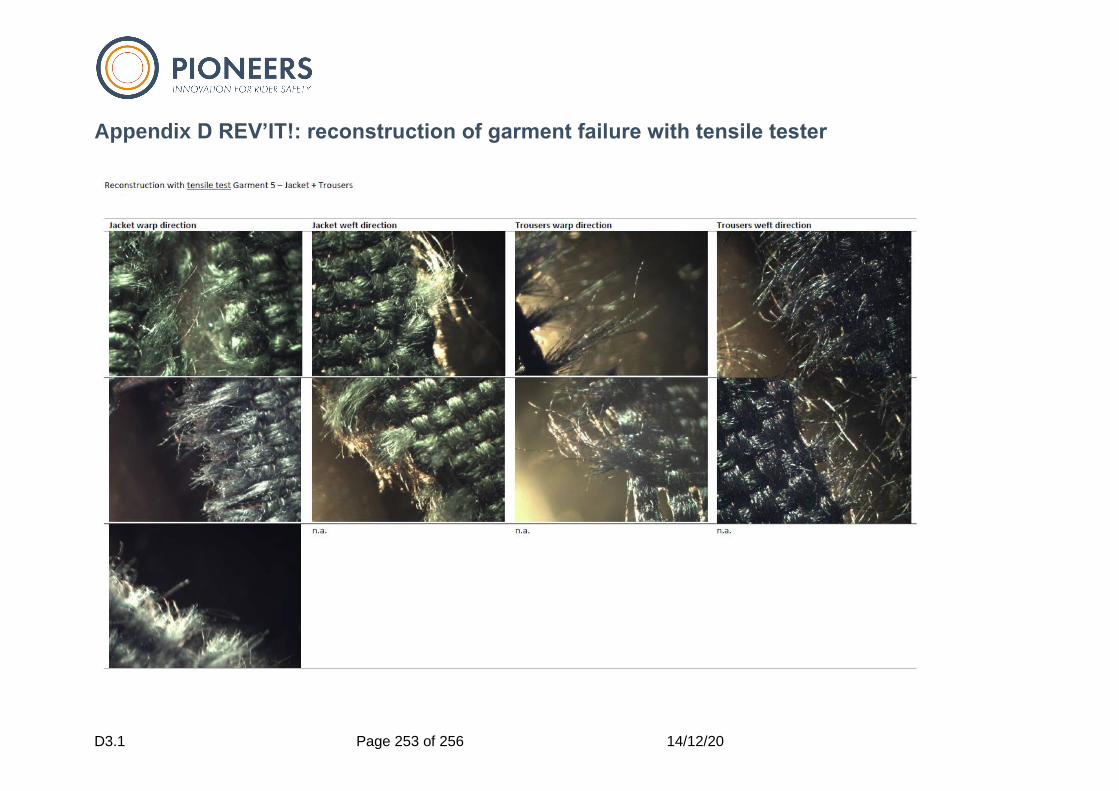
D3.1 Page 253 of 256 14/12/20
Appendix D REV’IT!: reconstruction of garment failure with tensile tester
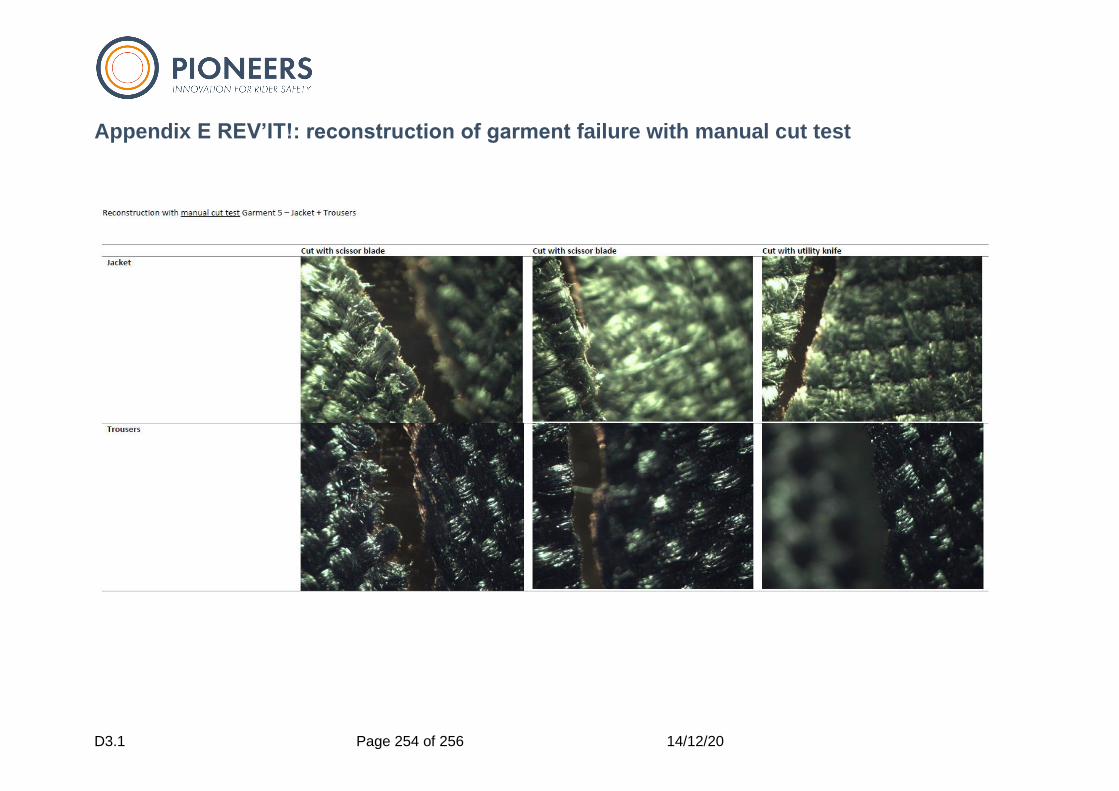
D3.1 Page 254 of 256 14/12/20
Appendix E REV’IT!: reconstruction of garment failure with manual cut test
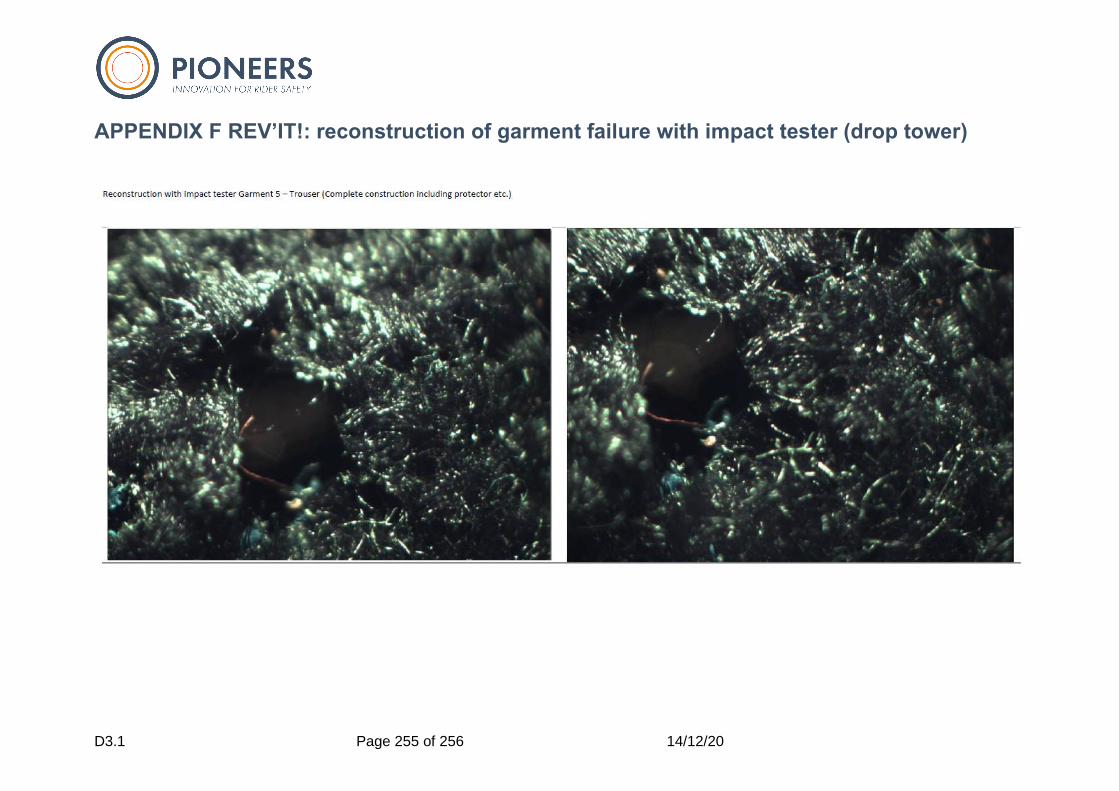
D3.1 Page 255 of 256 14/12/20
APPENDIX F REV’IT!: reconstruction of garment failure with impact tester (drop tower)

D3.1 Page 256 of 256 14/12/20
Acknowledgments
This project has received funding from the European Union's Horizon 2020 research and innovation programme under grant agreement No 769054.


![[H. Landstrom] Pioneers in Entrepreneurship and Sm(BookFi)](https://img.dokumen.tips/doc/110x75/6354984114cd96dfe105a083/h-landstrom-pioneers-in-entrepreneurship-and-smbookfi.jpg)


