Embed Size (px)
Citation preview

●
●
●
●
●
●
●
●
Current Meter Study for Agate, Port Orchard, and
Rich Passages
Study Plan
PSMEMPSMEM
Final August 29, 2005
Water Body Numbers
WA-15-0030 Port Orchard, Agate, and
Rich Passages, WA-15-0040 Sinclair
Inlet WA-15-0050 Dyes Inlet
R.K. Johnston, Ph.D. Marine Environmental Support Office –
Northwest Space and Naval Warfare Systems Center
Bremerton, WA
Skip Albertson Environmental Assessment
Washington State Department of Ecology PO Box 47600
Olympia, WA 98504-7600
Prepared by Puget Sound Marine Environmental Modeling
A partnership for modeling the marine environment of the Puget Sound
and
Project ENVVEST A partnership for improving the environmental
quality of Sinclair and Dyes Inlets
1

Report Documentation Page Form ApprovedOMB No. 0704-0188
Public reporting burden for the collection of information is estimated to average 1 hour per response, including the time for reviewing instructions, searching existing data sources, gathering andmaintaining the data needed, and completing and reviewing the collection of information. Send comments regarding this burden estimate or any other aspect of this collection of information,including suggestions for reducing this burden, to Washington Headquarters Services, Directorate for Information Operations and Reports, 1215 Jefferson Davis Highway, Suite 1204, ArlingtonVA 22202-4302. Respondents should be aware that notwithstanding any other provision of law, no person shall be subject to a penalty for failing to comply with a collection of information if itdoes not display a currently valid OMB control number.
1. REPORT DATE 29 AUG 2005 2. REPORT TYPE
3. DATES COVERED 00-00-2005 to 00-00-2005
4. TITLE AND SUBTITLE Current Meter Study for Agate, Port Orchard, and Rich Passages
5a. CONTRACT NUMBER
5b. GRANT NUMBER
5c. PROGRAM ELEMENT NUMBER
6. AUTHOR(S) 5d. PROJECT NUMBER
5e. TASK NUMBER
5f. WORK UNIT NUMBER
7. PERFORMING ORGANIZATION NAME(S) AND ADDRESS(ES) Space and Naval Warfare Systems Center,Marine EnvironmentalSupport Office ? Northwest,Bremerton,WA,98310
8. PERFORMING ORGANIZATIONREPORT NUMBER
9. SPONSORING/MONITORING AGENCY NAME(S) AND ADDRESS(ES) 10. SPONSOR/MONITOR’S ACRONYM(S)
11. SPONSOR/MONITOR’S REPORT NUMBER(S)
12. DISTRIBUTION/AVAILABILITY STATEMENT Approved for public release; distribution unlimited
13. SUPPLEMENTARY NOTES
14. ABSTRACT
15. SUBJECT TERMS
16. SECURITY CLASSIFICATION OF: 17. LIMITATION OF ABSTRACT Same as
Report (SAR)
18. NUMBEROF PAGES
28
19a. NAME OFRESPONSIBLE PERSON
a. REPORT unclassified
b. ABSTRACT unclassified
c. THIS PAGE unclassified
Standard Form 298 (Rev. 8-98) Prescribed by ANSI Std Z39-18

Current Meter Study for Agate, Port Orchard, and Rich Passages
Study Plan
Prepared by
Puget Sound Marine Environmental Modeling
and
PSNS & IMF Project ENVVEST
Water Body Numbers
WA-15-0030 Port Orchard, Agate Passage, and Rich Passage
WA-15-0040 Sinclair Inlet WA-15-0050 Dyes Inlet
Approvals:
_________________________________________________ G.M. Sherrell, PSNS & IMF ENVVEST, Project Manager
_________________________________________________ W. Kendra, Ecology, Environmental Assessment
2

Table of Contents
1. PROJECT DESCRIPTION..................................................................5
2. PROJECT OBJECTIVES ....................................................................5
3. BACKGROUND.................................................................................6
4. STUDY DESIGN...............................................................................7
5. DATA ANALYSIS AND MODELING ...................................................8 5.1.1 Measurement Quality Objectives ............................................ 8 5.1.2 Instrument Calibration.......................................................... 9
5.2 Data Management................................................................... 10
6. PROJECT SCHEDULE .....................................................................10
7. SUMMARY.....................................................................................11
8. REFERENCES.................................................................................12
9. TABLES.........................................................................................15
10. FIGURES................................................................................18
11. APPENDICES .........................................................................28
11.1 ADCP Parameter Settings for each current meter and station...... 28 11.1.1 Parameter settings for RICHPASS (300 kHz)........................ 28 11.1.2 Parameter settings for POPASS (300 kHz)........................... 28 11.1.3 Parameter settings for AGPASS (1200 kHz) ......................... 28 11.1.4 Parameter settings for PSNS-P4 (1200 kHz) ........................ 28
LIST OF TABLES
Table 1. Data quality objectives for current meter study in Agate, Port Orchard, and Rich, Passages........................................................... 16
3
Table 2. Operational parameters for the current meters available for the study (RDI 2005a). ....................................................................... 17
Table 3. List of station code, coordinates, depth, and location. ................ 17
LIST OF FIGURES
Figure 1. The location of Agate, Port Orchard, and Rich Passages in the central Puget Sound. ..................................................................... 19
Figure 2. Location of current meter stations within the study area. Bathymetry data from Finlayson (2005). .......................................... 20
Figure 3. Numerical grid for Puget Sound POM model (upper figure) and detail of model grid around Bainbridge Island (lower figure)................ 21
Figure 4. Location of the station in Rich Passage. White points denote the corners of the CH3D numerical grid. Bathymetry data from Finlayson (2005)......................................................................................... 22
Figure 5. Location of the station in Port Orchard Passage. White points denote the corners of the CH3D numerical grid. Bathymetry data from Finlayson (2005)........................................................................... 23
Figure 6. Location of the station in Agate Passage. Bathymetry data from Finlayson (2005)........................................................................... 24
Figure 7. Location of the station in Sinclair Inlet, within the Shipyard. The CH3D numerical grid is also shown. Bathymetry data from Finlayson (2005)......................................................................................... 25
Figure 8. Predicted current speed for Agate (upper) and Rich (lower) Passages for Sept. 14-15, 2005. Data from http://www.mobilegeographics.com:81/locations/5308.html?y=2005&m=10&d=15 ................... 26
Figure 9. Predicted tides for Brownsville (upper) and Bremerton (lower) for Sept. 14-15, 2005. Data from http://www.mobilegeographics.com:81/locations/714.html?y=2005&m=9&d=14 ..................... 27
4

1. Project Description
This document presents a study plan to obtain current data for Agate, Port Orchard, and Rich Passages in the central Puget Sound, Washington (Figure 1). The study will be conducted as a cooperative project among the Puget Sound Marine Environmental Monitoring (PSMEM) partnership; the study will be performed by the Puget Sound Naval Shipyard & Intermediate Maintenance Facility (Shipyard), the Space and Naval Warfare Systems Center San Diego (SSC-SD), and the Washington State Department of Ecology (Ecology). The study will be conducted during September to December 2005 and will be designed to collect 1 to 3 month long current records for strategic stations within the passages and one station adjacent to the Shipyard in Sinclair Inlet (Figure 2). Data from this study will be used to calibrate and verify coupling between the inlet-scale models being developed for the Inlets and passages utilizing the curvilinear hydrodynamics in 3-dimensions (CH3D) model (Wang and Richter 1999, Wang et al. 2005) and the sound-scale circulation model developed for the larger Puget Sound using the Princeton Ocean Model (POM) (Kawase 2002, Sarason 2004, 2005).
This plan has been prepared under the Project ENVVEST Final Project Agreement as a cooperative project among the Shipyard, the Environmental Protection Agency (EPA), Ecology, and technical stakeholders to help improve the environmental quality of the Sinclair and Dyes Inlet Watershed (US Navy, EPA and Ecology 2002). This sampling plan describes specific sampling activities to obtain data necessary to calibrate and verify hydrodynamic transport for the surface waters of Sinclair and Dyes Inlets and the passages connecting the Inlets to the central basin of the Puget Sound (Table 1).
2. Project Objectives
The objectives of this sampling plan are to:
1. Develop continuous records of current speed and direction as a function of water depth at selected locations within the passages during the spring-neap tidal cycle.
2. Collect data on current speed and direction as a function of water depth at selected locations within the passages during varying weather conditions.
3. Develop a continuous record of current speed and direction as a function of water depth at a station located within Sinclair Inlet adjacent to the shipyard.
5

The data obtained from this sampling effort will be used to support further development of the integrated watershed and receiving water models being implemented for the Sinclair and Dyes Inlet watershed (Skahill 2004, 2005, Johnston et al. 2003, Wang et al. 2005) and provide data for coupling the intet-scale model for the Inlets (CH3D) with the sound-scale model for the Puget Sound (POM, Johnston and Wang 2004, Kawase 2002, Sarason 2004, 2005).
3. Background
As part of Project ENVVEST (ENVVEST 2002), an inlet-scale integrated model for the Sinclair and Dyes Inlet watershed has been developed to simulate hydrodynamic mixing and transport, dynamic loading from the surrounding watershed, and exchange with the greater Puget Sound (Johnston et al. 2003). Using data on land use, land cover, and natural and engineered drainage basins, a unified Hydrologic Simulation Program Fortran (HSPF) model for the watershed was developed (Skahill 2004, 2005) and linked to the receiving water CH3D model. The integrated models are being used to simulate fresh water inflows and fecal coliform loading from the watershed to support the development of Total Maximum Daily Loads for the Inlets (May et al. 2005). In a related effort, being conduct by the University of Washington (UW), a Puget Sound-scale circulation model has been developed using the Princeton Ocean Model (POM) to simulate velocity, temperature, salinity, and mixing within the Puget Sound (Figure 3, Kawase 2002). Recently, the Puget Sound POM circulation model was programmed to use atmospheric forcing from the MM5 weather model (mesoscale model, Albright and Mass 2002) to perform routine hindcasting of the Puget Sound circulation on a 24-hour basis (Sarason 2004, 2005). As part of the Puget Sound Marine Environmental Modeling partnership, the inlet-scale model for Sinclair and Dyes Inlets has been expanded to include Port Orchard Passage, Liberty Bay, and Agate Passage. This will facilitate coupling with the POM circulation model and, eventually, result in the ability to simulate fluxes between the inlets and the Puget Sound (Johnston and Wang 2004).
6

4. Study Design
Upward looking acoustic Doppler current profiler (ADCP) current meters will be moored at strategic locations in Agate, Port Orchard, and Rich Passages and in Sinclair Inlet near the Shipyard (Figure 2). When ADCPs are used in vertical profiling mode, they are able to measure current velocities in uniform segments (cell depths, or bins) throughout the water column. Briefly, the ADCP resolves current velocities by measuring the Doppler shift of the acoustic backscatter generated by particles (phytoplankton, zooplankton, and particulates) suspended and traveling in the water column (RDI 1996). Data provided by the ADCP includes velocities (speed and direction), echo intensity, correlation of data quality, and percent good data – based on predefined thresholds for each ADCP – for each bin or cell depth measured in the water column (RDI 1996).
The stations selected in Agate, Port Orchard, and Rich Passage represent “choke points” over which the main water flow will occur. These stations are located mid-channel so that they will record the main volume of flow coming from the Sound into the Inlets and vice-versa. The vertical profiles will provide direct measures of current flow as a function of depth in the water column, which is necessary to calibrate and validate 3-D models. The stations are also located a sufficient distance from the numerical model’s boundaries so that the measured data can be compared to simulated data without confounding artifacts associated with the boundary conditions of the model.
The current meters available to support this study are two 300 kHz ADCPs (owned by Ecology, both manufactured by RD Instruments) and one 1200 kHz ADCP (owned by SSC-SD, also manufactured by RD Instruments). Prior to deployment, the PlanACDP program (RDI 2004) will be used to optimize the data yield for each location (see Appendix A for current meter recording parameters). The 300 kHz ADCPs will be deployed at the deeper stations, because they are more suited to measuring deeper depth-profiles and have a longer battery life (Table 2). The 300 kHz ADCPs will be deployed in Rich Passage (Figure 4) and Port Orchard Passage (Figure 5) for approximately 90 days. Due to the limited battery life for the 1200 kHz ADCP and the maximum depth of 15 m, the 1200 kHz ADCP will be deployed near the mouth of Agate Passage (Figure 6) for about 30 days, recovered, downloaded, and redeployed in Sinclair Inlet within the Shipyard (Figure 7) for another 30 days.
The deployments will consist of submerging a bottom mooring as near as possible to the predefined station locations (Table 3). The mooring will be placed on the bottom, anchored securely in place with lead weights, and affixed with weighted tag lines for recovery by grappling hook. In addition,
7

an acoustic release mechanism will also be used to deploy recovery lines (Ecology’s meters only). The deployment will not require any surface lines or mooring buoys at the surface. The actual location of the current meter and the position of the tag line for recovery will be recorded with a high-precision GPS system onboard the vessel.
The 90-day deployment from September to December 2005 for the stations in Port Orchard and Rich Passages will assure repeated measurements of the 14-day Spring-Neap tidal cycle as well as opportunistically capture any storm (e.g. wind-driven) events that may occur during the deployment period. Because the water currents in Agate Passage are expected to be dominated by a flume-like jet of water through the passage on incoming tide, a 30-day deployment was deemed adequate to resolve the current profile for Agate Passage. A 30-day deployment period was also deemed to be adequate to characterize the lower current velocities and restricted mixing expected for the station within the Shipyard.
5. Data Analysis and Modeling
5.1.1 Measurement Quality Objectives
Measurement quality objectives for the analyses conducted for this study can be expressed in terms of accuracy, precision, completeness, and sensitivity goals. These parameters define the quality of the data for use in model calibration and validation exercises.
Accuracy is defined as the degree of agreement between an observed value and its actual value. Accuracy includes a combination of random error and systematic error (bias) components that are due to sampling and data processing operations. The accuracy of the current measurements will be assessed based on the predefined thresholds set for each ADCP for each bin or cell depth measured in the water column (RDI 1996). Unacceptable data encountered for specific bins, will not be used for model calibration or validation.
Precision is defined as the degree to which a set of observations or measurements of the same property, obtained under similar conditions, conform to themselves. Precision is usually expressed as standard deviation, variance, or range, in either absolute or relative terms. The repeated measurements made over the tidal cycle will be evaluated to determine precision of the results.
Completeness is the amount of data collected as compared to the amount needed to ensure that the uncertainty or error is within acceptable limits.
8

The goal for data completeness is 100%. However, the project will not be compromised if less than 100% of the data collected are of acceptable quality. Should data be lost due to equipment malfunction or operator error, the deployment will need to be repeated in order to meet the data quality objectives of the study.
Comparability is a measure of the confidence with which one data set can be compared to another. This is a qualitative assessment and is addressed primarily in sampling design through use of comparable sampling procedures or, for monitoring programs, through accurate re-sampling of stations over time. The time series of data obtained from current meter stations will be evaluated to assure that the results are comparable and consistent with each other.
Representativeness is the degree to which data accurately and precisely represent a characteristic of a population or phenomena. This is a qualitative assessment and is addressed primarily in the sample design, through the selection of sampling sites, and procedures that reflect the project goals and environment being sampled. Developing continuous records of current profiles for 30 to 90 days at the current meter locations will assure that currents representative of the conditions during the deployment period are sampled.
Sensitivity is the capability of a test method or instrument to discriminate between measurement responses representing different levels of a variable of interest. Sensitivity is addressed primarily through the selection of appropriate instrumentation that is properly calibrated and deployed. Sensitivity will be assessed by the ADCP calibration and verification and the results obtained for measures of velocity accuracy, resolution, and range (RDI 2005a).
5.1.2 Instrument Calibration
The instruments will be calibrated according to manufacturer’s specifications (Table 2) and programmed to optimize data collection over the deployment intervals (see Appendix 11.1 ADCP Parameter Settings for each current meter and station). The expected velocity accuracy, resolution, and range are listed below (RDI 2005a):
Velocity accuracy: 1200 kHz: 0.3% of the water velocity relative to the ADCP ±0.3cm/s 300 kHz: 0.5% of the water velocity relative to the ADCP ±0.5cm/s
Velocity resolution: 0.1 cm/s Velocity range: ±5m/s (default) ±20m/s (maximum)
9

5.2 Data Management
Raw data obtained from the current meters will be downloaded and processed using the WinADCP software (RDI 2005b). The processed data will be evaluated to determine cross-sectional velocities, average and maximum flows, and compared to model results to determine agreement with model predictions (Richter 2004). The data will be archived and catalogued using the extended markup language (XML) metadata standard being developed by PSMEM for sharing data within the earth science and oceanographic community. The protocol involves submitting Federal Geographic Data Committee (FGDC)-compliant metadata in the form of XML documents, which are published in the collaborative data catalogue (UW 2005). Data users can then access the catalogue to obtain information about the data and learn how to obtain the raw and processed data sets.
6. Project Schedule
The schedule for current meter deployment and recovery is listed below. The predicted currents for Agate and Rich Passages for Sept. 14-15, 2005 are shown in Figure 8, and the predicted tides for Brownsville and Bremerton for Sept. 14-15, 2005 are shown in Figure 9.
Wednesday Sept. 14, 2005 – PSNS&IMF, SSC-SD, and Ecology will deploy both of Ecology’s 300 kHz ADCPs in Rich and Port Orchard Passages. Note that the Ecology team members will meet the PSNS&IMF Vessel at the Manchester Laboratory Dock to load equipment at 0800 on Sept. 14, 2005. Ecology will bring the current meters and necessary anchors, mooring gear, and recovery lines for their meters.
Rich Passage, West end, Washington Current 47.5667° N, 122.5333° W (http://www.mobilegeographics.com:81/locations/5308.html?y=2005&m=9&d=14) 2005-09-14 6:46 AM PDT Sunrise 2005-09-14 8:25 AM PDT 0.00 knots Slack, Flood Begins 2005-09-14 12:17 PM PDT 3.58 knots Max Flood 2005-09-14 4:37 PM PDT -0.00 knots Slack, Ebb Begins 2005-09-14 7:19 PM PDT -2.30 knots Max Ebb 2005-09-14 7:23 PM PDT Sunset
Thursday Sept. 15, 2005 – PSNS&IMF and SSC-SD will deploy the 1200 kHz ADCP in Agate Passage. Note that the 1200 kHz ADCP will be shipped from SSC-SD to PSNS&IMF to arrive no later than Sept. 9, 2005.
Agate Pass, South End of, Washington Current 47.7000° N, 122.5667° W Flood direction 216° True Ebb direction 37° True (http://www.mobilegeographics.com:81/locations/53.html?y=2005&m=9&d=15) 2005-09-15 1:55 AM PDT -0.00 knots Slack, Ebb Begins
10

2005-09-15 5:38 AM PDT -4.46 knots Max Ebb 2005-09-15 6:47 AM PDT Sunrise 2005-09-15 8:41 AM PDT 0.01 knots Slack, Flood Begins 2005-09-15 12:23 PM PDT 5.27 knots Max Flood 2005-09-15 4:33 PM PDT -0.00 knots Slack, Ebb Begins 2005-09-15 6:56 PM PDT -3.34 knots Max Ebb 2005-09-15 7:21 PM PDT Sunset
Friday Sept. 16, 2005 (Backup for deployment)
Week of Oct. 17, 2005 (tentative) – PSNS&IMF and SSC-SD will retrieve the 1600 kHz ADCP from Agate Passage and redeploy it at the Shipyard station.
Nov. 22, 2005 (tentative) – PSNS&IMF and SSC-SD will retrieve the 1200 kHz ADCP from the Shipyard station.
Week of Dec. 12, 2005 (tentative). Ecology will retrieve the 300 kHz ADCPs from Rich and Port Orchard Passages.
7. Summary
This sampling plan describes specific sampling activities to obtain data necessary to calibrate and verify hydrodynamic transport for the surface waters of Sinclair and Dyes Inlets and the passages connecting the Inlets to the central basin of the Puget Sound (Figure 1). The study will be conducted during September to December 2005 and is designed to collect 1 to 3 month long current records for strategic stations within the passages and one station adjacent to the Shipyard in Sinclair Inlet (Figure 2). Data from this study will be used to calibrate and verify coupling between the inlet-scale models being developed for Inlets and passages utilizing the curvilinear hydrodynamics in 3-dimensions (CH3D) model (Wang and Richter 1999, Wang et al. 2005) and the sound-scale circulation model developed for the larger Puget Sound using the Princeton Ocean Model (POM, Kawase 2002, Sarason 2004, 2005).
11

8. References
Albright, M. and Mass, M. 2002. Pacific Northwest MM5 Weather Forecasts: Information. Department of Atmospheric Sciences, University of Washington, Seattle, WA. http://www.atmos.washington.edu/mm5rt/info.html
ENVVEST 2002. PSNS Project ENVVEST Technical Work Masterplan, of May 2002, prepared by PSNS Project ENVVEST Technical Steering Committee. https://www.mesodat.org/envvest/tech_master_plan_06_f2_web2b.pdf
Finlayson D.P., 2005. Combined bathymetry and topography of the Puget Lowland, Washington State. University of Washington, (http://www.ocean.washington.edu/data/pugetsound/)
Johnston, R.K., P.F. Wang, H. Halkola, K.E. Richter, V.S. Whitney, B.E. Skahill, W.H. Choi, M. Roberts, R. Ambrose, and Mitsuhiro Kawase, 2003. An Integrated Watershed-Receiving Water Model For Sinclair and Dyes Inlets, Puget Sound, Washington, USA. Presentation at Estuarine Research Federation 2003 Conference Estuaries on the Edge: Convergence of Ocean, Land and Culture, September 14-18, 2003, Seattle, WA. http://www.psmem.org/models/psns-spawar.html
Johnston, R.K. and P.F. Wang 2004. A Partnership For Modeling The Marine Environment of Puget Sound, Washington – Puget Sound Naval Shipyard Report. Progress Report for the National Ocean Partnership Program (NOPP), Office of Naval Research (ONR), Award Number: N00014-02-1-0502, Report date: Sept. 30, 2004.
Kawase, M. 2002. Modeling Puget Sound Circulation. University of Washington, PRISM Retreat, Seattle, WA. http://www.prism.washington.edu/lc/PSSOFF/kawase.ppt
May, C.W., et al., 2005. An Analysis of Microbial Pollution in the Sinclair-Dyes Inlet Watershed, Final Report. Prepared by Battelle Marine Sciences Laboratory for PSNS & IMF Project ENVVEST, June 2005. https://www.mesodat.org/envvest/Reports/FC_TMDL_Report/readme.htm
RDI 1996. Acoustic Doppler Current Profiler, Principles of Operation: A Practical Primer. Second Edition for Broadband ADCPs. RD
12

Instruments, San Diego, CA. http://www.rdinstruments.com/rdi_library.html
RDI 2003. Plan ADCP Application. Ver. 2.02. RD Instruments, San Diego, CA. http://www.rdinstruments.com/rdi_library.html
RDI 2005a. Workhorse Sentinel: Self-contained 1200, 600, or 300 kHz ADCP. RD Instruments, San Diego, CA. http://www.rdinstruments.com/pdfs/datasheets/wh_sentinel.pdf
RDI 2005b. ADCP Post-Processing Software. RD Instruments, San Diego, CA. http://www.rdinstruments.com/adcpsoft.html
Richter, K.E. 2004. CH3D Hydrodynamic Model Validation Draft Report. Space and Naval Warfare Systems Center, San Diego, CA. September 12, 2004
Sarason, Christian, 2004. Puget Sound Circulation Model. Puget Sound Marine Environmental Modeling Puget Sound Modeling Workshop, April 23, 2004, University of Washington, Seattle, WA. http://www.psmem.org/workshop.4.23.04.html
Sarason, C. 2005. Welcome tima.ocean.washington.edu, home of the Puget Sound POM model. University of Washington, Seattle, WA. http://tima.ocean.washington.edu/
Skahill, Brian E. 2003. Preliminary Hydrological Simulation Program – Fortran (HSPF) Model Hydrologic Calibration for Streams in the Sinclair–Dyes Inlet Watershed, Draft Report. US Army Engineer Research and Development Center Vicksburg, MS, September 2003.
Skahill, Brian E. 2004. Hydrological Simulation Program – Fortran (HSPF) Model Hydrologic Calibration for Streams in the Sinclair–Dyes Inlet Watershed, Draft Report. US Army Engineer Research and Development Center Vicksburg, MS, April 2004.
Skahill, Brian E. 2005 (in prep). Addendum: HSPF Calibration - Missing Streams and Preliminary Storm Water Evaluation. Addendum to Hydrological Simulation Program – Fortran (HSPF) Model Hydrologic Calibration for Streams in the Sinclair–Dyes Inlet Watershed US Army Engineer Research and Development Center Vicksburg, MS.
US Navy, US EPA, and Washington State Department of Ecology 2000. Project ENVVEST: Phase I Final Project Agreement for the Puget Sound
13

Naval Shipyard, September 25, 2000 [Federal Register: October 23, 2000 (Volume 65, Number 205)]. http://www.epa.gov/ProjectXL/puget2/fpasigned.pdf
Wang, P.F., R.K. Johnston, H. Halkola, R.E. Richter, and B. Davidson, 2005. A Modeling Study of Combined Sewer Overflows in the Port Washington Narrows and Fecal Coliform Transport in Sinclair and Dyes Inlets, Washington. Prepared by Space and Naval Warfare Systems Center, San Diego for PSNS & IMF Project ENVVEST, FINAL REPORT. https://www.mesodat.org/envvest/CSO_Modeling/AppendixF_CSO_mo
University of Washington 2005. Informatics for Networked Data Integration and Graphic Output. UW, Seattle, WA. http://indigo.ocean.washington.edu:8080/datastream/index.jsp
14

9. Tables
15

Table 1. Data quality objectives for current meter study in Agate, Port Orchard, and Rich, Passages.
Current Meter Study - Data Quality Objectives STEP 1: State the Problem To calibrate and verify numerical models being developed for Sinclair Inlet, Dyes Inlet, Rich Passage, Port Orchard Passage, and Agate Passage data on current speed and direction over the full range of tidal conditions and representative weather conditions are needed at specific locations within the study area. The sampling will be conducted during the Fall 2005 (Sep. – Dec. 2005) to obtain data during storm and non-storm periods. STEP 2: Identify the Decision 1. What is the full range of tidal driven currents within Rich, Port Orchard, and
Agate Passages? 2. What is the contribution to current speed and direction from wind-driven events
within the study area? 3. What are the near-field currents within the interior of Sinclair Inlet adjacent to
the Shipyard? STEP 3: Identify Inputs to the Decision 4. Develop continuous records of current speed and direction as a function of water
depth at selected locations within the passages during the spring-neap tidal cycle.
5. Collect data on current speed and direction as a function of water depth at selected locations within the passages during varying weather conditions.
6. Develop a continuous record of current speed and direction as a function of water depth at a station located within Sinclair Inlet adjacent to the shipyard.
STEP 4: Define the Study Boundaries Spatial boundaries are Sinclair and Dyes Inlets and the passages connecting the Inlets to the central basin of the Puget Sound. STEP 5: Develop a Decision Rule Data on current speed and direction will be obtained for the spring-neap tidal cycle and for weather events that occur during the Fall 2005 (Sep. – Dec. 2005) sampling period. STEP 6: Evaluate Decision Errors Data will be evaluated to assure accuracy, precision, completeness, comparability, and representativeness. STEP 7: Optimize the Design for Obtaining Data Upward-looking Acoustic Doppler Current Profilers (ADCP) will be deployed on the bottom at strategic locations within the passages to obtain continuous current records during the Fall of 2005. The deployment will include the full range of tidal conditions and representative storm events that will occur within the study area during the deployment.
16

Table 2. Operational parameters for the current meters available for the study (RDI 2005a).
Accuracy
Frequency RangeCell Size
Water Velocity
Standard Deviation
1200 kHz 14m 1m 0.3% ±0.3 cm/s
300 kHz 126m 8m 0.5% ±0.5 cm/s
Table 3. List of station code, coordinates, depth, and location.
Code Latitude Longitude Depth (m)
Location
AGPASS 47.70871 -122.56941 15 Agate Passage south of bridge center of channel
POPASS 47.62444 -122.58556 35 Port Orchard Passage, south of University Point, center of channel
RICHPASS 47.58833 -122.56667 28 Rich Passage, west entrance adjacent to channel marker center of channel
PSNS-P4 47.55931 -122.63523 12 Shipyard between piers 3 and 4 in front of DD 4
17

10. Figures
18

Fc
AgatePassage
Port OrchardPassage
Rich Passage
AgatePassage
Port OrchardPassage
Rich Passage
igure 1. The location of Agate, Port Orchard, and Rich Passages in the entral Puget Sound.
19

Ecology 300 kHz (Sep – Dec 2005)
SSC-SD 1200 kHz (Sep/Oct 2005)
SSC-SD 1200 kHz (Oct/Nov 2005)
Sinclair I
nlet
Dyes Inlet
LibertyBay
PSNS-P4
RICHPASS
POPASS
AGPASS
Ecology 300 kHz (Sep – Dec 2005)
SSC-SD 1200 kHz (Sep/Oct 2005)
SSC-SD 1200 kHz (Oct/Nov 2005)
Sinclair I
nlet
Dyes Inlet
LibertyBay
PSNS-P4
RICHPASS
POPASS
AGPASS
Figure 2. Location of current meter stations within the study area. Bathymetry data from Finlayson (2005).
20

Figu
BainbridgeIsland
Sinclair Inlet
BI
Sinclair Inlet
BainbridgeIsland
Sinclair Inlet
BI
Sinclair Inlet
re 3. Numerical grid for Puget Sound POM model (upper figure) and
detail of model grid around Bainbridge Island (lower figure).
21
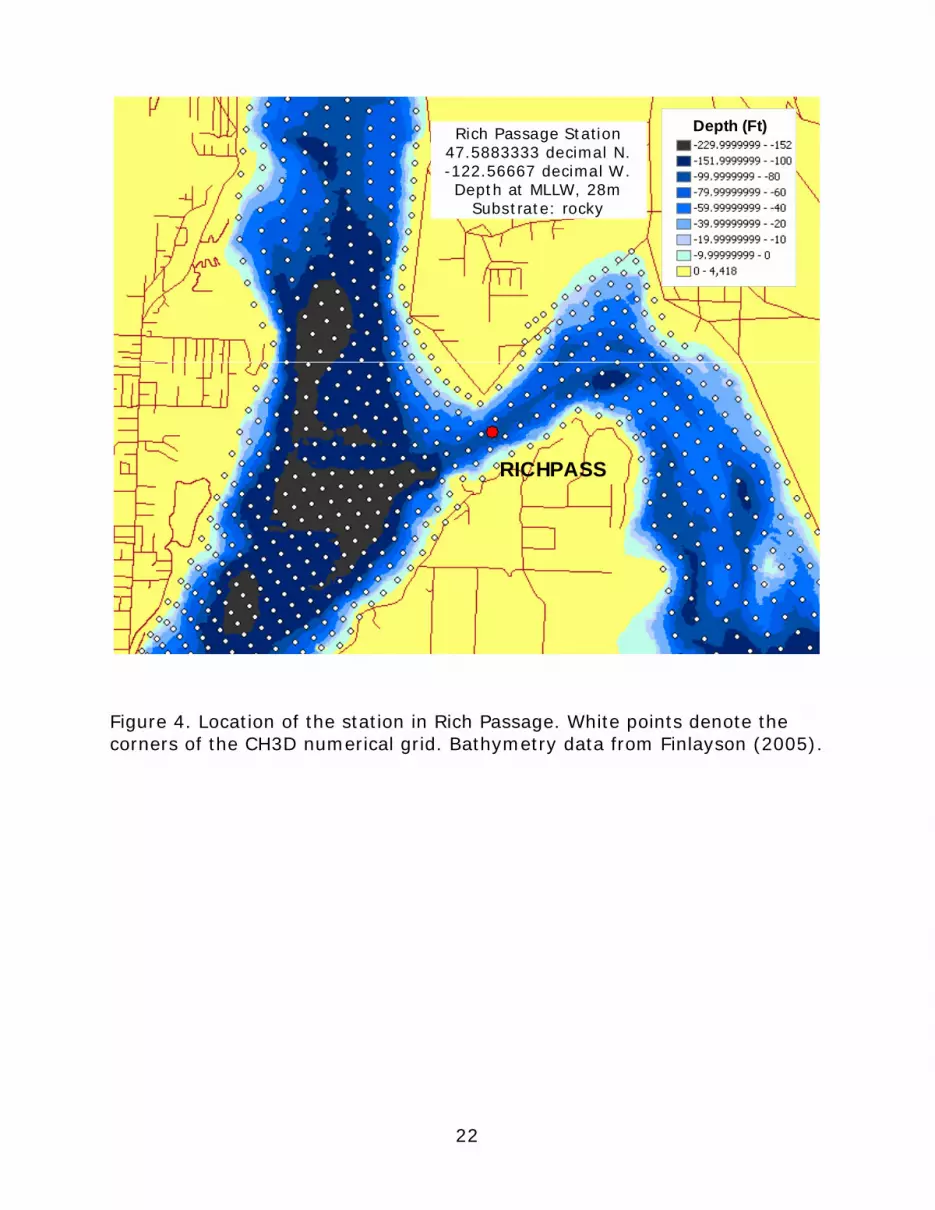
Rich Passage Station 47.5883333 decimal N.-122.56667 decimal W.Depth at MLLW, 28m
Substrate: rocky
Depth (Ft)Depth (Ft)
RICHPASS
Rich Passage Station 47.5883333 decimal N.-122.56667 decimal W.Depth at MLLW, 28m
Substrate: rocky
Depth (Ft)Depth (Ft)
RICHPASS
Figure 4. Location of the station in Rich Passage. White points denote the corners of the CH3D numerical grid. Bathymetry data from Finlayson (2005).
22

Port Orchard Passage Station 47.6244444 decimal N.-122.58556 decimal W.Depth at MLLW, 35m
Substrate: mud
POPASS
Depth (Ft)Depth (Ft)
Port Orchard Passage Station 47.6244444 decimal N.-122.58556 decimal W.Depth at MLLW, 35m
Substrate: mud
POPASS
Depth (Ft)Depth (Ft)
Figure 5. Location of the station in Port Orchard Passage. White points denote the corners of the CH3D numerical grid. Bathymetry data from
Finlayson (2005).
23

Agate Passage Station Depth at MLLW, 15m (< 30 ft)
Substrate: rocky
Depth (Ft)Depth (Ft)
AGPASS
Figure 6. Location of the station in Agate Passage. Bathymetry data from Finlayson (2005).
24

Depth (Ft)Depth (Ft)Depth (Ft)Depth (Ft)
FC
PSNS-P4PSNS-P4
igure 7. Location of the station in Sinclair Inlet, within the Shipyard. The H3D numerical grid is also shown. Bathymetry data from Finlayson (2005).
25

Figure 8. Predicted current speed for Agate (upper) and Rich (lower) Passages for Sept. 14-15, 2005. Data from http://www.mobilegeographics.com:81/locations/5308.html?y=2005&m=10&d=15
26

Figure 9. Predicted tides for Brownsville (upper) and Bremerton (lower) for Sept. 14-15, 2005. Data from http://www.mobilegeographics.com:81/locations/714.html?y=2005&m=9&d=14
27

11. Appendices
11.1 ADCP Parameter Settings for each current meter and station
(To be provided by Ecology and SSC-SD)
11.1.1 Parameter settings for RICHPASS (300 kHz)
11.1.2 Parameter settings for POPASS (300 kHz)
11.1.3 Parameter settings for AGPASS (1200 kHz)
11.1.4 Parameter settings for PSNS-P4 (1200 kHz)
28


